
ORINDA FUNDS -...
88
ORINDA FUNDS Semi-Annual Report August 31, 2013 Orinda SkyView Multi-Manager Hedged Equity Fund Class A Shares – OHEAX Class I Shares – OHEIX Orinda SkyView Macro Opportunities Fund Class A Shares – OMOAX Class I Shares – OMOIX Orinda Income Opportunities Fund Class A Shares – OIOAX Class I Shares – OIOIX
Transcript of ORINDA FUNDS -...
ORINDA FUNDS
Semi-Annual ReportAugust 31, 2013
Orinda SkyView Multi-Manager Hedged Equity FundClass A Shares – OHEAX
Class I Shares – OHEIX
Orinda SkyView Macro Opportunities FundClass A Shares – OMOAX
Class I Shares – OMOIX
Orinda Income Opportunities FundClass A Shares – OIOAX
Class I Shares – OIOIX

Table of ContentsOrinda SkyView Multi-Manager Hedged Equity Fund
Sector Allocation of Portfolio Assets . . . . . . . . . . . . . . . . . . . . . . . . . . . . . . . . . . . . 3Schedule of Investments . . . . . . . . . . . . . . . . . . . . . . . . . . . . . . . . . . . . . . . . . . . . . . 4Schedule of Securities Sold Short . . . . . . . . . . . . . . . . . . . . . . . . . . . . . . . . . . . . . . 13Schedule of Options Written . . . . . . . . . . . . . . . . . . . . . . . . . . . . . . . . . . . . . . . . . . 19
Orinda SkyView Macro Opportunities FundSector Allocation of Portfolio Assets . . . . . . . . . . . . . . . . . . . . . . . . . . . . . . . . . . . . 20Schedule of Investments . . . . . . . . . . . . . . . . . . . . . . . . . . . . . . . . . . . . . . . . . . . . . . 21Schedule of Securities Sold Short . . . . . . . . . . . . . . . . . . . . . . . . . . . . . . . . . . . . . . 28Schedule of Options Written . . . . . . . . . . . . . . . . . . . . . . . . . . . . . . . . . . . . . . . . . . 30Schedule of Futures Contracts . . . . . . . . . . . . . . . . . . . . . . . . . . . . . . . . . . . . . . . . . 31
Orinda Income Opportunities FundSector Allocation of Portfolio Assets . . . . . . . . . . . . . . . . . . . . . . . . . . . . . . . . . . . . 33Schedule of Investments . . . . . . . . . . . . . . . . . . . . . . . . . . . . . . . . . . . . . . . . . . . . . . 34
Financial StatementsStatements of Assets and Liabilities . . . . . . . . . . . . . . . . . . . . . . . . . . . . . . . . . . . . . 36Statements of Operations . . . . . . . . . . . . . . . . . . . . . . . . . . . . . . . . . . . . . . . . . . . . . 38Statements of Changes in Net Assets
Orinda SkyView Multi-Manager Hedged Equity Fund . . . . . . . . . . . . . . . . . . . 40Orinda SkyView Macro Opportunities Fund . . . . . . . . . . . . . . . . . . . . . . . . . . . 42Orinda Income Opportunities Fund . . . . . . . . . . . . . . . . . . . . . . . . . . . . . . . . . . 44
Statement of Cash FlowsOrinda SkyView Multi-Manager Hedged Equity Fund . . . . . . . . . . . . . . . . . . . 46Orinda SkyView Macro Opportunities Fund . . . . . . . . . . . . . . . . . . . . . . . . . . . 47
Financial HighlightsOrinda SkyView Multi-Manager Hedged Equity Fund . . . . . . . . . . . . . . . . . . . 48Orinda SkyView Macro Opportunities Fund . . . . . . . . . . . . . . . . . . . . . . . . . . . 50Orinda Income Opportunities Fund . . . . . . . . . . . . . . . . . . . . . . . . . . . . . . . . . . 52
Notes to the Financial Statements . . . . . . . . . . . . . . . . . . . . . . . . . . . . . . . . . . . . . . . . . 54Expense Example . . . . . . . . . . . . . . . . . . . . . . . . . . . . . . . . . . . . . . . . . . . . . . . . . . . . . . 74Notice to Shareholders . . . . . . . . . . . . . . . . . . . . . . . . . . . . . . . . . . . . . . . . . . . . . . . . . . 80Approval of Investment Sub-Advisory Agreements
Orinda SkyView Macro Opportunities Fund . . . . . . . . . . . . . . . . . . . . . . . . . . . . . . 81Approval of Investment Advisory Agreement
Orinda Income Opportunities Fund . . . . . . . . . . . . . . . . . . . . . . . . . . . . . . . . . . . . . 83Privacy Notice . . . . . . . . . . . . . . . . . . . . . . . . . . . . . . . . . . . . . . . . . . . Inside Back Cover
3
Orinda SkyView Multi-Manager Hedged Equity Fund
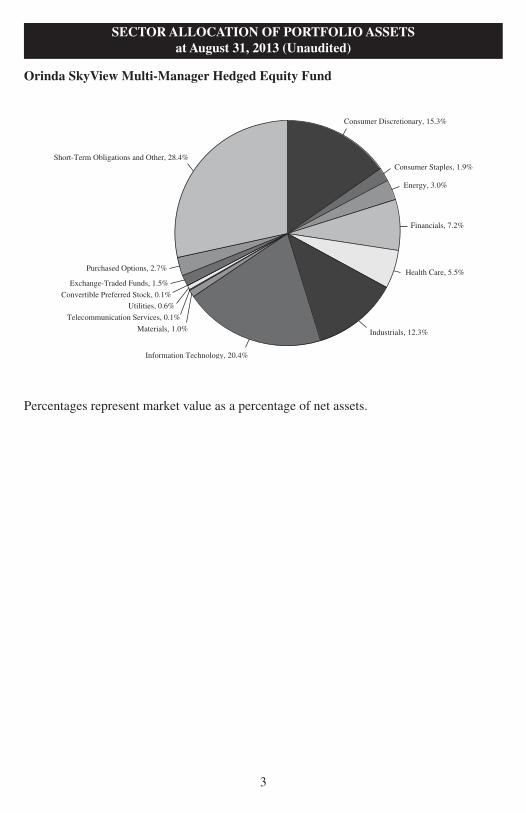
SECTORALLOCATION OF PORTFOLIOASSETSat August 31, 2013 (Unaudited)
Consumer Discretionary, 15.3%
Consumer Staples, 1.9%
Energy, 3.0%
Financials, 7.2%
Health Care, 5.5%
Industrials, 12.3%
Information Technology, 20.4%
Materials, 1.0%
Telecommunication Services, 0.1%
Utilities, 0.6%
Convertible Preferred Stock, 0.1%
Exchange-Traded Funds, 1.5%
Purchased Options, 2.7%
Short-Term Obligations and Other, 28.4%
Percentages represent market value as a percentage of net assets.

COMMON STOCKS - 67.3% Shares Value
Consumer Discretionary - 15.3%Advance Auto Parts, Inc.* 7,000 $ 560,490American Eagle Outfitters, Inc.* 30,000 434,100Ascent Capital Group, Inc.^* 1,949 143,914Big 5 Sporting Goods Corp.* 6,652 111,288BJ’s Restaurants, Inc.^* 12,305 384,408Black Diamond, Inc.^* 24,233 252,023Bon-Ton Stores, Inc.* 7,178 79,030Chico’s FAS, Inc.* 52,890 825,084Churchill Downs, Inc.* 1,748 141,588Chuy’s Holdings, Inc.^ 5,615 201,859Dana Holding Corp.* 6,694 140,306Deckers Outdoor Corp.^* 37,680 2,212,946DIRECTV^* 32,600 1,896,668Discovery Communications, Inc.^ 2,406 186,489Entravision Communications Corp.* 19,680 102,927Express, Inc.^* 30,000 629,700Family Dollar Stores, Inc. 7,800 555,282Francesca’s Holdings Corp.^* 44,192 1,065,911Hhgregg, Inc.^* 8,333 150,911Homeaway, Inc.^ 12,834 404,784Johnson Controls, Inc.* 3,570 144,692Kirklands, Inc.^* 10,294 200,836Lear Corp.* 2,436 167,475LKQ Corp.^* 49,505 1,447,526MGM Resorts International^* 9,129 161,492Monarch Casino & Resort, Inc.^* 10,330 194,204National CineMedia, Inc.* 67,530 1,214,190Orbitz Worldwide, Inc.^* 11,515 109,508Pacific Sunwear of California, Inc.^ 120,000 391,200Radioshack Corp.^ 100,000 327,000RetailMeNot, Inc.^ 10,475 334,781Ruby Tuesday, Inc.^* 49,782 361,417Scientific Games Corp.^* 84,230 1,203,647Shutterfly, Inc.^ 16,180 840,713Summer Infant, Inc.^ 5,000 16,200Target Corp.* 13,500 854,685Twenty First Century Fox, Inc. 6,686 209,472
SCHEDULE OF INVESTMENTSat August 31, 2013 (Unaudited)
4
The accompanying notes are an integral part of these financial statements.
Orinda SkyView Multi-Manager Hedged Equity Fund

COMMON STOCKS - 67.3% (Continued) Shares Value
Consumer Discretionary - 15.3% (Continued)Under Armour, Inc.^* 11,826 $ 859,041Visteon Corp.^* 2,292 164,130Xueda Education Group - ADR†*~ 135,585 527,426___________
20,209,343___________
Consumer Staples - 1.9%CVS Caremark Corp.* 24,600 1,428,030Kroger Co.* 3,933 143,948Safeway, Inc.* 25,000 647,500The Fresh Market, Inc.^* 5,402 263,671___________
2,483,149___________
Energy - 3.0%Advantage Oil & Gas Ltd.^† 34,446 125,039Core Laboratories NV†* 4,338 657,250Dril-Quip, Inc.^* 7,839 799,656Exterran Holdings, Inc.^* 5,371 147,327Geospace Technologies Corp.^ 5,863 409,003Green Plains Renewable Energy, Inc.^* 9,560 153,820Murphy Oil Corp.* 2,246 151,425Nabors Industries Ltd.†* 9,154 140,972Oasis Petroleum, Inc.^* 3,566 139,787Ocean Rig UDW, Inc.^†* 7,653 133,468Renewable Energy Group, Inc.^ 12,812 197,946Tsakos Energy Navigation Ltd.† 30,572 141,243World Fuel Services Corp.* 20,420 779,023___________
3,975,959___________
Financials - 7.2%Affiliated Managers Group, Inc.^* 3,714 647,424Berkshire Hathaway, Inc. - Class B^* 7,000 778,540BofI Holding, Inc.^* 14,189 919,021Citigroup, Inc.* 2,824 136,484CNO Financial Group, Inc.* 13,122 178,328Colony Bankcorp, Inc.^* 4,444 28,753Everest Re Group Ltd.†* 1,084 148,454First South Bancorp, Inc.^* 21,469 136,972Firstbank Corp.* 6,219 117,041
SCHEDULE OF INVESTMENTS (Continued)at August 31, 2013 (Unaudited)
5
The accompanying notes are an integral part of these financial statements.
Orinda SkyView Multi-Manager Hedged Equity Fund
COMMON STOCKS - 67.3% (Continued) Shares Value
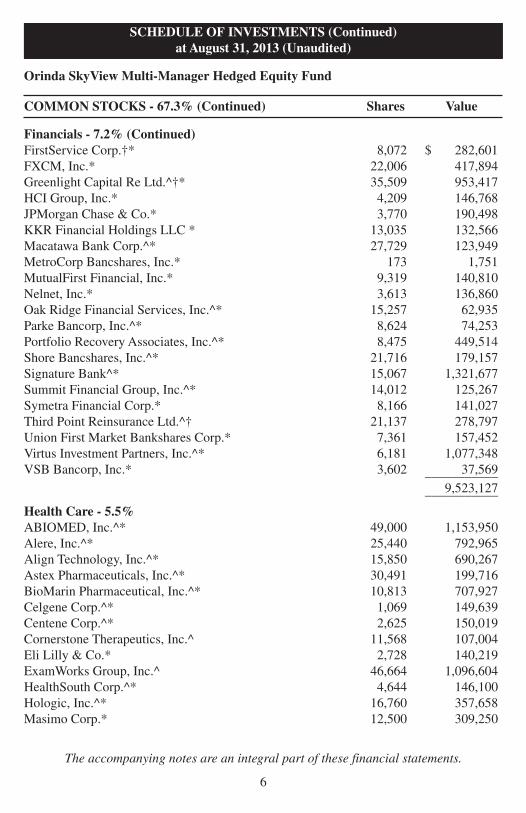
Financials - 7.2% (Continued)FirstService Corp.†* 8,072 $ 282,601FXCM, Inc.* 22,006 417,894Greenlight Capital Re Ltd.^†* 35,509 953,417HCI Group, Inc.* 4,209 146,768JPMorgan Chase & Co.* 3,770 190,498KKR Financial Holdings LLC * 13,035 132,566Macatawa Bank Corp.^* 27,729 123,949MetroCorp Bancshares, Inc.* 173 1,751MutualFirst Financial, Inc.* 9,319 140,810Nelnet, Inc.* 3,613 136,860Oak Ridge Financial Services, Inc.^* 15,257 62,935Parke Bancorp, Inc.^* 8,624 74,253Portfolio Recovery Associates, Inc.^* 8,475 449,514Shore Bancshares, Inc.^* 21,716 179,157Signature Bank^* 15,067 1,321,677Summit Financial Group, Inc.^* 14,012 125,267Symetra Financial Corp.* 8,166 141,027Third Point Reinsurance Ltd.^† 21,137 278,797Union First Market Bankshares Corp.* 7,361 157,452Virtus Investment Partners, Inc.^* 6,181 1,077,348VSB Bancorp, Inc.* 3,602 37,569___________
9,523,127___________
Health Care - 5.5%ABIOMED, Inc.^* 49,000 1,153,950Alere, Inc.^* 25,440 792,965Align Technology, Inc.^* 15,850 690,267Astex Pharmaceuticals, Inc.^* 30,491 199,716BioMarin Pharmaceutical, Inc.^* 10,813 707,927Celgene Corp.^* 1,069 149,639Centene Corp.^* 2,625 150,019Cornerstone Therapeutics, Inc.^ 11,568 107,004Eli Lilly & Co.* 2,728 140,219ExamWorks Group, Inc.^ 46,664 1,096,604HealthSouth Corp.^* 4,644 146,100Hologic, Inc.^* 16,760 357,658Masimo Corp.* 12,500 309,250
SCHEDULE OF INVESTMENTSat August 31, 2013 (Unaudited)
6
The accompanying notes are an integral part of these financial statements.
Orinda SkyView Multi-Manager Hedged Equity Fund
SCHEDULE OF INVESTMENTS (Continued)at August 31, 2013 (Unaudited)
COMMON STOCKS - 67.3% (Continued) Shares Value
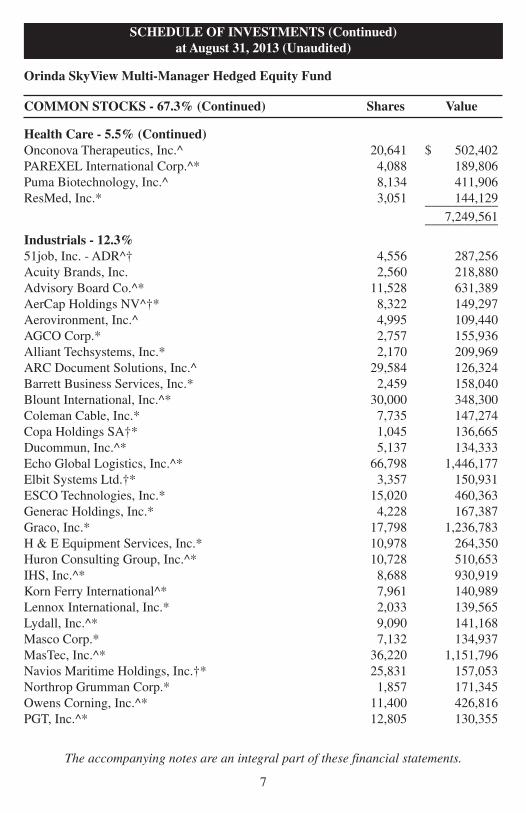
Health Care - 5.5% (Continued)Onconova Therapeutics, Inc.^ 20,641 $ 502,402PAREXEL International Corp.^* 4,088 189,806Puma Biotechnology, Inc.^ 8,134 411,906ResMed, Inc.* 3,051 144,129___________
7,249,561___________
Industrials - 12.3%51job, Inc. - ADR^† 4,556 287,256Acuity Brands, Inc. 2,560 218,880Advisory Board Co.^* 11,528 631,389AerCap Holdings NV^†* 8,322 149,297Aerovironment, Inc.^ 4,995 109,440AGCO Corp.* 2,757 155,936Alliant Techsystems, Inc.* 2,170 209,969ARC Document Solutions, Inc.^ 29,584 126,324Barrett Business Services, Inc.* 2,459 158,040Blount International, Inc.^* 30,000 348,300Coleman Cable, Inc.* 7,735 147,274Copa Holdings SA†* 1,045 136,665Ducommun, Inc.^* 5,137 134,333Echo Global Logistics, Inc.^* 66,798 1,446,177Elbit Systems Ltd.†* 3,357 150,931ESCO Technologies, Inc.* 15,020 460,363Generac Holdings, Inc.* 4,228 167,387Graco, Inc.* 17,798 1,236,783H & E Equipment Services, Inc.* 10,978 264,350Huron Consulting Group, Inc.^* 10,728 510,653IHS, Inc.^* 8,688 930,919Korn Ferry International^* 7,961 140,989Lennox International, Inc.* 2,033 139,565Lydall, Inc.^* 9,090 141,168Masco Corp.* 7,132 134,937MasTec, Inc.^* 36,220 1,151,796Navios Maritime Holdings, Inc.†* 25,831 157,053Northrop Grumman Corp.* 1,857 171,345Owens Corning, Inc.^* 11,400 426,816PGT, Inc.^* 12,805 130,355
SCHEDULE OF INVESTMENTSat August 31, 2013 (Unaudited)
7
The accompanying notes are an integral part of these financial statements.
Orinda SkyView Multi-Manager Hedged Equity Fund
SCHEDULE OF INVESTMENTS (Continued)at August 31, 2013 (Unaudited)

COMMON STOCKS - 67.3% (Continued) Shares Value
Industrials - 12.3% (Continued)Raytheon Co.* 2,064 $ 155,646Rexnord Corp.^ 8,552 164,113RPX Corp.^* 9,805 153,840Smith (A.O.) Corp.* 3,623 152,347SolarCity Corp.^ 5,270 165,162Stantec, Inc.† 2,604 119,628The Middleby Corp.^* 1,553 288,765TransDigm Group, Inc.* 8,068 1,105,316TRC Companies, Inc.^ 17,282 126,504Trinity Industries, Inc.* 4,701 198,476Valmont Industries, Inc.* 1,040 140,358WageWorks, Inc.^ 12,525 522,794Waste Connections, Inc.* 15,615 661,451Wesco Aircraft Holdings, Inc.^ 29,550 565,292Xylem, Inc.* 44,300 1,097,754___________
16,192,136___________
Information Technology - 20.4%Alliance Data Systems Corp.^* 926 181,218Alliance Fiber Optic Products, Inc.* 4,826 178,707ANSYS, Inc.^* 3,853 323,575Apple, Inc. 1,140 555,237Arrow Electronics, Inc.^* 3,131 145,341AudioCodes Ltd.^†* 26,965 176,621Baidu, Inc. - ADR^† 1,952 264,555Brightcove, Inc.^* 47,860 447,491Brocade Communications Systems, Inc.^* 64,710 478,854Calix, Inc.^* 11,895 152,851Cardtronics, Inc.^* 23,420 812,440Celestica, Inc.^†* 13,427 142,460Cognex Corp. 5,291 301,481Compuware Corp.* 12,875 137,376Concur Technologies, Inc.^* 2,514 245,668Corning, Inc.* 9,711 136,342Emulex Corp.^ 13,180 94,896Envestnet, Inc.^* 40,801 1,127,332Fabrinet^ 1,008 14,072
SCHEDULE OF INVESTMENTSat August 31, 2013 (Unaudited)
8
The accompanying notes are an integral part of these financial statements.
Orinda SkyView Multi-Manager Hedged Equity Fund
SCHEDULE OF INVESTMENTS (Continued)at August 31, 2013 (Unaudited)
COMMON STOCKS - 67.3% (Continued) Shares Value
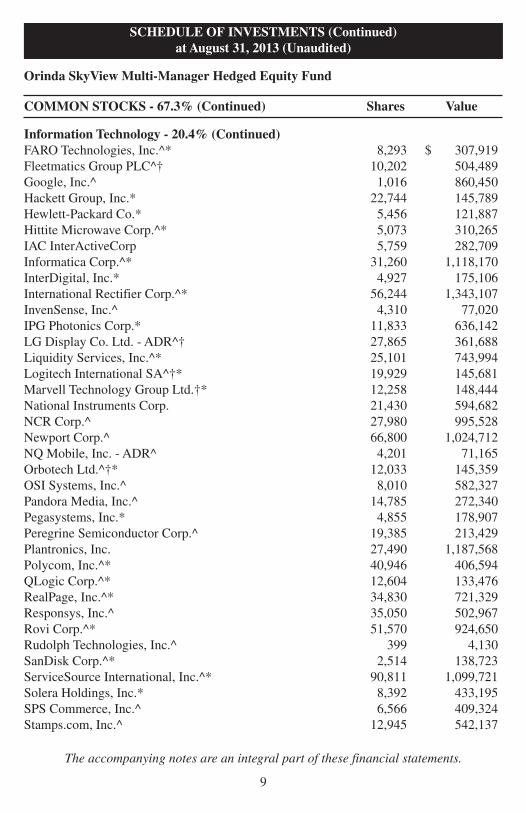
Information Technology - 20.4% (Continued)FARO Technologies, Inc.^* 8,293 $ 307,919Fleetmatics Group PLC^† 10,202 504,489Google, Inc.^ 1,016 860,450Hackett Group, Inc.* 22,744 145,789Hewlett-Packard Co.* 5,456 121,887Hittite Microwave Corp.^* 5,073 310,265IAC InterActiveCorp 5,759 282,709Informatica Corp.^* 31,260 1,118,170InterDigital, Inc.* 4,927 175,106International Rectifier Corp.^* 56,244 1,343,107InvenSense, Inc.^ 4,310 77,020IPG Photonics Corp.* 11,833 636,142LG Display Co. Ltd. - ADR^† 27,865 361,688Liquidity Services, Inc.^* 25,101 743,994Logitech International SA^†* 19,929 145,681Marvell Technology Group Ltd.†* 12,258 148,444National Instruments Corp. 21,430 594,682NCR Corp.^ 27,980 995,528Newport Corp.^ 66,800 1,024,712NQ Mobile, Inc. - ADR^ 4,201 71,165Orbotech Ltd.^†* 12,033 145,359OSI Systems, Inc.^ 8,010 582,327Pandora Media, Inc.^ 14,785 272,340Pegasystems, Inc.* 4,855 178,907Peregrine Semiconductor Corp.^ 19,385 213,429Plantronics, Inc. 27,490 1,187,568Polycom, Inc.^* 40,946 406,594QLogic Corp.^* 12,604 133,476RealPage, Inc.^* 34,830 721,329Responsys, Inc.^ 35,050 502,967Rovi Corp.^* 51,570 924,650Rudolph Technologies, Inc.^ 399 4,130SanDisk Corp.^* 2,514 138,723ServiceSource International, Inc.^* 90,811 1,099,721Solera Holdings, Inc.* 8,392 433,195SPS Commerce, Inc.^ 6,566 409,324Stamps.com, Inc.^ 12,945 542,137
SCHEDULE OF INVESTMENTSat August 31, 2013 (Unaudited)
9
The accompanying notes are an integral part of these financial statements.
Orinda SkyView Multi-Manager Hedged Equity Fund
SCHEDULE OF INVESTMENTS (Continued)at August 31, 2013 (Unaudited)

COMMON STOCKS - 67.3% (Continued) Shares Value
Information Technology - 20.4% (Continued)Synaptics, Inc.^* 3,510 $ 135,697Syntel, Inc.* 2,027 145,680Tableau Software, Inc.^ 2,091 151,200Taiwan Semiconductor - ADR† 50,100 829,656Texas Instruments, Inc.* 3,780 144,396The Ultimate Software Group, Inc.^* 5,788 811,535UniPixel, Inc.^ 670 13,005VeriFone Systems, Inc.^* 32,229 638,779Vishay Intertechnology, Inc.^* 10,245 125,501Xyratex Ltd.†* 13,983 142,347___________
26,919,436___________
Materials - 1.0%FutureFuel Corp. 14,301 230,818Methanex Corp.†* 3,287 152,813Monsanto Co. 4,979 487,394New Gold, Inc.^† 19,271 129,887Rubicon Minerals Corp.^†* 91,841 141,435Silver Wheaton Corp.†* 5,408 142,501___________
1,284,848___________
Telecommunication Services - 0.1%Inteliquent, Inc.* 23,078 184,624___________
184,624___________
Utilities - 0.6%Consolidated Water Co., Ltd.†* 11,487 146,689ITC Holdings Corp.* 7,050 626,674___________
773,363___________TOTAL COMMON STOCKS (Cost $71,574,865) 88,795,546___________
CONVERTIBLE PREFERRED STOCKS - 0.1%
Shaw Communications, Inc.†* 5,860 141,168___________TOTAL CONVERTIBLE PREFERRED STOCKS(Cost $142,875) 141,168___________
SCHEDULE OF INVESTMENTSat August 31, 2013 (Unaudited)
10
The accompanying notes are an integral part of these financial statements.
Orinda SkyView Multi-Manager Hedged Equity Fund
SCHEDULE OF INVESTMENTS (Continued)at August 31, 2013 (Unaudited)
EXCHANGE-TRADED FUNDS - 1.5% Shares Value
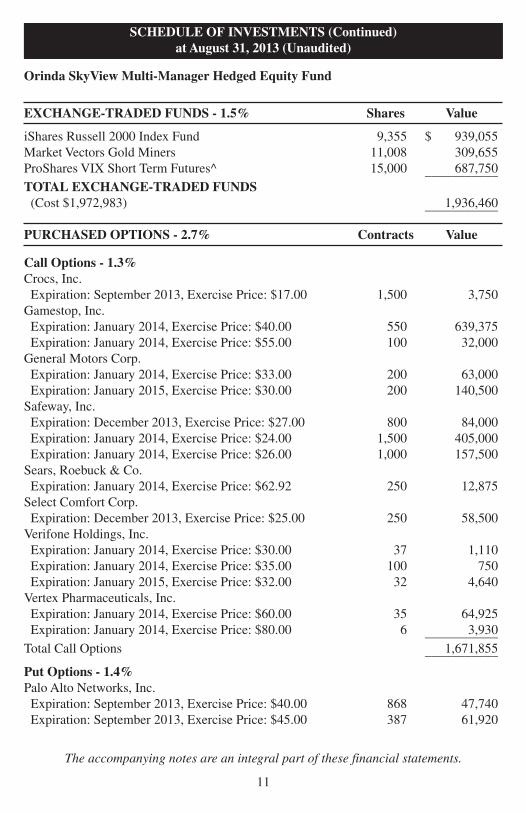
iShares Russell 2000 Index Fund 9,355 $ 939,055Market Vectors Gold Miners 11,008 309,655ProShares VIX Short Term Futures^ 15,000 687,750___________TOTAL EXCHANGE-TRADED FUNDS(Cost $1,972,983) 1,936,460___________
PURCHASED OPTIONS - 2.7% Contracts Value
Call Options - 1.3%Crocs, Inc.Expiration: September 2013, Exercise Price: $17.00 1,500 3,750Gamestop, Inc.Expiration: January 2014, Exercise Price: $40.00 550 639,375Expiration: January 2014, Exercise Price: $55.00 100 32,000General Motors Corp.Expiration: January 2014, Exercise Price: $33.00 200 63,000Expiration: January 2015, Exercise Price: $30.00 200 140,500Safeway, Inc.Expiration: December 2013, Exercise Price: $27.00 800 84,000Expiration: January 2014, Exercise Price: $24.00 1,500 405,000Expiration: January 2014, Exercise Price: $26.00 1,000 157,500Sears, Roebuck & Co.Expiration: January 2014, Exercise Price: $62.92 250 12,875Select Comfort Corp.Expiration: December 2013, Exercise Price: $25.00 250 58,500Verifone Holdings, Inc.Expiration: January 2014, Exercise Price: $30.00 37 1,110Expiration: January 2014, Exercise Price: $35.00 100 750Expiration: January 2015, Exercise Price: $32.00 32 4,640Vertex Pharmaceuticals, Inc.Expiration: January 2014, Exercise Price: $60.00 35 64,925Expiration: January 2014, Exercise Price: $80.00 6 3,930___________Total Call Options 1,671,855___________
Put Options - 1.4%Palo Alto Networks, Inc.Expiration: September 2013, Exercise Price: $40.00 868 47,740Expiration: September 2013, Exercise Price: $45.00 387 61,920
SCHEDULE OF INVESTMENTSat August 31, 2013 (Unaudited)
11
The accompanying notes are an integral part of these financial statements.
Orinda SkyView Multi-Manager Hedged Equity Fund
SCHEDULE OF INVESTMENTS (Continued)at August 31, 2013 (Unaudited)
PURCHASED OPTIONS - 2.7% (Continued) Contracts Value
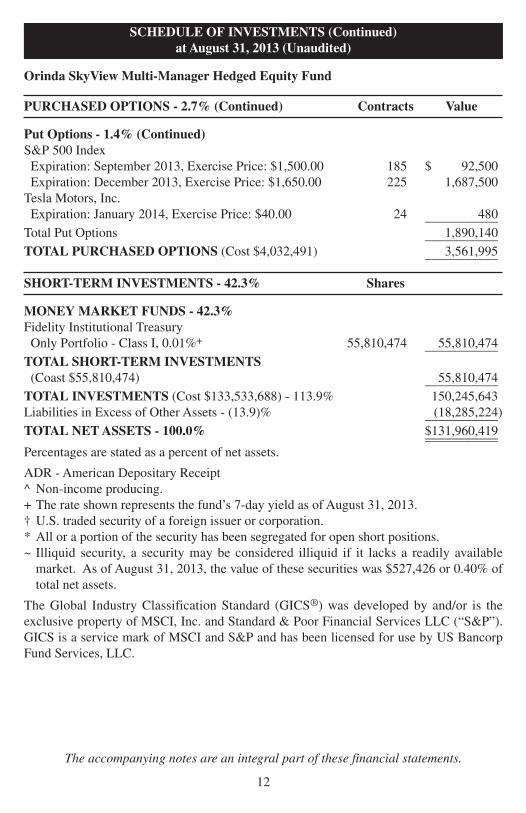
Put Options - 1.4% (Continued)S&P 500 IndexExpiration: September 2013, Exercise Price: $1,500.00 185 $ 92,500Expiration: December 2013, Exercise Price: $1,650.00 225 1,687,500Tesla Motors, Inc.Expiration: January 2014, Exercise Price: $40.00 24 480___________Total Put Options 1,890,140___________TOTAL PURCHASED OPTIONS (Cost $4,032,491) 3,561,995___________
SHORT-TERM INVESTMENTS - 42.3% Shares
MONEY MARKET FUNDS - 42.3%Fidelity Institutional TreasuryOnly Portfolio - Class I, 0.01%+ 55,810,474 55,810,474___________TOTAL SHORT-TERM INVESTMENTS(Coast $55,810,474) 55,810,474___________TOTAL INVESTMENTS (Cost $133,533,688) - 113.9% 150,245,643Liabilities in Excess of Other Assets - (13.9)% (18,285,224)___________TOTAL NETASSETS - 100.0% $131,960,419______________________Percentages are stated as a percent of net assets.
ADR - American Depositary Receipt^ Non-income producing.+ The rate shown represents the fund’s 7-day yield as of August 31, 2013.† U.S. traded security of a foreign issuer or corporation.* All or a portion of the security has been segregated for open short positions.~ Illiquid security, a security may be considered illiquid if it lacks a readily availablemarket. As of August 31, 2013, the value of these securities was $527,426 or 0.40% oftotal net assets.
The Global Industry Classification Standard (GICS®) was developed by and/or is theexclusive property of MSCI, Inc. and Standard & Poor Financial Services LLC (“S&P”).GICS is a service mark of MSCI and S&P and has been licensed for use by US BancorpFund Services, LLC.
SCHEDULE OF INVESTMENTSat August 31, 2013 (Unaudited)
12
The accompanying notes are an integral part of these financial statements.
Orinda SkyView Multi-Manager Hedged Equity Fund
SCHEDULE OF INVESTMENTS (Continued)at August 31, 2013 (Unaudited)
COMMON STOCKS - 25.1% Shares Value
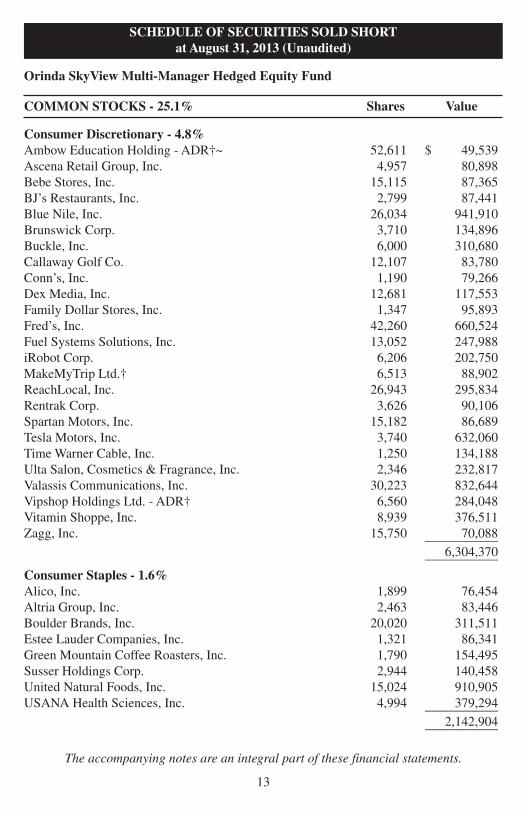
Consumer Discretionary - 4.8%Ambow Education Holding - ADR†~ 52,611 $ 49,539Ascena Retail Group, Inc. 4,957 80,898Bebe Stores, Inc. 15,115 87,365BJ’s Restaurants, Inc. 2,799 87,441Blue Nile, Inc. 26,034 941,910Brunswick Corp. 3,710 134,896Buckle, Inc. 6,000 310,680Callaway Golf Co. 12,107 83,780Conn’s, Inc. 1,190 79,266Dex Media, Inc. 12,681 117,553Family Dollar Stores, Inc. 1,347 95,893Fred’s, Inc. 42,260 660,524Fuel Systems Solutions, Inc. 13,052 247,988iRobot Corp. 6,206 202,750MakeMyTrip Ltd.† 6,513 88,902ReachLocal, Inc. 26,943 295,834Rentrak Corp. 3,626 90,106Spartan Motors, Inc. 15,182 86,689Tesla Motors, Inc. 3,740 632,060Time Warner Cable, Inc. 1,250 134,188Ulta Salon, Cosmetics & Fragrance, Inc. 2,346 232,817Valassis Communications, Inc. 30,223 832,644Vipshop Holdings Ltd. - ADR† 6,560 284,048Vitamin Shoppe, Inc. 8,939 376,511Zagg, Inc. 15,750 70,088___________
6,304,370___________
Consumer Staples - 1.6%Alico, Inc. 1,899 76,454Altria Group, Inc. 2,463 83,446Boulder Brands, Inc. 20,020 311,511Estee Lauder Companies, Inc. 1,321 86,341Green Mountain Coffee Roasters, Inc. 1,790 154,495Susser Holdings Corp. 2,944 140,458United Natural Foods, Inc. 15,024 910,905USANA Health Sciences, Inc. 4,994 379,294___________
2,142,904___________
13
The accompanying notes are an integral part of these financial statements.
Orinda SkyView Multi-Manager Hedged Equity Fund
SCHEDULE OF SECURITIES SOLD SHORTat August 31, 2013 (Unaudited)
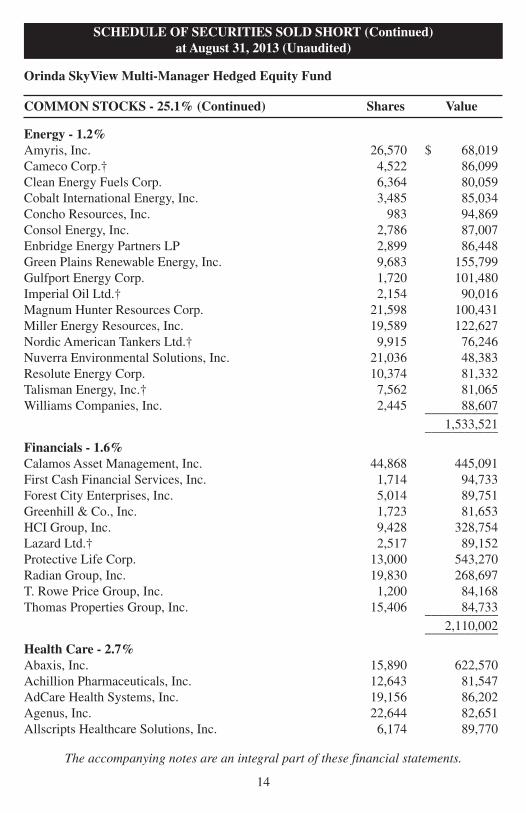
COMMON STOCKS - 25.1% (Continued) Shares Value
Energy - 1.2%Amyris, Inc. 26,570 $ 68,019Cameco Corp.† 4,522 86,099Clean Energy Fuels Corp. 6,364 80,059Cobalt International Energy, Inc. 3,485 85,034Concho Resources, Inc. 983 94,869Consol Energy, Inc. 2,786 87,007Enbridge Energy Partners LP 2,899 86,448Green Plains Renewable Energy, Inc. 9,683 155,799Gulfport Energy Corp. 1,720 101,480Imperial Oil Ltd.† 2,154 90,016Magnum Hunter Resources Corp. 21,598 100,431Miller Energy Resources, Inc. 19,589 122,627Nordic American Tankers Ltd.† 9,915 76,246Nuverra Environmental Solutions, Inc. 21,036 48,383Resolute Energy Corp. 10,374 81,332Talisman Energy, Inc.† 7,562 81,065Williams Companies, Inc. 2,445 88,607___________
1,533,521___________
Financials - 1.6%Calamos Asset Management, Inc. 44,868 445,091First Cash Financial Services, Inc. 1,714 94,733Forest City Enterprises, Inc. 5,014 89,751Greenhill & Co., Inc. 1,723 81,653HCI Group, Inc. 9,428 328,754Lazard Ltd.† 2,517 89,152Protective Life Corp. 13,000 543,270Radian Group, Inc. 19,830 268,697T. Rowe Price Group, Inc. 1,200 84,168Thomas Properties Group, Inc. 15,406 84,733___________
2,110,002___________
Health Care - 2.7%Abaxis, Inc. 15,890 622,570Achillion Pharmaceuticals, Inc. 12,643 81,547AdCare Health Systems, Inc. 19,156 86,202Agenus, Inc. 22,644 82,651Allscripts Healthcare Solutions, Inc. 6,174 89,770
14
The accompanying notes are an integral part of these financial statements.
Orinda SkyView Multi-Manager Hedged Equity Fund
SCHEDULE OF SECURITIES SOLD SHORT (Continued)at August 31, 2013 (Unaudited)
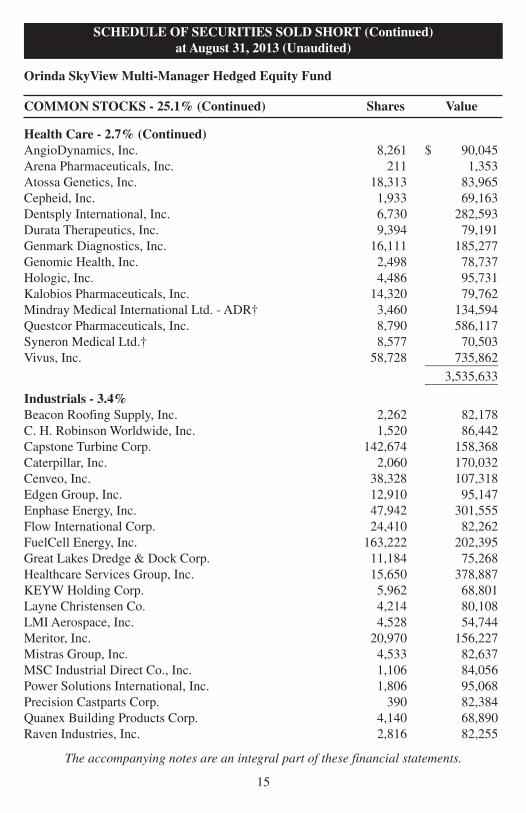
COMMON STOCKS - 25.1% (Continued) Shares Value
Health Care - 2.7% (Continued)AngioDynamics, Inc. 8,261 $ 90,045Arena Pharmaceuticals, Inc. 211 1,353Atossa Genetics, Inc. 18,313 83,965Cepheid, Inc. 1,933 69,163Dentsply International, Inc. 6,730 282,593Durata Therapeutics, Inc. 9,394 79,191Genmark Diagnostics, Inc. 16,111 185,277Genomic Health, Inc. 2,498 78,737Hologic, Inc. 4,486 95,731Kalobios Pharmaceuticals, Inc. 14,320 79,762Mindray Medical International Ltd. - ADR† 3,460 134,594Questcor Pharmaceuticals, Inc. 8,790 586,117Syneron Medical Ltd.† 8,577 70,503Vivus, Inc. 58,728 735,862___________
3,535,633___________
Industrials - 3.4%Beacon Roofing Supply, Inc. 2,262 82,178C. H. Robinson Worldwide, Inc. 1,520 86,442Capstone Turbine Corp. 142,674 158,368Caterpillar, Inc. 2,060 170,032Cenveo, Inc. 38,328 107,318Edgen Group, Inc. 12,910 95,147Enphase Energy, Inc. 47,942 301,555Flow International Corp. 24,410 82,262FuelCell Energy, Inc. 163,222 202,395Great Lakes Dredge & Dock Corp. 11,184 75,268Healthcare Services Group, Inc. 15,650 378,887KEYW Holding Corp. 5,962 68,801Layne Christensen Co. 4,214 80,108LMI Aerospace, Inc. 4,528 54,744Meritor, Inc. 20,970 156,227Mistras Group, Inc. 4,533 82,637MSC Industrial Direct Co., Inc. 1,106 84,056Power Solutions International, Inc. 1,806 95,068Precision Castparts Corp. 390 82,384Quanex Building Products Corp. 4,140 68,890Raven Industries, Inc. 2,816 82,255
15
The accompanying notes are an integral part of these financial statements.
Orinda SkyView Multi-Manager Hedged Equity Fund
SCHEDULE OF SECURITIES SOLD SHORT (Continued)at August 31, 2013 (Unaudited)

COMMON STOCKS - 25.1% (Continued) Shares Value
Industrials - 3.4% (Continued)SolarCity Corp. 14,769 $ 462,860Swift Transportation Co. 8,040 144,398TAL International Group, Inc. 3,490 149,372Tennant Co. 9,160 470,549Thermon Group Holdings, Inc. 11,357 235,090UTi Worldwide, Inc.† 5,393 89,038WESCO International, Inc. 5,256 387,735___________
4,534,064___________
Information Technology - 8.3%Allot Communications Ltd.† 6,874 83,863Angie’s List, Inc. 21,494 450,514Applied Micro Circuits Corp. 11,186 120,361Asure Software, Inc. 17,061 78,992AU Optronics Corp. - ADR† 107,810 413,990Badger Meter, Inc. 1,811 81,640Blackberry Ltd.† 23,105 233,823Broadcom Corp. 3,395 85,758Cray, Inc. 10,700 261,722DragonWave, Inc.† 104,105 281,084DTS, Inc. 26,688 535,361Emulex Corp. 11,705 84,276Entropic Communications, Inc. 19,942 83,358EZchip Semiconductor Ltd.† 9,176 261,516First Solar, Inc. 10,265 376,931Intermolecular, Inc. 10,266 61,493InterXion Holding NV† 3,640 87,105Ixia 5,405 78,481j2 Global, Inc. 3,928 193,415Lexmark International, Inc. 11,470 391,815Liquidity Services, Inc. 2,356 69,832LivePerson, Inc. 5,973 55,668Mellanox Technologies Ltd.† 2,198 86,645Mindspeed Technologies, Inc. 31,189 96,998MoSys, Inc. 17,235 62,735Netgear, Inc. 6,129 177,373Nokia Corp. - ADR† 76,646 298,919NVE Corp. 4,920 242,654
16
The accompanying notes are an integral part of these financial statements.
Orinda SkyView Multi-Manager Hedged Equity Fund
SCHEDULE OF SECURITIES SOLD SHORT (Continued)at August 31, 2013 (Unaudited)
COMMON STOCKS - 25.1% (Continued) Shares Value
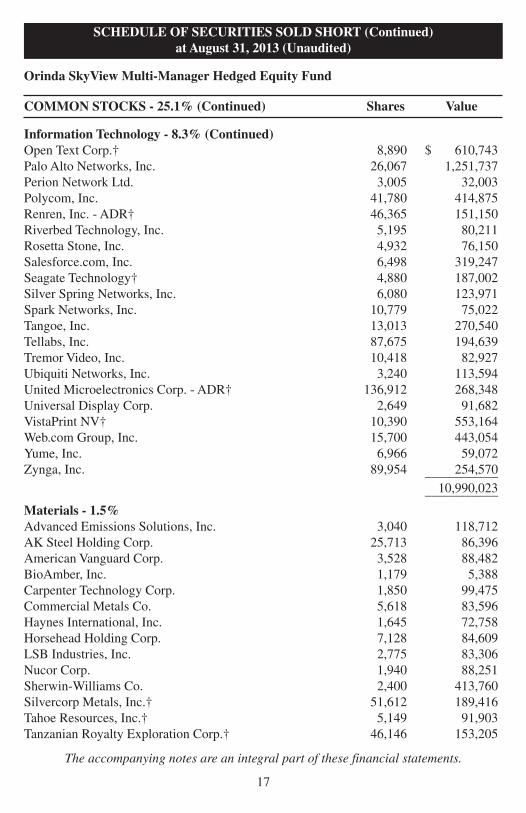
Information Technology - 8.3% (Continued)Open Text Corp.† 8,890 $ 610,743Palo Alto Networks, Inc. 26,067 1,251,737Perion Network Ltd. 3,005 32,003Polycom, Inc. 41,780 414,875Renren, Inc. - ADR† 46,365 151,150Riverbed Technology, Inc. 5,195 80,211Rosetta Stone, Inc. 4,932 76,150Salesforce.com, Inc. 6,498 319,247Seagate Technology† 4,880 187,002Silver Spring Networks, Inc. 6,080 123,971Spark Networks, Inc. 10,779 75,022Tangoe, Inc. 13,013 270,540Tellabs, Inc. 87,675 194,639Tremor Video, Inc. 10,418 82,927Ubiquiti Networks, Inc. 3,240 113,594United Microelectronics Corp. - ADR† 136,912 268,348Universal Display Corp. 2,649 91,682VistaPrint NV† 10,390 553,164Web.com Group, Inc. 15,700 443,054Yume, Inc. 6,966 59,072Zynga, Inc. 89,954 254,570___________
10,990,023___________
Materials - 1.5%Advanced Emissions Solutions, Inc. 3,040 118,712AK Steel Holding Corp. 25,713 86,396American Vanguard Corp. 3,528 88,482BioAmber, Inc. 1,179 5,388Carpenter Technology Corp. 1,850 99,475Commercial Metals Co. 5,618 83,596Haynes International, Inc. 1,645 72,758Horsehead Holding Corp. 7,128 84,609LSB Industries, Inc. 2,775 83,306Nucor Corp. 1,940 88,251Sherwin-Williams Co. 2,400 413,760Silvercorp Metals, Inc.† 51,612 189,416Tahoe Resources, Inc.† 5,149 91,903Tanzanian Royalty Exploration Corp.† 46,146 153,205
17
The accompanying notes are an integral part of these financial statements.
Orinda SkyView Multi-Manager Hedged Equity Fund
SCHEDULE OF SECURITIES SOLD SHORT (Continued)at August 31, 2013 (Unaudited)

COMMON STOCKS - 25.1% (Continued) Shares Value
Materials - 1.5% (Continued)Turquoise Hill Resources Ltd.† 17,974 $ 93,824Vulcan Materials Co. 1,583 75,667Zep, Inc. 6,480 91,238___________
1,919,986___________
Utilities - 0.0%Cadiz, Inc. 7,206 32,859___________TOTAL COMMON STOCKS (Proceeds $32,403,604) 33,103,362___________
EXCHANGE-TRADED FUNDS - 5.0%
Direxion Daily Small Cap Bear 3X Shares 2,500 69,000Direxion Daily Small Cap Bull 3X Shares 8,000 417,360iShares Russell 2000 Growth Index Fund 12,538 1,473,716iShares Russell 2000 Index Fund 32,970 3,309,529SPDR S&P 500 ETF Trust 4,292 702,386VelocityShares Daily Inverse VIX Short Term† 28,000 655,480___________TOTAL EXCHANGE-TRADED FUNDS(Proceeds $6,551,507) 6,627,471___________
REITS - 0.2%
American Tower Corp. 1,179 81,929CoreSite Realty Corp. 6,720 204,489___________TOTAL REITS (Proceeds $272,318) 286,418___________TOTAL SECURITIES SOLD SHORT(Proceeds $39,227,429) $ 40,017,251______________________Percentages are stated as a percent of net assets.
ADR - American Depositary Receipt† U.S. traded security of a foreign issuer or corporation.~ Illiquid security, a security may be considered illiquid if it lacks a readily availablemarket. As of August 31, 2013, the value of these securities was $49,539 or 0.04% oftotal net assets.
The Global Industry Classification Standard (GICS®) was developed by and/or is theexclusive property of MSCI, Inc. and Standard & Poor Financial Services LLC (“S&P”).GICS is a service mark of MSCI and S&P and has been licensed for use by US BancorpFund Services, LLC.
SCHEDULE OF SECURITIES SOLD SHORT (Continued)at August 31, 2013 (Unaudited)
18
The accompanying notes are an integral part of these financial statements.
Orinda SkyView Multi-Manager Hedged Equity Fund
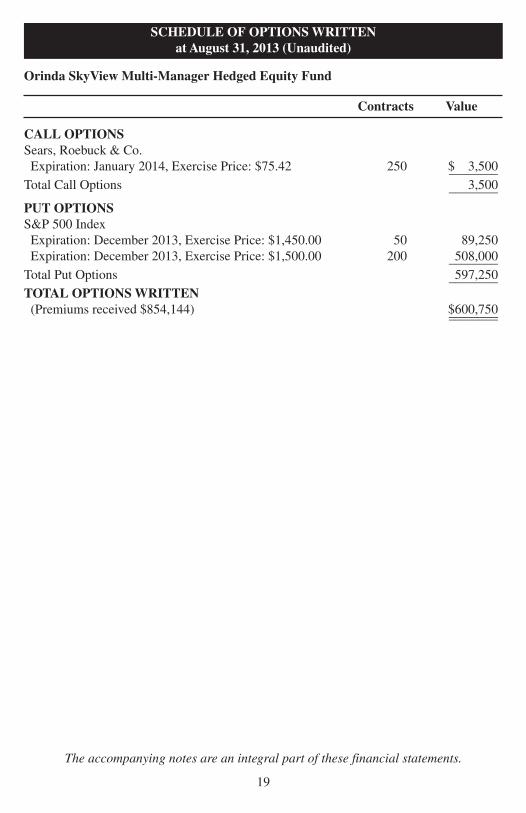
Contracts Value
CALL OPTIONSSears, Roebuck & Co.Expiration: January 2014, Exercise Price: $75.42 250 $ 3,500________Total Call Options 3,500________
PUT OPTIONSS&P 500 IndexExpiration: December 2013, Exercise Price: $1,450.00 50 89,250Expiration: December 2013, Exercise Price: $1,500.00 200 508,000________Total Put Options 597,250________TOTAL OPTIONSWRITTEN(Premiums received $854,144) $600,750________________
19
The accompanying notes are an integral part of these financial statements.
Orinda SkyView Multi-Manager Hedged Equity Fund
SCHEDULE OF OPTIONSWRITTENat August 31, 2013 (Unaudited)
20
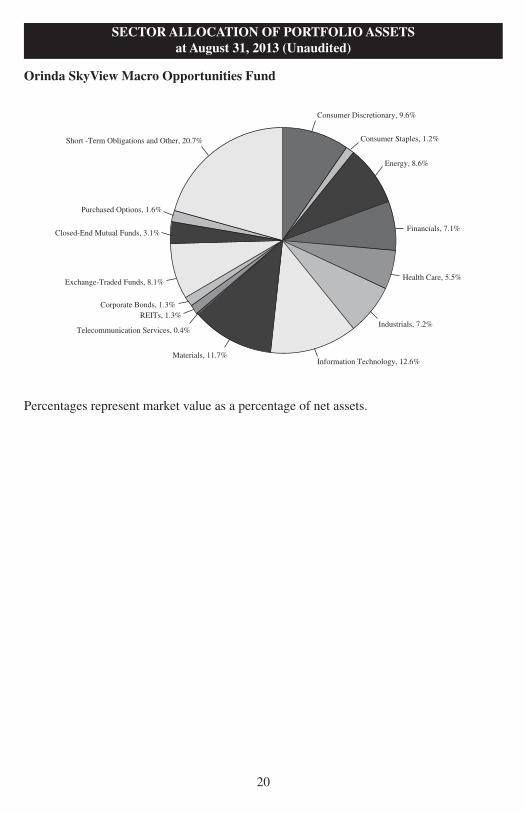
Orinda SkyView Macro Opportunities Fund
SECTORALLOCATION OF PORTFOLIOASSETSat August 31, 2013 (Unaudited)
Consumer Discretionary, 9.6%
Consumer Staples, 1.2%
Energy, 8.6%
Financials, 7.1%
Health Care, 5.5%
Industrials, 7.2%
Information Technology, 12.6%Materials, 11.7%
Telecommunication Services, 0.4%
REITs, 1.3%Corporate Bonds, 1.3%
Exchange-Traded Funds, 8.1%
Closed-End Mutual Funds, 3.1%
Purchased Options, 1.6%
Short -Term Obligations and Other, 20.7%
Percentages represent market value as a percentage of net assets.
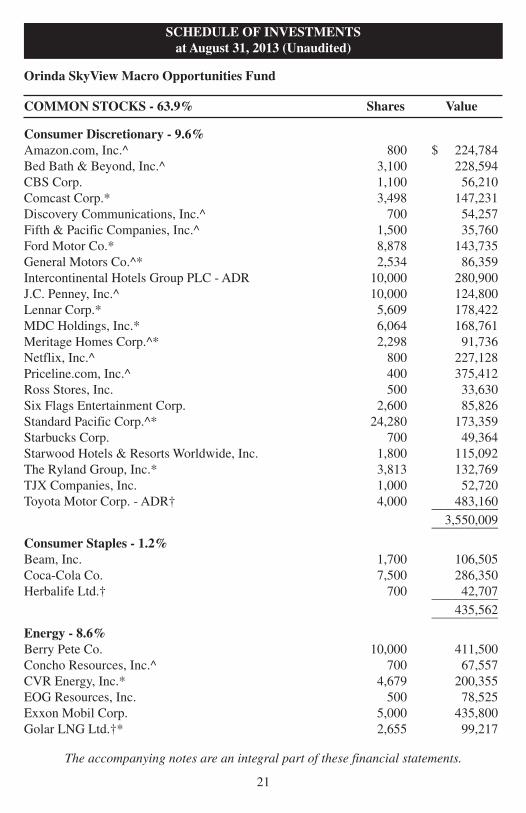
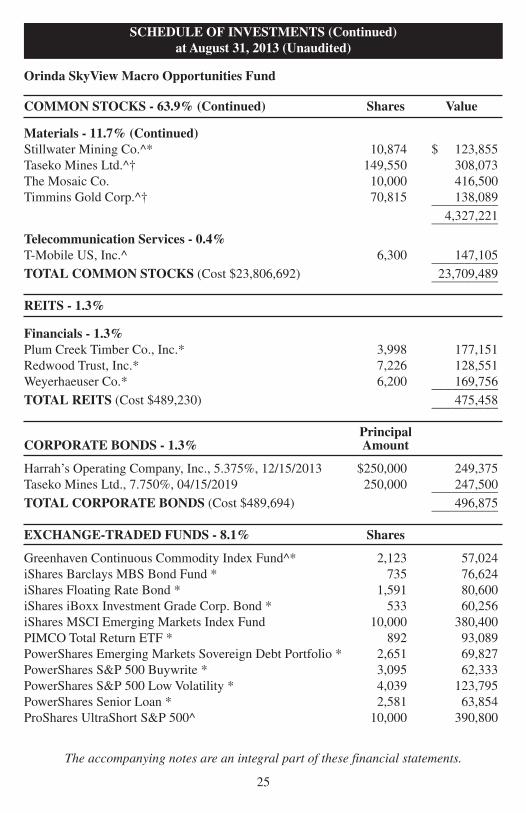
COMMON STOCKS - 63.9% Shares Value
Consumer Discretionary - 9.6%Amazon.com, Inc.^ 800 $ 224,784Bed Bath & Beyond, Inc.^ 3,100 228,594CBS Corp. 1,100 56,210Comcast Corp.* 3,498 147,231Discovery Communications, Inc.^ 700 54,257Fifth & Pacific Companies, Inc.^ 1,500 35,760Ford Motor Co.* 8,878 143,735General Motors Co.^* 2,534 86,359Intercontinental Hotels Group PLC - ADR 10,000 280,900J.C. Penney, Inc.^ 10,000 124,800Lennar Corp.* 5,609 178,422MDC Holdings, Inc.* 6,064 168,761Meritage Homes Corp.^* 2,298 91,736Netflix, Inc.^ 800 227,128Priceline.com, Inc.^ 400 375,412Ross Stores, Inc. 500 33,630Six Flags Entertainment Corp. 2,600 85,826Standard Pacific Corp.^* 24,280 173,359Starbucks Corp. 700 49,364Starwood Hotels & Resorts Worldwide, Inc. 1,800 115,092The Ryland Group, Inc.* 3,813 132,769TJX Companies, Inc. 1,000 52,720Toyota Motor Corp. - ADR† 4,000 483,160__________
3,550,009__________
Consumer Staples - 1.2%Beam, Inc. 1,700 106,505Coca-Cola Co. 7,500 286,350Herbalife Ltd.† 700 42,707__________
435,562__________
Energy - 8.6%Berry Pete Co. 10,000 411,500Concho Resources, Inc.^ 700 67,557CVR Energy, Inc.* 4,679 200,355EOG Resources, Inc. 500 78,525Exxon Mobil Corp. 5,000 435,800Golar LNG Ltd.†* 2,655 99,217
SCHEDULE OF INVESTMENTSat August 31, 2013 (Unaudited)
21
The accompanying notes are an integral part of these financial statements.
Orinda SkyView Macro Opportunities Fund
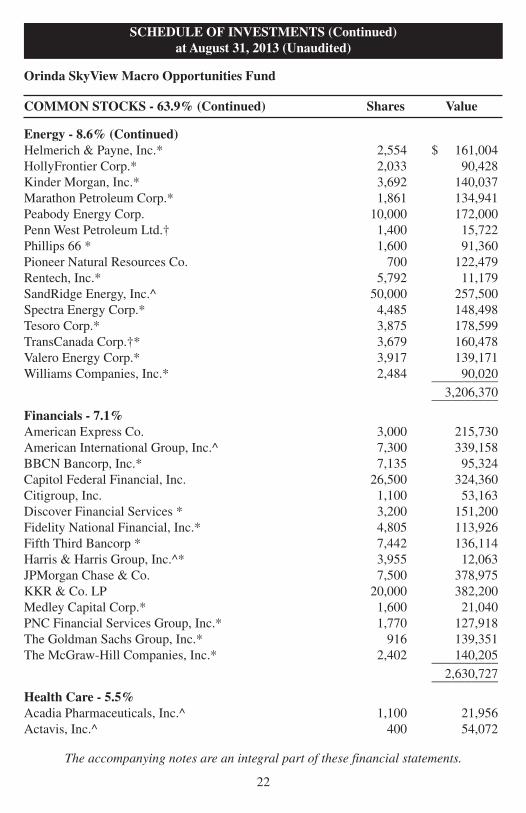
COMMON STOCKS - 63.9% (Continued) Shares Value
Energy - 8.6% (Continued)Helmerich & Payne, Inc.* 2,554 $ 161,004HollyFrontier Corp.* 2,033 90,428Kinder Morgan, Inc.* 3,692 140,037Marathon Petroleum Corp.* 1,861 134,941Peabody Energy Corp. 10,000 172,000Penn West Petroleum Ltd.† 1,400 15,722Phillips 66 * 1,600 91,360Pioneer Natural Resources Co. 700 122,479Rentech, Inc.* 5,792 11,179SandRidge Energy, Inc.^ 50,000 257,500Spectra Energy Corp.* 4,485 148,498Tesoro Corp.* 3,875 178,599TransCanada Corp.†* 3,679 160,478Valero Energy Corp.* 3,917 139,171Williams Companies, Inc.* 2,484 90,020__________
3,206,370__________
Financials - 7.1%American Express Co. 3,000 215,730American International Group, Inc.^ 7,300 339,158BBCN Bancorp, Inc.* 7,135 95,324Capitol Federal Financial, Inc. 26,500 324,360Citigroup, Inc. 1,100 53,163Discover Financial Services * 3,200 151,200Fidelity National Financial, Inc.* 4,805 113,926Fifth Third Bancorp * 7,442 136,114Harris & Harris Group, Inc.^* 3,955 12,063JPMorgan Chase & Co. 7,500 378,975KKR & Co. LP 20,000 382,200Medley Capital Corp.* 1,600 21,040PNC Financial Services Group, Inc.* 1,770 127,918The Goldman Sachs Group, Inc.* 916 139,351The McGraw-Hill Companies, Inc.* 2,402 140,205__________
2,630,727__________
Health Care - 5.5%Acadia Pharmaceuticals, Inc.^ 1,100 21,956Actavis, Inc.^ 400 54,072
SCHEDULE OF INVESTMENTS (Continued)at August 31, 2013 (Unaudited)
22
The accompanying notes are an integral part of these financial statements.
Orinda SkyView Macro Opportunities Fund
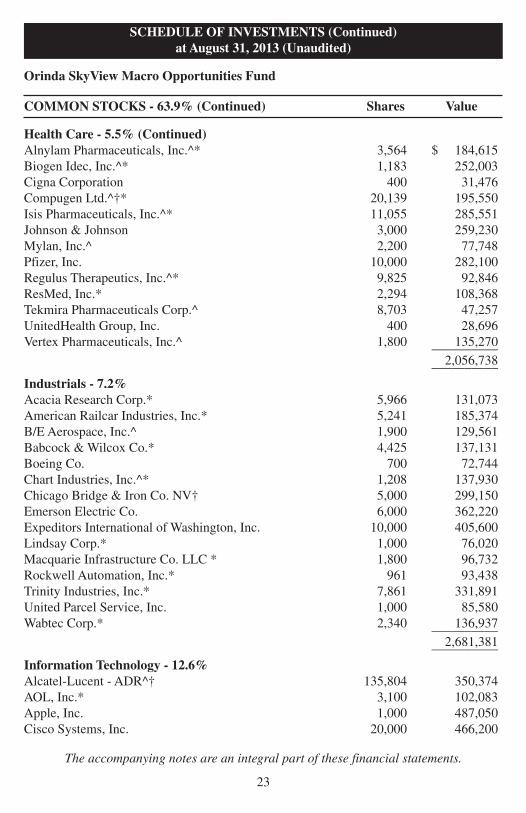
COMMON STOCKS - 63.9% (Continued) Shares Value
Health Care - 5.5% (Continued)Alnylam Pharmaceuticals, Inc.^* 3,564 $ 184,615Biogen Idec, Inc.^* 1,183 252,003Cigna Corporation 400 31,476Compugen Ltd.^†* 20,139 195,550Isis Pharmaceuticals, Inc.^* 11,055 285,551Johnson & Johnson 3,000 259,230Mylan, Inc.^ 2,200 77,748Pfizer, Inc. 10,000 282,100Regulus Therapeutics, Inc.^* 9,825 92,846ResMed, Inc.* 2,294 108,368Tekmira Pharmaceuticals Corp.^ 8,703 47,257UnitedHealth Group, Inc. 400 28,696Vertex Pharmaceuticals, Inc.^ 1,800 135,270__________
2,056,738__________
Industrials - 7.2%Acacia Research Corp.* 5,966 131,073American Railcar Industries, Inc.* 5,241 185,374B/E Aerospace, Inc.^ 1,900 129,561Babcock &Wilcox Co.* 4,425 137,131Boeing Co. 700 72,744Chart Industries, Inc.^* 1,208 137,930Chicago Bridge & Iron Co. NV† 5,000 299,150Emerson Electric Co. 6,000 362,220Expeditors International of Washington, Inc. 10,000 405,600Lindsay Corp.* 1,000 76,020Macquarie Infrastructure Co. LLC * 1,800 96,732Rockwell Automation, Inc.* 961 93,438Trinity Industries, Inc.* 7,861 331,891United Parcel Service, Inc. 1,000 85,580Wabtec Corp.* 2,340 136,937__________
2,681,381__________
Information Technology - 12.6%Alcatel-Lucent - ADR^† 135,804 350,374AOL, Inc.* 3,100 102,083Apple, Inc. 1,000 487,050Cisco Systems, Inc. 20,000 466,200
SCHEDULE OF INVESTMENTS (Continued)at August 31, 2013 (Unaudited)
23
The accompanying notes are an integral part of these financial statements.
Orinda SkyView Macro Opportunities Fund

COMMON STOCKS - 63.9% (Continued) Shares Value
Information Technology - 12.6% (Continued)Facebook, Inc.^* 12,468 $ 514,679FEI Co.* 1,762 137,930Google, Inc.^* 171 144,820Infosys Ltd. - ADR†* 2,560 118,707International Business Machines Corp. 2,500 455,675LinkedIn Corp.^ 700 168,028Microsoft Corp.* 5,022 167,735Pandora Media, Inc.^ 1,300 23,946Power Integrations, Inc. 1,300 67,756Qualcomm, Inc.* 14,351 951,184Ruckus Wireless, Inc.^ 3,100 42,129Synaptics, Inc.^* 2,695 104,189Taiwan Semiconductor - ADR†* 4,702 77,865Yahoo, Inc.^ 4,900 132,888Yelp, Inc.^ 3,100 161,138__________
4,674,376__________
Materials - 11.7%Agnico-Eagle Mines Ltd.†* 4,688 140,874Allied Nevada Gold Corp.^* 37,154 172,395AuRico Gold, Inc.†* 17,250 73,830Barrick Gold Corp.† 35,000 670,250E.I. du Pont de Nemours & Co. 700 39,634Eldorado Gold Corp.†* 23,149 197,924Endeavour Silver Corp.^†* 18,400 91,632Franco-Nevada Corp.†* 4,280 194,098Freeport-McMoRan Copper & Gold, Inc. 13,500 407,970Goldcorp, Inc.†* 6,093 179,743Hecla Mining Co. 40,796 139,522IAMGOLD Corp.†* 21,100 127,022Kinross Gold Corp.† 22,598 124,289Lyondellbasell Industries NV† 1,400 98,210New Gold, Inc.^†* 14,892 100,372North American Palladium Ltd.^† 76,993 77,763Pretium Resources, Inc.^† 10,327 87,160Royal Gold, Inc.* 2,424 140,665Rubicon Minerals Corp.^† 61,044 94,008Silver Wheaton Corp.†* 6,958 183,343
SCHEDULE OF INVESTMENTS (Continued)at August 31, 2013 (Unaudited)
24
The accompanying notes are an integral part of these financial statements.
Orinda SkyView Macro Opportunities Fund
COMMON STOCKS - 63.9% (Continued) Shares Value
Materials - 11.7% (Continued)Stillwater Mining Co.^* 10,874 $ 123,855Taseko Mines Ltd.^† 149,550 308,073The Mosaic Co. 10,000 416,500Timmins Gold Corp.^† 70,815 138,089__________
4,327,221__________
Telecommunication Services - 0.4%T-Mobile US, Inc.^ 6,300 147,105__________TOTAL COMMON STOCKS (Cost $23,806,692) 23,709,489__________
REITS - 1.3%
Financials - 1.3%Plum Creek Timber Co., Inc.* 3,998 177,151Redwood Trust, Inc.* 7,226 128,551Weyerhaeuser Co.* 6,200 169,756__________TOTAL REITS (Cost $489,230) 475,458__________
PrincipalCORPORATE BONDS - 1.3% Amount
Harrah’s Operating Company, Inc., 5.375%, 12/15/2013 $250,000 249,375Taseko Mines Ltd., 7.750%, 04/15/2019 250,000 247,500__________TOTAL CORPORATE BONDS (Cost $489,694) 496,875__________
EXCHANGE-TRADED FUNDS - 8.1% Shares
Greenhaven Continuous Commodity Index Fund^* 2,123 57,024iShares Barclays MBS Bond Fund * 735 76,624iShares Floating Rate Bond * 1,591 80,600iShares iBoxx Investment Grade Corp. Bond * 533 60,256iShares MSCI Emerging Markets Index Fund 10,000 380,400PIMCO Total Return ETF * 892 93,089PowerShares Emerging Markets Sovereign Debt Portfolio * 2,651 69,827PowerShares S&P 500 Buywrite * 3,095 62,333PowerShares S&P 500 LowVolatility * 4,039 123,795PowerShares Senior Loan * 2,581 63,854ProShares UltraShort S&P 500^ 10,000 390,800
SCHEDULE OF INVESTMENTS (Continued)at August 31, 2013 (Unaudited)
25
The accompanying notes are an integral part of these financial statements.
Orinda SkyView Macro Opportunities Fund

EXCHANGE-TRADED FUNDS - 8.1% Shares Value
SPDR DB International GovernmentInflation-Protected Bond^* 794 $ 45,623SPDR S&P 500 ETF Trust 2,800 458,220Sprott Physical Gold Trust Unit^†* 24,486 286,729Sprott Physical Platinum & Palladium Trust^†* 61,043 561,840Sprott Physical Silver Trust^†* 19,629 185,298__________TOTAL EXCHANGE-TRADED FUNDS(Cost $3,129,936) 2,996,312__________
CLOSED-END MUTUAL FUNDS - 3.1%
Central Fund of Canada Ltd.†* 71,060 1,136,960PennantPark Investment Corp.* 1,800 19,962__________TOTAL CLOSED-END MUTUAL FUNDS(Cost $1,119,446) 1,156,922__________
PURCHASED OPTIONS - 1.6% Contracts
Put Options - 1.6%Hewlett-Packard Co.Expiration: January 2014, Exercise Price: $15.00 250 6,000S&P 500 IndexExpiration: September 2013, Exercise Price: $1,500.00 65 32,500Expiration: December 2013, Exercise Price: $1,650.00 75 562,500Total Put Options 601,000__________TOTAL PURCHASED OPTIONS (Cost $766,761) 601,000__________
SCHEDULE OF INVESTMENTS (Continued)at August 31, 2013 (Unaudited)
26
The accompanying notes are an integral part of these financial statements.
Orinda SkyView Macro Opportunities Fund

SHORT-TERM INVESTMENTS - 29.0% Shares Value
MONEY MARKET FUNDS - 29.0%Fidelity Institutional Government Portfolio -Class I, 0.01%+ 10,745,028 $10,745,028__________TOTAL SHORT-TERM INVESTMENTS - 29.0% 10,745,028__________TOTAL INVESTMENTS (Cost $40,546,787) - 108.3% 40,181,084Liabilities in Excess of Other Assets - (8.3)% (3,065,816)__________TOTAL NETASSETS - 100.0% $37,115,268____________________Percentages are stated as a percent of net assets.
ADR - American Depositary Receipt^ Non-income producing.+ The rate shown represents the fund’s 7-day yield as of August 31, 2013.† U.S. traded security of a foreign issuer or corporation.* All or a portion of the security has been segregated for open short positions.
The Global Industry Classification Standard (GICS®) was developed by and/or is theexclusive property of MSCI, Inc. and Standard & Poor Financial Services LLC (“S&P”).GICS is a service mark of MSCI and S&P and has been licensed for use by US BancorpFund Services, LLC.
SCHEDULE OF INVESTMENTS (Continued)at August 31, 2013 (Unaudited)
27
The accompanying notes are an integral part of these financial statements.
Orinda SkyView Macro Opportunities Fund
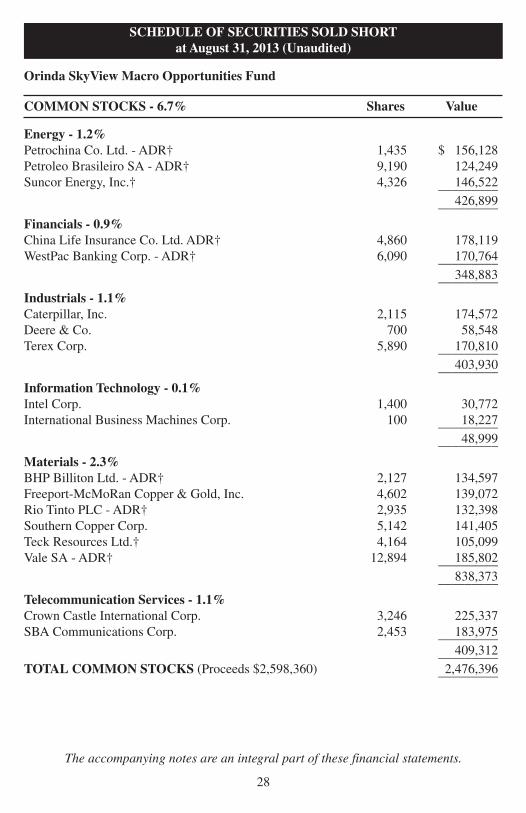
COMMON STOCKS - 6.7% Shares Value
Energy - 1.2%Petrochina Co. Ltd. - ADR† 1,435 $ 156,128Petroleo Brasileiro SA - ADR† 9,190 124,249Suncor Energy, Inc.† 4,326 146,522_________
426,899_________
Financials - 0.9%China Life Insurance Co. Ltd. ADR† 4,860 178,119WestPac Banking Corp. - ADR† 6,090 170,764_________
348,883_________
Industrials - 1.1%Caterpillar, Inc. 2,115 174,572Deere & Co. 700 58,548Terex Corp. 5,890 170,810_________
403,930_________
Information Technology - 0.1%Intel Corp. 1,400 30,772International Business Machines Corp. 100 18,227_________
48,999_________
Materials - 2.3%BHP Billiton Ltd. - ADR† 2,127 134,597Freeport-McMoRan Copper & Gold, Inc. 4,602 139,072Rio Tinto PLC - ADR† 2,935 132,398Southern Copper Corp. 5,142 141,405Teck Resources Ltd.† 4,164 105,099Vale SA - ADR† 12,894 185,802_________
838,373_________
Telecommunication Services - 1.1%Crown Castle International Corp. 3,246 225,337SBA Communications Corp. 2,453 183,975_________
409,312_________TOTAL COMMON STOCKS (Proceeds $2,598,360) 2,476,396_________
SCHEDULE OF SECURITIES SOLD SHORTat August 31, 2013 (Unaudited)
28
The accompanying notes are an integral part of these financial statements.
Orinda SkyView Macro Opportunities Fund
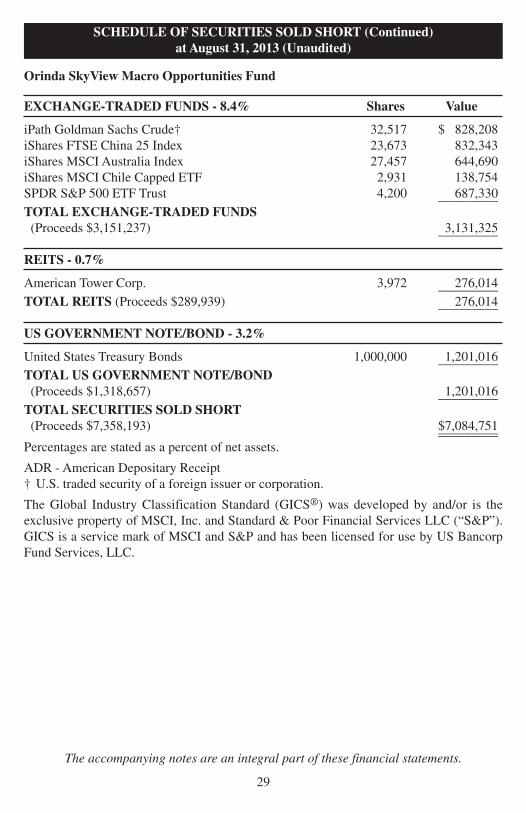
EXCHANGE-TRADED FUNDS - 8.4% Shares Value
iPath Goldman Sachs Crude† 32,517 $ 828,208iShares FTSE China 25 Index 23,673 832,343iShares MSCI Australia Index 27,457 644,690iShares MSCI Chile Capped ETF 2,931 138,754SPDR S&P 500 ETF Trust 4,200 687,330_________TOTAL EXCHANGE-TRADED FUNDS(Proceeds $3,151,237) 3,131,325_________
REITS - 0.7%
American Tower Corp. 3,972 276,014_________TOTAL REITS (Proceeds $289,939) 276,014_________
US GOVERNMENT NOTE/BOND - 3.2%
United States Treasury Bonds 1,000,000 1,201,016_________TOTAL US GOVERNMENT NOTE/BOND(Proceeds $1,318,657) 1,201,016_________TOTAL SECURITIES SOLD SHORT(Proceeds $7,358,193) $7,084,751__________________Percentages are stated as a percent of net assets.
ADR - American Depositary Receipt† U.S. traded security of a foreign issuer or corporation.
The Global Industry Classification Standard (GICS®) was developed by and/or is theexclusive property of MSCI, Inc. and Standard & Poor Financial Services LLC (“S&P”).GICS is a service mark of MSCI and S&P and has been licensed for use by US BancorpFund Services, LLC.
SCHEDULE OF SECURITIES SOLD SHORT (Continued)at August 31, 2013 (Unaudited)
29
The accompanying notes are an integral part of these financial statements.
Orinda SkyView Macro Opportunities Fund

Contracts Value
CALL OPTIONSBed Bath & Beyond, Inc.Expiration: September 2013, Exercise Price: $75.00 14 $ 1,120EOG Resources, Inc.Expiration: September 2013, Exercise Price: $165.00 5 560Facebook, Inc.Expiration: September 2013, Exercise Price: $42.50 7 224Priceline.com, Inc.Expiration: September 2013, Exercise Price: $940.00 1 950T-Mobile US, Inc.Expiration: September 2013, Exercise Price: $25.00 5 125________Total Call Options 2,979________
PUT OPTIONSDeere & Co.Expiration: September 2013, Exercise Price: $85.00 7 1,729Facebook, Inc.Expiration: September 2013, Exercise Price: $37.50 7 39Expiration: September 2013, Exercise Price: $41.00 7 469Expiration: September 2013, Exercise Price: $41.50 7 651Priceline.com, Inc.Expiration: September 2013, Exercise Price: $940.00 1 1,140S&P 500 IndexExpiration: December 2013, Exercise Price: $1,450.00 15 26,775Expiration: December 2013, Exercise Price: $1,500.00 65 165,100________Total Put Options 195,903________TOTAL OPTIONSWRITTEN(Premiums received $253,492) $198,882________________
SCHEDULE OF OPTIONSWRITTENat August 31, 2013 (Unaudited)
30
The accompanying notes are an integral part of these financial statements.
Orinda SkyView Macro Opportunities Fund
31
The accompanying notes are an integral part of these financial statements.
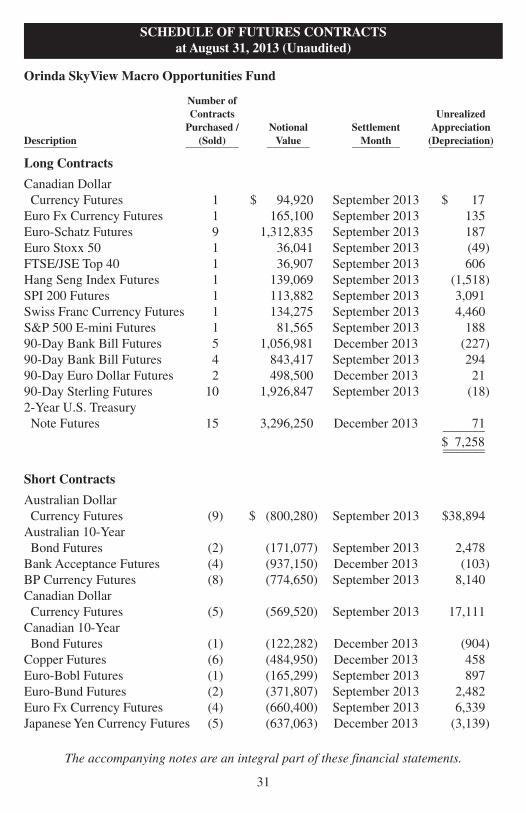
Number ofContracts UnrealizedPurchased / Notional Settlement Appreciation
Description (Sold) Value Month (Depreciation)__________ __________ ________ _________ ____________
Long Contracts
Canadian DollarCurrency Futures 1 $ 94,920 September 2013 $ 17Euro Fx Currency Futures 1 165,100 September 2013 135Euro-Schatz Futures 9 1,312,835 September 2013 187Euro Stoxx 50 1 36,041 September 2013 (49)FTSE/JSE Top 40 1 36,907 September 2013 606Hang Seng Index Futures 1 139,069 September 2013 (1,518)SPI 200 Futures 1 113,882 September 2013 3,091Swiss Franc Currency Futures 1 134,275 September 2013 4,460S&P 500 E-mini Futures 1 81,565 September 2013 18890-Day Bank Bill Futures 5 1,056,981 December 2013 (227)90-Day Bank Bill Futures 4 843,417 September 2013 29490-Day Euro Dollar Futures 2 498,500 December 2013 2190-Day Sterling Futures 10 1,926,847 September 2013 (18)2-Year U.S. TreasuryNote Futures 15 3,296,250 December 2013 71_______
$ 7,258______________
Short Contracts
Australian DollarCurrency Futures (9) $ (800,280) September 2013 $38,894Australian 10-YearBond Futures (2) (171,077) September 2013 2,478Bank Acceptance Futures (4) (937,150) December 2013 (103)BP Currency Futures (8) (774,650) September 2013 8,140Canadian DollarCurrency Futures (5) (569,520) September 2013 17,111Canadian 10-YearBond Futures (1) (122,282) December 2013 (904)Copper Futures (6) (484,950) December 2013 458Euro-Bobl Futures (1) (165,299) September 2013 897Euro-Bund Futures (2) (371,807) September 2013 2,482Euro Fx Currency Futures (4) (660,400) September 2013 6,339JapaneseYen Currency Futures (5) (637,063) December 2013 (3,139)
Orinda SkyView Macro Opportunities Fund
SCHEDULE OF FUTURES CONTRACTSat August 31, 2013 (Unaudited)

Number ofContracts UnrealizedPurchased / Notional Settlement Appreciation
Description (Sold) Value Month (Depreciation)__________ __________ ________ _________ ____________
JapaneseYenCurrency Futures (1) $ (127,350) September 2013 $(2,428)Long Gilt Futures (3) (508,609) December 2013 (221)Mexican Peso Futures (1) (37,350) September 2013 1,52290-Day Euro Dollar Futures (1) (248,263) December 2014 (65)90-Day Euro Dollar Futures (1) (245,938) December 2015 6090-Day Euro Dollar Futures (1) (247,300) June 2015 (27)90-Day Euro Dollar Futures (1) (244,475) June 2016 12390-Day Euro Dollar Futures (1) (247,838) March 2015 (52)90-Day Euro Dollar Futures (1) (245,200) March 2016 9890-Day Euro Dollar Futures (1) (246,650) September 2015 1090-Day Sterling Futures (3) (577,880) December 2013 143 Month Euro Euribor Futures (4) (1,316,760) March 2014 (337)3 Month Euro Swiss Franc(Euroswiss) InterestRate Futures (3) (805,659) March 2014 (32)5-Year U.S. TreasuryNote Futures (1) (119,680) December 2013 14710-Year U.S. TreasuryNote Futures (7) (869,969) December 2013 (901)30-Year U.S. TreasuryBond Futures (2) (263,813) December 2013 (972)_______
$69,592______________
As of August 31, 2013, initial margin deposits of $164,732 have been pledged in connectionwith futures contracts.
SCHEDULE OF FUTURES CONTRACTS (Continued)at August 31, 2013 (Unaudited)
32
The accompanying notes are an integral part of these financial statements.
Orinda SkyView Macro Opportunities Fund
SECTORALLOCATION OF PORTFOLIOASSETSat August 31, 2013 (Unaudited)
33
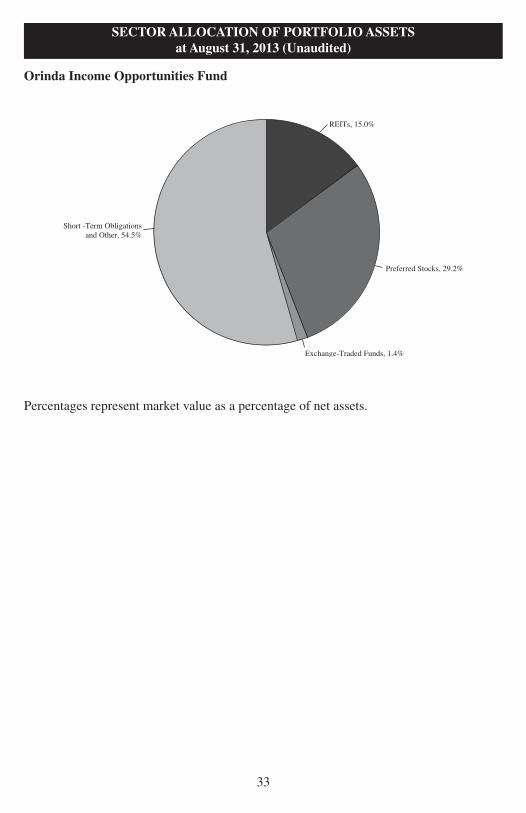
Orinda Income Opportunities Fund
REITs, 15.0%
Preferred Stocks, 29.2%
Exchange-Traded Funds, 1.4%
Short -Term Obligations and Other, 54.5%
Percentages represent market value as a percentage of net assets.
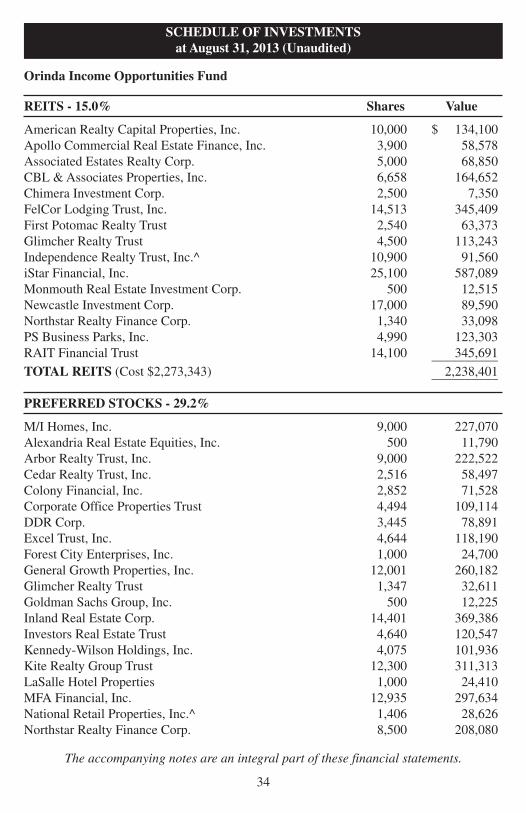
REITS - 15.0% Shares Value
American Realty Capital Properties, Inc. 10,000 $ 134,100Apollo Commercial Real Estate Finance, Inc. 3,900 58,578Associated Estates Realty Corp. 5,000 68,850CBL &Associates Properties, Inc. 6,658 164,652Chimera Investment Corp. 2,500 7,350FelCor Lodging Trust, Inc. 14,513 345,409First Potomac Realty Trust 2,540 63,373Glimcher Realty Trust 4,500 113,243Independence Realty Trust, Inc.^ 10,900 91,560iStar Financial, Inc. 25,100 587,089Monmouth Real Estate Investment Corp. 500 12,515Newcastle Investment Corp. 17,000 89,590Northstar Realty Finance Corp. 1,340 33,098PS Business Parks, Inc. 4,990 123,303RAIT Financial Trust 14,100 345,691__________TOTAL REITS (Cost $2,273,343) 2,238,401__________
PREFERRED STOCKS - 29.2%
M/I Homes, Inc. 9,000 227,070Alexandria Real Estate Equities, Inc. 500 11,790Arbor Realty Trust, Inc. 9,000 222,522Cedar Realty Trust, Inc. 2,516 58,497Colony Financial, Inc. 2,852 71,528Corporate Office Properties Trust 4,494 109,114DDR Corp. 3,445 78,891Excel Trust, Inc. 4,644 118,190Forest City Enterprises, Inc. 1,000 24,700General Growth Properties, Inc. 12,001 260,182Glimcher Realty Trust 1,347 32,611Goldman Sachs Group, Inc. 500 12,225Inland Real Estate Corp. 14,401 369,386Investors Real Estate Trust 4,640 120,547Kennedy-Wilson Holdings, Inc. 4,075 101,936Kite Realty Group Trust 12,300 311,313LaSalle Hotel Properties 1,000 24,410MFA Financial, Inc. 12,935 297,634National Retail Properties, Inc.^ 1,406 28,626Northstar Realty Finance Corp. 8,500 208,080
SCHEDULE OF INVESTMENTSat August 31, 2013 (Unaudited)
34
The accompanying notes are an integral part of these financial statements.
Orinda Income Opportunities Fund
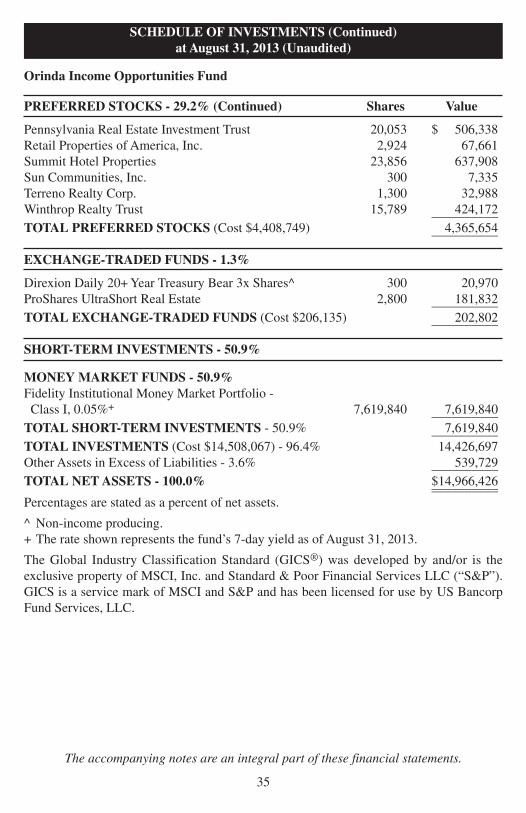
PREFERRED STOCKS - 29.2% (Continued) Shares Value
Pennsylvania Real Estate Investment Trust 20,053 $ 506,338Retail Properties of America, Inc. 2,924 67,661Summit Hotel Properties 23,856 637,908Sun Communities, Inc. 300 7,335Terreno Realty Corp. 1,300 32,988Winthrop Realty Trust 15,789 424,172__________TOTAL PREFERRED STOCKS (Cost $4,408,749) 4,365,654__________
EXCHANGE-TRADED FUNDS - 1.3%
Direxion Daily 20+Year Treasury Bear 3x Shares^ 300 20,970ProShares UltraShort Real Estate 2,800 181,832__________TOTAL EXCHANGE-TRADED FUNDS (Cost $206,135) 202,802__________
SHORT-TERM INVESTMENTS - 50.9%
MONEY MARKET FUNDS - 50.9%Fidelity Institutional Money Market Portfolio -Class I, 0.05%+ 7,619,840 7,619,840__________TOTAL SHORT-TERM INVESTMENTS - 50.9% 7,619,840__________TOTAL INVESTMENTS (Cost $14,508,067) - 96.4% 14,426,697Other Assets in Excess of Liabilities - 3.6% 539,729__________TOTAL NETASSETS - 100.0% $14,966,426____________________Percentages are stated as a percent of net assets.
^ Non-income producing.+ The rate shown represents the fund’s 7-day yield as of August 31, 2013.
The Global Industry Classification Standard (GICS®) was developed by and/or is theexclusive property of MSCI, Inc. and Standard & Poor Financial Services LLC (“S&P”).GICS is a service mark of MSCI and S&P and has been licensed for use by US BancorpFund Services, LLC.
SCHEDULE OF INVESTMENTS (Continued)at August 31, 2013 (Unaudited)
35
The accompanying notes are an integral part of these financial statements.
Orinda Income Opportunities Fund
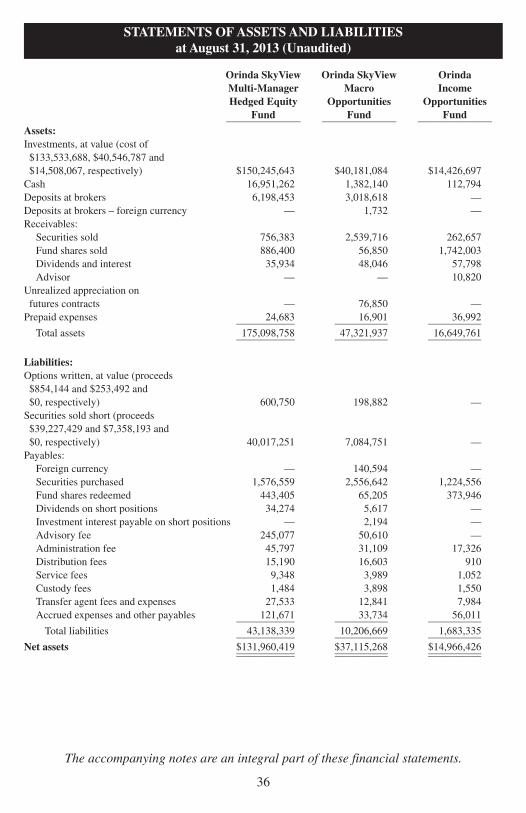
Orinda SkyView Orinda SkyView OrindaMulti-Manager Macro IncomeHedged Equity Opportunities Opportunities
Fund Fund Fund______________ ______________ ______________Assets:Investments, at value (cost of$133,533,688, $40,546,787 and$14,508,067, respectively) $150,245,643 $40,181,084 $14,426,697Cash 16,951,262 1,382,140 112,794Deposits at brokers 6,198,453 3,018,618 —Deposits at brokers – foreign currency — 1,732 —Receivables:
Securities sold 756,383 2,539,716 262,657Fund shares sold 886,400 56,850 1,742,003Dividends and interest 35,934 48,046 57,798Advisor — — 10,820
Unrealized appreciation onfutures contracts — 76,850 —Prepaid expenses 24,683 16,901 36,992___________ __________ __________
Total assets 175,098,758 47,321,937 16,649,761___________ __________ __________
Liabilities:Options written, at value (proceeds$854,144 and $253,492 and$0, respectively) 600,750 198,882 —Securities sold short (proceeds$39,227,429 and $7,358,193 and$0, respectively) 40,017,251 7,084,751 —Payables:
Foreign currency — 140,594 —Securities purchased 1,576,559 2,556,642 1,224,556Fund shares redeemed 443,405 65,205 373,946Dividends on short positions 34,274 5,617 —Investment interest payable on short positions — 2,194 —Advisory fee 245,077 50,610 —Administration fee 45,797 31,109 17,326Distribution fees 15,190 16,603 910Service fees 9,348 3,989 1,052Custody fees 1,484 3,898 1,550Transfer agent fees and expenses 27,533 12,841 7,984Accrued expenses and other payables 121,671 33,734 56,011___________ __________ __________Total liabilities 43,138,339 10,206,669 1,683,335___________ __________ __________
Net assets $131,960,419 $37,115,268 $14,966,426___________ __________ _____________________ __________ __________
STATEMENTS OFASSETSAND LIABILITIESat August 31, 2013 (Unaudited)
36
The accompanying notes are an integral part of these financial statements.

STATEMENTS OFASSETSAND LIABILITIES (Continued)at August 31, 2013 (Unaudited)
37
The accompanying notes are an integral part of these financial statements.
Orinda SkyView Orinda SkyView OrindaMulti-Manager Macro IncomeHedged Equity Opportunities Opportunities
Fund Fund Fund______________ ______________ ______________Net assets consist of:Paid in capital $117,321,325 $37,849,508 $15,062,193Accumulated net investment income (loss) (2,444,470) (570,855) 51,614Accumulated net realized gain (loss)on investments 908,043 (204,289) (66,011)Net unrealized appreciation (depreciation) on:
Investments 17,182,451 (199,942) (81,370)Options (470,496) (165,761) —Foreign currency related transactions (6) 1,705 —Securities sold short (789,822) 273,442 —Written options contracts 253,394 54,610 —Futures contracts — 76,850 —___________ __________ __________
Net assets $131,960,419 $37,115,268 $14,966,426___________ __________ _____________________ __________ __________Class A:
Net assets applicable to outstandingClass A shares $ 30,564,520 $18,699,486 $ 5,395,859Shares issued (Unlimited number ofbeneficial interest authorized,$0.01 par value) 1,147,856 752,834 217,156___________ __________ __________Net asset value andredemption price per share $ 26.63 $ 24.84 $ 24.85___________ __________ _____________________ __________ __________Maximum offering price per share(net asset value divided by 95.00%) $ 28.03 $ 26.15 $ 26.16___________ __________ _____________________ __________ __________
Class I:Net assets applicable to outstandingClass I shares 101,395,899 18,415,782 $ 9,570,567Shares issued (Unlimited number ofbeneficial interest authorized,$0.01 par value) 3,780,065 738,556 384,941___________ __________ __________Net asset value, offering price andredemption price per share $ 26.82 $ 24.93 $ 24.86___________ __________ _____________________ __________ __________
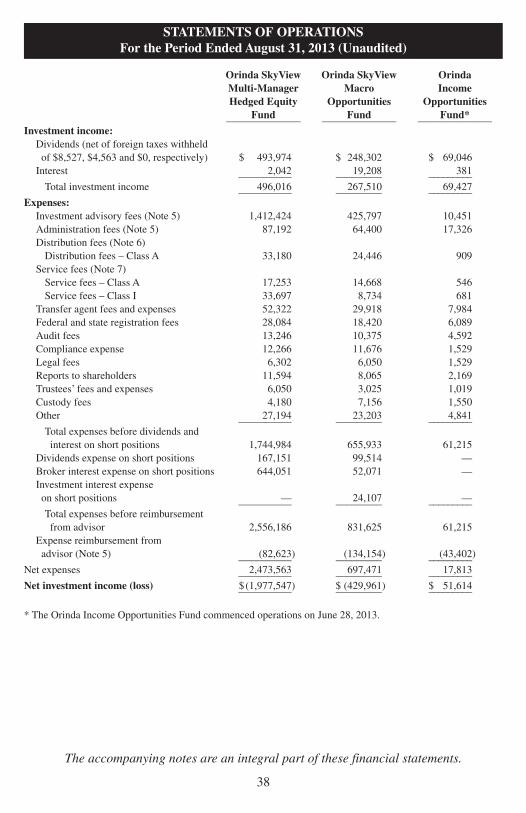
Orinda SkyView Orinda SkyView OrindaMulti-Manager Macro IncomeHedged Equity Opportunities Opportunities
Fund Fund Fund*______________ ______________ ______________Investment income:
Dividends (net of foreign taxes withheldof $8,527, $4,563 and $0, respectively) $ 493,974 $ 248,302 $ 69,046Interest 2,042 19,208 381__________ _________ _________Total investment income 496,016 267,510 69,427__________ _________ _________
Expenses:Investment advisory fees (Note 5) 1,412,424 425,797 10,451Administration fees (Note 5) 87,192 64,400 17,326Distribution fees (Note 6)Distribution fees – Class A 33,180 24,446 909
Service fees (Note 7)Service fees – Class A 17,253 14,668 546Service fees – Class I 33,697 8,734 681
Transfer agent fees and expenses 52,322 29,918 7,984Federal and state registration fees 28,084 18,420 6,089Audit fees 13,246 10,375 4,592Compliance expense 12,266 11,676 1,529Legal fees 6,302 6,050 1,529Reports to shareholders 11,594 8,065 2,169Trustees’ fees and expenses 6,050 3,025 1,019Custody fees 4,180 7,156 1,550Other 27,194 23,203 4,841__________ _________ _________Total expenses before dividends andinterest on short positions 1,744,984 655,933 61,215
Dividends expense on short positions 167,151 99,514 —Broker interest expense on short positions 644,051 52,071 —Investment interest expenseon short positions — 24,107 —__________ _________ _________Total expenses before reimbursementfrom advisor 2,556,186 831,625 61,215
Expense reimbursement fromadvisor (Note 5) (82,623) (134,154) (43,402)__________ _________ _________
Net expenses 2,473,563 697,471 17,813__________ _________ _________Net investment income (loss) $(1,977,547) $ (429,961) $ 51,614__________ _________ _________
* The Orinda Income Opportunities Fund commenced operations on June 28, 2013.
STATEMENTS OF OPERATIONSFor the Period Ended August 31, 2013 (Unaudited)
38
The accompanying notes are an integral part of these financial statements.

STATEMENT OF OPERATIONS (Continued)For the Period Ended August 31, 2013* (Unaudited)
39
The accompanying notes are an integral part of these financial statements.
Orinda SkyView Orinda SkyView OrindaMulti-Manager Macro IncomeHedged Equity Opportunities Opportunities
Fund Fund Fund*______________ ______________ ______________Realized and unrealizedgain (loss) on investments:Net realized gain (loss)on transactions from:Investments $11,051,757 $ (308,505) $ (66,011)Options 1,233,953 (148,808) —Foreign currency related transactions 10 1,605 —Securities sold short (5,892,439) 19,050 —Written options contracts 72,116 102,866 —Futures contracts 243,523 211,488 —
Net change in unrealized gain (loss) on:Investments 3,089,195 (414,448) (81,370)Options (246,288) (96,953) —Foreign currency related transactions (2) (215) —Securities sold short (2,209,918) 444,365 —Written options contracts 271,670 54,610 —Futures contracts (441) (71,774) —__________ _________ _________
Net realized and unrealizedgain (loss) on investments 7,613,136 (206,719) (147,381)__________ _________ _________Net increase (decrease) in net assetsresulting from operations $ 5,635,589 $ (636,680) $ (95,767)__________ _________ ___________________ _________ _________
* The Orinda Income Opportunities Fund commenced operations on June 28, 2013.
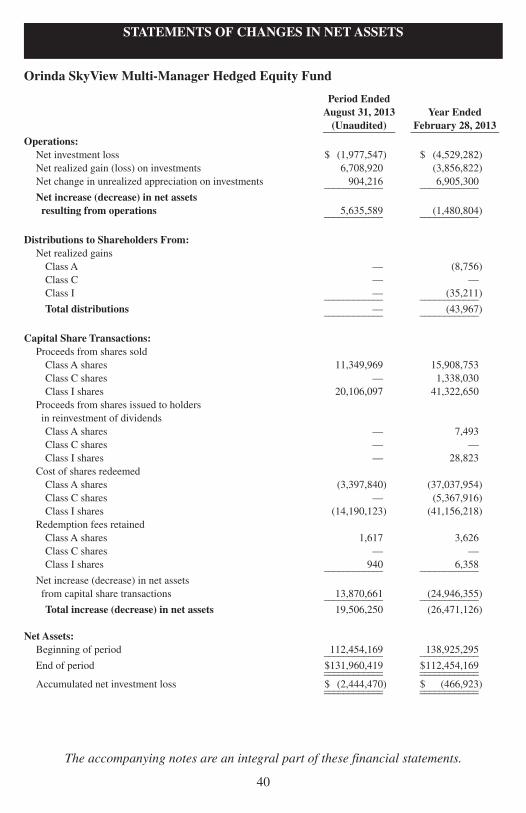
Period EndedAugust 31, 2013 Year Ended(Unaudited) February 28, 2013______________ _________________
Operations:Net investment loss $ (1,977,547) $ (4,529,282)Net realized gain (loss) on investments 6,708,920 (3,856,822)Net change in unrealized appreciation on investments 904,216 6,905,300____________ ____________Net increase (decrease) in net assetsresulting from operations 5,635,589 (1,480,804)____________ ____________
Distributions to Shareholders From:Net realized gainsClass A — (8,756)Class C — —Class I — (35,211)____________ ____________Total distributions — (43,967)____________ ____________
Capital Share Transactions:Proceeds from shares soldClass A shares 11,349,969 15,908,753Class C shares — 1,338,030Class I shares 20,106,097 41,322,650
Proceeds from shares issued to holdersin reinvestment of dividendsClass A shares — 7,493Class C shares — —Class I shares — 28,823
Cost of shares redeemedClass A shares (3,397,840) (37,037,954)Class C shares — (5,367,916)Class I shares (14,190,123) (41,156,218)
Redemption fees retainedClass A shares 1,617 3,626Class C shares — —Class I shares 940 6,358____________ ____________
Net increase (decrease) in net assetsfrom capital share transactions 13,870,661 (24,946,355)____________ ____________Total increase (decrease) in net assets 19,506,250 (26,471,126)
Net Assets:Beginning of period 112,454,169 138,925,295____________ ____________End of period $131,960,419 $112,454,169____________ ________________________ ____________Accumulated net investment loss $ (2,444,470) $ (466,923)____________ ________________________ ____________
40
The accompanying notes are an integral part of these financial statements.
Orinda SkyView Multi-Manager Hedged Equity Fund
STATEMENTS OF CHANGES IN NETASSETS

Period EndedAugust 31, 2013 Year Ended(Unaudited) February 28, 2013______________ _________________
Changes in Shares Outstanding:Shares soldClass A shares 434,401 640,779Class C shares — 53,665Class I shares 761,983 1,652,349
Proceeds from shares issued to holdersin reinvestment of dividendsClass A shares — 307Class C shares — —Class I shares — 1,176
Shares redeemedClass A shares (130,376) (1,510,948)Class C shares — (221,844)Class I shares (538,748) (1,668,841)____________ ____________
Net increase (decrease) in shares outstanding 527,260 (1,053,357)____________ ________________________ ____________
STATEMENTS OF CHANGES IN NETASSETS (Continued)
41
The accompanying notes are an integral part of these financial statements.
Orinda SkyView Multi-Manager Hedged Equity Fund

Period EndedAugust 31, 2013 Year Ended(Unaudited) February 28, 2013*______________ _________________
Operations:Net investment loss $ (429,961) $ (301,919)Net realized gain (loss) on investments (122,304) 98,095Net change in unrealized appreciation (depreciation)on investments (84,415) 125,329__________ __________Net decrease in net assetsresulting from operations (636,680) (78,495)__________ __________
Distributions to Shareholders From:Net realized gainsClass A — (12,991)Class I — (6,074)__________ __________Total distributions — (19,065)__________ __________
Capital Share Transactions:Proceeds from shares soldClass A shares 4,512,263 19,163,499Class I shares 7,326,701 14,112,061
Proceeds from shares issued to holdersin reinvestment of dividendsClass A shares — 12,322Class I shares — 6,042
Cost of shares redeemedClass A shares (2,817,276) (1,829,880)Class I shares (1,492,619) (1,146,142)
Redemption fees retainedClass A shares 369 1,590Class I shares 434 144__________ __________
Net increase in net assetsfrom capital share transactions 7,529,872 30,319,636__________ __________Total increase in net assets 6,893,192 30,222,076
Net Assets:Beginning of period 30,222,076 —__________ __________End of period $37,115,268 $30,222,076__________ ____________________ __________Accumulated net investment loss $ (570,855) $ (140,894)__________ ____________________ __________
* The Orinda SkyView Macro Opportunities Fund commenced operations on April 30, 2012.
STATEMENTS OF CHANGES IN NETASSETS
42
The accompanying notes are an integral part of these financial statements.
Orinda SkyView Macro Opportunities Fund*
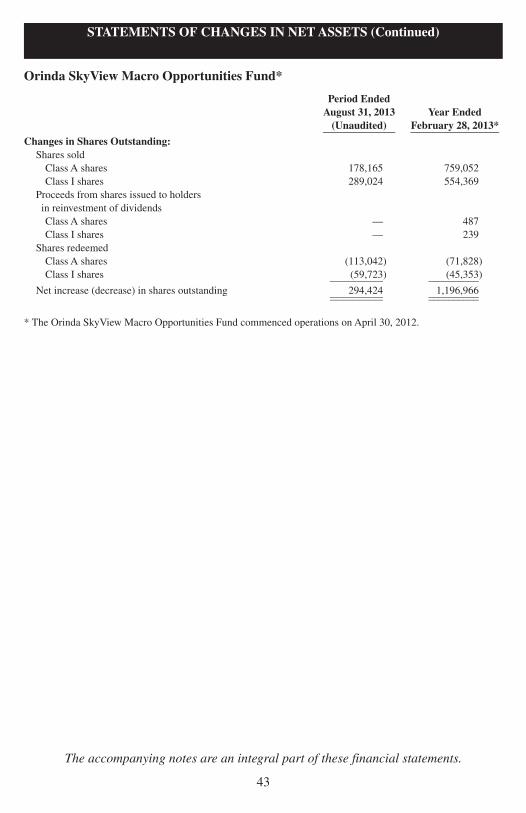
Period EndedAugust 31, 2013 Year Ended(Unaudited) February 28, 2013*______________ _________________
Changes in Shares Outstanding:Shares soldClass A shares 178,165 759,052Class I shares 289,024 554,369
Proceeds from shares issued to holdersin reinvestment of dividendsClass A shares — 487Class I shares — 239
Shares redeemedClass A shares (113,042) (71,828)Class I shares (59,723) (45,353)__________ __________
Net increase (decrease) in shares outstanding 294,424 1,196,966__________ ____________________ __________
* The Orinda SkyView Macro Opportunities Fund commenced operations on April 30, 2012.
STATEMENTS OF CHANGES IN NETASSETS (Continued)
43
The accompanying notes are an integral part of these financial statements.
Orinda SkyView Macro Opportunities Fund*
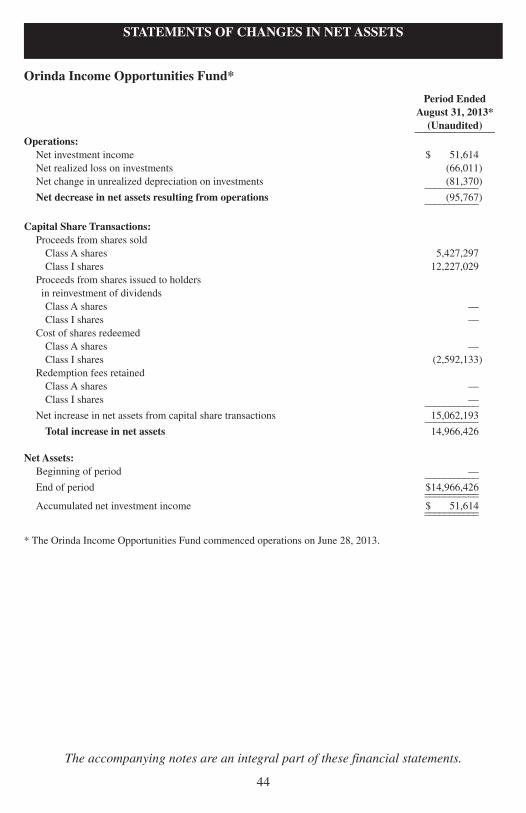
Period EndedAugust 31, 2013*(Unaudited)________________
Operations:Net investment income $ 51,614Net realized loss on investments (66,011)Net change in unrealized depreciation on investments (81,370)___________Net decrease in net assets resulting from operations (95,767)___________
Capital Share Transactions:Proceeds from shares soldClass A shares 5,427,297Class I shares 12,227,029
Proceeds from shares issued to holdersin reinvestment of dividendsClass A shares —Class I shares —
Cost of shares redeemedClass A shares —Class I shares (2,592,133)
Redemption fees retainedClass A shares —Class I shares —___________
Net increase in net assets from capital share transactions 15,062,193___________Total increase in net assets 14,966,426
Net Assets:Beginning of period —___________End of period $14,966,426______________________Accumulated net investment income $ 51,614______________________
* The Orinda Income Opportunities Fund commenced operations on June 28, 2013.
STATEMENTS OF CHANGES IN NETASSETS
44
The accompanying notes are an integral part of these financial statements.
Orinda Income Opportunities Fund*
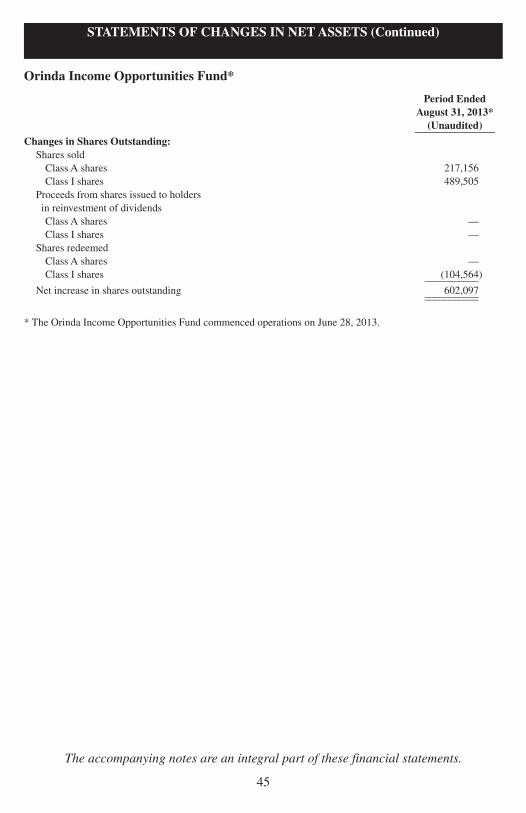
Period EndedAugust 31, 2013*(Unaudited)________________
Changes in Shares Outstanding:Shares soldClass A shares 217,156Class I shares 489,505
Proceeds from shares issued to holdersin reinvestment of dividendsClass A shares —Class I shares —
Shares redeemedClass A shares —Class I shares (104,564)___________
Net increase in shares outstanding 602,097______________________
* The Orinda Income Opportunities Fund commenced operations on June 28, 2013.
STATEMENTS OF CHANGES IN NETASSETS (Continued)
45
The accompanying notes are an integral part of these financial statements.
Orinda Income Opportunities Fund*

Increase (decrease) in cash —
Cash flows from operating activities:Net decrease in net assets from operations $ 5,635,589Adjustments to reconcile net increase (decrease) in net assetsfrom operations to net cash used in operating activities:
Purchases of investments (84,010,546)Proceeds for dispositions of investment securities 97,815,458Purchase of short term investments, net (26,590,266)Decrease in deposits at broker 10,464,860Decrease in dividends and interest receivable 18,030Decrease in receivable for securities sold 3,745,089Decrease in prepaid expenses and other assets 15,223Increase in options written 432,420Decrease in unrealized appreciation on futures contracts 441Increase in proceeds on securities sold short 4,729,202Decrease in payable for securities purchased (396,666)Decrease in payable for dividends on short positions (2,842)Increase in accrued management fees 65,242Increase in accrued administration fees 13,412Increase in distribution and service fees 8,728Increase in custody fees 1,200Increase in transfer agent expenses 8,669Increase in other accrued expenses 87,813Unrealized depreciation on securities (2,842,907)Net realized gain on investments (12,285,710)___________
Net cash used in operating activities (3,087,561)___________
Cash flows from financing activities:Proceeds from shares sold 30,888,139Payment on shares redeemed (17,749,316)Distributions paid in cash —___________
Net cash provided by financing activities 13,138,823___________Net increase in cash 10,051,262
Cash:Beginning balance 6,900,000___________Ending balance $ 16,951,262______________________
Supplemental information:Cash paid for interest $ 644,051
46
The accompanying notes are an integral part of these financial statements.
Orinda SkyView Multi-Manager Hedged Equity Fund
STATEMENT OF CASH FLOWSFor the Period Ended August 31, 2013 (Unaudited)
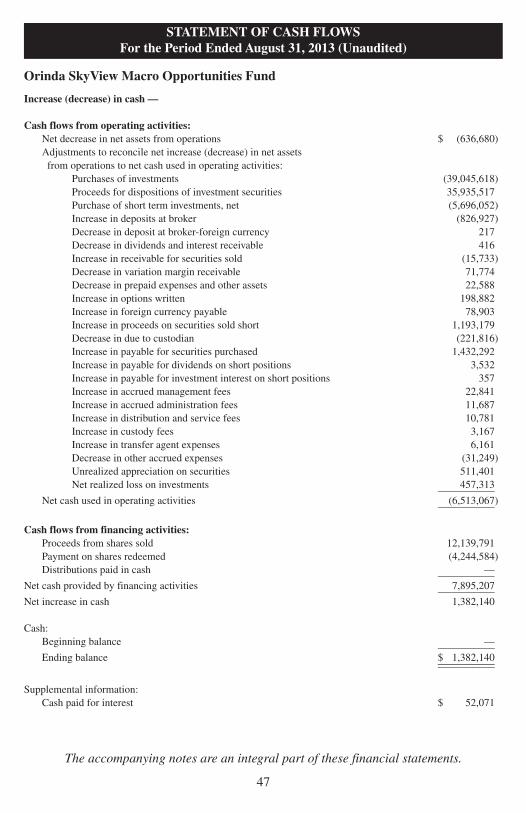
Increase (decrease) in cash —
Cash flows from operating activities:Net decrease in net assets from operations $ (636,680)Adjustments to reconcile net increase (decrease) in net assetsfrom operations to net cash used in operating activities:
Purchases of investments (39,045,618)Proceeds for dispositions of investment securities 35,935,517Purchase of short term investments, net (5,696,052)Increase in deposits at broker (826,927)Decrease in deposit at broker-foreign currency 217Decrease in dividends and interest receivable 416Increase in receivable for securities sold (15,733)Decrease in variation margin receivable 71,774Decrease in prepaid expenses and other assets 22,588Increase in options written 198,882Increase in foreign currency payable 78,903Increase in proceeds on securities sold short 1,193,179Decrease in due to custodian (221,816)Increase in payable for securities purchased 1,432,292Increase in payable for dividends on short positions 3,532Increase in payable for investment interest on short positions 357Increase in accrued management fees 22,841Increase in accrued administration fees 11,687Increase in distribution and service fees 10,781Increase in custody fees 3,167Increase in transfer agent expenses 6,161Decrease in other accrued expenses (31,249)Unrealized appreciation on securities 511,401Net realized loss on investments 457,313___________
Net cash used in operating activities (6,513,067)___________
Cash flows from financing activities:Proceeds from shares sold 12,139,791Payment on shares redeemed (4,244,584)Distributions paid in cash —___________
Net cash provided by financing activities 7,895,207___________Net increase in cash 1,382,140
Cash:Beginning balance —___________Ending balance $ 1,382,140______________________
Supplemental information:Cash paid for interest $ 52,071
STATEMENT OF CASH FLOWSFor the Period Ended August 31, 2013 (Unaudited)
47
The accompanying notes are an integral part of these financial statements.
Orinda SkyView Macro Opportunities Fund

For a capital share outstanding throughout each period
Class AFor the Six
Months Ended For the March 31, 2011August 31, Year Ended through2013 February 28, February 29,
(Unaudited) 2013 2012*_____________ ___________ _____________Net Asset Value – Beginning of Period $ 25.43 $ 25.43 $ 25.00_______ _______ _______Income from Investment Operations:Net investment income (loss) (0.30) (1.33) (0.21)Net realized and unrealized gain (loss) on investments 1.50 1.34 0.64_______ _______ _______
Total from investment operations 1.20 0.01 0.43_______ _______ _______Less Distributions:Dividends from net investment income — — —Distributions from net realized gains — (0.01) —_______ _______ _______
Total distributions — (0.01) —_______ _______ _______Net Asset Value – End of Period $ 26.63 $ 25.43 $ 25.43_______ _______ ______________ _______ _______Total Return 4.72%+ 0.04% 1.72%+
Ratios and Supplemental Data:Net assets, end of period (thousands) $30,564 $21,461 $43,583Ratio of operating expenses to average net assets:
Before Reimbursements 4.40%^ 4.86% 4.38%^After Reimbursements 4.26%^ 4.72% 3.90%^
Ratio of interest expense and dividends on short positionsto average net assets 1.31%^ 1.77% 0.95%^Ratio of operating expenses excluding interest expense anddividend payments on short positions to average net assets:
Before Reimbursements 3.09%^ 3.09% 3.43%^After Reimbursements 2.95%^ 2.95% 2.95%^
Ratio of net investment income (loss) to average net assets:Before Reimbursements (1.48)%^ (3.85)% (3.68)%^After Reimbursements (1.34)%^ (3.71)% (3.20)%^
Portfolio turnover rate 104%+ 130% 87%+
* Commencement of operations for Class A shares was March 31, 2011.+ Not Annualized^ Annualized
48
The accompanying notes are an integral part of these financial statements.
Orinda SkyView Multi-Manager Hedged Equity Fund
FINANCIAL HIGHLIGHTS

For a capital share outstanding throughout each period
Class IFor the Six
Months Ended For the March 31, 2011August 31, Year Ended through2013 February 28, February 29,
(Unaudited) 2013 2012*_____________ ___________ _____________Net Asset Value – Beginning of Period $ 25.58 $ 25.50 $ 25.00_______ _______ _______Income from Investment Operations:Net investment income (loss) (0.40) (0.91) (0.28)Net realized and unrealized gain (loss) on investments 1.64 1.00 0.78_______ _______ _______
Total from investment operations 1.24 0.09 0.50_______ _______ _______Less Distributions:Dividends from net investment income — — —Distributions from net realized gains — (0.01) —_______ _______ _______
Total distributions — (0.01) —_______ _______ _______Net Asset Value – End of Period $ 26.82 $ 25.58 $ 25.50_______ _______ ______________ _______ _______Total Return 4.85%+ 0.35% 2.00%+
Ratios and Supplemental Data:Net assets, end of period (thousands) $101,396 $90,993 $91,096Ratio of operating expenses to average net assets:
Before Reimbursements 4.10%^ 4.68% 4.14%^After Reimbursements 3.97%^ 4.52% 3.60%^
Ratio of interest expense and dividends on short positionsto average net assets 1.33%^ 1.88% 0.96%^Ratio of operating expenses excluding interest expense anddividend payments on short positions to average net assets:
Before Reimbursements 2.77%^ 2.80% 3.18%^After Reimbursements 2.64%^ 2.64% 2.64%^
Ratio of net investment income (loss) to average net assets:Before Reimbursements (3.29)%^ (3.63)% (3.46)%^After Reimbursements (3.16)%^ (3.47)% (2.92)%^
Portfolio turnover rate 104%+ 130% 87%+
* Commencement of operations for Class I shares was March 31, 2011.+ Not Annualized^ Annualized
49
The accompanying notes are an integral part of these financial statements.
Orinda SkyView Multi-Manager Hedged Equity Fund
FINANCIAL HIGHLIGHTS (Continued)
For a capital share outstanding throughout each period
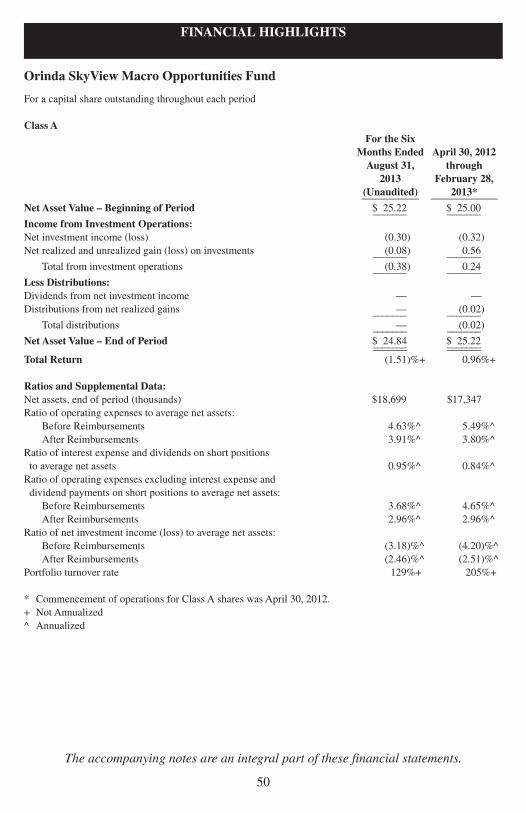
Class AFor the Six
Months Ended April 30, 2012August 31, through2013 February 28,
(Unaudited) 2013*___________ _____________Net Asset Value – Beginning of Period $ 25.22 $ 25.00_______ _______Income from Investment Operations:Net investment income (loss) (0.30) (0.32)Net realized and unrealized gain (loss) on investments (0.08) 0.56_______ _______
Total from investment operations (0.38) 0.24_______ _______Less Distributions:Dividends from net investment income — —Distributions from net realized gains — (0.02)_______ _______
Total distributions — (0.02)_______ _______Net Asset Value – End of Period $ 24.84 $ 25.22_______ ______________ _______Total Return (1.51)%+ 0.96%+
Ratios and Supplemental Data:Net assets, end of period (thousands) $18,699 $17,347Ratio of operating expenses to average net assets:
Before Reimbursements 4.63%^ 5.49%^After Reimbursements 3.91%^ 3.80%^
Ratio of interest expense and dividends on short positionsto average net assets 0.95%^ 0.84%^Ratio of operating expenses excluding interest expense anddividend payments on short positions to average net assets:
Before Reimbursements 3.68%^ 4.65%^After Reimbursements 2.96%^ 2.96%^
Ratio of net investment income (loss) to average net assets:Before Reimbursements (3.18)%^ (4.20)%^After Reimbursements (2.46)%^ (2.51)%^
Portfolio turnover rate 129%+ 205%+
* Commencement of operations for Class A shares was April 30, 2012.+ Not Annualized^ Annualized
50
The accompanying notes are an integral part of these financial statements.
Orinda SkyView Macro Opportunities Fund
FINANCIAL HIGHLIGHTS

For a capital share outstanding throughout each period
Class IFor the Six
Months Ended April 30, 2012August 31, through2013 February 28,
(Unaudited) 2013*___________ _____________Net Asset Value – Beginning of Period $ 25.28 $ 25.00_______ _______Income from Investment Operations:Net investment income (loss) (0.25) (0.16)Net realized and unrealized gain (loss) on investments (0.10) 0.46_______ _______
Total from investment operations (0.35) 0.30_______ _______Less Distributions:Dividends from net investment income — —Distributions from net realized gains — (0.02)_______ _______
Total distributions — (0.02)_______ _______Net Asset Value – End of Period $ 24.93 $ 25.28_______ ______________ _______Total Return (1.34)%+ 1.20%+
Ratios and Supplemental Data:Net assets, end of period (thousands) $18,416 $12,875Ratio of operating expenses to average net assets:
Before Reimbursements 4.34%^ 5.77%^After Reimbursements 3.61%^ 3.46%^
Ratio of interest expense and dividends on short positionsto average net assets 0.95%^ 0.80%^Ratio of operating expenses excluding interest expense anddividend payments on short positions to average net assets:
Before Reimbursements 3.39%^ 4.97%^After Reimbursements 2.66%^ 2.66%^
Ratio of net investment income (loss) to average net assets:Before Reimbursements (2.90)%^ (4.41)%^After Reimbursements (2.17)%^ (2.10)%^
Portfolio turnover rate 129%+ 205%+
* Commencement of operations for Class I shares was April 30, 2012.+ Not Annualized^ Annualized
FINANCIAL HIGHLIGHTS (Continued)
51
The accompanying notes are an integral part of these financial statements.
Orinda SkyView Macro Opportunities Fund

For a capital share outstanding throughout the period
Class AJune 28, 2013through
August 31, 2013*(Unaudited)_____________
Net Asset Value – Beginning of Period $ 25.00_______Income from Investment Operations:Net investment income (loss) 0.08Net realized and unrealized gain (loss) on investments (0.23)_______
Total from investment operations (0.15)_______Less Distributions:Dividends from net investment income —Distributions from net realized gains —_______
Total distributions —_______Net Asset Value – End of Period $ 24.85______________Total Return (0.60)%+
Ratios and Supplemental Data:Net assets, end of period (thousands) $5,396Ratio of operating expenses to average net assets:
Before Reimbursements 6.50%^After Reimbursements 1.90%^
Ratio of net investment income (loss) to average net assets:Before Reimbursements 0.13%^After Reimbursements 4.73%^
Portfolio turnover rate 88%+
* Commencement of operations for Class A shares was June 28, 2013.+ Not Annualized^ Annualized
FINANCIAL HIGHLIGHTS
52
The accompanying notes are an integral part of these financial statements.
Orinda Income Opportunities Fund

For a capital share outstanding throughout the period
Class IJune 28, 2013through
August 31, 2013*(Unaudited)_____________
Net Asset Value – Beginning of Period $ 25.00_______Income from Investment Operations:Net investment income (loss) 0.09Net realized and unrealized gain (loss) on investments (0.23)_______
Total from investment operations (0.14)_______Less Distributions:Dividends from net investment income —Distributions from net realized gains —_______
Total distributions —_______Net Asset Value – End of Period $ 24.86______________Total Return (0.56)%+
Ratios and Supplemental Data:Net assets, end of period (thousands) $9,570Ratio of operating expenses to average net assets:
Before Reimbursements 5.51%^After Reimbursements 1.60%^
Ratio of net investment income (loss) to average net assets:Before Reimbursements 1.14%^After Reimbursements 5.05%^
Portfolio turnover rate 88% +
* Commencement of operations for Class I shares was June 28, 2013.+ Not Annualized^ Annualized
FINANCIAL HIGHLIGHTS (Continued)
53
The accompanying notes are an integral part of these financial statements.
Orinda Income Opportunities Fund
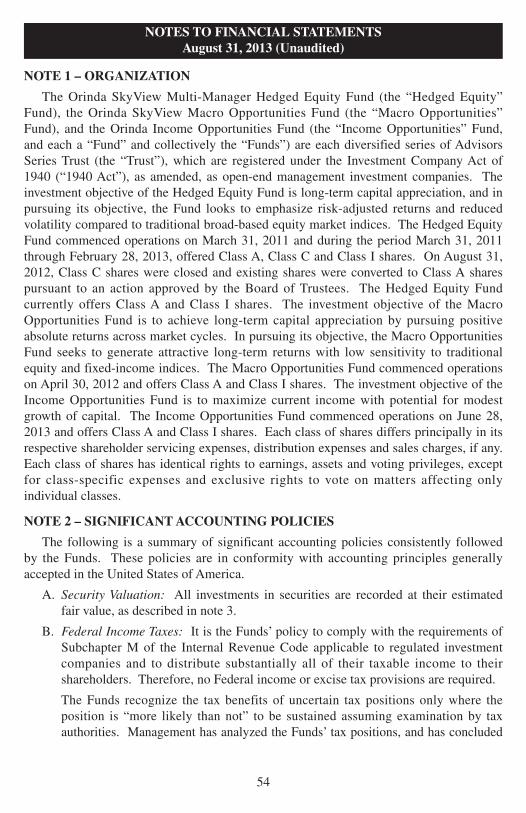
NOTE 1 – ORGANIZATION
The Orinda SkyView Multi-Manager Hedged Equity Fund (the “Hedged Equity”Fund), the Orinda SkyView Macro Opportunities Fund (the “Macro Opportunities”Fund), and the Orinda Income Opportunities Fund (the “Income Opportunities” Fund,and each a “Fund” and collectively the “Funds”) are each diversified series of AdvisorsSeries Trust (the “Trust”), which are registered under the Investment Company Act of1940 (“1940 Act”), as amended, as open-end management investment companies. Theinvestment objective of the Hedged Equity Fund is long-term capital appreciation, and inpursuing its objective, the Fund looks to emphasize risk-adjusted returns and reducedvolatility compared to traditional broad-based equity market indices. The Hedged EquityFund commenced operations on March 31, 2011 and during the period March 31, 2011through February 28, 2013, offered Class A, Class C and Class I shares. On August 31,2012, Class C shares were closed and existing shares were converted to Class A sharespursuant to an action approved by the Board of Trustees. The Hedged Equity Fundcurrently offers Class A and Class I shares. The investment objective of the MacroOpportunities Fund is to achieve long-term capital appreciation by pursuing positiveabsolute returns across market cycles. In pursuing its objective, the Macro OpportunitiesFund seeks to generate attractive long-term returns with low sensitivity to traditionalequity and fixed-income indices. The Macro Opportunities Fund commenced operationson April 30, 2012 and offers Class A and Class I shares. The investment objective of theIncome Opportunities Fund is to maximize current income with potential for modestgrowth of capital. The Income Opportunities Fund commenced operations on June 28,2013 and offers Class A and Class I shares. Each class of shares differs principally in itsrespective shareholder servicing expenses, distribution expenses and sales charges, if any.Each class of shares has identical rights to earnings, assets and voting privileges, exceptfor class-specific expenses and exclusive rights to vote on matters affecting onlyindividual classes.
NOTE 2 – SIGNIFICANTACCOUNTING POLICIES
The following is a summary of significant accounting policies consistently followedby the Funds. These policies are in conformity with accounting principles generallyaccepted in the United States of America.
A. Security Valuation: All investments in securities are recorded at their estimatedfair value, as described in note 3.
B. Federal Income Taxes: It is the Funds’ policy to comply with the requirements ofSubchapter M of the Internal Revenue Code applicable to regulated investmentcompanies and to distribute substantially all of their taxable income to theirshareholders. Therefore, no Federal income or excise tax provisions are required.
The Funds recognize the tax benefits of uncertain tax positions only where theposition is “more likely than not” to be sustained assuming examination by taxauthorities. Management has analyzed the Funds’ tax positions, and has concluded
NOTES TO FINANCIAL STATEMENTSAugust 31, 2013 (Unaudited)
54

that no liability for unrecognized tax benefits should be recorded related to uncertaintax positions taken on returns filed for the open tax year ended 2013, or expected tobe taken in the Funds’ 2014 tax returns. The Funds identify their major taxjurisdictions as U.S. Federal and the state of Wisconsin; however, the Funds are notaware of any tax positions for which it is reasonably possible that the total amountsof unrecognized tax benefits will change materially in the next twelve months.
C. Securities Transactions, Income and Distributions: Securities transactions areaccounted for on the trade date. Realized gains and losses on securities sold aredetermined on the basis of identified cost. Interest income is recorded on anaccrual basis. Dividend income and distributions to shareholders are recorded onthe ex-dividend date. Withholding taxes on foreign dividends have been providedfor in accordance with the Funds’ understanding of the applicable country’s taxrules and rates.
The Funds distribute substantially all net investment income, if any, and netrealized capital gains, if any, annually. The amount of dividends and distributionsto shareholders from net investment income and net realized capital gains isdetermined in accordance with Federal income tax regulations, which differ fromaccounting principles generally accepted in the United States of America. To theextent these book/tax differences are permanent, such amounts are reclassifiedwithin the capital accounts based on their Federal tax treatment.
Investment income, expenses (other than those specific to the class of shares), andrealized and unrealized gains and losses on investments are allocated to the separateclasses of the Funds’ shares based upon their relative net assets on the date incomeis earned or expensed and realized and unrealized gains and losses are incurred.
Each Fund is charged for those expenses that are directly attributable to the Funds,such as investment advisory, custody and transfer agent fees. Expenses that arenot attributable to a Fund are typically allocated among the Funds in proportion totheir respective net assets.
D. Use of Estimates: The preparation of financial statements in conformity withaccounting principles generally accepted in the United States of America requiresmanagement to make estimates and assumptions that affect the reported amountsof assets and liabilities at the date of the financial statements and the reportedamounts of increases and decreases in net assets during the reporting period.Actual results could differ from those estimates.
E. Foreign Currency: Values of investments denominated in foreign currencies areconverted into U.S. dollars using the spot market rate of exchange at the time ofvaluation. Purchases and sales of investments and income are translated into U.S.dollars using the spot market rate of exchange prevailing on the respective dates ofsuch transactions. Foreign investments present additional risks due to currencyfluctuations, economic and political factors, lower liquidity, governmentregulations, differences in accounting standards and other factors.
NOTES TO FINANCIAL STATEMENTS (Continued)August 31, 2013 (Unaudited)
55
F. Redemption Fees: The Hedged Equity Fund and Macro Opportunities Fund eachcharge a 1% redemption fee to shareholders who redeem shares held for 60 daysor less. Such fees are retained by the Fund and accounted for as an addition topaid-in capital.
G. Options Transactions: The Funds may utilize options for hedging purposes aswell as direct investment. Some options strategies, including buying puts, tend tohedge the Funds’ investments against price fluctuations. Other strategies, such aswriting puts and calls and buying calls, tend to increase market exposure. Optionscontracts may be combined with each other in order to adjust the risk and returncharacteristics of each Fund’s overall strategy in a manner deemed appropriate tothe Advisor and consistent with each Fund’s investment objective and policies.When a call or put option is written, an amount equal to the premium received isrecorded as a liability. The liability is marked-to-market daily to reflect thecurrent fair value of the written option. When a written option expires, a gain isrealized in the amount of the premium originally received. If a closing purchasecontract is entered into, a gain or loss is realized in the amount of the originalpremium less the cost of the closing transaction. If a written call option isexercised, a gain or loss is realized from the sale of the underlying security, andthe proceeds from such sale are increased by the premium originally received. If awritten put option is exercised, the amount of the premium originally receivedreduces the cost of the security which is purchased upon the exercise of the option.
With options, there is minimal counterparty credit risk to the Funds since theoptions are covered or secured, which means that the Funds will own theunderlying security or, to the extent they do not hold such a portfolio, will maintaina segregated account with the Funds’ custodian consisting of high quality liquiddebt obligations equal to the market value of the option, marked to market daily.
Options purchased are recorded as investments and marked-to-market daily toreflect the current fair value of the option contract. If an option purchased expires,a loss is realized in the amount of the cost of the option contract. If a closingtransaction is entered into, a gain or loss is realized to the extent that the proceedsfrom the sale are greater or less than the cost of the option. If a purchase putoption is exercised, a gain or loss is realized from the sale of the underlyingsecurity by adjusting the proceeds from such sale by the amount of the premiumoriginally paid. If a purchased call option is exercised, the cost of the securitypurchased upon exercise is increased by the premium originally paid.
H. Futures Contracts and Options on Futures Contracts: The Funds are subject toequity price risk, interest rate risk, and foreign currency exchange rate risk in thenormal course of pursuing their investment objectives. The Funds use futurescontracts and options on such futures contracts to gain exposure to, or hedgeagainst, changes in the value of equities, interest rates or foreign currencies. Afutures contract represents a commitment for the future purchase or sale of an
NOTES TO FINANCIAL STATEMENTS (Continued)August 31, 2013 (Unaudited)
56

asset at a specified price on a specified date. Upon entering into such contracts,the Funds are required to deposit with the broker, either in cash or securities, aninitial margin deposit in an amount equal to a certain percentage of the contractamount. Subsequent payments (variation margin) are made or received by theFunds each day, depending on the daily fluctuations in the value of the contract,and are recorded for financial statement purposes as unrealized gains or losses bythe Funds. Upon entering into such contracts, the Funds bear the risk of interest orexchange rates or securities prices moving unexpectedly, in which case, the Fundsmay not achieve the anticipated benefits of the futures contracts and may realize aloss. With futures, there is minimal counterparty credit risk to the Funds sincefutures are exchange traded and the exchange’s clearinghouse, as counterparty toall exchange-traded futures, guarantees the futures against default. The use offutures contracts, and options on futures contracts, involves the risk of imperfectcorrelation in movements in the price of futures contracts and options thereon,interest rates and the underlying hedged assets.
I. Leverage and Short Sales: The Funds may use leverage in connection with theirinvestment activities and may effect short sales of securities. Leverage canincrease the investment returns of the Funds if the securities purchased increase invalue in an amount exceeding the cost of the borrowing. However, if the securitiesdecrease in value, the Funds will suffer a greater loss than would have resultedwithout the use of leverage. A short sale is the sale by the Funds of a securitywhich they do not own in anticipation of purchasing the same security in the futureat a lower price to close the short position. A short sale will be successful if theprice of the shorted security decreases. However, if the underlying security goesup in price during the period in which the short position is outstanding, the Fundswill realize a loss. The risk on a short sale is unlimited because the Funds mustbuy the shorted security at the higher price to complete the transaction. Therefore,short sales may be subject to greater risks than investments in long positions. Witha long position, the maximum sustainable loss is limited to the amount paid for thesecurity plus the transaction costs, whereas there is no maximum attainable priceof the shorted security. The Funds would also incur increased transaction costsassociated with selling securities short. In addition, if the Funds sell securitiesshort, they must maintain a segregated account with their custodian containingcash or high-grade securities equal to (i) the greater of the current market value ofthe securities sold short or the market value of such securities at the time they weresold short, less (ii) any collateral deposited with the Funds’ broker (not includingthe proceeds from the short sales). The Funds may be required to add to thesegregated account as the market price of a shorted security increases. As a resultof maintaining and adding to its segregated account, the Funds may maintainhigher levels of cash or liquid assets (for example, U.S. Treasury bills, repurchaseagreements, high quality commercial paper and long equity positions) for
NOTES TO FINANCIAL STATEMENTS (Continued)August 31, 2013 (Unaudited)
57

collateral needs thus reducing their overall managed assets available for tradingpurposes. The Fund is obligated to pay the counterparty any dividends or interestdue on securities sold short. Such dividends and interest are recorded as anexpense to the Fund.
J. Mutual Fund and ETF Trading Risk: The Funds may invest in other mutual fundsthat are either open-end or closed-end investment companies as well as ETFs. ETFsare investment companies that are bought and sold on a national securities exchange.Unlike mutual funds, ETFs do not necessarily trade at the net asset values of theirunderlying securities, which means an ETF could potentially trade above or belowthe value of the underlying portfolios. Additionally, because ETFs trade like stockson exchanges, they are subject to trading and commission costs unlike mutual funds.Also, both mutual funds and ETFs have management fees that are part of their costs,and the Funds will indirectly bear their proportionate share of the costs.
K. Reclassification of Capital Accounts: Accounting principles generally accepted inthe United States of America require that certain components of net assets relatingto permanent differences be reclassified between financial and tax reporting.These reclassifications have no effect on net assets or net asset value per share.For the period ended February 28, 2013, the Funds made the following permanenttax adjustments on the Statements of Assets and Liabilities:
Undistributed AccumulatedNet Investment Net Realized Paid InIncome/(Loss) Gain/(Loss) Capital_____________ ____________ _______
Hedged Equity Fund 4,060,103 (137,335) (3,922,768)Macro Opportunity Fund 161,025 (161,025) —
L. Offsetting Assets & Liabilities: The Funds have adopted financial reporting rulesregarding offsetting assets and liabilities and related arrangements to enable usersof its financial statements to understand the effect of those arrangements on itsfinancial position. The Funds’ policy is to recognize a net asset/liability equal tothe net variation margin for the futures contracts. During the period ended August31, 2013, the Funds were not subject to any master netting arrangements. Foradditional information regarding the offsetting assets and liabilities at August 31,2013, please reference the table in Note 4.
M. Events Subsequent to the Fiscal Period End: In preparing the financial statementsas of August 31, 2013, management considered the impact of subsequent eventsfor potential recognition or disclosure in the financial statements.
NOTE 3 – SECURITIES VALUATION
The Funds have adopted authoritative fair value accounting standards which establishan authoritative definition of fair value and set out a hierarchy for measuring fair value.These standards require additional disclosures about the various inputs and valuationtechniques used to develop the measurements of fair value, a discussion of changes invaluation techniques and related inputs during the period, and expanded disclosure of
NOTES TO FINANCIAL STATEMENTS (Continued)August 31, 2013 (Unaudited)
58
valuation levels for major security types. These inputs are summarized in the three broadlevels listed below:
Level 1 – Unadjusted quoted prices in active markets for identical assets or liabilitiesthat the Funds have the ability to access.
Level 2 – Observable inputs other than quoted prices included in level 1 that areobservable for the asset or liability, either directly or indirectly. Theseinputs may include quoted prices for the identical instrument on an inactivemarket, prices for similar instruments, interest rates, prepayment speeds,credit risk, yield curves, default rates and similar data.
Level 3 – Unobservable inputs for the asset or liability, to the extent relevantobservable inputs are not available, representing the Funds’ own assumptionsabout the assumptions a market participant would use in valuing the asset orliability, and would be based on the best information available.
Following is a description of the valuation techniques applied to the Funds’ majorcategories of assets and liabilities measured at fair value on a recurring basis.
Equity Securities: Equity securities, including common stocks, preferred stocks,foreign-issued common stocks, exchange-traded funds, closed-end mutual funds and realestate investment trusts (REITs), that are primarily traded on a national securitiesexchange shall be valued at the last sale price on the exchange on which they are primarilytraded on the day of valuation or, if there has been no sale on such day, at the meanbetween the bid and asked prices. Securities primarily traded in the NASDAQ GlobalMarket System for which market quotations are readily available shall be valued using theNASDAQ Official Closing Price (“NOCP”). If the NOCP is not available, such securitiesshall be valued at the last sale price on the day of valuation, or if there has been no sale onsuch day, at the mean between the bid and asked prices. Over-the-counter securities whichare not traded in the NASDAQ Global Market System shall be valued at the most recentsales price. To the extent these securities are actively traded and valuation adjustments arenot applied, they are categorized in level 1 of the fair value hierarchy.
Securities for which market quotations are not readily available or if the closing pricedoes not represent fair value, are valued following procedures approved by the Board ofTrustees (“Board”). These procedures consider many factors, including the type ofsecurity, size of holding, trading volume and news events. Depending on the relativesignificance of the valuation inputs, these securities may be classified in either level 2 orlevel 3 of the fair value hierarchy.
Investment Companies: Investments in open-end mutual funds, including moneymarket funds, are generally priced at their net asset value per share provided by theservice agent of the Funds and will be classified in level 1 of the fair value hierarchy.
Exchange-Traded Notes: Investments in exchange-traded notes are actively traded ona national securities exchange and are valued based on the last sales price from theexchange and are categorized in level 1 of the fair value hierarchy.
NOTES TO FINANCIAL STATEMENTS (Continued)August 31, 2013 (Unaudited)
59
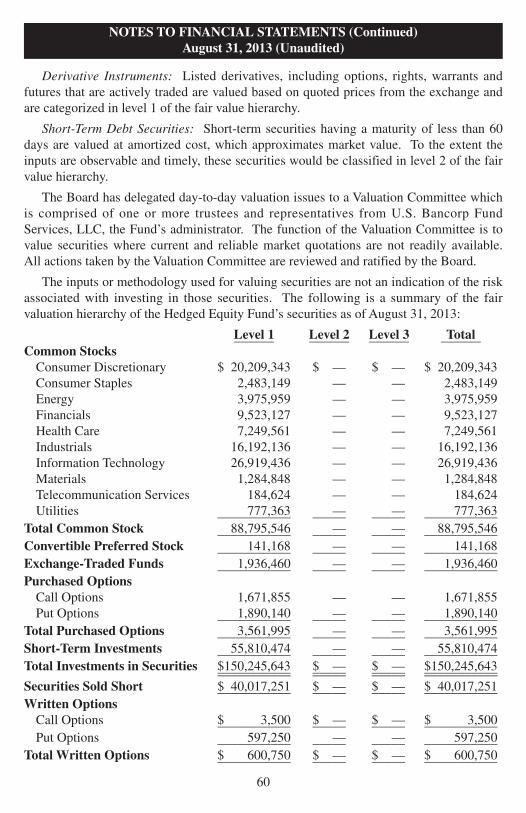
Derivative Instruments: Listed derivatives, including options, rights, warrants andfutures that are actively traded are valued based on quoted prices from the exchange andare categorized in level 1 of the fair value hierarchy.
Short-Term Debt Securities: Short-term securities having a maturity of less than 60days are valued at amortized cost, which approximates market value. To the extent theinputs are observable and timely, these securities would be classified in level 2 of the fairvalue hierarchy.
The Board has delegated day-to-day valuation issues to a Valuation Committee whichis comprised of one or more trustees and representatives from U.S. Bancorp FundServices, LLC, the Fund’s administrator. The function of the Valuation Committee is tovalue securities where current and reliable market quotations are not readily available.All actions taken by the Valuation Committee are reviewed and ratified by the Board.
The inputs or methodology used for valuing securities are not an indication of the riskassociated with investing in those securities. The following is a summary of the fairvaluation hierarchy of the Hedged Equity Fund’s securities as of August 31, 2013:
Level 1 Level 2 Level 3 Total______ ______ ______ ______Common StocksConsumer Discretionary $ 20,209,343 $ — $ — $ 20,209,343Consumer Staples 2,483,149 — — 2,483,149Energy 3,975,959 — — 3,975,959Financials 9,523,127 — — 9,523,127Health Care 7,249,561 — — 7,249,561Industrials 16,192,136 — — 16,192,136Information Technology 26,919,436 — — 26,919,436Materials 1,284,848 — — 1,284,848Telecommunication Services 184,624 — — 184,624Utilities 777,363 — — 777,363___________ _____ _____ ___________
Total Common Stock 88,795,546 — — 88,795,546___________ _____ _____ ___________Convertible Preferred Stock 141,168 — — 141,168___________ _____ _____ ___________Exchange-Traded Funds 1,936,460 — — 1,936,460___________ _____ _____ ___________Purchased OptionsCall Options 1,671,855 — — 1,671,855Put Options 1,890,140 — — 1,890,140___________ _____ _____ ___________
Total Purchased Options 3,561,995 — — 3,561,995___________ _____ _____ ___________Short-Term Investments 55,810,474 — — 55,810,474___________ _____ _____ ___________Total Investments in Securities $150,245,643 $ — $ — $150,245,643___________ _____ _____ ______________________ _____ _____ ___________Securities Sold Short $ 40,017,251 $ — $ — $ 40,017,251___________ _____ _____ ___________Written OptionsCall Options $ 3,500 $ — $ — $ 3,500___________ _____ _____ ___________Put Options 597,250 — — 597,250___________ _____ _____ ___________
Total Written Options $ 600,750 $ — $ — $ 600,750___________ _____ _____ ___________
NOTES TO FINANCIAL STATEMENTS (Continued)August 31, 2013 (Unaudited)
60

The following is a summary of the fair valuation hierarchy of the Macro OpportunitiesFund’s securities as of August 31, 2013:
Level 1 Level 2 Level 3 Total______ ______ ______ ______Common StocksConsumer Discretionary $ 3,550,009 $ — $ — $ 3,550,009Consumer Staples 435,562 — — 435,562Energy 3,206,370 — — 3,206,370Financials 2,630,727 — — 2,630,727Health Care 2,056,738 — — 2,056,738Industrials 2,681,381 — — 2,681,381Information Technology 4,674,376 — — 4,674,376Materials 4,327,221 — — 4,327,221Telecommunication Services 147,105 — — 147,105__________ ________ _____ __________
Total Common Stock 23,709,489 — — 23,709,489__________ ________ _____ __________REITs 475,458 — — 475,458__________ ________ _____ __________Corporate Bonds — 496,875 — 496,875__________ ________ _____ __________Exchange-Traded Funds 2,996,312 — — 2,996,312__________ ________ _____ __________Closed-End Mutual Funds 1,156,922 — — 1,156,922__________ ________ _____ __________Purchased OptionsPut Options 601,000 — — 601,000__________ ________ _____ __________
Total Purchased Options 601,000 — — 601,000__________ ________ _____ __________Short-Term Investments 10,745,028 — — 10,745,028__________ ________ _____ __________Total Investmentsin Securities $39,684,209 $496,875 $ — $40,181,084__________ ________ _____ ____________________ ________ _____ __________Total Securities Sold Short $ 7,084,751 $ — $ — $ 7,084,751__________ ________ _____ __________Written OptionsCall Options $ 2,979 $ — $ — 2,979Put Options 195,903 — — 195,903__________ ________ _____ __________
Total Written Options $ 198,882 $ — $ — 198,882__________ ________ _____ __________Other FinancialInstruments*Long Futures Contracts $ 7,258 $ — $ — $ 7,258Short Futures Contracts 69,592 — — 69,592__________ ________ _____ __________
Total Other FinancialInstruments $ 76,850 $ — $ — $ 76,850__________ ________ _____ __________
* Other financial instruments are derivative instruments not reflected in the Schedule of Investments, such asfutures, which are presented at the unrealized appreciation (depreciation) on the instrument.
NOTES TO FINANCIAL STATEMENTS (Continued)August 31, 2013 (Unaudited)
61
The following is a summary of the fair valuation hierarchy of the Income OpportunitiesFund’s securities as of August 31, 2013:
Level 1 Level 2 Level 3 Total______ ______ ______ ______REITs $ 2,238,401 $ — $ — $ 2,238,401__________ _____ _____ __________Preferred Stocks 4,365,654 — — 4,365,654__________ _____ _____ __________Exchange-Traded Funds 202,802 — — 202,802__________ _____ _____ __________Short-Term Investments 7,619,840 — — 7,619,840__________ _____ _____ __________Total Investmentsin Securities $14,426,697 $ — $ — $14,426,697__________ _____ _____ ____________________ _____ _____ __________
Transfers between levels are recognized at the end of the reporting period. During theperiod ended August 31, 2013, the Funds recognized no transfers between levels. Therewere no level 3 securities held in the Funds on August 31, 2013.
NOTE 4 – DERIVATIVES TRANSACTIONS
The Funds may use derivatives for different purposes, such as a substitute for taking aposition in the underlying asset and/or as part of a strategy designed to reduce exposure toother risks, such as interest rate or currency risk. The various derivative instruments that theFunds may use are options, futures, swaps, and forward foreign currency contracts, amongothers. The Funds may also use derivatives for leverage, in which case their use wouldinvolve leveraging risk. The Funds’ use of derivative instruments involves risks differentfrom, or possibly greater than, the risks associated with investing directly in securities andother traditional investments. Derivatives are subject to a number of risks, such as liquidityrisk, interest rate risk, market risk, credit risk and management risk. A Fund investing in aderivative instrument could lose more than the principal amount invested.
The Funds have adopted the disclosure provisions of FASB Accounting StandardCodification 815, Derivatives and Hedging (“ASC 815”). ASC 815 requires enhanceddisclosures about the Funds’ use of, and accounting for, derivative instruments and theeffect of derivative instruments on the Funds’ results of operations and financial position.Tabular disclosure regarding derivative fair value and gain/loss by contract type (e.g.,interest rate contracts, foreign exchange contracts, credit contracts, etc.) is required andderivatives accounted for as hedging instruments under ASC 815 must be disclosedseparately from those that do not qualify for hedge accounting. Even though the Fundsmay use derivatives in an attempt to achieve an economic hedge, the Funds’ derivativesare not accounted for as hedging instruments under ASC 815 because investmentcompanies account for their derivatives at fair value and record any changes in fair valuein current period earnings.
Average Balance InformationThe average monthly market values of purchased and written options during the
period ended August 31, 2013 for the Hedged Equity Fund were $2,739,718 and
NOTES TO FINANCIAL STATEMENTS (Continued)August 31, 2013 (Unaudited)
62

$731,875, respectively. The average monthly notional amount of long futures contractsduring the period ended August 31, 2013 was $1,758,697.
The average monthly market values of purchased and written options during the periodended August 31, 2013 for the Macro Opportunities Fund were $457,525 and $229,465,respectively. The average monthly notional amounts of long and short futures contractsduring the period ended August 31, 2013 were $5,129,939 and $9,469,858, respectively.
Orinda SkyView Multi-Manager Hedged Equity Fund
Transactions in written options contracts for the period ended August 31, 2013, are asfollows:
Number of PremiumsContracts Received
Beginning Balance (1,314) $ (150,054)
Options written (1,650) (1,308,690)Options closed 2,164 514,142Options expired — —Options exercised 300 90,458_____ __________Outstanding at August 31, 2013 (500) $ (854,144)_____ _______________ __________
Orinda SkyView Macro Opportunities Fund
Transactions in written options contracts for the period ended August 31, 2013, are asfollows:
Number of PremiumsContracts Received
Beginning Balance — $ —Options written (2,210) (524,300)Options closed 217 141,196Options expired 916 64,479Options exercised 936 65,133_____ __________Outstanding at August 31, 2013 (141) $ (253,492)_____ _______________ __________
As of August 31, 2013, the Macro Opportunities Fund held the following long futurescontracts: 2 90-Day Euro Dollar, 9 90-Day Bank Bill, 10 90-Day Sterling, 1 CanadianDollar Currency, 1 Swiss Franc Currency, 1 Euro Fx Currency, 1 Euro Stoxx 50,9 Euro-Schatz, 1 FTSE/JSE Top 40, 1 Hang Seng Index, 1 S&P 500 E-mini, 1 SPI 200,and 15 2-Year U.S. Treasury Note for delivery at various times. The Fund has recordedan unrealized gain of $7,258 as of August 31, 2013 related to these contracts.
As of August 31, 2013, the Macro Opportunities Fund also held the following shortfutures contracts: 4 3-Month Euro Euribor, 3 90-Day Sterling, 7 90-Day Euro Dollar,9 Australian Dollar Currency, 2 Australian 10-Year Bond, 4 Bank Acceptance, 8 BPCurrency, 6 Canadian Dollar Currency, 1 Canadian 10-Year Bond, 6 Copper, 3 3-Month
NOTES TO FINANCIAL STATEMENTS (Continued)August 31, 2013 (Unaudited)
63

Euro Swiss Franc (Euroswiss) Interest Rate, 4 Euro Fx Currency, 1 Euro-Bobl, 2 Euro-Bund, 6 Japanese Yen Currency, 3 Long Gilt, 1 Mexican Peso, 7 10-Year U.S. Treasury,1 5-Year U.S. Treasury, and 2 30-Year U.S. Treasury Bond for delivery at various times.The Fund has recorded an unrealized gain of $69,592 as of August 31, 2013 related tothese contracts.
The locations on the Statement of Assets and Liabilities of the Hedged Equity Fund’sderivative positions by type of exposure, all of which are not accounted for as hedginginstruments under ASC 815, are as follows:
Values of Derivative Instruments as of August 31, 2013 on the Statement of Assetsand Liabilities:
Assets Liabilities_____________________ __________________________Derivatives not accountedfor as hedging instruments Fair Fairunder ASC 815 Location Value Location Value____________________________________________________ __________________________Equity Contracts – Investments, OptionsOptions at fair value $3,561,995 written, at value $600,750____________________________________________________ __________________________Total $3,561,995 $600,750____________________________________________________ __________________________
The effect of Derivative Instruments on the Statement of Operations for the periodended August 31, 2013:
Amount of Realized Gain or (Loss) on Derivatives Recognized in Income
Derivatives not accountedfor as hedging instruments Purchased Writtenunder ASC 815 Options Options Futures Total
Equity Contracts $1,233,953 $ 72,116 $243,523 $1,549,592
Total $1,233,953 $ 72,116 $243,523 $1,549,592
Change in Unrealized Appreciation or (Depreciation) on Derivatives Recognized in Income
Derivatives not accountedfor as hedging instruments Purchased Writtenunder ASC 815 Options Options Futures Total
Equity Contracts $(246,288) $271,670 $ (441) $ 24,941
Total $(246,288) $271,670 $ (441) $ 24,941
NOTES TO FINANCIAL STATEMENTS (Continued)August 31, 2013 (Unaudited)
64
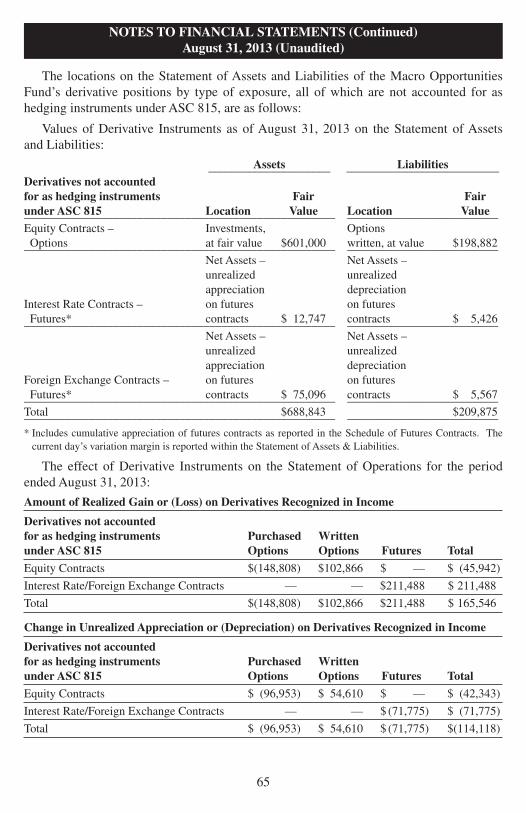
The locations on the Statement of Assets and Liabilities of the Macro OpportunitiesFund’s derivative positions by type of exposure, all of which are not accounted for ashedging instruments under ASC 815, are as follows:
Values of Derivative Instruments as of August 31, 2013 on the Statement of Assetsand Liabilities:
Assets Liabilities_____________________ __________________________Derivatives not accountedfor as hedging instruments Fair Fairunder ASC 815 Location Value Location Value____________________________________________________ __________________________Equity Contracts – Investments, OptionsOptions at fair value $601,000 written, at value $198,882____________________________________________________ __________________________
Net Assets – Net Assets –unrealized unrealizedappreciation depreciation
Interest Rate Contracts – on futures on futuresFutures* contracts $ 12,747 contracts $ 5,426____________________________________________________ __________________________
Net Assets – Net Assets –unrealized unrealizedappreciation depreciation
Foreign Exchange Contracts – on futures on futuresFutures* contracts $ 75,096 contracts $ 5,567____________________________________________________ __________________________Total $688,843 $209,875____________________________________________________ __________________________
* Includes cumulative appreciation of futures contracts as reported in the Schedule of Futures Contracts. Thecurrent day’s variation margin is reported within the Statement of Assets & Liabilities.
The effect of Derivative Instruments on the Statement of Operations for the periodended August 31, 2013:
Amount of Realized Gain or (Loss) on Derivatives Recognized in Income
Derivatives not accountedfor as hedging instruments Purchased Writtenunder ASC 815 Options Options Futures Total
Equity Contracts $(148,808) $102,866 $ — $ (45,942)
Interest Rate/Foreign Exchange Contracts — — $211,488 $ 211,488
Total $(148,808) $102,866 $211,488 $ 165,546
Change in Unrealized Appreciation or (Depreciation) on Derivatives Recognized in Income
Derivatives not accountedfor as hedging instruments Purchased Writtenunder ASC 815 Options Options Futures Total
Equity Contracts $ (96,953) $ 54,610 $ — $ (42,343)
Interest Rate/Foreign Exchange Contracts — — $(71,775) $ (71,775)
Total $ (96,953) $ 54,610 $ (71,775) $(114,118)
NOTES TO FINANCIAL STATEMENTS (Continued)August 31, 2013 (Unaudited)
65

The table below shows the offsetting assets and liabilities relating to the writtenoptions and futures contracts shown on the Statement of Assets and Liabilities.
Orinda SkyView Multi-Manager Hedged Equity FundAssets:
Gross Amounts notGross Net Amounts offset in the StatementAmounts Presented of Assets and Liabilities
Gross Offset in the in the____________________
Amounts of Statement of Statement of CollateralRecognized Assets and Assets and Financial Pledged NetAssets Liabilities Liabilities Instruments (Received) Amount__________ ___________ ___________ __________ ________ _______
DescriptionNone $ — $ — $ — $ — $ — $ —________ _______ ________ ________ ________ _____
$ — $ — $ — $ — $ — $ —________ _______ ________ ________ ________ _____________ _______ ________ ________ ________ _____Liabilities:
Gross Amounts notGross Net Amounts offset in the StatementAmounts Presented of Assets and Liabilities
Gross Offset in the in the____________________
Amounts of Statement of Statement of CollateralRecognized Assets and Assets and Financial Pledged NetLiabilities Liabilities Liabilities Instruments (Received) Amount__________ ___________ ___________ __________ ________ _______
DescriptionWrittenOptions $600,750 $ — $600,750 $ — $600,750 $ —________ ________ ________ ________ ________ _____
$600,750 $ — $600,750 $ — $600,750 $ —________ ________ ________ ________ ________ _____________ ________ ________ ________ ________ _____
Orinda SkyView Macro Opportunities FundAssets:
Gross Amounts notGross Net Amounts offset in the StatementAmounts Presented of Assets and Liabilities
Gross Offset in the in the____________________
Amounts of Statement of Statement of CollateralRecognized Assets and Assets and Financial Pledged NetAssets Liabilities Liabilities Instruments (Received) Amount__________ ___________ ___________ __________ ________ _______
DescriptionFuturesContracts $ 87,744 $(10,994) $ 76,750 $ — $ 76,750 $ —________ ________ ________ ________ ________ _____
$ 87,744 $(10,994) $ 76,750 $ — $ 76,750 $ —________ ________ ________ ________ ________ _____________ ________ ________ ________ ________ _____
NOTES TO FINANCIAL STATEMENTS (Continued)August 31, 2013 (Unaudited)
66

Liabilities:Gross Amounts not
Gross Net Amounts offset in the StatementAmounts Presented of Assets and Liabilities
Gross Offset in the in the____________________
Amounts of Statement of Statement of CollateralRecognized Assets and Assets and Financial Pledged NetLiabilities Liabilities Liabilities Instruments (Received) Amount__________ ___________ ___________ __________ ________ _______
DescriptionWrittenOptions $198,882 $ — $198,882 $ — $198,882 $ —FuturesContracts 10,994 $(10,994) — $ — — $ —________ ________ ________ ________ ________ _____
$209,876 $(10,994) $198,882 $ — $198,882 $ —________ ________ ________ ________ ________ _____________ ________ ________ ________ ________ _____
For additional information, please reference to the “Offsetting Assets and Liabilities”section in Note 2.
NOTE 5 – INVESTMENT ADVISORY FEE AND OTHER TRANSACTIONSWITHAFFILIATES
For the period ended August 31, 2013, Orinda Asset Management, LLC (the“Advisor”) provided the Funds with investment management services under anInvestment Advisory Agreement. The Advisor furnishes all investment advice, officespace, and facilities, and provides most of the personnel needed by the Funds. Ascompensation for its services, the Advisor is entitled to a monthly fee at the annual rate of2.30% based upon the average daily net assets of the Hedged Equity and MacroOpportunities Funds. The advisor receives a monthly fee at the annual rate of 1.00% forthe Income Opportunities Fund. For the period ended August 31, 2013, the HedgedEquity, Macro Opportunities, and Income Opportunities Funds incurred $1,412,424,$425,797, and $10,451 in advisory fees, respectively. Advisory fees payable at August31, 2013 for the Hedged Equity, Macro Opportunities and Income Opportunities Fundswere $245,077, $50,610 and $0, respectively. The Advisor has delegated the day to daymanagement of the Hedged Equity and Macro Opportunities Funds to various Sub-Advisors. The Advisor pays the Sub-Advisor fees for each of the Funds from its ownassets and these fees are not an additional expense of the Funds.
The Funds are responsible for their own operating expenses. The Advisor hascontractually agreed to waive its fees and/or absorb expenses of the Funds to ensure thatthe net annual operating expenses (excluding Acquired Fund Fees and Expenses, taxes,interest and dividends on securities sold short and extraordinary expenses) do not exceedthe following amounts of the average daily net assets for each class of shares:
NOTES TO FINANCIAL STATEMENTS (Continued)August 31, 2013 (Unaudited)
67
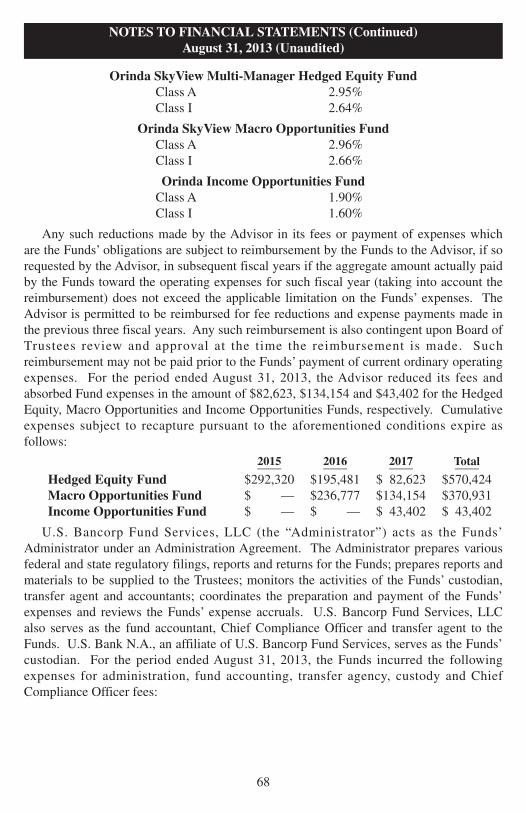
Orinda SkyView Multi-Manager Hedged Equity FundClass A 2.95%Class I 2.64%
Orinda SkyView Macro Opportunities FundClass A 2.96%Class I 2.66%
Orinda Income Opportunities FundClass A 1.90%Class I 1.60%
Any such reductions made by the Advisor in its fees or payment of expenses whichare the Funds’ obligations are subject to reimbursement by the Funds to the Advisor, if sorequested by the Advisor, in subsequent fiscal years if the aggregate amount actually paidby the Funds toward the operating expenses for such fiscal year (taking into account thereimbursement) does not exceed the applicable limitation on the Funds’ expenses. TheAdvisor is permitted to be reimbursed for fee reductions and expense payments made inthe previous three fiscal years. Any such reimbursement is also contingent upon Board ofTrustees review and approval at the time the reimbursement is made. Suchreimbursement may not be paid prior to the Funds’ payment of current ordinary operatingexpenses. For the period ended August 31, 2013, the Advisor reduced its fees andabsorbed Fund expenses in the amount of $82,623, $134,154 and $43,402 for the HedgedEquity, Macro Opportunities and Income Opportunities Funds, respectively. Cumulativeexpenses subject to recapture pursuant to the aforementioned conditions expire asfollows:
2015 2016 2017 Total____ ____ ____ ____Hedged Equity Fund $292,320 $195,481 $ 82,623 $570,424Macro Opportunities Fund $ — $236,777 $134,154 $370,931Income Opportunities Fund $ — $ — $ 43,402 $ 43,402
U.S. Bancorp Fund Services, LLC (the “Administrator”) acts as the Funds’Administrator under an Administration Agreement. The Administrator prepares variousfederal and state regulatory filings, reports and returns for the Funds; prepares reports andmaterials to be supplied to the Trustees; monitors the activities of the Funds’ custodian,transfer agent and accountants; coordinates the preparation and payment of the Funds’expenses and reviews the Funds’ expense accruals. U.S. Bancorp Fund Services, LLCalso serves as the fund accountant, Chief Compliance Officer and transfer agent to theFunds. U.S. Bank N.A., an affiliate of U.S. Bancorp Fund Services, serves as the Funds’custodian. For the period ended August 31, 2013, the Funds incurred the followingexpenses for administration, fund accounting, transfer agency, custody and ChiefCompliance Officer fees:
NOTES TO FINANCIAL STATEMENTS (Continued)August 31, 2013 (Unaudited)
68
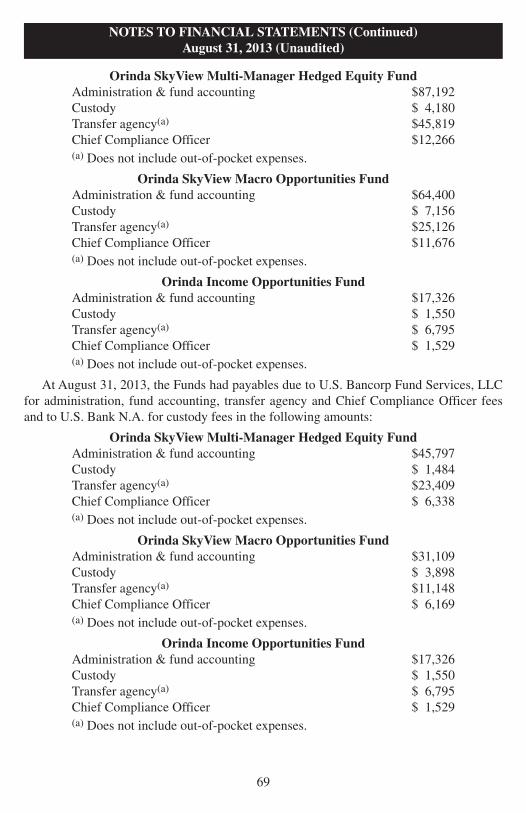
Orinda SkyView Multi-Manager Hedged Equity FundAdministration & fund accounting $87,192Custody $ 4,180Transfer agency(a) $45,819Chief Compliance Officer $12,266(a) Does not include out-of-pocket expenses.
Orinda SkyView Macro Opportunities FundAdministration & fund accounting $64,400Custody $ 7,156Transfer agency(a) $25,126Chief Compliance Officer $11,676(a) Does not include out-of-pocket expenses.
Orinda Income Opportunities FundAdministration & fund accounting $17,326Custody $ 1,550Transfer agency(a) $ 6,795Chief Compliance Officer $ 1,529(a) Does not include out-of-pocket expenses.
At August 31, 2013, the Funds had payables due to U.S. Bancorp Fund Services, LLCfor administration, fund accounting, transfer agency and Chief Compliance Officer feesand to U.S. Bank N.A. for custody fees in the following amounts:
Orinda SkyView Multi-Manager Hedged Equity FundAdministration & fund accounting $45,797Custody $ 1,484Transfer agency(a) $23,409Chief Compliance Officer $ 6,338(a) Does not include out-of-pocket expenses.
Orinda SkyView Macro Opportunities FundAdministration & fund accounting $31,109Custody $ 3,898Transfer agency(a) $11,148Chief Compliance Officer $ 6,169(a) Does not include out-of-pocket expenses.
Orinda Income Opportunities FundAdministration & fund accounting $17,326Custody $ 1,550Transfer agency(a) $ 6,795Chief Compliance Officer $ 1,529(a) Does not include out-of-pocket expenses.
NOTES TO FINANCIAL STATEMENTS (Continued)August 31, 2013 (Unaudited)
69
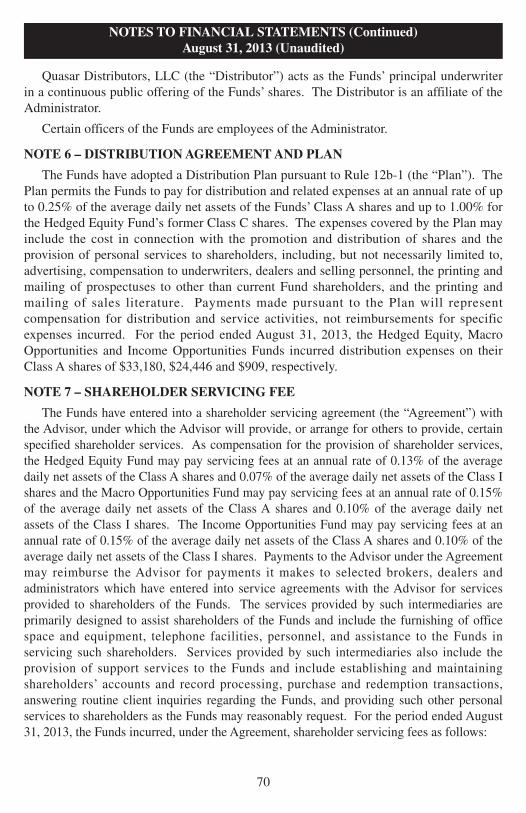
Quasar Distributors, LLC (the “Distributor”) acts as the Funds’ principal underwriterin a continuous public offering of the Funds’ shares. The Distributor is an affiliate of theAdministrator.
Certain officers of the Funds are employees of the Administrator.
NOTE 6 – DISTRIBUTIONAGREEMENTAND PLAN
The Funds have adopted a Distribution Plan pursuant to Rule 12b-1 (the “Plan”). ThePlan permits the Funds to pay for distribution and related expenses at an annual rate of upto 0.25% of the average daily net assets of the Funds’ Class A shares and up to 1.00% forthe Hedged Equity Fund’s former Class C shares. The expenses covered by the Plan mayinclude the cost in connection with the promotion and distribution of shares and theprovision of personal services to shareholders, including, but not necessarily limited to,advertising, compensation to underwriters, dealers and selling personnel, the printing andmailing of prospectuses to other than current Fund shareholders, and the printing andmailing of sales literature. Payments made pursuant to the Plan will representcompensation for distribution and service activities, not reimbursements for specificexpenses incurred. For the period ended August 31, 2013, the Hedged Equity, MacroOpportunities and Income Opportunities Funds incurred distribution expenses on theirClass A shares of $33,180, $24,446 and $909, respectively.
NOTE 7 – SHAREHOLDER SERVICING FEE
The Funds have entered into a shareholder servicing agreement (the “Agreement”) withthe Advisor, under which the Advisor will provide, or arrange for others to provide, certainspecified shareholder services. As compensation for the provision of shareholder services,the Hedged Equity Fund may pay servicing fees at an annual rate of 0.13% of the averagedaily net assets of the Class A shares and 0.07% of the average daily net assets of the Class Ishares and the Macro Opportunities Fund may pay servicing fees at an annual rate of 0.15%of the average daily net assets of the Class A shares and 0.10% of the average daily netassets of the Class I shares. The Income Opportunities Fund may pay servicing fees at anannual rate of 0.15% of the average daily net assets of the Class A shares and 0.10% of theaverage daily net assets of the Class I shares. Payments to the Advisor under the Agreementmay reimburse the Advisor for payments it makes to selected brokers, dealers andadministrators which have entered into service agreements with the Advisor for servicesprovided to shareholders of the Funds. The services provided by such intermediaries areprimarily designed to assist shareholders of the Funds and include the furnishing of officespace and equipment, telephone facilities, personnel, and assistance to the Funds inservicing such shareholders. Services provided by such intermediaries also include theprovision of support services to the Funds and include establishing and maintainingshareholders’ accounts and record processing, purchase and redemption transactions,answering routine client inquiries regarding the Funds, and providing such other personalservices to shareholders as the Funds may reasonably request. For the period ended August31, 2013, the Funds incurred, under the Agreement, shareholder servicing fees as follows:
70
NOTES TO FINANCIAL STATEMENTS (Continued)August 31, 2013 (Unaudited)

Orinda SkyView Multi-Manager Hedged Equity FundClass A $17,253Class I $33,697
Orinda SkyView Macro Opportunities FundClass A $14,668Class I $ 8,734Orinda Income Opportunities FundClass A $546Class I $681
NOTE 8 – SECURITIES TRANSACTIONS
For the period ended August 31, 2013, the cost of purchases and the proceeds fromsales of securities, excluding short-term securities, were as follows:
Purchases Sales_________ _____Hedged Equity Fund $84,010,546 $97,815,458Macro Opportunities Fund $39,045,618 $35,935,517Income Opportunities Fund $ 9,510,811 $ 2,556,573
There were no purchases or sales of long-term U.S. Government securities.
NOTE 9 – INCOME TAXESAND DISTRIBUTIONS TO SHAREHOLDERS
As of February 28, 2013, the components of accumulated earnings/(losses) on a taxbasis were as follows:
Hedged MacroEquity OpportunitiesFund Fund___________ __________
Cost of investments(a) $110,704,083 $32,263,734___________ _____________________ __________Gross unrealized appreciation 13,836,164 916,075Gross unrealized depreciation (2,208,576) (836,164)___________ __________Net unrealized appreciation 11,627,588 79,911___________ __________Undistributed ordinary income — 76,709Undistributed long-termcapital gain — 4,344___________ __________Total distributable earnings — 81,053___________ __________Other accumulatedgains/(losses) (2,624,083) (258,524)___________ __________Total accumulatedearnings/(losses) $ 9,003,505 $ (97,560)___________ _____________________ __________
(a) The difference between the book basis and tax basis net unrealized appreciationand cost is attributable primarily to wash sales, partnership income andoutstanding constructive sales.
NOTES TO FINANCIAL STATEMENTS (Continued)August 31, 2013 (Unaudited)
71
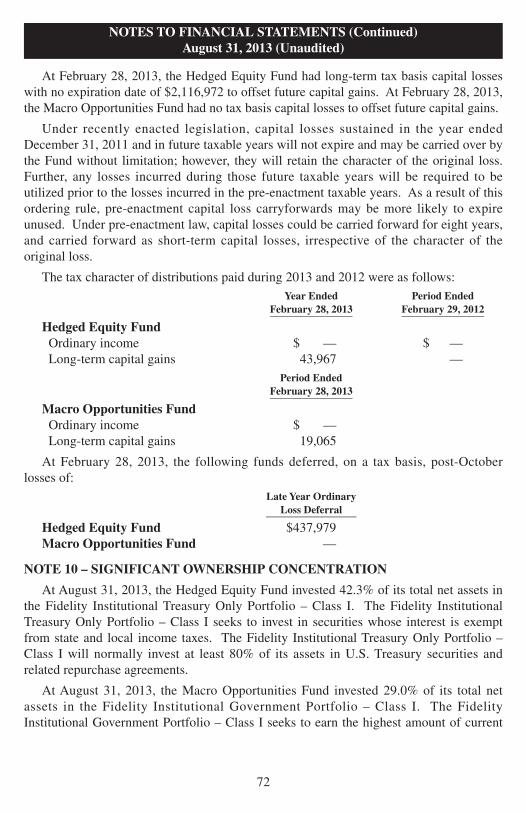
At February 28, 2013, the Hedged Equity Fund had long-term tax basis capital losseswith no expiration date of $2,116,972 to offset future capital gains. At February 28, 2013,the Macro Opportunities Fund had no tax basis capital losses to offset future capital gains.
Under recently enacted legislation, capital losses sustained in the year endedDecember 31, 2011 and in future taxable years will not expire and may be carried over bythe Fund without limitation; however, they will retain the character of the original loss.Further, any losses incurred during those future taxable years will be required to beutilized prior to the losses incurred in the pre-enactment taxable years. As a result of thisordering rule, pre-enactment capital loss carryforwards may be more likely to expireunused. Under pre-enactment law, capital losses could be carried forward for eight years,and carried forward as short-term capital losses, irrespective of the character of theoriginal loss.
The tax character of distributions paid during 2013 and 2012 were as follows:Year Ended Period Ended
February 28, 2013 February 29, 2012________________ ________________
Hedged Equity FundOrdinary income $ — $ —Long-term capital gains 43,967 —
Period EndedFebruary 28, 2013________________
Macro Opportunities FundOrdinary income $ —Long-term capital gains 19,065
At February 28, 2013, the following funds deferred, on a tax basis, post-Octoberlosses of:
Late Year OrdinaryLoss Deferral_________________
Hedged Equity Fund $437,979Macro Opportunities Fund —
NOTE 10 – SIGNIFICANT OWNERSHIP CONCENTRATION
At August 31, 2013, the Hedged Equity Fund invested 42.3% of its total net assets inthe Fidelity Institutional Treasury Only Portfolio – Class I. The Fidelity InstitutionalTreasury Only Portfolio – Class I seeks to invest in securities whose interest is exemptfrom state and local income taxes. The Fidelity Institutional Treasury Only Portfolio –Class I will normally invest at least 80% of its assets in U.S. Treasury securities andrelated repurchase agreements.
At August 31, 2013, the Macro Opportunities Fund invested 29.0% of its total netassets in the Fidelity Institutional Government Portfolio – Class I. The FidelityInstitutional Government Portfolio – Class I seeks to earn the highest amount of current
NOTES TO FINANCIAL STATEMENTS (Continued)August 31, 2013 (Unaudited)
72

income possible while maintaining principal and liquidity. The Fidelity InstitutionalGovernment Portfolio – Class I will normally invest at least 80% of its assets in U.S.government securities and related repurchase agreements.
At August 31, 2013, the Income Opportunities Fund invested 50.9% of its total netassets in the Fidelity Institutional Money Market Portfolio – Class I. The FidelityInstitutional Money Market Portfolio – Class I seeks to earn the highest amount ofcurrent income possible while maintaining principal and liquidity. The FidelityInstitutional Money Market Portfolio – Class I will invest predominantly in dollar-denominated money market securities. However, the fund is required to invest more than25% of its assets in the financial services industry and may also enter into reverserepurchase agreements.
NOTES TO FINANCIAL STATEMENTS (Continued)August 31, 2013 (Unaudited)
73

As a shareholder of the Fund, you incur two types of costs: (1) transaction costs includingsales charges (loads) and redemption fees, if applicable; and (2) ongoing costs, includingmanagement fees; distribution and/or service (12b-1 fees); and other Fund expenses. ThisExample is intended to help you understand your ongoing costs (in dollars) of investingin the Fund and to compare these costs with the ongoing costs of investing in othermutual funds.
The Example is based on an investment of $1,000 invested at the beginning of the periodindicated and held for the entire period from March 1, 2013 to August 31, 2013.
Actual ExpensesThe information in the table under the heading “Actual” provides information about actualaccount values and actual expenses. You may use the information in these columnstogether with the amount you invested, to estimate the expenses that you paid over theperiod. Simply divide your account value by $1,000 (for example, an $8,600 account valuedivided by $1,000 = 8.6), then multiply the result by the number in the row entitled“Expenses Paid During Period” to estimate the expenses you paid on your account duringthis period. There are some account fees that are charged to certain types of accounts,such as Individual Retirement Accounts (generally, a $15 fee is charged to the accountannually) that would increase the amount of expenses paid on your account. The examplebelow does not include portfolio trading commissions and related expenses and otherextraordinary expenses as determined under generally accepted accounting principles.
Hypothetical Example for Comparison PurposesThe information in the table under the heading “Hypothetical (5% return beforeexpenses)” provides information about hypothetical account values and hypotheticalexpenses based on the Fund’s actual expense ratio and assumed rate of return of 5% peryear before expenses, which is not the Fund’s actual return. The hypothetical accountvalues and expenses may not be used to estimate the actual ending account balance orexpenses you paid for the period. You may use this information to compare the ongoingcosts of investing in the Fund and other funds. To do so, compare this 5% hypotheticalexample with the 5% hypothetical examples that appear in the shareholder reports of theother funds. As noted above, there are some account fees that are charged to certain typesof accounts that would increase the amount of expense paid on your account.
Please note that the expenses shown in the table are meant to highlight your ongoingcosts only and do not reflect any transaction costs, such as sales charges (loads),redemption fees, or exchange fees. Therefore, the information under the heading“Hypothetical (5% return before expenses)” is useful in comparing ongoing costs only,and will not help you determine the relative total costs of owning different funds. Inaddition, if these transactional costs were included, your costs would have been higher.
74
EXPENSE EXAMPLEAugust 31, 2013 (Unaudited)
Orinda SkyView Multi-Manager Hedged Equity Fund

Beginning Ending Expenses PaidAccount Value Account Value During Period(1)
3/1/13 8/31/13 3/1/13 – 8/31/13____________ ____________ ______________
ActualClass A $1,000.00 $1,047.20 $21.98Class I $1,000.00 $1,048.50 $20.45
Hypothetical (5% returnbefore expenses)Class A $1,000.00 $1,003.73 $21.52Class I $1,000.00 $1,005.24 $20.02
(1) Expenses are equal to the Class A and Class I fund shares’ annualized expense ratios of 4.26% and 3.96%,respectively, multiplied by the average account value over the period, multiplied by 184/365 (to reflect theperiod).
75
Orinda SkyView Multi-Manager Hedged Equity Fund
EXPENSE EXAMPLE (Continued)August 31, 2013 (Unaudited)
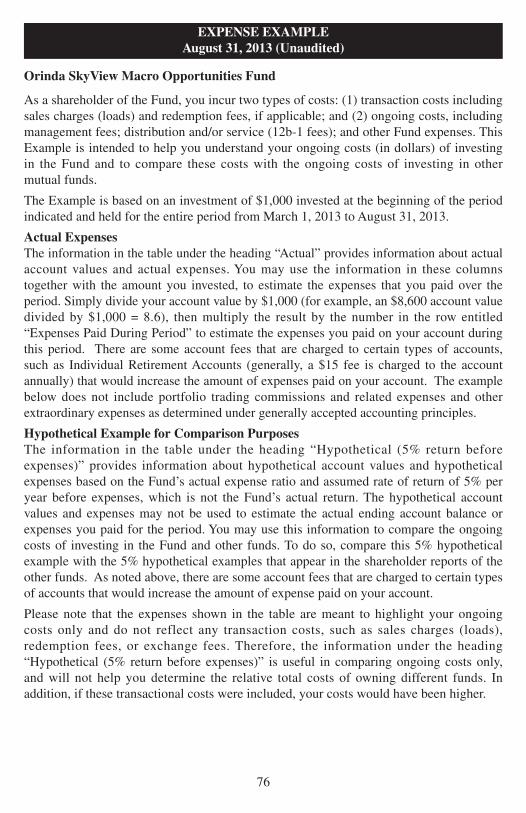
As a shareholder of the Fund, you incur two types of costs: (1) transaction costs includingsales charges (loads) and redemption fees, if applicable; and (2) ongoing costs, includingmanagement fees; distribution and/or service (12b-1 fees); and other Fund expenses. ThisExample is intended to help you understand your ongoing costs (in dollars) of investingin the Fund and to compare these costs with the ongoing costs of investing in othermutual funds.
The Example is based on an investment of $1,000 invested at the beginning of the periodindicated and held for the entire period from March 1, 2013 to August 31, 2013.
Actual ExpensesThe information in the table under the heading “Actual” provides information about actualaccount values and actual expenses. You may use the information in these columnstogether with the amount you invested, to estimate the expenses that you paid over theperiod. Simply divide your account value by $1,000 (for example, an $8,600 account valuedivided by $1,000 = 8.6), then multiply the result by the number in the row entitled“Expenses Paid During Period” to estimate the expenses you paid on your account duringthis period. There are some account fees that are charged to certain types of accounts,such as Individual Retirement Accounts (generally, a $15 fee is charged to the accountannually) that would increase the amount of expenses paid on your account. The examplebelow does not include portfolio trading commissions and related expenses and otherextraordinary expenses as determined under generally accepted accounting principles.
Hypothetical Example for Comparison PurposesThe information in the table under the heading “Hypothetical (5% return beforeexpenses)” provides information about hypothetical account values and hypotheticalexpenses based on the Fund’s actual expense ratio and assumed rate of return of 5% peryear before expenses, which is not the Fund’s actual return. The hypothetical accountvalues and expenses may not be used to estimate the actual ending account balance orexpenses you paid for the period. You may use this information to compare the ongoingcosts of investing in the Fund and other funds. To do so, compare this 5% hypotheticalexample with the 5% hypothetical examples that appear in the shareholder reports of theother funds. As noted above, there are some account fees that are charged to certain typesof accounts that would increase the amount of expense paid on your account.
Please note that the expenses shown in the table are meant to highlight your ongoingcosts only and do not reflect any transaction costs, such as sales charges (loads),redemption fees, or exchange fees. Therefore, the information under the heading“Hypothetical (5% return before expenses)” is useful in comparing ongoing costs only,and will not help you determine the relative total costs of owning different funds. Inaddition, if these transactional costs were included, your costs would have been higher.
EXPENSE EXAMPLEAugust 31, 2013 (Unaudited)
76
Orinda SkyView Macro Opportunities Fund
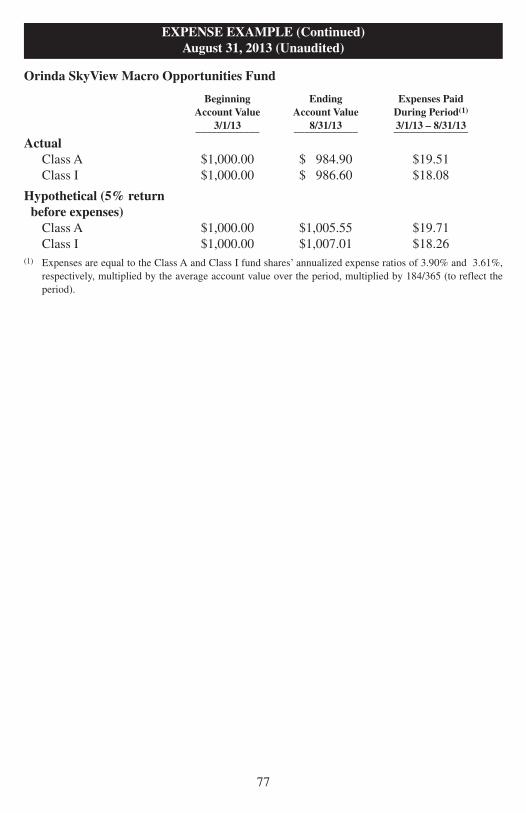
Beginning Ending Expenses PaidAccount Value Account Value During Period(1)
3/1/13 8/31/13 3/1/13 – 8/31/13____________ ____________ ______________
ActualClass A $1,000.00 $ 984.90 $19.51Class I $1,000.00 $ 986.60 $18.08
Hypothetical (5% returnbefore expenses)Class A $1,000.00 $1,005.55 $19.71Class I $1,000.00 $1,007.01 $18.26
(1) Expenses are equal to the Class A and Class I fund shares’ annualized expense ratios of 3.90% and 3.61%,respectively, multiplied by the average account value over the period, multiplied by 184/365 (to reflect theperiod).
EXPENSE EXAMPLE (Continued)August 31, 2013 (Unaudited)
77
Orinda SkyView Macro Opportunities Fund

As a shareholder of the Fund, you incur two types of costs: (1) transaction costs includingsales charges (loads) and redemption fees, if applicable; and (2) ongoing costs, includingmanagement fees; distribution and/or service (12b-1 fees); and other Fund expenses. ThisExample is intended to help you understand your ongoing costs (in dollars) of investingin the Fund and to compare these costs with the ongoing costs of investing in othermutual funds.
The Example is based on an investment of $1,000 invested at the beginning of the periodindicated and held for the entire period from June 28, 2013 (inception) to August 31, 2013.
Actual ExpensesThe information in the table under the heading “Actual” provides information about actualaccount values and actual expenses. You may use the information in these columnstogether with the amount you invested, to estimate the expenses that you paid over theperiod. Simply divide your account value by $1,000 (for example, an $8,600 account valuedivided by $1,000 = 8.6), then multiply the result by the number in the row entitled“Expenses Paid During Period” to estimate the expenses you paid on your account duringthis period. There are some account fees that are charged to certain types of accounts,such as Individual Retirement Accounts (generally, a $15 fee is charged to the accountannually) that would increase the amount of expenses paid on your account. The examplebelow does not include portfolio trading commissions and related expenses and otherextraordinary expenses as determined under generally accepted accounting principles.
Hypothetical Example for Comparison PurposesThe information in the table under the heading “Hypothetical (5% return beforeexpenses)” provides information about hypothetical account values and hypotheticalexpenses based on the Fund’s actual expense ratio and assumed rate of return of 5% peryear before expenses, which is not the Fund’s actual return. The hypothetical accountvalues and expenses may not be used to estimate the actual ending account balance orexpenses you paid for the period. You may use this information to compare the ongoingcosts of investing in the Fund and other funds. To do so, compare this 5% hypotheticalexample with the 5% hypothetical examples that appear in the shareholder reports of theother funds. As noted above, there are some account fees that are charged to certain typesof accounts that would increase the amount of expense paid on your account.
Please note that the expenses shown in the table are meant to highlight your ongoingcosts only and do not reflect any transaction costs, such as sales charges (loads),redemption fees, or exchange fees. Therefore, the information under the heading“Hypothetical (5% return before expenses)” is useful in comparing ongoing costs only,and will not help you determine the relative total costs of owning different funds. Inaddition, if these transactional costs were included, your costs would have been higher.
EXPENSE EXAMPLEAugust 31, 2013 (Unaudited)
78
Orinda Income Opportunities Fund

Beginning Ending Expenses PaidAccount Value Account Value During Period(1)
6/28/13 8/31/13 6/28/13 – 8/31/13____________ ____________ ______________
ActualClass A $1,000.00 $ 994.00 $3.32Class I $1,000.00 $ 994.40 $2.80
Hypothetical (5% returnbefore expenses)Class A $1,000.00 $1,005.44 $3.34Class I $1,000.00 $1,005.96 $2.81
(1) Expenses are equal to the Class A and Class I fund shares’ annualized expense ratios of 1.90% and 1.60%,respectively, multiplied by the average account value over the period, multiplied by 64/365 (to reflect theperiod).
EXPENSE EXAMPLE (Continued)August 31, 2013 (Unaudited)
79
Orinda Income Opportunities Fund

How to Obtain a Copy of the Funds’ Proxy Voting Policies
A description of the policies and procedures that the Funds use to determine how to voteproxies relating to portfolio securities is available without charge, upon request, bycalling 1-855-467-4632 or on the U.S. Securities and Exchange Commission’s (“SEC”)website at http://www.sec.gov.
How to Obtain a Copy of the Funds’ Proxy Voting Records for the 12-Month PeriodEnded June 30, 2013
Information regarding how the Funds voted proxies relating to portfolio securities duringthe most recent 12-month period ended June 30 is available without charge, upon request,by calling 1-855-467-4632. Furthermore, you can obtain the Funds’ proxy voting recordson the SEC’s website at http://www.sec.gov.
Quarterly Filings on Form N-Q
The Funds file their complete schedule of portfolio holdings with the SEC for the firstand third quarters of each fiscal year on Form N-Q. The Funds’ Form N-Q is available onthe SEC’s website at http://www.sec.gov. The Funds’ Form N-Q may be reviewed andcopied at the SEC’s Public Reference Room in Washington, DC, and information on theoperation of the Public Reference Room may be obtained by calling 1-202-551-8090.Information included in the Funds’ Form N-Q is also available, upon request, by calling1-855-467-4632.
Householding
In an effort to decrease costs, the Funds intend to reduce the number of duplicateprospectuses and annual and semi-annual reports you receive by sending only one copyof each to those addresses shared by two or more accounts and to shareholders theTransfer Agent reasonably believes are from the same family or household. Onceimplemented, if you would like to discontinue householding for your accounts, pleasecall toll-free at 1-855-467-4632 to request individual copies of these documents. Once theTransfer Agent receives notice to stop householding, the Transfer Agent will beginsending individual copies thirty days after receiving your request. This policy does notapply to account statements.
NOTICE TO SHAREHOLDERSat August 31, 2013 (Unaudited)
80

Orinda SkyView Macro Opportunities Fund
At a meeting held March 15-16, 2013, the members present of the Board of Trustees(“Board”) of Advisors Series Trust (the “Trust”), including the majority of the Trusteeswho are not “interested persons” (as that term is defined in the Investment Company Actof 1940, as amended) (the “Independent Trustees”), unanimously approved a new sub-advisory agreement (the “Sub-Advisory Agreement”) between the Trust, Orinda AssetManagement, LLC (“Orinda” or the “Advisor”) and Glaxis Capital Management, LLC(“Glaxis” or the “sub-advisor”) for the Orinda SkyView Macro Opportunities Fund (the“Fund”) for a period not to exceed two years. The Board considered that the terms andconditions of the proposed Sub-Advisory Agreement with Glaxis are generally similar inall material respects to the terms and conditions of the other sub-advisory agreementswith the Fund’s other sub-advisors, except for the sub-advisory agreement with SkyViewInvestment Advisors, LLC, which serves in a unique capacity as “lead sub-advisor”. TheBoard also considered that the fees payable to Glaxis under the proposed Sub-AdvisoryAgreement would not result in an increase in the Fund’s advisory fee levels previouslyapproved by the Fund’s initial shareholders or in an increase in the fee levels retained byOrinda after payment of the sub-advisory fees to the sub-advisors. Below is a summaryof the factors considered by the Board and the conclusions that formed the basis for theBoard’s approval of the Sub-Advisory Agreement:
The Board considered the overall fairness of the Sub-Advisory Agreement andwhether the agreement was in the best interest of the Fund. The full Board, whichincludes a majority of Independent Trustees, further considered factors it deemedrelevant with respect to the Fund, including, as applicable: (1) the nature, quality andextent of the services provided or to be provided by the sub-adviser to the Fund; (2) theinvestment performance of the Fund and its sub-adviser; (3) the costs of the services tobe provided and profits to be realized by the sub-advisor and its affiliates from the sub-adviser’s relationship with the Fund; (4) the extent to which economies of scale will berealized as the Fund grows and whether fee levels reflect those economies of scale for thebenefit of Fund investors; and (5) comparative services rendered and comparativeadvisory and sub-advisory fee rates. In addition to the foregoing factors, the Board alsodiscussed whether there were other benefits received by the Advisor, the sub-advisor, ortheir affiliates, from the sub-advisor’s relationship with the Fund. The Board concludedthat any fall-out benefits resulting from the engagement of the sub-advisor were such thatthey did not impact the Board’s conclusion that the proposed sub-advisory fees werereasonable.
The Board noted that Glaxis’ fees would be paid entirely by the Advisor so that noadditional expenses would be borne by shareholders for the engagement of Glaxis. TheBoard considered the scope and quality of services to be provided by the sub-advisor,including the fact that the sub-advisor pays the costs of all necessary investment andmanagement facilities necessary for the efficient conduct of its services. The Board alsoconsidered the qualifications and experience of the portfolio managers responsible for
APPROVAL OF INVESTMENTSUB-ADVISORYAGREEMENT (Unaudited)
81

managing the sub-advisor’s portion of the Fund. The Board further consideredcomparative fees and performance data of other comparable portfolios managed by thesub-advisor. Based on these considerations, the Board was satisfied, with respect toGlaxis and the Fund that (1) the Fund was reasonably likely to benefit from the nature,quality and extent of the sub-advisor’s services and (2) the sub-advisor’s compensation isfair and reasonable.
In considering the Sub-Advisory Agreement, no single factor was determinative of theBoard’s decision to approve the Sub-Advisory Agreement; rather, the Board based theirdetermination on the total mix of information available to them. Based on aconsideration of all the factors in their totality, the Trustees determined that the sub-advisory arrangement with Glaxis, including sub-advisory fees, were fair and reasonableto the Fund. The Board therefore determined that the approval of the Sub-AdvisoryAgreement was in the best interests of the Fund and its shareholders.
APPROVAL OF INVESTMENTSUB-ADVISORYAGREEMENT (Unaudited) (Continued)
82
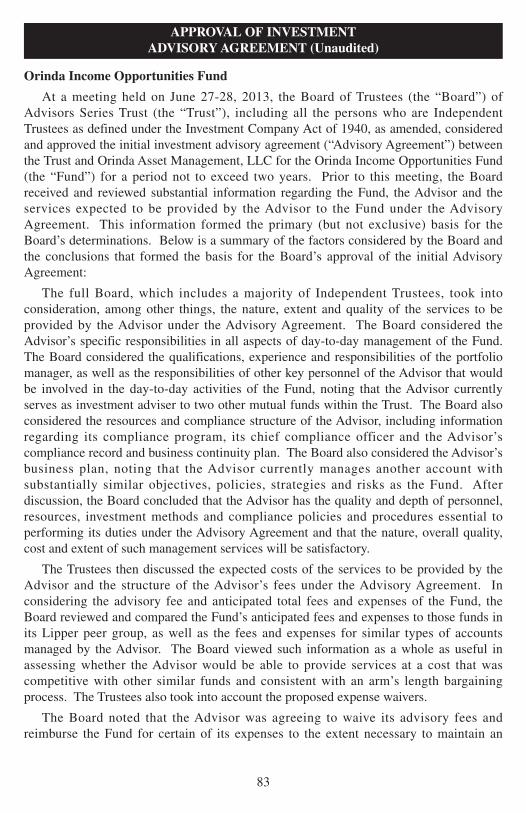
Orinda Income Opportunities Fund
At a meeting held on June 27-28, 2013, the Board of Trustees (the “Board”) ofAdvisors Series Trust (the “Trust”), including all the persons who are IndependentTrustees as defined under the Investment Company Act of 1940, as amended, consideredand approved the initial investment advisory agreement (“Advisory Agreement”) betweenthe Trust and Orinda Asset Management, LLC for the Orinda Income Opportunities Fund(the “Fund”) for a period not to exceed two years. Prior to this meeting, the Boardreceived and reviewed substantial information regarding the Fund, the Advisor and theservices expected to be provided by the Advisor to the Fund under the AdvisoryAgreement. This information formed the primary (but not exclusive) basis for theBoard’s determinations. Below is a summary of the factors considered by the Board andthe conclusions that formed the basis for the Board’s approval of the initial AdvisoryAgreement:
The full Board, which includes a majority of Independent Trustees, took intoconsideration, among other things, the nature, extent and quality of the services to beprovided by the Advisor under the Advisory Agreement. The Board considered theAdvisor’s specific responsibilities in all aspects of day-to-day management of the Fund.The Board considered the qualifications, experience and responsibilities of the portfoliomanager, as well as the responsibilities of other key personnel of the Advisor that wouldbe involved in the day-to-day activities of the Fund, noting that the Advisor currentlyserves as investment adviser to two other mutual funds within the Trust. The Board alsoconsidered the resources and compliance structure of the Advisor, including informationregarding its compliance program, its chief compliance officer and the Advisor’scompliance record and business continuity plan. The Board also considered the Advisor’sbusiness plan, noting that the Advisor currently manages another account withsubstantially similar objectives, policies, strategies and risks as the Fund. Afterdiscussion, the Board concluded that the Advisor has the quality and depth of personnel,resources, investment methods and compliance policies and procedures essential toperforming its duties under the Advisory Agreement and that the nature, overall quality,cost and extent of such management services will be satisfactory.
The Trustees then discussed the expected costs of the services to be provided by theAdvisor and the structure of the Advisor’s fees under the Advisory Agreement. Inconsidering the advisory fee and anticipated total fees and expenses of the Fund, theBoard reviewed and compared the Fund’s anticipated fees and expenses to those funds inits Lipper peer group, as well as the fees and expenses for similar types of accountsmanaged by the Advisor. The Board viewed such information as a whole as useful inassessing whether the Advisor would be able to provide services at a cost that wascompetitive with other similar funds and consistent with an arm’s length bargainingprocess. The Trustees also took into account the proposed expense waivers.
The Board noted that the Advisor was agreeing to waive its advisory fees andreimburse the Fund for certain of its expenses to the extent necessary to maintain an
APPROVAL OF INVESTMENTADVISORYAGREEMENT (Unaudited)
83

annual expense ratio, excluding acquired fund fees and expenses, interest and dividendson securities sold short, taxes and extraordinary expenses, of 1.90% for Class A sharesand 1.60% for Class I shares (the “Expense Caps”).
The Board noted that the Fund’s expected total operating expenses for Class A andClass I shares were above the peer group median and average. The Board also noted thatthe expected contractual advisory fee was above the peer group median and average, butthat the Fund’s expected contractual advisory fee was in line with the fees charged by theAdvisor to its other account with substantially similar objectives, policies, strategies andrisks as the Fund.
The Board concluded that the fees to be paid to the Advisor were fair and reasonablegiven the performance of its similarly managed account.
The Board also considered economies of scale that would be expected to be realizedby the Advisor as the assets of the Fund grew. The Board noted that the Advisor wouldbe contractually agreeing to reduce its advisory fees or reimburse Fund expensesindefinitely, but in no event for less than a one year term, so that the Fund does notexceed the Expense Caps. The Board concluded that there were no effective economiesof scale to be shared by the Advisor at this time, but indicated that this issue would berevisited in the future as circumstances changed and asset levels increased.
The Board then considered the profits expected to be realized by the Advisor from itsrelationship with the Fund. The Board reviewed the Advisor’s financial information andtook into account both the expected direct benefits and the indirect benefits to the Advisorfrom advising the Fund. The Board considered the expected profitability to the Advisorfrom its relationship with the Fund and considered any additional benefits that may bederived by the Advisor from its relationship with the Fund, such as benefits received inexchange for Rule 12b-1 fees and potential soft dollar benefits. After such review, theBoard determined that the expected profitability to the Advisor with respect to theAdvisory Agreement was not excessive, and that the Advisor should be able to maintainadequate profit levels to support the services it will provide to the Fund.
No single factor was determinative of the Board’s decision to approve the AdvisoryAgreement; rather, the Trustees based their determination on the total mix of informationavailable to them. Based on a consideration of all the factors in their totality, the Trusteesdetermined that the advisory arrangement with the Advisor, including advisory fees, wasfair and reasonable to the Fund. The Board, including a majority of IndependentTrustees, therefore determined that the approval of the Advisory Agreement was in thebest interests of the Fund and its shareholders.
APPROVAL OF INVESTMENTADVISORYAGREEMENT (Unaudited) (Continued)
84

(This Page Intentionally Left Blank.)


The Funds collect non-public information about you from the following sources:
• Information we receive about you on applications or other forms;
• Information you give us orally; and/or
• Information about your transactions with us or others.
We do not disclose any non-public personal information about our customers or formercustomers without the customer’s authorization, except as permitted by law or in responseto inquiries from governmental authorities. We may share information with affiliated andunaffiliated third parties with whom we have contracts for servicing the Funds. We willprovide unaffiliated third parties with only the information necessary to carry out theirassigned responsibilities. We maintain physical, electronic and procedural safeguards toguard your non-public personal information and require third parties to treat yourpersonal information with the same high degree of confidentiality.
In the event that you hold shares of the Funds through a financial intermediary, including,but not limited to, a broker-dealer, bank, or trust company, the privacy policy of yourfinancial intermediary would govern how your non-public personal information would beshared by those entities with unaffiliated third parties.
PRIVACY NOTICE

Investment AdvisorOrinda Asset Management LLC4 Orinda Way, Suite 100-B
Orinda, CA 94563
DistributorQuasar Distributors, LLC
615 East Michigan Street, 4th FloorMilwaukee, WI 53202
Transfer AgentU.S. Bancorp Fund Services, LLC
615 East Michigan StreetMilwaukee, WI 53202
(877) 626-6080
CustodianU.S. Bank National Association
Custody Operations1555 North River Center Drive, Suite 302
Milwaukee, WI 53212
Independent Registered Public Accounting FirmTait, Weller & Baker LLP
1818 Market Street, Suite 2400Philadelphia, PA 19103
Legal CounselPaul Hastings LLP75 East 55th StreetNewYork, NY 10022
This report is intended for shareholders of the Funds and may not be used as salesliterature unless preceded or accompanied by a current prospectus.
Past performance results shown in this report should not be considered a representation offuture performance. Share price and returns will fluctuate so that shares, when redeemed,may be worth more or less than their original cost. Statements and other informationherein are dated and are subject to change.