Kaizen Hedged Premium Spreads Fund - …€¦ · Kaizen Hedged Premium Spreads Fund Class I ......
56
Kaizen Hedged Premium Spreads Fund Class I (KZSIX) Altrius Enhanced Income Fund Class I (KEUIX) MarketGrader 100 Enhanced Index Fund Class I (KHMIX) ANNUAL REPORT December 31, 2016
Transcript of Kaizen Hedged Premium Spreads Fund - …€¦ · Kaizen Hedged Premium Spreads Fund Class I ......

Kaizen Hedged Premium Spreads Fund Class I (KZSIX)
Altrius Enhanced Income Fund Class I (KEUIX)
MarketGrader 100 Enhanced Index Fund Class I (KHMIX)
ANNUAL REPORT December 31, 2016

Kaizen Hedged Premium Spreads Fund Altrius Enhanced Income Fund
MarketGrader 100 Enhanced Index Fund Each a series of Investment Managers Series Trust II
This report and the financial statements contained herein are provided for the general information of the shareholders of the Kaizen Funds. This report is not authorized for distribution to prospective investors in the Funds unless preceded or accompanied by an effective prospectus.
www.kaizenfunds.com
Table of Contents Shareholder Letter ........................................................................................................................................ 1
Fund Performance ........................................................................................................................................ 3
Schedule of Investments ............................................................................................................................... 6
Statements of Assets and Liabilities ........................................................................................................... 24
Statements of Operations ........................................................................................................................... 25
Statements of Changes in Net Assets ......................................................................................................... 26
Financial Highlights ..................................................................................................................................... 29
Notes to Financial Statements .................................................................................................................... 32
Report of Independent Registered Public Accounting Firm ....................................................................... 45
Supplemental Information .......................................................................................................................... 46
Expense Examples ....................................................................................................................................... 48

1745 S. Naperville Rd, Suite 103 Wheaton, IL 60189
630.949.2070
Dear Shareholders,
The Kaizen Hedged Premium Spreads Funds Class I shares (KZSIX) shares returned 3.16%, for the year ending 12/31/2016. In comparison, the S&P 500 Total Return advanced 11.96%, for the same period. 2016 saw the worst start for a year in S&P 500 history, declining 10.27% through 2/11/2016. During the same period, KZSIX was down 4.74%. The redesigned VIX hedge and additional hedging techniques helped reduce declines compared to the S&P 500. The balance of the year was spent digging out of our early losses and managing event risk like the Brexit vote and the U.S. Presidential Election.
The MarketGrader 100 Enhanced Index Fund Class I shares, (KHMIX) shares returned 12.74%, for the year ending 12/31/2016. In comparison, the S&P 500 Total Return advanced 11.96%, for the same period. Outperformance of KHMIX compared to the S&P 500 was driven by the timing of the investments, missing most of the market losses that occurred early in January. The fund was hedged during short periods in February and in early November. These hedges resulted in a net cost to the fund.
The Altrius Enhanced Income Fund Class I shares, (KEUIX) shares returned 10.37%, for the year ending 12/31/2016. In comparison, the Bloomberg Barclay Aggregate Bond Index returned 2.65%. The SEC 30-day yield, net of expenses (subsidized), was 3.72% and the unsubsidized was 3.20%, as of the same period. The fund has outperformed its benchmark during 2016 due primarily to investments in lower quality corporate issues in the energy and materials sector along with the put writing component of the fund.
OUTLOOK
With the future impossible to predict, the management approach for Kaizen Hedged Premium Spreads Fund (KZSIX) is intended to remain the same. We will continue to prudently seek risk-adjusted returns with a keen eye towards risk management. We don’t use outlooks or projections in our investment process as those are fraught with error and can lead to undesirable investment outcomes. We position for the market environment we have, not the one we want.
Our Altrius Enhanced Income Fund (KEUIX) outlook continues to be low GDP growth in a volatile economic and market climate with potentially rising interest rates in the near to intermediate term. On the volatility side, we expect a more volatile equity market. Higher levels of implied volatility should enhance the opportunities for attractive risk-adjusted returns from writing out-of-the-money (OTM) put options on conservatively financed U.S. equities.
We will continue to follow the MarketGrader 100 Dynamic Risk Overlay Index with our next rebalance scheduled for February and our hedging signals are off for now, but always monitoring the volatility environment as measured by the VIX Index.
Thank you for your confidence and support. It is a privilege to serve you.
Thomas R. Young
President
1

1745 S. Naperville Rd, Suite 103 Wheaton, IL 60189
630.949.2070
Important Disclosures:
The views were those of the Fund Managers as of December 31, 2016, and may not reflect their views on the date this material is first published or anytime thereafter. These views are intended to assist the shareholders of the Fund in understanding their investments in the Fund and do not constitute investment advice. This material may contain discussions about investments that may or may not be held by the Fund as of the date of this material. All current and future holdings are subject to risk and to change. All investments are subject to risk, including possible loss of principal. See the prospectus for more fully described risks for each of the Funds.
An investment in the Kaizen Hedged Premium Spreads Fund is subject to risk, including, but are not limited to the following: written options risk, options risk, derivatives risk, futures risk, leveraging risk, hedging transaction risk, interest rate risk, liquidity risk, non-diversified risk, regulatory risk and limited operating history risk.
The MarketGrader 100 Enhanced Index Fund's risks include, but are not limited to, the following: The Fund invests in small and medium size companies, derivatives instruments involve inherent leverage, which may magnify the Fund's gains or losses. Risks of futures contracts, hedging transactions and liquidity risks, also, exist.
The Altrius Enhanced Income Fund's risks include, but are not limited to, the following: High yield bonds are debt securities rated below investment grade ("junk bonds") and convertible securities. Prices of foreign securities may be more volatile than the prices of securities of U.S, derivatives instruments involve inherent leverage, purchasing and writing put and call options are highly specialized activities and entail greater than ordinary investment risks. To the extent that the Fund invests in over-the-counter options, the Fund may be exposed to counterparty risk and liquidity risk.
The S&P 500 is a broad-based, unmanaged measurement of changes in stock market conditions based on the average of 500 widely held stocks. The VIX is a benchmark for stock market volatility designed to reflect investors’ consensus view of future 30-day expected stock market volatility. The value of a VIX hedge typically increases during sudden and extreme market declines. The MarketGrader 100 Dynamic Risk Overlay Index is a rules-based index intended to give investors a means of tracking the overall performance of a portfolio of 100 U.S equity securities with attractive metrics. The screening methodology is based primarily on the strength of a company’s fundamentals with respect to growth, value, profitability and cash flow. Each position is equally weighted to create a well-diversified U.S. equity portfolio with risk controls such as sector limits and liquidity filters. One cannot invest directly in an index.
Subsidized 30-Day SEC Yield is based on a 30-day period ending on the last day of the previous month and is computed by dividing the net investment income per share earned during the period by the maximum offering price per share on the last day of the period. This subsidized yield is based on the net expenses of the Fund of which the yield would be lower without the waivers in effect. Unsubsidized 30 Day SEC Yield is based on total expenses of the Fund. Each individual’s actual tax burden will vary.
2

Kaizen Hedged Premium Spreads Fund FUND PERFORMANCE at December 31, 2016 (Unaudited)
This graph compares a hypothetical $10,000 investment in the Fund’s Class I shares, made at its inception, with a similar investment in the S&P 500 Index. Results include the reinvestment of all dividends and capital gains.
The S&P 500 Index is a broad based unmanaged index of 500 stocks and widely recognized as representative of the equity market in general. This index does not reflect expenses, fees or sales charge, which would lower performance. The index is unmanaged and it is not possible to invest in an index.
Average Annual Total Returns as of December 31, 2016 1 Year Since Inception Inception Date Kaizen Hedged Premium Spreads Fund – Class I 3.16% -15.84% 08/03/15 S&P 500 Index 11.96% 7.08% 08/03/15
The performance data quoted here represents past performance and past performance is not a guarantee of future results. Investment return and principal value will fluctuate so that an investor's shares, when redeemed, may be worth more or less than their original cost. Current performance may be lower or higher than the performance information quoted. The most recent month end performance may be obtained by calling (844) 524-9366. The Fund’s expense ratio for the Class I shares was 1.50%, which was the amount stated in the current prospectus dated May 1, 2016. Returns reflect the reinvestment of distributions made by the Fund, if any. The graph and the performance table above do not reflect the deduction of taxes that a shareholder would pay on Fund distributions or the redemption of Fund shares. Shares redeemed within 30 days of purchase will be charged 2.00% redemption fee.
$7,840
$11,013
$0
$2,000
$4,000
$6,000
$8,000
$10,000
$12,000Performance of a $10,000 Investment
Kaizen Hedged Premium Spreads Fund - Class I S&P 500 Index
3
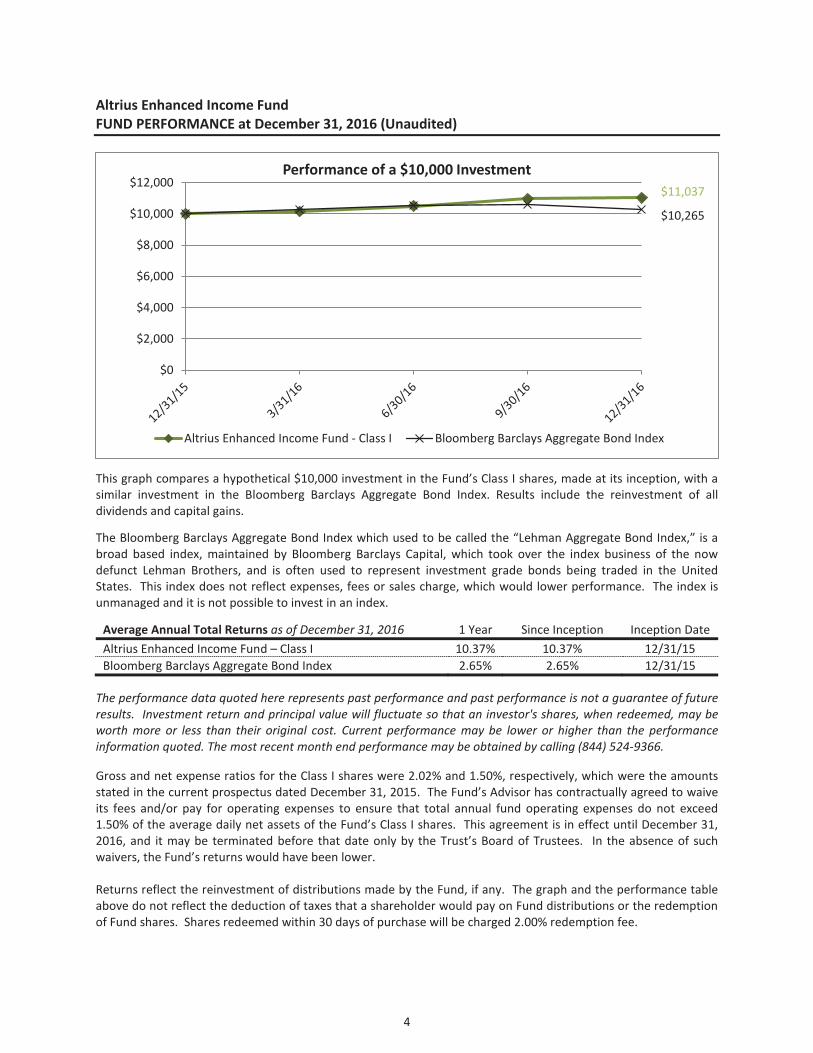
Altrius Enhanced Income Fund FUND PERFORMANCE at December 31, 2016 (Unaudited)
This graph compares a hypothetical $10,000 investment in the Fund’s Class I shares, made at its inception, with a similar investment in the Bloomberg Barclays Aggregate Bond Index. Results include the reinvestment of all dividends and capital gains.
The Bloomberg Barclays Aggregate Bond Index which used to be called the “Lehman Aggregate Bond Index,” is a broad based index, maintained by Bloomberg Barclays Capital, which took over the index business of the now defunct Lehman Brothers, and is often used to represent investment grade bonds being traded in the United States. This index does not reflect expenses, fees or sales charge, which would lower performance. The index is unmanaged and it is not possible to invest in an index.
Average Annual Total Returns as of December 31, 2016 1 Year Since Inception Inception Date Altrius Enhanced Income Fund – Class I 10.37% 10.37% 12/31/15 Bloomberg Barclays Aggregate Bond Index 2.65% 2.65% 12/31/15
The performance data quoted here represents past performance and past performance is not a guarantee of future results. Investment return and principal value will fluctuate so that an investor's shares, when redeemed, may be worth more or less than their original cost. Current performance may be lower or higher than the performance information quoted. The most recent month end performance may be obtained by calling (844) 524-9366. Gross and net expense ratios for the Class I shares were 2.02% and 1.50%, respectively, which were the amounts stated in the current prospectus dated December 31, 2015. The Fund’s Advisor has contractually agreed to waive its fees and/or pay for operating expenses to ensure that total annual fund operating expenses do not exceed 1.50% of the average daily net assets of the Fund’s Class I shares. This agreement is in effect until December 31, 2016, and it may be terminated before that date only by the Trust’s Board of Trustees. In the absence of such waivers, the Fund’s returns would have been lower. Returns reflect the reinvestment of distributions made by the Fund, if any. The graph and the performance table above do not reflect the deduction of taxes that a shareholder would pay on Fund distributions or the redemption of Fund shares. Shares redeemed within 30 days of purchase will be charged 2.00% redemption fee.
$11,037
$10,265
$0
$2,000
$4,000
$6,000
$8,000
$10,000
$12,000Performance of a $10,000 Investment
Altrius Enhanced Income Fund - Class I Bloomberg Barclays Aggregate Bond Index
4

MarketGrader 100 Enhanced Index Fund FUND PERFORMANCE at December 31, 2016 (Unaudited)
This graph compares a hypothetical $10,000 investment in the Fund’s Class I shares, made at its inception, with a similar investment in the S&P 500 Index. Results include the reinvestment of all dividends and capital gains.
The S&P 500 Index is a broad based unmanaged index of 500 stocks and widely recognized as representative of the equity market in general. This index does not reflect expenses, fees or sales charge, which would lower performance. The index is unmanaged and it is not possible to invest in an index.
Average Annual Total Returns as of December 31, 2016 1 Year Since Inception Inception Date MarketGrader 100 Enhanced Index Fund – Class I 12.74% 12.74% 12/31/15 S&P 500 Index 11.96% 11.96% 12/31/15
The performance data quoted here represents past performance and past performance is not a guarantee of future results. Investment return and principal value will fluctuate so that an investor's shares, when redeemed, may be worth more or less than their original cost. Current performance may be lower or higher than the performance information quoted. The most recent month end performance may be obtained by calling (844) 524-9366. Gross and net expense ratios for the Class I shares were 1.66% and 1.50%, respectively, which were the amounts stated in the current prospectus dated December 31, 2015. The Fund’s Advisor has contractually agreed to waive its fees and/or pay for operating expenses to ensure that total annual fund operating expenses do not exceed 1.50% of the average daily net assets of the Fund’s Class I shares. This agreement is in effect until December 31, 2016, and it may be terminated before that date only by the Trust’s Board of Trustees. In the absence of such waivers, the Fund’s returns would have been lower. Returns reflect the reinvestment of distributions made by the Fund, if any. The graph and the performance table above do not reflect the deduction of taxes that a shareholder would pay on Fund distributions or the redemption of Fund shares. Shares redeemed within 30 days of purchase will be charged 2.00% redemption fee.
$11,274
$11,196
$0
$2,000
$4,000
$6,000
$8,000
$10,000
$12,000Performance of a $10,000 Investment
MarketGrader 100 Enhanced Index Fund - Class I S&P 500 Index
5

Kaizen Hedged Premium Spreads Fund SCHEDULE OF INVESTMENTS As of December 31, 2016
Number
of Contracts Value __________ ____________ PURCHASED OPTIONS CONTRACTS – 0.3%
CALL OPTIONS – 0.2%
CBOE SPX Volatility Index 1,000 Exercise Price: $17.00, Expiration Date: January 18, 2017* $ 82,500
1,000 Exercise Price: $24.00, Expiration Date: January 18, 2017* 22,500 ____________
TOTAL CALL OPTIONS (Cost $208,567) 105,000 ____________
PUT OPTIONS – 0.1%
CBOE SPX Volatility Index 1,000 Exercise Price: $13.00, Expiration Date: January 18, 2017 22,500
CBOE S&P 500 Index 100 Exercise Price: $2,140.00, Expiration Date: January 13, 2017 27,750 ____________
TOTAL PUT OPTIONS (Cost $97,545) 50,250 ____________
TOTAL PURCHASED OPTIONS CONTRACTS (Cost $306,112) 155,250 ____________
Principal Amount __________
SHORT-TERM INVESTMENTS – 97.9%
$ 513,207 UMB Money Market Fiduciary, 0.01%1 513,207
62,000,000 United States Treasury Bill, 0.40%2 61,971,852 ____________
TOTAL SHORT-TERM INVESTMENTS (Cost $62,485,837) 62,485,059 ____________
TOTAL INVESTMENTS – 98.2% (Cost $62,791,949) 62,640,309
Other Assets in Excess of Liabilities – 1.8% 1,174,212 ____________ TOTAL NET ASSETS – 100.0% $ 63,814,521 ________________________
Number
of Contracts __________ SECURITIES SOLD SHORT – (0.1)%
WRITTEN OPTIONS CONTRACTS – (0.1)%
CALL OPTIONS – 0.0%
CBOE SPX Volatility Index (1,000) Exercise Price: $23.00, Expiration Date: January 18, 2017 (27,500) ____________
TOTAL CALL OPTIONS (Proceeds $51,050) (27,500) ____________
PUT OPTIONS – (0.1)%
CBOE SPX Volatility Index (1,000) Exercise Price: $14.00, Expiration Date: January 18, 2017 (62,500)
6
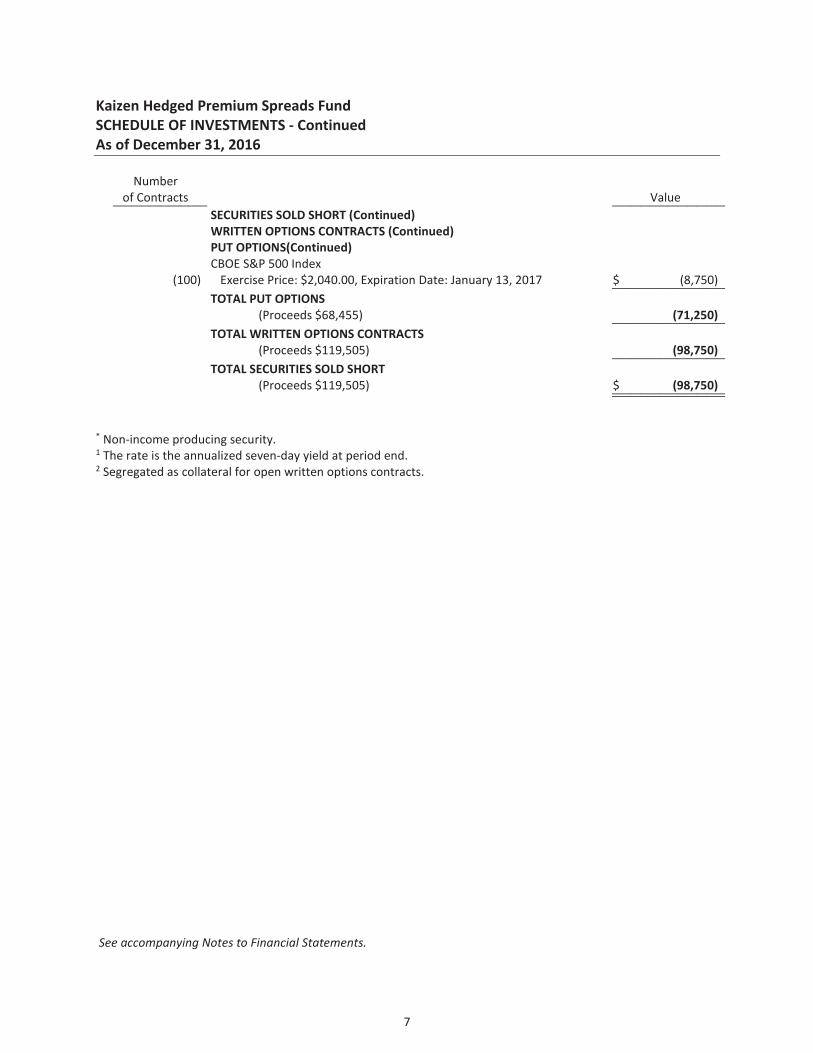
Kaizen Hedged Premium Spreads Fund SCHEDULE OF INVESTMENTS - Continued As of December 31, 2016
Number
of Contracts Value __________ ____________ SECURITIES SOLD SHORT (Continued) WRITTEN OPTIONS CONTRACTS (Continued) PUT OPTIONS(Continued) CBOE S&P 500 Index (100) Exercise Price: $2,040.00, Expiration Date: January 13, 2017 $ (8,750) ____________
TOTAL PUT OPTIONS (Proceeds $68,455) (71,250) ____________
TOTAL WRITTEN OPTIONS CONTRACTS (Proceeds $119,505) (98,750) ____________
TOTAL SECURITIES SOLD SHORT (Proceeds $119,505) $ (98,750) ________________________
* Non-income producing security. 1 The rate is the annualized seven-day yield at period end. 2 Segregated as collateral for open written options contracts.
See accompanying Notes to Financial Statements.
7

See accompanying Notes to Financial Statements.
As of December 31, 2016
FUTURES CONTRACTS
Number of UnrealizedContracts Expiration Value at Value at Appreciation
Long (Short) Description Date Trade Date December 31, 2016 (Depreciation)
25 E-mini S&P 500 March 2017 2,796,579$ 2,795,250$ (1,329)$
TOTAL FUTURES CONTRACTS 2,796,579$ 2,795,250$ (1,329)$
Kaizen Hedged Premium Spreads FundSCHEDULE OF INVESTMENTS - Continued
8

Kaizen Hedged Premium Spreads Fund SUMMARY OF INVESTMENTS As of December 31, 2016
Security Type Percent of Total
Net Assets Short-Term Investments 97.9% Purchased Options Contracts 0.3% __________Total Investments 98.2% Other Assets in Excess of Liabilities 1.8% __________Total Net Assets 100.0% ____________________
See accompanying Notes to Financial Statements.
9

Altrius Enhanced Income Fund SCHEDULE OF INVESTMENTS As of December 31, 2016
Principal Amount Value __________ ____________
CORPORATE BONDS – 75.2%
COMMUNICATIONS – 8.5%
$ 350,000 AMC Networks, Inc.
4.750%, 12/15/20221,6 $ 352,188
Cablevision Systems Corp. 90,000 7.750%, 4/15/20186 94,950
260,000 8.000%, 4/15/20206 285,350
350,000 DISH DBS Corp.
6.750%, 6/1/20216 379,750
233,000 EarthLink Holdings Corp.
8.875%, 5/15/20191,6 238,417
350,000 Frontier Communications Corp.
8.500%, 4/15/20206 367,500
350,000 McClatchy Co.
9.000%, 12/15/20221 372,750
60,000 Netflix, Inc.
5.375%, 2/1/20216 64,500
350,000 Sprint Capital Corp.
6.900%, 5/1/20196 370,562
T-Mobile USA, Inc. 30,000 6.625%, 11/15/20201,6 30,675
130,000 6.250%, 4/1/20211,6 135,200
350,000 Univision Communications, Inc.
6.750%, 9/15/20221,2 367,500
350,000 Windstream Services LLC
7.750%, 10/15/20201,6 359,800 ____________ 3,419,142 ____________ CONSUMER DISCRETIONARY – 15.6%
360,000 ADT Corp.
6.250%, 10/15/20216 390,600
415,000 Air Canada
7.750%, 4/15/20213 463,762
205,000 American Airlines Group, Inc.
6.125%, 6/1/20186 213,456
350,000 American Greetings Corp.
7.375%, 12/1/20211,6 357,000
427,000 Avis Budget Car Rental LLC / Avis Budget Finance, Inc.
5.500%, 4/1/20231 419,528
40,000 Cooper Tire & Rubber Co.
8.000%, 12/15/20196 44,700
350,000 Gap, Inc.
5.950%, 4/12/20211,6 368,319
40,000 Goodyear Tire & Rubber Co.
8.750%, 8/15/20206 47,700
10

Altrius Enhanced Income Fund SCHEDULE OF INVESTMENTS - Continued As of December 31, 2016
Principal Amount Value __________ ____________
CORPORATE BONDS (Continued) CONSUMER DISCRETIONARY(Continued)
Hertz Corp. $ $ 160,000 5.875%, 10/15/20201,6 156,400
290,000 7.375%, 1/15/20211 290,725
International Game Technology 60,000 7.500%, 6/15/20196 66,000
144,000 5.500%, 6/15/20206 149,040
324,000 J.C. Penney Corp., Inc.
8.125%, 10/1/20196 349,920
350,000 KB Home
8.000%, 3/15/20206 385,000
80,000 MGM Resorts International
6.750%, 10/1/20206 89,000
350,000 Penske Automotive Group, Inc.
5.750%, 10/1/20221,6 360,500
350,000 Rent-A-Center, Inc.
6.625%, 11/15/20201,6 320,250
340,000 RR Donnelley & Sons Co.
7.625%, 6/15/20206 353,600
350,000 Ruby Tuesday, Inc.
7.625%, 5/15/20201,6 332,500
160,000 Scientific Games Corp.
8.125%, 9/15/20181,6 162,000
320,000 Sears Roebuck Acceptance Corp.
6.875%, 10/15/20176 298,400
52,000 ServiceMaster Co. LLC
7.100%, 3/1/20186 54,210
350,000 Sonic Automotive, Inc.
5.000%, 5/15/20231 340,375
215,000 Yum! Brands, Inc.
3.750%, 11/1/20211,6 217,688 ____________ 6,230,673 ____________ CONSUMER STAPLES – 5.4%
280,000 Alliance One International, Inc.
9.875%, 7/15/20211,6 240,100
350,000 Avon Products, Inc.
6.500%, 3/1/20196 362,250
350,000 Central Garden & Pet Co.
6.125%, 11/15/20231,6 369,250
350,000 Cott Beverages, Inc.
5.375%, 7/1/20221 356,125
180,000 New Albertsons, Inc.
7.020%, 7/21/20176 181,611
11

Altrius Enhanced Income Fund SCHEDULE OF INVESTMENTS - Continued As of December 31, 2016
Principal Amount Value __________ ____________
CORPORATE BONDS (Continued) CONSUMER STAPLES(Continued)
$ 212,000 Post Holdings, Inc.
7.375%, 2/15/20221,6 $ 221,010
320,000 Revlon Consumer Products Corp.
5.750%, 2/15/20211,6 321,600
105,000 Vector Group Ltd.
7.750%, 2/15/20211,6 109,462 ____________ 2,161,408 ____________ ENERGY – 11.9%
256,000 Antero Resources Corp.
6.000%, 12/1/20201,6 263,680
280,000 Calumet Specialty Products Partners LP / Calumet Finance Corp.
7.625%, 1/15/20221,6 237,300
280,000 Carrizo Oil & Gas, Inc.
7.500%, 9/15/20201,6 289,800
199,000 CONSOL Energy, Inc.
8.250%, 4/1/20201,6 198,503
287,000 Era Group, Inc.
7.750%, 12/15/20221,6 258,300
350,000 Freeport-McMoran Oil & Gas LLC / FCX Oil & Gas, Inc.
6.125%, 6/15/20191,6 357,875
160,000 Harvest Operations Corp.
6.875%, 10/1/20173,6 160,000
305,000 Laredo Petroleum, Inc.
7.375%, 5/1/20221 316,056
350,000 Martin Midstream Partners LP / Martin Midstream Finance Corp.
7.250%, 2/15/20211,6 345,625
110,000 Noble Energy, Inc.
5.875%, 6/1/20221,6 120,156
280,000 NuStar Logistics LP
6.750%, 2/1/20216 302,400
280,000 Oasis Petroleum, Inc.
7.250%, 2/1/20191,6 280,000
350,000 Petrobras Global Finance B.V.
7.875%, 3/15/20193,6 375,144
350,000 PHI, Inc.
5.250%, 3/15/20191,6 329,000
350,000 SESI LLC
6.375%, 5/1/20191,6 350,000
350,000 Transocean, Inc.
6.500%, 11/15/20203,6 346,500
225,000 Whiting Petroleum Corp.
6.500%, 10/1/20181,6 223,875 ____________ 4,754,214 ____________
12

Altrius Enhanced Income Fund SCHEDULE OF INVESTMENTS - Continued As of December 31, 2016
Principal Amount Value __________ ____________
CORPORATE BONDS (Continued) FINANCIALS – 9.3%
CoreCivic, Inc. $ $ 87,000 4.125%, 4/1/20201 86,783
371,000 5.000%, 10/15/20221 370,072
341,000 Credit Acceptance Corp.
6.125%, 2/15/20211,6 344,410
350,000 Enova International, Inc.
9.750%, 6/1/20211,6 349,125
350,000 First Data Corp.
7.000%, 12/1/20231,2 372,750
350,000 Genworth Holdings, Inc.
7.700%, 6/15/20206 338,520
350,000 GFI Group, Inc.
8.375%, 7/19/20186 376,250
350,000 Icahn Enterprises LP / Icahn Enterprises Finance Corp.
6.000%, 8/1/20201,6 357,438
Nationstar Mortgage LLC / Nationstar Capital Corp. 45,000 6.500%, 8/1/20181,6 45,731
305,000 7.875%, 10/1/20201,6 315,675
280,000 Navient Corp.
8.000%, 3/25/20206 310,632
160,000 Oppenheimer Holdings, Inc.
8.750%, 4/15/20181,6 160,800
304,000 Popular, Inc.
7.000%, 7/1/20191,3 313,500 ____________ 3,741,686 ____________ HEALTH CARE – 2.8%
CHS/Community Health Systems, Inc. 60,000 8.000%, 11/15/20191,6 49,800
220,000 7.125%, 7/15/20201,6 167,266
350,000 IASIS Healthcare LLC / IASIS Capital Corp.
8.375%, 5/15/20191,6 304,500
350,000 Tenet Healthcare Corp.
6.750%, 2/1/20206 336,875
Valeant Pharmaceuticals International 80,000 7.000%, 10/1/20201,6 68,950
250,000 7.000%, 10/1/20201,2 215,469 ____________ 1,142,860 ____________ INDUSTRIALS – 6.4%
350,000 AECOM
5.750%, 10/15/20221,6 369,950
350,000 Bombardier, Inc.
5.750%, 3/15/20223 329,000
13

Altrius Enhanced Income Fund SCHEDULE OF INVESTMENTS - Continued As of December 31, 2016
Principal Amount Value __________ ____________
CORPORATE BONDS (Continued) INDUSTRIALS(Continued)
$ 40,000 Case New Holland Industrial, Inc.
7.875%, 12/1/20176 $ 42,050
280,000 Commercial Vehicle Group, Inc.
7.875%, 4/15/20191,6 279,650
400,000 Herc Rentals, Inc.
7.500%, 6/1/20221,2 421,500
350,000 Navistar International Corp.
8.250%, 11/1/20211,6 353,500
350,000 Titan International, Inc.
6.875%, 10/1/20201,6 342,562
54,000 United Rentals North America, Inc.
7.625%, 4/15/20221,6 56,835
350,000 XPO CNW, Inc.
7.250%, 1/15/20186 359,450 ____________ 2,554,497 ____________ MATERIALS – 10.3%
36,000 AEP Industries, Inc.
8.250%, 4/15/20191,6 36,720
280,000 AK Steel Corp.
7.625%, 5/15/20201,6 285,600
350,000 AngloGold Ashanti Holdings PLC
5.375%, 4/15/20203,6 359,625
248,000 ArcelorMittal
10.850%, 6/1/20193,6 290,160
400,000 Blue Cube Spinco, Inc.
9.750%, 10/15/20231 476,000
350,000 Chemours Co.
6.625%, 5/15/20231 346,500
181,000 Coeur Mining, Inc.
7.875%, 2/1/20211,6 187,788
60,000 Commercial Metals Co.
7.350%, 8/15/20186 63,600
349,000 Hecla Mining Co.
6.875%, 5/1/20211,6 356,852
350,000 Hexion, Inc.
6.625%, 4/15/20201 309,750
350,000 LSB Industries, Inc.
8.500%, 8/1/20191,4 322,000
160,000 SunCoke Energy, Inc.
7.625%, 8/1/20191,6 158,000
350,000 Tronox Finance LLC
6.375%, 8/15/20201,6 327,250
14

Altrius Enhanced Income Fund SCHEDULE OF INVESTMENTS - Continued As of December 31, 2016
Principal Amount Value __________ ____________
CORPORATE BONDS (Continued) MATERIALS(Continued)
$ 350,000 United States Steel Corp.
7.375%, 4/1/20206 $ 375,375
220,000 Vale Overseas Ltd.
5.625%, 9/15/20193,6 232,430 ____________ 4,127,650 ____________ TECHNOLOGY – 4.8%
350,000 BMC Software, Inc.
7.250%, 6/1/20186 351,750
350,000 Infor US, Inc.
6.500%, 5/15/20221,6 364,875
280,000 Micron Technology, Inc.
5.875%, 2/15/20221,6 291,900
350,000 Western Digital Corp.
10.500%, 4/1/20241,2 413,875
450,000 Zebra Technologies Corp.
7.250%, 10/15/20221 489,375 ____________ 1,911,775 ____________ UTILITIES – 0.2%
60,000 NRG Energy, Inc.
7.875%, 5/15/20211,6 62,550 ____________ 62,550 ____________
TOTAL CORPORATE BONDS (Cost $29,513,442) 30,106,455 ____________
SHORT-TERM INVESTMENTS – 25.0%
7,035,204 UMB Money Market Fiduciary, 0.01%5 7,035,204
3,000,000 United States Treasury Bill, 0.56%, 9/14/2017 2,985,060 ____________
TOTAL SHORT-TERM INVESTMENTS (Cost $10,023,437) 10,020,264 ____________
TOTAL INVESTMENTS – 100.2% (Cost $39,536,879) 40,126,719
Liabilities in Excess of Other Assets – (0.2)% (114,951) ____________ TOTAL NET ASSETS – 100.0% $ 40,011,768 ________________________
Number
of Contracts __________ SECURITIES SOLD SHORT – (4.3)%
WRITTEN OPTIONS CONTRACTS – (0.7)%
PUT OPTIONS – (0.7)%
Allergan PLC (16) Exercise Price: $180.00, Expiration Date: January 6, 2017 (80)
15

Altrius Enhanced Income Fund SCHEDULE OF INVESTMENTS - Continued As of December 31, 2016
Number
of Contracts Value __________ ____________ SECURITIES SOLD SHORT (Continued) WRITTEN OPTIONS CONTRACTS (Continued) PUT OPTIONS(Continued) Gilead Sciences, Inc. (53) Exercise Price: $72.00, Expiration Date: January 13, 2017 $ (9,037)
Icahn Enterprises LP (72) Exercise Price: $55.00, Expiration Date: February 17, 2017 (7,560)
iShares 20+ Year Treasury Bond ETF (48) Exercise Price: $125.00, Expiration Date: February 17, 2017* (31,920)
(85) Exercise Price: $126.00, Expiration Date: February 17, 2017* (63,962)
(39) Exercise Price: $127.00, Expiration Date: February 17, 2017* (32,760)
(38) Exercise Price: $128.00, Expiration Date: February 17, 2017* (35,435)
(48) Exercise Price: $125.00, Expiration Date: March 17, 2017* (35,040)
(46) Exercise Price: $126.00, Expiration Date: March 17, 2017* (37,375)
Teva Pharmaceutical Industries Ltd. (110) Exercise Price: $35.00, Expiration Date: January 6, 2017 (1,485)
The Mosaic Company (144) Exercise Price: $27.50, Expiration Date: January 20, 2017 (5,040)
The Procter & Gamble Company (45) Exercise Price: $83.00, Expiration Date: January 6, 2017 (945)
Twitter, Inc. (228) Exercise Price: $17.00, Expiration Date: January 13, 2017 (22,116)
Whole Foods Market, Inc. (132) Exercise Price: $29.50, Expiration Date: January 13, 2017 (2,442)
Wynn Resorts Ltd. (49) Exercise Price: $80.00, Expiration Date: January 20, 2017 (4,287) ____________
TOTAL PUT OPTIONS (Proceeds $321,687) (289,484) ____________
TOTAL WRITTEN OPTIONS CONTRACTS (Proceeds $321,687) $ (289,484) ________________________
Principal Amount __________
U.S. GOVERNMENT – (3.6)% UNITED STATES TREASURY BOND – (3.6)%
$ (1,500,000) United States Treasury Bond
2.875%, 11/15/2046 (1,448,204) ____________
TOTAL UNITED STATES TREASURY BOND (Proceeds $1,467,275) (1,448,204) ____________
TOTAL U.S. GOVERNMENT (Proceeds $1,467,275) (1,448,204) ____________
TOTAL SECURITIES SOLD SHORT (Proceeds $1,788,962) $ (1,737,688) ________________________
16

Altrius Enhanced Income Fund SCHEDULE OF INVESTMENTS - Continued As of December 31, 2016
LP – Limited Partnership PLC – Public Limited Company * Non-income producing security. 1 Callable. 2 Security exempt from registration under Rule 144A of the Securities Act of 1933. These securities are restricted and may be resold in transactions exempt from registration normally to qualified institutional buyers. The total value of these securities is $1,791,094. 3 Foreign security denominated in U.S. Dollars. 4 Variable, floating, or step rate security. 5 The rate is the annualized seven-day yield at period end. 6 Security segregated as collateral for open written options contracts and securities sold short.
See accompanying Notes to Financial Statements.
17

Altrius Enhanced Income Fund SUMMARY OF INVESTMENTS As of December 31, 2016
Security Type/Industry Percent of Total
Net Assets Corporate Bonds
Consumer Discretionary 15.6% Energy 11.9% Materials 10.3% Financials 9.3% Communications 8.5% Industrials 6.4% Consumer Staples 5.4% Technology 4.8% Health Care 2.8% Utilities 0.2% __________
Total Corporate Bonds 75.2% Short-Term Investments 25.0% __________Total Investments 100.2% Liabilities in Excess of Other Assets (0.2)% __________Total Net Assets 100.0% ____________________ See accompanying Notes to Financial Statements.
18

MarketGrader 100 Enhanced Index Fund SCHEDULE OF INVESTMENTS As of December 31, 2016
Number of Shares Value __________ ____________
COMMON STOCKS – 99.4%
COMMUNICATIONS – 5.7%
533 Alphabet, Inc. - Class A* $ 422,376
3,459 Facebook, Inc. - Class A* 397,958
82,278 MeetMe, Inc.* 405,630
299 Priceline Group, Inc.* 438,352
14,702 Sinclair Broadcast Group, Inc. - Class A 490,312
4,454 Walt Disney Co. 464,196 ____________ 2,618,824 ____________ CONSUMER DISCRETIONARY – 27.7%
6,394 Alaska Air Group, Inc. 567,340
3,230 Allegiant Travel Co. 537,472
22,801 American Eagle Outfitters, Inc. 345,891
12,080 AMN Healthcare Services, Inc.* 464,476
12,778 Cooper Tire & Rubber Co. 496,425
8,268 Copart, Inc.* 458,130
4,340 Drew Industries, Inc. 467,635
22,988 Fox Factory Holding Corp.* 637,917
23,829 Gentex Corp. 469,193
10,103 Grand Canyon Education, Inc.* 590,520
9,514 Hawaiian Holdings, Inc.* 542,298
12,470 Herman Miller, Inc. 426,474
11,351 Hibbett Sports, Inc.* 423,392
3,169 Home Depot, Inc. 424,900
26,319 JetBlue Airways Corp.* 590,072
12,556 LGI Homes, Inc.* 360,734
5,548 Lowe's Cos., Inc. 394,574
2,043 Mohawk Industries, Inc.* 407,946
20,197 Nautilus, Inc.* 373,645
7,318 NIKE, Inc. - Class B 371,974
14,778 Nutrisystem, Inc. 512,058
4,624 Polaris Industries, Inc. 380,971
3,518 Stanley Black & Decker, Inc. 403,480
5,436 Tempur Sealy International, Inc.* 371,170
5,448 Thor Industries, Inc. 545,072
5,440 TJX Cos., Inc. 408,707
31,611 TRI Pointe Group, Inc.* 362,894
1,579 Ulta Salon Cosmetics & Fragrance, Inc.* 402,550 ____________ 12,737,910 ____________ CONSUMER STAPLES – 3.6%
8,907 B&G Foods, Inc. 390,127
9,883 Cal-Maine Foods, Inc. 436,581
9,274 Five Below, Inc.* 370,589
19

MarketGrader 100 Enhanced Index Fund SCHEDULE OF INVESTMENTS - Continued As of December 31, 2016
Number of Shares Value __________ ____________
COMMON STOCKS (Continued) CONSUMER STAPLES(Continued) 13,258 Kroger Co. $ 457,534 ____________ 1,654,831 ____________ ENERGY – 1.9%
5,481 EQT Midstream Partners LP 420,283
10,427 Valero Energy Partners LP 461,603 ____________ 881,886 ____________ FINANCIALS – 16.4%
6,549 American Express Co. 485,150
11,274 Bank of the Ozarks, Inc. 592,900
6,304 CBOE Holdings, Inc. 465,803
2,203 Credit Acceptance Corp.* 479,174
13,343 Federated Investors, Inc. - Class B 377,340
17,198 Hanmi Financial Corp. 600,210
33,647 Heritage Insurance Holdings, Inc. 527,248
19,764 Home BancShares, Inc. 548,846
7,658 Intercontinental Exchange, Inc. 432,064
4,179 LendingTree, Inc.* 423,542
16,112 Marcus & Millichap, Inc.* 430,513
4,495 Mastercard, Inc. 464,109
16,778 ServisFirst Bancshares, Inc. 628,168
19,192 Universal Insurance Holdings, Inc. 545,053
16,335 Walker & Dunlop, Inc.* 509,652 ____________ 7,509,772 ____________ HEALTH CARE – 17.2%
6,429 AbbVie, Inc. 402,584
14,675 Akorn, Inc.* 320,355
4,551 Align Technology, Inc.* 437,488
2,477 Amgen, Inc. 362,162
8,650 Anika Therapeutics, Inc.* 423,504
1,367 Biogen, Inc.* 387,654
9,683 Cambrex Corp.* 522,398
3,840 Celgene Corp.* 444,480
9,476 Five Prime Therapeutics, Inc.* 474,842
5,314 Gilead Sciences, Inc. 380,536
26,896 Insys Therapeutics, Inc.* 247,443
7,403 Masimo Corp.* 498,962
2,212 McKesson Corp. 310,675
13,344 Natural Health Trends Corp. 331,599
42,599 SciClone Pharmaceuticals, Inc.* 460,069
3,401 United Therapeutics Corp.* 487,806
3,025 UnitedHealth Group, Inc. 484,121
6,470 USANA Health Sciences, Inc.* 395,964
20

MarketGrader 100 Enhanced Index Fund SCHEDULE OF INVESTMENTS - Continued As of December 31, 2016
Number of Shares Value __________ ____________
COMMON STOCKS (Continued) HEALTH CARE(Continued) 19,898 Xencor, Inc.* $ 523,715 ____________ 7,896,357 ____________ INDUSTRIALS – 12.5%
15,593 AAON, Inc. 515,348
9,074 Argan, Inc. 640,171
13,268 Douglas Dynamics, Inc. 446,468
4,881 Dycom Industries, Inc.* 391,895
12,789 Greenbrier Cos., Inc. 531,383
9,509 Hexcel Corp. 489,143
4,264 Pool Corp. 444,906
14,918 Smith & Wesson Holding Corp.* 314,471
9,463 Spirit AeroSystems Holdings, Inc. - Class A 552,166
28,644 Supreme Industries, Inc. - Class A 449,711
3,878 United Parcel Service, Inc. - Class B 444,574
31,863 Wabash National Corp.* 504,073 ____________ 5,724,309 ____________ MATERIALS – 4.2%
9,900 Berry Plastics Group, Inc.* 482,427
8,037 Dow Chemical Co. 459,877
6,666 Patrick Industries, Inc.* 508,616
7,145 Trex Co., Inc.* 460,138 ____________ 1,911,058 ____________ TECHNOLOGY – 10.2%
3,924 Apple, Inc. 454,478
14,779 Applied Materials, Inc. 476,918
5,431 Arista Networks, Inc.* 525,558
2,460 FactSet Research Systems, Inc. 402,038
3,380 Fair Isaac Corp. 402,964
21,259 Integrated Device Technology, Inc.* 500,862
6,061 KLA-Tencor Corp. 476,879
23,661 MaxLinear, Inc. - Class A* 515,810
19,095 NIC, Inc. 456,370
8,516 Ubiquiti Networks, Inc.* 492,225 ____________ 4,704,102 ____________
TOTAL COMMON STOCKS (Cost $42,023,592) 45,639,049 ____________
21

MarketGrader 100 Enhanced Index Fund SCHEDULE OF INVESTMENTS - Continued As of December 31, 2016
Principal Amount Value __________ ____________
SHORT-TERM INVESTMENTS – 1.5%
$ 674,628 UMB Money Market Fiduciary, 0.01%1 $ 674,628 ____________
TOTAL SHORT-TERM INVESTMENTS (Cost $674,628) 674,628 ____________
TOTAL INVESTMENTS – 100.9% (Cost $42,698,220) 46,313,677
Liabilities in Excess of Other Assets – (0.9)% (435,688) ____________ TOTAL NET ASSETS – 100.0% $ 45,877,989 ________________________ LP – Limited Partnership * Non-income producing security. 1 The rate is the annualized seven-day yield at period end. See accompanying Notes to Financial Statements.
22

MarketGrader 100 Enhanced Index Fund SUMMARY OF INVESTMENTS As of December 31, 2016
Security Type/Industry Percent of Total
Net Assets Common Stocks
Consumer Discretionary 27.7% Health Care 17.2% Financials 16.4% Industrials 12.5% Technology 10.2% Communications 5.7% Materials 4.2% Consumer Staples 3.6% Energy 1.9% __________
Total Common Stocks 99.4% Short-Term Investments 1.5% __________Total Investments 100.9% Liabilities in Excess of Other Assets (0.9)% __________Total Net Assets 100.0% ____________________ See accompanying Notes to Financial Statements.
23

See accompanying Notes to Financial Statements.
STATEMENTS OF ASSETS AND LIABILITIESAs of December 31, 2016
Assets:Investments, at cost $ 62,485,837 $ 39,536,879 $ 42,698,220 Purchased options contracts, at cost 306,112 - - Investments, at value $ 62,485,059 $ 40,126,719 $ 46,313,677 Purchased options contracts, at value 155,250 - - Cash segregated at Broker 1,522,729 1,562,387 - Receivables: Investment securities sold 15,215 - - Fund shares sold 10,260 121,071 127,520 Dividends and interest 13 487,030 28,445 Due from Advisor - - - Prepaid expenses 10,858 33,545 21,809 Total assets 64,199,384 42,330,752 46,491,451
Liabilities:Securities sold short, proceeds $ - $ 1,467,275 $ - Written options contracts, proceeds 119,505 321,687 - Securities sold short, at value $ - $ 1,448,204 $ - Written options contracts, at value 98,750 289,484 - Unrealized depreciation on futures contracts 1,329 - - Cash due to Broker - - 3,678 Payables: Investment securities purchased 52,143 488,450 461,858 Fund shares redeemed 91,627 10,404 57,130 Advisory fees 49,559 18,604 18,340 Shareholder servicing fees (Note 7) 165 2,926 3,246 Fund administration fees 16,474 3,803 5,114 Auditing fees 14,993 14,999 14,999 Fund accounting fees 14,013 12,826 9,106 Transfer agent fees and expenses 10,781 5,721 5,850 Custody fees 5,592 5,300 21,224 Chief Compliance Officer fees 1,310 4,787 1,523 Trustees' fees and expenses - 1,106 1,756 Interest on securities sold short - 5,599 - Offering costs - 68 - Accrued other expenses 28,127 6,703 9,638 Total liabilities 384,863 2,318,984 613,462
Net Assets $ 63,814,521 $ 40,011,768 $ 45,877,989
Components of Net Assets:Paid-in capital (par value of $0.01 per share with an unlimited number of shares authorized) $ 140,670,134 $ 39,486,920 $ 43,800,242 Accumulated net realized loss on investments,
securities sold short, futures contracts, purchased options purchased options contracts and written options contracts (76,723,399) (116,267) (1,537,710)
Net unrealized appreciation (depreciation) on:Investments (778) 589,840 3,615,457 Securities sold short - 19,072 -Purchased options contracts (150,862) - - Futures contracts (1,329) - - Written options contracts 20,755 32,203 -
Net Assets $ 63,814,521 $ 40,011,768 $ 45,877,989
Shares of beneficial interest issued and outstanding 8,139,657 3,776,173 4,158,421 Net asset value per share $ 7.84 $ 10.60 $ 11.03
Enhanced Index Fund
Class I Shares:
Kaizen HedgedPremium Spreads Fund
Altrius Enhanced Income Fund
MarketGrader 100
24

See accompanying Notes to Financial Statements.
STATEMENTS OF OPERATIONSFor the Year Ended December 31, 2016
Kaizen Hedged Altrius Enhanced MarketGrader 100Premium Spreads Fund Income Fund Enhanced Index Fund
Investment Income:Dividends -$ -$ 309,001$ Interest 327,520 928,375 62
Total investment income 327,520 928,375 309,063
Expenses:Advisory fees 1,222,385 183,102 271,183 Fund administration fees 117,366 48,601 44,997 Registration fees 113,837 25,181 39,541 Fund accounting fees 60,172 82,806 52,377 Transfer agent fees and expenses 59,119 26,120 28,286 Legal fees 36,452 17,045 20,206 Shareholder reporting fees 30,360 6,916 7,359 Offering costs 24,567 26,882 24,780 Miscellaneous 14,710 7,634 8,047 Custody fees 14,682 15,908 92,073 Auditing fees 14,649 14,999 14,999 Chief Compliance Officer fees 7,287 26,735 6,812 Trustees' fees and expenses 6,830 7,282 7,182 Insurance fees 3,984 2,279 2,279 Interest on securities sold short - 4,884 - Interest expense 2,922 1,521 2,010 Shareholder servicing fees (Note 7) 151 16,502 23,978
Total expenses 1,729,473 514,397 646,109 Advisory fees waived (102,973) (183,102) (271,183) Other expenses absorbed - (75,634) (3,119)
Net expenses 1,626,500 255,661 371,807 Net investment income (loss) (1,298,980) 672,714 (62,744)
Realized and Unrealized Gain (Loss) on Investments, Securities Sold Short, Purchased Options Contracts, Written Options Contracts and Futures Contracts:
Net realized gain (loss) on:Investments (10,413) 109,797 1,065,536 Securities sold short (26,080) - - Purchased options contracts (67,445,549) - - Written options contracts 70,941,080 (25,921) - Futures contracts (1,910,101) - (1,562,317)
Net realized gain (loss) 1,548,937 83,876 (496,781) Net change in unrealized appreciation/depreciation on:
Investments (778) 589,840 3,615,457 Securities sold short - 19,072 -Purchased options contracts (38,598) - - Futures contracts (1,329) - - Written options contracts 38,018 32,203 -
(2,687) 641,115 3,615,457 Net realized and unrealized gain on investments, securities sold short,
purchased options contracts, written options contracts and futures contracts 1,546,250 724,991 3,118,676
Net Increase in Net Assets from Operations 247,270$ 1,397,705$ 3,055,932$
Net change in unrealized appreciation/depreciation
25

See accompanying Notes to Financial Statements.
Kaizen Hedged Premium Spreads FundSTATEMENTS OF CHANGES IN NET ASSETS
Increase (Decrease) in Net Assets from:Operations: Net investment loss $ (1,298,980) $ (1,480,961) Net realized gain (loss) on investments, securities sold short, futures contracts, purchased options contracts and written options contracts 1,548,937 (78,272,336) Net change in unrealized appreciation/depreciation on investments, futures contracts, purchased options contracts and written options contracts (2,687) (129,527) Net increase (decrease) in net assets resulting from operations 247,270 (79,882,824) Capital Transactions: Net proceeds from shares sold: Class I 15,221,209 342,164,920 Cost of shares redeemed: Class I1 (115,815,041) (98,121,013) Net increase (decrease) in net assets from capital transactions (100,593,832) 244,043,907 Total increase (decrease) in net assets (100,346,562) 164,161,083 Net Assets: Beginning of period 164,161,083 - End of period $ 63,814,521 $ 164,161,083 Capital Share Transactions: Shares sold: Class I 2,035,501 34,806,594 Shares redeemed: Class I (15,518,185) (13,184,253) Net increase (decrease) from capital share transactions (13,482,684) 21,622,341
*Commencement of operations.1 Net of redemption fee proceeds of $8,748 and $59,754, respectively.
For the Period
December 31, 2015
For the
December 31, 2016Year Ended through
August 3, 2015*
26

See accompanying Notes to Financial Statements.
Altrius Enhanced Income FundSTATEMENTS OF CHANGES IN NET ASSETS
For the For the Year Ended Period Ended
December 31, 2016 December 31, 2015*Increase (Decrease) in Net Assets From:Operations: Net investment income 672,714$ -$ Net realized gain on investments and written options contracts 83,876 - Net change in unrealized appreciation/depreciation on investments, securities sold short and written options contracts 641,115 - Net increase in net assets resulting from operations 1,397,705 - Distributions to Shareholders: From net investment income: Class I (685,318) - From net realized gain: Class I (198,438) - Total distributions to shareholders (883,756) - Capital Transactions: Net proceeds from shares sold: Class I 43,116,862 1,000 Reinvestment of distributions: Class I 883,756 - Cost of shares redeemed: Class I1 (4,503,799) - Net increase in net assets from capital transactions 39,496,819 1,000
Total increase in net assets 40,010,768 1,000 Net Assets: Beginning of period 1,000 - End of period 40,011,768$ 1,000$ Capital Share Transactions: Shares sold: Class I 4,128,761 100 Shares reinvested: Class I 83,722 - Shares redeemed: Class I (436,410) - Net increase in capital share transactions 3,776,073 100
*Commencement of operations.1Net of redemption fee proceeds of $26,440 and $0, respectively.
27

See accompanying Notes to Financial Statements.
MarketGrader 100 Enhanced Index FundSTATEMENTS OF CHANGES IN NET ASSETS
For the For the Year Ended Period Ended
December 31, 2016 December 31, 2015*Increase (Decrease) in Net Assets From:Operations: Net investment loss (62,744)$ -$ Net realized loss on investments and futures contracts (496,781) - Net change in unrealized appreciation/depreciation on investments 3,615,457 - Net increase in net assets resulting from operations 3,055,932 - Distributions to Shareholders: From net capital gain: Class I (991,237) - Total distributions to shareholders (991,237) - Capital Transactions: Net proceeds from shares sold: Class I 48,861,752 1,000 Reinvestment of distributions: Class I 991,237 - Cost of shares redeemed: Class I1 (6,040,695) - Net increase in net assets from capital transactions 43,812,294 1,000
Total increase in net assets 45,876,989 1,000 Net Assets: Beginning of period 1,000 - End of period 45,877,989$ 1,000$ Capital Share Transactions: Shares sold: Class I 4,632,209 100 Shares reinvested: Class I 89,462 - Shares redeemed: Class I (563,350) - Net increase in capital share transactions 4,158,321 100
*Commencement of operations.1Net of redemption fee proceeds of $11,626 and $0, respectively.
28

Kaizen Hedged Premium Spreads FundFINANCIAL HIGHLIGHTSClass I
Per share operating performance.For a capital share outstanding throughout each period.
For the PeriodFor the August 3, 2015*
Year Ended throughDecember 31, 2016 December 31, 2015
Net asset value, beginning of period 7.59$ 10.00$ Income from Investment Operations:
Net investment loss1 (0.10) (0.06) Net realized and unrealized gain (loss) 0.35 (2.35) Total from investment operations 0.25 (2.41)
Redemption fee proceeds1 - 2 - 2
Net asset value, end of period 7.84$ 7.59$
Total return3 3.16% (24)% 4
Ratios and Supplemental Data:Net assets, end of period (in thousands) 63,815$ 164,161$
Ratio of expenses to average net assets (including interest expense):Before fees waived and expenses absorbed 1.72% 6 1.85% 5
After fees waived and expenses absorbed 1.62% 6 1.85% 5
Ratio of net investment loss to average net assets (including interest expense):Before fees waived and expenses absorbed (1.40)% (1.76)% 5
After fees waived and expenses absorbed (1.30)% (1.76)% 5
Portfolio turnover rate -% -% 4
* Commencement of operations.1 Based on average shares outstanding during the period.2 Amount represents less than $0.01 per share.3
4 Not annualized.5 Annualized.6
Total returns would have been lower had expenses not been waived or absorbed by the Advisor. Returns shown do not reflect thededuction of taxes that a shareholder would pay on Fund distributions or the redemption of Fund shares.
If interest on securities sold short had been excluded, the expense ratios would have remained unchanged for the year endedDecember 31, 2016 and for the period ended December 31, 2015.
See accompanying Notes to Financial Statements.
29

Altrius Enhanced Income FundFINANCIAL HIGHLIGHTS Class I
Per share operating performance.For a capital share outstanding throughout the period.
For theYear Ended
December 31, 2016
Net asset value, beginning of period 10.00$ Income from Investment Operations:
Net investment income1 0.43 Net realized and unrealized gain on investments, securities sold short and written options contracts 0.57 Total from investment operations 1.00
Less Distributions:From net investment income (0.37) From net realized gain (0.05) Total distributions (0.42)
Redemption fee proceeds1 0.02
Net asset value, end of period 10.60$
Total return2 10.37%
Ratios and Supplemental Data:Net assets, end of period (in thousands) 40,012$
Ratio of expenses to average net assets (including interest expense):Before fees waived and expenses absorbed 3.09% 3
After fees waived and expenses absorbed 1.53% 3
Ratio of net investment income to average net assets (including interest expense):Before fees waived and expenses absorbed 2.48%After fees waived and expenses absorbed 4.04%
Portfolio turnover rate 21%
1 Based on average shares outstanding during the period.2
3
Total returns would have been lower had expenses not been waived or absorbed by the Advisor. Returns shown do not reflect thededuction of taxes that a shareholder would pay on Fund distributions or the redemption of Fund shares.If interest on securities sold short had been excluded, the expense ratios would have been lowered by 0.03% for the year endedDecember 31, 2016.
See accompanying Notes to Financial Statements.
30

See accompanying Notes to Financial Statements.
MarketGrader 100 Enhanced Index FundFINANCIAL HIGHLIGHTS Class I
Per share operating performance.For a capital share outstanding throughout the period.
For the Year Ended
December 31, 2016
Net asset value, beginning of period 10.00$ Income from Investment Operations:
Net investment loss1 (0.03) Net realized and unrealized gain on investments 1.30 Total from investment operations 1.27
Less Distributions:From net realized gain (0.25) Total distributions (0.25)
Redemption fee proceeds1 0.01
Net asset value, end of period 11.03$
Total return2 12.74%
Ratios and Supplemental Data:Net assets, end of period (in thousands) 45,878$
Ratio of expenses to average net assets (including interest expense):Before fees waived and expenses absorbed 2.62% 3
After fees waived and expenses absorbed 1.51% 3
Ratio of net investment loss to average net assets (including interest expense):Before fees waived and expenses absorbed (1.37)%After fees waived and expenses absorbed (0.26)%
Portfolio turnover rate 105%
1 Based on average shares outstanding during the period.2
3
Total returns would have been lower had expenses not been waived or absorbed by the Advisor. Returns shown do not reflect thededuction of taxes that a shareholder would pay on Fund distributions or the redemption of Fund shares.If interest on securities sold short had been excluded, the expense ratios would have been lowered by 0.01% for the year endedDecember 31, 2016.
31

Kaizen Funds NOTES TO FINANCIAL STATEMENTS December 31, 2016
Note 1 – Organization Kaizen Hedged Premium Spreads Fund, Altrius Enhanced Income Fund and MarketGrader 100 Enhanced Index Fund (each a “Fund” and collectively the ‘‘Funds’’) are organized as a series of Investment Managers Series Trust II, a Delaware statutory trust (the “Trust”) which is registered as an open-end management investment company under the Investment Company Act of 1940, as amended (the “1940 Act”). The Kaizen Hedged Premium Spreads Fund is a non-diversified fund. The Altrius Enhanced Income Fund and MarketGrader 100 Enhanced Index Fund are diversified funds. The Kaizen Hedged Premium Spreads Fund’s primary investment objective is to seek risk-adjusted returns which are uncorrelated to the broader markets. The Fund currently offers one class of shares, Class I. Class A and Class C Shares are not currently available. The Fund’s Class I shares commenced operations on August 3, 2015. The Altrius Enhanced Income Fund’s primary investment objective is to maximize long-term total return and generate income. The Fund currently offers one class of shares, Class I. Class A and Class C Shares are not currently available. The Fund’s Class I shares commenced investment operations on December 31, 2015. The MarketGrader 100 Enhanced Index Fund’s primary investment objective is to seek investment results that track generally, before fees and expenses, to the performance of the Kaizen MarketGrader 100 Dynamic Risk Overlay Index (the “Underlying Index”). The Fund currently offers one class of shares, Class I. Class A and Class C Shares are not currently available. The Fund’s Class I shares commenced investment operations on December 31, 2015. Each Fund is an investment company and accordingly follows the investment company accounting and reporting guidance of the Financial Accounting Standards Board (FASB) Accounting Standard Codification Topic 946 “Financial Services—Investment Companies.” Note 2 – Accounting Policies The following is a summary of the significant accounting policies consistently followed by the Funds in the preparation of their financial statements. The preparation of financial statements in conformity with accounting principles generally accepted in the United States of America (“GAAP”) requires management to make estimates and assumptions that affect the reported amounts and disclosures in the financial statements. Actual results could differ from these estimates. (a) Valuation of Investments The Funds value equity securities at the last reported sale price on the principal exchange or in the principal over the counter (“OTC”) market in which such securities are traded, as of the close of regular trading on the NYSE on the day the securities are being valued or, if the last-quoted sales price is not readily available, the securities will be valued at the last bid or the mean between the last available bid and ask price. Securities traded on the NASDAQ are valued at the NASDAQ Official Closing Price (“NOCP”). Options are valued at the mean between the last available bid and asked prices used. Debt securities are valued by utilizing a price supplied by independent pricing service providers. The independent pricing service providers may use various valuation methodologies including matrix pricing and other analytical pricing models as well as market transactions and dealer quotations. These models generally consider such factors as yields or prices of bonds of comparable quality, type of issue, coupon, maturity, ratings and general market conditions. If a price is not readily available for a portfolio security, the security will be valued at fair value (the amount which the Funds might reasonably expect to receive for the security upon its current sale) as determined in good faith by the Funds’ advisor, subject to review and approval by the Valuation Committee, pursuant to procedures adopted by the Board of Trustees. The actions of the Valuation Committee are subsequently reviewed by the Board at its next regularly scheduled board meeting. The Valuation
32

Kaizen Funds NOTES TO FINANCIAL STATEMENTS – Continued December 31, 2016
Committee meets as needed. The Valuation Committee is comprised of all the Trustees, but action may be taken by any one of the Trustees. (b) Short Sales Short sales are transactions under which the Fund sells a security it does not own in anticipation of a decline in the value of that security. To complete such a transaction, the Fund must borrow the security to make delivery to the buyer. The Fund then is obligated to replace the security borrowed by purchasing the security at market price at the time of replacement. The price at such time may be more or less than the price at which the security was sold by the Fund. When a security is sold short, a decrease in the value of the security will be recognized as a gain and an increase in the value of the security will be recognized as a loss, which is potentially limitless. Until the security is replaced, the Fund is required to pay the lender amounts equal to dividend or interest that accrues during the period of the loan which is recorded as an expense. To borrow the security, the Fund also may be required to pay a premium or an interest fee, which are recorded as interest expense. Cash or securities are segregated for the broker to meet the necessary margin requirements. The Fund is subject to the risk that it may not always be able to close out a short position at a particular time or at an acceptable price. (c) Options The Funds may write or purchase options contracts primarily to enhance the Funds’ returns or reduce volatility. In addition, the Funds may utilize options in an attempt to generate gains from option premiums or to reduce overall portfolio risk. When a Fund writes or purchases an option, an amount equal to the premium received or paid by a Fund is recorded as a liability or an asset and is subsequently adjusted to the current market value of the option written or purchased. Premiums received or paid from writing or purchasing options which expire unexercised are treated by a Fund on the expiration date as realized gains or losses. The difference between the premium and the amount paid or received on affecting a closing purchase or sale transaction, including brokerage commissions, is also treated as a realized gain or loss. If an option is exercised, the premium paid or received is added to the cost of the purchase or proceeds from the sale in determining whether a Fund has realized a gain or a loss on investment transactions. A Fund, as a writer of an option, may have no control over whether the underlying securities may be sold (call) or purchased (put) and as a result bears the market risk of an unfavorable change in the price of the security underlying the written option. Transactions in option contracts written for the year ended December 31, 2016 in the Kaizen Hedged Premium Spreads Fund were as follows:
Number of Contracts Premium Amount Outstanding at December 31, 2015 10,000 $ 407,737 Options written 573,488 145,833,301 Options terminated in closing purchasing transactions (262,746) (83,016,985) Options expired (318,642) (63,104,548) Options exercised - - Outstanding at December 31, 2016 2,100 $ 119,505
33

Kaizen Funds NOTES TO FINANCIAL STATEMENTS – Continued December 31, 2016
Transactions in option contracts written for the year ended December 31, 2016 in the Altrius Enhanced Income Fund were as follows:
(d) Stock Index Futures The Funds may invest in stock index futures as a substitute for a comparable market position in the underlying securities. A stock index future obligates the seller to deliver (and the purchaser to accept), effectively, an amount of cash equal to a specific dollar amount times the difference between the value of a specific stock index at the close of the last trading day of the contract and the price at which the agreement is made. No physical delivery of the underlying stocks in the index is made. Initial margin deposits required upon entering into futures contracts are satisfied by the segregation of specific securities or cash as collateral for the account of the broker (the Funds’ agent in acquiring the futures position). During the period the futures contracts are open, changes in the value of the contracts are recognized as unrealized gains or losses by “marking to market” on a daily basis to reflect the market value of the contracts at the end of each day’s trading. Variation margin payments are received or made depending upon whether unrealized gains or losses are incurred. When the contracts are closed, the Funds recognize a realized gain or loss equal to the difference between the proceeds from, or cost of, the closing transaction and the Funds’ basis in the contract. Risks of entering into futures contracts include the possibility that a change in the value of the contract may not correlate with the changes in the value of the underlying instruments. The purchase of a futures contract involves the risk that the Funds could lose more than the original margin deposit required to initiate the futures transaction. There is minimal counterparty credit risk involved in entering into futures contracts since they are exchange-traded instruments and the exchange’s clearinghouse, as counterparty to all exchange-traded futures, guarantees the futures against default. (e) Investment Transactions, Investment Income and Expenses Investment transactions are accounted for on the trade date. Realized gains and losses on investments are determined on the identified cost basis. Dividend income is recorded net of applicable withholding taxes on the ex-dividend date and interest income is recorded on an accrual basis. Withholding taxes on foreign dividends, if applicable, are paid (a portion of which may be reclaimable) or provided for in accordance with the applicable country’s tax rules and rates and are disclosed in the Statement of Operations. Withholding tax reclaims are filed in certain countries to recover a portion of the amounts previously withheld. The Funds record a reclaim receivable based on a number of factors, including a jurisdiction’s legal obligation to pay reclaims as well as payment history and market convention. Discounts or premiums on debt securities are accreted or amortized to interest income over the lives of the respective securities using the effective interest method. Expenses incurred by the Trust with respect to more than one Fund are allocated in proportion to the net assets of each Fund except where allocation of direct expenses to each Fund or an alternative allocation method can be more appropriately made. The Kaizen Hedged Premium Spreads Fund incurred offering costs of approximately $41,276, which were amortized over a one-year period from August 3, 2015 (commencement of operations). The Altrius Enhanced Income Fund incurred offering costs of approximately $26,882, which were amortized over a one-year period from December 31, 2015 (commencement of operations).
Number of Contracts Premium Amount Outstanding at December 31, 2015 - $ - Options written 10,774 927,332 Options terminated in closing purchasing transactions (7,884) (537,635) Options expired (1,660) (59,972) Options exercised (77) (8,038) Outstanding at December 31, 2016 1,153 $ 321,687
34

Kaizen Funds NOTES TO FINANCIAL STATEMENTS – Continued December 31, 2016
The MarketGrader 100 Enhanced Index Fund incurred offering costs of approximately $24,780, which were amortized over a one-year period from December 31, 2015 (commencement of operations). (f) Distributions to Shareholders The Funds will make distributions of net investment income, per the table below and capital gains, if any, at least annually. Distributions to shareholders are recorded on the ex-dividend date. The amount and timing of distributions are determined in accordance with federal income tax regulations, which may differ from GAAP.
Distribution Frequency of Net Investment Income
Kaizen Hedged Premium Spreads Fund Annually Altrius Enhanced Income Fund Monthly MarketGrader 100 Enhanced Index Fund Annually
The character of distributions made during the year from net investment income or net realized gains may differ from the characterization for federal income tax purposes due to differences in the recognition of income, expense and gain (loss) items for financial statement and tax purposes. (g) Federal Income Taxes The Funds intend to comply with the requirements of Subchapter M of the Internal Revenue Code applicable to regulated investment companies and to distribute substantially all of its net investment income and any net realized gains to its shareholders. Therefore, no provision is made for federal income or excise taxes. Due to the timing of dividend distributions and the differences in accounting for income and realized gains and losses for financial statement and federal income tax purposes, the fiscal year in which amounts are distributed may differ from the year in which the income and realized gains and losses are recorded by the Funds. Accounting for Uncertainty in Income Taxes (the “Income Tax Statement”) requires an evaluation of tax positions taken (or expected to be taken) in the course of preparing a Fund’s tax returns to determine whether these positions meet a “more-likely-than-not” standard that, based on the technical merits, have a more than fifty percent likelihood of being sustained by a taxing authority upon examination. A tax position that meets the “more-likely-than-not” recognition threshold is measured to determine the amount of benefit to recognize in the financial statements. The Funds recognize interest and penalties, if any, related to unrecognized tax benefits as income tax expense in the Statements of Operations. The Income Tax Statement requires management of the Funds to analyze tax positions taken in the prior three open tax years, if any, and tax positions expected to be taken in the Funds’ current tax year, as defined by the IRS statute of limitations for all major jurisdictions, including federal tax authorities and certain state tax authorities. As of and during the open year ended December 31, 2015 and as of and during the year ended December 31, 2016, the Funds did not have a liability for any unrecognized tax benefits. The Funds have no examination in progress and are not aware of any tax positions for which it is reasonably possible that the total amounts of unrecognized tax benefits will significantly change in the next twelve months. (h) Use of Estimates The presentation of financial statements in conformity with GAAP requires management to make estimates and assumptions that affect the reported amounts of assets and liabilities at the date of the financial statements and the reported amounts of income and expenses during the reporting period. Actual results could differ from those estimates.
35
Kaizen Funds NOTES TO FINANCIAL STATEMENTS – Continued December 31, 2016
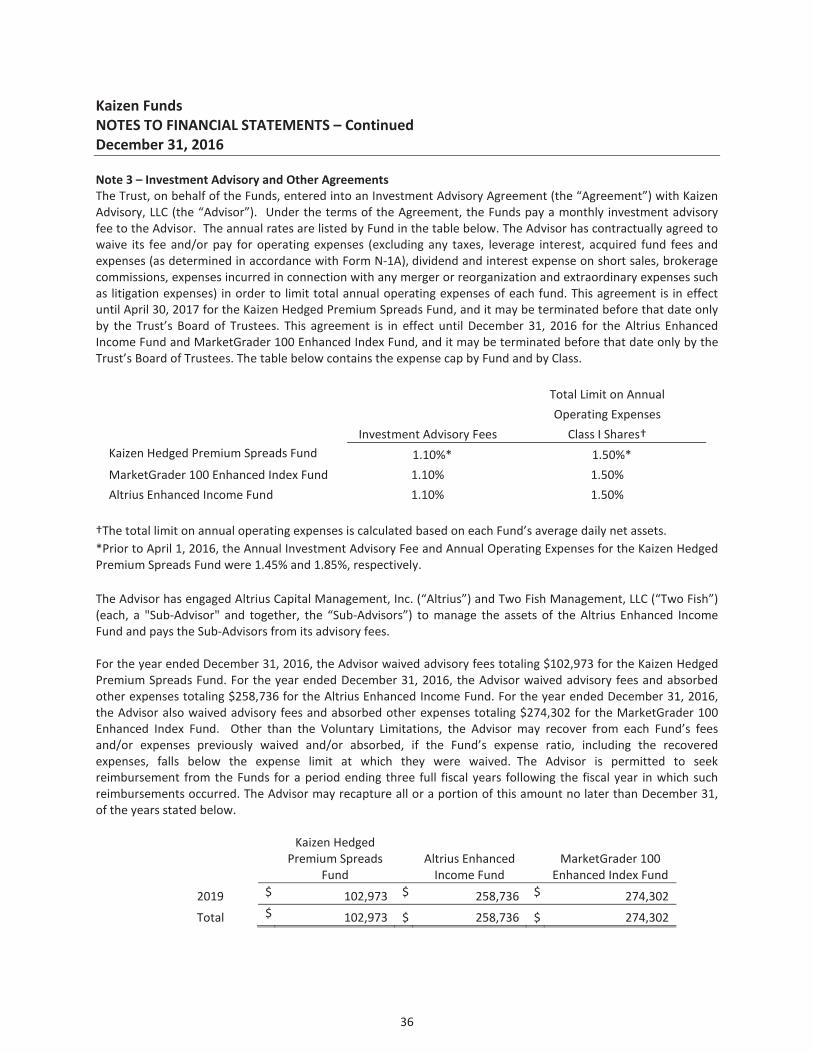
Note 3 – Investment Advisory and Other Agreements The Trust, on behalf of the Funds, entered into an Investment Advisory Agreement (the “Agreement”) with Kaizen Advisory, LLC (the “Advisor”). Under the terms of the Agreement, the Funds pay a monthly investment advisory fee to the Advisor. The annual rates are listed by Fund in the table below. The Advisor has contractually agreed to waive its fee and/or pay for operating expenses (excluding any taxes, leverage interest, acquired fund fees and expenses (as determined in accordance with Form N-1A), dividend and interest expense on short sales, brokerage commissions, expenses incurred in connection with any merger or reorganization and extraordinary expenses such as litigation expenses) in order to limit total annual operating expenses of each fund. This agreement is in effect until April 30, 2017 for the Kaizen Hedged Premium Spreads Fund, and it may be terminated before that date only by the Trust’s Board of Trustees. This agreement is in effect until December 31, 2016 for the Altrius Enhanced Income Fund and MarketGrader 100 Enhanced Index Fund, and it may be terminated before that date only by the Trust’s Board of Trustees. The table below contains the expense cap by Fund and by Class.
Total Limit on Annual Operating Expenses
Investment Advisory Fees Class I Shares† Kaizen Hedged Premium Spreads Fund 1.10%* 1.50%* MarketGrader 100 Enhanced Index Fund 1.10% 1.50% Altrius Enhanced Income Fund 1.10% 1.50%
†The total limit on annual operating expenses is calculated based on each Fund’s average daily net assets. *Prior to April 1, 2016, the Annual Investment Advisory Fee and Annual Operating Expenses for the Kaizen Hedged Premium Spreads Fund were 1.45% and 1.85%, respectively. The Advisor has engaged Altrius Capital Management, Inc. (“Altrius”) and Two Fish Management, LLC (“Two Fish”) (each, a "Sub-Advisor" and together, the “Sub-Advisors”) to manage the assets of the Altrius Enhanced Income Fund and pays the Sub-Advisors from its advisory fees. For the year ended December 31, 2016, the Advisor waived advisory fees totaling $102,973 for the Kaizen Hedged Premium Spreads Fund. For the year ended December 31, 2016, the Advisor waived advisory fees and absorbed other expenses totaling $258,736 for the Altrius Enhanced Income Fund. For the year ended December 31, 2016, the Advisor also waived advisory fees and absorbed other expenses totaling $274,302 for the MarketGrader 100 Enhanced Index Fund. Other than the Voluntary Limitations, the Advisor may recover from each Fund’s fees and/or expenses previously waived and/or absorbed, if the Fund’s expense ratio, including the recovered expenses, falls below the expense limit at which they were waived. The Advisor is permitted to seek reimbursement from the Funds for a period ending three full fiscal years following the fiscal year in which such reimbursements occurred. The Advisor may recapture all or a portion of this amount no later than December 31, of the years stated below.
Kaizen Hedged Premium Spreads
Fund
Altrius Enhanced
Income Fund
MarketGrader 100
Enhanced Index Fund 2019 $ 102,973 $ 258,736 $ 274,302 Total $ 102,973 $ 258,736 $ 274,302
36
Kaizen Funds NOTES TO FINANCIAL STATEMENTS – Continued December 31, 2016
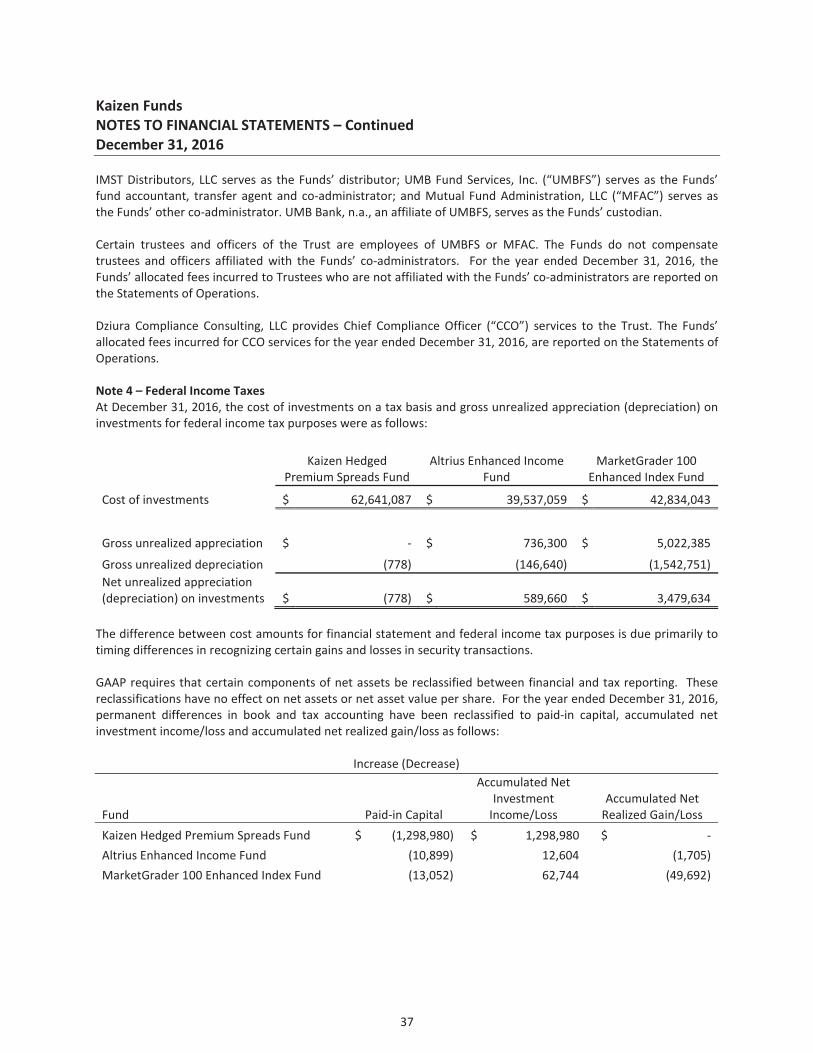
IMST Distributors, LLC serves as the Funds’ distributor; UMB Fund Services, Inc. (“UMBFS”) serves as the Funds’ fund accountant, transfer agent and co-administrator; and Mutual Fund Administration, LLC (“MFAC”) serves as the Funds’ other co-administrator. UMB Bank, n.a., an affiliate of UMBFS, serves as the Funds’ custodian. Certain trustees and officers of the Trust are employees of UMBFS or MFAC. The Funds do not compensate trustees and officers affiliated with the Funds’ co-administrators. For the year ended December 31, 2016, the Funds’ allocated fees incurred to Trustees who are not affiliated with the Funds’ co-administrators are reported on the Statements of Operations. Dziura Compliance Consulting, LLC provides Chief Compliance Officer (“CCO”) services to the Trust. The Funds’ allocated fees incurred for CCO services for the year ended December 31, 2016, are reported on the Statements of Operations. Note 4 – Federal Income Taxes At December 31, 2016, the cost of investments on a tax basis and gross unrealized appreciation (depreciation) on investments for federal income tax purposes were as follows:
Kaizen Hedged Premium Spreads Fund
Altrius Enhanced Income Fund
MarketGrader 100 Enhanced Index Fund
Cost of investments $ 62,641,087 $ 39,537,059 $ 42,834,043
Gross unrealized appreciation $ - $ 736,300 $ 5,022,385 Gross unrealized depreciation (778) (146,640) (1,542,751) Net unrealized appreciation (depreciation) on investments $ (778) $ 589,660 $ 3,479,634
The difference between cost amounts for financial statement and federal income tax purposes is due primarily to timing differences in recognizing certain gains and losses in security transactions. GAAP requires that certain components of net assets be reclassified between financial and tax reporting. These reclassifications have no effect on net assets or net asset value per share. For the year ended December 31, 2016, permanent differences in book and tax accounting have been reclassified to paid-in capital, accumulated net investment income/loss and accumulated net realized gain/loss as follows:
Increase (Decrease)
Fund
Paid-in Capital
Accumulated Net Investment
Income/Loss Accumulated Net
Realized Gain/Loss Kaizen Hedged Premium Spreads Fund $ (1,298,980) $ 1,298,980 $ - Altrius Enhanced Income Fund (10,899) 12,604 (1,705) MarketGrader 100 Enhanced Index Fund (13,052) 62,744 (49,692)
37

Kaizen Funds NOTES TO FINANCIAL STATEMENTS – Continued December 31, 2016
As of December 31, 2016, the components of accumulated earnings (deficit) on a tax basis were as follows:
Kaizen Hedged Premium
Spreads Fund Altrius Enhanced
Income Fund MarketGrader 100
Enhanced Index Fund Undistributed ordinary income $ - $ - $ - Undistributed long-term capital gains - - - Accumulated earnings - - -
Accumulated capital and other losses (75,808,614) (64,812) (1,401,887) Unrealized appreciation on investments (778) 589,660 3,479,634 Unrealized appreciation on open futures and options contracts (1,046,221) - - Total accumulated earnings
(deficit) $ (76,855,613) $ 524,848 $ 2,077,747 The tax character of distributions paid during the fiscal year ended December 31, 2016 was as follows: Kaizen Hedged Premium
Spreads Fund Altrius Enhanced
Income Fund MarketGrader 100
Enhanced Index Fund Distribution paid from: 2016 2015 2016 2015 2016 2015
Ordinary income $ - $ - $ 879,338 $ - $ 991,237 $ - Net long-term capital gains - - 4,418 - - -
Total taxable distributions $ - $ - $ 883,756 $ - $ 991,237 $ - At December 31, 2016, the Funds had accumulated capital loss carryforwards as follows:
Not Subject to Expiration Fund Short-Term Long-Term Total Kaizen Hedged Premium Spreads Fund $ 33,672,301 $ 42,136,313 $ 75,808,614 Altrius Enhanced Income Fund - - - MarketGrader 100 Enhanced Index Fund - - -
38

Kaizen Funds NOTES TO FINANCIAL STATEMENTS – Continued December 31, 2016
Post-October capital losses incurred after October 31 and within the taxable year are deemed to arise on the first business day of the Funds next taxable year. As of December 31, 2016, the following Funds had Post-October capital losses, which are deferred until January 1, 2107 for tax purposes:
Under the Regulated Investment Company Modernization Act of 2010 (the "Act"), the Fund is permitted to carryforward capital losses incurred in taxable years beginning after December 22, 2010, for an unlimited period. However, any losses incurred during those future taxable years will be required to be utilized prior to the losses incurred in pre-enactment taxable years. As a result of this ordering rule, pre-enactment capital loss carryforwards may be more likely to expire unused. Additionally, post-enactment capital losses that are carried forward will retain their character as either short-term or long-term capital losses rather than being considered all short-term as under previous law. Note 5 – Redemption Fee The Funds may impose a redemption fee of 2.00% of the total redemption amount on all shares redeemed within 30 days of purchase. For the year ended December 31, 2016 and the period ended December 31, 2015, the Kaizen Hedged Premium Spreads Fund received $8,748 and $59,754, respectively, in redemption fees. For the year ended December 31, 2016 and the period ended December 31, 2015, the Altrius Enhanced Income Fund received $26,440 and $0, respectively, in redemption fees. For the year ended December 31, 2016 and the period ended December 31, 2015, the MarketGrader 100 Enhanced Index Fund received $11,626 and $0, respectively, in redemption fees. Note 6 – Investment Transactions For the year ended December 31, 2016, purchases and sales of investments, excluding short-term investments, were as follows:
Purchases Sales
Proceeds from Securities Sold
Short Cover Short Securities
Kaizen Hedged Premium Spreads Fund $ - $ - $ - $ - Altrius Enhanced Income Fund 32,232,644 2,842,320 1,467,275 - MarketGrader 100 Enhanced Index Fund 66,592,582 25,634,526 - -
Note 7 – Shareholder Servicing Plan The Trust, on behalf of each Fund, has adopted a Shareholder Servicing Plan to pay a fee at an annual rate of up to 0.15% of the Funds’ average daily net assets of shares serviced by shareholder servicing agents who provide administrative and support services to their customers. For the year ended December 31, 2016, shareholder servicing fees incurred are disclosed on the Statements of Operations.
Post-October Capital Losses Fund Short-Term Long-Term Total Kaizen Hedged Premium Spreads Fund $ - $ - $ - Altrius Enhanced Income Fund 116,087 - 116,087 MarketGrader 100 Enhanced Index Fund 546,921 854,966 1,401,887
39

Kaizen Funds NOTES TO FINANCIAL STATEMENTS – Continued December 31, 2016
Note 8 – Indemnifications In the normal course of business, the Funds enter into contracts that contain a variety of representations which provide general indemnifications. The Funds’ maximum exposure under these arrangements is unknown, as this would involve future claims that may be made against the Funds that have not yet occurred. However, the Funds expect the risk of loss to be remote. Note 9 – Fair Value Measurements and Disclosure Fair Value Measurements and Disclosures defines fair value, establishes a framework for measuring fair value in accordance with GAAP, and expands disclosure about fair value measurements. It also provides guidance on determining when there has been a significant decrease in the volume and level of activity for an asset or a liability, when a transaction is not orderly, and how that information must be incorporated into a fair value measurement. Under Fair Value Measurements and Disclosures, various inputs are used in determining the value of the Funds’ investments. These inputs are summarized into three broad Levels as described below:
Level 1 – Unadjusted quoted prices in active markets for identical assets or liabilities that the Funds have the ability to access. Level 2 – Observable inputs other than quoted prices included in Level 1 that are observable for the asset or liability, either directly or indirectly. These inputs may include quoted prices for the identical instrument on an inactive market, prices for similar instruments, interest rates, prepayment speeds, credit risk, yield curves, default rates and similar data. Level 3 – Unobservable inputs for the asset or liability, to the extent relevant observable inputs are not available, representing the Funds’ own assumptions about the assumptions a market participant would use in valuing the asset or liability, and would be based on the best information available.
The availability of observable inputs can vary from security to security and is affected by a wide variety of factors, including for example, the type of security, whether the security is new and not yet established in the marketplace, the liquidity of markets, and other characteristics particular to the security. To the extent that valuation is based on models or inputs that are less observable or unobservable in the market, the determination of fair value requires more judgment. Accordingly, the degree of judgment exercised in determining fair value is greatest for instruments categorized in Level 3. The inputs to measure fair value may fall into different Levels of the fair value hierarchy. In such cases, for disclosure purposes, the Level in the fair value hierarchy within which the fair value measurement falls in its entirety, is determined based on the lowest Level input that is significant to the fair value measurement in its entirety.
40

Kaizen Funds NOTES TO FINANCIAL STATEMENTS – Continued December 31, 2016
The inputs or methodology used for valuing securities are not an indication of the risk associated with investing in those securities. The following is a summary of the inputs used, as of December 31, 2016, in valuing the Funds’ assets carried at fair value:
Kaizen Hedged Premium Spreads Fund Level 1 Level 2 Level 3** Total Assets Investments Purchased Options Contracts $ 155,250 $ - $ - $ 155,250 Short-Term Investments Money Market 513,207 - - 513,207 U.S. Treasury Bill - 61,971,852 - 61,971,852 Total Assets $ 668,457 $ 61,971,852 $ - $ 62,640,309
Liabilities
Written Options Contracts $ 98,750 $ - $ - $ 98,750 Other Financial Instruments1
Futures Contracts $ (1,329) $ - $ - $ (1,329)
Altrius Enhanced Income Fund Level 1 Level 2 Level 3** Total Assets Investments Corporate Bonds $ - $ 30,106,455 $ - $ 30,106,455 Short-Term Investments Money Market 7,035,204 - - 7,035,204 U.S. Treasury Bill - 2,985,060 - 2,985,060
Total Assets $ 7,035,204 $ 33,091,515 $ - $ 40,126,719
Liabilities Written Options Contracts $ 289,404 $ 80 $ - $ 289,484
MarketGrader 100 Enhanced Index Fund Level 1 Level 2* Level 3** Total Investments
Common Stocks2 $ 45,639,049 $ - $ - $ 45,639,049 Money Market - - - -
Short-Term Investments 674,628 - - 674,628
Total Investments $ 46,313,677 $ - $ - $ 46,313,677 * The Fund did not hold any Level 2 securities at period end.
41

Kaizen Funds NOTES TO FINANCIAL STATEMENTS – Continued December 31, 2016
** The Fund did not hold any Level 3 securities at period end. 1 Other financial instruments are derivative instruments such as futures. Futures contracts are valued at the unrealized appreciation (depreciation) on the instrument. 2 All common stocks held in the Fund are Level 1 securities. For a detailed break-out of common stocks by major industry classification, please refer to the Schedule of Investments. Transfers between Levels 1, 2 or 3 are recognized at the end of the reporting period. There were no transfers between Levels at period end. Note 10 – Derivatives and Hedging Disclosures Derivatives and Hedging requires enhanced disclosures about the Funds’ derivative and hedging activities, including how such activities are accounted for and their effects on the Funds’ financial position, performance and cash flows. The Kaizen Hedged Premium Spreads Fund and Altrius Enhanced Income Fund invested in options contracts during the year ended December 31, 2016. The effects of these derivative instruments on the Funds’ financial position and financial performance as reflected in the Statements of Assets and Liabilities and Statements of Operations are presented in the tables below. The fair values of derivative instruments as of December 31, 2016 by risk category are as follows:
Kaizen Hedged Premium Spreads Fund Asset Derivatives Liability Derivatives
Derivatives not designated as hedging instruments
Statement of Asset and Liabilities
Location Value
Statement of Asset and Liabilities
Location Value
Equity contracts Purchased options contracts, at value $ 155,250
Written options contracts, at value $ 98,750
Equity contracts
Unrealized depreciation on
futures contracts 1,329
Total $ 155,250 $ 100,079
Altrius Enhanced Income Fund Liability Derivatives
Derivatives not designated as hedging instruments
Statement of Asset and Liabilities
Location Value
Equity contracts Written options
contracts, at value $ 289,484
Total $ 289,484
42

Kaizen Funds NOTES TO FINANCIAL STATEMENTS – Continued December 31, 2016
The effects of derivative instruments on the Statements of Operations for the year ended December 31, 2016 are as follows:
Kaizen Hedged Premium Spreads Fund
Change in Unrealized Appreciation/Depreciation on Derivatives Recognized in Income
Derivatives not designated as hedging instruments Futures
Contracts
Purchased Options
Contracts
Written Options
Contracts Total Equity contracts $ (1,329) $ (38,598) $ 38,018 $ (1,909) Total $ (1,329) $ (38,598) $ 38,018 $ (1,909)
Altrius Enhanced Income Fund
Change in Unrealized Appreciation/Depreciation on Derivatives Recognized in Income
Derivatives not designated as hedging instruments Written Options
Contracts Total Equity contracts $ 32,203 $ 32,203 Total $ 32,203 $ 32,203
Kaizen Hedged Premium Spreads Fund Amount of Realized Gain or (Loss) on Derivatives Recognized in Income
Derivatives not designated as hedging instruments Purchased Options Contracts Written Options Contracts Futures Contracts Equity contracts $ (67,445,549) $ 70,941,080 $ (1,910,101) Total $ (67,445,549) $ 70,941,080 $ (1,910,101)
Altrius Enhanced Income Fund Amount of Realized Gain or (Loss) on Derivatives Recognized in Income
Derivatives not designated as hedging instruments Written Options Contracts Equity contracts $ (25,921) Total $ (25,921)
MarketGrader 100 Enhanced Index Fund Amount of Realized Gain or (Loss) on Derivatives Recognized in Income
Derivatives not designated as hedging instruments Futures Contracts Equity contracts $ (1,562,317) Total $ (1,562,317)
43
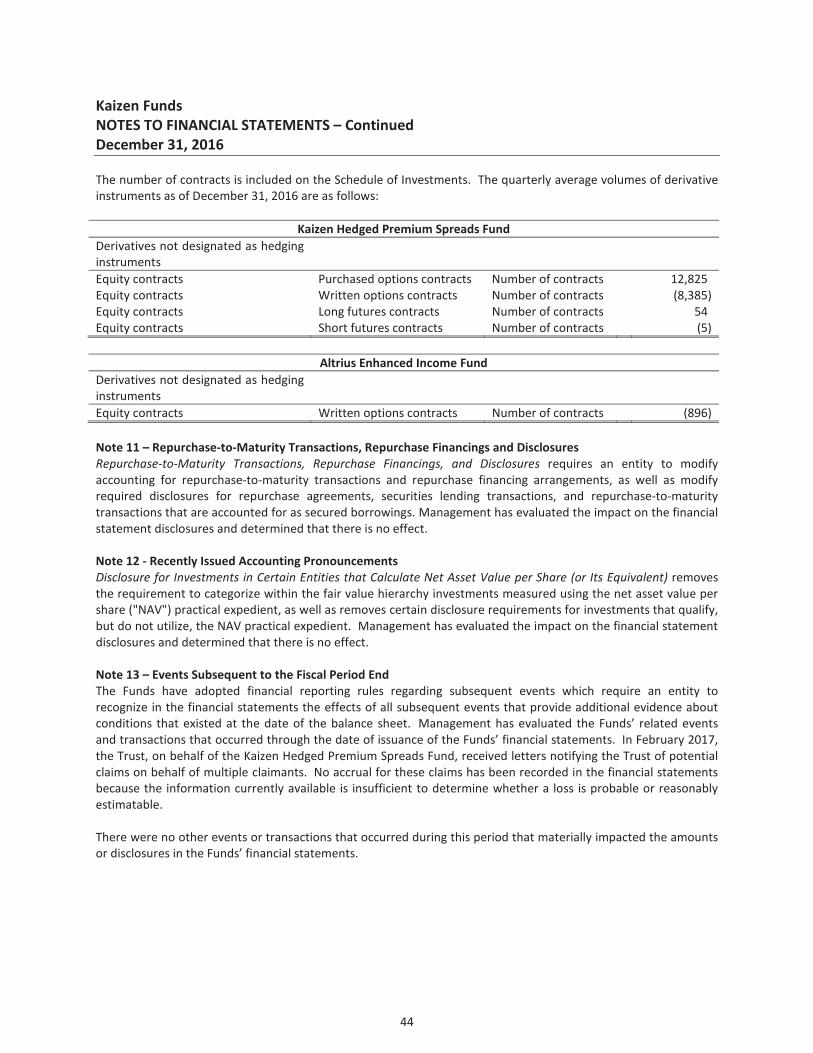
Kaizen Funds NOTES TO FINANCIAL STATEMENTS – Continued December 31, 2016
The number of contracts is included on the Schedule of Investments. The quarterly average volumes of derivative instruments as of December 31, 2016 are as follows:
Kaizen Hedged Premium Spreads Fund Derivatives not designated as hedging instruments
Equity contracts Purchased options contracts Number of contracts 12,825 Equity contracts Written options contracts Number of contracts (8,385) Equity contracts Long futures contracts Number of contracts 54 Equity contracts Short futures contracts Number of contracts (5)
Altrius Enhanced Income Fund Derivatives not designated as hedging instruments
Equity contracts Written options contracts Number of contracts (896) Note 11 – Repurchase-to-Maturity Transactions, Repurchase Financings and Disclosures Repurchase-to-Maturity Transactions, Repurchase Financings, and Disclosures requires an entity to modify accounting for repurchase-to-maturity transactions and repurchase financing arrangements, as well as modify required disclosures for repurchase agreements, securities lending transactions, and repurchase-to-maturity transactions that are accounted for as secured borrowings. Management has evaluated the impact on the financial statement disclosures and determined that there is no effect. Note 12 - Recently Issued Accounting Pronouncements Disclosure for Investments in Certain Entities that Calculate Net Asset Value per Share (or Its Equivalent) removes the requirement to categorize within the fair value hierarchy investments measured using the net asset value per share ("NAV") practical expedient, as well as removes certain disclosure requirements for investments that qualify, but do not utilize, the NAV practical expedient. Management has evaluated the impact on the financial statement disclosures and determined that there is no effect. Note 13 – Events Subsequent to the Fiscal Period End The Funds have adopted financial reporting rules regarding subsequent events which require an entity to recognize in the financial statements the effects of all subsequent events that provide additional evidence about conditions that existed at the date of the balance sheet. Management has evaluated the Funds’ related events and transactions that occurred through the date of issuance of the Funds’ financial statements. In February 2017, the Trust, on behalf of the Kaizen Hedged Premium Spreads Fund, received letters notifying the Trust of potential claims on behalf of multiple claimants. No accrual for these claims has been recorded in the financial statements because the information currently available is insufficient to determine whether a loss is probable or reasonably estimatable. There were no other events or transactions that occurred during this period that materially impacted the amounts or disclosures in the Funds’ financial statements.
44

REPORT OF INDEPENDENT REGISTERED PUBLIC ACCOUNTING FIRM
To the Shareholders of Kaizen Hedged Premium Spreads Fund, Altrius Enhanced Income Fund and MarketGrader 100 Enhanced Index Fund and the Board of Trustees of Investment Managers Series Trust II
We have audited the accompanying statements of assets and liabilities of Kaizen Hedged Premium Spreads Fund, Altrius Enhanced Income Fund and MarketGrader 100 Enhanced Index Fund (the “Funds”), each a series of Investment Managers Series Trust II, including the schedule of investments, as of December 31, 2016, and the related statements of operations for the year then ended, the statements of changes in net assets and the financial highlights for the period indicated thereon. These financial statements and financial highlights are the responsibility of the Fund’s management. Our responsibility is to express an opinion on these financial statements and financial highlights based on our audits.
We conducted our audits in accordance with the standards of the Public Company Accounting Oversight Board (United States). Those standards require that we plan and perform the audit to obtain reasonable assurance about whether the financial statements and financial highlights are free of material misstatement. The Funds are not required to have, nor were we engaged to perform, an audit of theirinternal control over financial reporting. Our audits included consideration of internal control over financial reporting as a basis for designing audit procedures that are appropriate in the circumstances, but not for the purpose of expressing an opinion on the effectiveness of the Funds’ internal control over financial reporting. Accordingly, we express no such opinion. An audit includes examining, on a test basis, evidence supporting the amounts and disclosures in the financial statements. Our procedures included confirmation of securities owned as of December 31, 2016, by correspondence with the custodian and brokers or by other appropriate auditing procedures where replies from brokers were not received. An audit also includes assessing the accounting principles used and significant estimates made by management, as well as evaluating the overall financial statement presentation. We believe that our audits provide a reasonable basis for our opinion.
In our opinion, the financial statements and financial highlights referred to above present fairly, in all material respects, the financial position of Kaizen Hedged Premium Spreads Fund Altrius Enhanced Income Fund and MarketGrader 100 Enhanced Index Fund as of December 31, 2016, and the results of their operations, the changes in their net assets, and their financial highlights for the periods indicated thereon , in conformity with accounting principles generally accepted in the United States of America.
TAIT, WELLER & BAKER LLP
Philadelphia, PennsylvaniaFebruary 28, 2017
45

Kaizen Funds SUPPLEMENTAL INFORMATION (Unaudited)
Long-Term Capital Gain Designation For federal income tax purposes, the Altrius Fund designates long-term capital gain dividends of $4,418, or the amounts determined to be necessary, for the year ended December 31, 2016. Qualified Dividend Income For the year ended December 31, 2016, 27.54% of dividends to be paid from net investment income, including short-term capital gains (if any), for the MarketGrader 100 Fund, is designated as qualified dividend income. Corporate Dividends Received Deduction For the year ended December 31, 2016, 26.93% of dividends to be paid from net investment income, including short-term capital gains (if any), for the MarketGrader 100 Fund, is designated as dividends received deduction available to corporate shareholders. Trustees and Officers Information Additional information about the Trustees is included in the Funds’ Statement of Additional Information which is available, without charge, upon request by calling (844) 524-9366. The Trustees and officers of the Funds and their principal occupations during the past five years are as follows:
Name, Address, Year of Birth and Position(s) held with Trust
Term of Officec and Length of Time Served
Principal Occupation During the Past Five Years and Other Affiliations
Number of Portfolios in
the Fund Complex
Overseen by Trustee
Other Directorships Held by Trustee
During the Past Five Years
“Independent” Trustees: Thomas Knipper, CPA a (Born 1957) Trustee
Since September 2013
Vice President and Chief Compliance Officer, Ameritas Investment Partners, a registered investment advisor (1995 – present).
12 None.
Kathleen K. Shkuda a (born 1951) Trustee
Since September 2013
Zigzag Consulting, a financial services consulting firm (2008-present). Director, Managed Accounts, Merrill Lynch (2007-2008).
12 None.
Larry D. Tashjian a (born 1953) Trustee and Chairman of the Board
Since September 2013
Principal, CAM Capital Advisors (2001-present), a family office.
12 General Finance Corporation.
John P. Zader a (born 1961) Trustee
Since September 2013
Retired (June 2014 - present). CEO, UMB Fund Services, Inc., a mutual fund and hedge fund service provider, and the transfer agent, fund accountant, and co-administrator for the Fund (2006 - June 2014).
12 Investment Managers Series
Trust, a registered investment
company (includes 78 portfolios).
46

Kaizen Funds SUPPLEMENTAL INFORMATION (Unaudited) - Continued
Name, Address, Year of Birth and Position(s) held with Trust
Term of Officec and Length of Time Served
Principal Occupation During the Past Five Years and Other Affiliations
Number of Portfolios in
the Fund Complex
Overseen by Trustee
Other Directorships Held by Trustee
During the Past Five Years
Interested Trustee: Eric M. Banhazl b† (born 1957) Trustee
Since September 2013
Chairman (2016 - present), and President (2006 - 2015), Mutual Fund Administration, LLC, co-administrator for the Fund. Trustee and Vice President, Investment Managers Series Trust II (September 2013 - January 2016).
12 Investment Managers Series
Trust, a registered investment
company (includes 78 portfolios).
Officers of the Trust: Terrance P. Gallagher a (born 1958) President
Since September 2013
Executive Vice President, UMB Fund Services, Inc. (2007 - present). Director of Compliance, Unified Fund Services Inc. (now Huntington Fund Services), a mutual fund service provider (2004 - 2007).
N/A N/A
Rita Dam b (born 1966) Treasurer and Assistant Secretary
Since September 2013
Co-Chief Executive Officer (2016 - present), and Vice President (2006 - 2015), Mutual Fund Administration, LLC.
N/A N/A
Joy Ausili b (born 1966) Vice President and Assistant Secretary
Since September 2013
Co-CEO (2016 – present), and Vice President, Mutual Fund Administration, LLC (2006 – 2015).
N/A N/A
Diane Drake b (born 1967) Secretary
Since January 2016
Senior Counsel, Mutual Fund Administration, LLC (October 2015 - present). Managing Director and Senior Counsel (2010 - 2015), BNY Mellon Investment Servicing (US) Inc.
N/A N/A
Martin Dziurab (born 1959) Chief Compliance Officer
Since September 2013
Principal, Dziura Compliance Consulting, LLC (October 2014 - present). Managing Director, Cipperman Compliance Services (2010 - September 2014). Chief Compliance Officer, Hanlon Investment Management (2009 - Morgan Stanley Investment Management (2000 - 2009).
N/A N/A
a Address for certain Trustees and certain officers: 235 W. Galena Street, Milwaukee, Wisconsin 53212. b Address for Mr. Banhazl, Ms. Ausili, Ms. Dam, and Ms. Drake: 2220 E. Route 66, Suite 226, Glendora, California 91740.
Address for Mr. Dziura: 39 Stafford Square, Boyertown, Pennsylvania 19512. c Trustees and officers serve until their successors have been duly elected. † Mr. Banhazl is an “interested person” of the Trust by virtue of his position with Mutual Fund Administration, LLC.
47

Kaizen Funds EXPENSE EXAMPLES For the Six Months Ended December 31, 2016 (Unaudited)
Expense Examples As a shareholder of the Funds, you incur two types of costs: (1) transaction costs including sales charges (loads) on purchase payments on certain classes, and (2) ongoing costs, including management fees and other Fund expenses. The examples below are intended to help you understand your ongoing costs (in dollars) of investing in the Funds and to compare these costs with the ongoing costs of investing in other mutual funds. These examples are based on an investment of $1,000 invested at the beginning of the period and held for the entire period from July 1, 2016 to December 31, 2016. Actual Expenses The information in the row titled “Actual Performance” of the table below provides actual account values and actual expenses. You may use the information in these columns, together with the amount you invested, to estimate the expenses that you paid over the period. Simply divide your account value by $1,000 (for example, an $8,600 account value divided by $1,000 = 8.6), then multiply the result by the number in the appropriate row under the column titled “Expenses Paid During Period” to estimate the expenses you paid on your account during this period. Hypothetical Example for Comparison Purposes The information in the row titled “Hypothetical (5% annual return before expenses)” of the table below provides hypothetical account values and hypothetical expenses based on the Fund’s actual expense ratios and an assumed rate of return of 5% per year before expenses, which is not the Fund’s actual return. The hypothetical account values and expenses may not be used to estimate the actual ending account balance or expenses you paid for the period. You may use this information to compare the ongoing costs of investing in the Fund and other funds. To do so, compare these 5% hypothetical examples with the 5% hypothetical examples that appear in the shareholder reports of the other funds. Please note that the expenses shown in the table are meant to highlight your ongoing costs only and do not reflect any transaction costs, such as sales charges (load) or contingent deferred sales charges. Therefore, the information in the row titled “Hypothetical (5% annual return before expenses)” is useful in comparing ongoing costs only, and will not help you determine the relative total costs of owning different funds. In addition, if these transactional costs were included, your costs would have been higher.
Kaizen Hedged Premium Spreads Fund Beginning Account Value
Ending Account Value
Expense Paid During Period
7/1/16 12/31/16 7/1/16 – 12/31/16 Class I Actual Performance* $1,000.00 $1,027.50 $7.65 7/1/16 12/31/16 7/1/16 – 12/31/16 Class I Hypothetical (5% annual return before
expenses) $1,000.00 $1,017.60 $7.61 *Expenses are equal to the Fund’s annualized expense ratios of 1.50% for the Class I shares multiplied by the average account values over the period, multiplied by 184/366 (to reflect the six month period) for Class I shares. The expense ratios reflect an expense waiver. Assume all dividends and distributions were reinvested.
48

Kaizen Funds EXPENSE EXAMPLES - Continued For the Six Months Ended December 31, 2016 (Unaudited)
Altrius Enhanced Income Fund Beginning Account Value
Ending Account Value
Expense Paid During Period
7/1/16 12/31/16 7/1/16 – 12/31/16 Class I Actual Performance* $1,000.00 $1,050.20 $7.94
7/1/16 12/31/16 7/1/16 – 12/31/16 Class I Hypothetical (5% annual return before
expenses) $1,000.00 $1,017.39 $7.81
*Expenses are equal to the Fund’s annualized expense ratios of 1.54% for the Class I shares multiplied by the average account values over the period, multiplied by 184/366 (to reflect the six month period) for Class I shares. Theexpense ratios reflect an expense waiver. Assume all dividends and distributions were reinvested.
MarketGrader 100 Enhanced Index Fund Beginning Account Value
Ending Account Value
Expense Paid During Period
7/1/16 12/31/16 7/1/16 – 12/31/16 Class I Actual Performance* $1,000.00 $1,090.30 $7.93
7/1/16 12/31/16 7/1/16 – 12/31/16 Class I Hypothetical (5% annual return before
expenses) $1,000.00 $1,017.55 $7.65
*Expenses are equal to the Fund’s annualized expense ratios of 1.51% for the Class I shares multiplied by the averageaccount values over the period, multiplied by 184/366 (to reflect the six month period) for Class I shares. Theexpense ratios reflect an expense waiver. Assume all dividends and distributions were reinvested.
49

This page is intentionally left blank

This page is intentionally left blank

This page is intentionally left blank

Kaizen Hedged Premium Spreads Fund
Altrius Enhanced Income Fund MarketGrader 100 Enhanced Index Fund
Each a series of Investment Managers Series Trust II
Investment Advisor Kaizen Advisory, LLC
1745 S. Naperville Road, Suite 106 Wheaton, Illinois 60189
Sub-Advisors Altrius Capital Management, Inc.
1323 Commerce Drive New Bern, North Carolina 28562
Two Fish Management, LLC 9333 N Meridian St., Suite 222
Indianapolis, Indiana 46260
Independent Registered Public Accounting Firm Tait, Weller & Baker LLP
1818 Market Street, Suite 2400 Philadelphia, Pennsylvania 19103
Custodian UMB Bank, n.a.
928 Grand Boulevard, 5th Floor Kansas City, Missouri 64106
Fund Co-Administrator Mutual Fund Administration, LLC
2220 E. Route 66, Suite 226 Glendora, California 91740
Fund Co-Administrator, Transfer Agent and Fund Accountant UMB Fund Services, Inc. 235 West Galena Street
Milwaukee, Wisconsin 53212
Distributor IMST Distributors, LLC
Three Canal Plaza, Suite 100 Portland, Maine 04101
www.foreside.com

FUND INFORMATION
TICKER CUSIP Kaizen Hedged Premium Spreads Fund – Class I KZSIX 46141T 836 Altrius Enhanced Income Fund – Class I KEUIX 46141T 737
MarketGrader 100 Enhanced Index Fund – Class I KHMIX 46141T 760 Privacy Principles of the Kaizen Funds for Shareholders The Funds are committed to maintaining the privacy of their shareholders and to safeguarding their non-public personal information. The following information is provided to help you understand what personal information the Funds collect, how we protect that information and why, in certain cases, we may share information with select other parties.
Generally, the Funds do not receive any non-public personal information relating to their shareholders, although certain non-public personal information of their shareholders may become available to the Funds. The Funds do not disclose any non-public personal information about their shareholders or former shareholders to anyone, except as permitted by law or as is necessary in order to service shareholder accounts (for example, to a transfer agent or third party administrator).
This report is sent to shareholders of the Kaizen Funds for their information. It is not a Prospectus, circular or representation intended for use in the purchase or sale of shares of the Fund or of any securities mentioned in this report. Proxy Voting Policies and Procedures A description of the Funds’ proxy voting policies and procedures related to portfolio securities is available without charge, upon request, by calling the Funds (toll-free) at (844) 524-9366 or on the U.S. Securities and Exchange Commission’s (“SEC”) website at www.sec.gov. Proxy Voting Record Information regarding how the Funds voted proxies for portfolio securities, if applicable, during the most recent 12-month period ended June 30, is also available, without charge and upon request by calling the Funds (toll-free) at (844) 524-9366 or by accessing the Funds’ Form N-PX on the SEC’s website at www.sec.gov. Form N-Q Disclosure The Funds file their complete schedule of portfolio holdings with the SEC for the first and third quarters of each fiscal year on Form N-Q. The Funds’ Form N-Q is available on the SEC website at www.sec.gov or by calling the Funds (toll-free) at (844) 524-9366. The Funds’ Form N-Q may also be viewed and copied at the SEC’s Public Reference Room in Washington, DC. Information on the operation of the Public Reference Room may be obtained by calling (800) SEC-0330.
Kaizen Funds P.O. Box 2175
Milwaukee, WI 53201 Toll Free: (844) 524-9366