Vanguard Wholesale International Equities Funds (Hedged ...
27
Vanguard Wholesale International Equities Funds (Hedged) and ETFs Interim report for the period ended 31 December 2021 Responsible Entity Vanguard Investments Australia Ltd. ABN 72 072 881 086 AFSL 227263 Level 13 130 Lonsdale Street Melbourne VIC 3000 Australia Telephone: (03) 8888 3888 Facsimile: 1300 765 712 vanguard.com.au
Transcript of Vanguard Wholesale International Equities Funds (Hedged ...

Vanguard Wholesale International Equities Funds (Hedged) and ETFs
Interim report for the period ended 31 December 2021
Responsible Entity
Vanguard Investments Australia Ltd. ABN 72 072 881 086 AFSL 227263
Level 13 130 Lonsdale Street Melbourne VIC 3000 Australia
Telephone: (03) 8888 3888 Facsimile: 1300 765 712
vanguard.com.au
Vanguard Wholesale International Equities Funds (Hedged) and ETFs
Fund ASX ARSN ABN
Vanguard Global Infrastructure Index Fund (Hedged) - 128 385 197 92 392 829 821
Vanguard MSCI Index International Shares (Hedged) ETF VGAD 165 786 989 92 314 430 239
Vanguard International Property Securities Index - 115 001 360 52 511 318 838 Fund (Hedged)
Vanguard International Small Companies Index - 127 015 436 13 064 564 422 Fund (Hedged)
Vanguard Ethically Conscious International Shares VESG 626 133 275 89 276 633 202 Index Fund
Vanguard Global Minimum Volatility Fund VMIN 165 787 708 80 259 391 198
Vanguard International Shares Index Fund (Hedged) - 093 254 909 97 123 270 094
Vanguard International Shares Select Exclusions Index Fund - 613 045 739 45 215 187 041
ContentsAbout Vanguard 1
Directors’ report 2
Auditor’s independence declaration 5
Statements of comprehensive income 6
Balance sheets 8
Statements of changes in equity 9
Statements of cash flows 10
Notes to the financial statements 12
Directors’ declaration 21
Independent auditor’s review report 22

About Vanguard
Vanguard Wholesale International Equities Funds (Hedged) and ETFs 1
Since our establishment in 1975, Vanguard has strived to be the world’s highest-value provider of investment products and services. We have an unwavering focus on our clients with a commitment to champion what’s best for investors by offering outstanding service, while keeping costs low.
Over the years Vanguard has built a reputation as a global leader in client advocacy and earned the trust of millions of investors along the way. Our sole purpose has been to align our interest with those of our investors to ensure they have the best chance for investment success.
With over AUD $11.6 trillion in assets under management globally as of 31 December 2021, including AUD $3 trillion in ETFs, Vanguard is one of the world’s largest global investment management companies.
In Australia, Vanguard has been serving financial advisers, retail clients and institutional investors for 25 years.
Our unique structure — putting investors’ interests firstWhat sets Vanguard apart — and allows Vanguard to put investors first around the world — is the ownership structure of The Vanguard Group, Inc., in the United States.
Rather than being publicly traded or owned by a small group of individuals, the Vanguard Group is owned by Vanguard’s US-domiciled funds and ETFs. Those funds, in turn, are owned by their investors.
This mutual structure aligns our interests with those of our investors and drives the culture, philosophy and policies throughout the Vanguard organisation worldwide. As a result, Australian investors benefit from Vanguard’s stability and experience, low costs and client focus.
Our investment expertiseWhen you invest with Vanguard, you have more than 40 years of investing experience behind you. So no matter which investment products suit your needs, you can feel confident that Vanguard investments are built on a rigorous investment philosophy that stands the test of time.
Low-cost investingWe know we can’t control the markets, but we can control the costs of investing. To that end, providing low-cost investments isn’t a pricing strategy for us. It’s how we do business.
We can keep costs low because of our unique ownership structure in the United States, which allows us to return profits to investors through lower costs.

Directors’ reportThe Responsible Entity of the Vanguard Wholesale International Equities Funds (Hedged) and ETFs (the “Funds”) for the half-year ended 31 December 2021 was Vanguard Investments Australia Ltd (the “Responsible Entity”).
The directors of Vanguard Investments Australia Ltd present their report together with the financial statements for the half-yearended 31 December 2021.
Principal activities
The Funds invest in accordance with the investment policy of the Funds as set out in their respective Product DisclosureStatements (PDSs) and in accordance with the Funds’ Constitution. The Funds (with the exception of Vanguard GlobalMinimum Volatility Fund) seek to track the returns of the Funds’ respective indices, before taking into account fees, expensesand tax. The Vanguard Global Minimum Volatility Fund seeks to provide long-term capital appreciation with volatility lowerthan the FTSE Global All Cap Index (AUD Hedged), before taking into account fees, expenses and tax.
The ETF Class units of the Funds operate as Exchange Traded Funds (ETFs) listed on the Australian Securities Exchange(ASX).
The Funds did not have any employees during the half-year.
There were no significant changes in the nature of the activities of the Funds during the half-year.
Directors
The following persons held office as directors of the Responsible Entity during the half-year and up to the date of this report:
J Platt (Resigned 21 January 2022)
F Kolimago (Resigned 15 October 2021)
C McIsaac (Resigned 21 January 2022)
C Cosby (Resigned 31 December 2021)
D Shrimski
J Bendl (Appointed 21 January 2022)
C Jacques (Appointed 21 January 2022)
K Petersen (Appointed 21 January 2022)
Review and results of operations
The Funds invest in listed equity securities, listed unit trusts, unlisted unit trusts, fixed interest securities, derivatives and cashand cash equivalents. The investment policy of the Funds continues to be in accordance with the provisions of the Funds’Constitution.
On 9 September 2021, the directors resolved to give the option to unitholders to voluntarily either switch or redeem from theVanguard International Shares Index Fund (Hedged) – NZD Class by 15 October 2021. A final payment of $1,107,073 wasmade on 20 October 2021 for unitholders who elected to redeem. As at 31 December 2021, Vanguard International SharesIndex Fund (Hedged) – NZD Class has no unitholders, realised all assets and will be dormant in operation.
Results
The results of the operations of the Funds were as follows:
Vanguard GlobalInfrastructure Index
Fund (Hedged)
Vanguard MSCIIndex International
Shares (Hedged) ETF
Vanguard InternationalProperty Securities
Index Fund (Hedged)
Vanguard InternationalSmall Companies
Index Fund (Hedged)
31 Dec2021
31 Dec2020
31 Dec2021
31 Dec2020
31 Dec2021
31 Dec2020
31 Dec2021
31 Dec2020
Operating profit/(loss) before finance costsattributable to unitholders ($’000) 64,069 31,629 146,289 206,348 192,933 151,471 (100) 14,503
Distributions - Wholesale Class
Distribution paid and payable ($’000) - 35,075 - - - 49,118 - 1,939
Distribution (cents per unit) - 7.2462 - - - 2.6801 - 3.2892
Distributions - ETF Class
Distribution paid and payable ($’000) - - - 50,531 - - - -
Distribution (cents per unit) - - - 305.1337 - - - -
2 Vanguard Interim Report

Directors’ report (continued)
Review and results of operations (continued)
Results (continued)
Vanguard EthicallyConscious International
Shares Index Fund
VanguardGlobal MinimumVolatility Fund
Vanguard InternationalShares Index Fund
(Hedged)
Vanguard InternationalShares Select
Exclusions Index Fund
31 Dec2021
31 Dec2020
31 Dec2021
31 Dec2020
31 Dec2021
31 Dec2020
31 Dec2021
31 Dec2020
Operating profit/(loss) before finance costsattributable to unitholders ($’000) 279,886 166,457 1,059 2,077 636,717 1,008,128 220,245 249,026
Distributions - Wholesale Class
Distribution paid and payable ($’000) - - - 569 - - - -
Distribution (cents per unit) - - - 6.2352 - - - -
Distributions - ETF Class
Distribution paid and payable ($’000) 3,551 1,007 - 625 - - - -
Distribution (cents per unit) 48.3919 34.4765 - 304.2336 - - - -
Distributions - AUD Class
Distribution paid and payable ($’000) - - - - - 458,373 - -
Distribution (cents per unit) - - - - - 7.1778 - -
Distributions - NZD Class
Distribution paid and payable ($’000) - - - - - 1,834 - -
Distribution (cents per unit) - - - - - 21.9526 - -
Distributions - AUD Unhedged Class
Distribution paid and payable ($’000) 9,136 3,091 - - - - 21,222 4,849
Distribution (cents per unit) 1.1901 0.7002 - - - - 4.3168 0.9721
Distributions - AUD Hedged Class
Distribution paid and payable ($’000) - - - - - - - 15,322
Distribution (cents per unit) - - - - - - - 6.9388
Distributions - NZD Hedged Class
Distribution paid and payable ($’000) - 21,774 - - - - - 44,017
Distribution (cents per unit) - 3.8498 - - - - - 6.6385
Significant changes in state of affairs
Frank Kolimago resigned as a Director of Vanguard Investments Australia Ltd on 15 October 2021.
Caroline Cosby resigned as a Director of Vanguard Investments Australia Ltd on 31 December 2021.
Chris Mclsaac resigned as a Director of Vanguard Investments Australia Ltd on 21 January 2022.
Jo Platt resigned as a Director of Vanguard Investments Australia Ltd on 21 January 2022.
John Bendl appointed as a Director of Vanguard Investments Australia Ltd on 21 January 2022.
Curt Jacques appointed as a Director of Vanguard Investments Australia Ltd on 21 January 2022.
Kim Petersen appointed as a Director of Vanguard Investments Australia Ltd on 21 January 2022.
Market disruptions associated with the COVID-19 pandemic have had a global impact, and uncertainty exists as to the long-term implications. Such disruptions can adversely affect assets of the Funds and thus performance of the Funds.
In the opinion of the directors, there were no other significant changes in the state of affairs of the Funds that occurred duringthe half-year.
Matters subsequent to the end of the half-year
Market disruptions associated with current geopolitical events have had a global impact, and uncertainty exists as to theirimplications. Such disruptions can adversely affect assets of the Funds and thus performance of the Funds. Management iscontinuing to monitor this development and evaluate its impact on the Funds.
No other matter or circumstance has arisen since 31 December 2021 that has significantly affected, or may significantly affect:
(i) the operations of the Funds in future financial periods; or
(ii) the results of those operations in future financial periods; or
(iii) the state of affairs of the Funds in future financial periods.
Vanguard Wholesale International Equities Funds (Hedged) and ETFs 3


PricewaterhouseCoopers, ABN 52 780 433 757 2 Riverside Quay, SOUTHBANK VIC 3006, GPO Box 1331, MELBOURNE VIC 3001 T: 61 3 8603 1000, F: 61 3 8603 1999, www.pwc.com.au
Liability limited by a scheme approved under Professional Standards Legislation.
Auditor’s Independence Declaration
Vanguard Global Infrastructure Index Fund (Hedged) Vanguard MSCI Index International Shares (Hedged) ETF* Vanguard International Property Securities Index Fund (Hedged) Vanguard International Small Companies Index Fund (Hedged) Vanguard Ethically Conscious International Shares Index Fund* Vanguard Global Minimum Volatility Fund* Vanguard International Shares Index Fund (Hedged) Vanguard International Shares Select Exclusions Index Fund
referred to collectively as the Vanguard Wholesale International Equities Funds (Hedged) and ETFs.
* denotes listed Funds
As lead auditor for the review of the Vanguard Wholesale International Equities Funds (Hedged) and ETFs for the half-year ended 31 December 2021, I declare that to the best of my knowledge and belief, there have been:
(a) no contraventions of the auditor independence requirements of the Corporations Act 2001 inrelation to the review; and
(b) no contraventions of any applicable code of professional conduct in relation to the review.
Adrian Gut Melbourne Partner PricewaterhouseCoopers
3 March 2022

Statements of comprehensive incomeFor the half-year ended 31 December 2021
Vanguard GlobalInfrastructure Index
Fund (Hedged)
Vanguard MSCIIndex International
Shares (Hedged) ETF
Vanguard InternationalProperty Securities
Index Fund (Hedged)
Vanguard InternationalSmall Companies
Index Fund (Hedged)
31 Dec2021
31 Dec2020
31 Dec2021
31 Dec2020
31 Dec2021
31 Dec2020
31 Dec2021
31 Dec2020
Notes $’000 $’000 $’000 $’000 $’000 $’000 $’000 $’000
Investment income
Distribution income 11,770 7,516 12,959 11,103 53,278 18,039 1,682 1,469
Net gains/(losses) on financial instrumentsat fair value through profit or loss 52,414 24,216 133,314 195,423 139,928 133,712 (1,747) 13,085
Other operating income - - 348 96 - - - -
Total net investment income/(loss) 64,184 31,732 146,621 206,622 193,206 151,751 (65) 14,554
Expenses
Responsible Entity’s fees 108 87 300 223 259 243 17 34
Custody fees 7 14 12 29 7 23 17 16
Transaction costs - - - - - - - -
Withholding tax expense - - - - - - - -
Other operating expenses - 2 20 22 7 14 1 1
Total operating expenses 115 103 332 274 273 280 35 51
Operating profit/(loss) 64,069 31,629 146,289 206,348 192,933 151,471 (100) 14,503
Finance costs attributable to unitholders
Distributions to unitholders 5 - - - - - - - -
(Increase)/decrease in net assetsattributable to unitholders 4 - - - - - - - -
Profit/(loss) for the half-year 64,069 31,629 146,289 206,348 192,933 151,471 (100) 14,503
Other comprehensive income - - - - - - - -
Total comprehensive income for the half-year 64,069 31,629 146,289 206,348 192,933 151,471 (100) 14,503
The above statements of comprehensive income should be read in conjunction with the accompanying notes.
6 Vanguard Interim Report

Statements of comprehensive income (continued)For the half-year ended 31 December 2021
Vanguard EthicallyConscious International
Shares Index Fund
VanguardGlobal MinimumVolatility Fund
Vanguard InternationalShares Index Fund
(Hedged)
Vanguard InternationalShares Select
Exclusions Index Fund
31 Dec2021
31 Dec2020
31 Dec2021
31 Dec2020
31 Dec2021
31 Dec2020
31 Dec2021
31 Dec2020
Notes $’000 $’000 $’000 $’000 $’000 $’000 $’000 $’000
Investment income
Dividend income 18,499 9,146 282 271 - - 15,807 13,907
Distribution income 976 455 10 - 71,685 98,443 705 647
Net gains/(losses) on financial instrumentsat fair value through profit or loss 266,504 159,558 875 1,900 566,415 910,900 208,970 238,479
Other operating income 195 70 8 4 - 5 21 35
Total net investment income/(loss) 286,174 169,229 1,175 2,175 638,100 1,009,348 225,503 253,068
Expenses
Responsible Entity’s fees 3,159 1,405 44 40 1,316 1,066 2,605 2,034
Custody fees 30 72 15 16 26 52 43 95
Transaction costs 309 127 10 7 - - 79 97
Withholding tax expense 2,525 1,146 36 33 - - 2,092 1,770
Other operating expenses 265 22 11 2 41 102 439 46
Total operating expenses 6,288 2,772 116 98 1,383 1,220 5,258 4,042
Operating profit/(loss) 279,886 166,457 1,059 2,077 636,717 1,008,128 220,245 249,026
Finance costs attributable to unitholders
Distributions to unitholders 5 (12,687) (25,872) - (1,194) - (460,207) (21,222) (64,188)
(Increase)/decrease in net assetsattributable to unitholders 4 (267,199) (140,585) (1,059) (883) (636,717) (547,921) (199,023) (184,838)
Profit/(loss) for the half-year - - - - - - - -
Other comprehensive income - - - - - - - -
Total comprehensive income for the half-year - - - - - - - -
The above statements of comprehensive income should be read in conjunction with the accompanying notes.
Vanguard Wholesale International Equities Funds (Hedged) and ETFs 7

Balance sheetsAs at 31 December 2021
Vanguard GlobalInfrastructure Index
Fund (Hedged)
Vanguard MSCIIndex International
Shares (Hedged) ETF
Vanguard InternationalProperty Securities
Index Fund (Hedged)
Vanguard InternationalSmall Companies
Index Fund (Hedged)
31 Dec2021
30 Jun2021
31 Dec2021
30 Jun2021
31 Dec2021
30 Jun2021
31 Dec2021
30 Jun2021
Notes $’000 $’000 $’000 $’000 $’000 $’000 $’000 $’000
Assets
Cash and cash equivalents 1,065 3,560 43,057 28,594 1,477 6,125 2,064 1,831
Margin accounts - 180 5,784 36,395 87 333 577 1,806
Receivables 141 418 12 23,357 271 638 10 37
Accrued income 4,574 7,546 7,191 13,797 35,658 15,057 1,364 2,322
Due from brokers - receivable for securitiessold - 14,671 - 95,045 - 42,969 - 3,664
Financial assets at fair value through profitor loss 742,868 653,647 1,856,704 1,667,970 1,775,611 1,635,575 114,669 74,531
Total assets 748,648 680,022 1,912,748 1,865,158 1,813,104 1,700,697 118,684 84,191
Liabilities
Margin accounts - - 4,862 7,640 - - - 310
Distribution payable 5 - 11,176 - 127,027 - 16,831 - 5,078
Payables 384 149 286 50 180 1,091 37 3
Due to brokers - payables for securitiespurchased 7,110 - 33,000 - 18,161 - 1,994 -
Financial liabilities at fair value throughprofit or loss 1,872 13,703 53,443 74,579 2,278 31,972 3,644 3,512
Total liabilities 9,366 25,028 91,591 209,296 20,619 49,894 5,675 8,903
Net assets attributable to unitholders(equity) 4 739,282 654,994 1,821,157 1,655,862 1,792,485 1,650,803 113,009 75,288
Vanguard EthicallyConscious International
Shares Index Fund
VanguardGlobal MinimumVolatility Fund
Vanguard InternationalShares Index Fund
(Hedged)
Vanguard InternationalShares Select
Exclusions Index Fund
31 Dec2021
30 Jun2021
31 Dec2021
30 Jun2021
31 Dec2021
30 Jun2021
31 Dec2021
30 Jun2021
Notes $’000 $’000 $’000 $’000 $’000 $’000 $’000 $’000
Assets
Cash and cash equivalents 23,577 30,495 808 382 97,286 119,333 17,873 17,253
Margin accounts 24,297 35,634 337 510 22,499 118,714 13,975 35,142
Receivables 5,627 10,762 33 38 1,011 4,620 2,716 2,838
Accrued income 2,303 1,466 38 48 46,344 174,847 1,213 1,348
Due from brokers - receivable for securitiessold - 8 - 948 - 245,978 - 5
Financial assets at fair value through profitor loss 3,410,839 2,270,972 30,881 23,815 8,624,149 6,877,706 2,311,041 2,130,671
Total assets 3,466,643 2,349,337 32,097 25,741 8,791,289 7,541,198 2,346,818 2,187,257
Liabilities
Margin accounts 12,488 12,829 830 - 21,574 25 808 4,315
Distribution payable 5 9,152 14,135 - 945 - 329,967 14,827 55,754
Payables 868 441 16 7 41,120 77,400 552 2,032
Due to brokers - payables for securitiespurchased - 20,003 - - 126,705 - - 2
Financial liabilities at fair value throughprofit or loss 35,706 47,968 79 685 246,045 308,417 38,040 69,448
Total liabilities 58,214 95,376 925 1,637 435,444 715,809 54,227 131,551
Net assets attributable to unitholders(liability) 4 3,408,429 2,253,961 31,172 24,104 8,355,845 6,825,389 2,292,591 2,055,706
The above balance sheets should be read in conjunction with the accompanying notes.
8 Vanguard Interim Report

Statements of changes in equityFor the half-year ended 31 December 2021
Vanguard GlobalInfrastructure Index
Fund (Hedged)
Vanguard MSCIIndex International
Shares (Hedged) ETF
Vanguard InternationalProperty Securities
Index Fund (Hedged)
Vanguard InternationalSmall Companies
Index Fund (Hedged)
31 Dec2021
31 Dec2020
31 Dec2021
31 Dec2020
31 Dec2021
31 Dec2020
31 Dec2021
31 Dec2020
Notes $’000 $’000 $’000 $’000 $’000 $’000 $’000 $’000
Total equity at the beginning of the half-year 654,994 402,484 1,655,862 1,026,643 1,650,803 1,352,967 75,288 56,400
Comprehensive income for the half-year
Profit/(loss) for the half-year 64,069 31,629 146,289 206,348 192,933 151,471 (100) 14,503
Other comprehensive income - - - - - - - -
Total comprehensive income for the half-year 64,069 31,629 146,289 206,348 192,933 151,471 (100) 14,503
Transactions with unitholders
Applications 113,371 148,328 260,694 155,759 164,000 206,806 41,971 5,207
Redemptions (100,215) (43,969) (254,850) (11,632) (224,870) (225,645) (5,029) (7,375)
Units issued upon reinvestment ofdistributions 7,063 28,544 13,162 - 9,619 18,138 879 153
Distributions paid and payable 5 - (35,075) - (50,531) - (49,118) - (1,939)
Total transactions with unitholders 20,219 97,828 19,006 93,596 (51,251) (49,819) 37,821 (3,954)
Total equity at the end of the half-year 739,282 531,941 1,821,157 1,326,587 1,792,485 1,454,619 113,009 66,949
Vanguard EthicallyConscious International
Shares Index Fund
VanguardGlobal MinimumVolatility Fund
Vanguard InternationalShares Index Fund
(Hedged)
Vanguard InternationalShares Select
Exclusions Index Fund
31 Dec2021
31 Dec2020
31 Dec2021
31 Dec2020
31 Dec2021
31 Dec2020
31 Dec2021
31 Dec2020
Notes $’000 $’000 $’000 $’000 $’000 $’000 $’000 $’000
Total equity at the beginning of the half-year - - - - - - - -
Comprehensive income for the half-year
Profit/(loss) for the half-year - - - - - - - -
Other comprehensive income - - - - - - - -
Total comprehensive income for the half-year - - - - - - - -
Transactions with unitholders
Applications - - - - - - - -
Redemptions - - - - - - - -
Units issued upon reinvestment ofdistributions - - - - - - - -
Distributions paid and payable 5 - - - - - - - -
Total transactions with unitholders - - - - - - - -
Total equity at the end of the half-year - - - - - - - -
The above statements of changes in equity should be read in conjunction with the accompanying notes.
Vanguard Wholesale International Equities Funds (Hedged) and ETFs 9

Statements of cash flowsFor the half-year ended 31 December 2021
Vanguard GlobalInfrastructure Index
Fund (Hedged)
Vanguard MSCIIndex International
Shares (Hedged) ETF
Vanguard InternationalProperty Securities
Index Fund (Hedged)
Vanguard InternationalSmall Companies
Index Fund (Hedged)
31 Dec2021
31 Dec2020
31 Dec2021
31 Dec2020
31 Dec2021
31 Dec2020
31 Dec2021
31 Dec2020
Notes $’000 $’000 $’000 $’000 $’000 $’000 $’000 $’000
Cash flows from operating activities
Proceeds from sale of financialinstruments at fair value through profit orloss 88,589 75,798 276,925 279,897 219,115 292,398 3,165 11,844
Purchases of financial instruments at fairvalue through profit or loss (100,451) (166,056) (177,844) (422,948) (154,592) (253,446) (35,700) (8,031)
Interest received - - - 3 - - - -
Other income received - - 348 96 - - - -
Responsible Entity’s fees paid (103) (80) (295) (204) (250) (230) (15) (11)
Operating expenses paid (11) (18) (38) (50) (15) (37) (9) (19)
Net cash inflow/(outflow) from operatingactivities (11,976) (90,356) 99,096 (143,206) 64,258 38,685 (32,559) 3,783
Cash flows from financing activities
Proceeds from applications by unitholders 113,649 148,653 284,041 153,263 164,368 206,924 41,999 5,257
Payments for redemptions by unitholders (99,982) (44,062) (254,850) (11,632) (225,790) (225,888) (5,007) (7,376)
Distributions paid from operating activities (4,113) (14,561) (113,630) - (7,212) (14,431) (4,199) (1,338)
Net cash inflow/(outflow) from financingactivities 9,554 90,030 (84,439) 141,631 (68,634) (33,395) 32,793 (3,457)
Net increase/(decrease) in cash and cashequivalents (2,422) (326) 14,657 (1,575) (4,376) 5,290 234 326
Cash and cash equivalents at thebeginning of the half-year 3,560 989 28,594 9,785 6,125 704 1,831 1,246
Effects of foreign currency exchange ratechanges on cash and cash equivalents (73) (40) (194) (827) (272) (224) (1) (21)
Cash and cash equivalents at the end ofthe half-year 1,065 623 43,057 7,383 1,477 5,770 2,064 1,551
Non-cash financing activities 7,063 28,544 13,162 - 9,619 18,138 879 153
The above statements of cash flows should be read in conjunction with the accompanying notes.
10 Vanguard Interim Report

Statements of cash flows (continued)For the half-year ended 31 December 2021
Vanguard EthicallyConscious International
Shares Index Fund
VanguardGlobal MinimumVolatility Fund
Vanguard InternationalShares Index Fund
(Hedged)
Vanguard InternationalShares Select
Exclusions Index Fund
31 Dec2021
31 Dec2020
31 Dec2021
31 Dec2020
31 Dec2021
31 Dec2020
31 Dec2021
31 Dec2020
Notes $’000 $’000 $’000 $’000 $’000 $’000 $’000 $’000
Cash flows from operating activities
Proceeds from sale of financialinstruments at fair value through profit orloss 101,756 90,731 7,014 14,559 100,934 988,329 244,178 148,856
Purchases of financial instruments at fairvalue through profit or loss (995,759) (381,373) (11,868) (8,387) (653,843) (977,549) (229,777) (260,661)
Transaction costs on purchases offinancial instruments at fair value throughprofit or loss (309) (127) (10) (7) - - (79) (97)
Interest received - 5 - - - 19 - 10
Dividends received 14,966 7,648 266 255 - - 13,823 12,267
Distributions received 776 381 7 - - - 601 546
Other income received 195 70 9 5 - 5 21 35
Responsible Entity’s fees paid (2,936) (1,312) (42) (41) (1,272) (997) (2,554) (1,965)
Operating expenses paid (359) (119) (18) (18) (76) (155) (567) (157)
Net cash inflow/(outflow) from operatingactivities (881,670) (284,096) (4,642) 6,366 (554,257) 9,652 25,646 (101,166)
Cash flows from financing activities
Proceeds from applications by unitholders 1,002,129 317,835 8,334 2,404 1,077,878 886,122 227,359 239,248
Payments for redemptions by unitholders (121,304) (25,628) (2,605) (8,148) (415,337) (785,896) (243,860) (112,804)
Distributions paid from operating activities (5,452) (2,007) (669) (639) (131,475) (125,617) (8,979) (5,726)
Net cash inflow/(outflow) from financingactivities 875,373 290,200 5,060 (6,383) 531,066 (25,391) (25,480) 120,718
Net increase/(decrease) in cash and cashequivalents (6,297) 6,104 418 (17) (23,191) (15,739) 166 19,552
Cash and cash equivalents at thebeginning of the half-year 30,495 11,419 382 353 119,333 38,919 17,253 22,689
Effects of foreign currency exchange ratechanges on cash and cash equivalents (621) (429) 8 (88) 1,144 (1,804) 454 (2,068)
Cash and cash equivalents at the end ofthe half-year 23,577 17,094 808 248 97,286 21,376 17,873 40,173
Non-cash financing activities 12,218 5,136 276 340 198,492 209,364 53,170 25,989
The above statements of cash flows should be read in conjunction with the accompanying notes.
Vanguard Wholesale International Equities Funds (Hedged) and ETFs 11

Notes to the financial statementsFor the half-year ended 31 December 2021
1 General informationThese financial statements cover the Vanguard Wholesale International Equities Funds (Hedged) and ETFs (the “Funds”) asregistered managed investment schemes. The respective constitution dates are as follows:
Vanguard Global Infrastructure Index Fund (Hedged) 26 October 2007
Vanguard MSCI Index International Shares (Hedged) ETF 12 September 2013
Vanguard International Property Securities Index Fund (Hedged) 30 June 2005
Vanguard International Small Companies Index Fund (Hedged) 9 August 2007
Vanguard Ethically Conscious International Shares Index Fund 23 April 2018
Vanguard Global Minimum Volatility Fund 12 September 2013
Vanguard International Shares Index Fund (Hedged) 8 June 2000
Vanguard International Shares Select Exclusions Index Fund 10 June 2016
The Responsible Entity of the Vanguard Wholesale International Equities Funds (Hedged) and ETFs is Vanguard InvestmentsAustralia Ltd (the “Responsible Entity”). The Responsible Entity’s registered office is Level 13,130 Lonsdale Street, MelbourneVIC 3000.
The Funds invest in accordance with the investment policy of the Funds as set out in their respective Product DisclosureStatements (PDSs) and in accordance with the Funds’ Constitution. The Funds (with the exception of Vanguard GlobalMinimum Volatility Fund) seek to track the returns of the Funds’ respective indices, before taking into account fees, expensesand tax. The Vanguard Global Minimum Volatility Fund seeks to provide long-term capital appreciation with volatility lowerthan the FTSE Global All Cap Index (AUD Hedged), before taking into account fees, expenses and tax.
The ETF Class units of the Funds operate as Exchange Traded Funds (ETFs) listed on the Australian Securities Exchange(ASX).
The financial statements were authorised for issue by the directors on 3 March 2022. The directors of the Responsible Entityhave the power to amend and reissue the financial statements.
2 Basis of preparation of interim reportThese interim financial statements for the half-year ended 31 December 2021 have been prepared in accordance withaccounting standard AASB 134 Interim Financial Reporting and the Corporations Act 2001.
The Funds are for-profit unit trusts for the purpose of preparing the financial statements.
This interim financial report does not include all the notes of the type normally included in an annual report. Accordingly, thisreport is to be read in conjunction with the annual report for the year ended 30 June 2021 and any public announcementsmade in the respect of the Funds during the interim reporting period in accordance with the continuous disclosurerequirements of the Corporations Act 2001.
The accounting policies adopted are consistent with those of the previous financial year and corresponding half-year reportingperiod.
New accounting standards or amendments adopted by the Funds
There are no new standards, interpretations or amendments to existing standards that are effective for the first time for thehalf-year beginning 1 July 2021 that would be expected to have a material impact on the Funds.
12 Vanguard Interim Report

Notes to the financial statements (continued)For the half-year ended 31 December 2021
3 Fair value measurementThe Funds measure and recognise the following assets and liabilities at fair value on a recurring basis:
Financial assets / liabilities at fair value through profit or loss (FVPL)
Derivative financial instruments
The Funds have no assets or liabilities at fair value on a non-recurring basis in the current reporting period.
AASB 13 requires disclosure of fair value measurements by level of the following fair value hierarchy:
(a) quoted prices (unadjusted) in active markets for identical assets or liabilities (level 1);
(b) inputs other than quoted prices included within level 1 that are observable for the asset or liability, either directly orindirectly (level 2); and
(c) inputs for the asset or liability that are not based on observable market data (unobservable inputs) (level 3).
(i) Fair value in an active market (level 1)
The fair value of financial assets and liabilities traded in active markets is based on their quoted market prices at the end ofthe reporting period without any deduction for estimated future selling costs.
The Funds value their investments in accordance with the accounting policies set out in note 2 to the financial statements. Forthe majority of investments, the Funds rely on information provided by independent pricing services for the valuation ofinvestments.
The quoted market price used for financial assets held by the Funds is the current bid price; the appropriate quoted marketprice for financial liabilities is the current asking price. When the Funds hold derivatives with offsetting market risks, they usemid-market prices as a basis for establishing fair values for the offsetting risk positions and applies this bid or asking price tothe net open position, as appropriate.
A financial instrument is regarded as quoted in an active market if quoted prices are readily and regularly available from anexchange, dealer, broker, industry group, pricing service, or regulatory agency, and those prices represent actual andregularly occurring market transactions on an arm’s length basis.
(ii) Fair value in an inactive or unquoted market (level 2 and level 3)
The fair value of financial assets and liabilities that are not traded in an active market is determined using valuationtechniques. These include the use of recent arm’s length market transactions, reference to the current fair value of asubstantially similar other instrument, discounted cash flow techniques, option pricing models or any other valuation techniquethat provides a reliable estimate of prices obtained in actual market transactions. The carrying amounts of the Funds’ assetsand liabilities at the balance sheet date approximate their fair values.
Where discounted cash flow techniques are used, estimated future cash flows are based on management’s best estimatesand the discount rate used is a market rate at the end of the reporting period applicable for an instrument with similar termsand conditions.
For other pricing models, inputs are based on market data at the end of the reporting period. Fair values for unquoted equityinvestments are estimated, if possible, using applicable price/earnings ratios for similar listed companies adjusted to reflectthe specific circumstances of the issuer.
The fair value of derivatives that are not exchange traded is estimated at the amount that the Funds would receive or pay toterminate the contract at the balance sheet date taking into account current market conditions (volatility and appropriate yieldcurve) and the current creditworthiness of the counterparties. The fair value of a forward contract is determined as a netpresent value of estimated future cash flows, discounted at appropriate market rates as at the valuation date. The fair value ofan option contract is determined by applying the Black-Scholes option valuation model.
Investments in other unlisted unit trusts are recorded at the redemption value per unit as reported by the investment managersof such funds.
Some of the inputs to these models may not be market observable and are therefore estimated based on assumptions.
The output of a model is always an estimate or approximation of a value that cannot be determined with certainty, andvaluation techniques employed may not fully reflect all factors relevant to the positions the Funds hold. Valuations aretherefore adjusted, where appropriate, to allow for additional factors including liquidity risk and counterparty risk.
The carrying value less impairment provision of other receivables and payables are assumed to approximate their fair values.The fair value of financial liabilities for disclosure purposes is estimated by discounting the future contractual cash flows at thecurrent market interest rate that is available to the Fund for similar financial instruments.
Vanguard Wholesale International Equities Funds (Hedged) and ETFs 13
Notes to the financial statements (continued)For the half-year ended 31 December 2021
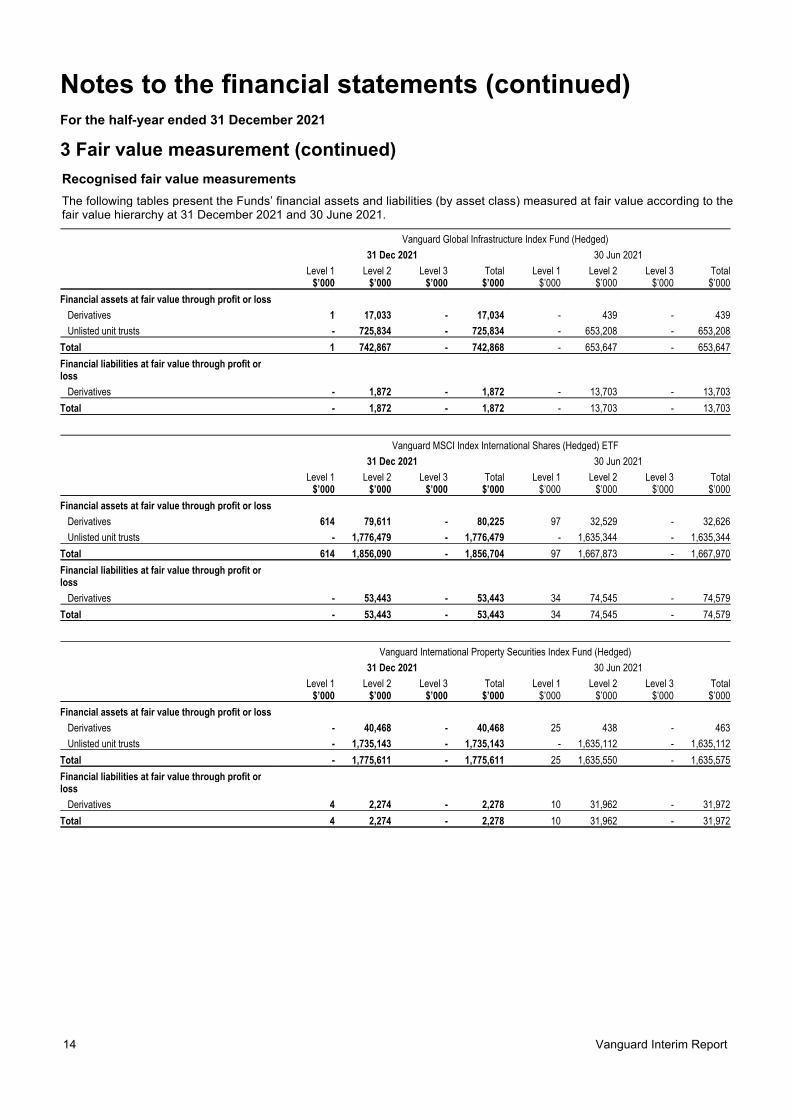
3 Fair value measurement (continued)
Recognised fair value measurements
The following tables present the Funds’ financial assets and liabilities (by asset class) measured at fair value according to thefair value hierarchy at 31 December 2021 and 30 June 2021.
Vanguard Global Infrastructure Index Fund (Hedged)
31 Dec 2021 30 Jun 2021
Level 1 Level 2 Level 3 Total Level 1 Level 2 Level 3 Total$’000 $’000 $’000 $’000 $’000 $’000 $’000 $’000
Financial assets at fair value through profit or loss
Derivatives 1 17,033 - 17,034 - 439 - 439
Unlisted unit trusts - 725,834 - 725,834 - 653,208 - 653,208
Total 1 742,867 - 742,868 - 653,647 - 653,647
Financial liabilities at fair value through profit orloss
Derivatives - 1,872 - 1,872 - 13,703 - 13,703
Total - 1,872 - 1,872 - 13,703 - 13,703
Vanguard MSCI Index International Shares (Hedged) ETF
31 Dec 2021 30 Jun 2021
Level 1 Level 2 Level 3 Total Level 1 Level 2 Level 3 Total$’000 $’000 $’000 $’000 $’000 $’000 $’000 $’000
Financial assets at fair value through profit or loss
Derivatives 614 79,611 - 80,225 97 32,529 - 32,626
Unlisted unit trusts - 1,776,479 - 1,776,479 - 1,635,344 - 1,635,344
Total 614 1,856,090 - 1,856,704 97 1,667,873 - 1,667,970
Financial liabilities at fair value through profit orloss
Derivatives - 53,443 - 53,443 34 74,545 - 74,579
Total - 53,443 - 53,443 34 74,545 - 74,579
Vanguard International Property Securities Index Fund (Hedged)
31 Dec 2021 30 Jun 2021
Level 1 Level 2 Level 3 Total Level 1 Level 2 Level 3 Total$’000 $’000 $’000 $’000 $’000 $’000 $’000 $’000
Financial assets at fair value through profit or loss
Derivatives - 40,468 - 40,468 25 438 - 463
Unlisted unit trusts - 1,735,143 - 1,735,143 - 1,635,112 - 1,635,112
Total - 1,775,611 - 1,775,611 25 1,635,550 - 1,635,575
Financial liabilities at fair value through profit orloss
Derivatives 4 2,274 - 2,278 10 31,962 - 31,972
Total 4 2,274 - 2,278 10 31,962 - 31,972
14 Vanguard Interim Report
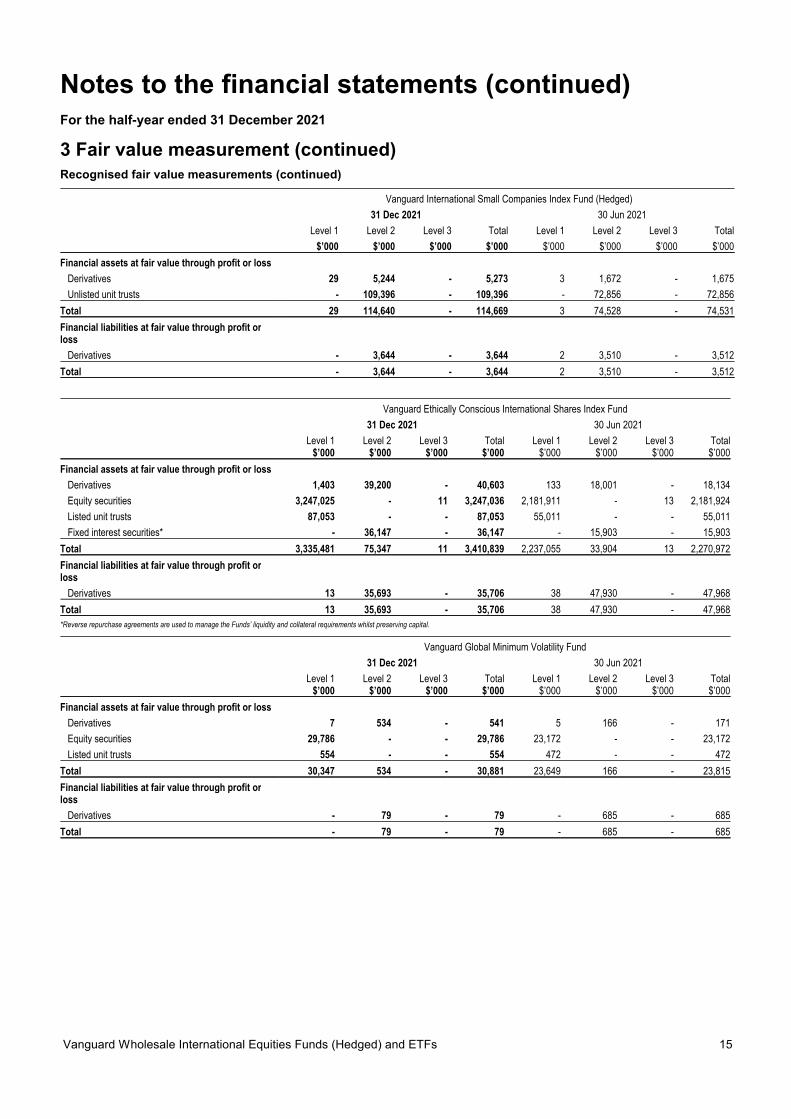
Notes to the financial statements (continued)For the half-year ended 31 December 2021
3 Fair value measurement (continued)Recognised fair value measurements (continued)
Vanguard International Small Companies Index Fund (Hedged)
31 Dec 2021 30 Jun 2021
Level 1 Level 2 Level 3 Total Level 1 Level 2 Level 3 Total
$’000 $’000 $’000 $’000 $’000 $’000 $’000 $’000
Financial assets at fair value through profit or loss
Derivatives 29 5,244 - 5,273 3 1,672 - 1,675
Unlisted unit trusts - 109,396 - 109,396 - 72,856 - 72,856
Total 29 114,640 - 114,669 3 74,528 - 74,531
Financial liabilities at fair value through profit orloss
Derivatives - 3,644 - 3,644 2 3,510 - 3,512
Total - 3,644 - 3,644 2 3,510 - 3,512
Vanguard Ethically Conscious International Shares Index Fund
31 Dec 2021 30 Jun 2021
Level 1 Level 2 Level 3 Total Level 1 Level 2 Level 3 Total$’000 $’000 $’000 $’000 $’000 $’000 $’000 $’000
Financial assets at fair value through profit or loss
Derivatives 1,403 39,200 - 40,603 133 18,001 - 18,134
Equity securities 3,247,025 - 11 3,247,036 2,181,911 - 13 2,181,924
Listed unit trusts 87,053 - - 87,053 55,011 - - 55,011
Fixed interest securities* - 36,147 - 36,147 - 15,903 - 15,903
Total 3,335,481 75,347 11 3,410,839 2,237,055 33,904 13 2,270,972
Financial liabilities at fair value through profit orloss
Derivatives 13 35,693 - 35,706 38 47,930 - 47,968
Total 13 35,693 - 35,706 38 47,930 - 47,968
*Reverse repurchase agreements are used to manage the Funds’ liquidity and collateral requirements whilst preserving capital.
Vanguard Global Minimum Volatility Fund
31 Dec 2021 30 Jun 2021
Level 1 Level 2 Level 3 Total Level 1 Level 2 Level 3 Total$’000 $’000 $’000 $’000 $’000 $’000 $’000 $’000
Financial assets at fair value through profit or loss
Derivatives 7 534 - 541 5 166 - 171
Equity securities 29,786 - - 29,786 23,172 - - 23,172
Listed unit trusts 554 - - 554 472 - - 472
Total 30,347 534 - 30,881 23,649 166 - 23,815
Financial liabilities at fair value through profit orloss
Derivatives - 79 - 79 - 685 - 685
Total - 79 - 79 - 685 - 685
Vanguard Wholesale International Equities Funds (Hedged) and ETFs 15
Notes to the financial statements (continued)For the half-year ended 31 December 2021
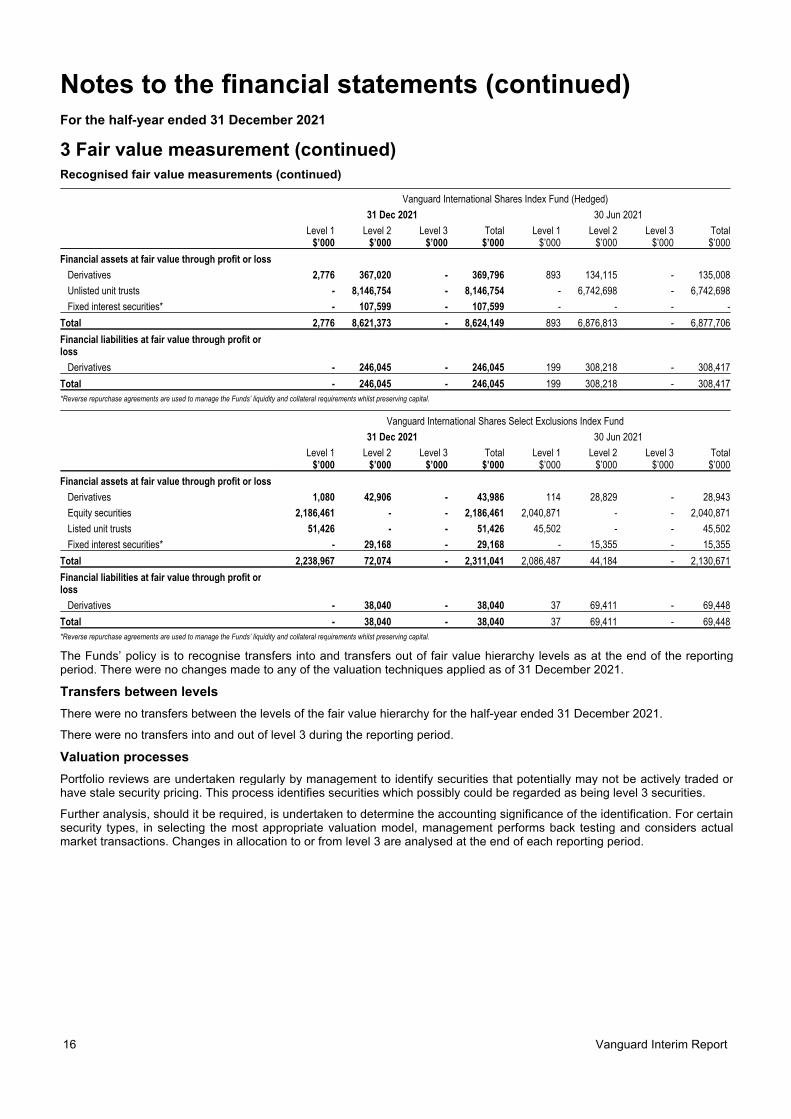
3 Fair value measurement (continued)Recognised fair value measurements (continued)
Vanguard International Shares Index Fund (Hedged)
31 Dec 2021 30 Jun 2021
Level 1 Level 2 Level 3 Total Level 1 Level 2 Level 3 Total$’000 $’000 $’000 $’000 $’000 $’000 $’000 $’000
Financial assets at fair value through profit or loss
Derivatives 2,776 367,020 - 369,796 893 134,115 - 135,008
Unlisted unit trusts - 8,146,754 - 8,146,754 - 6,742,698 - 6,742,698
Fixed interest securities* - 107,599 - 107,599 - - - -
Total 2,776 8,621,373 - 8,624,149 893 6,876,813 - 6,877,706
Financial liabilities at fair value through profit orloss
Derivatives - 246,045 - 246,045 199 308,218 - 308,417
Total - 246,045 - 246,045 199 308,218 - 308,417
*Reverse repurchase agreements are used to manage the Funds’ liquidity and collateral requirements whilst preserving capital.
Vanguard International Shares Select Exclusions Index Fund
31 Dec 2021 30 Jun 2021
Level 1 Level 2 Level 3 Total Level 1 Level 2 Level 3 Total$’000 $’000 $’000 $’000 $’000 $’000 $’000 $’000
Financial assets at fair value through profit or loss
Derivatives 1,080 42,906 - 43,986 114 28,829 - 28,943
Equity securities 2,186,461 - - 2,186,461 2,040,871 - - 2,040,871
Listed unit trusts 51,426 - - 51,426 45,502 - - 45,502
Fixed interest securities* - 29,168 - 29,168 - 15,355 - 15,355
Total 2,238,967 72,074 - 2,311,041 2,086,487 44,184 - 2,130,671
Financial liabilities at fair value through profit orloss
Derivatives - 38,040 - 38,040 37 69,411 - 69,448
Total - 38,040 - 38,040 37 69,411 - 69,448
*Reverse repurchase agreements are used to manage the Funds’ liquidity and collateral requirements whilst preserving capital.
The Funds’ policy is to recognise transfers into and transfers out of fair value hierarchy levels as at the end of the reportingperiod. There were no changes made to any of the valuation techniques applied as of 31 December 2021.
Transfers between levels
There were no transfers between the levels of the fair value hierarchy for the half-year ended 31 December 2021.
There were no transfers into and out of level 3 during the reporting period.
Valuation processes
Portfolio reviews are undertaken regularly by management to identify securities that potentially may not be actively traded orhave stale security pricing. This process identifies securities which possibly could be regarded as being level 3 securities.
Further analysis, should it be required, is undertaken to determine the accounting significance of the identification. For certainsecurity types, in selecting the most appropriate valuation model, management performs back testing and considers actualmarket transactions. Changes in allocation to or from level 3 are analysed at the end of each reporting period.
16 Vanguard Interim Report

Notes to the financial statements (continued)For the half-year ended 31 December 2021
4 Net assets attributable to unitholdersUnder AASB 132 Financial instruments: Presentation, puttable financial instruments meet the definition of a financial liability tobe classified as equity where certain strict criteria are met. The Funds shall classify a financial instrument as an equityinstrument from the date when the instrument has all the features and meets the conditions. Otherwise the financialinstrument should be disclosed as a liability.
Movement in number of units and net assets attributable to unitholders during the half-year were as follows:
Vanguard Global InfrastructureIndex Fund (Hedged)
Vanguard MSCI Index InternationalShares (Hedged) ETF
31 Dec2021
31 Dec2020
31 Dec2021
31 Dec2020
31 Dec2021
31 Dec2020
31 Dec2021
31 Dec2020
No. ’000 No. ’000 $’000 $’000 No. ’000 No. ’000 $’000 $’000
Balance as at 1 July 687,762 429,232 654,994 402,484 19,491 14,675 1,655,862 1,026,643
Applications 114,565 155,662 113,371 148,328 2,960 2,035 260,694 155,759
Redemptions (99,944) (46,079) (100,215) (43,969) (2,865) (150) (254,850) (11,632)
Units issued upon reinvestment of distributions 7,412 30,800 7,063 28,544 155 - 13,162 -
Distributions paid and payable - - - (35,075) - - - (50,531)
Profit/(loss) for the half-year - - 64,069 31,629 - - 146,289 206,348
Closing balance as at 31 December 709,795 569,615 739,282 531,941 19,741 16,560 1,821,157 1,326,587
Vanguard International PropertySecurities Index Fund (Hedged)
Vanguard International SmallCompanies Index Fund (Hedged)
31 Dec2021
31 Dec2020
31 Dec2021
31 Dec2020
31 Dec2021
31 Dec2020
31 Dec2021
31 Dec2020
No. ’000 No. ’000 $’000 $’000 No. ’000 No. ’000 $’000 $’000
Balance as at 1 July 1,948,777 1,918,533 1,650,803 1,352,967 66,626 62,641 75,288 56,400
Applications 183,702 284,686 164,000 206,806 35,766 5,308 41,971 5,207
Redemptions (249,895) (312,827) (224,870) (225,645) (4,419) (7,885) (5,029) (7,375)
Units issued upon reinvestment of distributions 11,346 26,094 9,619 18,138 777 165 879 153
Increase/(decrease) in net assets attributable to unitholders - - - - - - - -
Distributions paid and payable - - - (49,118) - - - (1,939)
Profit/(loss) for the half-year - - 192,933 151,471 - - (100) 14,503
Closing balance as at 31 December 1,893,930 1,916,486 1,792,485 1,454,619 98,750 60,229 113,009 66,949
Vanguard Ethically Conscious International Shares Index Fund
ETF Class AUD Unhedged Class
31 Dec2021
31 Dec2020
31 Dec2021
31 Dec2020
31 Dec2021
31 Dec2020
31 Dec2021
31 Dec2020
No. ’000 No. ’000 $’000 $’000 No. ’000 No. ’000 $’000 $’000
Balance as at 1 July 4,837 2,196 339,729 122,045 636,591 353,064 962,400 421,889
Applications 3,380 1,065 254,162 63,931 178,377 123,703 289,906 157,217
Redemptions - - - - (26,486) (9,303) (43,315) (11,547)
Units issued upon reinvestment of distributions 4 3 315 153 2,668 1,437 4,100 1,768
Increase/(decrease) in net assets attributable to unitholders - - 32,012 6,432 - - 82,834 25,702
Closing balance as at 31 December 8,221 3,264 626,218 192,561 791,150 468,901 1,295,925 595,029
NZD Hedged Class AUD Hedged Class
31 Dec2021
31 Dec2020
31 Dec2021
31 Dec2020
31 Dec2021
31 Dec2020
31 Dec2021
31 Dec2020
No. ’000 No. ’000 $’000 $’000 No. ’000 No. ’000 $’000 $’000
Balance as at 1 July 747,638 486,602 908,476 478,233 42,597 - 43,356 -
Applications 288,060 95,940 373,084 102,405 72,554 - 79,408 -
Redemptions (60,932) (12,852) (77,601) (14,104) (543) - (593) -
Units issued upon reinvestment of distributions 6,397 3,095 7,803 3,215 - - - -
Increase/(decrease) in net assets attributable to unitholders - - 150,546 108,451 - - 1,807 -
Closing balance as at 31 December 981,163 572,785 1,362,308 678,200 114,608 - 123,978 -
Vanguard Wholesale International Equities Funds (Hedged) and ETFs 17

Notes to the financial statements (continued)For the half-year ended 31 December 2021
4 Net assets attributable to unitholders (continued)
Vanguard Global Minimum Volatility Fund
Wholesale Class ETF Class
31 Dec2021
31 Dec2020
31 Dec2021
31 Dec2020
31 Dec2021
31 Dec2020
31 Dec2021
31 Dec2020
No. ’000 No. ’000 $’000 $’000 No. ’000 No. ’000 $’000 $’000
Balance as at 1 July 9,783 12,131 12,202 14,890 222 230 11,902 12,143
Applications 2,121 1,458 2,678 1,863 105 10 5,659 542
Redemptions (1,434) (4,467) (1,802) (5,664) (15) (45) (802) (2,484)
Units issued upon reinvestment of distributions 190 248 237 306 1 1 39 34
Increase/(decrease) in net assets attributable to unitholders - - 467 501 - - 592 382
Closing balance as at 31 December 10,660 9,370 13,782 11,896 313 196 17,390 10,617
Vanguard International Shares Index Fund (Hedged)
AUD Class NZD Class
31 Dec2021
31 Dec2020
31 Dec2021
31 Dec2020
31 Dec2021
31 Dec2020
31 Dec2021
31 Dec2020
No. ’000 No. ’000 $’000 $’000 No. ’000 No. ’000 $’000 $’000
Balance as at 1 July 7,278,488 6,156,421 6,816,013 5,240,184 7,719 15,385 9,376 19,753
Applications 1,103,178 983,248 1,074,263 886,415 - 5 - 7
Redemptions (375,745) (833,784) (368,549) (756,309) (8,121) (7,683) (10,467) (10,271)
Units issued upon reinvestment of distributions 211,313 241,650 198,001 208,691 402 543 491 673
Increase/(decrease) in net assets attributable to unitholders - - 636,117 547,430 - - 600 491
Closing balance as at 31 December 8,217,234 6,547,535 8,355,845 6,126,411 - 8,250 - 10,653
Vanguard International Shares Select Exclusions Index Fund
AUD Unhedged Class AUD Hedged Class
31 Dec2021
31 Dec2020
31 Dec2021
31 Dec2020
31 Dec2021
31 Dec2020
31 Dec2021
31 Dec2020
No. ’000 No. ’000 $’000 $’000 No. ’000 No. ’000 $’000 $’000
Balance as at 1 July 470,885 451,618 740,892 579,226 214,482 191,966 268,383 205,116
Applications 43,648 65,783 72,782 90,472 29,088 60,989 37,594 68,277
Redemptions (37,508) (7,896) (62,676) (10,673) (13,163) (32,749) (17,368) (37,512)
Units issued upon reinvestment of distributions 15,533 6,229 24,622 8,046 3,555 6,451 4,450 7,099
Increase/(decrease) in net assets attributable to unitholders - - 77,462 42,907 - - 23,121 24,203
Closing balance as at 31 December 492,558 515,734 853,082 709,978 233,962 226,657 316,180 267,183
NZD Hedged Class
31 Dec2021
31 Dec2020
31 Dec2021
31 Dec2020
No. ’000 No. ’000 $’000 $’000
Balance as at 1 July 748,061 649,643 1,046,431 767,761
Applications 76,256 62,735 116,649 80,556
Redemptions (107,824) (50,713) (162,289) (64,569)
Units issued upon reinvestment of distributions 17,159 8,862 24,098 10,844
Increase/(decrease) in net assets attributable to unitholders - - 98,440 117,728
Closing balance as at 31 December 733,652 670,527 1,123,329 912,320
Each unit represents a right to an individual share in the Funds and does not extend to a right to the underlying assets of theFunds. The Vanguard Global Infrastructure Index Fund (Hedged), Vanguard MSCI Index International Shares (Hedged) ETF,Vanguard International Property Securities Index Fund (Hedged) and Vanguard International Small Companies Index Fund(Hedged) have no separate classes of units and each unit has the same rights attaching to it as all other units of the Funds.
18 Vanguard Interim Report

Notes to the financial statements (continued)For the half-year ended 31 December 2021
4 Net assets attributable to unitholders (continued)Capital risk management
The Funds consider their net assets attributable to unitholders as capital, notwithstanding net assets attributable to unitholdersare classified either as a liability or equity. The amount of net assets attributable to unitholders can change significantly on adaily basis as the Funds are subject to daily applications and redemptions at the discretion of unitholders.
Daily applications and redemptions are reviewed relative to the liquidity of the Funds’ underlying assets on a daily basis by theResponsible Entity. Under the terms of the Funds’ Constitution, the Responsible Entity has the discretion to reject anapplication for units and to defer or adjust a redemption of units if the exercise of such discretion is in the best interests ofunitholders.
The Funds’ investment strategy remains unchanged and the Funds continue to hold direct investments which provideexposure to liquid assets including equity securities, income securities, interest earnings and cash equivalent securities. Assuch, the Funds will meet any capital requirements from the liquidation of liquid assets, which include cash and cashequivalents.
5 Distributions to unitholders paid and payableThe distributions during the half-year were as follows:
Vanguard Global InfrastructureIndex Fund (Hedged)
Vanguard MSCI Index InternationalShares (Hedged) ETF
31 Dec 2021 31 Dec 2020 31 Dec 2021 31 Dec 2020$’000 CPU $’000 CPU $’000 CPU $’000 CPU
Distributions paid
- 30 September - - 22,342 5.0107 - - - -
Distributions payable
- 31 December - - 12,733 2.2355 - - 50,531 305.1337
- - 35,075 7.2462 - - 50,531 305.1337
Vanguard International PropertySecurities Index Fund (Hedged)
Vanguard International SmallCompanies Index Fund (Hedged)
31 Dec 2021 31 Dec 2020 31 Dec 2021 31 Dec 2020$’000 CPU $’000 CPU $’000 CPU $’000 CPU
Distributions paid
- 30 September - - 32,569 1.8166 - - 1,491 2.5459
Distributions payable
- 31 December - - 16,549 0.8635 - - 448 0.7433
- - 49,118 2.6801 - - 1,939 3.2892
Vanguard Ethically Conscious International Shares Index Fund
ETF Class AUD Unhedged Class
31 Dec 2021 31 Dec 2020 31 Dec 2021 31 Dec 2020$’000 CPU $’000 CPU $’000 CPU $’000 CPU
Distributions paid
- 30 September 937 17.7967 351 15.4388 2,597 0.3635 1,337 0.3261
Distributions payable
- 31 December 2,614 30.5952 656 19.0377 6,539 0.8266 1,754 0.3741
3,551 48.3919 1,007 34.4765 9,136 1.1901 3,091 0.7002
NZD Hedged Class AUD Hedged Class
31 Dec 2021 31 Dec 2020 31 Dec 2021 31 Dec 2020$’000 CPU $’000 CPU $’000 CPU $’000 CPU
Distributions paid
- 30 September - - 3,870 0.7240 - - - -
Distributions payable
- 31 December - - 17,904 3.1258 - - - -
- - 21,774 3.8498 - - - -
Vanguard Wholesale International Equities Funds (Hedged) and ETFs 19

Notes to the financial statements (continued)For the half-year ended 31 December 2021
5 Distributions to unitholders paid and payable (continued)
Vanguard Global Minimum Volatility Fund
Wholesale Class ETF Class
31 Dec 2021 31 Dec 2020 31 Dec 2021 31 Dec 2020$’000 CPU $’000 CPU $’000 CPU $’000 CPU
Distributions paid
- 30 September - - 281 3.1557 - - 320 149.1154
Distributions payable
- 31 December - - 288 3.0795 - - 305 155.1182
- - 569 6.2352 - - 625 304.2336
Vanguard International Shares Index Fund (Hedged)
AUD Class NZD Class
31 Dec 2021 31 Dec 2020 31 Dec 2021 31 Dec 2020$’000 CPU $’000 CPU $’000 CPU $’000 CPU
Distributions paid
- 30 September - - 226,504 3.6365 - - 940 11.1129
Distributions payable
- 31 December - - 231,869 3.5413 - - 894 10.8397
- - 458,373 7.1778 - - 1,834 21.9526
Vanguard International Shares Select Exclusions Index Fund
AUD Unhedged Class AUD Hedged Class
31 Dec 2021 31 Dec 2020 31 Dec 2021 31 Dec 2020$’000 CPU $’000 CPU $’000 CPU $’000 CPU
Distributions paid
- 30 September 6,395 1.3066 1,763 0.3738 - - 8,378 3.8753
Distributions payable
- 31 December 14,827 3.0102 3,086 0.5983 - - 6,944 3.0635
21,222 4.3168 4,849 0.9721 - - 15,322 6.9388
NZD Hedged Class
31 Dec 2021 31 Dec 2020$’000 CPU $’000 CPU
Distributions paid
- 30 September - - 13,512 2.0891
Distributions payable
- 31 December - - 30,505 4.5494
- - 44,017 6.6385
6 Events occurring after the reporting periodMarket disruptions associated with current geopolitical events have had a global impact, and uncertainty exists as to theirimplications. Such disruptions can adversely affect assets of the Funds and thus performance of the Funds. Management iscontinuing to monitor this development and evaluate its impact on the Funds.
There are no other significant events that have occurred since balance date which would impact on the financial position ofthe Funds as disclosed in the balance sheet as at 31 December 2021 or on the results and cash flows of the Funds for thehalf-year ended on that date.
7 Contingent assets, contingent liabilities and commitmentsThere are no outstanding contingent assets, liabilities or commitments as at 31 December 2021 (30 June 2021: Nil).
20 Vanguard Interim Report


PricewaterhouseCoopers, ABN 52 780 433 757 2 Riverside Quay, SOUTHBANK VIC 3006, GPO Box 1331, MELBOURNE VIC 3001 T: 61 3 8603 1000, F: 61 3 8603 1999
Liability limited by a scheme approved under Professional Standards Legislation.
Independent auditor's review report
To the unitholders of:
Vanguard Global Infrastructure Index Fund (Hedged) Vanguard MSCI Index International Shares (Hedged) ETF* Vanguard International Property Securities Index Fund (Hedged) Vanguard International Small Companies Index Fund (Hedged) Vanguard Ethically Conscious International Shares Index Fund* Vanguard Global Minimum Volatility Fund* Vanguard International Shares Index Fund (Hedged) Vanguard International Shares Select Exclusions Index Fund
referred to collectively as the Vanguard Wholesale International Equities Funds (Hedged) and ETFs.
* denotes listed Funds
Report on the half-year financial report
Conclusion We have reviewed the half-year financial report of the Vanguard Wholesale International Equities Funds (Hedged) and ETFs (the Funds) which comprises the balance sheets as at 31 December 2021, the statements of comprehensive income, statements of changes in equity and statements of cash flows for the half-year ended on that date, significant accounting policies and explanatory notes and the directors' declaration.
Based on our review, which is not an audit, we have not become aware of any matter that makes us believe that the accompanying half-year financial report of the Vanguard Wholesale International Equities Funds (Hedged) and ETFs does not comply with the Corporations Act 2001 including:
1. giving a true and fair view of the Funds' financial positions as at 31 December 2021 and of theirperformance for the half-year ended on that date
2. complying with Accounting Standard AASB 134 Interim Financial Reporting and the CorporationsRegulations 2001.
Basis for conclusion We conducted our review in accordance with ASRE 2410 Review of a Financial Report Performed by the Independent Auditor of the Entity (ASRE 2410). Our responsibilities are further described in the Auditor’s responsibilities for the review of the half-year financial report section of our report.
We are independent of the Funds in accordance with the auditor independence requirements of the Corporations Act 2001 and the ethical requirements of the Accounting Professional & Ethical Standards Board’s APES 110 Code of Ethics for Professional Accountants (including Independence Standards) (the Code) that are relevant to the audit of the annual financial report in Australia. We have also fulfilled our other ethical responsibilities in accordance with the Code.
Responsibilities of the directors for the half-year financial report The directors are responsible for the preparation of the half-year financial report that gives a true and fair view in accordance with Australian Accounting Standards and the Corporations Act 2001 and for such internal control as the directors determine is necessary to enable the preparation of the half-year financial report that gives a true and fair view and is free from material misstatement whether due to fraud or error.
Auditor's responsibilities for the review of the half-year financial report Our responsibility is to express a conclusion on the half-year financial report based on our review. ASRE 2410 requires us to conclude whether we have become aware of any matter that makes us believe that the half-year financial report is not in accordance with the Corporations Act 2001 including giving a true and fair view of the Funds' financial position as at 31 December 2021 and of their performance for the half-year ended on that date, and complying with Accounting Standard AASB 134 Interim Financial Reporting and the Corporations Regulations 2001.
A review of a half-year financial report consists of making enquiries, primarily of persons responsible for financial and accounting matters, and applying analytical and other review procedures. A review is substantially less in scope than an audit conducted in accordance with Australian Auditing Standards and consequently does not enable us to obtain assurance that we would become aware of all significant matters that might be identified in an audit. Accordingly, we do not express an audit opinion.
PricewaterhouseCoopers
Adrian Gut Melbourne Partner 3 March 2022

Vanguard Investments Australia Ltd (ABN 72 072 881 086 / AFSL 227263) (“Vanguard”) is the product issuer andResponsible Entity of the interests in the Vanguard Wholesale Funds and Australian ETFs. Interests in the VanguardWholesale Funds are offered through a Product Disclosure Statement (“PDS”) only. Vanguard ETFs will only be issued toAuthorised Participants. That is, persons who have entered into an Authorised Participant Agreement with Vanguard (“EligibleInvestors”). Retail investors can transact in Vanguard ETFs through a stockbroker or financial adviser on the secondarymarket. You can access the relevant PDS at www.vanguard.com.au or by calling 1300 655 102.
Past performance is not an indication of future performance. In preparing this Interim Report, individual circumstances, forexample tax implications, have not been taken into account and it may, therefore, not be applicable to an individual’s situation.Before making an investment decision, you should consider your circumstances and whether the information contained in theInterim Report is applicable to your situation. This Interim Report was prepared in good faith and we accept no liability for anyerrors or omissions. All marks are the exclusive property of their respective owners.
The funds or securities referred to herein are not sponsored, endorsed, or promoted by MSCI, and MSCI bears no liability withrespect to any such funds or securities. The PDS contains a more detailed description of the limited relationship MSCI haswith Vanguard and any related funds.
London Stock Exchange Group companies include FTSE International Limited (‘FTSE’), Frank Russell Company (‘Russell’),MTS Next Limited (‘MTS’), and FTSE TMX Global Debt Capital Markets Inc. (‘FTSE TMX’). All rights reserved. ‘FTSE®’,‘Russell®’, ‘MTS®’, ‘FTSE TMX®’ and ‘FTSE Russell’ and other service marks and trademarks related to the FTSE or Russellindexes are trademarks of the London Stock Exchange Group companies and are used by FTSE, MTS, FTSE TMX andRussell under licence. All information is provided for information purposes only. No responsibility or liability can be acceptedby the London Stock Exchange Group companies nor its licensors for any errors or for any loss from use of this publication.Neither the London Stock Exchange Group companies nor any of their licensors make any claim, prediction, warranty orrepresentation whatsoever, expressly or impliedly, either as to the results to be obtained from the use of the FTSE Indices orthe fitness or suitability of the Indices for any particular purpose to which they might be put.
©2022 Vanguard Investments Australia Ltd. All rights reserved.
Responsible EntityVanguard Investments Australia LtdABN 72 072 881 086AFSL 227263
Level 13130 Lonsdale StreetMelbourne VIC 3000
Telephone: (03) 8888 3888Facsimile: 1300 765 712
vanguard.com.au

vanguard.com.au1300 655 101
Vanguard Investments Australia Ltd (ABN 72 072 881 086 / AFS Licence 227263) is the product issuer. We have not taken yours or your clients’ circumstances into account when preparing the information so it may not be applicable to the particular situation you are considering. You should consider yours and your clients’ circumstances, and our Product Disclosure Statements (“PDSs”), before making any investment decision or recommendation. You can access our PDSs at vanguard.com.au or by calling 1300 655 205. Past performance is not an indication of future performance. This publication was prepared in good faith and we accept no liability for any errors or omissions. © 2022 Vanguard Investments Australia Ltd. All rights reserved.IRIEQH_022022