Oregon Public Utility Commission€™s Utility Districts (PUDs) Central Lincoln PUD Clatskanie PUD...
109
Oregon Public Utility Commission
Transcript of Oregon Public Utility Commission€™s Utility Districts (PUDs) Central Lincoln PUD Clatskanie PUD...
Oregon Public Utility Commission
2012 Oregon Utility Statistics
Susan Ackerman, Chair Steven Bloom, Commissioner John Savage, Commissioner
Jason Eisdorfer, Director Utility Program

O P bli U ili C i iOregon Public Utility Commission3930 Fairview Industrial Dr SE, Salem OR 97302-1166
PO Box 1088, Salem OR 97308-1088
This document and more information about the OPUC is available at
www.puc.state.or.us
Contact Information:Mark Brown - Administrative Assistant – 503-378-8287Bob Valde P blic Affairs Specialist 503 378 8962Bob Valdez - Public Affairs Specialist – 503-378-8962
or email at: [email protected]
Cover photos: upper left - Wind Farm in Northeastern Oregon, by Bob Valdez; upper right – electric transmission tower in Oregon by Bob Valdez; lower right – Cascade Locks dam near Cascade Locks, Oregon by Bob Valdez; lower left – solar
panels on Oregon Department of Transportation (ODOT) building roof in Salem, Oregon, courtesy ODOT.
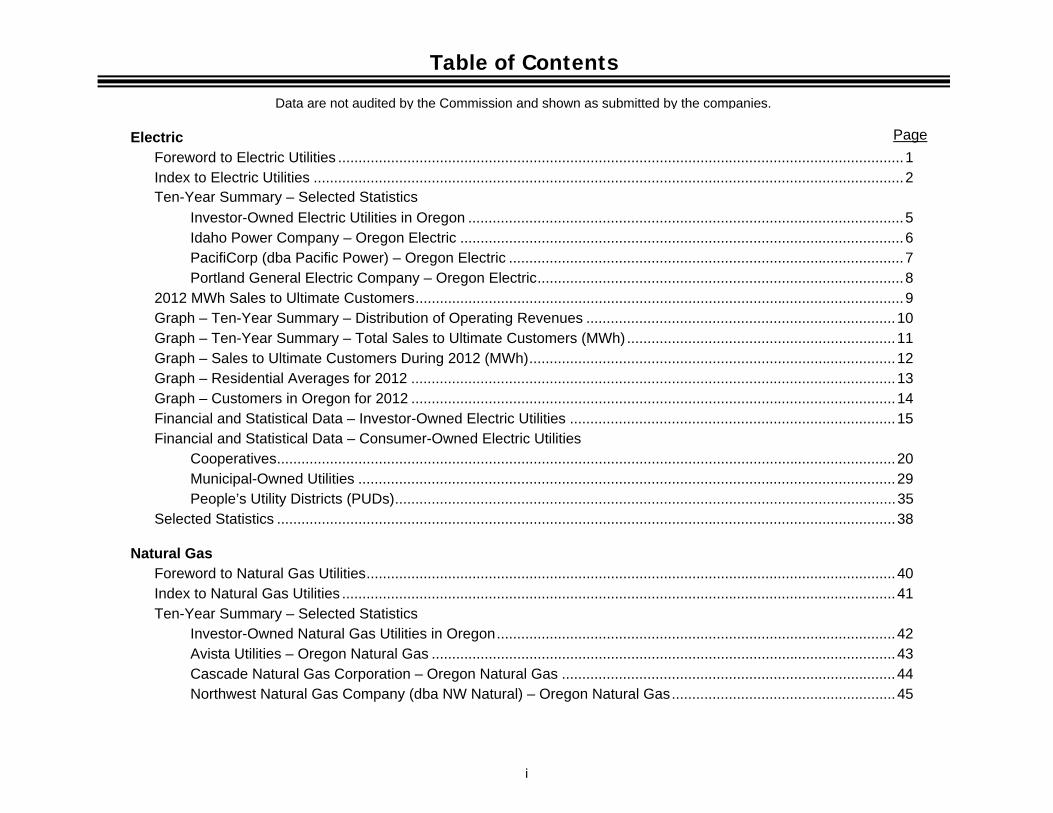
Table of Contents
Data are not audited by the Commission and shown as submitted by the companies.
Page Electric Foreword to Electric Utilities ........................................................................................................................................... 1 Index to Electric Utilities ................................................................................................................................................. 2 Ten-Year Summary – Selected Statistics Investor-Owned Electric Utilities in Oregon ........................................................................................................... 5 Idaho Power Company – Oregon Electric ............................................................................................................. 6 PacifiCorp (dba Pacific Power) – Oregon Electric ................................................................................................. 7 Portland General Electric Company – Oregon Electric .......................................................................................... 8 2012 MWh Sales to Ultimate Customers ........................................................................................................................ 9 Graph – Ten-Year Summary – Distribution of Operating Revenues ............................................................................ 10 Graph – Ten-Year Summary – Total Sales to Ultimate Customers (MWh) .................................................................. 11 Graph – Sales to Ultimate Customers During 2012 (MWh) .......................................................................................... 12 Graph – Residential Averages for 2012 ....................................................................................................................... 13 Graph – Customers in Oregon for 2012 ....................................................................................................................... 14 Financial and Statistical Data – Investor-Owned Electric Utilities ................................................................................ 15 Financial and Statistical Data – Consumer-Owned Electric Utilities Cooperatives ........................................................................................................................................................ 20
Municipal-Owned Utilities .................................................................................................................................... 29 People’s Utility Districts (PUDs) ........................................................................................................................... 35
Selected Statistics ........................................................................................................................................................ 38
Natural Gas Foreword to Natural Gas Utilities .................................................................................................................................. 40 Index to Natural Gas Utilities ........................................................................................................................................ 41 Ten-Year Summary – Selected Statistics
Investor-Owned Natural Gas Utilities in Oregon .................................................................................................. 42 Avista Utilities – Oregon Natural Gas .................................................................................................................. 43 Cascade Natural Gas Corporation – Oregon Natural Gas .................................................................................. 44 Northwest Natural Gas Company (dba NW Natural) – Oregon Natural Gas ....................................................... 45
i
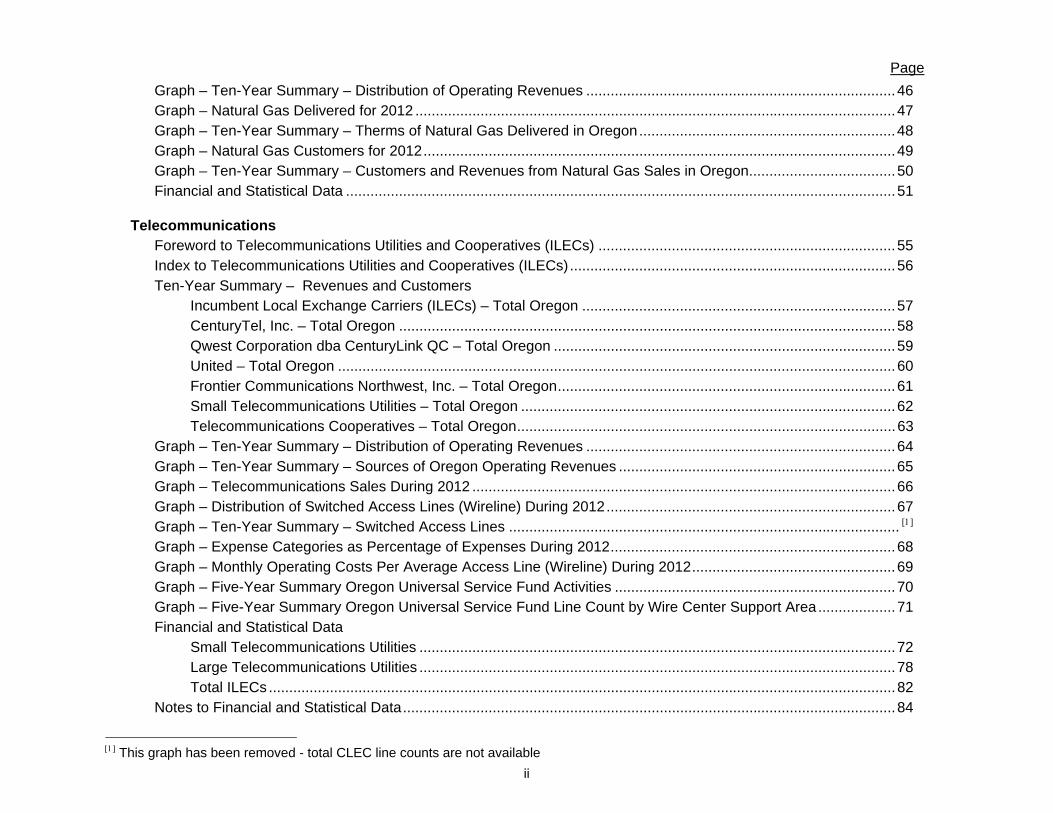
Page
Graph – Ten-Year Summary – Distribution of Operating Revenues ............................................................................ 46 Graph – Natural Gas Delivered for 2012 ...................................................................................................................... 47 Graph – Ten-Year Summary – Therms of Natural Gas Delivered in Oregon ............................................................... 48 Graph – Natural Gas Customers for 2012 .................................................................................................................... 49 Graph – Ten-Year Summary – Customers and Revenues from Natural Gas Sales in Oregon .................................... 50 Financial and Statistical Data ....................................................................................................................................... 51
Telecommunications Foreword to Telecommunications Utilities and Cooperatives (ILECs) ......................................................................... 55 Index to Telecommunications Utilities and Cooperatives (ILECs) ................................................................................ 56 Ten-Year Summary – Revenues and Customers Incumbent Local Exchange Carriers (ILECs) – Total Oregon ............................................................................. 57 CenturyTel, Inc. – Total Oregon .......................................................................................................................... 58 Qwest Corporation dba CenturyLink QC – Total Oregon .................................................................................... 59 United – Total Oregon ......................................................................................................................................... 60 Frontier Communications Northwest, Inc. – Total Oregon ................................................................................... 61 Small Telecommunications Utilities – Total Oregon ............................................................................................ 62 Telecommunications Cooperatives – Total Oregon ............................................................................................. 63 Graph – Ten-Year Summary – Distribution of Operating Revenues ............................................................................ 64 Graph – Ten-Year Summary – Sources of Oregon Operating Revenues .................................................................... 65 Graph – Telecommunications Sales During 2012 ........................................................................................................ 66 Graph – Distribution of Switched Access Lines (Wireline) During 2012 ....................................................................... 67 Graph – Ten-Year Summary – Switched Access Lines ................................................................................................ Graph – Expense Categories as Percentage of Expenses During 2012 ...................................................................... 68 Graph – Monthly Operating Costs Per Average Access Line (Wireline) During 2012 .................................................. 69 Graph – Five-Year Summary Oregon Universal Service Fund Activities ..................................................................... 70 Graph – Five-Year Summary Oregon Universal Service Fund Line Count by Wire Center Support Area ................... 71 Financial and Statistical Data Small Telecommunications Utilities ..................................................................................................................... 72 Large Telecommunications Utilities ..................................................................................................................... 78 Total ILECs .......................................................................................................................................................... 82 Notes to Financial and Statistical Data ......................................................................................................................... 84
This graph has been removed - total CLEC line counts are not available
ii
Water Page
Foreword to Water Utilities ........................................................................................................................................... 85 Index to Water Utilities .................................................................................................................................................. 86 Financial and Statistical Data
Class A ................................................................................................................................................................ 88Class B ................................................................................................................................................................ 90Class C ................................................................................................................................................................ 92
iii

Electric

Foreword to Electric Utilities
Three investor-owned electric utilities operate in Oregon. Investor-owned electric utilities provide service to approximately 74 percent of the customers in the state. The average annual kilowatt hour (kWh) consumption of residential customers for Oregon operations of investor-owned electric utilities is as follows:
2012 2011 2010 2009 2008
Investor-Owned Electric Utilities 10,818 11,213 10,902 11,504 11,660
The following types of electric suppliers served electric customers in Oregon on December 31, 2012:
Type of Electricity Supplier
Number
kWh Sales in Oregon (%)
Customers in Oregon (%)
Investor-Owned 3 67.4 73.8
Electricity Service Suppliers (ESS)[1] 3 3.1 < 0.1
Cooperative[2] 19 10.2 10.6
Municipal-Owned[2] 12 10.4 9.6
People’s Utility District[2] 6 9.0 6.0 [1]Since March 1, 2002, all retail electricity consumers of Portland General Electric Company and PacifiCorp, except residential consumers, may elect to purchase electricity from an entity other than the distribution utility. (See ORS 757.600 et seq.) [2]Cooperatives, Municipal-Owned Utilities, and People’s Utility Districts (PUDs), are not regulated by the Oregon Public Utility Commission, except for safety, area allocation, transmission lines, and curtailment. Reports submitted by Cooperatives, Municipal-Owned Utilities, and PUDs are not audited by the Commission. Some companies may report duplicate customers. An example of a duplicate is a customer whose household service is billed under a residential rate schedule and whose security lighting outside the home is billed under a lighting schedule. When duplicate customers are known and measurable, they have been footnoted. Summary data are provided for informational purposes only.
1
Index to Electric Utilities
Page Investor-Owned Idaho Power Company – Oregon Operations
PacifiCorp (dba Pacific Power) – Oregon Operations Portland General Electric (PGE)
Ten-Year Summaries ................................................................................................................................................. 5 2012 MWh Sales to Ultimate Customers .................................................................................................................... 9 Graphs for 2012 ....................................................................................................................................................... 10 Financial and Statistical Data
Balance Sheet – Total System ........................................................................................................................... 15 Income Statement – Total System ...................................................................................................................... 16 Financial Data – Oregon and Total System ........................................................................................................ 17 Source and Disposition of Electric Energy – Oregon and Total System .............................................................. 18 Sales Statistics – Oregon and Total System ....................................................................................................... 19
Consumer-Owned Cooperatives
Blachly-Lane County Cooperative Electric Assn. Central Electric Cooperative, Inc. Clearwater Power Company Columbia Basin Electric Cooperative, Inc. Columbia Power Cooperative Assn. Columbia Rural Electric Assn., Inc. Consumers Power, Inc. Coos-Curry Electric Cooperative, Inc. Douglas Electric Cooperative, Inc. . Harney Electric Cooperative, Inc. Hood River Electric Cooperative Lane Electric Cooperative, Inc. Midstate Electric Cooperative, Inc.
2
Page Oregon Trail Electric Consumers Cooperative, Inc. Salem Electric Surprise Valley Electrification Corp. Umatilla Electric Cooperative Wasco Electric Cooperative, Inc. West Oregon Electric Cooperative, Inc.
Financial and Statistical Data Operating Revenues, Expenses, and Income ..................................................................................................... 20 Source and Disposition of Electric Energy .......................................................................................................... 23 Sales Statistics ................................................................................................................................................... 26
Municipal-Owned
City of Ashland City of Bandon Canby Utility City of Cascade Locks City of Drain Light & Power Eugene Water & Electric Board City of Forest Grove Light & Power Hermiston Energy Services City of McMinnville Water & Light Milton-Freewater City Light & Power City of Monmouth Springfield Utility Board
Financial and Statistical Data Operating Revenues, Expenses, and Income ..................................................................................................... 29 Source and Disposition of Electric Energy .......................................................................................................... 31 Sales Statistics ................................................................................................................................................... 33
3
Page People’s Utility Districts (PUDs)
Central Lincoln PUD Clatskanie PUD Columbia River PUD Emerald PUD Northern Wasco County PUD Tillamook PUD
Financial and Statistical Data Operating Revenues, Expenses, and Income ..................................................................................................... 35 Source and Disposition of Electric Energy .......................................................................................................... 36 Sales Statistics ................................................................................................................................................... 37
Selected Statistics ...................................................................................................................................................... 38
4
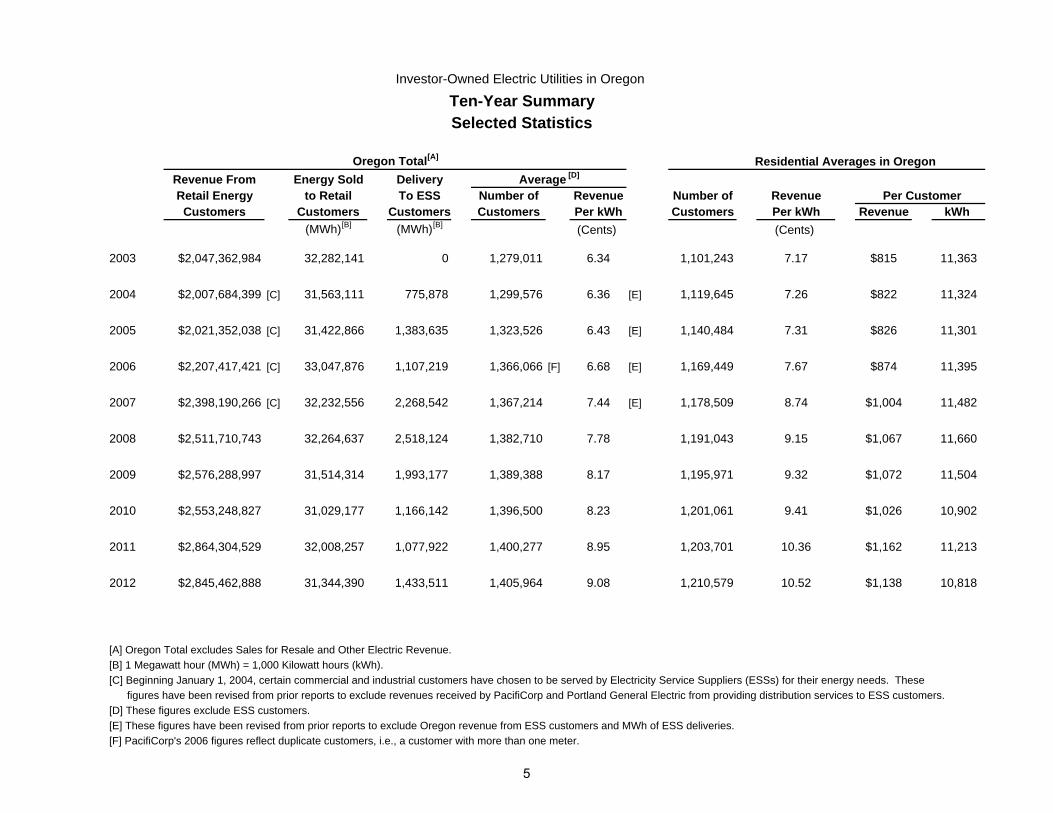
Investor-Owned Electric Utilities in Oregon
Ten-Year Summary Selected Statistics
Oregon Total[A] Residential Averages in OregonRevenue From Energy Sold DeliveryRetail Energy to Retail To ESS Number of Revenue Number of Revenue Per Customer
Customers Customers Customers Customers Per kWh Customers Per kWh Revenue kWh (MWh)[B] (MWh)[B] (Cents) (Cents)
2003 $2,047,362,984 32,282,141 0 1,279,011 6.34 1,101,243 7.17 $815 11,363
2004 $2,007,684,399 [C] 31,563,111 775,878 1,299,576 6.36 [E] 1,119,645 7.26 $822 11,324
2005 $2,021,352,038 [C] 31,422,866 1,383,635 1,323,526 6.43 [E] 1,140,484 7.31 $826 11,301
2006 $2,207,417,421 [C] 33,047,876 1,107,219 1,366,066 [F] 6.68 [E] 1,169,449 7.67 $874 11,395
2007 $2,398,190,266 [C] 32,232,556 2,268,542 1,367,214 7.44 [E] 1,178,509 8.74 $1,004 11,482
2008 $2,511,710,743 32,264,637 2,518,124 1,382,710 7.78 1,191,043 9.15 $1,067 11,660
2009 $2,576,288,997 31,514,314 1,993,177 1,389,388 8.17 1,195,971 9.32 $1,072 11,504
2010 $2,553,248,827 31,029,177 1,166,142 1,396,500 8.23 1,201,061 9.41 $1,026 10,902
2011 $2,864,304,529 32,008,257 1,077,922 1,400,277 8.95 1,203,701 10.36 $1,162 11,213
2012 $2,845,462,888 31,344,390 1,433,511 1,405,964 9.08 1,210,579 10.52 $1,138 10,818
[A] Oregon Total excludes Sales for Resale and Other Electric Revenue.[B] 1 Megawatt hour (MWh) = 1,000 Kilowatt hours (kWh).[C] Beginning January 1, 2004, certain commercial and industrial customers have chosen to be served by Electricity Service Suppliers (ESSs) for their energy needs. These figures have been revised from prior reports to exclude revenues received by PacifiCorp and Portland General Electric from providing distribution services to ESS customers.[D] These figures exclude ESS customers.[E] These figures have been revised from prior reports to exclude Oregon revenue from ESS customers and MWh of ESS deliveries.[F] PacifiCorp's 2006 figures reflect duplicate customers, i.e., a customer with more than one meter.
Average [D]
5
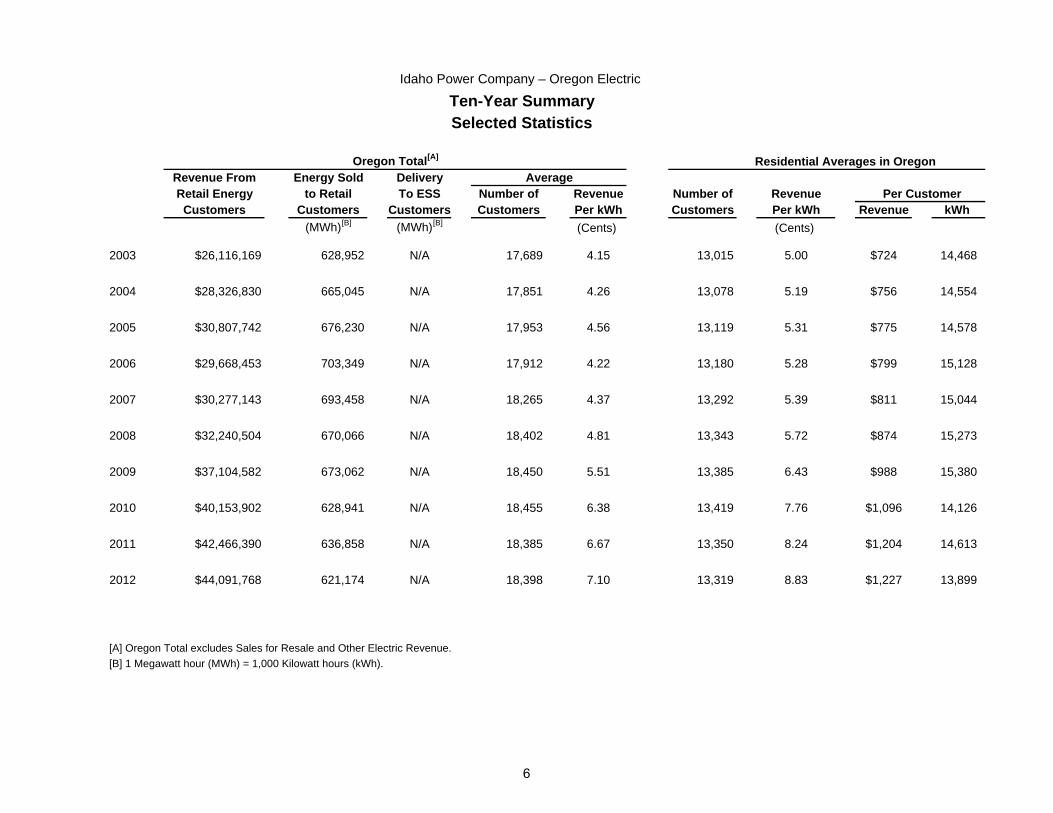
Idaho Power Company – Oregon Electric
Ten-Year Summary Selected Statistics
Oregon Total[A] Residential Averages in OregonRevenue From Energy Sold DeliveryRetail Energy to Retail To ESS Number of Revenue Number of Revenue Per Customer
Customers Customers Customers Customers Per kWh Customers Per kWh Revenue kWh (MWh)[B] (MWh)[B] (Cents) (Cents)
2003 $26,116,169 628,952 N/A 17,689 4.15 13,015 5.00 $724 14,468
2004 $28,326,830 665,045 N/A 17,851 4.26 13,078 5.19 $756 14,554
2005 $30,807,742 676,230 N/A 17,953 4.56 13,119 5.31 $775 14,578
2006 $29,668,453 703,349 N/A 17,912 4.22 13,180 5.28 $799 15,128
2007 $30,277,143 693,458 N/A 18,265 4.37 13,292 5.39 $811 15,044
2008 $32,240,504 670,066 N/A 18,402 4.81 13,343 5.72 $874 15,273
2009 $37,104,582 673,062 N/A 18,450 5.51 13,385 6.43 $988 15,380
2010 $40,153,902 628,941 N/A 18,455 6.38 13,419 7.76 $1,096 14,126
2011 $42,466,390 636,858 N/A 18,385 6.67 13,350 8.24 $1,204 14,613
2012 $44,091,768 621,174 N/A 18,398 7.10 13,319 8.83 $1,227 13,899
[A] Oregon Total excludes Sales for Resale and Other Electric Revenue.[B] 1 Megawatt hour (MWh) = 1,000 Kilowatt hours (kWh).
Average
6
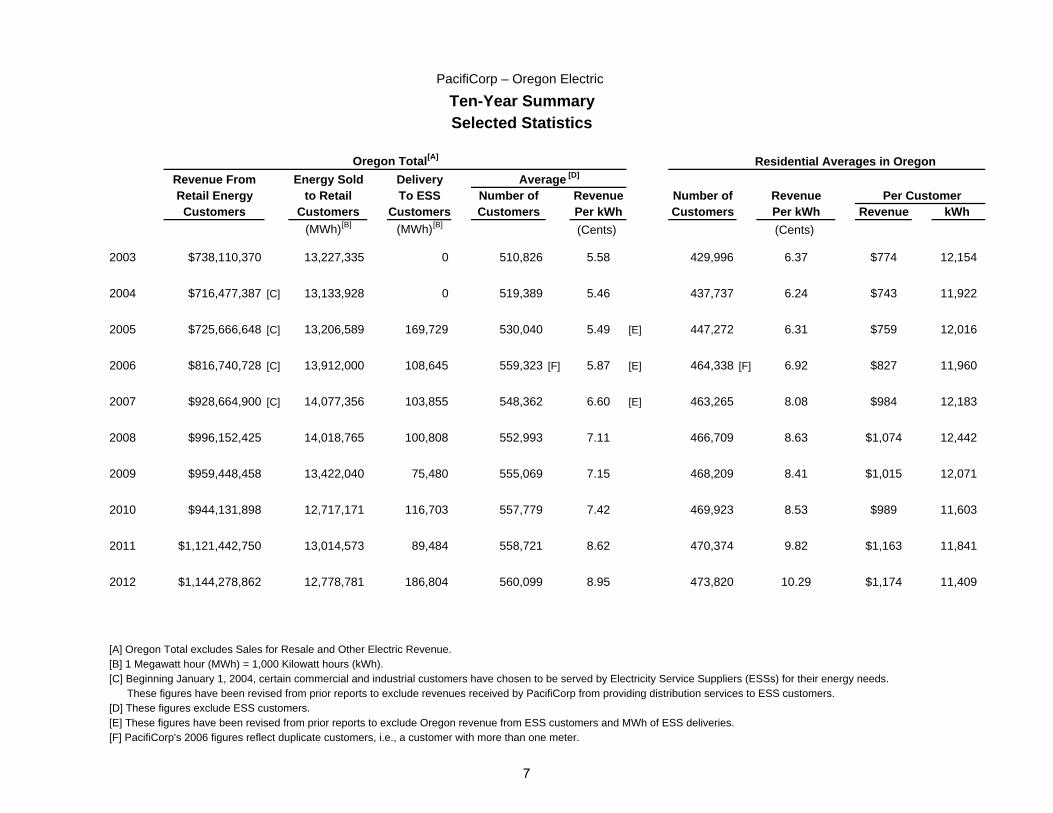
PacifiCorp – Oregon Electric
Ten-Year Summary Selected Statistics
Oregon Total[A] Residential Averages in OregonRevenue From Energy Sold DeliveryRetail Energy to Retail To ESS Number of Revenue Number of Revenue Per Customer
Customers Customers Customers Customers Per kWh Customers Per kWh Revenue kWh (MWh)[B] (MWh)[B] (Cents) (Cents)
2003 $738,110,370 13,227,335 0 510,826 5.58 429,996 6.37 $774 12,154
2004 $716,477,387 [C] 13,133,928 0 519,389 5.46 437,737 6.24 $743 11,922
2005 $725,666,648 [C] 13,206,589 169,729 530,040 5.49 [E] 447,272 6.31 $759 12,016
2006 $816,740,728 [C] 13,912,000 108,645 559,323 [F] 5.87 [E] 464,338 [F] 6.92 $827 11,960
2007 $928,664,900 [C] 14,077,356 103,855 548,362 6.60 [E] 463,265 8.08 $984 12,183
2008 $996,152,425 14,018,765 100,808 552,993 7.11 466,709 8.63 $1,074 12,442
2009 $959,448,458 13,422,040 75,480 555,069 7.15 468,209 8.41 $1,015 12,071
2010 $944,131,898 12,717,171 116,703 557,779 7.42 469,923 8.53 $989 11,603
2011 $1,121,442,750 13,014,573 89,484 558,721 8.62 470,374 9.82 $1,163 11,841
2012 $1,144,278,862 12,778,781 186,804 560,099 8.95 473,820 10.29 $1,174 11,409
[A] Oregon Total excludes Sales for Resale and Other Electric Revenue.[B] 1 Megawatt hour (MWh) = 1,000 Kilowatt hours (kWh).[C] Beginning January 1, 2004, certain commercial and industrial customers have chosen to be served by Electricity Service Suppliers (ESSs) for their energy needs. These figures have been revised from prior reports to exclude revenues received by PacifiCorp from providing distribution services to ESS customers.[D] These figures exclude ESS customers.[E] These figures have been revised from prior reports to exclude Oregon revenue from ESS customers and MWh of ESS deliveries.[F] PacifiCorp's 2006 figures reflect duplicate customers, i.e., a customer with more than one meter.
Average [D]
7
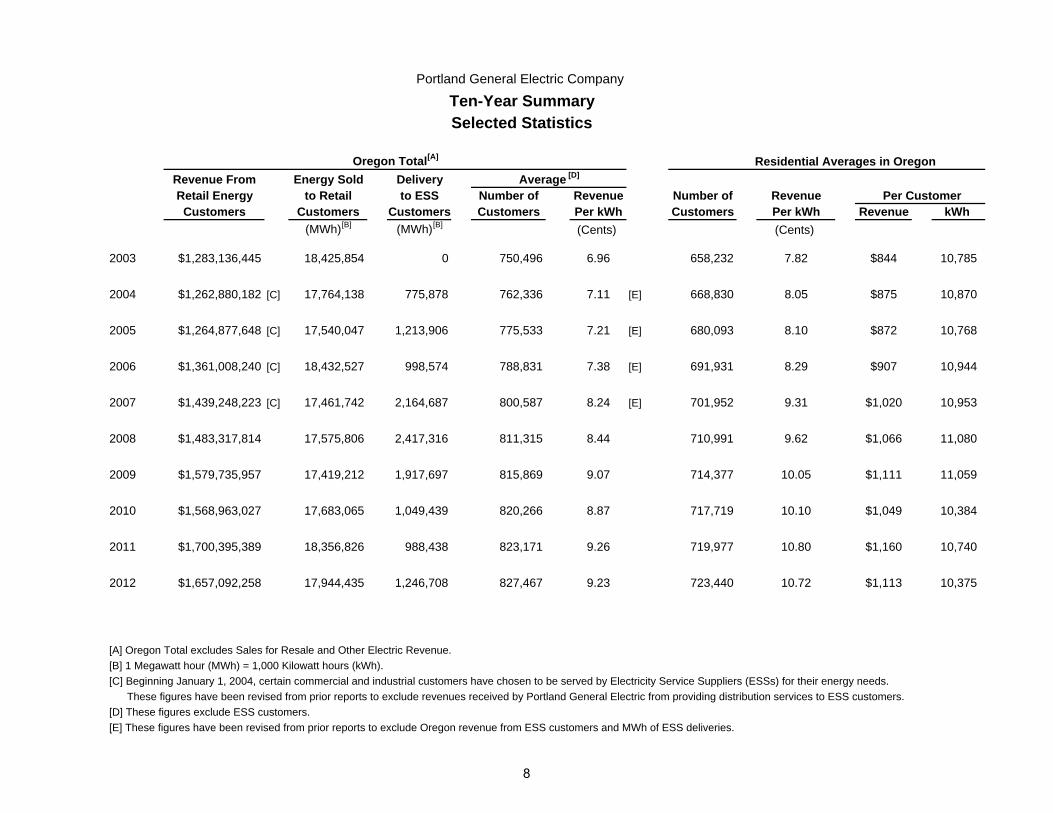
Portland General Electric Company
Ten-Year Summary Selected Statistics
Oregon Total[A] Residential Averages in OregonRevenue From Energy Sold DeliveryRetail Energy to Retail to ESS Number of Revenue Number of Revenue Per Customer
Customers Customers Customers Customers Per kWh Customers Per kWh Revenue kWh (MWh)[B] (MWh)[B] (Cents) (Cents)
2003 $1,283,136,445 18,425,854 0 750,496 6.96 658,232 7.82 $844 10,785
2004 $1,262,880,182 [C] 17,764,138 775,878 762,336 7.11 [E] 668,830 8.05 $875 10,870
2005 $1,264,877,648 [C] 17,540,047 1,213,906 775,533 7.21 [E] 680,093 8.10 $872 10,768
2006 $1,361,008,240 [C] 18,432,527 998,574 788,831 7.38 [E] 691,931 8.29 $907 10,944
2007 $1,439,248,223 [C] 17,461,742 2,164,687 800,587 8.24 [E] 701,952 9.31 $1,020 10,953
2008 $1,483,317,814 17,575,806 2,417,316 811,315 8.44 710,991 9.62 $1,066 11,080
2009 $1,579,735,957 17,419,212 1,917,697 815,869 9.07 714,377 10.05 $1,111 11,059
2010 $1,568,963,027 17,683,065 1,049,439 820,266 8.87 717,719 10.10 $1,049 10,384
2011 $1,700,395,389 18,356,826 988,438 823,171 9.26 719,977 10.80 $1,160 10,740
2012 $1,657,092,258 17,944,435 1,246,708 827,467 9.23 723,440 10.72 $1,113 10,375
[A] Oregon Total excludes Sales for Resale and Other Electric Revenue.[B] 1 Megawatt hour (MWh) = 1,000 Kilowatt hours (kWh).[C] Beginning January 1, 2004, certain commercial and industrial customers have chosen to be served by Electricity Service Suppliers (ESSs) for their energy needs. These figures have been revised from prior reports to exclude revenues received by Portland General Electric from providing distribution services to ESS customers.[D] These figures exclude ESS customers.[E] These figures have been revised from prior reports to exclude Oregon revenue from ESS customers and MWh of ESS deliveries.
Average [D]
8
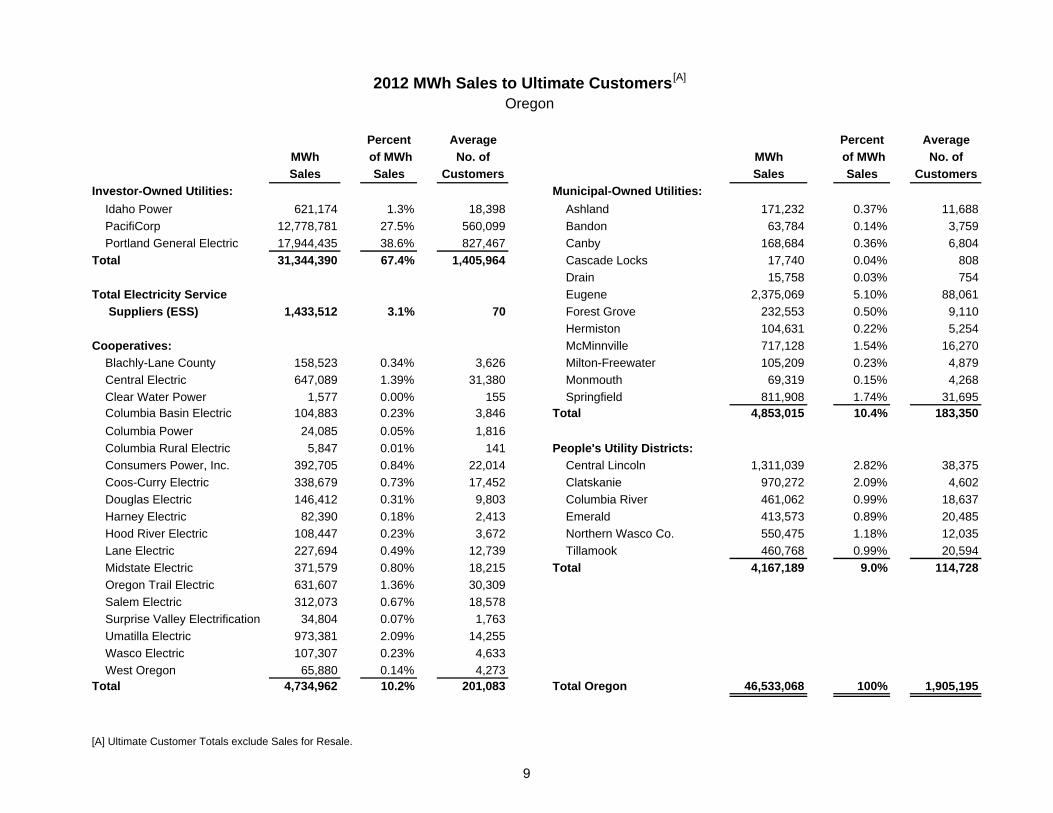
2012 MWh Sales to Ultimate Customers[A]
Oregon
Percent Average Percent AverageMWh of MWh No. of MWh of MWh No. ofSales Sales Customers Sales Sales Customers
Investor-Owned Utilities: Municipal-Owned Utilities: Idaho Power 621,174 1.3% 18,398 Ashland 171,232 0.37% 11,688 PacifiCorp 12,778,781 27.5% 560,099 Bandon 63,784 0.14% 3,759 Portland General Electric 17,944,435 38.6% 827,467 Canby 168,684 0.36% 6,804Total 31,344,390 67.4% 1,405,964 Cascade Locks 17,740 0.04% 808
Drain 15,758 0.03% 754Total Electricity Service Eugene 2,375,069 5.10% 88,061 Suppliers (ESS) 1,433,512 3.1% 70 Forest Grove 232,553 0.50% 9,110
Hermiston 104,631 0.22% 5,254Cooperatives: McMinnville 717,128 1.54% 16,270 Blachly-Lane County 158,523 0.34% 3,626 Milton-Freewater 105,209 0.23% 4,879 Central Electric 647,089 1.39% 31,380 Monmouth 69,319 0.15% 4,268 Clear Water Power 1,577 0.00% 155 Springfield 811,908 1.74% 31,695 Columbia Basin Electric 104,883 0.23% 3,846 Total 4,853,015 10.4% 183,350 Columbia Power 24,085 0.05% 1,816 Columbia Rural Electric 5,847 0.01% 141 People's Utility Districts: Consumers Power, Inc. 392,705 0.84% 22,014 Central Lincoln 1,311,039 2.82% 38,375 Coos-Curry Electric 338,679 0.73% 17,452 Clatskanie 970,272 2.09% 4,602 Douglas Electric 146,412 0.31% 9,803 Columbia River 461,062 0.99% 18,637 Harney Electric 82,390 0.18% 2,413 Emerald 413,573 0.89% 20,485 Hood River Electric 108,447 0.23% 3,672 Northern Wasco Co. 550,475 1.18% 12,035 Lane Electric 227,694 0.49% 12,739 Tillamook 460,768 0.99% 20,594 Midstate Electric 371,579 0.80% 18,215 Total 4,167,189 9.0% 114,728 Oregon Trail Electric 631,607 1.36% 30,309 Salem Electric 312,073 0.67% 18,578 Surprise Valley Electrification 34,804 0.07% 1,763 Umatilla Electric 973,381 2.09% 14,255 Wasco Electric 107,307 0.23% 4,633 West Oregon 65,880 0.14% 4,273Total 4,734,962 10.2% 201,083 Total Oregon 46,533,068 100% 1,905,195
[A] Ultimate Customer Totals exclude Sales for Resale.
9
$1,500
$2,000
$2,500
$3,000
$3,500
$4,000
Mill
ions
of D
olla
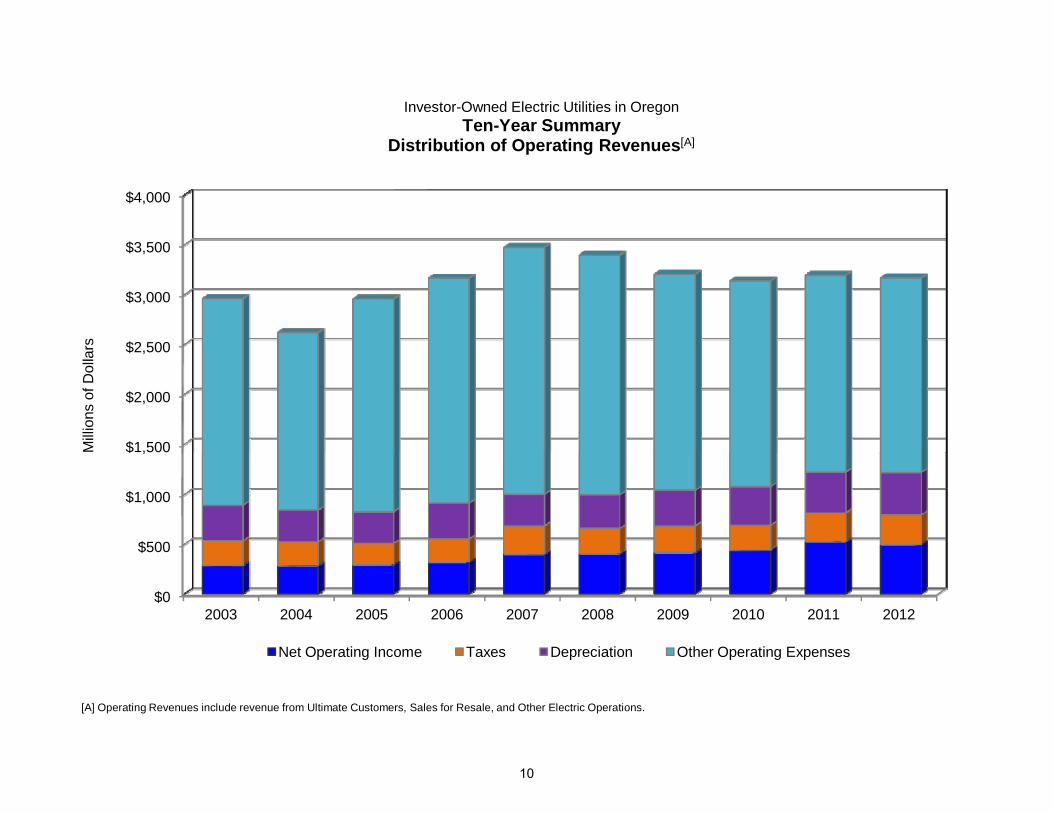
rsInvestor-Owned Electric Utilities in Oregon
Ten-Year SummaryDistribution of Operating Revenues[A]
$0
$500
$1,000
$ ,500
2003 2004 2005 2006 2007 2008 2009 2010 2011 2012
[A] Operating Revenues include revenue from Ultimate Customers, Sales for Resale, and Other Electric Operations.
Net Operating Income Taxes Depreciation Other Operating Expenses
10
25
30
35
40
45
50
55
In M
illio
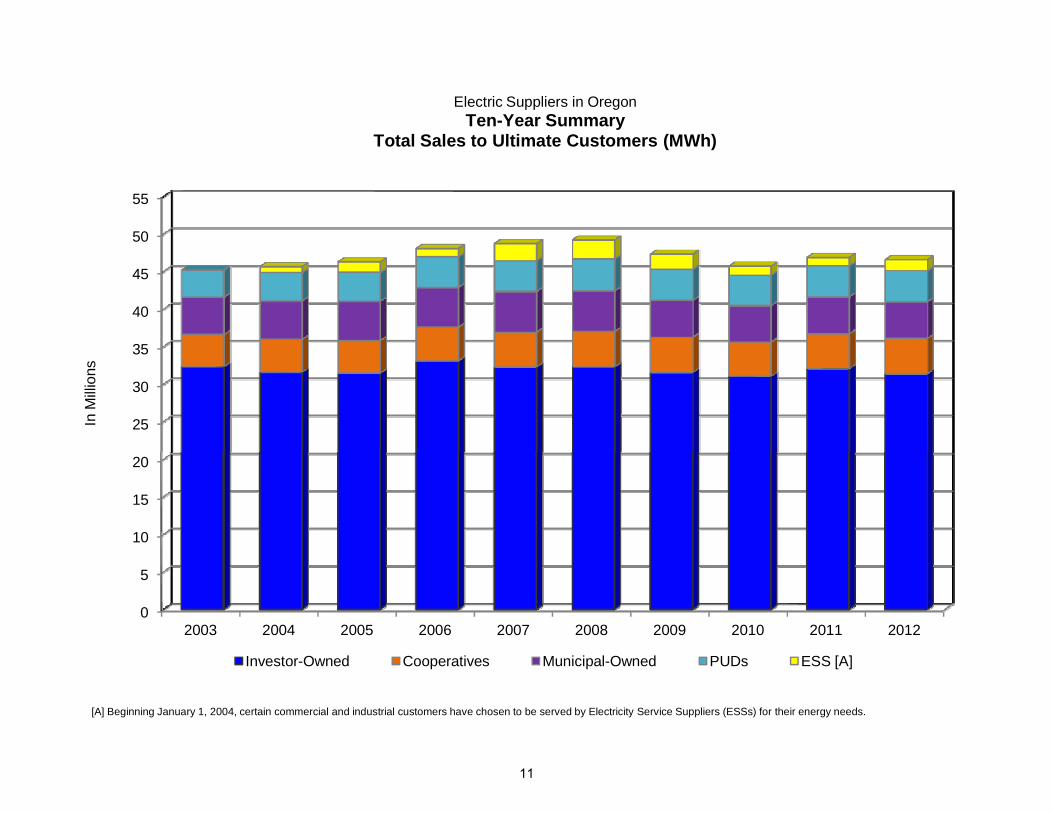
nsElectric Suppliers in Oregon
Ten-Year SummaryTotal Sales to Ultimate Customers (MWh)
0
5
10
15
20
2003 2004 2005 2006 2007 2008 2009 2010 2011 2012
Investor-Owned Cooperatives Municipal-Owned PUDs ESS [A]
[A] Beginning January 1, 2004, certain commercial and industrial customers have chosen to be served by Electricity Service Suppliers (ESSs) for their energy needs.
11
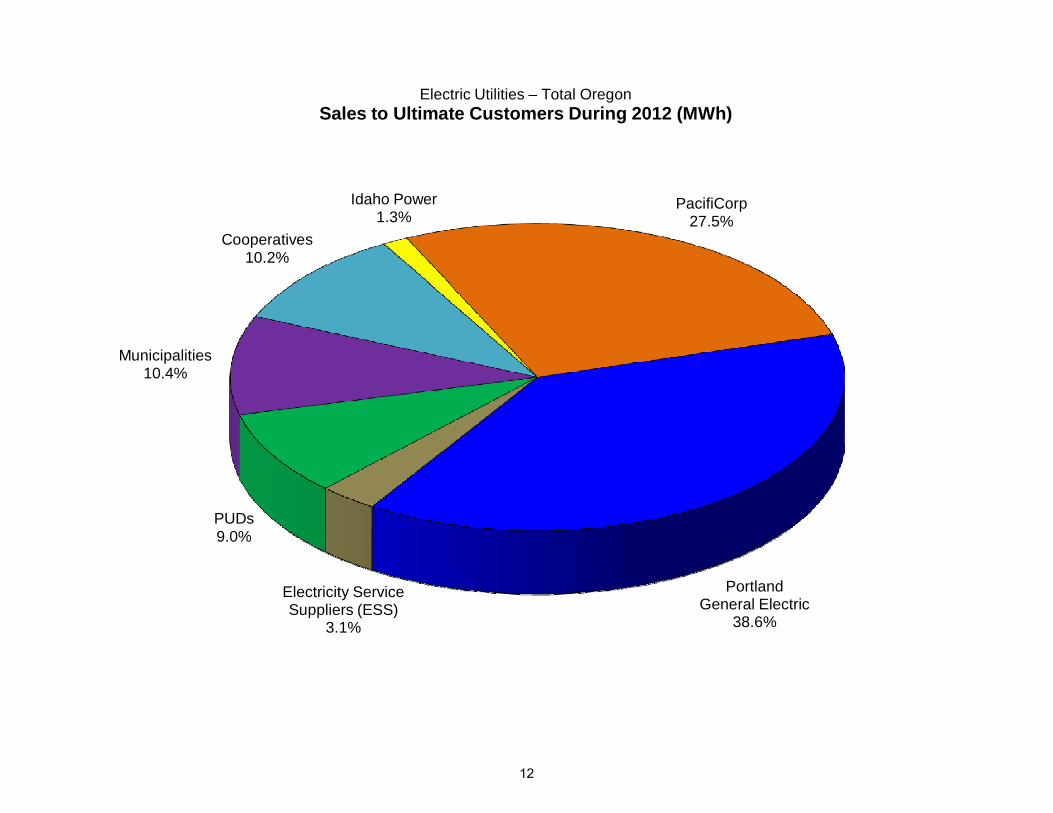
Idaho Power1.3%
PacifiCorp27.5%
Municipalities10.4%
Cooperatives10.2%
Electric Utilities – Total Oregon Sales to Ultimate Customers During 2012 (MWh)
Portland General Electric
38.6%
Electricity Service Suppliers (ESS)
3.1%
PUDs9.0%
12
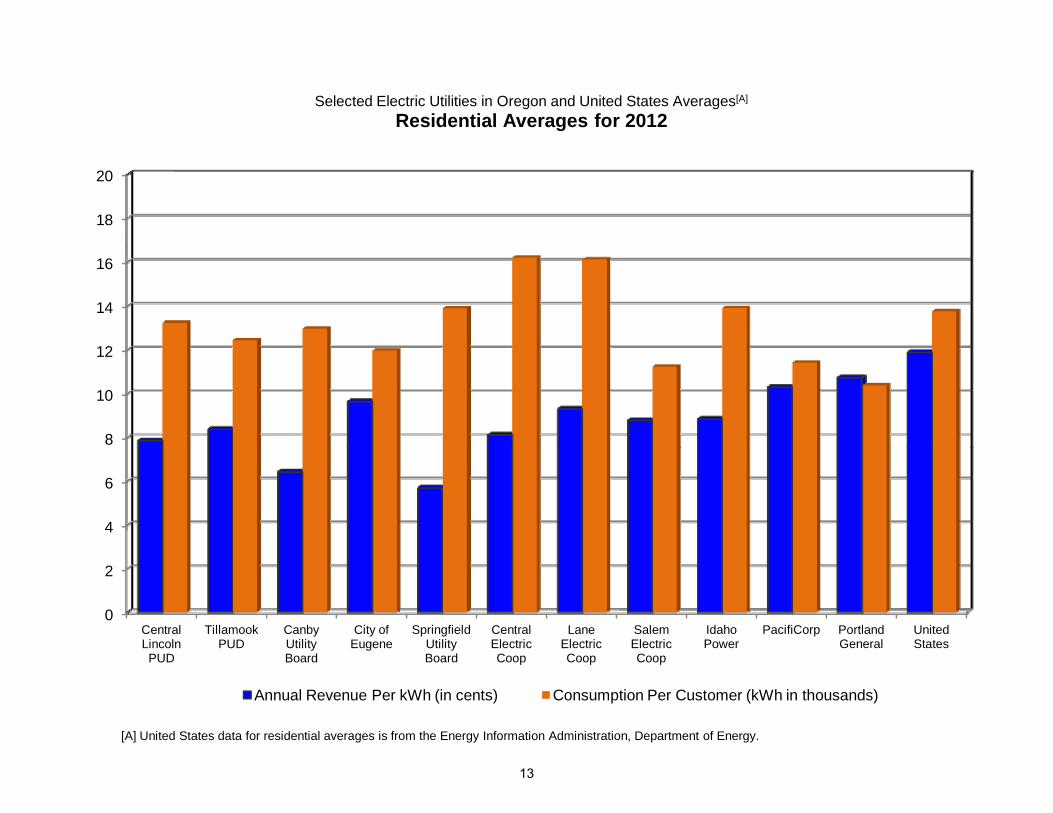
8
10
12
14
16
18
20
Selected Electric Utilities in Oregon and United States Averages[A]
Residential Averages for 2012
0
2
4
6
Central Lincoln PUD
Tillamook PUD
Canby Utility Board
City of Eugene
Springfield Utility Board
Central Electric Coop
Lane Electric Coop
Salem Electric Coop
Idaho Power
PacifiCorp Portland General
United States
[A] United States data for residential averages is from the Energy Information Administration, Department of Energy.
Annual Revenue Per kWh (in cents) Consumption Per Customer (kWh in thousands)
13

Idaho Power1.0%
PacifiCorp29.4%
Municipalities9.6%
Cooperatives10.6%
Electric Utilities – Total Oregon Customers in Oregon for 2012[A]
PortlandGeneral Electric
43.4%
PUDs6.0%
[A] For 2012, ESS customers are less than 1% of total Oregon customers.
14
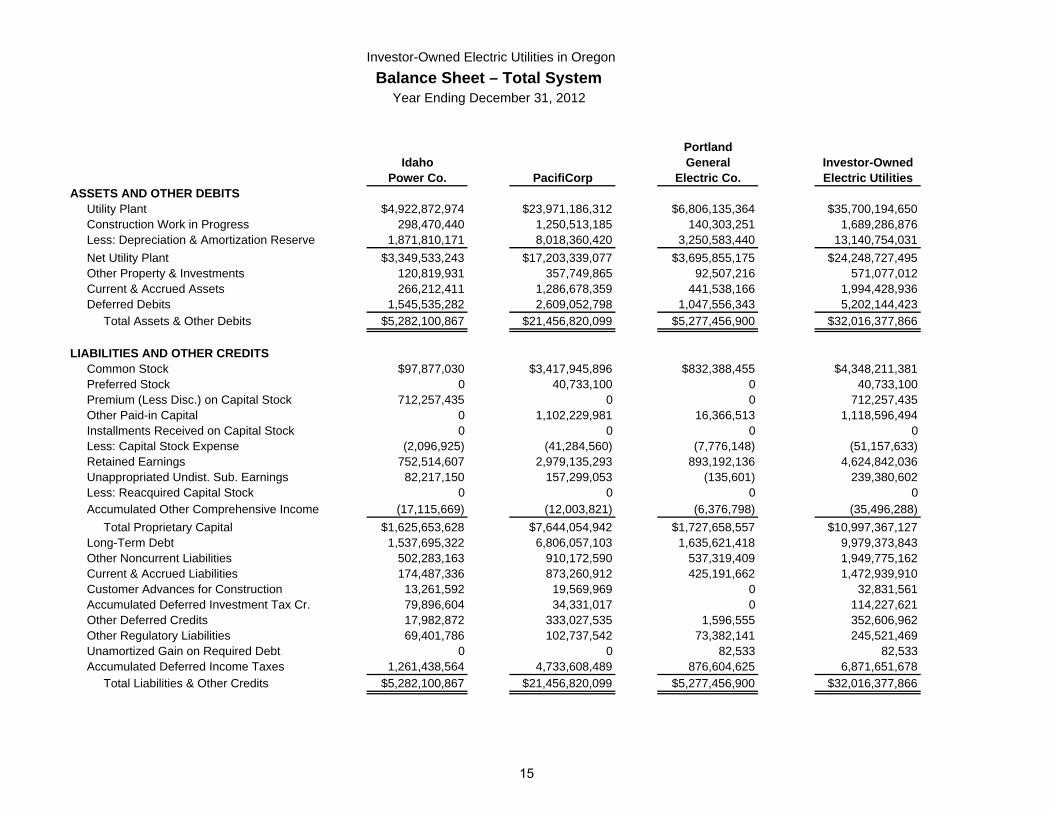
Investor-Owned Electric Utilities in OregonBalance Sheet – Total System
Year Ending December 31, 2012
PortlandIdaho General Investor-Owned
Power Co. PacifiCorp Electric Co. Electric UtilitiesASSETS AND OTHER DEBITS
Utility Plant $4,922,872,974 $23,971,186,312 $6,806,135,364 $35,700,194,650Construction Work in Progress 298,470,440 1,250,513,185 140,303,251 1,689,286,876Less: Depreciation & Amortization Reserve 1,871,810,171 8,018,360,420 3,250,583,440 13,140,754,031Net Utility Plant $3,349,533,243 $17,203,339,077 $3,695,855,175 $24,248,727,495Other Property & Investments 120,819,931 357,749,865 92,507,216 571,077,012Current & Accrued Assets 266,212,411 1,286,678,359 441,538,166 1,994,428,936Deferred Debits 1,545,535,282 2,609,052,798 1,047,556,343 5,202,144,423
Total Assets & Other Debits $5,282,100,867 $21,456,820,099 $5,277,456,900 $32,016,377,866
LIABILITIES AND OTHER CREDITSCommon Stock $97,877,030 $3,417,945,896 $832,388,455 $4,348,211,381Preferred Stock 0 40,733,100 0 40,733,100Premium (Less Disc.) on Capital Stock 712,257,435 0 0 712,257,435Other Paid-in Capital 0 1,102,229,981 16,366,513 1,118,596,494Installments Received on Capital Stock 0 0 0 0Less: Capital Stock Expense (2,096,925) (41,284,560) (7,776,148) (51,157,633)Retained Earnings 752,514,607 2,979,135,293 893,192,136 4,624,842,036Unappropriated Undist. Sub. Earnings 82,217,150 157,299,053 (135,601) 239,380,602Less: Reacquired Capital Stock 0 0 0 0Accumulated Other Comprehensive Income (17,115,669) (12,003,821) (6,376,798) (35,496,288)
Total Proprietary Capital $1,625,653,628 $7,644,054,942 $1,727,658,557 $10,997,367,127Long-Term Debt 1,537,695,322 6,806,057,103 1,635,621,418 9,979,373,843Other Noncurrent Liabilities 502,283,163 910,172,590 537,319,409 1,949,775,162Current & Accrued Liabilities 174,487,336 873,260,912 425,191,662 1,472,939,910Customer Advances for Construction 13,261,592 19,569,969 0 32,831,561Accumulated Deferred Investment Tax Cr. 79,896,604 34,331,017 0 114,227,621Other Deferred Credits 17,982,872 333,027,535 1,596,555 352,606,962Other Regulatory Liabilities 69,401,786 102,737,542 73,382,141 245,521,469Unamortized Gain on Required Debt 0 0 82,533 82,533Accumulated Deferred Income Taxes 1,261,438,564 4,733,608,489 876,604,625 6,871,651,678
Total Liabilities & Other Credits $5,282,100,867 $21,456,820,099 $5,277,456,900 $32,016,377,866
15
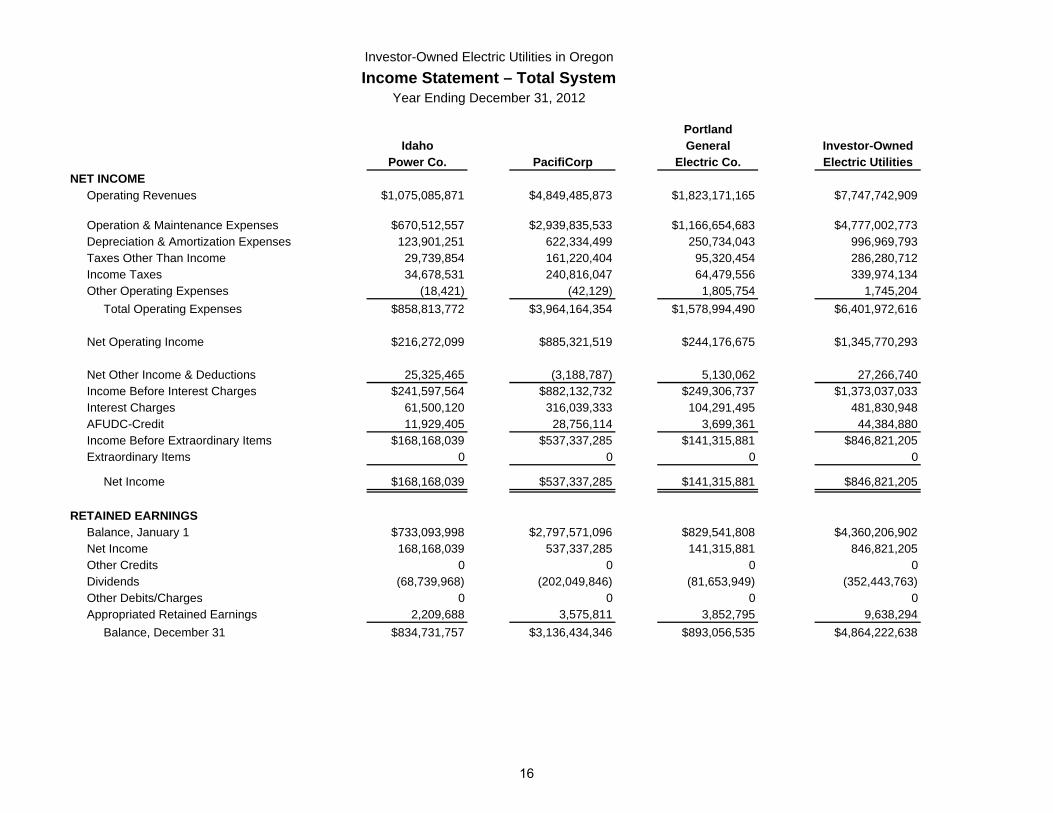
Investor-Owned Electric Utilities in OregonIncome Statement – Total System
Year Ending December 31, 2012
PortlandIdaho General Investor-Owned
Power Co. PacifiCorp Electric Co. Electric UtilitiesNET INCOME
Operating Revenues $1,075,085,871 $4,849,485,873 $1,823,171,165 $7,747,742,909
Operation & Maintenance Expenses $670,512,557 $2,939,835,533 $1,166,654,683 $4,777,002,773Depreciation & Amortization Expenses 123,901,251 622,334,499 250,734,043 996,969,793Taxes Other Than Income 29,739,854 161,220,404 95,320,454 286,280,712Income Taxes 34,678,531 240,816,047 64,479,556 339,974,134Other Operating Expenses (18,421) (42,129) 1,805,754 1,745,204
Total Operating Expenses $858,813,772 $3,964,164,354 $1,578,994,490 $6,401,972,616
Net Operating Income $216,272,099 $885,321,519 $244,176,675 $1,345,770,293
Net Other Income & Deductions 25,325,465 (3,188,787) 5,130,062 27,266,740Income Before Interest Charges $241,597,564 $882,132,732 $249,306,737 $1,373,037,033Interest Charges 61,500,120 316,039,333 104,291,495 481,830,948AFUDC-Credit 11,929,405 28,756,114 3,699,361 44,384,880Income Before Extraordinary Items $168,168,039 $537,337,285 $141,315,881 $846,821,205Extraordinary Items 0 0 0 0
Net Income $168,168,039 $537,337,285 $141,315,881 $846,821,205
RETAINED EARNINGS Balance, January 1 $733,093,998 $2,797,571,096 $829,541,808 $4,360,206,902Net Income 168,168,039 537,337,285 141,315,881 846,821,205Other Credits 0 0 0 0Dividends (68,739,968) (202,049,846) (81,653,949) (352,443,763)Other Debits/Charges 0 0 0 0Appropriated Retained Earnings 2,209,688 3,575,811 3,852,795 9,638,294
Balance, December 31 $834,731,757 $3,136,434,346 $893,056,535 $4,864,222,638
16
PortlandGeneral Investor-Owned
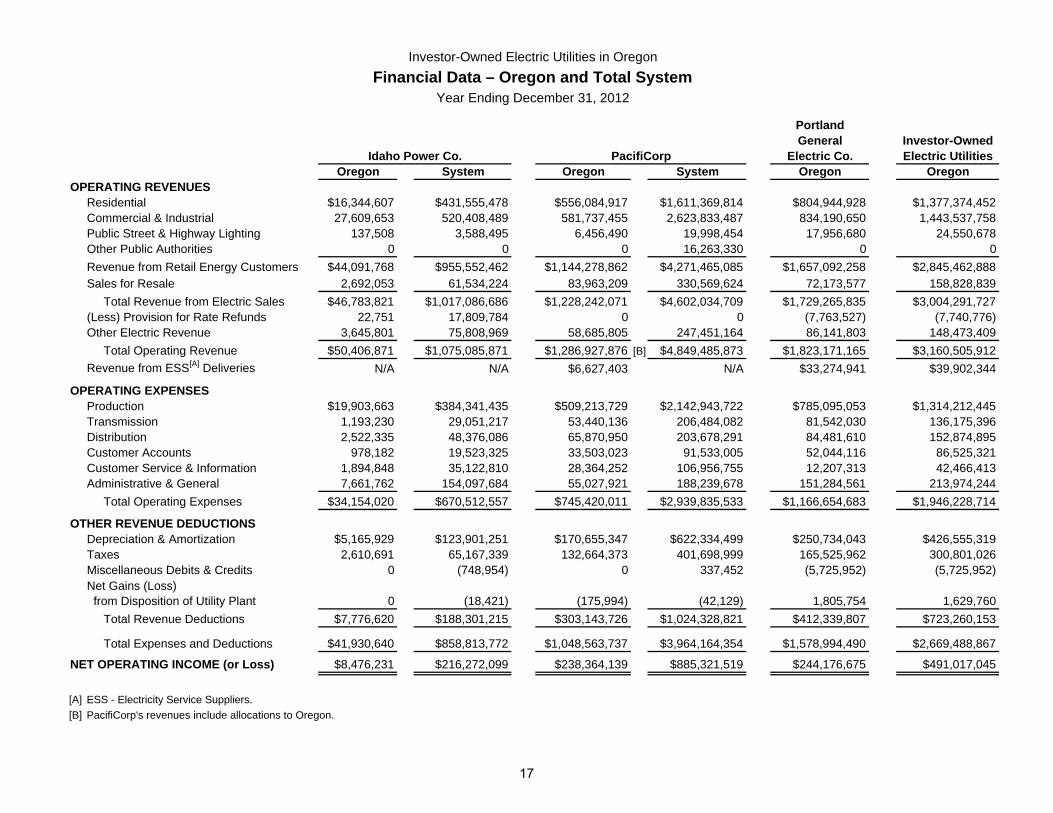
Idaho Power Co. PacifiCorp Electric Co. Electric UtilitiesOregon System Oregon System Oregon Oregon
OPERATING REVENUESResidential $16,344,607 $431,555,478 $556,084,917 $1,611,369,814 $804,944,928 $1,377,374,452Commercial & Industrial 27,609,653 520,408,489 581,737,455 2,623,833,487 834,190,650 1,443,537,758Public Street & Highway Lighting 137,508 3,588,495 6,456,490 19,998,454 17,956,680 24,550,678Other Public Authorities 0 0 0 16,263,330 0 0Revenue from Retail Energy Customers $44,091,768 $955,552,462 $1,144,278,862 $4,271,465,085 $1,657,092,258 $2,845,462,888Sales for Resale 2,692,053 61,534,224 83,963,209 330,569,624 72,173,577 158,828,839
Total Revenue from Electric Sales $46,783,821 $1,017,086,686 $1,228,242,071 $4,602,034,709 $1,729,265,835 $3,004,291,727(Less) Provision for Rate Refunds 22,751 17,809,784 0 0 (7,763,527) (7,740,776)Other Electric Revenue 3,645,801 75,808,969 58,685,805 247,451,164 86,141,803 148,473,409
Total Operating Revenue $50,406,871 $1,075,085,871 $1,286,927,876 [B] $4,849,485,873 $1,823,171,165 $3,160,505,912Revenue from ESS[A] Deliveries N/A N/A $6,627,403 N/A $33,274,941 $39,902,344
OPERATING EXPENSESProduction $19,903,663 $384,341,435 $509,213,729 $2,142,943,722 $785,095,053 $1,314,212,445Transmission 1,193,230 29,051,217 53,440,136 206,484,082 81,542,030 136,175,396Distribution 2,522,335 48,376,086 65,870,950 203,678,291 84,481,610 152,874,895Customer Accounts 978,182 19,523,325 33,503,023 91,533,005 52,044,116 86,525,321Customer Service & Information 1,894,848 35,122,810 28,364,252 106,956,755 12,207,313 42,466,413Administrative & General 7,661,762 154,097,684 55,027,921 188,239,678 151,284,561 213,974,244
Total Operating Expenses $34,154,020 $670,512,557 $745,420,011 $2,939,835,533 $1,166,654,683 $1,946,228,714 OTHER REVENUE DEDUCTIONS
Depreciation & Amortization $5,165,929 $123,901,251 $170,655,347 $622,334,499 $250,734,043 $426,555,319Taxes 2,610,691 65,167,339 132,664,373 401,698,999 165,525,962 300,801,026Miscellaneous Debits & Credits 0 (748,954) 0 337,452 (5,725,952) (5,725,952)Net Gains (Loss) from Disposition of Utility Plant 0 (18,421) (175,994) (42,129) 1,805,754 1,629,760
Total Revenue Deductions $7,776,620 $188,301,215 $303,143,726 $1,024,328,821 $412,339,807 $723,260,153
Total Expenses and Deductions $41,930,640 $858,813,772 $1,048,563,737 $3,964,164,354 $1,578,994,490 $2,669,488,867 NET OPERATING INCOME (or Loss) $8,476,231 $216,272,099 $238,364,139 $885,321,519 $244,176,675 $491,017,045
[A] ESS - Electricity Service Suppliers.[B] PacifiCorp's revenues include allocations to Oregon.
Financial Data – Oregon and Total SystemInvestor-Owned Electric Utilities in Oregon
Year Ending December 31, 2012
17
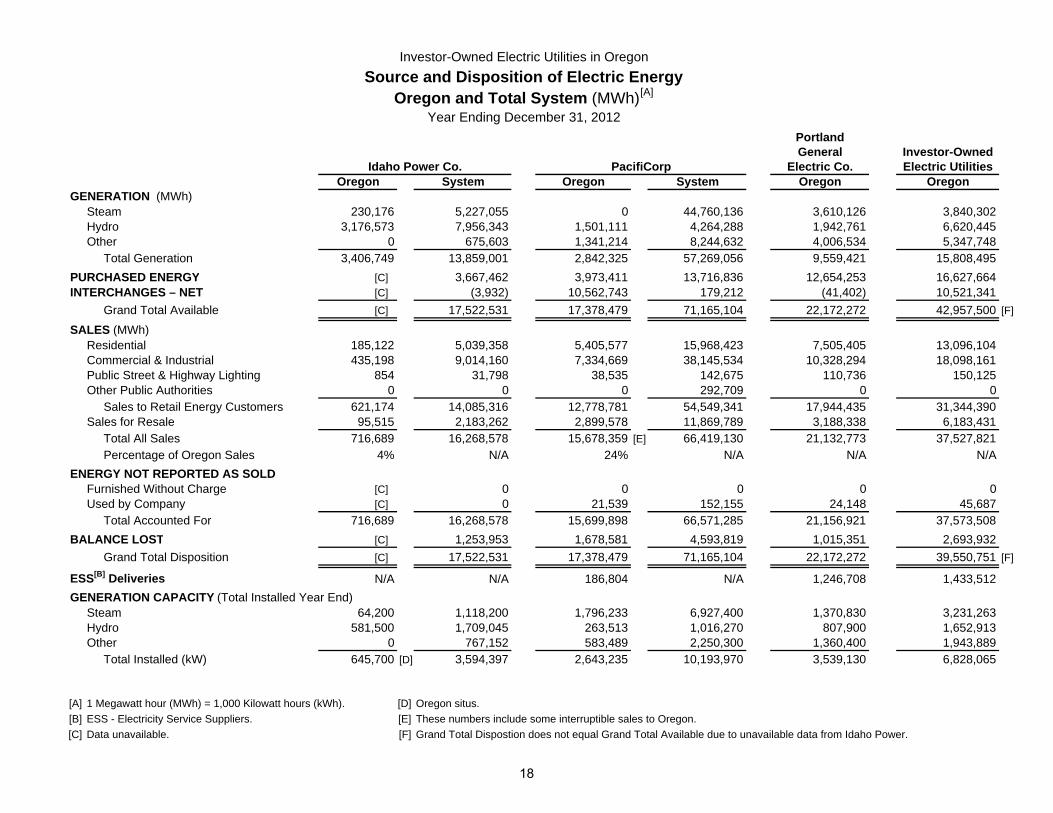
Investor-Owned Electric Utilities in OregonSource and Disposition of Electric Energy
Oregon and Total System (MWh)[A]
Year Ending December 31, 2012 PortlandGeneral Investor-Owned
Idaho Power Co. PacifiCorp Electric Co. Electric UtilitiesOregon System Oregon System Oregon Oregon
GENERATION (MWh)Steam 230,176 5,227,055 0 44,760,136 3,610,126 3,840,302Hydro 3,176,573 7,956,343 1,501,111 4,264,288 1,942,761 6,620,445Other 0 675,603 1,341,214 8,244,632 4,006,534 5,347,748
Total Generation 3,406,749 13,859,001 2,842,325 57,269,056 9,559,421 15,808,495PURCHASED ENERGY [C] 3,667,462 3,973,411 13,716,836 12,654,253 16,627,664INTERCHANGES – NET [C] (3,932) 10,562,743 179,212 (41,402) 10,521,341
Grand Total Available [C] 17,522,531 17,378,479 71,165,104 22,172,272 42,957,500 [F]
SALES (MWh)Residential 185,122 5,039,358 5,405,577 15,968,423 7,505,405 13,096,104Commercial & Industrial 435,198 9,014,160 7,334,669 38,145,534 10,328,294 18,098,161Public Street & Highway Lighting 854 31,798 38,535 142,675 110,736 150,125Other Public Authorities 0 0 0 292,709 0 0
Sales to Retail Energy Customers 621,174 14,085,316 12,778,781 54,549,341 17,944,435 31,344,390Sales for Resale 95,515 2,183,262 2,899,578 11,869,789 3,188,338 6,183,431
Total All Sales 716,689 16,268,578 15,678,359 [E] 66,419,130 21,132,773 37,527,821Percentage of Oregon Sales 4% N/A 24% N/A N/A N/A
ENERGY NOT REPORTED AS SOLDFurnished Without Charge [C] 0 0 0 0 0Used by Company [C] 0 21,539 152,155 24,148 45,687
Total Accounted For 716,689 16,268,578 15,699,898 66,571,285 21,156,921 37,573,508BALANCE LOST [C] 1,253,953 1,678,581 4,593,819 1,015,351 2,693,932
Grand Total Disposition [C] 17,522,531 17,378,479 71,165,104 22,172,272 39,550,751 [F]
ESS[B] Deliveries N/A N/A 186,804 N/A 1,246,708 1,433,512GENERATION CAPACITY (Total Installed Year End)
Steam 64,200 1,118,200 1,796,233 6,927,400 1,370,830 3,231,263Hydro 581,500 1,709,045 263,513 1,016,270 807,900 1,652,913Other 0 767,152 583,489 2,250,300 1,360,400 1,943,889
Total Installed (kW) 645,700 [D] 3,594,397 2,643,235 10,193,970 3,539,130 6,828,065
[A] 1 Megawatt hour (MWh) = 1,000 Kilowatt hours (kWh). [D] Oregon situs.[B] ESS - Electricity Service Suppliers. [E] These numbers include some interruptible sales to Oregon.[C] Data unavailable. [F] Grand Total Dispostion does not equal Grand Total Available due to unavailable data from Idaho Power.
18
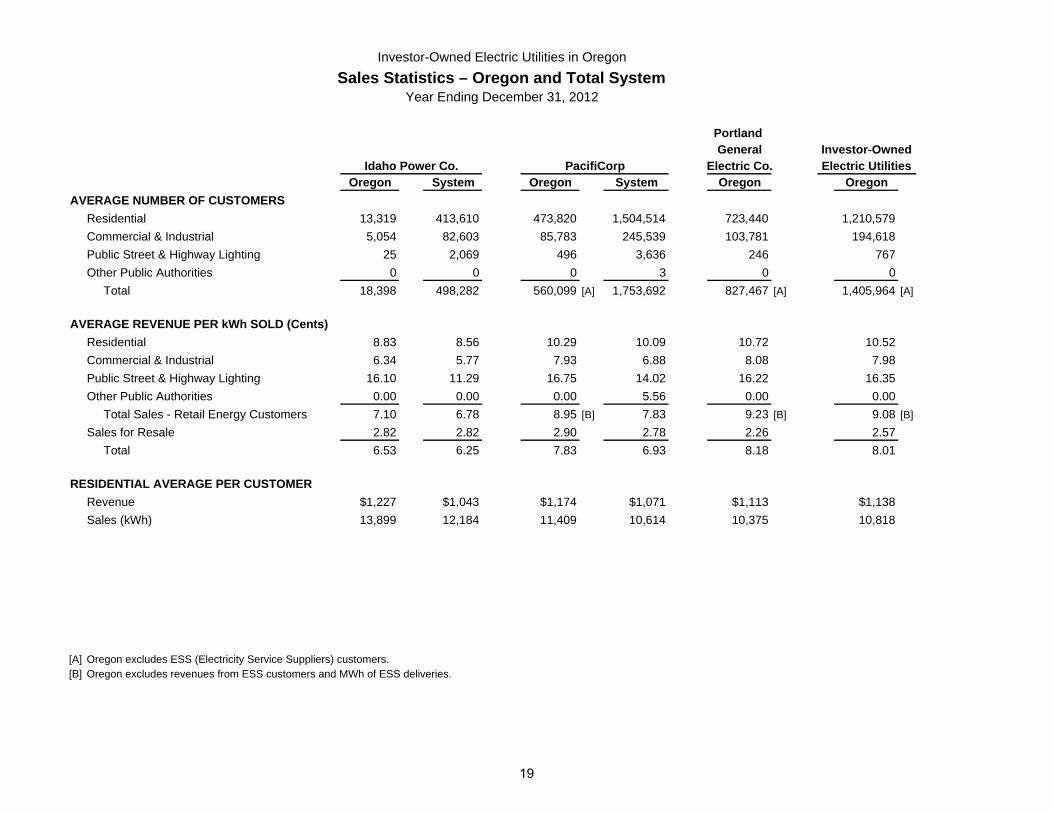
Investor-Owned Electric Utilities in OregonSales Statistics – Oregon and Total System
Year Ending December 31, 2012
Portland General Investor-Owned
Idaho Power Co. PacifiCorp Electric Co. Electric UtilitiesOregon System Oregon System Oregon Oregon
AVERAGE NUMBER OF CUSTOMERSResidential 13,319 413,610 473,820 1,504,514 723,440 1,210,579Commercial & Industrial 5,054 82,603 85,783 245,539 103,781 194,618Public Street & Highway Lighting 25 2,069 496 3,636 246 767Other Public Authorities 0 0 0 3 0 0
Total 18,398 498,282 560,099 [A] 1,753,692 827,467 [A] 1,405,964 [A]
AVERAGE REVENUE PER kWh SOLD (Cents)Residential 8.83 8.56 10.29 10.09 10.72 10.52Commercial & Industrial 6.34 5.77 7.93 6.88 8.08 7.98Public Street & Highway Lighting 16.10 11.29 16.75 14.02 16.22 16.35Other Public Authorities 0.00 0.00 0.00 5.56 0.00 0.00
Total Sales - Retail Energy Customers 7.10 6.78 8.95 [B] 7.83 9.23 [B] 9.08 [B]
Sales for Resale 2.82 2.82 2.90 2.78 2.26 2.57Total 6.53 6.25 7.83 6.93 8.18 8.01
RESIDENTIAL AVERAGE PER CUSTOMERRevenue $1,227 $1,043 $1,174 $1,071 $1,113 $1,138Sales (kWh) 13,899 12,184 11,409 10,614 10,375 10,818
[A] Oregon excludes ESS (Electricity Service Suppliers) customers.[B] Oregon excludes revenues from ESS customers and MWh of ESS deliveries.
19
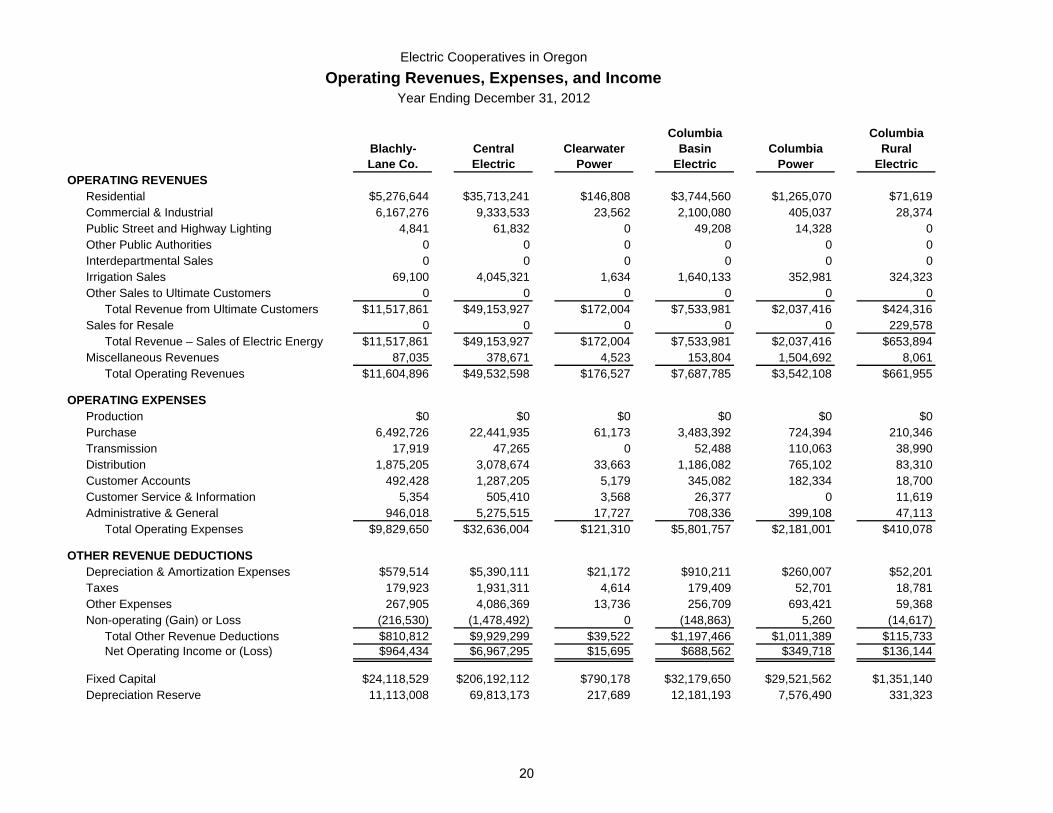
Electric Cooperatives in OregonOperating Revenues, Expenses, and Income
Year Ending December 31, 2012
Columbia ColumbiaBlachly- Central Clearwater Basin Columbia RuralLane Co. Electric Power Electric Power Electric
OPERATING REVENUESResidential $5,276,644 $35,713,241 $146,808 $3,744,560 $1,265,070 $71,619 Commercial & Industrial 6,167,276 9,333,533 23,562 2,100,080 405,037 28,374 Public Street and Highway Lighting 4,841 61,832 0 49,208 14,328 0 Other Public Authorities 0 0 0 0 0 0 Interdepartmental Sales 0 0 0 0 0 0 Irrigation Sales 69,100 4,045,321 1,634 1,640,133 352,981 324,323 Other Sales to Ultimate Customers 0 0 0 0 0 0
Total Revenue from Ultimate Customers $11,517,861 $49,153,927 $172,004 $7,533,981 $2,037,416 $424,316 Sales for Resale 0 0 0 0 0 229,578
Total Revenue – Sales of Electric Energy $11,517,861 $49,153,927 $172,004 $7,533,981 $2,037,416 $653,894 Miscellaneous Revenues 87,035 378,671 4,523 153,804 1,504,692 8,061
Total Operating Revenues $11,604,896 $49,532,598 $176,527 $7,687,785 $3,542,108 $661,955
OPERATING EXPENSESProduction $0 $0 $0 $0 $0 $0Purchase 6,492,726 22,441,935 61,173 3,483,392 724,394 210,346Transmission 17,919 47,265 0 52,488 110,063 38,990Distribution 1,875,205 3,078,674 33,663 1,186,082 765,102 83,310Customer Accounts 492,428 1,287,205 5,179 345,082 182,334 18,700Customer Service & Information 5,354 505,410 3,568 26,377 0 11,619Administrative & General 946,018 5,275,515 17,727 708,336 399,108 47,113
Total Operating Expenses $9,829,650 $32,636,004 $121,310 $5,801,757 $2,181,001 $410,078
OTHER REVENUE DEDUCTIONSDepreciation & Amortization Expenses $579,514 $5,390,111 $21,172 $910,211 $260,007 $52,201Taxes 179,923 1,931,311 4,614 179,409 52,701 18,781Other Expenses 267,905 4,086,369 13,736 256,709 693,421 59,368Non-operating (Gain) or Loss (216,530) (1,478,492) 0 (148,863) 5,260 (14,617)
Total Other Revenue Deductions $810,812 $9,929,299 $39,522 $1,197,466 $1,011,389 $115,733Net Operating Income or (Loss) $964,434 $6,967,295 $15,695 $688,562 $349,718 $136,144
Fixed Capital $24,118,529 $206,192,112 $790,178 $32,179,650 $29,521,562 $1,351,140Depreciation Reserve 11,113,008 69,813,173 217,689 12,181,193 7,576,490 331,323
20
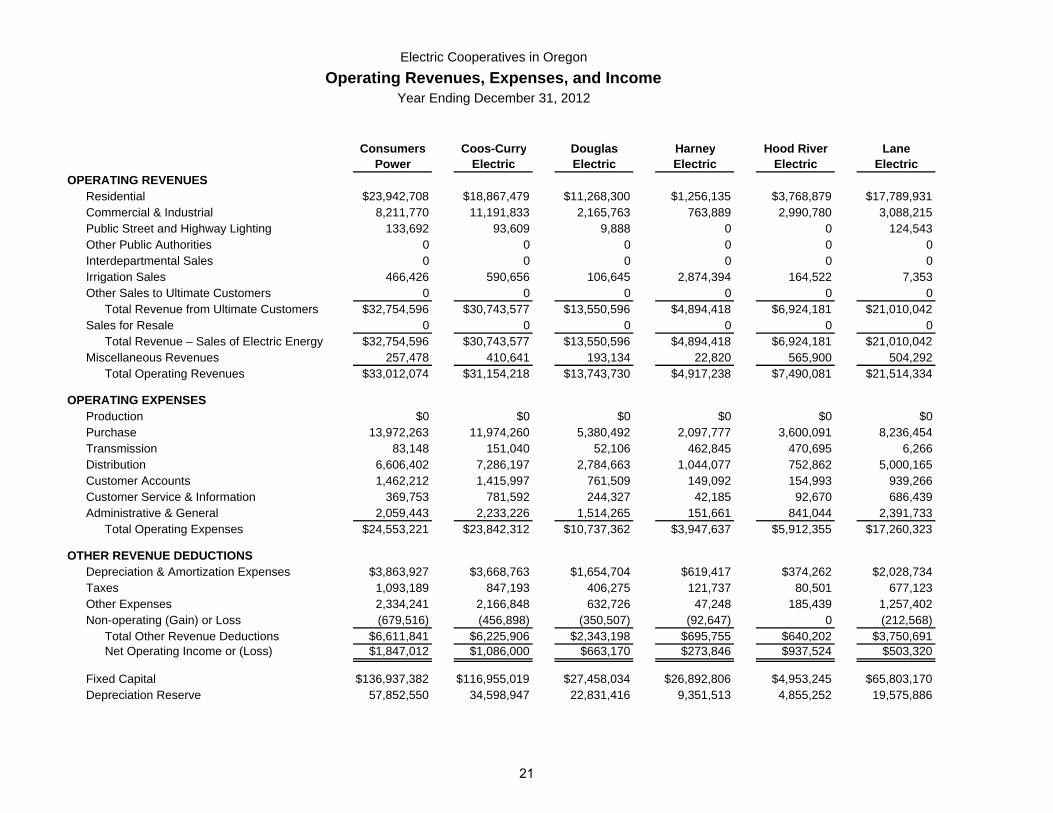
Electric Cooperatives in OregonOperating Revenues, Expenses, and Income
Year Ending December 31, 2012
Consumers Coos-Curry Douglas Harney Hood River LanePower Electric Electric Electric Electric Electric
OPERATING REVENUESResidential $23,942,708 $18,867,479 $11,268,300 $1,256,135 $3,768,879 $17,789,931 Commercial & Industrial 8,211,770 11,191,833 2,165,763 763,889 2,990,780 3,088,215 Public Street and Highway Lighting 133,692 93,609 9,888 0 0 124,543 Other Public Authorities 0 0 0 0 0 0 Interdepartmental Sales 0 0 0 0 0 0 Irrigation Sales 466,426 590,656 106,645 2,874,394 164,522 7,353 Other Sales to Ultimate Customers 0 0 0 0 0 0
Total Revenue from Ultimate Customers $32,754,596 $30,743,577 $13,550,596 $4,894,418 $6,924,181 $21,010,042 Sales for Resale 0 0 0 0 0 0
Total Revenue – Sales of Electric Energy $32,754,596 $30,743,577 $13,550,596 $4,894,418 $6,924,181 $21,010,042 Miscellaneous Revenues 257,478 410,641 193,134 22,820 565,900 504,292
Total Operating Revenues $33,012,074 $31,154,218 $13,743,730 $4,917,238 $7,490,081 $21,514,334
OPERATING EXPENSESProduction $0 $0 $0 $0 $0 $0Purchase 13,972,263 11,974,260 5,380,492 2,097,777 3,600,091 8,236,454Transmission 83,148 151,040 52,106 462,845 470,695 6,266Distribution 6,606,402 7,286,197 2,784,663 1,044,077 752,862 5,000,165Customer Accounts 1,462,212 1,415,997 761,509 149,092 154,993 939,266Customer Service & Information 369,753 781,592 244,327 42,185 92,670 686,439Administrative & General 2,059,443 2,233,226 1,514,265 151,661 841,044 2,391,733
Total Operating Expenses $24,553,221 $23,842,312 $10,737,362 $3,947,637 $5,912,355 $17,260,323
OTHER REVENUE DEDUCTIONSDepreciation & Amortization Expenses $3,863,927 $3,668,763 $1,654,704 $619,417 $374,262 $2,028,734Taxes 1,093,189 847,193 406,275 121,737 80,501 677,123Other Expenses 2,334,241 2,166,848 632,726 47,248 185,439 1,257,402Non-operating (Gain) or Loss (679,516) (456,898) (350,507) (92,647) 0 (212,568)
Total Other Revenue Deductions $6,611,841 $6,225,906 $2,343,198 $695,755 $640,202 $3,750,691Net Operating Income or (Loss) $1,847,012 $1,086,000 $663,170 $273,846 $937,524 $503,320
Fixed Capital $136,937,382 $116,955,019 $27,458,034 $26,892,806 $4,953,245 $65,803,170Depreciation Reserve 57,852,550 34,598,947 22,831,416 9,351,513 4,855,252 19,575,886
21
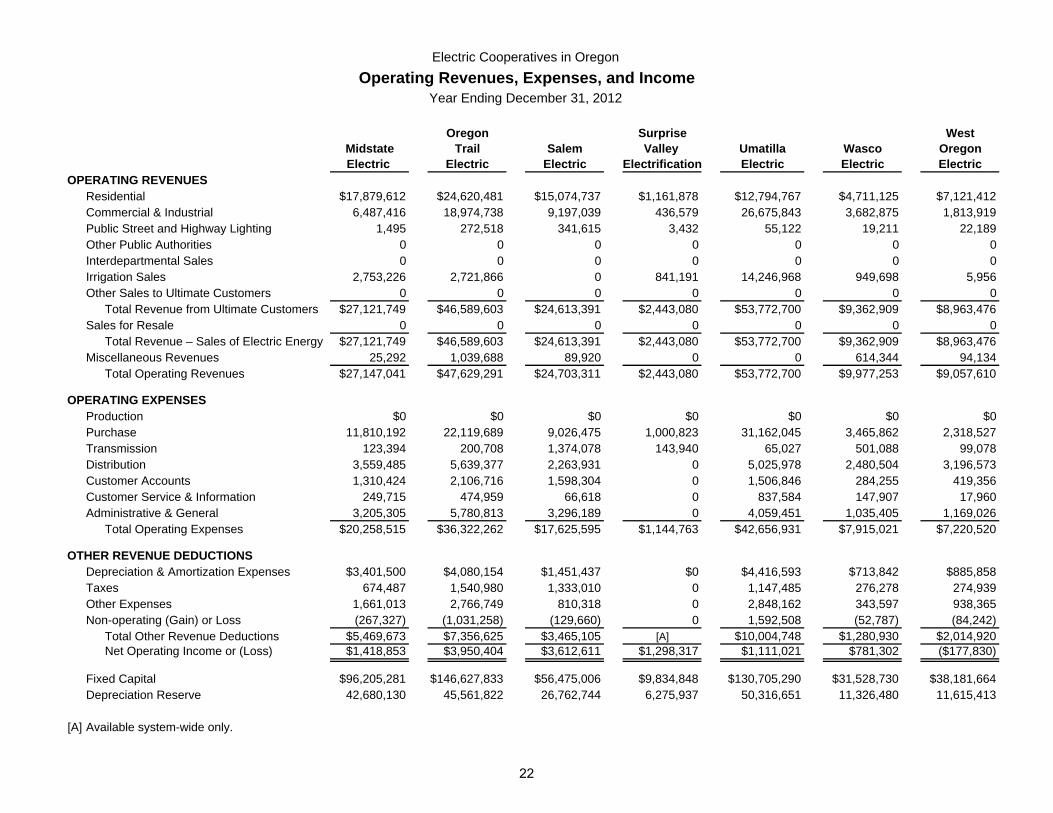
Electric Cooperatives in Oregon Operating Revenues, Expenses, and Income
Year Ending December 31, 2012
Oregon Surprise WestMidstate Trail Salem Valley Umatilla Wasco OregonElectric Electric Electric Electrification Electric Electric Electric
OPERATING REVENUESResidential $17,879,612 $24,620,481 $15,074,737 $1,161,878 $12,794,767 $4,711,125 $7,121,412Commercial & Industrial 6,487,416 18,974,738 9,197,039 436,579 26,675,843 3,682,875 1,813,919Public Street and Highway Lighting 1,495 272,518 341,615 3,432 55,122 19,211 22,189Other Public Authorities 0 0 0 0 0 0 0Interdepartmental Sales 0 0 0 0 0 0 0Irrigation Sales 2,753,226 2,721,866 0 841,191 14,246,968 949,698 5,956Other Sales to Ultimate Customers 0 0 0 0 0 0 0
Total Revenue from Ultimate Customers $27,121,749 $46,589,603 $24,613,391 $2,443,080 $53,772,700 $9,362,909 $8,963,476Sales for Resale 0 0 0 0 0 0 0
Total Revenue – Sales of Electric Energy $27,121,749 $46,589,603 $24,613,391 $2,443,080 $53,772,700 $9,362,909 $8,963,476Miscellaneous Revenues 25,292 1,039,688 89,920 0 0 614,344 94,134
Total Operating Revenues $27,147,041 $47,629,291 $24,703,311 $2,443,080 $53,772,700 $9,977,253 $9,057,610
OPERATING EXPENSESProduction $0 $0 $0 $0 $0 $0 $0Purchase 11,810,192 22,119,689 9,026,475 1,000,823 31,162,045 3,465,862 2,318,527Transmission 123,394 200,708 1,374,078 143,940 65,027 501,088 99,078Distribution 3,559,485 5,639,377 2,263,931 0 5,025,978 2,480,504 3,196,573Customer Accounts 1,310,424 2,106,716 1,598,304 0 1,506,846 284,255 419,356Customer Service & Information 249,715 474,959 66,618 0 837,584 147,907 17,960Administrative & General 3,205,305 5,780,813 3,296,189 0 4,059,451 1,035,405 1,169,026
Total Operating Expenses $20,258,515 $36,322,262 $17,625,595 $1,144,763 $42,656,931 $7,915,021 $7,220,520
OTHER REVENUE DEDUCTIONSDepreciation & Amortization Expenses $3,401,500 $4,080,154 $1,451,437 $0 $4,416,593 $713,842 $885,858Taxes 674,487 1,540,980 1,333,010 0 1,147,485 276,278 274,939Other Expenses 1,661,013 2,766,749 810,318 0 2,848,162 343,597 938,365Non-operating (Gain) or Loss (267,327) (1,031,258) (129,660) 0 1,592,508 (52,787) (84,242)
Total Other Revenue Deductions $5,469,673 $7,356,625 $3,465,105 [A] $10,004,748 $1,280,930 $2,014,920Net Operating Income or (Loss) $1,418,853 $3,950,404 $3,612,611 $1,298,317 $1,111,021 $781,302 ($177,830)
Fixed Capital $96,205,281 $146,627,833 $56,475,006 $9,834,848 $130,705,290 $31,528,730 $38,181,664Depreciation Reserve 42,680,130 45,561,822 26,762,744 6,275,937 50,316,651 11,326,480 11,615,413
[A] Available system-wide only.
22
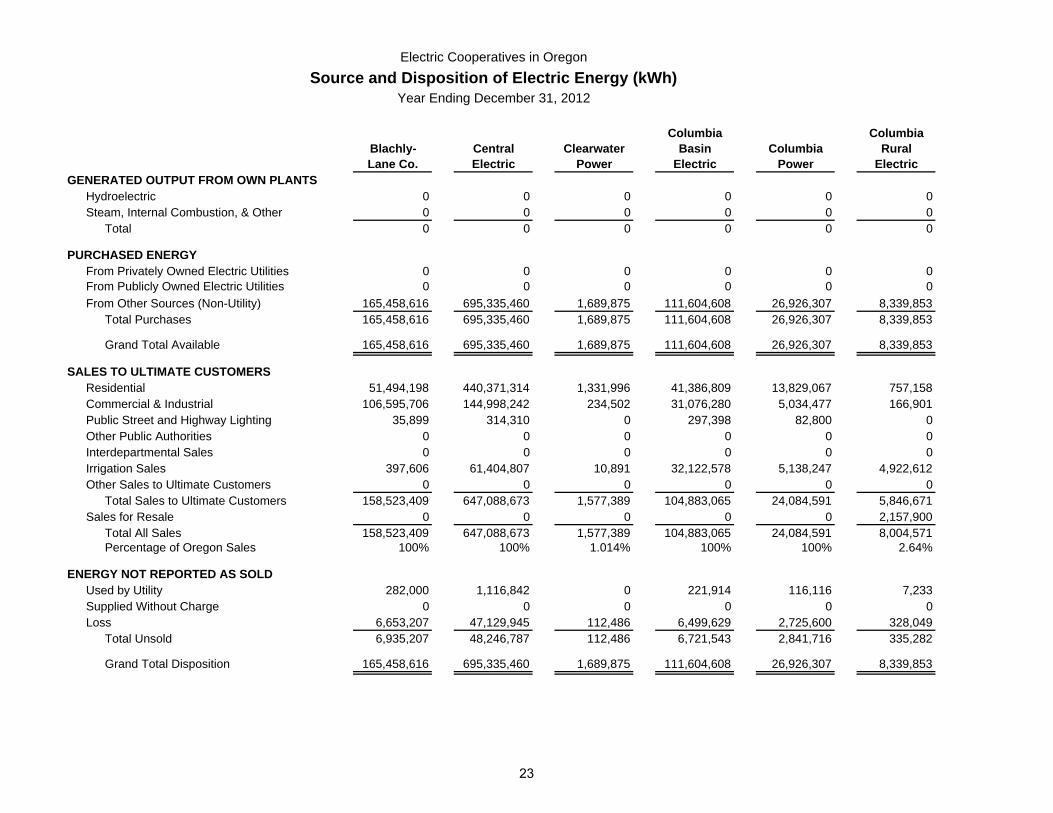
Electric Cooperatives in OregonSource and Disposition of Electric Energy (kWh)
Year Ending December 31, 2012
Columbia ColumbiaBlachly- Central Clearwater Basin Columbia RuralLane Co. Electric Power Electric Power Electric
GENERATED OUTPUT FROM OWN PLANTSHydroelectric 0 0 0 0 0 0Steam, Internal Combustion, & Other 0 0 0 0 0 0
Total 0 0 0 0 0 0
PURCHASED ENERGYFrom Privately Owned Electric Utilities 0 0 0 0 0 0From Publicly Owned Electric Utilities 0 0 0 0 0 0From Other Sources (Non-Utility) 165,458,616 695,335,460 1,689,875 111,604,608 26,926,307 8,339,853
Total Purchases 165,458,616 695,335,460 1,689,875 111,604,608 26,926,307 8,339,853
Grand Total Available 165,458,616 695,335,460 1,689,875 111,604,608 26,926,307 8,339,853
SALES TO ULTIMATE CUSTOMERSResidential 51,494,198 440,371,314 1,331,996 41,386,809 13,829,067 757,158Commercial & Industrial 106,595,706 144,998,242 234,502 31,076,280 5,034,477 166,901Public Street and Highway Lighting 35,899 314,310 0 297,398 82,800 0Other Public Authorities 0 0 0 0 0 0Interdepartmental Sales 0 0 0 0 0 0Irrigation Sales 397,606 61,404,807 10,891 32,122,578 5,138,247 4,922,612Other Sales to Ultimate Customers 0 0 0 0 0 0
Total Sales to Ultimate Customers 158,523,409 647,088,673 1,577,389 104,883,065 24,084,591 5,846,671Sales for Resale 0 0 0 0 0 2,157,900
Total All Sales 158,523,409 647,088,673 1,577,389 104,883,065 24,084,591 8,004,571Percentage of Oregon Sales 100% 100% 1.014% 100% 100% 2.64%
ENERGY NOT REPORTED AS SOLDUsed by Utility 282,000 1,116,842 0 221,914 116,116 7,233Supplied Without Charge 0 0 0 0 0 0Loss 6,653,207 47,129,945 112,486 6,499,629 2,725,600 328,049
Total Unsold 6,935,207 48,246,787 112,486 6,721,543 2,841,716 335,282
Grand Total Disposition 165,458,616 695,335,460 1,689,875 111,604,608 26,926,307 8,339,853
23
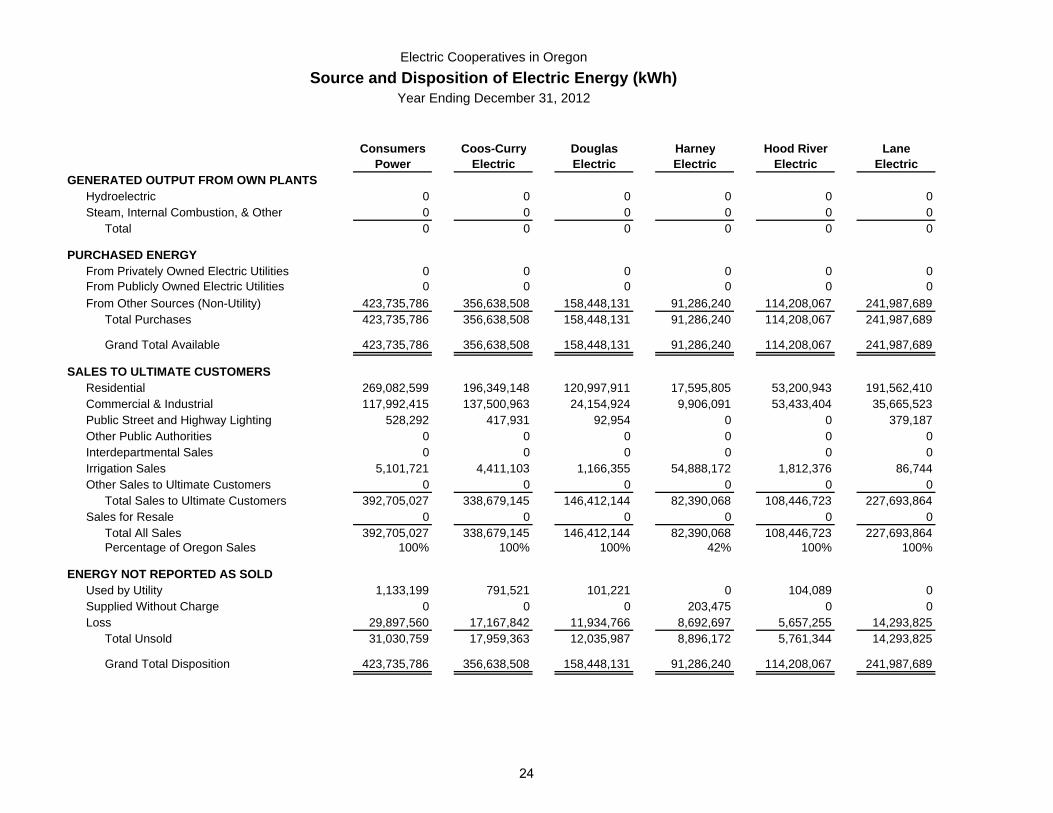
Electric Cooperatives in OregonSource and Disposition of Electric Energy (kWh)
Year Ending December 31, 2012
Consumers Coos-Curry Douglas Harney Hood River LanePower Electric Electric Electric Electric Electric
GENERATED OUTPUT FROM OWN PLANTSHydroelectric 0 0 0 0 0 0Steam, Internal Combustion, & Other 0 0 0 0 0 0
Total 0 0 0 0 0 0
PURCHASED ENERGYFrom Privately Owned Electric Utilities 0 0 0 0 0 0From Publicly Owned Electric Utilities 0 0 0 0 0 0From Other Sources (Non-Utility) 423,735,786 356,638,508 158,448,131 91,286,240 114,208,067 241,987,689
Total Purchases 423,735,786 356,638,508 158,448,131 91,286,240 114,208,067 241,987,689
Grand Total Available 423,735,786 356,638,508 158,448,131 91,286,240 114,208,067 241,987,689
SALES TO ULTIMATE CUSTOMERSResidential 269,082,599 196,349,148 120,997,911 17,595,805 53,200,943 191,562,410Commercial & Industrial 117,992,415 137,500,963 24,154,924 9,906,091 53,433,404 35,665,523 Public Street and Highway Lighting 528,292 417,931 92,954 0 0 379,187Other Public Authorities 0 0 0 0 0 0Interdepartmental Sales 0 0 0 0 0 0Irrigation Sales 5,101,721 4,411,103 1,166,355 54,888,172 1,812,376 86,744Other Sales to Ultimate Customers 0 0 0 0 0 0
Total Sales to Ultimate Customers 392,705,027 338,679,145 146,412,144 82,390,068 108,446,723 227,693,864Sales for Resale 0 0 0 0 0 0
Total All Sales 392,705,027 338,679,145 146,412,144 82,390,068 108,446,723 227,693,864Percentage of Oregon Sales 100% 100% 100% 42% 100% 100%
ENERGY NOT REPORTED AS SOLDUsed by Utility 1,133,199 791,521 101,221 0 104,089 0Supplied Without Charge 0 0 0 203,475 0 0Loss 29,897,560 17,167,842 11,934,766 8,692,697 5,657,255 14,293,825
Total Unsold 31,030,759 17,959,363 12,035,987 8,896,172 5,761,344 14,293,825
Grand Total Disposition 423,735,786 356,638,508 158,448,131 91,286,240 114,208,067 241,987,689
24
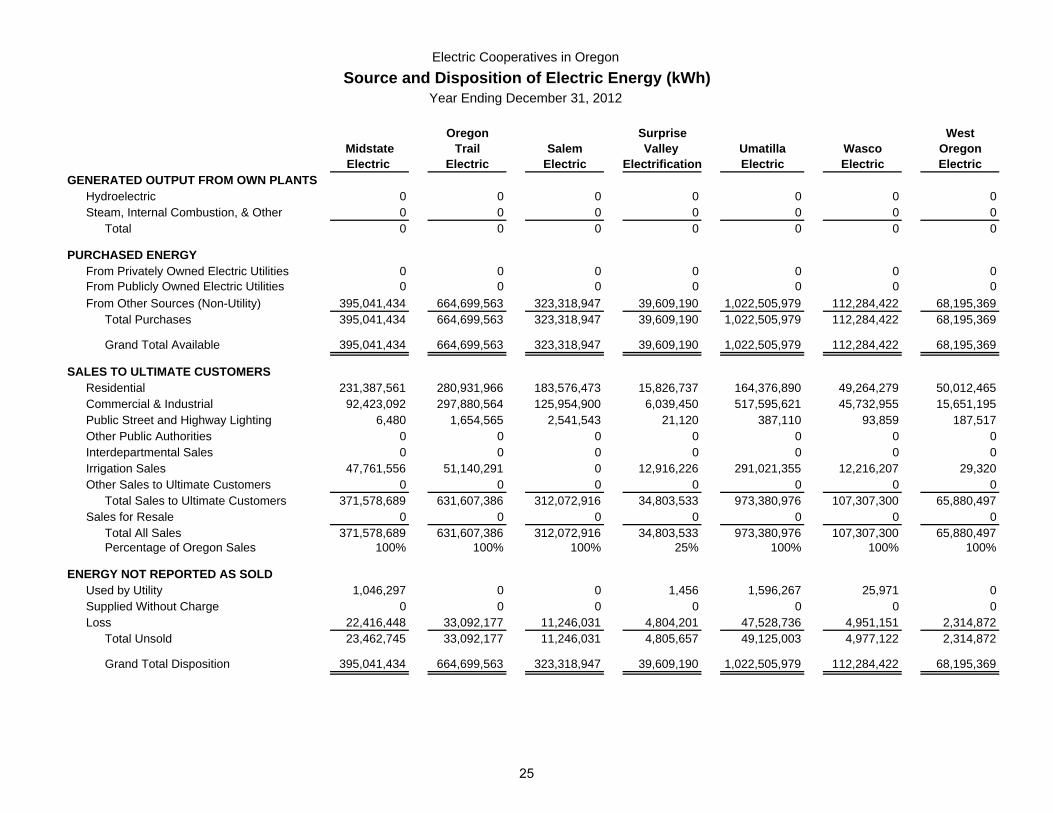
Electric Cooperatives in Oregon Source and Disposition of Electric Energy (kWh)
Year Ending December 31, 2012
Oregon Surprise WestMidstate Trail Salem Valley Umatilla Wasco OregonElectric Electric Electric Electrification Electric Electric Electric
GENERATED OUTPUT FROM OWN PLANTSHydroelectric 0 0 0 0 0 0 0Steam, Internal Combustion, & Other 0 0 0 0 0 0 0
Total 0 0 0 0 0 0 0
PURCHASED ENERGYFrom Privately Owned Electric Utilities 0 0 0 0 0 0 0From Publicly Owned Electric Utilities 0 0 0 0 0 0 0From Other Sources (Non-Utility) 395,041,434 664,699,563 323,318,947 39,609,190 1,022,505,979 112,284,422 68,195,369
Total Purchases 395,041,434 664,699,563 323,318,947 39,609,190 1,022,505,979 112,284,422 68,195,369
Grand Total Available 395,041,434 664,699,563 323,318,947 39,609,190 1,022,505,979 112,284,422 68,195,369
SALES TO ULTIMATE CUSTOMERSResidential 231,387,561 280,931,966 183,576,473 15,826,737 164,376,890 49,264,279 50,012,465Commercial & Industrial 92,423,092 297,880,564 125,954,900 6,039,450 517,595,621 45,732,955 15,651,195Public Street and Highway Lighting 6,480 1,654,565 2,541,543 21,120 387,110 93,859 187,517Other Public Authorities 0 0 0 0 0 0 0Interdepartmental Sales 0 0 0 0 0 0 0Irrigation Sales 47,761,556 51,140,291 0 12,916,226 291,021,355 12,216,207 29,320Other Sales to Ultimate Customers 0 0 0 0 0 0 0
Total Sales to Ultimate Customers 371,578,689 631,607,386 312,072,916 34,803,533 973,380,976 107,307,300 65,880,497Sales for Resale 0 0 0 0 0 0 0
Total All Sales 371,578,689 631,607,386 312,072,916 34,803,533 973,380,976 107,307,300 65,880,497Percentage of Oregon Sales 100% 100% 100% 25% 100% 100% 100%
ENERGY NOT REPORTED AS SOLDUsed by Utility 1,046,297 0 0 1,456 1,596,267 25,971 0Supplied Without Charge 0 0 0 0 0 0 0Loss 22,416,448 33,092,177 11,246,031 4,804,201 47,528,736 4,951,151 2,314,872
Total Unsold 23,462,745 33,092,177 11,246,031 4,805,657 49,125,003 4,977,122 2,314,872
Grand Total Disposition 395,041,434 664,699,563 323,318,947 39,609,190 1,022,505,979 112,284,422 68,195,369
25
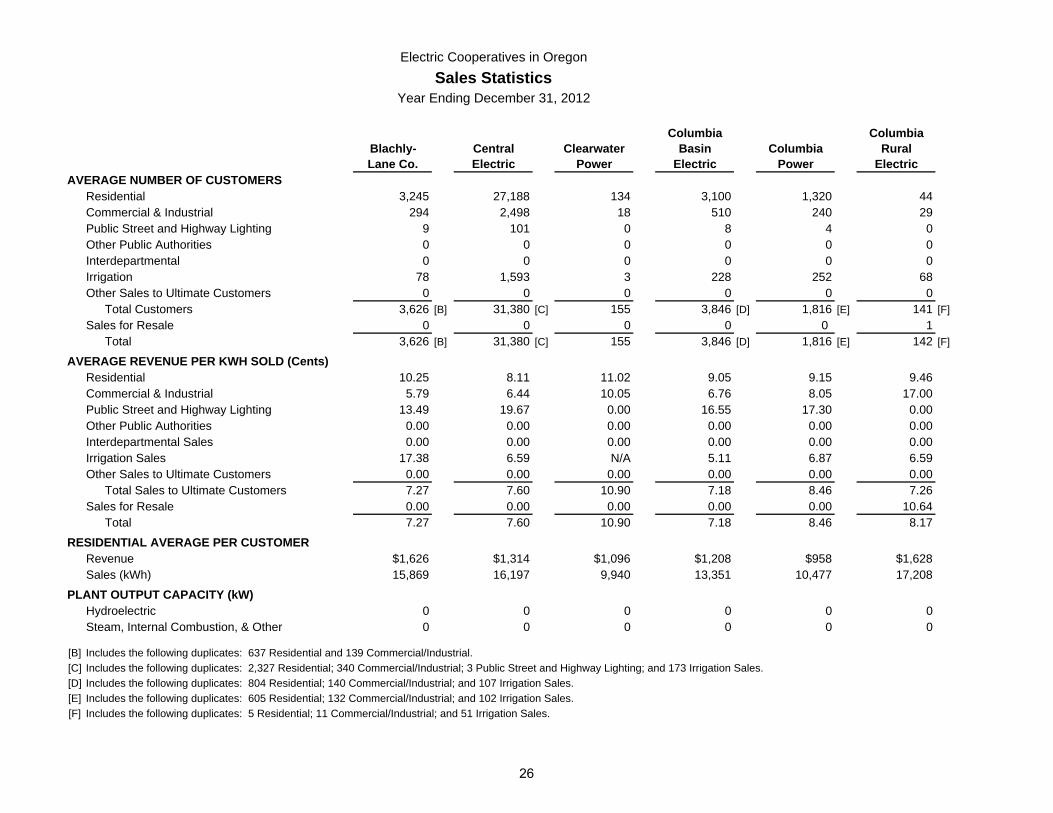
Electric Cooperatives in OregonSales Statistics
Year Ending December 31, 2012
Columbia ColumbiaBlachly- Central Clearwater Basin Columbia RuralLane Co. Electric Power Electric Power Electric
AVERAGE NUMBER OF CUSTOMERSResidential 3,245 27,188 134 3,100 1,320 44Commercial & Industrial 294 2,498 18 510 240 29Public Street and Highway Lighting 9 101 0 8 4 0Other Public Authorities 0 0 0 0 0 0Interdepartmental 0 0 0 0 0 0Irrigation 78 1,593 3 228 252 68Other Sales to Ultimate Customers 0 0 0 0 0 0
Total Customers 3,626 [B] 31,380 [C] 155 3,846 [D] 1,816 [E] 141 [F]Sales for Resale 0 0 0 0 0 1
Total 3,626 [B] 31,380 [C] 155 3,846 [D] 1,816 [E] 142 [F]
AVERAGE REVENUE PER KWH SOLD (Cents)Residential 10.25 8.11 11.02 9.05 9.15 9.46Commercial & Industrial 5.79 6.44 10.05 6.76 8.05 17.00Public Street and Highway Lighting 13.49 19.67 0.00 16.55 17.30 0.00Other Public Authorities 0.00 0.00 0.00 0.00 0.00 0.00Interdepartmental Sales 0.00 0.00 0.00 0.00 0.00 0.00Irrigation Sales 17.38 6.59 N/A 5.11 6.87 6.59Other Sales to Ultimate Customers 0.00 0.00 0.00 0.00 0.00 0.00
Total Sales to Ultimate Customers 7.27 7.60 10.90 7.18 8.46 7.26Sales for Resale 0.00 0.00 0.00 0.00 0.00 10.64
Total 7.27 7.60 10.90 7.18 8.46 8.17
RESIDENTIAL AVERAGE PER CUSTOMERRevenue $1,626 $1,314 $1,096 $1,208 $958 $1,628Sales (kWh) 15,869 16,197 9,940 13,351 10,477 17,208
PLANT OUTPUT CAPACITY (kW)Hydroelectric 0 0 0 0 0 0Steam, Internal Combustion, & Other 0 0 0 0 0 0
[B] Includes the following duplicates: 637 Residential and 139 Commercial/Industrial.[C] Includes the following duplicates: 2,327 Residential; 340 Commercial/Industrial; 3 Public Street and Highway Lighting; and 173 Irrigation Sales.[D] Includes the following duplicates: 804 Residential; 140 Commercial/Industrial; and 107 Irrigation Sales.[E] Includes the following duplicates: 605 Residential; 132 Commercial/Industrial; and 102 Irrigation Sales.[F] Includes the following duplicates: 5 Residential; 11 Commercial/Industrial; and 51 Irrigation Sales.
26
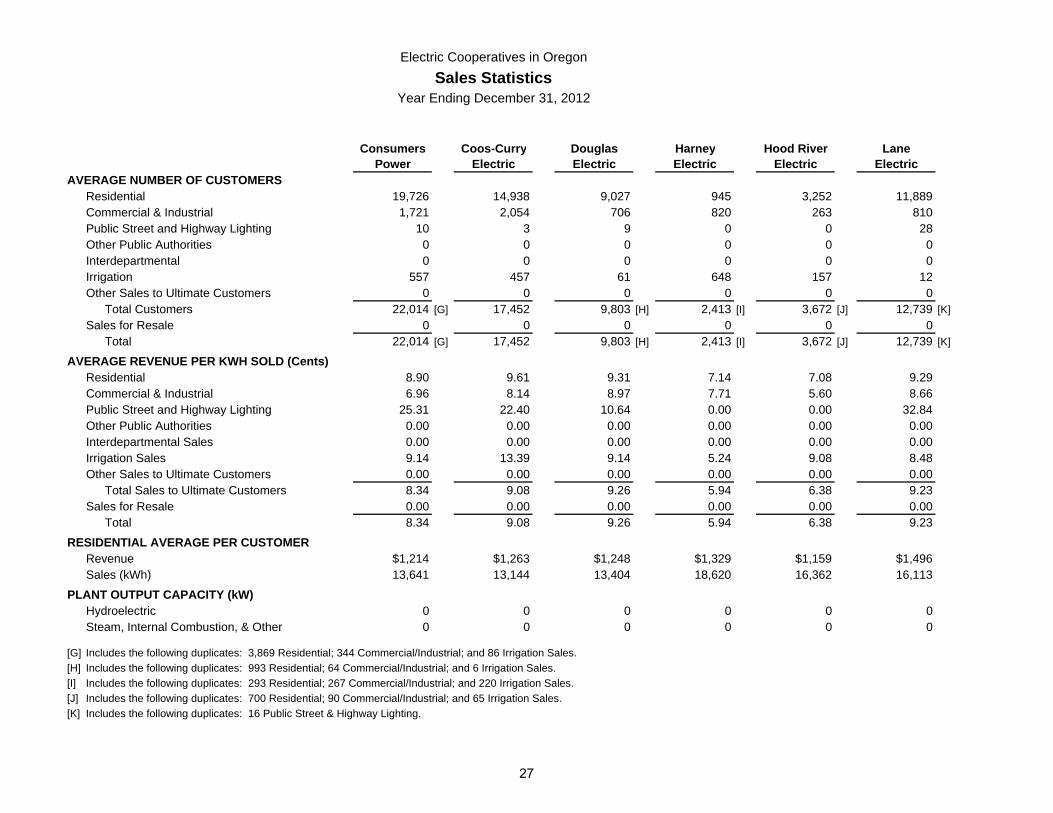
Electric Cooperatives in OregonSales Statistics
Year Ending December 31, 2012
Consumers Coos-Curry Douglas Harney Hood River LanePower Electric Electric Electric Electric Electric
AVERAGE NUMBER OF CUSTOMERSResidential 19,726 14,938 9,027 945 3,252 11,889Commercial & Industrial 1,721 2,054 706 820 263 810Public Street and Highway Lighting 10 3 9 0 0 28Other Public Authorities 0 0 0 0 0 0Interdepartmental 0 0 0 0 0 0Irrigation 557 457 61 648 157 12Other Sales to Ultimate Customers 0 0 0 0 0 0
Total Customers 22,014 [G] 17,452 9,803 [H] 2,413 [I] 3,672 [J] 12,739 [K]Sales for Resale 0 0 0 0 0 0
Total 22,014 [G] 17,452 9,803 [H] 2,413 [I] 3,672 [J] 12,739 [K]
AVERAGE REVENUE PER KWH SOLD (Cents)Residential 8.90 9.61 9.31 7.14 7.08 9.29Commercial & Industrial 6.96 8.14 8.97 7.71 5.60 8.66Public Street and Highway Lighting 25.31 22.40 10.64 0.00 0.00 32.84Other Public Authorities 0.00 0.00 0.00 0.00 0.00 0.00Interdepartmental Sales 0.00 0.00 0.00 0.00 0.00 0.00Irrigation Sales 9.14 13.39 9.14 5.24 9.08 8.48Other Sales to Ultimate Customers 0.00 0.00 0.00 0.00 0.00 0.00
Total Sales to Ultimate Customers 8.34 9.08 9.26 5.94 6.38 9.23Sales for Resale 0.00 0.00 0.00 0.00 0.00 0.00
Total 8.34 9.08 9.26 5.94 6.38 9.23
RESIDENTIAL AVERAGE PER CUSTOMERRevenue $1,214 $1,263 $1,248 $1,329 $1,159 $1,496Sales (kWh) 13,641 13,144 13,404 18,620 16,362 16,113
PLANT OUTPUT CAPACITY (kW)Hydroelectric 0 0 0 0 0 0Steam, Internal Combustion, & Other 0 0 0 0 0 0
[G] Includes the following duplicates: 3,869 Residential; 344 Commercial/Industrial; and 86 Irrigation Sales.[H] Includes the following duplicates: 993 Residential; 64 Commercial/Industrial; and 6 Irrigation Sales.[I] Includes the following duplicates: 293 Residential; 267 Commercial/Industrial; and 220 Irrigation Sales.[J] Includes the following duplicates: 700 Residential; 90 Commercial/Industrial; and 65 Irrigation Sales.[K] Includes the following duplicates: 16 Public Street & Highway Lighting.
27

Electric Cooperatives in OregonSales Statistics
Year Ending December 31, 2012
Oregon Surprise WestMidstate Trail Salem Valley Umatilla Wasco OregonElectric Electric Electric Electrification Electric Electric Electric
AVERAGE NUMBER OF CUSTOMERS Residential 16,159 25,033 16,500 1,148 10,961 3,769 3,948Commercial & Industrial 1,577 4,279 2,000 376 1,870 549 310Public Street and Highway Lighting 1 25 78 1 7 6 7Other Public Authorities 0 0 0 0 0 0 0Interdepartmental 0 0 0 0 0 0 0Irrigation 478 972 0 238 1,417 309 8Other Sales to Ultimate Customers 0 0 0 0 0 0 0
Total Customers 18,215 30,309 18,578 1,763 14,255 4,633 [L] 4,273 [M]Sales for Resale 0 0 0 0 0 0 0
Total 18,215 30,309 18,578 1,763 14,255 4,633 [L] 4,273 [M]
AVERAGE REVENUE PER KWH SOLD (Cents)Residential 7.73 8.76 8.21 7.34 7.78 9.56 14.24Commercial & Industrial 7.02 6.37 7.30 7.23 5.15 8.05 11.59Public Street and Highway Lighting 23.07 16.47 13.44 16.25 14.24 20.47 11.83Other Public Authorities 0.00 0.00 0.00 0.00 0.00 0.00 0.00Interdepartmental Sales 0.00 0.00 0.00 0.00 0.00 0.00 0.00Irrigation Sales 5.76 5.32 0.00 6.51 4.90 7.77 20.31Other Sales to Ultimate Customers 0.00 0.00 0.00 0.00 0.00 0.00 0.00
Total Sales to Ultimate Customers 7.30 7.38 7.89 7.02 5.52 8.73 13.61Sales for Resale 0.00 0.00 0.00 0.00 0.00 0.00 0.00
Total 7.30 7.38 7.89 7.02 5.52 8.73 13.61
RESIDENTIAL AVERAGE PER CUSTOMERRevenue $1,106 $984 $914 $1,012 $1,167 $1,250 $1,804Sales (kWh) 14,319 11,222 11,126 13,786 14,997 13,071 12,668
PLANT OUTPUT CAPACITY (kW)Hydroelectric 0 0 0 0 0 0 0Steam, Internal Combustion, & Other 0 0 0 0 0 0 0
[L] Includes the following duplicates: 893 Residential; 344 Commercial/Industrial; 1 Public Street and Highway Lighting; and 146 Irrigation Sales.[M] Includes the following duplicates: 266 Residential; 280 Commercial/Industrial; 3 Public Street and Highway Lighting; and 1 Irrigation Sales.
28
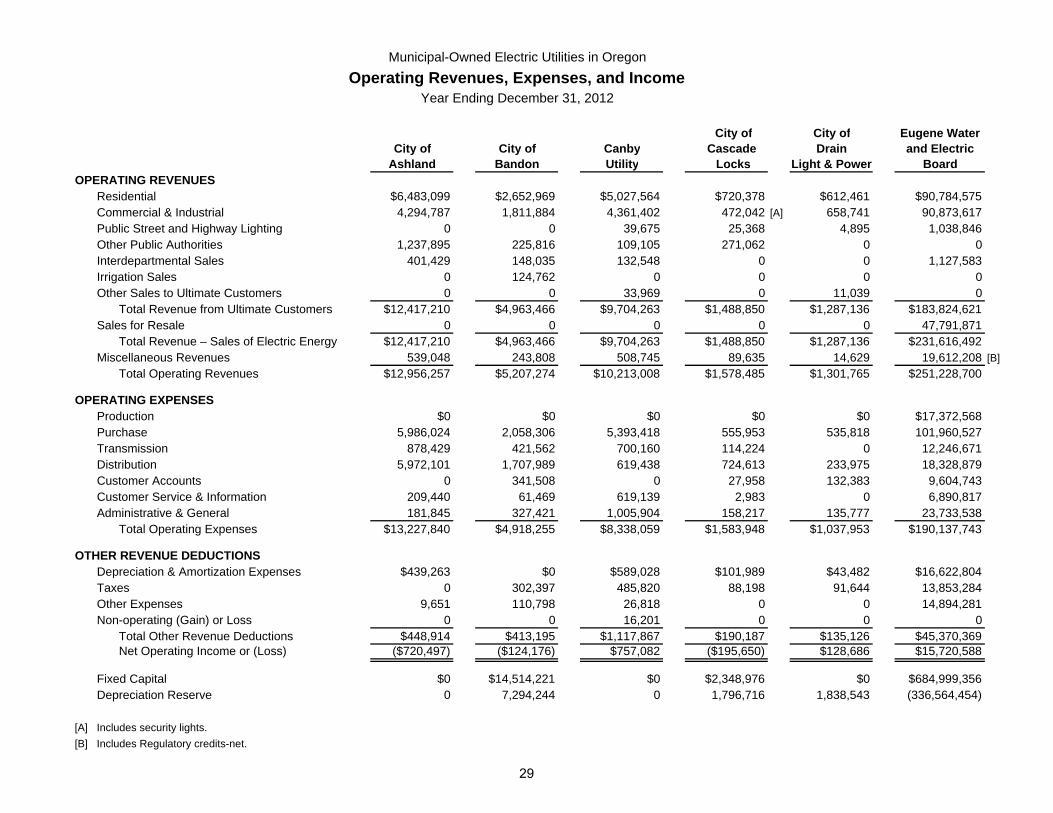
Municipal-Owned Electric Utilities in OregonOperating Revenues, Expenses, and Income
Year Ending December 31, 2012
City of City of Eugene WaterCity of City of Canby Cascade Drain and Electric
Ashland Bandon Utility Locks Light & Power BoardOPERATING REVENUES
Residential $6,483,099 $2,652,969 $5,027,564 $720,378 $612,461 $90,784,575Commercial & Industrial 4,294,787 1,811,884 4,361,402 472,042 [A] 658,741 90,873,617Public Street and Highway Lighting 0 0 39,675 25,368 4,895 1,038,846Other Public Authorities 1,237,895 225,816 109,105 271,062 0 0Interdepartmental Sales 401,429 148,035 132,548 0 0 1,127,583Irrigation Sales 0 124,762 0 0 0 0Other Sales to Ultimate Customers 0 0 33,969 0 11,039 0
Total Revenue from Ultimate Customers $12,417,210 $4,963,466 $9,704,263 $1,488,850 $1,287,136 $183,824,621Sales for Resale 0 0 0 0 0 47,791,871
Total Revenue – Sales of Electric Energy $12,417,210 $4,963,466 $9,704,263 $1,488,850 $1,287,136 $231,616,492Miscellaneous Revenues 539,048 243,808 508,745 89,635 14,629 19,612,208 [B]
Total Operating Revenues $12,956,257 $5,207,274 $10,213,008 $1,578,485 $1,301,765 $251,228,700
OPERATING EXPENSESProduction $0 $0 $0 $0 $0 $17,372,568Purchase 5,986,024 2,058,306 5,393,418 555,953 535,818 101,960,527Transmission 878,429 421,562 700,160 114,224 0 12,246,671Distribution 5,972,101 1,707,989 619,438 724,613 233,975 18,328,879Customer Accounts 0 341,508 0 27,958 132,383 9,604,743Customer Service & Information 209,440 61,469 619,139 2,983 0 6,890,817Administrative & General 181,845 327,421 1,005,904 158,217 135,777 23,733,538
Total Operating Expenses $13,227,840 $4,918,255 $8,338,059 $1,583,948 $1,037,953 $190,137,743
OTHER REVENUE DEDUCTIONSDepreciation & Amortization Expenses $439,263 $0 $589,028 $101,989 $43,482 $16,622,804Taxes 0 302,397 485,820 88,198 91,644 13,853,284Other Expenses 9,651 110,798 26,818 0 0 14,894,281Non-operating (Gain) or Loss 0 0 16,201 0 0 0
Total Other Revenue Deductions $448,914 $413,195 $1,117,867 $190,187 $135,126 $45,370,369Net Operating Income or (Loss) ($720,497) ($124,176) $757,082 ($195,650) $128,686 $15,720,588
Fixed Capital $0 $14,514,221 $0 $2,348,976 $0 $684,999,356Depreciation Reserve 0 7,294,244 0 1,796,716 1,838,543 (336,564,454)
[A] Includes security lights.[B] Includes Regulatory credits-net.
29
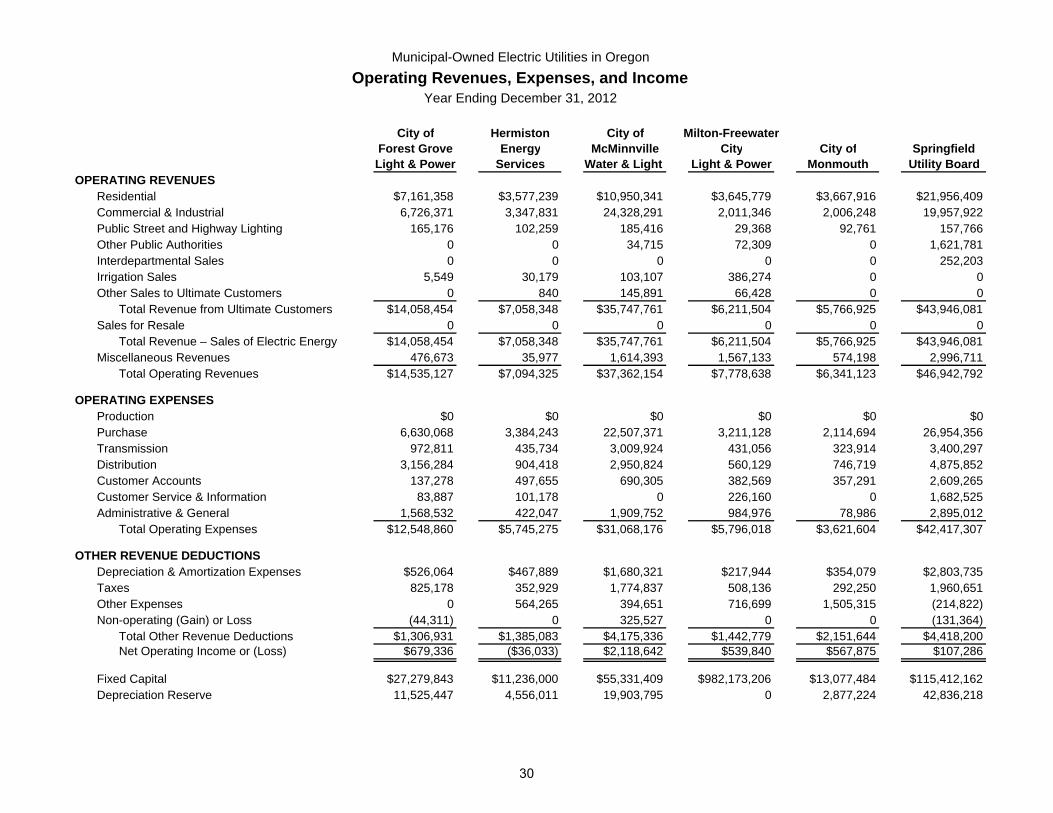
Municipal-Owned Electric Utilities in OregonOperating Revenues, Expenses, and Income
Year Ending December 31, 2012
City of Hermiston City of Milton-FreewaterForest Grove Energy McMinnville City City of SpringfieldLight & Power Services Water & Light Light & Power Monmouth Utility Board
OPERATING REVENUESResidential $7,161,358 $3,577,239 $10,950,341 $3,645,779 $3,667,916 $21,956,409Commercial & Industrial 6,726,371 3,347,831 24,328,291 2,011,346 2,006,248 19,957,922Public Street and Highway Lighting 165,176 102,259 185,416 29,368 92,761 157,766Other Public Authorities 0 0 34,715 72,309 0 1,621,781Interdepartmental Sales 0 0 0 0 0 252,203Irrigation Sales 5,549 30,179 103,107 386,274 0 0Other Sales to Ultimate Customers 0 840 145,891 66,428 0 0
Total Revenue from Ultimate Customers $14,058,454 $7,058,348 $35,747,761 $6,211,504 $5,766,925 $43,946,081Sales for Resale 0 0 0 0 0 0
Total Revenue – Sales of Electric Energy $14,058,454 $7,058,348 $35,747,761 $6,211,504 $5,766,925 $43,946,081Miscellaneous Revenues 476,673 35,977 1,614,393 1,567,133 574,198 2,996,711
Total Operating Revenues $14,535,127 $7,094,325 $37,362,154 $7,778,638 $6,341,123 $46,942,792
OPERATING EXPENSESProduction $0 $0 $0 $0 $0 $0Purchase 6,630,068 3,384,243 22,507,371 3,211,128 2,114,694 26,954,356Transmission 972,811 435,734 3,009,924 431,056 323,914 3,400,297Distribution 3,156,284 904,418 2,950,824 560,129 746,719 4,875,852Customer Accounts 137,278 497,655 690,305 382,569 357,291 2,609,265Customer Service & Information 83,887 101,178 0 226,160 0 1,682,525Administrative & General 1,568,532 422,047 1,909,752 984,976 78,986 2,895,012
Total Operating Expenses $12,548,860 $5,745,275 $31,068,176 $5,796,018 $3,621,604 $42,417,307
OTHER REVENUE DEDUCTIONSDepreciation & Amortization Expenses $526,064 $467,889 $1,680,321 $217,944 $354,079 $2,803,735Taxes 825,178 352,929 1,774,837 508,136 292,250 1,960,651Other Expenses 0 564,265 394,651 716,699 1,505,315 (214,822)Non-operating (Gain) or Loss (44,311) 0 325,527 0 0 (131,364)
Total Other Revenue Deductions $1,306,931 $1,385,083 $4,175,336 $1,442,779 $2,151,644 $4,418,200Net Operating Income or (Loss) $679,336 ($36,033) $2,118,642 $539,840 $567,875 $107,286
Fixed Capital $27,279,843 $11,236,000 $55,331,409 $982,173,206 $13,077,484 $115,412,162Depreciation Reserve 11,525,447 4,556,011 19,903,795 0 2,877,224 42,836,218
30
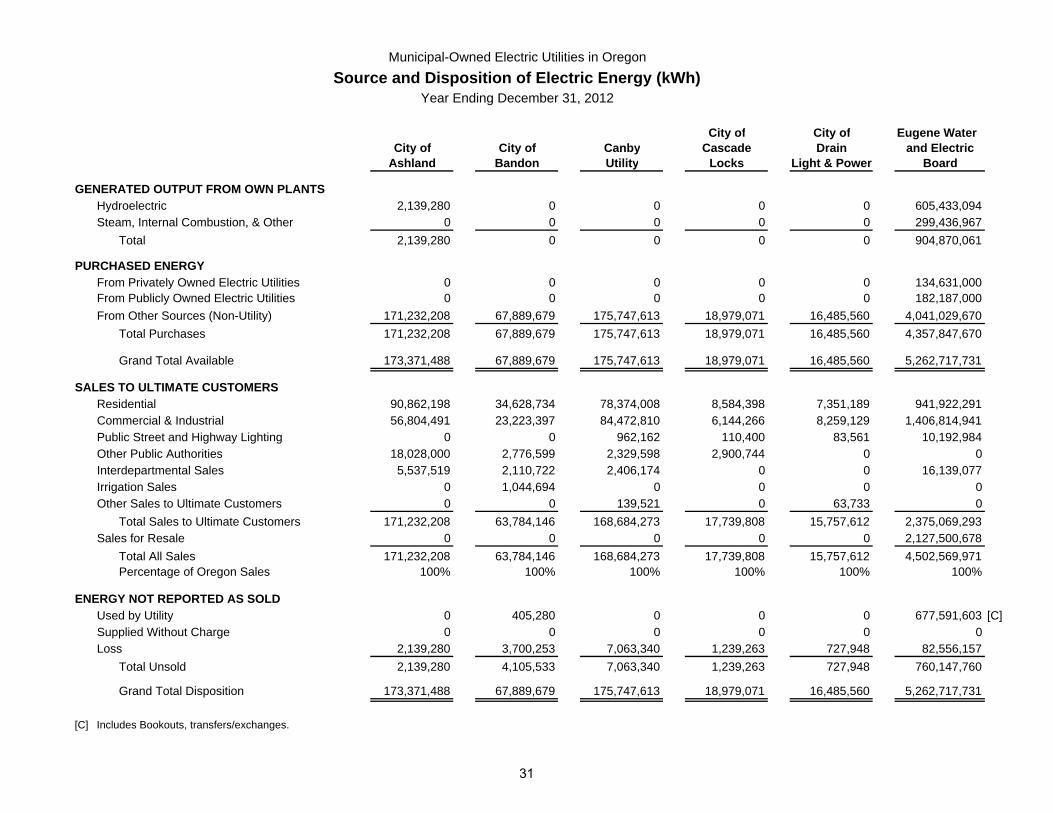
Municipal-Owned Electric Utilities in OregonSource and Disposition of Electric Energy (kWh)
Year Ending December 31, 2012
City of City of Eugene WaterCity of City of Canby Cascade Drain and Electric
Ashland Bandon Utility Locks Light & Power Board
GENERATED OUTPUT FROM OWN PLANTSHydroelectric 2,139,280 0 0 0 0 605,433,094Steam, Internal Combustion, & Other 0 0 0 0 0 299,436,967
Total 2,139,280 0 0 0 0 904,870,061
PURCHASED ENERGYFrom Privately Owned Electric Utilities 0 0 0 0 0 134,631,000From Publicly Owned Electric Utilities 0 0 0 0 0 182,187,000From Other Sources (Non-Utility) 171,232,208 67,889,679 175,747,613 18,979,071 16,485,560 4,041,029,670
Total Purchases 171,232,208 67,889,679 175,747,613 18,979,071 16,485,560 4,357,847,670
Grand Total Available 173,371,488 67,889,679 175,747,613 18,979,071 16,485,560 5,262,717,731
SALES TO ULTIMATE CUSTOMERSResidential 90,862,198 34,628,734 78,374,008 8,584,398 7,351,189 941,922,291Commercial & Industrial 56,804,491 23,223,397 84,472,810 6,144,266 8,259,129 1,406,814,941Public Street and Highway Lighting 0 0 962,162 110,400 83,561 10,192,984Other Public Authorities 18,028,000 2,776,599 2,329,598 2,900,744 0 0Interdepartmental Sales 5,537,519 2,110,722 2,406,174 0 0 16,139,077Irrigation Sales 0 1,044,694 0 0 0 0Other Sales to Ultimate Customers 0 0 139,521 0 63,733 0
Total Sales to Ultimate Customers 171,232,208 63,784,146 168,684,273 17,739,808 15,757,612 2,375,069,293Sales for Resale 0 0 0 0 0 2,127,500,678
Total All Sales 171,232,208 63,784,146 168,684,273 17,739,808 15,757,612 4,502,569,971Percentage of Oregon Sales 100% 100% 100% 100% 100% 100%
ENERGY NOT REPORTED AS SOLDUsed by Utility 0 405,280 0 0 0 677,591,603 [C]Supplied Without Charge 0 0 0 0 0 0Loss 2,139,280 3,700,253 7,063,340 1,239,263 727,948 82,556,157
Total Unsold 2,139,280 4,105,533 7,063,340 1,239,263 727,948 760,147,760
Grand Total Disposition 173,371,488 67,889,679 175,747,613 18,979,071 16,485,560 5,262,717,731
[C] Includes Bookouts, transfers/exchanges.
31
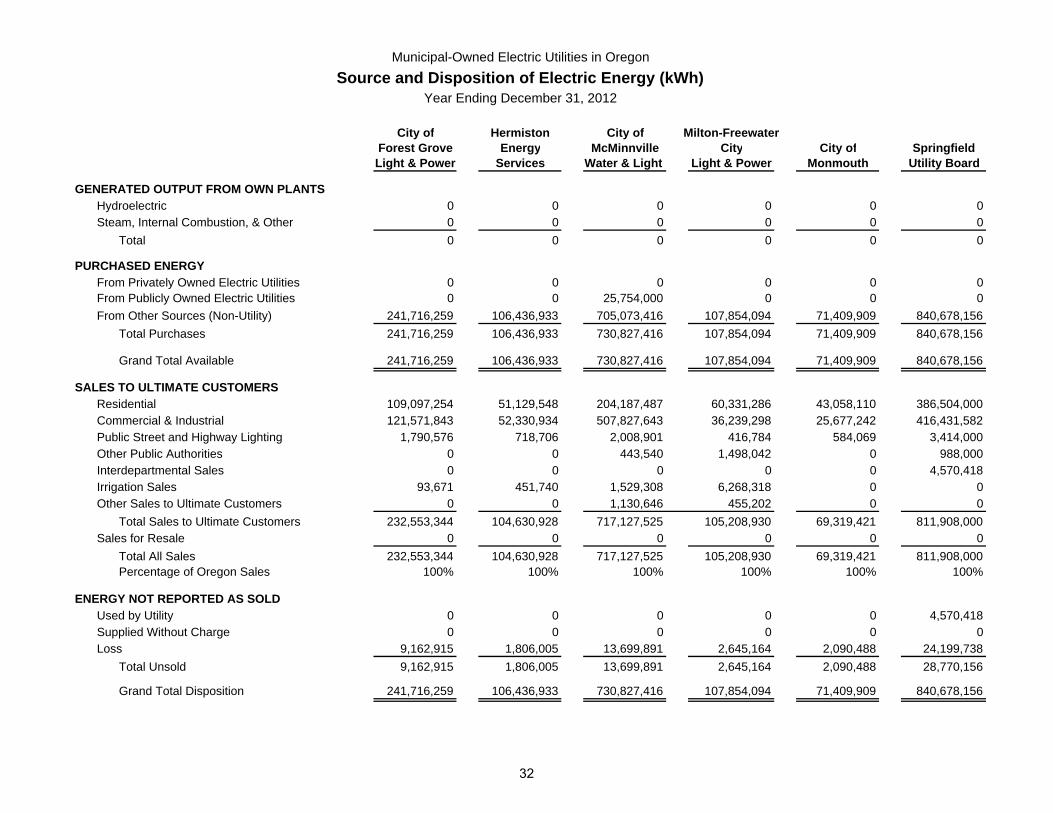
Municipal-Owned Electric Utilities in OregonSource and Disposition of Electric Energy (kWh)
Year Ending December 31, 2012
City of Hermiston City of Milton-FreewaterForest Grove Energy McMinnville City City of SpringfieldLight & Power Services Water & Light Light & Power Monmouth Utility Board
GENERATED OUTPUT FROM OWN PLANTSHydroelectric 0 0 0 0 0 0Steam, Internal Combustion, & Other 0 0 0 0 0 0
Total 0 0 0 0 0 0
PURCHASED ENERGYFrom Privately Owned Electric Utilities 0 0 0 0 0 0From Publicly Owned Electric Utilities 0 0 25,754,000 0 0 0From Other Sources (Non-Utility) 241,716,259 106,436,933 705,073,416 107,854,094 71,409,909 840,678,156
Total Purchases 241,716,259 106,436,933 730,827,416 107,854,094 71,409,909 840,678,156
Grand Total Available 241,716,259 106,436,933 730,827,416 107,854,094 71,409,909 840,678,156
SALES TO ULTIMATE CUSTOMERSResidential 109,097,254 51,129,548 204,187,487 60,331,286 43,058,110 386,504,000Commercial & Industrial 121,571,843 52,330,934 507,827,643 36,239,298 25,677,242 416,431,582Public Street and Highway Lighting 1,790,576 718,706 2,008,901 416,784 584,069 3,414,000Other Public Authorities 0 0 443,540 1,498,042 0 988,000Interdepartmental Sales 0 0 0 0 0 4,570,418Irrigation Sales 93,671 451,740 1,529,308 6,268,318 0 0Other Sales to Ultimate Customers 0 0 1,130,646 455,202 0 0
Total Sales to Ultimate Customers 232,553,344 104,630,928 717,127,525 105,208,930 69,319,421 811,908,000Sales for Resale 0 0 0 0 0 0
Total All Sales 232,553,344 104,630,928 717,127,525 105,208,930 69,319,421 811,908,000Percentage of Oregon Sales 100% 100% 100% 100% 100% 100%
ENERGY NOT REPORTED AS SOLDUsed by Utility 0 0 0 0 0 4,570,418Supplied Without Charge 0 0 0 0 0 0Loss 9,162,915 1,806,005 13,699,891 2,645,164 2,090,488 24,199,738
Total Unsold 9,162,915 1,806,005 13,699,891 2,645,164 2,090,488 28,770,156
Grand Total Disposition 241,716,259 106,436,933 730,827,416 107,854,094 71,409,909 840,678,156
32
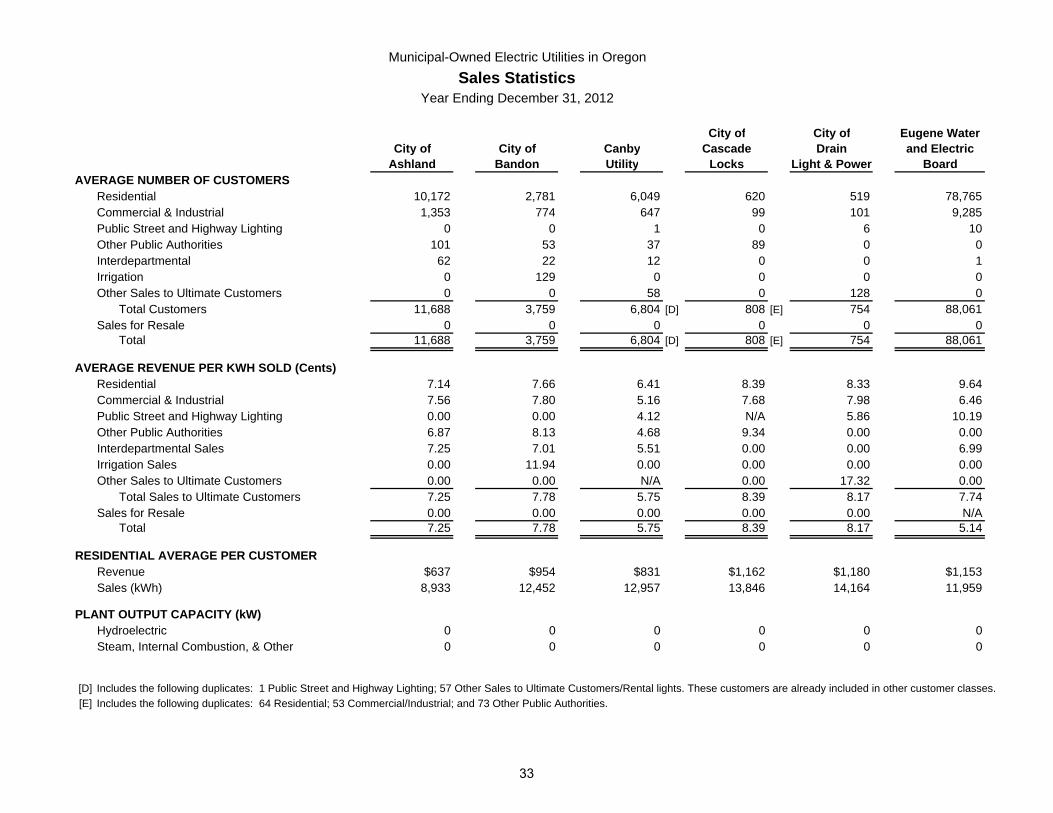
Municipal-Owned Electric Utilities in OregonSales Statistics
Year Ending December 31, 2012
City of City of Eugene WaterCity of City of Canby Cascade Drain and Electric
Ashland Bandon Utility Locks Light & Power BoardAVERAGE NUMBER OF CUSTOMERS
Residential 10,172 2,781 6,049 620 519 78,765Commercial & Industrial 1,353 774 647 99 101 9,285Public Street and Highway Lighting 0 0 1 0 6 10Other Public Authorities 101 53 37 89 0 0Interdepartmental 62 22 12 0 0 1Irrigation 0 129 0 0 0 0Other Sales to Ultimate Customers 0 0 58 0 128 0
Total Customers 11,688 3,759 6,804 [D] 808 [E] 754 88,061Sales for Resale 0 0 0 0 0 0
Total 11,688 3,759 6,804 [D] 808 [E] 754 88,061
AVERAGE REVENUE PER KWH SOLD (Cents)Residential 7.14 7.66 6.41 8.39 8.33 9.64Commercial & Industrial 7.56 7.80 5.16 7.68 7.98 6.46Public Street and Highway Lighting 0.00 0.00 4.12 N/A 5.86 10.19Other Public Authorities 6.87 8.13 4.68 9.34 0.00 0.00Interdepartmental Sales 7.25 7.01 5.51 0.00 0.00 6.99Irrigation Sales 0.00 11.94 0.00 0.00 0.00 0.00Other Sales to Ultimate Customers 0.00 0.00 N/A 0.00 17.32 0.00
Total Sales to Ultimate Customers 7.25 7.78 5.75 8.39 8.17 7.74Sales for Resale 0.00 0.00 0.00 0.00 0.00 N/A
Total 7.25 7.78 5.75 8.39 8.17 5.14
RESIDENTIAL AVERAGE PER CUSTOMERRevenue $637 $954 $831 $1,162 $1,180 $1,153Sales (kWh) 8,933 12,452 12,957 13,846 14,164 11,959
PLANT OUTPUT CAPACITY (kW)Hydroelectric 0 0 0 0 0 0Steam, Internal Combustion, & Other 0 0 0 0 0 0
[D] Includes the following duplicates: 1 Public Street and Highway Lighting; 57 Other Sales to Ultimate Customers/Rental lights. These customers are already included in other customer classes.[E] Includes the following duplicates: 64 Residential; 53 Commercial/Industrial; and 73 Other Public Authorities.
33
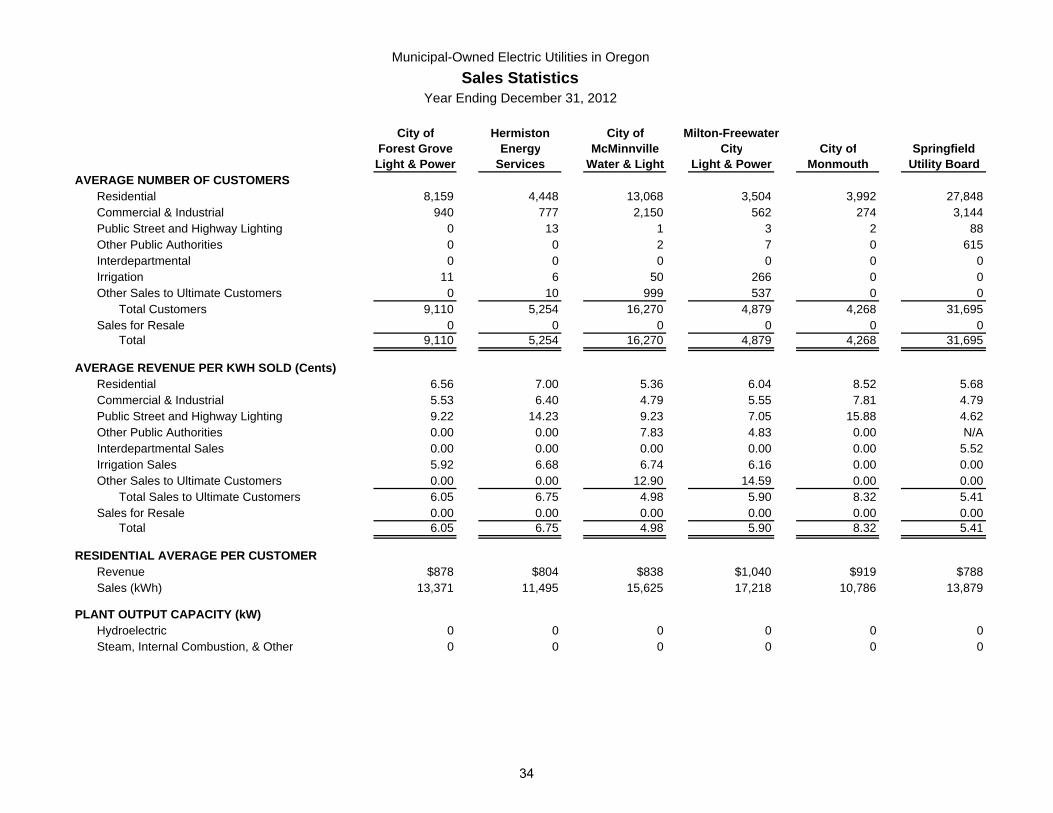
Municipal-Owned Electric Utilities in OregonSales Statistics
Year Ending December 31, 2012
City of Hermiston City of Milton-FreewaterForest Grove Energy McMinnville City City of SpringfieldLight & Power Services Water & Light Light & Power Monmouth Utility Board
AVERAGE NUMBER OF CUSTOMERSResidential 8,159 4,448 13,068 3,504 3,992 27,848Commercial & Industrial 940 777 2,150 562 274 3,144Public Street and Highway Lighting 0 13 1 3 2 88Other Public Authorities 0 0 2 7 0 615Interdepartmental 0 0 0 0 0 0Irrigation 11 6 50 266 0 0Other Sales to Ultimate Customers 0 10 999 537 0 0
Total Customers 9,110 5,254 16,270 4,879 4,268 31,695Sales for Resale 0 0 0 0 0 0
Total 9,110 5,254 16,270 4,879 4,268 31,695
AVERAGE REVENUE PER KWH SOLD (Cents)Residential 6.56 7.00 5.36 6.04 8.52 5.68Commercial & Industrial 5.53 6.40 4.79 5.55 7.81 4.79Public Street and Highway Lighting 9.22 14.23 9.23 7.05 15.88 4.62Other Public Authorities 0.00 0.00 7.83 4.83 0.00 N/AInterdepartmental Sales 0.00 0.00 0.00 0.00 0.00 5.52Irrigation Sales 5.92 6.68 6.74 6.16 0.00 0.00Other Sales to Ultimate Customers 0.00 0.00 12.90 14.59 0.00 0.00
Total Sales to Ultimate Customers 6.05 6.75 4.98 5.90 8.32 5.41Sales for Resale 0.00 0.00 0.00 0.00 0.00 0.00
Total 6.05 6.75 4.98 5.90 8.32 5.41
RESIDENTIAL AVERAGE PER CUSTOMERRevenue $878 $804 $838 $1,040 $919 $788Sales (kWh) 13,371 11,495 15,625 17,218 10,786 13,879
PLANT OUTPUT CAPACITY (kW)Hydroelectric 0 0 0 0 0 0Steam, Internal Combustion, & Other 0 0 0 0 0 0
34
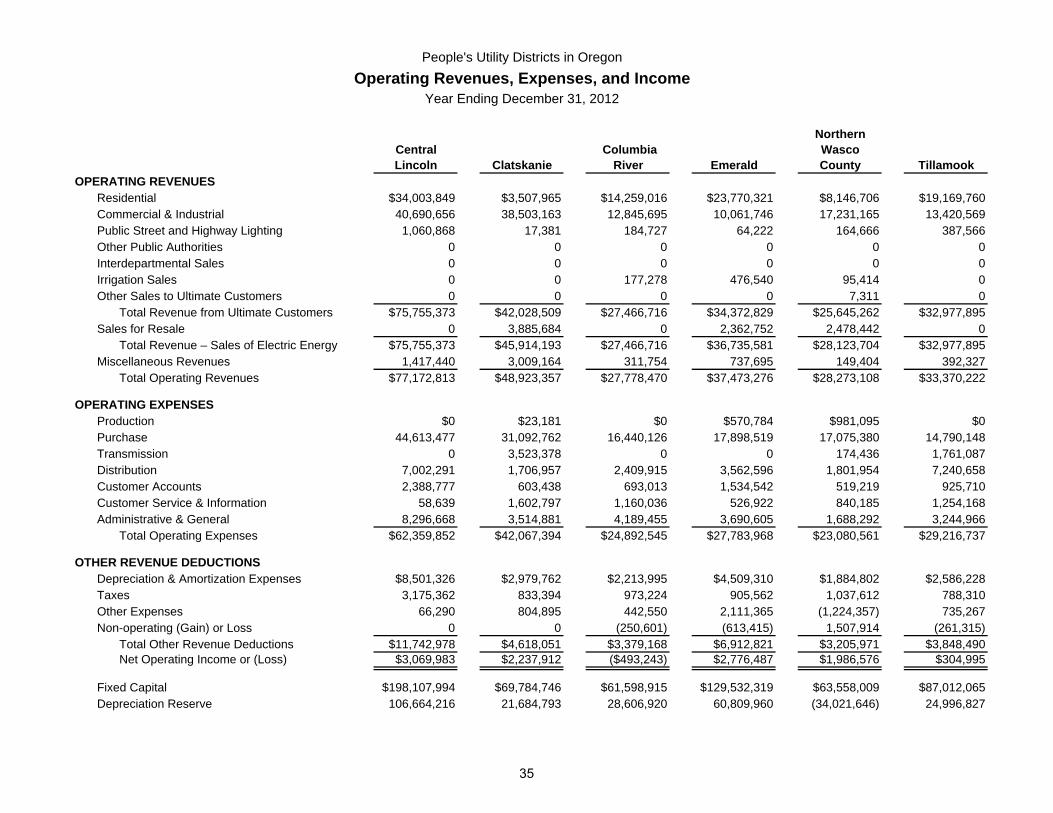
People's Utility Districts in OregonOperating Revenues, Expenses, and Income
Year Ending December 31, 2012
NorthernCentral Columbia WascoLincoln Clatskanie River Emerald County Tillamook
OPERATING REVENUESResidential $34,003,849 $3,507,965 $14,259,016 $23,770,321 $8,146,706 $19,169,760Commercial & Industrial 40,690,656 38,503,163 12,845,695 10,061,746 17,231,165 13,420,569Public Street and Highway Lighting 1,060,868 17,381 184,727 64,222 164,666 387,566Other Public Authorities 0 0 0 0 0 0Interdepartmental Sales 0 0 0 0 0 0Irrigation Sales 0 0 177,278 476,540 95,414 0Other Sales to Ultimate Customers 0 0 0 0 7,311 0
Total Revenue from Ultimate Customers $75,755,373 $42,028,509 $27,466,716 $34,372,829 $25,645,262 $32,977,895Sales for Resale 0 3,885,684 0 2,362,752 2,478,442 0
Total Revenue – Sales of Electric Energy $75,755,373 $45,914,193 $27,466,716 $36,735,581 $28,123,704 $32,977,895Miscellaneous Revenues 1,417,440 3,009,164 311,754 737,695 149,404 392,327
Total Operating Revenues $77,172,813 $48,923,357 $27,778,470 $37,473,276 $28,273,108 $33,370,222
OPERATING EXPENSESProduction $0 $23,181 $0 $570,784 $981,095 $0Purchase 44,613,477 31,092,762 16,440,126 17,898,519 17,075,380 14,790,148Transmission 0 3,523,378 0 0 174,436 1,761,087Distribution 7,002,291 1,706,957 2,409,915 3,562,596 1,801,954 7,240,658Customer Accounts 2,388,777 603,438 693,013 1,534,542 519,219 925,710Customer Service & Information 58,639 1,602,797 1,160,036 526,922 840,185 1,254,168Administrative & General 8,296,668 3,514,881 4,189,455 3,690,605 1,688,292 3,244,966
Total Operating Expenses $62,359,852 $42,067,394 $24,892,545 $27,783,968 $23,080,561 $29,216,737
OTHER REVENUE DEDUCTIONSDepreciation & Amortization Expenses $8,501,326 $2,979,762 $2,213,995 $4,509,310 $1,884,802 $2,586,228Taxes 3,175,362 833,394 973,224 905,562 1,037,612 788,310Other Expenses 66,290 804,895 442,550 2,111,365 (1,224,357) 735,267Non-operating (Gain) or Loss 0 0 (250,601) (613,415) 1,507,914 (261,315)
Total Other Revenue Deductions $11,742,978 $4,618,051 $3,379,168 $6,912,821 $3,205,971 $3,848,490Net Operating Income or (Loss) $3,069,983 $2,237,912 ($493,243) $2,776,487 $1,986,576 $304,995
Fixed Capital $198,107,994 $69,784,746 $61,598,915 $129,532,319 $63,558,009 $87,012,065Depreciation Reserve 106,664,216 21,684,793 28,606,920 60,809,960 (34,021,646) 24,996,827
35
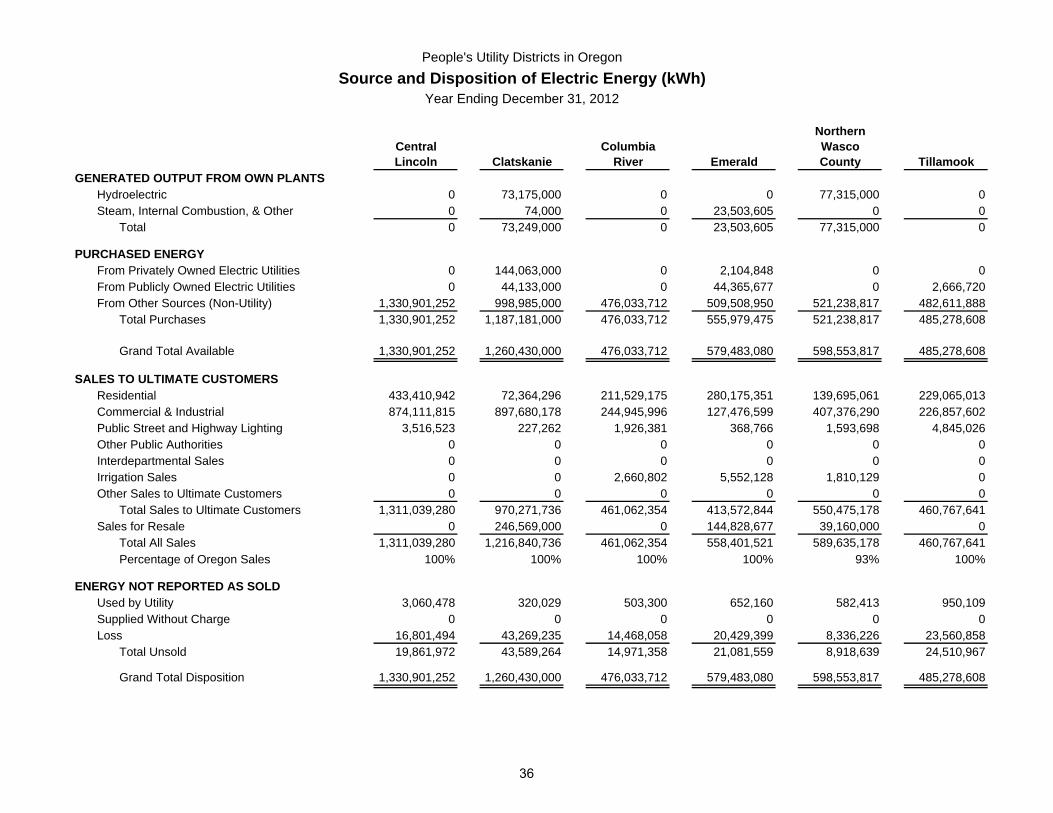
People's Utility Districts in OregonSource and Disposition of Electric Energy (kWh)
Year Ending December 31, 2012
NorthernCentral Columbia WascoLincoln Clatskanie River Emerald County Tillamook
GENERATED OUTPUT FROM OWN PLANTSHydroelectric 0 73,175,000 0 0 77,315,000 0Steam, Internal Combustion, & Other 0 74,000 0 23,503,605 0 0
Total 0 73,249,000 0 23,503,605 77,315,000 0
PURCHASED ENERGYFrom Privately Owned Electric Utilities 0 144,063,000 0 2,104,848 0 0From Publicly Owned Electric Utilities 0 44,133,000 0 44,365,677 0 2,666,720From Other Sources (Non-Utility) 1,330,901,252 998,985,000 476,033,712 509,508,950 521,238,817 482,611,888
Total Purchases 1,330,901,252 1,187,181,000 476,033,712 555,979,475 521,238,817 485,278,608
Grand Total Available 1,330,901,252 1,260,430,000 476,033,712 579,483,080 598,553,817 485,278,608
SALES TO ULTIMATE CUSTOMERSResidential 433,410,942 72,364,296 211,529,175 280,175,351 139,695,061 229,065,013Commercial & Industrial 874,111,815 897,680,178 244,945,996 127,476,599 407,376,290 226,857,602Public Street and Highway Lighting 3,516,523 227,262 1,926,381 368,766 1,593,698 4,845,026Other Public Authorities 0 0 0 0 0 0Interdepartmental Sales 0 0 0 0 0 0Irrigation Sales 0 0 2,660,802 5,552,128 1,810,129 0Other Sales to Ultimate Customers 0 0 0 0 0 0
Total Sales to Ultimate Customers 1,311,039,280 970,271,736 461,062,354 413,572,844 550,475,178 460,767,641Sales for Resale 0 246,569,000 0 144,828,677 39,160,000 0
Total All Sales 1,311,039,280 1,216,840,736 461,062,354 558,401,521 589,635,178 460,767,641Percentage of Oregon Sales 100% 100% 100% 100% 93% 100%
ENERGY NOT REPORTED AS SOLDUsed by Utility 3,060,478 320,029 503,300 652,160 582,413 950,109Supplied Without Charge 0 0 0 0 0 0Loss 16,801,494 43,269,235 14,468,058 20,429,399 8,336,226 23,560,858
Total Unsold 19,861,972 43,589,264 14,971,358 21,081,559 8,918,639 24,510,967
Grand Total Disposition 1,330,901,252 1,260,430,000 476,033,712 579,483,080 598,553,817 485,278,608
36
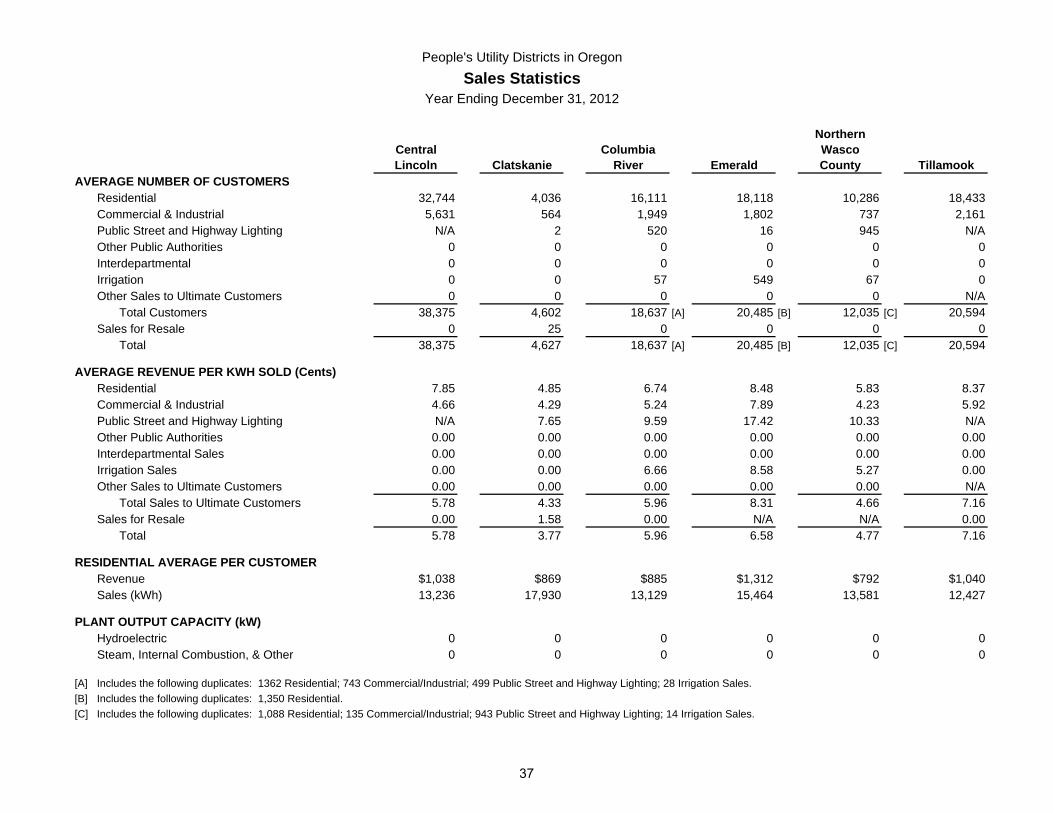
People's Utility Districts in OregonSales Statistics
Year Ending December 31, 2012
NorthernCentral Columbia WascoLincoln Clatskanie River Emerald County Tillamook
AVERAGE NUMBER OF CUSTOMERSResidential 32,744 4,036 16,111 18,118 10,286 18,433Commercial & Industrial 5,631 564 1,949 1,802 737 2,161Public Street and Highway Lighting N/A 2 520 16 945 N/AOther Public Authorities 0 0 0 0 0 0Interdepartmental 0 0 0 0 0 0Irrigation 0 0 57 549 67 0Other Sales to Ultimate Customers 0 0 0 0 0 N/A
Total Customers 38,375 4,602 18,637 [A] 20,485 [B] 12,035 [C] 20,594Sales for Resale 0 25 0 0 0 0
Total 38,375 4,627 18,637 [A] 20,485 [B] 12,035 [C] 20,594
AVERAGE REVENUE PER KWH SOLD (Cents)Residential 7.85 4.85 6.74 8.48 5.83 8.37Commercial & Industrial 4.66 4.29 5.24 7.89 4.23 5.92Public Street and Highway Lighting N/A 7.65 9.59 17.42 10.33 N/AOther Public Authorities 0.00 0.00 0.00 0.00 0.00 0.00Interdepartmental Sales 0.00 0.00 0.00 0.00 0.00 0.00Irrigation Sales 0.00 0.00 6.66 8.58 5.27 0.00Other Sales to Ultimate Customers 0.00 0.00 0.00 0.00 0.00 N/A
Total Sales to Ultimate Customers 5.78 4.33 5.96 8.31 4.66 7.16Sales for Resale 0.00 1.58 0.00 N/A N/A 0.00
Total 5.78 3.77 5.96 6.58 4.77 7.16
RESIDENTIAL AVERAGE PER CUSTOMERRevenue $1,038 $869 $885 $1,312 $792 $1,040Sales (kWh) 13,236 17,930 13,129 15,464 13,581 12,427
PLANT OUTPUT CAPACITY (kW)Hydroelectric 0 0 0 0 0 0Steam, Internal Combustion, & Other 0 0 0 0 0 0
[A] Includes the following duplicates: 1362 Residential; 743 Commercial/Industrial; 499 Public Street and Highway Lighting; 28 Irrigation Sales.[B] Includes the following duplicates: 1,350 Residential.[C] Includes the following duplicates: 1,088 Residential; 135 Commercial/Industrial; 943 Public Street and Highway Lighting; 14 Irrigation Sales.
37
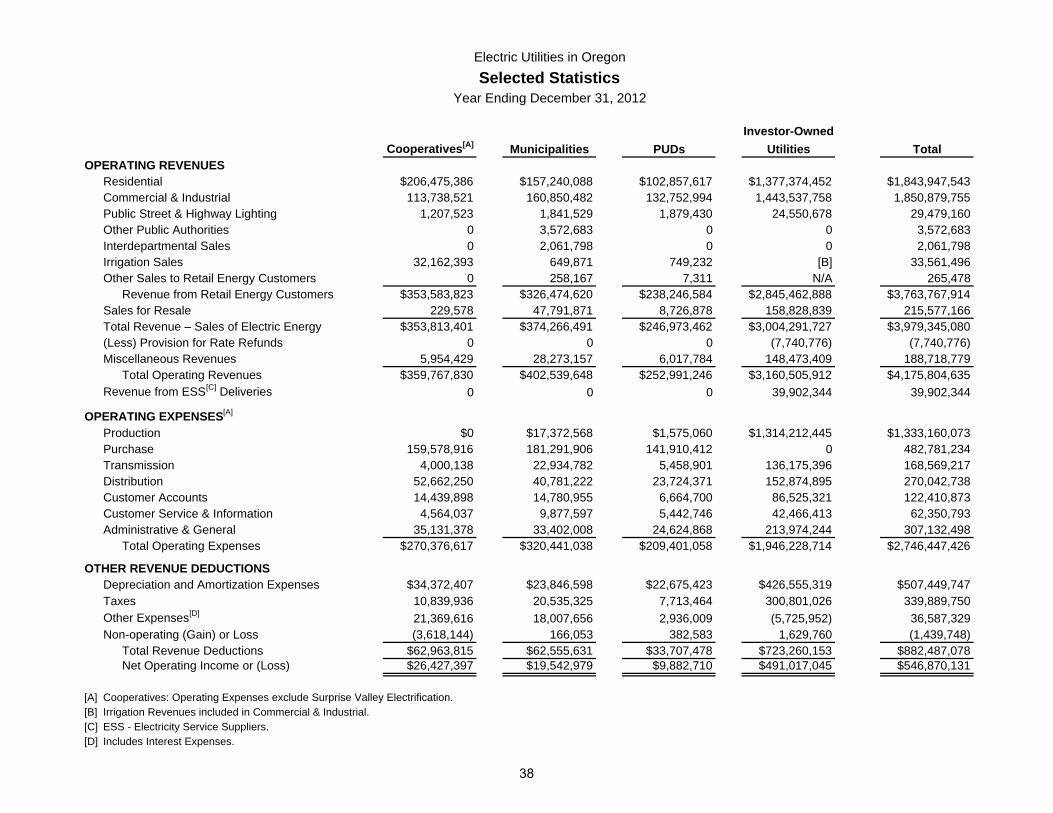
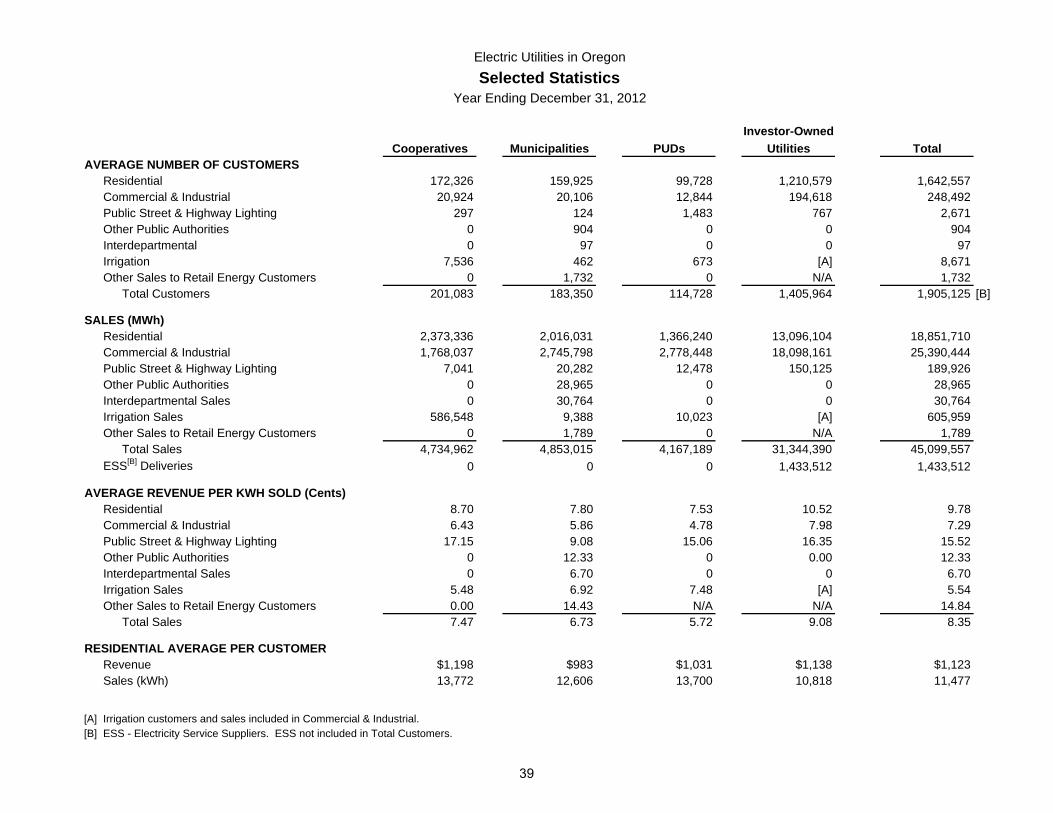
Electric Utilities in OregonSelected Statistics
Year Ending December 31, 2012
Investor-OwnedCooperatives[A] Municipalities PUDs Utilities Total
OPERATING REVENUESResidential $206,475,386 $157,240,088 $102,857,617 $1,377,374,452 $1,843,947,543Commercial & Industrial 113,738,521 160,850,482 132,752,994 1,443,537,758 1,850,879,755Public Street & Highway Lighting 1,207,523 1,841,529 1,879,430 24,550,678 29,479,160Other Public Authorities 0 3,572,683 0 0 3,572,683Interdepartmental Sales 0 2,061,798 0 0 2,061,798Irrigation Sales 32,162,393 649,871 749,232 [B] 33,561,496Other Sales to Retail Energy Customers 0 258,167 7,311 N/A 265,478
Revenue from Retail Energy Customers $353,583,823 $326,474,620 $238,246,584 $2,845,462,888 $3,763,767,914Sales for Resale 229,578 47,791,871 8,726,878 158,828,839 215,577,166Total Revenue – Sales of Electric Energy $353,813,401 $374,266,491 $246,973,462 $3,004,291,727 $3,979,345,080(Less) Provision for Rate Refunds 0 0 0 (7,740,776) (7,740,776)Miscellaneous Revenues 5,954,429 28,273,157 6,017,784 148,473,409 188,718,779
Total Operating Revenues $359,767,830 $402,539,648 $252,991,246 $3,160,505,912 $4,175,804,635Revenue from ESS[C] Deliveries 0 0 0 39,902,344 39,902,344
OPERATING EXPENSES[A]
Production $0 $17,372,568 $1,575,060 $1,314,212,445 $1,333,160,073Purchase 159,578,916 181,291,906 141,910,412 0 482,781,234Transmission 4,000,138 22,934,782 5,458,901 136,175,396 168,569,217Distribution 52,662,250 40,781,222 23,724,371 152,874,895 270,042,738Customer Accounts 14,439,898 14,780,955 6,664,700 86,525,321 122,410,873Customer Service & Information 4,564,037 9,877,597 5,442,746 42,466,413 62,350,793Administrative & General 35,131,378 33,402,008 24,624,868 213,974,244 307,132,498
Total Operating Expenses $270,376,617 $320,441,038 $209,401,058 $1,946,228,714 $2,746,447,426
OTHER REVENUE DEDUCTIONSDepreciation and Amortization Expenses $34,372,407 $23,846,598 $22,675,423 $426,555,319 $507,449,747Taxes 10,839,936 20,535,325 7,713,464 300,801,026 339,889,750Other Expenses[D] 21,369,616 18,007,656 2,936,009 (5,725,952) 36,587,329Non-operating (Gain) or Loss (3,618,144) 166,053 382,583 1,629,760 (1,439,748)
Total Revenue Deductions $62,963,815 $62,555,631 $33,707,478 $723,260,153 $882,487,078Net Operating Income or (Loss) $26,427,397 $19,542,979 $9,882,710 $491,017,045 $546,870,131
[A] Cooperatives: Operating Expenses exclude Surprise Valley Electrification.[B] Irrigation Revenues included in Commercial & Industrial.[C] ESS - Electricity Service Suppliers.[D] Includes Interest Expenses.
38
Electric Utilities in OregonSelected Statistics
Year Ending December 31, 2012
Investor-OwnedCooperatives Municipalities PUDs Utilities Total
AVERAGE NUMBER OF CUSTOMERSResidential 172,326 159,925 99,728 1,210,579 1,642,557Commercial & Industrial 20,924 20,106 12,844 194,618 248,492Public Street & Highway Lighting 297 124 1,483 767 2,671Other Public Authorities 0 904 0 0 904Interdepartmental 0 97 0 0 97Irrigation 7,536 462 673 [A] 8,671Other Sales to Retail Energy Customers 0 1,732 0 N/A 1,732
Total Customers 201,083 183,350 114,728 1,405,964 1,905,125 [B]
SALES (MWh)Residential 2,373,336 2,016,031 1,366,240 13,096,104 18,851,710Commercial & Industrial 1,768,037 2,745,798 2,778,448 18,098,161 25,390,444Public Street & Highway Lighting 7,041 20,282 12,478 150,125 189,926Other Public Authorities 0 28,965 0 0 28,965Interdepartmental Sales 0 30,764 0 0 30,764Irrigation Sales 586,548 9,388 10,023 [A] 605,959Other Sales to Retail Energy Customers 0 1,789 0 N/A 1,789
Total Sales 4,734,962 4,853,015 4,167,189 31,344,390 45,099,557ESS[B] Deliveries 0 0 0 1,433,512 1,433,512
AVERAGE REVENUE PER KWH SOLD (Cents)Residential 8.70 7.80 7.53 10.52 9.78Commercial & Industrial 6.43 5.86 4.78 7.98 7.29Public Street & Highway Lighting 17.15 9.08 15.06 16.35 15.52Other Public Authorities 0 12.33 0 0.00 12.33Interdepartmental Sales 0 6.70 0 0 6.70Irrigation Sales 5.48 6.92 7.48 [A] 5.54Other Sales to Retail Energy Customers 0.00 14.43 N/A N/A 14.84
Total Sales 7.47 6.73 5.72 9.08 8.35
RESIDENTIAL AVERAGE PER CUSTOMERRevenue $1,198 $983 $1,031 $1,138 $1,123Sales (kWh) 13,772 12,606 13,700 10,818 11,477
[A] Irrigation customers and sales included in Commercial & Industrial.[B] ESS - Electricity Service Suppliers. ESS not included in Total Customers.
39
Natural Gas

Foreword to Natural Gas Utilities
There are three investor-owned natural gas utilities operating in Oregon. They reported sales of 813 million therms in Oregon during 2012 resulting in operating revenues from natural gas sales of $882 million. Northwest Natural Gas Company, dba NW Natural, is the largest natural gas distribution utility operating in Oregon. During 2012, NW Natural’s Oregon total operating revenues comprised 74 percent of the total for the state. The company’s operating expenses, excluding depreciation, amortization, and taxes, represented 69 percent of the total expenses for the three utilities. NW Natural’s delivered therm volumes, excluding transportation, accounted for 82 percent of Oregon natural gas utility therm sales.
40
Index to Natural Gas Utilities
Page Investor-Owned
Avista Utilities (Avista) Cascade Natural Gas Corporation (Cascade) Northwest Natural Gas Company (dba NW Natural)
Ten-Year Summaries ................................................................................................................................................. 42 Graphs for 2012 ......................................................................................................................................................... 46 Financial and Statistical Data
Balance Sheet – Total System ............................................................................................................................ 51 Income Statement – Total System ...................................................................................................................... 52 Financial Data – Oregon and Total System ......................................................................................................... 53 Natural Gas Purchase and Delivery Statistics – Total Oregon ............................................................................ 54
41
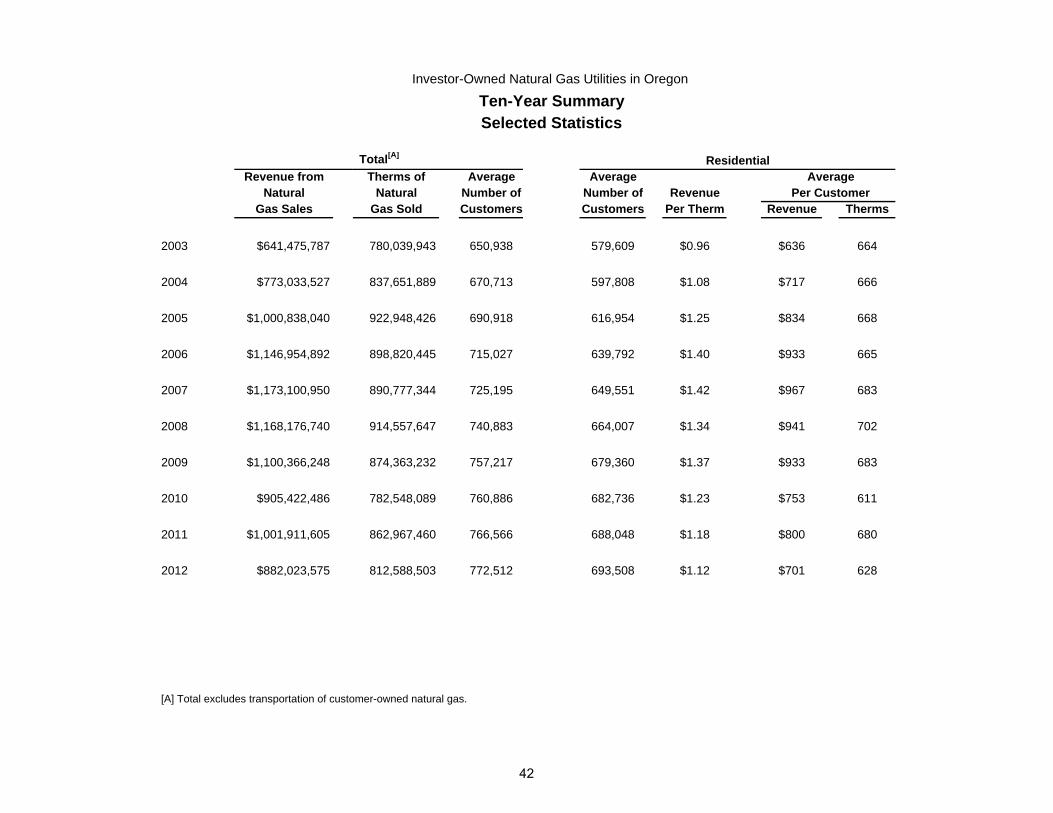
Investor-Owned Natural Gas Utilities in Oregon
Ten-Year SummarySelected Statistics
Total[A]
Revenue from Therms of Average Average AverageNatural Natural Number of Number of Revenue Per Customer
Gas Sales Gas Sold Customers Customers Per Therm Revenue Therms
2003 $641,475,787 780,039,943 650,938 579,609 $0.96 $636 664
2004 $773,033,527 837,651,889 670,713 597,808 $1.08 $717 666
2005 $1,000,838,040 922,948,426 690,918 616,954 $1.25 $834 668
2006 $1,146,954,892 898,820,445 715,027 639,792 $1.40 $933 665
2007 $1,173,100,950 890,777,344 725,195 649,551 $1.42 $967 683
2008 $1,168,176,740 914,557,647 740,883 664,007 $1.34 $941 702
2009 $1,100,366,248 874,363,232 757,217 679,360 $1.37 $933 683
2010 $905,422,486 782,548,089 760,886 682,736 $1.23 $753 611
2011 $1,001,911,605 862,967,460 766,566 688,048 $1.18 $800 680
2012 $882,023,575 812,588,503 772,512 693,508 $1.12 $701 628
[A] Total excludes transportation of customer-owned natural gas.
Residential
42
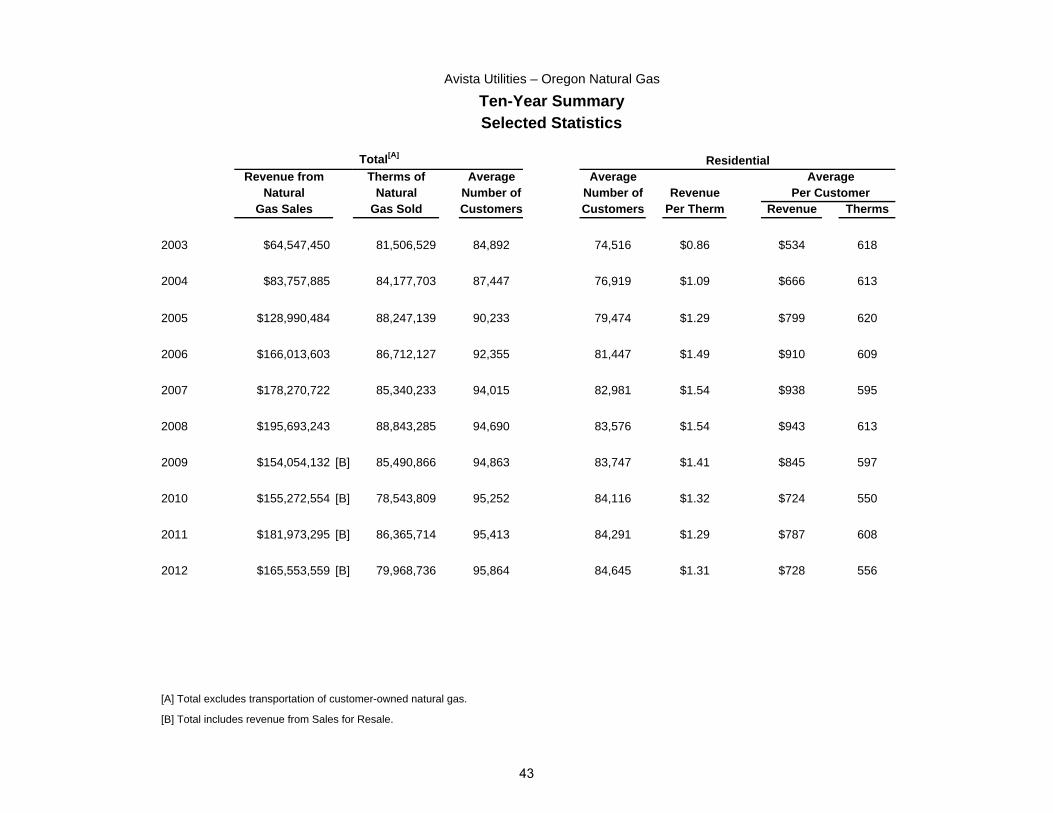
Avista Utilities – Oregon Natural Gas
Ten-Year SummarySelected Statistics
Total[A]
Revenue from Therms of Average Average AverageNatural Natural Number of Number of Revenue Per Customer
Gas Sales Gas Sold Customers Customers Per Therm Revenue Therms
2003 $64,547,450 81,506,529 84,892 74,516 $0.86 $534 618
2004 $83,757,885 84,177,703 87,447 76,919 $1.09 $666 613
2005 $128,990,484 88,247,139 90,233 79,474 $1.29 $799 620
2006 $166,013,603 86,712,127 92,355 81,447 $1.49 $910 609
2007 $178,270,722 85,340,233 94,015 82,981 $1.54 $938 595
2008 $195,693,243 88,843,285 94,690 83,576 $1.54 $943 613
2009 $154,054,132 [B] 85,490,866 94,863 83,747 $1.41 $845 597
2010 $155,272,554 [B] 78,543,809 95,252 84,116 $1.32 $724 550
2011 $181,973,295 [B] 86,365,714 95,413 84,291 $1.29 $787 608
2012 $165,553,559 [B] 79,968,736 95,864 84,645 $1.31 $728 556
[A] Total excludes transportation of customer-owned natural gas.
[B] Total includes revenue from Sales for Resale.
Residential
43

Cascade Natural Gas Corporation – Oregon Natural Gas
Ten-Year SummarySelected Statistics
Total[A]
Revenue from Therms of Average Average AverageNatural Natural Number of Number of Revenue Per Customer
Gas Sales Gas Sold Customers Customers Per Therm Revenue Therms
2003 $58,353,871 69,824,484 48,338 40,546 $0.96 $675 705
2004 $65,270,261 74,402,036 51,049 43,116 $1.00 $722 725
2005 $79,796,124 79,403,557 54,648 46,455 $1.10 $815 743
2006 $89,997,086 81,951,508 58,155 49,744 $1.22 $895 732
2007 $98,359,515 87,598,167 61,260 52,585 $1.28 $926 725
2008 $104,944,590 85,790,702 62,657 53,647 $1.28 $948 742
2009 $92,154,049 75,534,246 62,997 53,818 $1.29 $953 740
2010 $73,880,015 69,215,020 63,733 54,373 $1.12 $757 674
2011 $80,606,310 74,489,216 64,355 54,891 $1.11 $802 723
2012 $68,132,016 69,348,827 64,869 55,366 $0.99 $667 671
[A] Total excludes transportation of customer-owned natural gas.
Residential
44

Northwest Natural Gas Company – Oregon Natural Gas
Ten-Year SummarySelected Statistics
Total[A]
Revenue from Therms of Average Average AverageNatural Natural Number of Number of Revenue Per Customer
Gas Sales Gas Sold Customers Customers Per Therm Revenue Therms
2003 $518,574,466 628,708,930 517,708 464,547 $0.97 $648 667
2004 $624,005,381 679,072,150 532,217 477,773 $1.08 $725 669
2005 $792,051,432 755,297,730 546,037 491,025 $1.26 $841 669
2006 $890,944,203 730,156,810 564,517 508,601 $1.41 $941 668
2007 $896,470,713 717,838,944 569,920 513,985 $1.41 $975 693
2008 $867,538,907 739,923,660 583,536 526,784 $1.32 $941 712
2009 $854,158,067 713,338,120 599,357 541,795 $1.37 $945 690
2010 $676,269,917 634,789,260 601,901 544,247 $1.23 $758 614
2011 $739,332,000 702,112,530 606,798 548,866 $1.17 $801 687
2012 $648,338,000 663,270,940 611,779 553,497 $1.10 $701 635
[A] Total excludes transportation of customer-owned natural gas.
Residential
45
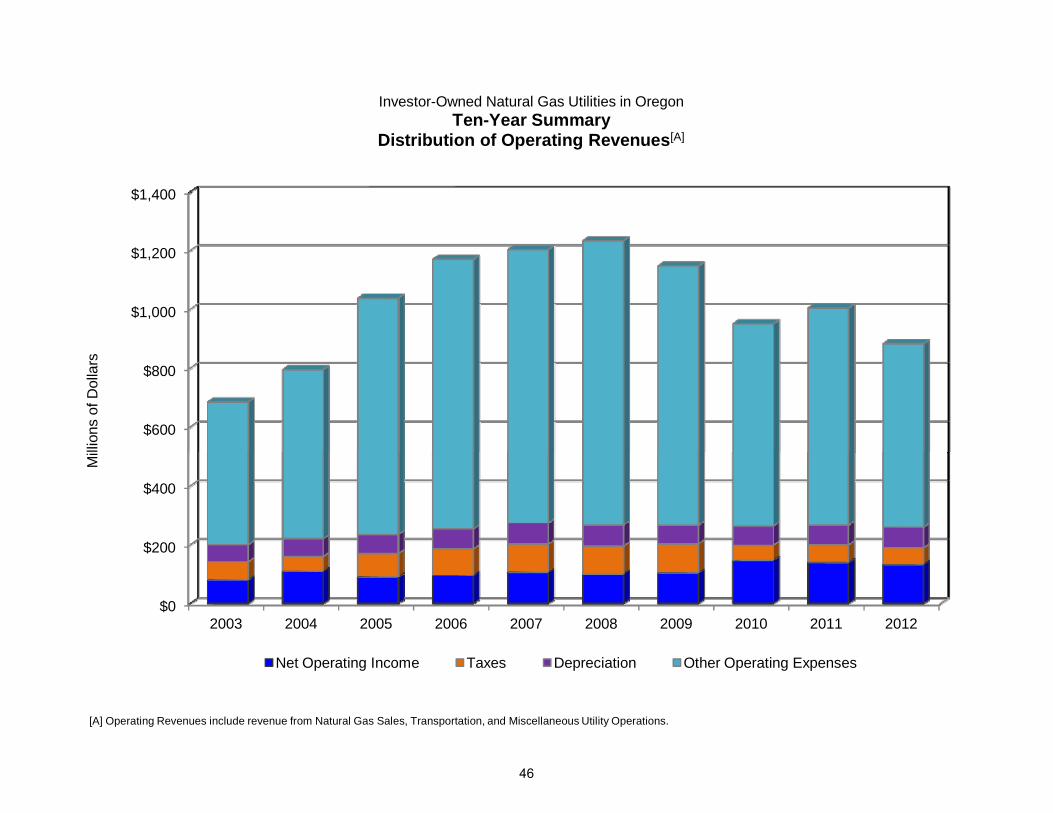
$600
$800
$1,000
$1,200
$1,400
llion
s of
Dol
lars
Investor-Owned Natural Gas Utilities in OregonTen-Year Summary
Distribution of Operating Revenues[A]
$0
$200
$400
2003 2004 2005 2006 2007 2008 2009 2010 2011 2012
Mi
[A] Operating Revenues include revenue from Natural Gas Sales, Transportation, and Miscellaneous Utility Operations.
Net Operating Income Taxes Depreciation Other Operating Expenses
46
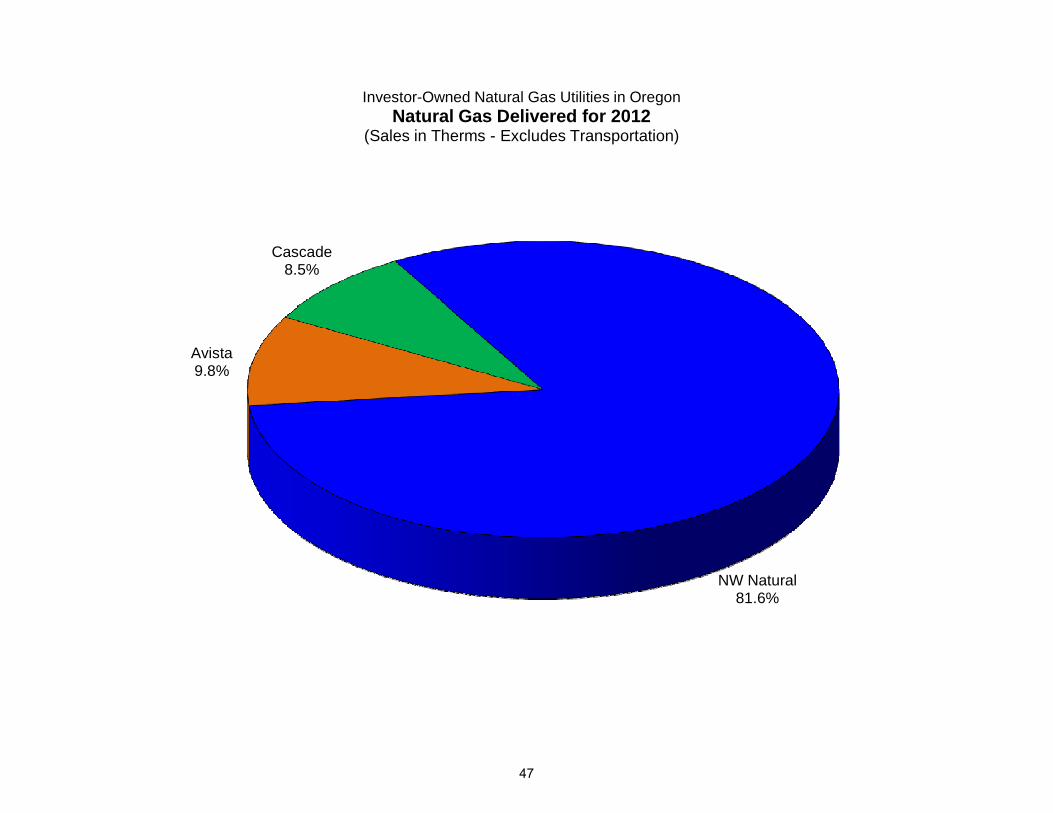
Avista 9.8%
Cascade8.5%
Investor-Owned Natural Gas Utilities in Oregon Natural Gas Delivered for 2012
(Sales in Therms - Excludes Transportation)
NW Natural81.6%
47
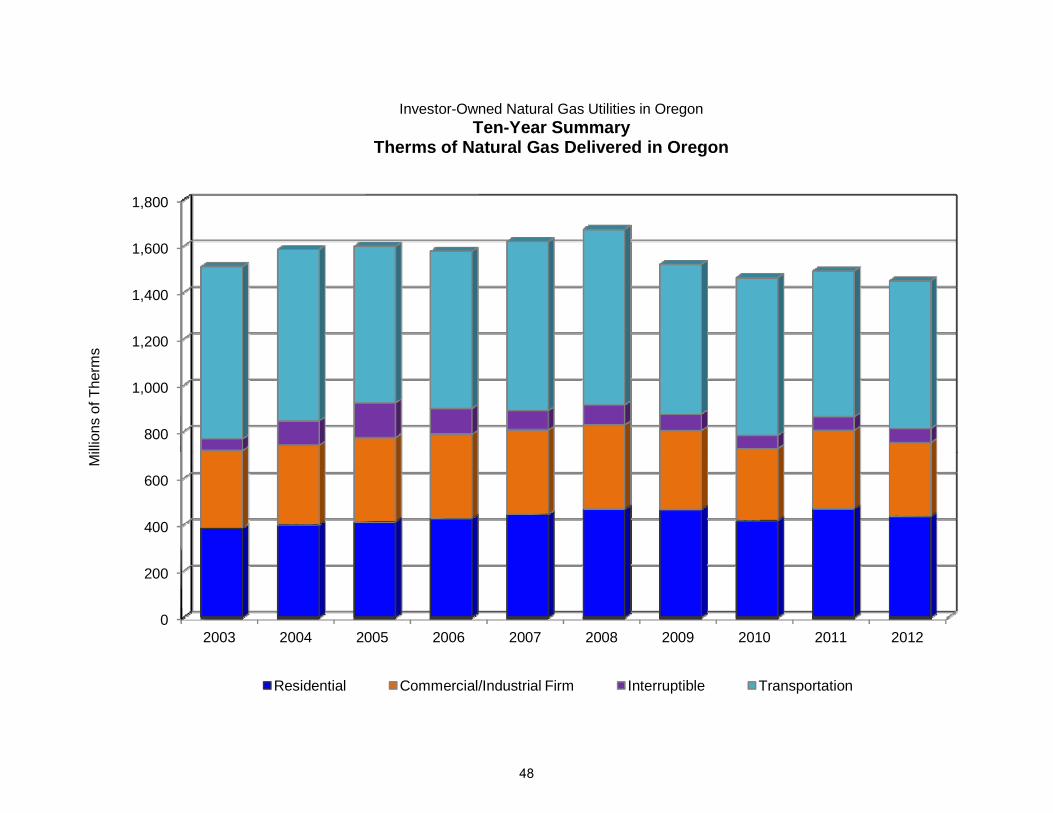
800
1,000
1,200
1,400
1,600
1,800
llion
s of
The
rms
Investor-Owned Natural Gas Utilities in OregonTen-Year Summary
Therms of Natural Gas Delivered in Oregon
0
200
400
600
2003 2004 2005 2006 2007 2008 2009 2010 2011 2012
Mi
Residential Commercial/Industrial Firm Interruptible Transportation
48
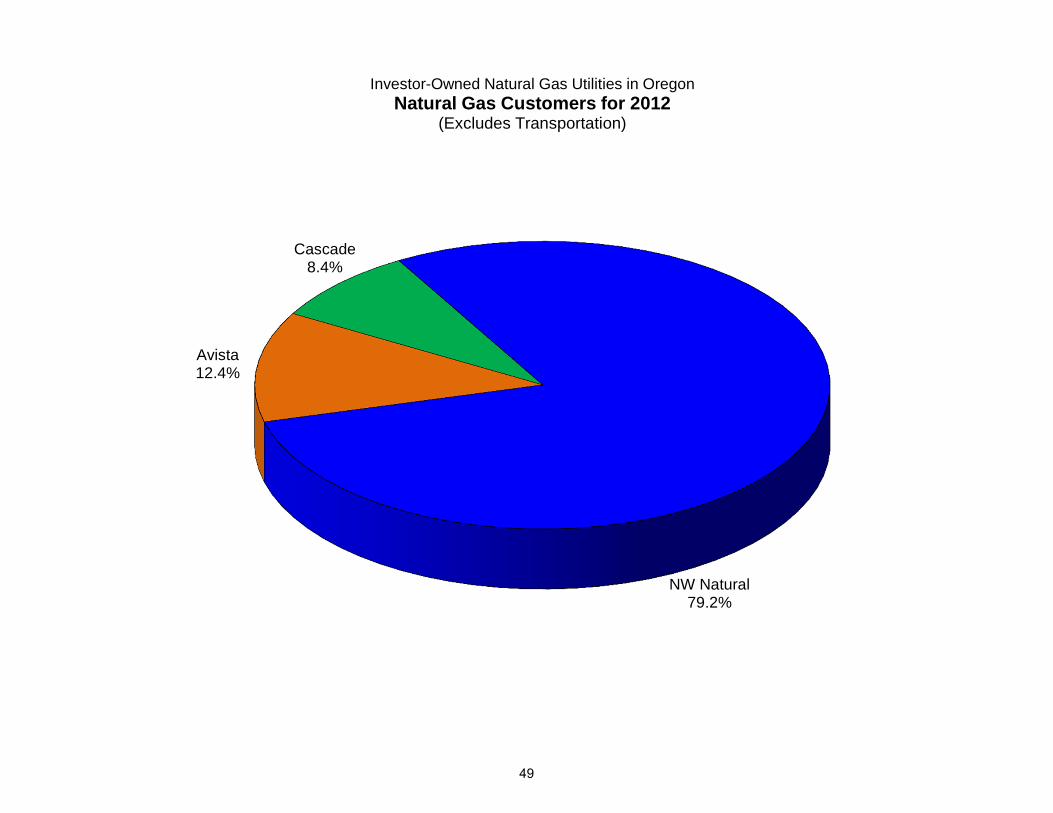
NW Natural79.2%
Avista 12.4%
Cascade8.4%
Investor-Owned Natural Gas Utilities in Oregon Natural Gas Customers for 2012
(Excludes Transportation)
49
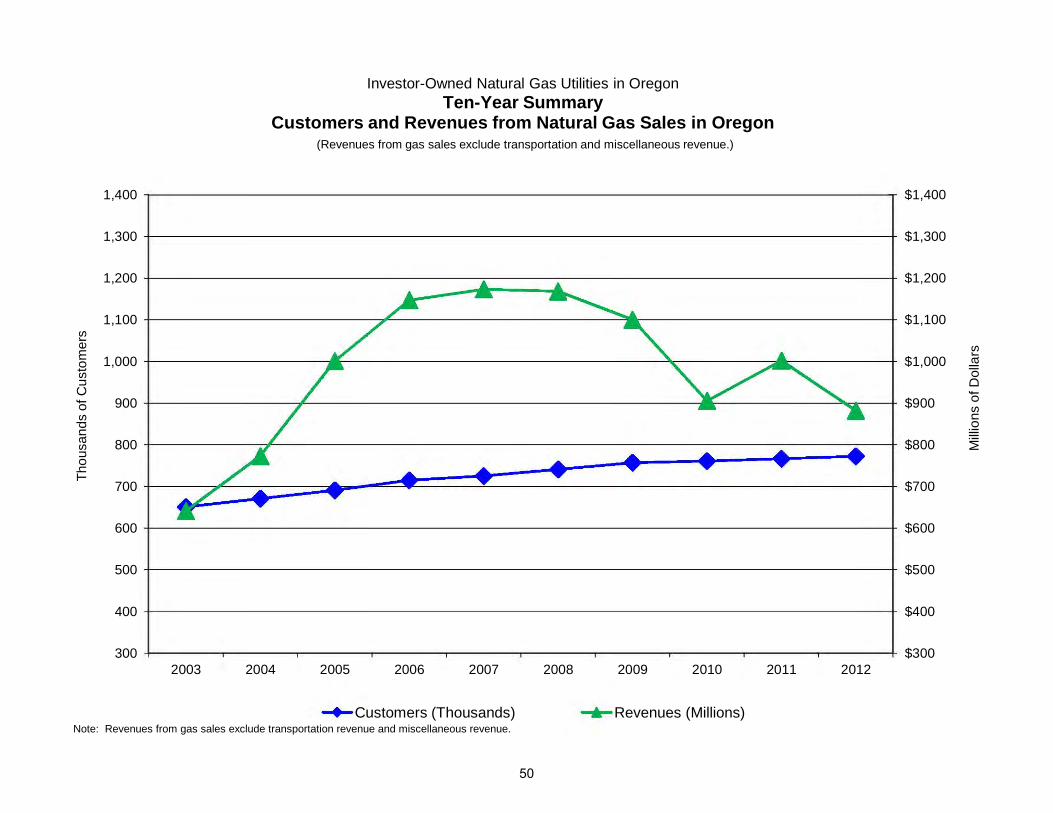
$800
$900
$1,000
$1,100
$1,200
$1,300
$1,400
800
900
1,000
1,100
1,200
1,300
1,400
Mill
ions
of D
olla
rs
usan
ds o
f Cus
tom
ers
Investor-Owned Natural Gas Utilities in OregonTen-Year Summary
Customers and Revenues from Natural Gas Sales in Oregon(Revenues from gas sales exclude transportation and miscellaneous revenue.)
Note: Revenues from gas sales exclude transportation revenue and miscellaneous revenue.
$300
$400
$500
$600
$700
300
400
500
600
700
2003 2004 2005 2006 2007 2008 2009 2010 2011 2012
Thou
Customers (Thousands) Revenues (Millions)
50
~ .... ....
~ - ~ / ~ ...
/ / - ~
/ ..... ..... ..... ....... ..... ..... ..... ..... ..... .....
...... .... ..... .... _.. /__ ...... .... .- ....
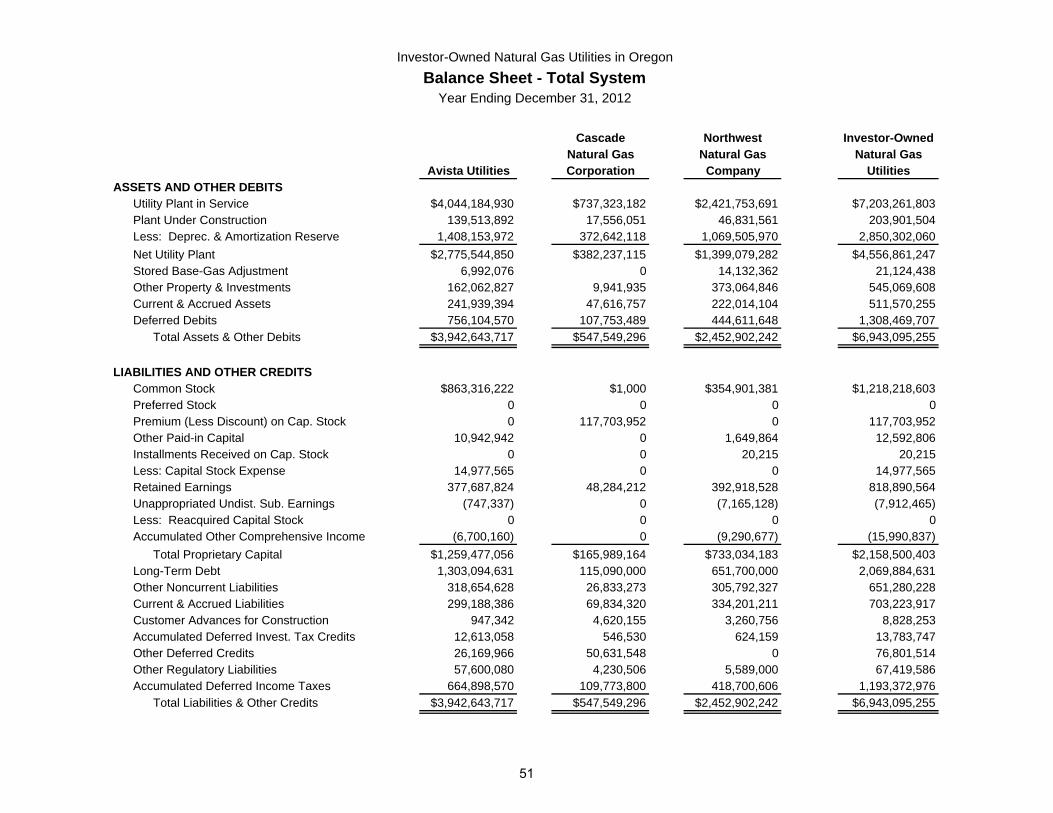
Investor-Owned Natural Gas Utilities in OregonBalance Sheet - Total System
Year Ending December 31, 2012
Cascade Northwest Investor-OwnedNatural Gas Natural Gas Natural Gas
Avista Utilities Corporation Company UtilitiesASSETS AND OTHER DEBITS
Utility Plant in Service $4,044,184,930 $737,323,182 $2,421,753,691 $7,203,261,803Plant Under Construction 139,513,892 17,556,051 46,831,561 203,901,504Less: Deprec. & Amortization Reserve 1,408,153,972 372,642,118 1,069,505,970 2,850,302,060Net Utility Plant $2,775,544,850 $382,237,115 $1,399,079,282 $4,556,861,247Stored Base-Gas Adjustment 6,992,076 0 14,132,362 21,124,438Other Property & Investments 162,062,827 9,941,935 373,064,846 545,069,608Current & Accrued Assets 241,939,394 47,616,757 222,014,104 511,570,255Deferred Debits 756,104,570 107,753,489 444,611,648 1,308,469,707
Total Assets & Other Debits $3,942,643,717 $547,549,296 $2,452,902,242 $6,943,095,255
LIABILITIES AND OTHER CREDITS Common Stock $863,316,222 $1,000 $354,901,381 $1,218,218,603Preferred Stock 0 0 0 0Premium (Less Discount) on Cap. Stock 0 117,703,952 0 117,703,952Other Paid-in Capital 10,942,942 0 1,649,864 12,592,806Installments Received on Cap. Stock 0 0 20,215 20,215Less: Capital Stock Expense 14,977,565 0 0 14,977,565Retained Earnings 377,687,824 48,284,212 392,918,528 818,890,564Unappropriated Undist. Sub. Earnings (747,337) 0 (7,165,128) (7,912,465)Less: Reacquired Capital Stock 0 0 0 0Accumulated Other Comprehensive Income (6,700,160) 0 (9,290,677) (15,990,837)
Total Proprietary Capital $1,259,477,056 $165,989,164 $733,034,183 $2,158,500,403Long-Term Debt 1,303,094,631 115,090,000 651,700,000 2,069,884,631Other Noncurrent Liabilities 318,654,628 26,833,273 305,792,327 651,280,228Current & Accrued Liabilities 299,188,386 69,834,320 334,201,211 703,223,917Customer Advances for Construction 947,342 4,620,155 3,260,756 8,828,253Accumulated Deferred Invest. Tax Credits 12,613,058 546,530 624,159 13,783,747Other Deferred Credits 26,169,966 50,631,548 0 76,801,514Other Regulatory Liabilities 57,600,080 4,230,506 5,589,000 67,419,586Accumulated Deferred Income Taxes 664,898,570 109,773,800 418,700,606 1,193,372,976
Total Liabilities & Other Credits $3,942,643,717 $547,549,296 $2,452,902,242 $6,943,095,255
51
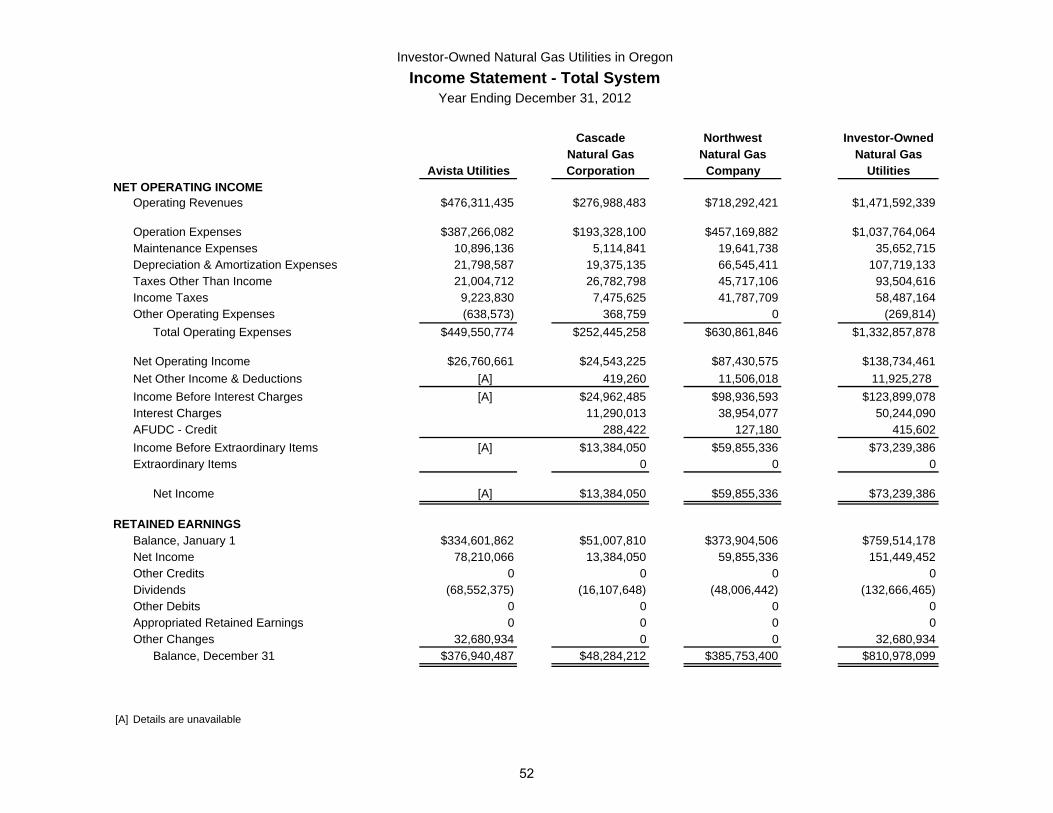
Investor-Owned Natural Gas Utilities in OregonIncome Statement - Total System
Year Ending December 31, 2012
Cascade Northwest Investor-OwnedNatural Gas Natural Gas Natural Gas
Avista Utilities Corporation Company UtilitiesNET OPERATING INCOME
Operating Revenues $476,311,435 $276,988,483 $718,292,421 $1,471,592,339
Operation Expenses $387,266,082 $193,328,100 $457,169,882 $1,037,764,064Maintenance Expenses 10,896,136 5,114,841 19,641,738 35,652,715Depreciation & Amortization Expenses 21,798,587 19,375,135 66,545,411 107,719,133Taxes Other Than Income 21,004,712 26,782,798 45,717,106 93,504,616Income Taxes 9,223,830 7,475,625 41,787,709 58,487,164Other Operating Expenses (638,573) 368,759 0 (269,814)
Total Operating Expenses $449,550,774 $252,445,258 $630,861,846 $1,332,857,878
Net Operating Income $26,760,661 $24,543,225 $87,430,575 $138,734,461Net Other Income & Deductions [A] 419,260 11,506,018 11,925,278Income Before Interest Charges [A] $24,962,485 $98,936,593 $123,899,078Interest Charges 11,290,013 38,954,077 50,244,090AFUDC - Credit 288,422 127,180 415,602Income Before Extraordinary Items [A] $13,384,050 $59,855,336 $73,239,386Extraordinary Items 0 0 0
Net Income [A] $13,384,050 $59,855,336 $73,239,386
RETAINED EARNINGS Balance, January 1 $334,601,862 $51,007,810 $373,904,506 $759,514,178Net Income 78,210,066 13,384,050 59,855,336 151,449,452Other Credits 0 0 0 0Dividends (68,552,375) (16,107,648) (48,006,442) (132,666,465)Other Debits 0 0 0 0Appropriated Retained Earnings 0 0 0 0Other Changes 32,680,934 0 0 32,680,934
Balance, December 31 $376,940,487 $48,284,212 $385,753,400 $810,978,099
[A] Details are unavailable
52
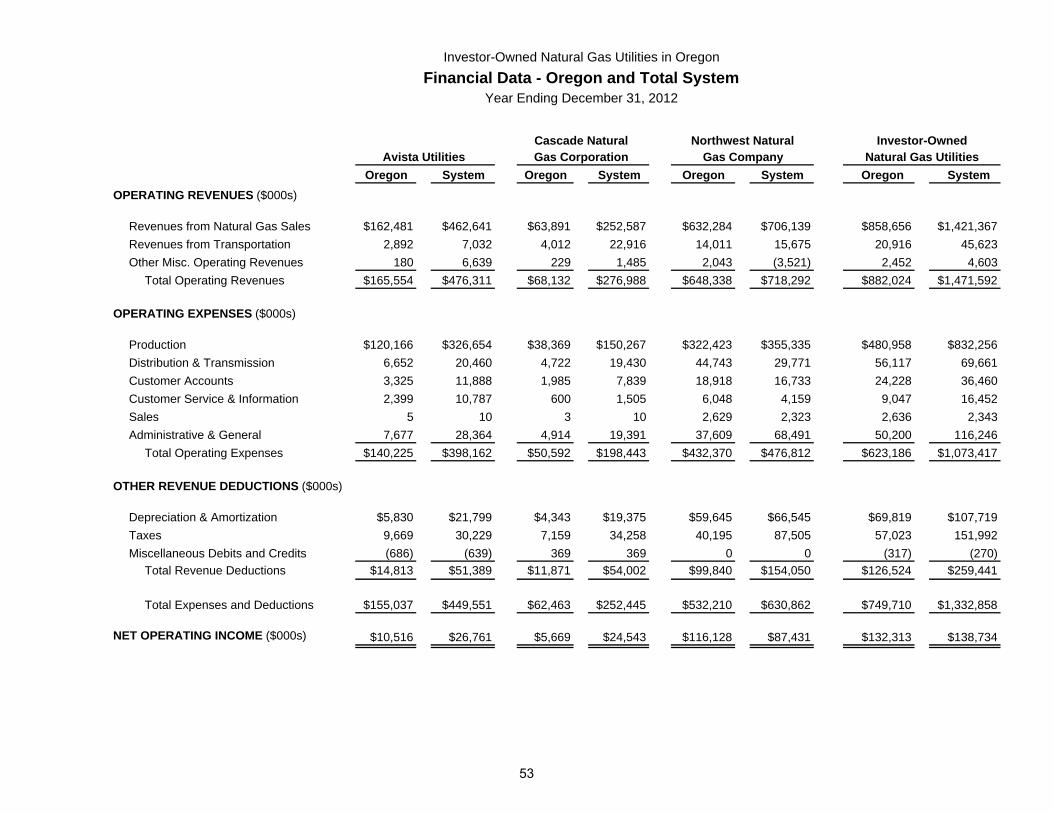
Investor-Owned Natural Gas Utilities in OregonFinancial Data - Oregon and Total System
Year Ending December 31, 2012
Cascade Natural Northwest Natural Investor-OwnedAvista Utilities Gas Corporation Gas Company Natural Gas Utilities
Oregon System Oregon System Oregon System Oregon SystemOPERATING REVENUES ($000s)
Revenues from Natural Gas Sales $162,481 $462,641 $63,891 $252,587 $632,284 $706,139 $858,656 $1,421,367Revenues from Transportation 2,892 7,032 4,012 22,916 14,011 15,675 20,916 45,623Other Misc. Operating Revenues 180 6,639 229 1,485 2,043 (3,521) 2,452 4,603
Total Operating Revenues $165,554 $476,311 $68,132 $276,988 $648,338 $718,292 $882,024 $1,471,592
OPERATING EXPENSES ($000s)
Production $120,166 $326,654 $38,369 $150,267 $322,423 $355,335 $480,958 $832,256Distribution & Transmission 6,652 20,460 4,722 19,430 44,743 29,771 56,117 69,661Customer Accounts 3,325 11,888 1,985 7,839 18,918 16,733 24,228 36,460Customer Service & Information 2,399 10,787 600 1,505 6,048 4,159 9,047 16,452Sales 5 10 3 10 2,629 2,323 2,636 2,343Administrative & General 7,677 28,364 4,914 19,391 37,609 68,491 50,200 116,246
Total Operating Expenses $140,225 $398,162 $50,592 $198,443 $432,370 $476,812 $623,186 $1,073,417
OTHER REVENUE DEDUCTIONS ($000s)
Depreciation & Amortization $5,830 $21,799 $4,343 $19,375 $59,645 $66,545 $69,819 $107,719Taxes 9,669 30,229 7,159 34,258 40,195 87,505 57,023 151,992Miscellaneous Debits and Credits (686) (639) 369 369 0 0 (317) (270)
Total Revenue Deductions $14,813 $51,389 $11,871 $54,002 $99,840 $154,050 $126,524 $259,441
Total Expenses and Deductions $155,037 $449,551 $62,463 $252,445 $532,210 $630,862 $749,710 $1,332,858
NET OPERATING INCOME ($000s) $10,516 $26,761 $5,669 $24,543 $116,128 $87,431 $132,313 $138,734
53
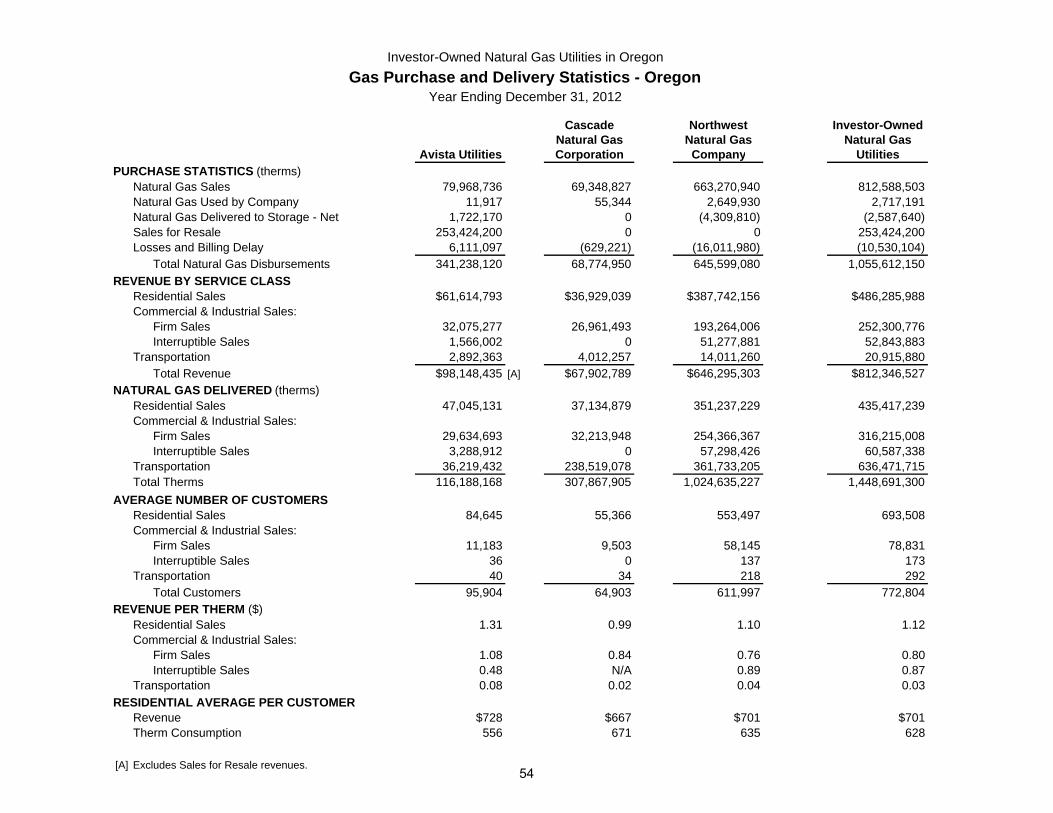
Investor-Owned Natural Gas Utilities in OregonGas Purchase and Delivery Statistics - Oregon
Year Ending December 31, 2012
Cascade Northwest Investor-OwnedNatural Gas Natural Gas Natural Gas
Avista Utilities Corporation Company UtilitiesPURCHASE STATISTICS (therms)
Natural Gas Sales 79,968,736 69,348,827 663,270,940 812,588,503Natural Gas Used by Company 11,917 55,344 2,649,930 2,717,191Natural Gas Delivered to Storage - Net 1,722,170 0 (4,309,810) (2,587,640)Sales for Resale 253,424,200 0 0 253,424,200Losses and Billing Delay 6,111,097 (629,221) (16,011,980) (10,530,104)
Total Natural Gas Disbursements 341,238,120 68,774,950 645,599,080 1,055,612,150REVENUE BY SERVICE CLASS
Residential Sales $61,614,793 $36,929,039 $387,742,156 $486,285,988Commercial & Industrial Sales:
Firm Sales 32,075,277 26,961,493 193,264,006 252,300,776Interruptible Sales 1,566,002 0 51,277,881 52,843,883
Transportation 2,892,363 4,012,257 14,011,260 20,915,880Total Revenue $98,148,435 [A] $67,902,789 $646,295,303 $812,346,527
NATURAL GAS DELIVERED (therms)Residential Sales 47,045,131 37,134,879 351,237,229 435,417,239Commercial & Industrial Sales:
Firm Sales 29,634,693 32,213,948 254,366,367 316,215,008Interruptible Sales 3,288,912 0 57,298,426 60,587,338
Transportation 36,219,432 238,519,078 361,733,205 636,471,715Total Therms 116,188,168 307,867,905 1,024,635,227 1,448,691,300
AVERAGE NUMBER OF CUSTOMERSResidential Sales 84,645 55,366 553,497 693,508Commercial & Industrial Sales:
Firm Sales 11,183 9,503 58,145 78,831Interruptible Sales 36 0 137 173
Transportation 40 34 218 292Total Customers 95,904 64,903 611,997 772,804
REVENUE PER THERM ($)Residential Sales 1.31 0.99 1.10 1.12Commercial & Industrial Sales:
Firm Sales 1.08 0.84 0.76 0.80Interruptible Sales 0.48 N/A 0.89 0.87
Transportation 0.08 0.02 0.04 0.03RESIDENTIAL AVERAGE PER CUSTOMER
Revenue $728 $667 $701 $701Therm Consumption 556 671 635 628
[A] Excludes Sales for Resale revenues.54

Telecommunications
Foreword to Telecommunications Utilities and Cooperatives (ILECs)
This section contains total company and total Oregon telecommunications data from annual reports filed by 31 incumbent local exchange carriers (ILECs). The ILECs consist of telecommunications utilities and cooperatives. Twenty-seven of the thirty-one ILECs serve less than 50,000 access lines in Oregon (small telecommunications utilities), and are partially exempt from regulation under Oregon Revised Statute (ORS) 759.040. Four ILECs have historically served more than 50,000 access lines (large telecommunications utilities), and are subject to local rate regulation.[1]
These data are shown as reported by the ILECs with two exceptions. First, Commission staff added directory revenues for Qwest Corporation dba CenturyLink QC, United Telephone Company of the Northwest dba CenturyLink, and Frontier Communications Northwest Inc. (formerly Verizon Communications, Inc.) as required by Commission order. Second, Commission staff estimated and added income taxes for privately held small telecommunications utilities to allow comparison with larger corporations.[2]
The total ILECs' 2012 gross Oregon operating revenues totaled $1.07 billion, a 3.1 percent decrease from 2011.[3] As measured by switched access lines, Qwest Corporation dba CenturyLink QC served 62 percent of Oregon's ILEC market and Frontier Communications served 21 percent of the ILEC market. The remaining ILECs served 17 percent. Therefore, the graphs and statistical data are heavily weighted by Qwest Corporation dba CenturyLink QC and Frontier Communications. The Public Utility Commission of Oregon implemented the Oregon Universal Service Fund (OUSF) program in 2001 to ensure that basic service is available to customers at reasonable and affordable rates. In the past five years, the annual average OUSF collected from approximately 239 certified telecommunications telephone service providers (TSPs) equaled $40 million. Disbursements to 33 eligible TSPs that provide basic local telephone service in the high-cost areas averaged $42 million.
[1] Competitive changes have resulted in some companies dropping below 50,000. [2] Some ILECs are S corporations that elect to pass corporate income, losses, deductions and credit through to their shareholders for federal tax purposes. [3] 2011 Gross Oregon Operating Revenues were $1.11 billion.
55
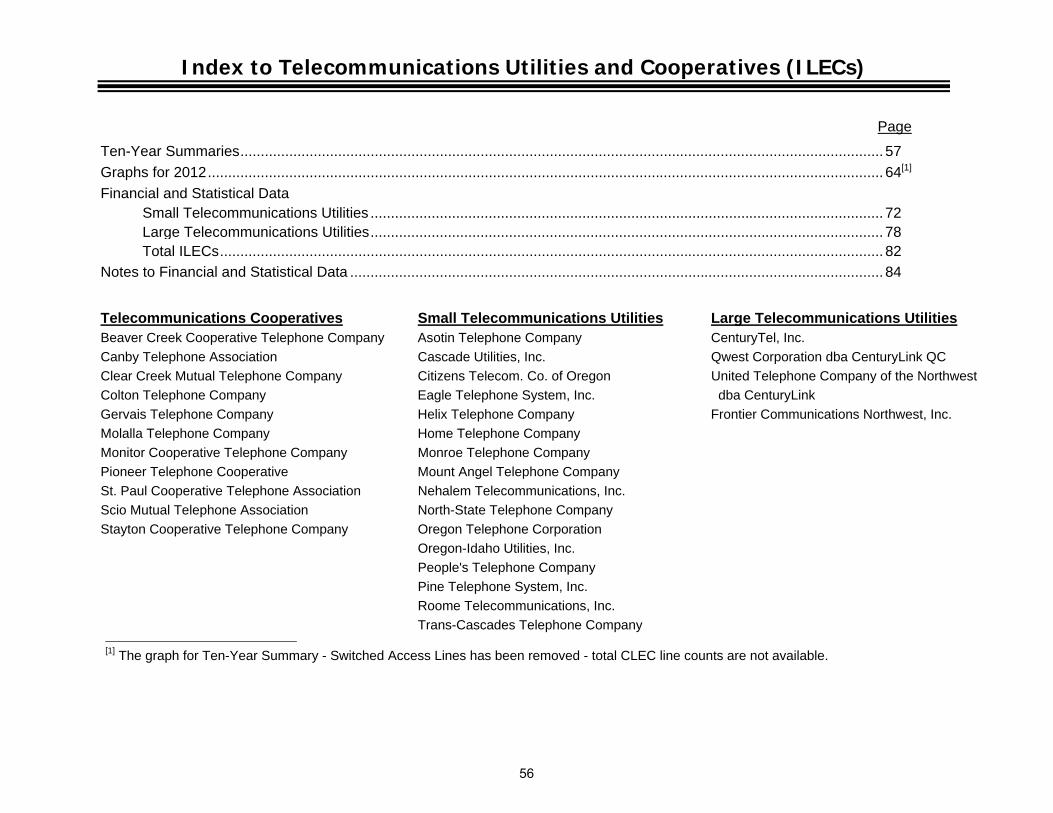
Index to Telecommunications Utilities and Cooperatives (ILECs)
Page
Ten-Year Summaries .............................................................................................................................................................. 57 Graphs for 2012 ...................................................................................................................................................................... 64[1] Financial and Statistical Data
Small Telecommunications Utilities .............................................................................................................................. 72Large Telecommunications Utilities.............................................................................................................................. 78Total ILECs ................................................................................................................................................................... 82
Notes to Financial and Statistical Data ................................................................................................................................... 84
Telecommunications Cooperatives Small Telecommunications Utilities Large Telecommunications Utilities Beaver Creek Cooperative Telephone Company Asotin Telephone Company CenturyTel, Inc. Canby Telephone Association Cascade Utilities, Inc. Qwest Corporation dba CenturyLink QC Clear Creek Mutual Telephone Company Citizens Telecom. Co. of Oregon United Telephone Company of the Northwest Colton Telephone Company Eagle Telephone System, Inc. dba CenturyLink Gervais Telephone Company Helix Telephone Company Frontier Communications Northwest, Inc. Molalla Telephone Company Home Telephone Company Monitor Cooperative Telephone Company Monroe Telephone Company Pioneer Telephone Cooperative Mount Angel Telephone Company St. Paul Cooperative Telephone Association Nehalem Telecommunications, Inc. Scio Mutual Telephone Association North-State Telephone Company Stayton Cooperative Telephone Company Oregon Telephone Corporation
Oregon-Idaho Utilities, Inc. People's Telephone Company Pine Telephone System, Inc. Roome Telecommunications, Inc. Trans-Cascades Telephone Company
[1] The graph for Ten-Year Summary - Switched Access Lines has been removed - total CLEC line counts are not available.
56
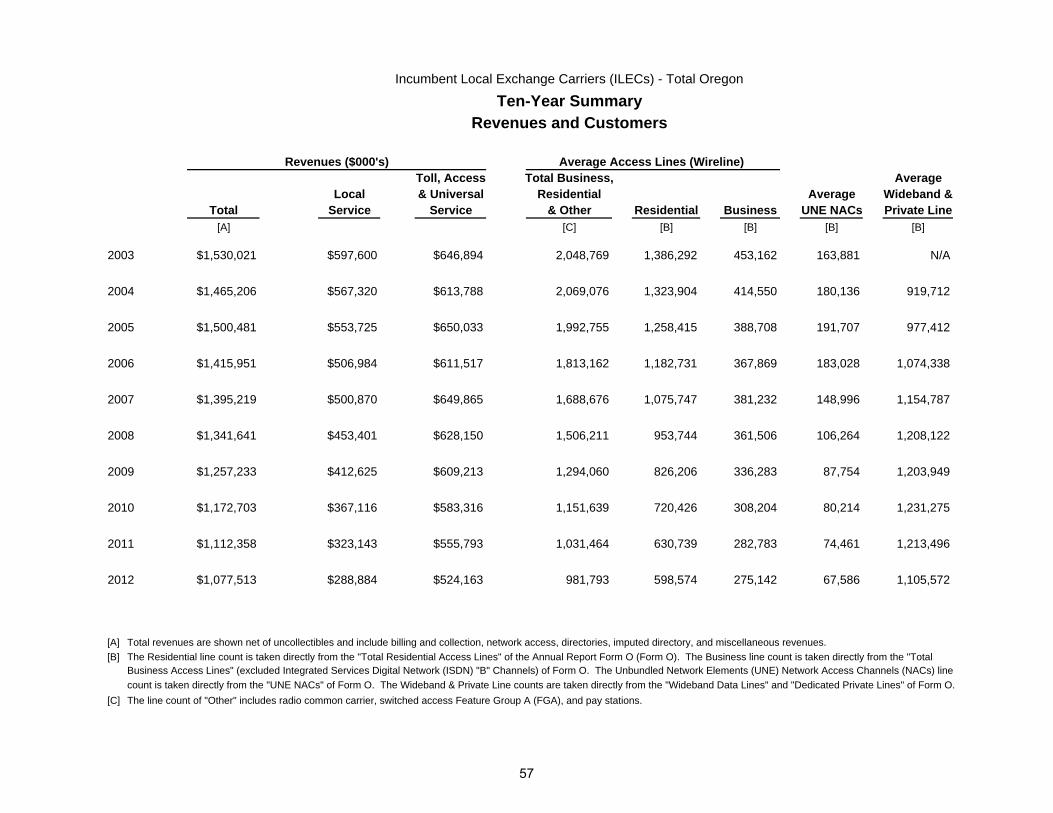
Incumbent Local Exchange Carriers (ILECs) - Total Oregon
Ten-Year SummaryRevenues and Customers
Toll, Access Total Business, AverageLocal & Universal Residential Average Wideband &
Total Service Service & Other Residential Business UNE NACs Private Line[A] [C] [B] [B] [B] [B]
$1,530,021 $597,600 $646,894 2,048,769 1,386,292 453,162 163,881 N/A
$1,465,206 $567,320 $613,788 2,069,076 1,323,904 414,550 180,136 919,712
$1,500,481 $553,725 $650,033 1,992,755 1,258,415 388,708 191,707 977,412
$1,415,951 $506,984 $611,517 1,813,162 1,182,731 367,869 183,028 1,074,338
$1,395,219 $500,870 $649,865 1,688,676 1,075,747 381,232 148,996 1,154,787
$1,341,641 $453,401 $628,150 1,506,211 953,744 361,506 106,264 1,208,122
$1,257,233 $412,625 $609,213 1,294,060 826,206 336,283 87,754 1,203,949
$1,172,703 $367,116 $583,316 1,151,639 720,426 308,204 80,214 1,231,275
$1,112,358 $323,143 $555,793 1,031,464 630,739 282,783 74,461 1,213,496
$1,077,513 $288,884 $524,163 981,793 598,574 275,142 67,586 1,105,572
[A] Total revenues are shown net of uncollectibles and include billing and collection, network access, directories, imputed directory, and miscellaneous revenues.[B] The Residential line count is taken directly from the "Total Residential Access Lines" of the Annual Report Form O (Form O). The Business line count is taken directly from the "Total
Business Access Lines" (excluded Integrated Services Digital Network (ISDN) "B" Channels) of Form O. The Unbundled Network Elements (UNE) Network Access Channels (NACs) linecount is taken directly from the "UNE NACs" of Form O. The Wideband & Private Line counts are taken directly from the "Wideband Data Lines" and "Dedicated Private Lines" of Form O.
[C] The line count of "Other" includes radio common carrier, switched access Feature Group A (FGA), and pay stations.
2011
Revenues ($000's) Average Access Lines (Wireline)
2007
2008
2009
2010
2003
2004
2005
2006
2012
57
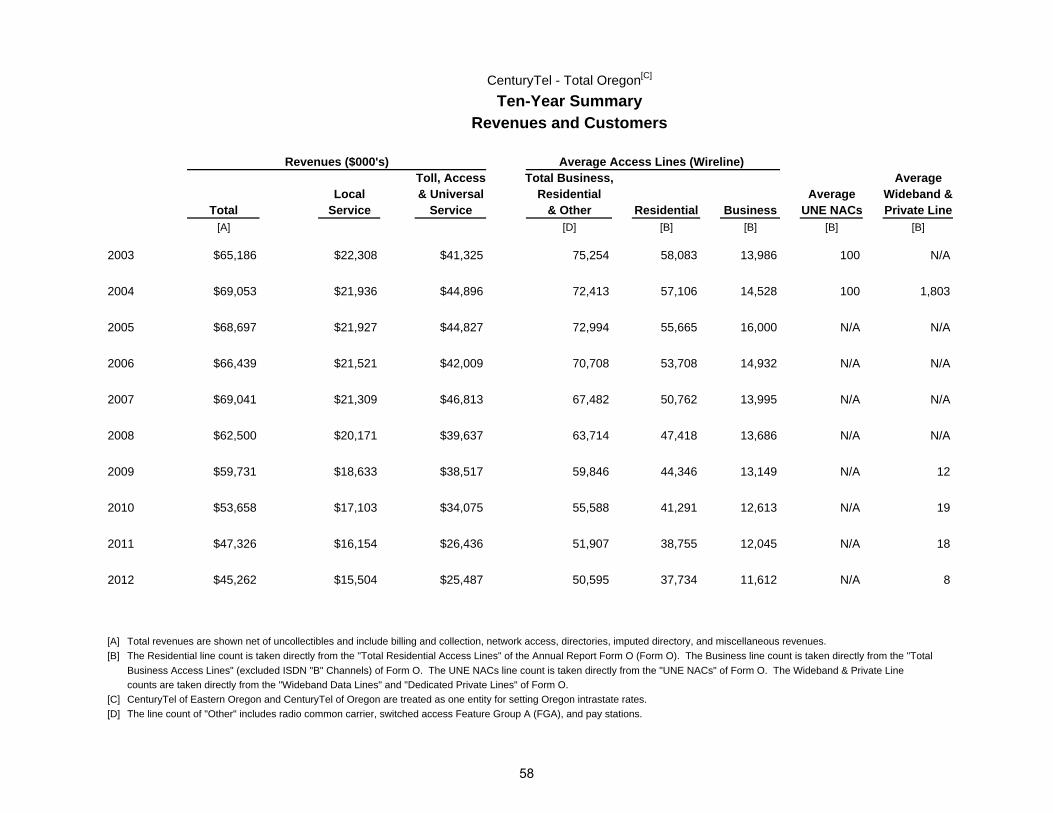
CenturyTel - Total Oregon[C]
Ten-Year SummaryRevenues and Customers
Toll, Access Total Business, AverageLocal & Universal Residential Average Wideband &
Total Service Service & Other Residential Business UNE NACs Private Line[A] [D] [B] [B] [B] [B]
$65,186 $22,308 $41,325 75,254 58,083 13,986 100 N/A
$69,053 $21,936 $44,896 72,413 57,106 14,528 100 1,803
$68,697 $21,927 $44,827 72,994 55,665 16,000 N/A N/A
$66,439 $21,521 $42,009 70,708 53,708 14,932 N/A N/A
$69,041 $21,309 $46,813 67,482 50,762 13,995 N/A N/A
$62,500 $20,171 $39,637 63,714 47,418 13,686 N/A N/A
$59,731 $18,633 $38,517 59,846 44,346 13,149 N/A 12
$53,658 $17,103 $34,075 55,588 41,291 12,613 N/A 19
$47,326 $16,154 $26,436 51,907 38,755 12,045 N/A 18
$45,262 $15,504 $25,487 50,595 37,734 11,612 N/A 8
[A] Total revenues are shown net of uncollectibles and include billing and collection, network access, directories, imputed directory, and miscellaneous revenues.[B] The Residential line count is taken directly from the "Total Residential Access Lines" of the Annual Report Form O (Form O). The Business line count is taken directly from the "Total
Business Access Lines" (excluded ISDN "B" Channels) of Form O. The UNE NACs line count is taken directly from the "UNE NACs" of Form O. The Wideband & Private Linecounts are taken directly from the "Wideband Data Lines" and "Dedicated Private Lines" of Form O.
[C] CenturyTel of Eastern Oregon and CenturyTel of Oregon are treated as one entity for setting Oregon intrastate rates.[D] The line count of "Other" includes radio common carrier, switched access Feature Group A (FGA), and pay stations.
2012
Revenues ($000's) Average Access Lines (Wireline)
2011
2003
2004
2005
2006
2007
2008
2009
2010
58
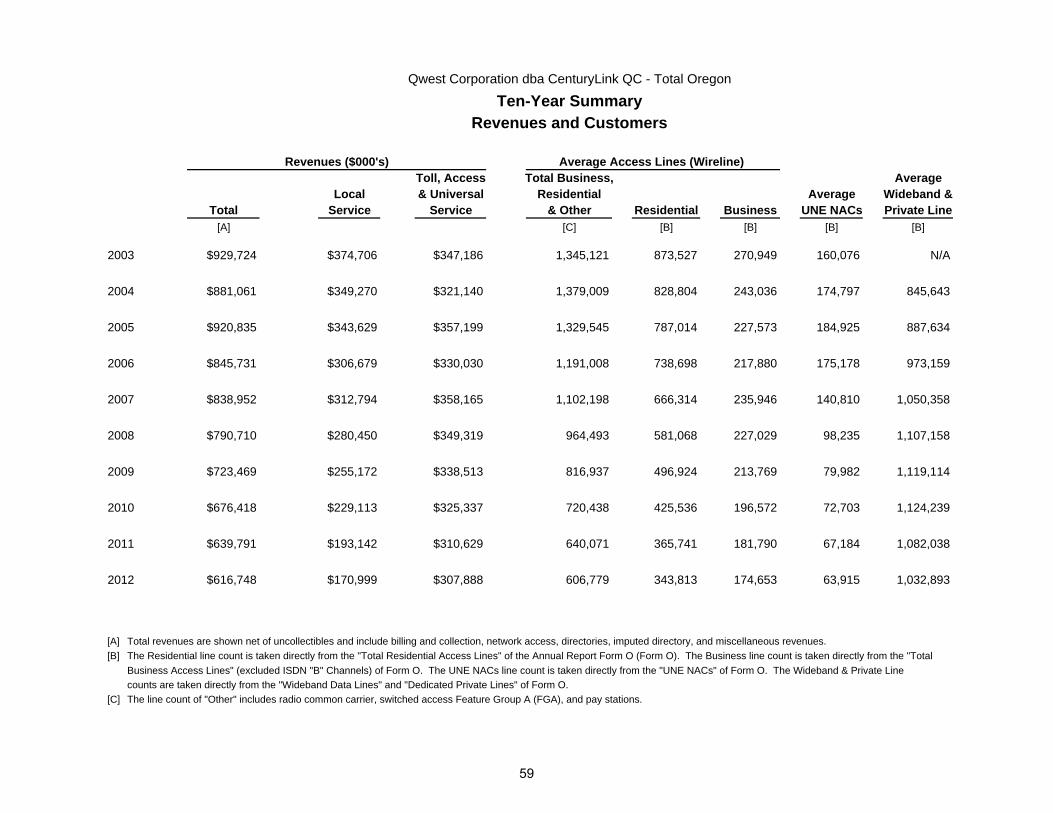
Qwest Corporation dba CenturyLink QC - Total Oregon
Ten-Year SummaryRevenues and Customers
Toll, Access Total Business, AverageLocal & Universal Residential Average Wideband &
Total Service Service & Other Residential Business UNE NACs Private Line[A] [C] [B] [B] [B] [B]
$929,724 $374,706 $347,186 1,345,121 873,527 270,949 160,076 N/A
$881,061 $349,270 $321,140 1,379,009 828,804 243,036 174,797 845,643
$920,835 $343,629 $357,199 1,329,545 787,014 227,573 184,925 887,634
$845,731 $306,679 $330,030 1,191,008 738,698 217,880 175,178 973,159
$838,952 $312,794 $358,165 1,102,198 666,314 235,946 140,810 1,050,358
$790,710 $280,450 $349,319 964,493 581,068 227,029 98,235 1,107,158
2003
2004
2005
2006
2007
Revenues ($000's) Average Access Lines (Wireline)
2008
$723,469 $255,172 $338,513 816,937 496,924 213,769 79,982 1,119,114
$676,418 $229,113 $325,337 720,438 425,536 196,572 72,703 1,124,239
$639,791 $193,142 $310,629 640,071 365,741 181,790 67,184 1,082,038
$616,748 $170,999 $307,888 606,779 343,813 174,653 63,915 1,032,893
[A] Total revenues are shown net of uncollectibles and include billing and collection, network access, directories, imputed directory, and miscellaneous revenues.[B] The Residential line count is taken directly from the "Total Residential Access Lines" of the Annual Report Form O (Form O). The Business line count is taken directly from the "Total
Business Access Lines" (excluded ISDN "B" Channels) of Form O. The UNE NACs line count is taken directly from the "UNE NACs" of Form O. The Wideband & Private Linecounts are taken directly from the "Wideband Data Lines" and "Dedicated Private Lines" of Form O.
[C] The line count of "Other" includes radio common carrier, switched access Feature Group A (FGA), and pay stations.
2012
2009
2010
2011
59
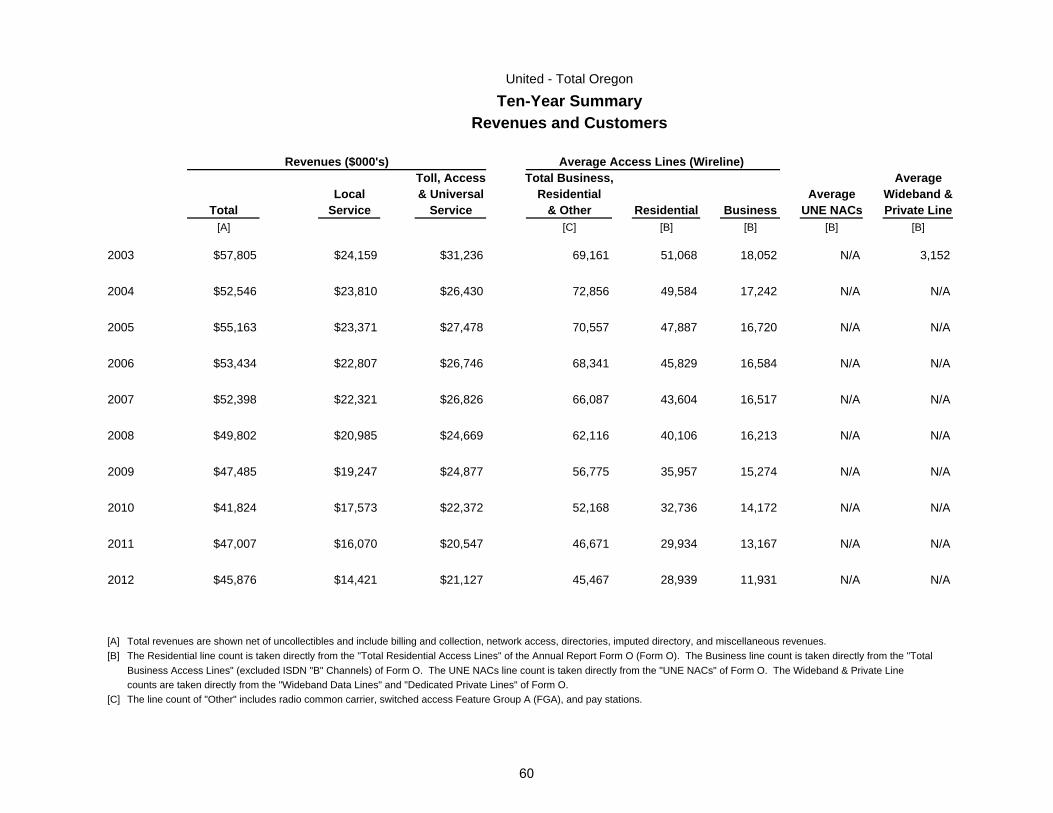
United - Total Oregon
Ten-Year SummaryRevenues and Customers
Toll, Access Total Business, AverageLocal & Universal Residential Average Wideband &
Total Service Service & Other Residential Business UNE NACs Private Line[A] [C] [B] [B] [B] [B]
$57,805 $24,159 $31,236 69,161 51,068 18,052 N/A 3,152
$52,546 $23,810 $26,430 72,856 49,584 17,242 N/A N/A
$55,163 $23,371 $27,478 70,557 47,887 16,720 N/A N/A
$53,434 $22,807 $26,746 68,341 45,829 16,584 N/A N/A
$52,398 $22,321 $26,826 66,087 43,604 16,517 N/A N/A
$49,802 $20,985 $24,669 62,116 40,106 16,213 N/A N/A
2004
2005
2006
2007
2008
2003
Revenues ($000's) Average Access Lines (Wireline)
$47,485 $19,247 $24,877 56,775 35,957 15,274 N/A N/A
$41,824 $17,573 $22,372 52,168 32,736 14,172 N/A N/A
$47,007 $16,070 $20,547 46,671 29,934 13,167 N/A N/A
$45,876 $14,421 $21,127 45,467 28,939 11,931 N/A N/A
[A] Total revenues are shown net of uncollectibles and include billing and collection, network access, directories, imputed directory, and miscellaneous revenues.[B] The Residential line count is taken directly from the "Total Residential Access Lines" of the Annual Report Form O (Form O). The Business line count is taken directly from the "Total
Business Access Lines" (excluded ISDN "B" Channels) of Form O. The UNE NACs line count is taken directly from the "UNE NACs" of Form O. The Wideband & Private Linecounts are taken directly from the "Wideband Data Lines" and "Dedicated Private Lines" of Form O.
[C] The line count of "Other" includes radio common carrier, switched access Feature Group A (FGA), and pay stations.
2009
2010
2012
2011
60

Frontier Communications Northwest, Inc. - Total Oregon
Ten-Year SummaryRevenues and Customers
Toll, Access Total Business, AverageLocal & Universal Residential Average Wideband &
Total Service Service & Other Residential Business UNE NACs Private Line[A] [C] [B] [B] [B] [B]
$363,330 $139,308 $155,852 448,875 320,629 126,436 3,705 N/A
$343,625 $134,012 $148,305 437,868 306,882 116,211 5,239 62,707
$336,511 $127,295 $147,999 414,767 288,031 105,233 6,782 76,412
$332,457 $117,517 $144,280 383,054 268,129 96,552 7,850 88,716
$314,101 $105,940 $145,413 357,659 242,737 93,539 8,186 91,619
$315,527 $92,908 $142,398 324,357 216,340 83,537 8,029 85,780
2005
2006
2007
2008
2003
2004
Revenues ($000's) Average Access Lines (Wireline)
$311,955 $85,843 $136,765 283,737 191,427 76,748 7,772 75,900
$287,642 $71,339 $131,118 249,922 166,678 68,258 7,511 97,043
$262,975 $66,411 $124,505 219,054 144,262 60,484 7,277 123,185
$252,292 $58,710 $93,317 207,432 136,048 61,334 3,671 61,826
[A] Total revenues are shown net of uncollectibles and include billing and collection, network access, directories, imputed directory, and miscellaneous revenues.[B] The Residential line count is taken directly from the "Total Residential Access Lines" of the Annual Report Form O (Form O). The Business line count is taken directly from the "Total
Business Access Lines" (excluded ISDN "B" Channels) of Form O. The UNE NACs line count is taken directly from the "UNE NACs" of Form O. The Wideband & Private Linecounts are taken directly from the "Wideband Data Lines" and "Dedicated Private Lines" of Form O.
[C] The line count of "Other" includes radio common carrier, switched access Feature Group A (FGA), and pay stations.
2010
2012
2009
2011
61
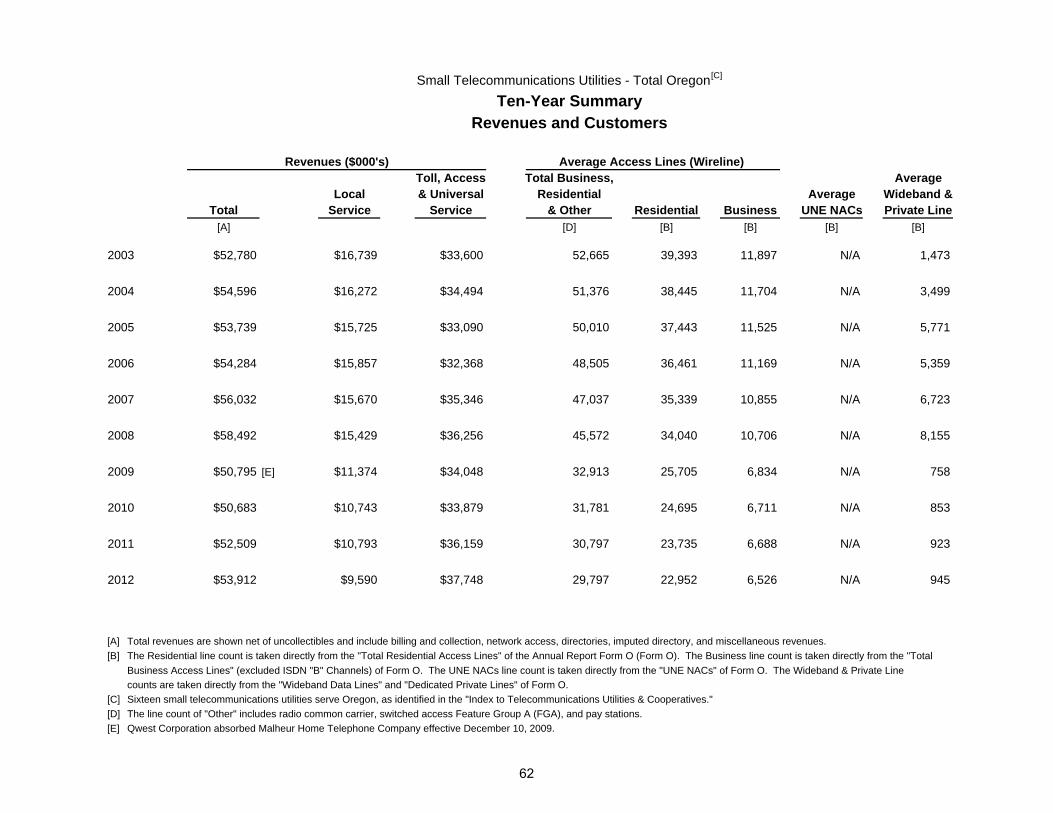
Small Telecommunications Utilities - Total Oregon[C]
Ten-Year SummaryRevenues and Customers
Toll, Access Total Business, AverageLocal & Universal Residential Average Wideband &
Total Service Service & Other Residential Business UNE NACs Private Line[A] [D] [B] [B] [B] [B]
$52,780 $16,739 $33,600 52,665 39,393 11,897 N/A 1,473
$54,596 $16,272 $34,494 51,376 38,445 11,704 N/A 3,499
$53,739 $15,725 $33,090 50,010 37,443 11,525 N/A 5,771
$54,284 $15,857 $32,368 48,505 36,461 11,169 N/A 5,359
$56,032 $15,670 $35,346 47,037 35,339 10,855 N/A 6,723
$58,492 $15,429 $36,256 45,572 34,040 10,706 N/A 8,155
2006
2007
2008
2003
2004
2005
Revenues ($000's) Average Access Lines (Wireline)
$50,795 [E] $11,374 $34,048 32,913 25,705 6,834 N/A 758
$50,683 $10,743 $33,879 31,781 24,695 6,711 N/A 853
$52,509 $10,793 $36,159 30,797 23,735 6,688 N/A 923
$53,912 $9,590 $37,748 29,797 22,952 6,526 N/A 945
[A] Total revenues are shown net of uncollectibles and include billing and collection, network access, directories, imputed directory, and miscellaneous revenues.[B] The Residential line count is taken directly from the "Total Residential Access Lines" of the Annual Report Form O (Form O). The Business line count is taken directly from the "Total
Business Access Lines" (excluded ISDN "B" Channels) of Form O. The UNE NACs line count is taken directly from the "UNE NACs" of Form O. The Wideband & Private Linecounts are taken directly from the "Wideband Data Lines" and "Dedicated Private Lines" of Form O.
[C] Sixteen small telecommunications utilities serve Oregon, as identified in the "Index to Telecommunications Utilities & Cooperatives."[D] The line count of "Other" includes radio common carrier, switched access Feature Group A (FGA), and pay stations.[E] Qwest Corporation absorbed Malheur Home Telephone Company effective December 10, 2009.
2012
2009
2010
2011
62

Telecommunications Cooperatives - Total Oregon[C]
Ten-Year SummaryRevenues and Customers
Toll, Access Total Business, AverageLocal & Universal Residential Average Wideband &
Total Service Service & Other Residential Business UNE NACs Private Line[A] [D] [B] [B] [B] [B]
$61,196 $20,380 $37,695 57,693 43,592 11,842 N/A 4,503
$64,325 $22,020 $38,523 55,554 43,083 11,829 N/A 6,060
$65,536 $21,778 $39,440 54,882 42,375 11,657 N/A 7,595
$63,606 $22,603 $36,084 51,546 39,906 10,752 N/A 7,104
$64,695 $22,836 $37,302 48,213 36,991 10,380 N/A 6,087
$64,610 $23,458 $35,871 45,959 34,772 10,335 N/A 7,029
2007
2008
2003
2004
2005
2006
Revenues ($000's) Average Access Lines (Wireline)
$63,798 $22,356 $36,493 43,852 31,847 10,509 N/A 8,165
$62,478 $21,245 $36,535 41,742 29,490 9,878 N/A 9,121
$62,750 $20,573 $37,517 42,964 28,312 8,609 N/A 7,332
$63,423 $19,660 $38,596 41,723 29,088 9,086 N/A 9,900
[A] Total revenues are shown net of uncollectibles and include billing and collection, network access, directories, imputed directory, and miscellaneous revenues.[B] The Residential line count is taken directly from the "Total Residential Access Lines" of the Annual Report Form O (Form O). The Business line count is taken directly from the "Total
Business Access Lines" (excluded ISDN "B" Channels) of Form O. The UNE NACs line count is taken directly from the "UNE NACs" of Form O. The Wideband & Private Linecounts are taken directly from the "Wideband Data Lines" and "Dedicated Private Lines" of Form O.
[C] Eleven telecommunications cooperatives serve Oregon, as identified in the "Index to Telecommunications Utilities & Cooperatives."[D] The line count of "Other" includes radio common carrier, switched access Feature Group A (FGA), and pay stations.
2012
2009
2010
2011
63
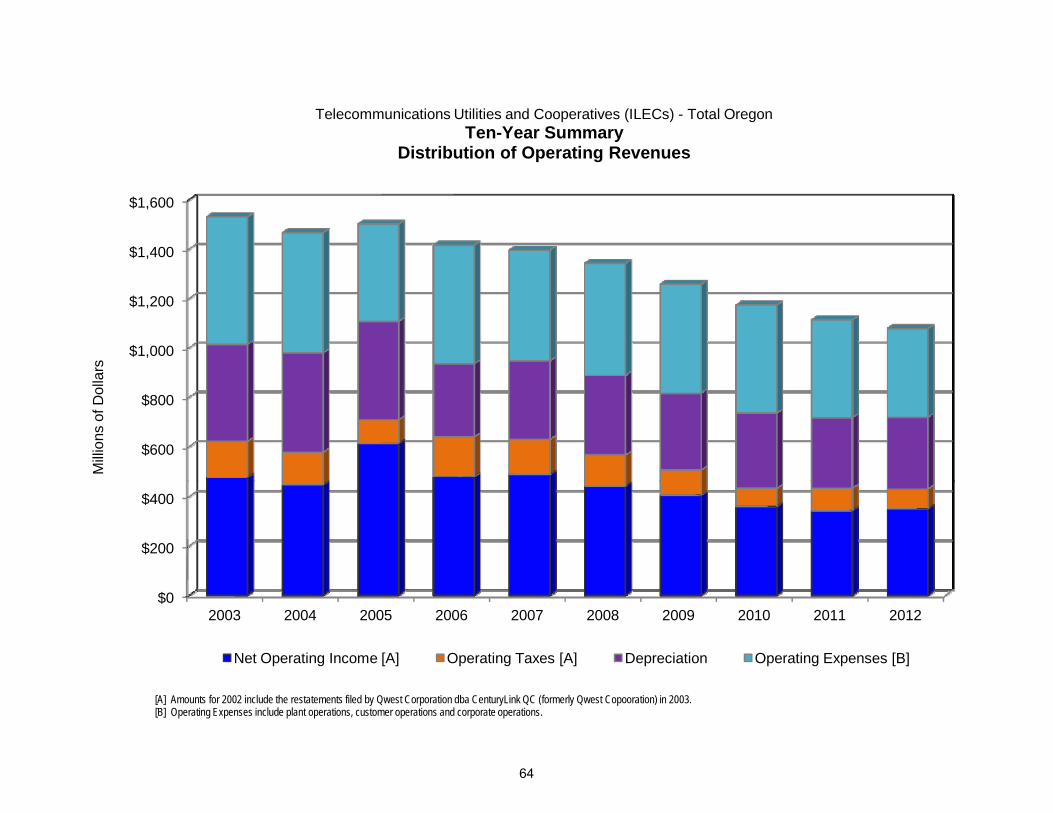
$600
$800
$1,000
$1,200
$1,400
$1,600
Mill
ions
of D
olla
rsTelecommunications Utilities and Cooperatives (ILECs) - Total Oregon
Ten-Year SummaryDistribution of Operating Revenues
$0
$200
$400
2003 2004 2005 2006 2007 2008 2009 2010 2011 2012
[A] Amounts for 2002 include the restatements filed by Qwest Corporation dba CenturyLink QC (formerly Qwest Copooration) in 2003.[B] Operating Expenses include plant operations, customer operations and corporate operations.
Net Operating Income [A] Operating Taxes [A] Depreciation Operating Expenses [B]
64
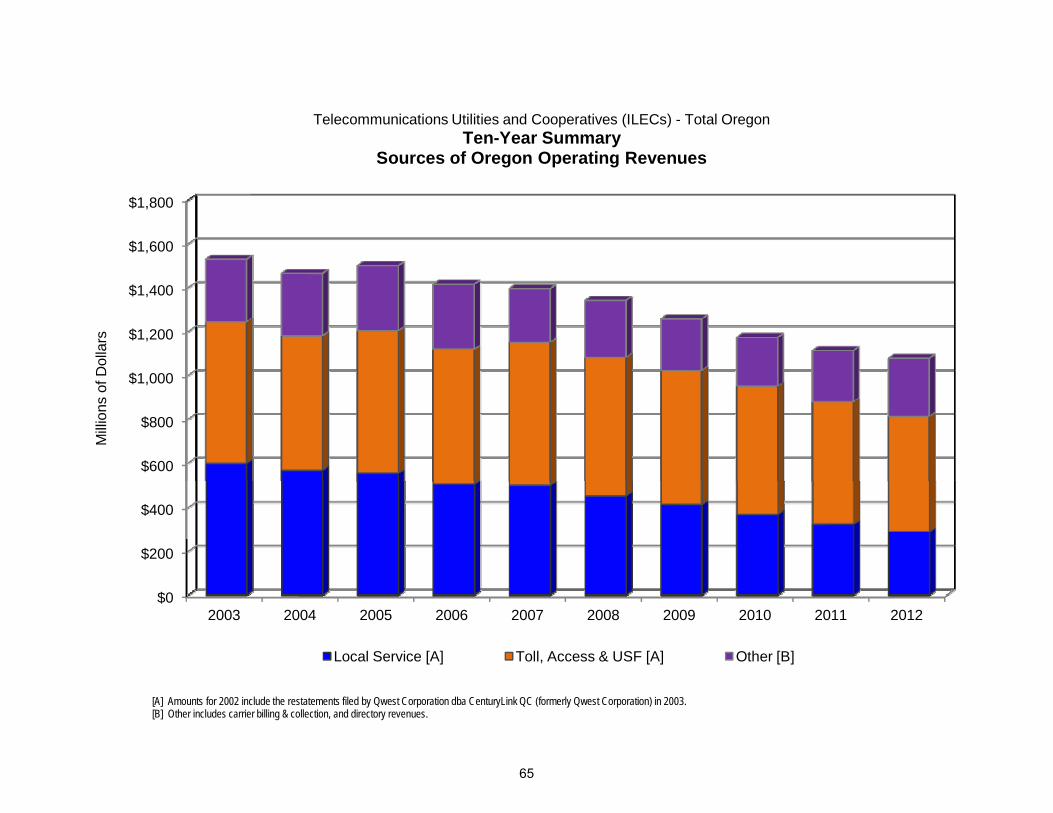
$600
$800
$1,000
$1,200
$1,400
$1,600
$1,800
Mill
ions
of D
olla
rsTelecommunications Utilities and Cooperatives (ILECs) - Total Oregon
Ten-Year SummarySources of Oregon Operating Revenues
$0
$200
$400
2003 2004 2005 2006 2007 2008 2009 2010 2011 2012
[A] Amounts for 2002 include the restatements filed by Qwest Corporation dba CenturyLink QC (formerly Qwest Corporation) in 2003.[B] Other includes carrier billing & collection, and directory revenues.
Local Service [A] Toll, Access & USF [A] Other [B]
65
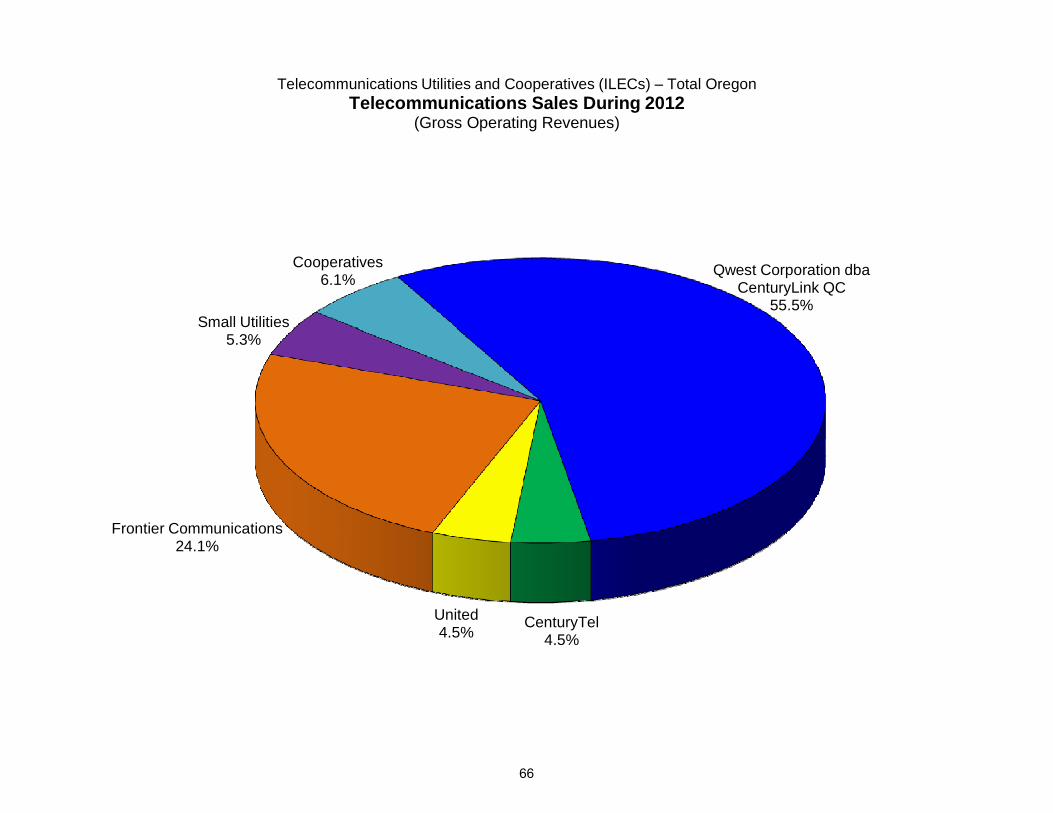
Qwest Corporation dba CenturyLink QC
55.5%Small Utilities
5.3%
Cooperatives6.1%
Telecommunications Utilities and Cooperatives (ILECs) – Total Oregon Telecommunications Sales During 2012
(Gross Operating Revenues)
CenturyTel4.5%
United4.5%
Frontier Communications24.1%
66
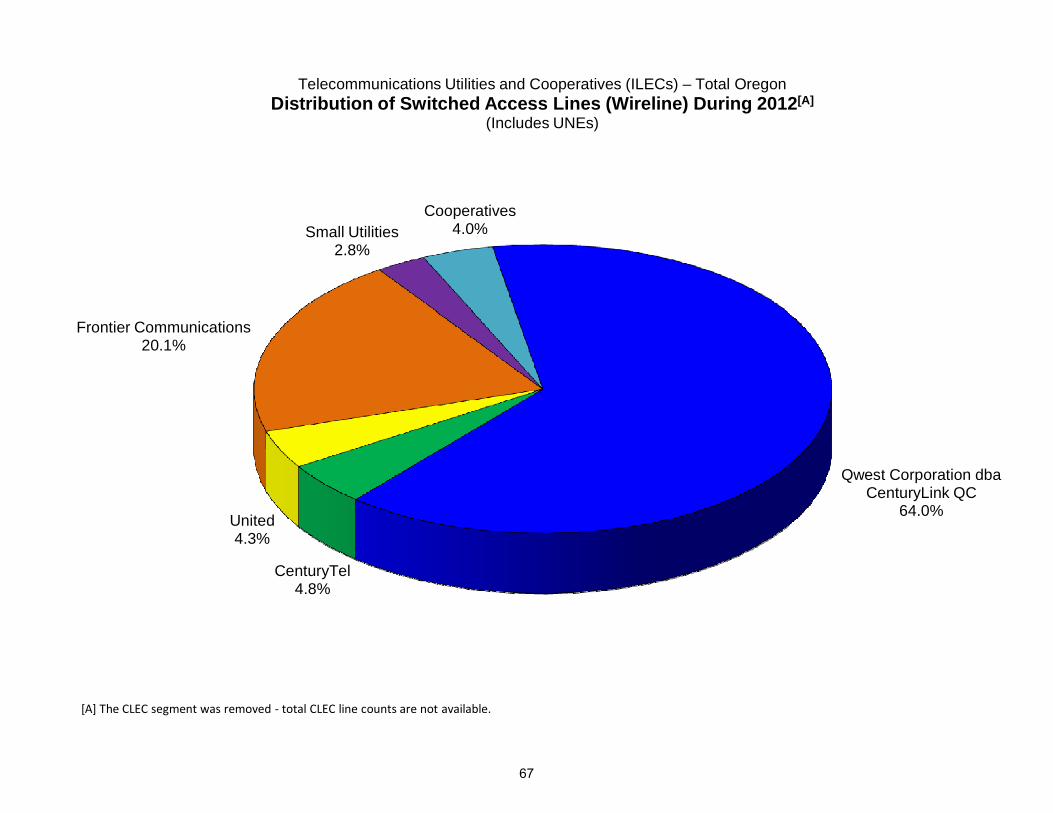
Frontier Communications20.1%
Small Utilities2.8%
Cooperatives4.0%
Telecommunications Utilities and Cooperatives (ILECs) – Total Oregon Distribution of Switched Access Lines (Wireline) During 2012[A]
(Includes UNEs)
Qwest Corporation dba CenturyLink QC
64.0%
CenturyTel4.8%
United4.3%
[A] The CLEC segment was removed ‐ total CLEC line counts are not available.
67
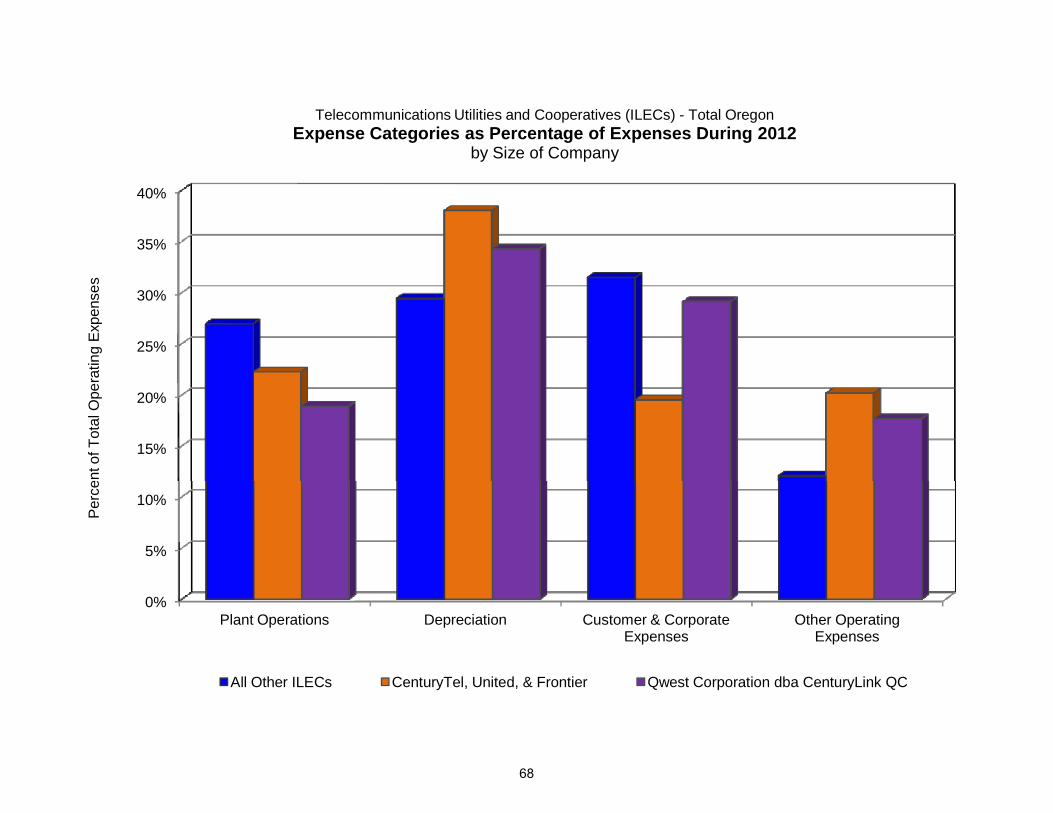
15%
20%
25%
30%
35%
40%
ent o
f Tot
al O
pera
ting
Exp
ense
sTelecommunications Utilities and Cooperatives (ILECs) - Total Oregon
Expense Categories as Percentage of Expenses During 2012by Size of Company
0%
5%
10%
Plant Operations Depreciation Customer & Corporate Expenses
Other Operating Expenses
Per
ce
All Other ILECs CenturyTel, United, & Frontier Qwest Corporation dba CenturyLink QC
68
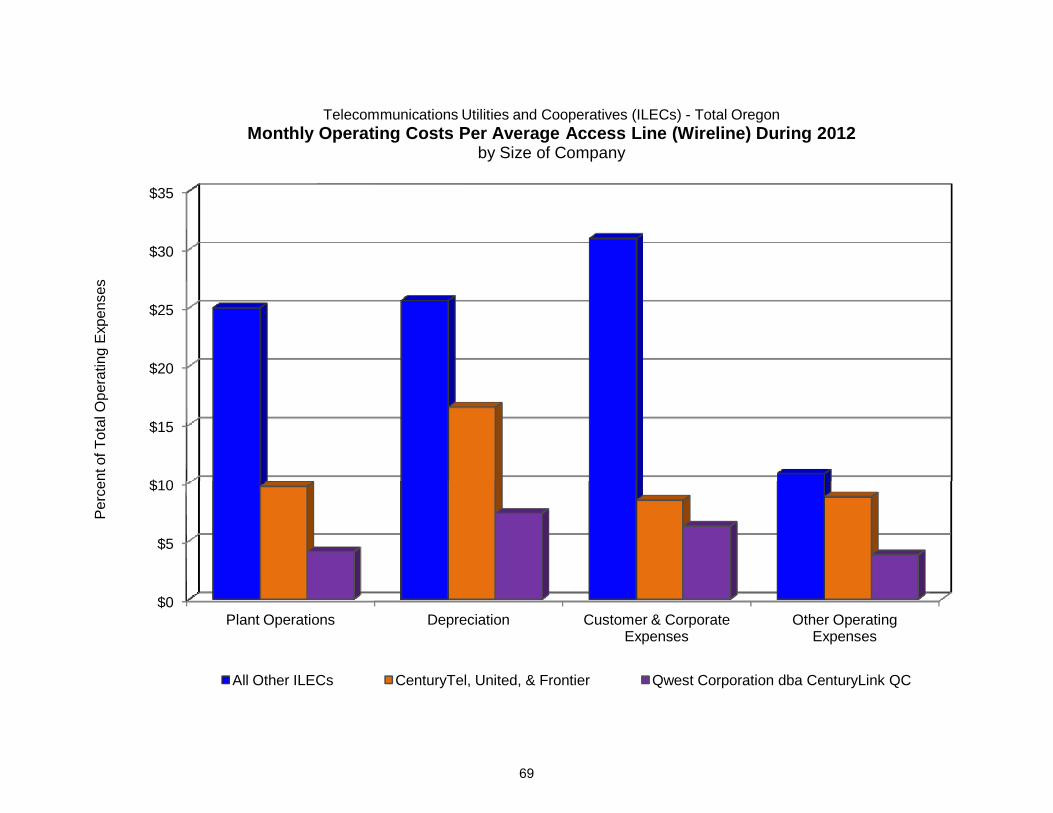
$10
$15
$20
$25
$30
$35
nt o
f Tot
al O
pera
ting
Exp
ense
sTelecommunications Utilities and Cooperatives (ILECs) - Total Oregon
Monthly Operating Costs Per Average Access Line (Wireline) During 2012by Size of Company
$0
$5
$10
Plant Operations Depreciation Customer & Corporate Expenses
Other Operating Expenses
Per
ce
All Other ILECs CenturyTel, United, & Frontier Qwest Corporation dba CenturyLink QC
69
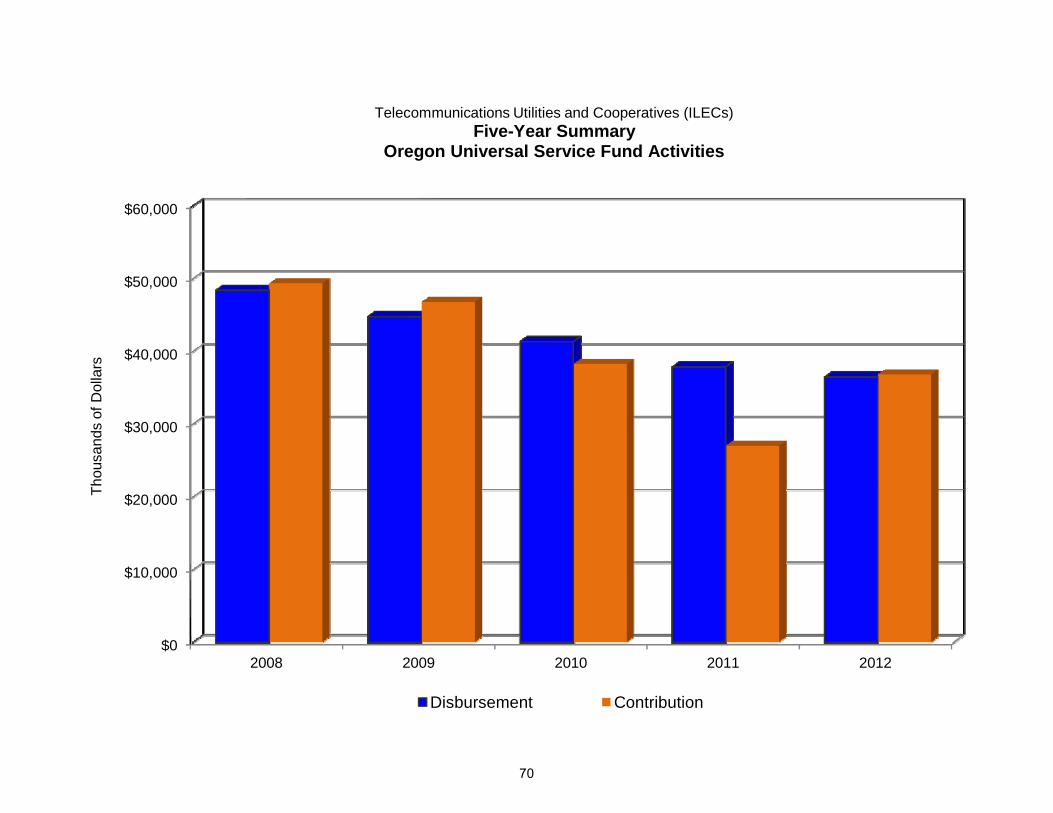
$30,000
$40,000
$50,000
$60,000
hous
ands
of D
olla
rsTelecommunications Utilities and Cooperatives (ILECs)
Five-Year SummaryOregon Universal Service Fund Activities
$0
$10,000
$20,000
2008 2009 2010 2011 2012
Th
Disbursement Contribution
70
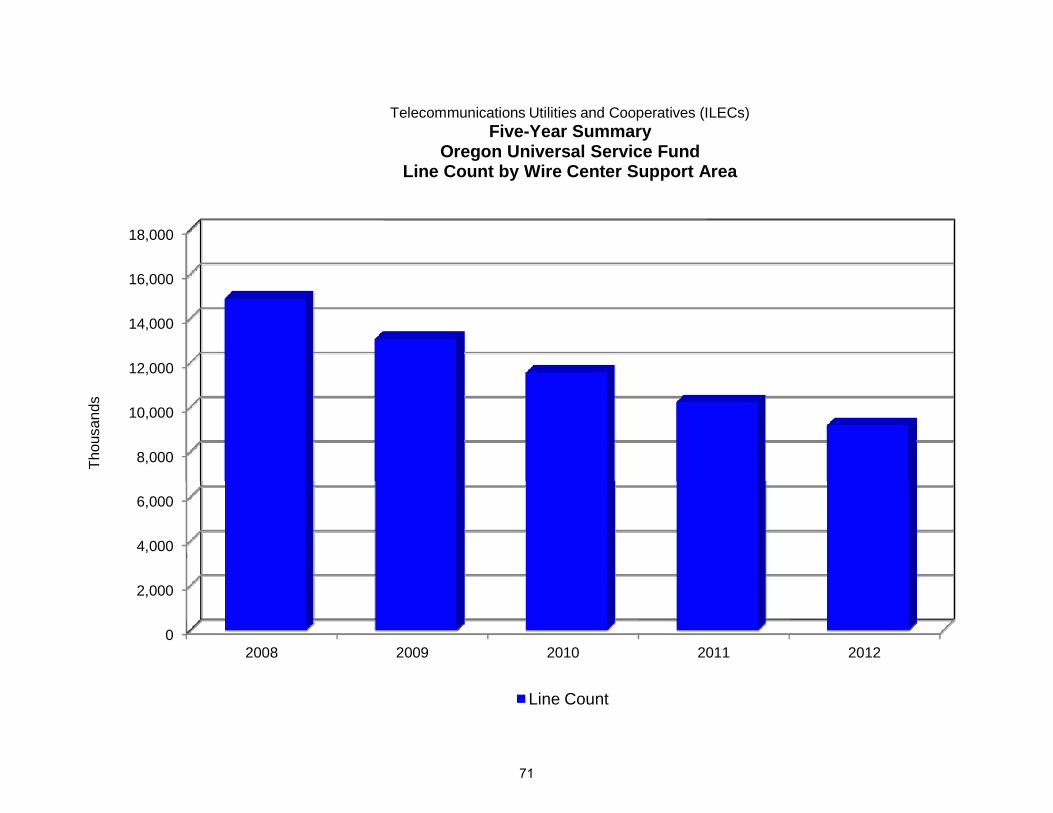
8,000
10,000
12,000
14,000
16,000
18,000
Thou
sand
sTelecommunications Utilities and Cooperatives (ILECs)
Five-Year SummaryOregon Universal Service Fund
Line Count by Wire Center Support Area
0
2,000
4,000
6,000
2008 2009 2010 2011 2012
Line Count
71
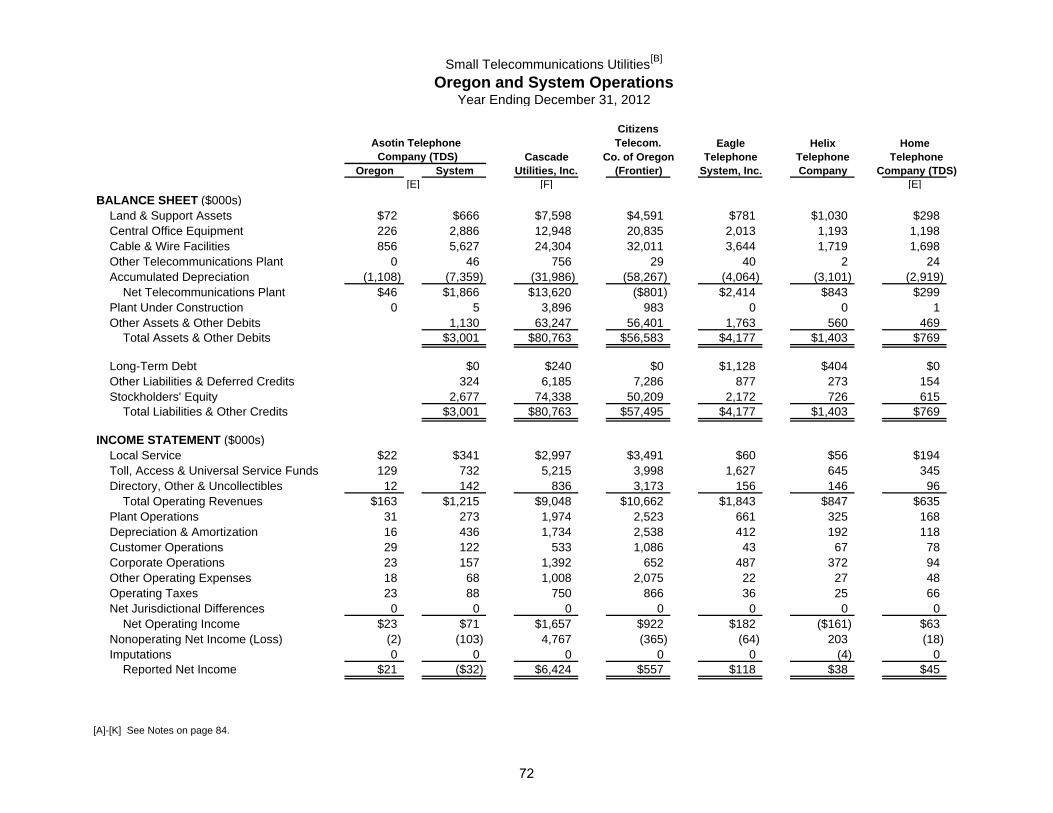
BALANCE SHEET ($000s) Land & Support Assets Central Office Equipment Cable & Wire Facilities Other Telecommunications Plant Accumulated Depreciation Net Telecommunications Plant Plant Under Construction Other Assets & Other Debits Total Assets & Other Debits
Long-Term Debt Other Liabilities & Deferred Credits Stockholders' Equity Total Liabilities & Other Credits
INCOME STATEMENT ($000s) Local Service Toll, Access & Universal Service Funds Directory, Other & Uncollectibles Total Operating Revenues Plant Operations Depreciation & Amortization Customer Operations Corporate Operations Other Operating Expenses Operating Taxes Net Jurisdictional Differences Net Operating Income Nonoperating Net Income (Loss) Imputations Reported Net Income
[A]-[K] See Notes on page 84.
Small Telecommunications Utilities[B]
Oregon and System OperationsYear Ending December 31, 2012
Eagle Helix HomeCascade Co. of Oregon Telephone Telephone Telephone
Oregon System Utilities, Inc. (Frontier) System, Inc. Company Company (TDS)[E] [F] [E]
$72 $666 $7,598 $4,591 $781 $1,030 $298226 2,886 12,948 20,835 2,013 1,193 1,198856 5,627 24,304 32,011 3,644 1,719 1,698
0 46 756 29 40 2 24(1,108) (7,359) (31,986) (58,267) (4,064) (3,101) (2,919)
$46 $1,866 $13,620 ($801) $2,414 $843 $2990 5 3,896 983 0 0 1
1,130 63,247 56,401 1,763 560 469$3,001 $80,763 $56,583 $4,177 $1,403 $769
$0 $240 $0 $1,128 $404 $0324 6,185 7,286 877 273 154
2,677 74,338 50,209 2,172 726 615$3,001 $80,763 $57,495 $4,177 $1,403 $769
$22 $341 $2,997 $3,491 $60 $56 $194129 732 5,215 3,998 1,627 645 345
12 142 836 3,173 156 146 96$163 $1,215 $9,048 $10,662 $1,843 $847 $635
31 273 1,974 2,523 661 325 16816 436 1,734 2,538 412 192 11829 122 533 1,086 43 67 7823 157 1,392 652 487 372 9418 68 1,008 2,075 22 27 4823 88 750 866 36 25 66
0 0 0 0 0 0 0$23 $71 $1,657 $922 $182 ($161) $63
(2) (103) 4,767 (365) (64) 203 (18)0 0 0 0 0 (4) 0
$21 ($32) $6,424 $557 $118 $38 $45
Citizens Telecom.
Company (TDS)Asotin Telephone
72
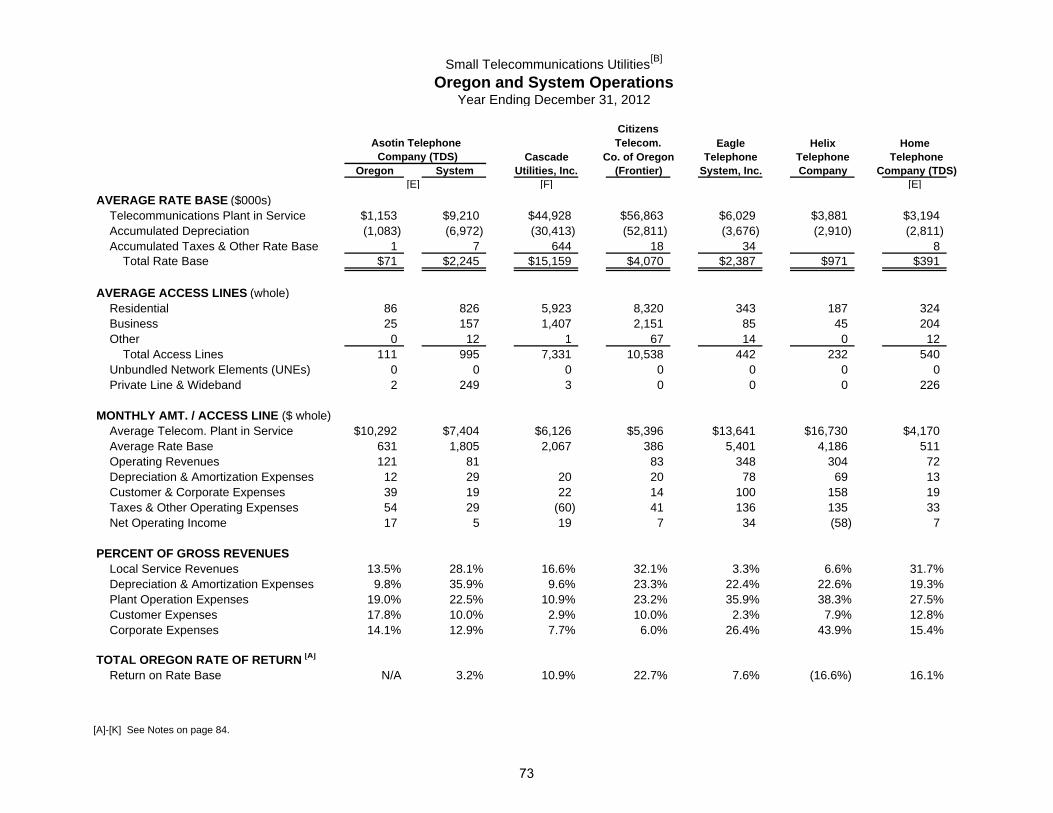
AVERAGE RATE BASE ($000s) Telecommunications Plant in Service Accumulated Depreciation Accumulated Taxes & Other Rate Base Total Rate Base
AVERAGE ACCESS LINES (whole) Residential Business Other Total Access Lines Unbundled Network Elements (UNEs) Private Line & Wideband Private Line & Wideband MONTHLY AMT. / ACCESS LINE ($ whole) Average Telecom. Plant in Service Average Rate Base Operating Revenues Depreciation & Amortization Expenses Customer & Corporate Expenses Taxes & Other Operating Expenses Net Operating Income
PERCENT OF GROSS REVENUES Local Service Revenues Depreciation & Amortization Expenses Plant Operation Expenses Customer Expenses Corporate Expenses
TOTAL OREGON RATE OF RETURN [A]
Return on Rate Base
[A]-[K] See Notes on page 84.
Small Telecommunications Utilities[B]
Oregon and System OperationsYear Ending December 31, 2012
Eagle Helix HomeCascade Co. of Oregon Telephone Telephone Telephone
Oregon System Utilities, Inc. (Frontier) System, Inc. Company Company (TDS)[E] [F] [E]
Company (TDS)Asotin Telephone
Citizens Telecom.
$1,153 $9,210 $44,928 $56,863 $6,029 $3,881 $3,194(1,083) (6,972) (30,413) (52,811) (3,676) (2,910) (2,811)
1 7 644 18 34 8$71 $2,245 $15,159 $4,070 $2,387 $971 $391
86 826 5,923 8,320 343 187 32425 157 1,407 2,151 85 45 204
0 12 1 67 14 0 12111 995 7,331 10,538 442 232 540
0 0 0 0 0 0 02 249 3 0 0 0 226
$10,292 $7,404 $6,126 $5,396 $13,641 $16,730 $4,170631 1,805 2,067 386 5,401 4,186 511121 81 83 348 304 72
12 29 20 20 78 69 1339 19 22 14 100 158 1954 29 (60) 41 136 135 3317 5 19 7 34 (58) 7
13.5% 28.1% 16.6% 32.1% 3.3% 6.6% 31.7%9.8% 35.9% 9.6% 23.3% 22.4% 22.6% 19.3%
19.0% 22.5% 10.9% 23.2% 35.9% 38.3% 27.5%17.8% 10.0% 2.9% 10.0% 2.3% 7.9% 12.8%14.1% 12.9% 7.7% 6.0% 26.4% 43.9% 15.4%
N/A 3.2% 10.9% 22.7% 7.6% (16.6%) 16.1%
73
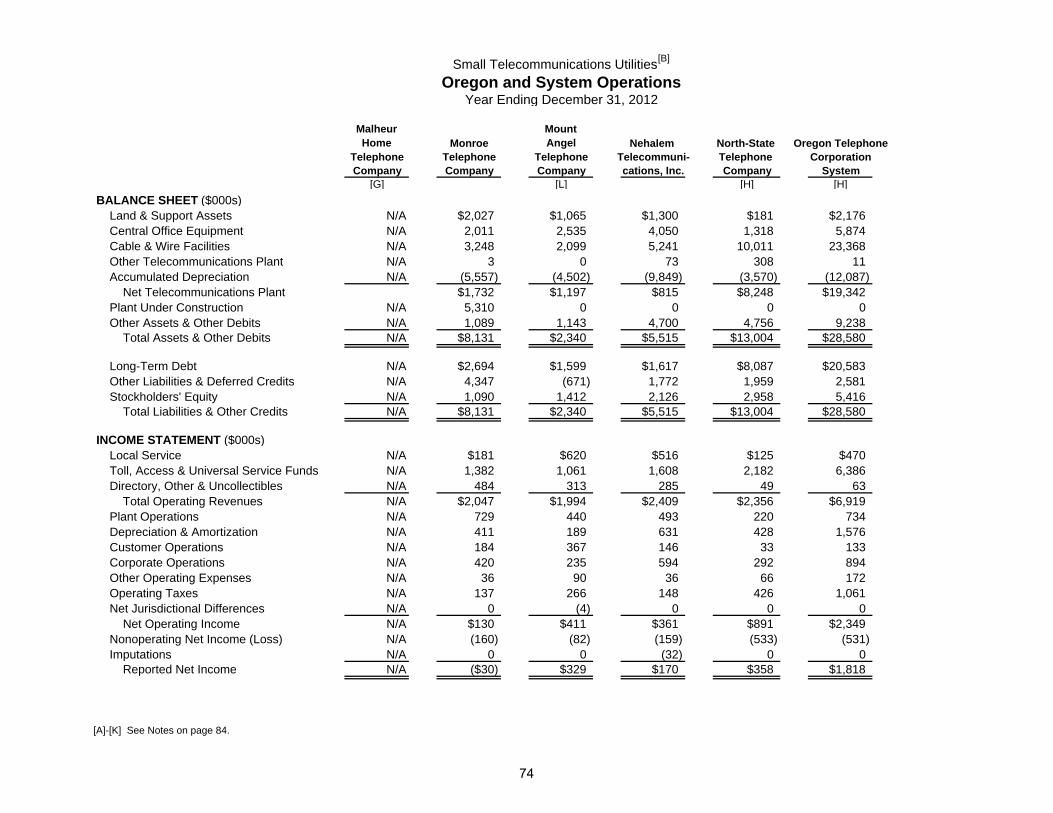
BALANCE SHEET ($000s) Land & Support Assets Central Office Equipment Cable & Wire Facilities Other Telecommunications Plant Accumulated Depreciation Net Telecommunications Plant Plant Under Construction Other Assets & Other Debits Total Assets & Other Debits
Long-Term Debt Other Liabilities & Deferred Credits Stockholders' Equity Total Liabilities & Other Credits
INCOME STATEMENT ($000s) Local Service Toll, Access & Universal Service Funds Directory, Other & Uncollectibles Total Operating Revenues Plant Operations Depreciation & Amortization Customer Operations Corporate Operations Other Operating Expenses Operating Taxes Net Jurisdictional Differences Net Operating Income Nonoperating Net Income (Loss) Imputations Reported Net Income
[A]-[K] See Notes on page 84.
Small Telecommunications Utilities[B]
Oregon and System OperationsYear Ending December 31, 2012
Monroe Nehalem North-State Oregon Telephone Telephone Telephone Telephone Telecommuni- Telephone Corporation Company Company Company cations, Inc. Company System
[G] [L] [H] [H]
N/A $2,027 $1,065 $1,300 $181 $2,176N/A 2,011 2,535 4,050 1,318 5,874N/A 3,248 2,099 5,241 10,011 23,368N/A 3 0 73 308 11N/A (5,557) (4,502) (9,849) (3,570) (12,087)
$1,732 $1,197 $815 $8,248 $19,342N/A 5,310 0 0 0 0N/A 1,089 1,143 4,700 4,756 9,238N/A $8,131 $2,340 $5,515 $13,004 $28,580
N/A $2,694 $1,599 $1,617 $8,087 $20,583N/A 4,347 (671) 1,772 1,959 2,581N/A 1,090 1,412 2,126 2,958 5,416N/A $8,131 $2,340 $5,515 $13,004 $28,580
N/A $181 $620 $516 $125 $470N/A 1,382 1,061 1,608 2,182 6,386N/A 484 313 285 49 63N/A $2,047 $1,994 $2,409 $2,356 $6,919N/A 729 440 493 220 734N/A 411 189 631 428 1,576N/A 184 367 146 33 133N/A 420 235 594 292 894N/A 36 90 36 66 172N/A 137 266 148 426 1,061N/A 0 (4) 0 0 0N/A $130 $411 $361 $891 $2,349N/A (160) (82) (159) (533) (531)N/A 0 0 (32) 0 0N/A ($30) $329 $170 $358 $1,818
Malheur Home
Mount Angel
74
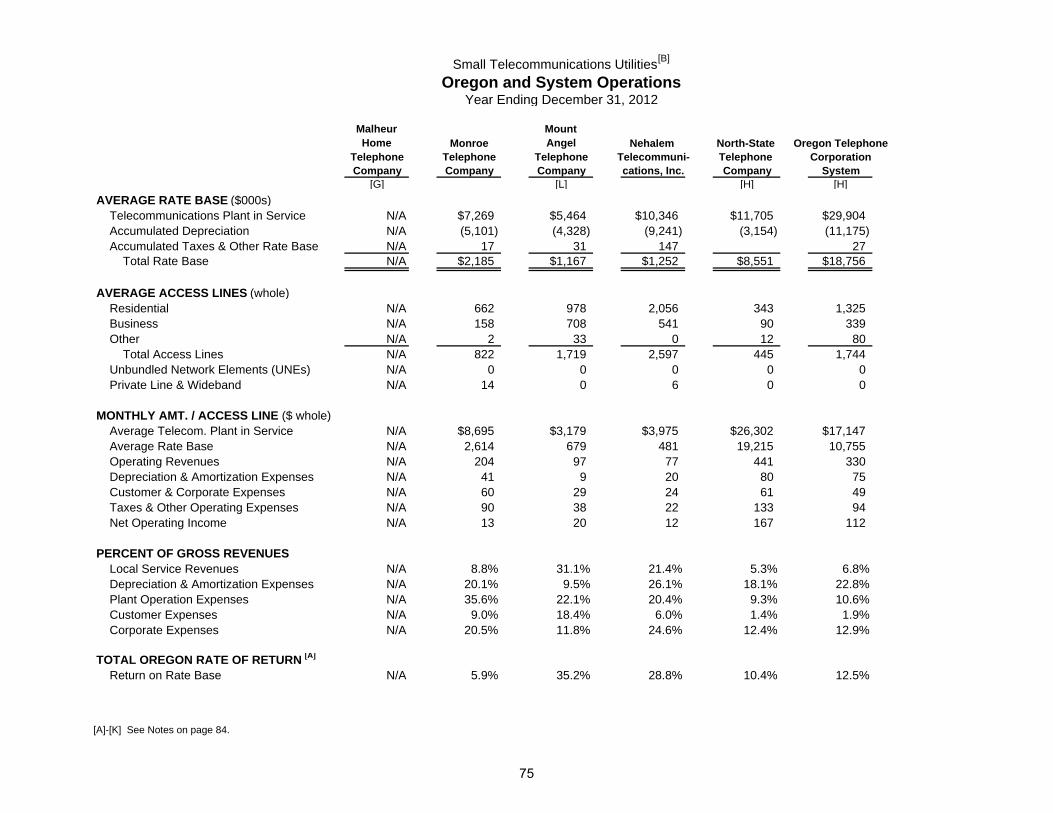
AVERAGE RATE BASE ($000s) Telecommunications Plant in Service Accumulated Depreciation Accumulated Taxes & Other Rate Base Total Rate Base
AVERAGE ACCESS LINES (whole) Residential Business Other Total Access Lines Unbundled Network Elements (UNEs) Private Line & Wideband Private Line & Wideband MONTHLY AMT. / ACCESS LINE ($ whole) Average Telecom. Plant in Service Average Rate Base Operating Revenues Depreciation & Amortization Expenses Customer & Corporate Expenses Taxes & Other Operating Expenses Net Operating Income
PERCENT OF GROSS REVENUES Local Service Revenues Depreciation & Amortization Expenses Plant Operation Expenses Customer Expenses Corporate Expenses
TOTAL OREGON RATE OF RETURN [A]
Return on Rate Base
[A]-[K] See Notes on page 84.
Small Telecommunications Utilities[B]
Oregon and System OperationsYear Ending December 31, 2012
Monroe Nehalem North-State Oregon Telephone Telephone Telephone Telephone Telecommuni- Telephone Corporation Company Company Company cations, Inc. Company System
[G] [L] [H] [H]
Malheur Home
Mount Angel
N/A $7,269 $5,464 $10,346 $11,705 $29,904N/A (5,101) (4,328) (9,241) (3,154) (11,175)N/A 17 31 147 27N/A $2,185 $1,167 $1,252 $8,551 $18,756
N/A 662 978 2,056 343 1,325N/A 158 708 541 90 339N/A 2 33 0 12 80N/A 822 1,719 2,597 445 1,744N/A 0 0 0 0 0N/A 14 0 6 0 0
N/A $8,695 $3,179 $3,975 $26,302 $17,147N/A 2,614 679 481 19,215 10,755N/A 204 97 77 441 330N/A 41 9 20 80 75N/A 60 29 24 61 49N/A 90 38 22 133 94N/A 13 20 12 167 112
N/A 8.8% 31.1% 21.4% 5.3% 6.8%N/A 20.1% 9.5% 26.1% 18.1% 22.8%N/A 35.6% 22.1% 20.4% 9.3% 10.6%N/A 9.0% 18.4% 6.0% 1.4% 1.9%N/A 20.5% 11.8% 24.6% 12.4% 12.9%
N/A 5.9% 35.2% 28.8% 10.4% 12.5%
75

BALANCE SHEET ($000s) Land & Support Assets Central Office Equipment Cable & Wire Facilities Other Telecommunications Plant Accumulated Depreciation Net Telecommunications Plant Plant Under Construction Other Assets & Other Debits Total Assets & Other Debits
Long-Term Debt Other Liabilities & Deferred Credits Stockholders' Equity Total Liabilities & Other Credits
INCOME STATEMENT ($000s) Local Service Toll, Access & Universal Service Funds Directory, Other & Uncollectibles Total Operating Revenues Plant Operations Depreciation & Amortization Customer Operations Corporate Operations Other Operating Expenses Operating Taxes Net Jurisdictional Differences Net Operating Income Nonoperating Net Income (Loss) Imputations Reported Net Income
[A]-[K] See Notes on page 84.
Small Telecommunications Utilities[B]
Oregon and System OperationsYear Ending December 31, 2012
Peoples Pine Roome Telephone Telephone Telecommuni- Telephone
Oregon System Company System, Inc. cations Inc. Company[I] [F]
$1,887 $2,097 $103 $3,341 $2,361 $2213,941 4,379 1,366 6,979 2,235 614
10,934 12,149 7,139 29,370 1,882 1,107309 344 0 42 0 0
(11,288) (12,542) (4,566) (15,258) (5,657) (1,411)$5,783 $6,427 $4,042 $24,474 $821 $531
40 45 0 387 1 4632,464 1,744 2,859 4,751 1,418
$8,936 $5,786 $27,720 $5,573 $2,412
$2,768 $0 $20,710 $449 $378775 733 3,390 112 69
5,393 5,053 3,620 5,012 1,965$8,936 $5,786 $27,720 $5,573 $2,412
$153 $171 $283 $149 $209 $643,407 3,786 1,896 6,676 701 490
169 187 166 465 129 32$3,729 $4,144 $2,345 $7,290 $1,039 $586
610 678 289 1,201 401 217853 948 468 2,225 252 34155 172 143 222 76 45641 712 385 1,252 251 213583 647 142 73 82 8357 396 392 715 28 (46)
0 0 0 0 0 0$530 $591 $526 $1,602 ($51) $115(205) (230) 6 (1,004) 38 5
0 0 0 0 0 0$325 $361 $532 $598 ($13) $120
Trans-Cascades
Utilities, Inc. Oregon-Idaho
76
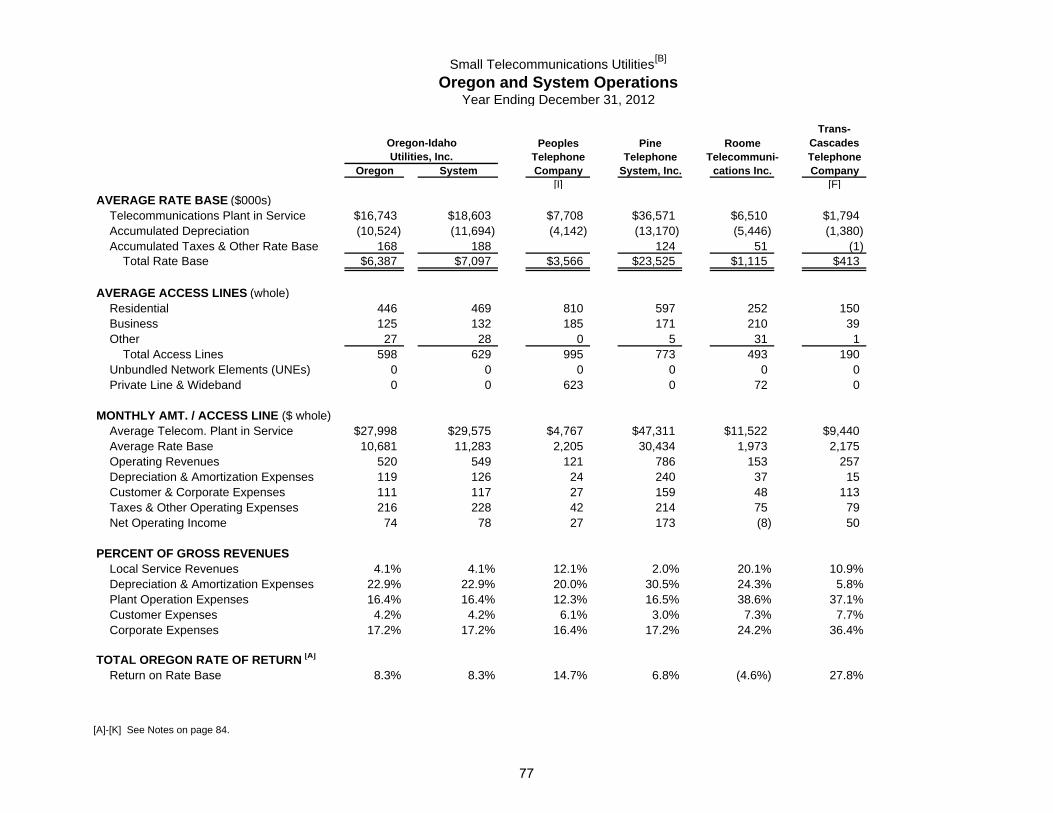
AVERAGE RATE BASE ($000s) Telecommunications Plant in Service Accumulated Depreciation Accumulated Taxes & Other Rate Base Total Rate Base
AVERAGE ACCESS LINES (whole) Residential Business Other Total Access Lines Unbundled Network Elements (UNEs) Private Line & Wideband Private Line & Wideband MONTHLY AMT. / ACCESS LINE ($ whole) Average Telecom. Plant in Service Average Rate Base Operating Revenues Depreciation & Amortization Expenses Customer & Corporate Expenses Taxes & Other Operating Expenses Net Operating Income
PERCENT OF GROSS REVENUES Local Service Revenues Depreciation & Amortization Expenses Plant Operation Expenses Customer Expenses Corporate Expenses
TOTAL OREGON RATE OF RETURN [A]
Return on Rate Base
[A]-[K] See Notes on page 84.
Small Telecommunications Utilities[B]
Oregon and System OperationsYear Ending December 31, 2012
Peoples Pine Roome Telephone Telephone Telecommuni- Telephone
Oregon System Company System, Inc. cations Inc. Company[I] [F]
Trans-Cascades
Utilities, Inc. Oregon-Idaho
$16,743 $18,603 $7,708 $36,571 $6,510 $1,794(10,524) (11,694) (4,142) (13,170) (5,446) (1,380)
168 188 124 51 (1)$6,387 $7,097 $3,566 $23,525 $1,115 $413
446 469 810 597 252 150125 132 185 171 210 39
27 28 0 5 31 1598 629 995 773 493 190
0 0 0 0 0 00 0 623 0 72 0
$27,998 $29,575 $4,767 $47,311 $11,522 $9,44010,681 11,283 2,205 30,434 1,973 2,175
520 549 121 786 153 257119 126 24 240 37 15111 117 27 159 48 113216 228 42 214 75 79
74 78 27 173 (8) 50
4.1% 4.1% 12.1% 2.0% 20.1% 10.9%22.9% 22.9% 20.0% 30.5% 24.3% 5.8%16.4% 16.4% 12.3% 16.5% 38.6% 37.1%
4.2% 4.2% 6.1% 3.0% 7.3% 7.7%17.2% 17.2% 16.4% 17.2% 24.2% 36.4%
8.3% 8.3% 14.7% 6.8% (4.6%) 27.8%
77
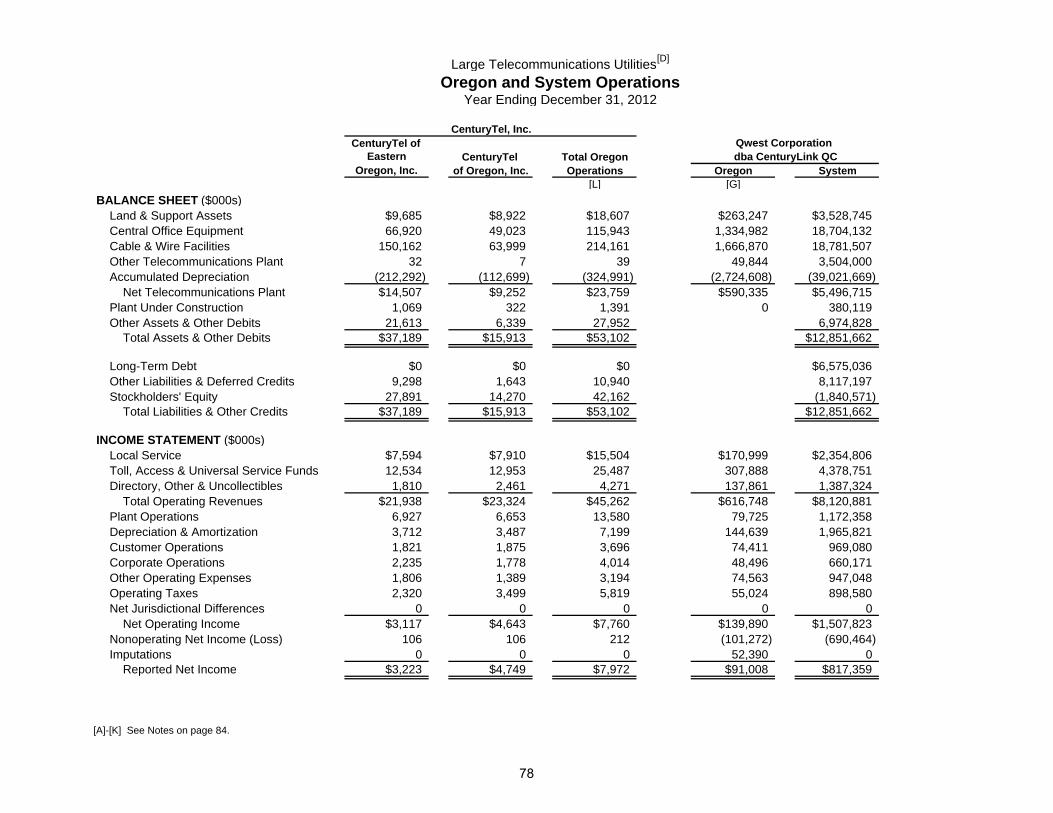
BALANCE SHEET ($000s) Land & Support Assets Central Office Equipment Cable & Wire Facilities Other Telecommunications Plant Accumulated Depreciation Net Telecommunications Plant Plant Under Construction Other Assets & Other Debits Total Assets & Other Debits
Long-Term Debt Other Liabilities & Deferred Credits Stockholders' Equity Total Liabilities & Other Credits
INCOME STATEMENT ($000s) Local Service Toll, Access & Universal Service Funds Directory, Other & Uncollectibles Total Operating Revenues Plant Operations Depreciation & Amortization Customer Operations Corporate Operations Other Operating Expenses Operating Taxes Net Jurisdictional Differences Net Operating Income Nonoperating Net Income (Loss) Imputations Reported Net Income
[A]-[K] See Notes on page 84.
Large Telecommunications Utilities[D]
Oregon and System OperationsYear Ending December 31, 2012
CenturyTel of CenturyTel Total Oregon
of Oregon, Inc. Operations Oregon System[L] [G]
$9,685 $8,922 $18,607 $263,247 $3,528,74566,920 49,023 115,943 1,334,982 18,704,132
150,162 63,999 214,161 1,666,870 18,781,50732 7 39 49,844 3,504,000
(212,292) (112,699) (324,991) (2,724,608) (39,021,669)$14,507 $9,252 $23,759 $590,335 $5,496,715
1,069 322 1,391 0 380,11921,613 6,339 27,952 6,974,828
$37,189 $15,913 $53,102 $12,851,662
$0 $0 $0 $6,575,0369,298 1,643 10,940 8,117,197
27,891 14,270 42,162 (1,840,571)$37,189 $15,913 $53,102 $12,851,662
$7,594 $7,910 $15,504 $170,999 $2,354,80612,534 12,953 25,487 307,888 4,378,751
1,810 2,461 4,271 137,861 1,387,324$21,938 $23,324 $45,262 $616,748 $8,120,881
6,927 6,653 13,580 79,725 1,172,3583,712 3,487 7,199 144,639 1,965,8211,821 1,875 3,696 74,411 969,0802,235 1,778 4,014 48,496 660,1711,806 1,389 3,194 74,563 947,0482,320 3,499 5,819 55,024 898,580
0 0 0 0 0$3,117 $4,643 $7,760 $139,890 $1,507,823
106 106 212 (101,272) (690,464)0 0 0 52,390 0
$3,223 $4,749 $7,972 $91,008 $817,359
Qwest Corporation dba CenturyLink QCEastern
Oregon, Inc.
CenturyTel, Inc.
78
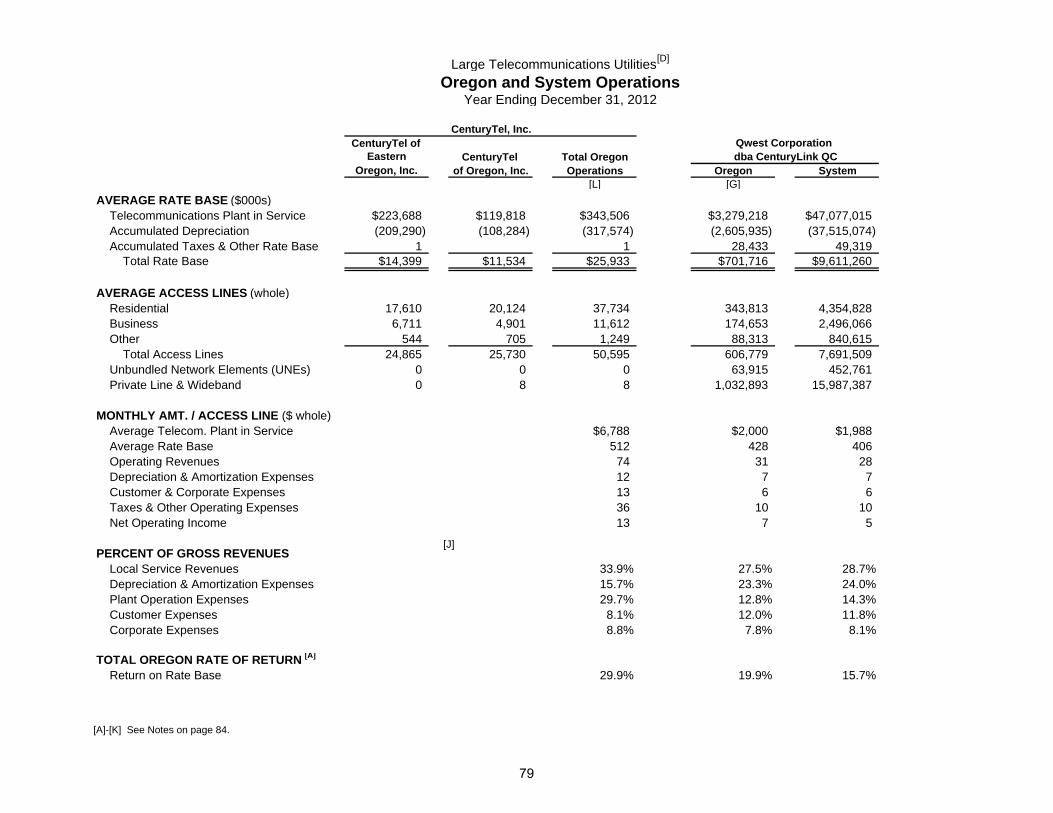
AVERAGE RATE BASE ($000s) Telecommunications Plant in Service Accumulated Depreciation Accumulated Taxes & Other Rate Base Total Rate Base
AVERAGE ACCESS LINES (whole) Residential Business Other Total Access Lines Unbundled Network Elements (UNEs) Private Line & Wideband Private Line & Wideband MONTHLY AMT. / ACCESS LINE ($ whole) Average Telecom. Plant in Service Average Rate Base Operating Revenues Depreciation & Amortization Expenses Customer & Corporate Expenses Taxes & Other Operating Expenses Net Operating Income
PERCENT OF GROSS REVENUES Local Service Revenues Depreciation & Amortization Expenses Plant Operation Expenses Customer Expenses Corporate Expenses
TOTAL OREGON RATE OF RETURN [A]
Return on Rate Base
[A]-[K] See Notes on page 84.
Large Telecommunications Utilities[D]
Oregon and System OperationsYear Ending December 31, 2012
CenturyTel of CenturyTel Total Oregon
of Oregon, Inc. Operations Oregon System[L] [G]
CenturyTel, Inc.Qwest Corporation dba CenturyLink QCEastern
Oregon, Inc.
$223,688 $119,818 $343,506 $3,279,218 $47,077,015(209,290) (108,284) (317,574) (2,605,935) (37,515,074)
1 1 28,433 49,319$14,399 $11,534 $25,933 $701,716 $9,611,260
17,610 20,124 37,734 343,813 4,354,8286,711 4,901 11,612 174,653 2,496,066
544 705 1,249 88,313 840,61524,865 25,730 50,595 606,779 7,691,509
0 0 0 63,915 452,7610 8 8 1,032,893 15,987,387
$6,788 $2,000 $1,988512 428 406
74 31 2812 7 713 6 636 10 1013 7 5
33.9% 27.5% 28.7%15.7% 23.3% 24.0%29.7% 12.8% 14.3%
8.1% 12.0% 11.8%8.8% 7.8% 8.1%
29.9% 19.9% 15.7%
[J]
79
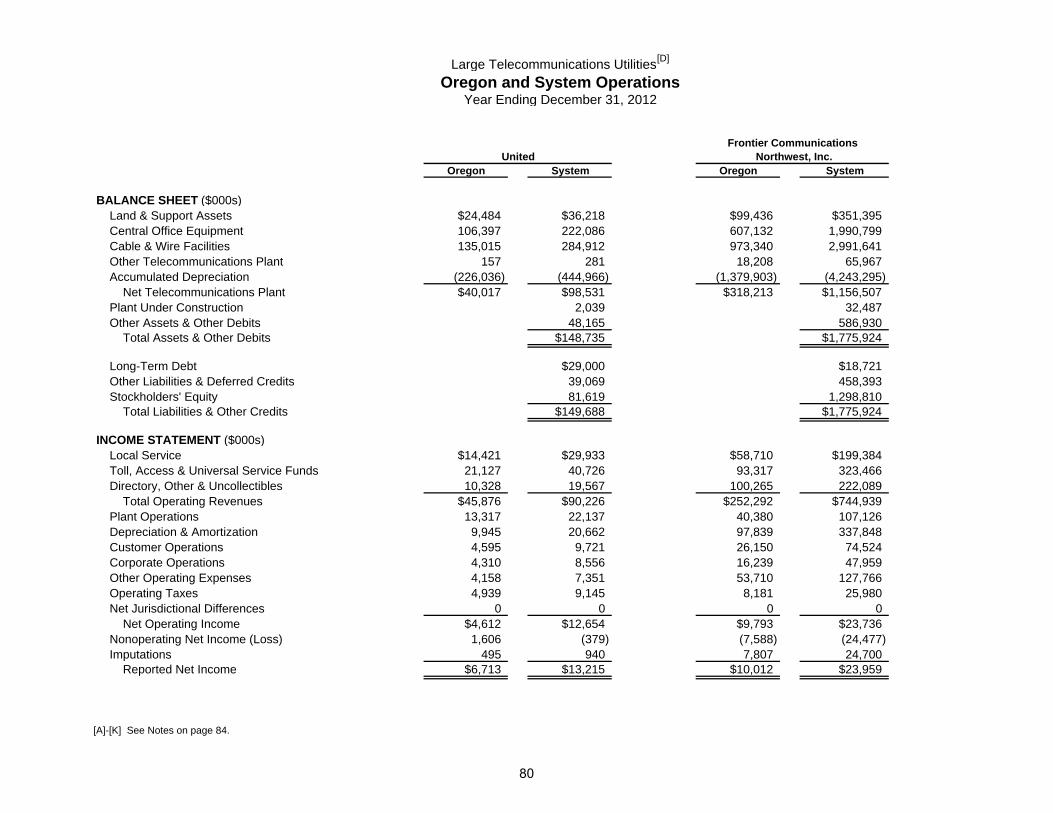
BALANCE SHEET ($000s) Land & Support Assets Central Office Equipment Cable & Wire Facilities Other Telecommunications Plant Accumulated Depreciation Net Telecommunications Plant Plant Under Construction Other Assets & Other Debits Total Assets & Other Debits
Long-Term Debt Other Liabilities & Deferred Credits Stockholders' Equity Total Liabilities & Other Credits
INCOME STATEMENT ($000s) Local Service Toll, Access & Universal Service Funds Directory, Other & Uncollectibles Total Operating Revenues Plant Operations Depreciation & Amortization Customer Operations Corporate Operations Other Operating Expenses Operating Taxes Net Jurisdictional Differences Net Operating Income Nonoperating Net Income (Loss) Imputations Reported Net Income
[A]-[K] See Notes on page 84.
Large Telecommunications Utilities[D]
Oregon and System OperationsYear Ending December 31, 2012
Oregon System Oregon System
$24,484 $36,218 $99,436 $351,395106,397 222,086 607,132 1,990,799135,015 284,912 973,340 2,991,641
157 281 18,208 65,967(226,036) (444,966) (1,379,903) (4,243,295)$40,017 $98,531 $318,213 $1,156,507
2,039 32,48748,165 586,930
$148,735 $1,775,924
$29,000 $18,72139,069 458,39381,619 1,298,810
$149,688 $1,775,924
$14,421 $29,933 $58,710 $199,38421,127 40,726 93,317 323,46610,328 19,567 100,265 222,089
$45,876 $90,226 $252,292 $744,93913,317 22,137 40,380 107,126
9,945 20,662 97,839 337,8484,595 9,721 26,150 74,5244,310 8,556 16,239 47,9594,158 7,351 53,710 127,7664,939 9,145 8,181 25,980
0 0 0 0$4,612 $12,654 $9,793 $23,736
1,606 (379) (7,588) (24,477)495 940 7,807 24,700
$6,713 $13,215 $10,012 $23,959
Frontier Communications Northwest, Inc.United
80
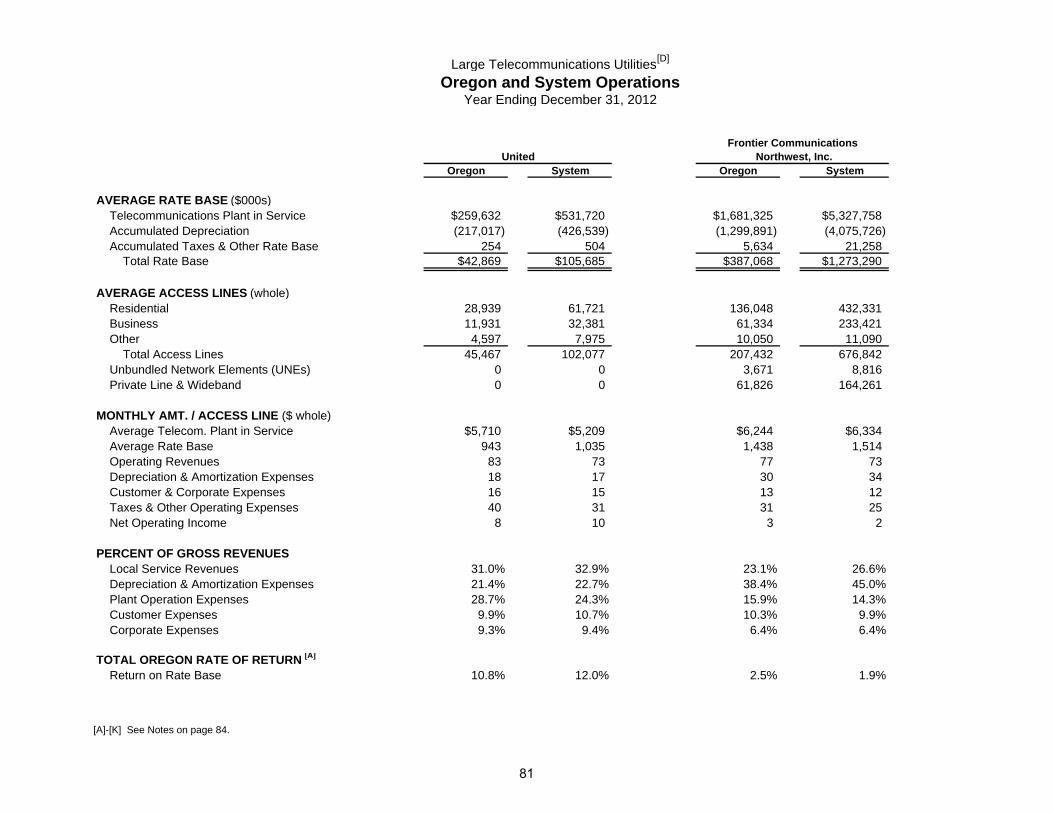
AVERAGE RATE BASE ($000s) Telecommunications Plant in Service Accumulated Depreciation Accumulated Taxes & Other Rate Base Total Rate Base
AVERAGE ACCESS LINES (whole) Residential Business Other Total Access Lines Unbundled Network Elements (UNEs) Private Line & Wideband Private Line & Wideband MONTHLY AMT. / ACCESS LINE ($ whole) Average Telecom. Plant in Service Average Rate Base Operating Revenues Depreciation & Amortization Expenses Customer & Corporate Expenses Taxes & Other Operating Expenses Net Operating Income
PERCENT OF GROSS REVENUES Local Service Revenues Depreciation & Amortization Expenses Plant Operation Expenses Customer Expenses Corporate Expenses
TOTAL OREGON RATE OF RETURN [A]
Return on Rate Base
[A]-[K] See Notes on page 84.
Large Telecommunications Utilities[D]
Oregon and System OperationsYear Ending December 31, 2012
Oregon System Oregon SystemUnited
Frontier Communications Northwest, Inc.
$259,632 $531,720 $1,681,325 $5,327,758(217,017) (426,539) (1,299,891) (4,075,726)
254 504 5,634 21,258$42,869 $105,685 $387,068 $1,273,290
28,939 61,721 136,048 432,33111,931 32,381 61,334 233,421
4,597 7,975 10,050 11,09045,467 102,077 207,432 676,842
0 0 3,671 8,8160 0 61,826 164,261
$5,710 $5,209 $6,244 $6,334943 1,035 1,438 1,514
83 73 77 7318 17 30 3416 15 13 1240 31 31 25
8 10 3 2
31.0% 32.9% 23.1% 26.6%21.4% 22.7% 38.4% 45.0%28.7% 24.3% 15.9% 14.3%
9.9% 10.7% 10.3% 9.9%9.3% 9.4% 6.4% 6.4%
10.8% 12.0% 2.5% 1.9%
81
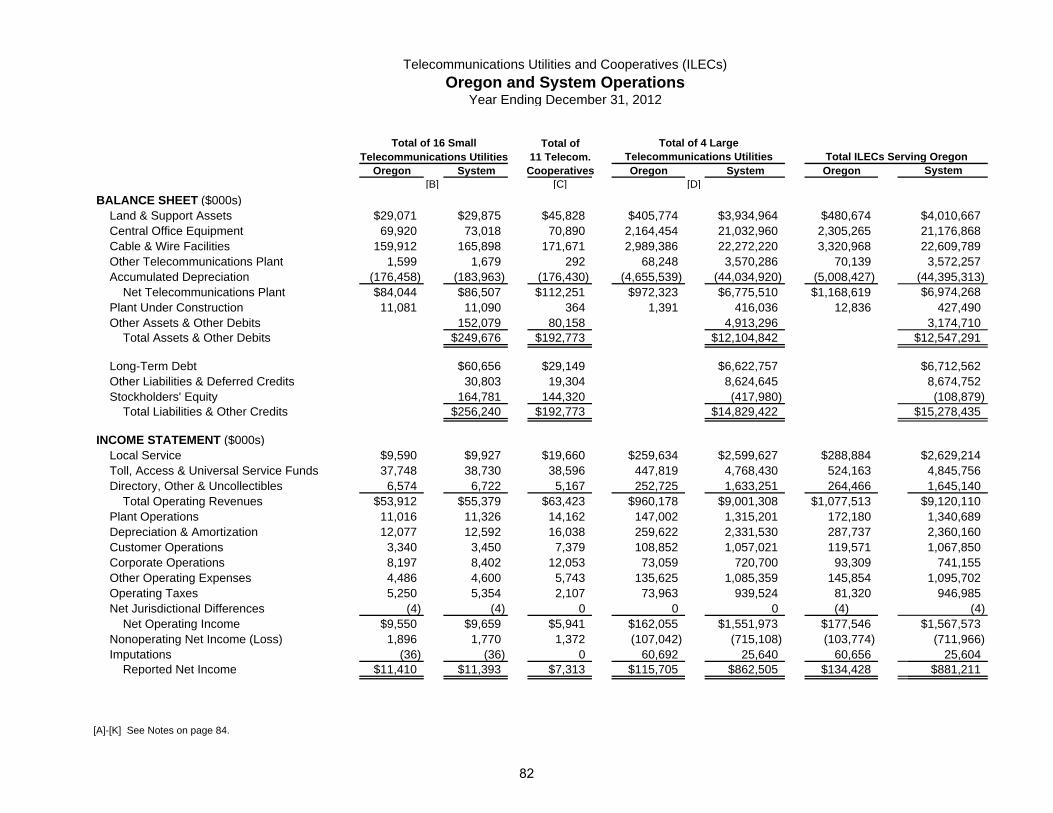
BALANCE SHEET ($000s) Land & Support Assets Central Office Equipment Cable & Wire Facilities Other Telecommunications Plant Accumulated Depreciation Net Telecommunications Plant Plant Under Construction Other Assets & Other Debits Total Assets & Other Debits
Long-Term Debt Other Liabilities & Deferred Credits Stockholders' Equity Total Liabilities & Other Credits
INCOME STATEMENT ($000s) Local Service Toll, Access & Universal Service Funds Directory, Other & Uncollectibles Total Operating Revenues Plant Operations Depreciation & Amortization Customer Operations Corporate Operations Other Operating Expenses Operating Taxes Net Jurisdictional Differences Net Operating Income Nonoperating Net Income (Loss) Imputations Reported Net Income
[A]-[K] See Notes on page 84.
Telecommunications Utilities and Cooperatives (ILECs)Oregon and System Operations
Year Ending December 31, 2012
Total ofTelecommunications Utilities 11 Telecom.
Oregon System Cooperatives Oregon System Oregon[B] [C] [D]
$29,071 $29,875 $45,828 $405,774 $3,934,964 $480,674 $4,010,66769,920 73,018 70,890 2,164,454 21,032,960 2,305,265 21,176,868
159,912 165,898 171,671 2,989,386 22,272,220 3,320,968 22,609,7891,599 1,679 292 68,248 3,570,286 70,139 3,572,257
(176,458) (183,963) (176,430) (4,655,539) (44,034,920) (5,008,427) (44,395,313)$84,044 $86,507 $112,251 $972,323 $6,775,510 $1,168,619
11,081 11,090 364 1,391 416,036 12,836 427,490152,079 80,158 4,913,296 3,174,710
$249,676 $192,773 $12,104,842
$60,656 $29,149 $6,622,757 $6,712,56230,803 19,304 8,624,645 8,674,752
164,781 144,320 (417,980) (108,879)$256,240 $192,773 $14,829,422
$9,590 $9,927 $19,660 $259,634 $2,599,627 $288,884 $2,629,21437,748 38,730 38,596 447,819 4,768,430 524,163 4,845,756
6,574 6,722 5,167 252,725 1,633,251 264,466 1,645,140$53,912 $55,379 $63,423 $960,178 $9,001,308 $1,077,513 $9,120,110
11,016 11,326 14,162 147,002 1,315,201 172,180 1,340,68912,077 12,592 16,038 259,622 2,331,530 287,737 2,360,160
3,340 3,450 7,379 108,852 1,057,021 119,571 1,067,8508,197 8,402 12,053 73,059 720,700 93,309 741,1554,486 4,600 5,743 135,625 1,085,359 145,854 1,095,7025,250 5,354 2,107 73,963 939,524 81,320 946,985
(4) (4) 0 0 0 (4) (4)$9,550 $9,659 $5,941 $162,055 $1,551,973 $177,546 $1,567,573
1,896 1,770 1,372 (107,042) (715,108) (103,774) (711,966)(36) (36) 0 60,692 25,640 60,656 25,604
$11,410 $11,393 $7,313 $115,705 $862,505 $134,428 $881,211
$15,278,435
$12,547,291
System
$6,974,268
Telecommunications Utilities Total ILECs Serving OregonTotal of 4 LargeTotal of 16 Small
82
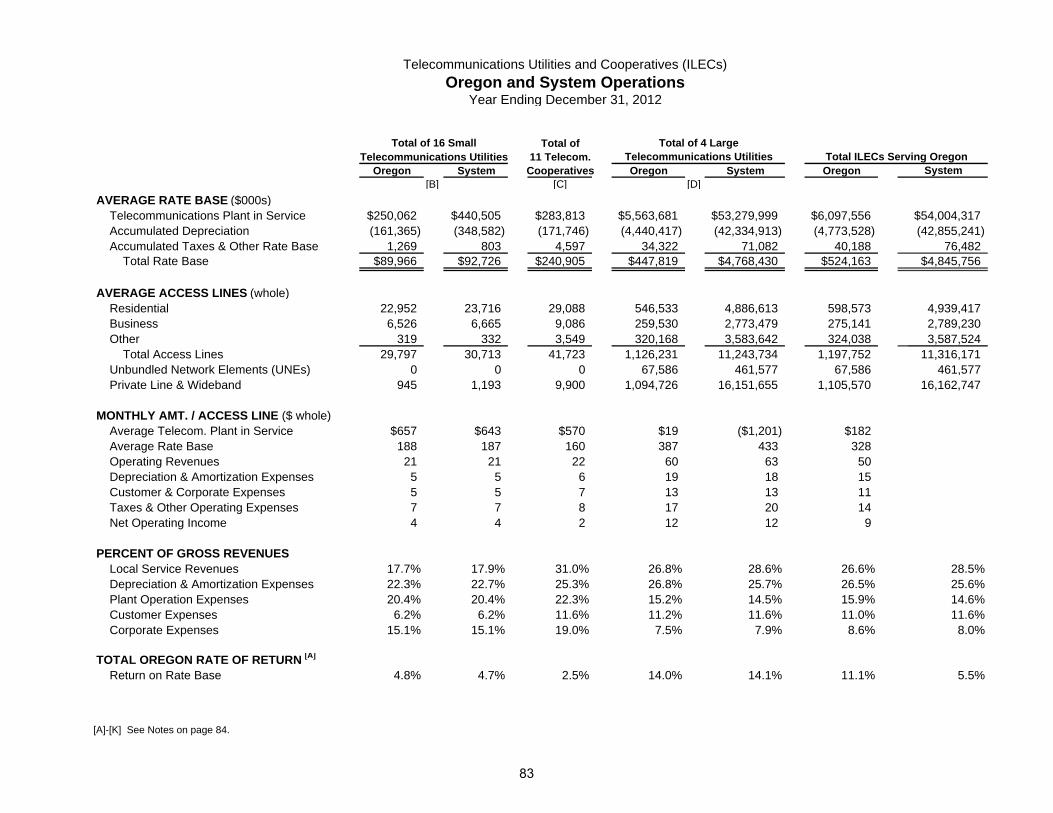
AVERAGE RATE BASE ($000s) Telecommunications Plant in Service Accumulated Depreciation Accumulated Taxes & Other Rate Base Total Rate Base
AVERAGE ACCESS LINES (whole) Residential Business Other Total Access Lines Unbundled Network Elements (UNEs) Private Line & Wideband Private Line & Wideband MONTHLY AMT. / ACCESS LINE ($ whole) Average Telecom. Plant in Service Average Rate Base Operating Revenues Depreciation & Amortization Expenses Customer & Corporate Expenses Taxes & Other Operating Expenses Net Operating Income
PERCENT OF GROSS REVENUES Local Service Revenues Depreciation & Amortization Expenses Plant Operation Expenses Customer Expenses Corporate Expenses
TOTAL OREGON RATE OF RETURN [A]
Return on Rate Base
[A]-[K] See Notes on page 84.
Telecommunications Utilities and Cooperatives (ILECs)Oregon and System Operations
Year Ending December 31, 2012
Total ofTelecommunications Utilities 11 Telecom.
Oregon System Cooperatives Oregon System Oregon[B] [C] [D]
SystemTelecommunications Utilities Total ILECs Serving Oregon
Total of 4 LargeTotal of 16 Small
$250,062 $440,505 $283,813 $5,563,681 $53,279,999 $6,097,556 $54,004,317(161,365) (348,582) (171,746) (4,440,417) (42,334,913) (4,773,528) (42,855,241)
1,269 803 4,597 34,322 71,082 40,188 76,482$89,966 $92,726 $240,905 $447,819 $4,768,430 $524,163
22,952 23,716 29,088 546,533 4,886,613 598,573 4,939,4176,526 6,665 9,086 259,530 2,773,479 275,141 2,789,230
319 332 3,549 320,168 3,583,642 324,038 3,587,52429,797 30,713 41,723 1,126,231 11,243,734 1,197,752 11,316,171
0 0 0 67,586 461,577 67,586 461,577945 1,193 9,900 1,094,726 16,151,655 1,105,570 16,162,747
$657 $643 $570 $19 ($1,201) $182188 187 160 387 433 328
21 21 22 60 63 505 5 6 19 18 155 5 7 13 13 117 7 8 17 20 144 4 2 12 12 9
17.7% 17.9% 31.0% 26.8% 28.6% 26.6% 28.5%22.3% 22.7% 25.3% 26.8% 25.7% 26.5% 25.6%20.4% 20.4% 22.3% 15.2% 14.5% 15.9% 14.6%
6.2% 6.2% 11.6% 11.2% 11.6% 11.0% 11.6%15.1% 15.1% 19.0% 7.5% 7.9% 8.6% 8.0%
4.8% 4.7% 2.5% 14.0% 14.1% 11.1% 5.5%
$4,845,756
83
Telecommunications Utilities and Cooperatives (ILECs)Notes to Financial and Statistical Data
Year Ending December 31, 2012
[A] Rate of return equals net operating income divided by average rate base. Total Oregon amounts include interstate operations subject to FCC jurisdiction, and the rates of return are provided for comparative purposes only. The Oregon Commission only regulates intrastate operations under Oregon Revised Statute (ORS) Chapter 759. Recently, intrastate rates of return have been lower than the interstate rates of return.
[B] Each small utility serves less than 50,000 access lines in Oregon. Their local rates are not generally subject to regulation. The statistics of the 16 small utilities are heavily weighted by Cascade Utilities and Citizens Telecommunications Company of Oregon (a Frontier affiliate). Combined, these two utilities serve 60 percent of Oregon's small telecommunications utility customers.
[C] For telecommunications cooperatives and associations, through services (as defined in Oregon Administrative Rule 860-034-0015) and access charges are subject to Commission regulation under ORSs 759.220 and 759.225. The statistics of the cooperatives are heavily weighted by Pioneer Telephone Cooperative, which serves 30 percent of Oregon's telecommunications cooperatives members; and Canby Telephone Association, which serves 15 percent.
[D] Each large utility serves at least 50,000 access lines in Oregon and is subject to intrastate regulation by the Commission, except as indicated in Note [J].
[E] Asotin Telephone Company and Home Telephone Company are owned by TDS Telecom.
[F] Cascade Utilities and Trans-Cascades Telephone Company are affiliated companies.
[G] Qwest Corporation dba CenturyLink QC absorbed Malheur Home Telephone Company. It no longer reports separately. See Order No. 09-483 effective December 10, 2009.
[H] North-State Telephone Company and Oregon Telephone Corporation are affiliated companies.
[I] Peoples Telephone Company is owned by Stayton Cooperative Telephone Company.
[J] CenturyTel of Eastern Oregon and CenturyTel of Oregon are treated as one entity for setting Oregon intrastate rates.
[K] Qwest's, United's, and Frontier Communications' yellow page revenue imputations are shown as required by Commission orders.
[L] Mt Angel Telephone Company is owned by Canby Telephone Association
84

Water
Foreword to Water Utilities
Data are not audited by the Commission and shown as submitted by the companies.
In general, only investor-owned water utilities and some water associations (when regulation is requested by 20 percent of membership) are regulated by the Oregon Public Utility Commission. The Commission regulates water rates if the utility: 1) serves 500 or more customers; 2) its average monthly residential rate exceeds $33 for unmetered systems or $36 for metered systems and 20 percent or more of its customers petition the Commission requesting regulation of rates; or 3) the utility requests to be regulated. During 2012, there were approximately 80 water utilities subject to PUC jurisdiction. However, only rate-regulated water utilities are required to file annual reports with the Commission.
For accounting purposes, water utilities are classified as A, B, and C, according to the level of water operating revenues.
Class A water utilities consistently have annual water operating revenues of $1,000,000 or more. There were three Class A water utilities in 2012: Avion Water Company, Inc.; Cline Butte Utility Company; and Sunriver Water LLC.
Class B water utilities consistently have annual water operating revenues between $200,000 and $999,999. There were five Class B water utilities in 2012: Charbonneau Water Company; Crooked River Ranch Water Company; Roats Water System; Running Y Utility Company; and Willamette Water Company.
Class C water utilities consistently have annual water operating revenues of less than $200,000. Seventeen Class C water utilities are included in the statistics book for 2012: Alsea Properties, Inc.; Clearwater Source LLC; DWF Round Lake Park & Utilities; Hillview Acres; Illahe Golf Club Estates; Lakeshore Water District; Long Butte Water System, Inc.; Metolius Meadows Property Owners Association; Odell Water Company; Old Sheep Ranch Water Association; Pelican Bay Heights Water System; Pete’s Mountain Water Company, Inc.; Shadow Wood Water Service; South Coast Water District, Inc.; South Hills Water System, Inc.; Squaw Creek Canyon Recreational Estates, Inc.; and Wilderness Canyon Water District.
85
Index to Water Utilities
Page Investor-Owned Class A Water Utilities Financial Data & Sales Statistics ...................................................................................................................................... 88
Avion Water Company, Inc. Cline Butte Utility Company Sunriver Water LLC
Class B Water Utilities Financial Data & Sales Statistics ...................................................................................................................................... 90
Charbonneau Water Company Crooked River Ranch Water Company Roats Water System Running Y Utility Company Willamette Water Company
Class C Water Utilities Financial Data & Sales Statistics ...................................................................................................................................... 92
Alsea Properties, Inc. Clearwater Source LLC DWF Round Lake Park & Utilities Hillview Acres Illahe Golf Club Estates Lakeshore Water District Long Butte Water System, Inc. Metolius Meadows Property Owners Association
86
Odell Water Company Old Sheep Ranch Water Association Pelican Bay Heights Water System Pete’s Mountain Water Company, Inc.
Shadow Wood Water Service South Coast Water District, Inc. South Hills Water System, Inc. Squaw Creek Canyon Recreational Estates, Inc. Wilderness Canyon Water District
87

Investor-Owned Water Utilities - Class AFinancial Data and Sales Statistics
Year Ending December 31, 2012
Avion Cline ButteWater Utility Sunriver
Company, Inc. Company Water LLCASSETS & OTHER DEBITS
Utility Plant $33,044,307 $2,688,601 $1,210,891Less: Depreciation & Amortization Reserve 0 0 0Other Property & Investments 580,065 1,043,733 (20,366)Materials and Supplies 176,517 0 47,547Other Current & Accrued Assets 339,648 56,850 1,618,309Deferred Debits 11,051 0 0 Total Assets & Other Debits $34,151,588 $3,789,184 $2,856,381
LIABILITIES & OTHER CREDITSCapital/Common Stock $164,338 $500 $3,320,708Retained Earnings 9,059,336 2,310,837 559,909Long-Term Debt 6,183,339 0 0Customer Deposits 500 0 0Other Current & Accrued Liabilities 259,161 1,477,847 3,516Advances for Construction 0 0 31,843Other Deferred Credits 0 0 0Contributions in Aid of Construction 18,109,612 0 1,229,514Accumulated Deferred Income Taxes 375,302 0 0 Total Liabilities & Other Credits $34,151,588 $3,789,184 $5,145,490
AVERAGE NUMBER OF CUSTOMERS Flat Rate 0 0 40Metered - Residential 11,127 1,336 4,238Metered - Commercial 320 25 118Irrigation (including golf courses) 787 139 117Fire Protection 0 0 30Other 0 1 3 Total Customers 12,234 1,501 4,546
88
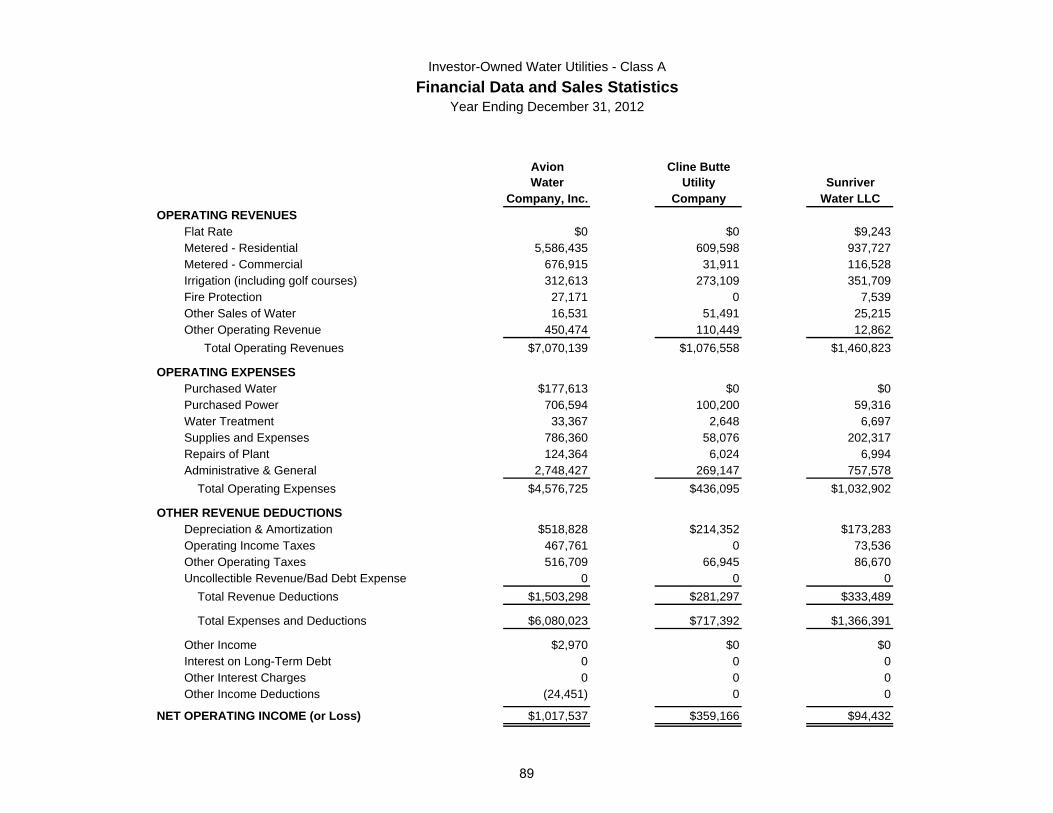
Investor-Owned Water Utilities - Class AFinancial Data and Sales Statistics
Year Ending December 31, 2012
Avion Cline ButteWater Utility Sunriver
Company, Inc. Company Water LLCOPERATING REVENUES
Flat Rate $0 $0 $9,243Metered - Residential 5,586,435 609,598 937,727Metered - Commercial 676,915 31,911 116,528Irrigation (including golf courses) 312,613 273,109 351,709Fire Protection 27,171 0 7,539Other Sales of Water 16,531 51,491 25,215Other Operating Revenue 450,474 110,449 12,862 Total Operating Revenues $7,070,139 $1,076,558 $1,460,823
OPERATING EXPENSESPurchased Water $177,613 $0 $0Purchased Power 706,594 100,200 59,316Water Treatment 33,367 2,648 6,697Supplies and Expenses 786,360 58,076 202,317Repairs of Plant 124,364 6,024 6,994Administrative & General 2,748,427 269,147 757,578 Total Operating Expenses $4,576,725 $436,095 $1,032,902
OTHER REVENUE DEDUCTIONSDepreciation & Amortization $518,828 $214,352 $173,283Operating Income Taxes 467,761 0 73,536Other Operating Taxes 516,709 66,945 86,670Uncollectible Revenue/Bad Debt Expense 0 0 0 Total Revenue Deductions $1,503,298 $281,297 $333,489
Total Expenses and Deductions $6,080,023 $717,392 $1,366,391
Other Income $2,970 $0 $0Interest on Long-Term Debt 0 0 0Other Interest Charges 0 0 0Other Income Deductions (24,451) 0 0
NET OPERATING INCOME (or Loss) $1,017,537 $359,166 $94,432
89

Investor-Owned Water Utilities - Class BFinancial Data and Sales Statistics
Year Ending December 31, 2012
Charbonneau Crooked River Roats Running Y WillametteWater Ranch Water Water Utility Water
Company Company System [A] Company CompanyASSETS & OTHER DEBITS
Utility Plant $464,652 ($1,794,948) $1,683,891 $580,669Less: Depreciation & Amortization Reserve 0 0 0 (514,864)Other Property & Investments 104,892 0 0 0Materials and Supplies 0 0 0 16,753Other Current & Accrued Assets 17,704 0 121,469 682,637Deferred Debits 0 0 0 8,454 Total Assets & Other Debits $587,248 ($1,794,948) $0 $1,805,360 $773,649
LIABILITIES & OTHER CREDITSCapital/Common Stock $200,000 $0 $500 $51,712Retained Earnings 383,981 0 996,204 (85,341)Long-Term Debt 0 40,736 0 0Customer Deposits 0 0 0 2,704Other Current & Accrued Liabilities 3,267 6,687 808,656 548,227Advances for Construction 0 0 0 0Other Deferred Credits 0 0 0 1,400Contributions in Aid of Construction 0 0 0 254,947Accumulated Deferred Income Taxes 0 0 0 0 Total Liabilities & Other Credits $587,248 $47,423 $0 $1,805,360 $773,649
AVERAGE NUMBER OF CUSTOMERS Flat Rate 0 0 0 0Metered - Residential 0 1,512 512 94Metered - Commercial 0 0 23 54Irrigation (including golf courses) 15 0 52 0Fire Protection 0 0 0 9Other 0 0 0 0 Total Customers 15 1,512 0 587 157
[A] Company did not file an annual report in time to be included
90
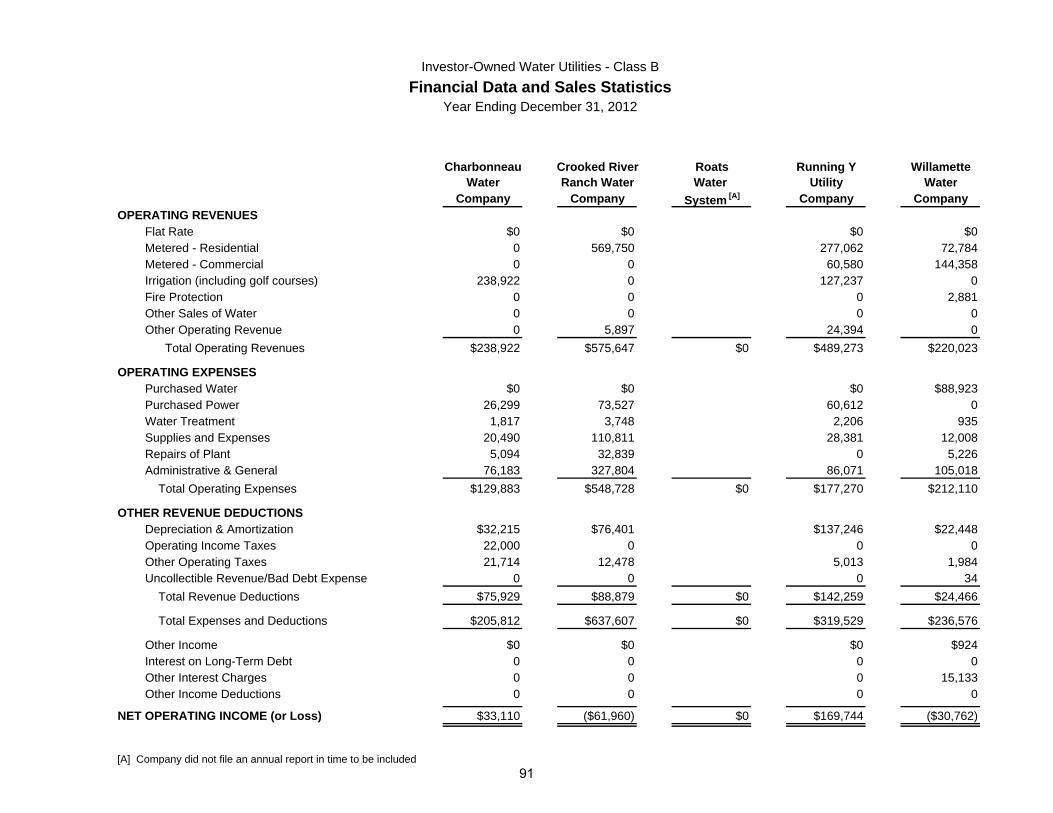
Investor-Owned Water Utilities - Class BFinancial Data and Sales Statistics
Year Ending December 31, 2012
Charbonneau Crooked River Roats Running Y WillametteWater Ranch Water Water Utility Water
Company Company System [A] Company CompanyOPERATING REVENUES
Flat Rate $0 $0 $0 $0Metered - Residential 0 569,750 277,062 72,784Metered - Commercial 0 0 60,580 144,358Irrigation (including golf courses) 238,922 0 127,237 0Fire Protection 0 0 0 2,881Other Sales of Water 0 0 0 0Other Operating Revenue 0 5,897 24,394 0 Total Operating Revenues $238,922 $575,647 $0 $489,273 $220,023
OPERATING EXPENSESPurchased Water $0 $0 $0 $88,923Purchased Power 26,299 73,527 60,612 0Water Treatment 1,817 3,748 2,206 935Supplies and Expenses 20,490 110,811 28,381 12,008Repairs of Plant 5,094 32,839 0 5,226Administrative & General 76,183 327,804 86,071 105,018 Total Operating Expenses $129,883 $548,728 $0 $177,270 $212,110
OTHER REVENUE DEDUCTIONSDepreciation & Amortization $32,215 $76,401 $137,246 $22,448Operating Income Taxes 22,000 0 0 0Other Operating Taxes 21,714 12,478 5,013 1,984Uncollectible Revenue/Bad Debt Expense 0 0 0 34 Total Revenue Deductions $75,929 $88,879 $0 $142,259 $24,466
Total Expenses and Deductions $205,812 $637,607 $0 $319,529 $236,576
Other Income $0 $0 $0 $924Interest on Long-Term Debt 0 0 0 0Other Interest Charges 0 0 0 15,133Other Income Deductions 0 0 0 0
NET OPERATING INCOME (or Loss) $33,110 ($61,960) $0 $169,744 ($30,762)
[A] Company did not file an annual report in time to be included91
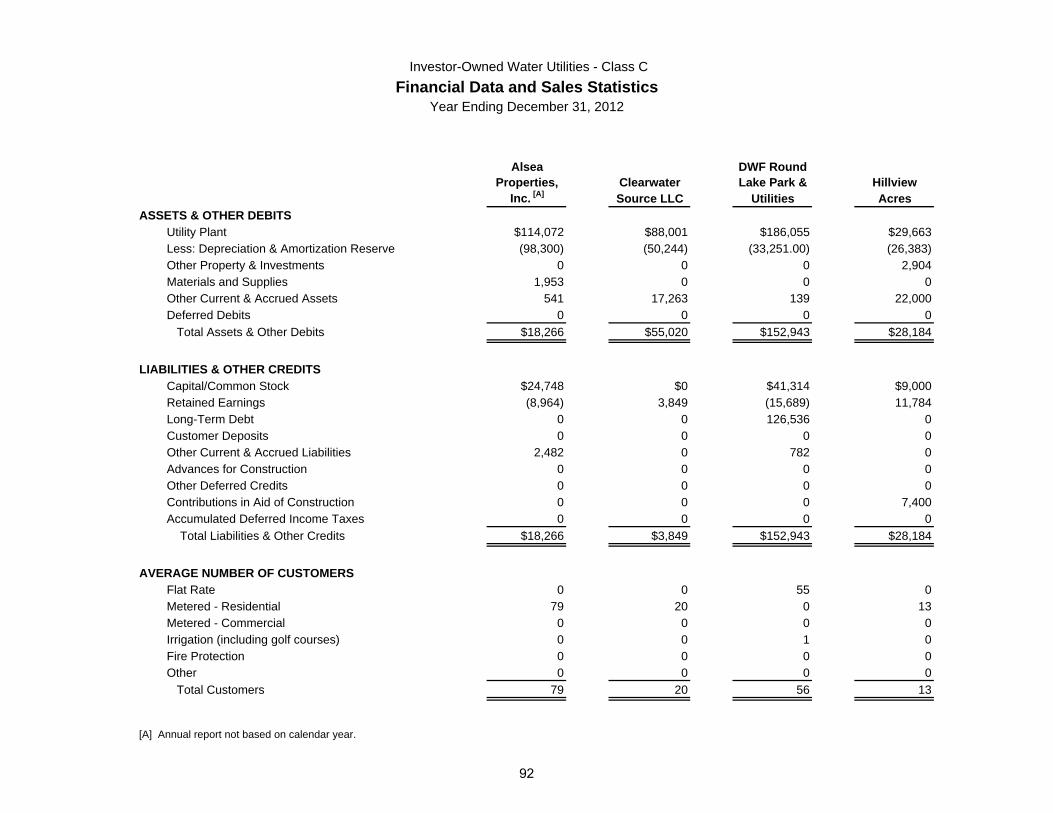
Investor-Owned Water Utilities - Class CFinancial Data and Sales Statistics
Year Ending December 31, 2012
Alsea DWF RoundProperties, Clearwater Lake Park & Hillview
Inc. [A] Source LLC Utilities AcresASSETS & OTHER DEBITS
Utility Plant $114,072 $88,001 $186,055 $29,663Less: Depreciation & Amortization Reserve (98,300) (50,244) (33,251.00) (26,383)Other Property & Investments 0 0 0 2,904Materials and Supplies 1,953 0 0 0Other Current & Accrued Assets 541 17,263 139 22,000Deferred Debits 0 0 0 0 Total Assets & Other Debits $18,266 $55,020 $152,943 $28,184
LIABILITIES & OTHER CREDITSCapital/Common Stock $24,748 $0 $41,314 $9,000Retained Earnings (8,964) 3,849 (15,689) 11,784Long-Term Debt 0 0 126,536 0Customer Deposits 0 0 0 0Other Current & Accrued Liabilities 2,482 0 782 0Advances for Construction 0 0 0 0Other Deferred Credits 0 0 0 0Contributions in Aid of Construction 0 0 0 7,400Accumulated Deferred Income Taxes 0 0 0 0 Total Liabilities & Other Credits $18,266 $3,849 $152,943 $28,184
AVERAGE NUMBER OF CUSTOMERSFlat Rate 0 0 55 0Metered - Residential 79 20 0 13Metered - Commercial 0 0 0 0Irrigation (including golf courses) 0 0 1 0Fire Protection 0 0 0 0Other 0 0 0 0 Total Customers 79 20 56 13
[A] Annual report not based on calendar year.
92
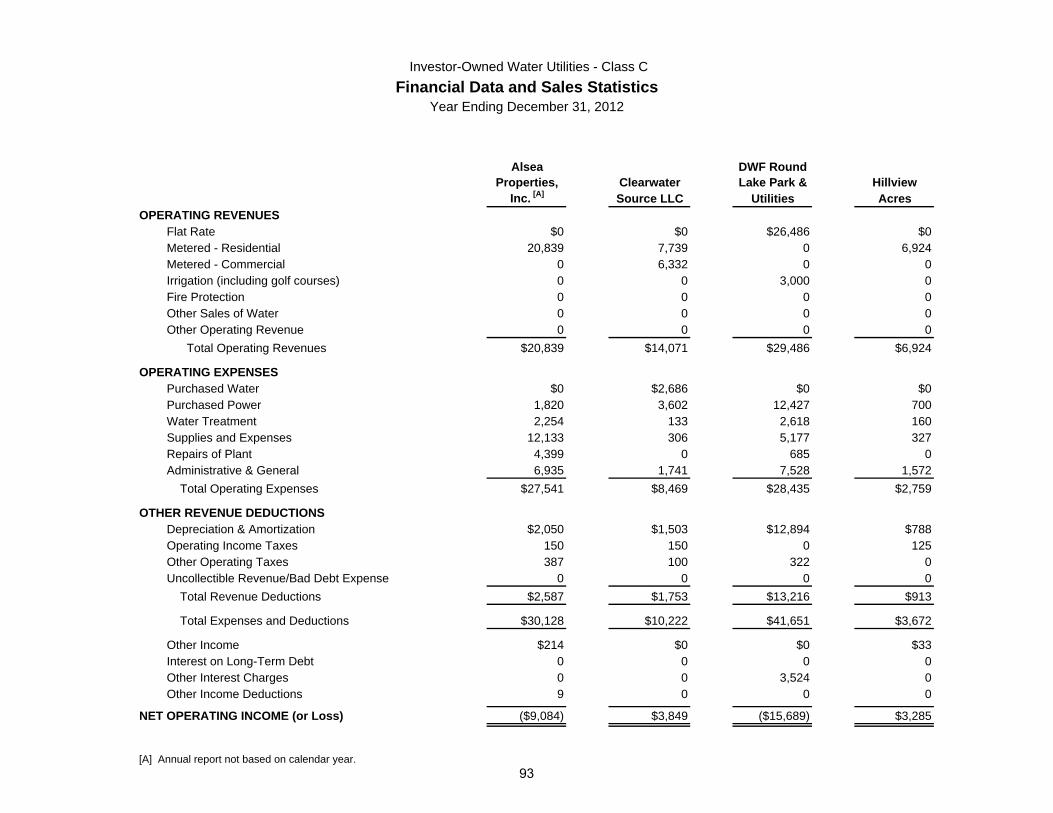
Investor-Owned Water Utilities - Class CFinancial Data and Sales Statistics
Year Ending December 31, 2012
Alsea DWF RoundProperties, Clearwater Lake Park & Hillview
Inc. [A] Source LLC Utilities AcresOPERATING REVENUES
Flat Rate $0 $0 $26,486 $0Metered - Residential 20,839 7,739 0 6,924Metered - Commercial 0 6,332 0 0Irrigation (including golf courses) 0 0 3,000 0Fire Protection 0 0 0 0Other Sales of Water 0 0 0 0Other Operating Revenue 0 0 0 0 Total Operating Revenues $20,839 $14,071 $29,486 $6,924
OPERATING EXPENSESPurchased Water $0 $2,686 $0 $0Purchased Power 1,820 3,602 12,427 700Water Treatment 2,254 133 2,618 160Supplies and Expenses 12,133 306 5,177 327Repairs of Plant 4,399 0 685 0Administrative & General 6,935 1,741 7,528 1,572 Total Operating Expenses $27,541 $8,469 $28,435 $2,759
OTHER REVENUE DEDUCTIONSDepreciation & Amortization $2,050 $1,503 $12,894 $788Operating Income Taxes 150 150 0 125Other Operating Taxes 387 100 322 0Uncollectible Revenue/Bad Debt Expense 0 0 0 0 Total Revenue Deductions $2,587 $1,753 $13,216 $913
Total Expenses and Deductions $30,128 $10,222 $41,651 $3,672
Other Income $214 $0 $0 $33Interest on Long-Term Debt 0 0 0 0Other Interest Charges 0 0 3,524 0Other Income Deductions 9 0 0 0
NET OPERATING INCOME (or Loss) ($9,084) $3,849 ($15,689) $3,285
[A] Annual report not based on calendar year.93
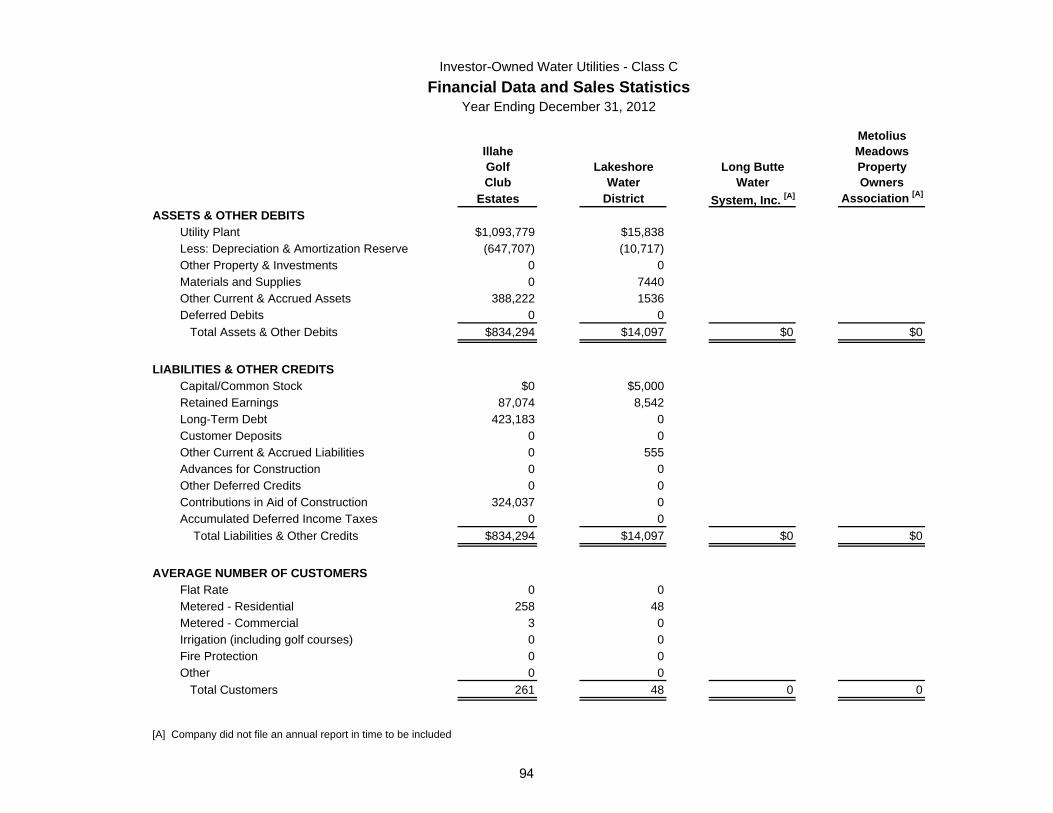
Investor-Owned Water Utilities - Class CFinancial Data and Sales Statistics
Year Ending December 31, 2012
MetoliusIllahe MeadowsGolf Lakeshore Long Butte PropertyClub Water Water Owners
Estates District System, Inc. [A] Association [A]
ASSETS & OTHER DEBITS Utility Plant $1,093,779 $15,838Less: Depreciation & Amortization Reserve (647,707) (10,717)Other Property & Investments 0 0Materials and Supplies 0 7440Other Current & Accrued Assets 388,222 1536Deferred Debits 0 0 Total Assets & Other Debits $834,294 $14,097 $0 $0
LIABILITIES & OTHER CREDITSCapital/Common Stock $0 $5,000Retained Earnings 87,074 8,542Long-Term Debt 423,183 0Customer Deposits 0 0Other Current & Accrued Liabilities 0 555Advances for Construction 0 0Other Deferred Credits 0 0Contributions in Aid of Construction 324,037 0Accumulated Deferred Income Taxes 0 0 Total Liabilities & Other Credits $834,294 $14,097 $0 $0
AVERAGE NUMBER OF CUSTOMERS Flat Rate 0 0Metered - Residential 258 48Metered - Commercial 3 0Irrigation (including golf courses) 0 0Fire Protection 0 0Other 0 0 Total Customers 261 48 0 0
[A] Company did not file an annual report in time to be included
94
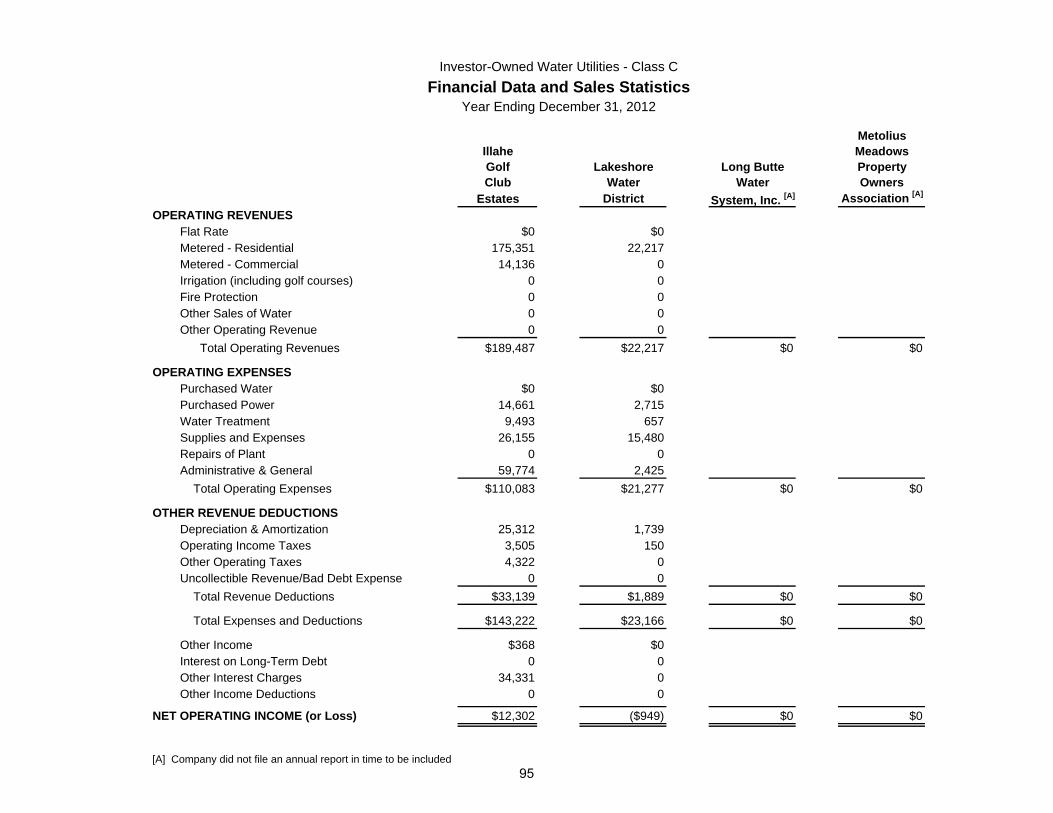
Investor-Owned Water Utilities - Class CFinancial Data and Sales Statistics
Year Ending December 31, 2012
MetoliusIllahe MeadowsGolf Lakeshore Long Butte PropertyClub Water Water Owners
Estates District System, Inc. [A] Association [A]
OPERATING REVENUESFlat Rate $0 $0Metered - Residential 175,351 22,217Metered - Commercial 14,136 0Irrigation (including golf courses) 0 0Fire Protection 0 0Other Sales of Water 0 0Other Operating Revenue 0 0 Total Operating Revenues $189,487 $22,217 $0 $0
OPERATING EXPENSESPurchased Water $0 $0Purchased Power 14,661 2,715Water Treatment 9,493 657Supplies and Expenses 26,155 15,480Repairs of Plant 0 0Administrative & General 59,774 2,425 Total Operating Expenses $110,083 $21,277 $0 $0
OTHER REVENUE DEDUCTIONSDepreciation & Amortization 25,312 1,739Operating Income Taxes 3,505 150Other Operating Taxes 4,322 0Uncollectible Revenue/Bad Debt Expense 0 0 Total Revenue Deductions $33,139 $1,889 $0 $0
Total Expenses and Deductions $143,222 $23,166 $0 $0
Other Income $368 $0Interest on Long-Term Debt 0 0Other Interest Charges 34,331 0Other Income Deductions 0 0
NET OPERATING INCOME (or Loss) $12,302 ($949) $0 $0
[A] Company did not file an annual report in time to be included95
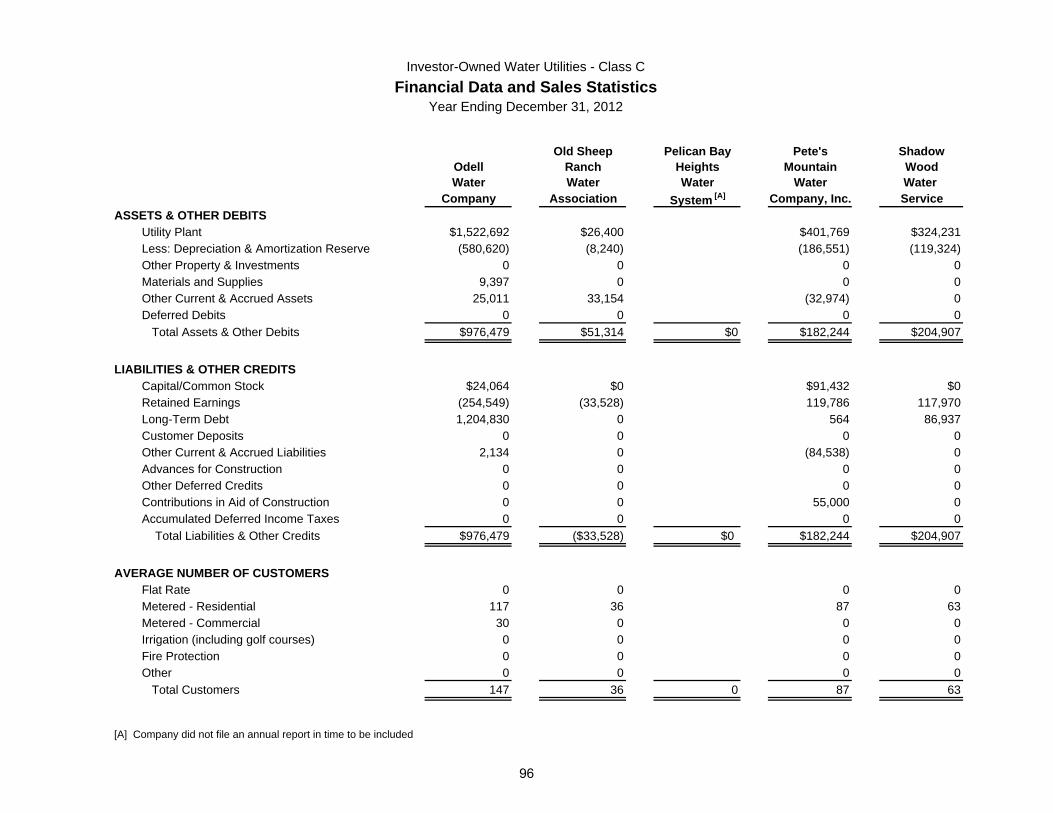
Investor-Owned Water Utilities - Class CFinancial Data and Sales Statistics
Year Ending December 31, 2012
Old Sheep Pelican Bay Pete's ShadowOdell Ranch Heights Mountain WoodWater Water Water Water Water
Company Association System [A] Company, Inc. ServiceASSETS & OTHER DEBITS
Utility Plant $1,522,692 $26,400 $401,769 $324,231Less: Depreciation & Amortization Reserve (580,620) (8,240) (186,551) (119,324)Other Property & Investments 0 0 0 0Materials and Supplies 9,397 0 0 0Other Current & Accrued Assets 25,011 33,154 (32,974) 0Deferred Debits 0 0 0 0 Total Assets & Other Debits $976,479 $51,314 $0 $182,244 $204,907
LIABILITIES & OTHER CREDITSCapital/Common Stock $24,064 $0 $91,432 $0Retained Earnings (254,549) (33,528) 119,786 117,970Long-Term Debt 1,204,830 0 564 86,937Customer Deposits 0 0 0 0Other Current & Accrued Liabilities 2,134 0 (84,538) 0Advances for Construction 0 0 0 0Other Deferred Credits 0 0 0 0Contributions in Aid of Construction 0 0 55,000 0Accumulated Deferred Income Taxes 0 0 0 0 Total Liabilities & Other Credits $976,479 ($33,528) $0 $182,244 $204,907
AVERAGE NUMBER OF CUSTOMERS Flat Rate 0 0 0 0Metered - Residential 117 36 87 63Metered - Commercial 30 0 0 0Irrigation (including golf courses) 0 0 0 0Fire Protection 0 0 0 0Other 0 0 0 0 Total Customers 147 36 0 87 63
[A] Company did not file an annual report in time to be included
96
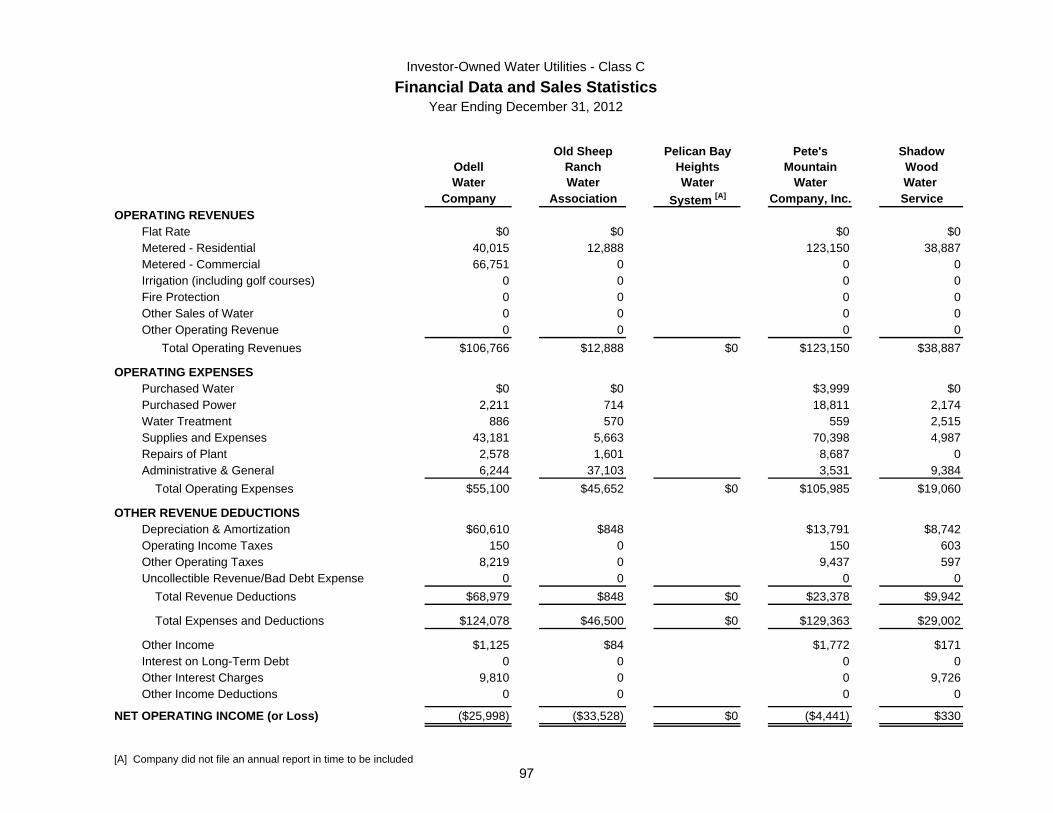
Investor-Owned Water Utilities - Class CFinancial Data and Sales Statistics
Year Ending December 31, 2012
Old Sheep Pelican Bay Pete's ShadowOdell Ranch Heights Mountain WoodWater Water Water Water Water
Company Association System [A] Company, Inc. ServiceOPERATING REVENUES
Flat Rate $0 $0 $0 $0Metered - Residential 40,015 12,888 123,150 38,887Metered - Commercial 66,751 0 0 0Irrigation (including golf courses) 0 0 0 0Fire Protection 0 0 0 0Other Sales of Water 0 0 0 0Other Operating Revenue 0 0 0 0 Total Operating Revenues $106,766 $12,888 $0 $123,150 $38,887
OPERATING EXPENSESPurchased Water $0 $0 $3,999 $0Purchased Power 2,211 714 18,811 2,174Water Treatment 886 570 559 2,515Supplies and Expenses 43,181 5,663 70,398 4,987Repairs of Plant 2,578 1,601 8,687 0Administrative & General 6,244 37,103 3,531 9,384 Total Operating Expenses $55,100 $45,652 $0 $105,985 $19,060
OTHER REVENUE DEDUCTIONSDepreciation & Amortization $60,610 $848 $13,791 $8,742Operating Income Taxes 150 0 150 603Other Operating Taxes 8,219 0 9,437 597Uncollectible Revenue/Bad Debt Expense 0 0 0 0 Total Revenue Deductions $68,979 $848 $0 $23,378 $9,942
Total Expenses and Deductions $124,078 $46,500 $0 $129,363 $29,002
Other Income $1,125 $84 $1,772 $171Interest on Long-Term Debt 0 0 0 0Other Interest Charges 9,810 0 0 9,726Other Income Deductions 0 0 0 0
NET OPERATING INCOME (or Loss) ($25,998) ($33,528) $0 ($4,441) $330
[A] Company did not file an annual report in time to be included97
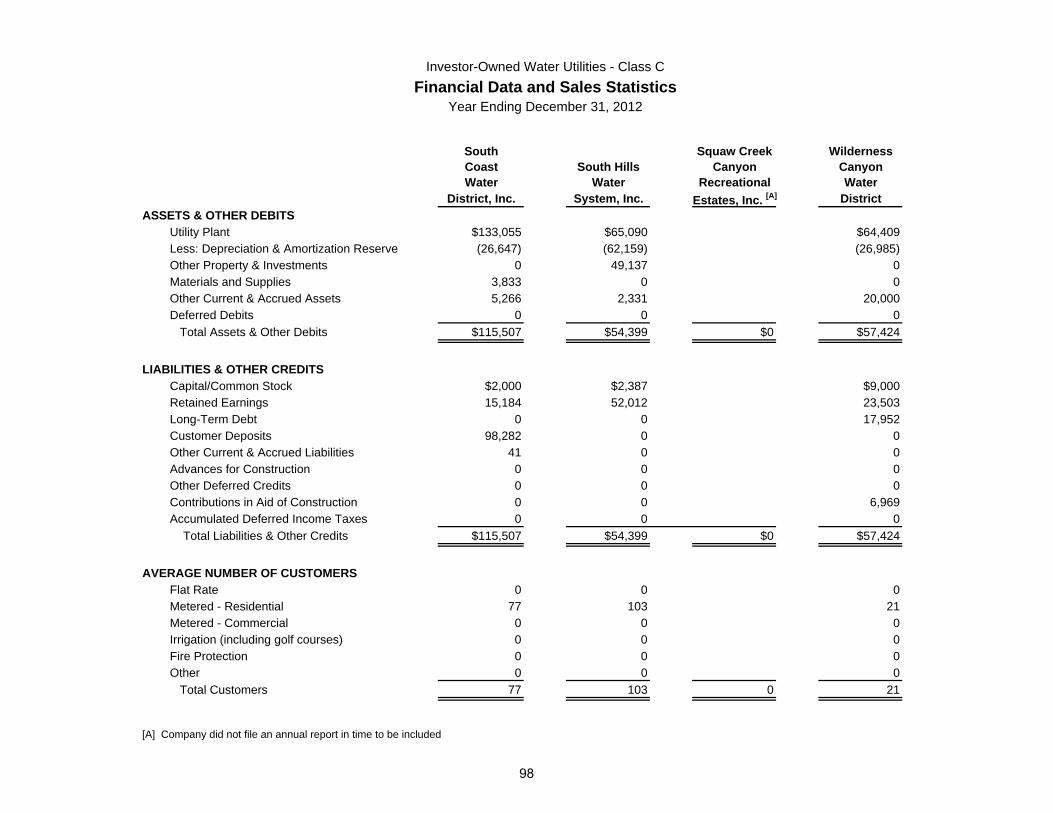
Investor-Owned Water Utilities - Class CFinancial Data and Sales Statistics
Year Ending December 31, 2012
South Squaw Creek WildernessCoast South Hills Canyon CanyonWater Water Recreational Water
District, Inc. System, Inc. Estates, Inc. [A] DistrictASSETS & OTHER DEBITS
Utility Plant $133,055 $65,090 $64,409Less: Depreciation & Amortization Reserve (26,647) (62,159) (26,985)Other Property & Investments 0 49,137 0Materials and Supplies 3,833 0 0Other Current & Accrued Assets 5,266 2,331 20,000Deferred Debits 0 0 0 Total Assets & Other Debits $115,507 $54,399 $0 $57,424
LIABILITIES & OTHER CREDITSCapital/Common Stock $2,000 $2,387 $9,000Retained Earnings 15,184 52,012 23,503Long-Term Debt 0 0 17,952Customer Deposits 98,282 0 0Other Current & Accrued Liabilities 41 0 0Advances for Construction 0 0 0Other Deferred Credits 0 0 0Contributions in Aid of Construction 0 0 6,969Accumulated Deferred Income Taxes 0 0 0 Total Liabilities & Other Credits $115,507 $54,399 $0 $57,424
AVERAGE NUMBER OF CUSTOMERS Flat Rate 0 0 0Metered - Residential 77 103 21Metered - Commercial 0 0 0Irrigation (including golf courses) 0 0 0Fire Protection 0 0 0Other 0 0 0 Total Customers 77 103 0 21
[A] Company did not file an annual report in time to be included
98
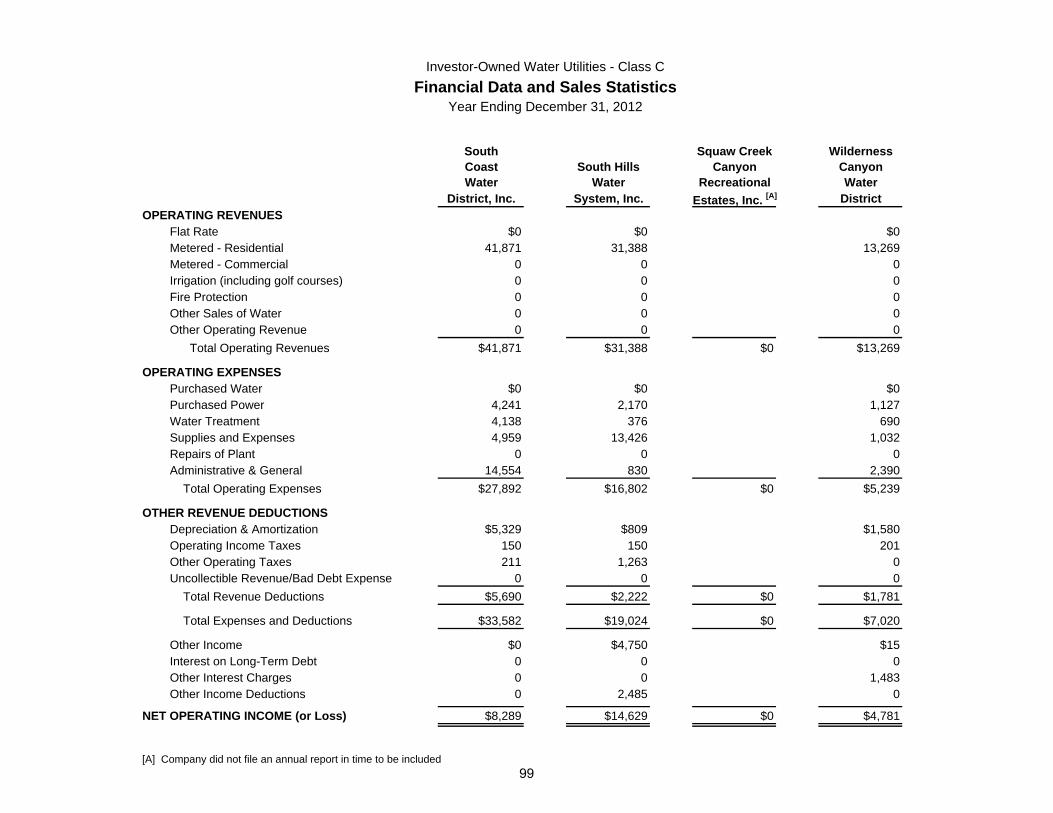
Investor-Owned Water Utilities - Class CFinancial Data and Sales Statistics
Year Ending December 31, 2012
South Squaw Creek WildernessCoast South Hills Canyon CanyonWater Water Recreational Water
District, Inc. System, Inc. Estates, Inc. [A] DistrictOPERATING REVENUES
Flat Rate $0 $0 $0Metered - Residential 41,871 31,388 13,269Metered - Commercial 0 0 0Irrigation (including golf courses) 0 0 0Fire Protection 0 0 0Other Sales of Water 0 0 0Other Operating Revenue 0 0 0 Total Operating Revenues $41,871 $31,388 $0 $13,269
OPERATING EXPENSESPurchased Water $0 $0 $0Purchased Power 4,241 2,170 1,127Water Treatment 4,138 376 690Supplies and Expenses 4,959 13,426 1,032Repairs of Plant 0 0 0Administrative & General 14,554 830 2,390 Total Operating Expenses $27,892 $16,802 $0 $5,239
OTHER REVENUE DEDUCTIONSDepreciation & Amortization $5,329 $809 $1,580Operating Income Taxes 150 150 201Other Operating Taxes 211 1,263 0Uncollectible Revenue/Bad Debt Expense 0 0 0 Total Revenue Deductions $5,690 $2,222 $0 $1,781
Total Expenses and Deductions $33,582 $19,024 $0 $7,020
Other Income $0 $4,750 $15Interest on Long-Term Debt 0 0 0Other Interest Charges 0 0 1,483Other Income Deductions 0 2,485 0
NET OPERATING INCOME (or Loss) $8,289 $14,629 $0 $4,781
[A] Company did not file an annual report in time to be included99