Optimize an Existing Program by Introducing Parallelism · Optimize an Existing Program by...
10
Optimize an Existing Program by Introducing Parallelism with Intel® Parallel Studio XE for Windows*
Transcript of Optimize an Existing Program by Introducing Parallelism · Optimize an Existing Program by...
Optimize an Existing
Program by
Introducing Parallelism with Intel® Parallel Studio XE for Windows*
2
INTEL® PARALLEL STUDIO XE EVALUATION GUIDE
Optimize an Existing Program by
Introducing Parallelism
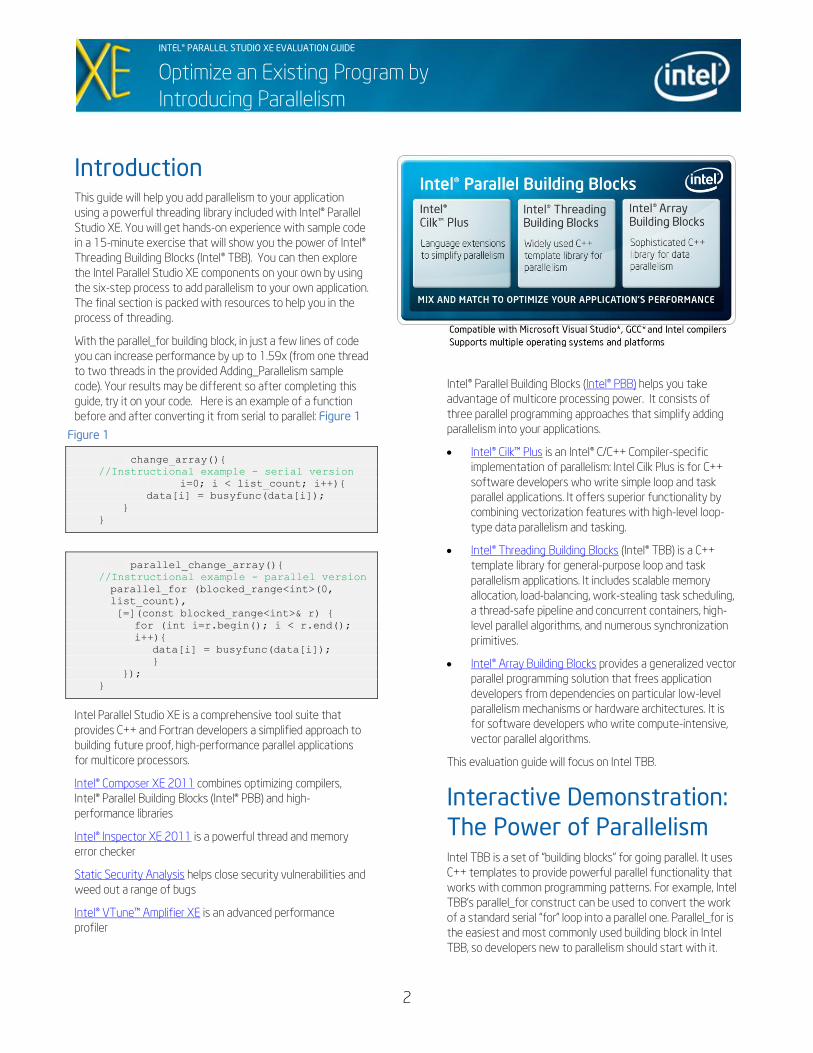
Introduction This guide will help you add parallelism to your application
using a powerful threading library included with Intel® Parallel
Studio XE. You will get hands-on experience with sample code
in a 15-minute exercise that will show you the power of Intel®
Threading Building Blocks (Intel® TBB). You can then explore
the Intel Parallel Studio XE components on your own by using
the six-step process to add parallelism to your own application.
The final section is packed with resources to help you in the
process of threading.
With the parallel_for building block, in just a few lines of code
you can increase performance by up to 1.59x (from one thread
to two threads in the provided Adding_Parallelism sample
code). Your results may be different so after completing this
guide, try it on your code. Here is an example of a function
before and after converting it from serial to parallel: Figure 1
void change_array(){
//Instructional example - serial version
for (int i=0; i < list_count; i++){
data[i] = busyfunc(data[i]);
}
}
void parallel_change_array(){
//Instructional example - parallel version
parallel_for (blocked_range<int>(0,
list_count),
[=](const blocked_range<int>& r) {
for (int i=r.begin(); i < r.end();
i++){
data[i] = busyfunc(data[i]);
}
});
}
Intel Parallel Studio XE is a comprehensive tool suite that
provides C++ and Fortran developers a simplified approach to
building future proof, high-performance parallel applications
for multicore processors.
Intel® Composer XE 2011 combines optimizing compilers,
Intel® Parallel Building Blocks (Intel® PBB) and high-
performance libraries
Intel® Inspector XE 2011 is a powerful thread and memory
error checker
Static Security Analysis helps close security vulnerabilities and
weed out a range of bugs
Intel® VTune™ Amplifier XE is an advanced performance
profiler
Figure 1
Intel® Parallel Building Blocks (Intel® PBB) helps you take
advantage of multicore processing power. It consists of
three parallel programming approaches that simplify adding
parallelism into your applications.
Intel® Cilk™ Plus is an Intel® C/C++ Compiler-specific
implementation of parallelism: Intel Cilk Plus is for C++
software developers who write simple loop and task
parallel applications. It offers superior functionality by
combining vectorization features with high-level loop-
type data parallelism and tasking.
Intel® Threading Building Blocks (Intel® TBB) is a C++
template library for general-purpose loop and task
parallelism applications. It includes scalable memory
allocation, load-balancing, work-stealing task scheduling,
a thread-safe pipeline and concurrent containers, high-
level parallel algorithms, and numerous synchronization
primitives.
Intel® Array Building Blocks provides a generalized vector
parallel programming solution that frees application
developers from dependencies on particular low-level
parallelism mechanisms or hardware architectures. It is
for software developers who write compute-intensive,
vector parallel algorithms.
This evaluation guide will focus on Intel TBB.
Interactive Demonstration:
The Power of Parallelism Intel TBB is a set of ―building blocks‖ for going parallel. It uses
C++ templates to provide powerful parallel functionality that
works with common programming patterns. For example, Intel
TBB’s parallel_for construct can be used to convert the work
of a standard serial ―for‖ loop into a parallel one. Parallel_for is
the easiest and most commonly used building block in Intel
TBB, so developers new to parallelism should start with it.
3
INTEL® PARALLEL STUDIO XE EVALUATION GUIDE
Optimize an Existing Program by
Introducing Parallelism
Why Intel® Threading Building Blocks—
Portable, Reliable, Scalable, Simple
> Portability—Thread API works across 32-bit and 64-bit
Windows*, Linux*, and Mac OS* X platforms and open-
source versions of FreeBSD*, IA Solaris*, QNX, and
Xbox* 360
> Open Design—Compiler, operating system, and processor
independent
> Forward Scaling—Automatically scales to more cores as
they become available without changing code or
recompiling
> Comprehensive Solution—Includes primitives and
threads, scalable memory allocation and tasking, parallel
algorithms, and concurrent containers
> Licensing Options—Commercial and open-source
versions are available. See below for links.
> Packaging—Available with Intel Parallel Studio, Intel®
Parallel Studio XE, single package, and in open source
For more information, please visit: the commercial or the
open source sites.
Try It Yourself Here is a simple example using Intel TBB parallel_for. You can
read it here or try it yourself using the steps below and the
Adding_Parallelism sample code.
Step 1. Install and Set Up Intel® Parallel Studio XE
Estimated completion time: 15-30 minutes
1 Download an evaluation copy of Intel Parallel Studio XE.
2. Install Intel Parallel Studio XE by clicking on the
parallel_studio_xe_2011_setup.exe (can take 15 to 30
minutes depending on your system).
Step 2. Install and View the Adding_Parallelism
Sample Application
Install the sample application:
1. Download the Adding_Parallelism_Exercise.zip sample file
to your local machine. This is a C++ console application
created with Microsoft* Visual Studio* 2005.
2. Extract the files from the Adding_Parallelism_Exercise.zip
file to a writable directory or share on your system, such
as My Documents\Visual Studio 20xx\Intel\samples
folder.
View the sample:
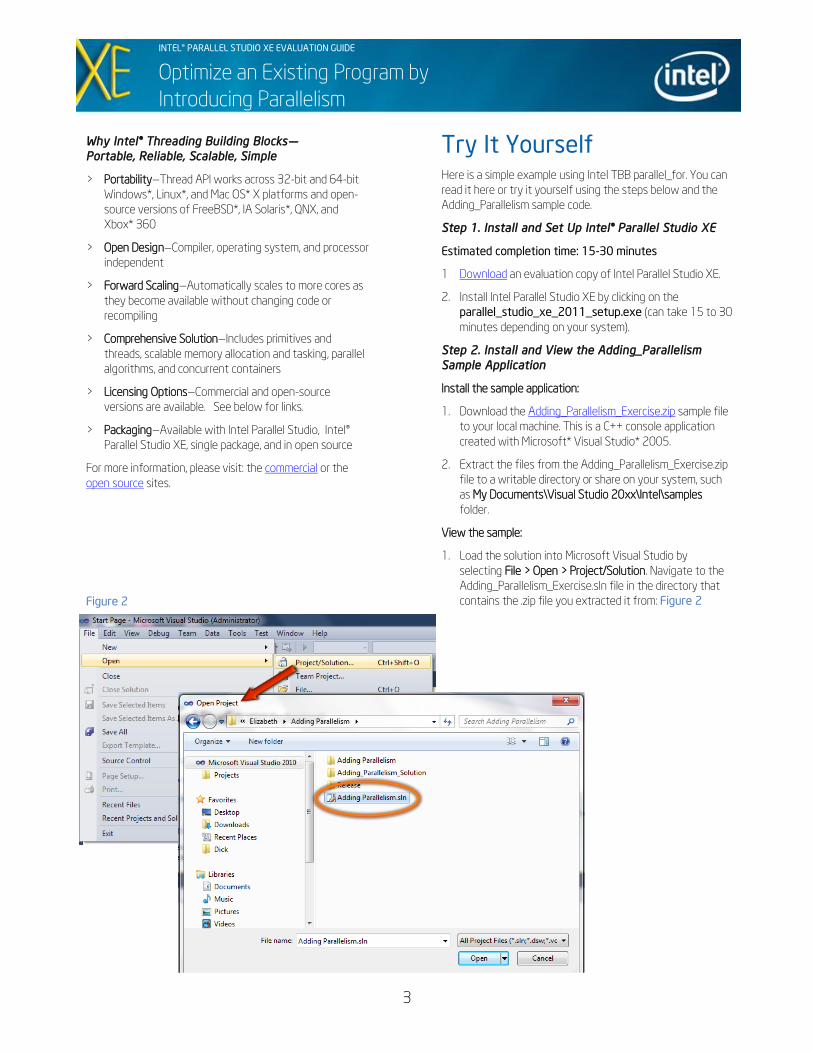
1. Load the solution into Microsoft Visual Studio by
selecting File > Open > Project/Solution. Navigate to the
Adding_Parallelism_Exercise.sln file in the directory that
contains the .zip file you extracted it from: Figure 2
Figure 2
4
INTEL® PARALLEL STUDIO XE EVALUATION GUIDE
Optimize an Existing Program by
Introducing Parallelism
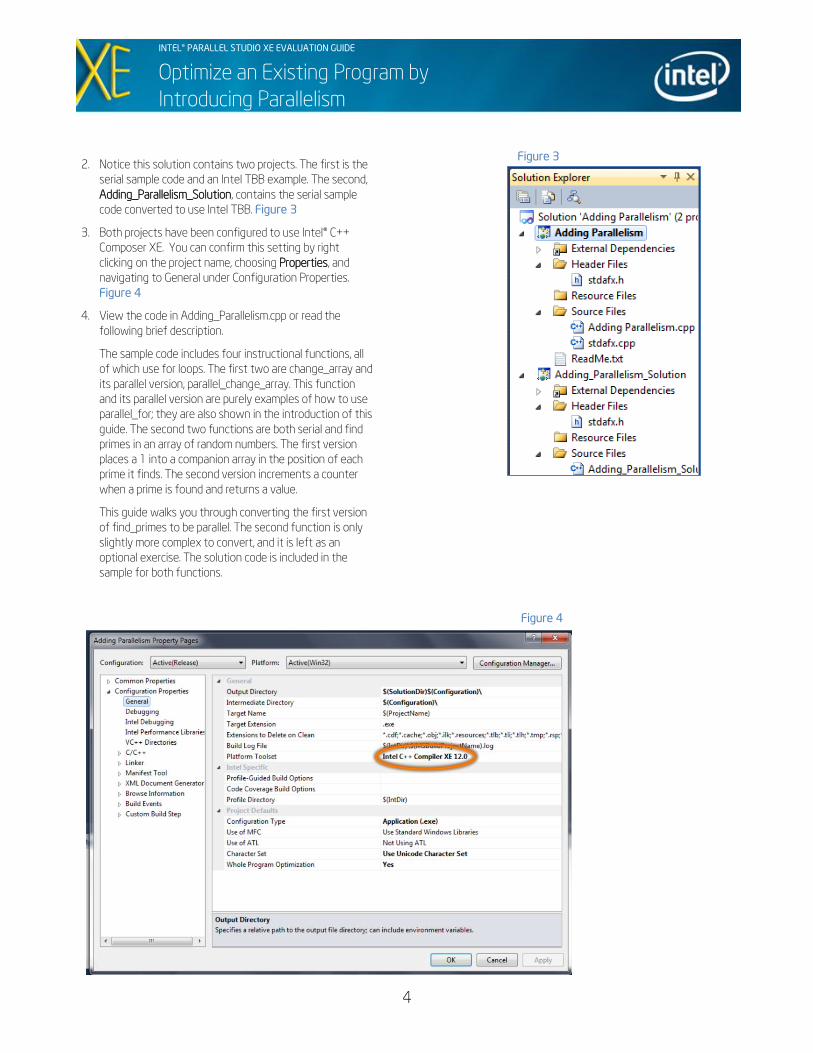
2. Notice this solution contains two projects. The first is the
serial sample code and an Intel TBB example. The second,
Adding_Parallelism_Solution, contains the serial sample
code converted to use Intel TBB. Figure 3
3. Both projects have been configured to use Intel® C++
Composer XE. You can confirm this setting by right
clicking on the project name, choosing Properties, and
navigating to General under Configuration Properties.
Figure 4
4. View the code in Adding_Parallelism.cpp or read the
following brief description.
The sample code includes four instructional functions, all
of which use for loops. The first two are change_array and
its parallel version, parallel_change_array. This function
and its parallel version are purely examples of how to use
parallel_for; they are also shown in the introduction of this
guide. The second two functions are both serial and find
primes in an array of random numbers. The first version
places a 1 into a companion array in the position of each
prime it finds. The second version increments a counter
when a prime is found and returns a value.
This guide walks you through converting the first version
of find_primes to be parallel. The second function is only
slightly more complex to convert, and it is left as an
optional exercise. The solution code is included in the
sample for both functions.
Figure 3
Figure 4
5
INTEL® PARALLEL STUDIO XE EVALUATION GUIDE
Optimize an Existing Program by
Introducing Parallelism
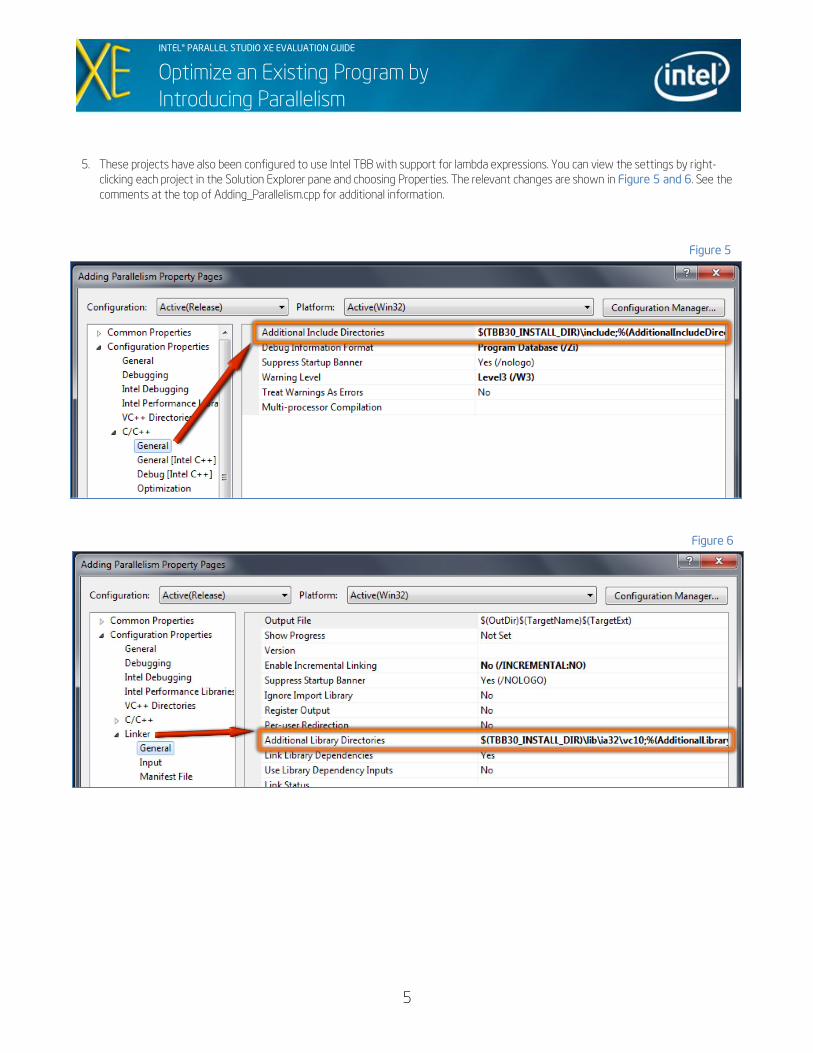
5. These projects have also been configured to use Intel TBB with support for lambda expressions. You can view the settings by right-
clicking each project in the Solution Explorer pane and choosing Properties. The relevant changes are shown in Figure 5 and 6. See the
comments at the top of Adding_Parallelism.cpp for additional information.
Figure 5
Figure 6
6
INTEL® PARALLEL STUDIO XE EVALUATION GUIDE
Optimize an Existing Program by
Introducing Parallelism
Step 3. Convert the find_primes Function Using Intel TBB
parallel_for
1. Notice that the proper includes have been added to the code
already. To use Intel TBB parallel_for, you must include
―tbb/parallel_for.h‖ and ―tbb/blocked_range.h.‖
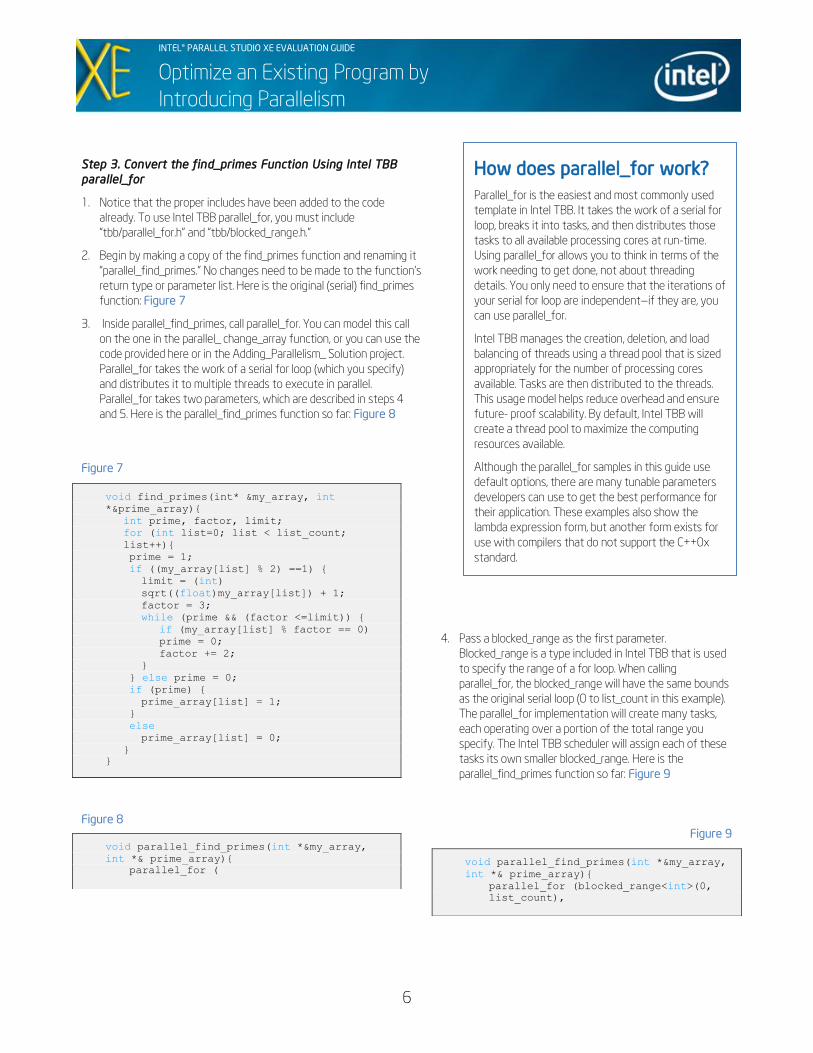
2. Begin by making a copy of the find_primes function and renaming it
―parallel_find_primes.‖ No changes need to be made to the function’s
return type or parameter list. Here is the original (serial) find_primes
function: Figure 7
3. Inside parallel_find_primes, call parallel_for. You can model this call
on the one in the parallel_ change_array function, or you can use the
code provided here or in the Adding_Parallelism_ Solution project.
Parallel_for takes the work of a serial for loop (which you specify)
and distributes it to multiple threads to execute in parallel.
Parallel_for takes two parameters, which are described in steps 4
and 5. Here is the parallel_find_primes function so far: Figure 8
Figure 7
void find_primes(int* &my_array, int
*&prime_array){
int prime, factor, limit;
for (int list=0; list < list_count;
list++){
prime = 1;
if ((my_array[list] % 2) ==1) {
limit = (int)
sqrt((float)my_array[list]) + 1;
factor = 3;
while (prime && (factor <=limit)) {
if (my_array[list] % factor == 0)
prime = 0;
factor += 2;
}
} else prime = 0;
if (prime) {
prime_array[list] = 1;
}
else
prime_array[list] = 0;
}
}
void parallel_find_primes(int *&my_array,
int *& prime_array){
parallel_for (
Figure 8
4. Pass a blocked_range as the first parameter.
Blocked_range is a type included in Intel TBB that is used
to specify the range of a for loop. When calling
parallel_for, the blocked_range will have the same bounds
as the original serial loop (0 to list_count in this example).
The parallel_for implementation will create many tasks,
each operating over a portion of the total range you
specify. The Intel TBB scheduler will assign each of these
tasks its own smaller blocked_range. Here is the
parallel_find_primes function so far: Figure 9
void parallel_find_primes(int *&my_array,
int *& prime_array){
parallel_for (blocked_range<int>(0,
list_count),
Figure 9
How does parallel_for work?
Parallel_for is the easiest and most commonly used
template in Intel TBB. It takes the work of a serial for
loop, breaks it into tasks, and then distributes those
tasks to all available processing cores at run-time.
Using parallel_for allows you to think in terms of the
work needing to get done, not about threading
details. You only need to ensure that the iterations of
your serial for loop are independent—if they are, you
can use parallel_for.
Intel TBB manages the creation, deletion, and load
balancing of threads using a thread pool that is sized
appropriately for the number of processing cores
available. Tasks are then distributed to the threads.
This usage model helps reduce overhead and ensure
future- proof scalability. By default, Intel TBB will
create a thread pool to maximize the computing
resources available.
Although the parallel_for samples in this guide use
default options, there are many tunable parameters
developers can use to get the best performance for
their application. These examples also show the
lambda expression form, but another form exists for
use with compilers that do not support the C++0x
standard.
7
INTEL® PARALLEL STUDIO XE EVALUATION GUIDE
Optimize an Existing Program by
Introducing Parallelism
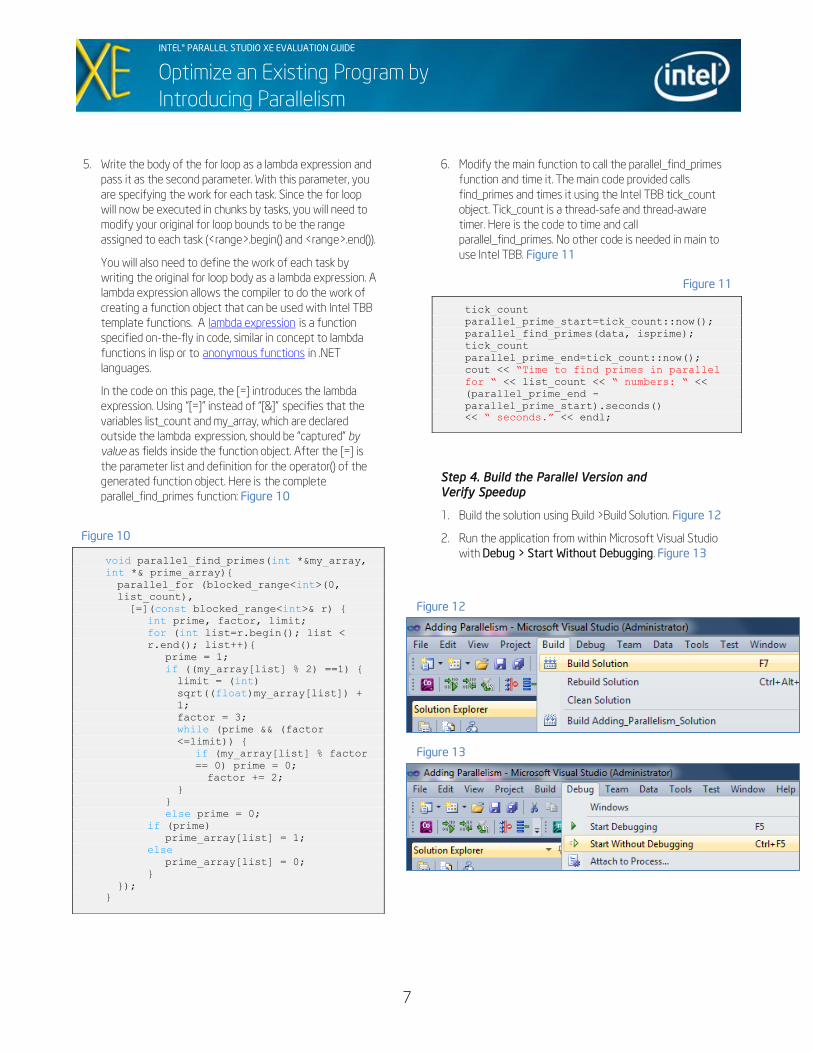
5. Write the body of the for loop as a lambda expression and
pass it as the second parameter. With this parameter, you
are specifying the work for each task. Since the for loop
will now be executed in chunks by tasks, you will need to
modify your original for loop bounds to be the range
assigned to each task (<range>.begin() and <range>.end()).
You will also need to define the work of each task by
writing the original for loop body as a lambda expression. A
lambda expression allows the compiler to do the work of
creating a function object that can be used with Intel TBB
template functions. A lambda expression is a function
specified on-the-fly in code, similar in concept to lambda
functions in lisp or to anonymous functions in .NET
languages.
In the code on this page, the [=] introduces the lambda
expression. Using ―[=]‖ instead of ―[&]‖ specifies that the
variables list_count and my_array, which are declared
outside the lambda expression, should be ―captured‖ by
value as fields inside the function object. After the [=] is
the parameter list and definition for the operator() of the
generated function object. Here is the complete
parallel_find_primes function: Figure 10
void parallel_find_primes(int *&my_array,
int *& prime_array){
parallel_for (blocked_range<int>(0,
list_count),
[=](const blocked_range<int>& r) {
int prime, factor, limit;
for (int list=r.begin(); list <
r.end(); list++){
prime = 1;
if ((my_array[list] % 2) ==1) {
limit = (int)
sqrt((float)my_array[list]) +
1;
factor = 3;
while (prime && (factor
<=limit)) {
if (my_array[list] % factor
== 0) prime = 0;
factor += 2;
}
}
else prime = 0;
if (prime)
prime_array[list] = 1;
else
prime_array[list] = 0;
}
});
}
Figure 10
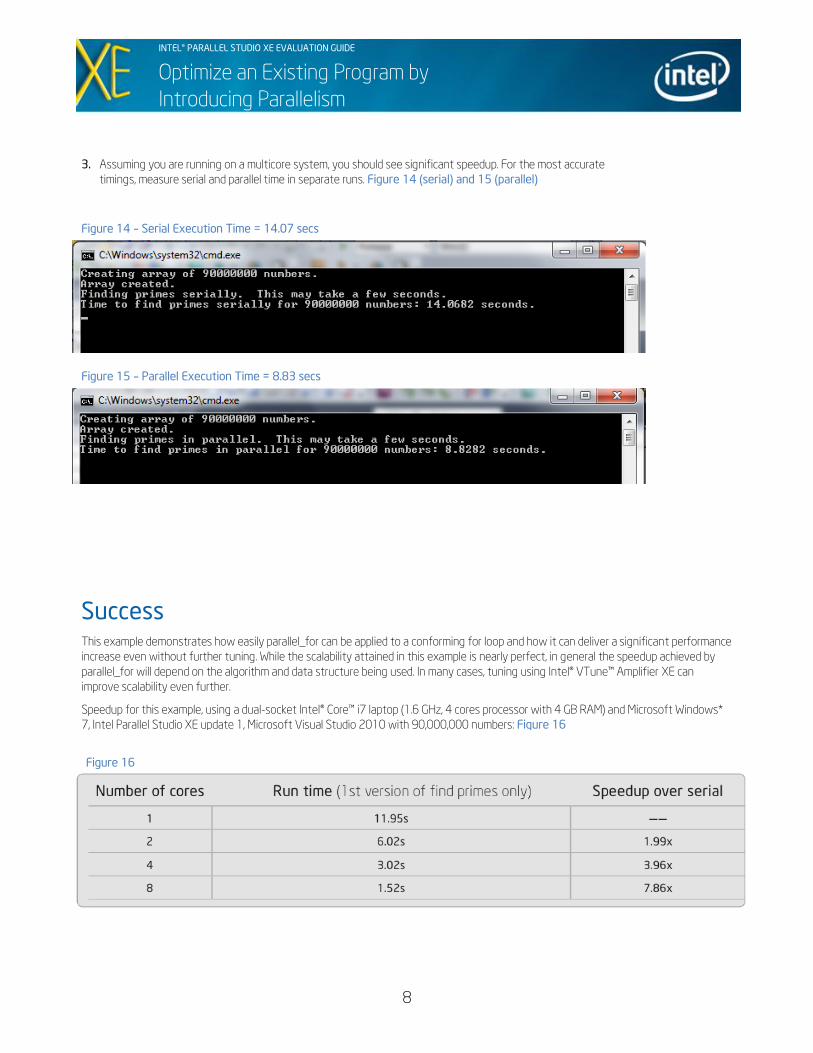
6. Modify the main function to call the parallel_find_primes
function and time it. The main code provided calls
find_primes and times it using the Intel TBB tick_count
object. Tick_count is a thread-safe and thread-aware
timer. Here is the code to time and call
parallel_find_primes. No other code is needed in main to
use Intel TBB. Figure 11
tick_count
parallel_prime_start=tick_count::now();
parallel_find_primes(data, isprime);
tick_count
parallel_prime_end=tick_count::now();
cout << “Time to find primes in parallel
for “ << list_count << “ numbers: “ <<
(parallel_prime_end -
parallel_prime_start).seconds()
<< “ seconds.” << endl;
Figure 11
Step 4. Build the Parallel Version and
Verify Speedup
1. Build the solution using Build >Build Solution. Figure 12
2. Run the application from within Microsoft Visual Studio
with Debug > Start Without Debugging. Figure 13
Figure 12
Figure 13
8
INTEL® PARALLEL STUDIO XE EVALUATION GUIDE
Optimize an Existing Program by
Introducing Parallelism
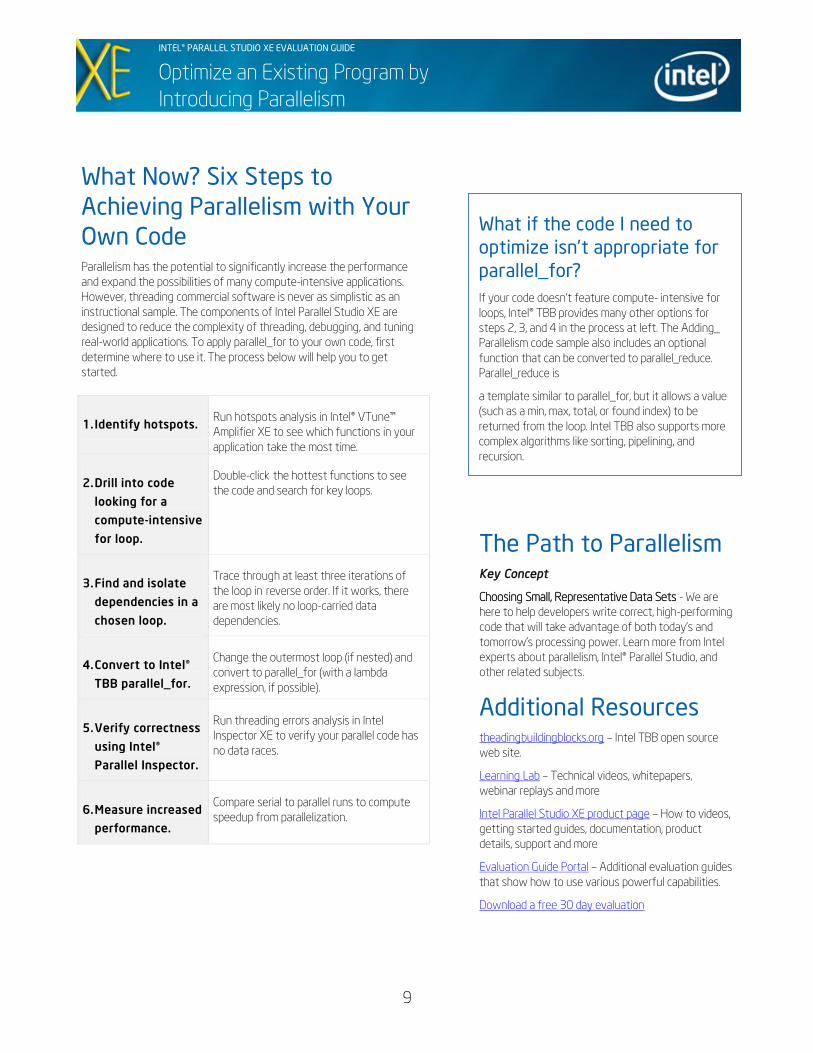
3. Assuming you are running on a multicore system, you should see significant speedup. For the most accurate
timings, measure serial and parallel time in separate runs. Figure 14 (serial) and 15 (parallel)
Success This example demonstrates how easily parallel_for can be applied to a conforming for loop and how it can deliver a significant performance
increase even without further tuning. While the scalability attained in this example is nearly perfect, in general the speedup achieved by
parallel_for will depend on the algorithm and data structure being used. In many cases, tuning using Intel® VTune™ Amplifier XE can
improve scalability even further.
Speedup for this example, using a dual-socket Intel® Core™ i7 laptop (1.6 GHz, 4 cores processor with 4 GB RAM) and Microsoft Windows*
7, Intel Parallel Studio XE update 1, Microsoft Visual Studio 2010 with 90,000,000 numbers: Figure 16
Figure 16
Figure 15 – Parallel Execution Time = 8.83 secs
Figure 14 – Serial Execution Time = 14.07 secs
9
INTEL® PARALLEL STUDIO XE EVALUATION GUIDE
Optimize an Existing Program by
Introducing Parallelism
What Now? Six Steps to
Achieving Parallelism with Your
Own Code Parallelism has the potential to significantly increase the performance
and expand the possibilities of many compute-intensive applications.
However, threading commercial software is never as simplistic as an
instructional sample. The components of Intel Parallel Studio XE are
designed to reduce the complexity of threading, debugging, and tuning
real-world applications. To apply parallel_for to your own code, first
determine where to use it. The process below will help you to get
started.
1. Identify hotspots. Run hotspots analysis in Intel® VTune™
Amplifier XE to see which functions in your
application take the most time.
2. Drill into code
looking for a
compute-intensive
for loop.
Double-click the hottest functions to see
the code and search for key loops.
3. Find and isolate
dependencies in a
chosen loop.
Trace through at least three iterations of
the loop in reverse order. If it works, there
are most likely no loop-carried data
dependencies.
4. Convert to Intel®
TBB parallel_for.
Change the outermost loop (if nested) and
convert to parallel_for (with a lambda
expression, if possible).
5. Verify correctness
using Intel®
Parallel Inspector.
Run threading errors analysis in Intel
Inspector XE to verify your parallel code has
no data races.
6. Measure increased
performance.
Compare serial to parallel runs to compute
speedup from parallelization.
What if the code I need to
optimize isn’t appropriate for
parallel_for?
If your code doesn’t feature compute- intensive for
loops, Intel® TBB provides many other options for
steps 2, 3, and 4 in the process at left. The Adding_
Parallelism code sample also includes an optional
function that can be converted to parallel_reduce.
Parallel_reduce is
a template similar to parallel_for, but it allows a value
(such as a min, max, total, or found index) to be
returned from the loop. Intel TBB also supports more
complex algorithms like sorting, pipelining, and
recursion.
The Path to Parallelism Key Concept
Choosing Small, Representative Data Sets - We are
here to help developers write correct, high-performing
code that will take advantage of both today’s and
tomorrow’s processing power. Learn more from Intel
experts about parallelism, Intel® Parallel Studio, and
other related subjects.
Additional Resources theadingbuildingblocks.org – Intel TBB open source
web site.
Learning Lab – Technical videos, whitepapers,
webinar replays and more
Intel Parallel Studio XE product page – How to videos,
getting started guides, documentation, product
details, support and more
Evaluation Guide Portal – Additional evaluation guides
that show how to use various powerful capabilities.
Download a free 30 day evaluation
10
INTEL® PARALLEL STUDIO XE EVALUATION GUIDE
Optimize an Existing Program by
Introducing Parallelism
© 2011, Intel Corporation. All rights reserved. Intel and the Intel logo are trademarks of Intel Corporation in the U.S. and other countries.
*Other names and brands may be claimed as the property of others.
Optimization Notice
Intel compilers, associated libraries and associated development tools may include or utilize options that optimize for instruction sets that
are available in both Intel and non-Intel microprocessors (for example SIMD instruction sets), but do not optimize equally for non-Intel
microprocessors. In addition, certain compiler options for Intel compilers, including some that are not specific to Intel micro-architecture,
are reserved for Intel microprocessors. For a detailed description of Intel compiler options, including the instruction sets and specific
microprocessors they implicate, please refer to the ―Intel Compiler User and Reference Guides‖ under ―Compiler Options." Many library
routines that are part of Intel compiler products are more highly optimized for Intel microprocessors than for other microprocessors. While
the compilers and libraries in Intel compiler products offer optimizations for both Intel and Intel-compatible microprocessors, depending on
the options you select, your code and other factors, you likely will get extra performance on Intel microprocessors.
Intel compilers, associated libraries and associated development tools may or may not optimize to the same degree for non-Intel
microprocessors for optimizations that are not unique to Intel microprocessors. These optimizations include Intel® Streaming SIMD
Extensions 2 (Intel® SSE2), Intel® Streaming SIMD Extensions 3 (Intel® SSE3), and Supplemental Streaming SIMD Extensions 3 (Intel
SSSE3) instruction sets and other optimizations. Intel does not guarantee the availability, functionality, or effectiveness of any
optimization on microprocessors not manufactured by Intel. Microprocessor-dependent optimizations in this product are intended for use
with Intel microprocessors.
While Intel believes our compilers and libraries are excellent choices to assist in obtaining the best performance on Intel and non-Intel
microprocessors, Intel recommends that you evaluate other compilers and libraries to determine which best meet your requirements. We
hope to win your business by striving to offer the best performance of any compiler or library; please let us know if you find we do not.
Notice revision #20110307