Optimising Building Design for Sustainability Using High Performance Concrete Doug Jenkins -...
21
Optimising Building Design Optimising Building Design for Sustainability Using for Sustainability Using High Performance Concrete High Performance Concrete Doug Jenkins - Interactive Design Services Daksh Baweja – The University of Technology, Sydney. Joanne Portella– DMC Advisory, Melbourne.
-
Upload
asa-smiles -
Category
Documents
-
view
220 -
download
0
Transcript of Optimising Building Design for Sustainability Using High Performance Concrete Doug Jenkins -...

Optimising Building Design for Optimising Building Design for Sustainability Using High Sustainability Using High Performance ConcretePerformance Concrete
Doug Jenkins - Interactive Design ServicesDaksh Baweja – The University of Technology, Sydney.Joanne Portella– DMC Advisory, Melbourne.

Introduction Introduction Focus of emissions reduction strategies in Australia has been on
cement reduction.– Can significant emissions reductions be made with the use of
high strength concrete? Outline of study:
– Effect of high strength concrete and high supplementary cementitious material (SCM) content on total CO2 emissions.
– Typical flat slab building structure– 5 grades of concrete– Reinforced or post-tensioned slab
Alternative Concrete MixesAlternative Concrete MixesTable 2: Mix Design Details
Concrete Mix Constituent/ Performance Parameter
Mix A: 25MPa
Reference case mix
(OPC only)
Mix B: Typical
25MPa mix containing
SCM's
Mix C: 40MPa
prestressed mix
Mix D: 65MPa
HSC mix
Mix E: 40MPa mix with high
SCM content
Total Binder Content 290 310 395 500 420GP Cement Content 290 250 335 350 255Flyash 0 30 60 70 80GGBFS 0 30 0 80 85Coarse Aggregate 980 990 1000 1035 1000Sand 945 900 830 690 785Water 185 185 180 180 180Total Binder Content 290 330 435 530 420Water:Binder Ratio 0.64 0.60 0.46 0.36 0.43Approx Volume Check (m3) - require 1.00 1.001 1.000 1.000 1.001 1.000Typical 28 day Compressive strength (fcm)
28 28 50 75 45
Transfer Strength - - 25 30 25Nominal Drying Shrinkage 750 750 650 550 600
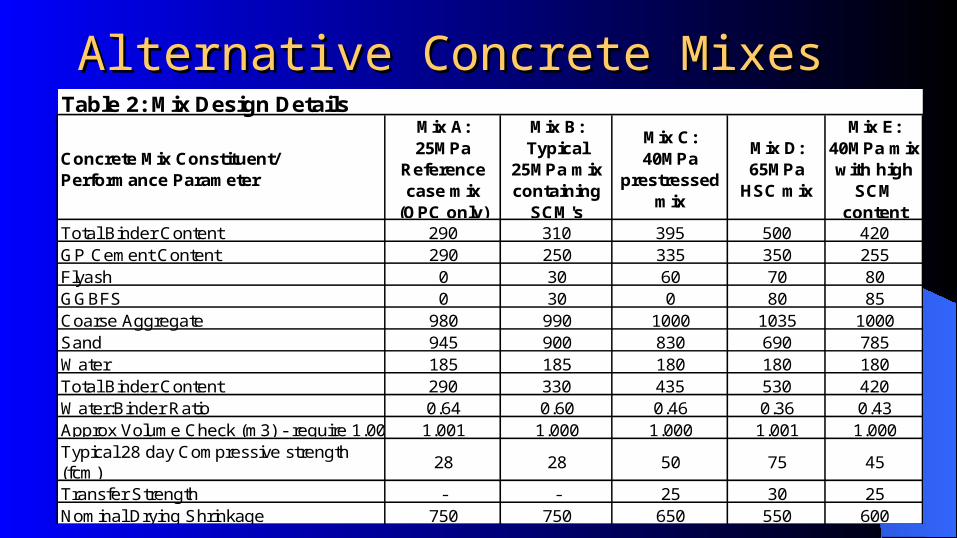
Component Emissions Component Emissions GP Cement 0.820 t CO2-e/tonne
Fly Ash 0.027 t CO2-e/tonne
GGBFS 0.143 t CO2-e/tonne
Ground Limestone 0.027 t CO2-e/tonne
Mineral Additions - Fly ash and/or Slag and/or Ground Limestone
0.085 t CO2-e/tonne
Minor Additional Constituent - Cement Kiln Dust0.027 t CO2-e/tonne
Basalt Coarse Aggregates 0.036 t CO2-e/tonne
Fine Aggregates 0.014 t CO2-e/tonne
Concrete Batching 0.003 t CO2-e/m3
Concrete Transport 0.009 t CO2-e/m3

Embodied Energy CalculationEmbodied Energy CalculationConstituent Emissions tC02-e/m3
Mix A: 25MPa
Reference
Mix B: Typical 25MPa with
SCM's
Mix C: 40MPa
prestressed
Mix D: 65MPa
HSC mix
Mix E: 40MPa mix with high SCM content
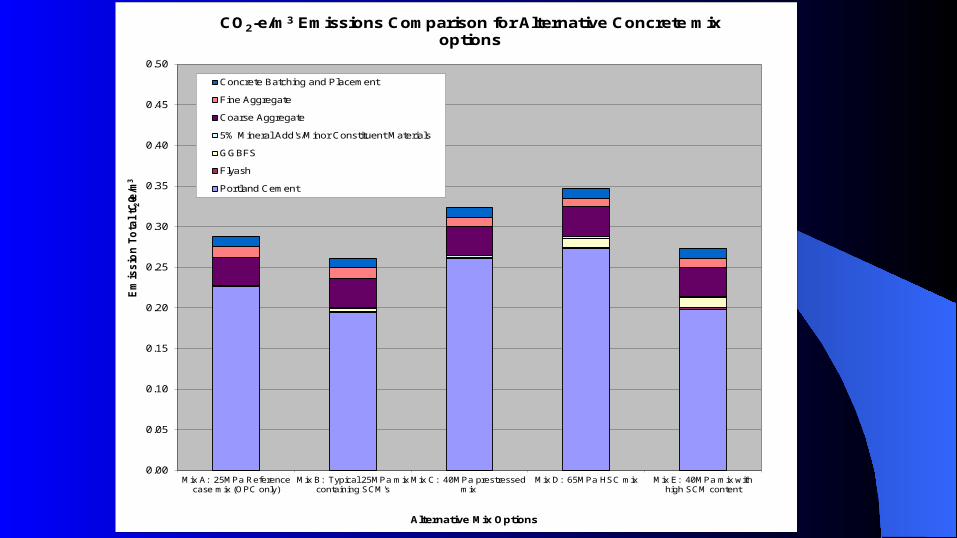
Portland Cement 0.2259 0.1948 0.2610 0.2727 0.1986Flyash 0.0000 0.0008 0.0016 0.0019 0.0022GGBFS 0.0000 0.0043 0.0000 0.0114 0.01225% Mineral Add's/Minor Constituent Materials0.0012 0.0011 0.0014 0.0015 0.0011Coarse Aggregate 0.0353 0.0356 0.0360 0.0373 0.0360Fine Aggregate 0.0132 0.0126 0.0116 0.0097 0.0110Concrete Batching and Placement 0.0120 0.0120 0.0120 0.0120 0.0120
Totals tCO2-e/m3 0.288 0.261 0.324 0.346 0.273
% due to Portland Cement 79% 75% 81% 79% 73%
% Reduction in CO2 Emissions compared with 25MPa Reference Case
9% -13% -20% 5%
% Portland Cement Reduction compared with 25MPa Reference Case
14% -16% -21% 12%

Concrete Emissions AnalysisConcrete Emissions Analysis
• Emissions based on emissions of component materials multiplied by material content
• Cement emissions allow for 5% mineral additions• Total mix emissions mainly controlled by cement
content• Based solely on emissions per cubic metre of concrete,
the 25 MPa standard structural mix, and the 40 MPa high SCM mix appear to offer the minimum CO2-e emissions.
0.00
0.05
0.10
0.15
0.20
0.25
0.30
0.35
0.40
0.45
0.50
Mix A: 25MPa Referencecase mix (OPC only)
Mix B: Typical 25MPa mixcontaining SCM's
Mix C: 40MPa prestressedmix
Mix D: 65MPa HSC mix Mix E: 40MPa mix withhigh SCM content
Em
iss
ion
To
tal
tCO
2-e
/m3
Alternative Mix Options
CO2-e/m3 Emissions Comparison for Alternative Concrete mix options
Concrete Batching and Placement
Fine Aggregate
Coarse Aggregate
5% Mineral Add's/Minor Constituent Materials
GGBFS
Flyash
Portland Cement

Flat Slab LayoutFlat Slab Layout

Structural Design ProcedureStructural Design Procedure
• Design to AS 3600 simplified method.• Checked to equivalent frame method (Warner et al)• Prestress force balanced approx. 85% of dead load• Deflections checked with non-linear finite element
analysis
Slab SectionsSlab Sections
• Reinforced slab depth controlled by deflections:• 25 MPa – 300 mm• 40 and 65 MPa – 250 mm
• Prestressed slab depth controlled by punching shear• 40 MPa – 180 mm• 65 MPa – 170 mm
Deflection AnalysisDeflection Analysis
• Non-linear finite element analysis; 4 node plate-shell elements
• Stress-strain curve formulated to give correct moment-curvature behaviour, allowing for:• Cracking of the concrete• Tension stiffening and loss of tension stiffening• Long term creep and shrinkage effects
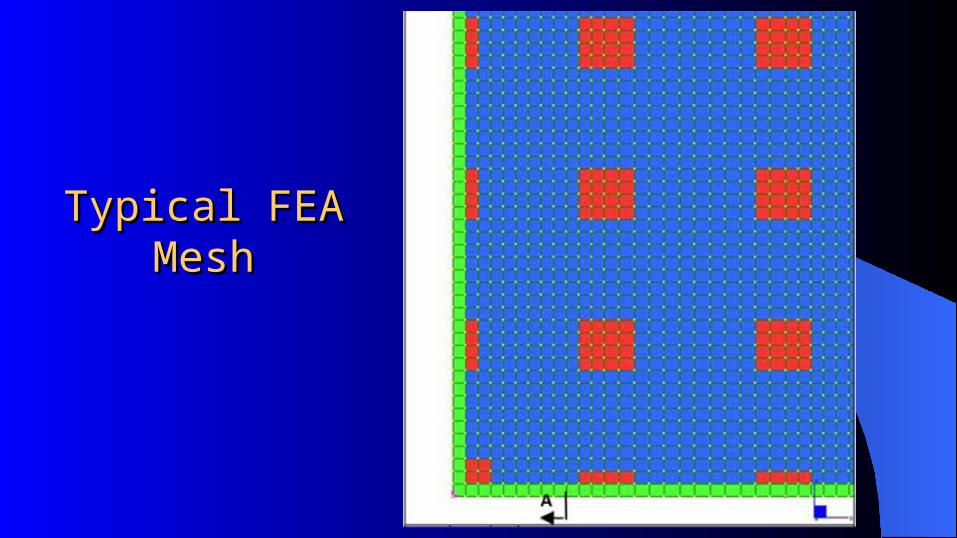
Typical FEA MeshTypical FEA Mesh
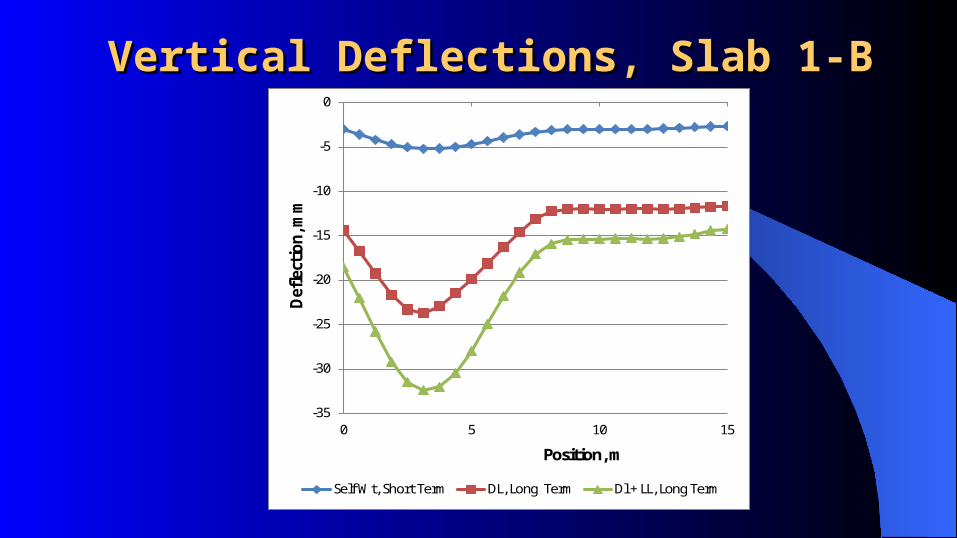
Vertical Deflections, Slab 1-BVertical Deflections, Slab 1-B
-35
-30
-25
-20
-15
-10
-5
0
0 5 10 15
Defl
ecti
on, m
m
Position, m
Self Wt, Short Term DL, Long Term Dl + LL, Long Term

Vertical Deflections, Slab 1-CVertical Deflections, Slab 1-C

Vertical Deflections, Slab 2-CVertical Deflections, Slab 2-C
Deflection ResultsDeflection Results
• Long term deflection of reinforced slabs greatly increased due to flexural cracking, shrinkage and creep effects
• Deflections of prestressed slab greatly reduced, and increase in deflection with time much less because the section remains uncracked.
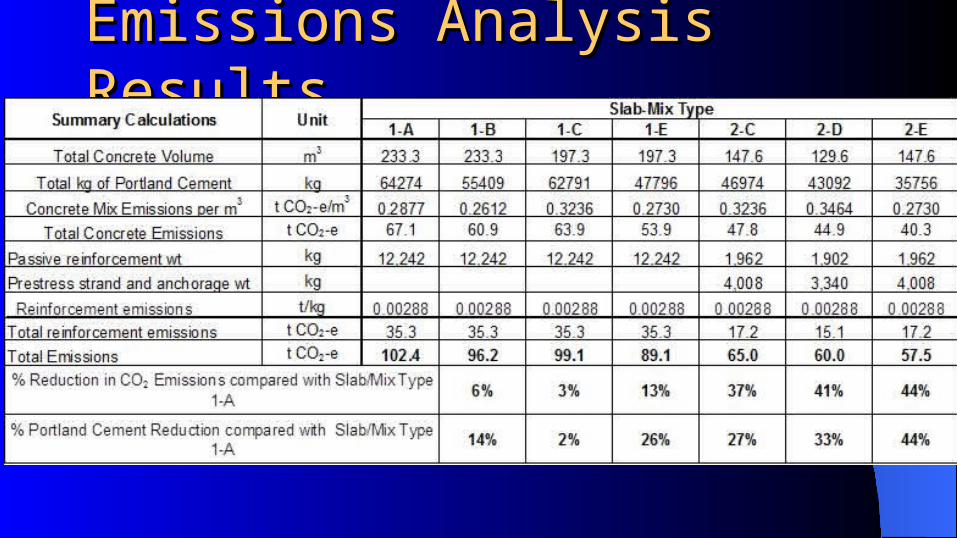
Emissions Analysis ResultsEmissions Analysis Results

Emissions Analysis ResultsEmissions Analysis Results

ConclusionsConclusions The mixes with minimum emissions allowed a small
reduction in CO2 emissions for the reinforced slabs, compared with the standard “reference case” concrete.
All of the prestressed slabs showed a much more significant reduction in total emissions, in spite of the higher cement content of the concrete used.
The high SCM 40 MPa mix gave the lowest overall emissions with a prestressed slab, but the emissions from the 65 MPa mix were only marginally higher.

ConclusionsConclusions Higher strengths allowed the use of a reduced depth
of slab, with associated savings in other works. These savings were not included in this analysis.
The high SCM mixes had a reduced early-age strength which is likely to impact on the construction program.
ConclusionsConclusionsThe overall reduction of CO2 emissions
was not a simple function of the reduction of Portland cement in the concrete, but was also based on how the material properties of the concretes used influenced the structural efficiency of the design.