OPTIMAL REGULATION OF BANK CAPITAL AND LIQUIDITY
29
OPTIMAL REGULATION OF BANK CAPITAL AND LIQUIDITY E Philip Davis NIESR and Brunel University West London [email protected] www.ephilipdavis.com groups.yahoo.com/group/ financial_stability Course on Financial Instability at the Estonian Central Bank, 9-11 December 2009 – Lecture 8
description
OPTIMAL REGULATION OF BANK CAPITAL AND LIQUIDITY. Course on Financial Instability at the Estonian Central Bank, 9-11 December 2009 – Lecture 8. E Philip Davis NIESR and Brunel University West London [email protected] www.ephilipdavis.com groups.yahoo.com/group/financial_stability. - PowerPoint PPT Presentation
Transcript of OPTIMAL REGULATION OF BANK CAPITAL AND LIQUIDITY
OPTIMAL REGULATION OF BANK CAPITAL AND
LIQUIDITY
E Philip DavisNIESR and Brunel University
West [email protected]
www.ephilipdavis.comgroups.yahoo.com/group/financial_stability
Course on Financial Instability at the Estonian Central Bank,9-11 December 2009 – Lecture 8
Abstract• Raising capital adequacy standards and introducing
binding liquidity requirements can have beneficial effects if they reduce the probability of a costly financial crisis, but may also reduce GDP by raising borrowing costs for households and companies.
• We estimate both benefits and costs of raising capital and liquidity, with the benefits being in terms of reduction in the probability of banking crises, while the costs are defined in terms of the economic impact of higher spreads for bank customers.
• Result shows a positive net benefit from substantial regulatory tightening, depending on underlying assumptions.

Structure
1. Introduction
2. Literature survey
3. Could we predict the crisis?
4. Impact of the crisis
5. Modelling the banking sector
6. Costs and benefits of tighter regulation
7. Conclusion

1 Introduction• NIESR research for FSA - background is recent
crisis and discussion of regulatory changes at global level – authors Ray Barrell, E Philip Davis, Tatiana Fic, Dawn Holland, Simon Kirby and Iana Liadze
• Review literature on bank behaviour relative to regulation of capital and liquidity
• Then assess whether a link of capital and liquidity to crisis probabilities can be traced
• Consider long run cost of crises (scarring)• Model behaviour of banks, impact on economy• Consider over what range there are positive net
benefits to regulatory tightening

2 Literature survey
• Much theoretical work abstracts from regulation• Most relevant is on bank capital buffers…• …and UK empirical work showing regulation (trigger
ratios) is main determinant of capital held – and also impacts loan supply
• Overall procyclicality of capital and balance sheet, and impact of introduction of Basel in early 1990s (credit crunch)
• Cross country work showing impact of capitalisation on margins
• Controversy regarding relevance of MM• Developing literature on crisis probabilities
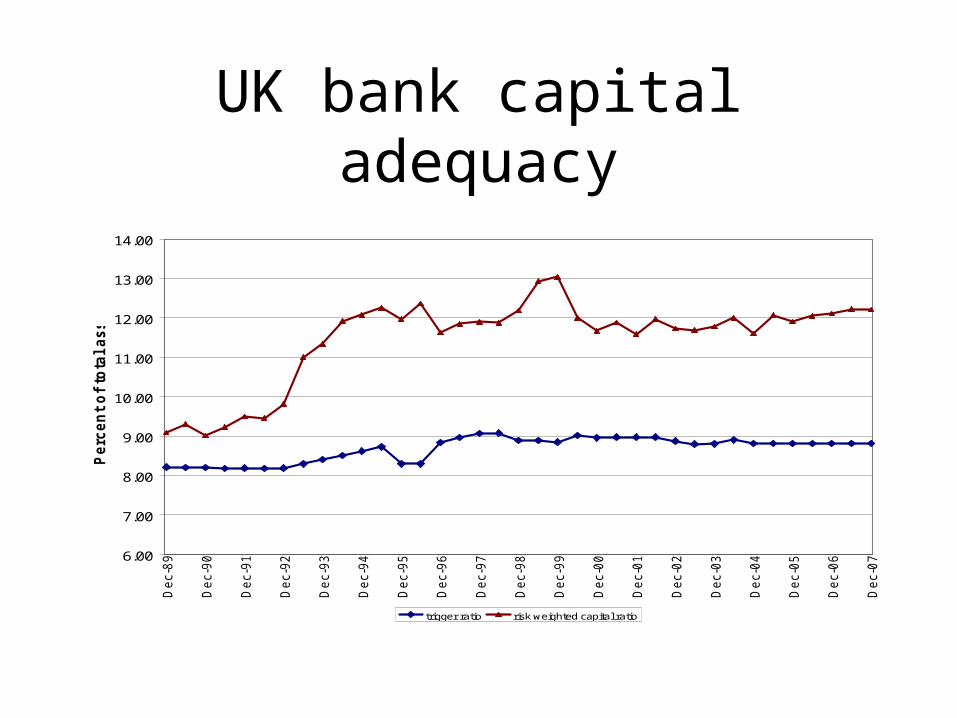
UK bank capital adequacy
6.00
7.00
8.00
9.00
10.00
11.00
12.00
13.00
14.00
De
c-8
9
De
c-9
0
De
c-9
1
De
c-9
2
De
c-9
3
De
c-9
4
De
c-9
5
De
c-9
6
De
c-9
7
De
c-9
8
De
c-9
9
De
c-0
0
De
c-0
1
De
c-0
2
De
c-0
3
De
c-0
4
De
c-0
5
De
c-0
6
De
c-0
7
Perc
en
t o
f to
tal
as
se
ts
trigger ratio risk weighted capital ratio
3 Predicting crises
• Most work on predicting crises, such as Demirguc Kunt and Detragiache (1998) uses logit and estimates across global sample of crises (mainly in emerging market economies)
• Typically crises found to be correlated with macroeconomic, banking sector and institutional indicators:– Low GDP growth, high interest rates, high inflation,
fiscal deficits. – Ratio of broad money to Foreign Exchange reserves,
credit to the private sector/GDP ratio, lagged credit growth
– Low GDP per capita and deposit insurance.
Could they predict the crisis?
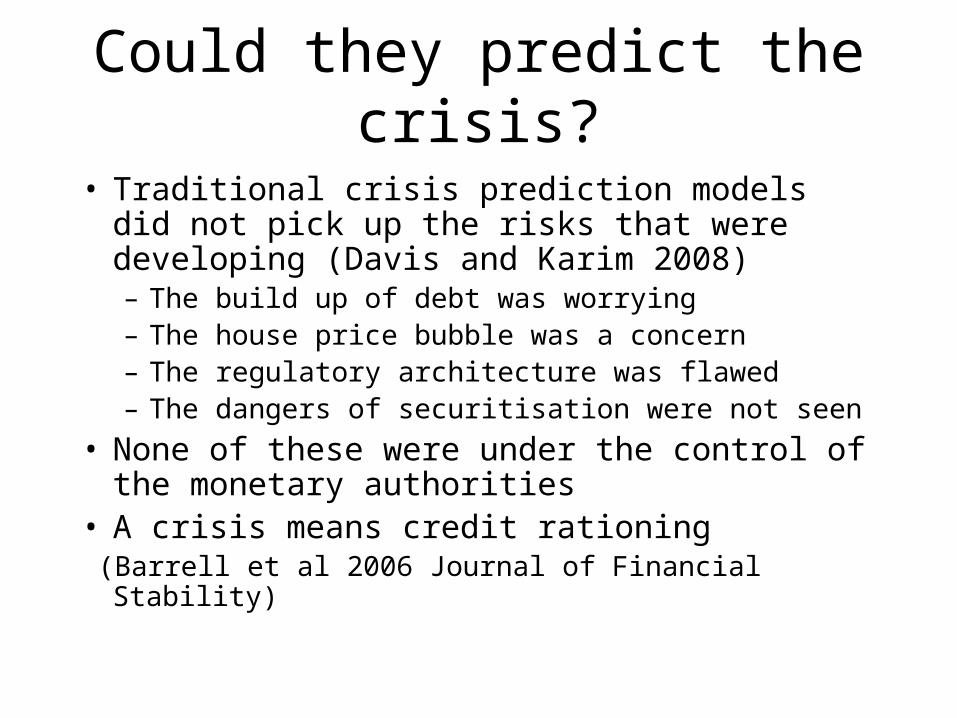
• Traditional crisis prediction models did not pick up the risks that were developing (Davis and Karim 2008)– The build up of debt was worrying– The house price bubble was a concern– The regulatory architecture was flawed– The dangers of securitisation were not seen
• None of these were under the control of the monetary authorities
• A crisis means credit rationing (Barrell et al 2006 Journal of Financial Stability)
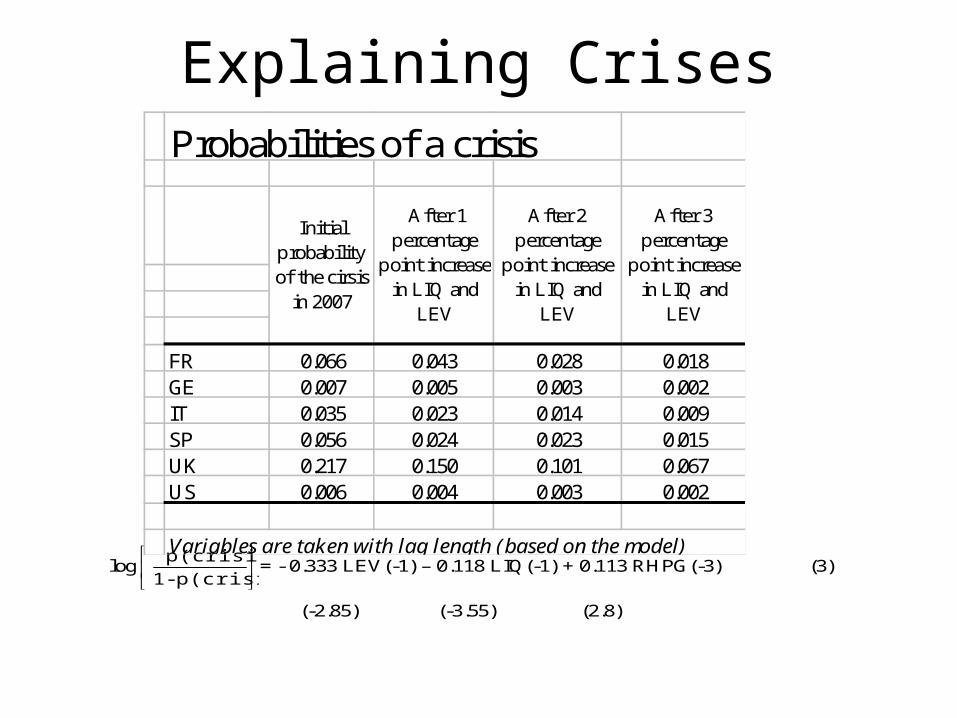
Explaining Crises
log
p(crisis)-1
p(crisis) = - 0.333 LEV(-1) – 0.118 LIQ(-1) + 0.113 RHPG(-3) (3)
(-2.85) (-3.55) (2.8)
Probabilities of a crisis
FR 0.066 0.043 0.028 0.018GE 0.007 0.005 0.003 0.002IT 0.035 0.023 0.014 0.009SP 0.056 0.024 0.023 0.015UK 0.217 0.150 0.101 0.067US 0.006 0.004 0.003 0.002
Variables are taken with lag length (based on the model)
Initial probability of the cirsis
in 2007
After 1 percentage
point increase in LIQ and
LEV
After 2 percentage
point increase in LIQ and
LEV
After 3 percentage
point increase in LIQ and
LEV
Comments on results
• We use unadjusted capital adequacy due to data limitations over 1980-2006 sample
• Changes in capital alone twice as effective as liquidity according to estimate
• Results show substantial reduction in crisis probabilities from regulatory tightening in Europe using OECD logit
• Weaker effect in US, which we consider relates to omission of off balance sheet activity – work under way to rectify this
4 Impact of the crisis
• Seek to assess effect of current crisis on UK economy, as a benchmark for benefits of regulation
• Key background is approach of Hoggarth and Sapporta (2001) who saw costs of crisis as integral of output lost below previous trend
• Highlight that initial recession is only part of costs given the possible long run effect on capital stock (scarring)
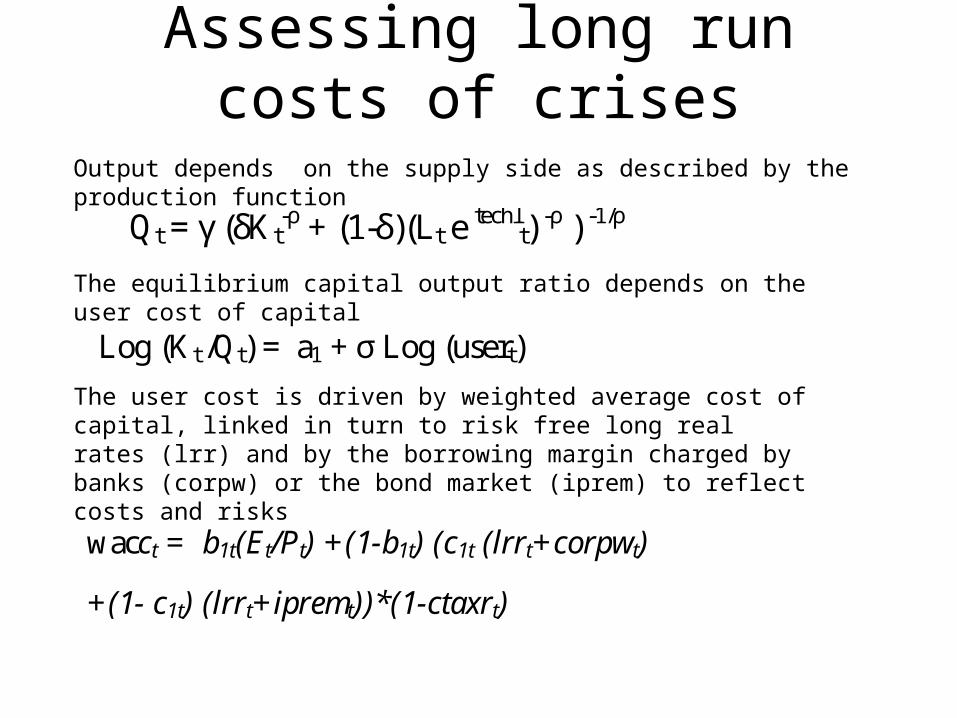
Assessing long run costs of crises
Qt = γ (δKt-ρ + (1-δ)(Lt e techl
t) -ρ ) -1/ρ
Log (Kt /Qt) = a1 + σ Log (usert)
Output depends on the supply side as described by the production function
The equilibrium capital output ratio depends on the user cost of capital
The user cost is driven by weighted average cost of capital, linked in turn to risk free long real rates (lrr) and by the borrowing margin charged by banks (corpw) or the bond market (iprem) to reflect costs and risks
wacct = b1t(Et/Pt) +(1-b1t) (c1t (lrrt+corpwt)
+(1- c1t) (lrrt+ipremt))*(1-ctaxrt)
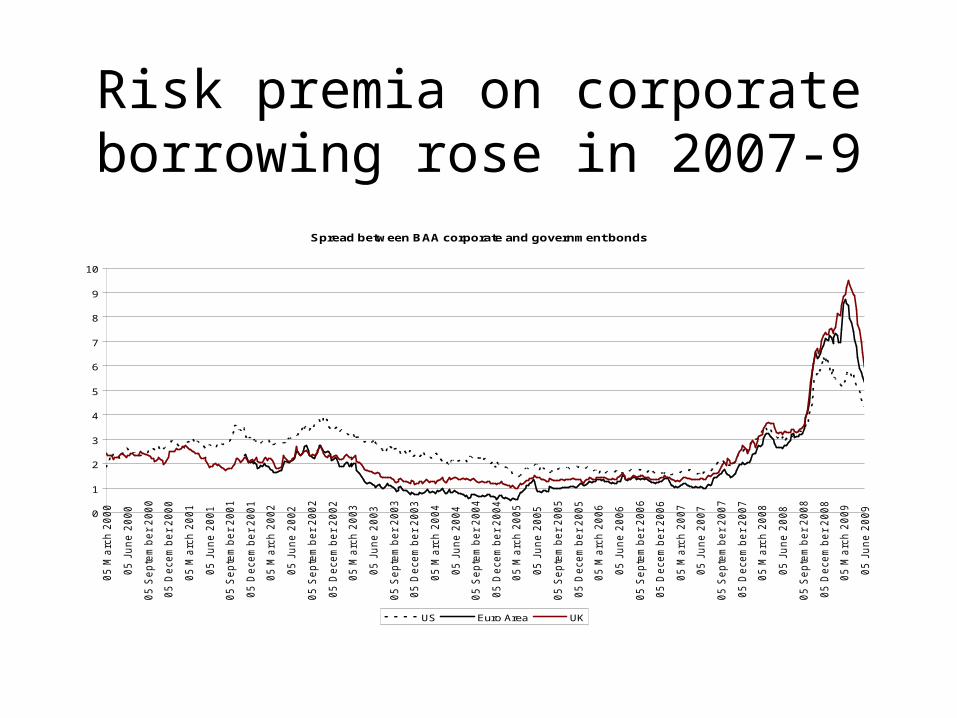
Risk premia on corporate borrowing rose in 2007-9
Spread between BAA corporate and government bonds
0
1
2
3
4
5
6
7
8
9
10
05
Ma
rch
20
00
05
Ju
ne
20
00
05
Se
pte
mb
er
20
00
05
De
ce
mb
er
20
00
05
Ma
rch
20
01
05
Ju
ne
20
01
05
Se
pte
mb
er
20
01
05
De
ce
mb
er
20
01
05
Ma
rch
20
02
05
Ju
ne
20
02
05
Se
pte
mb
er
20
02
05
De
ce
mb
er
20
02
05
Ma
rch
20
03
05
Ju
ne
20
03
05
Se
pte
mb
er
20
03
05
De
ce
mb
er
20
03
05
Ma
rch
20
04
05
Ju
ne
20
04
05
Se
pte
mb
er
20
04
05
De
ce
mb
er
20
04
05
Ma
rch
20
05
05
Ju
ne
20
05
05
Se
pte
mb
er
20
05
05
De
ce
mb
er
20
05
05
Ma
rch
20
06
05
Ju
ne
20
06
05
Se
pte
mb
er
20
06
05
De
ce
mb
er
20
06
05
Ma
rch
20
07
05
Ju
ne
20
07
05
Se
pte
mb
er
20
07
05
De
ce
mb
er
20
07
05
Ma
rch
20
08
05
Ju
ne
20
08
05
Se
pte
mb
er
20
08
05
De
ce
mb
er
20
08
05
Ma
rch
20
09
05
Ju
ne
20
09
US Euro Area UK
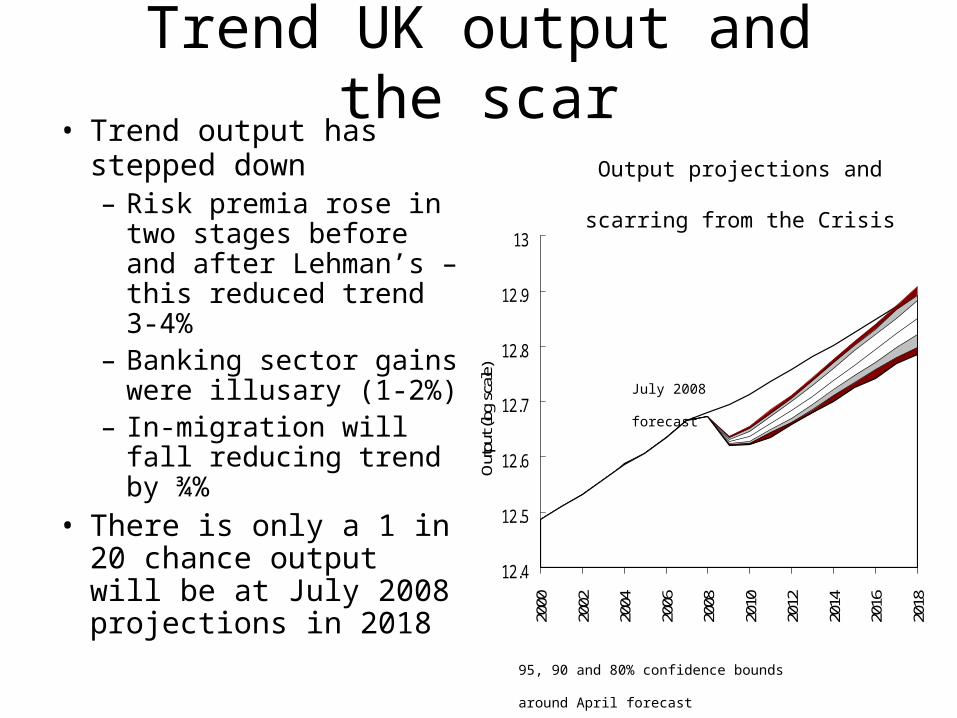
Trend UK output and the scar• Trend output has stepped
down – Risk premia rose in two
stages before and after Lehman’s –this reduced trend 3-4%
– Banking sector gains were illusary (1-2%)
– In-migration will fall reducing trend by ¾%
• There is only a 1 in 20 chance output will be at July 2008 projections in 2018
12.4
12.5
12.6
12.7
12.8
12.9
13
2000
2002
2004
2006
2008
2010
2012
2014
2016
2018
Out
put (
log s
cale)
Output projections and scarring from
the Crisis
July 2008 forecast
95, 90 and 80% confidence bounds
around April forecast
5 Modelling the banking sector• Shown that regulation has benefits in reducing
incidence and costs of crises• May also have a negative impact on output in both
the short and the long run by increasing borrowing costs and raising user cost of capital (an effective tax on banks has real effect, e.g. widens spreads)
• So model effects of regulation on output by constructing banking sector model and embedding in NiGEM
• Use the risk weighted capital adequacy, but correlation of 0.92 to unweighted

NiGEM model• NiGEM covers the OECD economies
– Supply and demand spelled out– Trade and capital account linkages– Stock flow consistent– Long run properties as a DSGE model
• Financial and exchange markets forward looking, as is the wage bargain
• Capital stock depends on user cost and on expected output 4 years ahead
• Increasing spread between borrowing and lending rates for individuals changes their incomes, and decision making on the timing of consumption, with possibility of inducing sharp short term reductions (no long run effect).
• Changing spread between borrowing and lending rates for firms may change user cost of capital and hence equilibrium level of output and capital in the economy in a sustained manner (short and long run effects).
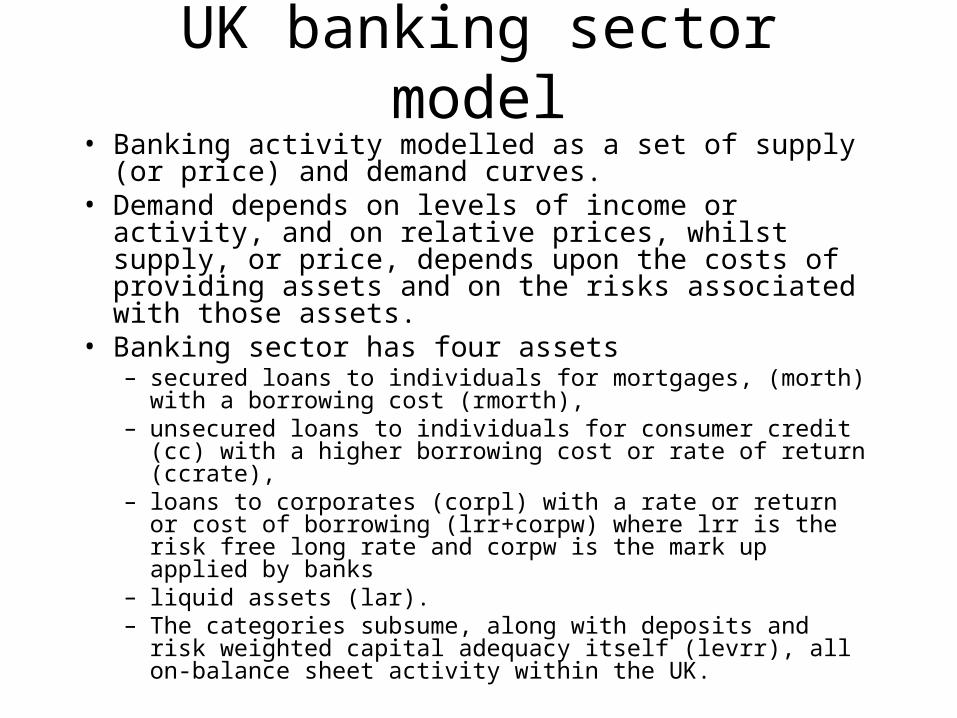
UK banking sector model• Banking activity modelled as a set of supply (or price) and
demand curves. • Demand depends on levels of income or activity, and on
relative prices, whilst supply, or price, depends upon the costs of providing assets and on the risks associated with those assets.
• Banking sector has four assets– secured loans to individuals for mortgages, (morth) with a
borrowing cost (rmorth), – unsecured loans to individuals for consumer credit (cc) with a
higher borrowing cost or rate of return (ccrate), – loans to corporates (corpl) with a rate or return or cost of
borrowing (lrr+corpw) where lrr is the risk free long rate and corpw is the mark up applied by banks
– liquid assets (lar). – The categories subsume, along with deposits and risk weighted
capital adequacy itself (levrr), all on-balance sheet activity within the UK.
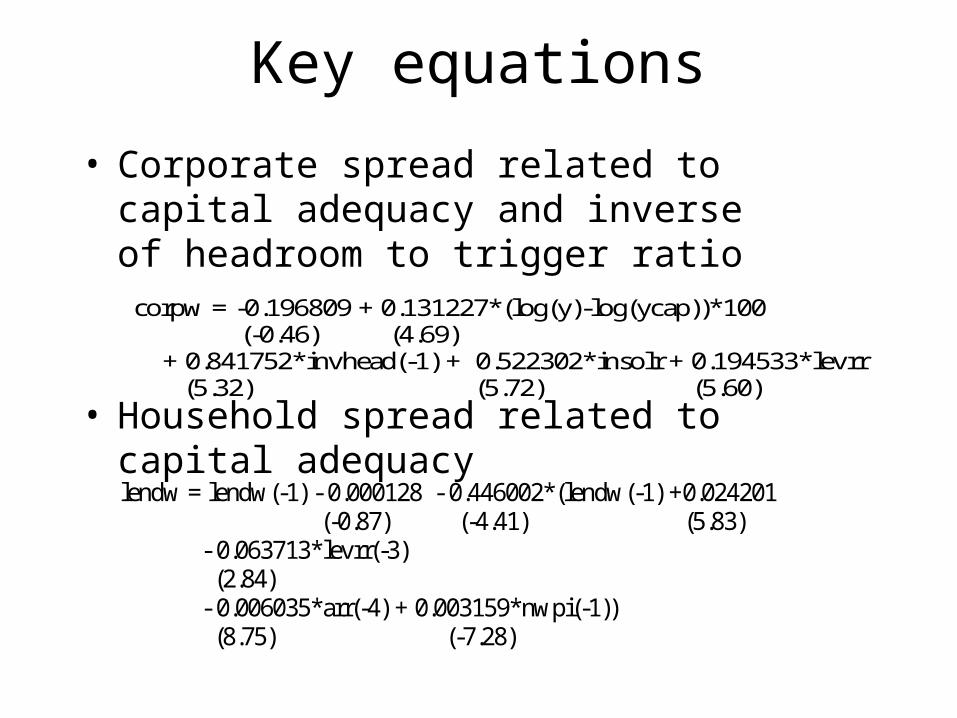
Key equations
• Corporate spread related to capital adequacy and inverse of headroom to trigger ratio
• Household spread related to capital adequacylendw = lendw(-1) - 0.000128 - 0.446002*(lendw(-1) +0.024201 (-0.87) (-4.41) (5.83) - 0.063713*levrr(-3) (2.84) - 0.006035*arr(-4) + 0.003159*nwpi(-1)) (8.75) (-7.28)
corpw = -0.196809 + 0.131227*(log(y)-log(ycap))*100 (-0.46) (4.69) + 0.841752*invhead(-1) + 0.522302*insolr + 0.194533*levrr (5.32) (5.72) (5.60)
Model details
• Each spread feeds into borrowing cost and then credit volume, with appropriate signs
• No direct role for liquidity (effect is calibrated based on estimated results for US)
• One to one relation of bank spread to bond spread (arbitrage)
• Adjustment equations for balance sheet and capital
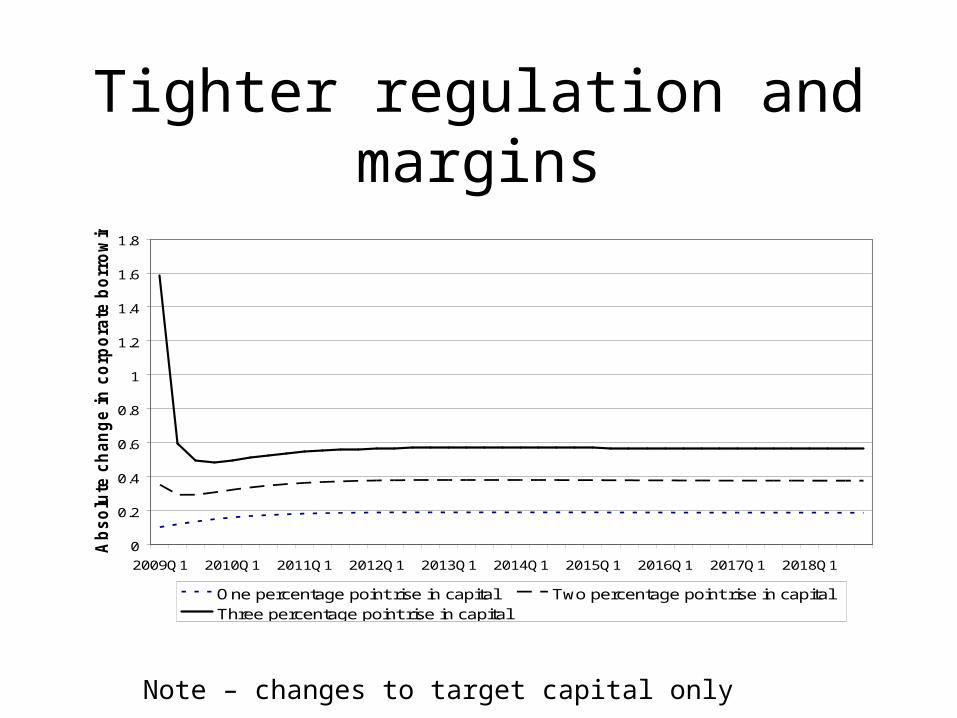
Tighter regulation and margins
0
0.2
0.4
0.6
0.8
1
1.2
1.4
1.6
1.8
2009Q1 2010Q1 2011Q1 2012Q1 2013Q1 2014Q1 2015Q1 2016Q1 2017Q1 2018Q1
Ab
so
lute
ch
an
ge
in
co
rpo
rate
bo
rro
win
g c
os
ts
One percentage point rise in capital Two percentage point rise in capitalThree percentage point rise in capital
Note – changes to target capital only
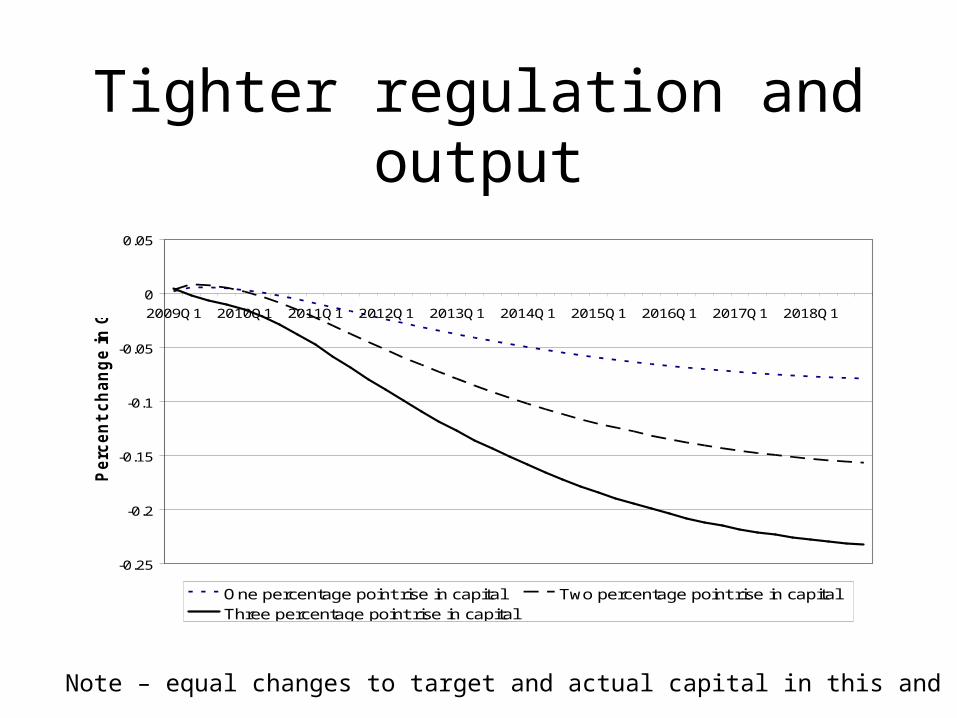
Tighter regulation and output
-0.25
-0.2
-0.15
-0.1
-0.05
0
0.05
2009Q1 2010Q1 2011Q1 2012Q1 2013Q1 2014Q1 2015Q1 2016Q1 2017Q1 2018Q1
Pe
rce
nt
ch
an
ge
in
GD
P
One percentage point rise in capital Two percentage point rise in capitalThree percentage point rise in capital
Note – equal changes to target and actual capital in this and following
(6) Costs and benefits of tighter regulation
• Compare the gains from tighter regulation to the costs of regulation– Gains are the change in the probability of a crisis
times lost output in this crisis
– Costs are regulatory impacts
• Look at steady state impacts in 2018
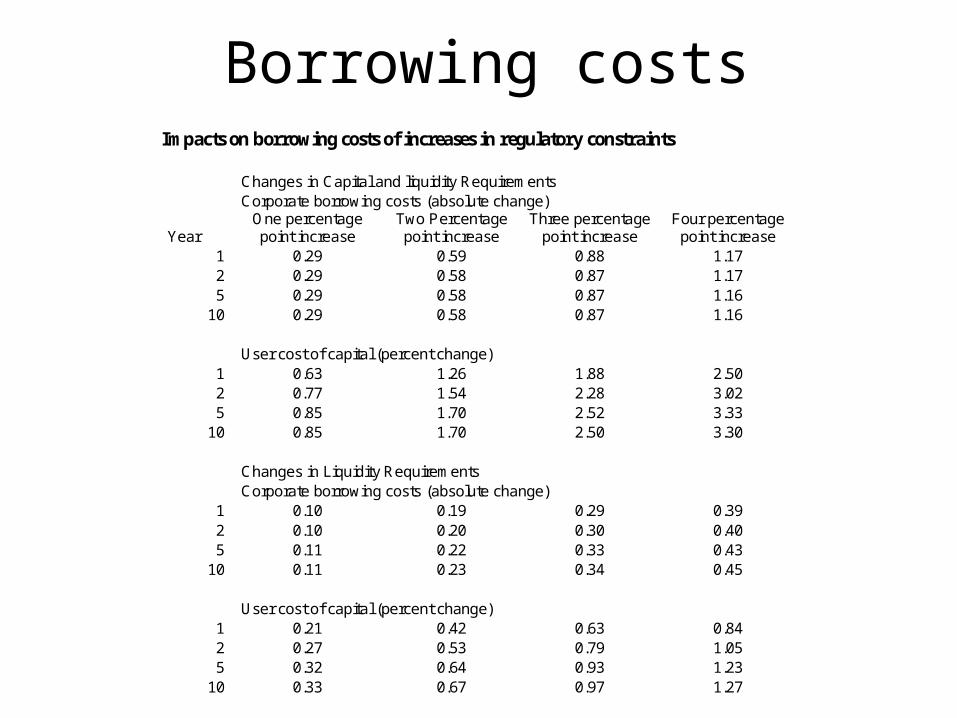
Borrowing costsImpacts on borrowing costs of increases in regulatory constraints Changes in Capital and liquidity Requirements Corporate borrowing costs (absolute change)
Year One percentage point increase
Two Percentage point increase
Three percentage point increase
Four percentage point increase
1 0.29 0.59 0.88 1.17 2 0.29 0.58 0.87 1.17 5 0.29 0.58 0.87 1.16
10 0.29 0.58 0.87 1.16 User cost of capital (percent change)
1 0.63 1.26 1.88 2.50 2 0.77 1.54 2.28 3.02 5 0.85 1.70 2.52 3.33
10 0.85 1.70 2.50 3.30 Changes in Liquidity Requirements Corporate borrowing costs (absolute change)
1 0.10 0.19 0.29 0.39 2 0.10 0.20 0.30 0.40 5 0.11 0.22 0.33 0.43
10 0.11 0.23 0.34 0.45 User cost of capital (percent change)
1 0.21 0.42 0.63 0.84 2 0.27 0.53 0.79 1.05 5 0.32 0.64 0.93 1.23
10 0.33 0.67 0.97 1.27
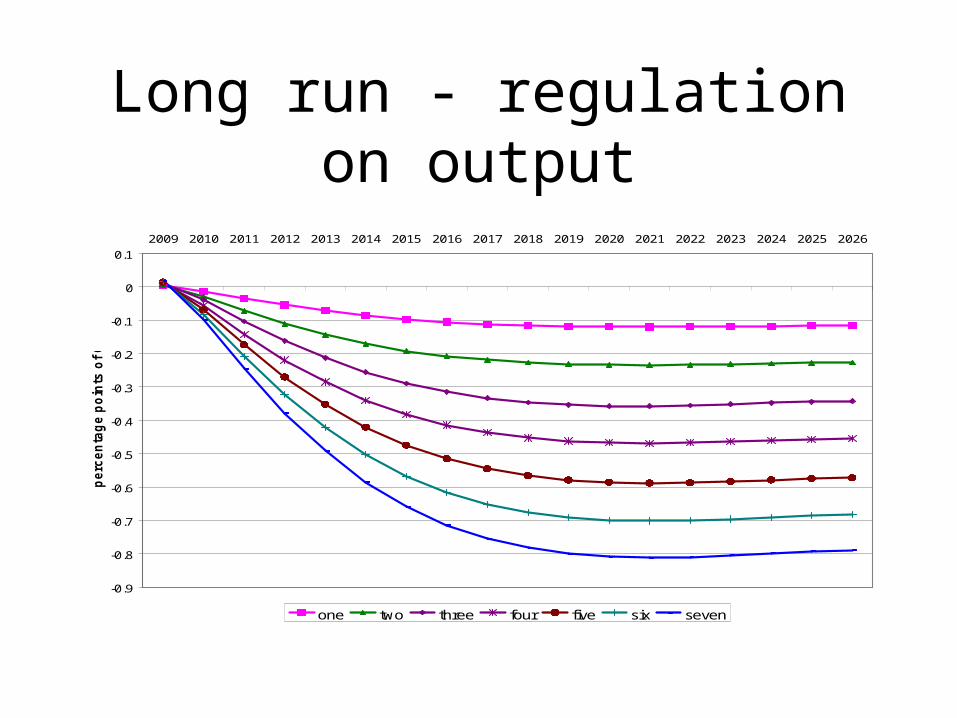
Long run - regulation on output
-0.9
-0.8
-0.7
-0.6
-0.5
-0.4
-0.3
-0.2
-0.1
0
0.1
2009 2010 2011 2012 2013 2014 2015 2016 2017 2018 2019 2020 2021 2022 2023 2024 2025 2026
pe
rce
nta
ge
po
ints
of
GD
P
one two three four five six seven
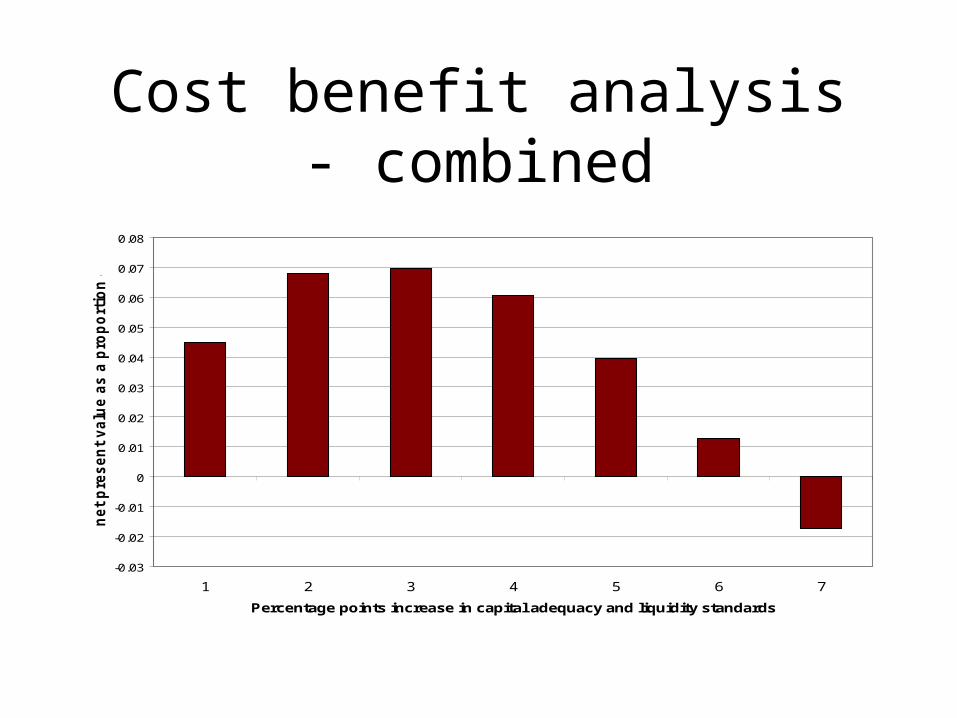
Cost benefit analysis - combined
-0.03
-0.02
-0.01
0
0.01
0.02
0.03
0.04
0.05
0.06
0.07
0.08
1 2 3 4 5 6 7
Percentage points increase in capital adequacy and liquidity standards
ne
t p
res
en
t v
alu
e a
s a
pro
po
rtio
n o
f G
DP
7 Conclusions
• Lax regulation raises the risk of a crisis• Raising capital adequacy standards and
introducing binding liquidity requirements beneficial if they reduce probability of costly financial crisis
• Also costs - any effective banking regulation works as a tax on bank activity. Hence regulations may reduce output through impacts on borrowing costs for households and companies
• Find short run impact on consumption and short and long run impact on investment
• Estimates of impacts on costs are upper bound as structure of portfolios and of relative prices may change if regulations significantly tighten
• When capital adequacy standards tightened by 1 pcp, banks contract balance sheets by 1.2 per cent and reduce riskiness of portfolio, with their risk weighted assets falling by 1.6 per cent - results contrary to the Modigliani Miller theorem of irrelevance of the debt equity choice
• Caution needed with rapid regulatory tightening owing to immediate impact on margins
• Positive net benefit from regulatory tightening, with a 2 to 6 percentage point increase in capital and liquidity ratios increasing welfare, depending upon assumptions
• Separate tightening of capital or liquidity ratios offers benefit up to 10 percentage points
References
• Barrell R, Davis E P, Fic T, Holland D, Kirby S, Liadze I (2009), "Optimal regulation of bank capital and liquidity: how to calibrate new international standards”, FSA Occasional Paper No 38