Corporate Liquidity - pdfs.semanticscholar.org€¦ · trade-off theory suggests that firms trade...
38
Corporate Liquidity Amy Dittmar Indiana University Jan Mahrt-Smith London Business School Henri Servaes London Business School and CEPR This Draft: May 2002 ______________________________________________________________ We are grateful to João Cocco, David Goldreich, John McConnell and Darius Miller for helpful comments and discussions.
-
Upload
nguyenthien -
Category
Documents
-
view
218 -
download
0
Transcript of Corporate Liquidity - pdfs.semanticscholar.org€¦ · trade-off theory suggests that firms trade...

Corporate Liquidity
Amy Dittmar Indiana University
Jan Mahrt-Smith
London Business School
Henri Servaes London Business School and CEPR
This Draft: May 2002
______________________________________________________________ We are grateful to João Cocco, David Goldreich, John McConnell and Darius Miller for helpful comments and discussions.
Corporate Liquidity
Abstract
Agency problems are an important determinant of corporate liquidity. For a sample of more than 11,000 firms from 45 countries, we find that corporations in countries where shareholders rights are not well protected hold up to twice as much cash as corporations in countries with good shareholder protection. In addition, when shareholder protection is poor, factors that generally drive the need for liquidity, such as investment opportunities and asymmetric information, actually become less important. These results strengthen after controlling for capital market development. In fact, consistent with the importance of agency costs, we find that managers actually hold larger cash balances when it is easier to access capital markets. Our evidence indicates that investors in countries with poor shareholder protection cannot force managers to disgorge excessive cash balances.

1
1. Introduction
At the end of 1998, the largest corporations around the world (as listed on the Global Vantage
database) held $1.5 trillion of cash and cash equivalents, which is almost 9% of the book value of their
assets and slightly above 9% of the market value of their equity. These numbers indicate that
investments in liquidity are important for corporations. Until recently, however, scholars paid relatively
little direct attention to the causes and consequences of corporate liquidity. Transactions costs were
assumed to be the major determinant of cash holdings and firms with a higher marginal cost of cash
shortfalls would hold more cash [see, for example, Miller and Orr (1966), Meltzer (1993), and Mulligan
(1997)]. With few exceptions, discussions of other factors that affect corporate liquidity were not the
central theme of research.
In an important recent paper, Opler, Pinkowitz, Stulz, and Williamson (1999) expand our
knowledge of the determinants of corporate liquidity considerably. Opler et al. (1999) consider two
broad explanations for liquidity, which have their antecedents in the capital structure literature. The
trade-off theory suggests that firms trade off the costs and benefits of corporate liquidity to derive the
optimal liquidity holdings. In this context, they do not only consider the transaction costs motive
described earlier, but also the effect of asymmetric information, and the agency costs of outside
financing. The financing hierarchy theory, on the other hand, suggests that there is no optimal amount
of cash, based on arguments similar to the pecking order theory of capital structure. Levels of debt
decrease and cash increase as the firm becomes more profitable and does not need external
financing.
Opler et al. (1999) examine the trade-off and hierarchy views of corporate liquidity for all firms on the
Compustat database over the period 1952-1994. They find substantial support for the trade-off model.
Firms hold more cash when they are smaller, have higher capital expenditures and R&D and better
investment opportunities, when they have higher and more volatile cash flows and lower net working
capital. Both transactions costs and costs due to asymmetric information are important factors in this
trade-off model. However, there is little evidence in their data to suggest that agency costs of
2
managerial discretion matter because managers who are more likely to be entrenched do not hold
more liquid assets. In addition, Mikkelson and Partch (2002) do not find that firms with substantial
cash holdings have a different ownership structure from other firms. This contrasts with the work of
Harford (1999), who focuses on the impact of cash holdings on the acquisitions made by companies.
He finds that cash-rich firms are more likely to attempt acquisitions, which is perhaps not surprising.
However, cash-rich bidders are more likely to overpay in these transactions and their post-acquisition
operating performance is worse than for other acquirers, which suggests that agency costs matter
when managers decide to use the liquidity they built up.1 One reason why Opler et al. (1999) may find little support for the agency cost motive for cash
holdings is that shareholders in the U.S. enjoy good protection and can therefore force managers to
return excess funds to them [see LaPorta, Lopez-de-Salines, Shleifer and Vishny (2000) for
supporting evidence]. The primary motivation for this paper is to shed additional light on the role of
corporate governance in the determination of corporate liquidity through the use of international data.
To do this we employ data for approximately 11,000 companies from 45 countries. The main reason
for taking the arguments to international data is that the variation in agency costs of equity across
countries is likely to be at least as substantial as the variation across companies within a particular
country. In addition, differences across countries in capital market development allow us to construct
several tests of the importance of agency problems, which cannot be developed on data from one
country. We focus our analysis on 1998, which is the most recent year for which comprehensive data
are available on the Global Vantage database.
Our results provide strong support for the importance of corporate governance in determining
corporate liquidity. For the median firm in countries with high shareholder protection, the ratio of cash
and cash equivalents to net assets (assets minus cash) is 6.30% compared to 8.60% in countries with
1 Lang, Stulz, and Walkling (1991) also provide some support for this hypothesis. They find that firms with high cash flows and low q ratios are more likely to overpay in acquisitions; of course, they look at cash flow, rather than the level of cash, so their evidence is merely indirect. Blanchard, Lopez-de-Silanes, and Shleifer (1994) also have some evidence that large cash holdings affect firm behavior. They look at 11 firms that received cash windfalls over the period 1980-1986 without affecting their investment opportunity set. Generally, they find that these firms do not return the funds to equityholders or debtholders, but use it for endeavours that are not value creating, on average.

3
low shareholder protection. This difference persists when we control for the median of the other
characteristics that affect liquidity. In particular, we find that the median liquidity ratio is higher in
countries with higher median market-to-book ratios and higher median R&D expenses, which provides
further support for the trade-off theory. However, after controlling for these differences, the impact of
shareholder protection persists and its magnitude is virtually unaffected. If we also control for capital
market development, they actually become stronger.
One issue with cross-country comparisons using country medians is that they hide the cross-
sectional variation within each country. We therefore also employ the individual firm observations in
our regression models, which allows us to control for firm-specific characteristics. Our findings persist
in these specifications. When we control for industry composition and include firm characteristics, we
find that firms in countries with the highest level of shareholder protection have about 40% less cash
and equivalents than firms in countries with the lowest level of shareholder protection. The sign and
significance of the other variables is consistent with U.S. evidence. Larger firms hold less liquid
assets while firms with better investment opportunities, as proxied by their market-to-book ratio are
more liquid. In addition, firms with more R&D are more cash-rich. However, firms with higher net
working capital, which can easily be converted to cash, are actually more liquid. Thus, working capital
and cash appear to be complements in most countries.
Two other tests confirm that corporate governance has a significant impact on cash holdings,
and that this is caused by increased managerial discretion and is therefore likely to be at the detriment
of shareholders. First, we examine whether the sensitivity of corporate liquidity to investment
opportunities depends on shareholder rights. This allows us to consider (and reject) a more nuanced
interpretation of the relation between governance and liquidity. One interpretation of our findings is
that managers hold more cash because shareholders cannot force them to disgorge the funds. This
allows managers to make more decisions ignoring the interests of shareholders. There is an
alternative interpretation of this result, however. In countries with low shareholder protection, it may
be more difficult to raise external funds. Managers are therefore more inclined to hoard cash in case
4
good opportunities come along. This interpretation of the result is much more benign. However, if this
is the case, then we would expect firms with good investment opportunities to hold more cash in
countries with low shareholder protection, because the inability to raise financing is more costly for
these firms. On the other hand, if the cash holdings are an outcome of the agency conflict, we would
expect managers to pay less attention to investment opportunities when shareholders have little
protection since this transactions cost motive is not the primary determinant of liquidity. Thus, the
relation between investment opportunities and cash is strongest in countries with fewer agency
problems. Consistent with the latter interpretation, we find that the effect of the market-to-book ratio is
much weaker in countries with few shareholder rights.
The second test is related to the work of Rajan and Zingales (1998) on financial dependence
and growth. They show that manufacturing firms from industrial sectors that need more outside
financing grow more in countries with more developed capital markets. We employ their measure of
outside financing in our analysis of the determinants of cash holdings to further distinguish between
the transaction cost and agency cost explanations of our findings. We find that firms in industries with
more dependence on external finance have more cash. Interestingly, this effect weakens significantly
in countries with poor shareholder protection. This lack of concern for external financing needs is
further evidence of the agency motive for cash holdings. If firms simply held cash because it is more
difficult to raise outside financing when shareholder protection is weak, we would have expected the
opposite effect.
Overall, the evidence in this paper indicates that shareholders rights, and therefore agency
costs, are important in determining corporate liquidity throughout the world. There is little other
systematic evidence on the determinants of corporate cash holdings outside the United States. Rajan
and Zingales (1995) present some descriptive statistics of cash holdings in the G-7 countries for 1991.
What stands out from these figures is that Japanese firms have almost twice as much cash and
equivalents as the companies in the other countries. However, their analysis is focused on
differences in capital structure, not liquidity. Pinkowitz and Williamson (2001) focus on the large cash

5
holdings in Japan. They argue these holdings derive from the power exerted by the strong Japanese
banks and they find that these holdings decline as bank power weakened over time.
The remainder of this paper is organized as follows. Section 2 discusses the various
determinants of corporate liquidity in greater detail. Section 3 describes our data collection procedure.
Section 4 contains our results, and Section 5 concludes.
2. Corporate liquidity and corporate governance
Opler et al. (1999) develop a useful framework for thinking about the determinants of cash
holdings by firms. As mentioned previously, they discuss two views of cash holdings by firms: the
trade-off model, which suggests that firms trade off various costs and benefits of debt financing when
they decide how much liquidity to maintain, and the financing hierarchy model, which suggests that
cash balances are the outcome of firm profitability and financing needs. We now discuss both views
in more detail, and discuss some variables that can be employed as proxies in these views.
2.1. The trade-off model of corporate liquidity
We can identify two costs of holding cash and cash equivalents. If we assume that managers
maximize shareholder wealth, then the only cost of holding cash is the lower return earned on it,
relative to other investments of the same risk. This cost is often called the cost-of-carry: the difference
between the return on cash and the interest that would have to be paid to finance an additional dollar
of cash. If we relax the assumption of shareholder wealth maximization, then the costs of holding
cash increase since managers now have the opportunity to engage in wasteful capital spending and
acquisitions or, in some countries, outright theft.
The benefits of holding cash balances stem from two motives. According to the transaction
costs motive, firms hold more cash when the costs of raising it and the opportunity costs of shortfalls
are higher. The current literature employs several variables to proxy for these costs. Given the
substantial fixed costs involved in raising outside financing, small firms are likely to find it costlier to

6
raise outside funds. In addition, there may be economies of scale in cash management, which also
suggest that small firms hold more cash. Firms with better investment opportunities are expected to
hold more cash because the opportunity cost of lost investment is larger for these companies;
similarly, we expect firms with more volatile cash flows to hold more cash to protect against the higher
likelihood of cash shortfalls. The level of capital spending, itself, should also be positively related with
levels of liquidity if it captures investment needs. When cash flows are higher, on the other hand,
firms need to hold less cash to meet future investment needs. Finally, firms that pay dividends can
always cut them to raise more funds, and they are therefore expected to hold fewer liquid assets.
Kim, Mauer, and Sherman (1998) develop a trade-off model of optimal cash holdings. Many of the
predictions that follow from their model are similar to those highlighted by Opler et al (1999). They
also argue that optimal liquidity is decreasing in the rate of return on current investment opportunities.
The precautionary motive for holding cash is based on the impact of asymmetric information
on the ability to raise funds. In particular, while firms may have access to capital markets to raise the
necessary financing, they may not want to do so at a particular point in time because the securities
they are planning to issue are undervalued. Myers and Majluf (1984) argue that firms can overcome
this problem by building up financial slack, which they define as cash, cash equivalents, and unused
risk-free borrowing capacity. Since firms with high R&D expenses are more opaque, the level of R&D
to sales is a good proxy for asymmetric information. We already employ the market-to-book ratio of
the firm because it captures growth opportunities, which are important in the transactions cost motive.
Of course, there is generally more uncertainty about the value of growth opportunities than about
assets in place. As such, the market-to-book ratio can also be employed as a proxy for asymmetric
information.
2.2. The financing hierarchy view of corporate liquidity
The financing hierarchy view as developed by Opler et al. (1999) suggests that there is no
optimal level of corporate liquidity, just as there is no optimal level of debt. The level of cash is simply

7
the outcome of the investment and financing decisions made by the firm as suggested by the pecking
order theory of financing. Firms with high cash flows pay dividends, they pay off their debts, and
accumulate cash. Firms with low cash flows draw down their cash and issue debt to finance
investment, but they refrain from issuing equity because it is too costly. Unfortunately, many of the
variables that are correlated with cash flows can also be employed as proxies in the trade-off theory.
The major difference between the two views is that the trade-off theory predicts a positive relationship
between investment (in capex and R&D) and cash levels, while the hierarchy view predicts a negative
sign. Additionally, the hierarchy view sees debt and cash merely as opposite sides of the same coin.
2.3. Shareholder protection and cash holdings
As discussed in section 2.1, the agency cost view of corporate liquidity suggest that managers
who are less concerned with shareholder wealth hoard cash and invest it in negative NPV projects or
use it to overpay in acquisitions. Of course, simply holding on to too much cash destroys value
because of the cost of carry. In addition, if the protection provided by these cash holdings reduces the
discipline imposed on management, corporate decision making may be affected, resulting in reduced
firm earnings. One of the issues in the well-known 1995 Chrysler case was not that holding onto cash
was wasteful per se or that management would spend it on negative NPV projects, but that
management would not take much action in case the U.S. economy went into a recession.
Management had basically informed shareholders that the $7.5 billion cash hoard would be needed
(i.e., used up) to weather a recession. Consistent with this view, Opler et al. (1999) show that firms
that move from high to low cash holdings are loss-making firms.
Overall, however, Opler et al. (1999) argue that there is little support for the agency cost
motive because ownership structure and corporate liquidity are not strongly related in their sample.
An alternative interpretation of this evidence, however, is that in the U.S. shareholders enjoy good
legal protection and can therefore force companies to disgorge the cash. La Porta, Lopez-de-Silanes,
Shleifer, and Vishny (2000) (LLSV) report evidence on dividend policy consistent with this

8
interpretation. They find that firms pay out more of their earnings in the form of dividends in countries
with good legal protection for shareholders. We therefore take the question to international data and
see whether cash holdings are higher in countries where shareholders have fewer rights. In addition,
we study whether the variables that measure the transactions costs and precautionary motives for
holding cash are less important when shareholder rights are weak. This is a corollary to the earlier
tests: if cash holdings are partly the outcome of weak shareholder protection, then the other
determinants should be less important. An alternative explanation for high cash holdings in countries
with weak shareholder protection is that firms simply hold more cash because capital markets are not
very receptive to new financing. That would make the precautionary and transactions costs motives
for cash holdings more important. We examine this in three ways. First, we determine whether the
development of the equity and debt market affects cash holdings or whether these effects are indeed
dominated by shareholder protection. Second, we determine whether the importance of proxies for
the precautionary and transactions costs motives is larger in countries with more shareholder
protection. Third, we analyze whether firms with greater need for outside financing hold more cash
and whether these holdings are affected by the level of shareholder protection.
3. Data Collection and Variable Construction
We gather data from the Global Vantage database for 1998. This is the most recent year of
data availability at this point in time. The database contains financial information for 16157 companies
from 80 countries. To measure shareholders rights we employ the shareholder rights measure
developed by LLSV (1998). This is an index formed by adding 1 when each of six criteria relating to
the extent to which minority shareholders have a say in corporate governance is met. LLSV construct
this measure for 49 countries; firms from other countries are excluded from our analysis. These
countries are mainly current and former Communist and African countries. In addition, four countries
for which LLSV have shareholder rights data are not included in Global Vantage: Ecuador, Nigeria, Sri
Lanka, and Uruguay. Thus, corporations from 45 countries are included in this paper.

9
We further remove the following sets of firms from the sample: (a) firms with operations in
financial services (SIC codes starting with 6); (b) firms that are considered governmental or quasi
governmental (SIC codes starting with 9); (c) firms for which cash and equivalents and/or assets are
missing; (d) firms which do not present consolidated financial statements. The remaining sample
consists of 11591 companies from 45 countries.
We define liquidity as the ratio of cash and cash equivalents to net assets, where net assets
are computed as assets less cash and equivalents. This procedure mimics the approach followed by
Opler et al. (1999); the main reason for netting out cash from assets is that a firm’s profitability is
mainly related to assets in place and cash should be measured relative to this base. We also report
on robustness checks where we use the ratio of cash to sales.
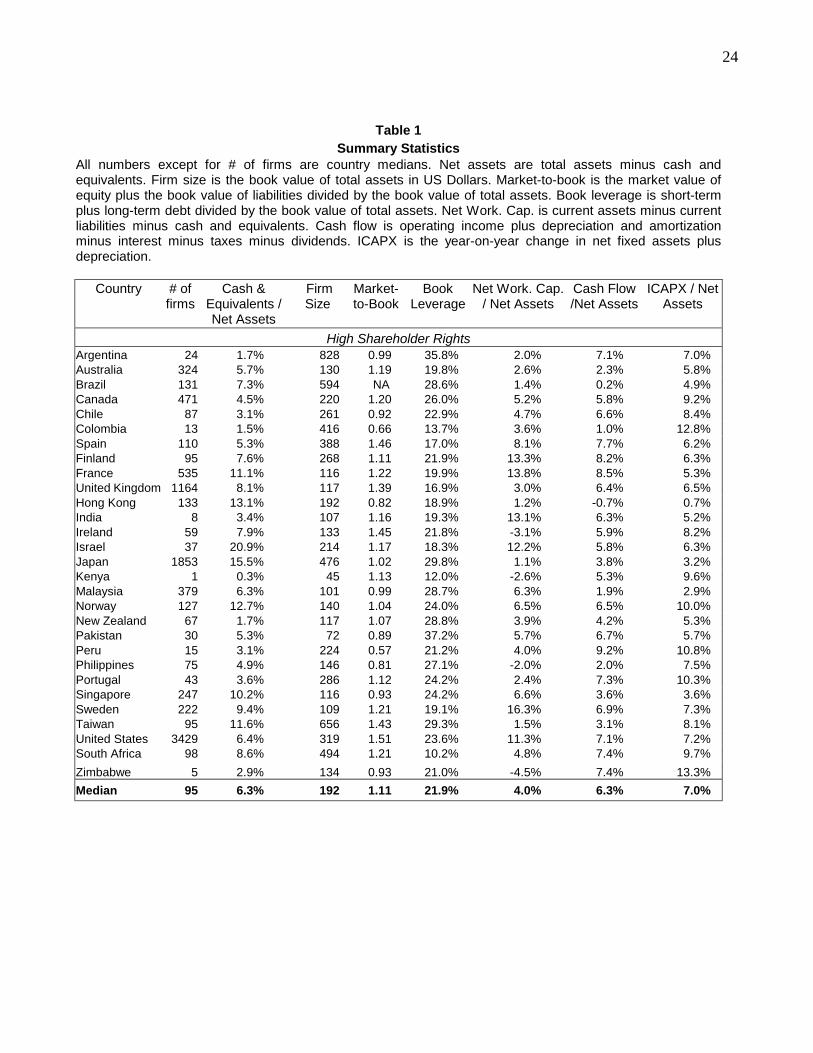
Table I presents a first look at the data. In this table, we divide the countries into two groups
based on LLSV’s shareholder rights variable. Twenty-nine countries are in the high shareholder rights
group (shareholder rights variable equal to 3, 4, or 5) and 16 are in the low shareholder rights group
(shareholder rights variable equal to 0, 1, or 2). The United States, Japan, and the United Kingdom
are the countries with the largest representation in the sample. There is substantial variation in firm
size as measured by book value of assets. The median firm in Mexico has a book value of $1.16
billion, while the median firm in Pakistan has a book value of only $72 million. Since size is one proxy
for the transactions costs associated with raising external financing, it will be important to control for
this cross-country variation in the analysis.
The key ratio of interest, which is cash to net assets, is displayed in column (iv) of Table 1.
There is tremendous cross-country variation in this ratio. The overall median is 6.6%, but many
countries have median cash to assets of over 10%. Egypt, with cash to assets of 29.57% and Israel
with cash to assets of 20.93% stand out. Japanese firm have a median cash to assets ratio of
15.49%, which is the highest of the countries with developed capital markets. In fact, this ratio is twice
as high as for the U.K. and more than double the level of the U.S. and Germany. Our figures for
10
Germany, Japan, and the U.S. broadly correspond to those reported by Pinkowitz and Williamson
(2001).
Notice that firms in the high shareholder rights group have median cash to assets of 6.30%,
compared to 8.60% in countries with low shareholder rights, consistent with the view that firms hold
more cash when shareholder protection is weak.
Table 1 also reports country medians for some of the other variables employed in our analysis.
We do not have the same number of observations for these variables because they are not available
on Global Vantage or because they require data to be available for prior years. In addition to size,
investment opportunities are important for both the transaction costs and the precautionary motive.
The market-to-book ratio of the firm, computed as (market value equity + book value liabilities) / total
assets is employed as a proxy for investment opportunities. Note that the U.S has the highest median
market-to-book ratio of the countries with developed capital markets at 1.51. We also report median
book leverage, the ratio of net working capital to assets, the ratio of cash flow to assets, and the level
of capital expenditures to assets. Cash flow is defined as EBITDA – interest payments – taxes –
dividends. Unlike for the U.S., capital expenditures data are not consistently available for most
countries. We therefore proxy for capital spending by taking the difference in net fixed assets
compared to the previous year and adding depreciation. The other variables included in the analysis,
but not reported in the table are: (a) a dummy variable, equal to 1 if the firm pays a dividend and zero
otherwise; and (b) the ratio of R&D expenses to sales as a measure of opaqueness.
We include leverage in some specifications to see whether firms simply finance additional cash
holdings with more debt or whether there is not a one-for-one relationship. The ratio of net working
capital to net assets is included as a control variable. Net working capital is normally computed as
current assets minus current liabilities, but we remove cash from the current assets computation. This
ratio captures additional liquidity held by the firm and our goal is to determine whether this liquidity
acts as a complement or substitute for cash and equivalents. We find a correlation between the
median level of cash and net working capital of only 0.04, however, which casts doubt on both the
11
complement and the substitute view. All of the ratios included in the analysis show substantial
variability across countries.
4. Results
This section contains the findings of our investigation of the determinants of cash holdings
across the countries in our sample. In section 4.1, we focus on the median cash to assets ratios in
each country and use country characteristics and medians of the other explanatory variables in the
estimation. Section 4.2 contains a more detailed analysis at the firm level and section 4.3. explores
interactions between shareholder rights and firm characteristics.
4.1. Explaining country medians
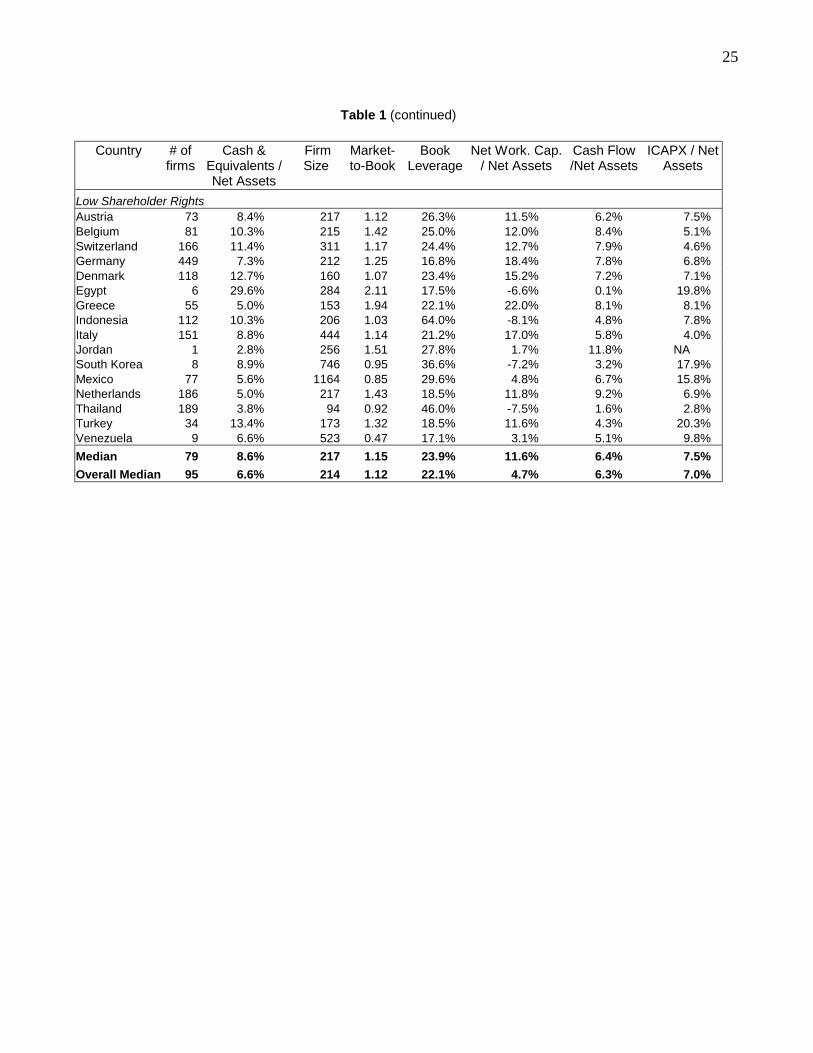
Table 2 contains the analysis of country medians. To maintain consistency with the work by
Opler et el. (1999), we employ the log of the ratio of cash to assets as the dependent variable.
Significance levels are adjusted to reflect White’s heteroskedasticity correction of the standard errors.
In model (i), we only include a dummy variable, equal to 1 if shareholders rights are high (equal to 3, 4
or 5) and zero otherwise. Consistent with the agency motive for cash holdings, the coefficient on the
dummy is negative and significant at the 7% level. The economic significance is substantial. The
median firm in a country with low shareholder rights holds 50% more cash to assets than in a country
with weak shareholder rights. This dummy variable alone explains 4% of the cross-country variation
in liquidity.
As LLSV (1998) demonstrate, shareholder rights are correlated with the legal origin of a
country, where the main distinction is between countries with a common law tradition versus those
with a civil law tradition. We investigate in column (ii) whether our result also holds when we include a
common law dummy in the regression instead of the shareholder rights dummy. While the coefficient
on the common law dummy is negative, it is not significantly different from zero.
12
Our interpretation of the result in column (i) is that managers like to hold a lot of cash because
it reduces pressures to perform and allows them to spend these funds on projects that increase their
non-pecuniary benefits, but have a negative impact on shareholder wealth. There is an alternative
interpretation for this result, however, which is much more benign. We know from LLSV (1997) that
capital markets are not well developed in countries with poor shareholder protection. This implies that
the transactions costs of raising additional funds are higher, and firms may respond to this by holding
into to higher cash balances.
In regression (iii) of Table 2, we include two measure of capital market development to
investigate whether this alternative interpretation is more consistent with the data. The first measure
is the ratio of external capital market to GNP and is discussed in greater detail in LLSV (1997). This
ratio employs the stock market capitalization held by minority shareholders as the numerator. This
may be a better measure of the size of capital markets in countries where shareholdings are highly
concentrated. The second measure captures the size of the credit market. It is the ratio of Private
Credit by Deposit Money Banks and Other Financial Institutions to GDP. This measures the total
amount of debt finance to private firms from all financial institutions, except central banks. We obtain
this ratio from Levine, Loayza, and Beck (2000). After controlling for the development of the capital
market, we continue to find that shareholder rights are important, and the economic and statistical
significance of the result remains as strong as in model (i). In addition, the sign on the size of the
stock market is positive, albeit insignificant, while the sign on the size of the debt market is positive
and marginally significant. This result suggests that, if anything, firms hold more liquid assets when
capital markets are large, and does not support the view that cash holdings are driven by the inability
of corporations to raise funds. Instead, the easier it is to raise funds, the more cash companies hold,
which is supportive of the agency view.
The first three models in Table 2 do not control for differences in the characteristics of the firms
across countries, and, as illustrated in Table 1, these differences are substantial. Moreover, we know
from prior work that these variables affect liquidity significantly. We therefore re-estimate models (i)
13
through (iii) but include the country medians of a number of other determinants of cash holdings.
These results are displayed in regressions (iv) through (vi). Consistent with prior evidence, we find
higher median cash balances in countries with higher market-to-book ratios and higher R&D intensity.
Cash flows have a negative impact on cash levels, which is consistent with the trade-off model.
Finally, the impact of median size and net working capital is not significant. The impact of the other
variables is also economically important. For example, increasing the market-to-book ratio from the
25th percentile in the distribution to the 75th percentile increases cash levels by 25%, while an increase
in the ratio of cash flow to assets from its 25th to its 75th percentile reduces cash balances by one third.
In both models (iv) and (vi), where the shareholder rights dummy is included, we continue to find that
firms in countries with better shareholder protection hold lower median cash balance. In fact, the full
model (vi) shows that the economic impact of this result has changed little after including the other
variables, which indicates that the agency motives is independent of the transactions costs and
precautionary motives. The coefficient on shareholder rights is actually highest in model (vi). Also
note that in this model, the development of the debt and equity markets has no significant impact on
cash levels.
One concern with the analyses reported in Table 2 is that the country medians hide substantial
cross-sectional variation within each country. If this variation in the explanatory variables is properly
controlled for, it may be the case that the importance of shareholder rights cancels out. In other
words, perhaps the shareholder rights dummy is only important because it captures some aspect of
the effect of the independent variables not properly controlled for by the use of medians. We perform
two sets of tests to investigate this possibility. In the next section, we estimate regressions at the firm
level. In the remainder of this section, we employ some of this firm-level information to compute a
median ‘excess’ cash measure at the country level. To do this, we develop two ‘optimal liquidity’
benchmarks. Both make use of U.S. data to determine what the base-case level of liquidity should be.
This assumes that a benchmark based on U.S. data provides a good indication of what cash levels

14
should be when shareholder rights are strong. Williamson and Pinkowitz (2001) employ a similar
approach in their analysis.
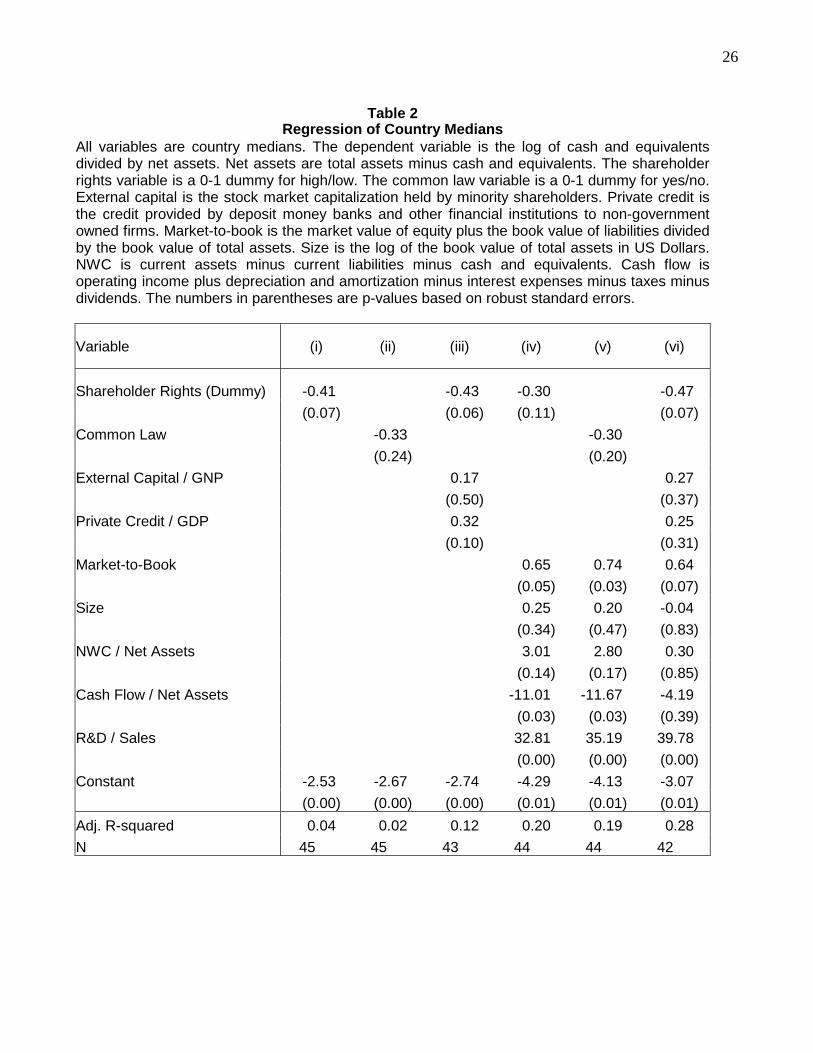
The first benchmark is simply the median cash level in the same U.S. two-digit SIC code
industry. Thus, for each firm in the sample, we adjust the cash ratio by the median of the firms in the
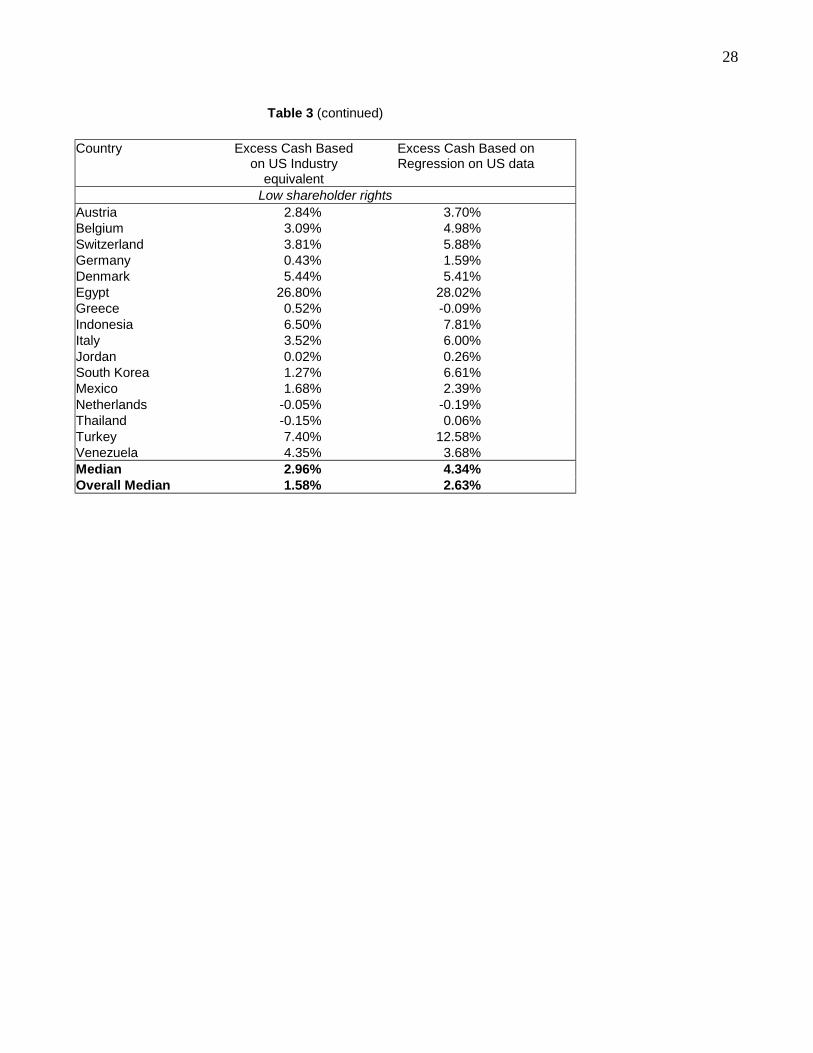
same two-digit SIC code in the U.S. Column (i) of Table 3 contains the median excess cash level for
each country using this benchmark. Note that the median excess cash level in countries with high
shareholder protection is only 1.15% compared to 2.96% in countries with low shareholder protection.
To obtain the second benchmark, we estimate a cross-sectional regression model of cash holdings for
U.S. firms, which includes the following explanatory variables: market-to-book, log size, cash flow over
net assets, net working capital over net assets, and R&D over sales. Two-digit SIC code dummies are
also included in this regression. This is equivalent to the reduced form model of Opler et al. (1999),
except that we do not include industry cash flow volatility since the industry dummies capture this
effect. They call this a reduced form model because it excludes leverage, capital spending, and a
dividend-paying dummy. These variables are excluded from the reduced form model since the trade-
off theory would argue that leverage, cash holdings, and investment policy are jointly determined. We
also do not include a regulation dummy because regulation varies dramatically by country.2
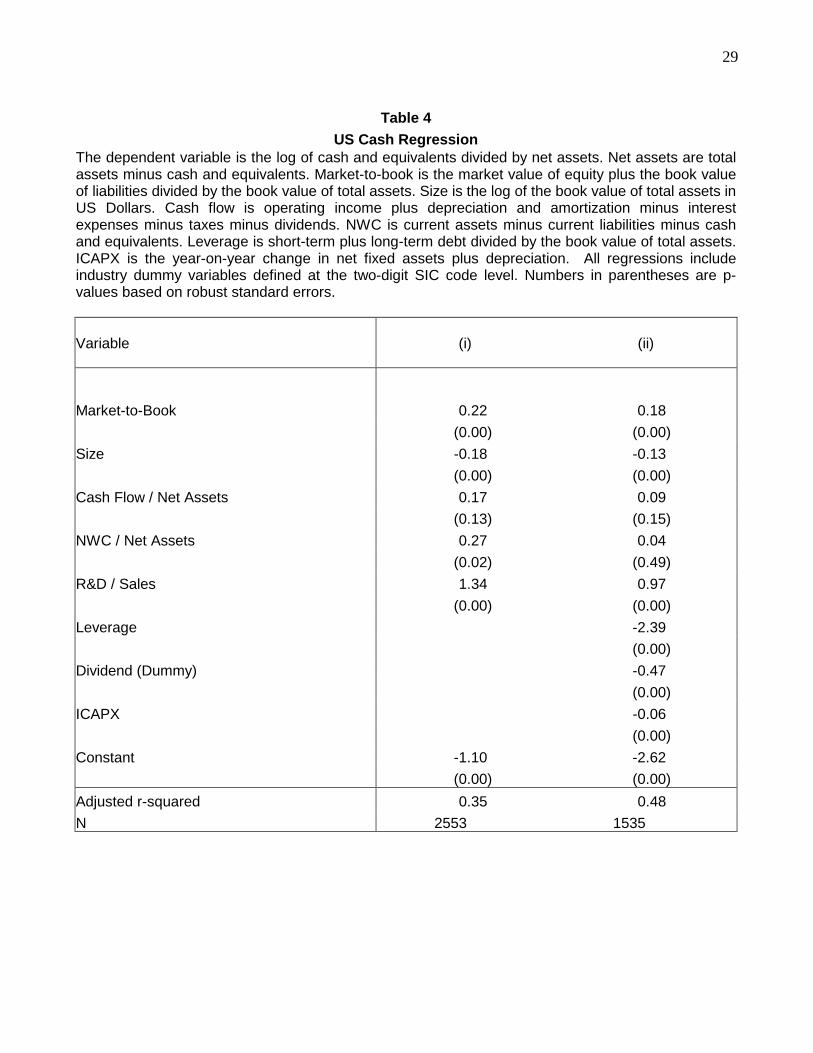
The results of this estimation are reported in Table 4. For completeness, we also report the
regression results for the full model in addition to the reduced form model, which is the one employed
for benchmarking. Firms have a higher ratio of cash to assets when they have a higher market-to-
book ratio, higher R&D expenses relative to sales, less debt, lower capital expenditures, when they
pay a dividend, and when they are smaller. The results are generally consistent with the evidence
presented by Opler et al. (1999) and Kim et al. (1998), with one exception: we find net working capital
and cash holdings to be complements, while Opler et al. find them to be substitutes. Column (ii) of
Table 3 contains the country medians of the excess cash levels based on this benchmark. Again, 2 As mentioned previously, there is one difference between Opler et al. (1999) and this paper in the computation of the capital expenditures variables. While Opler et al. employ the capital expenditures figure from Compustat, we compute capex as the difference in fixed assets plus depreciation. Obviously, this implies that assets sales are also part of our measure. The reason for employing this indirect measure is that capital expenditures data are not available for many of the firms outside the U.S.
15
there is a substantial difference between the median excess cash levels of high protection countries
(1.12%) and those of low protection countries (4.34%). Note that the developed capital market with
the highest deviation according to both benchmarks is Japan. Using U.S. firms from the same
industry, Japanese firms have median excess cash levels of 8.61%, and controlling for other firms
actually increases excess cash to 11.31%. Since Japan is also in the high shareholder protection
category, we require further study to investigate this observation. Moreover, our data are from 1998,
so Pinkowitz and Williamson’s (2001) explanation that strong banks forced companies to hold cash in
previous decades can only be a partial explanation for this phenomenon. By 1998, bank power in
Japan had been reduced substantially.
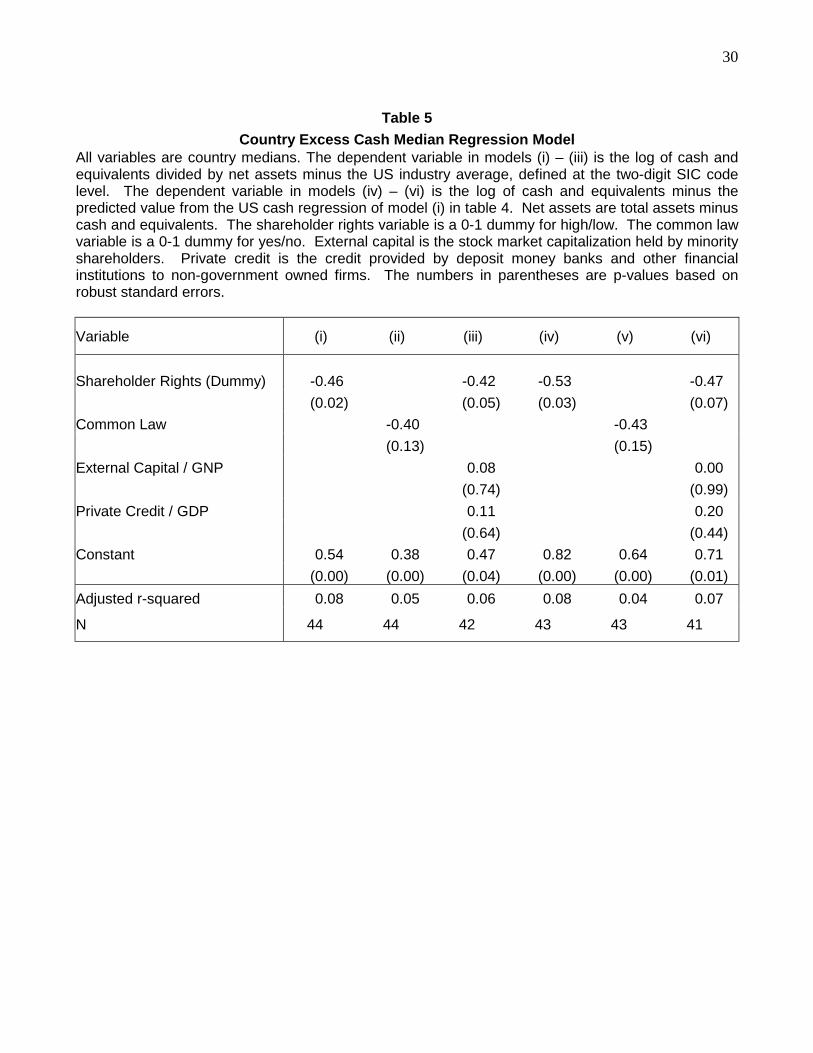
Table 5 contains regressions similar to those in Table 2, except that we now employ the
excess cash levels as the dependent variable. Obviously, the median firm characteristics are not
included in these models because they have been included in some of the models employed to
estimate the dependent variable. The first three regressions are based on U.S. industry adjusted cash
levels, and models (iv) through (vi) use regression model (i) of Table 4 to determine excess cash
levels. In columns (i) and (iv) we only use the high shareholder rights dummy to explain the level of
excess cash across countries. The result is consistent with the raw cash regressions: firms with high
shareholder protection have significantly lower cash holdings. In addition, the significance of the
shareholder rights dummy has increased compared to Table 2. In columns (ii) and (v) we employ a
common law dummy instead of a shareholder rights dummy; while the coefficient on the common law
dummy is of similar magnitude as that of the shareholder rights dummy, it is not significant. Finally, in
columns (iii) and (vi) we control for the size of the debt and equity market; both of these coefficients
are insignificant and they have little impact on the magnitude or significance of the shareholder rights
dummy.
Before moving to firm-specific regressions, we conduct a number of sensitivity tests. These
are reported in Table 6. In model (i), we employ the level of shareholder rights instead of a dummy
variable to explain the median raw country cash levels. We continue to find that firms in countries with

16
better shareholder protection hold more cash. The coefficient of –0.16 on shareholder rights indicates
that firms in countries where the shareholder rights variable is 0 hold more than twice the amount of
cash compared to firms in countries where the shareholder rights variable is 5. The dependent
variable in model (ii) is the excess cash level computed using the regression on U.S. data, and the
level of shareholder rights is the explanatory variable of interest. Again, our findings persist. In
column (iii), we employ the ratio of cash to sales instead of cash to assets, because it less likely that
sales figures are manipulated. The coefficient is positive, but significant at the 12% level only.
However, when we employ the excess cash to sales ratio based on a regression on U.S. data as the
dependent variable in column (iv), the impact of shareholder rights is significant once again. Since
cash to sales ratios are much more volatile than cash to assets ratios, the explanatory power of the
model is reduced. Overall, the models of liquidity estimated at the country level indicate that firms in
countries with low shareholder rights hold higher cash balances and this effect is not caused by
differences in capital market access.
4.2. Explaining liquidity at the firm level
In this section we estimate models of cash holdings at the firm level. Such an analysis is
warranted to see how important the shareholder rights variable is after we are able to take into
account the variation in cash holdings within a country as well as across countries. Moreover, this
analysis allows us to subject the agency costs hypotheses to further tests.
Table 7 contains the major regression specifications. The unit of observations in these models
is the individual firm, but the number of observations changes across regressions because not all data
items are available for all companies. To avoid problems with outliers, we winsorize all variables at
their 99th percentile. In addition, we again adjust the standard errors to allow for heteroskedasticity.
The level of shareholder rights (going from 0 to 5) is employed as the explanatory variable in these
models, but our results are similar if we employ a dummy variable instead to separate countries with
high and low shareholder protection. We will present the results of robustness tests to illustrate this.
17
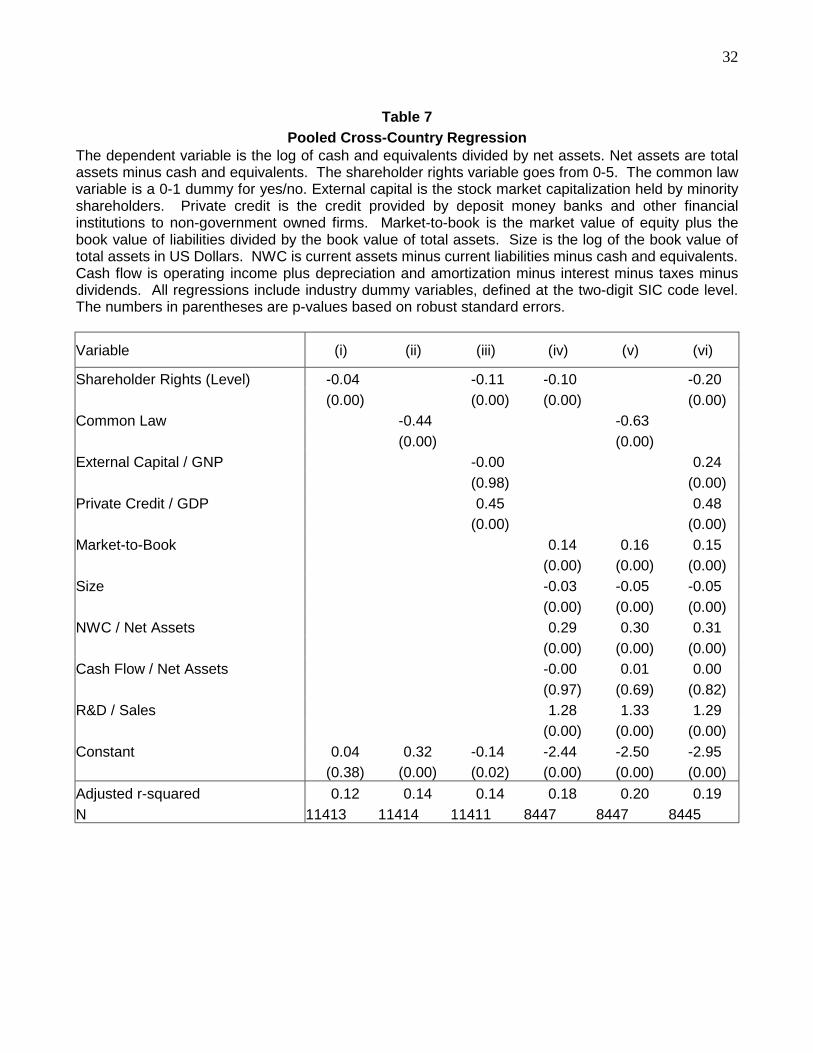
Model (i) of Table 7 contains the model with just shareholder rights and industry dummies as
the explanatory variables. The coefficient is negative and significant, which is consistent with the
country regressions. Increasing shareholder rights from 0 to 5 leads to a decrease in cash holdings of
18%. In column (ii), we include a common law dummy instead of shareholder rights. Unlike in the
country median regressions, the common law dummy is negative and significant in this specification.
The coefficient of –0.44 indicates that firms in common law countries hold 35% less cash than those in
civil law countries. Model (iii) includes measures of the development of the stock and debt markets to
make sure that the shareholder rights variable does not proxy for capital markets access. The
coefficient on the development of the debt market is actually positive, which is not consistent with the
capital markets access argument, but does support the agency cost explanation. Also note that the
impact of shareholder rights increases substantially after controlling for the size of capital markets.
The coefficient of –0.11 implies that an increase in shareholder rights from 0 to 5 leads to a decline in
cash holdings of 43%.
Models (iv) through (vi) of Table 7 repeat the previous analysis, but they include firm specific
characteristics, in addition to the industry dummies. If anything, the results are stronger after
controlling for firm-specific characteristics. The coefficient on shareholder rights increases from –0.04
in model (i) to –0.10 in model (iv) and from –0.11 in model (iii) to –0.20 in model (vi). Based on model
(vi), moving from 0 to 5 in the shareholder rights category reduces the level of cash and cash
equivalents by 62%. Also note that many of the control variables are significant and have the
expected sign. Thus, controlling for industry is not sufficient to capture the dispersion in the cash
ratios. Consistent with the country median regressions, we find that firms with higher market-to-book
ratios and higher levels of R&D expenses relative to sales have higher cash holdings, which supports
both the transactions costs and precautionary motives. We also find an important size effect at the
firm level: larger firms hold less cash. This effect did not appear in the cross-country regressions,
possibly because there is much more variation in size within each country than across countries.
Finally, the positive coefficient on the ratio of net working capital to assets suggests that cash holdings
18
and net working capital are complements. The other determinants of cash holdings are also important
economically. For instance, increasing firm size from its 25th percentile ($74 million) to its 75th
percentile ($889 million) reduces cash holdings by 12%, based on model (vi); increasing the market-
to-book ratio from its 25th percentile (0.95) to its 75th percentile (1.74), on the other hand, leads to an
increase in cash holdings of 12%.
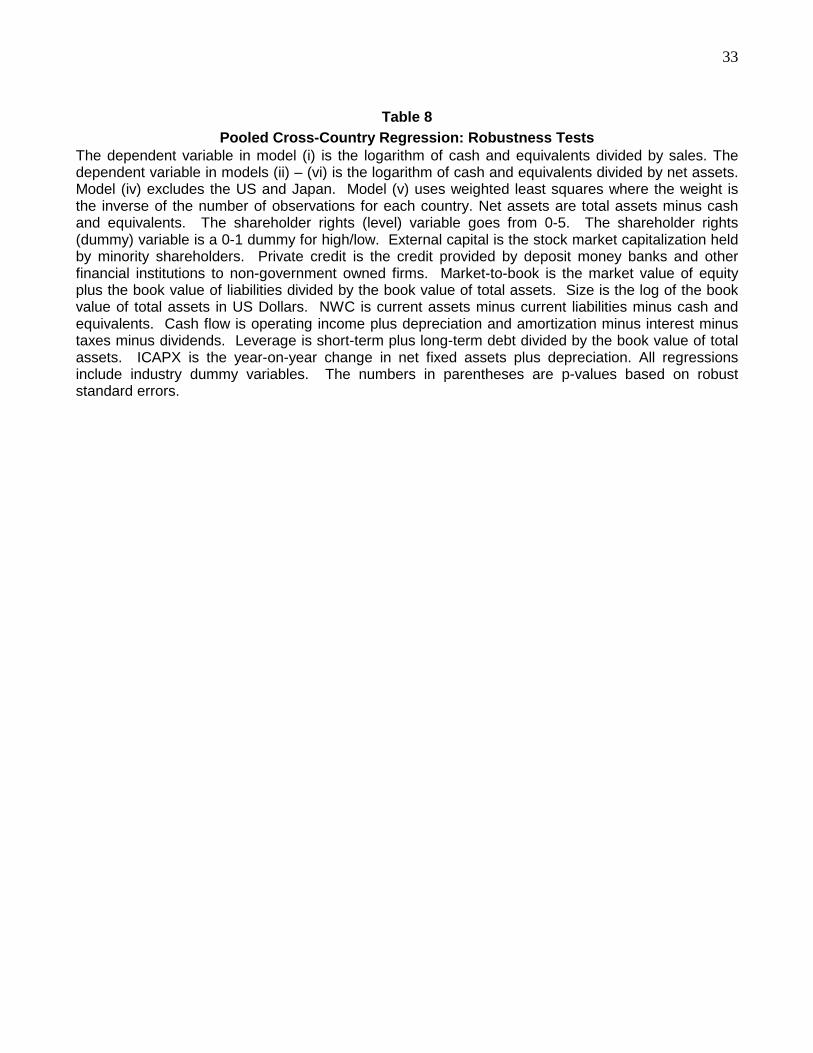
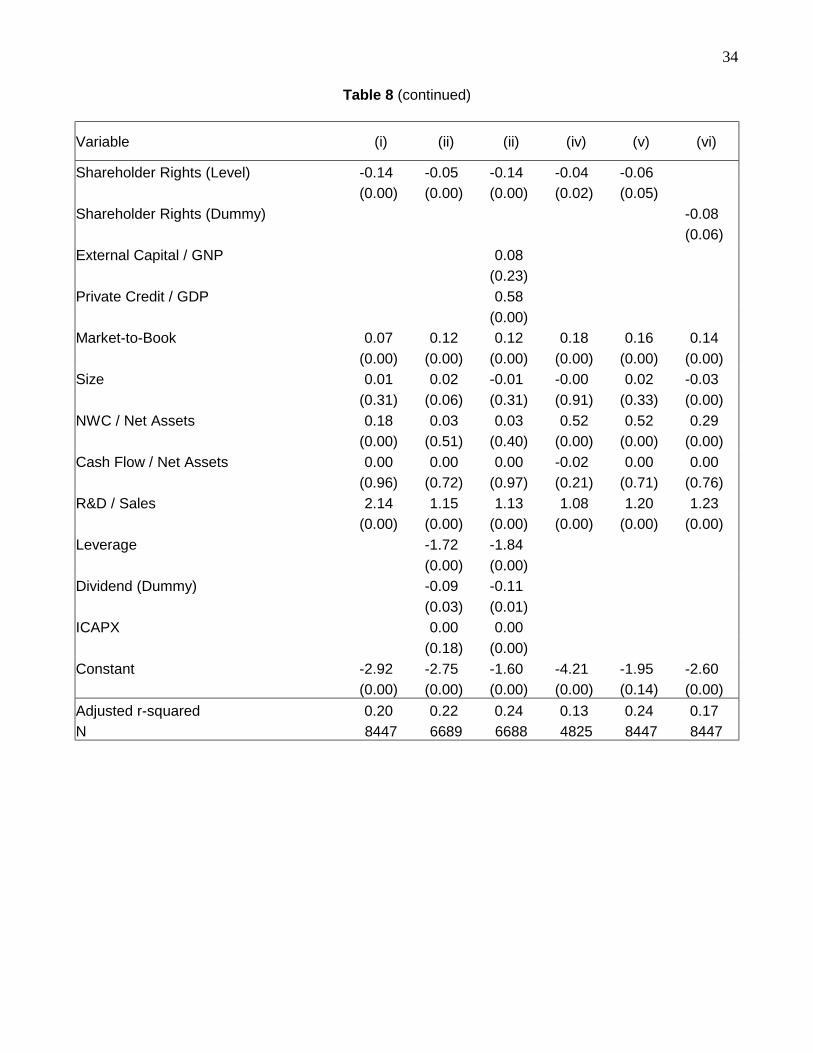
Table 8 reports the findings of a number of tests conducted to examine the robustness of these
findings. Model (i) employs the ratio of cash to sales as the dependent variable. Our inferences
remain unchanged. In model (ii), we include the variables excluded from the reduced form model:
leverage, a dividend dummy, and the level of capital expenditures, albeit that these variable are likely
to be endogenous. Nevertheless, even after controlling for these effects, we continue to find that firms
hold lower cash balances in countries where shareholders are not as well protected.3 In model (iii),
we also include measures of capital market development, without affecting the findings.
One concern about the firm-level regressions is that the results are caused by observations
from large countries. The regressions at the country level suggest that this is probably not the case,
but, nevertheless, we subject this concern to further scrutiny. In model (iv) of Table 8, we remove the
two countries with the largest number of observations in our sample: the U.S. and Japan. The impact
of shareholder rights continues to be significant in these models. In model (v), we estimate a
weighted least squares model, where the weight of each observation is the inverse of the number of
observations in each country, so that each country receives equal weight in the estimation. Again, our
findings persist. Finally, we include the shareholder rights dummy in model (vi) instead of the level,
with similar inferences.
In sum, the results of this subsection further strengthen our conclusion that agency problems
have an important impact on corporate cash holdings. In particular, after controlling for industry and
3 We also examine whether firms are indifferent between having one more dollar of cash or one less dollar of debt. The specification estimated in Table 8 employs the log of the cash ratio as the dependent variables, but the level of the leverage ratio as one of the explanatory variables, and is therefore not suited to examine this question. Using levels on both sides, we find the coefficient on leverage is always significantly larger than –1. Thus, the decision between holding cash and paying off debt is not a matter of indifference.
19
firm-specific characteristics, we continue to find that firms in countries with poor shareholder protection
have substantially higher cash holdings.
4.3. Interactions between firm characteristics and shareholder rights
In the previous analysis, we assumed that the impact of firm characteristics on cash holdings is
constant across countries. However, this does not need to be the case. In fact, the trade-off theory of
of the determinants of corporate liquidity has implications for the effects of these variables across
countries.
Let us first consider the transactions cost and precautionary motives. In our previous
discussion, we assumed that the cost of raising funds was constant, except for a size effect: large
corporations are assumed to be able to raise funds at a lower cost. The expected variation in liquidity
therefore comes from differences in the opportunity cost of lost investment. But, there are substantial
differences across countries in the costs of raising funds, as demonstrated by LLSV (1997). This
implies that firms should pay more attention to the opportunity cost variables in countries where
raising funds is more difficult. The agency cost hypothesis, on the other hand, suggests that the ease
of raising money may actually lead firms to hold more cash when they have the ability to do so. To
examine the validity of these arguments, we divide the countries into two groups according to the
median ratio of external capital to GNP (cut-off is 0.25) and also in two groups according to the
median ratio of private credit to GDP (cut-off is 0.645). We then create dummy variables equal to one
if a firm is in a country with well-developed equity / debt markets. These dummies are then interacted
with the two key variables used to capture opportunity costs and asymmetric information: the market-
to-book ratio and the ratio of R&D to sales.
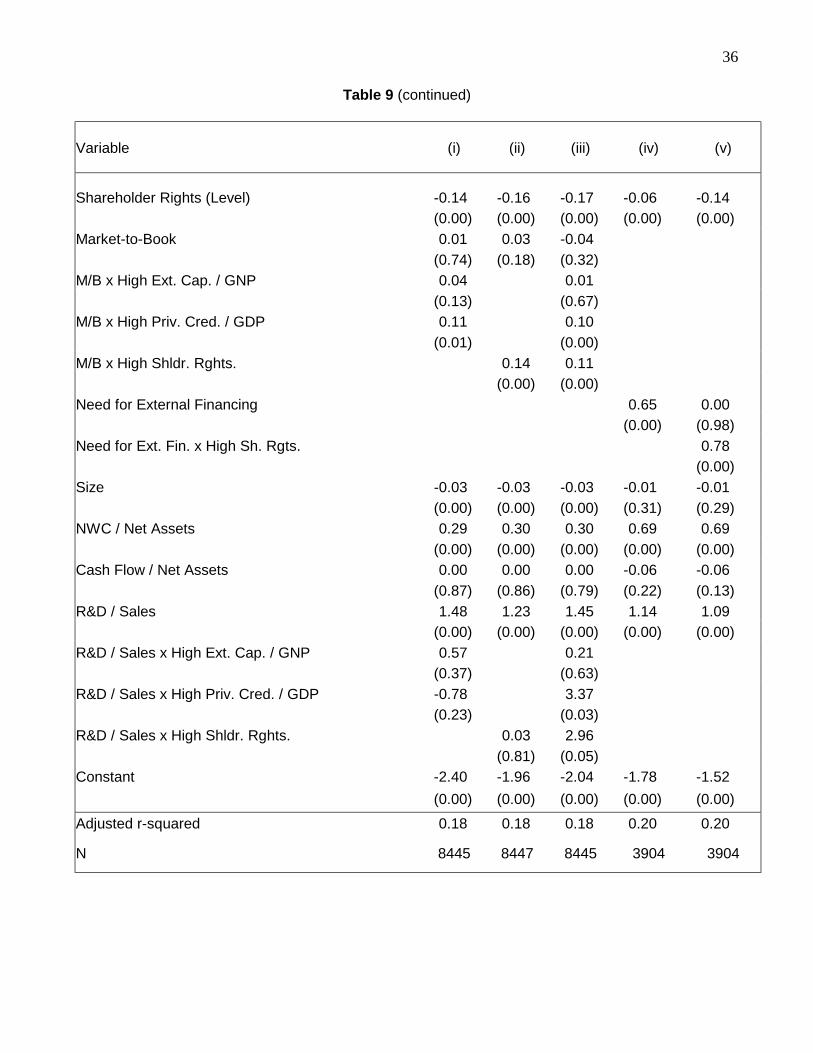
Column (i) of Table 9 contains the results of this enquiry. Note that we do not include capital
market size itself, because the prior discussion indicates that its importance should only be relevant to
the extent that if affects the magnitude of the other explanatory variables. The results are striking and
not fully consistent with the transactions cost or precautionary motives for cash holdings. The
20
coefficient on market-to-book itself is positive, but insignificant. The interactions with the large equity
market and debt market dummies are positive, and significant for the debt market interaction. This
result implies that the market-to-book ratio is more important in deciding how much cash to hold when
debt markets are larger, which is more consistent with an agency cost explanation: firms hold more
cash when they have the ability to raise more funds. The results on the R&D interactions are
insignificant. Thus, the cash holdings of more opaque firms are not affected by the size of the capital
market. Note that shareholder rights continue to have a significant negative on a firm’s holdings of
cash and equivalents.
In column (ii) of Table 9, we interact market-to-book and R&D with a high shareholder rights
dummy. The goal here is to determine whether, as predicted by the agency cost motive, managers
care more about the variables that affect cash holdings when shareholder rights are high. Our
evidence provides some support for this conjecture. The market-to-book ratio has no significant
impact on cash holdings in countries with low shareholder rights (the coefficient is 0.03, with a p-value
of 0.18), but its impact is significant in countries with high shareholder rights. Adding up the coefficient
on market-to-book and its interaction with the high shareholder rights dummy, we find a coefficient of
0.17, with a p-value of 0.00. To interpret this effect, moving from the 25th percentile of the market-to-
book ratio (0.95) to the 75th percentile (1.74), increases cash holdings by about 3% in countries with
low shareholder protection and by 14% in countries with high shareholder protection. Thus, managers
in countries where shareholder have few rights appear to take into account other factors when
considering how much cash to hold. Regarding R&D, we do not find that the impact of the R&D to
sales ratio on cash holdings depends on the level of shareholder protection.
To make sure that shareholder rights do not proxy for capital market development, model (iii)
combines the interactions of models (i) and (ii). The impact of shareholder rights on the effect of the
market-to-book ratio persists in this regression. In addition, the interaction between the R&D to sales
ratio and the shareholder rights dummy is also positive, which implies that opaqueness is a more
important determinant of cash holdings in countries with good shareholder protection. This finding
21
should be interpreted with caution, however, because the interaction between the credit market
dummy and R&D is negative and there is a high correlation between the credit market/R&D interaction
and the shareholder rights/R&D interaction.
The last two columns of Table 9 contain the results of our final test on the importance of
shareholder rights in different institutional settings. In previous tests, we included the market-to-book
ratio to capture investment opportunities. We now consider a more direct measure of the need for
external financing, which is a measure of an industry’s dependence on external financing developed
by Rajan and Zingales (1998). For their study of the impact of financial development on growth, Rajan
and Zingales (1998) compute such a measure using U.S. data, based on the view that capital markets
are relatively frictionless in the U.S. We employ this data items for two purposes. First, we examine
whether firms with greater financing needs hold more cash. One may argue that this variable better
captures the transactions cost motive than the market-to-book ratio since it focuses exclusively on
financing needs, and not investment opportunities. Second, we interact financing needs with our high
shareholder rights dummy to determine whether firms care more about financing needs when
shareholder rights are strong.
The regression in column (iv) of Table 9 contains the need variable but not the interaction; as
expected firms hold more liquid assets when they operate in industries with higher needs for external
financing. Note that we have fewer observations in this model because Rajan and Zingales (1998)
compute the need variable for manufacturing firms only. In column (v), we interact the need variable
with a high shareholder rights dummy. The need variable is no longer significant in this model; only
the interaction term is relevant. Thus, firms hold more cash when the need for external financing is
greater only in countries where shareholders enjoy good protection. This supports the agency costs
hypothesis: in countries where shareholders are not well protected, firms hold cash for other reasons,
in countries where they are well protected, firms care more about the transactions cost motive.
22
5. Conclusion
When managers decide how much cash to hold in the firm, do they care only about
shareholder wealth or about their personal well being as well? Our evidence indicates the latter:
agency problems are of primary importance in determining cash holdings. Using data on more than
11000 companies from 45 countries, we find significantly higher cash holdings in countries where
shareholders enjoy little protection. Moreover, the other determinants of cash holdings appear to be
less important in such countries. None of the evidence points to the fact that managers hold more
cash simply because it is more difficult to access capital markets in countries with poor shareholder
protection. If anything, firms hold more cash when it is easier to raise more funds, not less.
What we did not investigate in this paper are the consequences of having ‘excess cash’. The
evidence by Harford (1999) suggests that, even in the U.S., where shareholders are well protected,
managers with too much cash on their hands waste it on poor acquisitions. Opler, et al. (1999) find
less evidence that excess cash gets wasted, but this may be because this is less likely to happen in
the U.S. Nevertheless, they do find that firms with large amounts of excess cash appear to lose more
money in the future. Mikkelson and Partch (2002), on the other hand, find that the operating
performance of firms with large cash holdings does not differ from that of a size and industry matched
control sample. Again, we do not know whether this result would hold in an international context
where shareholders have fewer rights. Investigating the consequences of high cash holdings in an
international setting is therefore clearly an important area of future research.

23
References
Blanchard, O., Lopez-de-Silanes, F, and A. Shleifer, 1994. What Do Firms Do with Cash Windfalls? Journal of Financial Economics 36, 337-360.
Harford, J, 1999. Corporate Cash Reserves and Acquisitions. Journal of Finance 54, 1969-1997.
Kim, C., Mauer, D., and A. Sherman, 1998. The Determinants of Corporate Liquidity: Theory and Evidence. Journal of Financial and Quantitative Analysis 33, 335-359.
Lang, L., Stulz, R., and R. Walkling, 1991. A Test of the Free Cash Flow Hypothesis: The Case of Bidder Returns. Journal of Financial Economics 29, 315-335.
La Porta, R., Lopez-de-Salines, F., Shleifer, A., and R. Vishny, 1997. Legal Determinants of External Finance. Journal of Finance 52, 1131-1150.
La Porta, R., Lopez-de-Salines, F., Shleifer, A., and R. Vishny, 1998. Law and Finance. Journal of Political Economy 106, 1113-1155.
La Porta, R., Lopez-de-Salines, F., Shleifer, A., and R. Vishny, 2000. Agency Problems and Dividend Policies around the World. Journal of Finance 55, 1-33.
Levine, R., Loayza, N., and T. Beck, 2000. Financial Intermediation and Growth: Causality and Causes. Journal of Monetary Economics 46, 31-77.
Meltzer, A. 1993. The Demand for Money: A Cross-Section Study of Business Firms. Quarterly Journal of Economics 77, 405-422.
Mikkelson, W and M. Partch, 2002. Do Persistent Large Cash Reserves Hinder Performance?. Journal of Quantitative and Financial Analysis forthcoming.
Miller, M. and D. Orr, 1966. A Model of the Demand for Money by Firms. Quarterly Journal of Economics 80, 413-435.
Mulligan, C., 1997. Scale Economies, the Value of Time, and the Demand for Money: Longitudinal Evidence from Firms. Journal of Political Economy 105, 1061-1079.
Myers, S., and N. Majluf, 1984. Corporate Financing and Investment Decisions When Firms Have Information That Investors Do Not Have. Journal of Financial Economics 13, 187-221.
Opler, T., Pinkowitz, L., Stulz, R., and R. Williamson, 1999. The Determinants and Implications of Corporate Cash Holdings. Journal of Financial Economics 52, 3-46.
Pinkowitz, L. and R. Williamson, 2001. Bank Power and Cash Holdings: Evidence from Japan. Review of Financial Studies 14, 1059-1082.
Rajan, R. and L. Zingales, 1995. What Do We Know about Capital Structure? Some Evidence from International Data. Journal of Finance 50, 1421-1460.
Rajan, R. and L. Zingales, 1998. Financial Dependence and Growth. American Economic Review 88, 559-586.
24
Table 1 Summary Statistics
All numbers except for # of firms are country medians. Net assets are total assets minus cash and equivalents. Firm size is the book value of total assets in US Dollars. Market-to-book is the market value of equity plus the book value of liabilities divided by the book value of total assets. Book leverage is short-term plus long-term debt divided by the book value of total assets. Net Work. Cap. is current assets minus current liabilities minus cash and equivalents. Cash flow is operating income plus depreciation and amortization minus interest minus taxes minus dividends. ICAPX is the year-on-year change in net fixed assets plus depreciation.
Country # of firms
Cash & Equivalents / Net Assets
Firm Size
Market-to-Book
Book Leverage
Net Work. Cap. / Net Assets
Cash Flow /Net Assets
ICAPX / Net Assets
High Shareholder Rights Argentina 24 1.7% 828 0.99 35.8% 2.0% 7.1% 7.0% Australia 324 5.7% 130 1.19 19.8% 2.6% 2.3% 5.8% Brazil 131 7.3% 594 NA 28.6% 1.4% 0.2% 4.9% Canada 471 4.5% 220 1.20 26.0% 5.2% 5.8% 9.2% Chile 87 3.1% 261 0.92 22.9% 4.7% 6.6% 8.4% Colombia 13 1.5% 416 0.66 13.7% 3.6% 1.0% 12.8% Spain 110 5.3% 388 1.46 17.0% 8.1% 7.7% 6.2% Finland 95 7.6% 268 1.11 21.9% 13.3% 8.2% 6.3% France 535 11.1% 116 1.22 19.9% 13.8% 8.5% 5.3% United Kingdom 1164 8.1% 117 1.39 16.9% 3.0% 6.4% 6.5% Hong Kong 133 13.1% 192 0.82 18.9% 1.2% -0.7% 0.7% India 8 3.4% 107 1.16 19.3% 13.1% 6.3% 5.2% Ireland 59 7.9% 133 1.45 21.8% -3.1% 5.9% 8.2% Israel 37 20.9% 214 1.17 18.3% 12.2% 5.8% 6.3% Japan 1853 15.5% 476 1.02 29.8% 1.1% 3.8% 3.2% Kenya 1 0.3% 45 1.13 12.0% -2.6% 5.3% 9.6% Malaysia 379 6.3% 101 0.99 28.7% 6.3% 1.9% 2.9% Norway 127 12.7% 140 1.04 24.0% 6.5% 6.5% 10.0% New Zealand 67 1.7% 117 1.07 28.8% 3.9% 4.2% 5.3% Pakistan 30 5.3% 72 0.89 37.2% 5.7% 6.7% 5.7% Peru 15 3.1% 224 0.57 21.2% 4.0% 9.2% 10.8% Philippines 75 4.9% 146 0.81 27.1% -2.0% 2.0% 7.5% Portugal 43 3.6% 286 1.12 24.2% 2.4% 7.3% 10.3% Singapore 247 10.2% 116 0.93 24.2% 6.6% 3.6% 3.6% Sweden 222 9.4% 109 1.21 19.1% 16.3% 6.9% 7.3% Taiwan 95 11.6% 656 1.43 29.3% 1.5% 3.1% 8.1% United States 3429 6.4% 319 1.51 23.6% 11.3% 7.1% 7.2% South Africa 98 8.6% 494 1.21 10.2% 4.8% 7.4% 9.7% Zimbabwe 5 2.9% 134 0.93 21.0% -4.5% 7.4% 13.3% Median 95 6.3% 192 1.11 21.9% 4.0% 6.3% 7.0%
25
Table 1 (continued)
Country # of
firms Cash &
Equivalents / Net Assets
Firm Size
Market-to-Book
Book Leverage
Net Work. Cap. / Net Assets
Cash Flow /Net Assets
ICAPX / Net Assets
Low Shareholder Rights Austria 73 8.4% 217 1.12 26.3% 11.5% 6.2% 7.5% Belgium 81 10.3% 215 1.42 25.0% 12.0% 8.4% 5.1% Switzerland 166 11.4% 311 1.17 24.4% 12.7% 7.9% 4.6% Germany 449 7.3% 212 1.25 16.8% 18.4% 7.8% 6.8% Denmark 118 12.7% 160 1.07 23.4% 15.2% 7.2% 7.1% Egypt 6 29.6% 284 2.11 17.5% -6.6% 0.1% 19.8% Greece 55 5.0% 153 1.94 22.1% 22.0% 8.1% 8.1% Indonesia 112 10.3% 206 1.03 64.0% -8.1% 4.8% 7.8% Italy 151 8.8% 444 1.14 21.2% 17.0% 5.8% 4.0% Jordan 1 2.8% 256 1.51 27.8% 1.7% 11.8% NA South Korea 8 8.9% 746 0.95 36.6% -7.2% 3.2% 17.9% Mexico 77 5.6% 1164 0.85 29.6% 4.8% 6.7% 15.8% Netherlands 186 5.0% 217 1.43 18.5% 11.8% 9.2% 6.9% Thailand 189 3.8% 94 0.92 46.0% -7.5% 1.6% 2.8% Turkey 34 13.4% 173 1.32 18.5% 11.6% 4.3% 20.3% Venezuela 9 6.6% 523 0.47 17.1% 3.1% 5.1% 9.8% Median 79 8.6% 217 1.15 23.9% 11.6% 6.4% 7.5% Overall Median 95 6.6% 214 1.12 22.1% 4.7% 6.3% 7.0%
26
Table 2
Regression of Country Medians All variables are country medians. The dependent variable is the log of cash and equivalents divided by net assets. Net assets are total assets minus cash and equivalents. The shareholder rights variable is a 0-1 dummy for high/low. The common law variable is a 0-1 dummy for yes/no. External capital is the stock market capitalization held by minority shareholders. Private credit is the credit provided by deposit money banks and other financial institutions to non-government owned firms. Market-to-book is the market value of equity plus the book value of liabilities divided by the book value of total assets. Size is the log of the book value of total assets in US Dollars. NWC is current assets minus current liabilities minus cash and equivalents. Cash flow is operating income plus depreciation and amortization minus interest expenses minus taxes minus dividends. The numbers in parentheses are p-values based on robust standard errors.
Variable (i) (ii) (iii) (iv) (v) (vi)
Shareholder Rights (Dummy) -0.41 -0.43 -0.30 -0.47 (0.07) (0.06) (0.11) (0.07) Common Law -0.33 -0.30 (0.24) (0.20) External Capital / GNP 0.17 0.27 (0.50) (0.37) Private Credit / GDP 0.32 0.25 (0.10) (0.31) Market-to-Book 0.65 0.74 0.64 (0.05) (0.03) (0.07) Size 0.25 0.20 -0.04 (0.34) (0.47) (0.83) NWC / Net Assets 3.01 2.80 0.30 (0.14) (0.17) (0.85) Cash Flow / Net Assets -11.01 -11.67 -4.19 (0.03) (0.03) (0.39) R&D / Sales 32.81 35.19 39.78 (0.00) (0.00) (0.00) Constant -2.53 -2.67 -2.74 -4.29 -4.13 -3.07 (0.00) (0.00) (0.00) (0.01) (0.01) (0.01) Adj. R-squared 0.04 0.02 0.12 0.20 0.19 0.28 N 45 45 43 44 44 42
27
Table 3
Excess Cash Levels Excess cash based on U.S. Industry equivalent is computed by subtracting the median cash level of firms in the U.S. in the same two-digit SIC code industry. Excess cash based on regression on U.S. data is cash and equivalents divided by net assets minus the predicted value from the US cash regression of model (i) in table 4. Net assets are total assets minus cash and equivalents. Country Excess Cash Based
on US Industry equivalent
Excess Cash Based on Regression on US data
High shareholder rights Argentina -0.92% 0.41% Australia 0.32% 0.17% Brazil 1.85% NA Canada -0.71% -1.16% Chile -0.55% -0.70% Colombia -0.43% -0.73% Spain 1.11% 0.88% Finland 2.66% 2.70% France 3.15% 4.77% United Kingdom 1.19% 1.35% Hong Kong 5.86% 7.84% India -16.66% -1.38% Ireland 3.58% 5.14% Israel 12.87% 13.99% Japan 8.61% 11.31% Kenya -3.41% -4.23% Malaysia 1.58% 0.89% Norway 5.65% 6.80% New Zealand -1.08% -1.74% Pakistan -0.22% 1.12% Peru 0.51% 0.15% Philippines 0.58% 0.17% Portugal -1.06% -0.77% Singapore 3.39% 4.91% Sweden 1.33% 2.63% Taiwan 3.36% 6.17% South Africa 3.08% 4.55% Zimbabwe 0.46% 31.43%
Median 1.15% 1.12%
28
Table 3 (continued)
Country Excess Cash Based
on US Industry equivalent
Excess Cash Based on Regression on US data
Low shareholder rights Austria 2.84% 3.70% Belgium 3.09% 4.98% Switzerland 3.81% 5.88% Germany 0.43% 1.59% Denmark 5.44% 5.41% Egypt 26.80% 28.02% Greece 0.52% -0.09% Indonesia 6.50% 7.81% Italy 3.52% 6.00% Jordan 0.02% 0.26% South Korea 1.27% 6.61% Mexico 1.68% 2.39% Netherlands -0.05% -0.19% Thailand -0.15% 0.06% Turkey 7.40% 12.58% Venezuela 4.35% 3.68% Median 2.96% 4.34% Overall Median 1.58% 2.63%
29
Table 4
US Cash Regression The dependent variable is the log of cash and equivalents divided by net assets. Net assets are total assets minus cash and equivalents. Market-to-book is the market value of equity plus the book value of liabilities divided by the book value of total assets. Size is the log of the book value of total assets in US Dollars. Cash flow is operating income plus depreciation and amortization minus interest expenses minus taxes minus dividends. NWC is current assets minus current liabilities minus cash and equivalents. Leverage is short-term plus long-term debt divided by the book value of total assets. ICAPX is the year-on-year change in net fixed assets plus depreciation. All regressions include industry dummy variables defined at the two-digit SIC code level. Numbers in parentheses are p-values based on robust standard errors.
Variable (i) (ii)
Market-to-Book 0.22 0.18 (0.00) (0.00) Size -0.18 -0.13 (0.00) (0.00) Cash Flow / Net Assets 0.17 0.09 (0.13) (0.15) NWC / Net Assets 0.27 0.04 (0.02) (0.49) R&D / Sales 1.34 0.97 (0.00) (0.00) Leverage -2.39 (0.00) Dividend (Dummy) -0.47 (0.00) ICAPX -0.06 (0.00) Constant -1.10 -2.62 (0.00) (0.00) Adjusted r-squared 0.35 0.48 N 2553 1535
30
Table 5
Country Excess Cash Median Regression Model All variables are country medians. The dependent variable in models (i) – (iii) is the log of cash and equivalents divided by net assets minus the US industry average, defined at the two-digit SIC code level. The dependent variable in models (iv) – (vi) is the log of cash and equivalents minus the predicted value from the US cash regression of model (i) in table 4. Net assets are total assets minus cash and equivalents. The shareholder rights variable is a 0-1 dummy for high/low. The common law variable is a 0-1 dummy for yes/no. External capital is the stock market capitalization held by minority shareholders. Private credit is the credit provided by deposit money banks and other financial institutions to non-government owned firms. The numbers in parentheses are p-values based on robust standard errors.
Variable (i) (ii) (iii) (iv) (v) (vi)
Shareholder Rights (Dummy) -0.46 -0.42 -0.53 -0.47 (0.02) (0.05) (0.03) (0.07) Common Law -0.40 -0.43 (0.13) (0.15) External Capital / GNP 0.08 0.00 (0.74) (0.99) Private Credit / GDP 0.11 0.20 (0.64) (0.44) Constant 0.54 0.38 0.47 0.82 0.64 0.71 (0.00) (0.00) (0.04) (0.00) (0.00) (0.01) Adjusted r-squared 0.08 0.05 0.06 0.08 0.04 0.07
N 44 44 42 43 43 41

31
Table 6
Robustness Checks of Country Medians Regression The dependent variable in model (i) is the log of cash and equivalents divided by net assets. The dependent variable in model (ii) is the log of cash and equivalents divided by net assets minus the predicted value from the US cash regression of model (i) in table 4. The dependent variable in model (iii) is the log of cash and equivalents divided by sales. The dependent variable in model (iv) is the log of cash and equivalents divided by sales minus the predicted value from a US cash regression identical to that of model (i) in table 4, but with the log of cash and equivalents divided by sales as the dependent variable. Net assets are total assets minus cash and equivalents. The shareholder rights (dummy) variable is a 0-1 dummy for high/low. The shareholder rights (level) variable goes from 0-5. External capital is the stock market capitalization held by minority shareholders. Private credit is the credit provided by deposit money banks and other financial institutions to non-government owned firms. Market-to-book is the market value of equity plus the book value of liabilities divided by the book value of total assets. Size is the log of the book value of total assets in US Dollars. NWC is current assets minus current liabilities minus cash and equivalents. Cash flow is operating income plus depreciation and amortization minus interest minus taxes minus dividends. Numbers in parentheses are p-values based on robust standard errors. Variable
Log (cash/ assets)
(i)
Excess Log(cash/
assets) (ii)
Log(cash/ sales)
(iii)
Excess Log(cash/
sales) (iv)
Shareholder Rights (Dummy) -0.33 -0.48 (0.12) (0.07) Shareholder Rights (Level) -0.16 -0.15 (0.05) (0.06) External Capital / GNP 0.30 0.02 0.27 0.34 (0.37) (0.96) (0.32) (0.26) Private credit / GDP 0.27 0.24 -0.02 -0.20 (0.25) (0.35) (0.90) (0.50) Market-to-Book 0.760 0.520 (0.04) (0.07) Size -0.05 0.05 (0.76) (0.71) NWC / Net Assets 0.27 -1.48 (0.87) (0.28) Cash Flow / Net Assets -4.83 -7.61 (0.36) (0.12) R&D / Sales 34.78 46.89 (0.00) (0.00) Constant -2.93 0.84 -2.79 1.27 (0.01) (0.01) (0.00) (0.00) Adjusted r-squared 0.25 0.04 0.32 0.02
N 42 41 42 41
32
Table 7
Pooled Cross-Country Regression The dependent variable is the log of cash and equivalents divided by net assets. Net assets are total assets minus cash and equivalents. The shareholder rights variable goes from 0-5. The common law variable is a 0-1 dummy for yes/no. External capital is the stock market capitalization held by minority shareholders. Private credit is the credit provided by deposit money banks and other financial institutions to non-government owned firms. Market-to-book is the market value of equity plus the book value of liabilities divided by the book value of total assets. Size is the log of the book value of total assets in US Dollars. NWC is current assets minus current liabilities minus cash and equivalents. Cash flow is operating income plus depreciation and amortization minus interest minus taxes minus dividends. All regressions include industry dummy variables, defined at the two-digit SIC code level. The numbers in parentheses are p-values based on robust standard errors.
Variable (i) (ii) (iii) (iv) (v) (vi)
Shareholder Rights (Level) -0.04 -0.11 -0.10 -0.20 (0.00) (0.00) (0.00) (0.00) Common Law -0.44 -0.63 (0.00) (0.00) External Capital / GNP -0.00 0.24 (0.98) (0.00) Private Credit / GDP 0.45 0.48 (0.00) (0.00) Market-to-Book 0.14 0.16 0.15 (0.00) (0.00) (0.00) Size -0.03 -0.05 -0.05 (0.00) (0.00) (0.00) NWC / Net Assets 0.29 0.30 0.31 (0.00) (0.00) (0.00) Cash Flow / Net Assets -0.00 0.01 0.00 (0.97) (0.69) (0.82) R&D / Sales 1.28 1.33 1.29 (0.00) (0.00) (0.00) Constant 0.04 0.32 -0.14 -2.44 -2.50 -2.95 (0.38) (0.00) (0.02) (0.00) (0.00) (0.00) Adjusted r-squared 0.12 0.14 0.14 0.18 0.20 0.19 N 11413 11414 11411 8447 8447 8445
33
Table 8
Pooled Cross-Country Regression: Robustness Tests The dependent variable in model (i) is the logarithm of cash and equivalents divided by sales. The dependent variable in models (ii) – (vi) is the logarithm of cash and equivalents divided by net assets. Model (iv) excludes the US and Japan. Model (v) uses weighted least squares where the weight is the inverse of the number of observations for each country. Net assets are total assets minus cash and equivalents. The shareholder rights (level) variable goes from 0-5. The shareholder rights (dummy) variable is a 0-1 dummy for high/low. External capital is the stock market capitalization held by minority shareholders. Private credit is the credit provided by deposit money banks and other financial institutions to non-government owned firms. Market-to-book is the market value of equity plus the book value of liabilities divided by the book value of total assets. Size is the log of the book value of total assets in US Dollars. NWC is current assets minus current liabilities minus cash and equivalents. Cash flow is operating income plus depreciation and amortization minus interest minus taxes minus dividends. Leverage is short-term plus long-term debt divided by the book value of total assets. ICAPX is the year-on-year change in net fixed assets plus depreciation. All regressions include industry dummy variables. The numbers in parentheses are p-values based on robust standard errors.
34
Table 8 (continued)
Variable (i) (ii) (ii) (iv) (v) (vi)
Shareholder Rights (Level) -0.14 -0.05 -0.14 -0.04 -0.06 (0.00) (0.00) (0.00) (0.02) (0.05) Shareholder Rights (Dummy) -0.08 (0.06) External Capital / GNP 0.08 (0.23) Private Credit / GDP 0.58 (0.00) Market-to-Book 0.07 0.12 0.12 0.18 0.16 0.14 (0.00) (0.00) (0.00) (0.00) (0.00) (0.00) Size 0.01 0.02 -0.01 -0.00 0.02 -0.03 (0.31) (0.06) (0.31) (0.91) (0.33) (0.00) NWC / Net Assets 0.18 0.03 0.03 0.52 0.52 0.29 (0.00) (0.51) (0.40) (0.00) (0.00) (0.00) Cash Flow / Net Assets 0.00 0.00 0.00 -0.02 0.00 0.00 (0.96) (0.72) (0.97) (0.21) (0.71) (0.76) R&D / Sales 2.14 1.15 1.13 1.08 1.20 1.23 (0.00) (0.00) (0.00) (0.00) (0.00) (0.00) Leverage -1.72 -1.84 (0.00) (0.00) Dividend (Dummy) -0.09 -0.11 (0.03) (0.01) ICAPX 0.00 0.00 (0.18) (0.00) Constant -2.92 -2.75 -1.60 -4.21 -1.95 -2.60 (0.00) (0.00) (0.00) (0.00) (0.14) (0.00) Adjusted r-squared 0.20 0.22 0.24 0.13 0.24 0.17 N 8447 6689 6688 4825 8447 8447

35
Table 9
Pooled Cross-Country Regression: Interactions The dependent variable is the logarithm of cash and equivalents divided by net assets. Net assets are total assets minus cash and equivalents. All variables and interaction terms preceded by “High” are 0-1 dummies (high means above the median). The shareholder rights variable goes from 0-5. Market-to-book is the market value of equity plus the book value of liabilities divided by the book value of total assets. External capital is the stock market capitalization held by minority shareholders. Private credit is the credit provided by deposit money banks and other financial institutions to non-government owned firms. Need for External Financing is the US industry median level of the fraction of capital expenditures not financed with cash flow from operations from 1980 – 1990 from Rajan and Zingales (1998). Size is the log of the book value of total assets in US Dollars. NWC is current assets minus current liabilities minus cash and equivalents. Cash flow is operating income plus depreciation and amortization minus interest minus taxes minus dividends. All regressions include industry dummy variables, defined at the two-digit SIC code level. The numbers in parentheses are p-values based on robust standard errors.
36
Table 9 (continued)
Variable (i) (ii) (iii) (iv) (v)
Shareholder Rights (Level) -0.14 -0.16 -0.17 -0.06 -0.14 (0.00) (0.00) (0.00) (0.00) (0.00) Market-to-Book 0.01 0.03 -0.04 (0.74) (0.18) (0.32) M/B x High Ext. Cap. / GNP 0.04 0.01 (0.13) (0.67) M/B x High Priv. Cred. / GDP 0.11 0.10 (0.01) (0.00) M/B x High Shldr. Rghts. 0.14 0.11 (0.00) (0.00) Need for External Financing 0.65 0.00 (0.00) (0.98) Need for Ext. Fin. x High Sh. Rgts. 0.78 (0.00) Size -0.03 -0.03 -0.03 -0.01 -0.01 (0.00) (0.00) (0.00) (0.31) (0.29) NWC / Net Assets 0.29 0.30 0.30 0.69 0.69 (0.00) (0.00) (0.00) (0.00) (0.00) Cash Flow / Net Assets 0.00 0.00 0.00 -0.06 -0.06 (0.87) (0.86) (0.79) (0.22) (0.13) R&D / Sales 1.48 1.23 1.45 1.14 1.09 (0.00) (0.00) (0.00) (0.00) (0.00) R&D / Sales x High Ext. Cap. / GNP 0.57 0.21 (0.37) (0.63) R&D / Sales x High Priv. Cred. / GDP -0.78 3.37 (0.23) (0.03) R&D / Sales x High Shldr. Rghts. 0.03 2.96 (0.81) (0.05) Constant -2.40 -1.96 -2.04 -1.78 -1.52 (0.00) (0.00) (0.00) (0.00) (0.00) Adjusted r-squared 0.18 0.18 0.18 0.20 0.20
N 8445 8447 8445 3904 3904