Operational Success Key Indicators (CalMetrics) - Human
163
OPERATIONAL SUCCESS KEY INDICATORS BY THE CALMETRICS TEAM LEADERSHIP DEVELOPMENT PROGRAM MAY 2012
Transcript of Operational Success Key Indicators (CalMetrics) - Human

OPERATIONAL SUCCESS KEY INDICATORS
BY THE CALMETRICS TEAM
LEADERSHIP DEVELOPMENT PROGRAM MAY 2012

Table of Contents Executive Summary .......................................................................................................................................... 2 Project Sponsors and Team ........................................................................................................................... 4 Acknowledgements .......................................................................................................................................... 5 Introduction ....................................................................................................................................................... 6
Background and Purpose ......................................................................................................................... 6 Scope and Deliverables ............................................................................................................................. 6 Stakeholders and Vision ........................................................................................................................... 7 Definition of Metrics ................................................................................................................................. 7
Research Findings ............................................................................................................................................. 9 Literature Review ...................................................................................................................................... 9 Best Practices ............................................................................................................................................12 Change Facilitation ...................................................................................................................................24 Incentives and Reinforcement ...............................................................................................................27 Web Research of Campus Departments ...........................................................................................28 Challenges and Current Climate ..........................................................................................................29
Data Collection .............................................................................................................................................. 31 Campus Perception Survey ....................................................................................................................31 Interviews ..................................................................................................................................................34 Focus Group .............................................................................................................................................36
Recommendations/Conclusion ................................................................................................................... 39 Afterword ........................................................................................................................................................ 42 APPENDIX A: Project Charter ..................................................................................................................... i APPENDIX B: Toolkit .................................................................................................................................... ii APPENDIX C: Implementation Plan .......................................................................................................... iii APPENDIX D: Survey ................................................................................................................................... iv APPENDIX E: Metric Project Examples ..................................................................................................... v APPENDIX F: e-Learn Metrics Resources................................................................................................ vi APPENDIX G: Glossary ............................................................................................................................... vii APPENDIX H: References.......................................................................................................................... viii
OSKI: Operational Success Key Indicators | 2
Executive Summary The University of California, Berkeley is undergoing a period of intense transformation as the campus strives to improve efficiency, in part through the High Performance Culture (HPC) initiative of the Operational Excellence (OE) effort. The HPC initiative envisions the campus as a place for all of us to do our best work with recommendations for supporting this vision. One recommendation centers on the usage of metrics for measuring outcomes and this area was the focus for our project team, CalMetrics. The CalMetrics team of the Leadership Development Program (LDP) is sponsored by Richard Lyons, dean of the Haas School of Business, and Jeannine Raymond, assistant vice chancellor for human resources. Team members include: Rebecca Andersen, Jean Franco, Elizabeth Geno, Melanie Green, Yu-Tin Kuo, Layla Naranjo, Cheryl Olson, Rachel Richardson, and Daniel Roddick. Our charge was to explore the facets of a campus wide adoption of metrics to deliver the foundational best practices, recommendations on implementation, and the tools to facilitate adoption. We used five main research methods to gather information: focus groups, Internet research, interviews, literature review, and surveys. These methods allowed our team to gain a variety of perspectives and to utilize this knowledge in the development of our deliverables. For the purpose of this project, we define operational metrics as a fair, simple, transparent measure of a unit’s ability to accomplish its goals. Researching outside institutions for tools and metrics yielded few results as most findings were either too small or too big and complex, such as the methodologies promoted by the United Nations Development Programme (UNDP) and the U.S. Agency for International Development (USAID). However, research on best practices yielded five exemplary institutions. Their practices support the goals of UC Berkeley’s mission and can be described in five simple words: values, stewardship, goals, communication, and logic.
• Values – Zappos is committed to achieving the company’s 10 core values and has incorporated metrics into the company culture. The values were developed with participation from nearly all employees.
• Stewardship – Cornell University has maintained a commitment to staff and organizational stewardship since 2000, increasing effective collaboration and ongoing innovation.
• Goals – Purdue University is exemplary in their usage and promotion of the institution’s shared goals. Units develop their own goals, which roll up to higher level goals, allowing every staff to know how their contribution affects the larger mission.

OSKI: Operational Success Key Indicators | 3
• Communication – The University of Washington launched the Two Years to Two Decades (2y2d) initiative and utilizes communication across multiple fronts.
• Logic – The non-profit Institute on Governance provides a simplified version of the logical model for developing a performance measurement framework.
On the UC Berkeley campus, our research of the current climate and perceptions amongst staff and faculty highlighted three common concerns about the corporate implications of metrics, the actual usage and outcomes, and the levels of stewardship provided throughout the process. We strongly believe that leveraging staff stewardship will be a critical factor in addressing these concerns. In interviews, focus groups, and campus surveys, respondents were clear in expressing the need for an inclusive process from the inception and design of a metric through continued delivery and reassessment. The development and continuous improvement of core metrics across UC Berkeley is potentially instrumental in establishing a high performance culture. To this end, we created the standalone toolkit and implementation plan included in the appendices. Core metrics can be implemented as a standard across campus over time. Tailored metrics applicable to specific units can be developed unit by unit. The toolkit in the appendix can be extracted on its own to facilitate the process for any manager.

OSKI: Operational Success Key Indicators | 4
Project Sponsors and Team Project Sponsors: Richard Lyons, Dean, Haas School of Business Jeannine Raymond, Assistant Vice Chancellor of Human Resources Functional Sponsor: Stephanie Metz, Financial Analyst, Operational Excellence Program Office Process Consultant: James Dudek, Strategic Initiatives Manager, Student Affairs Information Technologies CalMetrics Team: Rebecca Andersen, Environmental Specialist, Office of Environment, Health & Safety Jean Franco, Staff Psychologist, Counseling and Psychological Services Elizabeth Geno, Director of Administration, Graduate School of Journalism Melanie Green, Graduate Student Affairs Officer, School of Social Welfare Yu-Tin Kuo, Solutions Architect, Campus Technology Services Layla Naranjo, Assistant Director, Incentive Awards Program Cheryl Olson, Executive Assistant, Audit and Advisory Services Rachel Richardson, Research Analyst, Haas School of Business Daniel Roddick, Director of Financial Aid, Haas School of Business

OSKI: Operational Success Key Indicators | 5
Acknowledgements The CalMetrics Team would like to thank the following for their invaluable assistance: Interviewees: Kiarash Afcari, Change Management Consultant, High Performance Culture Inez Bailey, Change Management Consultant, Center for Organizational & Workforce Effectiveness (COrWE) Yau-Man Chan, Chief Technology Officer, College of Chemistry Louise Davidson, Senior Country Officer for Equatorial Guinea, World Bank Anna Ewins, Consultant Richard Mathies, Dean, College of Chemistry Beata Najman, Team Supervisor, Extramural Funds Accounting Lyle Nevels, Interim Associate Vice Chancellor and Chief Information Officer Susan Roach, Director of Business Operations, Student Life and Admissions and Enrollment Business Operations Darrylyn Swift, Director, Service Quality and Organizational Effectiveness, Campus Shared Services ImplementationTeam High Performance Culture Initiative Team Metrics Subgroup: Deborah Nolan, Professor, Department of Statistics Judith Sykes, Manager, Department of Mechanical Engineering CalPlanning Subgroup: Kristin Rose, Change Management Lead Leadership Development Program: Inette Dishler, Strategic Professional Development Specialist, COrWE Kathy Mendonca, Principal Learning Specialist, COrWe Our Supervisors: Claytie Davis III, Director of Training, University Health Services Stephanie Fujii, Executive Director of Full-Time MBA Admissions, Haas School of Business Robert Gunnison, Director of School Affairs, Graduate School of Journalism Greg Haet, Associate Director, Office of Environment, Health & Safety Linda Rico, Associate Director, Incentive Awards Program Wanda Lyn Riley, Chief Audit Executive, Audit and Advisory Services Jennifer Sang, Director of Cross-Program Initiatives, Haas School of Business Robert Teague, Academic Coordinator, School of Social Welfare Tom Tsai, Manager, Campus Technology Services

OSKI: Operational Success Key Indicators | 6
Introduction Background and Purpose
The University of California, Berkeley is a premier institution of higher education, research, and public service. UC Berkeley consistently ranks among the best educational institutions in the world. Part of its excellence lies in its ability to sustain itself over time; through changes, monetary constraints and an array of other variables. Most recently, one of the methods UC Berkeley has used to maintain its excellence is the Operational Excellence (OE) initiative begun in 2009. In an effort to move towards operational excellence, the campus developed an initiative team to focus on High Performance Culture (HPC). The goals of the HPC initiative were to create a place where all of us can do our best work within an operating culture of accountability, agility, and rewards. This was done in an effort to establish a purpose-driven organization. In short, the goal was for the University to collectively come together and set priorities for how best to move forward and cultivate a culture of continuous improvement. Toward that end, the HPC initiative identified the need for a means to measure how effectively the campus operates. Through recent budget cuts and restructuring of units and staff changes, it has been seen that there is a need for infrastructure to evaluate these decisions and ensure they lead to success. Scope and Deliverables The Leadership Development Program (LDP) is a program for staff development through the Center for Organizational and Workforce Effectiveness (COrWE). Each cohort in LDP is organized into teams tasked with completing real projects on campus. The scope of this project is to develop a metrics toolkit and implementation plan. The metrics toolkit is designed to assist managers in developing service delivery metrics at the unit or department level. The implementation plan is a set of recommendations to the Campus Metrics Coordinator on how to move the campus toward the adoption and practice of metrics use. These items will include research and assessment of existing metrics within the university and outside the university. The scope of the project is not to develop specific metrics for each unit. Our project team, CalMetrics, was tasked with researching best practices regarding metrics, provide a toolkit to assist managers in developing metrics, and present a set of recommendations on how best to implement metrics at UC Berkeley. This report is the result of that work.

OSKI: Operational Success Key Indicators | 7
The impetus for this report was manifold. The goal was not to develop actual metrics for different units, but rather a method to provide for units to develop metrics with minimal work that were tailored to their job functions and goals. In addition, questions existed around the definition and use of metrics, including: “What are our goals? What are the top three things to measure? How will this tie into our mission at UC Berkeley?” Stakeholders and Vision Our stakeholders include not only senior management, but all staff and faculty at UC Berkeley. Stakeholders can even be expanded to include anyone with an interest in how we, as a public institution, operate. In order to keep the project focus on the potential positive impact on others, a vision statement was developed.
Definition of Metrics Although definitions of metrics is discussed in more detail later in the report, a short working definition is included here for you to reference in the future. In this report, metrics can be defined as: A fair, simple, transparent measure of a unit’s ability to accomplish its goals. To further elaborate on this definition, a definition of metrics is “a fair, simple, transparent measure of a unit’s ability to accomplish its goals”, or “a means to measure the productivity of a work unit, department, or organization”. It can be as simple as defining the agreed upon number of work hours to return a customer’s call or defining an elaborate plan to determine
Vision Statement
We believe UC Berkeley operational units do their best work through a feeling of engagement with their team and the UC Berkeley community, and the belief that their work serves a purpose. This engagement is fostered by a bridge of communication between administration's expectations and employee feedback and participation. Such communication is honest, clear, transparent, and utilizes a common language to enable both groups to bring resources to address common concerns. As a result, UC Berkeley units have a means to provide their best work and attain rewards and affirmation for their innovation while realizing the results of their efforts through improved business practices in their UC Berkeley community.
OSKI: Operational Success Key Indicators | 8
effectiveness, resource requirements, participants, and time-line to complete phases of a yearlong project. Metrics can measure productivity; however clarifying productivity is not the only benefit of metrics. Metrics can also serve as a conduit of communication between a unit/department and administration. This conversation may include the specifics of the project and may then progress to a conversation of mutually understood continuous improvement efforts. When used strategically, metrics can also demonstrate the value of a particular project. Metrics can be a means of capturing the attention of administration, engage support, and possibly encourage acquisition of resources. Metrics provides a common language both units/departments and administration can use to achieve collective goals and support the efforts of an organization to fulfill its mission statement. Administrative decisions can then be based on facts supplied by the unit’s use of metrics. Therefore, both the unit/department and administrative managers are able to make informed decisions based on information provided by sound metrics. We developed an acronym that may help crystallize metrics for staff in the context of UC Berkeley. This acronym is “OSKI”, which stands for Operational Success Key Indicators.

OSKI: Operational Success Key Indicators | 9
Research Findings Literature Review A review of literature was completed to provide background on the use of metrics in higher education, and how it is used to facilitate the productivity of units/departments and to convey potential benefits when using metrics. First, with the intent of this project, as defined by the aforementioned vision statement, a definition of metrics is a means to measure the productivity of a work unit, department, or organization (Melnyk, 2004). It can be as simple as defining the agreed upon number of work hours to return a customer's call, to defining an elaborate plan to determine effectiveness, resource requirements, participants, and a timeline to complete phases of a yearlong project. Metrics have been known by a variety of names but all refer to some means of measuring effectiveness; or ensuring what was to be accomplished has been and how it was accomplished. Measuring effectiveness was utilized by the first cave dweller when designing a spear; examining the width of the shaft to be gripped, the length and balance of the wood, whether it met aerodynamic needs, and the ability of the shaft to pierce the hide of either predator or prey. Today our need for metrics is no less imperative for economic survival of departments and organizations (Ruben, 1999). We too must examine the intent or goal of our organization and provide services or products that can be as cost and time effective as possible in this age of diminishing financial resources for all organizations and particularly for higher education. Metrics measures productivity but that is not all that metrics are intended to address. When attempting to demonstrate the value of a particular department or unit, metrics can be a means of capturing the attention of administration and determining resources necessary for the unit to achieve success. Metrics can be used to identify costs for the project, determine a timeline from development to implementation, measure the quantity of the product or service and the quality of the product or service, and indicate the human effect of the product or service (to both customers and the unit/department). Therefore, the unit/department direction and goals should be clear to both employees and customers. Providing clear operational metrics should not only indicate whether goals are met but should also provide the course taken to achieve those goals. Most institutions, including universities:
Universities have demonstrated their ability to manage quality when funding increases but there is reason to doubt their effectiveness when — as is so often the case today — funding declines. Such situations call for doing more, or at least as much, with less money (i.e., for the improvement of productivity and

OSKI: Operational Success Key Indicators | 10
efficiency). But the lack of direct quality measures coupled with flaws in the higher education marketplace raises the concern that institutions will simply “do less with less”— by cutting back on quality (Massey, 2010).
The use of metrics when coupled with the “flaws in the higher education marketplace” can include, but not over emphasize, the use of productivity and efficiency metrics while also implementing “quality assurance and improvement processes” to ensure on-going organizational improvement efforts while not limiting such to merely examining input-output formulas. To effectively implement organizational metrics, attention must be paid to knowledge. Knowledge can be either intrinsic to the organization or defined as “improved knowledge” through the use of training opportunities or organizing metrics within the context of a project. For example, positioning metrics as a tool rather than the project itself; providing day to day incentives for the members use of metrics; designing the goals for the use of metrics in a manner that is clear to all participants; starting simply; broadcasting the gathered data to the organization ensuring that data reflects group achievement rather than one individual; fostering discussion about the gathered information; and, finally, using the results of the data or project to facilitate continued organizational improvement. In essence, employees and other members need to see the benefit of their hard work. Negative data can establish strategies for improvement and provide a means to encourage continued improvement and continued involvement with the project and metrics gathering, even poor or incomplete metrics gathering may provide information on trends. Also, be sure not to over interpret data, i.e., allow for possible imprecision of the data itself (Iversen & Kautz, 2006). The Prosci 2005 Best Practices in Change Management report surveyed 411 companies on their change management experiences and the lessons they learned through that process to outline the greatest success factors, the biggest obstacles, and lessons on how to build good executive sponsorship. The resulting report was also able to identify key success factors and barriers to change. The success factors included: active and visible sponsorship, use of change management process and tools, effective communication, employee involvement in the change process and effective project leadership and planning. Barriers to change included resistance from employees and managers, inadequate senior management sponsorship, cultural barriers, and lack of change management expertise (Boudreau & Ramstad, 1998). The above research shows that the factors that will facilitate success are often related to the factors that obstruct success. By measuring these factors with relation to the project itself areas of improvement will be realized. It should be noted that the involvement of stakeholders in the factors that obstruct success will have a clear impact on the overall success of the project.

OSKI: Operational Success Key Indicators | 11
In essence, the implementation of metrics and change within an organization has the potential to foster innovative strategies. Innovative strategizing can be encouraged through the involvement of employees and provide a means of creating value rather than merely continuing to adopt reorganization and other cost saving measures. The more everyone employed by an organization can be encouraged to engage in organizational improvement through innovation and creative processes the more strategies can be created that add value to the organization. William F. Joyce states that the greatest resource any business or organization has is its people and people that have a sense of ownership of the organization they work for have a different mindset about the organization and a greater propensity to be collaborative and engaged with the mission of the facility. An organization’s culture cannot be changed by top-down decree no matter how well meaning. Leaders must provide an example for others to follow and require different behavior to allow a more positive result. With time, and repetition, such will result in cultural change. When approaching organizational improvement the principles are generally the same: find a technique, theory or method that is supported by sponsors and employees alike; ensure those implementing the approach are provided with the necessary resources to implement their part of the project and gather the necessary data; be prepared for data that may or may not support the sponsors or employees agenda; be certain to acknowledge and use the data gathered; provide rewards for follow through on the project; and, above all else, ensure that the data gathered and the project itself benefits the organization either in part or as a whole. Innovative strategizing involves visualizing things in a different manner. This new perspective can result in determining new ideas, creative strategies, and innovative direction. It also serves to engage the individual and promote involvement and motivation. The following sections provide a more in-depth examination of the overall field of organizational change, best practices in five different institutions, ways to facilitate change, and effective incentives and reinforcement with respect to change. Finally, research within UC Berkeley departments and an exploration of the current climate and challenges to change within our organization are presented.

OSKI: Operational Success Key Indicators | 12
Best Practices
In our research of metrics used in outside institutions, findings of what could be considered a best practice, ranging from transactional to operational, were numerous. Many institutions have used performance measurement tools and metrics for input/output evaluation for years. However, not all could be implemented at UC Berkeley. Some were “too small” — the project focus for UC Berkeley centers around accountability and achieving goals through the contribution of a team or unit; not measurement of a single individual’s work. The United States Agency for International Development (USAID)and United Nations Development Programme’s (UNDP) metrics were “too large” — the focus for UC Berkeley is intended to be on unit effectiveness, not the long-term viability of a nation’s economy. They may be scalable, but we believe USAID, UNDP, and RealWorld Evaluation’s methodologies were simply too complicated to be usable. We conducted research on various corporate entities, nonprofits, state and federal organizations, and both private and public institutions of higher education. For implementation of best practices to support the rollout of operational metrics at UC Berkeley, a few specific institutions rose to the top: Zappos, Cornell University, Purdue University, the University of Washington, and the Institute on Governance. These five institutions modeled successful practices supporting metrics for possible adoption at UC Berkeley that are based on modest yet insightful ideas. These practices are intuitive yet challenging and provokingly simple in nature but most of all support the goals of UC Berkeley’s mission in maintaining excellence in teaching, research and public service and the vision supporting a high performance culture. These practices can be described in five simple words: values, stewardship, goals, communication, and logic.
What is a Best Practice?
● A best practice is a method or technique that has consistently shown results superior to those achieved with other means, and that is used as a benchmark.
● Best practice is considered by some as a business buzzword, used to describe the process of developing and following a standard way of doing things that multiple organizations can use.

OSKI: Operational Success Key Indicators | 13
BEST PRACTICE: VALUES Zappos is a well-known online retailer of shoes, clothing and other goods, but perhaps even more well-known is their commitment to excellent customer service and customer experiences. Zappos credits its success to the foundational belief in the importance of culture, which has shaped nearly all their business decisions and activities. Zappos believes that the best way to develop a sustaining brand and robust performance is through cultivating the culture which best supports those goals. At Zappos, the definition of culture was formalized into 10 core values. These values were developed with participation from nearly all employees and since they have been developed, Zappos has completely committed to achieving these values.
Both their commitment to customer service and company culture is evident in Zappos’ metrics. Zappos is careful to focus their call center metrics not on the traditional transactional measurements of “call times” or “amount of calls answered”, but rather on the customer experience itself, using such metrics as:
● On a scale from 1 – 10: How likely would you be to recommend Zappos to a friend or family member?
● On a scale from 1 – 10: How likely would you be to request the person you spoke with again?
● On a scale from 1 – 10: How likely would you be to recommend this person to a friend or co-worker?
● On a scale from 1 – 10: How likely would you be to try and hire the person you spoke with?
Zappos Core Values
1. Deliver WOW Through Service 2. Embrace and Drive Change 3. Create Fun and A Little Weirdness 4. Be Adventurous, Creative, and Open-Minded 5. Pursue Growth and Learning 6. Build Open and Honest Relationships With Communication 7. Build a Positive Team and Family Spirit 8. Do More With Less 9. Be Passionate and Determined 10. Be Humble

OSKI: Operational Success Key Indicators | 14
The metrics above focus on whether the customer experience was positive and has the possibility to generate further revenue for the company, rather than focusing on what the call is costing the company in terms of employee time. These metrics can also be connected with the first of Zappos’ core values: “Deliver WOW Through Service”. While Zappos also tracks some transactional measurements for their call center, these transactional metrics are used only to see if more staffing or support is needed — they do not measure individual or team performance. In keeping with many of Zappos’ other core values (including “Pursue Growth and Learning”, “Build Open and Honest Relations with Communication” and “Build a Positive Team and Family Spirit”), all employees are aware of the metrics which are tracked as well as the results. In the call center, metrics are displayed prominently on the wall, which allows employees to be engaged with the metrics and actively participate in continual learning. In addition to metrics on business performance, Zappos demonstrates the ultimate commitment to continually improving its culture through collecting cultural metrics. One of these is a regular employee survey, asking employees whether they agree or disagree with statements such as:
● “I believe that the company has a higher purpose beyond just profits” ● “My role at Zappos has a real purpose — it is more than just a job” ● “I am very happy in my job”
Zappos also gathers input on cultural performance through the creation of the annual “Zappos culture book”. The Zappos culture book is made up of unedited and uncensored submissions from employees on “What Zappos culture means to you.” Looking through the Zappos culture book provides a transparent qualitative lens on the culture performance, which can assist Zappos by showing where improvements are necessary. BEST PRACTICE: STEWARDSHIP Since 2000, Cornell University has maintained a commitment to staff and organizational stewardship which has resulted in a commitment from staff at all levels to the university’s core mission and values thereby increasing effective collaboration and ongoing innovation. In UC Berkeley’s own endeavors to build a workforce in a high performance culture based on effective metrics, the idea and adoption of staff stewardship would be critical. Cornell recognized that staff excellence was a central component in essentially all of the university's activities. The central mission of any organization cannot be fully achieved without a community of staff who believe in the mission of the university and want to contribute to the success of its
OSKI: Operational Success Key Indicators | 15
mission. This is staff excellence. Staff at UC Berkeley are valuable at all levels and are loyal in their commitment to the campus and striving for excellence already as noted in our Campus Perception Survey. Therefore, investing in the idea of staff stewardship would go a long way in maintaining the continued service of high-performing individuals if given the opportunities outlined below. In higher education, many staff members contribute daily to the educational experience of students. Cornell's core values suggest the creation and maintenance of a workplace that provides respect, dignity, and fairness to all employees across all job classifications and units. Similar in nature to UC Berkeley, Cornell experienced a period of organizational changes and staff reductions through retirements, attrition, and layoffs, which only served to intensify levels of ambiguity and uncertainty among staff. In response, the idea of staff stewardship blossomed out of the following objectives and actions, which provided a foundation for metrics. Objectives and Actions Objective 1: Give priority to retention of highly qualified staff in valued positions as the university reorganizes to address budgetary constraints. Rationale: In light of constrained resources, the importance of retaining highly qualified staff in the most important positions is greater than normal. Actions:
1. Reward staff who assume additional duties due to the reductions in staff and who continue to excel during difficult times.
2. Identify positions that will be needed through the administrative reviews being conducted
3. Clearly define skills and talents needed to excel in these positions and accurately define positions to reflect expected outcomes.
4. Identify career ladders and training opportunities for advancement. 5. Provide staff annual performance reviews that accurately and honestly assess
performance in current positions and identify development plans for growth. 6. Align annual and ongoing salary increase programs to performance, and maintain a clear
focus on a total compensation philosophy that will attract and retain top talent. Objective 2: Be an exemplary employer across the entire spectrum of staff. Rationale: Cornell has been recognized for the quality of its human resource programs, and it is important to maintain and build on its strengths in human resources.

OSKI: Operational Success Key Indicators | 16
Actions: 1. Promote family-friendly policies and practices across academic and non-academic units
of the university. 2. Recognize and celebrate the value and contributions of staff across all job groupings or
classifications. 3. Continue the university's commitment to pay all employees a "living wage." 4. Ensure that unit leaders enable all employees to take full advantage of the staff training
and development opportunities. Objective 3: Provide job skill training to staff in a variety of venues. Rationale: Providing staff the opportunity to advance their careers, develop their talents, and improve their lives is an important aspect of being a good employer. It is also important to accomplish this in a way that actually does enhance the promotion opportunities of staff. Actions:
1. Increase the current job-skill offerings through the Division of Human Resources and track usage, reporting to the college/unit leadership on a regular basis.
2. Make greater use of online short courses and training to develop needed skills and talents.
3. Encourage staff to take advantage of the university "health and well-being" programs. 4. Tie training to identified development plans obtained in annual performance appraisals. 5. Require supervisors to undergo training in basic supervisory skills and to refresh and
update those skills on a regular basis. Objective 4: Sustain and, wherever possible, enhance flexibility in the workplace and workforce. Rationale: Flexibility is essential to manage work efficiently, to ensure a healthier workforce, and to support work/life balance. Different approaches or structures are likely to be required in different units, so policies and practices need to be adaptable at the local unit level. Actions:
1. Reassess job design and work allocation processes in light of recent declines in the university workforce.
2. Create more collaborative, team-oriented units or work settings in which staff explicitly share responsibility for outcomes, have complementary skills, and have the capacity (talents) to substitute for each other.
3. Encourage supervisors to make arrangements for staff to be away from their work, if necessary, for purposes of professional development.

OSKI: Operational Success Key Indicators | 17
BEST PRACTICE: GOALS Metrics that are sustainable are often connected to the mission, values, and goals of an institution. Purdue University is evidence of this as they successfully instituted a plan where units developed their own set of goals, or metrics, that could be rolled up to support the greater mission of the university. It is the idea of a “greater sum” equals success. Essentially, every staff member knows how they contribute to the strategic goals of the university by their contribution to the stated goals of their department/unit. Metrics are meaningful. In 2008, Purdue created a strategic plan for the whole university to tie metrics to academic excellence to achieve goals. They based their plan on the idea of “sustaining new synergies” and developed three overarching goals that would help move the university in a new direction. The goals were 1) Launching Tomorrow’s Leaders, 2) Discovery With Delivery, and 3) Meeting Global Challenges. All broad ideas but each had strategies that were common to all three goals as well as respective metrics to measure progress specific to each goal. The shared goals were:
● Talent — Enhancing the quality of the faculty and staff through aggressive recruitment of talented leaders in their fields, with keen attention to increasing diversity; and nurturing retention through professional development and support, supervisory training for leadership positions, and career advancement opportunities.
● Cultural Diversity — Fostering diversity and inclusivity in the campus community in terms of people and culture but also in collaboration amongst disciplines in educational and research endeavors.
● Positioning — Enhancing visibility nationally and globally; increasing accessibility to communities outside of campus, continuing to steward relationships with students, alumni, and patrons.
● Sustainability — Promoting environmental and ecological consciousness. ● Enrichment — Increasing the responsiveness to campus workplace quality of life needs
and issues with centralized attention, responsibility, and accountability. By making these goals public and connecting them to the work units do, metrics became meaningful and inspired positive responsiveness. In 2010, a system-wide metrics report was provided to the campus community to show progress by way of a dashboard of selected metrics indicating the status of performance. The results were almost across the board positive. Similarly, both the University of California, Irvine and University of North Carolina, Chapel Hill have instituted plans that connected unit metrics to the goals and mission of their institutions. At UC Irvine, strategic planning by campus leadership charged academic and administrative units campus-wide with developing strategic planning statements that contributed to the larger goals
OSKI: Operational Success Key Indicators | 18
of the University. In this way, all departments knew their contributions toward supporting the University’s future direction and how the metrics were to be used in achieving continued success of their respective units and the University as a whole. The inclusivity of involving individual units in overall goal-setting for the university with metrics helped to foster collaboration between all levels of staff. A unit of note at UC Irvine was Administrative and Business Services who developed their strategic plan based on aligning goals with metrics in the context of continuous improvement. The University of North Carolina-Chapel Hill also used the context of system-wide academic planning for the university to allow units/departments to contribute to goal setting and creating metrics that centered around teams rather than individuals. They took it a step further however, by creating a comparative benchmarking web tool1 that allows departments/units to compare metrics data to one another. We conclude that goal-setting and connecting metrics to the mission of an institution help substantiate whatever the metric may be. It gives the campus community focus and connectivity to the continued health of the institution and pride in contributing to the ongoing innovation and movement towards the high performance culture on the horizon. BEST PRACTICE: COMMUNICATION
There is a general rule of thumb that communication is the key to any relationship. This not only holds true for individuals but also staff, leadership, units, and the campus community. Rolling out metrics, or any change in an organization for that matter, could be fraught with error and negatively impact goals if communication is not firmly in place. Transparency of decision-making processes that affect units and the communication of goals and metrics to staff members of a given unit can only serve to increase loyalty, efficiency, and engagement. The University of Washington launched the Two Years to Two Decades (2y2d) Initiative with the basic foundation of “re-envisioning a shared future”. The concept of a shared future is rooted in communication and continuous process improvement. Furthermore, ongoing measurement is a necessary element in any improvement process. Metrics help organizations 1This webtool was not accessible to the public
“Communication is always seen as last, as the tail on the dog, whereas if you have a policy that people don’t understand, you’re going to lose.”
George Lakoff

OSKI: Operational Success Key Indicators | 19
quickly improve. In summary, processes improve when metrics are communicated and align with the vision, in this case, a shared future. Similar to Operational Excellence at UC Berkeley, several smaller initiatives were put into place to support the overall vision of 2y2d. These initiatives include Fostering Collaboration, Program Evaluation, and Organizational Effectiveness — all grounded in communication. One initiative in particular, the Organizational Effectiveness initiative, provided units with tools and templates on how to create their own metrics and implementation plans. These templates were simple and user-friendly, such as how to create a metric and how to set up a balanced scorecard. These in turn would support the overall 2y2d initiative similar to what was outlined in the previous “Goals” section at Purdue. The basic ideas in the initiative were assessment, strategy, implementation, measurement, evaluation, and sustainability. In all of these areas, the theme of communication is essential. In fact, one of the directives of the initiative was to “over-communicate” by using every existing communication vehicle possible to get everyone on board and working toward common goals set by the unit that then roll up into the greater mission and metrics set by 2y2d. The overarching initiative of 2y2d also support and encourage units to share best practices. One of these is communication of decision-making processes. These best practices include articulating a framework for decision-making and communicating directly with stakeholders who would be most affected by any given decision. In addition, communicating decisions to stakeholders not affected is also important. Leadership in units must communicate and engage staff in any formulation of metrics and involve all in the decision-making process that went to the creation of the metric. BEST PRACTICE: LOGIC
The Institute on Governance is a non-profit organization founded in Ottawa, Canada in 1990 to promote effective governance. Their 2002 publication Not a “Tool Kit”: Practitioner’s Guide to Measuring the Performance of Public Programs provides a simplified version of the Logical Framework model used by USAID, UNDP and similar organizations. It is free of the unnecessarily complex models and statistical analyses included by most large public programs, several of which were reviewed and set aside for precisely that reason. This should mitigate the risks of reduced stakeholder participation due to incomprehension and overload.
“It is of the highest importance in the art of detection to be able to recognize, out of a number of facts, which are incidental and which vital. Otherwise your energy and attention must be dissipated instead of being concentrated.”
Sherlock Holmes, “The Reigate Puzzle”

OSKI: Operational Success Key Indicators | 20
A good performance measurement framework tells a convincing story, backed by credible evidence, about the value added by the program. This narrative should address three elements:
● Goals and objectives of the program — where we want to “make a difference.” ● Steps by which the program will achieve those objectives ● How to determine that the program is on track to achieve those objectives
The narrative becomes clearer with a detailed understanding of the workings and the goals of the program whose performance is to be measured. If the performance indicators are developed out of context or simply copied from an irrelevant context, they will be of limited usefulness and may even undermine the program goals and objectives. Unfortunately, most organizations try to come up with the indicators first, and then build the rest of the process around them, which leads to confusion, unnecessary complications to “make it work”, wasted time, and frustration for the stakeholders. Eventually those initiatives will be quietly discarded. The development of performance indicators should come at the end of the process of creating a performance measurement framework. First figure out where you’re going, then decide how to get there. Only then will you know where to look for the signs of being on the right track. Lessons learned:
● Using one-size-fits-most performance indicators that are not relevant to the program being evaluated does not provide meaningful results.
● Overly complex systems frustrate all stakeholders, especially managers who have to enforce directives they do not agree with and which may not make sense to them.
● “Focus on How we are making a difference” versus “how we keep busy” ● Clear, simple communication is key to broadly inclusive participation in determining
objectives and matching activities to the logic model ● Without broad participation, decisions will roll back up to those too far removed from
the activities to be able to make informed choices.
● First, agree on the ultimate objectives of the program, which should be reasonably attainable and must not be in conflict.
clear, agreed-upon objectives logic model performance
indicators

OSKI: Operational Success Key Indicators | 21
● Next, create a logic model that links program inputs, activities and outputs to the ultimate objectives. Identify intermediate outcomes and clarify causal linkages between results and program activities.
● Finally, derive key performance indicators from the logic model. Indicators that do not meaningfully support the objectives should be discarded to keep the system simple.
Basic Logic Model
Inputs
Activities
Outputs
Outcome: immediate
Outcome: intermediate
Outcome: ultimate

OSKI: Operational Success Key Indicators | 22
Layer of Logic Model
Related Performance
Indicator
Positive Features Negative Features Mitigation?
Input actual program spending in relation to budget
data easy to get and low-cost
weak relationship to ultimate outcomes; may undercut quality and ultimate outcomes
Select indicators that support ultimate outcomes
Activity number of transactions
data easy to get and low-cost
weak relationship to ultimate outcomes; may undercut quality
Select indicators that support ultimate outcomes
Output ledgers and other reports
data easy to get and low-cost
weak relationship to ultimate outcomes
Select indicators that support ultimate outcomes
Outcome number of customers served
data easy to get and low-cost
weak relationship to ultimate outcomes
Examine quality and satisfaction
Outcome customer satisfaction
moderate relationship with ultimate outcomes
effort/cost of obtaining data
design software for simple, useful response
Outcome changes in level of service
strong relationship with ultimate outcomes
effort/cost of obtaining data; uncertain cause and effect
design surveys for customer and staff perspective
Outcome changes in service culture
reflects ultimate outcomes
uncertain cause and effect; it's a continuing journey
annual surveys, town halls, and face-to-face discussions within units; flexibility to make changes as needed
Every performance indicator has positives and negatives, which should be taken into account in selecting which ones to use. Four key challenges:
● Perverse incentives — does one objective or activity undercut another? An emphasis on transaction counts may provide incentives for duplicated effort or rework, or to find undesirable workarounds to reduce work.
● Tradeoff between meaningful results and results that are a fair reflection of program performance. Indicators that are a fair reflection: inputs, activities, outputs, immediate and intermediate outcomes over which the program has a reasonable degree of control and which have a logical connection to the ultimate results. The indicators selected

OSKI: Operational Success Key Indicators | 23
should support the program story, and should make sense to the program stakeholders. Indicators such as intermediate and ultimate outcomes that the program has little or no control over may need to be monitored and managed for, but are not in themselves a measure of the program’s effectiveness.
● Tradeoff between short-term effects and meaningful long-term change — major changes may require a longer period to be evaluated correctly.
● Tradeoff between meaningful results and results for which data may be collected with little cost and/or effort: fewer and better results rather than a low ratio of signal to noise.
Indicator Tradeoffs
Number of transactions
Meaningful
X
L M H
Difficulty
X
L M H
Control
X
L M H
Perverse Risk
X
L M H
Annual Change
X
L M H
● Meaningfulness of the indicator in relation to ultimate outcomes (“high” is ideal) ● Difficulty of data collection (“low” is ideal) ● Level of program control over measured phenomenon (”high” is ideal) ● Risk of creating a perverse incentive (“low” is ideal) ● Meaningful change on an annual basis (“high” is ideal)
Perfection isn’t possible; the positives and negatives of each indicator can be judged to determine whether or not each is valuable. The indicators selected should support the program story, and should make sense to the program stakeholders. Performance measurement and management are not ends in themselves; they are means to the end of better ultimate outcomes and a culture of continuous improvement.

OSKI: Operational Success Key Indicators | 24
Change Facilitation Change is inherently difficult. Even good changes, such as a job promotion or move to a new office building, involve a transitional process that includes leaving something behind to start something new. While changes can happen quickly, the transition process can take time and may hinder adoption to change. Change can take many forms, including:
● Organizational change: change which impacts all employees of an organization. ● Process Change: change which impacts a select group or even an individual within an
organization. For this review, the focus is on organizational change management, or “change facilitation”. There are many important elements with relation to facilitating change within an organization, including:
● Know what is changing and why. ● Know who is affected by the change and how they are affected. ● Ensure all parties are in communication with one another whether affected staff,
managers, or administration. ● Track the change process within the organization and whether it adheres to the
proposed change plan. Each employee should have a clear understanding of the mission of the overall organization and be able to see their contribution to the success of the mission and how their contribution has a direct relation to that mission’s success. For example, analysis of technology usage for companies within the US (between 1998 and 2000) identified an over-spending of $65B. Analysis revealed that monies were spent on technology that was later rejected by employees. The reason for that rejection was defined by employees as: too difficult to use, lack of appropriate training, failure of the technology to meet the needs of the employees, etc. (Colony, 2002). The lesson learned when attempting to implement new ideas and technology within an organization was to place the emphasis on managing, i.e., facilitating change to prevent project failure. While most organizations spend extensive time defining change programs and developing training programs for both project managers and teams, few devote resources toward the management of change itself. It is necessary for those leading change efforts, or facilitating the adoption of changes, to define which change management method is realistic to meet the needs of their unit, department or organization. There are numerous models from which to choose. For example, Hiatt (2006) developed the ADKAR model for change management in business, government and community

OSKI: Operational Success Key Indicators | 25
organizations, based on his 20 years of experience as an engineer and project leader; Kotter (1996) examined over 100 companies to examine how they implemented change; “the Deming Cycle” as defined by Van Bon et.al. (2008) provided a simple four step model for change that could be used in a variety of settings detailed as “Plan, Do, Check, and Change”; Prosci (2005) stated, “The three most critical roles of executive sponsors to facilitate change management were: participate actively and visibly throughout the project, build a coalition of sponsorship with peers and managers, and communicate effectively with employees.” Models and opinions of change facilitation are numerous. There are commonalities between these models, including the practices of:
● Securing buy-in from all stakeholders ● Developing clear, relevant and timely communication between all parties ● Data gathering and analysis on the change impacts ● Implementation of findings to affect change within the organization or group
For the implementation of metrics, we used three models of change facilitation to inform recommendations, the implementation plan and the metrics toolkit. These models were: Transitional Model of Change, William Bridges & Associates The Transitional Model of Change focuses on differentiating the change itself, or the external event which occurs to modify the current state, from the transition, or internal process of experiencing and adapting to the change. While the change itself can happen very quickly, the transition takes time and involves three key phases:
● The Ending: letting go of the current state ● The Neutral Zone: disorienting zone during which the change may be evolving and
people are determining how roles and responsibilities have changed ● The New Beginning: final zone where changes are implemented and accepted
According to the Transitional Model, as people move through the phases various emotional responses can be demonstrated and different approaches are helpful for facilitating a successful transition towards the last phase, the “new beginning”. Although this model does outline methods for change facilitation, it also points out that each person will move through the transition phases differently and there is no “right” way to emotionally react to change. The key to success is honest communication, trust and tolerance for individuals as they go through various emotional reactions and discover where they fit in the changed environment.

OSKI: Operational Success Key Indicators | 26
Switch: How to Change Things When Change is Hard, Chip Heath & Dan Heath The Switch Model of Change focuses on the message that “for things to change, somebody somewhere has to start acting differently.”2 In order to facilitate this change in behavior, Switch outlines three main steps:
● “Direct the Rider”: Appeal to the rational side of individuals (or the “rider”) by highlighting success stories and benefits of the change, being clear about how the behavior must change and by painting a picture of the destination or future state that the change is trying to achieve. By providing examples of success, the rational side can see that this change has value. Communicating how people should act differently will give people an idea of how to work with the change and provide them with concrete steps towards making the change. Painting a picture of the destination will give a sense of direction and purpose.
● “Motivate the Elephant”: Pay attention to the emotional side of individuals (or the “elephant”) by providing them with an emotional connection to the change, shrinking the change down into manageable steps and by instilling a mindset of continual improvement. Individuals will always have an emotional connection to change; spending time to cultivate an emotional connection will make the change meaningful and increase engagement. Breaking the change down into small steps will prevent the change from triggering a feeling of “stress” or “being overwhelmed”. Because change is inherently difficult, developing a mindset of continual improvement can help individuals become more comfortable with change.
● “Shape the Path”: It is necessary to clear the way for people to succeed; this includes changing the environment to promote the change, building new habits and using social pressure to influence others. Behaviors often change to fit their environment; by adapting the environment to promote the change, corresponding new behaviors will occur. When behavior is habitual it doesn’t require energy, it becomes “the way things are”. Building new habits is essential to sustaining change. Social pressure can be used to increase the adoption of new behaviors, although at the same time attention must be paid to ensure that “resisters” are not creating social pressure towards non-conformance.
As in the Transitional Model, the key to the Switch Model is working with people, making sure to not simply initiate a change, but also facilitate the adoption of the change.
2 Heath, C. and D. Heath, Switch: how to change things when change is hard, 2010

OSKI: Operational Success Key Indicators | 27
Eight Step Process of Successful Change, John P. Kotter Using research in how people respond and approach change, Kotter developed the Eight Step Process of Successful Change. This process is summarized below.
1. Create a Sense of Urgency: People must see why the change is necessary and why it is necessary “now”.
2. Pull Together the Guiding Team: The change must have sponsorship from individuals that inspire and garner trust from those impacted. In addition, there must be a leadership team that can help guide the change.
3. Develop the Change Vision and Strategy: A clear picture must be painted of what will change (what will the future look like?), what are the benefits of the change and how the change will occur (how will we get to the new future state?).
4. Communicate for Understanding and Buy In: As many people as possible must understand the change vision and strategy. Communication is key.
5. Empower Others to Act: Obstacles toward adopting the change must be removed and experimentation and innovation with adopting the change encouraged.
6. Produce Short-Term Wins: In order to keep up momentum, short-term wins are necessary as soon as possible.
7. Don’t Let Up: Change has a tendency to stagnate once individuals stop feeling the urgency; the guiding team must continue to press forward and point to the destination.
8. Create a New Culture: In order to sustain the change, new consequences (positive and negative) should be introduced to create a new culture that promotes the new behavior.
Incentives and Reinforcement Much of the work on metrics has been focused on effectiveness, streamlining, productivity, and improvement of a unit and its processes. At the same time, people are the center of the work, and through our research we found time and time again that people need to feel they are a value to the University, particularly when so much change is happening. One project we found as a model of recognition at a division-wide level is the “Thanks to You” initiative through the Division of Student Affairs. During the winter of 2011, facilitators were charged with training all managers within Student Affairs on the why, how, and when of effective recognition. Their work was informed by a “Recognition Survey,” focus groups, as well as research on the topic and culminated with the development of a “Manager’s Toolkit” to ensure this information was taken to all the units, programs, and departments.
OSKI: Operational Success Key Indicators | 28
At the unit level, managers that we spoke with shared some of the internal activities of recognition established to create a sense of community within the group. One manager spoke about taking time during staff meetings to have everyone write “thank you” cards to someone on campus that they had worked with that they would like to recognize. Another spoke about a “U-rock” campaign, where a simple rock with the message “U-rock” painted on the side was handed to an employee who demonstrated a job well done; that employee would then pass the rock to another employee who deserved recognition and so on. Another activity is the “Star Performer Award,” awarded via peer nominations and is granted based on values developed by the team, not metrics or results, and is passed on each month. Anna Ewins, an outside consultant working with OE projects, highlighted the need for reinforcements when promoting the adoption of new behaviors. Anna highlighted that both antecedents, which “push” new behaviors, and consequences, which “pull new behaviors, are necessary. Examples of antecedents include training, new procedures, tools, expectations and strategic communication; examples of consequences include feedback, praise, support, promotions, and performance reviews. There is a tendency in organizations to focus on antecedents and forget consequences; she stressed that consequences are crucial to sustaining new behaviors. In addition, it should be noted that positive reinforcements are four times more powerful than negative.3 The overall message from these various initiatives and advice was that recognition should be honest, authentic, timely and most importantly an integrated part of the culture of a unit. While it may be awkward at first, the key is to be consistent, and as a leader, to model the behavior. Web Research of Campus Departments In an effort to identify which department and units on campus are currently using some form of performance measurement, we conducted a search on the UC Berkeley domain using keywords such as “metric”, “key indicator”, “benchmark”, and “assessment”. The search on “metric” returned mostly scholarly references and other key words were similarly unsuccessful. Web sites which listed metrics were discovered, including a “Metrics and Announcement” page on the BFS/BAIRS/BearBuy website (http://www.bai.berkeley.edu/announce/metrics/processingTimes.htm), whose metrics section included what were called “performance benchmarks” indicating various transaction processing times for the Purchasing and Disbursements units.
Next, we targeted known service delivery units, including the Engineering Support Research Organization (ERSO), Research Enterprise Services (RES), the Student Affairs SMART Cluster, 3 Ewins, Anna, “After Assessment: An Overview of Change Management”, Presented at the Cal Assessment Network Meeting, September, 2011.

OSKI: Operational Success Key Indicators | 29
and The Human Resources Center (HRC). Of these four units, HRC was the only one which had metric results posted on a publicly viewable webpage. Although ERSO was used as a case study by the High Performance Culture initiative, most of the information appears to be inside ERSO’s intranet so we were unable to determine the extent of their internal communication regarding their metric program and results. Student Affairs does have a fairly comprehensive web site communicating about its Strategic Management & Administrative Resource Team (SMART) initiative. While their results are not online, Susan Roach, director of business operations, Student Life and Admissions and Enrollment Business Operations, shared in an interview that they in fact have metrics in place and have begun to use the data for operational decisions. Challenges and Current Climate As already identified by the High Performance Culture Initiative Team in the Design Phase Business Case,4 implementing a metrics program requires behavior changes at all levels (management, faculty, and staff) as well as systems that provide the needed data and access to that data that includes those that will need it. While having systems capable of collecting data is necessary to create efficiencies in the data collection process, there is also a risk of data overload. Specifically, today’s systems are capable of collecting so much information that it will be a challenge for units to know what is relevant and how to prioritize the relevant data they will use.
Resistance is normal and part of the change process. People move through the phases of change at different rates.5 The danger with resistance to change is in spending too much time focusing on those who resist adopting the change. Instead, most change efforts focus on the early majority. There are also those who are resistant to metrics themselves for a variety of reasons. Three common concerns emerged throughout the research we conducted involving campus staff:
● Many felt that UC Berkeley was becoming too “corporate”. Although metrics are used by many other universities6, the term “metric” is often perceived to be a tool only utilized by corporations.
● When asked about implementing metrics on campus, many respondents were worried about how the metrics would be used. Specifically, they feared some managers would only use metrics to measure individual performance. As previously stated, the focus of
4 http://oe.berkeley.edu/dpreports/documents/H_BusCase_042511_v2.pdf 5 The Rogers Innovation/Adoption Curve is often shown to illustrate the average breakdown of a population asked to adopt change. 6 Including UC Irvine, Cornell, Purdue, Yale, Johns Hopkins, University of North Carolina-Chapel Hill, and the University of Washington.

OSKI: Operational Success Key Indicators | 30
this project centers around metrics for measuring unit performance and effectiveness, not individual performance.
● Finally, many of the staff we heard from expressed the desire that all segments of the campus community be involved in the development of a metrics program and we concur. The metrics program will need broad support in order to be successful and we believe leveraging staff stewardship will be critical.
Lastly, there is the risk of burnout. The more metrics are connected to higher level outcomes/goals/missions, the longer it may take to see real results from the metrics that indicate success. Because of this, people can experience burnout with the idea of metrics and data collection. Therefore, it is important to keep data collection simple so that the process of collecting metrics does not become too arduous.

OSKI: Operational Success Key Indicators | 31
Data Collection The data collection process included a survey, several interviews conducted with key UC Berkeley figures, and focus groups to gather information from a cross-section of employees concerning their ideas around the use of metrics and what tactics would be most effective within the UC Berkeley work culture. The following details the development and results of each of these data gathering methods. Campus Perception Survey In order to a gain a broad campus perspective, we created an online survey and designed questions around different aspects of metrics such as implementation and collaboration. Through our experiences and research for this project, we were cognizant of the challenges in soliciting staff and faculty on a topic with such breadth. The definition of a metric, best practices around the usage, and intended outcomes of a campus-wide initiative may not be fully realized throughout the campus community. To address this, we included a definition of metrics, an example of a metric including usage, and areas for responders to express their general or specific concerns. Our objective was to invite all staff and faculty, but due to logistical constraints, we invited staff to respond anonymously through existing networks and mailing lists. Of approximately 1000 staff, 265 staff responded, representing a diverse cross-section of domains and organizational levels. Nearly 75% of respondents have been with the University for six or more years. We found it encouraging that in response to the questions on the helpfulness of metrics in the department and at a campus-wide level, over 82% of the responses were neutral to positive at both the department and campus-wide metric. Subsequent questions were targeted toward informing our implementation. Responders were asked to rate the importance of each of five areas for improving their work life, and the difficulty in implementing each area. The five areas were:
• We need tools to show how what we do supports the mission of the university. • Our unit needs to collect data to support making the right decision. • It would be helpful to have a standard process to assess our department’s ability to help
others. • All members should be involved in the department goal setting process. • We need ways to measure how much we have accomplished so our achievements can
be recognized. For improving work life, 88%-94% of responders rated each area neutral to very important. What is interesting is that in response to involving all members, the most responses were cast

OSKI: Operational Success Key Indicators | 32
rating this as both the least difficult and most difficult. This may be an area that needs to be further explored for the implementation.
The survey rating and comments were taken into consideration in development of both the toolkit and the implementation plan included in the appendices of this report. Responses to the definition and example metric:
• Over 55% felt metrics would be helpful on campus • Almost 55% felt metrics would be helpful in their department
Those who did not feel it would be helpful left comments such as these:
• “Numbers alone do not dictate success.” • “Our context is too fluid and the culture is too diverse.” • “If I could design them they would be [helpful], but political motivations drive their
synthesis and hence they yield nonsensical answers to serve the need of out of touch upper management.”
A majority of respondents felt that:
• “We need tools to show how what we do supports the mission of the university.” • “Our unit needs to collect data to support making the right decision.” • “It would be helpful to have a standard process to assess our department’s ability to
help others.” • “All members should be involved in the department goal setting process.” • “We need ways to measure how much we have accomplished so our achievements can
be recognized”

OSKI: Operational Success Key Indicators | 33
When it came to implementation, there was less agreement with the statements above. This indicates that stakeholders are open to metrics and see how it can add value. However, responses indicate guidance would be helpful in how to make this happen. In the last question, we asked which of the following were their top concerns with promoting change:
• Senior leaders demonstrate their commitment to change by supporting staff. • Training and staff support are a priority when implementing change. • Staff participate in the development of the change. • Motivation for positive change is built throughout our organization. • Communications are customized for different audiences, and are responsive to their
individual concerns. • Through communication staff have a sold understanding of the need for the change.
The chart below shows the breakdown of the results.
Finally, additional comments were solicited at the end of the survey. All comments were taken into consideration in development of both the toolkit and the implementation plan included as appendices of this report. The sample below represents the range of comments.
• “Some units might find it helpful to have models of how a metric would contribute to progress toward an institutional goal. Some units might find it helpful to have access to national benchmarks.”

OSKI: Operational Success Key Indicators | 34
• “A specific metric can only be credible when there is evidence supporting its benefit. People wishing to measure the work of others should lead by example.”
• “[The] “veto of one” practice is prevalent at Berkeley.” • “Promoting change in an organization is well researched and should not be decided
based on this questionnaire.” Interviews Through the course of our research phase, interviews were conducted with various unit leaders to gather feedback on the use of metrics, communicating results, lessons learned in implementing metrics, as well as recommendations. In addition to acquiring information on metrics, interviews with subject matter experts were conducted to get their thoughts and best practices regarding metrics and facilitating change. Through research and conversations with various constituents across the campus, “change” emerged as a common theme. For many on campus, metrics will be a new term and process to adopt. Thus, addressing how to approach this change was just as important in the implementation process. In total, we interviewed seven people from across the campus as well as one outside person. Below are comments that have been either paraphrased or listed verbatim. Identification information was omitted to respect the interviewee’s anonymity. Use of Metrics Overall, interviewees responded that metrics are used for the following operational functions:
● Decisions on staffing ● Distribution of workload across a unit ● Distribution of funding and allocation of resources ● Tracking volume of work ● Determining where the areas of activity are ● Assessing where the needs are ● Help understand customer expectations ● Improving business practices and processes
There was a great sense that metrics provided real data in the decision-making process as opposed to functioning from assumptions.

OSKI: Operational Success Key Indicators | 35
At the same time, others mentioned how metrics can also be beneficial to the group dynamics of a unit by:
● Showing how a unit is meeting larger goals ● Taking a pulse on the health of an organization ● Becoming a teambuilding exercise ● Creating a sense of pride in one’s work
Communicating Results
● Results should be communicated to managers of the units to work on improvements. ● One interviewee believed that it would not be useful for satisfaction rankings to appear
on a website. ● Results can be used to encourage employees to use the data to look for business
practices that need to be streamlined that they did not see before. ● Users have to be able to pull out data at an aggregated level so decision-makers can
easily understand it. ● In reporting, keep in mind who your audience is, what the results mean, and what
information would be useful. ● Always relate back to department goals and mission.
Implementation Lessons This piece was on lessons interviewees learned as metrics were being implemented in their respective unit:
● The belief is that the campus is currently not using metrics to drive improvement as much as it should be. Ultimately, units have to do something with the data to make it worthwhile.
● Explain that using metrics can save time so the argument that “there’s no time” is a reason to do it, not a reason not do it.
● Talking to other units who had already implemented metrics helped because they had already gone through the process.
● Prioritizing the data and what to track first as a group can bring a unit together. ● Have examples of the metrics, how the data is used, what the data is, and how the data
can help employees have a positive impact on their work. ● Numbers do not tell the whole story, thus when comparing data all of the variables
need to be considered. For instance, the number of “tickets” two employees report may be completely different, but what is the context? Are both employees equally trained to respond? Were there “ticket” items that were more complex, and therefore took longer to resolve?

OSKI: Operational Success Key Indicators | 36
Suggested Models The following models were suggested by our interviewees:
● Rogers Innovation/Adoption Curve ● Switch: How to Change Things When Change is Hard ● William Bridges’ Transitional Model of Change
The latter two models are discussed in further detail in the previous Change Facilitation section of this report. The Rogers Innovation/Adoption Curve identifies five categories of where people would fall during a change process:
● The idea is to focus on the Early Majority, because the Innovators and Early Adopters will be on board with the change from the beginning.
● The Laggards will not make any changes or adapt until they absolutely have to, thus it is not effective to focus on them initially.
● The Late Majority is skeptical, but they respect the Early Majority. Therefore, if you can get the Early Majority on board, then you can get the Late Majority as well.
Focus Group In determining campus perspectives on the implementation and communication of metrics, we decided that a focus group would be a beneficial medium for gathering information about the opinions, beliefs, vocabulary and thinking patterns of our target population. Focus groups are unique in that they encourage interaction between participants and informal discussion, which can lead to building on ideas and highlighting the underlying attitudes and perceptions around a topic.

OSKI: Operational Success Key Indicators | 37
Key goals for the focus group were to: 1. Find out what participants would like to see in a metrics toolkit — what would be
helpful to them in developing, implementing and communicating metrics for their departments?
2. Find out participant’s opinions and ideas for how metric results can be successfully shared and communicated to customers.
The Chancellor’s Staff Advisory Committee (CSAC) was selected as the focus group audience because of their mission and diverse campus representation. CSAC is charged with providing staff input into campus decision-making processes which directly affect staff; their goal is to assist with creating a positive working environment for all staff members. The committee is made up of 16 members, appointed by the Chancellor, which reflect the diversity of the campus staff community. The focus group was held at a general CSAC meeting on April 4, 2012. Many specific ideas for the toolkit and implementation pieces were provided and have been incorporated into the recommendations made in this report. In addition, the following key general perceptions were shared:
1. Having an inclusive process is key. It is vital that staff be involved in the metrics creation, implementation and communication process in order to both secure staff buy-in and ensure relevant metrics are created and utilized properly. Metrics can be empowering, as they can demonstrate value and worth, and can also drive continual improvement as they help uncover challenges and benefits in work. However, this is only true if the staff who do the work that will be measured are allowed to participate in the process rather than be given a “top down” directive.
2. Must understand the driving force behind metrics. In order to understand why
the shift towards using metrics is necessary and beneficial for campus, staff must understand the driving force behind metrics. There must be a compelling case for implementing metrics to counter the resistance that naturally comes with change. In the current climate of continual change, it is also helpful to communicate information which can answer the question “What’s in it for me?” so that individuals do not automatically “tune out” to yet another change.
3. Conflict between “delivering numbers” and “continual improvement”. There
is a danger when developing metrics that the focus will be on delivering “good results” rather than on painting a true picture which can be used for continual improvement. To ensure staff do not fear the use of metrics, a message must be communicated that the purpose of metrics are not to create pressure for perfection, but rather to help

OSKI: Operational Success Key Indicators | 38
highlight obstacles and opportunities for improvement. Training should be provided on how to analyze metrics and on how they can be used to start a conversation for improvement, rather than punish poor performance.
4. How intangibles can be measured. Metrics tend to focus on quantitative results,
which can be hard to ascribe to qualitative aspects of performance. The question of “how to measure intangibles?” should be answered through training and education. Videos, FAQ sheets, and simple examples of metrics are all helpful tools that can provide useful education on how to develop both quantitative and qualitative measurements.
5. Focus on measuring the system and not the people. The University has a system
in place to measure individual performance; the purpose of metrics is to measure “team” performance toward set goals. Metrics which are targeted toward individuals leave out an important aspect of performance: the system in which individuals work. Instead, metrics should be targeted toward the system and highlighting how it can be improved to enable staff to do their best work.

OSKI: Operational Success Key Indicators | 39
Recommendations/Conclusion Assemble the team In the appendix is a detailed implementation plan designed for use by the Campus Metrics Coordinator or other designated staff. This report and other tools can be used for planning, designing the implementation, launching metrics on campus with early adopters, evaluating effectiveness, and sustaining its usefulness. It is vital that staff be involved in the metrics creation, implementation and communication process in order to both secure staff support and ensure relevant metrics are created and utilized properly. The staff who do the work that will be measured should be able to participate in the process rather than be given a “top down” directive. Success depends on developing staff stewardship and good communications, with continuing support from leadership, including providing training, guidance, promoting best practices, and modeling core values. Leadership should also make the effort to acknowledge the emotional impact of change, and to get training or other support to facilitate change.
Build the framework Use the toolkit in the appendix to design unit metrics in line with logical principles. The development of performance indicators should come at the end of the process of creating a performance measurement framework.
● First, agree on the ultimate objectives of the program, which should be reasonably attainable and must not be in conflict.
● Next, create a logic model that links program inputs, activities and outputs to the ultimate objectives. Identify intermediate outcomes and clarify causal linkages between results and program activities.
● Finally, derive key performance indicators from the logic model. Indicators that do not meaningfully support the objectives should be discarded to keep the system simple.
● Design dashboard and other reporting tools to share results.
Conduct participatory evaluation While the main focus of this project was to provide recommendations regarding the implementation of campus-wide metrics, we are also proposing that the newly hired Campus Metrics Coordinator heavily promote the development and use of metrics at a unit level on a voluntary basis. We have designed the toolkit included as an appendix to this report to be used

OSKI: Operational Success Key Indicators | 40
by anyone interested in developing and implementing metrics and have included recommendations related to both campus-wide and unit-specific metrics. Early adopter units will have the opportunity to develop their own metrics and collaborate in the design of new action plans.
● Collaboration: ○ Inclusive language must be backed up by inclusive practices ○ Implement face-to-face, not via email announcement ○ Build communities of practice to share their experiences ○ Analyze the data and build consensus on results ○ Participants collaborate in design of new action plans based on results ○ Build in rewards and incentives to encourage participation
Dialogue continues
● Data Collection: ○ Regularly review and respond to feedback ○ Get employee perspective as well as managers and customers ○ Allow for open comments as well as one-click selections ○ Set up dashboards to display results
● Analysis:
○ Re-evaluate metrics to make sure they do not create perverse incentives, such as “teaching to the test”, losing the big picture, or undercutting other goals.
○ Measuring performance shouldn’t just monitor whether a target is met; it should include processes by which improvements can be made. Metrics are not an end result but a conversation starter to see how continuous improvement can be made.
● Model continuous improvement:
○ Continue to use metrics that have proved effective; change or replace those that have not.
○ Recognize and reward improvements and useful recommendations ○ Include metrics as part of hiring and orientation ○ Make tools and training readily available to meet community’s needs

OSKI: Operational Success Key Indicators | 41
Evolve Metrics must be able to evolve to address changing needs. Metrics cannot become entrenched or stagnant even as they become a core part of how we maintain focus on our goals. Metrics need to adapt to the diverse areas and functions of the campus from lab research to financial aid, to faculty recruiting, to purchase orders. Continuous communication and engagement will help in sustaining metrics. Orient new adopters to see themselves as stakeholders with vital parts to play or people will move into comfort zones and metrics may not be implemented significantly. This will reduce its ability to improve the work environment and in turn weaken support over time. Metrics are not the end product. If treated as such it will become just another “duty as assigned”. Metrics will be sustainable because they are used to identify areas of improvement whether it’s more training, new software, or a change to an office’s configuration.

OSKI: Operational Success Key Indicators | 42
Afterword Our team’s experience of coming together for this project has been a microcosm of the larger metrics adoption process: at first there were competing hypotheses of finding a ready-made set of metrics somewhere, finding the answer through highly complex instruments of social science, viewing the issue as fundamentally a PR problem, and uncertainty as to whether this project was meant to affirm the status quo or provide honest feedback. There were varying visions of how much control or structure was required. At first, we made apparent progress following a predetermined outline, then hit a plateau until we let go and changed to an agile approach. We wrestled with these questions almost endlessly as we developed bonds of trust, shared understanding, and organic collaborative leadership. In the end, we had results we could live with and a sense of “sweat equity” in what we built together. There is no shortcut to enlightenment; there is a reason all pilgrimages require serious commitments of time and effort. The miracle is effected through the opportunities for reflection and growth on the journey. This team can provide guidance, but in the end cannot serve as virtual representatives of the campus community; each unit must walk its own walk. The journey may seem daunting at first, but the reward is beyond price: at the end of the road, the travelers will find that along the way they themselves have developed the very tools they need to succeed. In conclusion, to our stakeholders, from new employees to 30-year veterans, to traditional offices such as the Office of Undergraduate Admissions to newer divisions such as Equity and Inclusion, thank you for taking the time to read this report. We hope it is both informative and inspiring.


APPENDIX A:
Project Charter


OE PROJECT CHARTER CALMETRICS
Project Charter Template v1 OEPM101 Workbook Section 2 Page 2 of 5
PURPOSE (What problem will be solved by the project? What value does this project add to the organization? How does this project align with the strategic priorities of the organization? What benefits are expected once the project is completed? The OE High Performance Culture Initiative received approval for developing metrics toolkit for measuring unit effectiveness. With a move towards shared services, the administrative duties of a unit are changing. To make the transition successful, metrics are needed to monitor operational efficiencies and ensure the needs of those they serve and the objectives of the university are met.
RESULTS (What does success look like? How do we know that the problem described above is resolved? This typically involves clarifying metrics for operations once the project is completed.) # SUCCESS MEASURE 1 Identification of current metrics that are successfully measuring effective service delivery on campus and in external
organizations
2 Guidelines and best practices created to aid units in the design of assessment processes to measure their output 3 Proposal of training methods to aid deans, dept chairs and managers in developing their own metrics
4
SCOPE (The scope defines the boundaries in terms of where the project begins and ends. The scope describes what will be delivered - where, when, and how. It describes the services, functions, systems, solutions, or tangible products for which the sponsor w ill take delivery.) The scope is to develop a metrics toolkit and implementation plan. The metrics toolkit will be designed to assist
managers in developing service delivery metrics at the unit or department level. The implementation plan will be used
as a set of recommendations to the Metrics Coordinator on how to move the University towards the adoption and
practice of metrics use. These items will include research and assessment of existing metrics within the university and
outside the university. The scope of the project is not to develop specific metrics for each unit.
PROJECT CONSTRAINTS & ASSUMPTIONS (List the known and anticipated constraints, and the initial assumptions for the project.) # NAME 1 Time available to complete the project, both in terms of the project teams’ availability due to existing work
responsibilities and the project deadline, is the initial constraint. 2 An assumption is that the project is targeted towards those units with a service delivery aspect. 3 Difficulty accessing needed individuals for interviews/information within our time constraints.
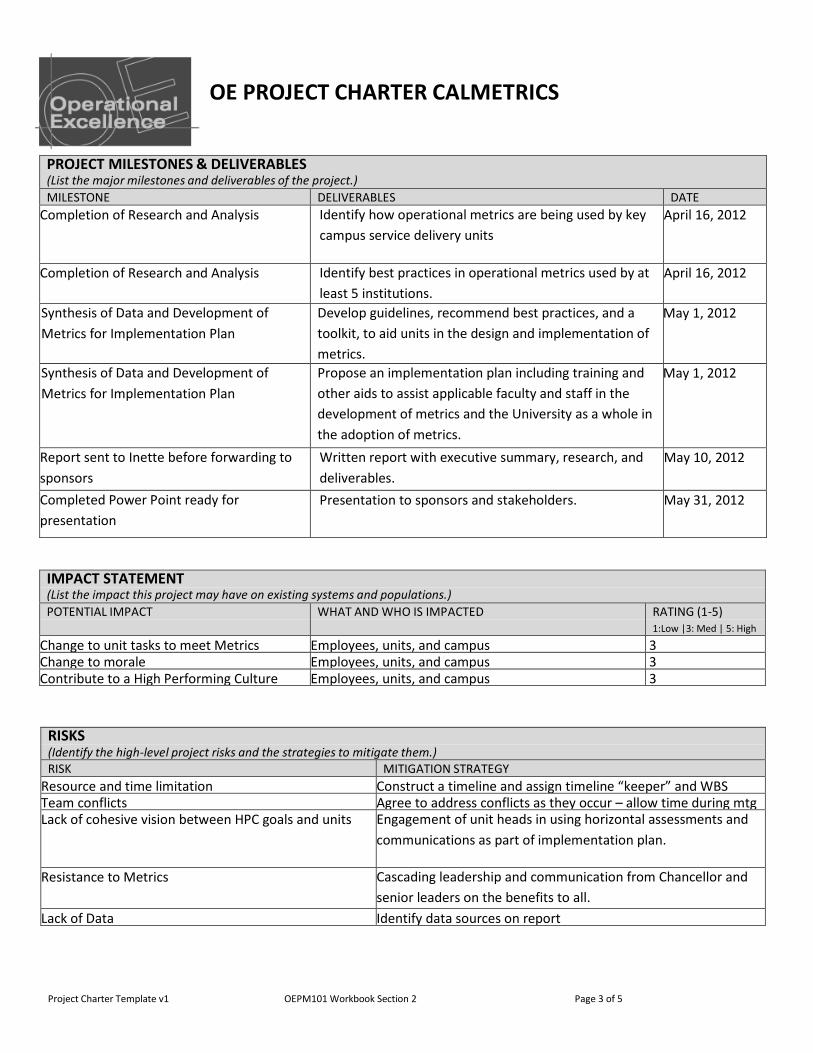
OE PROJECT CHARTER CALMETRICS
Project Charter Template v1 OEPM101 Workbook Section 2 Page 3 of 5
PROJECT MILESTONES & DELIVERABLES (List the major milestones and deliverables of the project.) MILESTONE DELIVERABLES DATE
Completion of Research and Analysis Identify how operational metrics are being used by key campus service delivery units
April 16, 2012
Completion of Research and Analysis Identify best practices in operational metrics used by at least 5 institutions.
April 16, 2012
Synthesis of Data and Development of Metrics for Implementation Plan
Develop guidelines, recommend best practices, and a toolkit, to aid units in the design and implementation of metrics.
May 1, 2012
Synthesis of Data and Development of Metrics for Implementation Plan
Propose an implementation plan including training and other aids to assist applicable faculty and staff in the development of metrics and the University as a whole in the adoption of metrics.
May 1, 2012
Report sent to Inette before forwarding to sponsors
Written report with executive summary, research, and deliverables.
May 10, 2012
Completed Power Point ready for presentation
Presentation to sponsors and stakeholders. May 31, 2012
IMPACT STATEMENT (List the impact this project may have on existing systems and populations.) POTENTIAL IMPACT WHAT AND WHO IS IMPACTED RATING (1-5)
1:Low |3: Med | 5: High
Change to unit tasks to meet Metrics Employees, units, and campus 3 Change to morale Employees, units, and campus 3 Contribute to a High Performing Culture Employees, units, and campus 3
RISKS (Identify the high-level project risks and the strategies to mitigate them.) RISK MITIGATION STRATEGY
Resource and time limitation Construct a timeline and assign timeline “keeper” and WBS Team conflicts Agree to address conflicts as they occur – allow time during mtg Lack of cohesive vision between HPC goals and units Engagement of unit heads in using horizontal assessments and
communications as part of implementation plan.
Resistance to Metrics Cascading leadership and communication from Chancellor and senior leaders on the benefits to all.
Lack of Data Identify data sources on report

OE PROJECT CHARTER CALMETRICS
Project Charter Template v1 OEPM101 Workbook Section 2 Page 4 of 5
COMMUNICATION (Highlight the communication requirements between the Sponsor, the Key Stakeholders and the Project Team, including the frequency of check-ins, project reviews, and status reports (in person and written).) We will touch base with primary sponsors and the functional sponsor for approval of project charter. There will be a mid-point meeting with primary sponsors March 26, 2012. There may be ad hoc emails over the course of the project to ensure our milestones correctly coincide with their expectations. Primary Sponsors and Functional Sponsor will receive our presentation May 31, 2012.

OE PROJECT CHARTER CALMETRICS
Project Charter Template v1 OEPM101 Workbook Section 2 Page 5 of 5
APPENDIX A - PROJECT ROLES & RESPONSIBILITIES Name the members of the project team.
PRIMARY PROJECT SPONSOR: Provides overall direction, guidance, and funding for the project.
RESPONSIBILITIES include setting the vision and strategic direction, approving the project charter and plan; securing resources for the project; confirming the project’s goals and objectives; keeping abreast of major project activities; making decisions on escalated issues; and assisting in the resolution of roadblocks. NAME Jeannine Raymond NAME Rich Lyons NAME John Wilton
FUNCTIONAL OWNER: Manages the impact of the project in their functional area.
RESPONSIBILITIES include ensuring agreed-upon project tasks and deliverables are completed, incorporating the views of their customers, providing functional expertise in a particular area, articulating requirements, and working to ensure that business needs are met. NAME Stephanie Metz
Describe the roles and responsibilities of the project participants. PROJECT TEAM MEMBERS
RESPONSIBILITIES include
understanding the work to be completed, completing the research, data gathering, analysis, and documentation, informing the project manager and team members of issues, scope changes, risks, and quality concerns, and proactively communicate status and manage expectations.
NAME Rebecca Andersen NAME Jean Franco NAME Elizabeth Geno NAME Melanie Green NAME Yu-Tin Kuo NAME Layla Naranjo NAME Cheryl Olson NAME Rachel Richardson NAME Daniel Roddick

APPENDIX B:
Toolkit


2
I. INTRODUCTION 3 II. WHAT IS A METRIC 4
Characteristics 5 Benefits 7 Pitfalls and Challenges 8
III. HOW TO CREATE A METRIC 9
Change Facilitation 10 Staff Stewardship 17 Mission 21 Sample Five Step Plan for Developing Metrics 24
IV. HOW TO SUSTAIN METRICS 38
Design into Organization 39 Communicating Results 40 How to Use Results 41 Incentives and Reinforcements 42
V. WHAT ARE THE TOOLS 43
Metrics at a Glance 44 Transactional vs. Operational Metrics Guide 45 Change Impact Assessment 47 Stakeholder Commitment Assessment 50 Stakeholder Map 52 Stakeholder Engagement Template 55 Driving Force for Change Template 57 Vision Planning Tool 59 Pareto Analysis Worksheet 61 Paired Analysis Worksheet 63 Force Field Analysis Worksheet 65 Facilitation Cheat Sheet 66 Metric Template 68 Communication Planning Template 69
TABLE OF CONTENTS

3
Metrics help us do our best work. At the University of California, Berkeley, units are being charged with doing their best work as the campus moves into an era of high performance culture. Doing our best work begins with the feeling of inclusion and engagement of staff within their cohort and larger campus community. This is fostered through a two–way bridge of communication between campus leadership and staff that includes opportunities for brainstorming on innovation, participation, and vetting. Such participation requires honesty and clarity, enabling both groups to collaborate on resources to address common concerns and open pathways for innovation. As a manager, it is your role to model and set the tone as well as establish a common language that everyone can use throughout the unit about operational metrics and their benefits. Ultimately, metrics and a philosophy of continuous improvement become embedded in your team culture. Most managers strive for the outcome of a high performance culture but do not have the tools or information to begin the process of tying the organization’s intended outcomes to clearly defined metrics. This guide is intended to be used as a pathway (or toolkit) for units, particularly managers, to achieve a common language and set organizational goals that roll up into the mission of the University and a high performing culture through the use of operational metrics. In this guide, you will learn what metrics are and are not, why and how to use them, how to build internal measures that make sense for your unit, and how to sustain them as the campus community strives towards continuous improvement. Metrics are a tool for improvement and amplified impact.
INTRODUCTION

4
A metric is a fair, simple and transparent measure of a unit’s ability to accomplish its goals. Metrics are tools for continuous improvement and can help everyone do their best work. They help maintain the focus on critical success factors, align unit efforts to campus-wide mission critical initiatives, set expectations, provide feedback, reveal opportunities for improvement, and ensure decisions are made fairly.
A metric is a fair, simple and transparent measure of a unit’s ability to accomplish its goals. Metrics are tools for continuous improvement and can help everyone do their best work. They help maintain the focus on critical success factors, align unit efforts to campus-wide mission critical initiatives, set expectations, provide feedback, reveal opportunities for improvement, and ensure decisions are made fairly.
In this section, things to consider…
Characteristics (the what) Benefits (the why) Pitfalls and Challenges
WHAT IS A METRIC?
HELPING US DO OUR BEST WORK

5
People can understand the term “metrics” to mean many different things. There are individual metrics, such as performance appraisals, and team metrics, such as the results from a ticketing system. For the purposes of this toolkit, we will be focusing only on metrics which are “team” in nature. Team Metrics: Metrics which measure progress towards shared team goals. While individuals will contribute to the result, you should not be able to break down a team metric and tie the measure to only one individual’s work. Team metrics focus on the progress of the entire team and stay away from evaluating individual strengths and weaknesses. By focusing on the team, you will unify staff and diminish competition within the team.
There are two main types of team metrics: Transactional Metrics: These metrics are usually quantitative in nature and can be defined as the amount of work accomplished (or activity completed) in a certain amount of time. Examples include:
● The amount of customer calls handled each day. ● The amount of laboratory safety inspections completed each month. ● The amount of student appointments completed each day.
Operational Metrics: These metrics can be quantitative or qualitative and measure progress towards important outcomes, not just activity completed. As such, these metrics are harder to define. You can think of operational metrics as overarching metrics that are firmly tied to a team’s vision, or the end result they are trying to achieve. Examples of operational metrics include:
● Customer satisfaction survey results. ● Amount of laboratories receiving a “high” safety rating during inspections. ● Date completed (no lapses) in student registrations.
Characteristics
There are two types of team metrics: transactional and operational metrics.

6
The key point to remember is that transactional metrics measure output (activities) while operational metrics measure outcomes, or how a team makes a difference in the real world.
While both transactional and operational metrics can be beneficial, the bulk of this toolkit will focus on operational metrics because of their additional benefits and connection to a team vision. Key characteristics which are vital for successful metrics include:
● Metrics are indicators: Metrics should elicit only one type of response: to investigate. Metrics do not provide you with the answers, but rather point you where you will want to ask more questions.
● Metrics are transparent: All team members should be aware of what is being measured, why, what the results will be used for and how it will improve the work. The front-loaded time you invest in efforts to elicit engagement, communication, and transparency will yield increased trust and buy-in from team members as metrics are being implemented.
● Metrics are tied to mission and/or vision: Whether metrics measure activity (transactional metrics) or outcomes (operational metrics) they must be tied to a mission and/or vision. All metrics should provide information for how a team can improve performance towards implementing their mission or achieving their vision.
● Metrics are S.M.A.R.T. : ○ Specific/Simple: metrics should be specific enough to represent critical
areas of performance and simple enough to enable relative ease in collection and analysis of data.
○ Measurable: metrics must provide a real measure of performance. ○ Actionable: metrics should be easy to understand and should highlight
where action (investigation) is needed. ○ Relevant: metrics should be relevant to a team’s mission and vision. ○ Timely: metrics should be able to be measured in real-time so timely
investigation and feedback can occur.
Characteristics

7
Operational metrics are an invitation to be empowered. They identify why the work a team does is valuable and how the team makes a vital contribution. They answer the question: “why does what I do matter?” Finally, operational metrics can be symbols of accomplishments that motivate and energize.
- Team members can be empowered to take ownership of improving a process based on the feedback received through the metrics. This allows for people’s strengths to be used, which can result in a team member’s feeling more engaged and proud of their work, while they are contributing to the mission of the organization. In short, operational metrics drive behavior and cultivate a culture of continuous improvement.
Operational metrics show progress and commitment towards a team’s vision, which increases the credibility that the team has with stakeholders. In addition to engaging team members, operational metrics engage stakeholders by also providing them with an answer to the question: “why does what the team does matter?” Stakeholders are able to see continual improvement towards success which can make a team’s vision more concrete and “real”, thereby increasing stakeholder support.
Benefits of Operational Metrics
Operational metrics can empower
Operational metrics drive behavior
Operational metrics enhance credibility

8
Developing useful metrics is difficult. The development process takes time, effort and careful attention. Being aware of the pitfalls and challenges can help you see what to avoid and how to put in place the most beneficial metrics possible. The hesitation towards operational metrics may stem from a lack of understanding of what metrics are, what they are measuring, and why and how they are being used. While the purpose of operational metrics is to measure the unit’s overall effectiveness, individuals may believe they will be personally impacted by the results (i.e. their personal performance will be measured and judged). To avoid this pitfall, take responsibility for clarifying and empowering team
members on the benefits and purpose of metrics. Once data is collected, there is a possibility that you will run into a situation where you will have too much information, you will not know what to prioritize, or how to discern what is useful. This is common when first implementing metrics. To avoid this pitfall, be sure to think through the data collection and analysis
step before you put a metric in place. As stated earlier, metrics do not provide the answers, but help managers ask questions that lead to action. Some metrics do not tell the whole story and the data must be contextualized. It is important to remember that metrics are indicators and not truths. To avoid this pitfall, use metrics to ask questions and investigate but not make
judgments based on the metric itself. Your metric may not always drive the behavior you want, and in fact may motivate team members to behave in ways that are opposed to some of your high level outcomes. Operational metrics, as a rule, have a tendency to have less perverse incentives than transactional metrics (where measurements such as call times can promote faster processing speed but not necessarily better service), however perverse incentives is always something that you should be on the look out for. To avoid this pitfall, carefully think through if your metrics are driving the right
behaviors.
Pitfalls and Challenges
Reluctance
Data Overload
Metrics as Truth
Perverse Incentives

9
Ongoing measurement is an essential part of any improvement process. The results of implementing the plan must be measured in order to evaluate the degree to which the plan and its implementation have been successful. But how do we get there? Who decides what the metrics are? Good metrics can help units quickly improve by rooting them in some key concepts. In this section, things to consider…
Change Facilitation Staff Stewardship Mission Step-by-Step Plan
HOW TO CREATE A METRIC?
HELPING US DO OUR BEST WORK

10
Change is inherently difficult. Even good changes, like a job promotion or a marriage, involve a transitional process that includes leaving something behind to start something new. While changes can happen quickly, the transition process can take time and may hinder adoption to new changes. To highlight the difference between change and transition, imagine your department is moving to a new building on campus. The change is the physical move itself; packing and unpacking the office equipment, rearranging furniture in the new space and going to a new location for work. The transition is all of the confusion, stress, anxiety, and perhaps excitement that everyone in the department is experiencing during the change. A great challenge is facilitating people through the associated transition that comes with change, which includes helping letting go to “what was” before a new beginning can be realized. This transition is experienced internally and may be invisible or hard to observe. In addition, each person may experience the transition in a unique way. The creation and adoption of metrics may be a change for your team which will require a transitional process before it can be fully accepted and implemented. Why pay attention to the transition? Why should you worry about helping lead people through the transition; shouldn’t it be enough to simply share your vision of change and promote the new state? In short, it is by not paying attention to the transition that many change initiatives fail; just because a change is well managed does not mean the transition process will take care of itself. People need time and space to work through the natural process of stress, confusion, and resistance that accompanies change; as a leader you can help to facilitate this process and ensure success. The change transition process involves three phases, an ending/losing/letting go of the current state, a disorienting neutral zone and a new beginning. As people move through the phases, various emotional responses can be demonstrated and different approaches are helpful for facilitating a successful transition towards the last phase, the “new beginning”.
Change Facilitation
Change = External event which occurs to modify the current state. Transition= Internal process of experiencing and adapting to the change.
Ensure change initiatives result in being more than just a rearrangement of the status quo by facilitating the transition process.

11
Each person will move through the transition phases differently, and not everyone will necessarily make it through the process. There is no “right” way to emotionally react to change, especially at first. A description of each phase as well as potential emotional responses is below. Use this to help you first acknowledge your own reaction to the change and where you are in the transition process, and then help assess where others are and how you can facilitate them towards a “new beginning”.
What is happening during this phase? People may experience a loss of control Some may resist /deny that a change is necessary Overreaction can occur as anxiety rises Staff may be giving up areas of competencies Individuals are searching for closure
Potential Emotional responses: Denial Shock Anxiety/stress Anger Ambivalence Frustration Excitement Mourning Energized
What is happening during this phase? Things may feel chaotic and fast-moving People may become less productive and/or feel overloaded Confusion will exist over where people “fit” in the new state Polarization will occur- some will be excited about potential
new opportunities, some will become protective and hang on to the past
Danger of backsliding towards the “old way” will exist side by side with the opportunities the new beginning brings
Potential Emotional responses: Confusion Resentment Anxiety Frustration Discomfort Excitement
What is happening during this phase? Some will feel a sense of being “with it”, others left behind Power juggling may occur as people try to adapt Fears will exist around if the new beginning will work out New identities, strengths and values may emerge
Potential Emotional responses: Renewal Excitement Anxiety
Ending
Neutral Zone
New
Change Facilitation
The Change Transition Process

12
For each transition phase, there are things leaders can do to ease the transition. Before leading others through the change, ensure you have a good understanding of why the change is necessary, what the change includes (and doesn’t include) and how you can explain this to others. As you will see below, during all phases, the key to success is communication, communication, communication. Remember, you cannot “fix” everything for everyone, but you can be honest and timely in your communication and you can be tolerant of various emotional reactions as well as flexible while people discover where they fit within the change.
Facilitating the Change Transition Process
Leadership approaches to facilitate the transition: Communicate (often!) why the change is necessary Ask how people are feeling and inquire about anticipated obstacles for change Validate feelings and offer empathy Acknowledge losses opening and sympathetically Clearly define what is changing and what is not Define which new behaviors are expected
This transitional model of change was pioneered by William Bridges & Associates. Further information building on the dynamics presented in this toolkit can be found in the book Managing Transitions, by William Bridges.
Change Facilitation
A good rule of thumb is to frequently communicate what you know, what you don’t know and when you might know more. Transparency and trust are key.

13
You can lead a change initiative to success by following simple steps to facilitate the emotional transition, incorporate everyone’s best thinking and unblock barriers to implementation. The steps below were developed by incorporating a variety of change management models, which are cited on the last page of the Change Leadership Steps. Everyone’s leadership style is unique, so you should feel free to adapt these steps as necessary to your style and the situation.
Understand the scope of the change Rationale and Impact. What is the rationale behind the change?
How will the change impact you and your team? Roles and Influence. What is your role in the change initiative-
where do you and your team “fit”? How much control or influence do you have in the change?
Consequences. What are the potential positive or negative consequences of the change? What can be done to manage these?
Manage your response to the change Transition. How is your transition to the change progressing?
Check in with yourself early and often. Agreement. Do you believe in the change and think it is fair?
Do you believe the change will actually occur? Resistance. What can you do to overcome any resistance you may
feel towards the change?
Build your support system Mentorship. Who can mentor you through the process of
leading the change? Do you have any peers who can act as thought partners during the process?
Guidance. Who is sponsoring the change? Is there a change initiative team?
Experts. Are there any experts in change or in the initiative that you should connect with?
Understand Change
Stakeholders Vision & Empower
Anchor the Change
Change Leadership Steps
Understand Change

14
Identify stakeholders Brainstorm. Who are all the possible audiences and stakeholders
that fall within your scope? Who will be impacted by the change? Organize. What is the impact for each stakeholder? What
influence may the stakeholder have on the change process?
Assess stakeholder commitment Current commitment. What is the current commitment for each
stakeholder? Target commitment. In order to achieve success, what
commitment do you need from each stakeholder? Commitment gap. What is the gap between current and target
commitment? What obstacles exist to prevent achieving target commitment?
Develop engagement / communication plans Engagement plan. How can you best engage each stakeholder to
achieve the target commitment? Can feedback on engagement be gathered from stakeholders?
Communication plan. How can you best provide general communication to all stakeholders?
Driving force for change Necessity. What is the compelling reason for change? What needs
to happen? How will the future be better than the past? Picture the future. What will the future look like? How can you
paint a picture of the future to inspire others?
Developing a shared vision Parameters. What are the parameters and scope for the change
initiative? What input/ influence will your team have on the vision?
Create Future Images. Using the driving force for change, what possibilities do team members see for the future?
Create Shared Vision. Using the individual ideas for the future, what would a shared vision look like? How can this be communicated as a motivational force?
Empowering broad-based action Enable. How can team members be enabled and empowered to
get involved? Is innovation and experimentation with the change encouraged?
Challenges. What barriers exist and how can they be removed? Short-term Wins. How can short-term, visible and tangible
successes be generated? How can you use these wins to motivate the team?
Change Leadership Steps
Stakeholders
Vision & Empower

15
Reinforce new behaviors Define. What new behaviors are desired for the change to
succeed? How can these expectations be communicated? Reinforce. How can the new behavior expectations be built into
the team culture? How can you, as a leader, model the new behaviors? How can timely and targeted feedback be provided as individuals work to adopt new behaviors? What consequences should be developed to reinforce behaviors?
Remove obstacles Shape the environment. Can the environment (e.g. work
processes, site, schedule) be modified to reinforce new behaviors?
Grow capabilities. What training, tools and procedures are necessary to support the behavior change?
Use feedback Gather input. Can input be gathered on the change implementation?
Are temporary solutions necessary to prevent a backslide to the “old way”?
Revise and refine. Should the change be modified or improved as lessons are learned?
References in Change Leadership Switch: how to change things when change is hard, by Chip Heath and Dan Heath, 2010 Leading Change, by John Kotter, 1996 Our Iceberg Is Melting: Changing and Succeeding Under Any Conditions, by John Kotter, 2006 Managing Transitions: making the most of change, William Bridges, 2009 “Leading Change, Transition & Transformation”: a guide for university staff, The University of Adelaide “Results Delivery: Busting three common myths of change management”, Bain Brief, by Patrick Litre, Alan Bird, Gib Carey and Paul Meehan. http://www.bain.com/publications/articles/results-delivery-busting-3-common-change-management-myths.aspx
Tools and Templates: Change Impact Assessment Stakeholder Commitment Assessment Stakeholder Map Stakeholder Engagement Template Driving Force for Change Template Vision Planning Tool
Change Leadership Steps
Anchor the Change

16
Incorporated into the Change Dynamics and Change Leadership Steps sections are critical success factors to success. While each change effort will be unique in its situation and audience, there are elements of change leadership that are applicable to most change initiatives.
The following critical success factors are gathered from research in change leadership as well as participant feedback from a campus course, “Managing Change in Your Department”, sponsored by CARE Services and summarized in “The 30 Minute Change Primer” provided by University Health Services. Direction Setting The leader must provide clear direction and share a compelling and concrete
vision for the future. Honestly and openly communicate the need (driver) for the change (ensure you
understand the rationale behind the change), benefits of the change and potential negatives of the change.
Emphasis that the necessity of the change. Impact Assessment Acknowledge your reaction to the change and where you are in the transition
process. Identify what you can do to ensure your own “buy-in” with the change. Assess the impact of the change on yourself and on others (Where are people in the
transition process? What emotional responses might you expect?); mitigate and respond to impacts as necessary.
Communication Provide timely and relevant communication on the change; communicate what
you know (and what you don’t know) as soon as possible. Whenever possible, communicate information on how individuals will be
affected (during and after the change). Seek out opportunities for private dialogue with staff.
Empower Others Identify and engage stakeholders at the appropriate levels. Facilitate the process of creating a shared vision for the future, short-term wins and
long-term goals. Empower others to work as part of the team and be involved in change
implementation. Encourage experimentation and innovation; allow mistakes to be made without
threat to reputations or performance ratings.
Critical Success Factors
Critical Success Factors in Change Leadership
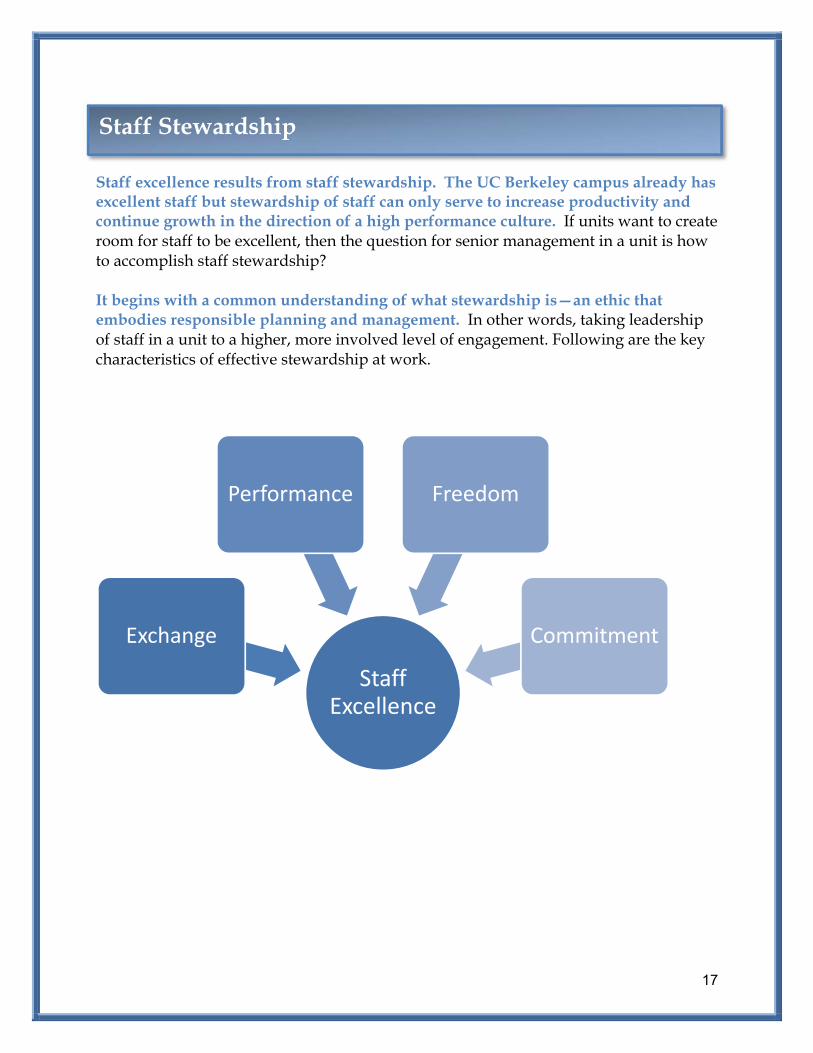
17
Staff excellence results from staff stewardship. The UC Berkeley campus already has excellent staff but stewardship of staff can only serve to increase productivity and continue growth in the direction of a high performance culture. If units want to create room for staff to be excellent, then the question for senior management in a unit is how to accomplish staff stewardship? It begins with a common understanding of what stewardship is—an ethic that embodies responsible planning and management. In other words, taking leadership of staff in a unit to a higher, more involved level of engagement. Following are the key characteristics of effective stewardship at work.
Staff Excellence
Exchange
Performance Freedom
Commitment
Staff Stewardship
18
1. An Effective Exchange of Purpose Oftentimes leaders give staff members as little information as they have to. By contrast, stewardship starts with sharing as much as you possibly can. Your most critical responsibilities are to provide a clear vision of where the team is headed. Those in leadership positions should be compelled to offer clear expectations of the role and results that are expected of the individuals on a team. This also requires you to take the time to explain why you have chosen the path the team will now be on. It’s important that they ask questions; the more confident they feel about your direction, the more likely they are to do a good job helping to get there. It means talking about why you’re seeking certain outcomes, how you think they’ll positively impact all involved, and how you arrived at the decision to ask for those results. The “exchange of purpose is a two-way street: it’s as important that you understand where staff members are headed as it is for them to know your intentions. You need to know what they value, what they hope to attain in the coming months and years, what their vision of greatness is for themselves, what role they would like to play in the organization. You now have the foundation for effective dialogue, negotiation and commitment to mutual success. 2. Emphasis on Performance Results Working through a stewardship agreement helps you to focus more on deliverable results, and less on intentions. Stewardship emphasizes the importance of getting real results that deliver great service and help set the foundation for the high-performing culture Berkeley seeks for all units in the future. You are asking for bottom-line results and a commitment to attain them according to agreed-upon organizational norms and established metrics that were a result of a team effort. When there is agreement that these results will be delivered, more freedom to team members may exist to do the day-to-day, hour-to-hour work as they see fit. In return for this freedom, team members should participate in delivering the results.
Staff Stewardship

19
3. Freedom: You Can Make a Difference Once you’ve negotiated a stewardship agreement and the expected results, you can give team members a chance to design the actual work. Since they are committed to delivering results, it may be suggested that you give them a lot more freedom than usual. They might choose to work from home, work late at night or early in the morning, meet with peers to gather information in person, on the phone or via email. As long as the method is ethically sound, respectful of the needs of others and gets the agreed-upon results, they have a lot of leeway. Freedom does not mean any constructive criticism. Just as you welcome input from team members about how you are as a leader in doing your work, so too they should provide welcome feedback on how they might improve. 4. Conscious Commitment When stewardship is used well, people learn the difficult skills of negotiation and learn to make appropriate compromises and commitments. Committed and caring people are here at Berkeley and the type that we want to work with. What’s the alternative to commitment? One option is action taken out of a sense of sacrifice. Ironically, leaders are often relieved when staff members acquiesce and go along with your way of doing things. But this sort of passivity is likely to boomerang and not be helpful to anyone. Another alternative is for people to act out of a sense of entitlement, the sense that they have something coming to them simply because they are here. A better view is that everyone is entitled to a shot at success and the expectation that you will honor the commitments you have made. Everyone has needs, dreams and desires—and it is helpful when those in management positions are strongly committed to helping team members to achieve those. But to help fulfill those dreams, ask staff to first work to create a great organization. The emphasis is on conscious commitment. When people make choices, they act from personal strength. Common commitment means that all parties will support the plan at hand and each other en route. In summary, staff stewardship is rooted in participation of staff at all levels in a unit. If values are shared, then everyone benefits. Working groups become more effective and may produce higher quality ideas, leadership skills of staff even if not in management positions improve, and the development of a respectful, supportive atmosphere is fostered. Metrics can be more impactful and help all of us to our best work if a unit engaged in staff stewardship.
Staff Stewardship

20
Objectives and Actions in Pursuing Staff Stewardship
Give priority to retention of highly qualified staff in valued positions as the university reorganizes to address budgetary constraints. Actions: 1. Reward staff who assume additional duties due to the reductions in staff and
who continue to excel during difficult times. 2. Clearly define skills and talents needed to excel in these positions and
accurately define positions to reflect expected outcomes. 3. Identify career ladders and training opportunities for advancement. 4. Provide staff annual performance reviews that accurately and honestly assess
performance in current positions and identify development plans for growth
Be an exemplary employer across the entire spectrum of staff. Actions: 1. Recognize and celebrate the value and contributions of staff across all job
groupings or classifications. 2. Ensure that unit leaders enable all employees to take full advantage of the
staff training and development opportunities.
Provide job skill training to staff in a variety of venues. Actions: 1. Increase the current job-skill offerings through the Division of Human
Resources and track usage, reporting to the college/unit leadership on a regular basis.
2. Make greater use of online short courses and training to develop needed skills and talents.
3. Tie training to identified development plans obtained in annual performance appraisals.
4. Require supervisors to undergo training in basic supervisory skills and to refresh and update those skills on a regular basis.
Sustain and, if possible, enhance flexibility in the workplace and workforce. Actions: 1. Reassess job design and work allocation processes in light of recent declines
in the university workforce 2. Encourage supervisors to make arrangements for staff to be away from their
work, if necessary, for purposes of professional development.
Staff Stewardship
Goal 1
Goal 2
Goal 3
Goal 4

21
Missions, visions and values are tools that can be used to inspire team members, create a standard of excellence and provide a sense of purpose. These items are useful not only for team members, but also for customers in conveying a clear sense of direction and commitment. While missions, visions and values share some common benefits, they have very different intensions.
Vision Statements: Paints a picture of the future state you want to achieve (if you fulfilled your mission, how would the world be different?).
Mission Statements: Tells how you will achieve your vision (what does your team currently do?).
Values: Describes what you stand for (how will you behave while working towards your mission?).
When changing a procedure or process (such as adopting metrics for a team), it is useful to connect the change to visions, missions and values. This will make clear how the new procedure/process relates to the team’s purpose, activities, purpose and culture. When developing metrics, the connection to a vision, mission statement or values must be particularly clear. Achieving this connection will accomplish a few things, including:
1. Providing a clear explanation for how each metric relates to the team. 2. Providing a sense of how a team’s activities contribute to the success of the
team’s mission. 3. Providing customers with a measure of progress and commitment towards
achieving the team mission statement. In addition to a team’s unique vision, mission or values, connections for metrics can also be made with higher organizational visions, missions and values. The University’s mission is included on the next page and it is suggested that the team conduct research to determine if other relevant unit/department level missions exist.
Sample University Mission, vision and/or core values include: School of Public Health: http://sph.berkeley.edu/friends/mission.php Business and Administrative Services:
http://bas.berkeley.edu/about/mission Student Affairs: http://students.berkeley.edu/uga/gnr/general/mission.htm Residential & Student Service Programs:
http://students.berkeley.edu/uga/gnr/general/mission.htm
What are Missions, Visions, and Values?

22
We teach - educating students at all levels, from undergraduate to the most advanced graduate level. Undergraduate programs are available to all eligible California high-school graduates and community college transfer students who wish to attend the University of California. Instructional programs at the undergraduate level transmit knowledge and skills to students. At the graduate level, students experience with their instructors the processes of developing and testing new hypotheses and fresh interpretations of knowledge. Education for professional careers, grounded in understanding of relevant sciences, literature and research methods, provides individuals with the tools to continue intellectual development over a lifetime and to contribute to the needs of a changing society. Through our academic programs, UC helps create an educated workforce that keeps the California economy competitive. And, through University Extension, with a half-million enrollments annually, UC provides continuing education for Californians to improve their job skills and enhance the quality of their lives. We do research - by some of the world's best researchers and brightest students in hundreds of disciplines at its campuses, national laboratories, medical centers and other research facilities around the state. UC provides a unique environment in which leading scholars and promising students strive together to expand fundamental knowledge of human nature, society, and the natural world. Its basic research programs yield a multitude of benefits for California: billions of tax dollars, economic growth through the creation of new products, technologies, jobs, companies and even new industries, agricultural productivity, advances in health care, improvements in the quality of life. UC's research has been vital in the establishment of the Internet and the semiconductor, software and biotechnology industries in California, making substantial economic and social contributions. We provide public service, which dates back to UC's origins as a land grant institution in the 1860s. Today, through its public service programs and industry partnerships, UC disseminates research results and translates scientific discoveries into practical knowledge and technological innovations that benefit California and the nation. UC's agricultural extension programs serve hundreds of thousands of Californians in every county in the state. Open to all Californians, UC's libraries, museums, performing arts spaces, gardens and science centers are valuable public resources and community gathering places. The University's active involvement in public-school partnerships and professional development institutes help strengthen the expertise of teachers and the academic achievement of students in communities throughout California. http://www.universityofcalifornia.edu/aboutuc/mission.html
University of California’s Mission

23
Engaging in a collaborative process to create a mission, vision or value set can increase engagement. By involving staff in the creation process they will feel more committed to its success. This idea is known as staff stewardship. Staff excellence and innovation are the result when staff stewardship is cultivated. There are a variety of ways to involve staff in creating a mission, vision or value set. Methods can include: Townhall discussions where ideas are brainstormed Forming initiative teams to create drafts for comment One on one conversations where ideas and feedback are solicited Encouraging submission of ideas via email
Depending on your team culture, a combination of methods may be best. Whichever methods you determine to use for this process, there are key questions you can use to prompt ideas and encourage creativity. Thought Questions for Developing Visions:
If we fulfilled our mission, how would the world be different? If our success could be guaranteed, what would be the end result of our efforts? What are our team activities hoping to achieve?
Thought Questions for Developing Missions:
What are the activities of our team? Why do we conduct these activities? Who are our customers for each activity?
How would we describe our team activities to others? How would we answer the question “what do you do?”
Thought Questions for Developing Value Sets:
What does our business stand for? What values do we find important as we carry out our activities? How would we describe our team culture to others?
Creating a Mission, Vision or Value Set
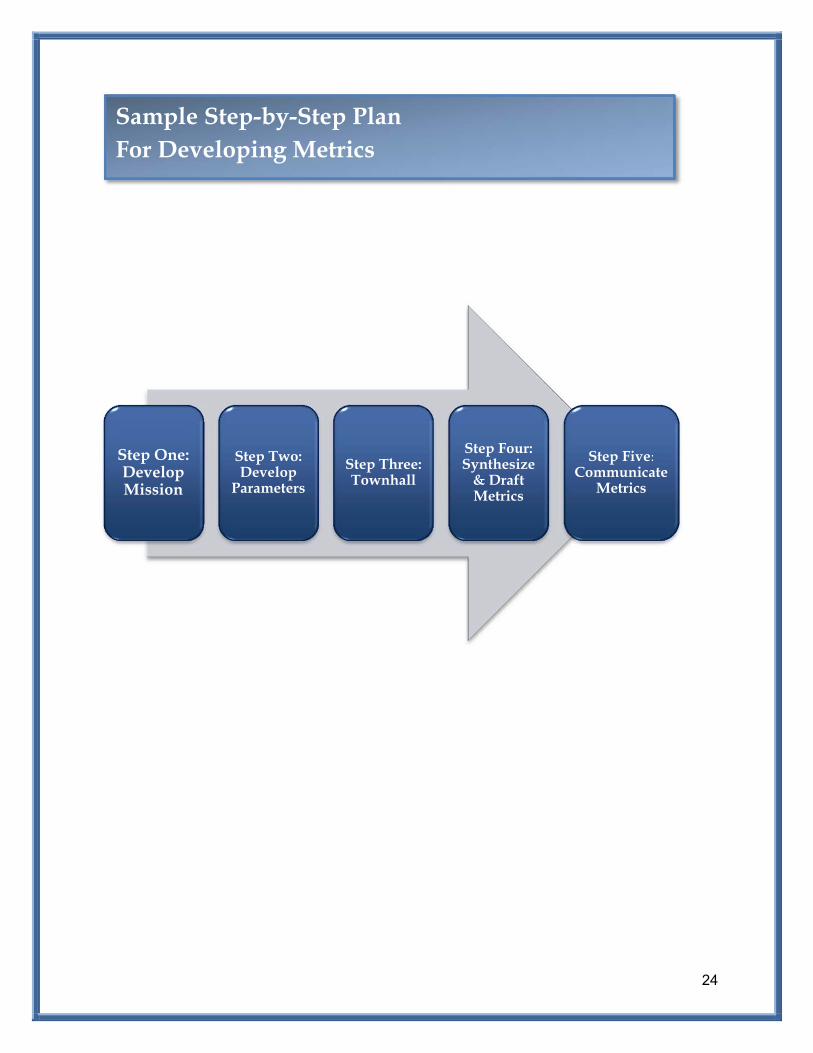
24
Step One: Develop Mission
Step Two: Develop
Parameters
Step Three: Townhall
Step Four: Synthesize
& Draft Metrics
Step Five: Communicate
Metrics
Sample Step-by-Step Plan For Developing Metrics

25
Create Your Unit’s Mission & Vision The first step in developing metrics is to ensure you have a robust and well-understood mission and vision for your team. The metrics process starts here because before you can implement measures, everyone on your team must understand what you are trying to achieve (your vision) and how you are planning on getting there (your mission).
If you attempt to implement metrics without rooting them in a solid foundation of team mission and vision statements, you may run into difficulties including: Customers and/or team members may not see the value in your metrics.
Individuals may ask “Why are we doing this? How is it helpful? Is this just more busy work?”
The metrics you choose may focus your attention on activities that are not crucial to your operations, or achieving your vision. This may hinder your progress towards your vision.
An incorrect perception of “what you do” (mission) and “why you do it” (vision) may develop.
Your metrics may not lead you down a path of continuous improvement. In order to achieve continuous improvement, your metrics must provide you valuable information about your activities and progress towards achieving your vision.
Step One: Develop Mission
Vision Statements: Paints a picture of the future state you want to achieve (Where is your team going? What is your direction? Mission Statements: Tells how you will achieve your vision (What does your team do?)
26
Depending on the scope of your team, you may find it useful to develop a unique vision and mission and/or use a broader, organizational vision and mission. For example, a small special project initiative team in Student Affairs may want to develop a unique vision and mission as well as look at the UC Berkeley Student Affairs mission: http://students.berkeley.edu/uga/gnr/general/mission.htm. The University’s mission is included in the Mission, Visions & Values section of this toolkit for your reference. Your team may want to conduct independent research to find other applicable organizational missions and visions to guide you. When creating your mission and vision, using a collaborative process can increase engagement, resulting in a better product and ensure everyone is “on board”. If you involve your team in creating the mission and vision they will be more committed to achieving success, and have a deeper understanding of why measuring the progress towards success (using metrics) is beneficial. Key point: Whichever collaborative method you choose for creating a mission
and vision, remember that it is important to lay out the parameters of the process. How will the final mission and vision be decided? How will the goals for supporting the mission be determined? It is useful for the team to understand their roles in decision making so that they can be allowed full creatively. The next step will guide you further on this point.
Step One: Develop Mission

27
After setting the mission and/or vision for the unit, the next step is to decide on the questions you are trying to answer? What are the goals to support the mission and who will determine them? How will staff support these goals and how will success be measured? Before creating metrics, the next step is rooted in the decision-making process. Sounds simple, but there are various ways in which a team can reach consensus about how to proceed. Decision making is an essential leadership skill. If you can learn how to make timely, well-considered decisions, then you can lead your team or unit to well-deserved success, meet metrics, and enter a new era of continuous improvement and a high performance culture. If, however, you make poor decisions, the work of the staff in a unit will be undermined and not meet metrics set by the goals. No one succeeds. There are many ways to improve decision-making processes and the following are some good options to consider for your unit. Each of these processes includes a short “how-to” section and their relation to developing metrics based on aligning goals with the mission of the unit as well continuation of engaging staff in processes related to the work they do or will do in the future. In addition, more in-depth templates are available in the tool section of this guide.
Pareto Analysis
Paired Comparison Analysis
Force Field Analysis
RAPID
Step Two: Develop Parameters

28
Pareto Analysis Based on the Pareto Principle, this process is also known as the "80/20 Rule" – which is the idea that 20% of causes generate 80% of results. With this tool, we're trying to find the 20% of work that will generate 80% of the results that doing all of the work would deliver. The figures 80 and 20 are illustrative – the Pareto Principle illustrates the lack of symmetry that often appears between work put in and results achieved. For example, 13% of work could generate 87% of returns. Or 70% of problems could be resolved by dealing with 30% of the causes. Pareto Analysis is a simple technique for prioritizing possible changes by
identifying the problems that will be resolved by making these changes. Paired Comparison Analysis This tool can be used to weigh the importance of options relative to each other and can be used to make “apples to oranges” comparisons. It is particularly useful where you do not have objective data to base this on. This makes it easy to choose the most important problem to solve, or select the solution that will give you the greatest advantage. Paired Comparison Analysis helps you to set priorities where there are
conflicting demands on your resources. Force Field Analysis This analysis tool is useful for weighing the pros and cons of a decision. By carrying out the analysis you can plan to strengthen the forces supporting a decision, and reduce the impact of opposition to it. Where you have decided to carry out a plan, Force Field Analysis helps you identify changes that you could make to improve it. Force Field Analysis is a useful technique for looking at all the forces for and
against a plan. It helps you to weigh the importance of these factors and decide on implementation.
Step Two: Develop Parameters

29
RAPID The last decision-making tool that is rooted in the “who” rather than “what”. It can be used to assign roles so that everyone knows who is accountable. Every success, every mishap, every opportunity seized or missed stems from a decision someone made-or failed to make. Yet in many units, decisions routinely stall the efficiency of a team of staff thereby decreasing everyone’s performance. The culprit? Ambiguity over who's accountable for which decisions. In one auto manufacturer that was missing milestones for rolling out new models, marketers and product developers each thought they were responsible for deciding new models' standard features and colors. Result? Conflict over who had final say, endless revisiting of decisions-and missed deadlines that led to lost sales.
To assign clear roles for the decisions that most affect your unit’s performance, the acronym for RAPID is used. Who RECOMMEND a course of action on a key decision? Who must AGREE to a recommendation before it can move forward? Who PERFORM the actions needed to implement the decision? Who’s INPUT is needed to determine the proposal's feasibility? Who DECIDES-or brings) the decision to closure and commits the organization to implement it?
Key Point: The RAPID tool leads us to the next step. After the decision-
making process has been chosen and some decision made, it’s time to take it to staff. This is where staff stewardship continues to play an important role in developing metrics in the unit. The next step will further guide you on this point.
Source: http://www.bain.com/publications/articles/who-has-d-how-clear-decision-roles-enhance-organizational-performance.aspx
Tools & Templates: • Pareto Analysis • Paired Comparison Analysis • Force Field Analysis
Step Two: Develop Parameters

30
You have now laid the foundation for gathering feedback from staff on developing metrics for continual improvement. The mission and vision will provide the context for the metrics while the parameters you have communicated will guide the process. When gathering input, there are a variety of methods that can be used. In this step we will go through how you can use a “townhall” method; keep in mind as you reading that you may want to adapt this method to better fit your team’s culture and needs. The term “townhall” can mean a variety of different things; here are we are using it as a generic term to mean an input gathering session where all team members are invited to share ideas, perspectives and opinions. The key factor which will make your townhall a success is operating from participatory values This means operating from a place that:
● Encourages full participation, ● promotes a mutual understanding, ● seeks inclusive solutions, and ● assumes shared responsibility.
There are many facilitation techniques that can be used to promote participatory values. A few of the most important techniques are summarized in the “Facilitation Cheat Sheet” found in the Tools Section. To learn more on facilitation, you can contact the UC Berkeley Center for Organizational and Workforce Effectiveness (COrWE) or the Berkeley Facilitators Network (BFN) staff organization. You may also find it useful to bring in a neutral third party to facilitate your townhall discussion so that you can fully participate in the activity. In addition to utilizing good facilitation techniques to encourage participation, you can also employ activities & processes which encourage participation. A few suggested activities listed below and their defined processes are in the next pages. Structured Go-Round Online Brainstorming Small Groups Individual Writing and Sharing The 5 Whys Brainstorming
Step Three: Townhall

31
Structured Go-Arounds: Structured Go-Arounds can be used to open or close a meeting. They provide a structured way for individuals to provide thoughts on a topic and can affirm that everyone’s participation is valuable. For this activity, you will go around the room and have each participant share thoughts on a topic (often with a guideline of 1-2 minutes for sharing). Online Brainstorming: There are many tools online that can help to facilitate brainstorming before a townhall is even convened. Online brainstorming via such tools as a forum on bspace or a bulletin board on wallwisher (wallwisher.org) can start people thinking about the topic so that they come to the town hall meeting prepared and ready to discuss. Completing online brainstorming exercises not only helps with preparation but it also provides an outlet for those individuals who do not enjoy thinking “on their feet” in a large group setting. If your team members do not have access to computers, you can also use a bulletin board in the hallway for group brainstorming before a meeting. Small Groups: Small groups can allow for greater participation from individuals. Quieter individuals are more inclined to talk in small groups while dominant personalities have a lesser effect. It is often useful to structure a townhall with a few small group activities scattered throughout the meeting, so as to break up the time and keep energy high. A useful technique is to have each small group “report out” findings to the large group at the conclusion of the activity. Individual Writing & Sharing: Often times individuals need time to formulate their thoughts on a particular topic before they feel comfortable sharing in a large group. Setting aside time in a meeting for people to individual think through a topic before you ask them to share can result in increased participation. For this activity, you will have individuals individually write on a topic or question for a set period of time (often 5 minutes) and then provide an opportunity for them to share what they wrote.
Step Three: Townhall

32
The 5 Whys: This activity is a question-asking technique that allows the facilitator to get “below the surface” and find the root cause to a problem. The technique starts when someone voices a problem, such as “we aren’t responding to customer requests fast enough”. The facilitator then asks “why?”, listens for an answer (such as, “because we are understaffed”) then asks “why?” again, until enough iterations (usually five) have gone one that the root cause of the problem emerges. At the heart of this activity is the theory that people do not fail, processes do. Knowing the root cause of a problem can help you see where a metric is needed to drive continual improvement. Brainstorming: Brainstorming is a method for individuals to quickly generate a large quantity of ideas. All ideas are given equal weight and judgment is reserved until after the brainstorming activity is completed. It is often useful to have someone record the ideas on a flip chart so that the entire group can view. Another variation of this activity is to have everyone generate ideas on post-its and then share as a group. After the listing activity is completed, ideas can be categorized and or voted on for inclusion. No matter which activities or processes you use to increase participation, you will also want to consider how you will focus your team on the topic of metrics. You can use a set of questions to frame the activity and provide a useful direction. Key Point: There are many ways to involve your team in developing metrics.
The key is to provide a pathway for communication and encourage participation from all. Allow team members the opportunity to be innovative with developing measure for their progress. Doing so will provide you with a more “real” measurement of the work and will increase buy-in and commitment from team members. The next step will help you take the data gathered and synthesize it into draft metrics.
Tools & Templates: • Facilitation Cheat Sheet
Step Three: Townhall

33
The first three steps have now set the foundation for developing metrics. A mission or vision has been established, goals have been set, buy-in and feedback have occurred, and now it’s time to pull it all together. Since the most effective and useful metrics are designed with the end in mind, the efforts leading up to this point ensure that there is no wasteful time spent on data collection that cannot be used, money, and resources in creating a flawed metric. In synthesizing information to build metrics, the metric template in this toolkit can prove useful in organizing what is needed to proceed. The defined areas below, which we can call building blocks, are useful in asking the right questions to determine the best actions to be measured which will meet the unit’s goals. Using processes identified in earlier steps such as the “5 Whys” or other effective processes such as brainstorming activities, mind maps, process mapping, and stakeholder analysis are great tools to get to the finish line of developing the metric.
1) Measurement Intent
2) Measurement Definition
3) Baseline
4) Target
5) Progress to Target
6) Who Sets Target
7) Who measures/reports
8) Frequency of update
Step Four: Synthesize & Draft Metric
Metric Building Blocks

34
Developing your metric based on these key points will lead to success.
Test-drive your metric. It’s important to engage key stakeholders to see if the metric makes sense to the team, especially any stakeholders who will be recipients or clients of the metric. Surveying staff allows management to determine the extent to which employees believe their organizational culture promotes improvement in processes, products and services and organizational outcomes.
Brainstorm many metrics. Constructing a metric matrix provides opportunity to set priorities and make comparisons before paring down to the best metrics to use. Further, a matrix allows you to see metrics in a list, identify their importance for monitoring success (high/low), the ease of obtaining data on the metric (easy/feasible but requires effort/difficult) and the cost of data collection (financial and resources).
Keep metrics simple. The concept of keeping metrics simple promotes the
idea of both keeping the data collection and analysis relatively easy and keeping the metric itself memorable and meaningful to staff and customers. Metrics must be easy enough to understand so that they can drive behavior.
Focus on a few metrics. Limit to a representative set of metrics that monitor
critical areas of performance rather than have too many metrics that cloud the picture. At the same time, it is important to have more than one metric, in most cases, as each metric tells only a piece of the story.
View metrics as indicators. Metrics are not facts, they are simply indicators which can start a conversation around continuous improvement. By themselves, without analysis and narrative, metrics do not have meaning; they must be put into context.
Step Four: Synthesize & Draft Metric

35
Operational metrics are about meeting team goals. Rolling out metrics at the
unit level is about supporting and aligning work with goals. It is not about transactional or individual metrics characterized in the earlier sections of this toolkit.
Metrics drive behavior. Good metrics should drive the behavior that will help the team reach common goals.
Key Point: If the first three steps of this plan included the recommended
concept of staff stewardship then the metric being created should reflect involvement of the recipients of the metric: the staff of the unit. As mentioned in staff stewardship, members of a unit contributing to facets of mission building, goal-setting, decision-making, and feedback opportunities, will be more apt to understand and meet the goal of the metric. Any measurement of an individual or team that is being placed on them without consideration of the work they already do will not move the unit forward.
Tools & Templates: • Metric Development Template
Step Four: Synthesize & Draft Metric

36
The last step in this sample plan centers on communication. When getting and maintaining buy-in from any level of staff in an organization, it is best to over-communicate, even if it means being repetitions or providing information in every possible communication vehicle available to the unit. The CalMetrics LDP Project Team conducted a focus group and sent out a survey on metric implementation in early 2012 and the concern with bad or insufficient communication around metric implementation was a significant theme. In the current climate of change the University is going through during the era of Operational Excellence, a high performance culture is possible through clear communication of goals and what is expected of units to contribute to the overall goals of the mission of Berkeley. Communication plans can help bring about the successful implementation of a solution or project and undoubtedly, a metric. This especially holds true in helping a unit working together towards goals based on metrics created by the leadership with the staff of the unit. Using the RAPID tool discussed earlier would be useful in determining who and how to communicate metrics to all staff in a unit. Regardless of how it is done, communication plans and other tools listed in this section alleviate any ambiguity and support ongoing progress towards goals of the unit. Appropriate communication plans increase the probability of continuous stakeholder buy-in. Furthermore, a communication plan lists necessary steps for the implementation, provide a mechanism for tracking progress, and document who should be notified and what point.
A prose version or graphical representation of the drafted metric is often helpful for recipients of the metric. Metrics should be simple but even so, a visual graph, chart or other graphic tells a story that can then be used later in continuing to communicate the metric results.
Step Five: Communicating Metrics
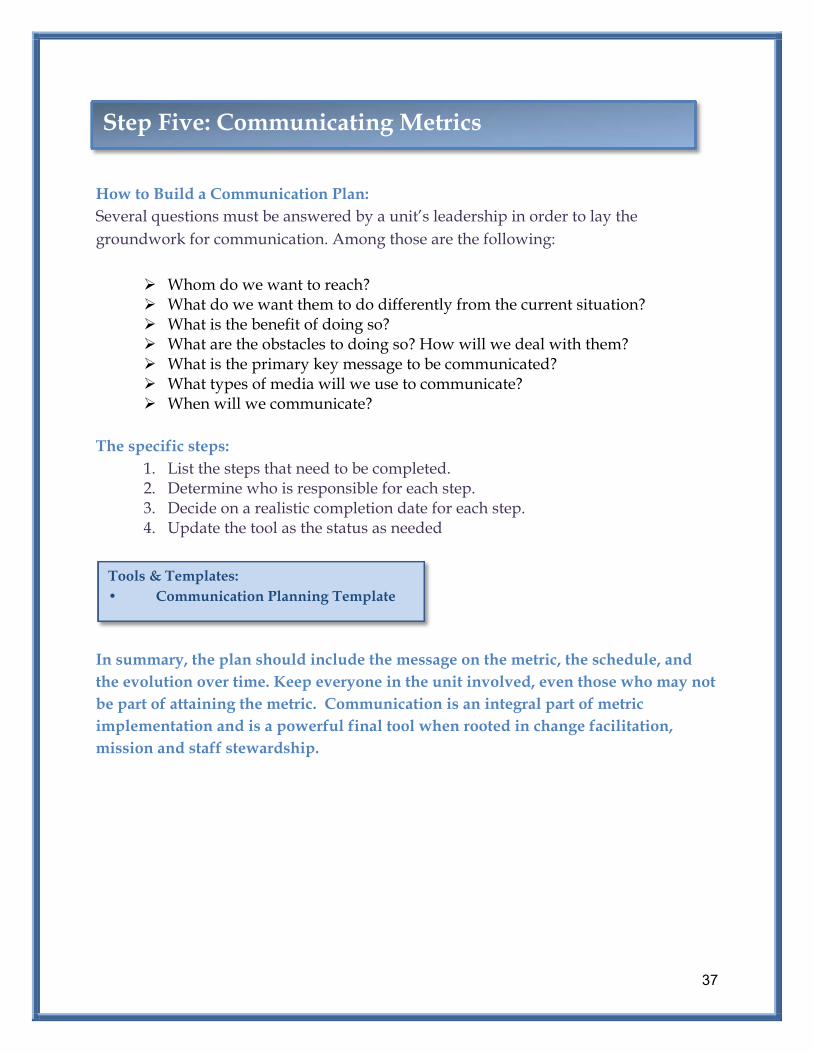
37
How to Build a Communication Plan: Several questions must be answered by a unit’s leadership in order to lay the groundwork for communication. Among those are the following:
Whom do we want to reach? What do we want them to do differently from the current situation? What is the benefit of doing so? What are the obstacles to doing so? How will we deal with them? What is the primary key message to be communicated? What types of media will we use to communicate? When will we communicate?
The specific steps: 1. List the steps that need to be completed. 2. Determine who is responsible for each step. 3. Decide on a realistic completion date for each step. 4. Update the tool as the status as needed
In summary, the plan should include the message on the metric, the schedule, and the evolution over time. Keep everyone in the unit involved, even those who may not be part of attaining the metric. Communication is an integral part of metric implementation and is a powerful final tool when rooted in change facilitation, mission and staff stewardship.
Step Five: Communicating Metrics
Tools & Templates: • Communication Planning Template

38
Developing and implementing metrics to assess goals of a unit in a new era of continuous improvement is not a one-time project. It is a dynamic process that requires constant evaluation, feedback, communication, and re-evaluation in order to sustain them. Successful implementation of metrics will require constant monitoring and communication about positive or negative results that may or may not need revising.
In this section, things to consider… Design into Organization Communicating Results Using the Results Incentives and Reinforcements
HOW TO SUSTAIN METRICS?
HELPING US DO OUR BEST WORK
39
Metrics can and should become a part of your office culture. While it may not seem like it at this point, you can lead your organization to be engaged in the continuous use of metrics. Fostering a common language around continuous improvement and institutionalizing various processes will make it clear to everyone in the unit, whether new or someone who has been around for years, that metrics are a common and normal practice. The sustainability of metrics is not just about implementation, but also about adoption. Below are a few suggestions of where you can begin to design metrics into your organization: Hiring Process: During the hiring process, make it clear to potential candidates
that methods of evaluation are regularly used to determine the effectiveness of processes and practices. It should also be communicated that metrics can lead to opportunities that foster a space for team members to be innovative, creative, and allow them ownership in finding ways to improve the work they do.
Team Member Orientation: As you hire new team members, the orientation to
your unit is another opportunity to inform them of specific metrics that are in place and any highlights of metrics already used. Being transparent about this information up front allows team members to be clear on what the expectations of the team are and how they can contribute.
Staff Training: As stated earlier, some results may highlight the need for team
members to be trained on a new system or a different process. Thus, providing additional training will result in greater efficiency in their work. Trainings also demonstrate that you are investing in their development and thus the team member will feel a sense of value to the team.
Design into Organization

40
Designing metrics and collecting the feedback is not enough. The data will still need to be synthesized and analyzed. However, what happens once this information has yielded its results? Do you share it? Who do you share it with? What format should you use for sharing the information? Did the metrics produce the information you were looking for? The important piece is that you want to instill pride in your results so the sting of metrics is minimized. Who do I share with? This answer will mainly depend on the information you collected. In certain instances, you may need to share your results with various stakeholders, while other data will be shared publicly. If the data is about the work your team members are doing on a day-to-day basis, and they would benefit from the results, then they should have access to the information. The more transparent a leader is about the intent and purpose of metrics, the easier and more comfortable it may be to share the results. Changing a work culture in the beginning can be difficult or awkward, but consistency of transparency will help normalize and institutionalize the use of metrics in your organization. The following questions can be used as a guide in your process of deciding what information to share and with whom: Who are my stakeholders and do they have a vested interest in this data? Is the audience that I share this data with able to do something with it? Will the data be misinterpreted if it is used as a stand-alone item? What context is necessary to understand and get the full picture of the data? Once you share it, are you prepared to be asked, “Now what?” Is there danger of the data singling out a specific person on your team?
How do I share the results? Once you have determined who you are going to share the results with, you must consider the best method of illustrating the data. Your communication about the results should include your analysis, some sort of graphical or pictorial representation that paints a picture of the metric result, and a narrative description of what the metric is telling the viewer. You want to make sure that you are as clear and simple as possible in your presentation. Consider the question above, “What context is necessary to understand to get a full picture of the data?”
Communicating Results

41
At the beginning of the toolkit, benefits to using metrics were identified. Results are your call to action. Enable employees to see and act on potential organizational improvements. Most times solutions generated from front-line staff can be the most fruitful for the organization and can be the easiest to quickly implement. Establish feedback loops. Connect with stakeholders to determine whether the metrics and data continue to be effective in achieving the goals of the unit/university. Leverage Successes. Use successes to see how other areas can also be improved. The principle of Appreciative Inquiry states that a positive focus tends to deliver a positive effect. “When you focus on what works and you dream of the possibilities, it is very inspiring to people. (The Art of Appreciative Inquiry, HBS Article) Analytics Value Chain. Google has identified a “Analytics Value Chain” (AV Chain) which shows the progress companies can go through in using metrics as analytical tools. The AV Chain has the following stages (from initial to robust):
○ Opinion: decisions are made based on experience and intuition. ○ Data: quantitative and qualitative information exists, but is
unstructured and not integrated. ○ Metrics: common language with accepted definitions, enabling
benchmarking and improvement. ○ Analysis: unearths correlations, identifies trends and special
populations. ○ Insight: draws specific findings based on credible evidence to influence
decision makers. ○ Action: enact a process and policy change; continue to measure impact.
Today, the new world of metrics is predictive analytics.
How to Use Results

42
“Consequences” and “accountability” can elicit cringes or menacing glances. While both are important to a unit’s health and credibility, there is a need to reframe and unpack the terms and while at the same time balancing these concepts with rewards and incentives. Change can take a toll on employees and through our research we found that even small gestures to recognize their work can go a long way in leading a team through the transition. When looking at metrics results and how they can potentially tie to performance management, also consider the areas for celebration and positive reinforcement. As a manager, this is where you can model continuous improvement. Reward individuals who have contributed a new idea or method for improving a process, or for just doing an outstanding job. This can be a personal note of acknowledgement or a public recognition. There are also campus-wide initiatives that you can take advantage of such as SPOT awards and the Chancellor’s Outstanding Staff Award. Professional development opportunities can also be seen as individual rewards, particularly if this is something the team member has asked for. Celebrate benchmarks as a team. It is very easy to get caught up in the day-to-day work, especially when so many units are overworked and understaffed. Feeling like everyone is working from deadline to deadline is also common. However, it is equally important to stop and acknowledge the milestones. Appreciate the team’s efforts, time, and energy that they spent to get there. Contextualize behavior by considering the severity of the behavior and how aware the individual was of such behavior. If further training is needed to prevent the unwanted behavior then provide the team member with the time and resources to engage in the additional training. Good luck on your journey in developing, implementing, and using metrics to help your organization do their best work! Envision your model organization and how metrics can help you get there!
Incentives & Reinforcements

43
The following templates are a starting place for managers to define, create, and sustain metrics for their unit. The variety of options is meant to be a menu to pick and choose what works best for any given unit on campus. Ongoing support of developing and instituting metrics outside of the toolkit will also be plentiful in the future.
In this section, things to consider... Metrics at a Glance Transactional vs. Operational Metrics Reference Change Impact Assessment Stakeholder Commitment Assessment Stakeholder Map Stakeholder Engagement Template Driving Force for Change Template Vision Planning Tool Pareto Analysis Worksheet Paired Comparison Analysis Worksheet Force Field Analysis Worksheet Facilitation Cheat Sheet Metric Template Communication Plan Template
WHAT ARE THE TOOLS?
HELPING US DO OUR BEST WORK

44
Metrics help us do our best work. A metric is a fair, simple and transparent measure of a unit’s ability to accomplish goals.
Key Characteristics for Success Metrics are indicators Metrics are transparent Metrics are tied to mission and/or vision Metrics are S.M.A.R.T. : Specific, Measurable, Actionable, Relevant, Timely
Benefits Operational metrics can empower Operational metrics drive behavior Operational metrics enhance credibility
Pitfalls and Mitigation Strategies Reluctance: Clarify and empower team members on the benefits of metrics. Data Overload: Think through data collection before you put metric in place. Metrics as Truth: Use metric to ask questions, not make judgments on metric. Perverse Incentives: Ensure your metrics are driving the right behaviors.
When Creating Metrics Consider… Change Facilitation Staff Stewardship Mission Planning
Sample Step-by-Step Plan Step One: Develop Mission Step Two: Develop Parameters Step Three: Townhall Step Four: Synthesize and Draft Metrics Step Five: Communicate Metrics
Design into Organization Hiring Processes Employee Orientation Staff training
Communicating Results Design metric with a built-in feedback loop Determine stakeholders Be transparent about intents and purposes Share, share, share
Metrics at a Glance

45
To understand transactional and operational metrics, it is useful to have an understanding of the logic model, or the systematic method of looking at “what your team does and why”.
The Logic Model The logic model in action:
Transactional vs. Operational Metrics Reference
Inputs Resources applied
(finances, time, people)
Activities Actions taken
Outputs Products, projects, services
or processes completed
Outcomes Results of activities & outputs
What a team does How a team makes a difference
Inputs Two full-time laboratory
safety inspectors
Activities Laboratory inspections are
conducted
Outputs Laboratory inspections are completed; report are filed Outcomes
Laboratory accidents decrease, safer workplace is
created

46
Both transactional and operational metrics provide an indication of where investigation is needed to continually improve. The key difference in transactional and operational metrics is that one will point you to system improvements while the other can lead to both system and behavioral improvements. Transactional Metric Purpose: Transactional metrics measure a team’s progress towards achieving the team vision. In other words, transactional metrics measure a team’s “activities” (what they do) and “output” (products, projects, services or processes completed). Investigating this measurement can highlight where system improvements are needed, such as increased staffing, new technologies or modified procedures. Because transactional metrics typically ONLY measure activity, they do not tell “the whole story” and should be used sparingly. Operational Metric Purpose: Operational metrics measure the changes a team makes in the real world towards achieving the team vision. In other words, operational metrics measure the “outcomes” of the team’s activities and outputs. An operational metric can highlight if a team is heading in the right direction and if they are being successful. Operational metrics can drive behavior and increase employee engagement as they see real progress and impact of their work. Operational metrics tell a more complete story of progress and should be shared with team members.
Transactional Metric Example Operational Metric Example
Number of customer concerns handled per day Satisfaction survey results from customers
Number of career development workshops provided to graduate students each year
Number of graduate students with fulfilling careers (or further educational plans) after graduating from UC Berkeley
Number of students who attended information session for XX graduate school
Number of students who submitted applications for XX graduate school
Remember, a healthy and high-performing team is constantly looking to make sure their outcomes are clearly and purposefully tied to their vision; this process is backed and informed by the operational metrics they use.

47
The purpose of a change impact assessment is to highlight the impact of proposed changed on the organization, people, processes and technology. Having a greater understanding of this impact can help to:
Develop a change facilitation strategy and identify areas that need greater attention
Understand the effects of the change on people and how these affects can be best managed
Clarify who the stakeholders are, their potential concerns and levels of involvement
STEP ONE: List the main changes planned in order to realize the change vision. Use additional paper if necessary. The questions below may help in brainstorming changes associated with the change vision.
1. Are there any changes to the proposed organizational structure? 2. Major process changes? Activities / tasks introduced or eliminated? 3. Locational changes? 4. Personnel changes? 5. Will new technology be needed or introduced? Will any legacy systems be retired?
Change Impact Assessment

48
STEP TWO: Plug in each of the major changes to the chart below. Next add in a short description of the “as-is” state and the “to-be” situation. Finally, add the impact for this change in moving from the “as-is” to the “to-be”. The impact could be: jobs that will change, effect on business as usual, group dynamic changes, numbers of people involved, etc. As you list impacts, do not forget the personal impact of the change and how it may affect your staff “transition” from the “as-is” to the “to-be”. Note: This step may be one where you can involve your staff in brainstorming the impacts of the change. Share with staff the major changes and inquire about what they think will be positive outcomes and/or issues that may need to be mitigated.
Major Change “As-Is” State “To-Be” State Impact of
Change

49
STEP THREE: Transfer the major changes and impacts to the chart below. Next, list “action ideas” for managing the impacts as necessary. Some action ideas may be centered around mitigating the impact while other will be focused more on promoting or highlighting the impact. Note: This is another opportunity to engage staff in finding solutions and being creative with the change process. Ask staff for their ideas on handling the various impacts and/or provide opportunities to get involved with “action items”. Above all, do not forget to communicate findings and offer an opportunity to provide feedback.
Major Change Impact of Change Action Plan

50
The purpose of this tool is to help you assess the current and target levels of commitment for stakeholders as well determine what you can do to “close the gap”. You will want to use this assessment for those stakeholders you have determined could be critical to the success of your project; this may include stakeholders whom you’ve decided to actively engage, stakeholders who may be highly impacted by the change and/or stakeholders whom have a high level of influence on success.
STEP ONE: In the table on page two, record all stakeholders whom you would like to include in this commitment assessment (far left column). STEP TWO: For each stakeholder, ask yourself which of the following captures their current level of commitment:
Blocker – stop it from happening
Neutral – Let it happen
Supporter – Hope it happens
Leader – Make it happen In the table on page two, write “current” in the corresponding box underneath the current level of commitment. STEP THREE: Consider where you need each stakeholder’s commitment to be in order to ensure the success of the change. Remember that not everyone has to be in the “leader” column. In the table on page two, type “target” in the box underneath the level of needed commitment. If the current and target levels of commitment are the same, change the text to read “current = target”.
STEP FOUR: Determine the “plan to address the gap” for each stakeholder. Consider the following:
If current = target: no plan is necessary and you can write “sustain” in the “plan to address the gap” column.
If current < target: in the “plan to address the gap column”, record ideas for increasing commitment.
Remember: Stakeholders are a valuable asset; they can help support your efforts if you take time to ensure they are adequately informed and engaged. Plan to re-assess your stakeholder commitment levels over time and use the Stakeholder Engagement Plan to develop methods for keeping stakeholders involved.
Stakeholder Commitment Assessment

51
Stakeholder Commitment Assessment Table
Stakeholder Name
Blocker “Stop it from happening”
Neutral “Let it happen”
Supporter “Help it happen”
Leader “Make it happen”
Plan to Address the Gap
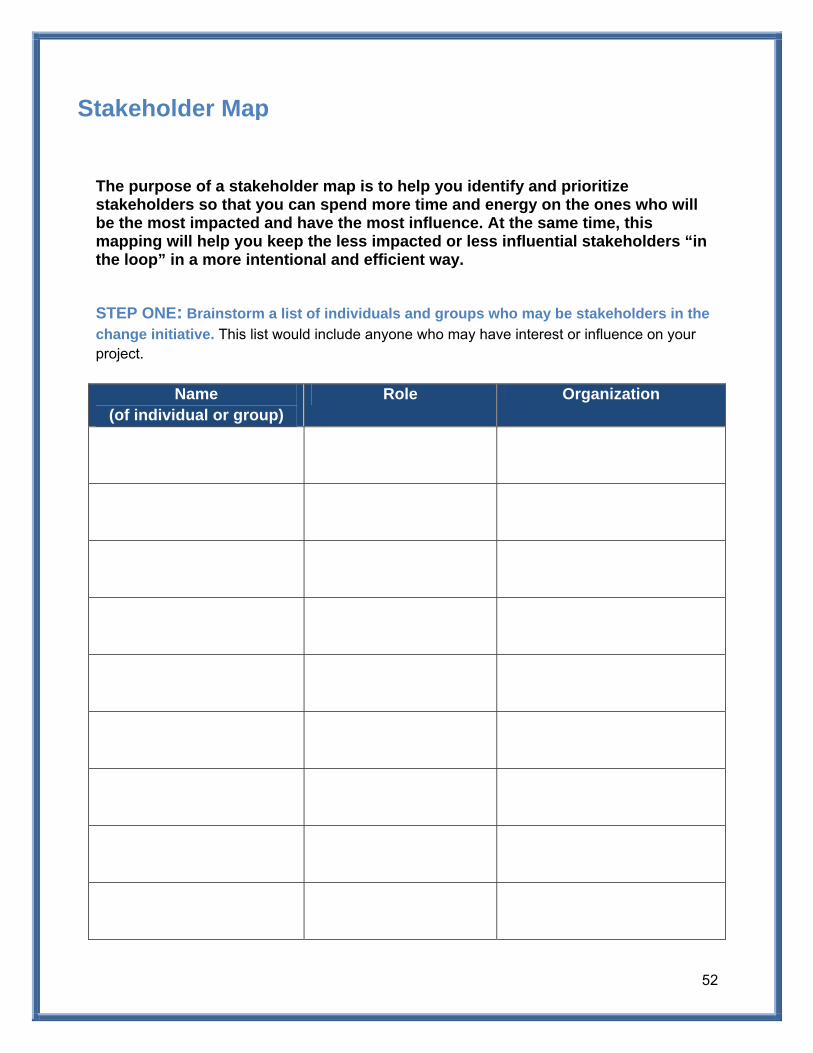
52
The purpose of a stakeholder map is to help you identify and prioritize stakeholders so that you can spend more time and energy on the ones who will be the most impacted and have the most influence. At the same time, this mapping will help you keep the less impacted or less influential stakeholders “in the loop” in a more intentional and efficient way.
STEP ONE: Brainstorm a list of individuals and groups who may be stakeholders in the change initiative. This list would include anyone who may have interest or influence on your project.
Name (of individual or group)
Role Organization
Stakeholder Map
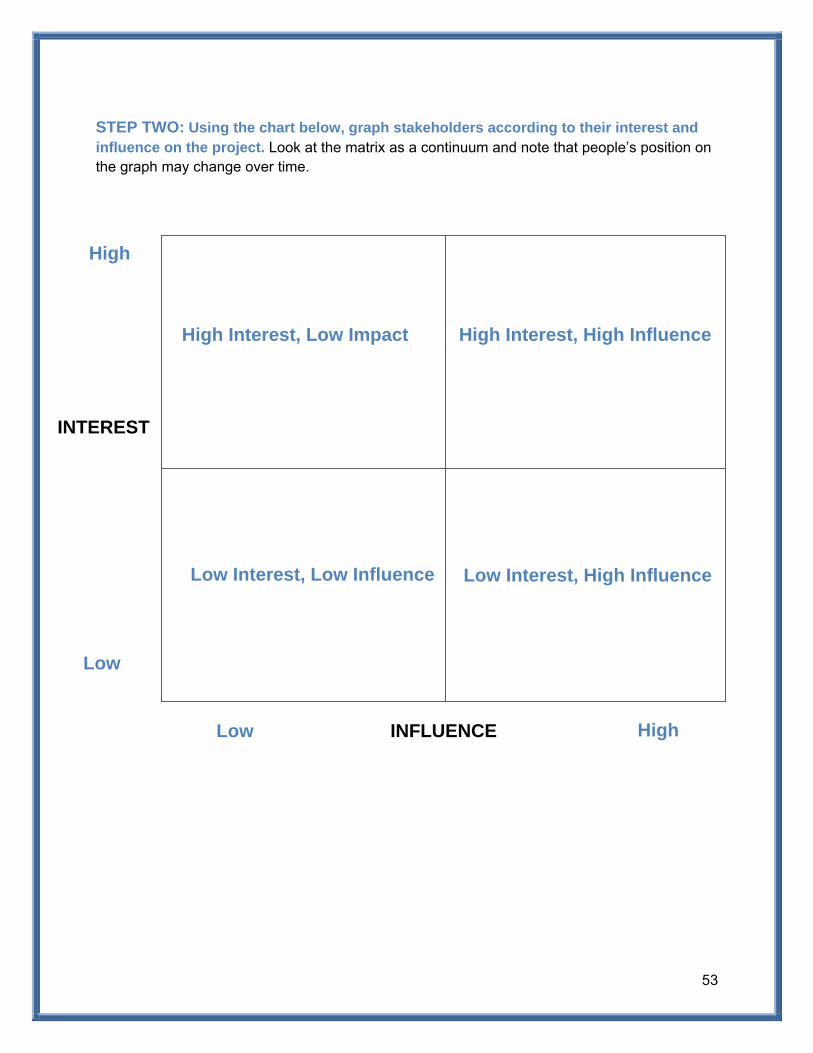
53
STEP TWO: Using the chart below, graph stakeholders according to their interest and influence on the project. Look at the matrix as a continuum and note that people’s position on the graph may change over time.
INFLUENCE
INTEREST
High Interest, Low Impact High Interest, High Influence
Low Interest, High InfluenceLow Interest, Low Influence
High
Low
Low High

54
STEP THREE: Using the Stakeholder Analysis Map, classify each stakeholder into one of the four categories listed below.
High Impact, High Influence: Stakeholders who will be significantly impacted as a result of the changes and have significant ability to affect success of the change. These stakeholders should be actively engaged in the change process.
High Impact, Low Influence: Stakeholders who may be significantly impacted but whom do not have a great ability to affect success. Take time to understand the needs of these stakeholders and mitigate the impact where possible. Depending on the level of impact, you may want to actively engage some of these stakeholders as well.
Low Impact, High Influence: Stakeholders who will not be significantly impacted but whom do have high influence on success. Be sure to involve these stakeholders in the change so you can benefit from their influence.
Low Impact, Low Influence: Stakeholders who will not be significantly impacted and do not have high influence. These stakeholders should be kept informed.
Keep in mind: High Impact Stakeholders:
Stakeholders who will be impacted the most will need many opportunities to provide input to decision‐makers. Ask for feedback often and follow through on it afterwards.
It is critical that high impact stakeholder needs are understood.
High impact stakeholders may need assistance in getting through the transition process; clear communication is needed on what is changing, what is staying the same and how they will be affected. In addition, these stakeholders need to understand if responsibilities, roles or expectations are changing.
High Influence Stakeholders: Stakeholders who exercise a lot of influence should be consulted for key decisions.
Involve high influence stakeholders early so they can be most effective in assisting with the change.
It may be valuable to ask some of these stakeholders for help in increasing the commitment of other stakeholders.
For those stakeholders who you decide should be actively engaged in the process, use the Stakeholder Commitment Assessment to assist you in determining the current and target levels of commitment towards the project and the Stakeholder Engagement Plan Template to assist you in creating engagement plans for each stakeholder.

55
The purpose of a stakeholder engagement plan is to help you lay out which methods of engagement you want to use for each stakeholder. This engagement plan should be a living document that changes as you receive feedback from stakeholders and as their commitment levels evolve. Above all, be sure to ask Stakeholders how they can best be engaged with the project. Be sure to keep in mind the “target commitment” for each stakeholder as well as what impact the change will have on them and what influence they have on success.
STEP ONE: In the table on page two, record all stakeholders whom you would like to include in the Engagement Plan (far left column). STEP TWO: Look at the various sample engagement activities below. Using the sample
list and any ideas you are able to generate, choose engagement activities for each stakeholder. You can use the notes section to record information such as what type of commitment was needed from the stakeholder. Sample Engagement Activities
Bi‐weekly 1:1 meetings: Hold regular “one on one” meetings to share information, ask for feedback and listen to stakeholder needs. These meetings are a chance for people to be heard, to gather important perspectives and respond to concerns.
Working groups: Establish working groups for individuals to provide feedback and influence the proposed change. Be sure to establish a charter for working groups so that members understand the group goals; these groups are a great way to gather opinions and increase “buy‐in”.
Leadership opportunities: Ask stakeholders to be involved in key leadership positions related to the change (e.g. sponsor, change leader) or to campaign the change by speaking at key events.
Town Halls: Hold public forums to convey information and ask for feedback or concerns. These sessions can also be working sessions where brainstorming and other participatory activities occur. Be sure to communicate results of the Town Hall to all participants and follow‐up on results.
Working sessions: Similar to Town Halls, these are working sessions where invited participants are asked to actively engage in activities to provide information, find solutions to problems and/or reframe the change to come up with terms which are meaningful to them.
Email updates: Provide stakeholders with a way to opt in to regular email announcements and/or newsletters. Can also use other social media tools (e.g. blogs, websites, wiki, Facebook) to keep people informed.
Stakeholder Engagement Plan

56
STEP THREE: After an engagement activity is completed, be sure to record “How’d it go?” and “What’s next?” To answer this question, you may want to collect feedback from the stakeholders themselves on the engagement activities.
Stakeholder Name Engagement Activities
How’d it go? What’s next?
Notes (What type of commitment is
needed from this stakeholder?)

57
Driving Force for Change Template
The purpose of this template is to help you think through the reason for change and how this can be communicated in a compelling way. Stakeholders will become more invested in the change when they understand the “driving force”.
STEP ONE: Answer the questions below, which are meant to help guide you through the process of discovering the driving force for change. If you do not have answers to some of the questions, this may be a good time to gather more data.
Question 1: What is the change? Describe the change in as much detail as possible. Include benefits and outcomes.
Question 2: What needs to happen? Describe what needs to happen in order for the change to occur. . Question 3: Why must the change happen now? Describe why the change is necessary and what the consequences are of not implementing the change.

58
Question 4: What will the future look like? How will the future be different (better) than the past?
STEP TWO: Using the information you have written above, develop a story to depict the “Driving Force for Change”. Keep in mind that your story should paint a vivid picture of the change itself, the necessity of the change and how the future will be different / better. Your story should connect to both the rational side of people as well as the emotional side.

59
The purpose of a vision planning tool is to enable teams to develop a shared understanding of the future state they are trying to achieve. This tool can be used when developing a shared vision for a change initiative or a team vision statement. STEP ONE: Define Team Purpose. Determine and share why this team has been formed. Is the team’s goal to lead the change initiative or to provide input and help shape the change initiative? Does the team have a broader purpose, such as fulfilling departmental goals? Is this an ongoing team or is it more “project based”?
STEP TWO: Set parameters. Determine what influence the team will have on the vision. Is the team tasked with creating the final vision or are they to provide input to a deciding body (i.e. manager, project lead)? Are they allowed full creativity with the vision or are there certain items which must / cannot be incorporated? Is there a particular focus or direction for this vision already?
Vision Planning
*Before proceeding to step three, be sure to communicate with the team

60
STEP THREE: Create future images. Have each person on the team create a picture of what
they envision the future to look like after the team has been successful in meeting their mission / purpose and completing all of their goals. This picture can be painted through individual writing, drawing, listing aspects of the future state on post-its…whichever method inspires the most creativity. As individuals are creating this picture of the future, it may be helpful to consider the following questions:
Who are our customers and how does what we do impact them? What value do we provide to our customers?
What is the unique contribution this team makes to the University’s success? How does our team work together to achieve these results? If we solved all of our problems and completed all of our tasks, how would the world be
different?
STEP FOUR: Share future images. Share team member findings from step three with the
group. Depending on the group size and composition, you may want to have a “gallery display” of the images (post images around the room for group members to browse), have individuals “report out” their future images (give each individual a time limit to describe their future image; be sure that people know this is a time for listening and not for discussion) or have individuals discuss future images in small groups.
STEP FIVE: Commonalities and differences. As a large group, brainstorm which
commonalities exist between the individual future images and have a facilitator record the results on a flip chart. Next list any differences in the future images. After these items are recorded, ask the group to vote on which commonalities and differences should be incorporated into the shared vision. STEP FOUR: Create shared vision. Depending on your group’s purpose and size, either
finish creating the shared vision as a large group, assign a sub-group to create a draft and report back or provide your input to the person(s) who will be creating the vision. Be sure to be clear with the team on what the next steps are and what participation they can (or should) have. If the team is expected to adopt this vision, be sure to provide a method to members on providing feedback on the shared vision.
Remember! A powerful vision has the following characteristics: It outlines a compelling reason for change It conveys a picture of the future It presents a feasible, if challenging, process It is focused on what needs to be achieved It appeals to the long term interest of all stakeholders It is flexible It can be communicated easily

61
Pareto Analysis Worksheet Pareto Analysis is a simple technique for prioritizing problem-solving work so that the first piece of work you do resolved the greatest number of problems. It's based on the Pareto Principle (also known as the 80/20 Rule) – the idea that 80% of problems may be caused by as few as 20% of causes.
To use Pareto Analysis, identify and list problems and their causes. Then score each problem and group them together by their cause. Then add up the score for each group. Finally, work on finding a solution to the cause of the problems in group with the highest score.
Pareto Analysis not only shows you the most important problem to solve, it also gives you a score showing how severe the problem is.
How to Use the Tool
Step 1: Identify and List Problems
Firstly, write a list of all of the problems that you need to resolve. Where possible, talk to clients and team members to get their input, and draw on surveys, helpdesk logs and such, where these are available.
Step 2: Identify the Root Cause of Each Problem
For each problem, identify its fundamental cause. (Techniques such as Brainstorming and the 5- Whys process mentioned in this toolkit can help with this.)
Step 3: Score Problems
Now you need to score each problem. The scoring method you use depends on the sort of problem you're trying to solve.
For example, if you're trying to improve profits, you might score problems on the basis of how much they are costing you. Alternatively, if you're trying to improve customer satisfaction, you might score them on the basis of the number of complaints eliminated by solving the problem.
Step 4: Group Problems Together By Root Cause
Next, group problems together by cause. For example, if three of your problems are caused by lack of staff, put these in the same group.

62
Step 5: Add up the Scores for Each Group
You can now add up the scores for each cause group. The group with the top score is your highest priority, and the group with the lowest score is your lowest priority.
Step 6: Take Action
Now you need to deal with the causes of your problems, dealing with your top-priority problem, or group of problems, first.
Keep in mind that low scoring problems may not even be worth bothering with - solving these problems may cost you more than the solutions are worth.
Sample Pareto Analysis Table
# Problem (Step One) Cause (Step Two) Score (Step Three) 1
2
3
4
5
http://www.mindtools.com/pages/main/newMN_TED.htm

63
Paired Comparison Analysis Worksheet Paired Comparison Analysis helps you to work out the importance of a number of options relative to each other. It is particularly useful where you do not have objective data to base this on.
This makes it easy to choose the most important problem to solve, or select the solution that will give you the greatest advantage. Paired Comparison Analysis helps you to set priorities where there are conflicting demands on your resources. It is also an ideal tool for comparing "apples with oranges" – completely different options such as whether to invest in marketing, a new IT system or a new piece of machinery. These decisions are usually much harder than comparing three possible new IT systems, for example.
How to Use the Tool:
Follow these steps to use the technique in the table provided on the following page:
1. List the options you will compare. Assign a letter to each option.
2. Mark the options as row and column headings on the worksheet.
3. Note that the cells on the table where you will be comparing an option with itself have
been blocked out – there will never be a difference in these cells!
4. The cells on the table where you will be duplicating a comparison are also blocked out.
5. Within the remaining cells compare the option in the row with the one in the column. For
each cell, decide which of the two options is more important. Write down the letter of the
more important option in the cell, and score the difference in importance from 0 (no
difference) to 3 (major difference).
6. Finally, consolidate the results by adding up the total of all the values for each of the
options. You may want to convert these values into a percentage of the total score.

64
Paired Comparison Analysis Table
OPTION TOTAL RANK A:
B:
C:
D:
E:
F:
G:
OPTION A: B: C: D: E: F: G: A:
B:
C:
D:
E:
F:
G:

65
Force Field Analysis
Force Field Analysis is a useful technique for looking at all the forces for and against a decision. In effect, it is a specialized method of weighing pros and cons.
By carrying out the analysis you can plan to strengthen the forces supporting a decision, and reduce the impact of opposition to it.
Describe your plan or proposal for change in the middle.
List all forces for change in one column, and all forces against change in another column.
Assign a score to each force, from 1 (weak) to 5 (strong).
Forces FOR
Change Score Change
Proposal Forces AGAINST
Change Score
Total Total

66
Facilitation Cheat Sheet This reference sheet provides a quick guide to facilitation techniques which can help increase participation, “buy-in” and creativity. You can find more information on facilitation from COrWE, the Berkeley Facilitators Network or handbooks such as the Facilitator’s Guide to Participatory Decision-Making by Sam Kaner.
Framing the meeting…
Setting clear expectations, roles and rules of engagement: It is vital that participants understand the purpose of the group as well as their role within the group. Having this clarified will help participants feel safe to participate because they will know what is expected of them. Meeting expectations (e.g. “community agreements” or “ground rules”) can be defined by the facilitator and/or the participants.
Active listening skills…
Paraphrasing: This tool can help clarify understanding, validate contributions and let people hear how their ideas are being heard by others. This is a particularly useful tool to help someone who does not feel heard by the group. To paraphrase, repeat back what the speaker said in your own words without adding your own judgment. It is useful to use starter statements when paraphrasing, such as “It sounds like you are saying…”, “Let me see if I am understanding you…”, or “Is this what you mean?” After paraphrasing, expect (or ask) the speaker to confirm or clarify your understanding.
Mirroring: This tool is a shorter version of paraphrasing; it validates contributions in a highly
structured, fast-paced way. This is a particularly useful tool when doing a brainstorming or idea generating activity. Mirroring can also build trust as it is a very neutral form of paraphrasing. To use mirroring, repeat back what the speaker said using their exact words. If they said a single sentence, repeat it verbatim. If they said more than one sentence, repeat back key words or phrases.
Balancing: This tool helps you to gather diverse perspectives. Often silence is taken for agreement; this tool debunks that myth and invites different thoughts and minority viewpoints. Key phrases to use in balancing include: “Are there other ways of looking at this issue?”, “Does everyone else agree with this perspective?”, “Does anyone have a different position?”, and “Can anyone play devil’s advocate for a few minutes?”

67
Encouraging: This tool can be used to encourage participants who may not have spoken up. Using the “encouraging” tool is an art; it is not easy to invite participation without putting individuals on the spot. The key is to be neutral in how you invite participation. Phrases to use in encouraging include: “Who else has an idea?”, “Is there a XX perspective on this issue?”, “What do others think?”, and “Are there comments from anyone who hasn’t spoken up in a while?”
Stacking: This tool is a procedure for keeping a “queue” of individuals when there are many people who want to speak, all at once. Using stacking lets everyone know that you are aware they have something to add and will be invited to speak in turn. To employ stacking, follow the four steps below:
1. Ask individuals to raise their hand before speaking. 2. Create a speaking order by assigning a number to each person with their hand raised. 3. Call on people when their time to speak arrives. 4. After the final speaker, ask if there is anyone else who would like to speak.
There are variations of stacking that can be used (e.g. instead of using numbers for the speaking order, keep a ordered list of the names of individuals in the queue) and you may also want to develop a procedure for “jumping the stack or queue” depending on your group dynamics (e.g. perhaps the leader is allowed to jump the queue and speak out of turn, or if someone has a comment to build on what someone else says they are allowed to jump the queue).
Intentional silence: One of the best tools in the facilitator’s toolbox can be an intentional silence. Often times, meeting facilitators can be uncomfortable with silence and will want to push the meeting along. By allowing a pause, lasting only 5 – 10 seconds, it provides individuals with the chance to organize their thoughts, digest what has been said and/or decide if they would like to speak up. Employing intentional silence is easy, simply pause and let the group-think happen. If the group has trouble focusing, you may want to introduce the exercise by saying “let’s take a few moments of silence and consider what was just said” or something similar.
Creating a group memory…
Chart writing: This tool helps to create a group memory of the meeting proceedings. It is also a useful way of clarifying what was said and spark creativity. After a meeting, the chart writing can serve as the basis for meeting minutes; if is often helpful to take a photo of the chart and email to the group for record. To use chart writing, record ideas/thoughts on a white board, flip chart pad, computer (with projected image) or other means of displaying the notes for all. Be sure to write large and with plenty of white space so the chart is easy to read.
The Garden: Also known as “the parking lot”, this tool is a useful place to track ideas that are tangential from the current discussion, but still important and may warrant follow-up at a later time. To employ this tool, when someone brings up a topic which detracts from the conversation, start by acknowledging the point (using active listening skills), then state that it will be put in the garden for future discussion.

68
Metric Template In determining your metric, the following table can help you build and track your progress by activities used, how the process went, and then the final conclusion for each building block.
Building Block Activities to get there How’d it go? What’s next? Final
Objective Measurement Intent Measurement Definition/Formula Baseline Target Progress to Target Who Sets Target/Measures/Reports Frequency of Update

69
Communication Planning Template To build a communication plan, several questions must be answered by a unit’s leadership in order to lay the groundwork for communication. Among those are the following:
Whom do we want to reach? What do we want them to do differently from the current situation? What is the benefit of doing so? What are the obstacles to doing so? How will we deal with them? What is the primary key message to be communicated? What types of media will we use to communicate? When will we communicate?
The specific steps: 1. List the steps that need to be completed. 2. Determine who is responsible for each step. 3. Decide on a realistic completion date for each step. 4. Update the tool as the status as needed.
Action Step Responsible Person
Complete By Status

APPENDIX C:
Implementation Plan

1
Implementation Plan The CalMetrics Team would like to thank the High Performance Culture (HPC) Initiative Team and the Metrics Subgroup for the work they have already done related to metrics. In the Design Phase Business Case prepared by the HPC Initiative Team, they recommended the establishment of “sharper methods of measurement (‘metrics’) for making and implementing the right decisions, including alignment across organizational levels, by implementing new processes of on-going unit-level assessment.” The purpose of this implementation plan is to provide recommendations on how to do that. We believe that implementing metrics at UC Berkeley should be a two-pronged approach. While the main focus of this project was to provide recommendations regarding the implementation of campus-wide metrics, we are also proposing that the newly hired Campus Metrics Coordinator heavily promote the development and use of metrics at a unit level. Unlike the campus-wide metrics program, however, we are recommending that participation in a unit-level metric program initially be voluntary. Therefore, we have created the toolkit included as Appendix B of this report, which can be used by anyone interested in developing and implementing metrics and have included recommendations related to both campus-wide and unit-specific metrics below. As detailed in this plan, we are recommending a phased approach for implementing these metrics programs consisting of four phases: Assessment and Planning; Design; Pilot; and Sustainability. I. Assessment and Planning
a. Current Campus Climate
Three common concerns emerged throughout the various research we conducted involving campus staff:
1. Many felt that Berkeley was becoming too “corporate”. Although metrics are used by many other universities1, the term “metric” is often perceived to be a tool only utilized by corporations.
2. When asked about implementing metrics on campus, many respondents were worried about how the metrics would be used. Specifically, they feared some managers would only use metrics to measure individual performance. As previously stated, the focus of this project centers around metrics for measuring unit performance and effectiveness, not individual performance.
1 Including UC Irvine, Cornell, Purdue, Yale, Johns Hopkins, University of North Carolina-Chapel Hill, and the University of Washington.

2
3. Finally, many of the staff we heard from expressed the desire that all segments of the campus community be involved in the development of a metrics program and we concur. The metrics program will need broad support in order to be successful and we believe leveraging staff stewardship will be critical.
As a means to address these concerns, we developed a term that we believe more accurately reflects the intended purpose of our proposed campus metrics program — Operational Success Key Indicators (or OSKIs) — and recommend that the campus considering using this term or something similar as part of their campus-wide implementation.
b. Initiative Team
Implementing a campus metrics program will be a major endeavor. Therefore, we recommend that the Campus Metrics Coordinator gather an Initiative Team comprising of representatives from campus to assist her. As stated previously, we believe broad engagement with the campus community is critical and, therefore, suggest that the team include both faculty and staff.
c. Identification of Units
In a survey sent to various campus groups (see Appendix D of the report), we asked respondents “…do you believe metrics will be helpful on a campus-wide level?” They were asked to rate their response on a scale from 1 (Not Helpful at All) to 5 (Very Helpful). Although the majority (55%) believed metrics would be helpful (indicating either a 4 or 5 rating), several of those that did not believe they would be helpful pointed to the diversity of campus units and their missions. Not only is the campus comprised of various types of units (e.g., administrative, academic, research), they come in all shapes and sizes and one set of core metrics will not apply to all. As a result, we recommend that more than one set of core metrics be developed to address this diversity. In order to do this, one of the first decisions that will need to be made by the Campus Metrics Coordinator and her Initiative Team will be how to most effectively group campus departments and units into common areas for core metrics reporting and usage purpose. One potential break down would be along areas the units serve such as student services, teaching, administrative/business operations, research, etc.

3
d. Identification of Stakeholders and Input Gathering
Once these “core” units are determined, stakeholders will need to be identified for each of these areas to facilitate gathering the necessary input needed to develop the most meaningful set of metrics for that area and that the metrics follow the S.M.A.R.T. philosophy which states that metrics should be Specific, Measurable, Actionable, Relevant and Timely. As previously mentioned, in order for the program to be successful, we believe it is critical that input be collected from all segments of the campus from the highest administrators to the front-line staff and include not only the staff and managers who will be using the metrics but the customers they serve. Since the proposed metrics program is part of the Operational Excellence (OE) HPC initiative, we believe that collaboration with another HPC effort, Berkeley Operating Principles, as well as other OE projects, would be advantageous.
e. Tools and Training Identification
The stated goals of Operational Excellence is to lower administrative costs and improve the quality of campus operations to make them more efficient. In order to align with these goals, we recommend that the Campus Metrics Coordinator and Initiative Team consult with Information Services and Technology and campus units that are currently using metrics such as the Engineering Research Support Organization (ERSO), Haas School of Business, the Office of Human Resources, and Division of Student Affairs to determine what tools are currently available either on campus or externally to assist with metric data collection and reporting. In addition, to have an effective metrics program, it will be critical that those undertaking a metrics program have relevant training opportunities available to assist them. Therefore, we recommend that the Campus Metrics Coordinator and Initiative Team determine what training is currently available as well as what additional training will be needed. Our team conducted a search the campus’ e-Learn system to determine what metrics-related information was available at the time and a listing of the Job Aids and SkillBriefs found have been included in the report as Appendix F. Metrics require that the unit using them have something in place against which to measure, such as goals, a mission or a strategic plan. Since many units on campus have not formally developed these items, we suggest some form of guidance in this area be included in the training options. In addition, we believe a course on designing and delivering effective surveys would benefit many different campus constituents.

4
f. Communication Plan Development
Transparency is extremely important for a successful implementation of both the campus-wide and unit-level metrics programs. For employees to be engaged in and support a metrics program, they must clearly understand the benefits of having metrics as well as understand how decisions regarding the program are being made. Therefore, we recommend that the Campus Metrics Coordinator and Initiative Team develop a comprehensive communication plan regarding the campus-wide metrics program. We further recommend that they be available to provide assistance to those units planning to implement their own programs to ensure that there is a clear and consistent message being delivered.
II. Design a. Overview
Our team recommends that the design phase of the campus-wide metric program begin with the identification and implementation of core metrics for one of the previously determined Units (the Implementation Unit). The initial focus will be at the top level of the Implementation Unit and how metrics should be incorporated into UC Berkeley’s unique environment. This will serve as a model for refining and expanding the program to other levels of the Implementation Unit. We further recommend that the metrics program allocate resources to promote transparency and adoption throughout the campus. Paramount in this area is communicating how metrics should be used throughout the campus. Training opportunities, the toolkit, and other necessary support should also be provided for early adopters to develop metrics tailored to their organizational objectives. This effort can be parallel to the campus-wide implementation and new tools and/or techniques created for the campus-wide effort should be shared with early adopters. We believe that the need for core metrics presents a unique opportunity where the metric design requires input from all levels of a unit, but implementation and usage can begin at the upper levels. By implementing from the top, the upper levels would be the first practitioners and work with the Initiative Team to tailor the program toward the unit’s domain. This approach sets the standard for how metrics should be utilized throughout the unit.
b. Designing Core Metrics
The Initiative Team should work with the Implementation Unit to identify the set of strategic goals and behaviors that can be promoted through metrics. This set will lead to the development of the core metrics that can be applicable at all levels of the Implementation Unit. Designing all aspects of the metric, including the outcomes and

5
usage needs the active participation from all groups affected by the metric. As the program is expanded, each groups understands how the metric applies at their level and how their work contributes to the larger mission. Embracing the principles of staff stewardship in the design will be a key driver in defining the operating culture.
c. Automation Automating data collection and presentation should be a high priority for the Initiative Team and this will provide interesting challenges. At the top level, many of the core metrics can be aggregations of lower level data and any new, manual process will add an additional strain on overworked staff, thus hindering adoption at all levels. New automated processes can be developed, but this option can easily be cost prohibitive. We recommend that the Initiative Team establish a collective knowledge around campus providers, users, and promoters of data, services, and tools. Understanding the automation possibilities will be immediately applicable to the design of the core metrics for the unit. Forward looking, this knowledge will be a foundation to identify opportunities for cost-savings and organizational alignment as the program is scaled across different units.
d. Dashboard and Reporting Tool Similar to the considerations around automation, the dashboard and reporting tools should leverage existing designs and services. In this area, special consideration should be given to selecting a robust solution that can accommodate inclusion of early adopters. The importance is for the campus-wide program to promote the best practices for presentation and reporting by having the early adopters utilize the same templates and platforms the campus-wide program Implementation Unit is using. This provides transparency to the program and provides insight into the environment needed to support a large-scale rollout.
e. Training The initiative team should provide training opportunities to the Implementation Unit and early adopters of the program’s tools and techniques. We recommend that the Initiative Team look toward leveraging existing resources and coordinate with the Center for Organizational and Workforce Effectiveness (COrWE) on current and future offerings. Relevant training opportunities should be expanded to the campus when possible.
f. Communication Plan
The communication plan developed in the Assessment and Planning phase should now be utilized and revised, as needed, in response to changes in the program or the current climate of the campus. Developments in other areas, especially other

6
High Performance Culture initiatives, can present new opportunities that could also require revisions to the communication plan.
g. Toolkit The toolkit should be made available to the campus community and utilized by the Implementation Unit and early adopters. An ongoing budgetary allocation will be needed to provide support needed to refine and expand the toolkit component.
III. Pilot Recommendation
We propose conducting an initial pilot of the campus-wide metric program. The pilot would focus on implementing on a smaller scale the recommendations outlined in the “Assessment and Planning” and “Design” sections of this plan. We believe the following objectives can be achieved through the use of a pilot: 1. Pilot participants gather support and buy in for future metric initiatives as well as
become early adopters.
2. The set of core metrics identified in the pilot is determined to be applicable to a larger set of units performing in the related job function.
3. The metric initiative team collects data regarding the functionality and usability of
the selected dashboard and reporting tool. 4. The Initiative Team learns from the challenges and obstacles experienced during the
pilot and plans as needed for future implementation.
IV. Sustainability
a. Overview and Re-alignment
The final phase we have for the implementation plan is focused on continuous improvement. At this point, there is an available baseline for core metrics from the pilot participants. Goals can be reviewed and adjusted as needed given the new information. Metrics themselves can be tweaked in preparation for full campus participation.
b. Campus-wide Rollout
Second, in this phase, we recommend a campus-wide rollout using one or two core metrics tested in the pilot. For example, the standard developed for the customer

7
satisfaction metric can be utilized by all units as identified previously, not just some units. This would be on-going with an annual review and posting of the metric results on the dashboard at a high level. At this point we recommend further development to ensure data can be easily gathered across campus via a web tool in a standard format and then uploaded to the display dashboard. We do not recommend publicly posting the ratings for the smaller departments or offices on campus, but, rather, use the data to give a measurement of customer service satisfaction for the larger units of campus, such as Finance, IST, Student Services, and University Extension. The point of this phase is to get everyone participating who was not in the pilot. From there trends can be observed as discussion point to assess goals and progress.
c. Continuous On-Boarding Third, tailored metrics should continue to be encouraged in units. It will be left to managers of those units as to whether they will become a standard part of their business process. This can also be an opportunity to use the dashboard to highlight tailored metrics from a unit on campus. Providing ‘featured” metrics will encourage transparency and collaboration as units can share information on how they are measuring effectiveness.
d. Embrace New Ideas for Core Metrics
We hope that by this phase our colleagues in units who have not implemented tailored or other core metrics have had their concerns and hesitations addressed. There was concern about how metrics will be implemented, what they are, why they are useful, who should be involved, when it would be appropriate, and where it is most useful. This plan has brought us to the point where we expect the bulk of staff to now be on-board. At this point new core metrics can be explored and standards set that would be appropriate to all. The effective implementation of previous phases is what will allow us to get to a campus-wide implementation.

APPENDIX D:
Survey

CalMetrics Survey Questions
The High-Performance Culture Initiative design team developed a proposal for the implementation of metrics at UC Berkeley. Metrics are measurements used to determine whether a department is achieving their goals or mission.
Example of how metrics are commonly used:
Goal: Collectively an Office of Development & Alumni Relations averages 4 new endowments a year. The goal is to increase the average over 3 years. Metric: The average number of new endowments secured over the next 3 years is greater than 4 per year. Process: The unit works strategically to increase scholarships each year so the average is higher than 4.
1. Considering the information above, do you believe metrics will be helpful on a campus- wide level?
5 Very Helpful 4 3 2 1 Not at all Helpful
1a. Why do you feel that metrics would not be helpful on a campus-wide level? (Only those who indicated a 2 or 1 in the previous question viewed this question)
2. Do you believe metrics will be helpful in your department?
5 Very Helpful 4 3 2 1 Not at all Helpful
2a. Why do you feel that metrics would not be helpful in your department? (Only those who indicated a 2 or 1 in the previous question viewed this question)

3. Please consider the statements below and indicate the importance of each to improving your work experience at Berkeley
Extremely Important
Very Important
Neither Important nor Unimportant
Very Unimportant
Not at all Important
1) We need tools to show how what we do supports
the mission of the University.
2) Our unit needs to
collect data to support
making the right decision.
3) It would be helpful to have
a standard process to assess our
department’s ability to help
others.
4) All members should be
involved in the department goal setting
process.
5) We need ways to
measure how much we have accomplished
so our achievements
can be recognized

4. Based on your experience working in your current job role. Please rank the following statements in order of difficulty of implementation in your department. 1= Most difficult to implement, 5 = Least difficult to implement.
______ 1) We need tools to show how what we do supports the mission of the University. ______ 2) Our unit needs to collect data to support making the right decision. ______ 3) It would be helpful to have a standard process to assess our department’s ability to help others. ______ 4) All members should be involved in the department goal setting process. ______ 5) We need ways to measure how much we have accomplished so our achievements can be recognized.

5. Establishing methods of measurement ("metrics") represents a change to the operational culture at Berkeley. Please check the top 3 elements that would most effectively promote change in your department.
Through communication staff have a solid understanding of the need for the change. Staff participate in the development of the change. Senior leaders demonstrate their commitment to change by supporting staff. Motivation for positive change is built throughout our organization. Training and staff support are a priority when implementing change. Communications are customized for different audiences, and are responsive to their individual
concern.
6. What else would you like for us to know?
7. How long have you been working at the University?
Less than 6 months 6- 12 months 1-5 years 6+ years
8. Do you work in one of the fields below?
human resources informational technology research administration procurement finance No, I do not work in the above fields
9. How many people do you directly manage? Less than 6 months 1-3 4-6 6+

CalMetrics Survey
Last Modified: 05/02/2012
1. Do you work in one of the fields below?
CalMetrics Survey
# Answer Response
1 human resources 27
2 informational technology 82
3 research administration 38
4 procurement 17
5 finance 39
6 No, I do not work in the above fields 107
Statistic Value
Total Responses 265
CalMetrics Survey Final Results 5.02.12
Page 1 of 8

2. How many people do you directly manage?
Answer Response
0 145
1-3 41
4-6 23
6+ 56
Total 265
CalMetrics Survey Final Results 5.02.12
Page 2 of 8

3. How long have you been working at the University?
Answer Response
Less than 6 months 1
6- 12 months 9
1-5 years 61
6+ years 194
Total 265
CalMetrics Survey Final Results 5.02.12
Page 3 of 8
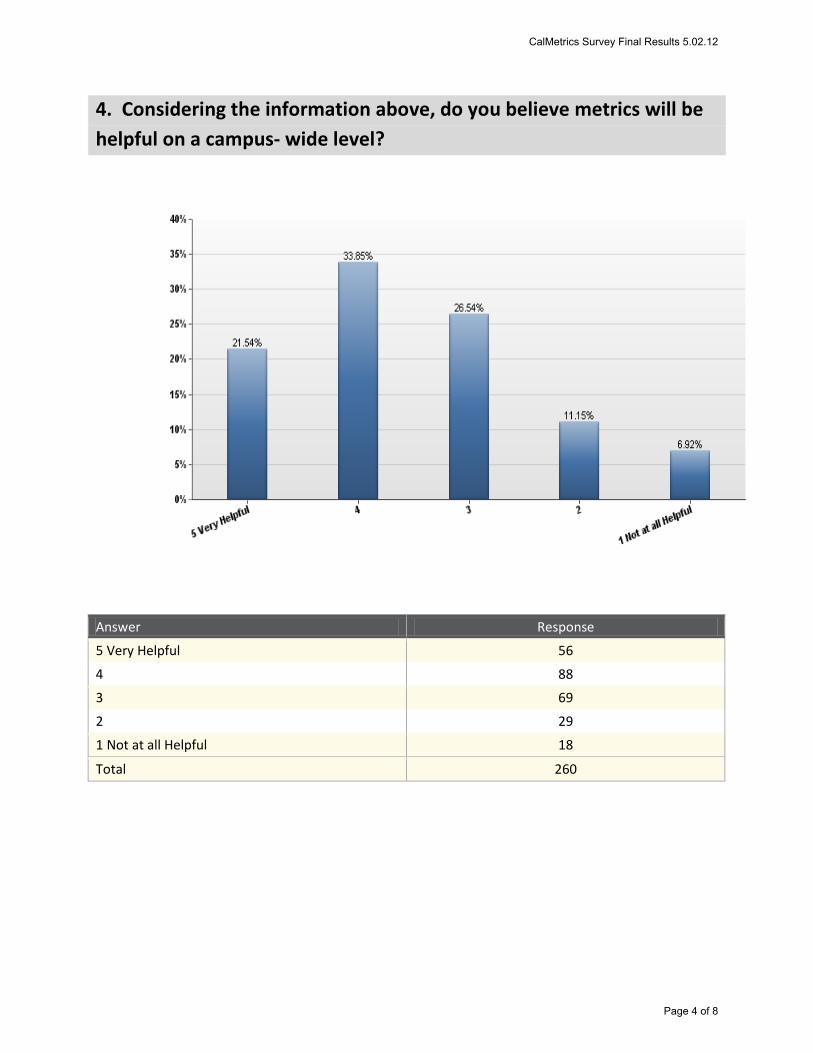
4. Considering the information above, do you believe metrics will be helpful on a campus- wide level?
Answer Response
5 Very Helpful 56
4 88
3 69
2 29
1 Not at all Helpful 18
Total 260
CalMetrics Survey Final Results 5.02.12
Page 4 of 8

5. Do you believe metrics will be helpful in your department?
Answer Response
5 Very Helpful 72
4 69
3 73
2 29
1 Not at all Helpful 17
Total 260
CalMetrics Survey Final Results 5.02.12
Page 5 of 8

6. P
leas
e co
nsid
er th
e st
atem
ents
bel
ow a
nd in
dica
te th
e im
port
ance
of e
ach
to im
prov
ing
your
w
ork
expe
rienc
e at
Ber
kele
y
Cal
Met
rics
Sur
vey
Fina
l Res
ults
5.0
2.12
Pag
e 6
of 8

7.
Bas
ed o
n yo
ur e
xper
ienc
e w
orki
ng in
you
r cur
rent
job
role
. Ple
ase
rank
the
follo
win
g st
atem
ents
in o
rder
of d
iffic
ulty
of i
mpl
emen
tatio
n in
you
r dep
artm
ent.
1=
Mos
t diff
icul
t to
impl
emen
t, 5
= Le
ast d
iffic
ult t
o im
plem
ent.
1 =
Mos
t diff
icul
t to
Impl
emen
t, 5
= Le
ast d
iffic
ult t
o Im
plem
ent
Cal
Met
rics
Sur
vey
Fina
l Res
ults
5.0
2.12
Pag
e 7
of 8

8. E
stab
lishi
ng m
etho
ds o
f mea
sure
men
t ("m
etric
s") r
epre
sent
s a c
hang
e to
the
oper
atio
nal
cultu
re a
t Ber
kele
y. P
leas
e ch
eck
the
top
3 el
emen
ts th
at w
ould
mos
t eff
ectiv
ely
prom
ote
chan
ge in
you
r dep
artm
ent.
Cal
Met
rics
Sur
vey
Fina
l Res
ults
5.0
2.12
Pag
e 8
of 8


APPENDIX E:
Metric Project Examples
1
Metric Project Examples Examples of projects to implement metrics: Unit or Department — Project to facilitate participation; address need for change within departments that has been identified by its members, and provide an opportunity for members to determine the scope and provide feedback for the unit using metrics as an aspect of the overall project.
Project Name: Morale Meter
Purpose: Unit members are to define what “morale” means to the unit and what gets in the way of positive morale. Example: inefficiency is determined to detract from morale; suggestions determine current areas of inefficiency such as: agendas need to be provided for all members prior to meetings, identify frequency of staff meetings during high volume periods, etc. Plan: members determine a finite number of items to address over the next six months and commit to completing metrics to determine how effective the changes are in improving morale through use of a brief survey to be completed by all members. A “pre-test” survey is completed by the members to determine the current “morale meter” standing. Findings will be shared with the members during monthly staff meetings and used to further improve morale through evaluating the results and using the data to support or change the current areas for improvement/change. Metrics: The metrics include items determined by the unit members as correlating to morale. A dashboard graphic to provide a quick snapshot of current morale will be posted on the staff meeting agenda each month, and encourage review of the agenda prior to the meeting. Review: At six months the metrics determine which areas for improvement or change resulted in improvement of morale and fuel discussion of further items for consideration by the unit/department along with possible deletion of items that were not helpful. An overall morale meter result is provided for the members to determine current morale and the degree of change from the initial baseline.
Project Name: Work Smart
Purpose: Campus-wide project to facilitate campus community involvement and participation and provide an opportunity to implement a simple metrics project to encourage future involvement in projects involving metrics along with provision of an incentive/reward program. Plan: In an effort to utilize the extensive knowledge by members concerning their units, each unit is to identify a significant cost savings measure for their unit (only). Such as: the unit identifies an alternate vendor that will result in a significant cost savings and takes into

2
consideration costs to change vendors (if any) and cost to implement new vendor program (training needs, form changes, down-time, etc.) when determining the overall efficiency of the suggestion. Example: The unit identifies that use of a new process method will reduce replication of work and allow for more efficient completion of day to day activities thereby resulting in overall increase in efficiency. This efficiency will result in increased customer satisfaction as shown by a customer satisfaction surveys that currently describe time to deliverables as a significant concern. Review/Reward: Each plan will be reviewed by an impartial panel and the top ten respondents (units) will receive a catered two hour lunch. Their success and the nature of their winning plan will be posted and they will receive a certificate detailing their contribution to the campus community and the appreciation of the community for their efforts along with implementation of the suggested and researched plan.


APPENDIX F:
e-Learn Metrics Resources

1
e-Learn Metrics Resources e-Learn is "a set of online learning options available to staff from work or home on a 24 hour basis." For information on e-Learn and other Online Learning classes available to UC Berkeley staff, please see http://hrweb.berkeley.edu/learning/online-learning. Job Aids Available on e-Learn Job Aid Notes Equations for Performance Metrics
Equations for inbound call center performance metrics.
Key Process Metric Calculations Equations for calculating key process metrics of Process Capability, Net Present Value, and Return on Investment.
Making Monitoring a Metric Summary of steps to establish consensus on quality and generate scalable monitoring evaluations for an Inbound Call Center.
Understanding The Balanced Scorecard
Sample metrics for the four perspectives and example specifications for each metric.
Balanced Scorecard Metrics Examples of the four categories (financial, customer, internal process, learning and growth) of balanced scorecard metrics.
Banking Industry Key Metrics Key metrics about the banking industry. Biotechnology Industry Key Metrics
Key metrics about the biotechnology industry.
Capital Markets Industry Key Metrics
Key metrics about the capital markets industry.
Characteristics of Good Metrics Considerations of a good metric. Considerations When Designing a Key Measurement System
Considerations when designing a key measurement system.
Consumer Electronics Industry Key Metrics
Key metrics about the consumer electronics.
Education Industry Key Metrics Key metrics about the education industry. Health Care Industry Key Metrics Key metrics about the health care industry. Key Metrics (IT) Key metrics and sources of online data about the
information technology industry. Key Metrics (broadcasting and entertainment)
Key metrics and sources of online data about the broadcasting and entertainment industry.
Key Metrics (manufacturing) Key metrics and sources of online data about the manufacturing industry.

2
Key Metrics (oil and gas) Key metrics and sources of online data about the oil and gas industry.
Key Metrics Key metrics for food and beverage industry. Meaningful Metrics Example metrics for different strategic goals. Measuring Current Processes Overall steps for measuring a process. Performance Metrics (technical security)
List of questions and criteria that help you analyze the technical security architecture and its components.
Performance Metrics Rules of Thumb
Rule of Thumb on judging a process capability for Six Sigma.
Performance Metrics Types of performance metrics. Performance Monitoring Techniques
Techniques for monitoring employee performance.
Pharmaceutical Industry Key Metrics and Sources
Key metrics used in the pharmaceutical industry.
Supplier Performance Metrics Common metrics for suppliers. The Balanced Scorecard Examples of the four categories of balanced scorecard
metrics. Tool Integration Summary of how Six Sigma, Lean Manufacturing, ISO 9000,
and Balanced scorecard relate to the Baldrige Criteria.

3
SkillBriefs Available on e-Learn SkillBrief Summary Customer Service Metrics (Service Center)
Defines benchmarks as performance goals with benchmarking identifying current levels of performance, process, and outcome and comparing them against internal and external standards. Benchmarking shows an organization where it stands in relation to its own goals and in relation to other organizations, notably the competition. Lists sample metrics with some discussion on the metrics and effects/usages:
• First Contact Resolution rate • Average Speed to Answer (ASA) • Average Hold Time • Average Handle Time (AHT) • Abandon Before Answer (ABA) • Availability • Customer Satisfaction Level
Example Incident Response and Management Metrics
• the number of incidents in total and by CSR • Average Time to Resolve • incidents categorized by priority, severity, or type • cost per incident
Customer Service Metrics
A metric is a thing or property that is measured. A measurement is an actual numeric quantity. The Purdue University Center for Customer Driven Quality is highlighted. Core support center metrics:
• calls closed on the first contact • average speed of answer (ASA) • talk time • abandoned before answer (ABA) • percent available and percent occupied • customer satisfaction
Designing HR Initiatives
Summarizes the fives stages and 11 steps to designing strategic HR initiatives. From the e-Learn course: HR as Business Partner - Using Metrics and Designing Strategic Initiatives

4
Effective Metrics to Measure the Success of Six Sigma Projects
Use metrics to contribute to process knowledge and help create a baseline for strategic processes. The three characteristics that metrics should share:
• Customer focus • Cross functionality • Informational
Financial Metrics Helps Six Sigma teams analyze or "cost out" prospective improvement projects. Three basic calculation models:
• Return on Investment (ROI) • Payback Time (PBT) • Total Cost of Implementation (TCI)
How to Measure Current Processes
Summarizes the four steps for measuring a process. 1. Determine what to measure - have a balance of measurements that are both feasible to collect and useful or valuable to the organization. Common areas:
• Business measures - gauge common business or financial components of a process, such as time or cost.
• Process flow metrics - gauge efficiency and speed of a process, such as process cycle efficiency or takt time.
• Quality measures - assess the quality of output, such as defect count, DPMO, or rate of conformance to specifications.
2. Identify data sources - should be accurate and represent the process to measure 3. Collect process data - consider stratification factors for analysis and reporting 4. Take and refine measurements - validate data collection instruments and sampling plan. Evaluate measurements against four criteria: accuracy, repeatability, reproducibility, and stability.

5
IT Strategy Measurement
Four steps in measuring: define metrics, monitor results, compare to benchmarks, control for variances Balanced scorecard is a useful tool for measuring the IT Strategy's contribution to the organization's business objectives. Common perspectives:
• Business - measurable value and financial returns • Innovation - innovating and developing the capabilities required
for future organizational needs. • User - meets the requirements of the users • Operational - providing high-quality, cost-effective IT projects
and processes, while minimizing defects and maximizing availability.
Metric and Goal Characteristics
Project metrics and goals must be customer focused, cross-functional, and informational. Three tools to hear the "Voice of the Customer"
• Going to the Gemba - going to the source for information. In the manufacturing environment, this meant visiting the workers on the factory floor. Now, it is about talking and interviewing customers to find out about their requirements.
• Kano Analysis - separating customer needs into three categories: satisfiers, delighters, or dissatisfiers. Dissatisfiers are expected by the customer. Satisfiers please the customer, and more of these are better. Delighters surprise and "wow" the customer.
• House of Quality - a visual representation of the Voice of Customer data that shows relationships between customer requirements and engineering requirements.
Performance Measurement and Mission Statements
Mission statements clearly and concisely set out an organization's mission and strategic direction, and they communicate the company's purpose to employees and customers alike. Objectives stated in a mission statement should be quantifiable, appropriate, and specific. Performance metrics must be clearly defined, must measure the right things, and should include benchmarks, timelines, and consequences for failure to meet quantifiables. Measuring performance shouldn't just monitor whether a target is met; it should include processes by which improvements can be made.
Quality and Basic Statistics
Summary of GQM model from the e-Learn course: Measurement - Assessment and Metrics
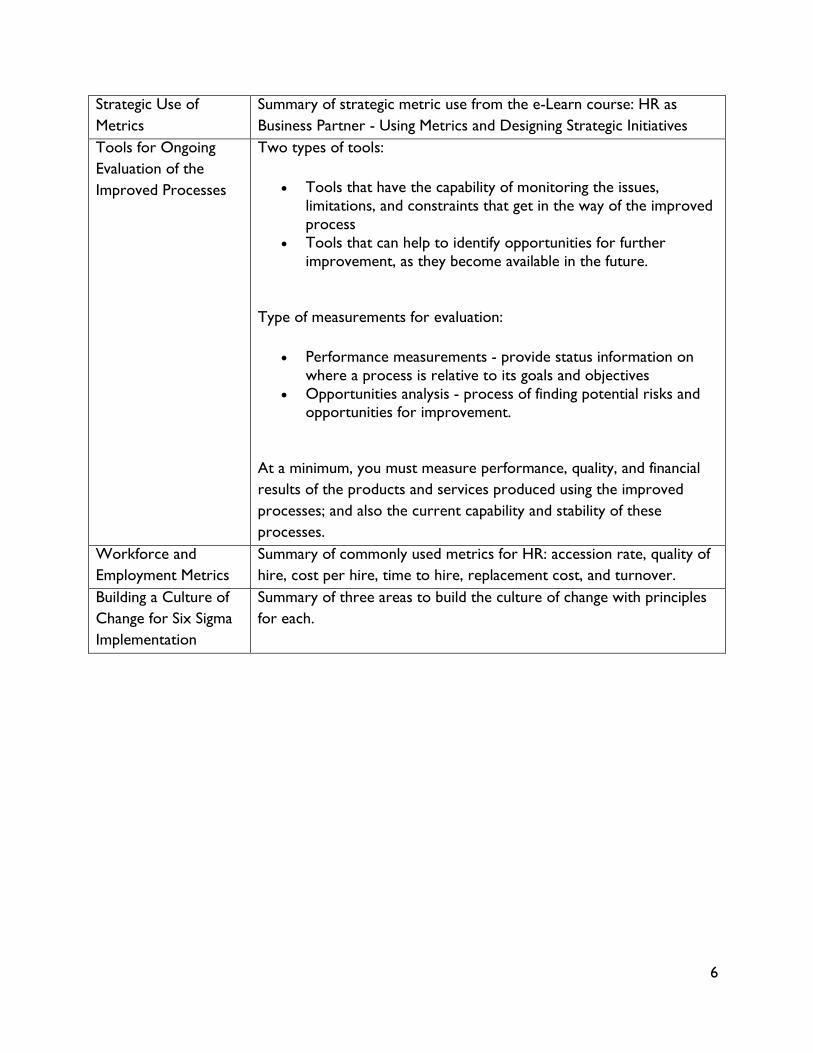
6
Strategic Use of Metrics
Summary of strategic metric use from the e-Learn course: HR as Business Partner - Using Metrics and Designing Strategic Initiatives
Tools for Ongoing Evaluation of the Improved Processes
Two types of tools:
• Tools that have the capability of monitoring the issues, limitations, and constraints that get in the way of the improved process
• Tools that can help to identify opportunities for further improvement, as they become available in the future.
Type of measurements for evaluation:
• Performance measurements - provide status information on where a process is relative to its goals and objectives
• Opportunities analysis - process of finding potential risks and opportunities for improvement.
At a minimum, you must measure performance, quality, and financial results of the products and services produced using the improved processes; and also the current capability and stability of these processes.
Workforce and Employment Metrics
Summary of commonly used metrics for HR: accession rate, quality of hire, cost per hire, time to hire, replacement cost, and turnover.
Building a Culture of Change for Six Sigma Implementation
Summary of three areas to build the culture of change with principles for each.


APPENDIX G:
Glossary

1
GLOSSARY Accountability: the responsibility to provide evidence to stakeholders that a program or project is effective and conforms with planned results, legal and fiscal requirements. Accountability is also an obligation to provide a true and fair view of performance and the results of operations. Berkeley’s Shared Services: an internal service organization staffed by functional subject matter experts using standardized processes and efficient systems to deliver consistent, high-quality, administrative services to the campus community in support of UC Berkeley’s teaching, research, and public service missions. http://oe.berkeley.edu/projects/orgsimp/documents/WEBOSGDeck20120213FINAL.pdf (slide 14) COrWE: Center for Organizational and Workforce Effectiveness Logical framework (logframe) approach: A methodology that logically relates the main elements in a program and project design and helps ensure that the intervention is likely to achieve measurable results. The "logframe matrix" can be used to summarize and ensure consistency among outcomes, outputs, activities and inputs, and to identify important risks or assumptions. It is also referred to as a results-oriented program planning and management methodology. The approach helps to identify strategic elements (inputs, outputs, purposes, goal) of a program, their causal relationships, and the external factors that may influence success or failure of the program. The approach includes the establishment of performance indicators to be used for monitoring and evaluating achievement of program aims. Operations Metrics: a measure of the efficiency and effectiveness of an operation or process. http://www.businessdictionary.com/definition/operations-metrics.html OSKI: Operational Success Key Indicators (LDP CalMetrics Team/Cheryl Olson) Outcome: Actual or intended change in conditions between the completion of outputs and the achievement of impact. Outcome monitoring is measuring performance of program, project or process. Outcome evaluation assesses the "how" and "why" outcomes are or are not being achieved as intended, and the contribution of outputs to the outcome. http://web.undp.org/evaluation/documents/HandBook/ME-Handbook.pdf Outputs: Tangible products, including services of a program or project that are necessary to achieve the objectives of the program or project. Outputs relate to the completion (rather than
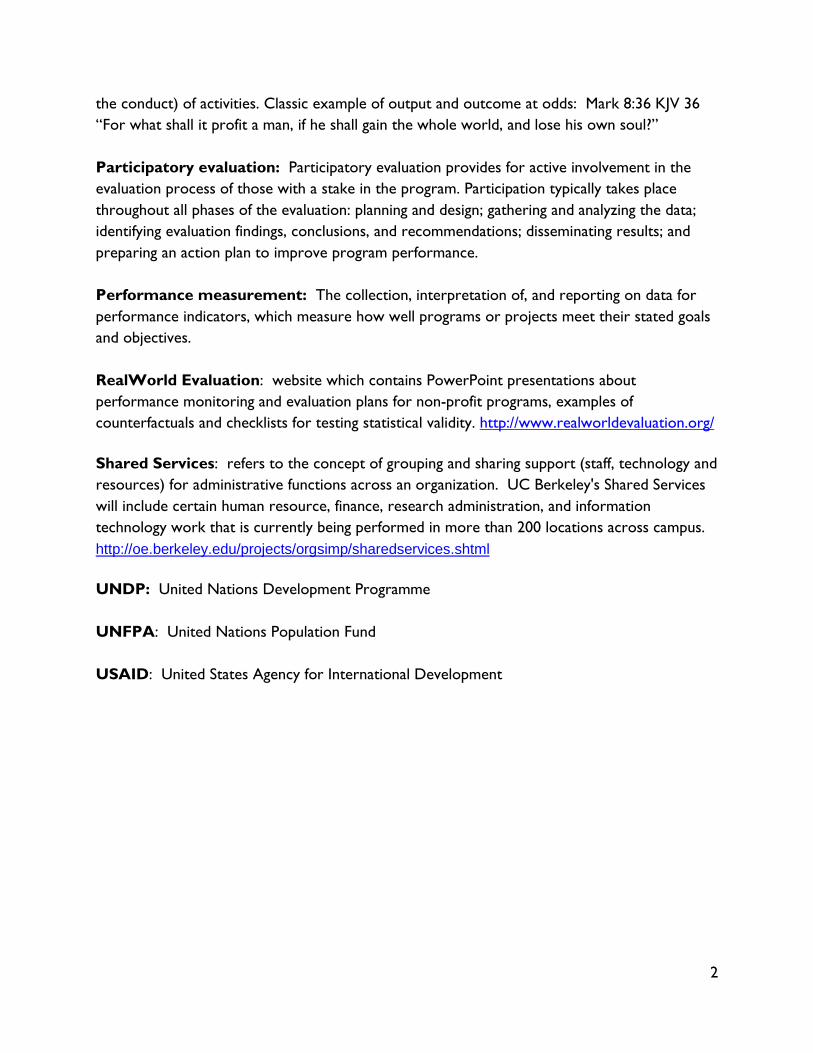
2
the conduct) of activities. Classic example of output and outcome at odds: Mark 8:36 KJV 36 “For what shall it profit a man, if he shall gain the whole world, and lose his own soul?” Participatory evaluation: Participatory evaluation provides for active involvement in the evaluation process of those with a stake in the program. Participation typically takes place throughout all phases of the evaluation: planning and design; gathering and analyzing the data; identifying evaluation findings, conclusions, and recommendations; disseminating results; and preparing an action plan to improve program performance. Performance measurement: The collection, interpretation of, and reporting on data for performance indicators, which measure how well programs or projects meet their stated goals and objectives. RealWorld Evaluation: website which contains PowerPoint presentations about performance monitoring and evaluation plans for non-profit programs, examples of counterfactuals and checklists for testing statistical validity. http://www.realworldevaluation.org/ Shared Services: refers to the concept of grouping and sharing support (staff, technology and resources) for administrative functions across an organization. UC Berkeley's Shared Services will include certain human resource, finance, research administration, and information technology work that is currently being performed in more than 200 locations across campus. http://oe.berkeley.edu/projects/orgsimp/sharedservices.shtml UNDP: United Nations Development Programme UNFPA: United Nations Population Fund USAID: United States Agency for International Development


APPENDIX H:
Resources

References Bamberger, M, J. Rugh, and L. Mabry, RealWorld Evaluation: Working Under Budget, Time and Political Constraints, 2nd ed., (Sage Publications 2012) Boudreau, J. and P. Ramstad, “Human resource Metrics: Can Measures Be Strategic?” Center for Advanced Human Resource Studies, Working Paper Series Paper 123, Cornell University (1998). Bridges, William, Managing Transitions: making the most of change, 2009 Colony, G. (2002) My view: Naked Technology Retrieved December 8, 2008 from: http://www.forrester.com/ER/Research/Brief/Excerpt/0,1317,15589,00.html Ewins, Anna, “After Assessment: An Overview of Change Management”, Pesented at the Cal Assessment Network Meeting, September, 2012. Heath, C. and D. Heath, Switch: how to change things when change is hard, 2010 Iversen, J. and K Kautz, The Challenge of Metrics Implementation (Department of Computer Science, Aalborg University and Institute for Informatics, Copenhagen Business School, 2006). Kaplan, R. and D. Norton, “Using the balanced Scorecard as a Strategic Management System” Harvard Business Review, Managing for the Long Term (July – August 2007): 2-13. Kinni, T., “The Art of Appreciative Inquiry,” Harvard Business Review, "Exploit What You Do Best," Harvard Management Update, Vol. 8, No. 8, August 2003 Klubeck, M., M. Langthorne, and D. Padgett, Do-It-Yourself Metrics: Metrics have arrived – which means we need a practical approach to implementing them (EDUCAUSE Quarterly, Vol. 29, No. 3, 2006). Klubeck, Martin, Metrics How to Improve Key Business Results, 2011 Kotter, J. Leading Change, 1996 Kotter, J., Our Iceberg Is Melting: Changing and Succeeding Under Any Conditions, 2006 Litre, Patrick, Alan Bird, Gib Carey and Paul Meehan. “Results Delivery: Busting three common myths of change management”, Bain Brief, http://www.bain.com/publications/articles/results-delivery-busting-3-common-change-management-myths.aspx

Malik, K. “UNDP Handbook on Planning, Monitoring and Evaluating for Development Results,” (UN Development Programme, 2009) Manno, B.V. “A Road to Results: A Performance Measurement Guidebook for the Annie E. Casey Foundation’s Education Program,” (Annie E. Casey Foundation, 2007) Massy, W., Metrics for Efficiency and Effectiveness in Higher Education: Completing the Completion Agenda (Stanford University, 2010). Melnyk, S., DM Stewart and M Swink, “Metrics and Performance Measurement in Operations Management: Dealing With the Metrics Maze,” Journal of Operations Management 22 (2004): 209-217. Metz, Stephanie “Why Have Metrics?”, Presented at the Cal Assessment Network Meeting Presentation, July 5, 2012. Morisawa, T. “Building Performance Measurement Systems With the Balanced Scorecard Approach,” (Nomura Research Institute, 2002) Myers, R., Business Tools and Metrics: Reference for Students and Professionals, 2006 Office of the Chief Information Officer, US Dept. of the Treasury, “Treasury IT Performance Measures Guide,” (US Treasury, 2007) Okfalisa, R., A Alias, K. Y. Wong and N. Salim, A Review of Metrics to Measure and Monitor the Performance of Strategy Implementation (Journal of Theoretical and Applied Information Technology (2009): 171-180. Paparone, C.R. “A Values-Based Critique of Lean Six Sigma as a Management Ideology,” Army Logistician, PB 700-08-01, Vol. 40, Issue 1 Prosci’s Change Management Maturity Model™. Retrieved July 1st, 2009 from: http://www.change-management.com/Prosci-CM-Maturity-Model-writeup.pdf Reuters, T., Finding Meaningful Performance measures for Higher Education: A Report for Executives (10/20/2008). Ruben, B.D., Toward a Balanced Scorecard for Higher Education: Rethinking the College and University Excellence Indicators Framework (QCI, Center for Organizational Development and Leadership, Rutgers University 99-02, Fall, 1999). Seddon, J., Freedom from Command and Control: Rethinking Management for Lean Service (Productivity Press, 2005)

Schachter, M. “Not a Tool Kit: Practitioner’s Guide to Measuring the Performance of Public Programs,” (Institute on Governance, 2002) University Excellence Indicators Framework (QCI, Center for Organizational Development and Leadership, Rutgers University 99-02, Fall, 1999). "U.S. General Accounting Office, GAO-04-343SP Comptroller General's Forum: High-Performing Organizations: Metrics, Means, and Mechanisms for Achieving High Performance in the 21st Century Public Management Environment (02/13/2004). US Office of Personnel Management-- Human Capital Assessment and Accountability Framework Resource Center: The Results-Oriented Performance Culture System describes policy and procedures established by the US OPM for the use of other US government departments. Includes links to specified metrics and other resources. http://www.opm.gov/hcaaf_resource_center/5-1.asp USAID Development Experience Clearinghouse-- source for the extremely useful USAID TIPS for Performance Monitoring and Evaluation, a multi-part series http://dec.usaid.gov/index.cfm UNFPA- United Nations Population Fund-- source for UNFPA Monitoring and Evaluation Handbook http://www.unfpa.org/ University of Adelaide, compiler, “Leading Change, Transition & Transformation”: a guide for university staff, http://www.adelaide.edu.au/hr/strategic/leading_change_toolit.pdf. (not named) “Outcome-Level Evaluation: A Companion Guide to the Handbook on Planning, Monitoring and Evaluating for Development Results for Programme Units and Evaluators,” (UNDP 2011) (not named) “Addendum to UNDP Handbook on Planning, Monitoring and Evaluating for Development Results,” (UNDP 2011) Websites: www.berkeley.edu http://oe.berkeley.edu/ http://campuslife.berkeley.edu/sa/orgchart/vc http://www.cornell.edu/strategicplan/stewardship.cfm http://www.washington.edu/discover/leadership/provost/initiatives/2y2d http://www.purdue.edu/strategic_plan/ http://www.universityofcalifornia.edu/aboutuc/mission.html http://www.valuebasedmanagement.net/methods_rogers_innovation_adoption_curve.html http://www.gearstream.com/blog/21/59/Metrics-That-Encourage-Agile-Teams-to-Collaborate.html

http://www.themana.gr/management/measure-quality-not-call-time/ http://www.uservoice.com/blog/index.php/entries/numbers-zappos-looks-at/?utm_source=good-stuff http://www.engineeringadventure.com/2012/01/scary-business-metrics-and-zappos.html http://www.destinationcrm.com/Articles/Editorial/Magazine-Features/Mistaken-Metrics-57514.aspx http://www.nytimes.com/2010/01/10/business/10corner.html?_r=1&pagewanted=all