ECO-TOURISM IMPACT / SUCCESS INDICATORS …pdf.usaid.gov/pdf_docs/PNACT973.pdfECO-TOURISM IMPACT /...
59
Biodiversity Conservation & Economic Growth Project (BCEG) ECO-TOURISM IMPACT / SUCCESS INDICATORS BASELINE DATA 2002 KALOFER PILOT REGION OF CENTRAL BALKAN NATIONAL PARK Prepared by: Dr. Nikolina Popova BCEG Project consultant Bulgaria Biodiversity Conservation and Economic Growth Project is a collaborative initiative between the United States Agency for International Development and the Government of the Republic of Bulgaria implemented by Associates in Rural Development, Inc. Project Number LAG-I-00-99-00013-00, Task Order 01 June 2003 Sofia, Bulgaria
-
Upload
truongtram -
Category
Documents
-
view
217 -
download
1
Transcript of ECO-TOURISM IMPACT / SUCCESS INDICATORS …pdf.usaid.gov/pdf_docs/PNACT973.pdfECO-TOURISM IMPACT /...

Biodiversity Conservation & Economic Growth Project (BCEG)
ECO-TOURISM IMPACT / SUCCESSINDICATORS
BASELINE DATA 2002
KALOFER PILOT REGIONOF CENTRAL BALKAN NATIONAL PARK
Prepared by:
Dr. Nikolina PopovaBCEG Project consultant
Bulgaria Biodiversity Conservation and Economic Growth Project
is a collaborative initiative between the
United States Agency for International Developmentand theGovernment of the Republic of Bulgaria
implemented byAssociates in Rural Development, Inc.Project Number LAG-I-00-99-00013-00, Task Order 01
June 2003Sofia, Bulgaria

Bulgaria Biodiversity Conservation &Economic Growth Project
Baseline data on Ecotourism Impact Kalofer i
Table of contents
Preface iii
Executive Summary v
1.0 Success and impact indicators of eco-tourism developmentMethodological introduction 1
1.1 Purpose of indicators 11.2 Structure of indicators offered 21.3 Methodologies of conducting the research 3
2.0 Results from research in Kalofer pilot region 5
2.1 Tourism sector 52.2 Visitors 142.3 Tourist destination 242.4 Economic effects 292.5 Social effects 362.6 Cultural effects 41
3.0 Conclusions and recommendations 47
Appendices
Appendix 1 Questionnaire for managers of tourist establishments 53Appendix 2 Questionnaire for visitors 57Appendix 3 Questionnaire for local communities 63Appendix 4 Questionnaire for local authorities 67


Bulgaria Biodiversity Conservation &Economic Growth Project
Baseline data on Ecotourism Impact Kalofer iii
Preface
The Biodiversity Conservation and Economic Growth (BCEG) Project is funded by theUnited States Agency for International Development, (USAID), as part of its strategicsupport to the Republic of Bulgaria. The Project is sponsored by USAID in conjunction withthe Government of Bulgaria – the Ministry of Environment and Waters (MOEW). TheProject is governed by a Memorandum of Understanding (MOU) between the twogovernments, and its implementation covers the period: May 2000 – June 2003.
This Project is a logical evolution of earlier USAID assistance to biodiversity conservationin the country. It follows some 10 years of assessment, technical assistance and financing ofBulgaria’s biodiversity conservation strategic development, new protected areas legislation,and new national park institutions. The Project is designed to capitalize on the achievementsof the Bulgaria Global Environmental Facility (GEF) Biodiversity Project (implementedduring the period June 1995-April 2000), and builds on lessons learned.
The BCEG Project addresses six specific contract themes known as tasks or “contract resultpackages”. The BCEG Project includes the finalization and implementation of two nationalpark management plans, the development of a new management plan for Rila MonasteryNature Park. It assists in the development of financial mechanisms and strategies to ensurethe solvency of national parks. The Project pilots economic growth activities with selecttarget groups around two Bulgarian national parks. And it continues to build on theprinciples of strong public information and awareness as stepping stones for informed publicengagement and promotion of biodiversity conservation and protected area managementactivities.
This Project is issued as a Task Order (Contract Number LAG-I-00-99-00013-00) under theUSAID Global Biodiversity and Forestry Indefinite Quantities Contract (IQC); and isimplemented on behalf of USAID by Associates in Rural Development, (ARD) Inc., ofBurlington, Vermont, USA.
The Project is implemented through a Project Management Unit (PMU) based in Sofia, andincludes a Team Leader, three Bulgarian technical specialists, and support staff. Projectactivities are coordinated through two mechanisms –
a) Project Coordination Group – serves as a steering committee for Project planningand monitors implementation. This consists of the National Nature ProtectionService of the MOEW, and national park directors, the PMU and USAID;
b) Project Counterpart Team – PMU staff working with MOEW/NNPScounterparts.
The Project is largely implemented through the Directorates for Rila and Central BalkanNational Parks. Additional technical assistance is provided by Bulgarian and internationalconsultants, and is based on specific terms of reference.


Bulgaria Biodiversity Conservation &Economic Growth Project
Baseline data on Ecotourism Impact Kalofer v
Executive Summary
An Eco-tourism Monitoring Guidebook was developed as part of program of support to ruraleco-tourism development in association with two of the country’s largest national parks –Rila and Central Balkan. Two pilot areas have developed models of community eco-tourismas a result of projects undertaken by these two national parks in the implementation of theirmanagement plans. The community eco-tourism models developed with the assistance ofnational parks have demonstrated successful examples of public-private enterprise andcoalitions with protected areas, as well as a viable tool for community development. TheGuidebook was used by community ecotourism initiative groups to collect the baseline datafor monitoring eco-tourism impacts in the two pilot areas. The results of their work can befound in this report for Kalofer pilot area, associated with Central Balkan National Park andin another report for Samokov pilot area, associated with Rila National Park.
The Guidebook is dedicated to the belief that communities who set their own targets for eco-tourism development are also in the best position to chose and monitor their success orfailure. Self- selected community indicators in which all community eco-tourism developersare engaged in identifying and monitoring works much better than those imposed fromoutside the community.
A research project on the status of eco-tourism in the Kalofer pilot region was conducted inthe summer of 2002.
Objectives:Application of the Guide for Monitoring of Eco-tourism Impacts in protected areas inBulgaria and neighboring communities, developed by the Biodiversity Conservation andEconomic Growth Project and implemented by ARD, Inc, with funding from the U.S.Agency for International Development
Collection of information on the current status of eco-tourism on a comparative basis toassess future changes.
Implementation period: June 2002Region: Kalofer pilot regionSubjects of research (general totalities):- Tourist entrepreneurs’ establishments- Visitors- Local population- Local authorities
Methods:Standardized questionnaires designed for:
І Managers of tourist establishmentsІІ VisitorsІІІ Local communitiesІV Local authorities
Inventory tables completed by the local administration.
Approach: direct, one-time research

Bulgaria Biodiversity Conservation &Economic Growth Project
Baseline data on Ecotourism Impact Kalofervi
Volume of research sample:58 individuals representatives of local communities50 visitors27 tourist establishments
Representation:1) The results are not representative of all the local population and visitors2) Results are representative for the general whole of tourist entrepreneurs’
establishments since in small communities they comprise the larger part of thebusiness community.
Results from research in Kalofer pilot region
The research results are presented by the indicator groups as they are introduced in theGuide for Monitoring of Eco-tourism Impacts.
1. Tourism sector
There are emerging and developing family eco-tourist businesses and a positive trend forexpansion. This will result in the creation of new jobs for people outside these families. Themain features of the eco-tourist sector are:
1. year-round local employment2. existence of eco-tourism NGOs3. availability of local educational programs in tourism.4) a 50% growth in municipal expenditures in 2001 for improvement in the overall
infrastructure, as well as over a 60% growth in the construction of recreation andtourism facilities, as compared to 1999
All are indicative of favorable conditions for eco-tourism development
Areas that require attention are1) improvements in the categories of accommodation facilities and the diversity of
services offered2) tourism infrastructure3) formal and informal allocation of responsibilities among the state, the private
sector and the public sector.
2. Visitors
Collecting information from and on visitors annually is an important component of the eco-tourism monitoring system. This information can serve as a basis for assessing the quality ofsupply and adaptations in supply, for tourist product development, and for strategicallyplanning tourism development in the destination of concern. Most visitors to Kalofer areBulgarians living in Sofia (39.4%), Plovdiv (21%), and other large cities of the country(11%). All individuals questioned are up to 45 years of age, and most have a secondary orhigher education. Based on their responses to the questionnaires, they are people with anaverage income for Bulgaria.
The needs and preferences of visitors to Kalofer overlap fully with the profile of potentialeco-tourists in Bulgaria. Visitors prefer short trips and about one third have visited this

Bulgaria Biodiversity Conservation &Economic Growth Project
Baseline data on Ecotourism Impact Kalofer vii
destination many times. They learned about Kalofer mostly from relatives or friends.Visitors’ perception of this destination is related to the specific features of eco-touristproduct offered – serenity in natural surroundings and preserved cultural and historicalheritage.
3. Tourist destination
Each entrepreneur recorded a slight increase in the number of visitors, which is acharacteristic trend for newly developing destinations. Currently there are nine registeredaccommodation establishments and half of them have been operating for more than fouryears. The accommodation capacity of Kalofer is 105 beds. At this time there is no threat ofexceeding the carrying capacity of the destination. Tourist costs are primarily foraccommodation and dining. The costs for eco-tourist services constitute a small share of theoverall costs, and are indicative of the potential for developing eco-tourist attractions.
4. Economic effects of tourism.
Indicators of the economic effects of tourism give an idea of the role tourism plays in theoverall economy. These indicators are divided into seven groups and require annualmonitoring by both local authorities and eco-tourism entrepreneurs.The main effects noted in the analysis of these indicators are:
1) eco-tourism is the main source of income for one-half of those employed in eco-tourism
2) the number of people with professional qualifications is insignificant3) almost all establishments are owned by local entrepreneurs4) none have used bank financing5) less than one third of the local entrepreneurs are members of some tourism
organization6) the increase in enterprises is well paced with tourism development7) less than one percent of those employed work in the eco-tourism sector,
indicating that eco-tourism has little actual effect on job creation8) goods and services for eco-tourism businesses are purchased locally, which helps
to encourage additional small business development”
5. Social effects of tourism
Indicators used for monitoring social effects show the direct and indirect positive impacts oftourism on social life in the community. They need to be monitored annually by localauthorities.The following positive effects, however of narrow scope, have been measured in the Kaloferregion:
1) a 49% growth in enterprises for commercial and social infrastructure in 2001,compared to 1999. There are no statistics for enterprises related to recreationand sport.
2) a strong positive attitude in local communities towards eco-tourism developmentand an absence of irritability among local people
3) a positive trend in local community development, with an insignificant negativepopulation growth and the construction of new lodgings

Bulgaria Biodiversity Conservation &Economic Growth Project
Baseline data on Ecotourism Impact Kaloferviii
4) low level of noise pollution.
Needed improvements include a reduction in solid waste and a reduction in the intensity oftraffic during the active season.
6. Cultural effects of tourism
The cultural effects of tourism are indicative of the overall effect tourism has on the cultureand cultural heritage of the region. These indicators require annual monitoring on the part oflocal authorities. Eco-tourist entrepreneurs should monitor the indicator for use of localknowledge and skills in tourism and in tourist supply seasonally. The research found that:
1) There do not appear to be any threats to local culture as a result of impacts fromtourism. Most of the local community share the opinion that eco-tourism tendsto preserve local culture
2) A broad range of local crafts is part of the eco-tourism supply3) The nine annual cultural events are not sufficient to develop local cultural
tourism4) There is an average degree of compliance of tourist infrastructure with local
architecture
There are no statistics on significant indicators to identify probable impacts from all tourismactivities in the region, not just eco-tourism. The main recommendations from therespondents focus on simplifying the questionnaires and on the frequency of monitoringdifferent indicators.

Bulgaria Biodiversity Conservation &Economic Growth Project
Baseline data on Ecotourism Impact Kalofer 1
1.0 Success and Impact Indicators of Eco-tourism DevelopmentMethodological Introduction
1.1 Purpose of indicators
The set of impact and success indicators of eco-tourism is an instrument that assists in betterunderstanding the impact of eco-tourism on the environment. By monitoring theseindicators, one can evaluate whether the overall objectives for eco-tourism are being met.To define whether a given region is sustainable in terms of tourism development impacts, anumber of indicators are needed showing the relationship between tourism activities and thecapacity of the area to sustain these impacts.
Indicators help resource managers and others identify how communities change as a result oftourism development. Eco-tourism is associated with the most valuable natural and culturalsites and phenomena in a given destination. Damage to these resources will undoubtedly befollowed by economic losses for those whose livelihoods depend on tourism, and byecological and social losses for the whole local community. Thus, it is critically importantfor eco-tourism to be developed in harmony with the environment, and businesses shouldplay a leading role in establishing sustainable ecological and economic practices.
The following categories of effects indicate the possible risks of environmentally unfriendlydevelopment and development of tourism as a whole, including eco-tourism development:
Too much infrastructure Water, air, and soil pollution Noise pollution Deteriorating quality of natural resources from too many people Changes in the culture of host community
The long-term viability of tourism can be assured only when the limitations and favorableopportunities of the overall environment for tourism development are understood and waysto measure changes induced by tourism are identified and applied. Though eco-tourism isnot usually associated with a large number of visitors, its development in a given communityover a long period of time can lead to a number of changes that may negatively affect thecommunity’s social, cultural and economic life and its natural environment. These changesmight not be conspicuous, especially if the number of visitors is small or if eco-tourismactivities are not causing any substantial impacts. However, these types of changes tend toaccumulate slowly and gradually over course of weeks, months or years, and can ultimatelybring about huge and irreversible changes in the environment, deteriorating the livingconditions of the local community. This is why it is essential that these changes be regularlyobserved and monitored to project future changes, follow trends of development, andestablish controls and possibilities for regulation of undesirable processes.
Even when eco-tourism leads to positive changes it is important to monitor changes in thecommunity in order to identify the level to which the desired eco-tourism objectives arebeing achieved. Indicators can show steady tendencies in eco-tourism development. This iswhy measuring changes and providing this information to local people, and to relevantauthorities and institutions responsible for community development, and management ofeco-tourism could help them to make the best decisions. Using indicators makes it possibleto collect and develop a considerable amount of data on tourism in the community, including

Bulgaria Biodiversity Conservation &Economic Growth Project
Baseline data on Ecotourism Impact Kalofer2
opportunities for periodic updating and creating a dynamic order, as well as measuring andassessing change.
1.2. Structure of indicators
The methodological approach of this study is based on a set of tourism impact indicators thatcan be used in the process of eco-tourism planning and can provide necessary informationfor managers in tourism and administration officers in the public sector. These impacts aregrouped in three categories:
1) socio-cultural - effects on the social and cultural life of community2) economic - effects on the economic life of the community3) ecological or physical - effects on the natural resources or their ecological state,
within the community or in the surrounding area
Structuring the indicators, or identifying the main groups, is based on their role in supportingthe types of decisions local authorities and the tourist industry must make in the process ofplanning and managing tourism. Thus, one and the same question may fall within the detailsof several indicators. The main types of indicators in practice in the world today are:
Precautionary indicators – these indicators help to identify and prevent problems. Examplesof the most widely used indicators in this category are: a decrease in number of regularvisitors, decreased number of visits, and a decrease in the number of investments.
Indicators measuring carrying capacity or stress factor – these measure external factors ortendencies that should be considered in the process of planning and management. The bestexamples are: an increase in population, varying demand, increased loading from a variety ofuses on one and the same resource.
Indicators measuring the state of natural resources and volume of demand for theseresources – these indicators help managers identify what has changed in these resources inrelation to other similar resources, when compared with previous data or to acceptedstandards.
Indicators measuring impact/effects of tourism - these indicators can be integrated intobusiness plans, or be used to target activities that may be producing an effect that needs to beaddressed. An example is closing beaches due to pollution problems.
Indicators measuring management efforts/actions - these indicators provide information thatis used to measure the results of actions taken. Some examples include levels of controlledpollution, costs made for control of solid wastes, and size of protected areas.
Indicators measuring the consequences of management efforts - These identify the effect ofmeasures taken for sustainable development of tourism in the community. An example islowered levels of degradation in natural complexes.
The main group of indicators is used to measure and provide the necessary information tothe basic sectors involved in eco-tourism activities:
Public sector – the indicators show the actual role of each participant and reveal therelationships among them.
Visitors - monitoring is targeted at management of product quality by using indicators todetermine the visitor’s degree of satisfaction with the goods and services offered.

Bulgaria Biodiversity Conservation &Economic Growth Project
Baseline data on Ecotourism Impact Kalofer 3
Tourism sector - indicators provide information on tourism quality and its dynamics, andhelp to identify the key trends in its development.
Local population –- indicators indirectly measure changes in the economic, socio-culturaland ecological environment through the attitudes and perceptions of the local population.They show whether there is economic growth, whether the psychological comfort of localpopulation is established or violated, and whether qualities/features of the naturalenvironment and of cultural and historical heritage are preserved and improved.
1.3. Methodology of research
Data collection was carried out in June through direct, one-time inquiry by a team of masterstudents in Tourism of Sofia University St. Climent Ohridsky. The team interviewed 58representatives of local communities, 50 visitors, and 27 tourist establishments. The studentmagistrates were specially trained to conduct interviews and had some former experience inthis field. As part of the interview process they shared their experience with schoolchildrenfrom the in tourism in the secondary schools in the towns Kazanluk and Kalofer. Datacollected from the completed questionnaires were processed using the statistical packageSPSS, in percents and ratios. The percentage of respondents in this study was quite high -90%.
To obtain the opinion of the local population the so-called “ street inquiry” was used.Interviews were done in public places such as the town square, streets and public buildings.This type of inquiry was appropriate to the objectives, i.e. quick, one-time research to obtainrelatively reliable information based on spontaneous answers and in a way that allowed theinterviewer to oversee filling in the forms. The visitors’ questionnaires were completedwhere the visitors were staying, and over 90% responded. The tourist sector questionnaireswere completed at dining and accommodation establishments, identified by the Eco-tourismInitiative Group. The questionnaires were completed either with the help of the interviewersor independently by the managers or owners of these establishments.
Information the public sector (local authorities) was collected from different localgovernment bodies using inventory tables. This was a three-stage procedure: 1 preliminarymeetings with representatives of local authorities to clarify the volume and essence ofinformation; 2 submitting the questionnaire to the municipalities to be filled in by “a personin charge”, and 3 interviewers picking up the completed questionnaires.
The main groups of indicators were studied with the help of about 200 questions. This largenumber questions is difficult to use in monitoring because they require considerable effortand time and there is no statistical data available for many of them. The large number ofindicators was used during the first phase of the research with a view that collecting as muchinformation as possible would help to specify some factors in detail when appropriate


Bulgaria Biodiversity Conservation &Economic Growth Project
Baseline data on Ecotourism Impact Kalofer 5
2.0 Results from the research conducted in the Kalofer pilot region
The results of the research are presented by the indicator groups identified in the Guide forMonitoring of Eco-tourism Impacts. For purposes of the present analysis, the main groupof indicators is described with the help of a minimum set of key questions
2.1 Tourism sector
The indicators and related indices (questions) are most often quantitative and give an idea ofthe scope of the tourism sector. For example there are questions about the overall number oftourism enterprises and the number of people employed in tourism. On the other hand, thesedata allow a comparison between tourism and other economic activities. This helps to definetourism’s role in regional development at the present time, to evaluate the objectives thatwere set, and to identify future objectives related to tourism development in the region.These indicators and indices highlight the overall picture of tourism, i.e. what aspects arewell developed, to help make relevant management decisions at the local level.
Eight groups of indicators have been included in this research (Table 1):1) Number of those employed in tourism2) Type of employment3) Salaries/wages4) NGO-s involved in tourism5) Contributions by government (construction, donations)6) Improvements that are needed – facilities and services7) Availability of local training in tourism8) Allocation of responsibilities among the private sector, the state and the public
sector, including NGO-s
Some indicators, for example 2,6,7 and 8, refer to important qualitative aspects of tourism inthe region. They are interrelated and serve as a basis for a more profound economicanalysis. For example indicator 2 (the ratio of permanent to temporary employment) may beused for identifying training needs. Practice has shown that the use of a large share of thetemporarily employed labor force requires maintaining needed professional skills throughconsistent training.
It should be noted that some of the questions may be used to reveal various aspects of touristdevelopment and hence are included in other, different groups of indicators
2.1.1. Number of people employed in tourism – this is the main qualitative indicator. Itshows the scale of the business. It needs to be permanently monitored.
Key questions:- How many people work at the establishment?- Number and/or percent of people employed in tourism from the local population.
At present, there is no available information on the dynamics of existing jobs, but there is apositive trend in employing local people.
2.1.2. Type of employment - this indicator should be used in combination with the formerone to reveal the qualitative state of local employment.

Bulgaria Biodiversity Conservation &Economic Growth Project
Baseline data on Ecotourism Impact Kalofer6
Key questions:- What is the ratio of year-round to seasonal employment?- What is the ratio of permanent to temporary employment?- What is the ratio of local to external labor force?- What is the ratio of men to women?- What is the ratio of full time jobs to part time jobs?- What is the profile of the employees – members of family or hired labor?
There is a trend in family businesses to expand by creating new working places or hiringlocal people outside the family. The ratios between full and partial employment andbetween permanent and temporary employment are favorable for development of businesses.Those occupied full time and all-year through tend to prevail.
2.1.3. Salaries / wages – this indicator and related question give an idea of the financial stateof the business and serves as a base for comparison with the average values for the country.
Key question:- How many workers receive the minimal salary, the average one and above average
for the country?- What is the average salary in the community?
At present, remuneration is within the within the average salary for the country.
2.1.4. NGOs involved in tourism – this group of indicators shows awareness of theimportant role of the non-governmental sector in the planning process for touristdevelopment at local level. The establishment of NGOs dealing with tourism issues is a steptowards developing mechanisms for their formal participation in strategically planningeconomic development, including the development of tourism.
There are two active organizations in the region – the Eco-tourism Association CentralBalkan-Kalofer and the Craftsmen Society. However their membership is rather poor, withonly three tourist enterprises listed as members. There is also one membership in theBulgarian Association for Alternative Tourism (BAAT).
2.1.5. Contribution on the part of government - this group of indicators is very importantbecause recreation and tourism require a certain level of development in both overalltechnical infrastructure, such as water and sewage, electric power supply and roads, as wellas in public facilities for diverse recreation activities. Usually external visitors, touristsincluded, use sport, entertainment and other facilities constructed initially for the needs oflocal people. Local and central government have the primary responsibility for providingthese infrastructure facilities. They are also responsible for identifying various sources offinancing, and assisting local government in obtaining financing for building such facilities.
Key issues:- Contribution on the part of central government for developing tourist enterprises,
such as number of constructions and amount of donations- Expenditures of the municipality for maintenance of technical infrastructure- Expenditures of the municipality directly related to tourism, i.e. tourist facilities,
attractions, cultural centers, and sport facilities.

Bulgaria Biodiversity Conservation &Economic Growth Project
Baseline data on Ecotourism Impact Kalofer 7
In 2001 the municipality had a 50% increase in expenditures for improving the overallinfrastructure and a 60% increase for construction of recreation and tourism facilities, ascompared to 1999. There has been no contribution to tourism by the central government.
2.1.6. Improvements that are needed in facilities and services – this indicator is indicativeof the availability of facilities to satisfy two groups of needs: the usual daily biological needsas sleep, food and personal hygiene, and for communication, safety and security, and secondthe needs associated with recreation and amusements at the establishment and in the region.
Key questions are:- Is the establishment categorized according to current regulations?- What is the capacity of the establishment?- What fire alarm equipment has been installed?- Is there parking at the establishment?- What are the dining facilities – taverna, restaurant, coffeehouse, confectionery, bar,
disco club, others?- Is there a separate WC in the rooms?- Are there phone, TV and radio sets and air conditioning in the rooms?- What additional services are offered at the establishment?
Most accommodation facilities are in the low category, and provide no extra services. Someoffer TVs and telephones.
2.1.7. Availability of local training in tourism – establishing and maintaining aneducational/ training network in the field of tourism is necessary for providing services thatmeet the requirements of tourists. A training network also means additional localemployment.
Key questions for this group of indicators are:- How many of those employed have the necessary education and qualification in
tourism?- How many of those employed have worked in tourism before?- What are the training/educational needs at your establishment?- What qualification/training course would you like to cover?- What are the training/educational needs in the area of tourism of the community?- Number of local training programs or schools in the area of tourism
There is just one class in the secondary school in Kalofer where tourism education isavailable. There are no opportunities for professional specialization and training of personnelemployed in tourism. There are several areas where specialized training is needed, includingaccommodation and catering, marketing, management, and specialized tourist services.
2.1.8. Allocation of responsibilities among the private sector, the state and the publicsector, including NGOs – in times of strong competition and especially in this period oftransition to a market economy, it is essential to integrate the efforts of all the sectors relateddirectly or indirectly to tourism. Often the interests of various sectors differ and sometimestend to contradict. That is why it is necessary to clearly identify common interests, which inturn would require efforts to unite to establish favorable business conditions.
Bulgaria Biodiversity Conservation &Economic Growth Project
Baseline data on Ecotourism Impact Kalofer8
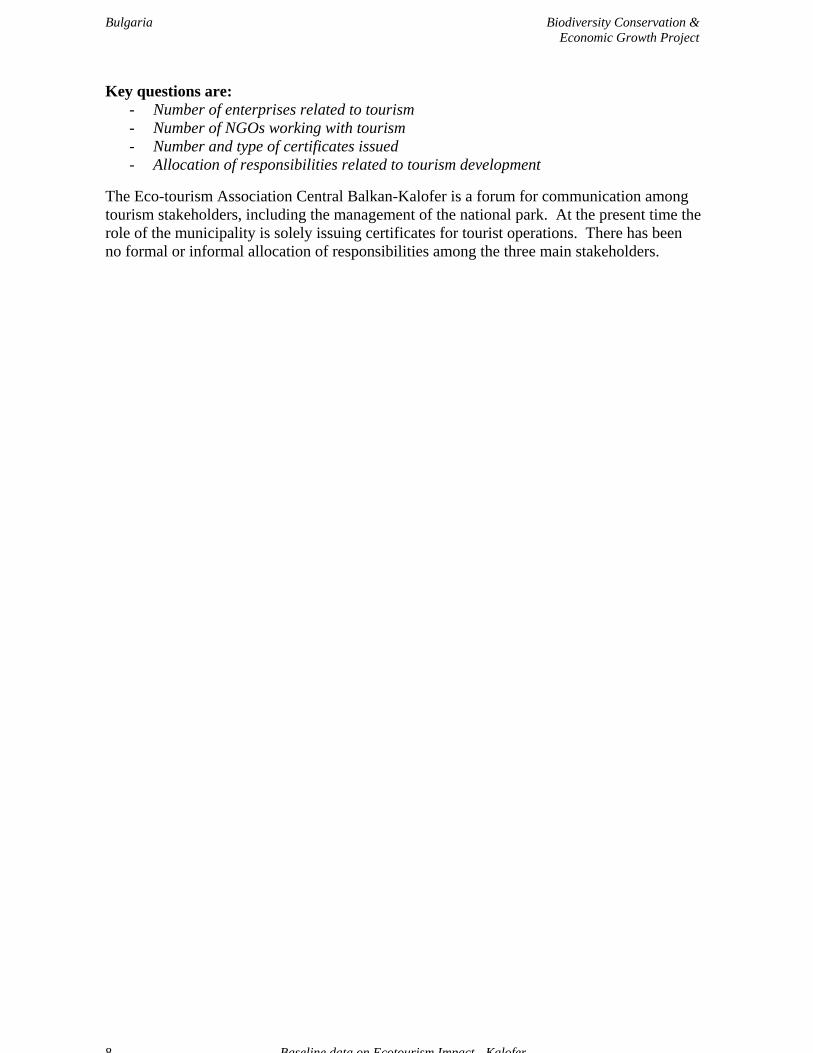
Key questions are:- Number of enterprises related to tourism- Number of NGOs working with tourism- Number and type of certificates issued- Allocation of responsibilities related to tourism development
The Eco-tourism Association Central Balkan-Kalofer is a forum for communication amongtourism stakeholders, including the management of the national park. At the present time therole of the municipality is solely issuing certificates for tourist operations. There has beenno formal or informal allocation of responsibilities among the three main stakeholders.

Bulgaria Biodiversity Conservation &Economic Growth Project
Baseline data on Ecotourism Impact - Kalofer 9
Table 1 Tourism sector in Kalofer
Indicators Questions from the questionnaires IndexValue
Index-Growthin % -Baseforcomparison
Recommendedindicator value
Tourism sector
1. Number of employees intourism
І- Number of people employed in touristestablishments?ІV- Number of local population employed intourism
Number10
%Base
Base
Increase
Increase
І- What share of those employed are: 0.8Local people or from other community 10/ 0Permanently or temporarily employed 7 /3Full time or part-time 7 /3
2. Type of employment (fulltime, part time, seasonal,local/external)
Men/women 5 /5 …
Improvement –value above 1
І – How many workers get the followingsalary?
Index-2.3Index-1
MinimalAverage for the countryAbove the average for the country
10Base Increase -
Above theaverage salaryIncrease
3. Salaries/Wages
ІV- What is the average salary in thecommunity
100 BGL Base Increase
4. NGO-s involved in tourismІV- Number of NGO-s involved in tourism 2 Base Improvement –
according tolocal strategy
5. Contribution of centralgovernment (construction,donations, others)
ІV- Number of constructions, donations, etc.… … Statistics
needed

Bulgaria Biodiversity Conservation &Economic Growth Project
Baseline data on Ecotourism Impact - Kalofer10
I - What is the category of the establishment?
I – Is the establishment categorized accordingto Regulation 2002?I – What is the capacity of the establishments(beds)
Single and double rooms Rooms with three or more beds
954555
Base Improvement-According tolocal strategy
І- What is the heating source used? Wood Diesel Electricity Coal
700300
Base Improvement-According tolocal strategy
І-Establishments with fire-precautionfacilities.
1 fire-extinguisher 2 fire-extinguishers over 3 fire-extinguishers
Base Improvement-According tostandards set
І- Is there a parking place to theestablishment.
With parking place No parking places
12
Base Sustain
І-Establishments offering dining and drinks. No dining Dining and drinks
19
Base Sustain
6. Improvement needed
І- Is there a separate WC to the room? Yes No
10 Index –0.1
Improvement –value close to 1

Bulgaria Biodiversity Conservation &Economic Growth Project
Baseline data on Ecotourism Impact - Kalofer 11
І- Is there in the room: Telephone TV Radio Air-conditioning
10610
Base Improvement –According tobusiness plans
I. Extra services offered by the establishmentrelated to local folklore, culture and traditions
Establishments that offer extra services Establishments that do not offer such
services
0
10
BaseImprovement –as per businessplans and localstrategy
I. Establishments with personnel that has thenecessary education and qualification intourism
With the necessary education Without the necessary education
010
Base Improvement –sharp change
І-Establishments with business plan With business plan Without business plan
09
Base Improvement –sharp change
І – Distribution of new investments: Local taxes and charges New equipment Rehabilitation works Resources and materials Other expenditures
633201526
Base Improvement –as per businessplans and localstrategy
І – Attracting customers by means of: Mediators Relatives and friends Others
1085 5
Base Increase - in market ingchannels

Bulgaria Biodiversity Conservation &Economic Growth Project
Baseline data on Ecotourism Impact - Kalofer12
І – Membership in tourism organizations. establishments that are not members of
any organization establishments that are members of
organizations
7
3
Base Increase ofmembers
І- Establishments with personnel with thenecessary specialized education and training
Without the necessary specialization With the necessary specialization
100
Base Improvement –sharpimprovement
І – Establishments with personnelexperienced in tourism
Little or no experience Experienced
100
Improvement –sharpimprovement
In your opinion, what are thetraining/educational needs of the personnel inyour establishment?
Room maids Cooks Waiters Receptionists
75101010
Base Improvement –According tobusiness plans
7. Availability of localtraining in tourism
VІ – Number of local programs / schools fortraining in tourism 2
Improvement –as per localstrategy
ІV- Number of tourism-oriented enterprises 5 Growth –150%
Improvement –as per regionaldevelopmentplan
8. Distribution ofresponsibilities amongprivate sector, the state, andNGOs.
ІV- Number of NGOs in the field of tourism 2 Base Improvement –as per localstrategy

Bulgaria Biodiversity Conservation &Economic Growth Project
Baseline data on Ecotourism Impact - Kalofer 13
ІV- Number and type of tourism certificatesissued by the municipality in 2001.
Accommodation establishments /2002*/ Dining establishments Applied crafts
17
2 –16*123
Base Improvement –as per localstrategy
VI – Allocation of responsibilities for tourismdevelopment
- Improvement –As per localstrategy
Key to Indicator Values: Improvement; Decrease; Sustain; Increase; Dots –absence of statistical dataІ Questionnaire for managers of tourist establishmentsІІ Questionnaire for visitorsІІІ Questionnaire for local communitiesІV Questionnaire for local authorities

Bulgaria Biodiversity Conservation &Economic Growth Project
Baseline data on Ecotourism Impact Kalofer14
2.2 Visitors
Monitoring visitors is an important element in the monitoring system. Visitors should bemonitored continuously, and the data should serve as a basis for evaluating the quality ofservices, for making changes in services, for developing the tourist product, and forstrategically planning tourism development at the destination.The main groups of indicators found in Table 2 are:
1) Income, demographic characteristics and other data on visitors2) Needs, recommendations and interests3) Satisfaction with services and facilities4) Models of visits5) Access to services6) Parking7) Image of the destination
2.2.1. Income, demographic characteristic and other data for visitors - these indicators areimportant for understanding a broad range of physiological, educational, spiritual and otherneeds of visitors. Good knowledge of these can lead to setting feasible objectives indeveloping a tourist product that meets the expectations of visitors and therefore achieves anacceptable quality.
Key questions in this group of indicators are:- How did you come to know about this tourist place?- What is your nationality?- What is your permanent living address?- What is your sex?- What is your age?- What is your marital status?- What is your education/profession?- How do you evaluate your standard of living?- How did you organize your vacation?
Most of Kalofer’s visitors are Bulgarians who live in Sofia (39.4%), Plovdiv (21%) andother large cities in the country (11%). All individuals questioned are younger than 45 yearsof age and 46% have a higher education. Based on their responses to the questionnaire, theirincomes are average for Bulgaria. This research has demonstrated that the types of visitorsto Kalofer are consistent with the profile of potential customers for eco-tourism in Bulgaria.1
2.2.2. Needs, preferences and interests – this group of indicators is important because itdirectly relates to visitors’ motivation for choosing a specific tourist establishment, and isindicative of visitors’ expectations of the quality and quantity of goods and servicesimportant to them. Monitoring these indicators provides measures of compliance with thequality of tourist product.
The key question is:What is the purpose of your visit here?
1 Prospects for the Development of Eco-tourism in Bulgaria. Research on domestic market Project BCEG,2002

Bulgaria Biodiversity Conservation &Economic Growth Project
Baseline data on Ecotourism Impact Kalofer 15
The needs and preferences of visitors are quite consistent with the characteristics of eco-tourist destination – recreation and activities oriented to natural and cultural heritage.
2.2.3. Satisfaction with services and equipment – this indicator is viewed as a complex oneand is a function of many other factors and indicators. The key questions focus onestablishing consistency between the visitor’s expectations of relevant goods and servicesand their actual perception of tourist supply at their destination. This indicator requiresanswers to questions clarifying the character of tourist demand and visitors’ behaviorrevealed in the purpose of their visit, and activities they tend to perform or would like toperform during their stay. There are also some questions that require a direct answer on thedegree of satisfaction with the stay and specific services provided.
The key questions related to this indicator are:- Are you satisfied with your vacation here?- Would you like to visit this place again?- Would you recommend this place to your relatives or friends?- What is your overall impression from your stay here?- What is your assessment of the separate components of tourist supply?
There is a high degree of satisfaction with the quality of services offered. It will be essentialto monitor the dynamics of this indicator, as it is dependent on the market dynamics forspecialized eco-tourist products.
2.2.4. Models of visit – this group of indicators reveals the basic model of recreation activity.They show what the recreational activities are. When compared with the questions about thevisit and the relevance of recreation and tourism activities, it becomes clear whether thetourist product supply meets tourists’ expectations. The indicator also shows what theirfuture intentions are to visit again. To a certain degree, their intention depends on whetherthe hypothetical recreation supply and the actual supply are similar.
Key questions:- How many times have you visited this place?- How long are you staying here?- Where did you get information about this tourist establishment?- How is your vacation organized?- What are your approximate costs for your stay here?- What recreation activities did you do during your stay?
Short-term visits tend to prevail and about one third of the visitors have been to the Kaloferarea repeatedly. Relatives and friends were their main source of information about the area.
2.2.5. Access to services - among the basic components of tourist supply is accessibleinformation and transportation. This indicator is a complex one and can be described using anumber of indices/questions related to various elements of the transport system. It isimportant that they be defined precisely, depending on the type of transport to the touristdestination of concern/
Key questions:- What means of transportation did you use to get here?- How do you assess the transport accessibility of the tourist establishment?- How do you assess the informational accessibility of the tourist establishment?

Bulgaria Biodiversity Conservation &Economic Growth Project
Baseline data on Ecotourism Impact Kalofer16
Access to the Kalofer area is good, but there isn’t much signage or other guide information.
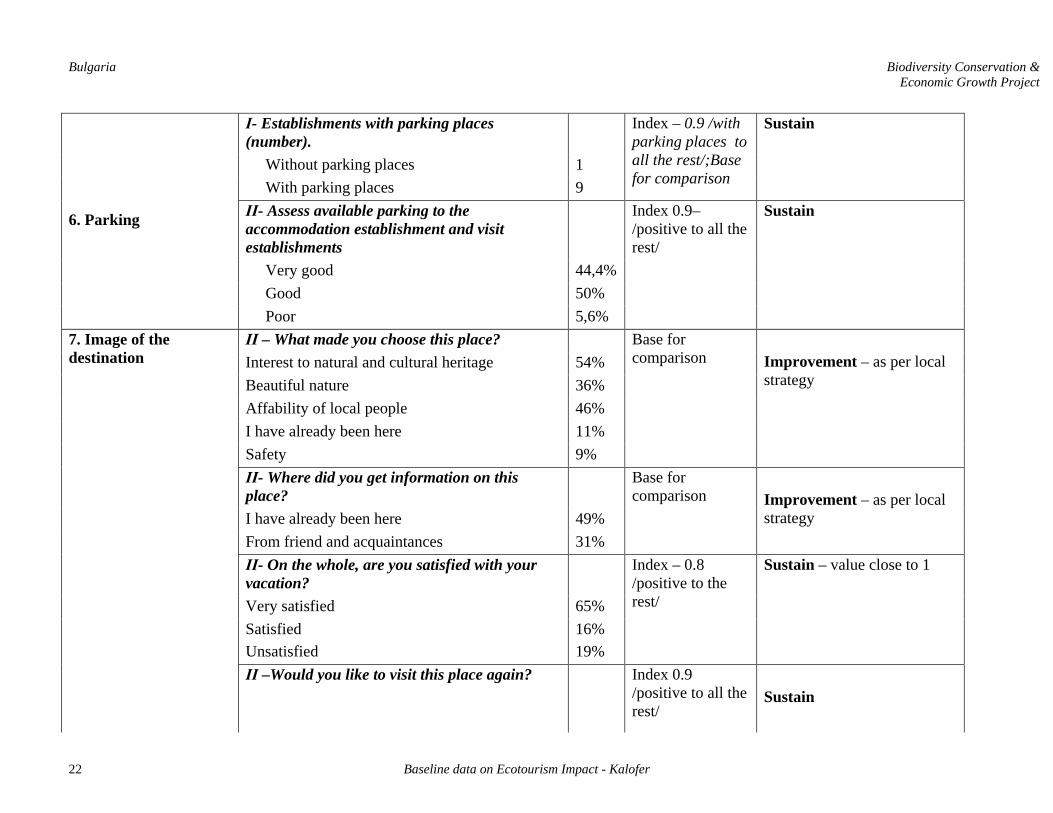
2.2.6. Parking – this indicator is related to the previous one but is monitored separately sinceparking is a service used during a stay at the tourist site. It is an important indicator tomonitor at the research establishment since the automobile is the main mode oftransportation. When tourism is practiced on a smaller scale, one’s personal automobile isthe more common form of transportation.
Key questions:- Does the establishment have any parking spaces?- Please assess options for parking at the accommodation establishments
Parking conditions in Kalofer are very good.
2.2.7. Destination image –this group of indicators demonstrates what the tourists’perceptions are of the destination. Practice has shown the importance of this factor whentourists make decisions about where to visit. Tourists’ opinion do not always coincide withthat one of producers of goods and services, hence it is essential to know what the image ofthe tourist establishment is in the eyes of tourists. It is important to use this information toplan proper marketing efforts, and to maintain and make further improvements toestablishments. The image of a destination is closely connected with the degree ofsatisfaction tourists have about their stay. Thus many of the questions related to thisindicator are used to assess the degree of visitor satisfaction.
Key questions:- What made you select this tourist establishment?- Would you like to visit this tourist establishment again?- Would you recommend this place to your relatives or friends?- What is your overall impression from your stay here?
The results of this research show that the Kalofer region has a very good image.

Bulgaria Biodiversity Conservation &Economic Growth Project
Baseline data on Ecotourism Impact - Kalofer 17
Table 2. Visitors to Kalofer
Indicator Questions from the questionnaires Value of the index/Increase in %/ Basefor comparison
Recommended indicator value
Visitors
ІІ Your national identity?
Bulgarian
Foreigners
91.5%
8,5
Base forcomparison
Improvement –
As per local strategy
ІІ- Your gender?Men
Women
51,5%
48,5%
Base forcomparison
ІІ- Your age group?Up to 35 years
Up to 45 years
76,9%
23,1
Base forcomparison
ІІ Your permanent residence?Sofia
Other settlements
39,4%
60,6%
Base forcomparison
1. Income,demographiccharacteristics andother data for tourismmarket
ІІ Your family statusNot married
Married
38,9%
61,1%
Base forcomparison
Improvement –productcompliance

Bulgaria Biodiversity Conservation &Economic Growth Project
Baseline data on Ecotourism Impact - Kalofer18
-ІІ Your education
Semi higher and Higher
Secondary
60,6%
29,4%
Base forcomparison
ІІ Your professionAdministrative workMedium executive levelLow executive levelOthers
16,5%45,2%8,8%23,6%
Base forcomparison
ІІ-Your material circumstances?-Well-to-do /over the average for the country/-Average level for the country-Poor (below the average one for the country)
14,2%82,9%
Base forcomparison
Improvement –productcompliance
2. Needs, preferencesand interests
ІІ – Purpose of the visit to the settlement andthe surroundings /target activityRecreation in natural environmentInterpretative tour to local craftVisit to natural landmarksTaking pictures of natural landmarksTourist trailsInterpretative trips in local cultureCelebrations and anniversaries
77,7%50%68,4%50%61.6%92.6%25%
Base forcomparison
Improvement – according toregional strategy
ІІ- On the whole, are you satisfied with yourvacation?Very satisfiedSatisfiedUnsatisfied
65%16%19%
Index – 0.8/positive to allresponses
Improvement – value near to 1
3. Satisfaction withservices and equipment ІІ –Would you like to visit this tourist
destination again?Yes, with pleasureI can’t say
96.9%3,1%
Index – 0.9/positive to allanswers/
Sustain

Bulgaria Biodiversity Conservation &Economic Growth Project
Baseline data on Ecotourism Impact - Kalofer 19
ІІ –Would you recommend this touristdestination to your relatives or friends?Yes, absolutelyI can’t say
93.9%6.1%
Index – 0.8/positive to allresponses/
Sustain
ІІ- Please, assess separate components of touristsupply1. AccommodationSafety Very good 60% Good 40%
Index – 1.0/positive to allresponses/
Sustain
Conveniences in the rooms Very good 15% Unsatisfactory 85%
Index – 0.2/positive to allresponses/
Improvement – value nearto 1
Affability of the personnel Very good 60% Good 40%
Index – 1.0/positive to allresponses/
Sustain
2. Tourist productRecreation Good 50% Unsatisfactory 50%
Index – 0.5/positive to allresponses/
Improvement – value nearto 1
3. National kitchen Good 50% Poor 50%
Index – 0.5/positive to allresponses
Improvement – value nearto 1
4. Amusements Good 2%
Index – 0.2/positive to allresponses
Improvement – value nearto 1

Bulgaria Biodiversity Conservation &Economic Growth Project
Baseline data on Ecotourism Impact - Kalofer20
Unsatisfactory 80%4. Tourist and other relevant information Good 26% Poor 17%
Index – 0.6/positive to allresponses/
Improvement – value nearto 1
4.Behavioral pattern
ІІ- How many times have you visited this touristdestination? First time Second time More than twice
63%20%17%
Base forcomparison
ІІ-Where did you get information about thistourist destination? I have been already here 49% From friends and acquaintances 31%
Base forcomparison
ІІ- How has your vacation been organized? Booked by acquaintances 25% Direct booking 13% Chosen at spot 10% Through tourist agency 9%
Base forcomparison
ІІ- How long are you staying here? 1 overnight 33% 2 overnights 3%
Base forcomparison
Improvement –as per localstrategy
ІІ- What are your approximate expenditures foryour stay here? Up to 50 BGL 53% Up to 100 BGL 20%
Base forcomparison Improvement –as per local
strategy

Bulgaria Biodiversity Conservation &Economic Growth Project
Baseline data on Ecotourism Impact - Kalofer 21
Up to 200 BGL Above 200 BGL
13%7%
ІІ- What recreation activities have you indulgedin during your stay here? (in percent)Recreation in natural surrounding 77,7Visits to natural landmarks 68,4Taking pictures of natural landscapes 50Interpretative tours to local craft 50Interpretation of local culture 92,6 Mountain trails 61,6Participation in celebration and anniversaries 25
Base forcomparison Improvement – as per local
strategy
ІІ- What transport did you use to get here?Personal transport vehiclePublic transportCharter bus /organized by a tourist agency/
25%14%11%
ІІ- Please, assess transport and informationalaccessibility
Base forcomparison
Improvement – as per localstrategy
Transport accessibility Very good 44% Good 48%
Index – 0.9/positive to all therest/
Improvement
Informational accessibility Very good 38% Good 31%
5. Access to services
Poor 31%
Index – 0. 7/positive to all therest/
Improvement - value closeto 1
Bulgaria Biodiversity Conservation &Economic Growth Project
Baseline data on Ecotourism Impact - Kalofer22
І- Establishments with parking places(number). Without parking places 1 With parking places 9
Index – 0.9 /withparking places toall the rest/;Basefor comparison
Sustain
ІІ- Assess available parking to theaccommodation establishment and visitestablishments Very good 44,4% Good 50%
6. Parking
Poor 5,6%
Index 0.9–/positive to all therest/
Sustain
ІІ – What made you choose this place?Interest to natural and cultural heritage 54%Beautiful nature 36%Affability of local people 46%I have already been here 11%Safety 9%
Base forcomparison Improvement – as per local
strategy
ІІ- Where did you get information on thisplace?I have already been here 49%From friend and acquaintances 31%
Base forcomparison Improvement – as per local
strategy
ІІ- On the whole, are you satisfied with yourvacation?Very satisfied 65%SatisfiedUnsatisfied
16%19%
Index – 0.8/positive to therest/
Sustain – value close to 1
7. Image of thedestination
ІІ –Would you like to visit this place again? Index 0.9/positive to all therest/
Sustain

Bulgaria Biodiversity Conservation &Economic Growth Project
Baseline data on Ecotourism Impact - Kalofer 23
Yes, with pleasure I can’t say
97%3,1%
ІІ –Would you recommend this tourist place toyour relatives or friends? Yes, absolutely I can’t say
94%6.1%
Index 0.9/positive to all therest/
Sustain
Key to Indicator Values: Improvement; Decrease; Sustain; Increase; Dots –absence of statistical dataІ Questionnaire for managers of tourist establishmentsІІ Questionnaire for visitorsІІІ Questionnaire for local communityІV Questionnaire for local authorities

Bulgaria Biodiversity Conservation &Economic Growth Project
Baseline data on Ecotourism Impact Kalofer24
2.3 Tourist destinationThe main groups of indicators for monitoring the tourist destination (Table 3) are:
1) Number of visitors per sq. km.2) Number of visitors as compared to local population3) Tourist expenditures4) Accommodation costs
2.3.1. Number of visitors per square unit (sq. km or sq. decares) – this is a precautionaryindicator used to show compliance with the level of loading of recreation areas.
Key questions:- Number of local population- What is the declared percentage of land for recreation and tourism- Number of tourists
There is no statistical data available on the number of visitors but information from tourismentrepreneurs shows an increase in their number. This is a characteristic trend for newlydeveloping destinations.
2.3.2. Ratio of number of tourists to number of local population – this group of indicatorshelps to identify the degree of psycho-physiological convenience of tourists and of the oflocal community, as well as favorable conditions for providing services to tourists.
Key questions:- Number of local population- Number of tourists
At this stage there is no threat of exceeding the carrying capacity of the destination for thenumber of tourists.
2.3.3.Tourist expenditure - this indicator shows tourist expenditures in the areas oftransportation, accommodation and dining, recreation activities and tourism at the site. Theinformation can be used to develop tourist packages aimed at larger sales of services forrecreation, i.e. not solely for accommodation and dining. This indicator should be monitoredon regular basis and if possible by month or season.
Key questions:- What is the capacity of the establishment?- Number of visitors to the community?- What type of expenses have you made during your stay?
The main expenses are accommodation and dining costs, and the amount spent onspecialized tourist services is rather small in comparison.
2.3.4. Accommodation establishments - this indicator reveals the state of theaccommodation sector, which is usually the first one to develop in a given destination. Thequestions comprise both quantitative and qualitative parameter of establishments monitored.
Key questions:- Number of accommodation establishments.- Type of accommodation establishments, category, operation time- What is the capacity of the establishment?- Number of individuals that were accommodated?

Bulgaria Biodiversity Conservation &Economic Growth Project
Baseline data on Ecotourism Impact Kalofer 25
There are nine registered accommodation establishments and half have been in operation formore than four years. The total capacity is 105 beds.

Bulgaria Biodiversity Conservation &Economic Growth Project
Baseline data on Ecotourism Impact - Kalofer26
Table 3. Kalofer Tourist Destination
Indicator Questions from the questionnaires Value of indicator Recommendedindicator value
Tourist destination Measure Index / BaseІV- Number of local population 3782
ІV- What is the % of the land for recreation and tourism(decares) 2%
1. Number of visitors per sq.km/decare
ІV- Number of tourists 910
33 decares perone tourist
14.6 decaresper person forgeneral use(tourist or localresident)
Improvement- asper regulations
І- State number of tourists (those with overnights) in thetourist establishments
833
ІV- Number of local population 3782
1 tourist/5local residents
Improvement- asper regulations (tothe limit ofcarrying capacity)
ІV- Number of visitors to the community ... - Statistics should becarried out
2. Number of tourists tolocal population
ІІ- What type of expenditures did you make? (average inBGL) Accommodation Food Sport, amusements and tourist activities
5528
Base forcomparison
Improvement- asper business plansand local strategy

Bulgaria Biodiversity Conservation &Economic Growth Project
Baseline data on Ecotourism Impact - Kalofer 27
I. What is the capacity of the establishments? … - Statistics should becarried out
IV – Number of visitors in the community … - Statistics should becarried out
3. Tourist expenditure ІІ- What type of expenditures did you make? /averagein BGL/ Accommodation Food Sport, amusements and tourist activities
5528
Base forcomparison
Improvement- asper regulations (tothe limit ofcarrying capacity)
ІV- Number of accommodation establishments 9 Base forcomparison
Increase
І- What is the type of establishment, when was itestablished, is it categorized and what is its category?(number, stars)
Index – 0.6/ratio ofestablishmentsto privatelodgings
Increase – highervalues of ratio
A) Family Hotel 1 year
1, no stars
4. Accommodation facilities
B) Country house 1 year
2, 1 star Index – 0.6/ratio ofcategorizedestablishmentsto notcategorized
Improvement – ofcategory as perbusiness plans

Bulgaria Biodiversity Conservation &Economic Growth Project
Baseline data on Ecotourism Impact - Kalofer28
C) Private lodging 1 year 3 years over 4 years
D) Monastery 1 year
1, no stars1, no stars3, 1 star
1, no starsІ- What is the capacity of the establishment?Single and double roomsRooms with 3 and more beds
5055
Base forcomparison
Improvement – asper local strategy
І- What is the number of visits (with overnights)? 865 Base forcomparison
Increase
Key to Indicator Values: Improvement; Decrease; Sustain; Increase; Dots – absence of statistical dataІ Questionnaire for managers of tourist establishmentsІІ Questionnaire for visitorsІІІ Questionnaire for local communityІV Questionnaire for local authorities

Bulgaria Biodiversity Conservation &Economic Growth Project
Baseline data on Ecotourism Impact Kalofer 29
2.4 Economic effects of tourism
The economic effects of tourism demonstrate the role of tourism in the overall economy.These indicators reflect both the dynamics of tourist businesses and the promotion ofeconomic activities related to providing services to tourists. At the initial stage of tourismdevelopment, it is advisable to monitor almost all indicators throughout the year to see thechanges in its development. At further stages of development, some indicators should bemonitored periodically, every 3-5 years, to capture the macroeconomic changes that havetaken place such as changes in the number of enterprises and number of beds.
The economic indicators (Table 4) are:1) Jobs2) Number of tourism enterprises3) Local entrepreneurship4) Revenues from tourism5) Number of certificates issued6) External work force as compared to local unemployment7) Economic costs of related business development
2.4.1. Jobs – questions from this group of indicators overlap with questions regarding workforce in the section devoted to the tourism sector. In this section they are interpreted chieflyby comparing them with the same indicators covering the overall economic sphere of theregion. This requires consistent and well structured monitoring to collect statistical data.This research has focused on comparing two indices – employment in % of local populationand average salary.
Key questions:- How many people are employed in the tourist establishments in the region?- What is the profile of those employed? – owners, family members, hired labor force
from local community/other communities, full or part time, men/women.- How many of those employed get a) minimal salary, b) average for the country and
c) above average for the country?- How many of those employed consider that tourism is their a) main activity, b)
additional activity?- How many of those employed in tourism have the necessary education and
qualification?- How many of those employed have former experience in the sphere of tourism?- What are the training/educational needs in the area of tourism?- What is the number or percentage of local people employed in tourism?- What is the size of the average salary in the community?
Eco-tourism is a main source of income for half of those employed in it. The number ofqualified personnel is insignificant. The dynamics of this indicator need to be monitored.
2.4.2. Number of enterprises accompanying and supporting tourism development – thisgroup of indicator illustrate the scope and structure of other economic activities that havedeveloped to provide services for tourists. Statistical observation of this indicator isimportant for developing and refining economic development plans for the community overthe long-term. The public sector/local authorities should monitor these indicators.

Bulgaria Biodiversity Conservation &Economic Growth Project
Baseline data on Ecotourism Impact Kalofer30
Key question:- Number of tourism-oriented enterprises
For the last three years, there has been a considerable increase in the number of enterprisesrelated to tourism development. This speaks to the positive economic impact of tourism onthe community’s economy.
2.4.3. Local entrepreneurship – this group of indicators shows whether tourism is going tohave greater or lesser effect on the local community in terms of profit (does it stay with thecommunity); employment of local people, and favorable business environment (creditopportunities).
Key questions:- Type of establishment - own property, rented, other forms- Is the manager of the establishment the owner (local, external) or hired (local,
external)?- Have you taken out a bank loan and how many times?- Who makes the decisions for new investments and larger costs for the establishment?- How do you recruit your customers?- Are you a member of some organization related to tourism?
Local entrepreneurs own all but one of the establishments, and none have financed theircosts with a bank loan. Only three establishments are members of tourist organization.
2.4.4. Revenues/income generated from tourism - this group of indicators shows the directeffects of tourism on revenues/income generated in the municipality.
Key questions:- What % of community income comes from tourism?- What is the share of tourism in the overall revenues of the municipality?
There are no relevant statistical data on these issues.
2.4.5. Number of certificates issued - this group of indicators is closely associated with thegroup of indicators for local entrepreneurship. It shows the growth and structure of tourism,and indirectly the stage of development of the destination.
Key questions:- Number of certificates issued- Type of certificates issued
There has been an increase in the number of certificates, mostly for catering services.
2.4.6. External labor force /local unemployment – this indicator is important for identifyingthe direct impact of tourism on local employment.
Key questions:- What percent of the local population is employed in tourism?- What is the level of unemployment?- Number of people receiving social assistance- Number of people that have moved from the settlement- Number of people that have settled in the community

Bulgaria Biodiversity Conservation &Economic Growth Project
Baseline data on Ecotourism Impact Kalofer 31
Those employed in eco-tourism are about 1 % of the local community, so this sector has hadan insignificant effect for job creation.
2.4.7. Economic costs for developing eco-tourist enterprises business in the regions – thisgroup of indicators show the direct effect of eco-tourism on the local economy and it showsefforts by the public sector to create a favorable business environment for tourismdevelopment.
Key questions- Where did you get the materials, resources and equipment for your establishment?- What are your costs for the establishment (% of the total)?- How are new investments allocated?- What are the expenditures of the municipality for improving and maintaining the
overall infrastructure?- What are the costs of the municipality directly related to tourism?
Eco-tourism businesses tend to purchase their goods and services locally, which support thedevelopment of other small-scale businesses.

Bulgaria Biodiversity Conservation &Economic Growth Project
Baseline data on Ecotourism Impact - Kalofer32
Table 4. Economic Effects of Tourism in KaloferIndicators Questions from the questionnaires Value of
indicator
Value of index/Growth in %/Base Recommended
indicator valueEconomic Number/
%І – How many people work in the establishment? 10 Base for comparisonІ – What is the profile of those employed? Local people or from other community Permanently or temporarily employed Full time or part time Men or women
10/07/37/35/5
Index – 0.7 / ratio offull to part timeemployment, ofpermanent to seasonalemploymentIndex - 1 / ratio of localto external employees /Index – 1 /ratio of manto women
Sustain orImprovement –depending on localstrategy
І – How many of those employed receive: The minimal salary The average for the country Above the average for the country
-10-
Base for comparison Improvement
І- For how many of those employed is tourism: Main occupation Additional occupation
52%24%
Index – 0.5 Improvement – asper business plans
1. Jobs
І- How many of those employed have he necessary qualificationand training?
- Index 0.0 Improvement – asper business plans

Bulgaria Biodiversity Conservation &Economic Growth Project
Baseline data on Ecotourism Impact - Kalofer 33
І- How many of those employed in the establishments workedpreviously in the area of tourism?
- Index - 0.0 Improvement – asper business plans
І- In your opinion what are the educational/training needs inyour establishment?Room maidsCooksWaitersReceptionists
75101010
Base for comparison Improvement - asper business plans
ІV- Number or percent of local people employed in tourism 0.8% Base for comparison Increase – as perlocal strategy
2. Number ofenterprisesinvolved in tourism
ІV- Number of local enterprises involved in tourism 5 Base for comparison Increase
І- Type of establishment (number)- Owned- Rented
811
Index – 0.9 Sustain
І- The manager of the establishment is:Local ownerLocal resident employed
89 %11 %
Index – 0.9 Sustain3. Localentrepreneurs
І- Does the establishment got a business plan? 0 Base for comparison ImprovementІ- Have you used a bank of other type of loan? What loan, howmany times and time terms?
-
І- Who makes the decisions on new investments and larger costsof the establishment? The owner of the establishment 100%
Index – 0.0/ ratio ofemployed to managers
Improvement

Bulgaria Biodiversity Conservation &Economic Growth Project
Baseline data on Ecotourism Impact - Kalofer34
І- How do you attract your customers? -Through tourist mediators - Friends and acquaintances - Tourist Advertising - Other sources
10 %55 %30 % 5 %
Index– 0.4 /ratio ofmarketing channels toother ways
Improvement – asper business plans
І- Are you a member in some organization related to tourism?Establishments that are not members to any relevant organizationEstablishments that are members of such organizations
67 %33 %
Index – 0.3 /membersto non-members
Increase – highervalues
ІV- What percent of locally generated revenues come fromtourism?
... - Statistics should beprovided
4. Revenues fromtourism –municipal andcentral state
ІV- Share of tourism in the economic structure of thecommunity (% of total revenues of the municipality)
... - Statistics should beprovided
5. Number ofcertificates issued
ІV- Number and types of certificates for tourist operation issuedby the municipality 17
Base for comparison Statistics should beprovided
І- The manager of the establishment is: a local person local resident employed
89 %11 %
Index – 0.9
ІV- How many of those employed in the establishment are localresidents?
100%
ІV- What is the % of local people employed in tourism? 0.8 % Index 0.3 / employed inenterprises as per allthose employed
IV – What is the level of unemployment /% of activepopulation/?
5 % Base for comparison
ІV- Number of people receiving social assistance 350 Base for comparisonІV- Number of people that have moved from the settlement 100 Base for comparison
6. External workforce/localunemployment
ІV- Number of people that have settled in 20 Base for comparison
Decrease – it isrecommended ratios,percentage andnumber of localresidents employedin tourism to bebigger than that oneof external laborforce

Bulgaria Biodiversity Conservation &Economic Growth Project
Baseline data on Ecotourism Impact - Kalofer 35
І- Where do you purchase materials, resources and equipmentfor your establishment? From the settlement or the municipality region From outside sources
95 %5 %
7. Economic costsfor businessdevelopment
І- What are your expenditures (in %)? Local taxes and charges New equipment Rehabilitation works Resources and materials Advertising
5533222015
Base for comparison Improvement – asper business plans
І- Has the establishment got a business plan? 0 Base for comparison Sharp improvementІ- Have you used a bank or some other type of loan? What typeof loan, how many times and at what time terms?
- Base for comparison Improvement – asper business plans
І- How are new investments allocated? (%) New furnishing New equipment Rehabilitation Marketing and advertising New jobs
15301563
Base for comparison Improvement – asper business plan
ІV- What are the expenditures of the municipality for improvingand maintaining the overall infrastructure?
42% 50% Growth ascompared to 1999
Improvement
ІV- What are the expenditures of the municipality for tourism? 8300BGL
60% Growth ascompared to 1999
Improvement
Key to Indicator Values: Improvement; Decrease; Sustain; Increase; Dots –absence of statistical dataІ Questionnaire for managers of tourist establishmentsІІ Questionnaire for visitorsІІІ Questionnaire for local communityІV Questionnaire for local authorit

Bulgaria Biodiversity Conservation &Economic Growth Project
Baseline data on Ecotourism Impact Kalofer36
2.5. Social effects of tourism
The indicators used for monitoring social effects have been chosen to evaluate the positiveimpacts of tourism on the social life of the local community and the indirect effects.
The main groups of indicators (Table 5) are:1) Number of facilities for local use in relation to population and number of visitors2) Loading of facilities providing services for local population3) Noise pollution and pollution from solid wastes4) Traffic5) Irritability index6) Development of the municipality (population, country houses, new houses)7) Change in ownership of the land8) Change in family structure
2.5.1. Number of facilities for local use in relation to population and number of visitors -this group of indicators shows whether tourism development leads to improvements in theoverall and specialized recreational infrastructure, or brings discomfort to both the localpopulation and tourists.
Key questions are:- Number of commercial and social infrastructure enterprises providing services to the
local population- Number of enterprises in the area of sport, recreation and amusements meant to be
used by both local community and tourists
There was a 48% growth in commercial and social infrastructure enterprises in 2001, ascompared with 1999. There are no available statistics for recreation and sports enterprises.
2.5.2. Loading of facilities providing services for local population - this indicator is closelyconnected with the previous one. In general, in destinations where development of small-scale eco-tourism is anticipated the level of loading should not exceed even its mediumvalues.
The degree of loading on enterprises providing services is low.
2.5.3. Noise pollution and pollution from solid wastes - this indicator is viewed inecological terms. Its values should be within the minimal limits for communities with typesof tourist development other than the traditional large-scale tourism.
There are two key questions:- Level of noise pollution coming from vehicles or production processes- Quality of solid wastes, in thousand cubic meters or tons
There is a low level of noise pollution, but solid waste volumes are increasing.
2.5.4. Traffic – this indicator is monitored by following the intensity of traffic in- and off-season.
The key question is:What is the level of traffic intensity along the roads (high, medium, low)
There is a high level of traffic intensity throughout the year in the Kalofer region.

Bulgaria Biodiversity Conservation &Economic Growth Project
Baseline data on Ecotourism Impact Kalofer 37
2.5.5. Irritability index This is a complex indicator reflecting the impact of a number offactors related to tourism development in a given community. Usually the expansion oftourism brings about negative attitudes or negative behavior on the part of the localcommunity. This indicator implies projections of all social indicators mentioned so far. It isvery important to monitor current opinions, views and attitude of local communities towardstourists since successful tourism development is impossible without their support.
Key issues related to this group are:- Tourism creates problems in providing services for local population (% of those
responding)- Tourism deteriorates places where it develops.- Tourism improves quality of life in the settlement
No irritability has been measured in the local community.
2.5.6. Community development (population, country houses, new houses) – Practice showthat tourism development overall is based on developing communities. If there is nodevelopment of the community or its infrastructure, both general and specialized, thentourism development would be rather limited. This is especially valid for eco-touristdestinations, since tourist consumption itself is closely related with a stay at, and contactwith local people and the use of common facilities.
Key questions –.- Number of local population- Number of second lodgings- New houses constructed- Do you have a country house/cottage in the surroundings?- How do you personally perceive yourself - poor, of average income or well to do?
On the whole, there is a positive trend in local community development. New houses andcountry houses are being constructed, and most local people declare that they have anaverage living standard. The level of emigration is negligible.
2.5.7. Change in the ownership of the land – the research shows that 15% of the land in thisregion is owned by the local population. Since there is no statistical data available forprevious years, this percent can be used for comparative purposes in the future.
2.5.8. Change in family structure - this indicator is important for analyzing conditions foreco-tourism development, since this is a form of tourism founded essentially by familybusinesses. The indicator also shows the capacity of the available work force.
Key questions:- How many are there in your family?- Average number of people in one household?- Have you any kids below 15 year of age?
The results are similar to the average for the country

Bulgaria Biodiversity Conservation &Economic Growth Project
Baseline data on Ecotourism Impact - Kalofer38
Table 5 Social Effects of Eco-tourism in Kalofer
Indicators Questions from the questionnaireValue oftheindicator
Value of theindex /Growth in%/ Base forcomparison
Recommendedindicator value
SocialІV- Number of enterprises providing services for localpopulation (commercial and public)
391. Number of facilities forlocal use in relation tonumber of local populationand number of visitors
ІV- Number of enterprises in the area of sport, recreationand amusement used both by local community andtourists
21
Growth 48 % Improvement-as per regionalplan
2. Loading of facilitiesserving local population
ІV- Level of loading of enterprises providing services(high, medium, low)
Low Base forcomparison
Decrease
III - Tourism leads to problems in providing services forlocal community Yes No I can’t say
ІV- Quantity of solid wastes in the municipality (tons)
4 %71 %25 %
2300
Index – 2.3 /positive tonegativeresponses
Base forcomparison
Increase –value biggerthan 1
Decrease
3. Noise and solid wastespollution
ІV- Level of noise pollution (high, medium, low) Low Base forcomparison
Decrease
4. Traffic flow ІV- Intensity of traffic along the roads (high, medium,low)
High Decrease Decrease
5. Irritability index
ІІІ- Tourism causes problems in providing services tolocal populationYesNoI can’t say
4 %71 %25 %
Index– 2.3/positive tonegative answers/
Increase –valuehigher than 1

Bulgaria Biodiversity Conservation &Economic Growth Project
Baseline data on Ecotourism Impact - Kalofer 39
ІІІ- Tourism deteriorates the places where it developsYesNoI can’t say
3.7 %79,3 %17 %
Index – 3.8/positive tonegative answers/
Increase –valuehigher than 1
ІІІ-Tourism improves the quality of life in the settlement? Yes No I can’t say
82 % 7 %11 %
Index – 4.5/positive tnegative answers/
Increase –valuehigher than 1
ІV- Number of local population 3782 Base forcomparison
ІV- Number of second homes 160 Base forcomparison
ІV- New houses constructed 3 Base forcomparison
As per regionalplan
ІІІ-When was the house you live in built? (number)1990 – 19981980 – 19891960 – 19791950 – 1959
651913
Base forcomparison
As per regionalplan
ІІІ- Number of country houses/cottages in thesurroundings?Belonging to local populationBelonging to other people
160 60
Base forcomparison
As per regionalplan
6. Development ofdestination (population,country houses, newhouses)
ІІІ- How do you perceive yourself - poor, of averageincome or well to do? Poor With average income I cannot say
19%62%19%
Base forcomparison
Improvement –as per localstrategy
7. Change in ownership ofland
ІV- % of land ownership of local residents 14.84 % Base forcomparison
As per regionalplan

Bulgaria Biodiversity Conservation &Economic Growth Project
Baseline data on Ecotourism Impact - Kalofer40
ІІІ- How many members are there in your family? 4 persons 3 persons 2 persons Other
31 %19 %26 %14 %
Base forcomparison
As per regionalplan
ІІІ- Have you any kids below 15 year of age? Yes No
18 %82 %
Base forcomparison
As per regionalplan
8. Change in familystructure
ІV- Average number of people in one household 2,7 Base forcomparison
As per regionalplan
Key to Indicator Values: Improvement; Decrease; Sustain; Increase; Dots –absence of statistical dataІ Questionnaire for managers of tourist establishments
ІІ Questionnaire for visitorsІІІ Questionnaire for local communityІV Questionnaire for local authorities

Bulgaria Biodiversity Conservation &Economic Growth Project
Baseline data on Ecotourism Impact Kalofer 41
2.6 Cultural effects of tourism
Cultural effects appear to be among the most important to tourism related to the culturalheritage of the community. Similar to other effects, they are viewed as positive or negativeand may appear simultaneously.
The main groups of indicators (Table 6) are:1). Ratio of tourists (domestic, regional, international) to local population2) Number of cultural festivals3) Change in local values, dress and customs4) Compliance of infrastructure design with local culture5) Degree of use of local knowledge and skills in tourism
2.6.1. Ratio of tourists (domestic, regional, international) to local population - this groupof indicators shows the possible effects of tourists upon the local community depending ontheir nationality and related models of behavior, as well as features of life style and culturethat could be used for developing tourism.
Key questions:- Number of tourists in the community- Number of local population- Permanent residence of tourists (country, town)- Number of visitors in your establishment
This ratio cannot be established due to absence of statistical data and monitoring.
2.6.2. Numbers of cultural festivals - this index is indicative of the degree of inclusion oflocal cultural traditions and customs in tourist supply.
Key question- Number of festivals and public events (parades, festivities, and other celebrations)
Nine cultural events took place last year. There is no statistics for previous years.
2.6.3. Change in local values, dress and customs – the indicator shows whether touristschange local culture in positive or negative ways.
Key question:- Do you think that tourism tends to bring changes in local values, dress and customs?
At this time there is no threat of changes.
2.6.4. Compliance of infrastructure design with local culture - this indicator shows thedegree to which tourism development complies with the characteristic features of culturalheritage, which is an essential product in this destination.
Key questions:- Degree of compliance of architectural design of tourist infrastructure and existing
facilities with local culture (high, medium, low)- Do you think tourism preserves/meets local architectural environment?
There is a medium level of consistency of tourist infrastructure with local infrastructure.

Bulgaria Biodiversity Conservation &Economic Growth Project
Baseline data on Ecotourism Impact Kalofer42
2.6.5. Degree of use of local knowledge and skills in tourism – this indicator reveals thedegree to which cultural heritage is included and what aspects of this heritage are madeavailable.
Key questions:- Are local life style and culture, skills and knowledge included in offering services
and goods for tourists?- What other services does the establishment offer?- Which of them are related to local folklore, culture, traditions and customs?
A range of crafts is included in local eco-tourism supply in the Kalofer region.
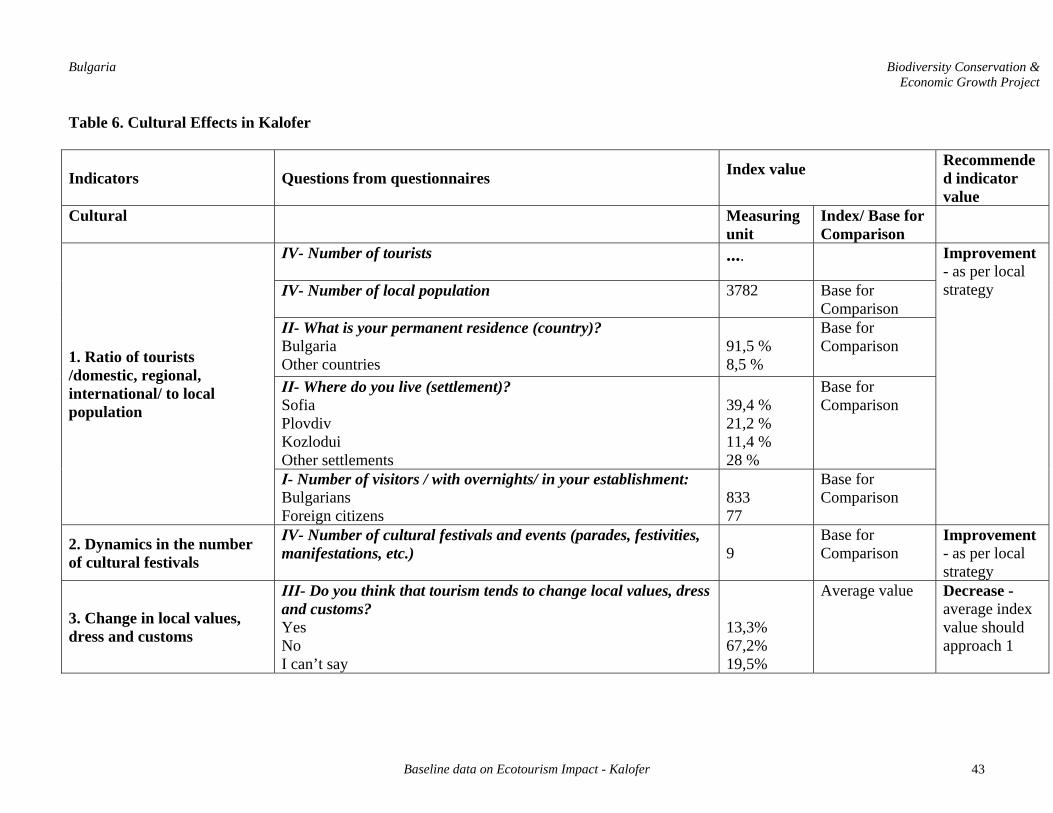
Bulgaria Biodiversity Conservation &Economic Growth Project
Baseline data on Ecotourism Impact - Kalofer 43
Table 6. Cultural Effects in Kalofer
Indicators Questions from questionnaires Index value Recommended indicatorvalue
Cultural Measuringunit
Index/ Base forComparison
ІV- Number of tourists ....
ІV- Number of local population 3782 Base forComparison
ІІ- What is your permanent residence (country)?BulgariaOther countries
91,5 %8,5 %
Base forComparison
ІІ- Where do you live (settlement)?SofiaPlovdivKozloduiOther settlements
39,4 %21,2 %11,4 %28 %
Base forComparison
1. Ratio of tourists/domestic, regional,international/ to localpopulation
І- Number of visitors / with overnights/ in your establishment:BulgariansForeign citizens
83377
Base forComparison
Improvement- as per localstrategy
2. Dynamics in the numberof cultural festivals
ІV- Number of cultural festivals and events (parades, festivities,manifestations, etc.) 9
Base forComparison
Improvement- as per localstrategy
3. Change in local values,dress and customs
ІІІ- Do you think that tourism tends to change local values, dressand customs?YesNoI can’t say
13,3%67,2%19,5%
Average value Decrease -average indexvalue shouldapproach 1

Bulgaria Biodiversity Conservation &Economic Growth Project
Baseline data on Ecotourism Impact - Kalofer44
ІV- Level of compliance of the architectural design of touristinfrastructure and existing facilities with local culture ( high,medium, low)
low Base forComparison
Improvement– as perregulations
4. Compliance ofinfrastructure design withlocal culture
ІІI- Do you think that tourism preserves and corresponds to localarchitectural environment and life style of community? Yes No I can’t say
76%11%13%
Index – 0.7 /positive as perthe rest ofresponses/
Increase –average indexvalue shouldapproach 1
ІІІ- What services and goods of local life style and culture, skillsand knowledge are offered to tourists?
Index –Ratio of guests’responses tothose of theestablishments
Wood-carving 62% Index – 0.7
Folklore interior 52% Index – 2.4
Carpentry 50% Index – 0.6
Culinary art 48% Index – 0.5
Weaving 40% Index – 1.6
Improvement– index valuehigher than 1
Improvement-as per localstrategyAnd businessPlans
5. Degree of utilization oflocal knowledge and skills intourism
І- What extra services does the establishment offer? Which ofthem are related to local folklore, culture, traditions andcustoms? Woodcarving Culinary art Carpentry Weaving Folklore interior
83%75%75%50%21%
Increase - asper localstrategyAnd businessPlans

Bulgaria Biodiversity Conservation &Economic Growth Project
Baseline data on Ecotourism Impact - Kalofer 45
Key to Indicator Values: Improvement; Decrease; Sustain; Increase; Dots –absence of statistical dataІ Questionnaire for managers of tourist establishmentsІІ Questionnaire for visitorsІІІ Questionnaire for local communityІV Questionnaire for local authorities


Bulgaria Biodiversity Conservation &Economic Growth Project
Baseline data on Ecotourism Impact Kalofer 47
3.0 Conclusions and Recommendations
This research project achieved its main goals of applying the Guide for Monitoring Eco-tourism Impacts to the Kalofer pilot region, and collecting data for a database that can beused for comparing future changes in eco-tourism development in the region.
3.1 Methodological conclusions
The main methodological conclusion is the need to reduce the number of indicators and thenumber of indices in particular. This reduction should be made on the basis of the specificstatus and business objectives of each establishment. The evaluation categories in thequestionnaires should be decreased and the same number of evaluation scales should be usedin all of the questionnaires. This will facilitate the statistical analysis of the data collected.Specific and more detailed questions could be used when trying to identify problems andareas of special concern.
3.2. Conclusions related to indicators
І. Tourism sector
Eight groups of indicators were used in this research:1) Number of those employed in tourism2) Type of employment3) Salaries/wages4) NGO-s involved in tourism5) Contribution on the part of government (constructions, donations, etc.)6) Improvements that are needed – facilities and services7) Availability of local training in tourism8) Allocation of responsibilities among the private sector, the state and the public
sector, including NGO-s
All eight groups should be monitored on an annual basis. Measuring these indicators showsthe state of various components and elements of the tourism sector and allows for acomparison with normative or standardized and target values. Indicators 4,6,7 and 8 shouldbe supported with data from local authorities and NGOs, while the rest should be monitoredat each establishment as appropriate.
ІІ. VisitorsMonitoring visitors is a very important aspect of an overall monitoring program and theseindicators should be assessed consistently.
The main groups of indicators are1) Income, demographic characteristics and other data for tourism market2) Needs, preferences and interests3) Models of visits4) Satisfaction with services and facilities5) Access to services6) Parking places.7) Image of destination
Bulgaria Biodiversity Conservation &Economic Growth Project
Baseline data on Ecotourism Impact Kalofer48
Indicator groups 5 and 6 should be observed every three or four years, since changes tend tooccur every few years. These groups of indicators should be monitored by local authorities,which should also provide statistical information for the analysis. In addition number 6should be monitored at tourist establishments, since it is here that relevant measures forimproving this indicator can be taken. Indicator 1 requires registration of new customersevery time they come. If customers who come a second or more times are to be considered,monitoring of this indicator may be conducted every 2 or 3 years. Indicator 4 is subject toconstant monitoring, regardless of whether customers are old or new. It is advisable that allquestions from Table 2 be utilized and included in a separate questionnaire form to be filledin at the end of the stay.As noted, monitoring of visitors is an element of great significance to the system ofmonitoring that is why they have to be observed non-stop.
ІІІ. Tourist destination
The groups of indicators are:1) Number of visitors per sq. km.2) Number of visitors to local population3) Tourist expenditure4) Accommodation costs
Indicator groups 1, 2 and 4 should be monitored by local authorities on an annual basis witha view of recording damages to tourist resources, such as loading and degradation, as well asto obtain a full picture of visits both to the region and to the entrepreneurs’ sector. Indicatorgroup 3 illustrates the effectiveness of functioning tourist attractions. It should be monitoredat/by the establishments, constantly and in every season.
ІV. Economic effects
There are seven groups of economic indicators:1) Jobs2) Number of enterprises that are tourism-oriented3) Local entrepreneurship4) Income/revenues from tourism5) Number of certificates issued6) External labor force as compared to local unemployment7) Economic costs of tourism
Local authorities should observe all the indicator groups on an annual basis. The Eco-tourism Association Central Balkan-Kalofer should be asked to cooperate and activelyparticipate in the monitoring process. These indicators focus on the particular eco-tourismlocations and its influence on the overall economy of the municipality
V. Social effects
There are eight indicator groups:1) Number of facilities meant for local use in relation to population and number of
visitors2) Loading of facilities providing services for the local population3) Noise and solid waste pollution4) Traffic flow5) Index of irritability

Bulgaria Biodiversity Conservation &Economic Growth Project
Baseline data on Ecotourism Impact Kalofer 49
6) Development of the municipality (population, country houses, new houses)7) Change in land ownership8) Change in family structure
Local authorities should observe these indicator groups annually. Certain statistics for anumber of indicators are lacking. The non-governmental sector should initiate monitoring ofthese indicators to begin to establish a database. These indicators primarily measure loadingon different environmental components, and serve as a basis for managing actions andmeasuring their results. The tourism sector should become acquainted with them and adjustthe size of tourist groups in such a way so as to avoid degradation of natural complexes.
VІ. Cultural effects
The main groups of indicators used in this research for identifying these effects are:1) Ratio between tourists (domestic, regional, international) and local population2) Number of cultural festivals3) Change in local values, dress, and customs4) Compliance of infrastructure design with local culture5) Degree of utilization of local knowledge and skills in tourism
Local authorities should collect data annually on indicator groups 1 through 4, since theycover the overall impact of tourism on culture and cultural heritage of the community. Thecurrent lack of statistics doesn’t allow for the clear identification of impacts from tourism.Indicator group 5 should be seasonally monitored by tourist establishments themselves andthe results used to compare with tourist expectations for supply of goods and services relatedto local cultural heritage.