Opened to traffic: July 1, 1940 Collapsed: November 7, 1940 Lewis Cluck - lxc130030 Advanced...
20
Tacoma Narrows Bridge Opened to traffic: July 1, 1940 Collapsed: November 7, 1940 Lewis Cluck - lxc130030 Advanced Requirements Engineering – SE 6361.Z01 Oct. 26, 2012
-
Upload
austen-french -
Category
Documents
-
view
214 -
download
1
Transcript of Opened to traffic: July 1, 1940 Collapsed: November 7, 1940 Lewis Cluck - lxc130030 Advanced...
Tacoma Narrows Bridge
Opened to traffic: July 1, 1940Collapsed: November 7, 1940
Lewis Cluck - lxc130030Advanced Requirements Engineering – SE 6361.Z01Oct. 26, 2012

Design of Collapsed Bridge
Modified Tacoma Narrows design used 8-foot deep girders and increased span to width ratio allowing for a slimmer and more elegant look. Also cheaper: $7 million

Problems Noticed
The structure experienced considerable vertical oscillations while it was still under construction, several strategies were used, in vain, to reduce the motion of the bridge. They included:[2]
attachment of tie-down cables to the plate girders, which were anchored to 50-ton concrete blocks on the shore. This measure proved ineffective, as the cables snapped shortly after installation.
addition of a pair of inclined cable stays that connected the main cables to the bridge deck at mid-span. These remained in place until the collapse, but were also ineffective at reducing the oscillations.
finally, the structure was equipped with hydraulic buffers installed between the towers and the floor system of the deck to damp longitudinal motion of the main span. The effectiveness of the hydraulic dampers was nullified, however, because the seals of the units were damaged when the bridge was sand-blasted before being painted.

Investigating the Issue
Professor Frederick Burt Farquharson from the at the University of Washington hired to perform wind-tunnel tests and recommend solutions in order to reduce the oscillations of the bridge.
1:200 scale model of bridge1:20 scale model of deck section

Aeroelastic Flutter
Fluttering is a physical phenomenon in which several degrees of freedom of a structure become coupled in an unstable oscillation driven by the wind.
This movement inserts energy to the bridge during each cycle so that it neutralizes the natural damping of the structure; the composed system (bridge-fluid) therefore behaves as if it had an effective negative damping (or positive feedback), leading to an exponentially growing response.
The wind speed that causes the beginning of the fluttering phenomenon (when the effective damping becomes zero) is known as the flutter velocity. Fluttering occurs even in low-velocity winds with steady flow. Hence, bridge design must ensure that flutter velocity will be higher than the maximum mean wind speed present at the site.

Suggested Fixes
Five days before the collapse, the test studies are concluded.

Aeroelastic Flutter (cont)
In other words, the oscillations increase in amplitude with each cycle because the wind pumps in more energy than the flexing of the structure can dissipate, and finally drives the bridge toward failure due to excessive deflection and stress.

Torsional Motion

Changes to Bridge Design
Dampening Mechanisms
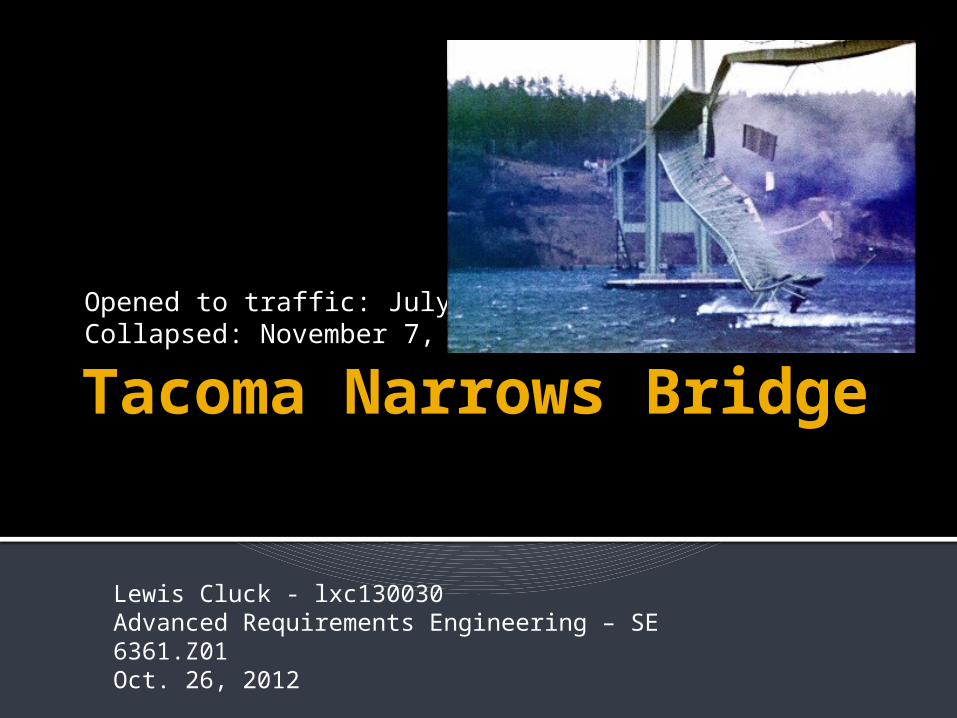
Changes to Bridge Design
Stiffening Trusses with lateral bracing
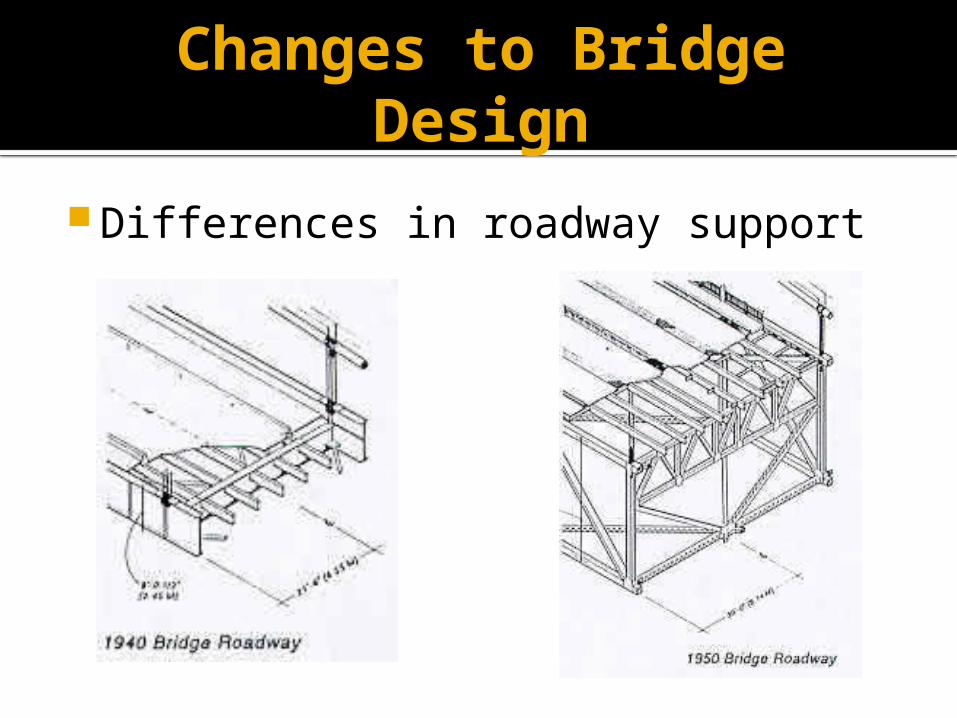
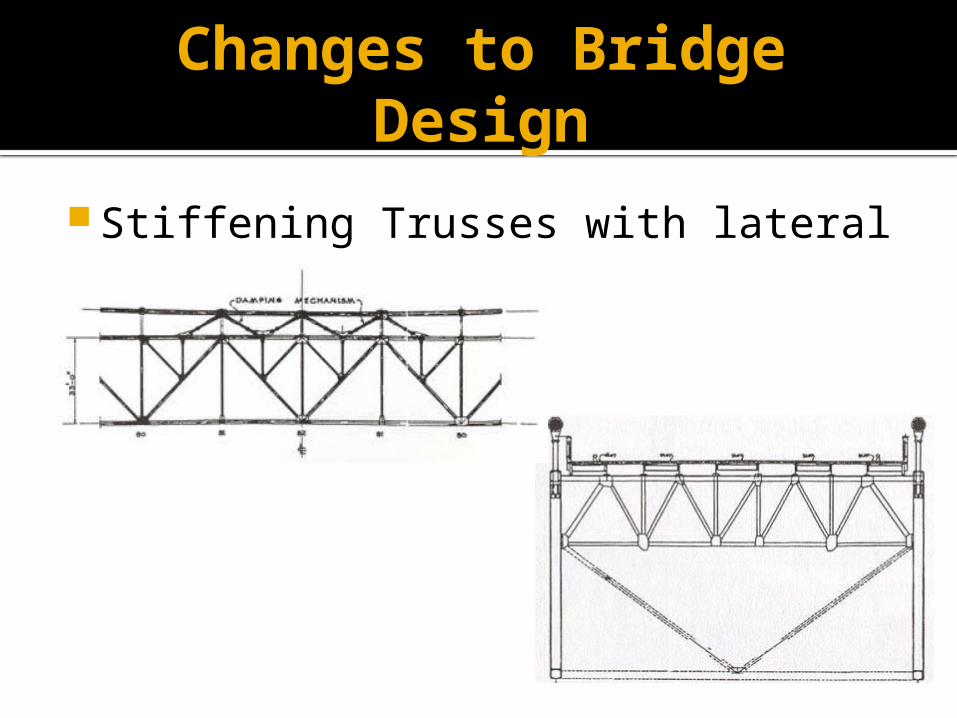
Changes to Bridge Design
Differences in roadway support

Changes to Bridge Design
Wind grates function as vents to alleviate oscillations caused by wind

Changes in Bridge Design
Tower height increased to reduce cable sag ratio for 1:10 to 1:12
Old tower: 425 ft
New tower: 467 ft

Wind Tunnel Testing
In designing this structure, bridge engineers first used wind tunnel tests to determine the behavior and stability of a physical model of a proposed bridge.
The research and design provided significant information to suspension bridge engineers nationwide and had an important effect on all suspension bridge designs that followed.

Changes in Design Practice
The United States government requires that all bridges built with federal funds must first have their preliminary design subjected to wind tunnel analysis using a 3-dimensional model.

Span Ratio Comparison
Bridge Width to Length (of Center Span)
Girder Depth to Length (of Center Span)
1940 Narrows Bridge 1:72 1:350
Current Narrows Bridge 1:46 1:112
Golden Gate Bridge 1:47 1:168
George Washington Bridge 1:33 1:120
Bronx-Whitestone Bridge 1:31 1:209

Tacoma Narrows Bridges Today

Current Tacoma Narrows Bridges

2007 Construction

References
1. ^ Washington State Department of Transportation (2005). “1940 Narrows Bridge – The Machine". Retrieved 2012-11-20.
2. Rita Robison. "Tacoma Narrows Bridge Collapse." In When Technology Fails, edited by Neil Schlager, pp. 18–190. Detroit: Gale Research, 1994.