OPEC · Oil Market Highlights OPEC Monthly Oil Market Report – May 2018 i Oil Market Highlights...
104
Monthly Oil Market Report OPEC 14 May 2018 Feature article: Non-OPEC oil supply development Oil market highlights Feature article Crude oil price movements Commodity markets World economy World oil demand World oil supply Product markets and refinery operations Tanker market Oil trade Stock movements Balance of supply and demand i iii 1 8 11 31 42 58 65 69 75 82
Transcript of OPEC · Oil Market Highlights OPEC Monthly Oil Market Report – May 2018 i Oil Market Highlights...
Monthly Oil Market ReportO P E C
14 May 2018
Feature article:Non-OPEC oil supply development
Oil market highlights
Feature article
Crude oil price movements
Commodity markets
World economy
World oil demand
World oil supply
Product markets and refinery operations
Tanker market
Oil trade
Stock movements
Balance of supply and demand
i
iii
1
8
11
31
42
58
65
69
75
82

Organization of the Petroleum Exporting Countries
Helferstorferstrasse 17, A-1010 Vienna, AustriaE-mail: prid(at)opec.orgWebsite: www.opec.org
Oil Market Highlights
OPEC Monthly Oil Market Report – May 2018 i
Oil Market Highlights Crude Oil Price Movements In April, the OPEC Reference Basket (ORB) rose by $4.67, or 7.3%, month-on-month (m-o-m), to average $68.43/b, with Dated Brent and Dubai rising by nearly 9% each, while spot WTI increased by 6%. Year-to-date (y-t-d), the ORB value was $13.85, or 26.7%, higher at $65.67/b, compared with the same period a year earlier. Geopolitical concerns, tightening product inventories and robust demand provided support for prices. With regard to crude oil futures, in April, ICE Brent was up $5.04, or 7.6%, at $71.76/b, while NYMEX WTI gained $3.55, or 5.7%, to stand at $66.33/b. Y-t-d, ICE Brent is $13.96, or 25.7%, higher at $68.36/b, while NYMEX WTI has risen by $12.15, or 23.5%, to $63.77/b, compared with the same period a year earlier. The ICE Brent/NYMEX WTI spread widened significantly to $5.44/b in April – the widest this year – on bearish US fundamentals. Despite the surge in crude oil futures prices, speculative net long positions ended lower, however, long-to-short ratios in ICE Brent increased further to record highs. Both Brent and Dubai market structures moved deeper into backwardation on strong prompt month prices and healthy physical crude markets, while NYMEX WTI remained at the same level, in backwardation. The sweet/sour differentials widened further in Europe and Asia, while in the US Gulf Coast (USGC), the spread narrowed more.
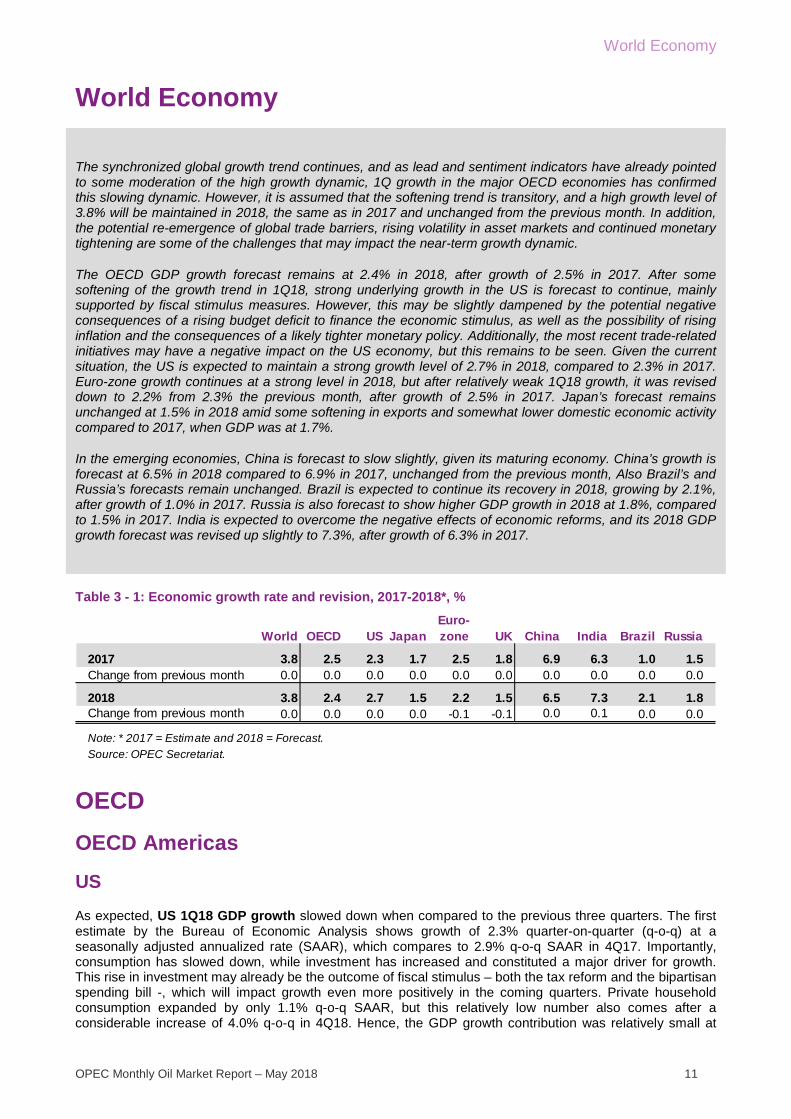
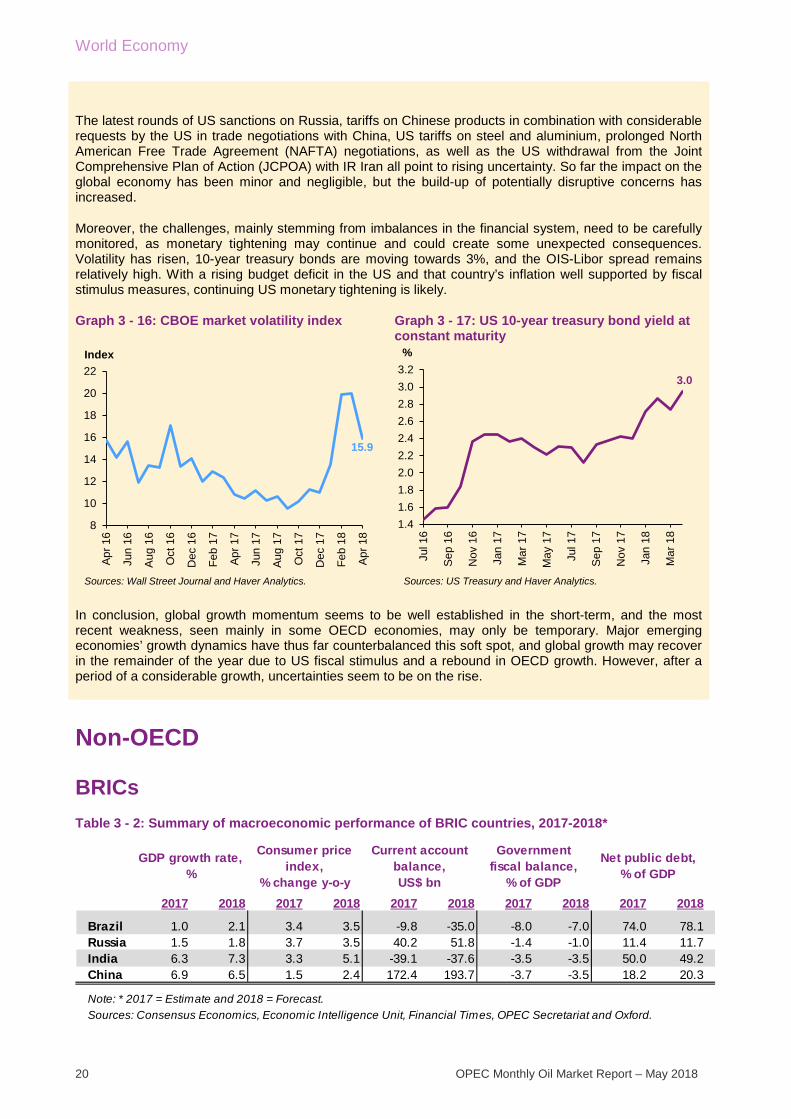
World Economy The global GDP growth forecast remains at 3.8% for 2018, following growth of 3.8% in 2017. Expected US growth in 2018 is unchanged from the previous month at 2.7%, after growth of 2.3% in 2017. Growth in the Euro-zone was revised down to 2.2% in 2018, following growth of 2.5% in 2017. Japan’s 2018 growth forecast remains at 1.5%, after growth of 1.7% in 2017. For 2018, Developing Countries’ GPD growth is seen unchanged at 4.4%, following growth of 4.0% a year earlier. While India’s 2018 forecast was revised up slightly to 7.3%, following 2017 GDP growth of 6.3%, China’s 2018 GDP growth forecast remains unchanged at 6.5%, after 2017 growth of 6.9%. Brazil and Russia also saw an unchanged GDP growth forecast at 2.1% and 1.8% in 2018, respectively, following growth of 1% and 1.5% in 2017.
World Oil Demand World oil demand growth for 2017 was kept unchanged from last month’s assessment, despite some adjustments to both OECD and non-OECD regions, which offset each other. World oil demand is estimated to have grown by 1.65 mb/d in 2017 to average 97.20 mb/d. For 2018, oil demand growth is forecast to increase by around 1.65 mb/d to average 98.85 mb/d. Growth was revised higher by 25 tb/d compared with last month’s assessment. This is mainly to account for firm OECD data in 1Q18. Oil demand growth in the non-OECD region was also revised upward, primarily on the back of better-than-expected data from Other Asia, including India, and Latin America. China is anticipated to lead oil demand growth in 2018, followed by Other Asia and OECD Americas.
World Oil Supply Non-OPEC supply for 2017 was revised down slightly by 0.01 mb/d to now show growth of 0.87 mb/d y-o-y and average 57.89 mb/d. The revision came on the back of a review of historical non-conventional production data leading to downward adjustments, mostly for Brazil, as well as upward revisions, notably for OECD Europe. Furthermore, in 2018, upward revisions in 1Q18 to the forecasts of the US, Argentina, Colombia and China were partially offset by downward adjustments to Canada, Mexico, Norway, UK, and Brazil. This has led to an upward revision to 2018 non-OPEC supply of 0.01 mb/d. It is now estimated to grow by 1.72 mb/d y-o-y to average 59.62 mb/d, compared to last month’s assessment. Following a downward revision in 2017, OPEC NGLs and non-conventional liquids production in 2018 are forecast to grow by 0.18 mb/d y-o-y, to average 6.49 mb/d. OPEC crude oil production in April 2018 increased by 12 tb/d, to average 31.93 mb/d, according to secondary sources.
Oil Market Highlights
ii OPEC Monthly Oil Market Report – May 2018
Product Markets and Refining Operations Product markets in the Atlantic Basin saw strong gains in April. In the US, refining margins strengthened across the top and middle of the barrel. Reduced refinery product output caused by planned and unplanned refinery outages, along with record-breaking gasoline export levels and strong diesel inventory drawdowns drove US margins to a record three-year high in April. In Europe, product markets saw a recovery, supported by the gasoline and diesel complexes, despite losses in all other products. Meanwhile, product markets in Asia weakened due to pressure seen at the top of the barrel, attributed to high supply in the regional gasoline market. Higher Oman crude prices in April, despite the onset of spring refinery maintenance season, further exacerbated the downturn seen in the Asian market.
Tanker Market Dirty tanker spot freight rates mostly declined in April or remained at previously low levels. VLCC average spot freight rates stayed almost flat compared with the previous month, while Suezmax and Aframax rates dropped by 6% and 3% m-o-m, respectively. The decline in rates was attributed to limited inquiries, continuing tonnage oversupply, as well as reduced port and transit delays. Similarly, the clean tanker market saw lower monthly freight rates on most reported routes due to the same circumstances.
Stock Movements Preliminary data for March 2018 shows that total OECD commercial oil stocks fell by 12.7 mb to stand at 2,829 mb, which is 9 mb above the latest five-year average. However, this current level of OECD stocks still remains 258 mb above January 2014. Within the components, crude stocks in March 2018 indicated a surplus of 12 mb, while product stocks witnessed a deficit of 3 mb against the latest five-year average. In terms of days of forward cover, OECD commercial stocks fell in March to stand at 59.9 days, which is 1.6 days lower than the latest five-year average.
Balance of Supply and Demand In 2017, demand for OPEC crude is estimated to stand at 33.0 mb/d, 0.6 mb/d higher than a year earlier. In 2018, demand for OPEC crude is forecast at 32.7 mb/d, 0.3 mb/d lower than the 2017 level.
Feature Article
OPEC Monthly Oil Market Report – May 2018 iii
Feature Article Non-OPEC oil supply development
Non-OPEC oil supply has seen a recovery in 2017 and 2018, following a contraction in 2016. This has been on the back of improving oil market conditions and rising oil prices, but it is evident that uncertainties remain as to the forecast pace of growth of non-OPEC supply for the remainder of the year.
Non-OPEC oil supply grew by 0.87 mb/d in 2017, given higher crude oil prices with NYMEX WTI rising by $7.38, or 17%, y-o-y, to average $50.85/b. However, it is important to note that non-OPEC capital expenditure (CAPEX), including exploration, increased by only 2% y-o-y. Moreover, it has seen a decline of around 42% compared to the 2014 level.
The outlier in this investment story is the US tight oil industry, which saw investment rise by more than 42% y-o-y in 2017, at about $138 billion, with 2H17 seeing greater expansion as crude oil prices continued to gain. Easy access to capital, cheap money and production hedging contributed to this trend. This helped US crude oil production surpass 10 mb/d in November 2017. In addition, US tight oil supply has benefitted from lower unit prices and more efficient operations. The estimated ultimate recovery rose on average by 20% for key tight oil plays from 3Q16 to 3Q17 and the average well cost per lateral length fell by a substantial 35% between 2014 and 2017. This has contributed to a drop in the average WTI breakeven price for US tight oil by as much as 40%.
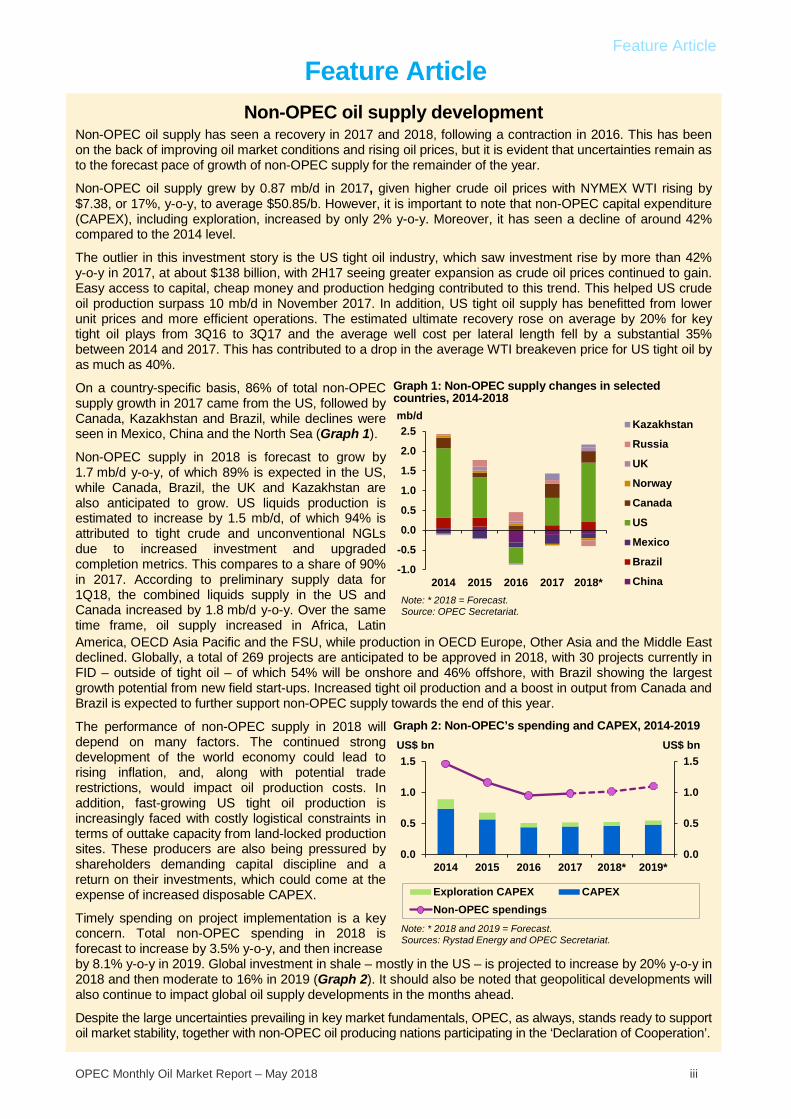
On a country-specific basis, 86% of total non-OPEC supply growth in 2017 came from the US, followed by Canada, Kazakhstan and Brazil, while declines were seen in Mexico, China and the North Sea (Graph 1).
Non-OPEC supply in 2018 is forecast to grow by 1.7 mb/d y-o-y, of which 89% is expected in the US, while Canada, Brazil, the UK and Kazakhstan are also anticipated to grow. US liquids production is estimated to increase by 1.5 mb/d, of which 94% is attributed to tight crude and unconventional NGLs due to increased investment and upgraded completion metrics. This compares to a share of 90% in 2017. According to preliminary supply data for 1Q18, the combined liquids supply in the US and Canada increased by 1.8 mb/d y-o-y. Over the same time frame, oil supply increased in Africa, Latin
Graph 1: Non-OPEC supply changes in selected countries, 2014-2018
America, OECD Asia Pacific and the FSU, while production in OECD Europe, Other Asia and the Middle East declined. Globally, a total of 269 projects are anticipated to be approved in 2018, with 30 projects currently in FID – outside of tight oil – of which 54% will be onshore and 46% offshore, with Brazil showing the largest growth potential from new field start-ups. Increased tight oil production and a boost in output from Canada and Brazil is expected to further support non-OPEC supply towards the end of this year.
The performance of non-OPEC supply in 2018 will depend on many factors. The continued strong development of the world economy could lead to rising inflation, and, along with potential trade restrictions, would impact oil production costs. In addition, fast-growing US tight oil production is increasingly faced with costly logistical constraints in terms of outtake capacity from land-locked production sites. These producers are also being pressured by shareholders demanding capital discipline and a return on their investments, which could come at the expense of increased disposable CAPEX.
Timely spending on project implementation is a key concern. Total non-OPEC spending in 2018 is forecast to increase by 3.5% y-o-y, and then increase
Graph 2: Non-OPEC’s spending and CAPEX, 2014-2019
by 8.1% y-o-y in 2019. Global investment in shale – mostly in the US – is projected to increase by 20% y-o-y in 2018 and then moderate to 16% in 2019 (Graph 2). It should also be noted that geopolitical developments will also continue to impact global oil supply developments in the months ahead.
Despite the large uncertainties prevailing in key market fundamentals, OPEC, as always, stands ready to support oil market stability, together with non-OPEC oil producing nations participating in the ‘Declaration of Cooperation’.
-1.0
-0.5
0.0
0.5
1.0
1.5
2.0
2.5
2014 2015 2016 2017 2018*
mb/dKazakhstan
Russia
UK
Norway
Canada
US
Mexico
Brazil
ChinaNote: * 2018 = Forecast.Source: OPEC Secretariat.
0.0
0.5
1.0
1.5
0.0
0.5
1.0
1.5
2014 2015 2016 2017 2018* 2019*
US$ bnUS$ bn
Exploration CAPEX CAPEXNon-OPEC spendings
Note: * 2018 and 2019 = Forecast.Sources: Rystad Energy and OPEC Secretariat.

Feature Article
iv OPEC Monthly Oil Market Report – May 2018
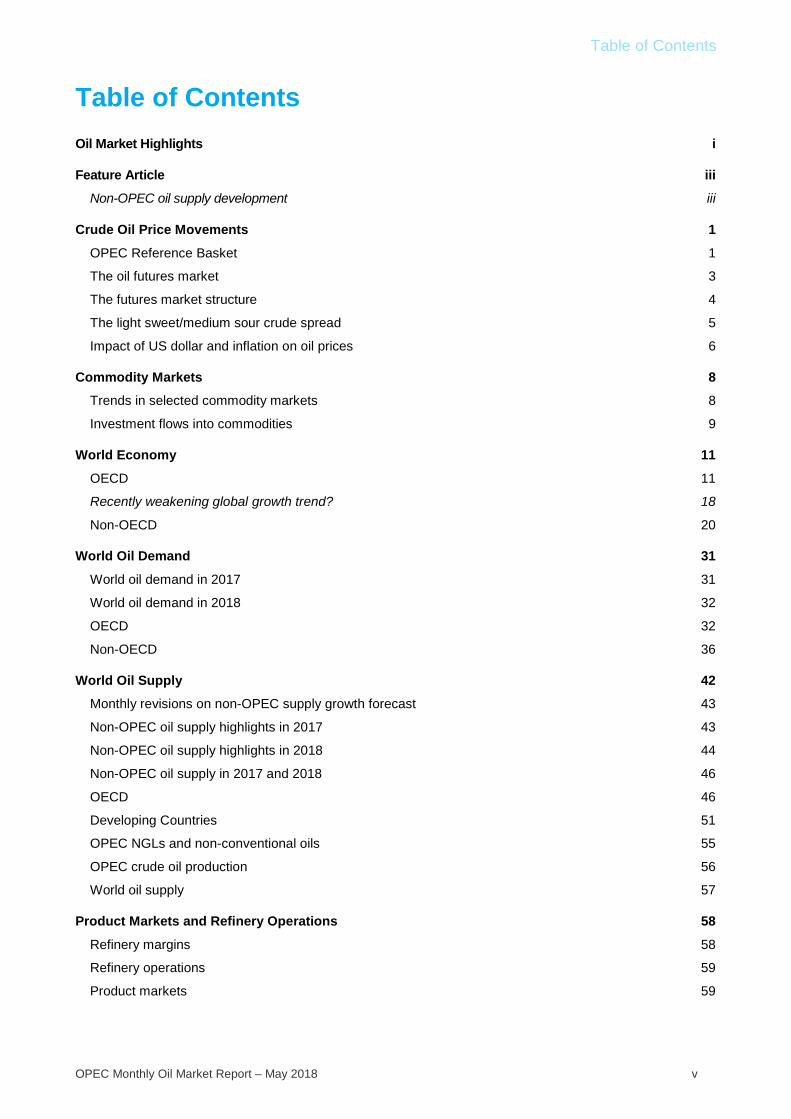
Table of Contents
OPEC Monthly Oil Market Report – May 2018 v
Table of Contents Oil Market Highlights i
Feature Article iii Non-OPEC oil supply development iii
Crude Oil Price Movements 1 OPEC Reference Basket 1 The oil futures market 3 The futures market structure 4 The light sweet/medium sour crude spread 5 Impact of US dollar and inflation on oil prices 6
Commodity Markets 8 Trends in selected commodity markets 8 Investment flows into commodities 9
World Economy 11 OECD 11 Recently weakening global growth trend? 18 Non-OECD 20
World Oil Demand 31 World oil demand in 2017 31 World oil demand in 2018 32 OECD 32 Non-OECD 36
World Oil Supply 42 Monthly revisions on non-OPEC supply growth forecast 43 Non-OPEC oil supply highlights in 2017 43 Non-OPEC oil supply highlights in 2018 44 Non-OPEC oil supply in 2017 and 2018 46 OECD 46 Developing Countries 51 OPEC NGLs and non-conventional oils 55 OPEC crude oil production 56 World oil supply 57
Product Markets and Refinery Operations 58 Refinery margins 58 Refinery operations 59 Product markets 59
Table of Contents
vi OPEC Monthly Oil Market Report – May 2018
Tanker Market 65 Spot fixtures 65 Sailings and arrivals 65 Dirty tanker freight rates 66 Clean tanker freight rates 68
Oil Trade 69 US 69 Japan 70 China 71 India 72 FSU 73
Stock Movements 75 OECD 75 EU plus Norway 77 US 77 Japan 79 China 80 Singapore and Amsterdam-Rotterdam-Antwerp (ARA) 80
Balance of Supply and Demand 82 Balance of supply and demand in 2017 82 Balance of supply and demand in 2018 83
Appendix 84
Glossary of Terms 90 Abbreviations 90 Acronyms 91
Contributors to the OPEC Monthly Oil Market Report 93

Crude Oil Price Movements
OPEC Monthly Oil Market Report – May 2018 1
Crude Oil Price Movements
In April, the OPEC Reference Basket (ORB) ended sharply higher, increasing by more than 7% to $68.43/b over the previous month. All ORB component values improved solidly, together with their respective crude oil benchmarks, particularly Dated Brent and Dubai, which rose by almost 9% over the month. Year-to-date (y-t-d), the ORB value was 26.7%, or $13.85, higher at $65.67/b, compared with the same period in 2017.
While both oil futures rose over the month, ICE Brent crude oil futures ended the month significantly higher, above the $70/b level. The oil market was underpinned in April by renewed geopolitical issues, tightening product inventories and robust global demand that dampened the effects of a stronger dollar and rising US production. Strong conformity by OPEC and participating non-OPEC nations in terms of production adjustments through the ‘Declaration of Cooperation’ also continue to support the oil market. ICE Brent was up $5.04 in April, or 7.6%, to average $71.76/b, while NYMEX WTI gained $3.55, or 5.7%, to average $66.33/b. Y-t-d, ICE Brent is $13.96, or 25.7%, higher at $68.36/b, while NYMEX WTI is up $12.15, or 23.5%, at $63.77/b. The spread between the NYMEX WTI and ICE Brent benchmarks extended significantly in April to its widest level so far this year on increasing US supplies. The first-month ICE Brent/NYMEX WTI spread widened by $1.49 m-o-m to $5.44/b.
Despite the surge in crude oil futures prices, speculative net length positions ended the month slightly lower in ICE Brent futures and options positions. The long-to-short ratio in ICE Brent speculative positions increased further from 15.5:1 to a record-breaking 19.9:1. Total futures and options open interest volume in the two exchanges was 535,701 lots, or 8.3%, higher at 7 million contracts.
Both Brent and Dubai market structures moved deeper into backwardation over the month on strong prompt month prices and somewhat healthy physical crude oil demand. In the US, WTI backwardation remained at the same level. For the second month in a row, apart from the US Gulf Coast (USGC), all sour crudes were under pressure. Sweet/sour differentials widened further in Europe and Asia, while on the USGC the spread narrowed more.
OPEC Reference Basket The ORB jumped over 7% in April, the highest monthly gain since last November, to average $68.43/b. This is the highest monthly value since November 2014. All ORB component values increased sharply alongside their respective crude oil benchmarks, particularly Dated Brent and Dubai, which rose by nearly 9% over the month. Crude oil physical benchmarks WTI, Dubai and Dated Brent spot prices rose by $3.56, $5.53 and $5.69, respectively.
Values of light sweet crude ORB components from West and North Africa, including Saharan Blend, Es Sider, Girassol, Bonny Light, Equatorial Guinea’s Zafiro and Gabon’s Rabi, increased on average by $5.47, or 8.3%, to $71.53/b in April. Gains in these crudes were capped by price differentials reaching their lowest levels so far this year, as seasonally slow demand from China and an abundance of competing grades gave sellers very little leverage. The West African (WAF) market also faced a double headwind: the biggest premium of Brent crude to Dubai since early 2016, as well as weak Asian refining margins.
Graph 1 - 1: Crude oil price movement
40
50
60
70
80
40
50
60
70
80
Apr
17
May
17
Jun
17Ju
l 17
Aug
17
Sep
17
Oct
17
Nov
17
Dec
17
Jan
18Fe
b 18
Mar
18
Apr
18
May
18
US$/bUS$/b
OPEC Basket WTI Brent Dated
Sources: Argus Media, OPEC Secretariat and Platts.
Crude Oil Price Movements
2 OPEC Monthly Oil Market Report – May 2018
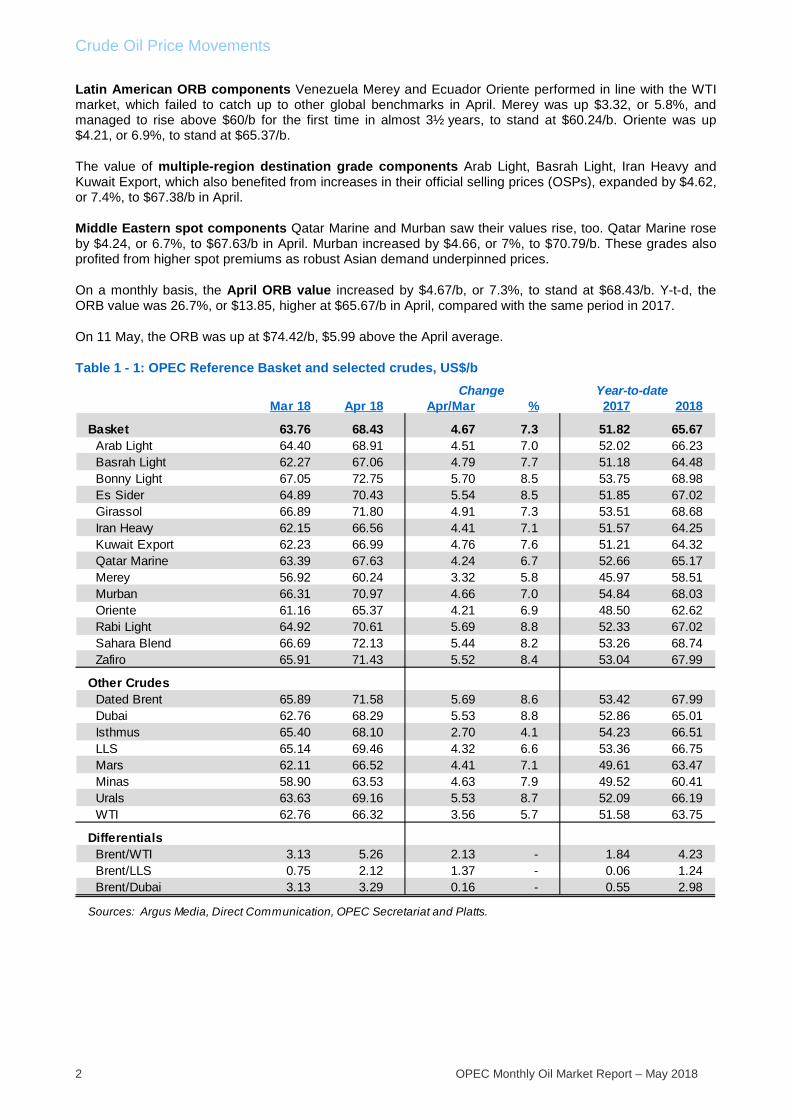
Latin American ORB components Venezuela Merey and Ecuador Oriente performed in line with the WTI market, which failed to catch up to other global benchmarks in April. Merey was up $3.32, or 5.8%, and managed to rise above $60/b for the first time in almost 3½ years, to stand at $60.24/b. Oriente was up $4.21, or 6.9%, to stand at $65.37/b.
The value of multiple-region destination grade components Arab Light, Basrah Light, Iran Heavy and Kuwait Export, which also benefited from increases in their official selling prices (OSPs), expanded by $4.62, or 7.4%, to $67.38/b in April.
Middle Eastern spot components Qatar Marine and Murban saw their values rise, too. Qatar Marine rose by $4.24, or 6.7%, to $67.63/b in April. Murban increased by $4.66, or 7%, to $70.79/b. These grades also profited from higher spot premiums as robust Asian demand underpinned prices.
On a monthly basis, the April ORB value increased by $4.67/b, or 7.3%, to stand at $68.43/b. Y-t-d, the ORB value was 26.7%, or $13.85, higher at $65.67/b in April, compared with the same period in 2017.
On 11 May, the ORB was up at $74.42/b, $5.99 above the April average.
Table 1 - 1: OPEC Reference Basket and selected crudes, US$/b
Mar 18 Apr 18 Apr/Mar % 2017 2018
Basket 63.76 68.43 4.67 7.3 51.82 65.67 Arab Light 64.40 68.91 4.51 7.0 52.02 66.23 Basrah Light 62.27 67.06 4.79 7.7 51.18 64.48 Bonny Light 67.05 72.75 5.70 8.5 53.75 68.98 Es Sider 64.89 70.43 5.54 8.5 51.85 67.02 Girassol 66.89 71.80 4.91 7.3 53.51 68.68 Iran Heavy 62.15 66.56 4.41 7.1 51.57 64.25 Kuwait Export 62.23 66.99 4.76 7.6 51.21 64.32 Qatar Marine 63.39 67.63 4.24 6.7 52.66 65.17 Merey 56.92 60.24 3.32 5.8 45.97 58.51 Murban 66.31 70.97 4.66 7.0 54.84 68.03 Oriente 61.16 65.37 4.21 6.9 48.50 62.62 Rabi Light 64.92 70.61 5.69 8.8 52.33 67.02 Sahara Blend 66.69 72.13 5.44 8.2 53.26 68.74 Zafiro 65.91 71.43 5.52 8.4 53.04 67.99
Other Crudes Dated Brent 65.89 71.58 5.69 8.6 53.42 67.99 Dubai 62.76 68.29 5.53 8.8 52.86 65.01 Isthmus 65.40 68.10 2.70 4.1 54.23 66.51 LLS 65.14 69.46 4.32 6.6 53.36 66.75 Mars 62.11 66.52 4.41 7.1 49.61 63.47 Minas 58.90 63.53 4.63 7.9 49.52 60.41 Urals 63.63 69.16 5.53 8.7 52.09 66.19 WTI 62.76 66.32 3.56 5.7 51.58 63.75
Differentials Brent/WTI 3.13 5.26 2.13 - 1.84 4.23 Brent/LLS 0.75 2.12 1.37 - 0.06 1.24 Brent/Dubai 3.13 3.29 0.16 - 0.55 2.98
Sources: Argus Media, Direct Communication, OPEC Secretariat and Platts.
Change Year-to-date
Crude Oil Price Movements
OPEC Monthly Oil Market Report – May 2018 3
The oil futures market ICE Brent crude oil futures ended the month significantly higher, above $70/b, which has not been seen since late 2014. NYMEX WTI futures also rose sharply, but at a lower rate due to rising US oil supplies, both in terms of production and inventories, as well as a strengthening US dollar. The oil market was underpinned over the month by renewed geopolitical issues, tightening product inventories and robust global demand. This all dampened the effects of a stronger dollar and rising US production. Strong conformity from OPEC and participating non-OPEC nations in terms of production adjustments under the ‘Declaration of Cooperation’ continue to support the oil market, too.
In April, ICE Brent was on average $5.04, or 7.6%, higher at $71.76/b, while NYMEX WTI gained $3.55, or 5.7%, to average $66.33/b. Y-t-d, ICE Brent is $13.96, or 25.7%, higher at $68.36/b, while NYMEX WTI is $12.15, or 23.5%, higher at $63.73/b. In line with improvements in crude oil futures, DME Oman also rose a sharp $4.94, or 7.8%, over the month to settle at an average $68.49/b in April. Y-t-d, DME Oman was up $12.27, or 23.1%, at $65.40/b.
On 11 May, ICE Brent stood at $77.12/b and NYMEX WTI at $70.70/b.
Table 1 - 2: Crude oil futures, US$/b
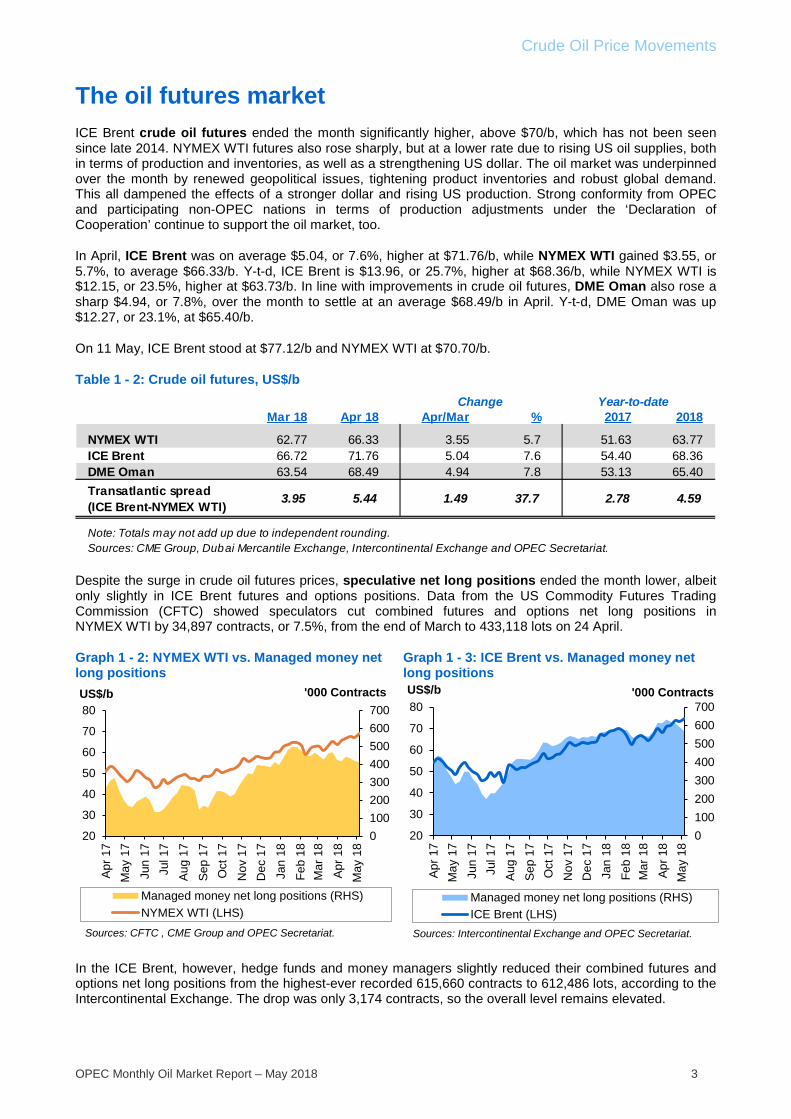
Despite the surge in crude oil futures prices, speculative net long positions ended the month lower, albeit only slightly in ICE Brent futures and options positions. Data from the US Commodity Futures Trading Commission (CFTC) showed speculators cut combined futures and options net long positions in NYMEX WTI by 34,897 contracts, or 7.5%, from the end of March to 433,118 lots on 24 April.
Graph 1 - 2: NYMEX WTI vs. Managed money net long positions
Graph 1 - 3: ICE Brent vs. Managed money net long positions
In the ICE Brent, however, hedge funds and money managers slightly reduced their combined futures and options net long positions from the highest-ever recorded 615,660 contracts to 612,486 lots, according to the Intercontinental Exchange. The drop was only 3,174 contracts, so the overall level remains elevated.
Mar 18 Apr 18 Apr/Mar % 2017 2018
NYMEX WTI 62.77 66.33 3.55 5.7 51.63 63.77ICE Brent 66.72 71.76 5.04 7.6 54.40 68.36DME Oman 63.54 68.49 4.94 7.8 53.13 65.40Transatlantic spread (ICE Brent-NYMEX WTI) 3.95 5.44 1.49 37.7 2.78 4.59
Note: Totals may not add up due to independent rounding.
Change
Sources: CME Group, Dubai Mercantile Exchange, Intercontinental Exchange and OPEC Secretariat.
Year-to-date
0100200300400500600700
20
30
40
50
60
70
80
Apr 1
7M
ay 1
7Ju
n 17
Jul 1
7Au
g 17
Sep
17O
ct 1
7N
ov 1
7D
ec 1
7Ja
n 18
Feb
18M
ar 1
8Ap
r 18
May
18
US$/b
Managed money net long positions (RHS)NYMEX WTI (LHS)
'000 Contracts
Sources: CFTC , CME Group and OPEC Secretariat.
0100200300400500600700
20
30
40
50
60
70
80
Apr
17
May
17
Jun
17Ju
l 17
Aug
17
Sep
17
Oct
17
Nov
17
Dec
17
Jan
18Fe
b 18
Mar
18
Apr
18
May
18
US$/b
Managed money net long positions (RHS)ICE Brent (LHS)
'000 Contracts
Sources: Intercontinental Exchange and OPEC Secretariat.
Crude Oil Price Movements
4 OPEC Monthly Oil Market Report – May 2018
The long-to-short ratio in ICE Brent speculative positions increased further from 15.5:1 to a record-breaking 19.9:1. In NYMEX WTI, the ratio decreased to 13.2:1 from 16.3:1.
The total futures and options open interest volume in the two exchanges was 535,701 lots, or 8.3%, higher at 7 million contracts.
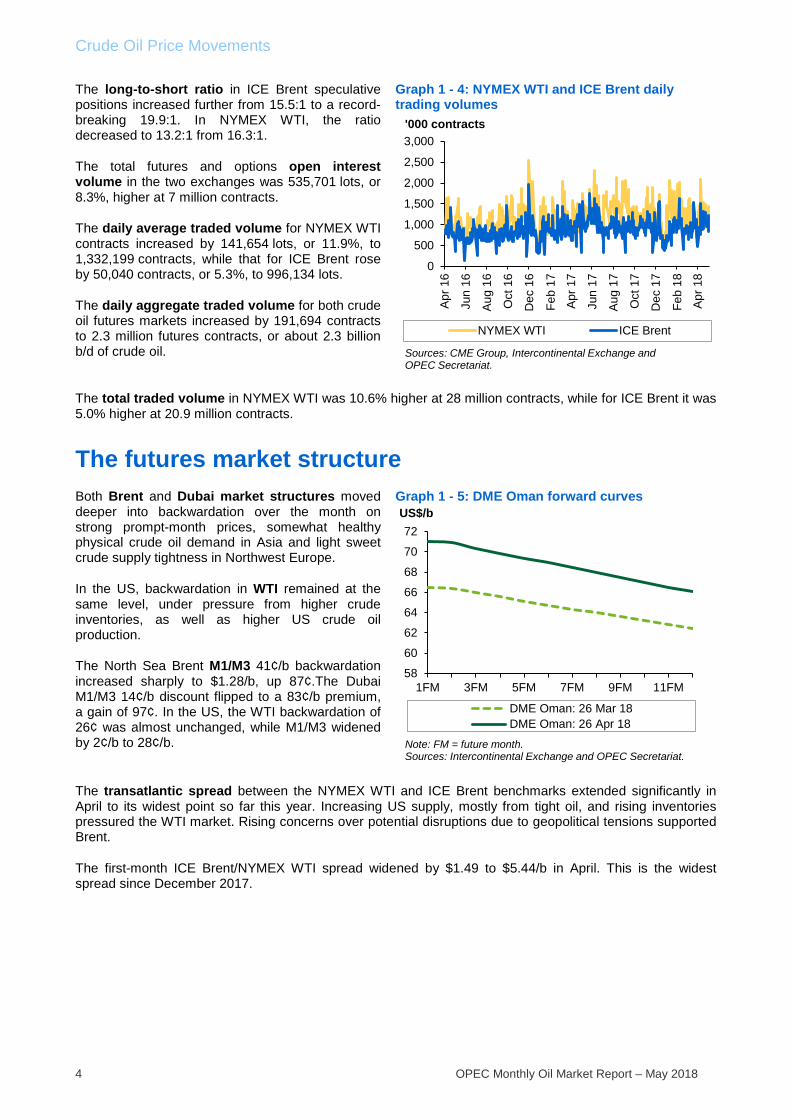
The daily average traded volume for NYMEX WTI contracts increased by 141,654 lots, or 11.9%, to 1,332,199 contracts, while that for ICE Brent rose by 50,040 contracts, or 5.3%, to 996,134 lots.
The daily aggregate traded volume for both crude oil futures markets increased by 191,694 contracts to 2.3 million futures contracts, or about 2.3 billion b/d of crude oil.
Graph 1 - 4: NYMEX WTI and ICE Brent daily trading volumes
The total traded volume in NYMEX WTI was 10.6% higher at 28 million contracts, while for ICE Brent it was 5.0% higher at 20.9 million contracts.
The futures market structure Both Brent and Dubai market structures moved deeper into backwardation over the month on strong prompt-month prices, somewhat healthy physical crude oil demand in Asia and light sweet crude supply tightness in Northwest Europe.
In the US, backwardation in WTI remained at the same level, under pressure from higher crude inventories, as well as higher US crude oil production.
The North Sea Brent M1/M3 41¢/b backwardation increased sharply to $1.28/b, up 87¢.The Dubai M1/M3 14¢/b discount flipped to a 83¢/b premium, a gain of 97¢. In the US, the WTI backwardation of 26¢ was almost unchanged, while M1/M3 widened by 2¢/b to 28¢/b.
Graph 1 - 5: DME Oman forward curves
The transatlantic spread between the NYMEX WTI and ICE Brent benchmarks extended significantly in April to its widest point so far this year. Increasing US supply, mostly from tight oil, and rising inventories pressured the WTI market. Rising concerns over potential disruptions due to geopolitical tensions supported Brent.
The first-month ICE Brent/NYMEX WTI spread widened by $1.49 to $5.44/b in April. This is the widest spread since December 2017.
0
500
1,000
1,500
2,000
2,500
3,000
Apr
16
Jun
16
Aug
16
Oct
16
Dec
16
Feb
17
Apr
17
Jun
17
Aug
17
Oct
17
Dec
17
Feb
18
Apr
18
NYMEX WTI ICE Brent
Sources: CME Group, Intercontinental Exchange and OPEC Secretariat.
'000 contracts
58
60
62
64
66
68
70
72
1FM 3FM 5FM 7FM 9FM 11FM
US$/b
DME Oman: 26 Mar 18DME Oman: 26 Apr 18
Note: FM = future month.Sources: Intercontinental Exchange and OPEC Secretariat.
Crude Oil Price Movements
OPEC Monthly Oil Market Report – May 2018 5
Graph 1 - 6: NYMEX WTI forward curves Graph 1 - 7: ICE Brent forward curves
Table 1 - 3: NYMEX WTI and ICE Brent forward curves, US$/b
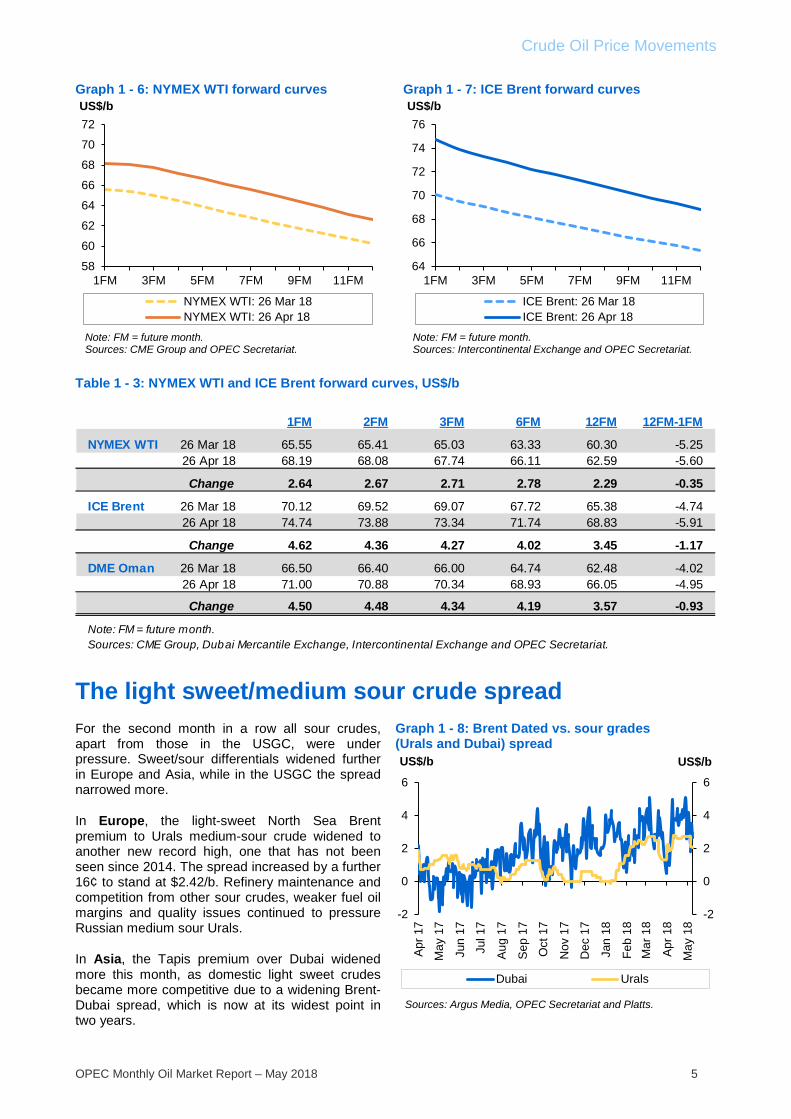
The light sweet/medium sour crude spread For the second month in a row all sour crudes, apart from those in the USGC, were under pressure. Sweet/sour differentials widened further in Europe and Asia, while in the USGC the spread narrowed more.
In Europe, the light-sweet North Sea Brent premium to Urals medium-sour crude widened to another new record high, one that has not been seen since 2014. The spread increased by a further 16¢ to stand at $2.42/b. Refinery maintenance and competition from other sour crudes, weaker fuel oil margins and quality issues continued to pressure Russian medium sour Urals.
In Asia, the Tapis premium over Dubai widened more this month, as domestic light sweet crudes became more competitive due to a widening Brent-Dubai spread, which is now at its widest point in two years.
Graph 1 - 8: Brent Dated vs. sour grades (Urals and Dubai) spread
58
60
62
64
66
68
70
72
1FM 3FM 5FM 7FM 9FM 11FM
US$/b
NYMEX WTI: 26 Mar 18NYMEX WTI: 26 Apr 18
Note: FM = future month.Sources: CME Group and OPEC Secretariat.
64
66
68
70
72
74
76
1FM 3FM 5FM 7FM 9FM 11FM
US$/b
ICE Brent: 26 Mar 18ICE Brent: 26 Apr 18
Note: FM = future month.Sources: Intercontinental Exchange and OPEC Secretariat.
1FM 2FM 3FM 6FM 12FM 12FM-1FM
NYMEX WTI 26 Mar 18 65.55 65.41 65.03 63.33 60.30 -5.2526 Apr 18 68.19 68.08 67.74 66.11 62.59 -5.60
Change 2.64 2.67 2.71 2.78 2.29 -0.35
ICE Brent 26 Mar 18 70.12 69.52 69.07 67.72 65.38 -4.7426 Apr 18 74.74 73.88 73.34 71.74 68.83 -5.91
Change 4.62 4.36 4.27 4.02 3.45 -1.17
DME Oman 26 Mar 18 66.50 66.40 66.00 64.74 62.48 -4.0226 Apr 18 71.00 70.88 70.34 68.93 66.05 -4.95
Change 4.50 4.48 4.34 4.19 3.57 -0.93
Note: FM = future month.Sources: CME Group, Dubai Mercantile Exchange, Intercontinental Exchange and OPEC Secretariat.
-2
0
2
4
6
-2
0
2
4
6
Apr
17
May
17
Jun
17
Jul 1
7
Aug
17
Sep
17
Oct
17
Nov
17
Dec
17
Jan
18
Feb
18M
ar 1
8
Apr
18
May
18
US$/bUS$/b
Dubai Urals
Sources: Argus Media, OPEC Secretariat and Platts.
Crude Oil Price Movements
6 OPEC Monthly Oil Market Report – May 2018
The Brent/Dubai spread widened further to $3.29/b, discouraging the flow of West-East arbitrage for Atlantic Basin crudes. The Tapis/Dubai spread widened by 29¢ to $5.22/b. The Dated Brent/Dubai spread increased by 16¢ to $3.29/b from $3.13/b the previous month.
In the USGC, the LLS premium over medium-sour Mars decreased again by 9¢ to $2.94/b, partially on limited sour crude imports and the start-up of some refineries after planned seasonal maintenance work.
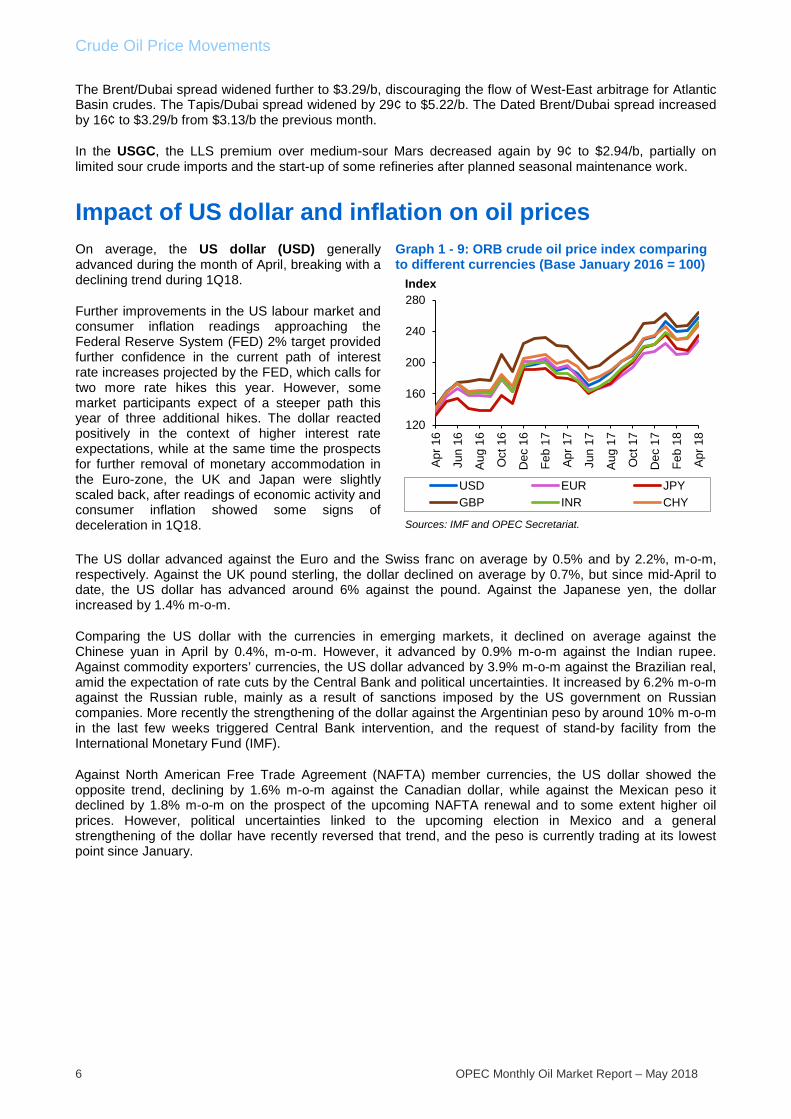
Impact of US dollar and inflation on oil prices On average, the US dollar (USD) generally advanced during the month of April, breaking with a declining trend during 1Q18.
Further improvements in the US labour market and consumer inflation readings approaching the Federal Reserve System (FED) 2% target provided further confidence in the current path of interest rate increases projected by the FED, which calls for two more rate hikes this year. However, some market participants expect of a steeper path this year of three additional hikes. The dollar reacted positively in the context of higher interest rate expectations, while at the same time the prospects for further removal of monetary accommodation in the Euro-zone, the UK and Japan were slightly scaled back, after readings of economic activity and consumer inflation showed some signs of deceleration in 1Q18.
Graph 1 - 9: ORB crude oil price index comparing to different currencies (Base January 2016 = 100)
The US dollar advanced against the Euro and the Swiss franc on average by 0.5% and by 2.2%, m-o-m, respectively. Against the UK pound sterling, the dollar declined on average by 0.7%, but since mid-April to date, the US dollar has advanced around 6% against the pound. Against the Japanese yen, the dollar increased by 1.4% m-o-m.
Comparing the US dollar with the currencies in emerging markets, it declined on average against the Chinese yuan in April by 0.4%, m-o-m. However, it advanced by 0.9% m-o-m against the Indian rupee. Against commodity exporters’ currencies, the US dollar advanced by 3.9% m-o-m against the Brazilian real, amid the expectation of rate cuts by the Central Bank and political uncertainties. It increased by 6.2% m-o-m against the Russian ruble, mainly as a result of sanctions imposed by the US government on Russian companies. More recently the strengthening of the dollar against the Argentinian peso by around 10% m-o-m in the last few weeks triggered Central Bank intervention, and the request of stand-by facility from the International Monetary Fund (IMF).
Against North American Free Trade Agreement (NAFTA) member currencies, the US dollar showed the opposite trend, declining by 1.6% m-o-m against the Canadian dollar, while against the Mexican peso it declined by 1.8% m-o-m on the prospect of the upcoming NAFTA renewal and to some extent higher oil prices. However, political uncertainties linked to the upcoming election in Mexico and a general strengthening of the dollar have recently reversed that trend, and the peso is currently trading at its lowest point since January.
120
160
200
240
280
Apr 1
6
Jun
16
Aug
16
Oct
16
Dec
16
Feb
17
Apr 1
7
Jun
17
Aug
17
Oct
17
Dec
17
Feb
18
Apr 1
8
USD EUR JPYGBP INR CHY
Index
Sources: IMF and OPEC Secretariat.
Crude Oil Price Movements
OPEC Monthly Oil Market Report – May 2018 7
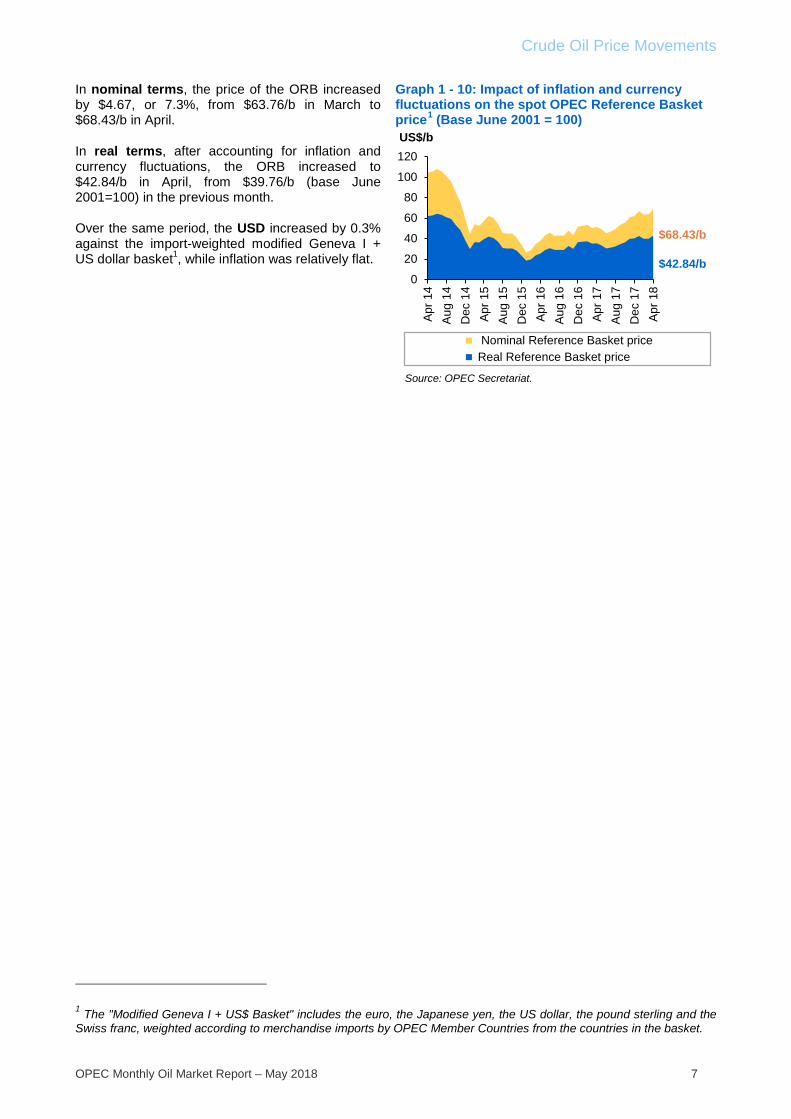
In nominal terms, the price of the ORB increased by $4.67, or 7.3%, from $63.76/b in March to $68.43/b in April.
In real terms, after accounting for inflation and currency fluctuations, the ORB increased to $42.84/b in April, from $39.76/b (base June 2001=100) in the previous month.
Over the same period, the USD increased by 0.3% against the import-weighted modified Geneva I + US dollar basket1, while inflation was relatively flat.
Graph 1 - 10: Impact of inflation and currency fluctuations on the spot OPEC Reference Basket price1 (Base June 2001 = 100)
1 The "Modified Geneva I + US$ Basket" includes the euro, the Japanese yen, the US dollar, the pound sterling and the Swiss franc, weighted according to merchandise imports by OPEC Member Countries from the countries in the basket.
0
20
40
60
80
100
120
Apr 1
4Au
g 14
Dec
14
Apr 1
5Au
g 15
Dec
15
Apr 1
6Au
g 16
Dec
16
Apr 1
7Au
g 17
Dec
17
Apr 1
8
US$/b
Nominal Reference Basket price Real Reference Basket price
Source: OPEC Secretariat.
$68.43/b
$42.84/b
Commodity Markets
8 OPEC Monthly Oil Market Report – May 2018
Commodity Markets
Energy prices increased in April led by crude oil and natural gas, while coal prices retreated. In the group of non-energy commodities, metal prices were led by higher aluminium prices, which increased as a result of the imposition of US sanctions on the world’s second largest aluminium producing company, Rusal. Prices briefly spiked by around 30%, but gave back some of those gains towards the end of the month. Nickel and palladium prices were also affected by the potential imposition of sanctions against Russian producer, Norilsk. Gold prices were weaker towards the end of month on a firmer outlook for interest rate increases by the US Federal Reserve.
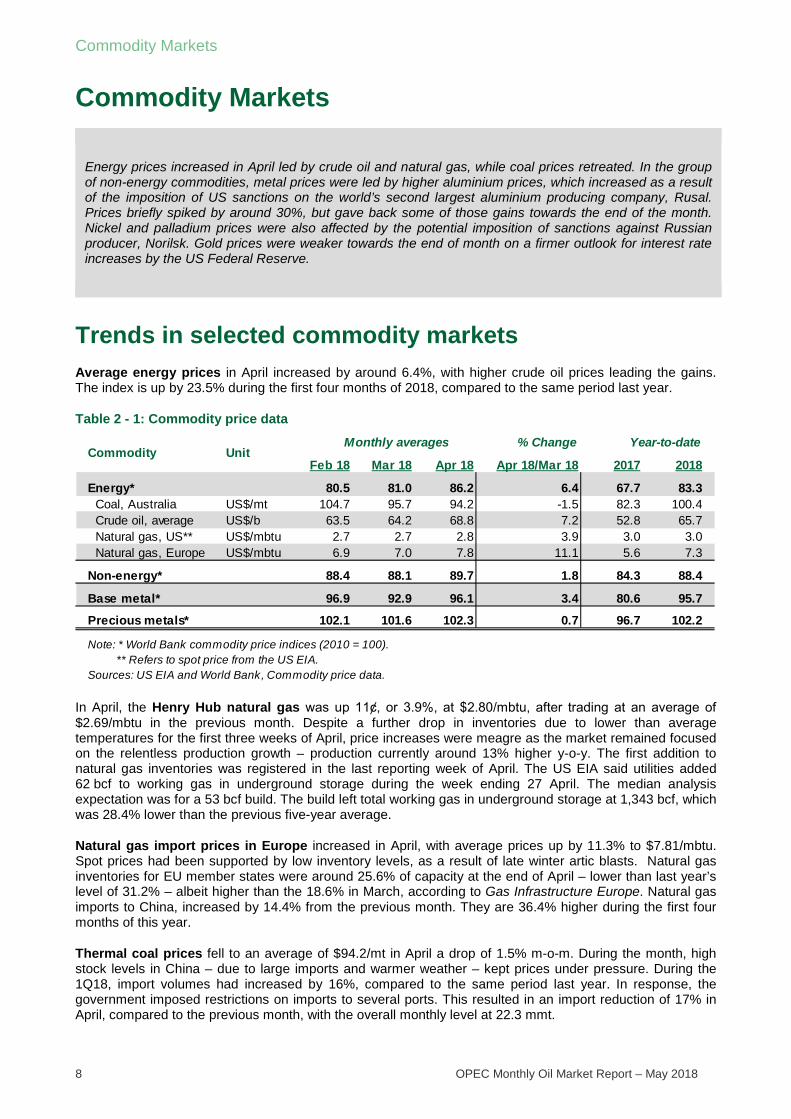
Trends in selected commodity markets Average energy prices in April increased by around 6.4%, with higher crude oil prices leading the gains. The index is up by 23.5% during the first four months of 2018, compared to the same period last year.
Table 2 - 1: Commodity price data
In April, the Henry Hub natural gas was up 11ȼ, or 3.9%, at $2.80/mbtu, after trading at an average of $2.69/mbtu in the previous month. Despite a further drop in inventories due to lower than average temperatures for the first three weeks of April, price increases were meagre as the market remained focused on the relentless production growth – production currently around 13% higher y-o-y. The first addition to natural gas inventories was registered in the last reporting week of April. The US EIA said utilities added 62 bcf to working gas in underground storage during the week ending 27 April. The median analysis expectation was for a 53 bcf build. The build left total working gas in underground storage at 1,343 bcf, which was 28.4% lower than the previous five-year average.
Natural gas import prices in Europe increased in April, with average prices up by 11.3% to $7.81/mbtu. Spot prices had been supported by low inventory levels, as a result of late winter artic blasts. Natural gas inventories for EU member states were around 25.6% of capacity at the end of April – lower than last year’s level of 31.2% – albeit higher than the 18.6% in March, according to Gas Infrastructure Europe. Natural gas imports to China, increased by 14.4% from the previous month. They are 36.4% higher during the first four months of this year.
Thermal coal prices fell to an average of $94.2/mt in April a drop of 1.5% m-o-m. During the month, high stock levels in China – due to large imports and warmer weather – kept prices under pressure. During the 1Q18, import volumes had increased by 16%, compared to the same period last year. In response, the government imposed restrictions on imports to several ports. This resulted in an import reduction of 17% in April, compared to the previous month, with the overall monthly level at 22.3 mmt.
% Change
Feb 18 Mar 18 Apr 18 Apr 18/Mar 18 2017 2018
Energy* 80.5 81.0 86.2 6.4 67.7 83.3 Coal, Australia US$/mt 104.7 95.7 94.2 -1.5 82.3 100.4 Crude oil, average US$/b 63.5 64.2 68.8 7.2 52.8 65.7 Natural gas, US** US$/mbtu 2.7 2.7 2.8 3.9 3.0 3.0 Natural gas, Europe US$/mbtu 6.9 7.0 7.8 11.1 5.6 7.3
Non-energy* 88.4 88.1 89.7 1.8 84.3 88.4
Base metal* 96.9 92.9 96.1 3.4 80.6 95.7
Precious metals* 102.1 101.6 102.3 0.7 96.7 102.2
Note: * World Bank commodity price indices (2010 = 100). ** Refers to spot price from the US EIA.Sources: US EIA and World Bank, Commodity price data.
UnitCommodity Monthly averages Year-to-date
Commodity Markets
OPEC Monthly Oil Market Report – May 2018 9
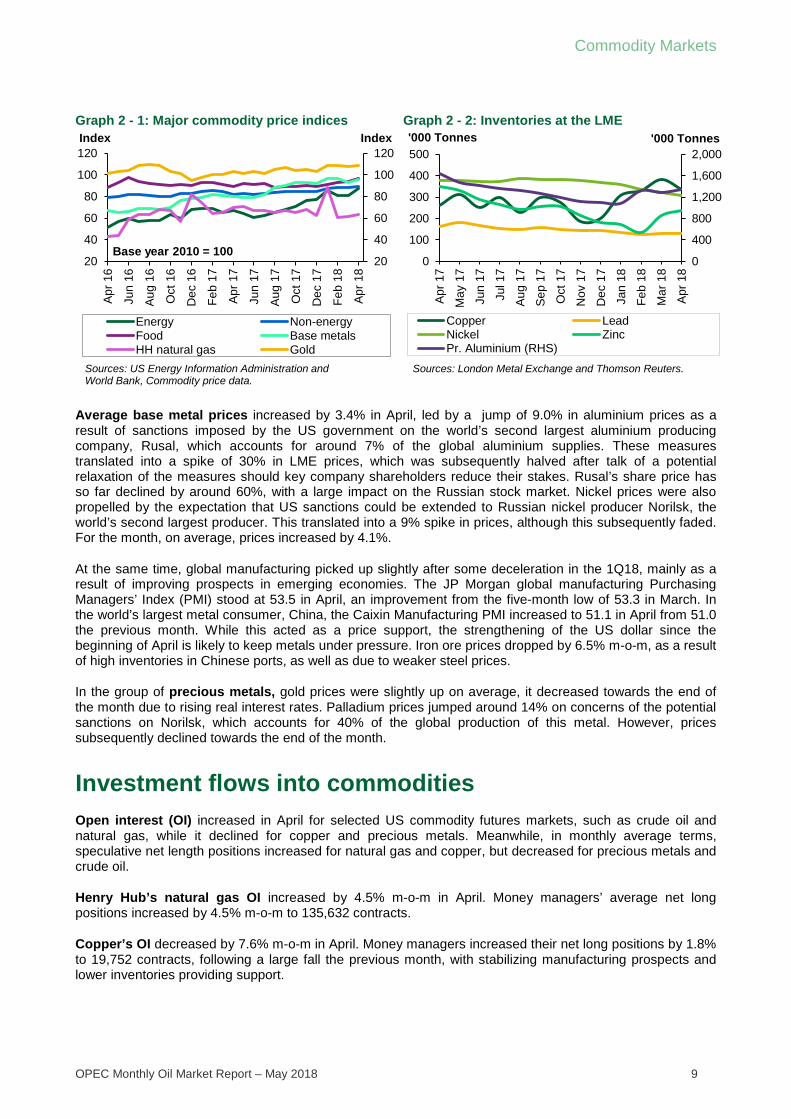
Graph 2 - 1: Major commodity price indices Graph 2 - 2: Inventories at the LME
Average base metal prices increased by 3.4% in April, led by a jump of 9.0% in aluminium prices as a result of sanctions imposed by the US government on the world’s second largest aluminium producing company, Rusal, which accounts for around 7% of the global aluminium supplies. These measures translated into a spike of 30% in LME prices, which was subsequently halved after talk of a potential relaxation of the measures should key company shareholders reduce their stakes. Rusal’s share price has so far declined by around 60%, with a large impact on the Russian stock market. Nickel prices were also propelled by the expectation that US sanctions could be extended to Russian nickel producer Norilsk, the world’s second largest producer. This translated into a 9% spike in prices, although this subsequently faded. For the month, on average, prices increased by 4.1%.
At the same time, global manufacturing picked up slightly after some deceleration in the 1Q18, mainly as a result of improving prospects in emerging economies. The JP Morgan global manufacturing Purchasing Managers’ Index (PMI) stood at 53.5 in April, an improvement from the five-month low of 53.3 in March. In the world’s largest metal consumer, China, the Caixin Manufacturing PMI increased to 51.1 in April from 51.0 the previous month. While this acted as a price support, the strengthening of the US dollar since the beginning of April is likely to keep metals under pressure. Iron ore prices dropped by 6.5% m-o-m, as a result of high inventories in Chinese ports, as well as due to weaker steel prices.
In the group of precious metals, gold prices were slightly up on average, it decreased towards the end of the month due to rising real interest rates. Palladium prices jumped around 14% on concerns of the potential sanctions on Norilsk, which accounts for 40% of the global production of this metal. However, prices subsequently declined towards the end of the month.
Investment flows into commodities Open interest (OI) increased in April for selected US commodity futures markets, such as crude oil and natural gas, while it declined for copper and precious metals. Meanwhile, in monthly average terms, speculative net length positions increased for natural gas and copper, but decreased for precious metals and crude oil.
Henry Hub’s natural gas OI increased by 4.5% m-o-m in April. Money managers’ average net long positions increased by 4.5% m-o-m to 135,632 contracts.
Copper’s OI decreased by 7.6% m-o-m in April. Money managers increased their net long positions by 1.8% to 19,752 contracts, following a large fall the previous month, with stabilizing manufacturing prospects and lower inventories providing support.
20
40
60
80
100
120
20
40
60
80
100
120
Apr 1
6
Jun
16
Aug
16
Oct
16
Dec
16
Feb
17
Apr 1
7
Jun
17
Aug
17
Oct
17
Dec
17
Feb
18
Apr 1
8
IndexIndex
Energy Non-energyFood Base metalsHH natural gas Gold
Sources: US Energy Information Administration and World Bank, Commodity price data.
Base year 2010 = 1000
400
800
1,200
1,600
2,000
0
100
200
300
400
500
Apr 1
7
May
17
Jun
17
Jul 1
7
Aug
17
Sep
17
Oct
17
Nov
17
Dec
17
Jan
18
Feb
18
Mar
18
Apr 1
8
'000 Tonnes'000 Tonnes
Copper LeadNickel ZincPr. Aluminium (RHS)
Sources: London Metal Exchange and Thomson Reuters.
Commodity Markets
10 OPEC Monthly Oil Market Report – May 2018
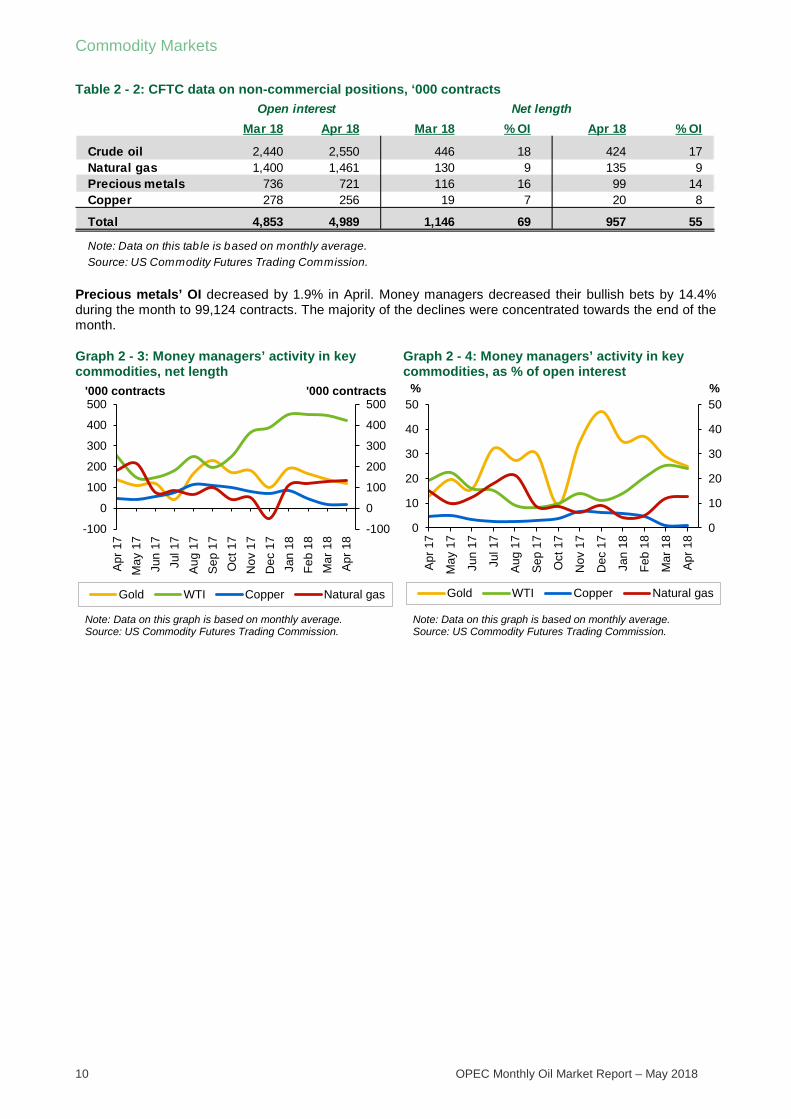
Table 2 - 2: CFTC data on non-commercial positions, ‘000 contracts
Precious metals’ OI decreased by 1.9% in April. Money managers decreased their bullish bets by 14.4% during the month to 99,124 contracts. The majority of the declines were concentrated towards the end of the month.
Graph 2 - 3: Money managers’ activity in key commodities, net length
Graph 2 - 4: Money managers’ activity in key commodities, as % of open interest
Mar 18 Apr 18 Mar 18 % OI Apr 18 % OI
Crude oil 2,440 2,550 446 18 424 17Natural gas 1,400 1,461 130 9 135 9Precious metals 736 721 116 16 99 14Copper 278 256 19 7 20 8
Total 4,853 4,989 1,146 69 957 55
Note: Data on this tab le is based on monthly average.Source: US Commodity Futures Trading Commission.
Open interest Net length
-100
0
100
200
300
400
500
-100
0
100
200
300
400
500
Apr 1
7M
ay 1
7Ju
n 17
Jul 1
7Au
g 17
Sep
17O
ct 1
7N
ov 1
7D
ec 1
7Ja
n 18
Feb
18M
ar 1
8Ap
r 18
Gold WTI Copper Natural gas
Note: Data on this graph is based on monthly average.Source: US Commodity Futures Trading Commission.
'000 contracts '000 contracts
0
10
20
30
40
50
0
10
20
30
40
50
Apr 1
7
May
17
Jun
17
Jul 1
7
Aug
17
Sep
17
Oct
17
Nov
17
Dec
17
Jan
18
Feb
18
Mar
18
Apr 1
8
%%
Gold WTI Copper Natural gas
Note: Data on this graph is based on monthly average.Source: US Commodity Futures Trading Commission.
World Economy
OPEC Monthly Oil Market Report – May 2018 11
World Economy
The synchronized global growth trend continues, and as lead and sentiment indicators have already pointed to some moderation of the high growth dynamic, 1Q growth in the major OECD economies has confirmed this slowing dynamic. However, it is assumed that the softening trend is transitory, and a high growth level of 3.8% will be maintained in 2018, the same as in 2017 and unchanged from the previous month. In addition, the potential re-emergence of global trade barriers, rising volatility in asset markets and continued monetary tightening are some of the challenges that may impact the near-term growth dynamic.
The OECD GDP growth forecast remains at 2.4% in 2018, after growth of 2.5% in 2017. After some softening of the growth trend in 1Q18, strong underlying growth in the US is forecast to continue, mainly supported by fiscal stimulus measures. However, this may be slightly dampened by the potential negative consequences of a rising budget deficit to finance the economic stimulus, as well as the possibility of rising inflation and the consequences of a likely tighter monetary policy. Additionally, the most recent trade-related initiatives may have a negative impact on the US economy, but this remains to be seen. Given the current situation, the US is expected to maintain a strong growth level of 2.7% in 2018, compared to 2.3% in 2017. Euro-zone growth continues at a strong level in 2018, but after relatively weak 1Q18 growth, it was revised down to 2.2% from 2.3% the previous month, after growth of 2.5% in 2017. Japan’s forecast remains unchanged at 1.5% in 2018 amid some softening in exports and somewhat lower domestic economic activity compared to 2017, when GDP was at 1.7%.
In the emerging economies, China is forecast to slow slightly, given its maturing economy. China’s growth is forecast at 6.5% in 2018 compared to 6.9% in 2017, unchanged from the previous month, Also Brazil’s and Russia’s forecasts remain unchanged. Brazil is expected to continue its recovery in 2018, growing by 2.1%, after growth of 1.0% in 2017. Russia is also forecast to show higher GDP growth in 2018 at 1.8%, compared to 1.5% in 2017. India is expected to overcome the negative effects of economic reforms, and its 2018 GDP growth forecast was revised up slightly to 7.3%, after growth of 6.3% in 2017.
Table 3 - 1: Economic growth rate and revision, 2017-2018*, %
OECD OECD Americas
US As expected, US 1Q18 GDP growth slowed down when compared to the previous three quarters. The first estimate by the Bureau of Economic Analysis shows growth of 2.3% quarter-on-quarter (q-o-q) at a seasonally adjusted annualized rate (SAAR), which compares to 2.9% q-o-q SAAR in 4Q17. Importantly, consumption has slowed down, while investment has increased and constituted a major driver for growth. This rise in investment may already be the outcome of fiscal stimulus – both the tax reform and the bipartisan spending bill -, which will impact growth even more positively in the coming quarters. Private household consumption expanded by only 1.1% q-o-q SAAR, but this relatively low number also comes after a considerable increase of 4.0% q-o-q in 4Q18. Hence, the GDP growth contribution was relatively small at
World OECD US JapanEuro-zone UK China India Brazil Russia
2017 3.8 2.5 2.3 1.7 2.5 1.8 6.9 6.3 1.0 1.5Change from previous month 0.0 0.0 0.0 0.0 0.0 0.0 0.0 0.0 0.0 0.0
2018 3.8 2.4 2.7 1.5 2.2 1.5 6.5 7.3 2.1 1.8Change from previous month 0.0 0.0 0.0 0.0 -0.1 -0.1 0.0 0.1 0.0 0.0
Note: * 2017 = Estimate and 2018 = Forecast.Source: OPEC Secretariat.

World Economy
12 OPEC Monthly Oil Market Report – May 2018
0.7 percentage points. Strong support came from the increase of 7.3% q-o-q SAAR in private investments, contributing 1.2 percentage points to the overall growth number. With the labour market seeing continued improvements, as well as considerable fiscal support provided via the Tax Cuts and Jobs Act, as well as the Bipartisan Budget Act, the slowdown in 1Q18 is expected to be temporary, and growth is anticipated to be well supported in 2018.
However, the latest trade-related initiatives by the US Administration, imposing certain tariffs on steel and aluminium products, various other tariffs on a variety of products imported from China, followed by challenging trade-negotiations with China over the past weeks. have led to rising uncertainty as the outcome of all these initiatives is unclear. The area of trade tariffs must be closely monitored as the potential for tit-for-tat retaliations and continued uncertainty may impact growth negatively and could have more serious economic consequences. This may then lead to rising global inflation, declining business sentiment, as well as other effects that could dampen ongoing global growth. The initiation of further sanctions on Russia and the withdrawal from the Iran nuclear deal are additional elements that may be a source of uncertainty in the future, impacting the US economy and global trade.
Also, the likely increase in federal debt and the rising budget deficit will be elements that will need close monitoring, and while they only materialize in the medium term, these outcomes may already be anticipated by capital markets and influence investors’ behaviour. The overnight indexed swap (OIS) – LIBOR spread remained high also in the second half of April and in May, and will need to be closely monitored. It remains to be seen if the widening OIS – LIBOR spread is only a temporary phenomenon or if it reflects ongoing uncertainty in the financial system. Also, it may indicate already tightening conditions in the inter-banking market. Hence, given the pick-up in growth, the strong labour market and further rising inflation, a continuation of the gradual normalization of monetary policies seems likely in 2018.
Inflation numbers have improved again slightly. Overall inflation remained at 2.4% in April, the same level as in March, and the important core inflation – excluding volatile items such as food and energy – remained steady for a second consecutive month at 2.1% y-o-y, compared to 1.9% in February and 1.8% in January. Also the Fed’s favoured inflation index, the personal consumption expenditure price index (PCE index), rose to 2.0% in April, which is around the Fed’s inflation target. Importantly, the PCE index, excluding food and energy, rose to 1.9% y-o-y, compared to 1.6% y-oy in February, almost at the Fed’s target rate.
Improvements in the labour market continued in April. Non-farm payrolls increased by 164,000 after an upwardly-revised figure of 135,000 in March. The unemployment rate fell to 3.9% from 4.1% in March, while the average hourly earnings growth for the private sector rose by 2.6% y-o-y, steady from March and February, but slightly below the 2.8% in January. Positively, long-term unemployment numbers fell further to stand at 20.0% in April, improving from a level of 20.3% in March and also compared to 20.7% in February and 21.5% in January, indicating a continued structural shift in the labour market. This April number is again the lowest level since the Lehman Brothers bankruptcy in September 2008. However, another important element in the labour market mix, the participation rate, fell by 0.1 pp to stand at 62.8% in April.
Industrial production saw a further strong rise in March, moving to 4.3% y-o-y growth from an even stronger February level of 4.4% y-o-y. Also, domestic demand held up well in March, with retail sales growing by 3.9% y-o-y compared to February growth of 3.6% y-o-y.
Consumer sentiment held up well and rose slightly, according to the Conference Board, whose consumer confidence index rose slightly to stand at a level of 128.7 in April, compared to 127.0 in March. This is again at almost the 10-year high of 130.0 in February.
Graph 3 - 1: US consumer confidence index
128.7
115
120
125
130
135
Apr 1
7
May
17
Jun
17
Jul 1
7
Aug
17
Sep
17
Oct
17
Nov
17
Dec
17
Jan
18
Feb
18
Mar
18
Apr 1
8
Index
Sources: The Conference Board and Haver Analytics.
World Economy
OPEC Monthly Oil Market Report – May 2018 13
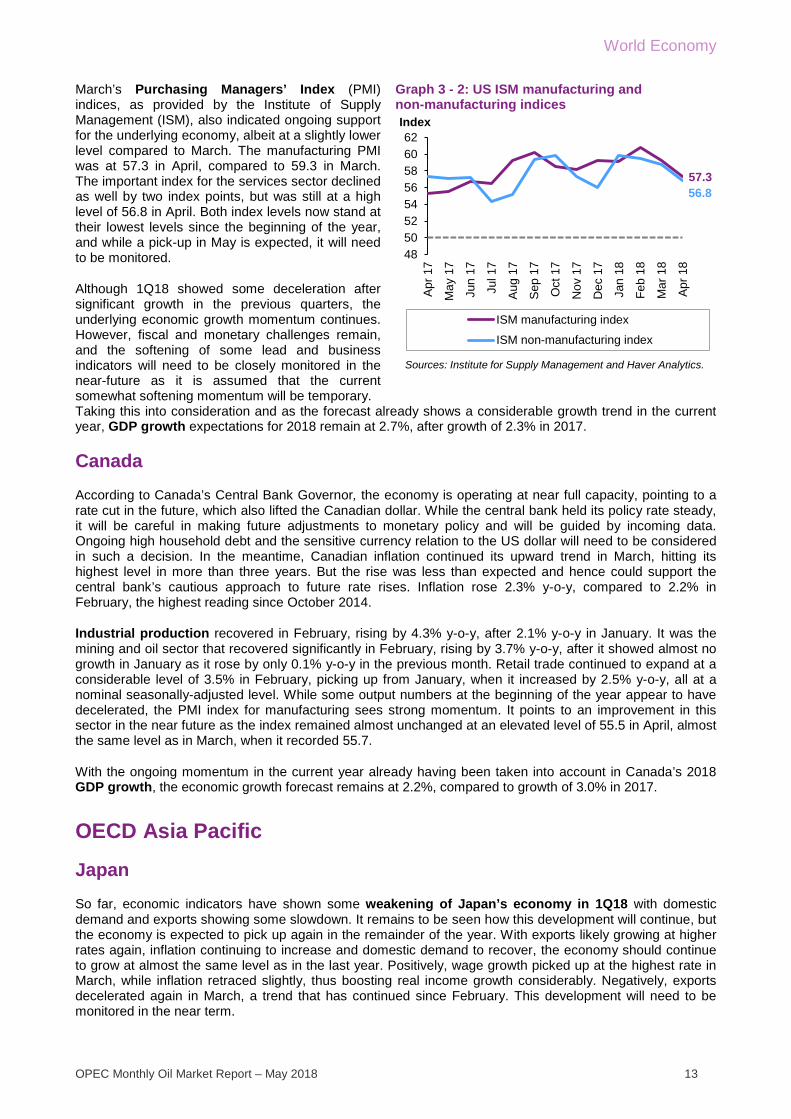
March’s Purchasing Managers’ Index (PMI) indices, as provided by the Institute of Supply Management (ISM), also indicated ongoing support for the underlying economy, albeit at a slightly lower level compared to March. The manufacturing PMI was at 57.3 in April, compared to 59.3 in March. The important index for the services sector declined as well by two index points, but was still at a high level of 56.8 in April. Both index levels now stand at their lowest levels since the beginning of the year, and while a pick-up in May is expected, it will need to be monitored.
Although 1Q18 showed some deceleration after significant growth in the previous quarters, the underlying economic growth momentum continues. However, fiscal and monetary challenges remain, and the softening of some lead and business indicators will need to be closely monitored in the near-future as it is assumed that the current somewhat softening momentum will be temporary.
Graph 3 - 2: US ISM manufacturing and non-manufacturing indices
Taking this into consideration and as the forecast already shows a considerable growth trend in the current year, GDP growth expectations for 2018 remain at 2.7%, after growth of 2.3% in 2017.
Canada According to Canada’s Central Bank Governor, the economy is operating at near full capacity, pointing to a rate cut in the future, which also lifted the Canadian dollar. While the central bank held its policy rate steady, it will be careful in making future adjustments to monetary policy and will be guided by incoming data. Ongoing high household debt and the sensitive currency relation to the US dollar will need to be considered in such a decision. In the meantime, Canadian inflation continued its upward trend in March, hitting its highest level in more than three years. But the rise was less than expected and hence could support the central bank’s cautious approach to future rate rises. Inflation rose 2.3% y-o-y, compared to 2.2% in February, the highest reading since October 2014.
Industrial production recovered in February, rising by 4.3% y-o-y, after 2.1% y-o-y in January. It was the mining and oil sector that recovered significantly in February, rising by 3.7% y-o-y, after it showed almost no growth in January as it rose by only 0.1% y-o-y in the previous month. Retail trade continued to expand at a considerable level of 3.5% in February, picking up from January, when it increased by 2.5% y-o-y, all at a nominal seasonally-adjusted level. While some output numbers at the beginning of the year appear to have decelerated, the PMI index for manufacturing sees strong momentum. It points to an improvement in this sector in the near future as the index remained almost unchanged at an elevated level of 55.5 in April, almost the same level as in March, when it recorded 55.7.
With the ongoing momentum in the current year already having been taken into account in Canada’s 2018 GDP growth, the economic growth forecast remains at 2.2%, compared to growth of 3.0% in 2017.
OECD Asia Pacific
Japan So far, economic indicators have shown some weakening of Japan’s economy in 1Q18 with domestic demand and exports showing some slowdown. It remains to be seen how this development will continue, but the economy is expected to pick up again in the remainder of the year. With exports likely growing at higher rates again, inflation continuing to increase and domestic demand to recover, the economy should continue to grow at almost the same level as in the last year. Positively, wage growth picked up at the highest rate in March, while inflation retraced slightly, thus boosting real income growth considerably. Negatively, exports decelerated again in March, a trend that has continued since February. This development will need to be monitored in the near term.
57.356.8
4850525456586062
Apr 1
7
May
17
Jun
17
Jul 1
7
Aug
17
Sep
17
Oct
17
Nov
17
Dec
17
Jan
18
Feb
18
Mar
18
Apr 1
8
Index
ISM manufacturing index
ISM non-manufacturing index
Sources: Institute for Supply Management and Haver Analytics.
World Economy
14 OPEC Monthly Oil Market Report – May 2018
While the Fed seems to continue its gradual monetary tightening and the ECB is also willing to reverse its accommodative monetary policy sometime in the future, the BoJ has confirmed that it will continue its monetary stimulus with quantitative and qualitative monetary easing (QQE) measures with Yield Curve Control for as long as necessary. In its latest meeting at the end of April, it concluded that it will continue expanding the monetary base until the y-o-y rate of increase in the observed CPI – all items less fresh food – exceeds 2% and then remains above this target in a stable manner. The short-term interest rate remains at minus 0.1% and the cap on 10-year bond yields remains at “around zero” as the BoJ will continue to buy assets at a pace of ¥80 trillion a year. This confirmation of an accommodative monetary policy by the BoJ may have been an additional reason that led to the most recent decline of the yen compared to the US dollar.
While healthy growth, particularly in 2H17, in combination with rising energy prices, has had a positive effect on inflation, consumer price growth weakened again somewhat in March. After a considerable increase in inflation, which stood at 1.5% in February, the March number stood at only 1.1%. This compares with 1.3% y-o-y in January and 1.0% y-o-y in December. Significant support came from rising energy prices, a generally healthy development for the Japanese economy. As the labour market shortages continue, inflation will also be supported in the near term via wage growth expectations. In March, monthly earnings rose by a very high level of 2.5% y-o-y after a rise of 0.4% y-o-y in February. The labour force shortage, in combination with growth in earnings, will likely lead to gradual growth in domestic consumption. At the same time, the government is supporting policies that may help productivity as the labour market tightness is also an important factor keeping the economy from expanding at a significantly higher rate than in previous years due to this lack of labour resources. Another governmental aim in this respect is to lift the participation rate, mainly women’s participation rate, which ticked up over the past years and now stands at above 70%, an increase of almost 10 percentage points over the last 10 years, with major progress in previous years. Core inflation, which excludes food and energy and is more wage-dependent, declined to 0.8% y-o-y, compared to 1.0% y-o-y in February. Given the tightness in the labour market, the unemployment rate remained at an ultra-low level of only 2.5% y-o-y in March.
Japanese exports continued their sluggish expansion in March. After strong growth in past months –January’s growth stood at of 12.3% y-o-y – March exports rose by only 2.1% y-o-y, compared to 1.8% y-o-y in February. Industrial production recovered somewhat in March, expanding by 3.6%, compared to 2.5% y-o-y in February and a very low rise of only 1.3% y-o-y in January. Positively, manufacturing orders continued their strong rise, at 9.6% y-o-y in February, after reaching 11.6% y-o-y in January.
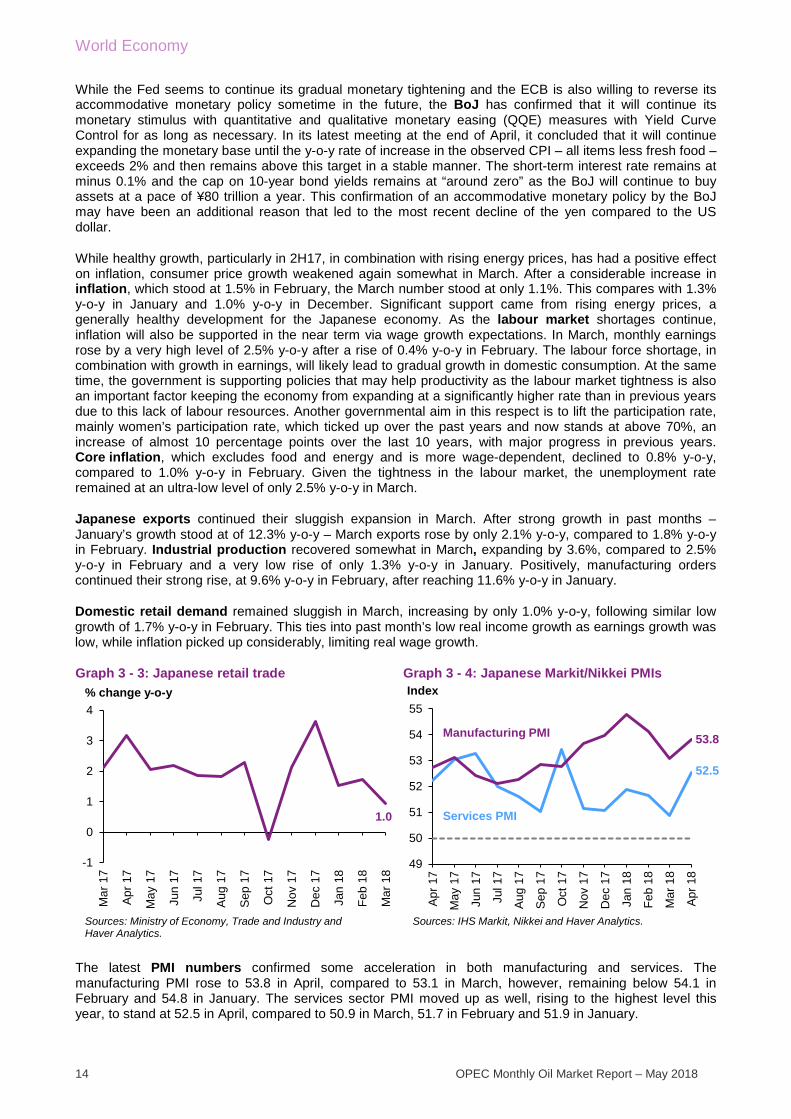
Domestic retail demand remained sluggish in March, increasing by only 1.0% y-o-y, following similar low growth of 1.7% y-o-y in February. This ties into past month’s low real income growth as earnings growth was low, while inflation picked up considerably, limiting real wage growth.
Graph 3 - 3: Japanese retail trade Graph 3 - 4: Japanese Markit/Nikkei PMIs
The latest PMI numbers confirmed some acceleration in both manufacturing and services. The manufacturing PMI rose to 53.8 in April, compared to 53.1 in March, however, remaining below 54.1 in February and 54.8 in January. The services sector PMI moved up as well, rising to the highest level this year, to stand at 52.5 in April, compared to 50.9 in March, 51.7 in February and 51.9 in January.
1.0
-1
0
1
2
3
4
Mar
17
Apr 1
7
May
17
Jun
17
Jul 1
7
Aug
17
Sep
17
Oct
17
Nov
17
Dec
17
Jan
18
Feb
18
Mar
18
Sources: Ministry of Economy, Trade and Industry and Haver Analytics.
% change y-o-y
52.5
53.8
49
50
51
52
53
54
55
Apr 1
7
May
17
Jun
17
Jul 1
7
Aug
17
Sep
17
Oct
17
Nov
17
Dec
17
Jan
18
Feb
18
Mar
18
Apr 1
8Index
Sources: IHS Markit, Nikkei and Haver Analytics.
Services PMI
Manufacturing PMI
World Economy
OPEC Monthly Oil Market Report – May 2018 15
While some slowdown has become apparent, the most recent developments still confirm a solid underlying growth dynamic in the Japanese economy, a trend that has already been taken into consideration in the 2018 GDP growth forecast of 1.5%. This compares to a very strong growth rate of 1.7% in 2017. Some challenges in the economy remain, and given the tight labour market situation and high capacity utilization rates, further growth potential seems limited for now.
South Korea Political developments on the Korean Peninsula seem to be improving substantially. It remains to be seen how this will impact economic growth, and more clarity will become available in the coming months. This may be positive for growth in the medium term, and while some recent indicators have pointed to some softening in the growth dynamic, 1Q18 GDP numbers turned out stronger than expected at 1.1% y-o-y, translating to 4.4% q-o-q SAAR. Governmental consumption was particularly high, growing by 10.2% q-o-q SAAR, while private household consumption increased by only 2.4% y-o-y SAAR. Investment in the economy also expanded considerably, probably a positive impact from the most recent decline of political tensions in the region and which was reflected in both negative investment growth in 3Q17 as well as a lower growth rate in 4Q17. On average, 2H18 investment growth was generally flat. Interestingly, the latest PMI number for the manufacturing sector showed a slowing trend, standing at 48.4 in April, even lower than the level of 49.1 in March, already indicating a contraction in the economy. However, it seems that investments and most likely rising private household consumption will lead to ongoing strong growth in the economy during the coming quarters.
Some slight improvement in the economy has been taken into consideration as domestic developments show more optimism and external trade is forecast to pick up over the year. However, the prospect of increased trade protectionism could potentially pose some headwinds to the growth forecast.
Hence, South Korea’s 2018 GDP growth forecast remains at 2.7%, after growth of 3.1% y-o-y for 2017.
OECD Europe
Euro-zone While the Euro-zone has had strong growth in 2017 and is expected to continue on a solid trend in 2018, some of the dynamic has somewhat slowed down in 1Q18 based on the latest 1Q18 GDP data released by Euro-stat. After annualized quarterly growth of clearly above 2% in 2017, 1Q18 GDP growth decelerated to 1.7% in 1Q18. Overall, growth is expected to remain solid in most of the Euro-zone economies. The main challenges will not only be policy and banking sector-related issues, but also the potential for growing uncertainty amid the possible rise in trade protectionism, low income growth and the ongoing high sovereign debt levels across the region. Uncertainty about the Euro-zone’s economic development was also reflected recently in asset markets and was accompanied by some softening in lead and sentiment indicators. While greater details are not yet available, the coming GDP data releases will need to be carefully analysed. Monetary stimulus is expected to be reduced gradually in 2018 after the latest low inflation numbers and the slowdown in growth. It will continue to be an important element in the Euro-zone’s economic upswing, and a sharp tapering is not anticipated as long as inflation remains low and clearly below the ECB’s target. Among the main challenges that remain, political developments are at the forefront. This is particularly important as sovereign debt levels remain high across the Euro-zone, with the exception of particularly Germany. In Italy, the political situation is still in flux after the latest general election and as Italian banks are still challenged by weak balance sheets, this will need continued monitoring as growth remains low in the economy. While Germany is doing well, France’s latest 1Q18 number was lower than expected at only 1.0% q-o-q SAAR, clearly below last years’ average growth of 2.0%.

World Economy
16 OPEC Monthly Oil Market Report – May 2018
The positive trend in the labour market improvements stabilized in March. The unemployment rate remained at 8.5%, the same level as in February. Consumer confidence has also remained almost unchanged lately, with the balance of the European Commission’s consumer confidence indicator standing at 0.4 in April, slightly above the 0.1 in March and February, but clearly below the January level of 1.4. Retail sales have continued to clearly decelerate over the past months with the growth level now standing at 1.6% y-o-y in March, compared to 2.3% y-o-y in February, the fourth month of a consecutive slowdown. Industrial production grew by 2.9% y-o-y in February, and while still a good level, it is the lowest growth in four months.
Inflation fell again, a situation that will probably impact the ECB’s monetary policy, also in combination with the most recent slowing economic development. So far, the ECB continues QE purchases of €30 billion, which will run at least until September 2018, and could be continued beyond that time, if necessary. The main policy rate stands at 0%, and the rate for deposit facilities at -0.4%. Some areas of the Euro-zone’s banking sector remain weak, and the growth dynamic of the liquidity line has remained sluggish in the past months based on the latest available data. The lending of financial intermediaries to the private sector rose by only 1.4% in March, below the already sluggish 1.6% in February and the 1.9% level witnessed in January. This is now the lowest level of expansion since November 2016. So while inflation remains low and the extremely low interest rates are eating into households’ wealth levels, the stimulus is obviously becoming less effective.
Inflation fell back to stand at only 1.2% y-o-y in April, after a March growth rate of 1.3% y-o-y. While the labour market is improving and the unemployment rate fell, wage growth still remains muted, also given the still high unemployment levels in most economies in the Euro-zone. Core inflation – that is, the consumer price index (CPI), excluding energy, and food – remained very low, standing at 0.7% y-o-y in April, after 1.0% in March. So, all inflation indicators remain well below the ECB’s approximate 2% inflation target.
Graph 3 - 5: Euro-zone CPI and lending activity
In addition, the Euro-zone’s latest PMI indicators generally pointed downwards. The manufacturing PMI fell in April, standing at 56.2, compared to March’s 56.6. The important PMI for the services sector, which constitutes the largest sector in the Euro-zone, fell to 54.7 in April, compared to 54.9 in March. Given the most recent larger-than-expected weakness of growth momentum in the Euro-zone, the GDP growth forecast has been revised down to 2.2%, compared to 2.3% in last month’s report. This compares to 2017 growth of 2.5%. Political uncertainties, Brexit procedures, weakness in the banking sector, as well as monetary policies remain important factors to monitor.
Graph 3 - 6: Euro-zone IHS Markit PMIs
-4-3-2-10123
-1
0
1
2
3Fe
b 13
Jun
13O
ct 1
3Fe
b 14
Jun
14O
ct 1
4Fe
b 15
Jun
15O
ct 1
5Fe
b 16
Jun
16O
ct 1
6Fe
b 17
Jun
17O
ct 1
7Fe
b 18
CPI (LHS) MFI lending (RHS)
Sources: Statistical Office of the European Communities, European Central Bank and Haver Analytics.
% change y-o-y % change y-o-y
54.756.2
48
50
52
54
56
58
60
62
Apr 1
7
May
17
Jun
17
Jul 1
7
Aug
17
Sep
17
Oct
17
Nov
17
Dec
17
Jan
18
Feb
18
Mar
18
Apr 1
8
Index
Sources: IHS Markit and Haver Analytics.
Services PMI
Manufacturing PMI
World Economy
OPEC Monthly Oil Market Report – May 2018 17
UK After the release of 1Q18 GDP growth estimates of only 0.4% q-o-q SAAR, it is clear that the UK is not only affected by some slowdown in economic activity in the EU, but also Brexit is very likely having a further considerable negative effect on the UK’s economy. Therefore, the decision to raise interest rates by the Bank of England may be postponed further as also inflation is coming down again and growth is stuttering. This will continue to keep the pound sterling from rising considerably, a potential support for further exports.
The unemployment rate remained surprisingly low, at 4.1% in January, even below the already low 4.2% witnessed in December, as per the latest available data. However, it is expected that this trend will reverse in the coming months. While slowing down, wage growth is holding up relatively well, rising by 2.4% y-o-y in February, after 2.8% in January and 3.2% y-o-y in December. At the same time, inflation is challenging real income growth, which remains negative due to the fact that inflation is rising at an even higher level of 2.5% y-o-y in March, 2.7% in February and 3.0% in January. These inflation rates may continue to negatively impact potential future consumption and as a consequence real wage growth.
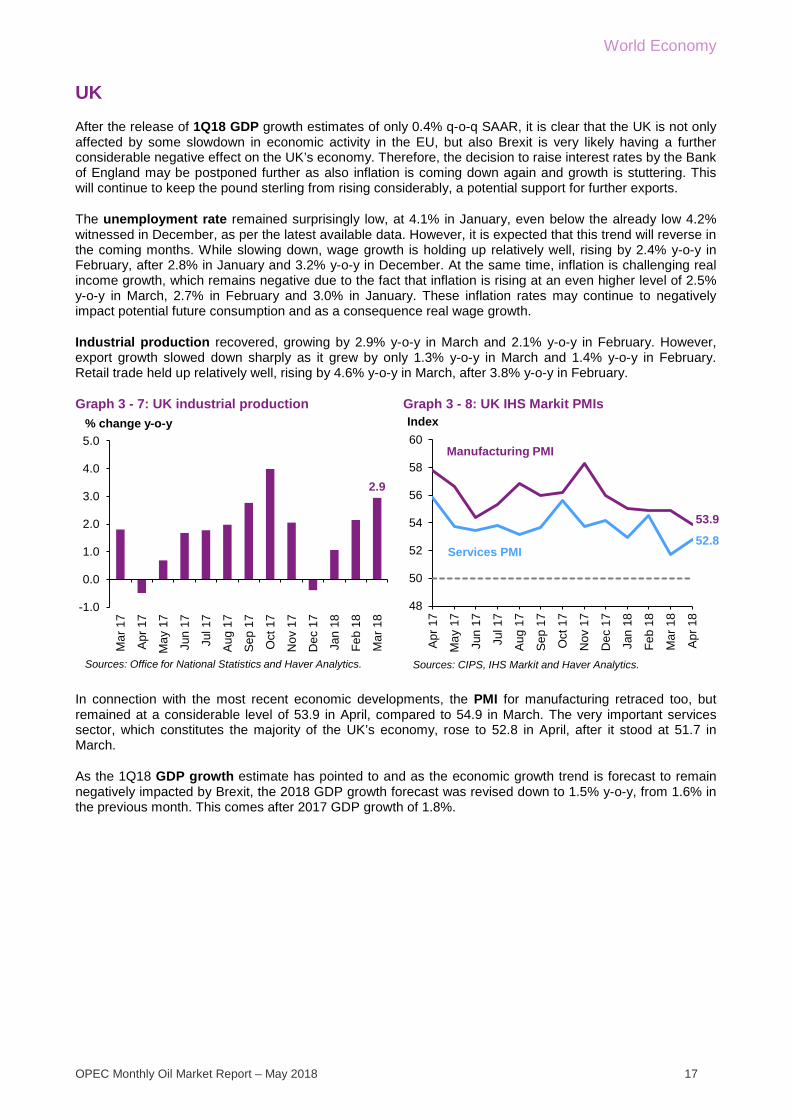
Industrial production recovered, growing by 2.9% y-o-y in March and 2.1% y-o-y in February. However, export growth slowed down sharply as it grew by only 1.3% y-o-y in March and 1.4% y-o-y in February. Retail trade held up relatively well, rising by 4.6% y-o-y in March, after 3.8% y-o-y in February.
Graph 3 - 7: UK industrial production Graph 3 - 8: UK IHS Markit PMIs
In connection with the most recent economic developments, the PMI for manufacturing retraced too, but remained at a considerable level of 53.9 in April, compared to 54.9 in March. The very important services sector, which constitutes the majority of the UK’s economy, rose to 52.8 in April, after it stood at 51.7 in March.
As the 1Q18 GDP growth estimate has pointed to and as the economic growth trend is forecast to remain negatively impacted by Brexit, the 2018 GDP growth forecast was revised down to 1.5% y-o-y, from 1.6% in the previous month. This comes after 2017 GDP growth of 1.8%.
2.9
-1.0
0.0
1.0
2.0
3.0
4.0
5.0
Mar
17
Apr 1
7
May
17
Jun
17
Jul 1
7
Aug
17
Sep
17
Oct
17
Nov
17
Dec
17
Jan
18
Feb
18
Mar
18
Sources: Office for National Statistics and Haver Analytics.
% change y-o-y
52.8
53.9
48
50
52
54
56
58
60A
pr 1
7
May
17
Jun
17
Jul 1
7
Aug
17
Sep
17
Oct
17
Nov
17
Dec
17
Jan
18
Feb
18
Mar
18
Apr
18
Index
Sources: CIPS, IHS Markit and Haver Analytics.
Services PMI
Manufacturing PMI
World Economy
18 OPEC Monthly Oil Market Report – May 2018
Recently weakening global growth trend?
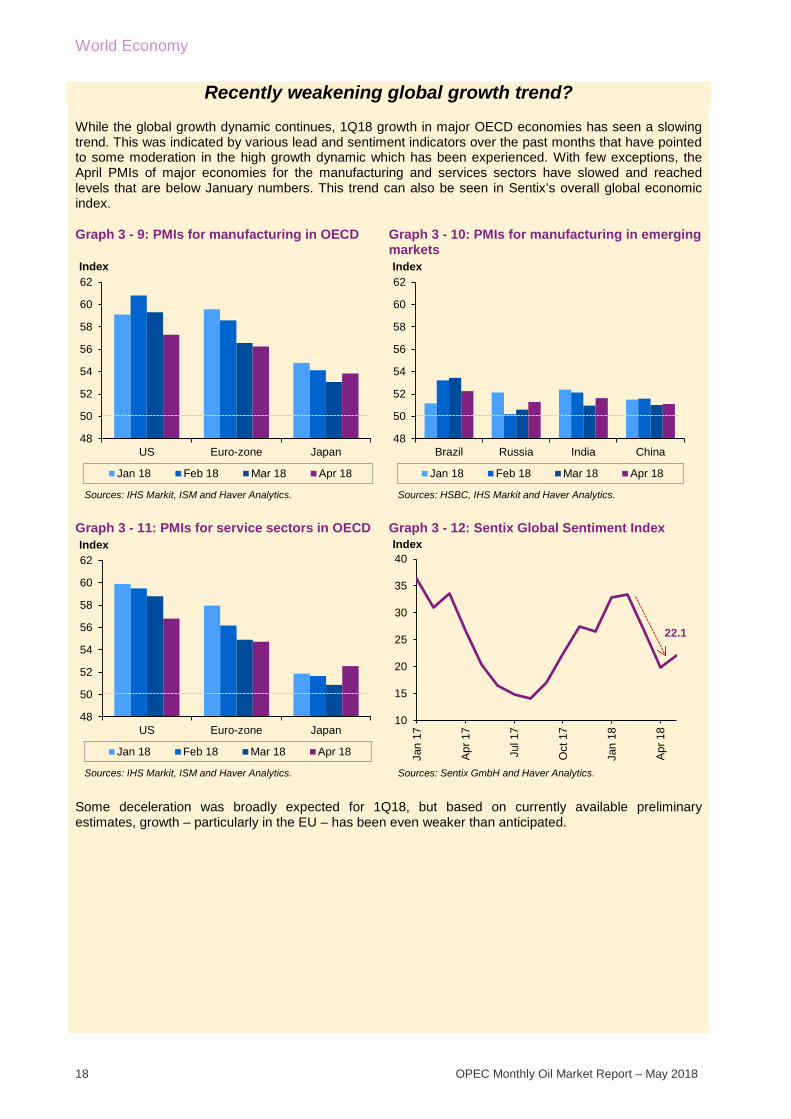
While the global growth dynamic continues, 1Q18 growth in major OECD economies has seen a slowing trend. This was indicated by various lead and sentiment indicators over the past months that have pointed to some moderation in the high growth dynamic which has been experienced. With few exceptions, the April PMIs of major economies for the manufacturing and services sectors have slowed and reached levels that are below January numbers. This trend can also be seen in Sentix’s overall global economic index.
Graph 3 - 9: PMIs for manufacturing in OECD Graph 3 - 10: PMIs for manufacturing in emerging markets
Graph 3 - 11: PMIs for service sectors in OECD Graph 3 - 12: Sentix Global Sentiment Index
Some deceleration was broadly expected for 1Q18, but based on currently available preliminary estimates, growth – particularly in the EU – has been even weaker than anticipated.
48
50
52
54
56
58
60
62
US Euro-zone Japan
Index
Jan 18 Feb 18 Mar 18 Apr 18
Sources: IHS Markit, ISM and Haver Analytics.
48
50
52
54
56
58
60
62
Brazil Russia India China
Index
Jan 18 Feb 18 Mar 18 Apr 18
Sources: HSBC, IHS Markit and Haver Analytics.
48
50
52
54
56
58
60
62
US Euro-zone Japan
Index
Jan 18 Feb 18 Mar 18 Apr 18
Sources: IHS Markit, ISM and Haver Analytics.
22.1
10
15
20
25
30
35
40
Jan
17
Apr 1
7
Jul 1
7
Oct
17
Jan
18
Apr 1
8
Index
Sources: Sentix GmbH and Haver Analytics.
World Economy
OPEC Monthly Oil Market Report – May 2018 19
Graph 3 - 13: US GDP quarterly growth, q-o-q, seasonally adjusted annual rate (SAAR)
Graph 3 - 14: Euro-zone and UK GDP quarterly growth, q-o-q, SAAR
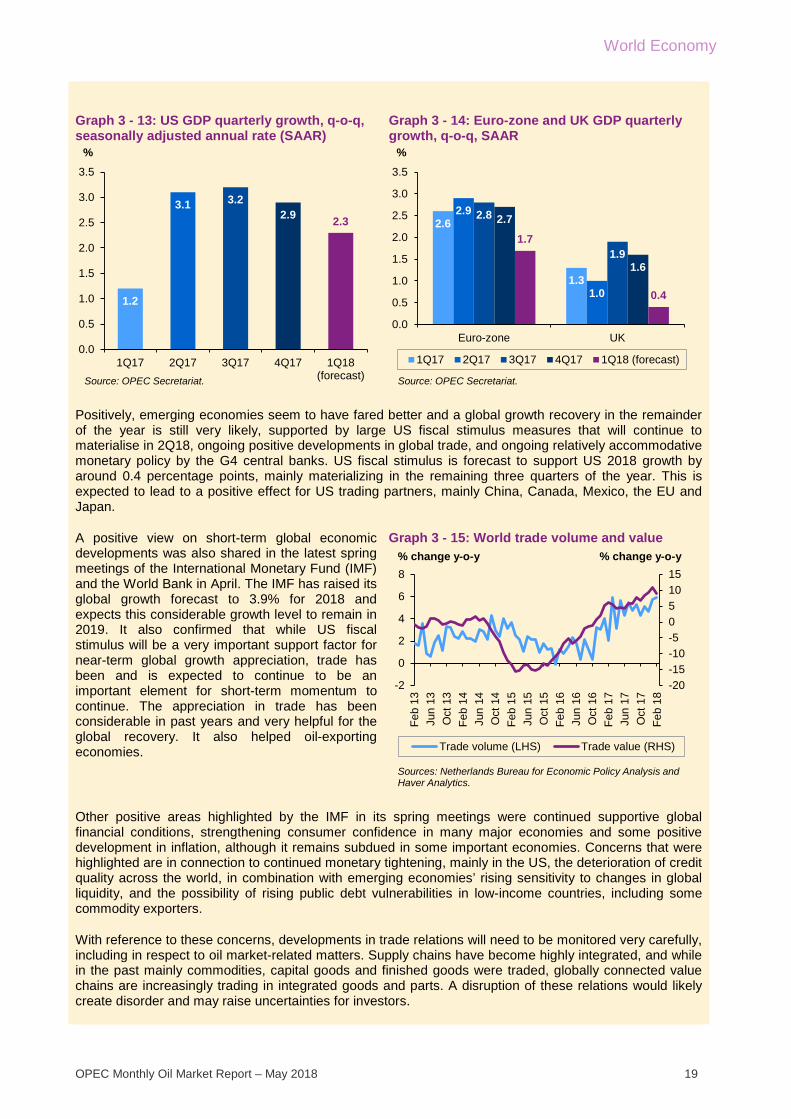
Positively, emerging economies seem to have fared better and a global growth recovery in the remainder of the year is still very likely, supported by large US fiscal stimulus measures that will continue to materialise in 2Q18, ongoing positive developments in global trade, and ongoing relatively accommodative monetary policy by the G4 central banks. US fiscal stimulus is forecast to support US 2018 growth by around 0.4 percentage points, mainly materializing in the remaining three quarters of the year. This is expected to lead to a positive effect for US trading partners, mainly China, Canada, Mexico, the EU and Japan.
A positive view on short-term global economic developments was also shared in the latest spring meetings of the International Monetary Fund (IMF) and the World Bank in April. The IMF has raised its global growth forecast to 3.9% for 2018 and expects this considerable growth level to remain in 2019. It also confirmed that while US fiscal stimulus will be a very important support factor for near-term global growth appreciation, trade has been and is expected to continue to be an important element for short-term momentum to continue. The appreciation in trade has been considerable in past years and very helpful for the global recovery. It also helped oil-exporting economies.
Graph 3 - 15: World trade volume and value
Other positive areas highlighted by the IMF in its spring meetings were continued supportive global financial conditions, strengthening consumer confidence in many major economies and some positive development in inflation, although it remains subdued in some important economies. Concerns that were highlighted are in connection to continued monetary tightening, mainly in the US, the deterioration of credit quality across the world, in combination with emerging economies’ rising sensitivity to changes in global liquidity, and the possibility of rising public debt vulnerabilities in low-income countries, including some commodity exporters.
With reference to these concerns, developments in trade relations will need to be monitored very carefully, including in respect to oil market-related matters. Supply chains have become highly integrated, and while in the past mainly commodities, capital goods and finished goods were traded, globally connected value chains are increasingly trading in integrated goods and parts. A disruption of these relations would likely create disorder and may raise uncertainties for investors.
1.2
3.1 3.22.9 2.3
0.0
0.5
1.0
1.5
2.0
2.5
3.0
3.5
1Q17 2Q17 3Q17 4Q17 1Q18(forecast)
%
Source: OPEC Secretariat.
2.6
1.3
2.9
1.0
2.8
1.9
2.7
1.6
1.7
0.4
0.0
0.5
1.0
1.5
2.0
2.5
3.0
3.5
Euro-zone UK
%
1Q17 2Q17 3Q17 4Q17 1Q18 (forecast)
Source: OPEC Secretariat.
-20-15-10-5051015
-2
0
2
4
6
8
Feb
13Ju
n 13
Oct
13
Feb
14Ju
n 14
Oct
14
Feb
15Ju
n 15
Oct
15
Feb
16Ju
n 16
Oct
16
Feb
17Ju
n 17
Oct
17
Feb
18
Trade volume (LHS) Trade value (RHS)
Sources: Netherlands Bureau for Economic Policy Analysis and Haver Analytics.
% change y-o-y % change y-o-y
World Economy
20 OPEC Monthly Oil Market Report – May 2018
The latest rounds of US sanctions on Russia, tariffs on Chinese products in combination with considerable requests by the US in trade negotiations with China, US tariffs on steel and aluminium, prolonged North American Free Trade Agreement (NAFTA) negotiations, as well as the US withdrawal from the Joint Comprehensive Plan of Action (JCPOA) with IR Iran all point to rising uncertainty. So far the impact on the global economy has been minor and negligible, but the build-up of potentially disruptive concerns has increased.
Moreover, the challenges, mainly stemming from imbalances in the financial system, need to be carefully monitored, as monetary tightening may continue and could create some unexpected consequences. Volatility has risen, 10-year treasury bonds are moving towards 3%, and the OIS-Libor spread remains relatively high. With a rising budget deficit in the US and that country’s inflation well supported by fiscal stimulus measures, continuing US monetary tightening is likely.
Graph 3 - 16: CBOE market volatility index Graph 3 - 17: US 10-year treasury bond yield at constant maturity
In conclusion, global growth momentum seems to be well established in the short-term, and the most recent weakness, seen mainly in some OECD economies, may only be temporary. Major emerging economies’ growth dynamics have thus far counterbalanced this soft spot, and global growth may recover in the remainder of the year due to US fiscal stimulus and a rebound in OECD growth. However, after a period of a considerable growth, uncertainties seem to be on the rise.
Non-OECD
BRICs
Table 3 - 2: Summary of macroeconomic performance of BRIC countries, 2017-2018*
15.9
8
10
12
14
16
18
20
22
Apr 1
6
Jun
16
Aug
16
Oct
16
Dec
16
Feb
17
Apr 1
7
Jun
17
Aug
17
Oct
17
Dec
17
Feb
18
Apr 1
8Index
Sources: Wall Street Journal and Haver Analytics.
3.0
1.41.61.82.02.22.42.62.83.03.2
Jul 1
6
Sep
16
Nov
16
Jan
17
Mar
17
May
17
Jul 1
7
Sep
17
Nov
17
Jan
18
Mar
18
%
Sources: US Treasury and Haver Analytics.
2017 2018 2017 2018 2017 2018 2017 2018 2017 2018
Brazil 1.0 2.1 3.4 3.5 -9.8 -35.0 -8.0 -7.0 74.0 78.1Russia 1.5 1.8 3.7 3.5 40.2 51.8 -1.4 -1.0 11.4 11.7India 6.3 7.3 3.3 5.1 -39.1 -37.6 -3.5 -3.5 50.0 49.2China 6.9 6.5 1.5 2.4 172.4 193.7 -3.7 -3.5 18.2 20.3
Note: * 2017 = Estimate and 2018 = Forecast.Sources: Consensus Economics, Economic Intelligence Unit, Financial Times, OPEC Secretariat and Oxford.
GDP growth rate,%
Consumer price index,
% change y-o-y
Current account balance, US$ bn
Government fiscal balance,
% of GDP
Net public debt, % of GDP
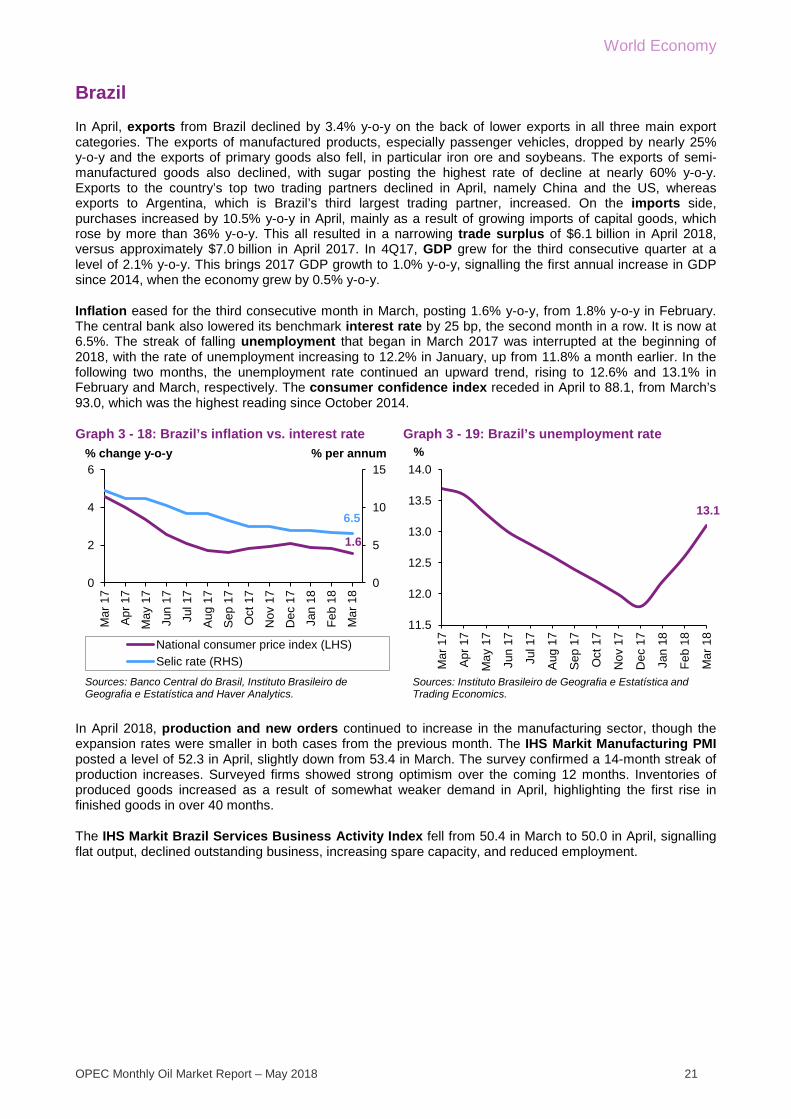
World Economy
OPEC Monthly Oil Market Report – May 2018 21
Brazil In April, exports from Brazil declined by 3.4% y-o-y on the back of lower exports in all three main export categories. The exports of manufactured products, especially passenger vehicles, dropped by nearly 25% y-o-y and the exports of primary goods also fell, in particular iron ore and soybeans. The exports of semi-manufactured goods also declined, with sugar posting the highest rate of decline at nearly 60% y-o-y. Exports to the country’s top two trading partners declined in April, namely China and the US, whereas exports to Argentina, which is Brazil’s third largest trading partner, increased. On the imports side, purchases increased by 10.5% y-o-y in April, mainly as a result of growing imports of capital goods, which rose by more than 36% y-o-y. This all resulted in a narrowing trade surplus of $6.1 billion in April 2018, versus approximately $7.0 billion in April 2017. In 4Q17, GDP grew for the third consecutive quarter at a level of 2.1% y-o-y. This brings 2017 GDP growth to 1.0% y-o-y, signalling the first annual increase in GDP since 2014, when the economy grew by 0.5% y-o-y.
Inflation eased for the third consecutive month in March, posting 1.6% y-o-y, from 1.8% y-o-y in February. The central bank also lowered its benchmark interest rate by 25 bp, the second month in a row. It is now at 6.5%. The streak of falling unemployment that began in March 2017 was interrupted at the beginning of 2018, with the rate of unemployment increasing to 12.2% in January, up from 11.8% a month earlier. In the following two months, the unemployment rate continued an upward trend, rising to 12.6% and 13.1% in February and March, respectively. The consumer confidence index receded in April to 88.1, from March’s 93.0, which was the highest reading since October 2014.
Graph 3 - 18: Brazil’s inflation vs. interest rate Graph 3 - 19: Brazil’s unemployment rate
In April 2018, production and new orders continued to increase in the manufacturing sector, though the expansion rates were smaller in both cases from the previous month. The IHS Markit Manufacturing PMI posted a level of 52.3 in April, slightly down from 53.4 in March. The survey confirmed a 14-month streak of production increases. Surveyed firms showed strong optimism over the coming 12 months. Inventories of produced goods increased as a result of somewhat weaker demand in April, highlighting the first rise in finished goods in over 40 months.
The IHS Markit Brazil Services Business Activity Index fell from 50.4 in March to 50.0 in April, signalling flat output, declined outstanding business, increasing spare capacity, and reduced employment.
1.6
6.5
0
5
10
15
0
2
4
6
Mar
17
Apr 1
7
May
17
Jun
17
Jul 1
7
Aug
17
Sep
17
Oct
17
Nov
17
Dec
17
Jan
18
Feb
18
Mar
18
National consumer price index (LHS)Selic rate (RHS)
Sources: Banco Central do Brasil, Instituto Brasileiro de Geografia e Estatística and Haver Analytics.
% change y-o-y % per annum
13.1
11.5
12.0
12.5
13.0
13.5
14.0
Mar
17
Apr 1
7
May
17
Jun
17
Jul 1
7
Aug
17
Sep
17
Oct
17
Nov
17
Dec
17
Jan
18
Feb
18
Mar
18
%
Sources: Instituto Brasileiro de Geografia e Estatística and Trading Economics.
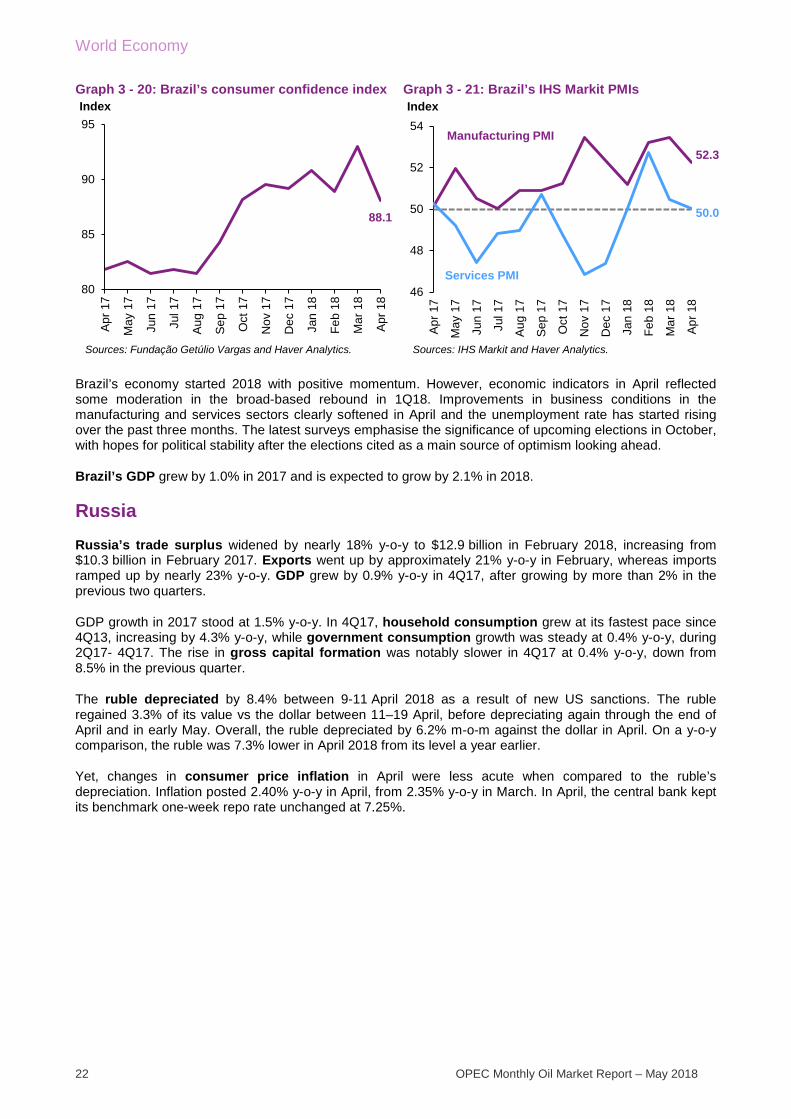
World Economy
22 OPEC Monthly Oil Market Report – May 2018
Graph 3 - 20: Brazil’s consumer confidence index Graph 3 - 21: Brazil’s IHS Markit PMIs
Brazil’s economy started 2018 with positive momentum. However, economic indicators in April reflected some moderation in the broad-based rebound in 1Q18. Improvements in business conditions in the manufacturing and services sectors clearly softened in April and the unemployment rate has started rising over the past three months. The latest surveys emphasise the significance of upcoming elections in October, with hopes for political stability after the elections cited as a main source of optimism looking ahead.
Brazil’s GDP grew by 1.0% in 2017 and is expected to grow by 2.1% in 2018.
Russia Russia’s trade surplus widened by nearly 18% y-o-y to $12.9 billion in February 2018, increasing from $10.3 billion in February 2017. Exports went up by approximately 21% y-o-y in February, whereas imports ramped up by nearly 23% y-o-y. GDP grew by 0.9% y-o-y in 4Q17, after growing by more than 2% in the previous two quarters.
GDP growth in 2017 stood at 1.5% y-o-y. In 4Q17, household consumption grew at its fastest pace since 4Q13, increasing by 4.3% y-o-y, while government consumption growth was steady at 0.4% y-o-y, during 2Q17- 4Q17. The rise in gross capital formation was notably slower in 4Q17 at 0.4% y-o-y, down from 8.5% in the previous quarter.
The ruble depreciated by 8.4% between 9-11 April 2018 as a result of new US sanctions. The ruble regained 3.3% of its value vs the dollar between 11–19 April, before depreciating again through the end of April and in early May. Overall, the ruble depreciated by 6.2% m-o-m against the dollar in April. On a y-o-y comparison, the ruble was 7.3% lower in April 2018 from its level a year earlier.
Yet, changes in consumer price inflation in April were less acute when compared to the ruble’s depreciation. Inflation posted 2.40% y-o-y in April, from 2.35% y-o-y in March. In April, the central bank kept its benchmark one-week repo rate unchanged at 7.25%.
88.1
80
85
90
95
Apr 1
7
May
17
Jun
17
Jul 1
7
Aug
17
Sep
17
Oct
17
Nov
17
Dec
17
Jan
18
Feb
18
Mar
18
Apr 1
8
Index
Sources: Fundação Getúlio Vargas and Haver Analytics.
52.3
50.0
46
48
50
52
54
Apr 1
7
May
17
Jun
17
Jul 1
7
Aug
17
Sep
17
Oct
17
Nov
17
Dec
17
Jan
18
Feb
18
Mar
18
Apr 1
8
Index
Sources: IHS Markit and Haver Analytics.
Services PMI
Manufacturing PMI
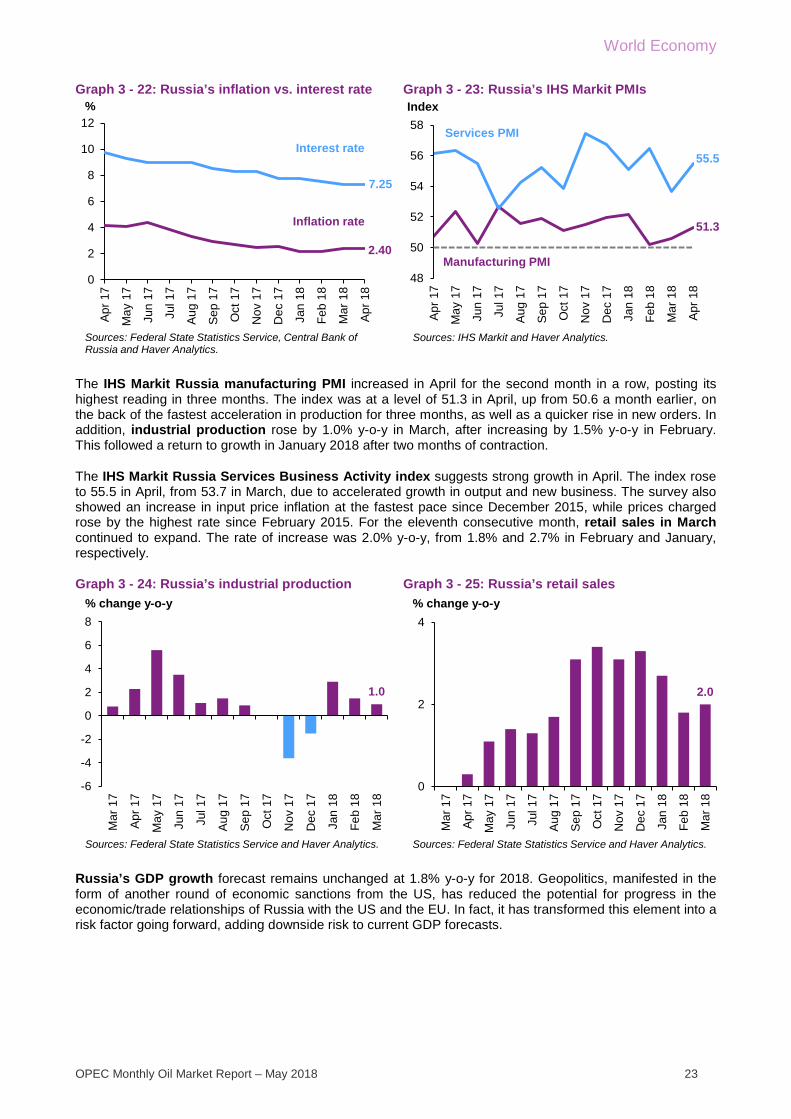
World Economy
OPEC Monthly Oil Market Report – May 2018 23
Graph 3 - 22: Russia’s inflation vs. interest rate Graph 3 - 23: Russia’s IHS Markit PMIs
The IHS Markit Russia manufacturing PMI increased in April for the second month in a row, posting its highest reading in three months. The index was at a level of 51.3 in April, up from 50.6 a month earlier, on the back of the fastest acceleration in production for three months, as well as a quicker rise in new orders. In addition, industrial production rose by 1.0% y-o-y in March, after increasing by 1.5% y-o-y in February. This followed a return to growth in January 2018 after two months of contraction.
The IHS Markit Russia Services Business Activity index suggests strong growth in April. The index rose to 55.5 in April, from 53.7 in March, due to accelerated growth in output and new business. The survey also showed an increase in input price inflation at the fastest pace since December 2015, while prices charged rose by the highest rate since February 2015. For the eleventh consecutive month, retail sales in March continued to expand. The rate of increase was 2.0% y-o-y, from 1.8% and 2.7% in February and January, respectively.
Graph 3 - 24: Russia’s industrial production Graph 3 - 25: Russia’s retail sales
Russia’s GDP growth forecast remains unchanged at 1.8% y-o-y for 2018. Geopolitics, manifested in the form of another round of economic sanctions from the US, has reduced the potential for progress in the economic/trade relationships of Russia with the US and the EU. In fact, it has transformed this element into a risk factor going forward, adding downside risk to current GDP forecasts.
2.40
7.25
0
2
4
6
8
10
12Ap
r 17
May
17
Jun
17
Jul 1
7
Aug
17
Sep
17
Oct
17
Nov
17
Dec
17
Jan
18
Feb
18
Mar
18
Apr 1
8
%
Sources: Federal State Statistics Service, Central Bank of Russia and Haver Analytics.
Inflation rate
Interest rate
51.3
55.5
48
50
52
54
56
58
Apr 1
7
May
17
Jun
17
Jul 1
7
Aug
17
Sep
17
Oct
17
Nov
17
Dec
17
Jan
18
Feb
18
Mar
18
Apr 1
8
Index
Sources: IHS Markit and Haver Analytics.
Services PMI
Manufacturing PMI
1.0
-6
-4
-2
0
2
4
6
8
Mar
17
Apr 1
7
May
17
Jun
17
Jul 1
7
Aug
17
Sep
17
Oct
17
Nov
17
Dec
17
Jan
18
Feb
18
Mar
18
% change y-o-y
Sources: Federal State Statistics Service and Haver Analytics.
2.0
0
2
4
Mar
17
Apr 1
7
May
17
Jun
17
Jul 1
7
Aug
17
Sep
17
Oct
17
Nov
17
Dec
17
Jan
18
Feb
18
Mar
18
% change y-o-y
Sources: Federal State Statistics Service and Haver Analytics.
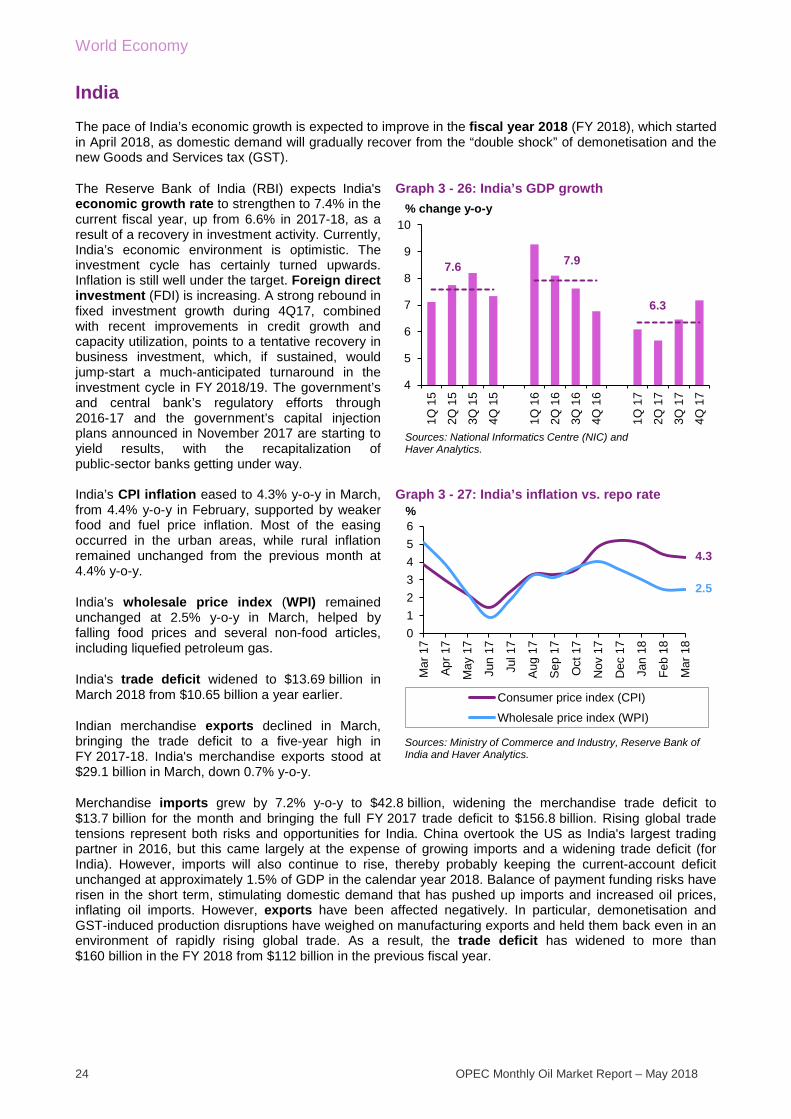
World Economy
24 OPEC Monthly Oil Market Report – May 2018
India The pace of India’s economic growth is expected to improve in the fiscal year 2018 (FY 2018), which started in April 2018, as domestic demand will gradually recover from the “double shock” of demonetisation and the new Goods and Services tax (GST).
The Reserve Bank of India (RBI) expects India's economic growth rate to strengthen to 7.4% in the current fiscal year, up from 6.6% in 2017-18, as a result of a recovery in investment activity. Currently, India’s economic environment is optimistic. The investment cycle has certainly turned upwards. Inflation is still well under the target. Foreign direct investment (FDI) is increasing. A strong rebound in fixed investment growth during 4Q17, combined with recent improvements in credit growth and capacity utilization, points to a tentative recovery in business investment, which, if sustained, would jump-start a much-anticipated turnaround in the investment cycle in FY 2018/19. The government’s and central bank’s regulatory efforts through 2016-17 and the government’s capital injection plans announced in November 2017 are starting to yield results, with the recapitalization of public-sector banks getting under way.
Graph 3 - 26: India’s GDP growth
India’s CPI inflation eased to 4.3% y-o-y in March, from 4.4% y-o-y in February, supported by weaker food and fuel price inflation. Most of the easing occurred in the urban areas, while rural inflation remained unchanged from the previous month at 4.4% y-o-y.
India’s wholesale price index (WPI) remained unchanged at 2.5% y-o-y in March, helped by falling food prices and several non-food articles, including liquefied petroleum gas.
India's trade deficit widened to $13.69 billion in March 2018 from $10.65 billion a year earlier.
Indian merchandise exports declined in March, bringing the trade deficit to a five-year high in FY 2017-18. India's merchandise exports stood at $29.1 billion in March, down 0.7% y-o-y.
Graph 3 - 27: India’s inflation vs. repo rate
Merchandise imports grew by 7.2% y-o-y to $42.8 billion, widening the merchandise trade deficit to $13.7 billion for the month and bringing the full FY 2017 trade deficit to $156.8 billion. Rising global trade tensions represent both risks and opportunities for India. China overtook the US as India's largest trading partner in 2016, but this came largely at the expense of growing imports and a widening trade deficit (for India). However, imports will also continue to rise, thereby probably keeping the current-account deficit unchanged at approximately 1.5% of GDP in the calendar year 2018. Balance of payment funding risks have risen in the short term, stimulating domestic demand that has pushed up imports and increased oil prices, inflating oil imports. However, exports have been affected negatively. In particular, demonetisation and GST-induced production disruptions have weighed on manufacturing exports and held them back even in an environment of rapidly rising global trade. As a result, the trade deficit has widened to more than $160 billion in the FY 2018 from $112 billion in the previous fiscal year.
7.6 7.9
6.3
4
5
6
7
8
9
10
1Q 1
5
2Q 1
5
3Q 1
5
4Q 1
5
1Q 1
6
2Q 1
6
3Q 1
6
4Q 1
6
1Q 1
7
2Q 1
7
3Q 1
7
4Q 1
7
Sources: National Informatics Centre (NIC) and Haver Analytics.
% change y-o-y
4.3
2.5
0123456
Mar
17
Apr 1
7
May
17
Jun
17
Jul 1
7
Aug
17
Sep
17
Oct
17
Nov
17
Dec
17
Jan
18
Feb
18
Mar
18
%
Consumer price index (CPI)
Wholesale price index (WPI)
Sources: Ministry of Commerce and Industry, Reserve Bank of India and Haver Analytics.
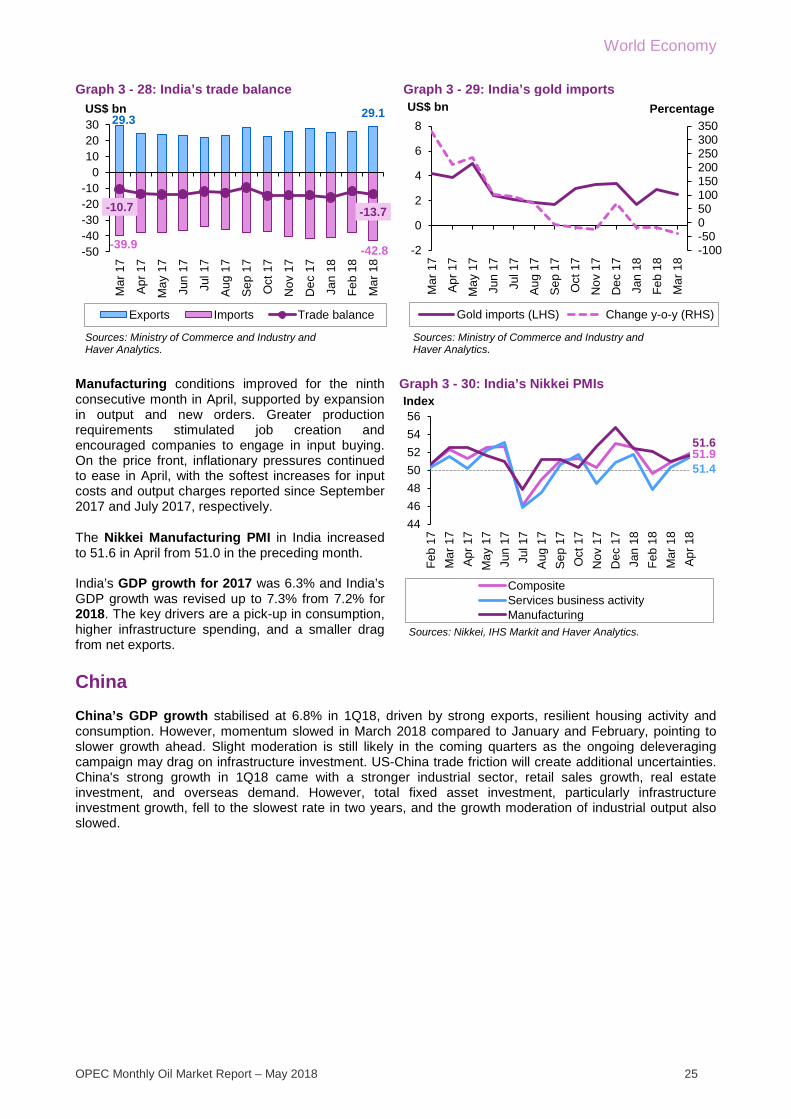
World Economy
OPEC Monthly Oil Market Report – May 2018 25
Graph 3 - 28: India’s trade balance Graph 3 - 29: India’s gold imports
Manufacturing conditions improved for the ninth consecutive month in April, supported by expansion in output and new orders. Greater production requirements stimulated job creation and encouraged companies to engage in input buying. On the price front, inflationary pressures continued to ease in April, with the softest increases for input costs and output charges reported since September 2017 and July 2017, respectively.
The Nikkei Manufacturing PMI in India increased to 51.6 in April from 51.0 in the preceding month. India’s GDP growth for 2017 was 6.3% and India’s GDP growth was revised up to 7.3% from 7.2% for 2018. The key drivers are a pick-up in consumption, higher infrastructure spending, and a smaller drag from net exports.
Graph 3 - 30: India’s Nikkei PMIs
China China’s GDP growth stabilised at 6.8% in 1Q18, driven by strong exports, resilient housing activity and consumption. However, momentum slowed in March 2018 compared to January and February, pointing to slower growth ahead. Slight moderation is still likely in the coming quarters as the ongoing deleveraging campaign may drag on infrastructure investment. US-China trade friction will create additional uncertainties. China's strong growth in 1Q18 came with a stronger industrial sector, retail sales growth, real estate investment, and overseas demand. However, total fixed asset investment, particularly infrastructure investment growth, fell to the slowest rate in two years, and the growth moderation of industrial output also slowed.
29.3 29.1
-39.9 -42.8
-10.7 -13.7
-50-40-30-20-10
0102030
Mar
17
Apr 1
7
May
17
Jun
17
Jul 1
7
Aug
17
Sep
17
Oct
17
Nov
17
Dec
17
Jan
18
Feb
18
Mar
18
Exports Imports Trade balance
US$ bn
Sources: Ministry of Commerce and Industry and Haver Analytics.
-100-50050100150200250300350
-2
0
2
4
6
8
Mar
17
Apr 1
7
May
17
Jun
17
Jul 1
7
Aug
17
Sep
17
Oct
17
Nov
17
Dec
17
Jan
18
Feb
18
Mar
18
US$ bn
Gold imports (LHS) Change y-o-y (RHS)
Sources: Ministry of Commerce and Industry and Haver Analytics.
Percentage
51.951.4
51.6
44464850525456
Feb
17M
ar 1
7Ap
r 17
May
17
Jun
17Ju
l 17
Aug
17Se
p 17
Oct
17
Nov
17
Dec
17
Jan
18Fe
b 18
Mar
18
Apr 1
8
Index
CompositeServices business activityManufacturing
Sources: Nikkei, IHS Markit and Haver Analytics.
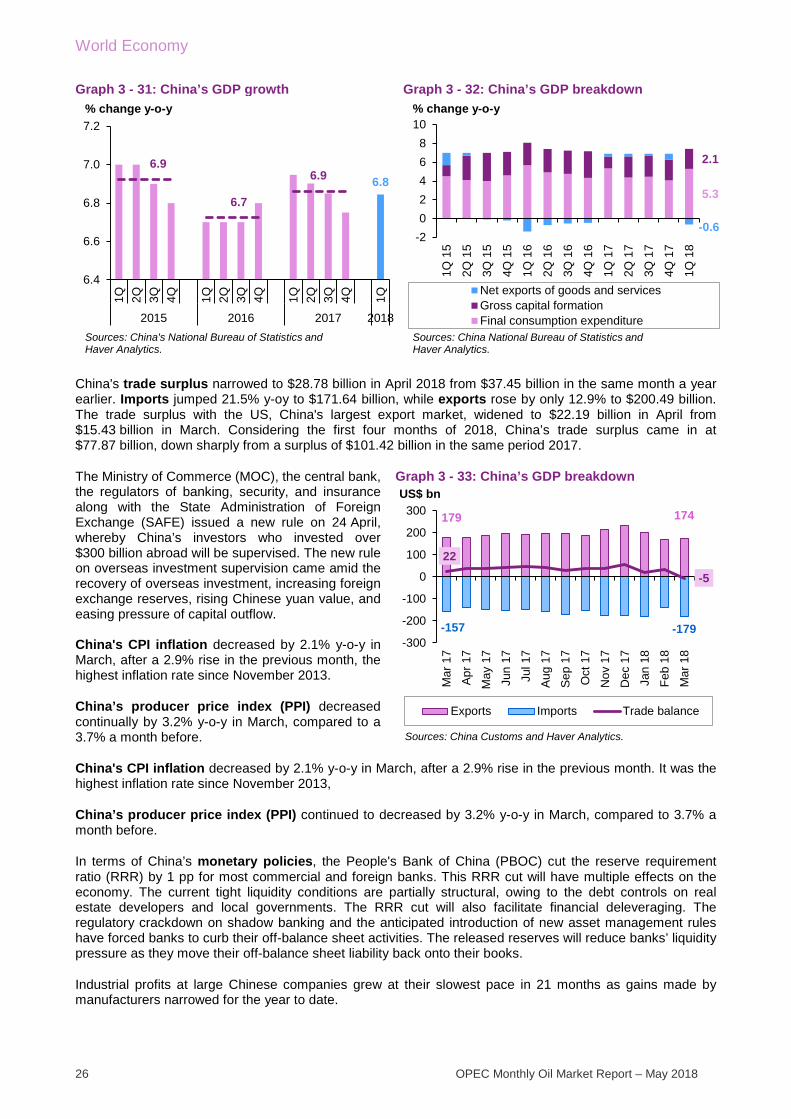
World Economy
26 OPEC Monthly Oil Market Report – May 2018
Graph 3 - 31: China’s GDP growth Graph 3 - 32: China’s GDP breakdown
China's trade surplus narrowed to $28.78 billion in April 2018 from $37.45 billion in the same month a year earlier. Imports jumped 21.5% y-oy to $171.64 billion, while exports rose by only 12.9% to $200.49 billion. The trade surplus with the US, China's largest export market, widened to $22.19 billion in April from $15.43 billion in March. Considering the first four months of 2018, China’s trade surplus came in at $77.87 billion, down sharply from a surplus of $101.42 billion in the same period 2017.
The Ministry of Commerce (MOC), the central bank, the regulators of banking, security, and insurance along with the State Administration of Foreign Exchange (SAFE) issued a new rule on 24 April, whereby China’s investors who invested over $300 billion abroad will be supervised. The new rule on overseas investment supervision came amid the recovery of overseas investment, increasing foreign exchange reserves, rising Chinese yuan value, and easing pressure of capital outflow. China's CPI inflation decreased by 2.1% y-o-y in March, after a 2.9% rise in the previous month, the highest inflation rate since November 2013.
China’s producer price index (PPI) decreased continually by 3.2% y-o-y in March, compared to a 3.7% a month before.
Graph 3 - 33: China’s GDP breakdown
China's CPI inflation decreased by 2.1% y-o-y in March, after a 2.9% rise in the previous month. It was the highest inflation rate since November 2013,
China’s producer price index (PPI) continued to decreased by 3.2% y-o-y in March, compared to 3.7% a month before.
In terms of China’s monetary policies, the People's Bank of China (PBOC) cut the reserve requirement ratio (RRR) by 1 pp for most commercial and foreign banks. This RRR cut will have multiple effects on the economy. The current tight liquidity conditions are partially structural, owing to the debt controls on real estate developers and local governments. The RRR cut will also facilitate financial deleveraging. The regulatory crackdown on shadow banking and the anticipated introduction of new asset management rules have forced banks to curb their off-balance sheet activities. The released reserves will reduce banks’ liquidity pressure as they move their off-balance sheet liability back onto their books.
Industrial profits at large Chinese companies grew at their slowest pace in 21 months as gains made by manufacturers narrowed for the year to date.
6.86.9
6.7
6.9
6.4
6.6
6.8
7.0
7.21Q 2Q 3Q 4Q 1Q 2Q 3Q 4Q 1Q 2Q 3Q 4Q 1Q
2015 2016 2017 2018Sources: China's National Bureau of Statistics and Haver Analytics.
% change y-o-y
5.3
2.1
-0.6-202468
10
1Q 1
5
2Q 1
5
3Q 1
5
4Q 1
5
1Q 1
6
2Q 1
6
3Q 1
6
4Q 1
6
1Q 1
7
2Q 1
7
3Q 1
7
4Q 1
7
1Q 1
8
Net exports of goods and servicesGross capital formationFinal consumption expenditure
Sources: China National Bureau of Statistics andHaver Analytics.
% change y-o-y
179 174
-157 -179
22
-5
-300
-200
-100
0
100
200
300
Mar
17
Apr 1
7M
ay 1
7Ju
n 17
Jul 1
7Au
g 17
Sep
17O
ct 1
7N
ov 1
7D
ec 1
7Ja
n 18
Feb
18M
ar 1
8
US$ bn
Exports Imports Trade balance
Sources: China Customs and Haver Analytics.
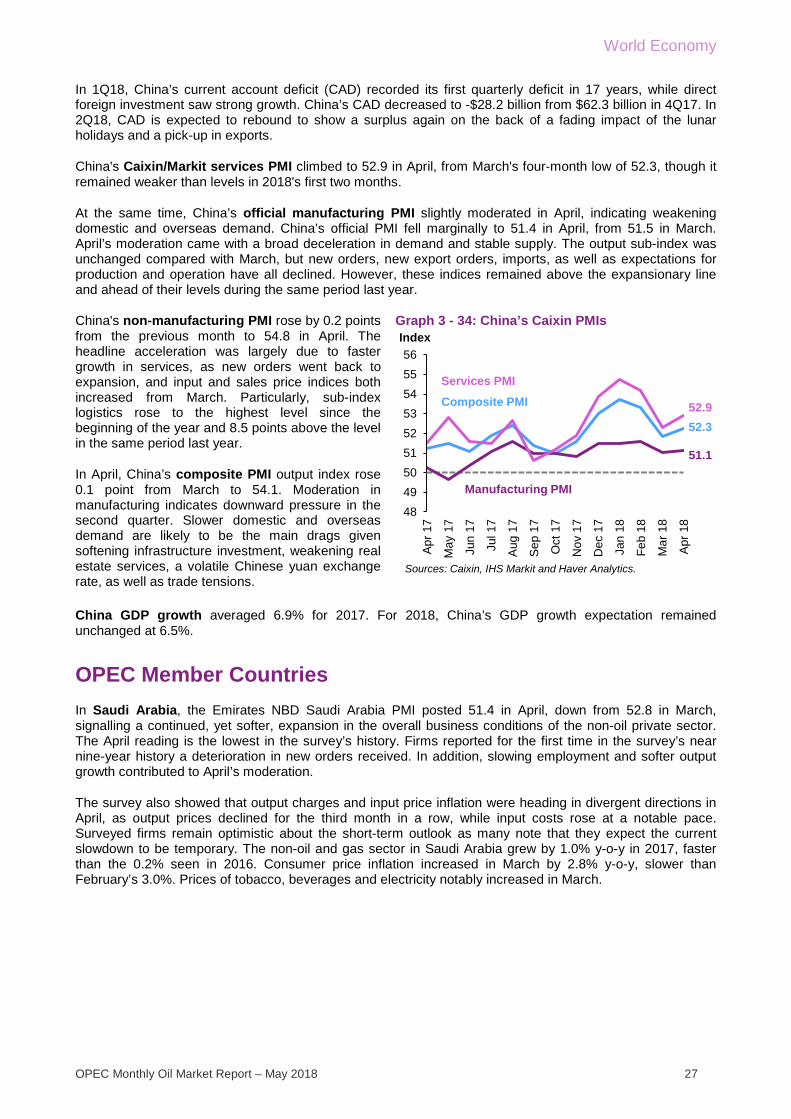
World Economy
OPEC Monthly Oil Market Report – May 2018 27
In 1Q18, China’s current account deficit (CAD) recorded its first quarterly deficit in 17 years, while direct foreign investment saw strong growth. China’s CAD decreased to -$28.2 billion from $62.3 billion in 4Q17. In 2Q18, CAD is expected to rebound to show a surplus again on the back of a fading impact of the lunar holidays and a pick-up in exports.
China's Caixin/Markit services PMI climbed to 52.9 in April, from March's four-month low of 52.3, though it remained weaker than levels in 2018's first two months.
At the same time, China’s official manufacturing PMI slightly moderated in April, indicating weakening domestic and overseas demand. China’s official PMI fell marginally to 51.4 in April, from 51.5 in March. April’s moderation came with a broad deceleration in demand and stable supply. The output sub-index was unchanged compared with March, but new orders, new export orders, imports, as well as expectations for production and operation have all declined. However, these indices remained above the expansionary line and ahead of their levels during the same period last year.
China's non-manufacturing PMI rose by 0.2 points from the previous month to 54.8 in April. The headline acceleration was largely due to faster growth in services, as new orders went back to expansion, and input and sales price indices both increased from March. Particularly, sub-index logistics rose to the highest level since the beginning of the year and 8.5 points above the level in the same period last year.
In April, China’s composite PMI output index rose 0.1 point from March to 54.1. Moderation in manufacturing indicates downward pressure in the second quarter. Slower domestic and overseas demand are likely to be the main drags given softening infrastructure investment, weakening real estate services, a volatile Chinese yuan exchange rate, as well as trade tensions.
Graph 3 - 34: China’s Caixin PMIs
China GDP growth averaged 6.9% for 2017. For 2018, China’s GDP growth expectation remained unchanged at 6.5%.
OPEC Member Countries
In Saudi Arabia, the Emirates NBD Saudi Arabia PMI posted 51.4 in April, down from 52.8 in March, signalling a continued, yet softer, expansion in the overall business conditions of the non-oil private sector. The April reading is the lowest in the survey’s history. Firms reported for the first time in the survey’s near nine-year history a deterioration in new orders received. In addition, slowing employment and softer output growth contributed to April’s moderation.
The survey also showed that output charges and input price inflation were heading in divergent directions in April, as output prices declined for the third month in a row, while input costs rose at a notable pace. Surveyed firms remain optimistic about the short-term outlook as many note that they expect the current slowdown to be temporary. The non-oil and gas sector in Saudi Arabia grew by 1.0% y-o-y in 2017, faster than the 0.2% seen in 2016. Consumer price inflation increased in March by 2.8% y-o-y, slower than February’s 3.0%. Prices of tobacco, beverages and electricity notably increased in March.
52.3
51.1
52.9
484950515253545556
Apr 1
7
May
17
Jun
17
Jul 1
7
Aug
17
Sep
17
Oct
17
Nov
17
Dec
17
Jan
18
Feb
18
Mar
18
Apr 1
8
Index
Sources: Caixin, IHS Markit and Haver Analytics.
Composite PMI
Manufacturing PMI
Services PMI

World Economy
28 OPEC Monthly Oil Market Report – May 2018
Graph 3 - 35: Saudi Arabia’s Emirates NBD manufacturing PMI
Graph 3 - 36: Saudi Arabia’s inflation
In Nigeria, the Stanbic IBTC Bank Nigeria PMI continued to post strong readings for the sixth consecutive month, which continues to emphasize solid improvements in the business conditions of the private sector. The index registered a level of 58.1 in April, slightly down from March’s record high of 58.8. The survey showed a record expansion in private sector output. Output has grown continuously since the start of 2017. Inflation input costs in April grew at the highest rate in 50 months. As a result of an unprecedented expansion in output, purchases soared at a record rate as firms ramped up production in April. New orders also continued to grow at a strong rate during the month, albeit lower than March’s rate of expansion. Growth in job creation continued in April too, as firms required more staff to expand operating capacity. GDP grew by 1.9% y-o-y in the 4Q17, signalling the highest rate of growth since the 4Q15. This brings the full year 2017 growth to 0.8% y-o-y. The increase in consumer price inflation continued to ease in March, falling to 13.3% y-o-y, its lowest since April 2016. Inflation posted a level 14.3% y-o-y in February, down from 15.1% y-o-y in January.
Graph 3 - 37: Nigeria’s Stanbic IBTC Bank manufacturing PMI
Graph 3 - 38: Nigeria’s inflation
Inflation in the United Arab Emirates (UAE) increased in March by 3.4% y-o-y, lower than February’s y-o-y level of 4.4% and January’s 4.7%, which was the fastest pace since August 2015. Price increases in most spending categories declined in March, including for transportation, food and soft drinks, textiles and clothing. Housing, water, electricity and gas prices eased in March. Expansion in the country’s non-oil private sector continued in April 2018, at a slightly faster pace, according to the Emirates NBD UAE PMI. The index rose to 55.1 in April, from 54.8 in March, and was a return to February’s level. The survey showed improved growth in output, new orders and employment during April. As such, business confidence soared to a 34-month high.
51.4
45
50
55
60
Apr 1
6
Jun
16
Aug
16
Oct
16
Dec
16
Feb
17
Apr 1
7
Jun
17
Aug
17
Oct
17
Dec
17
Feb
18
Apr 1
8
Index
Sources: Emirates NBD, IHS Markit and Haver Analytics.
2.8
-2
-1
0
1
2
3
4
Mar
16
May
16
Jul 1
6
Sep
16
Nov
16
Jan
17
Mar
17
May
17
Jul 1
7
Sep
17
Nov
17
Jan
18
Mar
18
Sources: General Authority for Statistics and Haver Analytics.
% change y-o-y
58.1
45
50
55
60
Apr 1
6
Jun
16
Aug
16
Oct
16
Dec
16
Feb
17
Apr 1
7
Jun
17
Aug
17
Oct
17
Dec
17
Feb
18
Apr 1
8
Index
Sources: IHS Markit, Stanbic IBTC Bank and Haver Analytics.
13.312
13
14
15
16
17
18
19
20
Mar
16
May
16
Jul 1
6
Sep
16
Nov
16
Jan
17
Mar
17
May
17
Jul 1
7
Sep
17
Nov
17
Jan
18
Mar
18
Sources: National Bureau of Statistics and Haver Analytics.
% change y-o-y
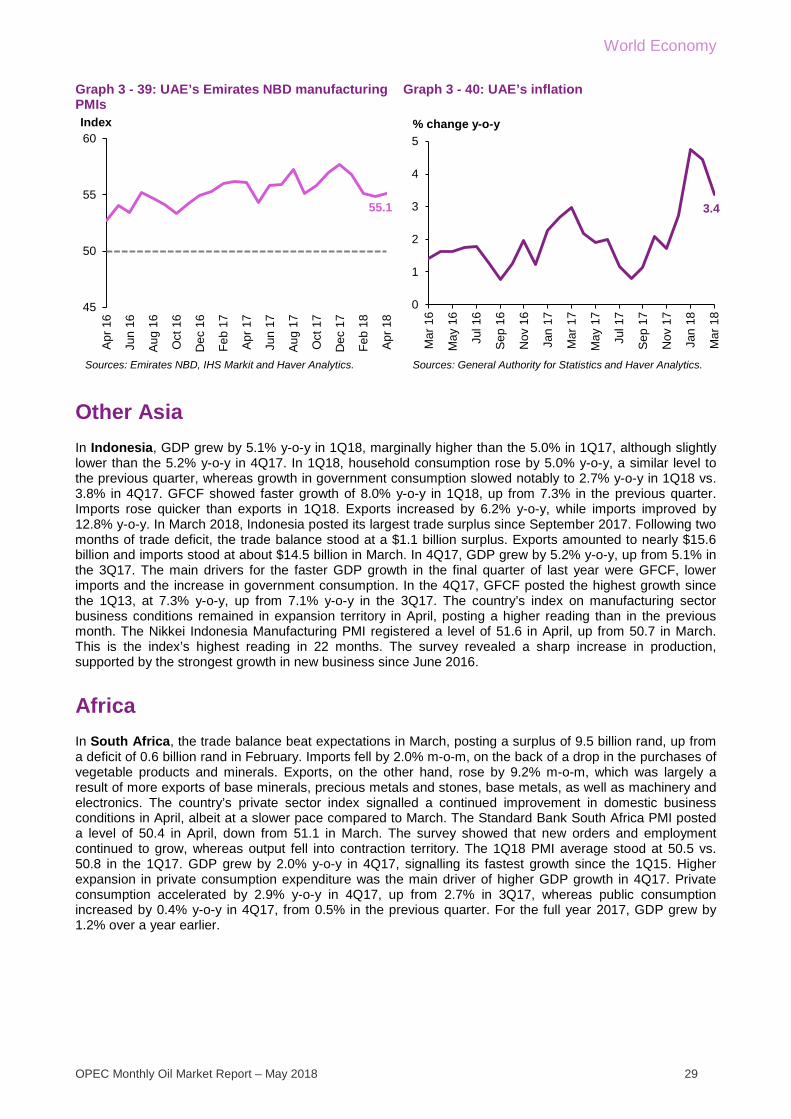
World Economy
OPEC Monthly Oil Market Report – May 2018 29
Graph 3 - 39: UAE’s Emirates NBD manufacturing PMIs
Graph 3 - 40: UAE’s inflation
Other Asia In Indonesia, GDP grew by 5.1% y-o-y in 1Q18, marginally higher than the 5.0% in 1Q17, although slightly lower than the 5.2% y-o-y in 4Q17. In 1Q18, household consumption rose by 5.0% y-o-y, a similar level to the previous quarter, whereas growth in government consumption slowed notably to 2.7% y-o-y in 1Q18 vs. 3.8% in 4Q17. GFCF showed faster growth of 8.0% y-o-y in 1Q18, up from 7.3% in the previous quarter. Imports rose quicker than exports in 1Q18. Exports increased by 6.2% y-o-y, while imports improved by 12.8% y-o-y. In March 2018, Indonesia posted its largest trade surplus since September 2017. Following two months of trade deficit, the trade balance stood at a $1.1 billion surplus. Exports amounted to nearly $15.6 billion and imports stood at about $14.5 billion in March. In 4Q17, GDP grew by 5.2% y-o-y, up from 5.1% in the 3Q17. The main drivers for the faster GDP growth in the final quarter of last year were GFCF, lower imports and the increase in government consumption. In the 4Q17, GFCF posted the highest growth since the 1Q13, at 7.3% y-o-y, up from 7.1% y-o-y in the 3Q17. The country’s index on manufacturing sector business conditions remained in expansion territory in April, posting a higher reading than in the previous month. The Nikkei Indonesia Manufacturing PMI registered a level of 51.6 in April, up from 50.7 in March. This is the index’s highest reading in 22 months. The survey revealed a sharp increase in production, supported by the strongest growth in new business since June 2016.
Africa In South Africa, the trade balance beat expectations in March, posting a surplus of 9.5 billion rand, up from a deficit of 0.6 billion rand in February. Imports fell by 2.0% m-o-m, on the back of a drop in the purchases of vegetable products and minerals. Exports, on the other hand, rose by 9.2% m-o-m, which was largely a result of more exports of base minerals, precious metals and stones, base metals, as well as machinery and electronics. The country’s private sector index signalled a continued improvement in domestic business conditions in April, albeit at a slower pace compared to March. The Standard Bank South Africa PMI posted a level of 50.4 in April, down from 51.1 in March. The survey showed that new orders and employment continued to grow, whereas output fell into contraction territory. The 1Q18 PMI average stood at 50.5 vs. 50.8 in the 1Q17. GDP grew by 2.0% y-o-y in 4Q17, signalling its fastest growth since the 1Q15. Higher expansion in private consumption expenditure was the main driver of higher GDP growth in 4Q17. Private consumption accelerated by 2.9% y-o-y in 4Q17, up from 2.7% in 3Q17, whereas public consumption increased by 0.4% y-o-y in 4Q17, from 0.5% in the previous quarter. For the full year 2017, GDP grew by 1.2% over a year earlier.
55.1
45
50
55
60
Apr 1
6
Jun
16
Aug
16
Oct
16
Dec
16
Feb
17
Apr 1
7
Jun
17
Aug
17
Oct
17
Dec
17
Feb
18
Apr 1
8
Index
Sources: Emirates NBD, IHS Markit and Haver Analytics.
3.4
0
1
2
3
4
5
Mar
16
May
16
Jul 1
6
Sep
16
Nov
16
Jan
17
Mar
17
May
17
Jul 1
7
Sep
17
Nov
17
Jan
18
Mar
18
Sources: General Authority for Statistics and Haver Analytics.
% change y-o-y
World Economy
30 OPEC Monthly Oil Market Report – May 2018
Latin America In Chile, the central bank held its benchmark interest rate at 2.5% in early May, citing an expectation for low inflation throughout most of 2018. The central bank also expects inflation to gradually rise in 2019 and reach the bank’s target of 3.0%. Annual consumer price inflation decreased to 1.8% y-o-y in March. Inflation expectations also showed no significant changes. The growth in economic activities in 1Q18 was generally better q-o-q. Sharp increases were reported in mining activities, in addition to a better performance in construction investment. Both consumer and business confidence were positive in April. The central bank’s economic expectations survey for April pointed to GDP growth of around 3.5% in 2018 for Chile.
Transition region In the Czech Republic, the manufacturing sector showed strong growth in April, despite dipping to a seven-month low, according to the IHS Markit Czech Republic Manufacturing PMI. The index registered 57.2 in April, fractionally lower than March’s 57.3. This came on the back of solid growth in production, albeit the lowest reading of the sub-index in six months. As a result, the job creation rate softened to its slowest level since October 2016. New orders received by producers of Czech goods increased at an accelerated rate in April and were well above the long-run series average. On the price front, input inflation continued to rise at a marked rate, due to higher raw material costs, especially metals. Growth in buying activity was the weakest for six months in April. The slowdown reflected higher raw material prices and the largest deterioration in vendor performance since the series began in June 2001. In 2017, the economy grew by 4.3% y-o-y. Household consumption growth accelerated to 4.5% y-o-y in 4Q17, up from 4.1% in 3Q17. GFCF also expanded at a higher rate in of 7.3% y-o-y in 4Q17, vs. 6.3% in the previous quarter.
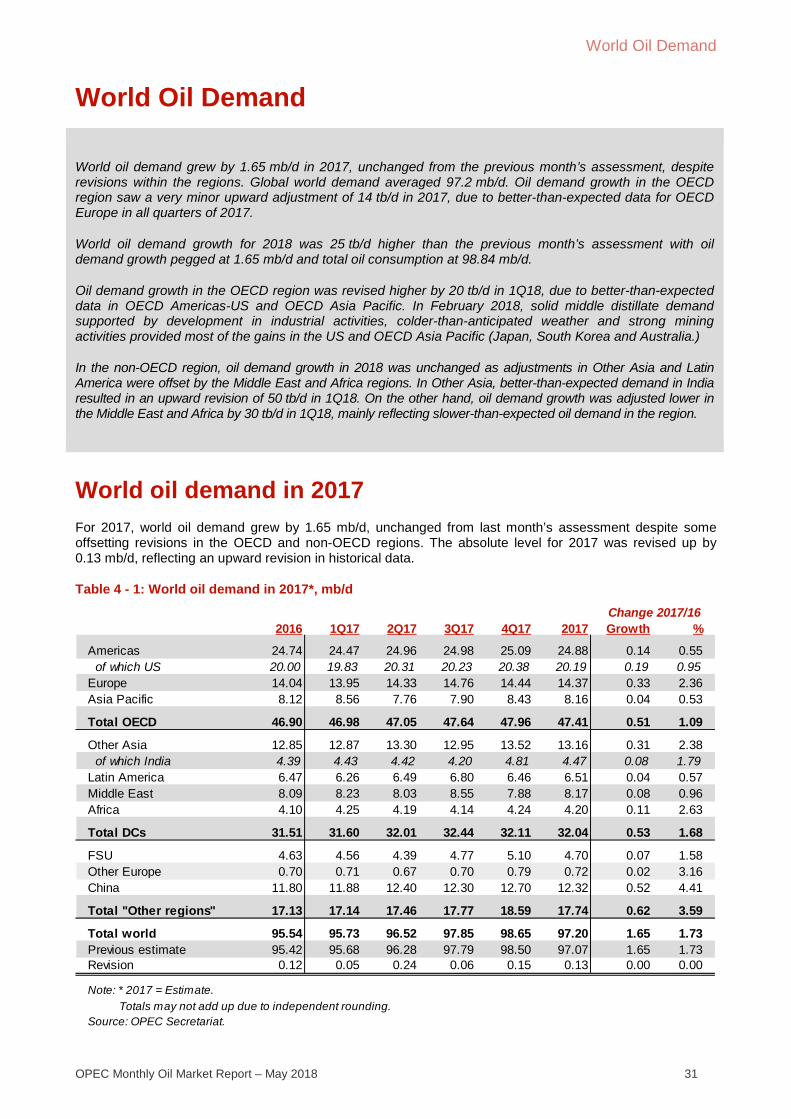
World Oil Demand
OPEC Monthly Oil Market Report – May 2018 31
World Oil Demand
World oil demand grew by 1.65 mb/d in 2017, unchanged from the previous month’s assessment, despite revisions within the regions. Global world demand averaged 97.2 mb/d. Oil demand growth in the OECD region saw a very minor upward adjustment of 14 tb/d in 2017, due to better-than-expected data for OECD Europe in all quarters of 2017.
World oil demand growth for 2018 was 25 tb/d higher than the previous month’s assessment with oil demand growth pegged at 1.65 mb/d and total oil consumption at 98.84 mb/d.
Oil demand growth in the OECD region was revised higher by 20 tb/d in 1Q18, due to better-than-expected data in OECD Americas-US and OECD Asia Pacific. In February 2018, solid middle distillate demand supported by development in industrial activities, colder-than-anticipated weather and strong mining activities provided most of the gains in the US and OECD Asia Pacific (Japan, South Korea and Australia.)
In the non-OECD region, oil demand growth in 2018 was unchanged as adjustments in Other Asia and Latin America were offset by the Middle East and Africa regions. In Other Asia, better-than-expected demand in India resulted in an upward revision of 50 tb/d in 1Q18. On the other hand, oil demand growth was adjusted lower in the Middle East and Africa by 30 tb/d in 1Q18, mainly reflecting slower-than-expected oil demand in the region.
World oil demand in 2017 For 2017, world oil demand grew by 1.65 mb/d, unchanged from last month’s assessment despite some offsetting revisions in the OECD and non-OECD regions. The absolute level for 2017 was revised up by 0.13 mb/d, reflecting an upward revision in historical data.
Table 4 - 1: World oil demand in 2017*, mb/d
2016 1Q17 2Q17 3Q17 4Q17 2017 Growth %
Americas 24.74 24.47 24.96 24.98 25.09 24.88 0.14 0.55 of which US 20.00 19.83 20.31 20.23 20.38 20.19 0.19 0.95Europe 14.04 13.95 14.33 14.76 14.44 14.37 0.33 2.36Asia Pacific 8.12 8.56 7.76 7.90 8.43 8.16 0.04 0.53
Total OECD 46.90 46.98 47.05 47.64 47.96 47.41 0.51 1.09
Other Asia 12.85 12.87 13.30 12.95 13.52 13.16 0.31 2.38 of which India 4.39 4.43 4.42 4.20 4.81 4.47 0.08 1.79Latin America 6.47 6.26 6.49 6.80 6.46 6.51 0.04 0.57Middle East 8.09 8.23 8.03 8.55 7.88 8.17 0.08 0.96Africa 4.10 4.25 4.19 4.14 4.24 4.20 0.11 2.63
Total DCs 31.51 31.60 32.01 32.44 32.11 32.04 0.53 1.68
FSU 4.63 4.56 4.39 4.77 5.10 4.70 0.07 1.58Other Europe 0.70 0.71 0.67 0.70 0.79 0.72 0.02 3.16China 11.80 11.88 12.40 12.30 12.70 12.32 0.52 4.41
Total "Other regions" 17.13 17.14 17.46 17.77 18.59 17.74 0.62 3.59
Total world 95.54 95.73 96.52 97.85 98.65 97.20 1.65 1.73Previous estimate 95.42 95.68 96.28 97.79 98.50 97.07 1.65 1.73Revision 0.12 0.05 0.24 0.06 0.15 0.13 0.00 0.00
Source: OPEC Secretariat. Totals may not add up due to independent rounding.
Change 2017/16
Note: * 2017 = Estimate.
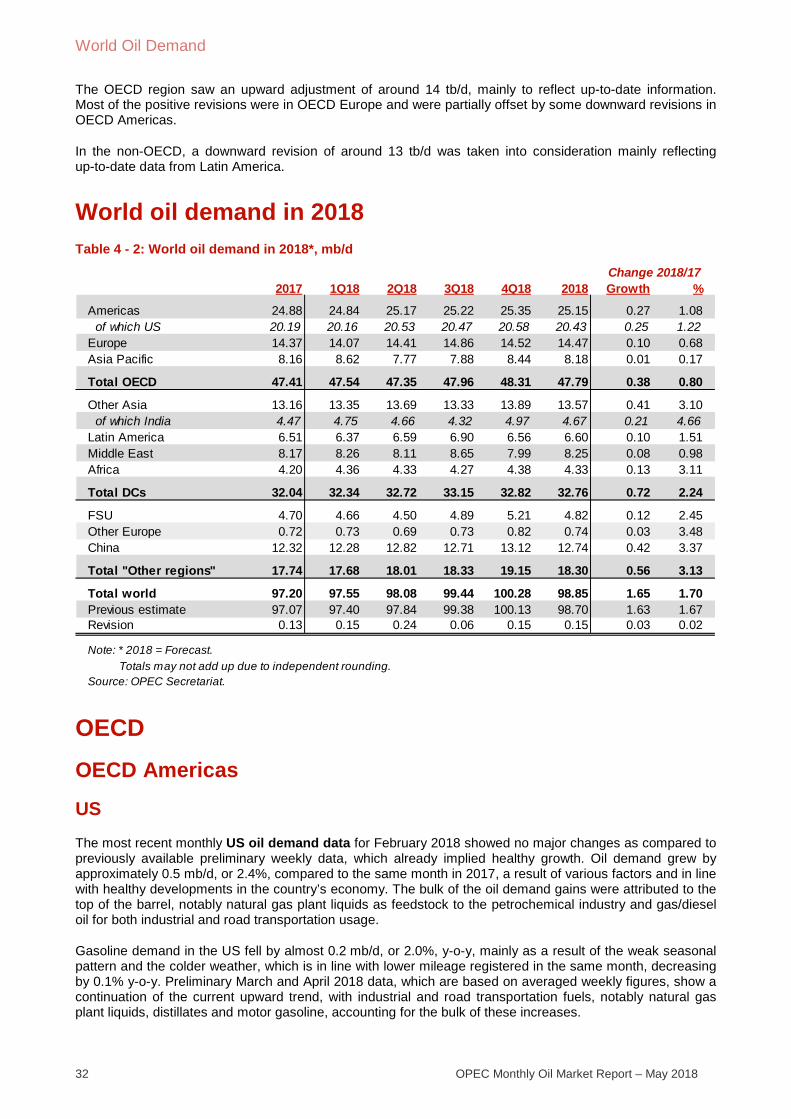
World Oil Demand
32 OPEC Monthly Oil Market Report – May 2018
The OECD region saw an upward adjustment of around 14 tb/d, mainly to reflect up-to-date information. Most of the positive revisions were in OECD Europe and were partially offset by some downward revisions in OECD Americas.
In the non-OECD, a downward revision of around 13 tb/d was taken into consideration mainly reflecting up-to-date data from Latin America.
World oil demand in 2018 Table 4 - 2: World oil demand in 2018*, mb/d
OECD OECD Americas
US The most recent monthly US oil demand data for February 2018 showed no major changes as compared to previously available preliminary weekly data, which already implied healthy growth. Oil demand grew by approximately 0.5 mb/d, or 2.4%, compared to the same month in 2017, a result of various factors and in line with healthy developments in the country’s economy. The bulk of the oil demand gains were attributed to the top of the barrel, notably natural gas plant liquids as feedstock to the petrochemical industry and gas/diesel oil for both industrial and road transportation usage.
Gasoline demand in the US fell by almost 0.2 mb/d, or 2.0%, y-o-y, mainly as a result of the weak seasonal pattern and the colder weather, which is in line with lower mileage registered in the same month, decreasing by 0.1% y-o-y. Preliminary March and April 2018 data, which are based on averaged weekly figures, show a continuation of the current upward trend, with industrial and road transportation fuels, notably natural gas plant liquids, distillates and motor gasoline, accounting for the bulk of these increases.
2017 1Q18 2Q18 3Q18 4Q18 2018 Growth %
Americas 24.88 24.84 25.17 25.22 25.35 25.15 0.27 1.08 of which US 20.19 20.16 20.53 20.47 20.58 20.43 0.25 1.22Europe 14.37 14.07 14.41 14.86 14.52 14.47 0.10 0.68Asia Pacific 8.16 8.62 7.77 7.88 8.44 8.18 0.01 0.17
Total OECD 47.41 47.54 47.35 47.96 48.31 47.79 0.38 0.80
Other Asia 13.16 13.35 13.69 13.33 13.89 13.57 0.41 3.10 of which India 4.47 4.75 4.66 4.32 4.97 4.67 0.21 4.66Latin America 6.51 6.37 6.59 6.90 6.56 6.60 0.10 1.51Middle East 8.17 8.26 8.11 8.65 7.99 8.25 0.08 0.98Africa 4.20 4.36 4.33 4.27 4.38 4.33 0.13 3.11
Total DCs 32.04 32.34 32.72 33.15 32.82 32.76 0.72 2.24
FSU 4.70 4.66 4.50 4.89 5.21 4.82 0.12 2.45Other Europe 0.72 0.73 0.69 0.73 0.82 0.74 0.03 3.48China 12.32 12.28 12.82 12.71 13.12 12.74 0.42 3.37
Total "Other regions" 17.74 17.68 18.01 18.33 19.15 18.30 0.56 3.13
Total world 97.20 97.55 98.08 99.44 100.28 98.85 1.65 1.70Previous estimate 97.07 97.40 97.84 99.38 100.13 98.70 1.63 1.67Revision 0.13 0.15 0.24 0.06 0.15 0.15 0.03 0.02
Source: OPEC Secretariat. Totals may not add up due to independent rounding.
Change 2018/17
Note: * 2018 = Forecast.

World Oil Demand
OPEC Monthly Oil Market Report – May 2018 33
Graph 4 - 1: OECD Americas oil demand, y-o-y change
Graph 4 - 2: US gasoline demand, y-o-y change
While 2018 US oil demand remains strongly dependent on the development of the US economy, the current forecasting potential continues to be skewed to the upside, as compared to last month’s assessment. The current oil price environment remains an influential variable. Trends in vehicle sales have seen the return of healthy growth for sport utility vehicles (SUVs) and pickup sales in the year 2017. Early car-sales indicators for March hint towards a rise of around 3% y-o-y, led by solid light-truck sales. Nevertheless, there also some downside risks that may cap oil demand growth, such as fuel substitution and vehicle efficiencies.
Table 4 - 3: US oil demand, tb/d
Mexico In Mexico, oil demand declined mostly in March 2018, with the exceptions of gasoline and jet/kerosene, which have partly offset the declines for the remaining petroleum product categories. Gasoline demand increased, while jet/kerosene has been increasing for the last several years, reflecting the gains in air travel to and from the country.
Canada Oil demand in Canada slightly increased in February 2018. Gains were solid for the demand of gas/diesel oil, gasoline and residual fuel oil, but have been almost offset by declines in LPG requirements, mainly as a result of fuel substitution. 2018 projections for Canadian oil demand remain unchanged from last month’s assessment, pointing towards a slight increase y-o-y, and with forecasting risks being balanced towards the upside and downside.
OECD Americas oil demand grew by 0.14 mb/d in 2017, compared with 2016. OECD Americas oil demand growth is projected at 0.27 mb/d in 2018, compared with 2017.
-1,500
-1,000
-500
0
500
1,000
1,500
-1,500
-1,000
-500
0
500
1,000
1,500Ja
n
Feb
Mar Apr
May Jun
Jul
Aug
Sep Oct
Nov
Dec
tb/dtb/d
Historical range Historical average
2017 2018
Sources: National, Joint Organisations Data Initiative and OPEC Secretariat.
-300
-200
-100
0
100
200
300
Feb
17
Mar
17
Apr
17
May
17
Jun
17
Jul 1
7
Aug
17
Sep
17
Oct
17
Nov
17
Dec
17
Jan
18
Feb
18
tb/d
Source: US Energy Information Administration.
Feb 18 Feb 17 tb/d %
LPG 3,015 2,614 401 15.3Naphtha 219 255 -36 -14.1Gasoline 8,817 8,995 -178 -2.0Jet/kerosene 1,600 1,531 69 4.5Diesel oil 3,962 3,905 57 1.5Fuel oil 282 270 12 4.4Other products 2,015 1,880 135 7.2
Total 19,910 19,450 460 2.4
Change 2018/17
Sources: US Energy Information Administration and OPEC Secretariat.
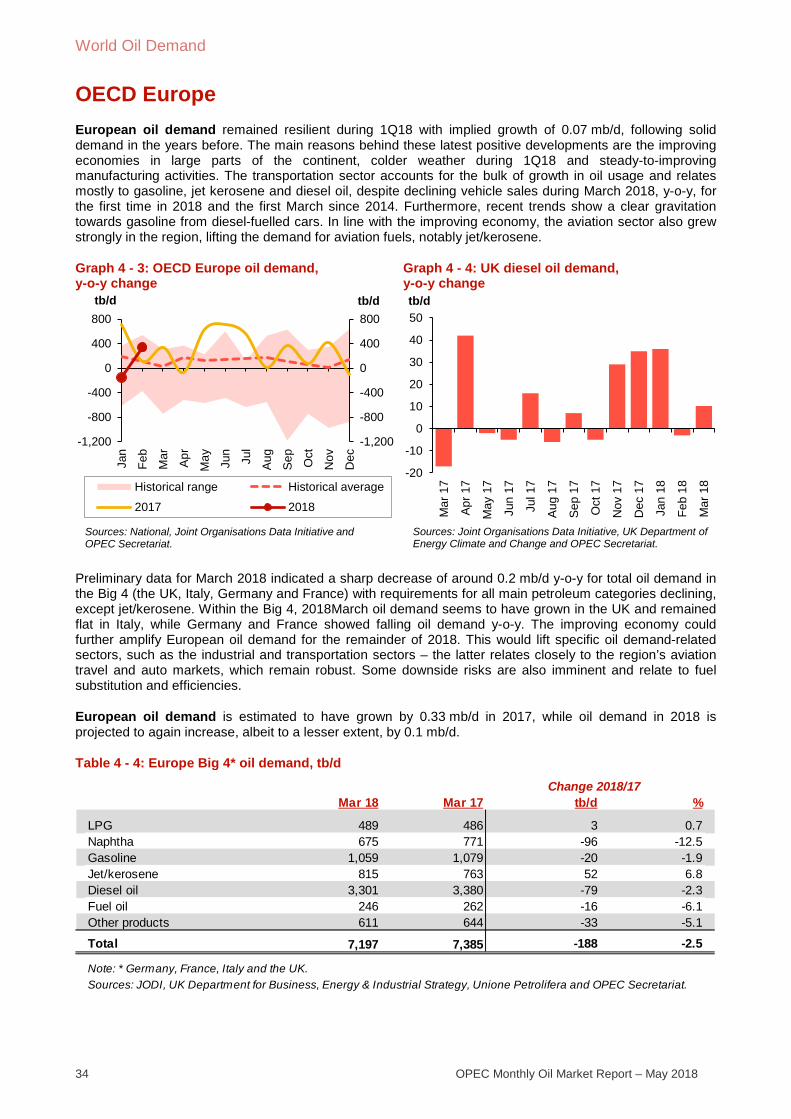
World Oil Demand
34 OPEC Monthly Oil Market Report – May 2018
OECD Europe European oil demand remained resilient during 1Q18 with implied growth of 0.07 mb/d, following solid demand in the years before. The main reasons behind these latest positive developments are the improving economies in large parts of the continent, colder weather during 1Q18 and steady-to-improving manufacturing activities. The transportation sector accounts for the bulk of growth in oil usage and relates mostly to gasoline, jet kerosene and diesel oil, despite declining vehicle sales during March 2018, y-o-y, for the first time in 2018 and the first March since 2014. Furthermore, recent trends show a clear gravitation towards gasoline from diesel-fuelled cars. In line with the improving economy, the aviation sector also grew strongly in the region, lifting the demand for aviation fuels, notably jet/kerosene.
Graph 4 - 3: OECD Europe oil demand, y-o-y change
Graph 4 - 4: UK diesel oil demand, y-o-y change
Preliminary data for March 2018 indicated a sharp decrease of around 0.2 mb/d y-o-y for total oil demand in the Big 4 (the UK, Italy, Germany and France) with requirements for all main petroleum categories declining, except jet/kerosene. Within the Big 4, 2018March oil demand seems to have grown in the UK and remained flat in Italy, while Germany and France showed falling oil demand y-o-y. The improving economy could further amplify European oil demand for the remainder of 2018. This would lift specific oil demand-related sectors, such as the industrial and transportation sectors – the latter relates closely to the region’s aviation travel and auto markets, which remain robust. Some downside risks are also imminent and relate to fuel substitution and efficiencies.
European oil demand is estimated to have grown by 0.33 mb/d in 2017, while oil demand in 2018 is projected to again increase, albeit to a lesser extent, by 0.1 mb/d.
Table 4 - 4: Europe Big 4* oil demand, tb/d
-1,200
-800
-400
0
400
800
-1,200
-800
-400
0
400
800
Jan
Feb
Mar Apr
May Jun
Jul
Aug
Sep Oct
Nov
Dec
tb/dtb/d
Historical range Historical average
2017 2018
Sources: National, Joint Organisations Data Initiative and OPEC Secretariat.
-20
-10
0
10
20
30
40
50
Mar
17
Apr 1
7
May
17
Jun
17
Jul 1
7
Aug
17
Sep
17
Oct
17
Nov
17
Dec
17
Jan
18
Feb
18
Mar
18
tb/d
Sources: Joint Organisations Data Initiative, UK Department of Energy Climate and Change and OPEC Secretariat.
Mar 18 Mar 17 tb/d %
LPG 489 486 3 0.7Naphtha 675 771 -96 -12.5Gasoline 1,059 1,079 -20 -1.9Jet/kerosene 815 763 52 6.8Diesel oil 3,301 3,380 -79 -2.3Fuel oil 246 262 -16 -6.1Other products 611 644 -33 -5.1
Total 7,197 7,385 -188 -2.5
Sources: JODI, UK Department for Business, Energy & Industrial Strategy, Unione Petrolifera and OPEC Secretariat.
Change 2018/17
Note: * Germany, France, Italy and the UK.
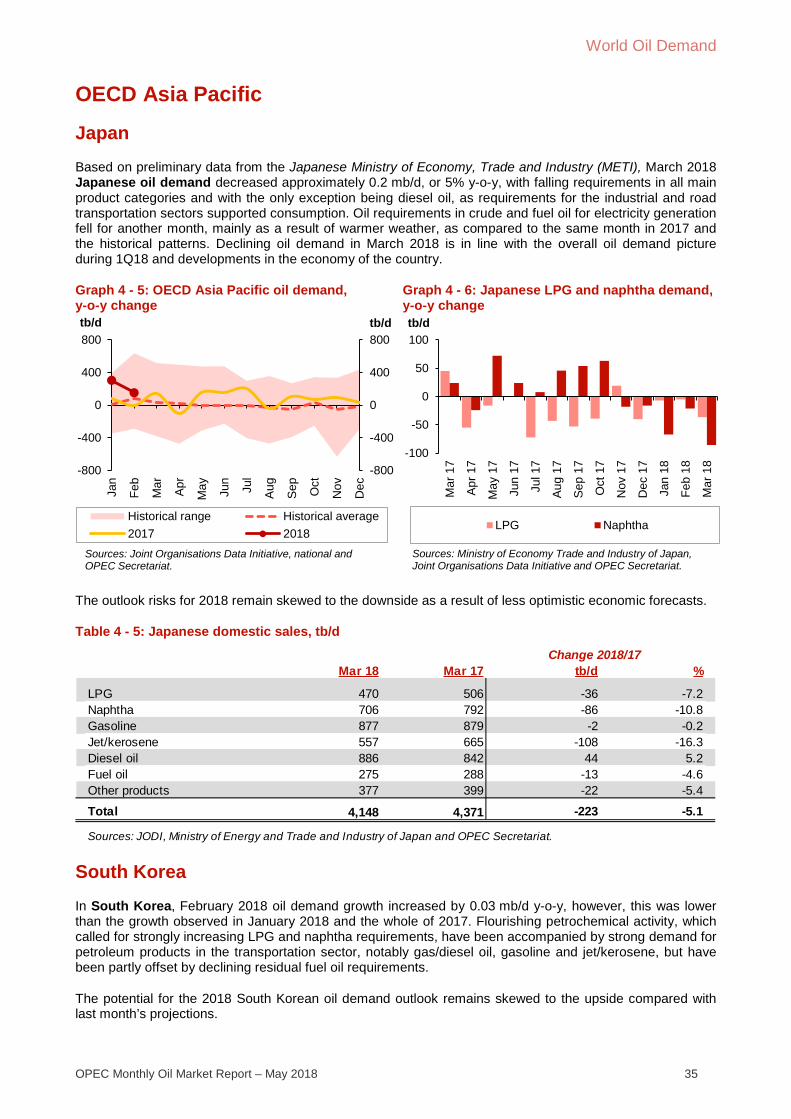
World Oil Demand
OPEC Monthly Oil Market Report – May 2018 35
OECD Asia Pacific
Japan Based on preliminary data from the Japanese Ministry of Economy, Trade and Industry (METI), March 2018 Japanese oil demand decreased approximately 0.2 mb/d, or 5% y-o-y, with falling requirements in all main product categories and with the only exception being diesel oil, as requirements for the industrial and road transportation sectors supported consumption. Oil requirements in crude and fuel oil for electricity generation fell for another month, mainly as a result of warmer weather, as compared to the same month in 2017 and the historical patterns. Declining oil demand in March 2018 is in line with the overall oil demand picture during 1Q18 and developments in the economy of the country.
Graph 4 - 5: OECD Asia Pacific oil demand, y-o-y change
Graph 4 - 6: Japanese LPG and naphtha demand, y-o-y change
The outlook risks for 2018 remain skewed to the downside as a result of less optimistic economic forecasts.
Table 4 - 5: Japanese domestic sales, tb/d
South Korea In South Korea, February 2018 oil demand growth increased by 0.03 mb/d y-o-y, however, this was lower than the growth observed in January 2018 and the whole of 2017. Flourishing petrochemical activity, which called for strongly increasing LPG and naphtha requirements, have been accompanied by strong demand for petroleum products in the transportation sector, notably gas/diesel oil, gasoline and jet/kerosene, but have been partly offset by declining residual fuel oil requirements.
The potential for the 2018 South Korean oil demand outlook remains skewed to the upside compared with last month’s projections.
-800
-400
0
400
800
-800
-400
0
400
800
Jan
Feb
Mar Apr
May Jun
Jul
Aug
Sep Oct
Nov
Dec
tb/dtb/d
Historical range Historical average2017 2018
Sources: Joint Organisations Data Initiative, national and OPEC Secretariat.
-100
-50
0
50
100
Mar
17
Apr
17
May
17
Jun
17
Jul 1
7
Aug
17
Sep
17
Oct
17
Nov
17
Dec
17
Jan
18
Feb
18
Mar
18
tb/d
LPG Naphtha
Sources: Ministry of Economy Trade and Industry of Japan, Joint Organisations Data Initiative and OPEC Secretariat.
Mar 18 Mar 17 tb/d %
LPG 470 506 -36 -7.2Naphtha 706 792 -86 -10.8Gasoline 877 879 -2 -0.2Jet/kerosene 557 665 -108 -16.3Diesel oil 886 842 44 5.2Fuel oil 275 288 -13 -4.6Other products 377 399 -22 -5.4
Total 4,148 4,371 -223 -5.1
Change 2018/17
Sources: JODI, Ministry of Energy and Trade and Industry of Japan and OPEC Secretariat.
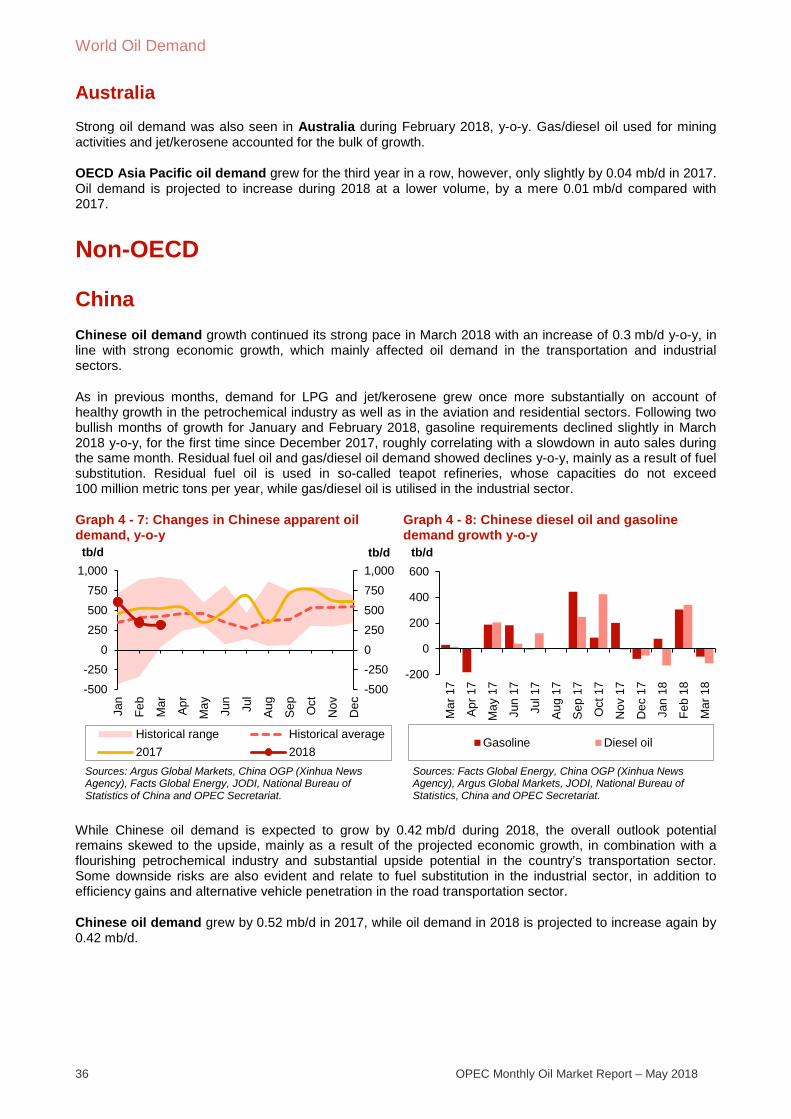
World Oil Demand
36 OPEC Monthly Oil Market Report – May 2018
Australia Strong oil demand was also seen in Australia during February 2018, y-o-y. Gas/diesel oil used for mining activities and jet/kerosene accounted for the bulk of growth.
OECD Asia Pacific oil demand grew for the third year in a row, however, only slightly by 0.04 mb/d in 2017. Oil demand is projected to increase during 2018 at a lower volume, by a mere 0.01 mb/d compared with 2017.
Non-OECD
China Chinese oil demand growth continued its strong pace in March 2018 with an increase of 0.3 mb/d y-o-y, in line with strong economic growth, which mainly affected oil demand in the transportation and industrial sectors.
As in previous months, demand for LPG and jet/kerosene grew once more substantially on account of healthy growth in the petrochemical industry as well as in the aviation and residential sectors. Following two bullish months of growth for January and February 2018, gasoline requirements declined slightly in March 2018 y-o-y, for the first time since December 2017, roughly correlating with a slowdown in auto sales during the same month. Residual fuel oil and gas/diesel oil demand showed declines y-o-y, mainly as a result of fuel substitution. Residual fuel oil is used in so-called teapot refineries, whose capacities do not exceed 100 million metric tons per year, while gas/diesel oil is utilised in the industrial sector.
Graph 4 - 7: Changes in Chinese apparent oil demand, y-o-y
Graph 4 - 8: Chinese diesel oil and gasoline demand growth y-o-y
While Chinese oil demand is expected to grow by 0.42 mb/d during 2018, the overall outlook potential remains skewed to the upside, mainly as a result of the projected economic growth, in combination with a flourishing petrochemical industry and substantial upside potential in the country’s transportation sector. Some downside risks are also evident and relate to fuel substitution in the industrial sector, in addition to efficiency gains and alternative vehicle penetration in the road transportation sector.
Chinese oil demand grew by 0.52 mb/d in 2017, while oil demand in 2018 is projected to increase again by 0.42 mb/d.
-500-25002505007501,000
-500-250
0250500750
1,000
Jan
Feb
Mar Apr
May Jun
Jul
Aug
Sep Oct
Nov
Dec
tb/dtb/d
Historical range Historical average2017 2018
Sources: Argus Global Markets, China OGP (Xinhua News Agency), Facts Global Energy, JODI, National Bureau of Statistics of China and OPEC Secretariat.
-200
0
200
400
600
Mar
17
Apr
17
May
17
Jun
17
Jul 1
7
Aug
17
Sep
17
Oct
17
Nov
17
Dec
17
Jan
18
Feb
18
Mar
18
tb/d
Gasoline Diesel oil
Sources: Facts Global Energy, China OGP (Xinhua News Agency), Argus Global Markets, JODI, National Bureau of Statistics, China and OPEC Secretariat.
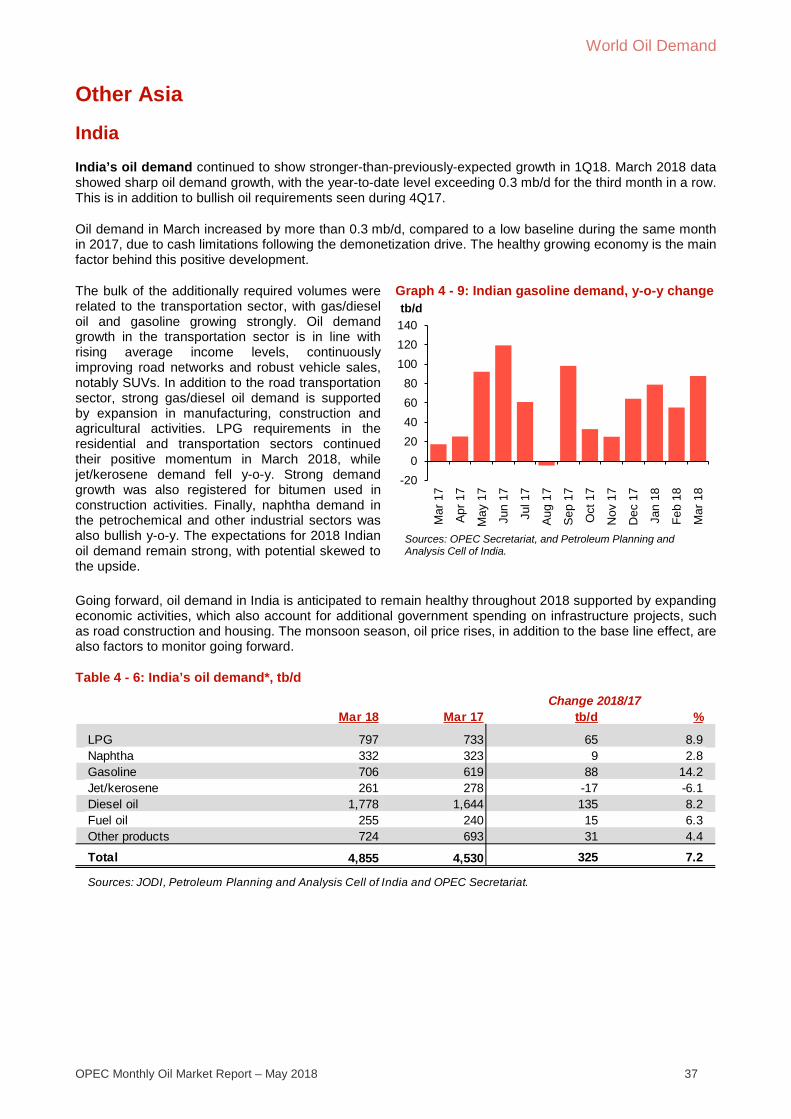
World Oil Demand
OPEC Monthly Oil Market Report – May 2018 37
Other Asia
India India’s oil demand continued to show stronger-than-previously-expected growth in 1Q18. March 2018 data showed sharp oil demand growth, with the year-to-date level exceeding 0.3 mb/d for the third month in a row. This is in addition to bullish oil requirements seen during 4Q17.
Oil demand in March increased by more than 0.3 mb/d, compared to a low baseline during the same month in 2017, due to cash limitations following the demonetization drive. The healthy growing economy is the main factor behind this positive development.
The bulk of the additionally required volumes were related to the transportation sector, with gas/diesel oil and gasoline growing strongly. Oil demand growth in the transportation sector is in line with rising average income levels, continuously improving road networks and robust vehicle sales, notably SUVs. In addition to the road transportation sector, strong gas/diesel oil demand is supported by expansion in manufacturing, construction and agricultural activities. LPG requirements in the residential and transportation sectors continued their positive momentum in March 2018, while jet/kerosene demand fell y-o-y. Strong demand growth was also registered for bitumen used in construction activities. Finally, naphtha demand in the petrochemical and other industrial sectors was also bullish y-o-y. The expectations for 2018 Indian oil demand remain strong, with potential skewed to the upside.
Graph 4 - 9: Indian gasoline demand, y-o-y change
Going forward, oil demand in India is anticipated to remain healthy throughout 2018 supported by expanding economic activities, which also account for additional government spending on infrastructure projects, such as road construction and housing. The monsoon season, oil price rises, in addition to the base line effect, are also factors to monitor going forward.
Table 4 - 6: India’s oil demand*, tb/d
-200
20406080
100120140
Mar
17
Apr
17
May
17
Jun
17
Jul 1
7
Aug
17
Sep
17
Oct
17
Nov
17
Dec
17
Jan
18
Feb
18
Mar
18
tb/d
Sources: OPEC Secretariat, and Petroleum Planning and Analysis Cell of India.
Mar 18 Mar 17 tb/d %
LPG 797 733 65 8.9Naphtha 332 323 9 2.8Gasoline 706 619 88 14.2Jet/kerosene 261 278 -17 -6.1Diesel oil 1,778 1,644 135 8.2Fuel oil 255 240 15 6.3Other products 724 693 31 4.4
Total 4,855 4,530 325 7.2
Sources: JODI, Petroleum Planning and Analysis Cell of India and OPEC Secretariat.
Change 2018/17
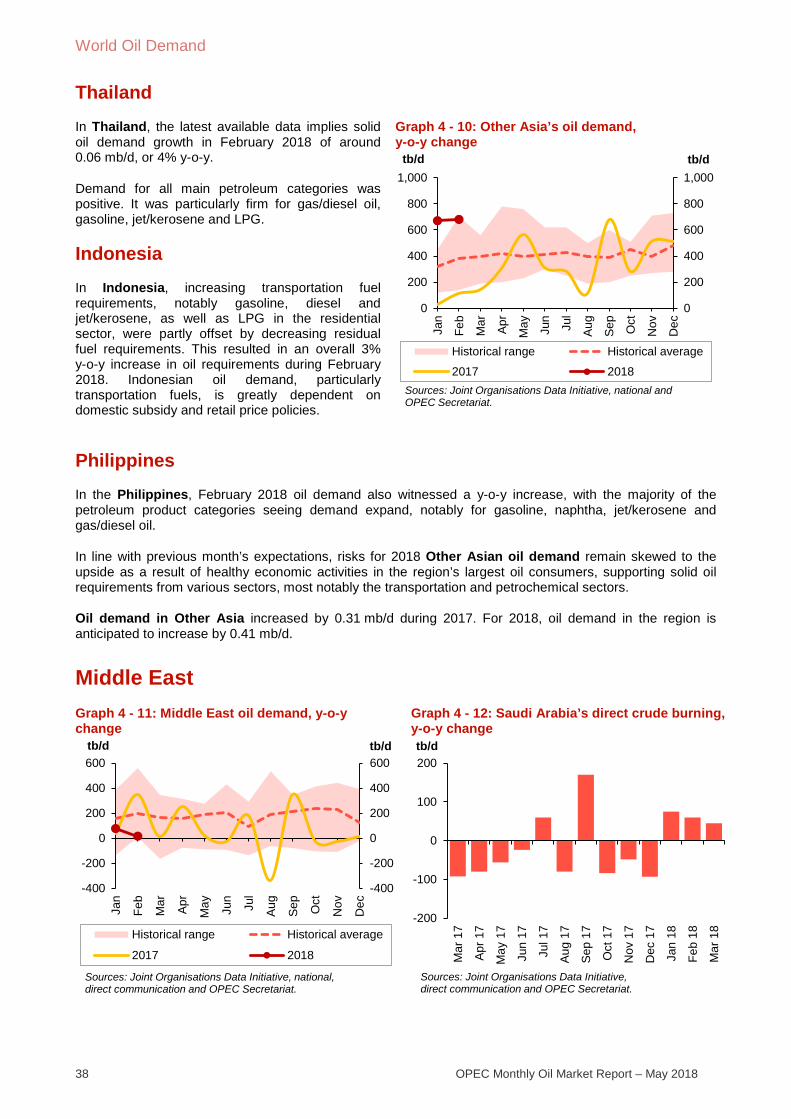
World Oil Demand
38 OPEC Monthly Oil Market Report – May 2018
Thailand In Thailand, the latest available data implies solid oil demand growth in February 2018 of around 0.06 mb/d, or 4% y-o-y.
Demand for all main petroleum categories was positive. It was particularly firm for gas/diesel oil, gasoline, jet/kerosene and LPG.
Indonesia In Indonesia, increasing transportation fuel requirements, notably gasoline, diesel and jet/kerosene, as well as LPG in the residential sector, were partly offset by decreasing residual fuel requirements. This resulted in an overall 3% y-o-y increase in oil requirements during February 2018. Indonesian oil demand, particularly transportation fuels, is greatly dependent on domestic subsidy and retail price policies.
Graph 4 - 10: Other Asia’s oil demand, y-o-y change
Philippines In the Philippines, February 2018 oil demand also witnessed a y-o-y increase, with the majority of the petroleum product categories seeing demand expand, notably for gasoline, naphtha, jet/kerosene and gas/diesel oil.
In line with previous month’s expectations, risks for 2018 Other Asian oil demand remain skewed to the upside as a result of healthy economic activities in the region’s largest oil consumers, supporting solid oil requirements from various sectors, most notably the transportation and petrochemical sectors.
Oil demand in Other Asia increased by 0.31 mb/d during 2017. For 2018, oil demand in the region is anticipated to increase by 0.41 mb/d.
Middle East Graph 4 - 11: Middle East oil demand, y-o-y change
Graph 4 - 12: Saudi Arabia’s direct crude burning, y-o-y change
0
200
400
600
800
1,000
0
200
400
600
800
1,000
Jan
Feb
Mar Apr
May Jun
Jul
Aug
Sep Oct
Nov
Dec
tb/dtb/d
Historical range Historical average
2017 2018Sources: Joint Organisations Data Initiative, national and OPEC Secretariat.
-400
-200
0
200
400
600
-400
-200
0
200
400
600
Jan
Feb
Mar Apr
May Jun
Jul
Aug
Sep Oct
Nov
Dec
tb/dtb/d
Historical range Historical average
2017 2018
Sources: Joint Organisations Data Initiative, national, direct communication and OPEC Secretariat.
-200
-100
0
100
200
Mar
17
Apr
17
May
17
Jun
17
Jul 1
7
Aug
17
Sep
17
Oct
17
Nov
17
Dec
17
Jan
18
Feb
18
Mar
18
tb/d
Sources: Joint Organisations Data Initiative, direct communication and OPEC Secretariat.
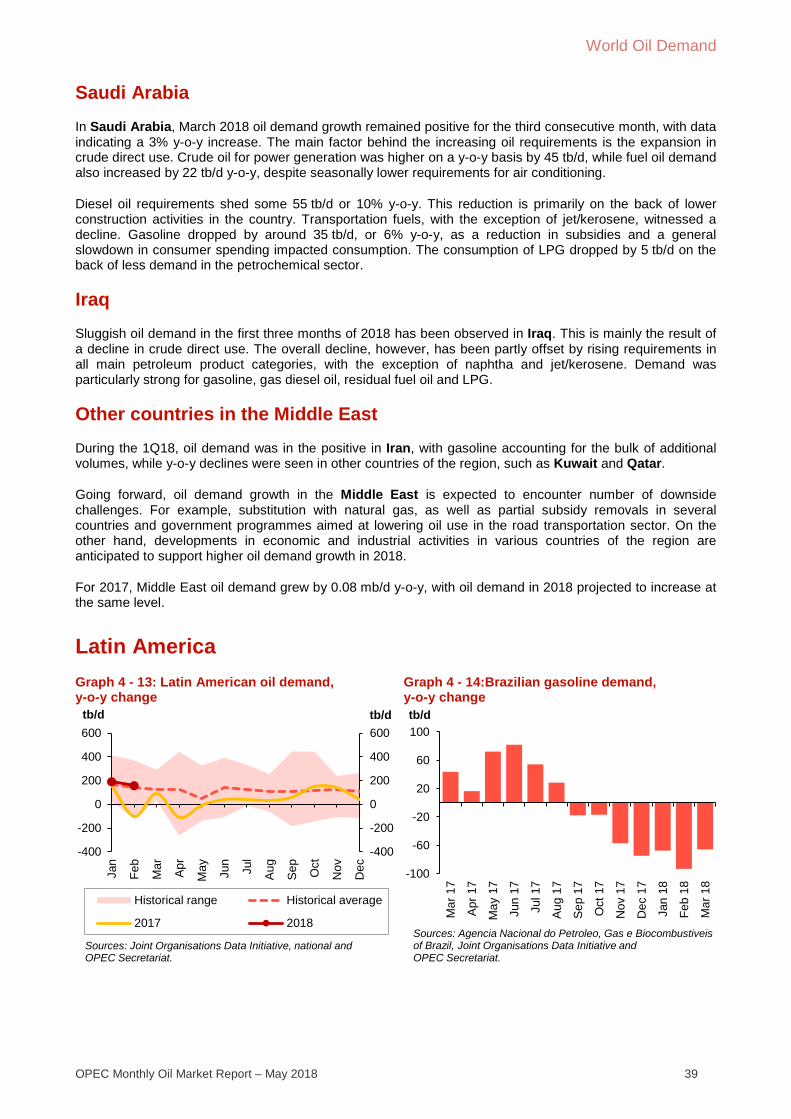
World Oil Demand
OPEC Monthly Oil Market Report – May 2018 39
Saudi Arabia In Saudi Arabia, March 2018 oil demand growth remained positive for the third consecutive month, with data indicating a 3% y-o-y increase. The main factor behind the increasing oil requirements is the expansion in crude direct use. Crude oil for power generation was higher on a y-o-y basis by 45 tb/d, while fuel oil demand also increased by 22 tb/d y-o-y, despite seasonally lower requirements for air conditioning.
Diesel oil requirements shed some 55 tb/d or 10% y-o-y. This reduction is primarily on the back of lower construction activities in the country. Transportation fuels, with the exception of jet/kerosene, witnessed a decline. Gasoline dropped by around 35 tb/d, or 6% y-o-y, as a reduction in subsidies and a general slowdown in consumer spending impacted consumption. The consumption of LPG dropped by 5 tb/d on the back of less demand in the petrochemical sector.
Iraq Sluggish oil demand in the first three months of 2018 has been observed in Iraq. This is mainly the result of a decline in crude direct use. The overall decline, however, has been partly offset by rising requirements in all main petroleum product categories, with the exception of naphtha and jet/kerosene. Demand was particularly strong for gasoline, gas diesel oil, residual fuel oil and LPG.
Other countries in the Middle East During the 1Q18, oil demand was in the positive in Iran, with gasoline accounting for the bulk of additional volumes, while y-o-y declines were seen in other countries of the region, such as Kuwait and Qatar.
Going forward, oil demand growth in the Middle East is expected to encounter number of downside challenges. For example, substitution with natural gas, as well as partial subsidy removals in several countries and government programmes aimed at lowering oil use in the road transportation sector. On the other hand, developments in economic and industrial activities in various countries of the region are anticipated to support higher oil demand growth in 2018.
For 2017, Middle East oil demand grew by 0.08 mb/d y-o-y, with oil demand in 2018 projected to increase at the same level.
Latin America Graph 4 - 13: Latin American oil demand, y-o-y change
Graph 4 - 14:Brazilian gasoline demand, y-o-y change
-400
-200
0
200
400
600
-400
-200
0
200
400
600
Jan
Feb
Mar Apr
May Jun
Jul
Aug
Sep Oct
Nov
Dec
tb/dtb/d
Historical range Historical average
2017 2018
Sources: Joint Organisations Data Initiative, national and OPEC Secretariat.
-100
-60
-20
20
60
100
Mar
17
Apr
17
May
17
Jun
17
Jul 1
7
Aug
17
Sep
17
Oct
17
Nov
17
Dec
17
Jan
18
Feb
18
Mar
18
tb/d
Sources: Agencia Nacional do Petroleo, Gas e Biocombustiveis of Brazil, Joint Organisations Data Initiative and OPEC Secretariat.
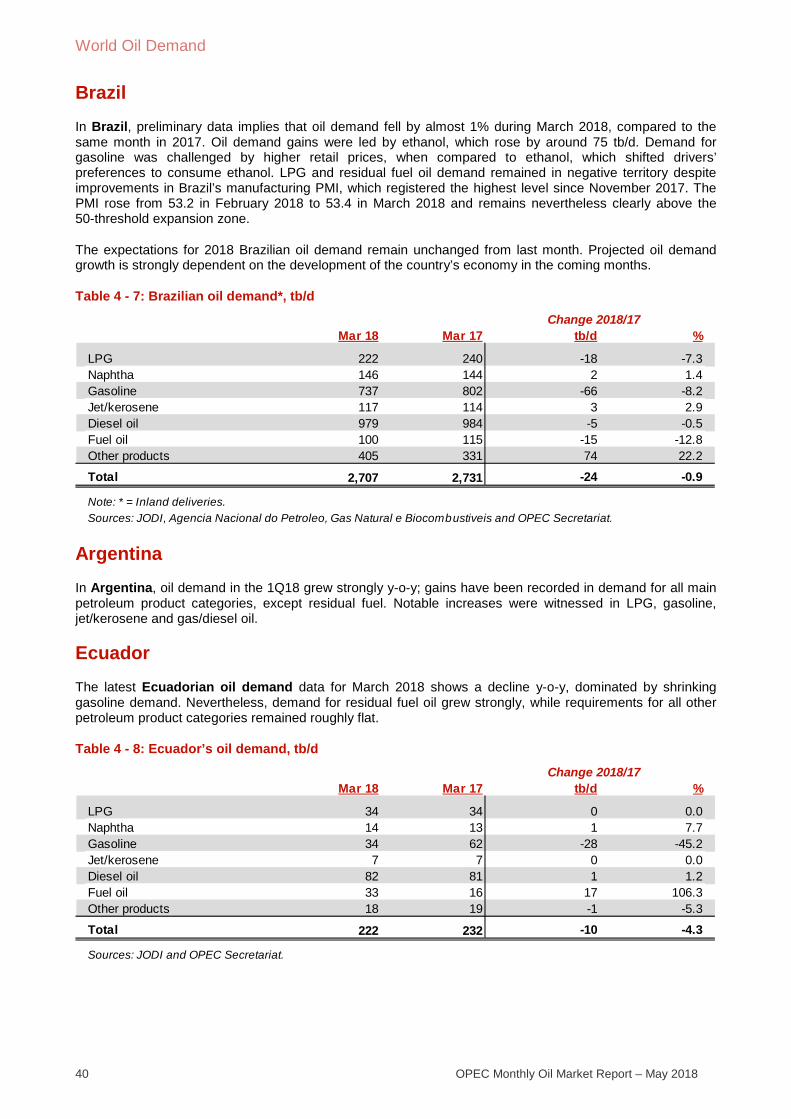
World Oil Demand
40 OPEC Monthly Oil Market Report – May 2018
Brazil In Brazil, preliminary data implies that oil demand fell by almost 1% during March 2018, compared to the same month in 2017. Oil demand gains were led by ethanol, which rose by around 75 tb/d. Demand for gasoline was challenged by higher retail prices, when compared to ethanol, which shifted drivers’ preferences to consume ethanol. LPG and residual fuel oil demand remained in negative territory despite improvements in Brazil’s manufacturing PMI, which registered the highest level since November 2017. The PMI rose from 53.2 in February 2018 to 53.4 in March 2018 and remains nevertheless clearly above the 50-threshold expansion zone.
The expectations for 2018 Brazilian oil demand remain unchanged from last month. Projected oil demand growth is strongly dependent on the development of the country’s economy in the coming months.
Table 4 - 7: Brazilian oil demand*, tb/d
Argentina In Argentina, oil demand in the 1Q18 grew strongly y-o-y; gains have been recorded in demand for all main petroleum product categories, except residual fuel. Notable increases were witnessed in LPG, gasoline, jet/kerosene and gas/diesel oil.
Ecuador The latest Ecuadorian oil demand data for March 2018 shows a decline y-o-y, dominated by shrinking gasoline demand. Nevertheless, demand for residual fuel oil grew strongly, while requirements for all other petroleum product categories remained roughly flat.
Table 4 - 8: Ecuador’s oil demand, tb/d
Mar 18 Mar 17 tb/d %
LPG 222 240 -18 -7.3Naphtha 146 144 2 1.4Gasoline 737 802 -66 -8.2Jet/kerosene 117 114 3 2.9Diesel oil 979 984 -5 -0.5Fuel oil 100 115 -15 -12.8Other products 405 331 74 22.2
Total 2,707 2,731 -24 -0.9
Change 2018/17
Sources: JODI, Agencia Nacional do Petroleo, Gas Natural e Biocombustiveis and OPEC Secretariat.Note: * = Inland deliveries.
Mar 18 Mar 17 tb/d %
LPG 34 34 0 0.0Naphtha 14 13 1 7.7Gasoline 34 62 -28 -45.2Jet/kerosene 7 7 0 0.0Diesel oil 82 81 1 1.2Fuel oil 33 16 17 106.3Other products 18 19 -1 -5.3
Total 222 232 -10 -4.3
Change 2018/17
Sources: JODI and OPEC Secretariat.

World Oil Demand
OPEC Monthly Oil Market Report – May 2018 41
Going forward, potential for 2018 oil demand growth in Latin America points to the upside, mainly given expectations for improving economic conditions in Brazil and Argentina for the remainder of 2018. On the other hand, negative indicators stem from a possible slower-than-expected development in the region’s overall economy, as well as unexpected weather conditions that may limit oil demand growth potential.
Latin American oil demand increased by 0.04 mb/d in 2017. During 2018, oil demand growth in the region is forecast to rise by 0.10 mb/d, compared with 2017.
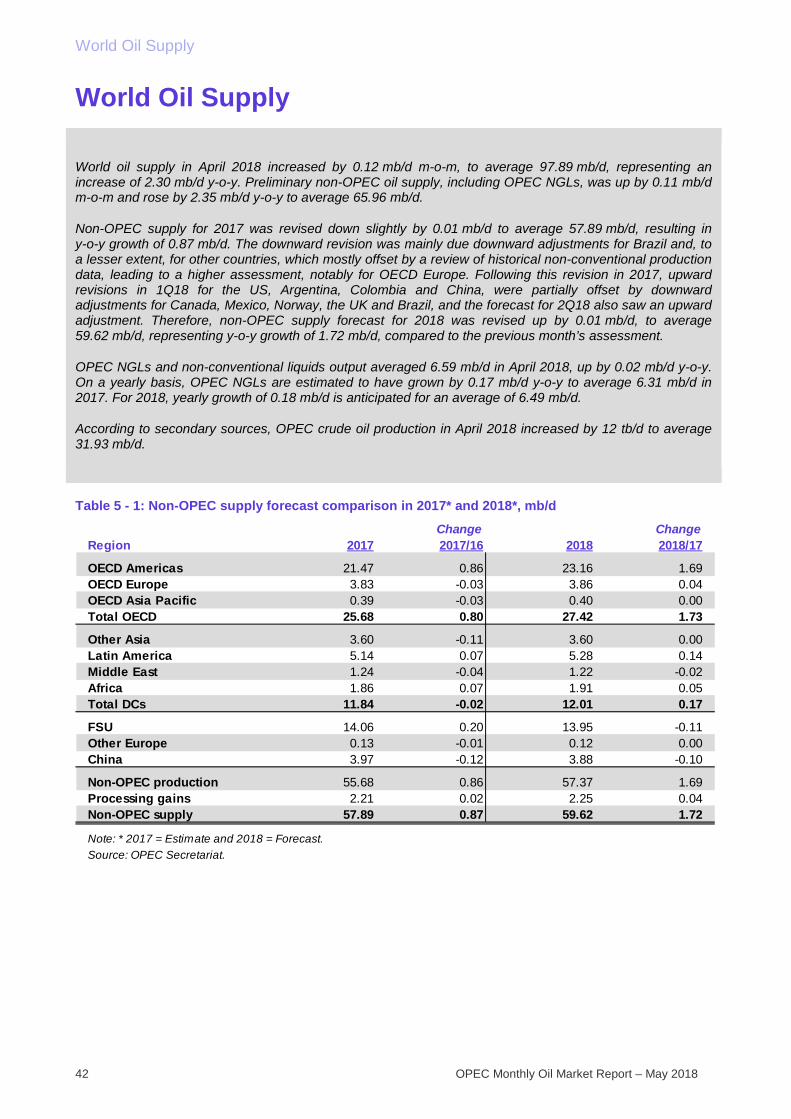
World Oil Supply
42 OPEC Monthly Oil Market Report – May 2018
World Oil Supply
World oil supply in April 2018 increased by 0.12 mb/d m-o-m, to average 97.89 mb/d, representing an increase of 2.30 mb/d y-o-y. Preliminary non-OPEC oil supply, including OPEC NGLs, was up by 0.11 mb/d m-o-m and rose by 2.35 mb/d y-o-y to average 65.96 mb/d.
Non-OPEC supply for 2017 was revised down slightly by 0.01 mb/d to average 57.89 mb/d, resulting in y-o-y growth of 0.87 mb/d. The downward revision was mainly due downward adjustments for Brazil and, to a lesser extent, for other countries, which mostly offset by a review of historical non-conventional production data, leading to a higher assessment, notably for OECD Europe. Following this revision in 2017, upward revisions in 1Q18 for the US, Argentina, Colombia and China, were partially offset by downward adjustments for Canada, Mexico, Norway, the UK and Brazil, and the forecast for 2Q18 also saw an upward adjustment. Therefore, non-OPEC supply forecast for 2018 was revised up by 0.01 mb/d, to average 59.62 mb/d, representing y-o-y growth of 1.72 mb/d, compared to the previous month’s assessment.
OPEC NGLs and non-conventional liquids output averaged 6.59 mb/d in April 2018, up by 0.02 mb/d y-o-y. On a yearly basis, OPEC NGLs are estimated to have grown by 0.17 mb/d y-o-y to average 6.31 mb/d in 2017. For 2018, yearly growth of 0.18 mb/d is anticipated for an average of 6.49 mb/d.
According to secondary sources, OPEC crude oil production in April 2018 increased by 12 tb/d to average 31.93 mb/d.
Table 5 - 1: Non-OPEC supply forecast comparison in 2017* and 2018*, mb/d
Change Change2017 2017/16 2018 2018/17
OECD Americas 21.47 0.86 23.16 1.69OECD Europe 3.83 -0.03 3.86 0.04OECD Asia Pacific 0.39 -0.03 0.40 0.00Total OECD 25.68 0.80 27.42 1.73
Other Asia 3.60 -0.11 3.60 0.00Latin America 5.14 0.07 5.28 0.14Middle East 1.24 -0.04 1.22 -0.02Africa 1.86 0.07 1.91 0.05Total DCs 11.84 -0.02 12.01 0.17
FSU 14.06 0.20 13.95 -0.11Other Europe 0.13 -0.01 0.12 0.00China 3.97 -0.12 3.88 -0.10
Non-OPEC production 55.68 0.86 57.37 1.69Processing gains 2.21 0.02 2.25 0.04Non-OPEC supply 57.89 0.87 59.62 1.72
Note: * 2017 = Estimate and 2018 = Forecast.Source: OPEC Secretariat.
Region
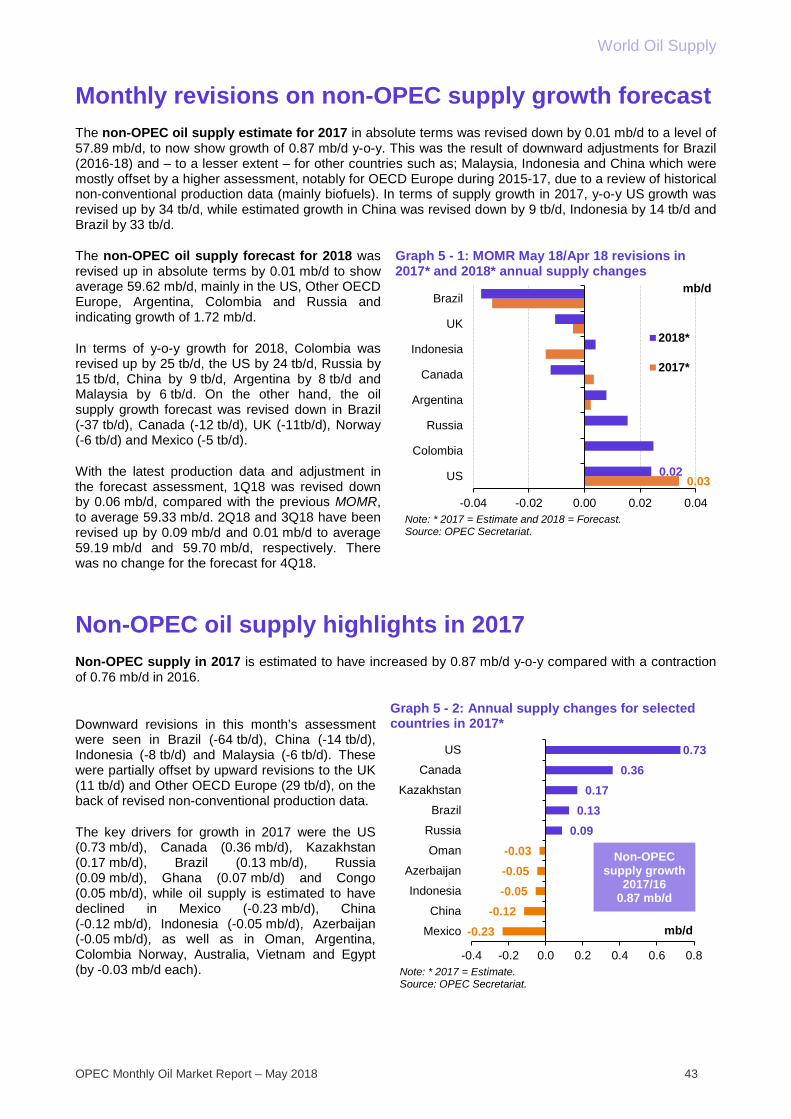
World Oil Supply
OPEC Monthly Oil Market Report – May 2018 43
Monthly revisions on non-OPEC supply growth forecast The non-OPEC oil supply estimate for 2017 in absolute terms was revised down by 0.01 mb/d to a level of 57.89 mb/d, to now show growth of 0.87 mb/d y-o-y. This was the result of downward adjustments for Brazil (2016-18) and – to a lesser extent – for other countries such as; Malaysia, Indonesia and China which were mostly offset by a higher assessment, notably for OECD Europe during 2015-17, due to a review of historical non-conventional production data (mainly biofuels). In terms of supply growth in 2017, y-o-y US growth was revised up by 34 tb/d, while estimated growth in China was revised down by 9 tb/d, Indonesia by 14 tb/d and Brazil by 33 tb/d.
The non-OPEC oil supply forecast for 2018 was revised up in absolute terms by 0.01 mb/d to show average 59.62 mb/d, mainly in the US, Other OECD Europe, Argentina, Colombia and Russia and indicating growth of 1.72 mb/d.
In terms of y-o-y growth for 2018, Colombia was revised up by 25 tb/d, the US by 24 tb/d, Russia by 15 tb/d, China by 9 tb/d, Argentina by 8 tb/d and Malaysia by 6 tb/d. On the other hand, the oil supply growth forecast was revised down in Brazil (-37 tb/d), Canada (-12 tb/d), UK (-11tb/d), Norway (-6 tb/d) and Mexico (-5 tb/d).
With the latest production data and adjustment in the forecast assessment, 1Q18 was revised down by 0.06 mb/d, compared with the previous MOMR, to average 59.33 mb/d. 2Q18 and 3Q18 have been revised up by 0.09 mb/d and 0.01 mb/d to average 59.19 mb/d and 59.70 mb/d, respectively. There was no change for the forecast for 4Q18.
Graph 5 - 1: MOMR May 18/Apr 18 revisions in 2017* and 2018* annual supply changes
Non-OPEC oil supply highlights in 2017 Non-OPEC supply in 2017 is estimated to have increased by 0.87 mb/d y-o-y compared with a contraction of 0.76 mb/d in 2016.
Downward revisions in this month’s assessment were seen in Brazil (-64 tb/d), China (-14 tb/d), Indonesia (-8 tb/d) and Malaysia (-6 tb/d). These were partially offset by upward revisions to the UK (11 tb/d) and Other OECD Europe (29 tb/d), on the back of revised non-conventional production data.
The key drivers for growth in 2017 were the US (0.73 mb/d), Canada (0.36 mb/d), Kazakhstan (0.17 mb/d), Brazil (0.13 mb/d), Russia (0.09 mb/d), Ghana (0.07 mb/d) and Congo (0.05 mb/d), while oil supply is estimated to have declined in Mexico (-0.23 mb/d), China (-0.12 mb/d), Indonesia (-0.05 mb/d), Azerbaijan (-0.05 mb/d), as well as in Oman, Argentina, Colombia Norway, Australia, Vietnam and Egypt (by -0.03 mb/d each).
Graph 5 - 2: Annual supply changes for selected countries in 2017*
0.030.02
-0.04 -0.02 0.00 0.02 0.04
US
Colombia
Russia
Argentina
Canada
Indonesia
UK
Brazilmb/d
2018*
2017*
Note: * 2017 = Estimate and 2018 = Forecast.Source: OPEC Secretariat.
-0.23-0.12
-0.05-0.05-0.03
0.090.13
0.170.36
0.73
-0.4 -0.2 0.0 0.2 0.4 0.6 0.8
Mexico
China
Indonesia
Azerbaijan
Oman
Russia
Brazil
Kazakhstan
Canada
US
mb/d
Note: * 2017 = Estimate.Source: OPEC Secretariat.
Non-OPEC supply growth
2017/160.87 mb/d
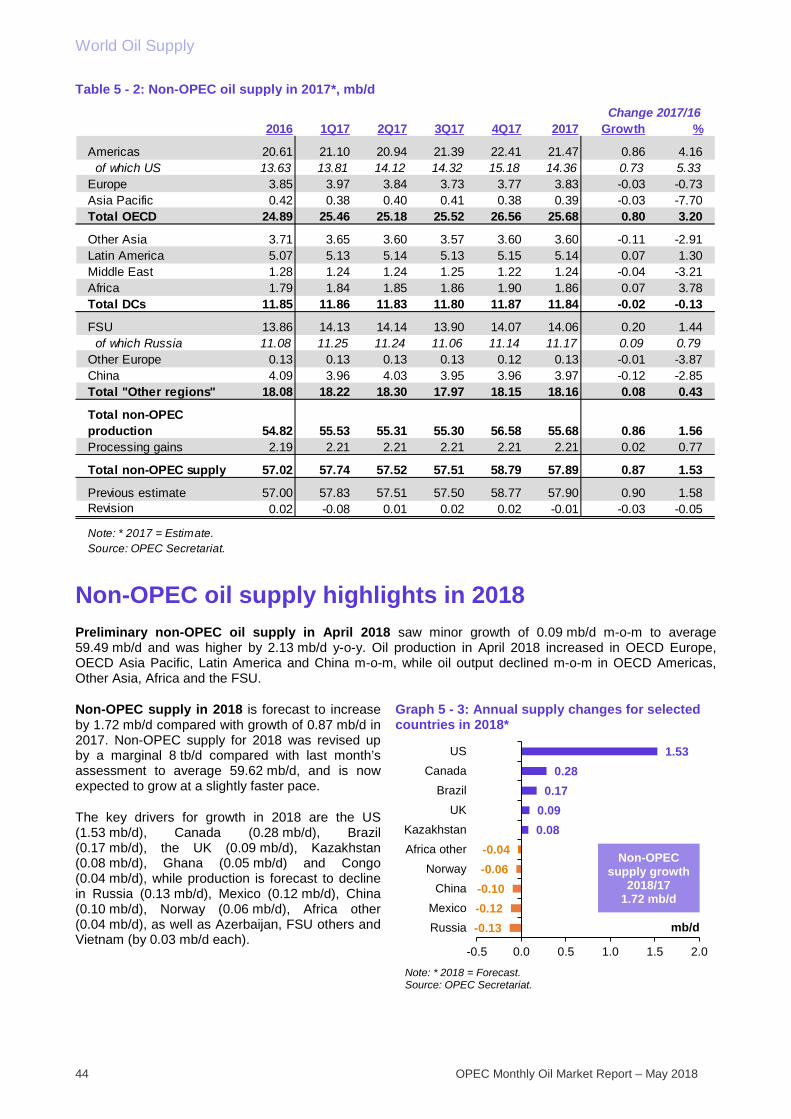
World Oil Supply
44 OPEC Monthly Oil Market Report – May 2018
Table 5 - 2: Non-OPEC oil supply in 2017*, mb/d
Non-OPEC oil supply highlights in 2018 Preliminary non-OPEC oil supply in April 2018 saw minor growth of 0.09 mb/d m-o-m to average 59.49 mb/d and was higher by 2.13 mb/d y-o-y. Oil production in April 2018 increased in OECD Europe, OECD Asia Pacific, Latin America and China m-o-m, while oil output declined m-o-m in OECD Americas, Other Asia, Africa and the FSU.
Non-OPEC supply in 2018 is forecast to increase by 1.72 mb/d compared with growth of 0.87 mb/d in 2017. Non-OPEC supply for 2018 was revised up by a marginal 8 tb/d compared with last month’s assessment to average 59.62 mb/d, and is now expected to grow at a slightly faster pace.
The key drivers for growth in 2018 are the US (1.53 mb/d), Canada (0.28 mb/d), Brazil (0.17 mb/d), the UK (0.09 mb/d), Kazakhstan (0.08 mb/d), Ghana (0.05 mb/d) and Congo (0.04 mb/d), while production is forecast to decline in Russia (0.13 mb/d), Mexico (0.12 mb/d), China (0.10 mb/d), Norway (0.06 mb/d), Africa other (0.04 mb/d), as well as Azerbaijan, FSU others and Vietnam (by 0.03 mb/d each).
Graph 5 - 3: Annual supply changes for selected countries in 2018*
2016 1Q17 2Q17 3Q17 4Q17 2017 Growth %
Americas 20.61 21.10 20.94 21.39 22.41 21.47 0.86 4.16 of which US 13.63 13.81 14.12 14.32 15.18 14.36 0.73 5.33Europe 3.85 3.97 3.84 3.73 3.77 3.83 -0.03 -0.73Asia Pacific 0.42 0.38 0.40 0.41 0.38 0.39 -0.03 -7.70Total OECD 24.89 25.46 25.18 25.52 26.56 25.68 0.80 3.20
Other Asia 3.71 3.65 3.60 3.57 3.60 3.60 -0.11 -2.91Latin America 5.07 5.13 5.14 5.13 5.15 5.14 0.07 1.30Middle East 1.28 1.24 1.24 1.25 1.22 1.24 -0.04 -3.21Africa 1.79 1.84 1.85 1.86 1.90 1.86 0.07 3.78Total DCs 11.85 11.86 11.83 11.80 11.87 11.84 -0.02 -0.13
FSU 13.86 14.13 14.14 13.90 14.07 14.06 0.20 1.44 of which Russia 11.08 11.25 11.24 11.06 11.14 11.17 0.09 0.79Other Europe 0.13 0.13 0.13 0.13 0.12 0.13 -0.01 -3.87China 4.09 3.96 4.03 3.95 3.96 3.97 -0.12 -2.85Total "Other regions" 18.08 18.22 18.30 17.97 18.15 18.16 0.08 0.43
Total non-OPEC production 54.82 55.53 55.31 55.30 56.58 55.68 0.86 1.56Processing gains 2.19 2.21 2.21 2.21 2.21 2.21 0.02 0.77
Total non-OPEC supply 57.02 57.74 57.52 57.51 58.79 57.89 0.87 1.53
Previous estimate 57.00 57.83 57.51 57.50 58.77 57.90 0.90 1.58Revision 0.02 -0.08 0.01 0.02 0.02 -0.01 -0.03 -0.05
Note: * 2017 = Estimate.Source: OPEC Secretariat.
Change 2017/16
-0.13-0.12-0.10-0.06-0.04
0.080.09
0.170.28
1.53
-0.5 0.0 0.5 1.0 1.5 2.0
RussiaMexicoChina
NorwayAfrica other
KazakhstanUK
BrazilCanada
US
mb/d
Non-OPEC supply growth
2018/171.72 mb/d
Note: * 2018 = Forecast.Source: OPEC Secretariat.
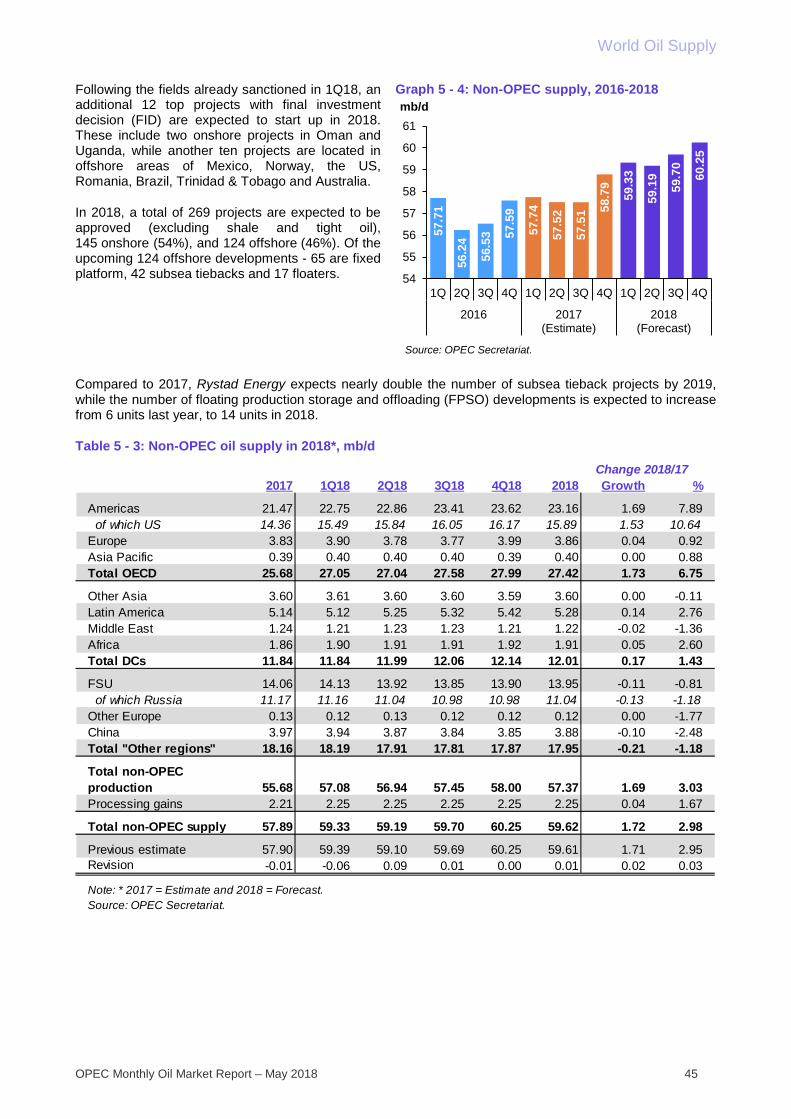
World Oil Supply
OPEC Monthly Oil Market Report – May 2018 45
Following the fields already sanctioned in 1Q18, an additional 12 top projects with final investment decision (FID) are expected to start up in 2018. These include two onshore projects in Oman and Uganda, while another ten projects are located in offshore areas of Mexico, Norway, the US, Romania, Brazil, Trinidad & Tobago and Australia.
In 2018, a total of 269 projects are expected to be approved (excluding shale and tight oil), 145 onshore (54%), and 124 offshore (46%). Of the upcoming 124 offshore developments - 65 are fixed platform, 42 subsea tiebacks and 17 floaters.
Graph 5 - 4: Non-OPEC supply, 2016-2018
Compared to 2017, Rystad Energy expects nearly double the number of subsea tieback projects by 2019, while the number of floating production storage and offloading (FPSO) developments is expected to increase from 6 units last year, to 14 units in 2018.
Table 5 - 3: Non-OPEC oil supply in 2018*, mb/d
57.7
1
56.2
4
56.5
3 57.5
9
57.7
4
57.5
2
57.5
1 58.7
9
59.3
3
59.1
9
59.7
0
60.2
5
54
55
56
57
58
59
60
61
1Q 2Q 3Q 4Q 1Q 2Q 3Q 4Q 1Q 2Q 3Q 4Q
2016 2017(Estimate)
2018(Forecast)
mb/d
Source: OPEC Secretariat.
2017 1Q18 2Q18 3Q18 4Q18 2018 Growth %
Americas 21.47 22.75 22.86 23.41 23.62 23.16 1.69 7.89 of which US 14.36 15.49 15.84 16.05 16.17 15.89 1.53 10.64Europe 3.83 3.90 3.78 3.77 3.99 3.86 0.04 0.92Asia Pacific 0.39 0.40 0.40 0.40 0.39 0.40 0.00 0.88Total OECD 25.68 27.05 27.04 27.58 27.99 27.42 1.73 6.75
Other Asia 3.60 3.61 3.60 3.60 3.59 3.60 0.00 -0.11Latin America 5.14 5.12 5.25 5.32 5.42 5.28 0.14 2.76Middle East 1.24 1.21 1.23 1.23 1.21 1.22 -0.02 -1.36Africa 1.86 1.90 1.91 1.91 1.92 1.91 0.05 2.60Total DCs 11.84 11.84 11.99 12.06 12.14 12.01 0.17 1.43
FSU 14.06 14.13 13.92 13.85 13.90 13.95 -0.11 -0.81 of which Russia 11.17 11.16 11.04 10.98 10.98 11.04 -0.13 -1.18Other Europe 0.13 0.12 0.13 0.12 0.12 0.12 0.00 -1.77China 3.97 3.94 3.87 3.84 3.85 3.88 -0.10 -2.48Total "Other regions" 18.16 18.19 17.91 17.81 17.87 17.95 -0.21 -1.18
Total non-OPEC production 55.68 57.08 56.94 57.45 58.00 57.37 1.69 3.03Processing gains 2.21 2.25 2.25 2.25 2.25 2.25 0.04 1.67
Total non-OPEC supply 57.89 59.33 59.19 59.70 60.25 59.62 1.72 2.98
Previous estimate 57.90 59.39 59.10 59.69 60.25 59.61 1.71 2.95Revision -0.01 -0.06 0.09 0.01 0.00 0.01 0.02 0.03
Note: * 2017 = Estimate and 2018 = Forecast.Source: OPEC Secretariat.
Change 2018/17
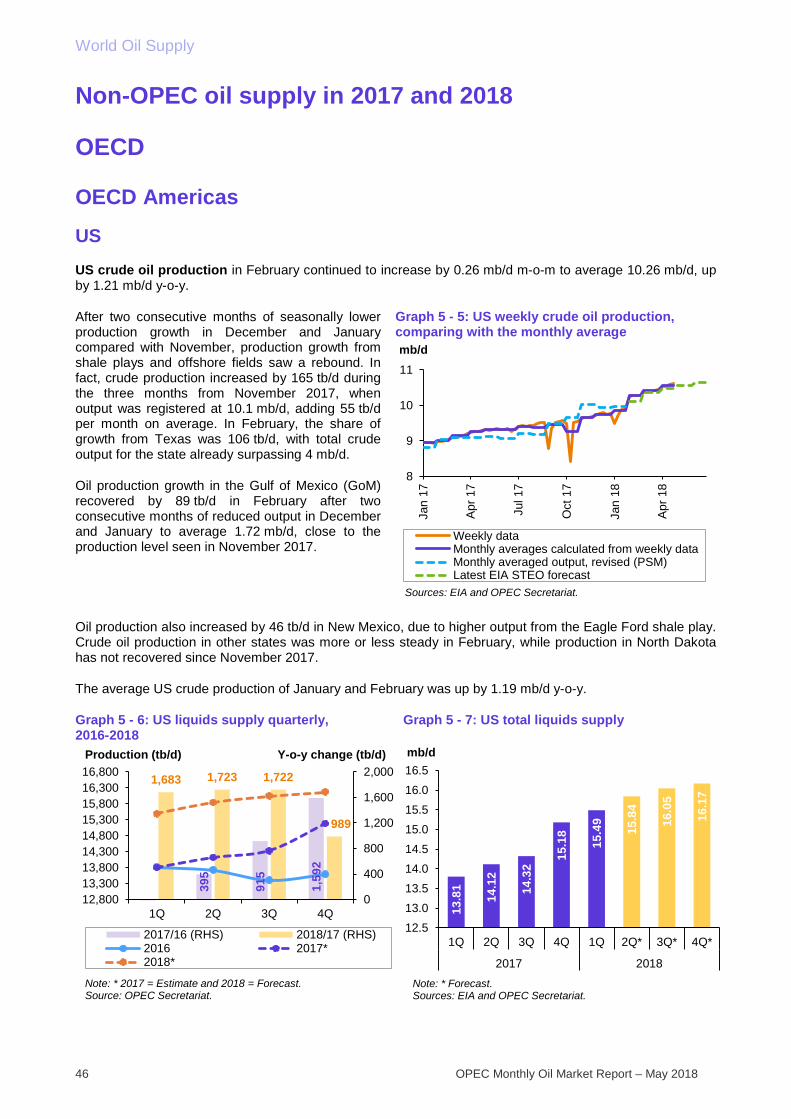
World Oil Supply
46 OPEC Monthly Oil Market Report – May 2018
Non-OPEC oil supply in 2017 and 2018
OECD
OECD Americas
US US crude oil production in February continued to increase by 0.26 mb/d m-o-m to average 10.26 mb/d, up by 1.21 mb/d y-o-y.
After two consecutive months of seasonally lower production growth in December and January compared with November, production growth from shale plays and offshore fields saw a rebound. In fact, crude production increased by 165 tb/d during the three months from November 2017, when output was registered at 10.1 mb/d, adding 55 tb/d per month on average. In February, the share of growth from Texas was 106 tb/d, with total crude output for the state already surpassing 4 mb/d.
Oil production growth in the Gulf of Mexico (GoM) recovered by 89 tb/d in February after two consecutive months of reduced output in December and January to average 1.72 mb/d, close to the production level seen in November 2017.
Graph 5 - 5: US weekly crude oil production, comparing with the monthly average
Oil production also increased by 46 tb/d in New Mexico, due to higher output from the Eagle Ford shale play. Crude oil production in other states was more or less steady in February, while production in North Dakota has not recovered since November 2017.
The average US crude production of January and February was up by 1.19 mb/d y-o-y.
Graph 5 - 6: US liquids supply quarterly, 2016-2018
Graph 5 - 7: US total liquids supply
8
9
10
11
Jan
17
Apr
17
Jul 1
7
Oct
17
Jan
18
Apr
18
mb/d
Weekly dataMonthly averages calculated from weekly dataMonthly averaged output, revised (PSM)Latest EIA STEO forecast
Sources: EIA and OPEC Secretariat.
395
915
1,59
2
1,683 1,723 1,722
989
0
400
800
1,200
1,600
2,000
12,80013,30013,80014,30014,80015,30015,80016,30016,800
1Q 2Q 3Q 4Q
2017/16 (RHS) 2018/17 (RHS)2016 2017*2018*
Note: * 2017 = Estimate and 2018 = Forecast.Source: OPEC Secretariat.
Y-o-y change (tb/d)Production (tb/d)
13.8
1
14.1
2
14.3
2
15.1
8
15.4
9
15.8
4
16.0
5
16.1
7
12.513.013.514.014.515.015.516.016.5
1Q 2Q 3Q 4Q 1Q 2Q* 3Q* 4Q*
2017 2018
mb/d
Note: * Forecast.Sources: EIA and OPEC Secretariat.
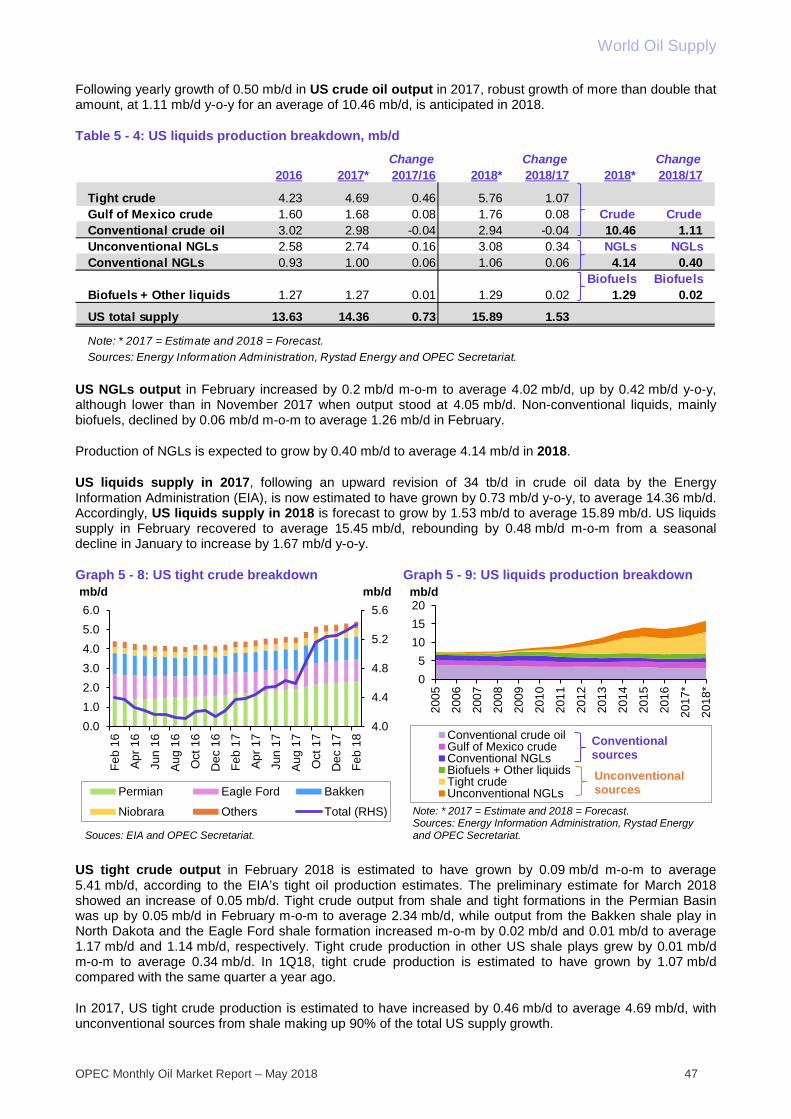
World Oil Supply
OPEC Monthly Oil Market Report – May 2018 47
Following yearly growth of 0.50 mb/d in US crude oil output in 2017, robust growth of more than double that amount, at 1.11 mb/d y-o-y for an average of 10.46 mb/d, is anticipated in 2018.
Table 5 - 4: US liquids production breakdown, mb/d
US NGLs output in February increased by 0.2 mb/d m-o-m to average 4.02 mb/d, up by 0.42 mb/d y-o-y, although lower than in November 2017 when output stood at 4.05 mb/d. Non-conventional liquids, mainly biofuels, declined by 0.06 mb/d m-o-m to average 1.26 mb/d in February.
Production of NGLs is expected to grow by 0.40 mb/d to average 4.14 mb/d in 2018.
US liquids supply in 2017, following an upward revision of 34 tb/d in crude oil data by the Energy Information Administration (EIA), is now estimated to have grown by 0.73 mb/d y-o-y, to average 14.36 mb/d. Accordingly, US liquids supply in 2018 is forecast to grow by 1.53 mb/d to average 15.89 mb/d. US liquids supply in February recovered to average 15.45 mb/d, rebounding by 0.48 mb/d m-o-m from a seasonal decline in January to increase by 1.67 mb/d y-o-y.
Graph 5 - 8: US tight crude breakdown Graph 5 - 9: US liquids production breakdown
US tight crude output in February 2018 is estimated to have grown by 0.09 mb/d m-o-m to average 5.41 mb/d, according to the EIA’s tight oil production estimates. The preliminary estimate for March 2018 showed an increase of 0.05 mb/d. Tight crude output from shale and tight formations in the Permian Basin was up by 0.05 mb/d in February m-o-m to average 2.34 mb/d, while output from the Bakken shale play in North Dakota and the Eagle Ford shale formation increased m-o-m by 0.02 mb/d and 0.01 mb/d to average 1.17 mb/d and 1.14 mb/d, respectively. Tight crude production in other US shale plays grew by 0.01 mb/d m-o-m to average 0.34 mb/d. In 1Q18, tight crude production is estimated to have grown by 1.07 mb/d compared with the same quarter a year ago.
In 2017, US tight crude production is estimated to have increased by 0.46 mb/d to average 4.69 mb/d, with unconventional sources from shale making up 90% of the total US supply growth.
Change Change Change2016 2017* 2017/16 2018* 2018/17 2018* 2018/17
Tight crude 4.23 4.69 0.46 5.76 1.07Gulf of Mexico crude 1.60 1.68 0.08 1.76 0.08 Crude CrudeConventional crude oil 3.02 2.98 -0.04 2.94 -0.04 10.46 1.11Unconventional NGLs 2.58 2.74 0.16 3.08 0.34 NGLs NGLsConventional NGLs 0.93 1.00 0.06 1.06 0.06 4.14 0.40
Biofuels BiofuelsBiofuels + Other liquids 1.27 1.27 0.01 1.29 0.02 1.29 0.02
US total supply 13.63 14.36 0.73 15.89 1.53
Note: * 2017 = Estimate and 2018 = Forecast.Sources: Energy Information Administration, Rystad Energy and OPEC Secretariat.
4.0
4.4
4.8
5.2
5.6
0.01.02.03.04.05.06.0
Feb
16
Apr
16
Jun
16
Aug
16
Oct
16
Dec
16
Feb
17
Apr
17
Jun
17
Aug
17
Oct
17
Dec
17
Feb
18
mb/dmb/d
Permian Eagle Ford Bakken
Niobrara Others Total (RHS)
Souces: EIA and OPEC Secretariat.
05
101520
2005
2006
2007
2008
2009
2010
2011
2012
2013
2014
2015
2016
2017
*
2018
*
mb/d
Conventional crude oilGulf of Mexico crudeConventional NGLsBiofuels + Other liquidsTight crudeUnconventional NGLs
Note: * 2017 = Estimate and 2018 = Forecast.Sources: Energy Information Administration, Rystad Energy and OPEC Secretariat.
Conventionalsources
Unconventionalsources

World Oil Supply
48 OPEC Monthly Oil Market Report – May 2018
For 2018, US tight crude is forecast to grow by 1.07 mb/d y-o-y to average 5.76 mb/d, and hold a share of 94% of total supply, due to upgraded completion metrics.
Table 5 - 5: US tight oil production growth in 2017 and 2018
US oil rig count
The total US rig (oil and gas) count increased by 11 units w-o-w to 1,032 units in the week ended 4 May, which is the highest number of units since April 2015.
The US oil rig count increased by 9 units w-o-w to reach 834 rigs, the fifth consecutive weekly increase and the highest since March 2015. The corresponding y-o-y increase was 131 units, or 19%. Horizontal rigs (active in oil and gas fields) moved up by 12 units w-o-w to reach 913 rigs.
Graph 5 - 10: The comparison between WTI price, US oil rig count and US crude oil production
Table 5 - 6: US rotary rig count on 4 May 2018
Shale playtb/d Production Y-o-y change Production Y-o-y change
Permian tight 1.91 0.46 2.64 0.73Bakken shale 1.06 0.04 1.18 0.12Eagle Ford shale 1.08 -0.09 1.17 0.09Niobrara shale 0.33 0.04 0.39 0.06Other tight plays 0.31 0.02 0.39 0.08
Total 4.69 0.46 5.76 1.07
Note: * 2017 = Estimate and 2018 = Forecast.Source: OPEC Secretariat.
2017* 2018*
03006009001,2001,5001,800
020406080
100120
Jan
14
Jan
15
Jan
16
Jan
17
Jan
18
UnitsUS$/b
WTI spot price (LHS) US oil rig count (RHS 1)
Sources: Baker Hughes, EIA and OPEC Secretariat.
US production (RHS 2)
7
8
9
10
11mb/d
4 May 18 Month ago Year ago M-o-m Y-o-y Y-o-y, %
Oil and gas split Oil 834 808 703 26 131 19%Gas 196 194 173 2 23 13%
Location Onshore 1,013 991 858 22 155 18%Offshore 19 12 19 7 0 0%
Basin Williston 57 55 43 2 14 33%Eagle Ford 67 66 75 1 -8 -11%Permian 458 444 349 14 109 31%
Drilling trajectory Directional 64 63 67 1 -3 -4%Horizontal 913 884 734 29 179 24%Vertical 55 56 76 -1 -21 -28%
US total rig count 1,032 1,003 877 29 155 18%
Sources: Baker Hughes and OPEC Secretariat.
Change

World Oil Supply
OPEC Monthly Oil Market Report – May 2018 49
Canada Canadian oil supply showed a recovery of 0.13 mb/d in February, according to preliminary data, compared with the actual output in January, to average 5.23 mb/d, up by 0.19 mb/d y-o-y. The main increase in February was due to an additional 114 tb/d in oil sands output, resulting in an average of 2.94 mb/d. This was followed by a minor increase of 15 tb/d in conventional crude oil output to average 1.26 mb/d, mainly coming from a production ramp-up at the Hebron offshore field.
However, preliminary oil production data in March and April, following the unplanned outages at Suncor and Mildred Lake as well as production falling at in-situ projects such as Foster Creek and Christina Lake, is showing significant declines of 0.23 mb/d and 0.32 mb/d m-o-m, respectively. In 2017, some 55%, or 2.71 mb/d, of total oil production in Canada came from oil sands, 25% from conventional sources and around 20% from NGLs.
Canada’s 2018 production forecast, following robust growth of 0.36 mb/d in 2017, shows y-o-y growth of 0.28 mb/d, revised down by 0.01 mb/d in absolute supply, to average 5.15 mb/d.
Graph 5 - 11: Canada production by product type Graph 5 - 12: Canada liquids supply quarterly, 2016-2018
Mexico Mexico’s liquids supply in March declined by 0.06 mb/d m-o-m to average 2.09 mb/d, close to the level of 0.08 mb/d that was forecast in the last month’s assessment. It was also lower by 0.24 mb/d y-o-y. Considering January’s output at 2.19 mb/d, this y-o-y drop in March is assumed to have been due partially also to maintenance. Nevertheless, oil production in 1Q18 showed q-o-q growth of 0.02 mb/d to average 2.15 mb/d, spurred on by improved performance at offshore fields, compared to 4Q17.
Crude oil production in March indicated a m-o-m drop of 0.06 mb/d to average 1.84 mb/d, while NGL production was steady at 0.25 mb/d. The m-o-m decline in Mexico’s crude oil output was mainly due to the declines seen at three main fields: the KMZ complex, the Cantarel field as well as the Chuc field, all of which are located offshore.
Mexico’s liquids supply for 2018, following a downward revision of 5 tb/d in absolute supply due to a downward adjustment of 21 tb/d in 1Q18, is expected to contract by 0.12 mb/d, less than the decline seen a year earlier, to average 2.11 mb/d.
0
1
2
3
Apr
14
Jul 1
4O
ct 1
4Ja
n 15
Apr
15
Jul 1
5O
ct 1
5Ja
n 16
Apr
16
Jul 1
6O
ct 1
6Ja
n 17
Apr
17
Jul 1
7O
ct 1
7Ja
n 18
Apr
18
mb/d
Conventional crude oilNGLsSynthetic crude + crude bitumen
Source: OPEC Secretariat.
307
613
297
233
141
362
340
283
0100200300400500600700
3,500
4,000
4,500
5,000
5,500
1Q 2Q 3Q 4Q
2017/16 (RHS) 2018/17 (RHS)2016 2017*2018*
Note: * 2017 = Estimate and 2018 = Forecast.Source: OPEC Secretariat.
Y-o-y change (tb/d)Production (tb/d)
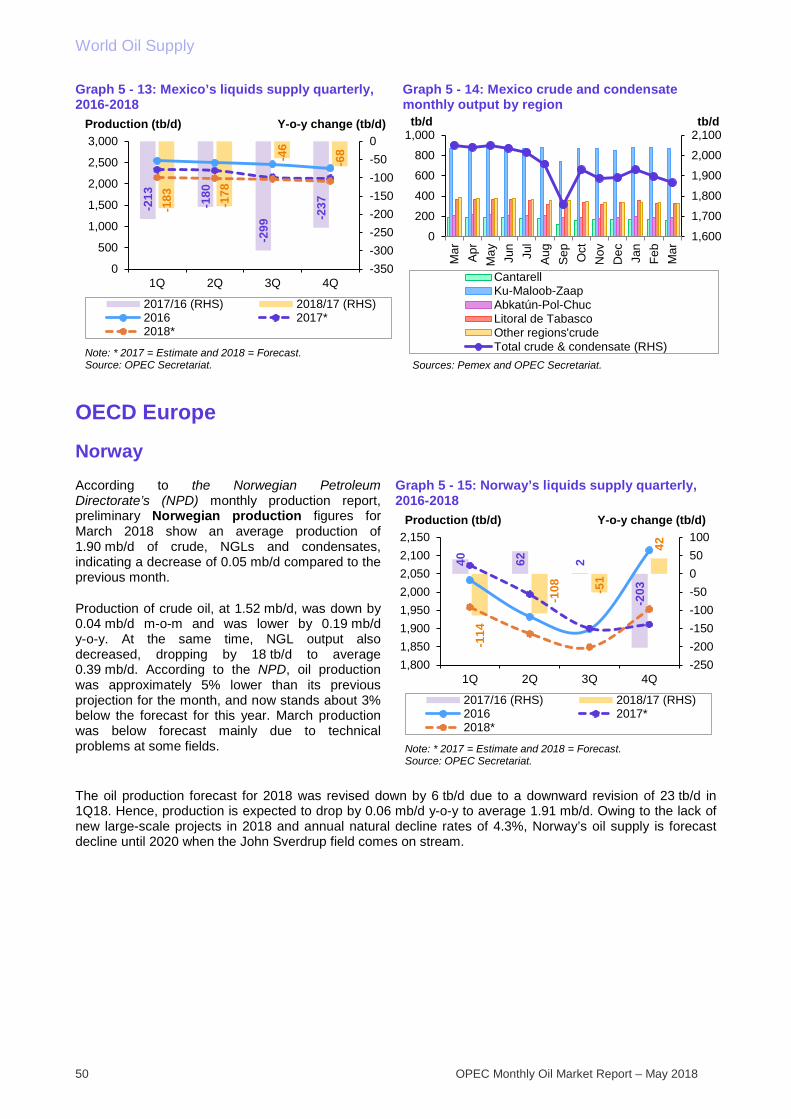
World Oil Supply
50 OPEC Monthly Oil Market Report – May 2018
Graph 5 - 13: Mexico’s liquids supply quarterly, 2016-2018
Graph 5 - 14: Mexico crude and condensate monthly output by region
OECD Europe
Norway According to the Norwegian Petroleum Directorate’s (NPD) monthly production report, preliminary Norwegian production figures for March 2018 show an average production of 1.90 mb/d of crude, NGLs and condensates, indicating a decrease of 0.05 mb/d compared to the previous month.
Production of crude oil, at 1.52 mb/d, was down by 0.04 mb/d m-o-m and was lower by 0.19 mb/d y-o-y. At the same time, NGL output also decreased, dropping by 18 tb/d to average 0.39 mb/d. According to the NPD, oil production was approximately 5% lower than its previous projection for the month, and now stands about 3% below the forecast for this year. March production was below forecast mainly due to technical problems at some fields.
Graph 5 - 15: Norway’s liquids supply quarterly, 2016-2018
The oil production forecast for 2018 was revised down by 6 tb/d due to a downward revision of 23 tb/d in 1Q18. Hence, production is expected to drop by 0.06 mb/d y-o-y to average 1.91 mb/d. Owing to the lack of new large-scale projects in 2018 and annual natural decline rates of 4.3%, Norway’s oil supply is forecast decline until 2020 when the John Sverdrup field comes on stream.
-213 -180
-299
-237-1
83 -178
-46
-68
-350-300-250-200-150-100-500
0
500
1,000
1,500
2,000
2,500
3,000
1Q 2Q 3Q 4Q
2017/16 (RHS) 2018/17 (RHS)2016 2017*2018*
Note: * 2017 = Estimate and 2018 = Forecast.Source: OPEC Secretariat.
Y-o-y change (tb/d)Production (tb/d)
1,600
1,700
1,800
1,900
2,000
2,100
0
200
400
600
800
1,000
Mar Ap
rM
ay Jun
Jul
Aug
Sep
Oct
Nov
Dec Jan
Feb
Mar
tb/dtb/d
CantarellKu-Maloob-ZaapAbkatún-Pol-ChucLitoral de TabascoOther regions'crudeTotal crude & condensate (RHS)
Sources: Pemex and OPEC Secretariat.
40 62 2
-203
-114
-108 -5
1
42-250-200-150-100-50050100
1,8001,8501,9001,9502,0002,0502,1002,150
1Q 2Q 3Q 4Q
2017/16 (RHS) 2018/17 (RHS)2016 2017*2018*
Note: * 2017 = Estimate and 2018 = Forecast.Source: OPEC Secretariat.
Y-o-y change (tb/d)Production (tb/d)
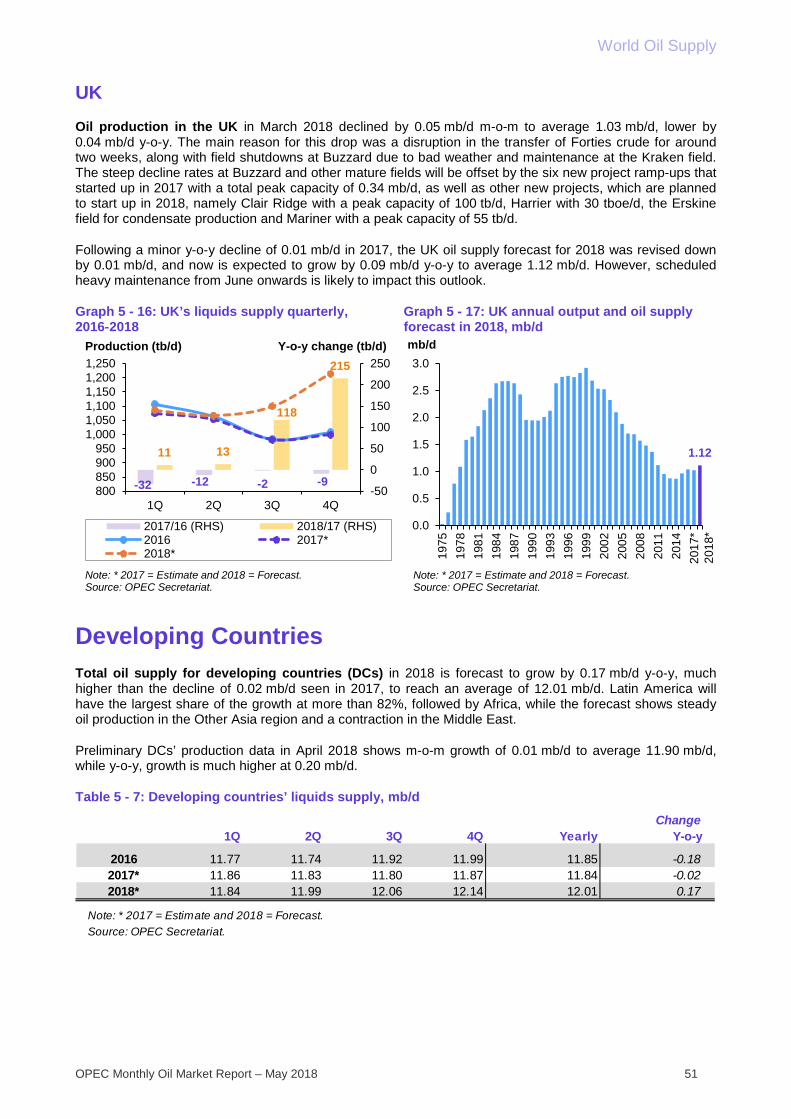
World Oil Supply
OPEC Monthly Oil Market Report – May 2018 51
UK Oil production in the UK in March 2018 declined by 0.05 mb/d m-o-m to average 1.03 mb/d, lower by 0.04 mb/d y-o-y. The main reason for this drop was a disruption in the transfer of Forties crude for around two weeks, along with field shutdowns at Buzzard due to bad weather and maintenance at the Kraken field. The steep decline rates at Buzzard and other mature fields will be offset by the six new project ramp-ups that started up in 2017 with a total peak capacity of 0.34 mb/d, as well as other new projects, which are planned to start up in 2018, namely Clair Ridge with a peak capacity of 100 tb/d, Harrier with 30 tboe/d, the Erskine field for condensate production and Mariner with a peak capacity of 55 tb/d.
Following a minor y-o-y decline of 0.01 mb/d in 2017, the UK oil supply forecast for 2018 was revised down by 0.01 mb/d, and now is expected to grow by 0.09 mb/d y-o-y to average 1.12 mb/d. However, scheduled heavy maintenance from June onwards is likely to impact this outlook.
Graph 5 - 16: UK’s liquids supply quarterly, 2016-2018
Graph 5 - 17: UK annual output and oil supply forecast in 2018, mb/d
Developing Countries Total oil supply for developing countries (DCs) in 2018 is forecast to grow by 0.17 mb/d y-o-y, much higher than the decline of 0.02 mb/d seen in 2017, to reach an average of 12.01 mb/d. Latin America will have the largest share of the growth at more than 82%, followed by Africa, while the forecast shows steady oil production in the Other Asia region and a contraction in the Middle East.
Preliminary DCs’ production data in April 2018 shows m-o-m growth of 0.01 mb/d to average 11.90 mb/d, while y-o-y, growth is much higher at 0.20 mb/d.
Table 5 - 7: Developing countries’ liquids supply, mb/d
-32 -12 -2 -9
11 13
118
215
-50
0
50
100
150
200
250
800850900950
1,0001,0501,1001,1501,2001,250
1Q 2Q 3Q 4Q
2017/16 (RHS) 2018/17 (RHS)2016 2017*2018*
Note: * 2017 = Estimate and 2018 = Forecast.Source: OPEC Secretariat.
Y-o-y change (tb/d)Production (tb/d)
1.12
0.0
0.5
1.0
1.5
2.0
2.5
3.0
1975
1978
1981
1984
1987
1990
1993
1996
1999
2002
2005
2008
2011
2014
2017
*
mb/d
Note: * 2017 = Estimate and 2018 = Forecast.Source: OPEC Secretariat.
2018
*
Change1Q 2Q 3Q 4Q Yearly Y-o-y
2016 11.77 11.74 11.92 11.99 11.85 -0.182017* 11.86 11.83 11.80 11.87 11.84 -0.022018* 11.84 11.99 12.06 12.14 12.01 0.17
Note: * 2017 = Estimate and 2018 = Forecast.Source: OPEC Secretariat.
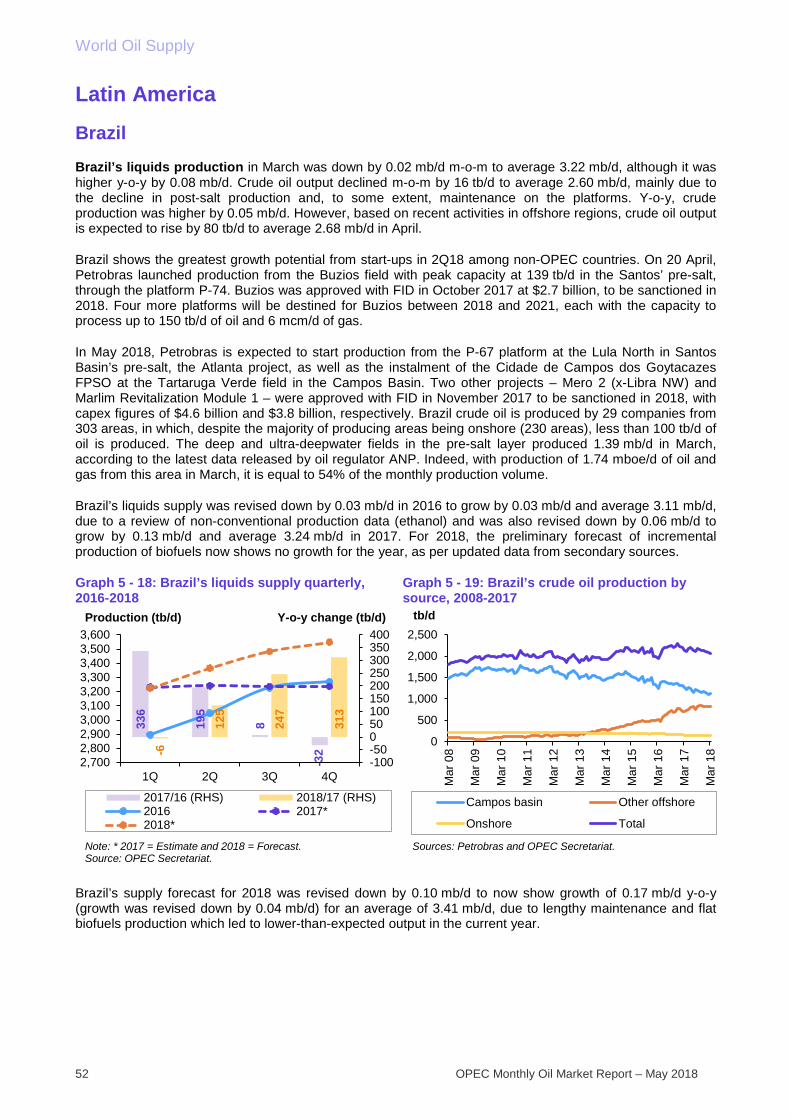
World Oil Supply
52 OPEC Monthly Oil Market Report – May 2018
Latin America
Brazil Brazil’s liquids production in March was down by 0.02 mb/d m-o-m to average 3.22 mb/d, although it was higher y-o-y by 0.08 mb/d. Crude oil output declined m-o-m by 16 tb/d to average 2.60 mb/d, mainly due to the decline in post-salt production and, to some extent, maintenance on the platforms. Y-o-y, crude production was higher by 0.05 mb/d. However, based on recent activities in offshore regions, crude oil output is expected to rise by 80 tb/d to average 2.68 mb/d in April.
Brazil shows the greatest growth potential from start-ups in 2Q18 among non-OPEC countries. On 20 April, Petrobras launched production from the Buzios field with peak capacity at 139 tb/d in the Santos’ pre-salt, through the platform P-74. Buzios was approved with FID in October 2017 at $2.7 billion, to be sanctioned in 2018. Four more platforms will be destined for Buzios between 2018 and 2021, each with the capacity to process up to 150 tb/d of oil and 6 mcm/d of gas.
In May 2018, Petrobras is expected to start production from the P-67 platform at the Lula North in Santos Basin’s pre-salt, the Atlanta project, as well as the instalment of the Cidade de Campos dos Goytacazes FPSO at the Tartaruga Verde field in the Campos Basin. Two other projects – Mero 2 (x-Libra NW) and Marlim Revitalization Module 1 – were approved with FID in November 2017 to be sanctioned in 2018, with capex figures of $4.6 billion and $3.8 billion, respectively. Brazil crude oil is produced by 29 companies from 303 areas, in which, despite the majority of producing areas being onshore (230 areas), less than 100 tb/d of oil is produced. The deep and ultra-deepwater fields in the pre-salt layer produced 1.39 mb/d in March, according to the latest data released by oil regulator ANP. Indeed, with production of 1.74 mboe/d of oil and gas from this area in March, it is equal to 54% of the monthly production volume.
Brazil’s liquids supply was revised down by 0.03 mb/d in 2016 to grow by 0.03 mb/d and average 3.11 mb/d, due to a review of non-conventional production data (ethanol) and was also revised down by 0.06 mb/d to grow by 0.13 mb/d and average 3.24 mb/d in 2017. For 2018, the preliminary forecast of incremental production of biofuels now shows no growth for the year, as per updated data from secondary sources.
Graph 5 - 18: Brazil’s liquids supply quarterly, 2016-2018
Graph 5 - 19: Brazil’s crude oil production by source, 2008-2017
Brazil’s supply forecast for 2018 was revised down by 0.10 mb/d to now show growth of 0.17 mb/d y-o-y (growth was revised down by 0.04 mb/d) for an average of 3.41 mb/d, due to lengthy maintenance and flat biofuels production which led to lower-than-expected output in the current year.
336
195
8
-32-6
125
247
313
-100-50050100150200250300350400
2,7002,8002,9003,0003,1003,2003,3003,4003,5003,600
1Q 2Q 3Q 4Q
2017/16 (RHS) 2018/17 (RHS)2016 2017*2018*
Note: * 2017 = Estimate and 2018 = Forecast.Source: OPEC Secretariat.
Y-o-y change (tb/d)Production (tb/d)
0
500
1,000
1,500
2,000
2,500
Mar
08
Mar
09
Mar
10
Mar
11
Mar
12
Mar
13
Mar
14
Mar
15
Mar
16
Mar
17
Mar
18
tb/d
Campos basin Other offshore
Onshore Total
Sources: Petrobras and OPEC Secretariat.
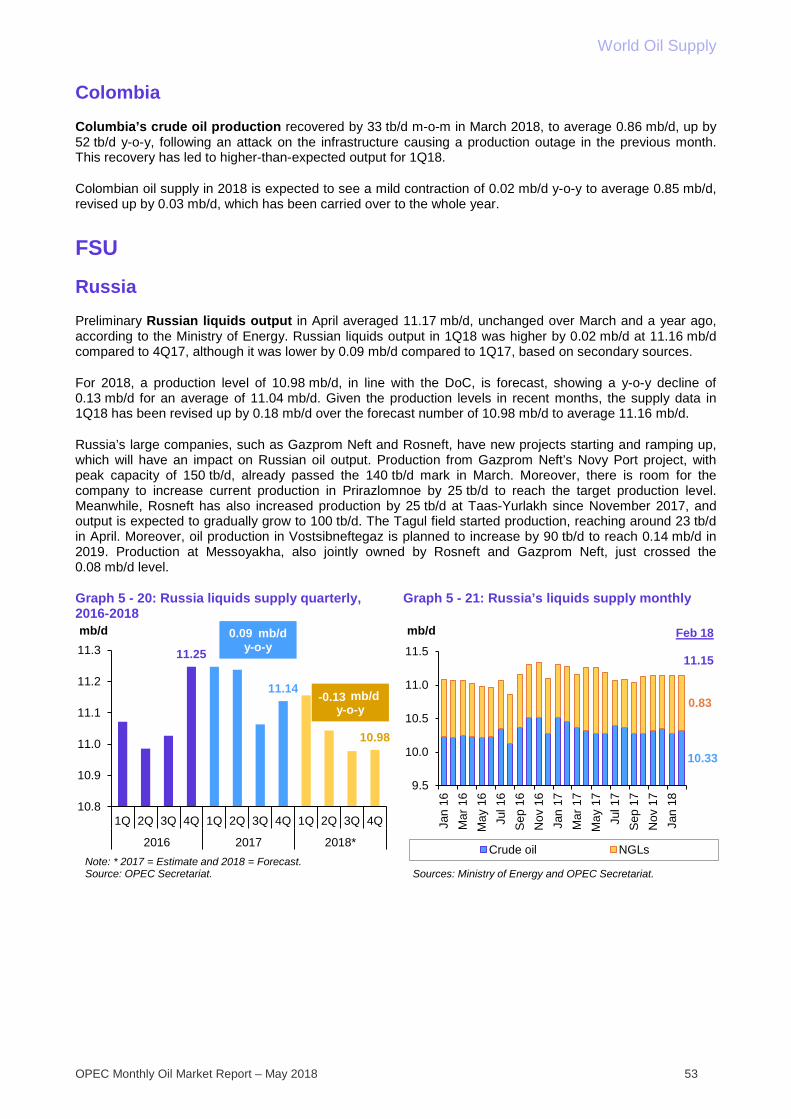
World Oil Supply
OPEC Monthly Oil Market Report – May 2018 53
Colombia Columbia’s crude oil production recovered by 33 tb/d m-o-m in March 2018, to average 0.86 mb/d, up by 52 tb/d y-o-y, following an attack on the infrastructure causing a production outage in the previous month. This recovery has led to higher-than-expected output for 1Q18.
Colombian oil supply in 2018 is expected to see a mild contraction of 0.02 mb/d y-o-y to average 0.85 mb/d, revised up by 0.03 mb/d, which has been carried over to the whole year.
FSU
Russia Preliminary Russian liquids output in April averaged 11.17 mb/d, unchanged over March and a year ago, according to the Ministry of Energy. Russian liquids output in 1Q18 was higher by 0.02 mb/d at 11.16 mb/d compared to 4Q17, although it was lower by 0.09 mb/d compared to 1Q17, based on secondary sources.
For 2018, a production level of 10.98 mb/d, in line with the DoC, is forecast, showing a y-o-y decline of 0.13 mb/d for an average of 11.04 mb/d. Given the production levels in recent months, the supply data in 1Q18 has been revised up by 0.18 mb/d over the forecast number of 10.98 mb/d to average 11.16 mb/d.
Russia’s large companies, such as Gazprom Neft and Rosneft, have new projects starting and ramping up, which will have an impact on Russian oil output. Production from Gazprom Neft’s Novy Port project, with peak capacity of 150 tb/d, already passed the 140 tb/d mark in March. Moreover, there is room for the company to increase current production in Prirazlomnoe by 25 tb/d to reach the target production level. Meanwhile, Rosneft has also increased production by 25 tb/d at Taas-Yurlakh since November 2017, and output is expected to gradually grow to 100 tb/d. The Tagul field started production, reaching around 23 tb/d in April. Moreover, oil production in Vostsibneftegaz is planned to increase by 90 tb/d to reach 0.14 mb/d in 2019. Production at Messoyakha, also jointly owned by Rosneft and Gazprom Neft, just crossed the 0.08 mb/d level.
Graph 5 - 20: Russia liquids supply quarterly, 2016-2018
Graph 5 - 21: Russia’s liquids supply monthly
11.25
11.14
10.98
10.8
10.9
11.0
11.1
11.2
11.3
1Q 2Q 3Q 4Q 1Q 2Q 3Q 4Q 1Q 2Q 3Q 4Q
2016 2017 2018*
mb/d
mb/dy-o-y
Note: * 2017 = Estimate and 2018 = Forecast.Source: OPEC Secretariat.
-0.13
mb/dy-o-y
0.09
10.33
0.83
9.5
10.0
10.5
11.0
11.5
Jan
16M
ar 1
6M
ay 1
6Ju
l 16
Sep
16
Nov
16
Jan
17M
ar 1
7M
ay 1
7Ju
l 17
Sep
17
Nov
17
Jan
18
mb/d
Crude oil NGLs
Sources: Ministry of Energy and OPEC Secretariat.
Feb 18
11.15
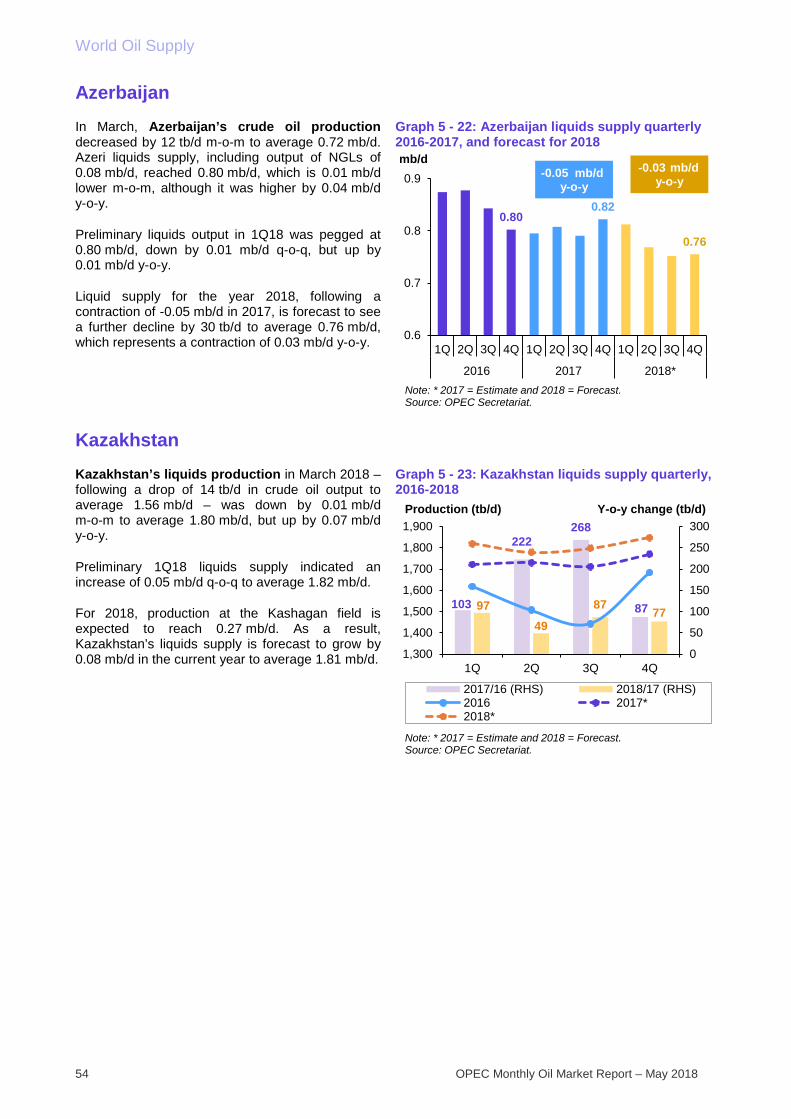
World Oil Supply
54 OPEC Monthly Oil Market Report – May 2018
Azerbaijan In March, Azerbaijan’s crude oil production decreased by 12 tb/d m-o-m to average 0.72 mb/d. Azeri liquids supply, including output of NGLs of 0.08 mb/d, reached 0.80 mb/d, which is 0.01 mb/d lower m-o-m, although it was higher by 0.04 mb/d y-o-y.
Preliminary liquids output in 1Q18 was pegged at 0.80 mb/d, down by 0.01 mb/d q-o-q, but up by 0.01 mb/d y-o-y.
Liquid supply for the year 2018, following a contraction of -0.05 mb/d in 2017, is forecast to see a further decline by 30 tb/d to average 0.76 mb/d, which represents a contraction of 0.03 mb/d y-o-y.
Graph 5 - 22: Azerbaijan liquids supply quarterly 2016-2017, and forecast for 2018
Kazakhstan Kazakhstan’s liquids production in March 2018 – following a drop of 14 tb/d in crude oil output to average 1.56 mb/d – was down by 0.01 mb/d m-o-m to average 1.80 mb/d, but up by 0.07 mb/d y-o-y.
Preliminary 1Q18 liquids supply indicated an increase of 0.05 mb/d q-o-q to average 1.82 mb/d.
For 2018, production at the Kashagan field is expected to reach 0.27 mb/d. As a result, Kazakhstan’s liquids supply is forecast to grow by 0.08 mb/d in the current year to average 1.81 mb/d.
Graph 5 - 23: Kazakhstan liquids supply quarterly, 2016-2018
0.800.82
0.76
0.6
0.7
0.8
0.9
1Q 2Q 3Q 4Q 1Q 2Q 3Q 4Q 1Q 2Q 3Q 4Q
2016 2017 2018*
mb/d
Note: * 2017 = Estimate and 2018 = Forecast.Source: OPEC Secretariat.
mb/dy-o-y
-0.03mb/dy-o-y
-0.05
103
222268
879749
87 77
0
50
100
150
200
250
300
1,300
1,400
1,500
1,600
1,700
1,800
1,900
1Q 2Q 3Q 4Q
2017/16 (RHS) 2018/17 (RHS)2016 2017*2018*
Note: * 2017 = Estimate and 2018 = Forecast.Source: OPEC Secretariat.
Y-o-y change (tb/d)Production (tb/d)
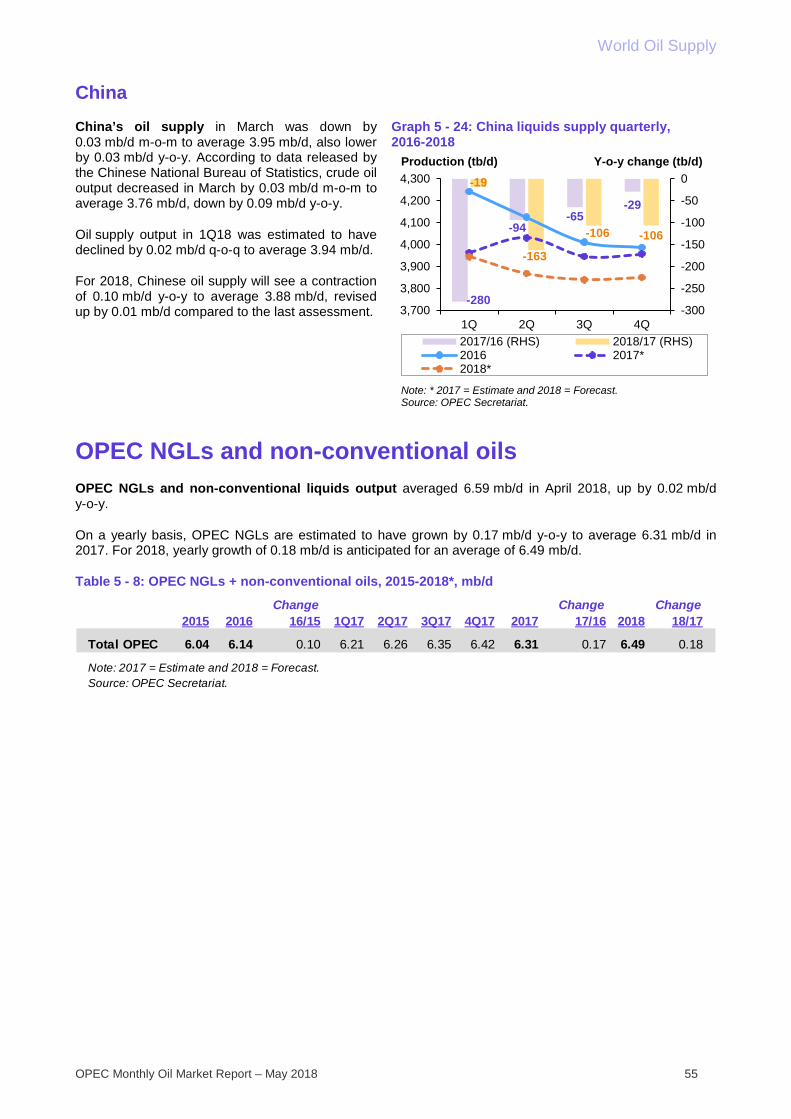
World Oil Supply
OPEC Monthly Oil Market Report – May 2018 55
China China’s oil supply in March was down by 0.03 mb/d m-o-m to average 3.95 mb/d, also lower by 0.03 mb/d y-o-y. According to data released by the Chinese National Bureau of Statistics, crude oil output decreased in March by 0.03 mb/d m-o-m to average 3.76 mb/d, down by 0.09 mb/d y-o-y.
Oil supply output in 1Q18 was estimated to have declined by 0.02 mb/d q-o-q to average 3.94 mb/d.
For 2018, Chinese oil supply will see a contraction of 0.10 mb/d y-o-y to average 3.88 mb/d, revised up by 0.01 mb/d compared to the last assessment.
Graph 5 - 24: China liquids supply quarterly, 2016-2018
OPEC NGLs and non-conventional oils OPEC NGLs and non-conventional liquids output averaged 6.59 mb/d in April 2018, up by 0.02 mb/d y-o-y.
On a yearly basis, OPEC NGLs are estimated to have grown by 0.17 mb/d y-o-y to average 6.31 mb/d in 2017. For 2018, yearly growth of 0.18 mb/d is anticipated for an average of 6.49 mb/d.
Table 5 - 8: OPEC NGLs + non-conventional oils, 2015-2018*, mb/d
-280
-94-65
-29
-19
-163
-106 -106
-300
-250
-200
-150
-100
-50
0
3,700
3,800
3,900
4,000
4,100
4,200
4,300
1Q 2Q 3Q 4Q2017/16 (RHS) 2018/17 (RHS)2016 2017*2018*
Note: * 2017 = Estimate and 2018 = Forecast.Source: OPEC Secretariat.
Y-o-y change (tb/d)Production (tb/d)
Change Change Change2015 2016 16/15 1Q17 2Q17 3Q17 4Q17 2017 17/16 2018 18/17
Total OPEC 6.04 6.14 0.10 6.21 6.26 6.35 6.42 6.31 0.17 6.49 0.18
Note: 2017 = Estimate and 2018 = Forecast.Source: OPEC Secretariat.

World Oil Supply
56 OPEC Monthly Oil Market Report – May 2018
OPEC crude oil production According to secondary sources, total OPEC-14 crude oil production averaged 31.93 mb/d in April, an increase of 12 tb/d from the previous month. Higher production in Saudi Arabia and Algeria was partially offset by decreased crude oil production, mainly in Venezuela, Gabon and Nigeria.
Table 5 - 9: OPEC crude oil production based on secondary sources, tb/d
Table 5 - 10: OPEC crude oil production based on direct communication, tb/d
2016 2017 3Q17 4Q17 1Q18 Feb 18 Mar 18 Apr 18 Apr/Mar
Algeria 1,090 1,043 1,055 1,014 1,014 1,039 979 997 17.7Angola 1,725 1,637 1,641 1,628 1,562 1,576 1,523 1,515 -7.8Ecuador 545 530 536 525 516 515 517 520 3.1Equatorial Guinea 160 133 127 129 133 128 134 127 -6.8Gabon 221 200 199 199 195 192 193 183 -9.3Iran, I.R. 3,515 3,811 3,833 3,822 3,813 3,810 3,813 3,823 10.0Iraq 4,392 4,446 4,478 4,401 4,437 4,436 4,430 4,429 -0.7Kuwait 2,853 2,708 2,707 2,704 2,704 2,702 2,704 2,705 0.8Libya 390 817 932 967 990 1,007 976 982 6.9Nigeria 1,556 1,658 1,763 1,760 1,794 1,799 1,799 1,791 -8.3Qatar 656 607 603 604 592 573 595 590 -4.3Saudi Arabia 10,406 9,954 9,994 9,975 9,950 9,950 9,912 9,959 46.5UAE 2,979 2,915 2,922 2,892 2,850 2,820 2,866 2,872 6.1Venezuela 2,154 1,911 1,920 1,762 1,540 1,540 1,478 1,436 -41.7
Total OPEC 32,643 32,372 32,711 32,383 32,089 32,086 31,918 31,930 12.1
Note: Totals may not add up due to independent rounding.Source: OPEC Secretariat.
2016 2017 3Q17 4Q17 1Q18 Feb 18 Mar 18 Apr 18 Apr/Mar
Algeria 1,146 1,059 1,065 1,012 1,004 1,036 966 979 13.0Angola 1,722 1,632 1,668 1,585 1,519 1,498 1,496 1,498 2.0Ecuador 549 531 535 522 512 513 511 517 5.3Equatorial Guinea .. 129 124 126 127 127 125 122 -2.7Gabon .. .. .. .. .. .. .. .. ..Iran, I.R. 3,651 3,867 3,865 3,833 3,811 3,810 3,806 3,804 -2.0Iraq 4,648 4,469 4,380 4,361 4,360 4,360 4,360 4,360 0.0Kuwait 2,954 2,704 2,700 2,702 2,702 2,700 2,700 2,705 5.0Libya .. .. .. .. .. .. .. .. ..Nigeria 1,427 1,510 1,592 1,572 1,611 1,635 1,560 1,724 164.7Qatar 652 600 589 608 594 539 616 .. ..Saudi Arabia 10,460 9,951 9,978 9,977 9,942 9,935 9,907 9,868 -39.1UAE 3,088 2,967 2,969 2,904 2,841 2,797 2,872 2,869 -3.0Venezuela 2,373 2,072 2,102 1,804 1,623 1,586 1,509 1,505 -4.0
Total OPEC .. .. .. .. .. .. .. .. ..
Note: Totals may not add up due to independent rounding. .. Not availab le.Source: OPEC Secretariat.

World Oil Supply
OPEC Monthly Oil Market Report – May 2018 57
World oil supply
Preliminary data for April 2018 indicates that global oil supply increased by 0.12 mb/d m-o-m to average 97.89 mb/d. Non-OPEC supply (including OPEC NGLs) increased by 0.11 mb/d m-o-m to average 65.96 mb/d, higher by 2.35 mb/d y-o-y. This was mainly driven by the US, the UK, Brazil, China and OPEC NGLs, which partially offset m-o-m declines in Canada, Ghana and Kazakhstan. OPEC crude oil production increased by 12 tb/d in April, to stand at 31.9 mb/d. The share of OPEC crude oil in total global production remained unchanged at 32.6% compared with the previous month. Estimates are based on preliminary data from direct communications for non-OPEC supply, OPEC NGLs and non-conventional oil, while estimates for OPEC crude production are based on secondary sources.
Graph 5 - 25: OPEC and world oil supply
32.231.994.397.9
919293949596979899
28
29
30
31
32
33
34
May
16
Jul 1
6
Sep
16
Nov
16
Jan
17
Mar
17
May
17
Jul 1
7
Sep
17
Nov
17
Jan
18
Mar
18
mb/dmb/d
OPEC crude production (LHS)World supply (RHS)
Source: OPEC Secretariat.
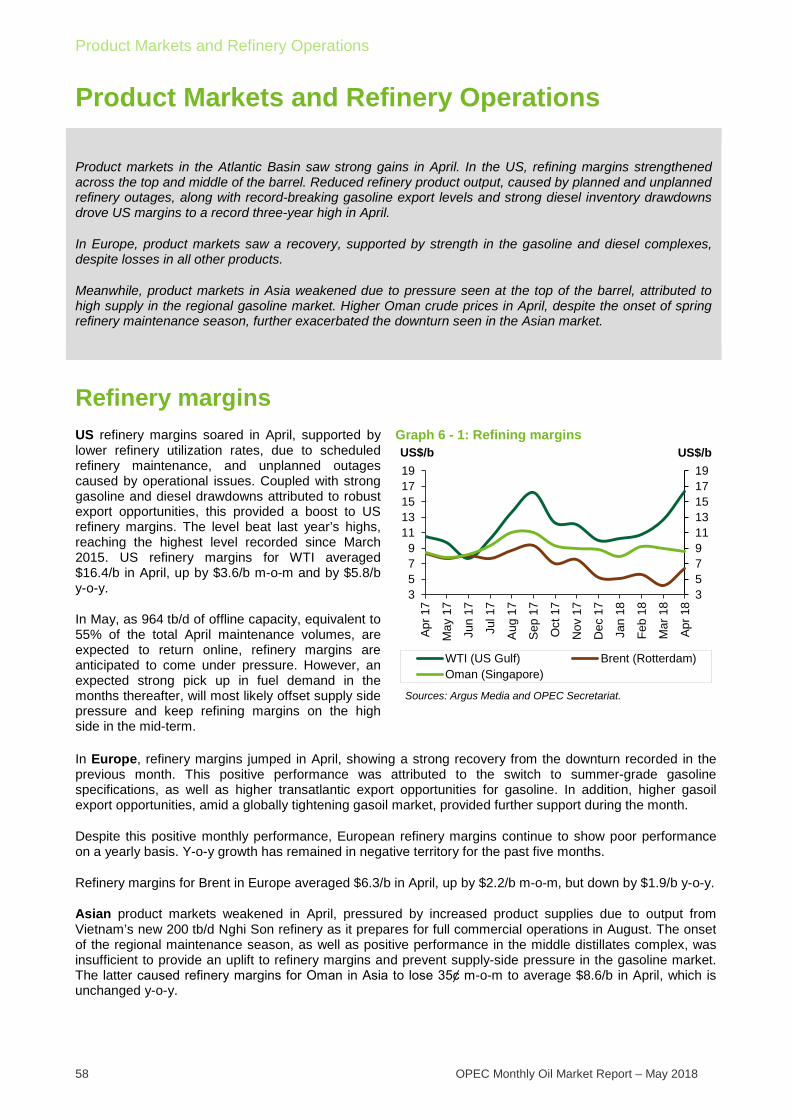
Product Markets and Refinery Operations
58 OPEC Monthly Oil Market Report – May 2018
Product Markets and Refinery Operations
Product markets in the Atlantic Basin saw strong gains in April. In the US, refining margins strengthened across the top and middle of the barrel. Reduced refinery product output, caused by planned and unplanned refinery outages, along with record-breaking gasoline export levels and strong diesel inventory drawdowns drove US margins to a record three-year high in April.
In Europe, product markets saw a recovery, supported by strength in the gasoline and diesel complexes, despite losses in all other products.
Meanwhile, product markets in Asia weakened due to pressure seen at the top of the barrel, attributed to high supply in the regional gasoline market. Higher Oman crude prices in April, despite the onset of spring refinery maintenance season, further exacerbated the downturn seen in the Asian market.
Refinery margins US refinery margins soared in April, supported by lower refinery utilization rates, due to scheduled refinery maintenance, and unplanned outages caused by operational issues. Coupled with strong gasoline and diesel drawdowns attributed to robust export opportunities, this provided a boost to US refinery margins. The level beat last year’s highs, reaching the highest level recorded since March 2015. US refinery margins for WTI averaged $16.4/b in April, up by $3.6/b m-o-m and by $5.8/b y-o-y.
In May, as 964 tb/d of offline capacity, equivalent to 55% of the total April maintenance volumes, are expected to return online, refinery margins are anticipated to come under pressure. However, an expected strong pick up in fuel demand in the months thereafter, will most likely offset supply side pressure and keep refining margins on the high side in the mid-term.
Graph 6 - 1: Refining margins
In Europe, refinery margins jumped in April, showing a strong recovery from the downturn recorded in the previous month. This positive performance was attributed to the switch to summer-grade gasoline specifications, as well as higher transatlantic export opportunities for gasoline. In addition, higher gasoil export opportunities, amid a globally tightening gasoil market, provided further support during the month.
Despite this positive monthly performance, European refinery margins continue to show poor performance on a yearly basis. Y-o-y growth has remained in negative territory for the past five months.
Refinery margins for Brent in Europe averaged $6.3/b in April, up by $2.2/b m-o-m, but down by $1.9/b y-o-y.
Asian product markets weakened in April, pressured by increased product supplies due to output from Vietnam’s new 200 tb/d Nghi Son refinery as it prepares for full commercial operations in August. The onset of the regional maintenance season, as well as positive performance in the middle distillates complex, was insufficient to provide an uplift to refinery margins and prevent supply-side pressure in the gasoline market. The latter caused refinery margins for Oman in Asia to lose 35ȼ m-o-m to average $8.6/b in April, which is unchanged y-o-y.
35791113151719
3579
1113151719
Apr
17
May
17
Jun
17
Jul 1
7
Aug
17
Sep
17
Oct
17
Nov
17
Dec
17
Jan
18
Feb
18
Mar
18
Apr
18
US$/bUS$/b
WTI (US Gulf) Brent (Rotterdam)Oman (Singapore)
Sources: Argus Media and OPEC Secretariat.
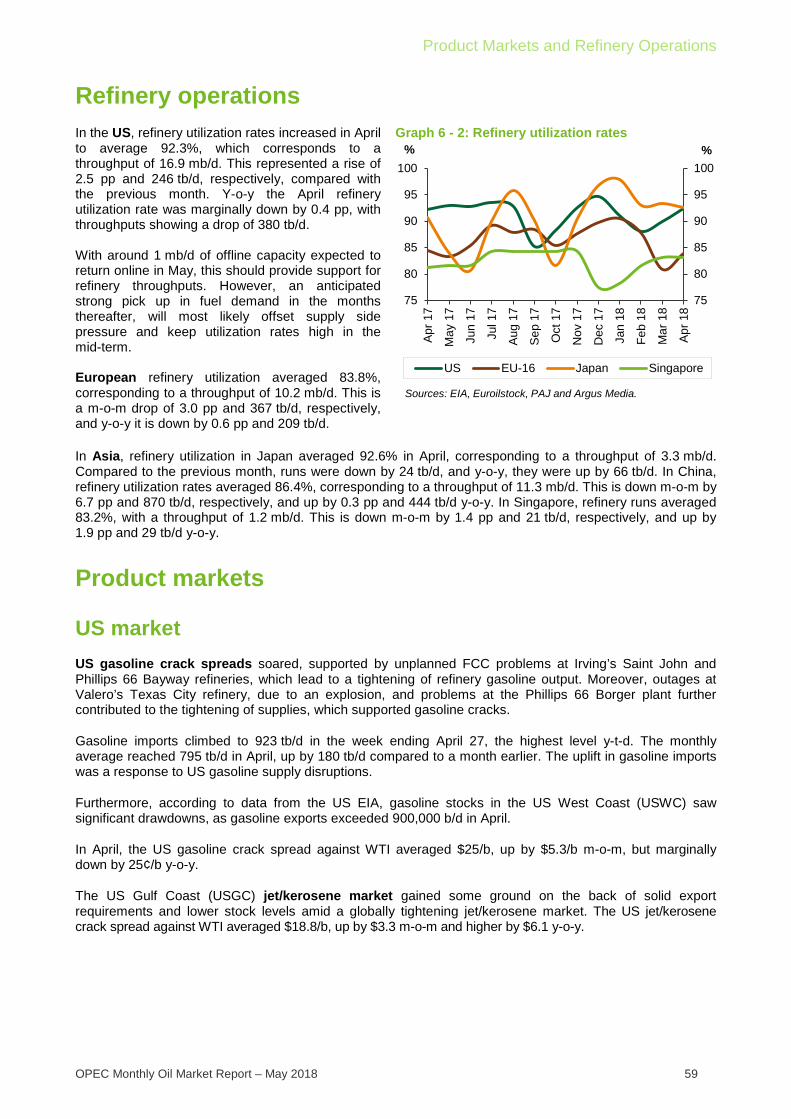
Product Markets and Refinery Operations
OPEC Monthly Oil Market Report – May 2018 59
Refinery operations In the US, refinery utilization rates increased in April to average 92.3%, which corresponds to a throughput of 16.9 mb/d. This represented a rise of 2.5 pp and 246 tb/d, respectively, compared with the previous month. Y-o-y the April refinery utilization rate was marginally down by 0.4 pp, with throughputs showing a drop of 380 tb/d. With around 1 mb/d of offline capacity expected to return online in May, this should provide support for refinery throughputs. However, an anticipated strong pick up in fuel demand in the months thereafter, will most likely offset supply side pressure and keep utilization rates high in the mid-term. European refinery utilization averaged 83.8%, corresponding to a throughput of 10.2 mb/d. This is a m-o-m drop of 3.0 pp and 367 tb/d, respectively, and y-o-y it is down by 0.6 pp and 209 tb/d.
Graph 6 - 2: Refinery utilization rates
In Asia, refinery utilization in Japan averaged 92.6% in April, corresponding to a throughput of 3.3 mb/d. Compared to the previous month, runs were down by 24 tb/d, and y-o-y, they were up by 66 tb/d. In China, refinery utilization rates averaged 86.4%, corresponding to a throughput of 11.3 mb/d. This is down m-o-m by 6.7 pp and 870 tb/d, respectively, and up by 0.3 pp and 444 tb/d y-o-y. In Singapore, refinery runs averaged 83.2%, with a throughput of 1.2 mb/d. This is down m-o-m by 1.4 pp and 21 tb/d, respectively, and up by 1.9 pp and 29 tb/d y-o-y.
Product markets
US market US gasoline crack spreads soared, supported by unplanned FCC problems at Irving’s Saint John and Phillips 66 Bayway refineries, which lead to a tightening of refinery gasoline output. Moreover, outages at Valero’s Texas City refinery, due to an explosion, and problems at the Phillips 66 Borger plant further contributed to the tightening of supplies, which supported gasoline cracks.
Gasoline imports climbed to 923 tb/d in the week ending April 27, the highest level y-t-d. The monthly average reached 795 tb/d in April, up by 180 tb/d compared to a month earlier. The uplift in gasoline imports was a response to US gasoline supply disruptions.
Furthermore, according to data from the US EIA, gasoline stocks in the US West Coast (USWC) saw significant drawdowns, as gasoline exports exceeded 900,000 b/d in April.
In April, the US gasoline crack spread against WTI averaged $25/b, up by $5.3/b m-o-m, but marginally down by 25¢/b y-o-y.
The US Gulf Coast (USGC) jet/kerosene market gained some ground on the back of solid export requirements and lower stock levels amid a globally tightening jet/kerosene market. The US jet/kerosene crack spread against WTI averaged $18.8/b, up by $3.3 m-o-m and higher by $6.1 y-o-y.
75
80
85
90
95
100
75
80
85
90
95
100
Apr
17
May
17
Jun
17
Jul 1
7
Aug
17
Sep
17
Oct
17
Nov
17
Dec
17
Jan
18
Feb
18
Mar
18
Apr
18
%%
US EU-16 Japan Singapore
Sources: EIA, Euroilstock, PAJ and Argus Media.
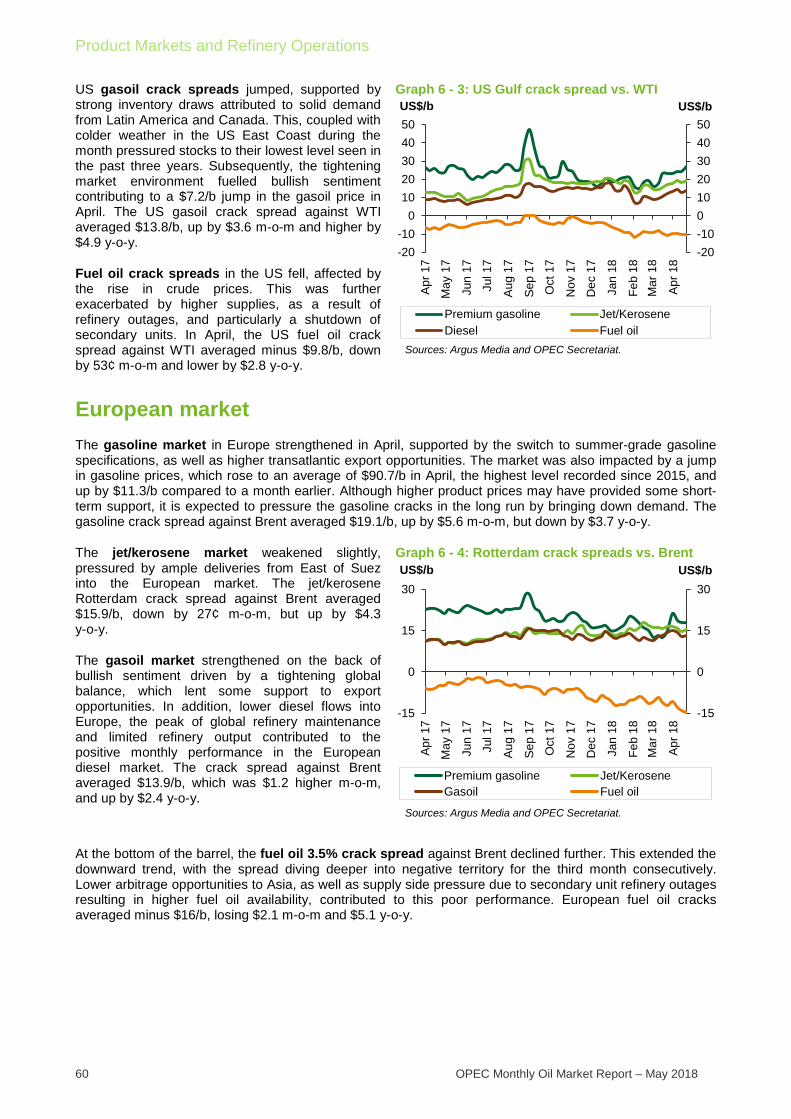
Product Markets and Refinery Operations
60 OPEC Monthly Oil Market Report – May 2018
US gasoil crack spreads jumped, supported by strong inventory draws attributed to solid demand from Latin America and Canada. This, coupled with colder weather in the US East Coast during the month pressured stocks to their lowest level seen in the past three years. Subsequently, the tightening market environment fuelled bullish sentiment contributing to a $7.2/b jump in the gasoil price in April. The US gasoil crack spread against WTI averaged $13.8/b, up by $3.6 m-o-m and higher by $4.9 y-o-y.
Fuel oil crack spreads in the US fell, affected by the rise in crude prices. This was further exacerbated by higher supplies, as a result of refinery outages, and particularly a shutdown of secondary units. In April, the US fuel oil crack spread against WTI averaged minus $9.8/b, down by 53¢ m-o-m and lower by $2.8 y-o-y.
Graph 6 - 3: US Gulf crack spread vs. WTI
European market The gasoline market in Europe strengthened in April, supported by the switch to summer-grade gasoline specifications, as well as higher transatlantic export opportunities. The market was also impacted by a jump in gasoline prices, which rose to an average of $90.7/b in April, the highest level recorded since 2015, and up by $11.3/b compared to a month earlier. Although higher product prices may have provided some short-term support, it is expected to pressure the gasoline cracks in the long run by bringing down demand. The gasoline crack spread against Brent averaged $19.1/b, up by $5.6 m-o-m, but down by $3.7 y-o-y.
The jet/kerosene market weakened slightly, pressured by ample deliveries from East of Suez into the European market. The jet/kerosene Rotterdam crack spread against Brent averaged $15.9/b, down by 27¢ m-o-m, but up by $4.3 y-o-y.
The gasoil market strengthened on the back of bullish sentiment driven by a tightening global balance, which lent some support to export opportunities. In addition, lower diesel flows into Europe, the peak of global refinery maintenance and limited refinery output contributed to the positive monthly performance in the European diesel market. The crack spread against Brent averaged $13.9/b, which was $1.2 higher m-o-m, and up by $2.4 y-o-y.
Graph 6 - 4: Rotterdam crack spreads vs. Brent
At the bottom of the barrel, the fuel oil 3.5% crack spread against Brent declined further. This extended the downward trend, with the spread diving deeper into negative territory for the third month consecutively. Lower arbitrage opportunities to Asia, as well as supply side pressure due to secondary unit refinery outages resulting in higher fuel oil availability, contributed to this poor performance. European fuel oil cracks averaged minus $16/b, losing $2.1 m-o-m and $5.1 y-o-y.
-20-1001020304050
-20-10
01020304050
Apr 1
7
May
17
Jun
17
Jul 1
7
Aug
17
Sep
17
Oct
17
Nov
17
Dec
17
Jan
18
Feb
18M
ar 1
8
Apr 1
8
US$/bUS$/b
Premium gasoline Jet/KeroseneDiesel Fuel oil
Sources: Argus Media and OPEC Secretariat.
-15
0
15
30
-15
0
15
30
Apr 1
7
May
17
Jun
17
Jul 1
7
Aug
17
Sep
17
Oct
17
Nov
17
Dec
17
Jan
18
Feb
18M
ar 1
8
Apr 1
8
US$/bUS$/b
Premium gasoline Jet/KeroseneGasoil Fuel oil
Sources: Argus Media and OPEC Secretariat.
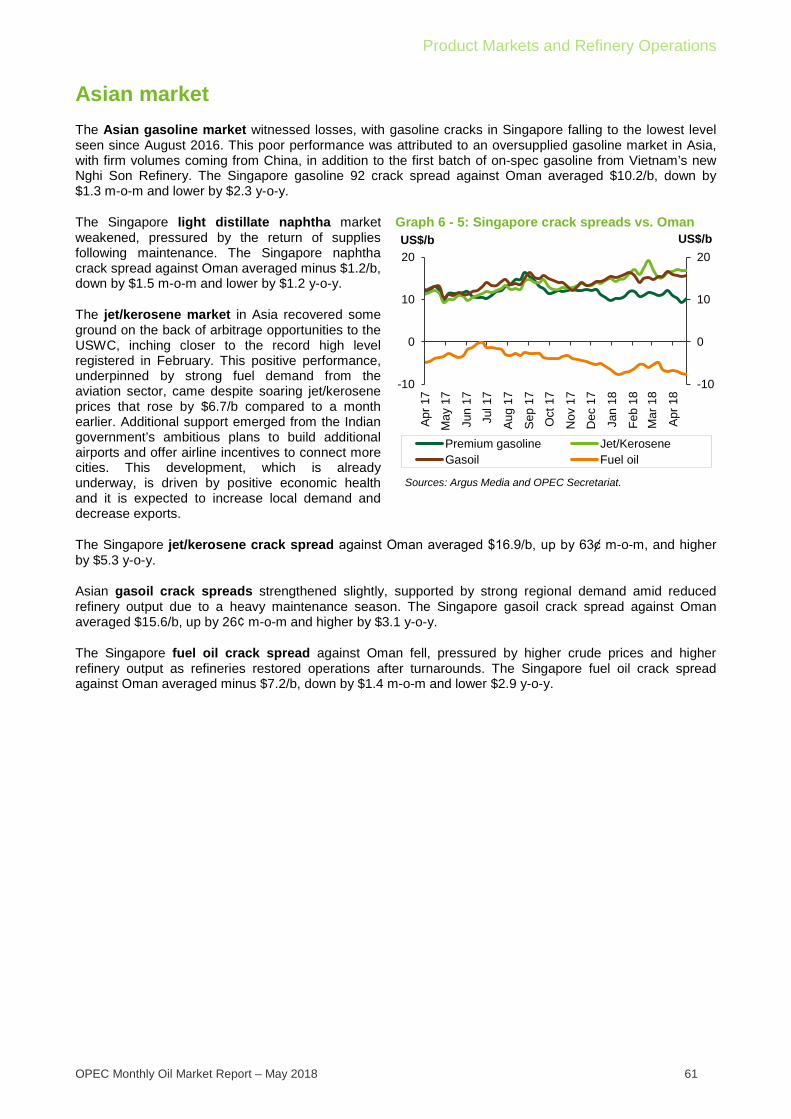
Product Markets and Refinery Operations
OPEC Monthly Oil Market Report – May 2018 61
Asian market The Asian gasoline market witnessed losses, with gasoline cracks in Singapore falling to the lowest level seen since August 2016. This poor performance was attributed to an oversupplied gasoline market in Asia, with firm volumes coming from China, in addition to the first batch of on-spec gasoline from Vietnam’s new Nghi Son Refinery. The Singapore gasoline 92 crack spread against Oman averaged $10.2/b, down by $1.3 m-o-m and lower by $2.3 y-o-y.
The Singapore light distillate naphtha market weakened, pressured by the return of supplies following maintenance. The Singapore naphtha crack spread against Oman averaged minus $1.2/b, down by $1.5 m-o-m and lower by $1.2 y-o-y.
The jet/kerosene market in Asia recovered some ground on the back of arbitrage opportunities to the USWC, inching closer to the record high level registered in February. This positive performance, underpinned by strong fuel demand from the aviation sector, came despite soaring jet/kerosene prices that rose by $6.7/b compared to a month earlier. Additional support emerged from the Indian government’s ambitious plans to build additional airports and offer airline incentives to connect more cities. This development, which is already underway, is driven by positive economic health and it is expected to increase local demand and decrease exports..
Graph 6 - 5: Singapore crack spreads vs. Oman
The Singapore jet/kerosene crack spread against Oman averaged $16.9/b, up by 63ȼ m-o-m, and higher by $5.3 y-o-y.
Asian gasoil crack spreads strengthened slightly, supported by strong regional demand amid reduced refinery output due to a heavy maintenance season. The Singapore gasoil crack spread against Oman averaged $15.6/b, up by 26¢ m-o-m and higher by $3.1 y-o-y.
The Singapore fuel oil crack spread against Oman fell, pressured by higher crude prices and higher refinery output as refineries restored operations after turnarounds. The Singapore fuel oil crack spread against Oman averaged minus $7.2/b, down by $1.4 m-o-m and lower $2.9 y-o-y.
-10
0
10
20
-10
0
10
20
Apr 1
7
May
17
Jun
17
Jul 1
7
Aug
17
Sep
17
Oct
17
Nov
17
Dec
17
Jan
18
Feb
18M
ar 1
8
Apr 1
8
US$/bUS$/b
Premium gasoline Jet/KeroseneGasoil Fuel oil
Sources: Argus Media and OPEC Secretariat.
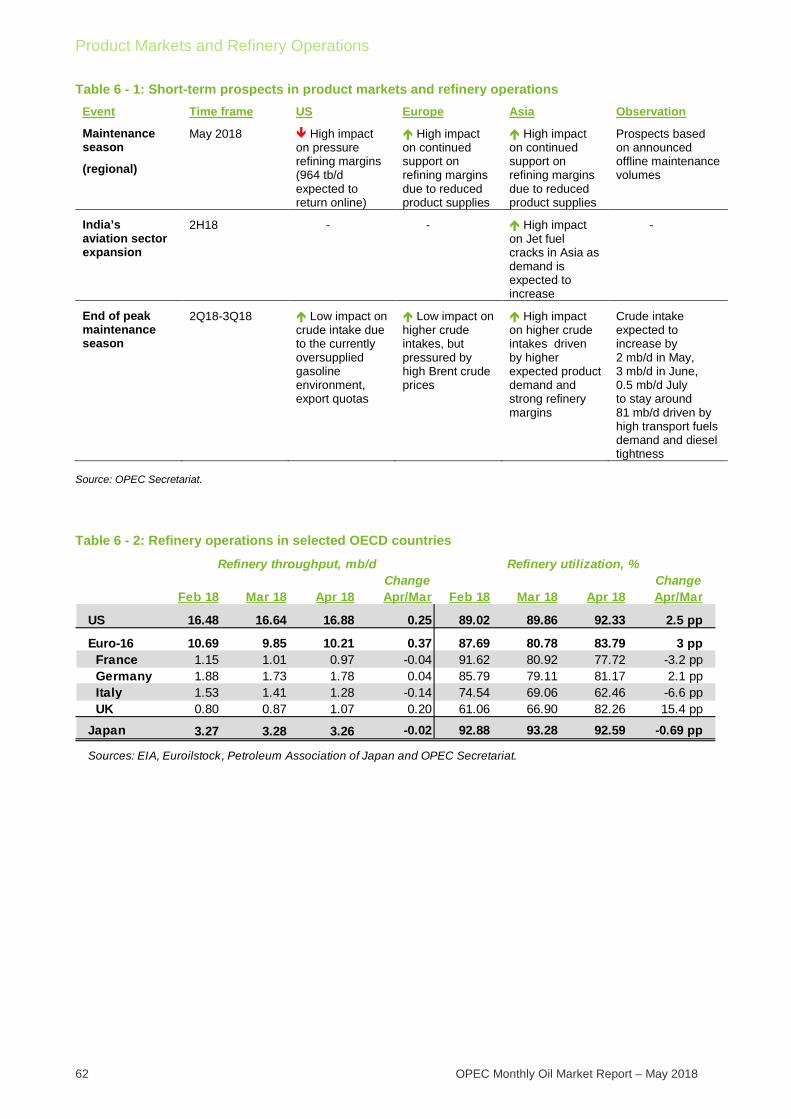
Product Markets and Refinery Operations
62 OPEC Monthly Oil Market Report – May 2018
Table 6 - 1: Short-term prospects in product markets and refinery operations Event Time frame US Europe Asia Observation
Maintenance season
(regional)
May 2018 High impact on pressure refining margins (964 tb/d expected to return online)
High impact on continued support on refining margins due to reduced product supplies
High impact on continued support on refining margins due to reduced product supplies
Prospects based on announced offline maintenance volumes
India’s aviation sector expansion
2H18 - -
High impact on Jet fuel cracks in Asia as demand is expected to increase
-
End of peak maintenance season
2Q18-3Q18 Low impact on crude intake due to the currently oversupplied gasoline environment, export quotas
Low impact on higher crude intakes, but pressured by high Brent crude prices
High impact on higher crude intakes driven by higher expected product demand and strong refinery margins
Crude intake expected to increase by 2 mb/d in May, 3 mb/d in June, 0.5 mb/d July to stay around 81 mb/d driven by high transport fuels demand and diesel tightness
Source: OPEC Secretariat.
Table 6 - 2: Refinery operations in selected OECD countries
Change ChangeFeb 18 Mar 18 Apr 18 Apr/Mar Feb 18 Mar 18 Apr 18 Apr/Mar
US 16.48 16.64 16.88 0.25 89.02 89.86 92.33 2.5 pp
Euro-16 10.69 9.85 10.21 0.37 87.69 80.78 83.79 3 pp France 1.15 1.01 0.97 -0.04 91.62 80.92 77.72 -3.2 pp Germany 1.88 1.73 1.78 0.04 85.79 79.11 81.17 2.1 pp Italy 1.53 1.41 1.28 -0.14 74.54 69.06 62.46 -6.6 pp UK 0.80 0.87 1.07 0.20 61.06 66.90 82.26 15.4 pp
Japan 3.27 3.28 3.26 -0.02 92.88 93.28 92.59 -0.69 pp
Sources: EIA, Euroilstock, Petroleum Association of Japan and OPEC Secretariat.
Refinery throughput, mb/d Refinery utilization, %

Product Markets and Refinery Operations
OPEC Monthly Oil Market Report – May 2018 63
Table 6 - 3: Refinery crude throughput, mb/d
2015 2016 2017 2Q17 3Q17 4Q17 1Q18 2Q18*
Total OECD 37.61 37.41 37.95 38.04 38.25 38.21 37.59 38.08
OECD Americas 19.01 18.78 19.04 19.80 19.03 19.02 18.79 19.61of which US 16.43 16.51 16.89 17.42 16.89 17.02 16.64 17.01
OECD Europe 12.00 11.85 12.09 11.82 12.42 12.25 11.85 11.95of which: France 1.15 1.12 1.14 1.11 1.18 1.20 1.10 1.12Germany 1.87 1.88 1.85 1.74 1.93 1.92 1.86 1.82Italy 1.34 1.30 1.36 1.28 1.40 1.44 1.48 1.34UK 1.10 1.08 1.06 1.06 1.06 1.08 0.89 1.07
OECD Asia Pacific 6.60 6.78 6.82 6.43 6.80 6.95 6.95 6.52of which Japan 3.26 3.28 3.23 2.99 3.24 3.19 3.33 3.18
Total Non-OECD 40.59 41.38 42.09 41.44 42.03 43.10 43.00 42.87
of which:China 10.44 10.77 11.35 11.00 11.27 11.92 11.75 11.42Middle East 6.66 6.98 7.12 7.15 7.21 7.29 7.16 7.35Russia 5.64 5.58 5.59 5.46 5.62 5.64 5.78 5.65Latin America 6.13 5.69 5.43 5.51 5.34 5.22 4.95 5.09India 4.56 4.93 4.98 4.89 4.82 5.21 5.19 4.93Africa 2.11 2.08 2.07 2.03 2.08 2.02 2.09 2.02
Total world 78.20 78.78 80.10 79.48 80.29 81.31 80.59 80.95
Note: * Includes OPEC Secretariat's estimates. Totals may not add up due to independent rounding.Source: OPEC Secretariat, Jodi, AFREC, APEC, EIA, IEA, Euroilstock, Petroleum Association of Japan, Ministry data, including Ministry of Energy of the Russian Federation, Ministry of Petroleum and Natural Gas of India.

Product Markets and Refinery Operations
64 OPEC Monthly Oil Market Report – May 2018
Table 6 - 4: Refined product prices, US$/b
Change Year-to-dateMar 18 Apr 18 Apr/Mar 2017 2018
Naphtha* 62.89 68.99 6.10 55.09 65.76Premium gasoline (unleaded 93) 82.47 91.32 8.85 74.42 84.61Regular gasoline (unleaded 87) 76.82 85.02 8.20 68.57 78.87Jet/Kerosene 78.26 85.16 6.90 66.07 81.15Gasoil (0.2% S) 72.97 80.14 7.17 62.31 76.13Fuel oil (3.0% S) 52.75 52.55 -0.20 47.05 54.09
Naphtha 63.29 65.69 2.40 53.66 64.00Premium gasoline (unleaded 98) 79.34 90.68 11.34 75.13 84.61Jet/Kerosene 82.03 87.45 5.42 66.84 83.56Gasoil/Diesel (10 ppm) 78.64 85.49 6.85 66.35 80.93Fuel oil (1.0% S) 55.15 58.66 3.51 48.71 56.65Fuel oil (3.5% S) 52.00 55.61 3.61 44.31 53.52
Naphtha 62.41 66.59 4.18 52.81 63.46Premium gasoline** 73.81 82.50 8.69 66.56 76.68Jet/Kerosene 79.61 86.16 6.55 65.12 81.54Diesel 78.66 85.58 6.92 66.92 80.83Fuel oil (1.0% S) 56.38 59.63 3.25 49.55 57.89Fuel oil (3.5% S) 53.47 56.90 3.43 46.18 54.94
Naphtha 63.08 67.14 4.06 54.04 64.47Premium gasoline (unleaded 95) 77.12 81.50 4.38 68.01 78.56Regular gasoline (unleaded 92) 74.25 78.45 4.20 65.43 75.88Jet/Kerosene 79.00 85.16 6.16 65.32 81.29Gasoil/Diesel (50 ppm) 78.25 84.04 5.79 66.33 80.49Fuel oil (180 cst) 56.94 61.07 4.13 49.67 58.47Fuel oil (380 cst 3.5% S) 56.05 56.56 0.51 49.24 57.77
Sources: Argus Media and OPEC Secretariat.
Note: * Barges. ** Cost, insurance and freight (CIF).
US Gulf (Cargoes FOB):
Rotterdam (Barges FoB):
Mediterranean (Cargoes FOB):
Singapore (Cargoes FOB):
Tanker Market
OPEC Monthly Oil Market Report – May 2018 65
Tanker Market
In April, the tanker market saw a general bearish sentiment, which has prevailed for some time.
Following a drop in rates witnessed the previous month, average dirty tanker spot freight rates declined by a further 3% in April, compared to the previous month. Lower rates were seen in Suezmax and Aframax, while the VLCC class showed a minimal change in rates.
Weak freight rates were partially attributed to holidays in the West, as well as thin market activity, in general. A continuous build in the supply of vessels, as well as reduced weather and transit delays, pressured rates in April.
Clean tanker spot freight rates also saw a general downward trend, with lower earnings in April across most reported routes due to a lack of activity. On average, clean tanker spot freight rates fell by 5% compared to the previous month.
Lower earnings in both the clean and dirty market sectors were amplified by operational cost increases, mainly on the back of high bunker fuel costs.
Spot fixtures According to preliminary data, global fixtures rose by 1.5% in April, compared with the previous month. OPEC spot fixtures were down by 0.27 mb/d, or 2%, to average 13.61 mb/d.
Fixtures on the Middle East-to-East route averaged 6.92 mb/d in April, down by 0.63 mb/d from one month earlier, while those on the Middle East-to-West route averaged 2.47 mb/d.
Outside the Middle East, fixtures averaged 4.22 mb/d in April, dropping by 0.08 mb/d m-o-m, and saw an increase of 0.61 mb/d compared with the same period a year before.
Table 7 - 1: Spot fixtures, mb/d
Sailings and arrivals Preliminary data shows OPEC sailings declined by 0.5% in April to average 24.4 mb/d. This was 0.54 mb/d above the same month a year ago. Middle East sailings also dropped by 0.6% in April compared to the previous month.
Arrivals in April were mixed, registering m-o-m declines in North American and West Asian ports of 6.1% and 3.9%, respectively, while arrivals to Europe increased by 2.8% to average 12.47 mb/d. Arrivals at Far Eastern ports averaged 8.57 mb/d, unchanged from one month previous.
ChangeFeb 18 Mar 18 Apr 18 Apr 18/Mar 18
All areas 19.30 19.22 19.50 0.28 OPEC 13.76 13.88 13.61 -0.27 Middle East/East 7.14 7.55 6.92 -0.63 Middle East/West 2.52 2.02 2.47 0.44 Outside Middle East 4.10 4.30 4.22 -0.08
Sources: Oil Movements and OPEC Secretariat.
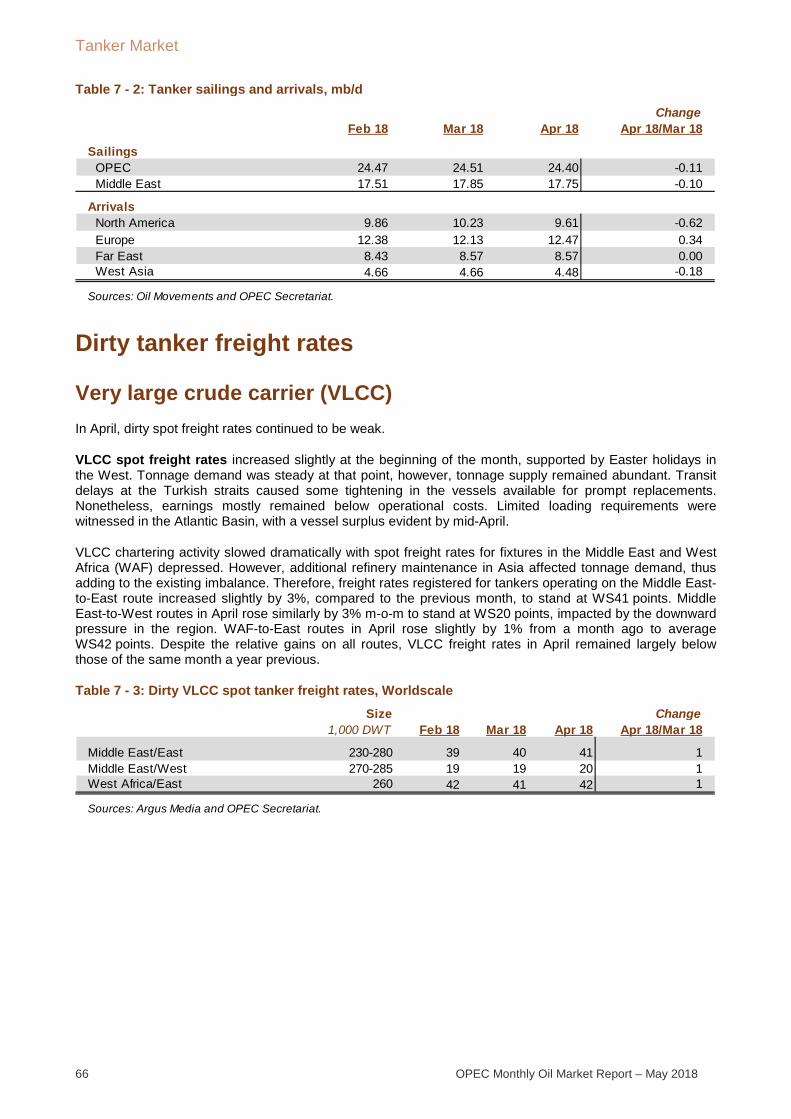
Tanker Market
66 OPEC Monthly Oil Market Report – May 2018
Table 7 - 2: Tanker sailings and arrivals, mb/d
Dirty tanker freight rates
Very large crude carrier (VLCC) In April, dirty spot freight rates continued to be weak.
VLCC spot freight rates increased slightly at the beginning of the month, supported by Easter holidays in the West. Tonnage demand was steady at that point, however, tonnage supply remained abundant. Transit delays at the Turkish straits caused some tightening in the vessels available for prompt replacements. Nonetheless, earnings mostly remained below operational costs. Limited loading requirements were witnessed in the Atlantic Basin, with a vessel surplus evident by mid-April.
VLCC chartering activity slowed dramatically with spot freight rates for fixtures in the Middle East and West Africa (WAF) depressed. However, additional refinery maintenance in Asia affected tonnage demand, thus adding to the existing imbalance. Therefore, freight rates registered for tankers operating on the Middle East-to-East route increased slightly by 3%, compared to the previous month, to stand at WS41 points. Middle East-to-West routes in April rose similarly by 3% m-o-m to stand at WS20 points, impacted by the downward pressure in the region. WAF-to-East routes in April rose slightly by 1% from a month ago to average WS42 points. Despite the relative gains on all routes, VLCC freight rates in April remained largely below those of the same month a year previous.
Table 7 - 3: Dirty VLCC spot tanker freight rates, Worldscale
ChangeFeb 18 Mar 18 Apr 18 Apr 18/Mar 18
Sailings OPEC 24.47 24.51 24.40 -0.11 Middle East 17.51 17.85 17.75 -0.10
Arrivals North America 9.86 10.23 9.61 -0.62 Europe 12.38 12.13 12.47 0.34 Far East 8.43 8.57 8.57 0.00 West Asia 4.66 4.66 4.48 -0.18
Sources: Oil Movements and OPEC Secretariat.
Size Change1,000 DWT Feb 18 Mar 18 Apr 18 Apr 18/Mar 18
Middle East/East 230-280 39 40 41 1Middle East/West 270-285 19 19 20 1West Africa/East 260 42 41 42 1
Sources: Argus Media and OPEC Secretariat.
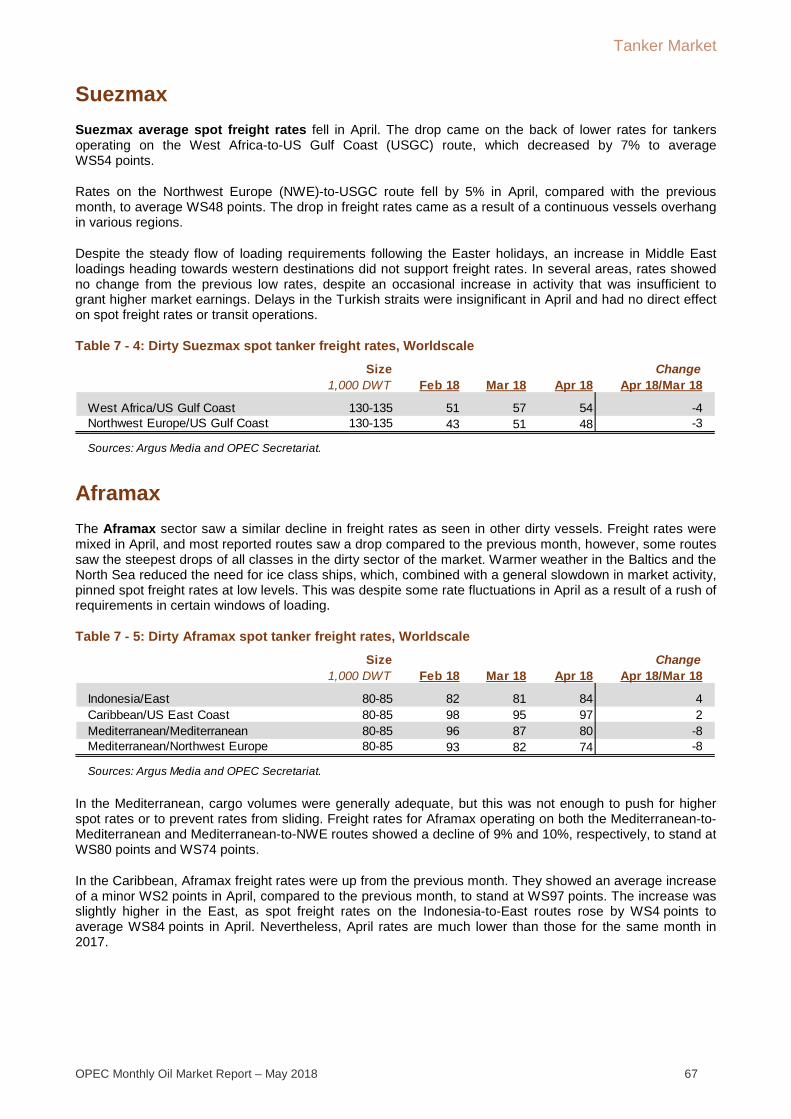
Tanker Market
OPEC Monthly Oil Market Report – May 2018 67
Suezmax Suezmax average spot freight rates fell in April. The drop came on the back of lower rates for tankers operating on the West Africa-to-US Gulf Coast (USGC) route, which decreased by 7% to average WS54 points.
Rates on the Northwest Europe (NWE)-to-USGC route fell by 5% in April, compared with the previous month, to average WS48 points. The drop in freight rates came as a result of a continuous vessels overhang in various regions.
Despite the steady flow of loading requirements following the Easter holidays, an increase in Middle East loadings heading towards western destinations did not support freight rates. In several areas, rates showed no change from the previous low rates, despite an occasional increase in activity that was insufficient to grant higher market earnings. Delays in the Turkish straits were insignificant in April and had no direct effect on spot freight rates or transit operations.
Table 7 - 4: Dirty Suezmax spot tanker freight rates, Worldscale
Aframax The Aframax sector saw a similar decline in freight rates as seen in other dirty vessels. Freight rates were mixed in April, and most reported routes saw a drop compared to the previous month, however, some routes saw the steepest drops of all classes in the dirty sector of the market. Warmer weather in the Baltics and the North Sea reduced the need for ice class ships, which, combined with a general slowdown in market activity, pinned spot freight rates at low levels. This was despite some rate fluctuations in April as a result of a rush of requirements in certain windows of loading.
Table 7 - 5: Dirty Aframax spot tanker freight rates, Worldscale
In the Mediterranean, cargo volumes were generally adequate, but this was not enough to push for higher spot rates or to prevent rates from sliding. Freight rates for Aframax operating on both the Mediterranean-to-Mediterranean and Mediterranean-to-NWE routes showed a decline of 9% and 10%, respectively, to stand at WS80 points and WS74 points.
In the Caribbean, Aframax freight rates were up from the previous month. They showed an average increase of a minor WS2 points in April, compared to the previous month, to stand at WS97 points. The increase was slightly higher in the East, as spot freight rates on the Indonesia-to-East routes rose by WS4 points to average WS84 points in April. Nevertheless, April rates are much lower than those for the same month in 2017.
Size Change1,000 DWT Feb 18 Mar 18 Apr 18 Apr 18/Mar 18
West Africa/US Gulf Coast 130-135 51 57 54 -4Northwest Europe/US Gulf Coast 130-135 43 51 48 -3
Sources: Argus Media and OPEC Secretariat.
Size Change1,000 DWT Feb 18 Mar 18 Apr 18 Apr 18/Mar 18
Indonesia/East 80-85 82 81 84 4Caribbean/US East Coast 80-85 98 95 97 2Mediterranean/Mediterranean 80-85 96 87 80 -8Mediterranean/Northwest Europe 80-85 93 82 74 -8
Sources: Argus Media and OPEC Secretariat.
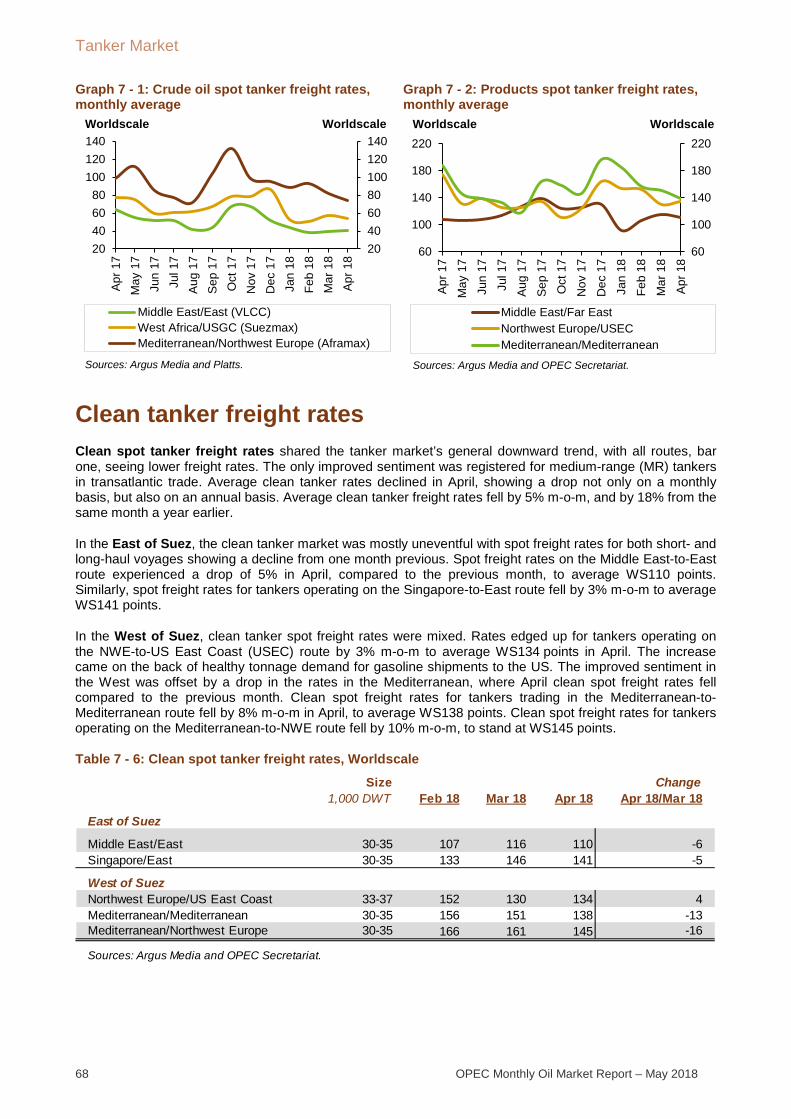
Tanker Market
68 OPEC Monthly Oil Market Report – May 2018
Graph 7 - 1: Crude oil spot tanker freight rates, monthly average
Graph 7 - 2: Products spot tanker freight rates, monthly average
Clean tanker freight rates Clean spot tanker freight rates shared the tanker market’s general downward trend, with all routes, bar one, seeing lower freight rates. The only improved sentiment was registered for medium-range (MR) tankers in transatlantic trade. Average clean tanker rates declined in April, showing a drop not only on a monthly basis, but also on an annual basis. Average clean tanker freight rates fell by 5% m-o-m, and by 18% from the same month a year earlier.
In the East of Suez, the clean tanker market was mostly uneventful with spot freight rates for both short- and long-haul voyages showing a decline from one month previous. Spot freight rates on the Middle East-to-East route experienced a drop of 5% in April, compared to the previous month, to average WS110 points. Similarly, spot freight rates for tankers operating on the Singapore-to-East route fell by 3% m-o-m to average WS141 points.
In the West of Suez, clean tanker spot freight rates were mixed. Rates edged up for tankers operating on the NWE-to-US East Coast (USEC) route by 3% m-o-m to average WS134 points in April. The increase came on the back of healthy tonnage demand for gasoline shipments to the US. The improved sentiment in the West was offset by a drop in the rates in the Mediterranean, where April clean spot freight rates fell compared to the previous month. Clean spot freight rates for tankers trading in the Mediterranean-to-Mediterranean route fell by 8% m-o-m in April, to average WS138 points. Clean spot freight rates for tankers operating on the Mediterranean-to-NWE route fell by 10% m-o-m, to stand at WS145 points.
Table 7 - 6: Clean spot tanker freight rates, Worldscale
20406080100120140
20406080
100120140
Apr 1
7M
ay 1
7Ju
n 17
Jul 1
7Au
g 17
Sep
17O
ct 1
7N
ov 1
7D
ec 1
7Ja
n 18
Feb
18M
ar 1
8Ap
r 18
Middle East/East (VLCC)West Africa/USGC (Suezmax)Mediterranean/Northwest Europe (Aframax)
Sources: Argus Media and Platts.
Worldscale Worldscale
60
100
140
180
220
60
100
140
180
220
Apr
17
May
17
Jun
17Ju
l 17
Aug
17
Sep
17
Oct
17
Nov
17
Dec
17
Jan
18Fe
b 18
Mar
18
Apr
18
Middle East/Far EastNorthwest Europe/USECMediterranean/Mediterranean
Sources: Argus Media and OPEC Secretariat.
Worldscale Worldscale
Size Change1,000 DWT Feb 18 Mar 18 Apr 18 Apr 18/Mar 18
East of Suez
Middle East/East 30-35 107 116 110 -6Singapore/East 30-35 133 146 141 -5
West of SuezNorthwest Europe/US East Coast 33-37 152 130 134 4Mediterranean/Mediterranean 30-35 156 151 138 -13Mediterranean/Northwest Europe 30-35 166 161 145 -16
Sources: Argus Media and OPEC Secretariat.

Oil Trade
OPEC Monthly Oil Market Report – May 2018 69
Oil Trade
In April, preliminary data shows that US crude oil imports increased from the previous month to stand at 8.4 mb/d, which is 661 tb/d, or 9%, higher m-o-m and 259 tb/d higher y-o-y. US product imports declined by 188 tb/d m-o-m, or 9%, to average 2 mb/d, while y-o-y, they dropped by 103 tb/d, or 5%.
Japan’s crude oil imports increased in March by 224 tb/d, or 8%, to average 3.2 mb/d. On an annual basis, crude imports increased in March by 15 tb/d. Product imports dropped in March by 18 tb/d to average 692 tb/d.
China’s crude oil imports increased in March to stand at 9.3 mb/d, up by 816 tb/d, or 10%, from the previous month, marking the second highest level for imports on record. On an annual basis, crude imports were up by 52 tb/d. China’s product imports increased in March by 41 tb/d from the previous month, and by 208 tb/d from a year earlier to average 1.5 mb/d.
In March, India’s crude imports averaged 4.4 mb/d, which is lower than the level seen one month before and the lowest level for crude imports since September 2017. The decline in imports came as the industry undertakes scheduled refinery maintenance. Crude imports in March were up by 124 tb/d from the same month a year ago tb/d, while product imports in March dropped by 34 tb/d from a month before to average 772 tb/d, which indicates a decline of 145 tb/d y-o-y, or 16%.
US In April, preliminary data shows that US crude oil imports increased from the previous month to stand at 8.4 mb/d, up by 661 tb/d, or 9%, m-o-m, while y-o-y, they were 259 tb/d higher than the previous year.
Graph 8 - 1: US imports of crude and petroleum products
Graph 8 - 2: US exports of crude and petroleum products
US product imports declined by 188 tb/d m-o-m, or 9%, to average 2 mb/d, while y-o-y, they dropped by 103 tb/d, or 5%. Y-t-d, product imports increased marginally by 8 tb/d.
In April, US crude exports went up by 209 tb/d m-o-m, or 12%, to reach a peak level averaging 1.9 mb/d.
4.5
5.5
6.5
7.5
8.5
9.5
0.00.51.01.52.02.53.0
Apr
17
May
17
Jun
17Ju
l 17
Aug
17
Sep
17
Oct
17
Nov
17
Dec
17
Jan
18Fe
b 18
Mar
18
Apr
18
mb/dmb/d
Fuel oil Jet fuel/keroseneGasoline Propane/propyleneOthers* Crude (RHS)
Note: * Others: Contains natural gas liquids, liquefied refinerygases (LRG's), other liquids and all finished petroleum productsexcept gasoline, jet fuel/kerosene, fuel oil and propane/propylene.Sources: US EIA and OPEC Secretatiat.
0
500
1,000
1,500
2,000
01,0002,0003,0004,0005,0006,000
Apr 1
7M
ay 1
7Ju
n 17
Jul 1
7Au
g 17
Sep
17O
ct 1
7N
ov 1
7D
ec 1
7Ja
n 18
Feb
18M
ar 1
8Ap
r 18
tb/dtb/d
Fuel oil Jet fuel/keroseneGasoline Propane/propyleneOthers* Crude (RHS)
Note: * Others: Contains natural gas liquids, liquefied refinery gases (LRG's), other liquids and all finished petroleum products except gasoline, jet fuel/kerosene, fuel oil and propane/propylene.Sources: US EIA and OPEC Secretatiat.
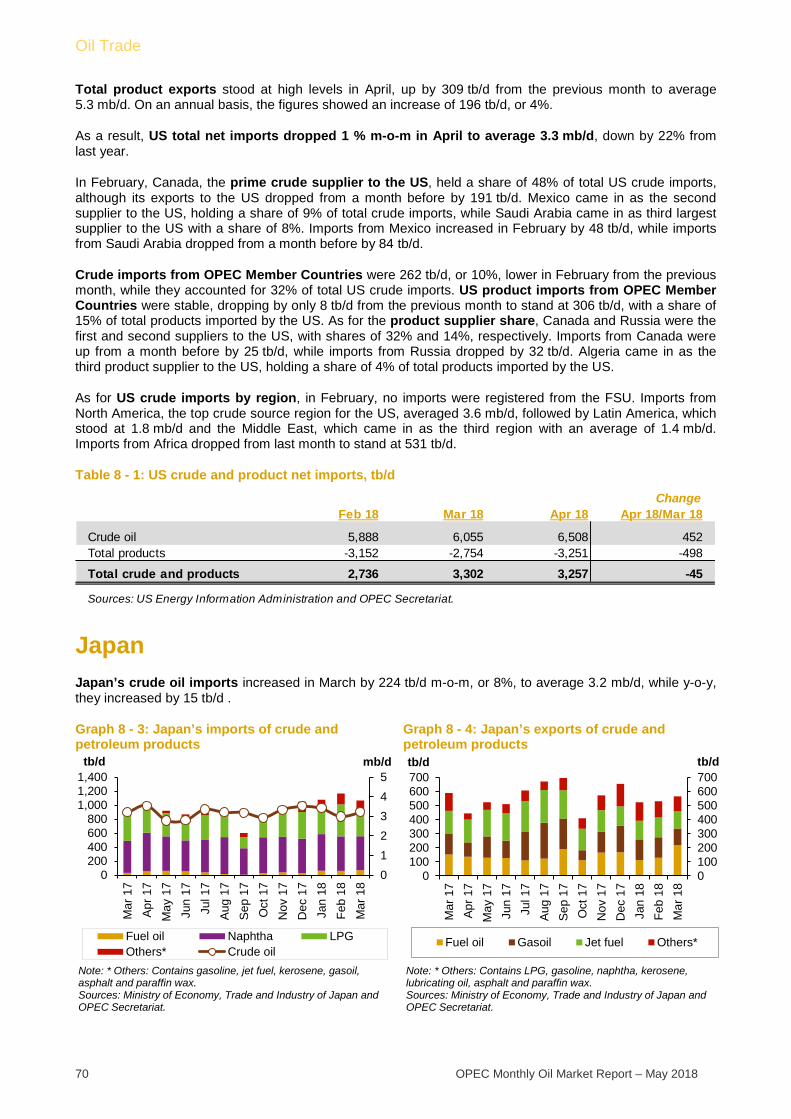
Oil Trade
70 OPEC Monthly Oil Market Report – May 2018
Total product exports stood at high levels in April, up by 309 tb/d from the previous month to average 5.3 mb/d. On an annual basis, the figures showed an increase of 196 tb/d, or 4%.
As a result, US total net imports dropped 1 % m-o-m in April to average 3.3 mb/d, down by 22% from last year.
In February, Canada, the prime crude supplier to the US, held a share of 48% of total US crude imports, although its exports to the US dropped from a month before by 191 tb/d. Mexico came in as the second supplier to the US, holding a share of 9% of total crude imports, while Saudi Arabia came in as third largest supplier to the US with a share of 8%. Imports from Mexico increased in February by 48 tb/d, while imports from Saudi Arabia dropped from a month before by 84 tb/d.
Crude imports from OPEC Member Countries were 262 tb/d, or 10%, lower in February from the previous month, while they accounted for 32% of total US crude imports. US product imports from OPEC Member Countries were stable, dropping by only 8 tb/d from the previous month to stand at 306 tb/d, with a share of 15% of total products imported by the US. As for the product supplier share, Canada and Russia were the first and second suppliers to the US, with shares of 32% and 14%, respectively. Imports from Canada were up from a month before by 25 tb/d, while imports from Russia dropped by 32 tb/d. Algeria came in as the third product supplier to the US, holding a share of 4% of total products imported by the US.
As for US crude imports by region, in February, no imports were registered from the FSU. Imports from North America, the top crude source region for the US, averaged 3.6 mb/d, followed by Latin America, which stood at 1.8 mb/d and the Middle East, which came in as the third region with an average of 1.4 mb/d. Imports from Africa dropped from last month to stand at 531 tb/d.
Table 8 - 1: US crude and product net imports, tb/d
Japan Japan’s crude oil imports increased in March by 224 tb/d m-o-m, or 8%, to average 3.2 mb/d, while y-o-y, they increased by 15 tb/d .
Graph 8 - 3: Japan’s imports of crude and petroleum products
Graph 8 - 4: Japan’s exports of crude and petroleum products
ChangeFeb 18 Mar 18 Apr 18 Apr 18/Mar 18
Crude oil 5,888 6,055 6,508 452Total products -3,152 -2,754 -3,251 -498
Total crude and products 2,736 3,302 3,257 -45
Sources: US Energy Information Administration and OPEC Secretariat.
012345
0200400600800
1,0001,2001,400
Mar
17
Apr
17
May
17
Jun
17Ju
l 17
Aug
17
Sep
17
Oct
17
Nov
17
Dec
17
Jan
18Fe
b 18
Mar
18
mb/dtb/d
Fuel oil Naphtha LPGOthers* Crude oil
Note: * Others: Contains gasoline, jet fuel, kerosene, gasoil, asphalt and paraffin wax.Sources: Ministry of Economy, Trade and Industry of Japan and OPEC Secretariat.
0100200300400500600700
0100200300400500600700
Mar
17
Apr
17
May
17
Jun
17Ju
l 17
Aug
17
Sep
17
Oct
17
Nov
17
Dec
17
Jan
18Fe
b 18
Mar
18
tb/dtb/d
Fuel oil Gasoil Jet fuel Others*
Note: * Others: Contains LPG, gasoline, naphtha, kerosene, lubricating oil, asphalt and paraffin wax.Sources: Ministry of Economy, Trade and Industry of Japan and OPEC Secretariat.
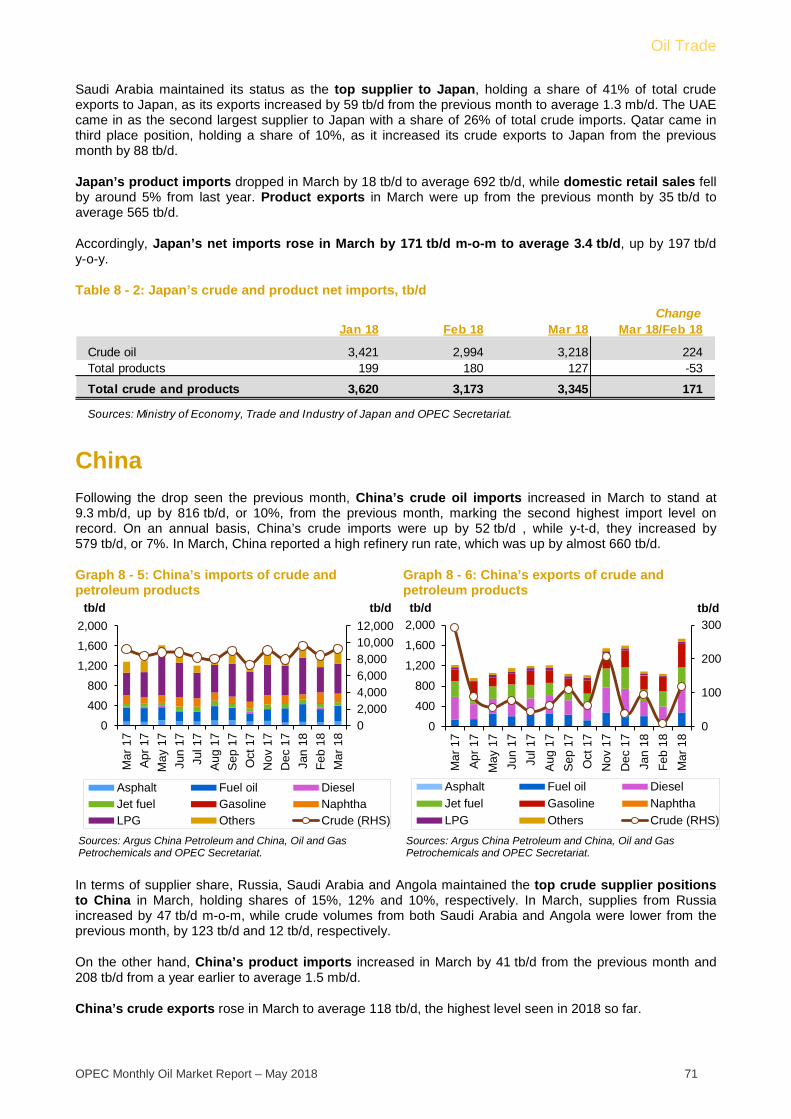
Oil Trade
OPEC Monthly Oil Market Report – May 2018 71
Saudi Arabia maintained its status as the top supplier to Japan, holding a share of 41% of total crude exports to Japan, as its exports increased by 59 tb/d from the previous month to average 1.3 mb/d. The UAE came in as the second largest supplier to Japan with a share of 26% of total crude imports. Qatar came in third place position, holding a share of 10%, as it increased its crude exports to Japan from the previous month by 88 tb/d.
Japan’s product imports dropped in March by 18 tb/d to average 692 tb/d, while domestic retail sales fell by around 5% from last year. Product exports in March were up from the previous month by 35 tb/d to average 565 tb/d.
Accordingly, Japan’s net imports rose in March by 171 tb/d m-o-m to average 3.4 tb/d, up by 197 tb/d y-o-y.
Table 8 - 2: Japan’s crude and product net imports, tb/d
China Following the drop seen the previous month, China’s crude oil imports increased in March to stand at 9.3 mb/d, up by 816 tb/d, or 10%, from the previous month, marking the second highest import level on record. On an annual basis, China’s crude imports were up by 52 tb/d , while y-t-d, they increased by 579 tb/d, or 7%. In March, China reported a high refinery run rate, which was up by almost 660 tb/d.
Graph 8 - 5: China’s imports of crude and petroleum products
Graph 8 - 6: China’s exports of crude and petroleum products
In terms of supplier share, Russia, Saudi Arabia and Angola maintained the top crude supplier positions to China in March, holding shares of 15%, 12% and 10%, respectively. In March, supplies from Russia increased by 47 tb/d m-o-m, while crude volumes from both Saudi Arabia and Angola were lower from the previous month, by 123 tb/d and 12 tb/d, respectively.
On the other hand, China’s product imports increased in March by 41 tb/d from the previous month and 208 tb/d from a year earlier to average 1.5 mb/d.
China’s crude exports rose in March to average 118 tb/d, the highest level seen in 2018 so far.
ChangeJan 18 Feb 18 Mar 18 Mar 18/Feb 18
Crude oil 3,421 2,994 3,218 224Total products 199 180 127 -53
Total crude and products 3,620 3,173 3,345 171
Sources: Ministry of Economy, Trade and Industry of Japan and OPEC Secretariat.
02,0004,0006,0008,00010,00012,000
0
400
800
1,200
1,600
2,000
Mar
17
Apr
17
May
17
Jun
17Ju
l 17
Aug
17
Sep
17
Oct
17
Nov
17
Dec
17
Jan
18Fe
b 18
Mar
18
tb/dtb/d
Asphalt Fuel oil DieselJet fuel Gasoline NaphthaLPG Others Crude (RHS)
Sources: Argus China Petroleum and China, Oil and Gas Petrochemicals and OPEC Secretariat.
0
100
200
300
0
400
800
1,200
1,600
2,000
Mar
17
Apr
17
May
17
Jun
17Ju
l 17
Aug
17
Sep
17
Oct
17
Nov
17
Dec
17
Jan
18Fe
b 18
Mar
18
tb/dtb/d
Asphalt Fuel oil DieselJet fuel Gasoline NaphthaLPG Others Crude (RHS)
Sources: Argus China Petroleum and China, Oil and Gas Petrochemicals and OPEC Secretariat.
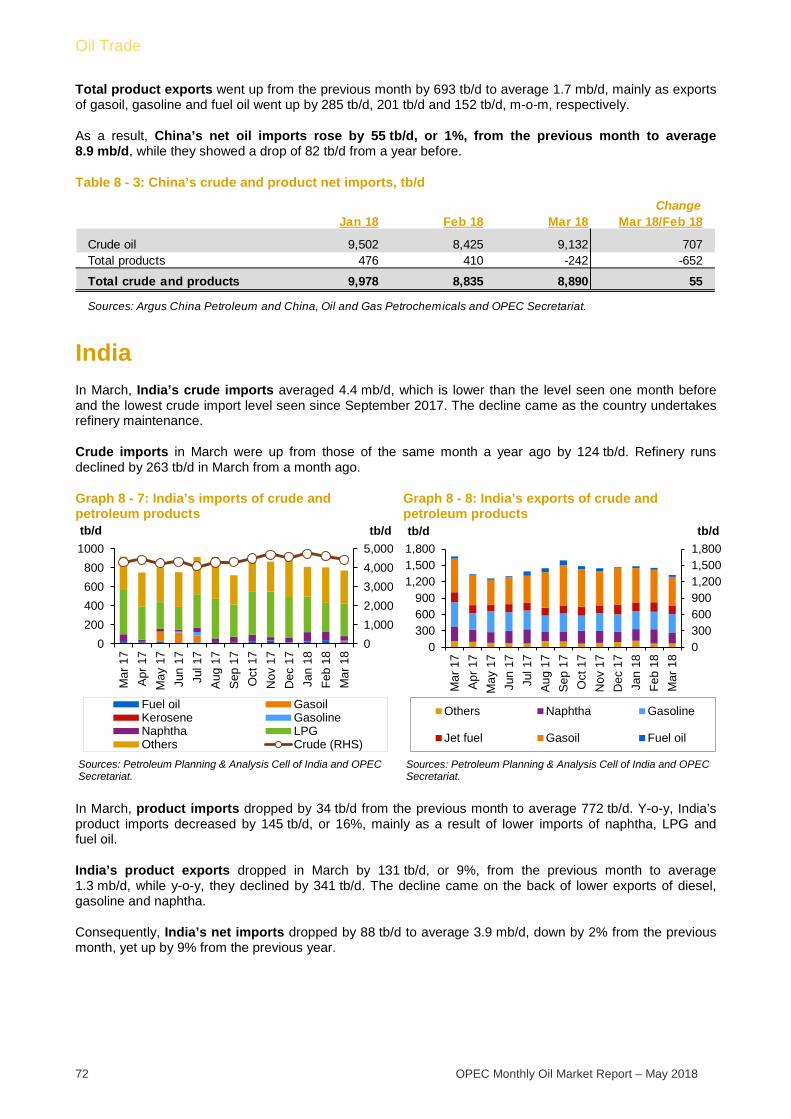
Oil Trade
72 OPEC Monthly Oil Market Report – May 2018
Total product exports went up from the previous month by 693 tb/d to average 1.7 mb/d, mainly as exports of gasoil, gasoline and fuel oil went up by 285 tb/d, 201 tb/d and 152 tb/d, m-o-m, respectively.
As a result, China’s net oil imports rose by 55 tb/d, or 1%, from the previous month to average 8.9 mb/d, while they showed a drop of 82 tb/d from a year before.
Table 8 - 3: China’s crude and product net imports, tb/d
India In March, India’s crude imports averaged 4.4 mb/d, which is lower than the level seen one month before and the lowest crude import level seen since September 2017. The decline came as the country undertakes refinery maintenance.
Crude imports in March were up from those of the same month a year ago by 124 tb/d. Refinery runs declined by 263 tb/d in March from a month ago.
Graph 8 - 7: India’s imports of crude and petroleum products
Graph 8 - 8: India’s exports of crude and petroleum products
In March, product imports dropped by 34 tb/d from the previous month to average 772 tb/d. Y-o-y, India’s product imports decreased by 145 tb/d, or 16%, mainly as a result of lower imports of naphtha, LPG and fuel oil.
India’s product exports dropped in March by 131 tb/d, or 9%, from the previous month to average 1.3 mb/d, while y-o-y, they declined by 341 tb/d. The decline came on the back of lower exports of diesel, gasoline and naphtha.
Consequently, India’s net imports dropped by 88 tb/d to average 3.9 mb/d, down by 2% from the previous month, yet up by 9% from the previous year.
ChangeJan 18 Feb 18 Mar 18 Mar 18/Feb 18
Crude oil 9,502 8,425 9,132 707Total products 476 410 -242 -652
Total crude and products 9,978 8,835 8,890 55
Sources: Argus China Petroleum and China, Oil and Gas Petrochemicals and OPEC Secretariat.
01,0002,0003,0004,0005,000
0200400600800
1000
Mar
17
Apr
17
May
17
Jun
17Ju
l 17
Aug
17
Sep
17
Oct
17
Nov
17
Dec
17
Jan
18Fe
b 18
Mar
18
tb/dtb/d
Fuel oil GasoilKerosene GasolineNaphtha LPGOthers Crude (RHS)
Sources: Petroleum Planning & Analysis Cell of India and OPEC Secretariat.
03006009001,2001,5001,800
0300600900
1,2001,5001,800
Mar
17
Apr
17
May
17
Jun
17Ju
l 17
Aug
17
Sep
17
Oct
17
Nov
17
Dec
17
Jan
18Fe
b 18
Mar
18
tb/dtb/d
Others Naphtha Gasoline
Jet fuel Gasoil Fuel oil
Sources: Petroleum Planning & Analysis Cell of India and OPEC Secretariat.
Oil Trade
OPEC Monthly Oil Market Report – May 2018 73
Table 8 - 4: India’s crude and product net imports, tb/d
FSU In March, total crude oil exports from the Former Soviet Union (FSU) rose by 109 tb/d m-o-m, or 2%, to average 6.9 mb/d. Crude exports through Russian pipelines also went up by 35 tb/d m-o-m to average 4 mb/d.
In the Transneft system, total shipments from the Black Sea went up by 11 tb/d m-o-m, or 2%, to average 542 tb/d in March, while total Baltic Sea exports dropped by 9 tb/d m-o-m as shipments from the Ust Luga port dropped by 158 tb/d m-o-m, although the drop was offset by higher exports from the Primorsk port, which increased by 148 tb/d m-o-m. Meantime, the Druzhba pipeline’s total shipments went down by only 5 tb/d, to average 1 mb/d. The Kozmino shipments were higher in March by 18 tb/d m-o-m, or 3%, to average 575 tb/d.
In the Lukoil system, exports were relatively stable from the previous month in the Barents Sea and the Baltic Sea. Russia’s Far East total exports increased from the previous month to average 368 tb/d.
Central Asia’s total exports stood at 209 tb/d in March, down by 46 tb/d m-o-m.
Black Sea total exports went up by 89 tb/d m-o-m as a result of increased shipments from the Novorossiyk port terminal (CPC).
In the Mediterranean Sea, BTC supplies increased from the previous month by 23 tb/d m-o-m, or 3%, to average 705 tb/d.
FSU total product exports declined by 176 tb/d m-o-m, or 5%, to average 3.2 mb/d. This drop came as a result of lower imported volumes of all products, which declined by a range of between 5-63 tb/d.
ChangeJan 18 Feb 18 Mar 18 Mar 18/Feb 18
Crude oil 4,738 4,609 4,425 -185Total products -673 -649 -552 97
Total crude and products 4,065 3,960 3,872 -88
Note: India data tab le does not include information for crude import and product export by Reliance Industries.Sources: Petroleum Planning & Analysis Cell of India and OPEC Secretariat.

Oil Trade
74 OPEC Monthly Oil Market Report – May 2018
2017 3Q17 4Q17 Feb 18 Mar 18
Transneft systemEurope Black sea total 605 573 617 532 542
Novorossiysk port terminal - total 605 573 617 532 542 of which: Russian oil 424 403 409 357 365 Others 181 170 208 175 177Baltic sea total 1,516 1,403 1,434 1,288 1,278 Primorsk port terminal - total 871 801 777 619 768 of which: Russian oil 871 801 777 619 768 Others 0 0 0 0 0 Ust-Luga port terminal - total 645 603 657 668 510 of which: Russian oil 470 423 478 488 348 Others 175 180 180 180 162Druzhba pipeline total 1,009 1,044 1,018 1,010 1,005 of which: Russian oil 977 1,012 986 977 973 Others 32 32 32 33 32
Asia Pacific ocean total 645 638 662 557 575 Kozmino port terminal - total 645 638 662 557 575China (via ESPO pipeline) total 336 339 345 528 549 China Amur 336 339 345 528 549
Total Russian crude exports 4,111 3,997 4,076 3,914 3,949
Lukoil systemEurope & Barents sea total 170 159 146 133 135North America Varandey offshore platform 170 159 146 133 135Europe Baltic sea total 13 14 13 8 6
Kalinigrad port terminal 13 14 13 8 6
Other routesAsia Russian Far East total 343 305 317 356 368
Aniva bay port terminal 127 122 135 129 142 De Kastri port terminal 216 184 182 227 226Central Asia total 262 250 285 255 209 Kenkiyak-Alashankou 262 250 285 255 209
Europe Black sea total 1,277 1,163 1,374 1,393 1,482 Novorossiysk port terminal (CPC) 1,194 1,115 1,276 1,297 1,405 Supsa port terminal 72 42 90 86 77 Batumi port terminal 11 6 8 10 0 Kulevi port terminal 0 0 0 0 0Mediterranean sea total 707 731 719 682 705 BTC 707 731 719 682 705
Russian railRussian rail 40 36 45 35 29 of which: Russian oil 40 36 45 35 29 Others 0 0 0 0 0
Total FSU crude exports 6,923 6,655 6,976 6,776 6,884
ProductsGasoline 193 184 171 290 277Naphtha 549 509 559 562 521Jet 35 34 32 36 31Gasoil 980 833 881 1,134 1,112Fuel oil 1,025 870 1,012 994 962VGO 308 286 313 365 302
Total FSU product exports 3,089 2,715 2,967 3,381 3,205
Total FSU oil exports 10,012 9,370 9,943 10,157 10,089
Sources: Argus Nefte Transport and Argus Global Markets.
Table 8 - 5: Recent FSU exports of crude and petroleum products by sources, tb/d
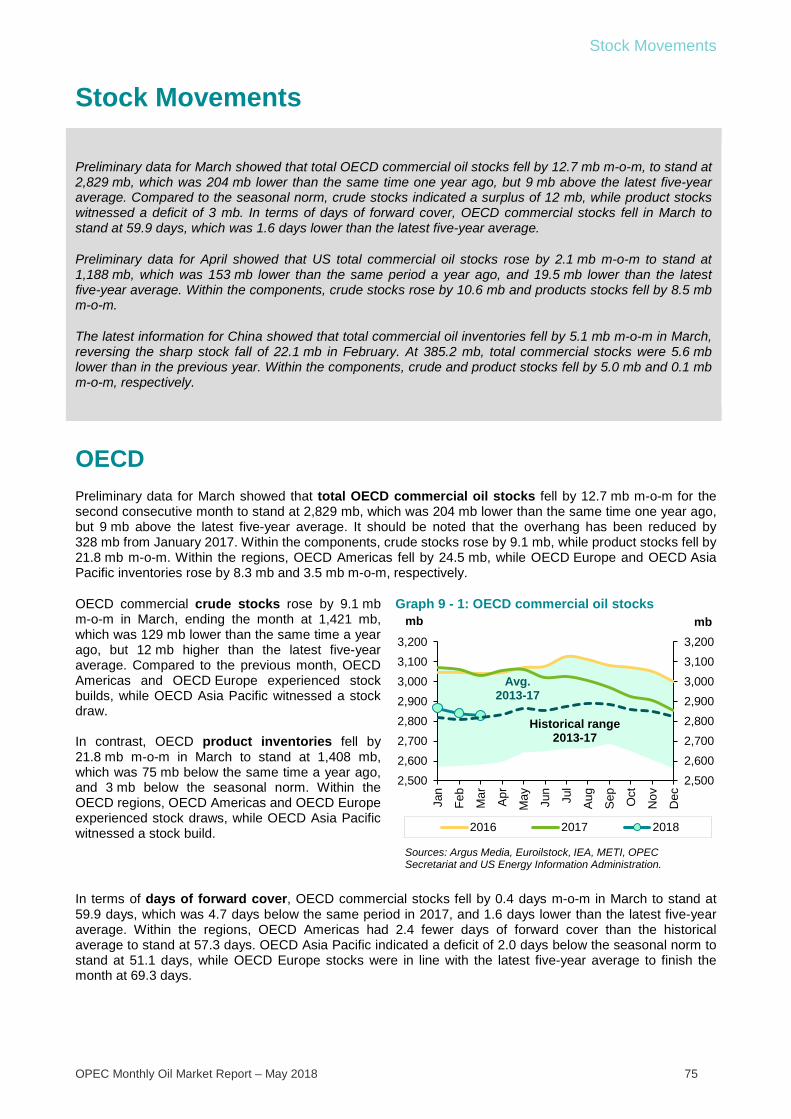
Stock Movements
OPEC Monthly Oil Market Report – May 2018 75
Stock Movements
Preliminary data for March showed that total OECD commercial oil stocks fell by 12.7 mb m-o-m, to stand at 2,829 mb, which was 204 mb lower than the same time one year ago, but 9 mb above the latest five-year average. Compared to the seasonal norm, crude stocks indicated a surplus of 12 mb, while product stocks witnessed a deficit of 3 mb. In terms of days of forward cover, OECD commercial stocks fell in March to stand at 59.9 days, which was 1.6 days lower than the latest five-year average.
Preliminary data for April showed that US total commercial oil stocks rose by 2.1 mb m-o-m to stand at 1,188 mb, which was 153 mb lower than the same period a year ago, and 19.5 mb lower than the latest five-year average. Within the components, crude stocks rose by 10.6 mb and products stocks fell by 8.5 mb m-o-m.
The latest information for China showed that total commercial oil inventories fell by 5.1 mb m-o-m in March, reversing the sharp stock fall of 22.1 mb in February. At 385.2 mb, total commercial stocks were 5.6 mb lower than in the previous year. Within the components, crude and product stocks fell by 5.0 mb and 0.1 mb m-o-m, respectively.
OECD Preliminary data for March showed that total OECD commercial oil stocks fell by 12.7 mb m-o-m for the second consecutive month to stand at 2,829 mb, which was 204 mb lower than the same time one year ago, but 9 mb above the latest five-year average. It should be noted that the overhang has been reduced by 328 mb from January 2017. Within the components, crude stocks rose by 9.1 mb, while product stocks fell by 21.8 mb m-o-m. Within the regions, OECD Americas fell by 24.5 mb, while OECD Europe and OECD Asia Pacific inventories rose by 8.3 mb and 3.5 mb m-o-m, respectively.
OECD commercial crude stocks rose by 9.1 mb m-o-m in March, ending the month at 1,421 mb, which was 129 mb lower than the same time a year ago, but 12 mb higher than the latest five-year average. Compared to the previous month, OECD Americas and OECD Europe experienced stock builds, while OECD Asia Pacific witnessed a stock draw. In contrast, OECD product inventories fell by 21.8 mb m-o-m in March to stand at 1,408 mb, which was 75 mb below the same time a year ago, and 3 mb below the seasonal norm. Within the OECD regions, OECD Americas and OECD Europe experienced stock draws, while OECD Asia Pacific witnessed a stock build.
Graph 9 - 1: OECD commercial oil stocks
In terms of days of forward cover, OECD commercial stocks fell by 0.4 days m-o-m in March to stand at 59.9 days, which was 4.7 days below the same period in 2017, and 1.6 days lower than the latest five-year average. Within the regions, OECD Americas had 2.4 fewer days of forward cover than the historical average to stand at 57.3 days. OECD Asia Pacific indicated a deficit of 2.0 days below the seasonal norm to stand at 51.1 days, while OECD Europe stocks were in line with the latest five-year average to finish the month at 69.3 days.
2,5002,6002,7002,8002,9003,0003,1003,200
2,5002,6002,7002,8002,9003,0003,1003,200
Jan
Feb
Mar Apr
May Jun
Jul
Aug
Sep Oct
Nov
Dec
mbmb
2016 2017 2018
Historical range2013-17
Sources: Argus Media, Euroilstock, IEA, METI, OPEC Secretariat and US Energy Information Administration.
Avg. 2013-17
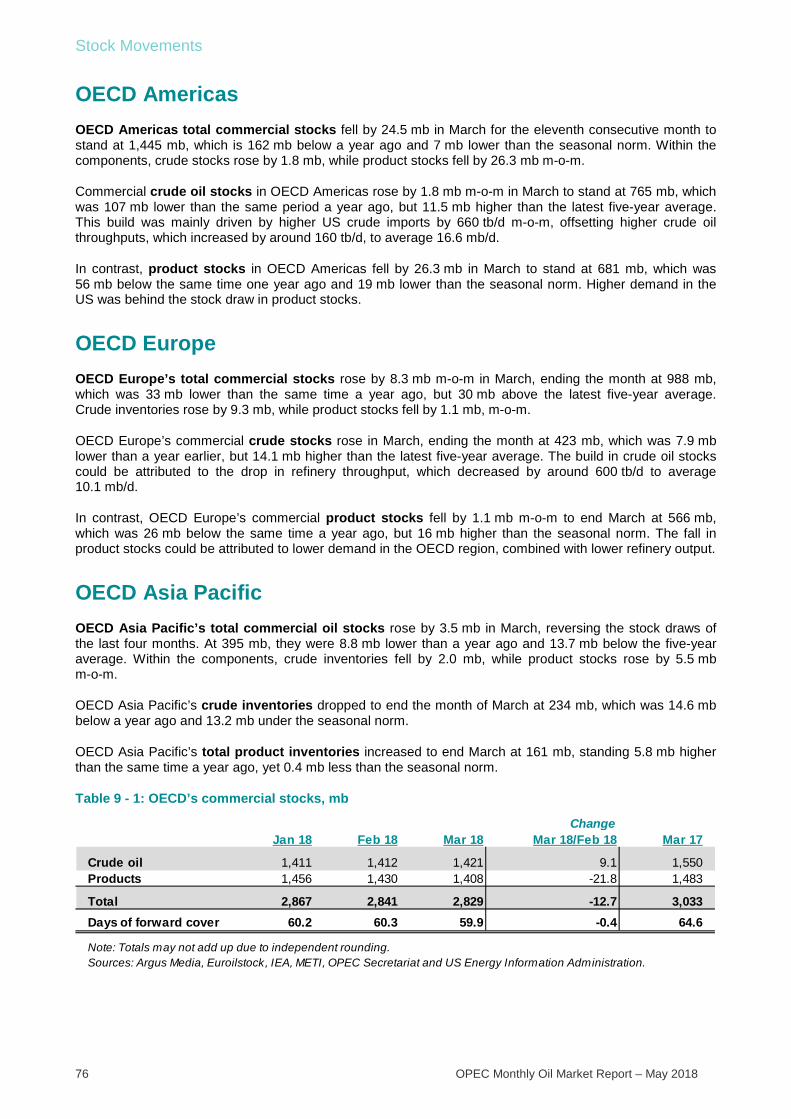
Stock Movements
76 OPEC Monthly Oil Market Report – May 2018
OECD Americas OECD Americas total commercial stocks fell by 24.5 mb in March for the eleventh consecutive month to stand at 1,445 mb, which is 162 mb below a year ago and 7 mb lower than the seasonal norm. Within the components, crude stocks rose by 1.8 mb, while product stocks fell by 26.3 mb m-o-m.
Commercial crude oil stocks in OECD Americas rose by 1.8 mb m-o-m in March to stand at 765 mb, which was 107 mb lower than the same period a year ago, but 11.5 mb higher than the latest five-year average. This build was mainly driven by higher US crude imports by 660 tb/d m-o-m, offsetting higher crude oil throughputs, which increased by around 160 tb/d, to average 16.6 mb/d.
In contrast, product stocks in OECD Americas fell by 26.3 mb in March to stand at 681 mb, which was 56 mb below the same time one year ago and 19 mb lower than the seasonal norm. Higher demand in the US was behind the stock draw in product stocks.
OECD Europe OECD Europe’s total commercial stocks rose by 8.3 mb m-o-m in March, ending the month at 988 mb, which was 33 mb lower than the same time a year ago, but 30 mb above the latest five-year average. Crude inventories rose by 9.3 mb, while product stocks fell by 1.1 mb, m-o-m.
OECD Europe’s commercial crude stocks rose in March, ending the month at 423 mb, which was 7.9 mb lower than a year earlier, but 14.1 mb higher than the latest five-year average. The build in crude oil stocks could be attributed to the drop in refinery throughput, which decreased by around 600 tb/d to average 10.1 mb/d.
In contrast, OECD Europe’s commercial product stocks fell by 1.1 mb m-o-m to end March at 566 mb, which was 26 mb below the same time a year ago, but 16 mb higher than the seasonal norm. The fall in product stocks could be attributed to lower demand in the OECD region, combined with lower refinery output.
OECD Asia Pacific OECD Asia Pacific’s total commercial oil stocks rose by 3.5 mb in March, reversing the stock draws of the last four months. At 395 mb, they were 8.8 mb lower than a year ago and 13.7 mb below the five-year average. Within the components, crude inventories fell by 2.0 mb, while product stocks rose by 5.5 mb m-o-m.
OECD Asia Pacific’s crude inventories dropped to end the month of March at 234 mb, which was 14.6 mb below a year ago and 13.2 mb under the seasonal norm.
OECD Asia Pacific’s total product inventories increased to end March at 161 mb, standing 5.8 mb higher than the same time a year ago, yet 0.4 mb less than the seasonal norm.
Table 9 - 1: OECD’s commercial stocks, mb
ChangeJan 18 Feb 18 Mar 18 Mar 18/Feb 18 Mar 17
Crude oil 1,411 1,412 1,421 9.1 1,550Products 1,456 1,430 1,408 -21.8 1,483
Total 2,867 2,841 2,829 -12.7 3,033Days of forward cover 60.2 60.3 59.9 -0.4 64.6
Note: Totals may not add up due to independent rounding.Sources: Argus Media, Euroilstock, IEA, METI, OPEC Secretariat and US Energy Information Administration.
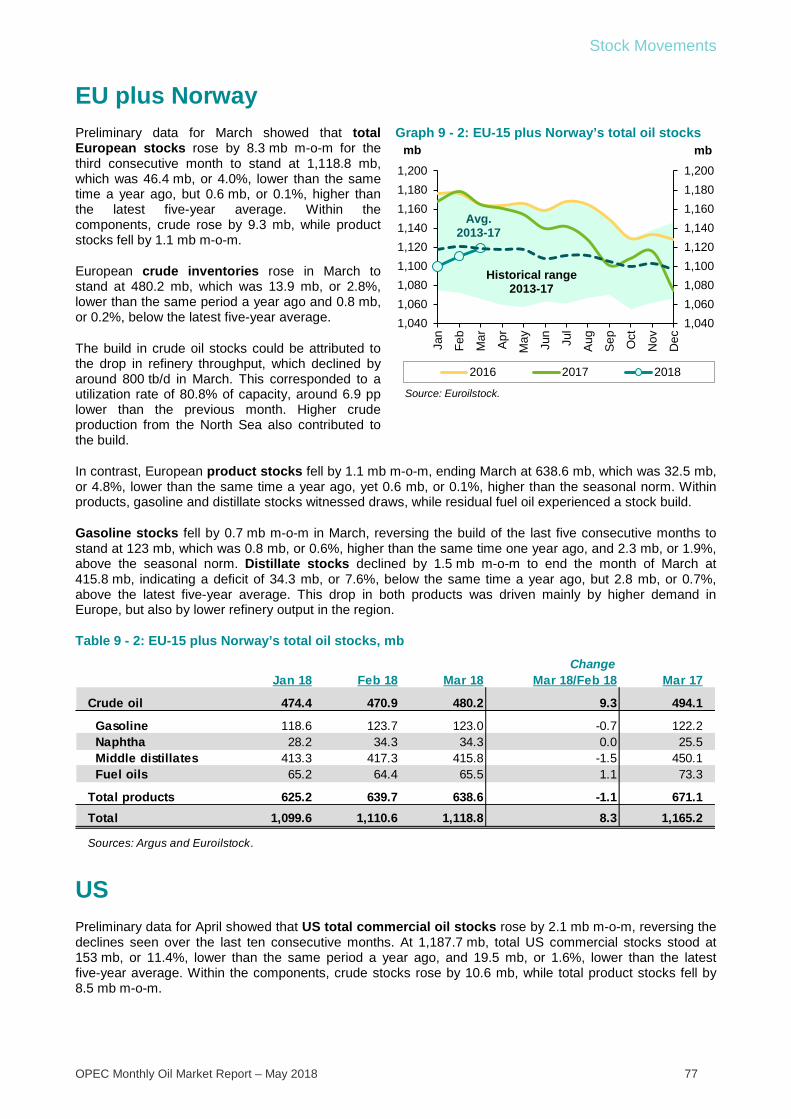
Stock Movements
OPEC Monthly Oil Market Report – May 2018 77
EU plus Norway Preliminary data for March showed that total European stocks rose by 8.3 mb m-o-m for the third consecutive month to stand at 1,118.8 mb, which was 46.4 mb, or 4.0%, lower than the same time a year ago, but 0.6 mb, or 0.1%, higher than the latest five-year average. Within the components, crude rose by 9.3 mb, while product stocks fell by 1.1 mb m-o-m.
European crude inventories rose in March to stand at 480.2 mb, which was 13.9 mb, or 2.8%, lower than the same period a year ago and 0.8 mb, or 0.2%, below the latest five-year average.
The build in crude oil stocks could be attributed to the drop in refinery throughput, which declined by around 800 tb/d in March. This corresponded to a utilization rate of 80.8% of capacity, around 6.9 pp lower than the previous month. Higher crude production from the North Sea also contributed to the build.
Graph 9 - 2: EU-15 plus Norway’s total oil stocks
In contrast, European product stocks fell by 1.1 mb m-o-m, ending March at 638.6 mb, which was 32.5 mb, or 4.8%, lower than the same time a year ago, yet 0.6 mb, or 0.1%, higher than the seasonal norm. Within products, gasoline and distillate stocks witnessed draws, while residual fuel oil experienced a stock build.
Gasoline stocks fell by 0.7 mb m-o-m in March, reversing the build of the last five consecutive months to stand at 123 mb, which was 0.8 mb, or 0.6%, higher than the same time one year ago, and 2.3 mb, or 1.9%, above the seasonal norm. Distillate stocks declined by 1.5 mb m-o-m to end the month of March at 415.8 mb, indicating a deficit of 34.3 mb, or 7.6%, below the same time a year ago, but 2.8 mb, or 0.7%, above the latest five-year average. This drop in both products was driven mainly by higher demand in Europe, but also by lower refinery output in the region.
Table 9 - 2: EU-15 plus Norway’s total oil stocks, mb
US Preliminary data for April showed that US total commercial oil stocks rose by 2.1 mb m-o-m, reversing the declines seen over the last ten consecutive months. At 1,187.7 mb, total US commercial stocks stood at 153 mb, or 11.4%, lower than the same period a year ago, and 19.5 mb, or 1.6%, lower than the latest five-year average. Within the components, crude stocks rose by 10.6 mb, while total product stocks fell by 8.5 mb m-o-m.
1,0401,0601,0801,1001,1201,1401,1601,1801,200
1,0401,0601,0801,1001,1201,1401,1601,1801,200
Jan
Feb
Mar Apr
May Jun
Jul
Aug
Sep Oct
Nov
Dec
mbmb
2016 2017 2018
Historical range2013-17
Source: Euroilstock.
Avg. 2013-17
ChangeJan 18 Feb 18 Mar 18 Mar 18/Feb 18 Mar 17
Crude oil 474.4 470.9 480.2 9.3 494.1
Gasoline 118.6 123.7 123.0 -0.7 122.2 Naphtha 28.2 34.3 34.3 0.0 25.5 Middle distillates 413.3 417.3 415.8 -1.5 450.1 Fuel oils 65.2 64.4 65.5 1.1 73.3
Total products 625.2 639.7 638.6 -1.1 671.1Total 1,099.6 1,110.6 1,118.8 8.3 1,165.2
Sources: Argus and Euroilstock.
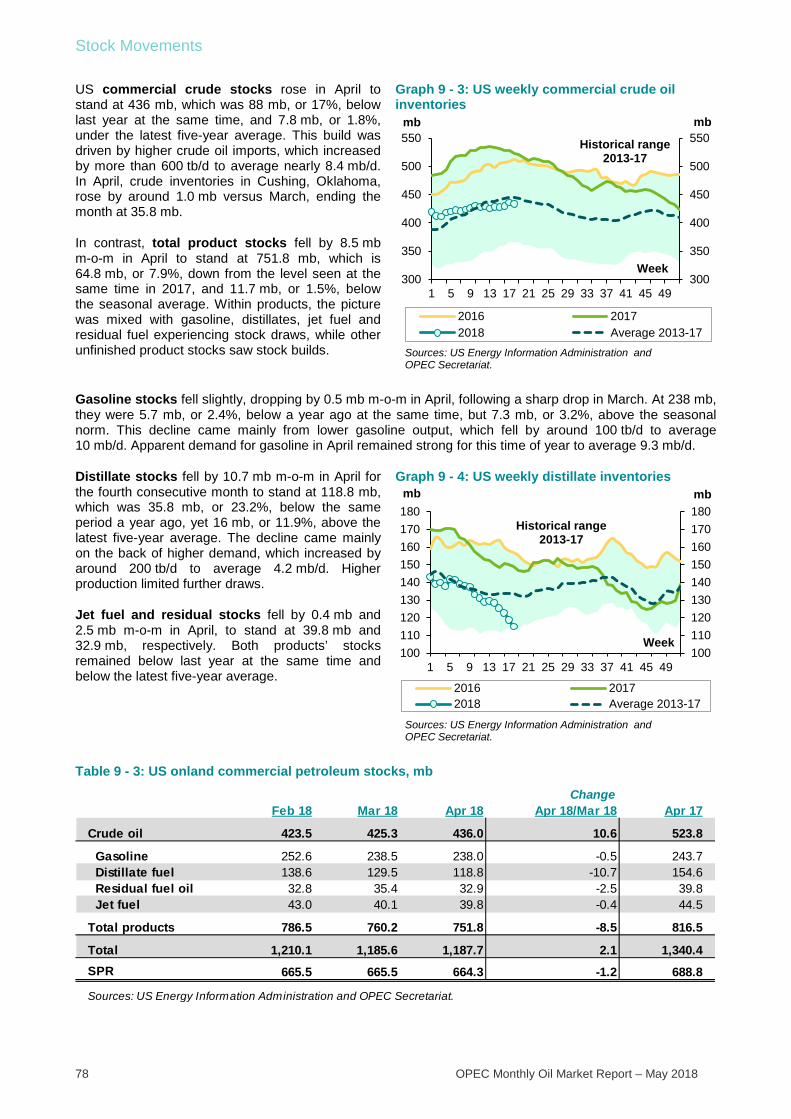
Stock Movements
78 OPEC Monthly Oil Market Report – May 2018
US commercial crude stocks rose in April to stand at 436 mb, which was 88 mb, or 17%, below last year at the same time, and 7.8 mb, or 1.8%, under the latest five-year average. This build was driven by higher crude oil imports, which increased by more than 600 tb/d to average nearly 8.4 mb/d. In April, crude inventories in Cushing, Oklahoma, rose by around 1.0 mb versus March, ending the month at 35.8 mb.
In contrast, total product stocks fell by 8.5 mb m-o-m in April to stand at 751.8 mb, which is 64.8 mb, or 7.9%, down from the level seen at the same time in 2017, and 11.7 mb, or 1.5%, below the seasonal average. Within products, the picture was mixed with gasoline, distillates, jet fuel and residual fuel experiencing stock draws, while other unfinished product stocks saw stock builds.
Graph 9 - 3: US weekly commercial crude oil inventories
Gasoline stocks fell slightly, dropping by 0.5 mb m-o-m in April, following a sharp drop in March. At 238 mb, they were 5.7 mb, or 2.4%, below a year ago at the same time, but 7.3 mb, or 3.2%, above the seasonal norm. This decline came mainly from lower gasoline output, which fell by around 100 tb/d to average 10 mb/d. Apparent demand for gasoline in April remained strong for this time of year to average 9.3 mb/d.
Distillate stocks fell by 10.7 mb m-o-m in April for the fourth consecutive month to stand at 118.8 mb, which was 35.8 mb, or 23.2%, below the same period a year ago, yet 16 mb, or 11.9%, above the latest five-year average. The decline came mainly on the back of higher demand, which increased by around 200 tb/d to average 4.2 mb/d. Higher production limited further draws.
Jet fuel and residual stocks fell by 0.4 mb and 2.5 mb m-o-m in April, to stand at 39.8 mb and 32.9 mb, respectively. Both products’ stocks remained below last year at the same time and below the latest five-year average.
Graph 9 - 4: US weekly distillate inventories
Table 9 - 3: US onland commercial petroleum stocks, mb
300
350
400
450
500
550
300
350
400
450
500
550
1 5 9 13 17 21 25 29 33 37 41 45 49
mbmb
2016 20172018 Average 2013-17
Historical range2013-17
Sources: US Energy Information Administration and OPEC Secretariat.
Week
100110120130140150160170180
100110120130140150160170180
1 5 9 13 17 21 25 29 33 37 41 45 49
mbmb
2016 20172018 Average 2013-17
Historical range2013-17
Sources: US Energy Information Administration and OPEC Secretariat.
Week
ChangeFeb 18 Mar 18 Apr 18 Apr 18/Mar 18 Apr 17
Crude oil 423.5 425.3 436.0 10.6 523.8
Gasoline 252.6 238.5 238.0 -0.5 243.7 Distillate fuel 138.6 129.5 118.8 -10.7 154.6 Residual fuel oil 32.8 35.4 32.9 -2.5 39.8 Jet fuel 43.0 40.1 39.8 -0.4 44.5
Total products 786.5 760.2 751.8 -8.5 816.5
Total 1,210.1 1,185.6 1,187.7 2.1 1,340.4SPR 665.5 665.5 664.3 -1.2 688.8
Sources: US Energy Information Administration and OPEC Secretariat.
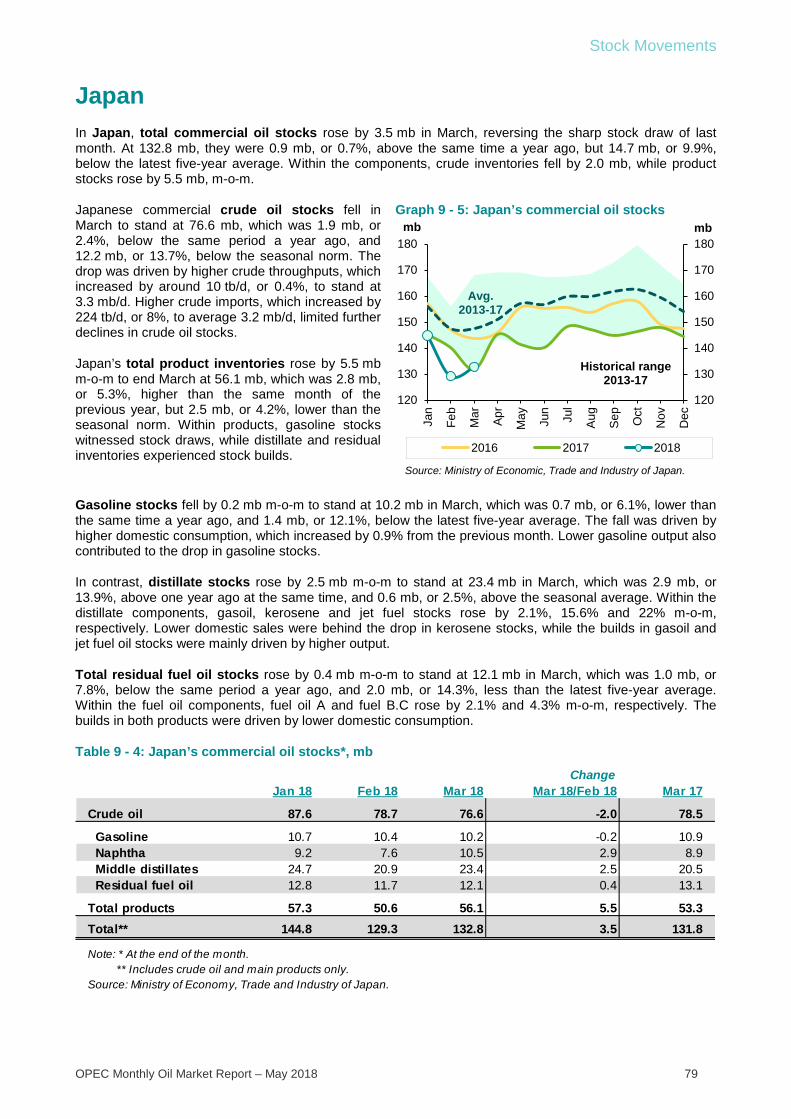
Stock Movements
OPEC Monthly Oil Market Report – May 2018 79
Japan In Japan, total commercial oil stocks rose by 3.5 mb in March, reversing the sharp stock draw of last month. At 132.8 mb, they were 0.9 mb, or 0.7%, above the same time a year ago, but 14.7 mb, or 9.9%, below the latest five-year average. Within the components, crude inventories fell by 2.0 mb, while product stocks rose by 5.5 mb, m-o-m.
Japanese commercial crude oil stocks fell in March to stand at 76.6 mb, which was 1.9 mb, or 2.4%, below the same period a year ago, and 12.2 mb, or 13.7%, below the seasonal norm. The drop was driven by higher crude throughputs, which increased by around 10 tb/d, or 0.4%, to stand at 3.3 mb/d. Higher crude imports, which increased by 224 tb/d, or 8%, to average 3.2 mb/d, limited further declines in crude oil stocks.
Japan’s total product inventories rose by 5.5 mb m-o-m to end March at 56.1 mb, which was 2.8 mb, or 5.3%, higher than the same month of the previous year, but 2.5 mb, or 4.2%, lower than the seasonal norm. Within products, gasoline stocks witnessed stock draws, while distillate and residual inventories experienced stock builds.
Graph 9 - 5: Japan’s commercial oil stocks
Gasoline stocks fell by 0.2 mb m-o-m to stand at 10.2 mb in March, which was 0.7 mb, or 6.1%, lower than the same time a year ago, and 1.4 mb, or 12.1%, below the latest five-year average. The fall was driven by higher domestic consumption, which increased by 0.9% from the previous month. Lower gasoline output also contributed to the drop in gasoline stocks.
In contrast, distillate stocks rose by 2.5 mb m-o-m to stand at 23.4 mb in March, which was 2.9 mb, or 13.9%, above one year ago at the same time, and 0.6 mb, or 2.5%, above the seasonal average. Within the distillate components, gasoil, kerosene and jet fuel stocks rose by 2.1%, 15.6% and 22% m-o-m, respectively. Lower domestic sales were behind the drop in kerosene stocks, while the builds in gasoil and jet fuel oil stocks were mainly driven by higher output.
Total residual fuel oil stocks rose by 0.4 mb m-o-m to stand at 12.1 mb in March, which was 1.0 mb, or 7.8%, below the same period a year ago, and 2.0 mb, or 14.3%, less than the latest five-year average. Within the fuel oil components, fuel oil A and fuel B.C rose by 2.1% and 4.3% m-o-m, respectively. The builds in both products were driven by lower domestic consumption.
Table 9 - 4: Japan’s commercial oil stocks*, mb
120
130
140
150
160
170
180
120
130
140
150
160
170
180
Jan
Feb
Mar Apr
May Jun
Jul
Aug
Sep Oct
Nov
Dec
mbmb
2016 2017 2018
Historical range2013-17
Source: Ministry of Economic, Trade and Industry of Japan.
Avg. 2013-17
ChangeJan 18 Feb 18 Mar 18 Mar 18/Feb 18 Mar 17
Crude oil 87.6 78.7 76.6 -2.0 78.5
Gasoline 10.7 10.4 10.2 -0.2 10.9 Naphtha 9.2 7.6 10.5 2.9 8.9 Middle distillates 24.7 20.9 23.4 2.5 20.5 Residual fuel oil 12.8 11.7 12.1 0.4 13.1
Total products 57.3 50.6 56.1 5.5 53.3Total** 144.8 129.3 132.8 3.5 131.8
Note: * At the end of the month. ** Includes crude oil and main products only.Source: Ministry of Economy, Trade and Industry of Japan.
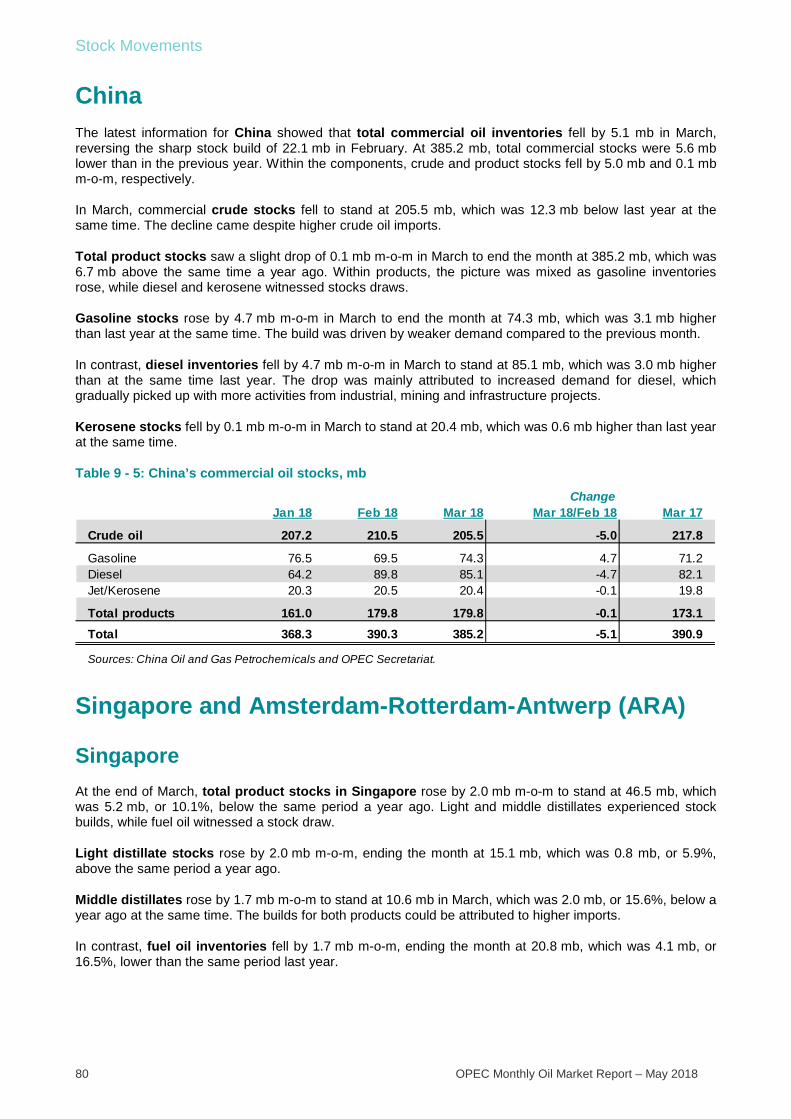
Stock Movements
80 OPEC Monthly Oil Market Report – May 2018
China The latest information for China showed that total commercial oil inventories fell by 5.1 mb in March, reversing the sharp stock build of 22.1 mb in February. At 385.2 mb, total commercial stocks were 5.6 mb lower than in the previous year. Within the components, crude and product stocks fell by 5.0 mb and 0.1 mb m-o-m, respectively.
In March, commercial crude stocks fell to stand at 205.5 mb, which was 12.3 mb below last year at the same time. The decline came despite higher crude oil imports.
Total product stocks saw a slight drop of 0.1 mb m-o-m in March to end the month at 385.2 mb, which was 6.7 mb above the same time a year ago. Within products, the picture was mixed as gasoline inventories rose, while diesel and kerosene witnessed stocks draws.
Gasoline stocks rose by 4.7 mb m-o-m in March to end the month at 74.3 mb, which was 3.1 mb higher than last year at the same time. The build was driven by weaker demand compared to the previous month.
In contrast, diesel inventories fell by 4.7 mb m-o-m in March to stand at 85.1 mb, which was 3.0 mb higher than at the same time last year. The drop was mainly attributed to increased demand for diesel, which gradually picked up with more activities from industrial, mining and infrastructure projects.
Kerosene stocks fell by 0.1 mb m-o-m in March to stand at 20.4 mb, which was 0.6 mb higher than last year at the same time.
Table 9 - 5: China’s commercial oil stocks, mb
Singapore and Amsterdam-Rotterdam-Antwerp (ARA)
Singapore At the end of March, total product stocks in Singapore rose by 2.0 mb m-o-m to stand at 46.5 mb, which was 5.2 mb, or 10.1%, below the same period a year ago. Light and middle distillates experienced stock builds, while fuel oil witnessed a stock draw.
Light distillate stocks rose by 2.0 mb m-o-m, ending the month at 15.1 mb, which was 0.8 mb, or 5.9%, above the same period a year ago.
Middle distillates rose by 1.7 mb m-o-m to stand at 10.6 mb in March, which was 2.0 mb, or 15.6%, below a year ago at the same time. The builds for both products could be attributed to higher imports.
In contrast, fuel oil inventories fell by 1.7 mb m-o-m, ending the month at 20.8 mb, which was 4.1 mb, or 16.5%, lower than the same period last year.
ChangeJan 18 Feb 18 Mar 18 Mar 18/Feb 18 Mar 17
Crude oil 207.2 210.5 205.5 -5.0 217.8
Gasoline 76.5 69.5 74.3 4.7 71.2Diesel 64.2 89.8 85.1 -4.7 82.1Jet/Kerosene 20.3 20.5 20.4 -0.1 19.8
Total products 161.0 179.8 179.8 -0.1 173.1Total 368.3 390.3 385.2 -5.1 390.9
Sources: China Oil and Gas Petrochemicals and OPEC Secretariat.
Stock Movements
OPEC Monthly Oil Market Report – May 2018 81
Amsterdam-Rotterdam-Antwerp (ARA) Total product stocks in ARA rose for the fourth consecutive month, increasing by 0.3 mb m-o-m to stand at 45.9 mb in March, which was 4.8 mb, or 9.4%, lower than at the same time a year ago. Within products, the picture was mixed as gasoline, jet oil and fuel oil inventories rose, while gasoil stocks witnessed a draw.
Gasoline stocks rose by 0.5 mb m-o-m to stand at 11.8 mb in March, which was 3.3 mb, or 39.3%, above last year at the same time.
Jet oil and fuel oil stocks rose by 0.1 mb and 1.2 mb m-o-m to stand at 4.6 mb and 6.4 mb, respectively. Both products remained below last year at the same time.
In contrast, gasoil stocks fell by 1.9 mb m-o-m, ending the month at 19.9 mb, which was 4.4 mb, or 18.1%, below a year earlier during the same period.
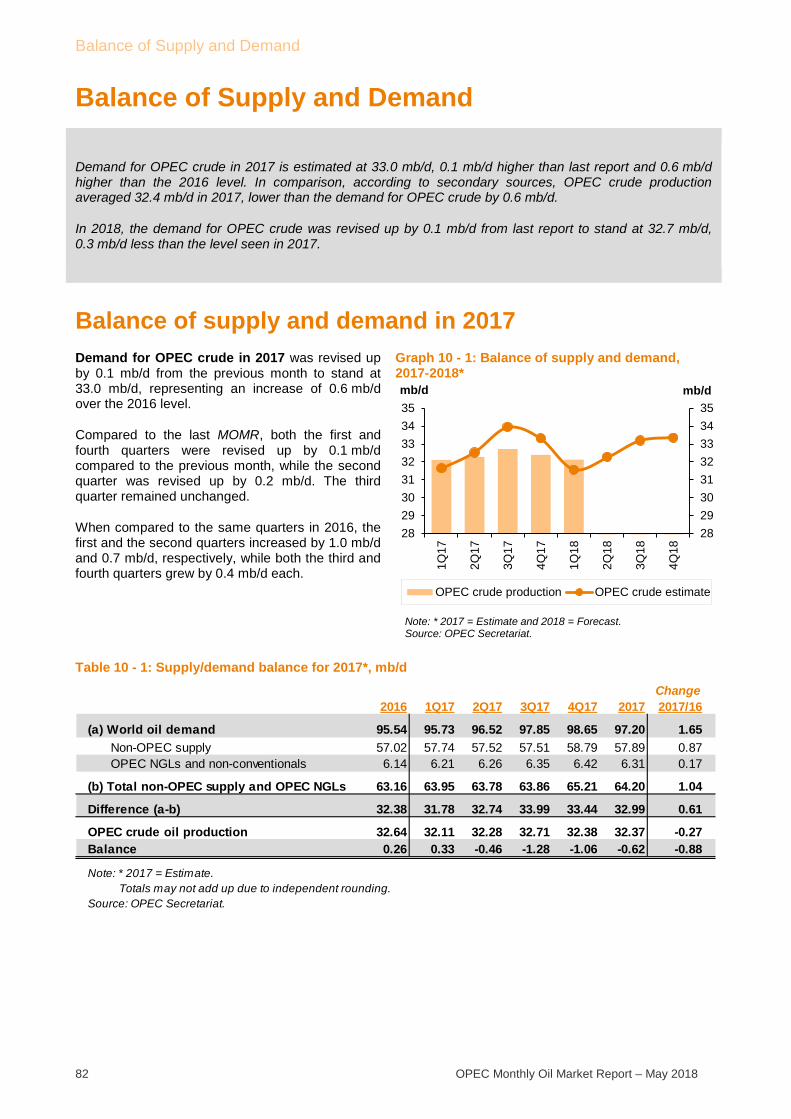
Balance of Supply and Demand
82 OPEC Monthly Oil Market Report – May 2018
Balance of Supply and Demand
Demand for OPEC crude in 2017 is estimated at 33.0 mb/d, 0.1 mb/d higher than last report and 0.6 mb/d higher than the 2016 level. In comparison, according to secondary sources, OPEC crude production averaged 32.4 mb/d in 2017, lower than the demand for OPEC crude by 0.6 mb/d.
In 2018, the demand for OPEC crude was revised up by 0.1 mb/d from last report to stand at 32.7 mb/d, 0.3 mb/d less than the level seen in 2017.
Balance of supply and demand in 2017 Demand for OPEC crude in 2017 was revised up by 0.1 mb/d from the previous month to stand at 33.0 mb/d, representing an increase of 0.6 mb/d over the 2016 level.
Compared to the last MOMR, both the first and fourth quarters were revised up by 0.1 mb/d compared to the previous month, while the second quarter was revised up by 0.2 mb/d. The third quarter remained unchanged.
When compared to the same quarters in 2016, the first and the second quarters increased by 1.0 mb/d and 0.7 mb/d, respectively, while both the third and fourth quarters grew by 0.4 mb/d each.
Graph 10 - 1: Balance of supply and demand, 2017-2018*
Table 10 - 1: Supply/demand balance for 2017*, mb/d
2829303132333435
2829303132333435
1Q17
2Q17
3Q17
4Q17
1Q18
2Q18
3Q18
4Q18
mb/dmb/d
OPEC crude production OPEC crude estimate
Note: * 2017 = Estimate and 2018 = Forecast.Source: OPEC Secretariat.
Change2016 1Q17 2Q17 3Q17 4Q17 2017 2017/16
(a) World oil demand 95.54 95.73 96.52 97.85 98.65 97.20 1.65 Non-OPEC supply 57.02 57.74 57.52 57.51 58.79 57.89 0.87 OPEC NGLs and non-conventionals 6.14 6.21 6.26 6.35 6.42 6.31 0.17
(b) Total non-OPEC supply and OPEC NGLs 63.16 63.95 63.78 63.86 65.21 64.20 1.04
Difference (a-b) 32.38 31.78 32.74 33.99 33.44 32.99 0.61
OPEC crude oil production 32.64 32.11 32.28 32.71 32.38 32.37 -0.27Balance 0.26 0.33 -0.46 -1.28 -1.06 -0.62 -0.88
Note: * 2017 = Estimate. Totals may not add up due to independent rounding.Source: OPEC Secretariat.
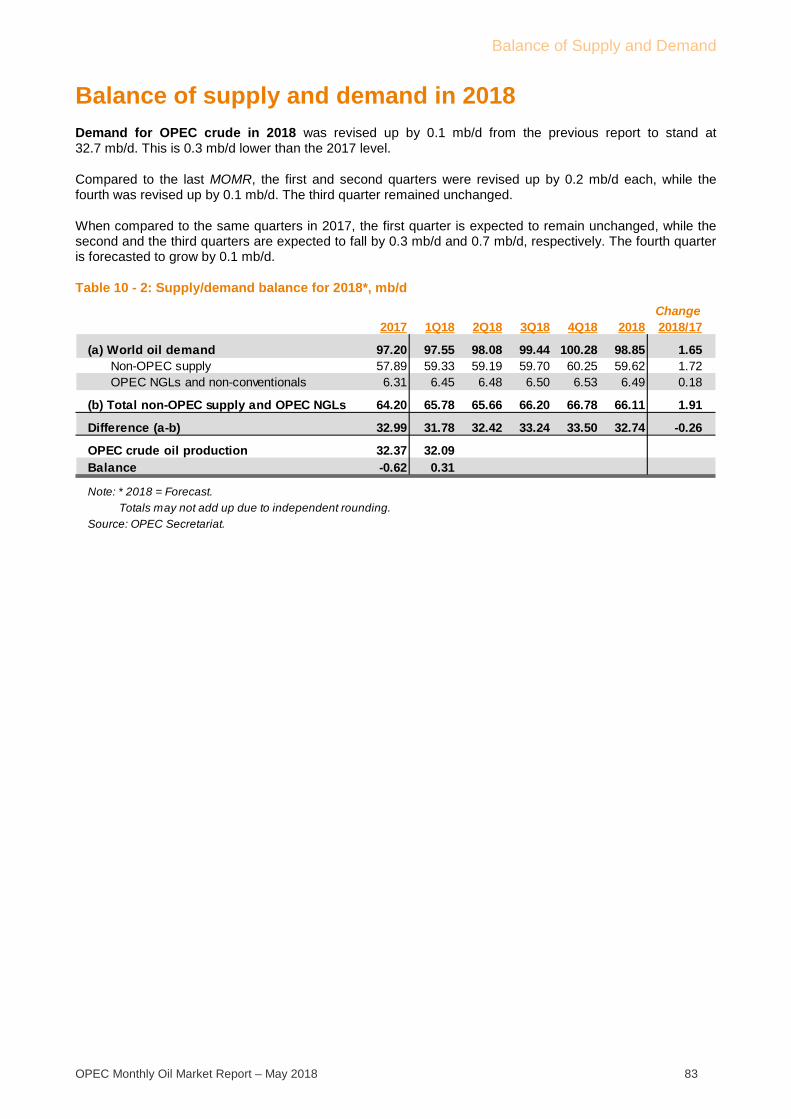
Balance of Supply and Demand
OPEC Monthly Oil Market Report – May 2018 83
Balance of supply and demand in 2018 Demand for OPEC crude in 2018 was revised up by 0.1 mb/d from the previous report to stand at 32.7 mb/d. This is 0.3 mb/d lower than the 2017 level.
Compared to the last MOMR, the first and second quarters were revised up by 0.2 mb/d each, while the fourth was revised up by 0.1 mb/d. The third quarter remained unchanged.
When compared to the same quarters in 2017, the first quarter is expected to remain unchanged, while the second and the third quarters are expected to fall by 0.3 mb/d and 0.7 mb/d, respectively. The fourth quarter is forecasted to grow by 0.1 mb/d.
Table 10 - 2: Supply/demand balance for 2018*, mb/d
Change2017 1Q18 2Q18 3Q18 4Q18 2018 2018/17
(a) World oil demand 97.20 97.55 98.08 99.44 100.28 98.85 1.65 Non-OPEC supply 57.89 59.33 59.19 59.70 60.25 59.62 1.72 OPEC NGLs and non-conventionals 6.31 6.45 6.48 6.50 6.53 6.49 0.18
(b) Total non-OPEC supply and OPEC NGLs 64.20 65.78 65.66 66.20 66.78 66.11 1.91
Difference (a-b) 32.99 31.78 32.42 33.24 33.50 32.74 -0.26
OPEC crude oil production 32.37 32.09 0.00 0.00 0.00 0.00 -32.37Balance -0.62 0.31 -32.42 -33.24 -33.50 -32.74 -32.12
Note: * 2018 = Forecast. Totals may not add up due to independent rounding.Source: OPEC Secretariat.

Appendix
84 OPEC Monthly Oil Market Report – May 2018
Appendix
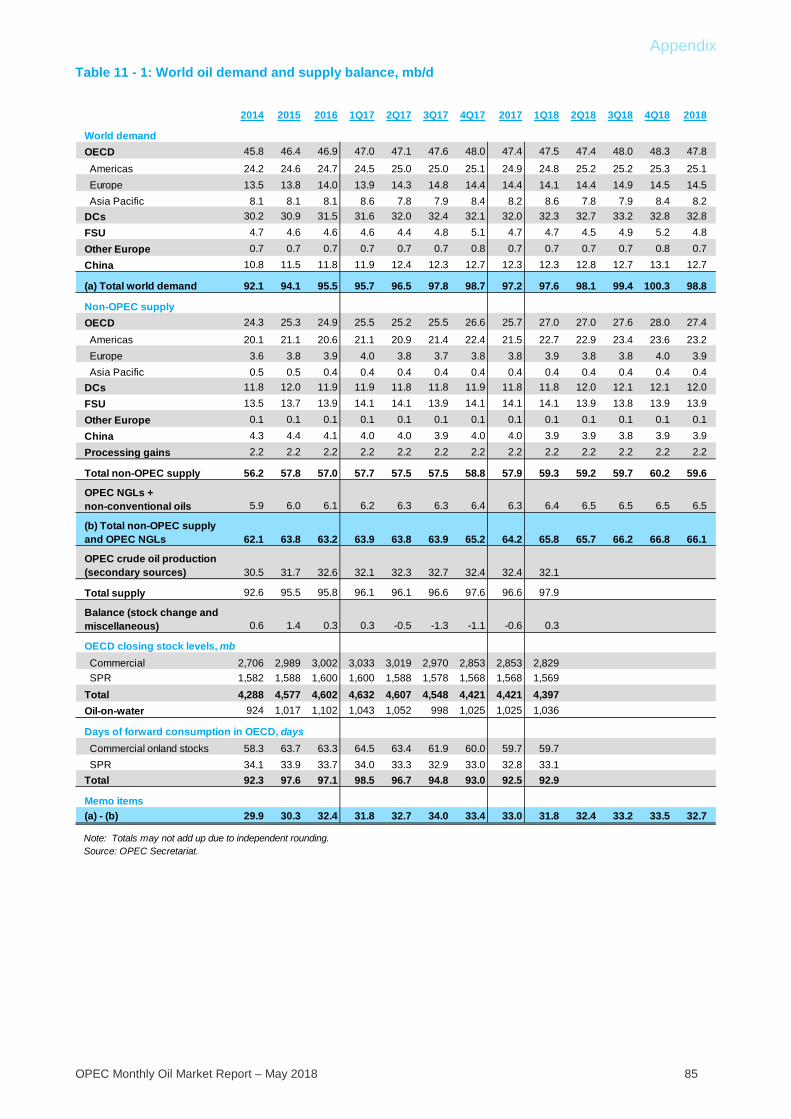
Appendix
OPEC Monthly Oil Market Report – May 2018 85
Table 11 - 1: World oil demand and supply balance, mb/d
2014 2015 2016 1Q17 2Q17 3Q17 4Q17 2017 1Q18 2Q18 3Q18 4Q18 2018
World demandOECD 45.8 46.4 46.9 47.0 47.1 47.6 48.0 47.4 47.5 47.4 48.0 48.3 47.8
Americas 24.2 24.6 24.7 24.5 25.0 25.0 25.1 24.9 24.8 25.2 25.2 25.3 25.1 Europe 13.5 13.8 14.0 13.9 14.3 14.8 14.4 14.4 14.1 14.4 14.9 14.5 14.5 Asia Pacific 8.1 8.1 8.1 8.6 7.8 7.9 8.4 8.2 8.6 7.8 7.9 8.4 8.2DCs 30.2 30.9 31.5 31.6 32.0 32.4 32.1 32.0 32.3 32.7 33.2 32.8 32.8FSU 4.7 4.6 4.6 4.6 4.4 4.8 5.1 4.7 4.7 4.5 4.9 5.2 4.8Other Europe 0.7 0.7 0.7 0.7 0.7 0.7 0.8 0.7 0.7 0.7 0.7 0.8 0.7China 10.8 11.5 11.8 11.9 12.4 12.3 12.7 12.3 12.3 12.8 12.7 13.1 12.7
(a) Total world demand 92.1 94.1 95.5 95.7 96.5 97.8 98.7 97.2 97.6 98.1 99.4 100.3 98.8
Non-OPEC supplyOECD 24.3 25.3 24.9 25.5 25.2 25.5 26.6 25.7 27.0 27.0 27.6 28.0 27.4
Americas 20.1 21.1 20.6 21.1 20.9 21.4 22.4 21.5 22.7 22.9 23.4 23.6 23.2 Europe 3.6 3.8 3.9 4.0 3.8 3.7 3.8 3.8 3.9 3.8 3.8 4.0 3.9 Asia Pacific 0.5 0.5 0.4 0.4 0.4 0.4 0.4 0.4 0.4 0.4 0.4 0.4 0.4DCs 11.8 12.0 11.9 11.9 11.8 11.8 11.9 11.8 11.8 12.0 12.1 12.1 12.0FSU 13.5 13.7 13.9 14.1 14.1 13.9 14.1 14.1 14.1 13.9 13.8 13.9 13.9Other Europe 0.1 0.1 0.1 0.1 0.1 0.1 0.1 0.1 0.1 0.1 0.1 0.1 0.1China 4.3 4.4 4.1 4.0 4.0 3.9 4.0 4.0 3.9 3.9 3.8 3.9 3.9Processing gains 2.2 2.2 2.2 2.2 2.2 2.2 2.2 2.2 2.2 2.2 2.2 2.2 2.2
Total non-OPEC supply 56.2 57.8 57.0 57.7 57.5 57.5 58.8 57.9 59.3 59.2 59.7 60.2 59.6
OPEC NGLs + non-conventional oils 5.9 6.0 6.1 6.2 6.3 6.3 6.4 6.3 6.4 6.5 6.5 6.5 6.5
(b) Total non-OPEC supply and OPEC NGLs 62.1 63.8 63.2 63.9 63.8 63.9 65.2 64.2 65.8 65.7 66.2 66.8 66.1
OPEC crude oil production (secondary sources) 30.5 31.7 32.6 32.1 32.3 32.7 32.4 32.4 32.1
Total supply 92.6 95.5 95.8 96.1 96.1 96.6 97.6 96.6 97.9
Balance (stock change and miscellaneous) 0.6 1.4 0.3 0.3 -0.5 -1.3 -1.1 -0.6 0.3
OECD closing stock levels, mb Commercial 2,706 2,989 3,002 3,033 3,019 2,970 2,853 2,853 2,829 SPR 1,582 1,588 1,600 1,600 1,588 1,578 1,568 1,568 1,569Total 4,288 4,577 4,602 4,632 4,607 4,548 4,421 4,421 4,397Oil-on-water 924 1,017 1,102 1,043 1,052 998 1,025 1,025 1,036
Days of forward consumption in OECD, days Commercial onland stocks 58.3 63.7 63.3 64.5 63.4 61.9 60.0 59.7 59.7 SPR 34.1 33.9 33.7 34.0 33.3 32.9 33.0 32.8 33.1Total 92.3 97.6 97.1 98.5 96.7 94.8 93.0 92.5 92.9
Memo items(a) - (b) 29.9 30.3 32.4 31.8 32.7 34.0 33.4 33.0 31.8 32.4 33.2 33.5 32.7
Note: Totals may not add up due to independent rounding.Source: OPEC Secretariat.
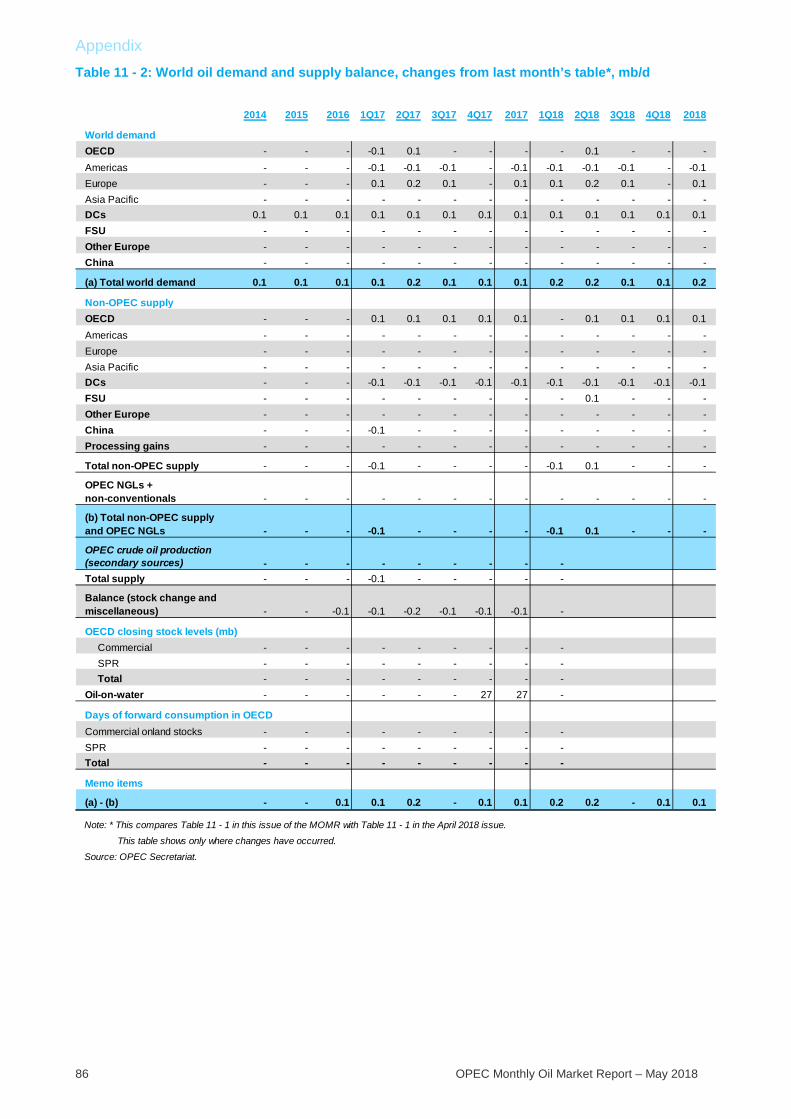
Appendix
86 OPEC Monthly Oil Market Report – May 2018
Table 11 - 2: World oil demand and supply balance, changes from last month’s table*, mb/d
2014 2015 2016 1Q17 2Q17 3Q17 4Q17 2017 1Q18 2Q18 3Q18 4Q18 2018
World demandOECD - - - -0.1 0.1 - - - - 0.1 - - -Americas - - - -0.1 -0.1 -0.1 - -0.1 -0.1 -0.1 -0.1 - -0.1Europe - - - 0.1 0.2 0.1 - 0.1 0.1 0.2 0.1 - 0.1Asia Pacific - - - - - - - - - - - - -DCs 0.1 0.1 0.1 0.1 0.1 0.1 0.1 0.1 0.1 0.1 0.1 0.1 0.1FSU - - - - - - - - - - - - -Other Europe - - - - - - - - - - - - -China - - - - - - - - - - - - -
(a) Total world demand 0.1 0.1 0.1 0.1 0.2 0.1 0.1 0.1 0.2 0.2 0.1 0.1 0.2
Non-OPEC supplyOECD - - - 0.1 0.1 0.1 0.1 0.1 - 0.1 0.1 0.1 0.1Americas - - - - - - - - - - - - -Europe - - - - - - - - - - - - -Asia Pacific - - - - - - - - - - - - -DCs - - - -0.1 -0.1 -0.1 -0.1 -0.1 -0.1 -0.1 -0.1 -0.1 -0.1FSU - - - - - - - - - 0.1 - - -Other Europe - - - - - - - - - - - - -China - - - -0.1 - - - - - - - - -Processing gains - - - - - - - - - - - - -
Total non-OPEC supply - - - -0.1 - - - - -0.1 0.1 - - -
OPEC NGLs + non-conventionals - - - - - - - - - - - - -
(b) Total non-OPEC supply and OPEC NGLs - - - -0.1 - - - - -0.1 0.1 - - -
OPEC crude oil production (secondary sources) - - - - - - - - -Total supply - - - -0.1 - - - - -
Balance (stock change and miscellaneous) - - -0.1 -0.1 -0.2 -0.1 -0.1 -0.1 -
OECD closing stock levels (mb) Commercial - - - - - - - - - SPR - - - - - - - - - Total - - - - - - - - -Oil-on-water - - - - - - 27 27 -
Days of forward consumption in OECDCommercial onland stocks - - - - - - - - -SPR - - - - - - - - -Total - - - - - - - - -
Memo items
(a) - (b) - - 0.1 0.1 0.2 - 0.1 0.1 0.2 0.2 - 0.1 0.1
Note: * This compares Table 11 - 1 in this issue of the MOMR with Table 11 - 1 in the April 2018 issue.
This table shows only where changes have occurred.
Source: OPEC Secretariat.

Appendix
OPEC Monthly Oil Market Report – May 2018 87
Table 11 - 3: OECD oil stocks and oil on water at the end of period
2015 2016 2017 1Q16 2Q16 3Q16 4Q16 1Q17 2Q17 3Q17 4Q17 1Q18
Closing stock levels, mb
OECD onland commercial 2,989 3,002 2,853 3,039 3,076 3,084 3,002 3,033 3,019 2,970 2,853 2,829Americas 1,561 1,598 1,499 1,592 1,611 1,621 1,598 1,608 1,595 1,572 1,499 1,445Europe 993 989 942 1,026 1,026 1,013 989 1,022 999 965 942 988Asia Pacific 435 414 412 421 438 450 414 404 424 433 412 395
OECD SPR 1,588 1,600 1,568 1,595 1,592 1,596 1,600 1,600 1,588 1,578 1,568 1,569Americas 697 697 665 697 697 697 697 694 681 676 665 667Europe 475 481 480 478 474 477 481 484 484 479 480 477Asia Pacific 416 421 423 419 421 421 421 422 423 423 423 424
OECD total 4,577 4,602 4,421 4,633 4,668 4,679 4,602 4,632 4,607 4,548 4,421 4,397
Oil-on-water 1,017 1,102 1,025 1,055 1,094 1,068 1,102 1,043 1,052 998 1,025 1,036
Days of forward consumption in OECD, days
OECD onland commercial 64 64 60 66 65 65 64 65 63 62 60 60Americas 63 65 60 65 64 65 65 64 64 63 60 57Europe 73 72 68 74 71 71 72 72 68 67 68 69Asia Pacific 51 48 48 55 56 54 48 52 54 52 48 51
OECD SPR 34 34 33 35 34 34 34 34 33 33 33 33Americas 28 28 27 28 28 28 28 28 27 27 27 26Europe 35 35 34 34 33 34 35 34 33 33 34 33Asia Pacific 49 49 49 54 54 50 49 55 53 50 49 55
OECD total 98 98 93 101 99 99 98 99 97 95 93 93
Sources: Argus Media, Euroilstock, IEA, JODI, METI, OPEC Secretariat and US Energy Information Administration.
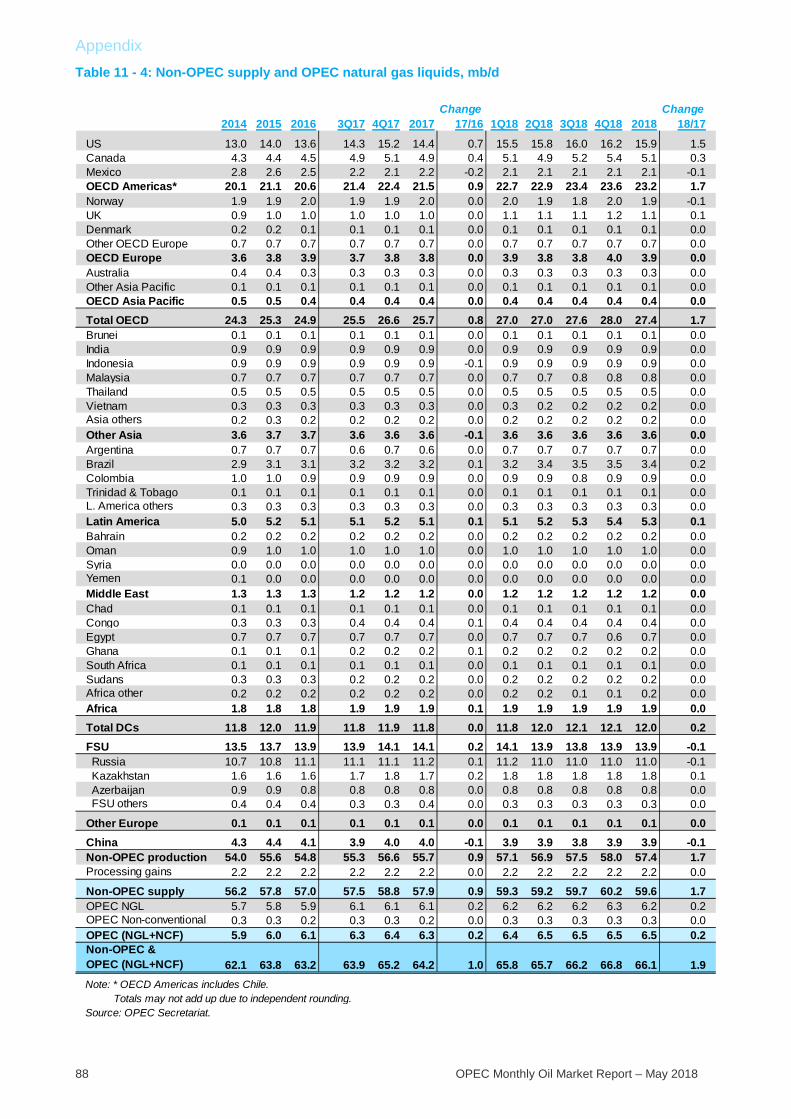
Appendix
88 OPEC Monthly Oil Market Report – May 2018
Table 11 - 4: Non-OPEC supply and OPEC natural gas liquids, mb/d
Change Change2014 2015 2016 3Q17 4Q17 2017 17/16 1Q18 2Q18 3Q18 4Q18 2018 18/17
US 13.0 14.0 13.6 14.3 15.2 14.4 0.7 15.5 15.8 16.0 16.2 15.9 1.5Canada 4.3 4.4 4.5 4.9 5.1 4.9 0.4 5.1 4.9 5.2 5.4 5.1 0.3Mexico 2.8 2.6 2.5 2.2 2.1 2.2 -0.2 2.1 2.1 2.1 2.1 2.1 -0.1OECD Americas* 20.1 21.1 20.6 21.4 22.4 21.5 0.9 22.7 22.9 23.4 23.6 23.2 1.7Norway 1.9 1.9 2.0 1.9 1.9 2.0 0.0 2.0 1.9 1.8 2.0 1.9 -0.1UK 0.9 1.0 1.0 1.0 1.0 1.0 0.0 1.1 1.1 1.1 1.2 1.1 0.1Denmark 0.2 0.2 0.1 0.1 0.1 0.1 0.0 0.1 0.1 0.1 0.1 0.1 0.0Other OECD Europe 0.7 0.7 0.7 0.7 0.7 0.7 0.0 0.7 0.7 0.7 0.7 0.7 0.0OECD Europe 3.6 3.8 3.9 3.7 3.8 3.8 0.0 3.9 3.8 3.8 4.0 3.9 0.0Australia 0.4 0.4 0.3 0.3 0.3 0.3 0.0 0.3 0.3 0.3 0.3 0.3 0.0Other Asia Pacific 0.1 0.1 0.1 0.1 0.1 0.1 0.0 0.1 0.1 0.1 0.1 0.1 0.0OECD Asia Pacific 0.5 0.5 0.4 0.4 0.4 0.4 0.0 0.4 0.4 0.4 0.4 0.4 0.0Total OECD 24.3 25.3 24.9 25.5 26.6 25.7 0.8 27.0 27.0 27.6 28.0 27.4 1.7Brunei 0.1 0.1 0.1 0.1 0.1 0.1 0.0 0.1 0.1 0.1 0.1 0.1 0.0India 0.9 0.9 0.9 0.9 0.9 0.9 0.0 0.9 0.9 0.9 0.9 0.9 0.0Indonesia 0.9 0.9 0.9 0.9 0.9 0.9 -0.1 0.9 0.9 0.9 0.9 0.9 0.0Malaysia 0.7 0.7 0.7 0.7 0.7 0.7 0.0 0.7 0.7 0.8 0.8 0.8 0.0Thailand 0.5 0.5 0.5 0.5 0.5 0.5 0.0 0.5 0.5 0.5 0.5 0.5 0.0Vietnam 0.3 0.3 0.3 0.3 0.3 0.3 0.0 0.3 0.2 0.2 0.2 0.2 0.0Asia others 0.2 0.3 0.2 0.2 0.2 0.2 0.0 0.2 0.2 0.2 0.2 0.2 0.0Other Asia 3.6 3.7 3.7 3.6 3.6 3.6 -0.1 3.6 3.6 3.6 3.6 3.6 0.0Argentina 0.7 0.7 0.7 0.6 0.7 0.6 0.0 0.7 0.7 0.7 0.7 0.7 0.0Brazil 2.9 3.1 3.1 3.2 3.2 3.2 0.1 3.2 3.4 3.5 3.5 3.4 0.2Colombia 1.0 1.0 0.9 0.9 0.9 0.9 0.0 0.9 0.9 0.8 0.9 0.9 0.0Trinidad & Tobago 0.1 0.1 0.1 0.1 0.1 0.1 0.0 0.1 0.1 0.1 0.1 0.1 0.0L. America others 0.3 0.3 0.3 0.3 0.3 0.3 0.0 0.3 0.3 0.3 0.3 0.3 0.0Latin America 5.0 5.2 5.1 5.1 5.2 5.1 0.1 5.1 5.2 5.3 5.4 5.3 0.1Bahrain 0.2 0.2 0.2 0.2 0.2 0.2 0.0 0.2 0.2 0.2 0.2 0.2 0.0Oman 0.9 1.0 1.0 1.0 1.0 1.0 0.0 1.0 1.0 1.0 1.0 1.0 0.0Syria 0.0 0.0 0.0 0.0 0.0 0.0 0.0 0.0 0.0 0.0 0.0 0.0 0.0Yemen 0.1 0.0 0.0 0.0 0.0 0.0 0.0 0.0 0.0 0.0 0.0 0.0 0.0Middle East 1.3 1.3 1.3 1.2 1.2 1.2 0.0 1.2 1.2 1.2 1.2 1.2 0.0Chad 0.1 0.1 0.1 0.1 0.1 0.1 0.0 0.1 0.1 0.1 0.1 0.1 0.0Congo 0.3 0.3 0.3 0.4 0.4 0.4 0.1 0.4 0.4 0.4 0.4 0.4 0.0Egypt 0.7 0.7 0.7 0.7 0.7 0.7 0.0 0.7 0.7 0.7 0.6 0.7 0.0Ghana 0.1 0.1 0.1 0.2 0.2 0.2 0.1 0.2 0.2 0.2 0.2 0.2 0.0South Africa 0.1 0.1 0.1 0.1 0.1 0.1 0.0 0.1 0.1 0.1 0.1 0.1 0.0Sudans 0.3 0.3 0.3 0.2 0.2 0.2 0.0 0.2 0.2 0.2 0.2 0.2 0.0Africa other 0.2 0.2 0.2 0.2 0.2 0.2 0.0 0.2 0.2 0.1 0.1 0.2 0.0Africa 1.8 1.8 1.8 1.9 1.9 1.9 0.1 1.9 1.9 1.9 1.9 1.9 0.0Total DCs 11.8 12.0 11.9 11.8 11.9 11.8 0.0 11.8 12.0 12.1 12.1 12.0 0.2FSU 13.5 13.7 13.9 13.9 14.1 14.1 0.2 14.1 13.9 13.8 13.9 13.9 -0.1 Russia 10.7 10.8 11.1 11.1 11.1 11.2 0.1 11.2 11.0 11.0 11.0 11.0 -0.1 Kazakhstan 1.6 1.6 1.6 1.7 1.8 1.7 0.2 1.8 1.8 1.8 1.8 1.8 0.1 Azerbaijan 0.9 0.9 0.8 0.8 0.8 0.8 0.0 0.8 0.8 0.8 0.8 0.8 0.0 FSU others 0.4 0.4 0.4 0.3 0.3 0.4 0.0 0.3 0.3 0.3 0.3 0.3 0.0
Other Europe 0.1 0.1 0.1 0.1 0.1 0.1 0.0 0.1 0.1 0.1 0.1 0.1 0.0China 4.3 4.4 4.1 3.9 4.0 4.0 -0.1 3.9 3.9 3.8 3.9 3.9 -0.1Non-OPEC production 54.0 55.6 54.8 55.3 56.6 55.7 0.9 57.1 56.9 57.5 58.0 57.4 1.7Processing gains 2.2 2.2 2.2 2.2 2.2 2.2 0.0 2.2 2.2 2.2 2.2 2.2 0.0
Non-OPEC supply 56.2 57.8 57.0 57.5 58.8 57.9 0.9 59.3 59.2 59.7 60.2 59.6 1.7OPEC NGL 5.7 5.8 5.9 6.1 6.1 6.1 0.2 6.2 6.2 6.2 6.3 6.2 0.2OPEC Non-conventional 0.3 0.3 0.2 0.3 0.3 0.2 0.0 0.3 0.3 0.3 0.3 0.3 0.0OPEC (NGL+NCF) 5.9 6.0 6.1 6.3 6.4 6.3 0.2 6.4 6.5 6.5 6.5 6.5 0.2Non-OPEC & OPEC (NGL+NCF) 62.1 63.8 63.2 63.9 65.2 64.2 1.0 65.8 65.7 66.2 66.8 66.1 1.9
Source: OPEC Secretariat. Totals may not add up due to independent rounding.Note: * OECD Americas includes Chile.
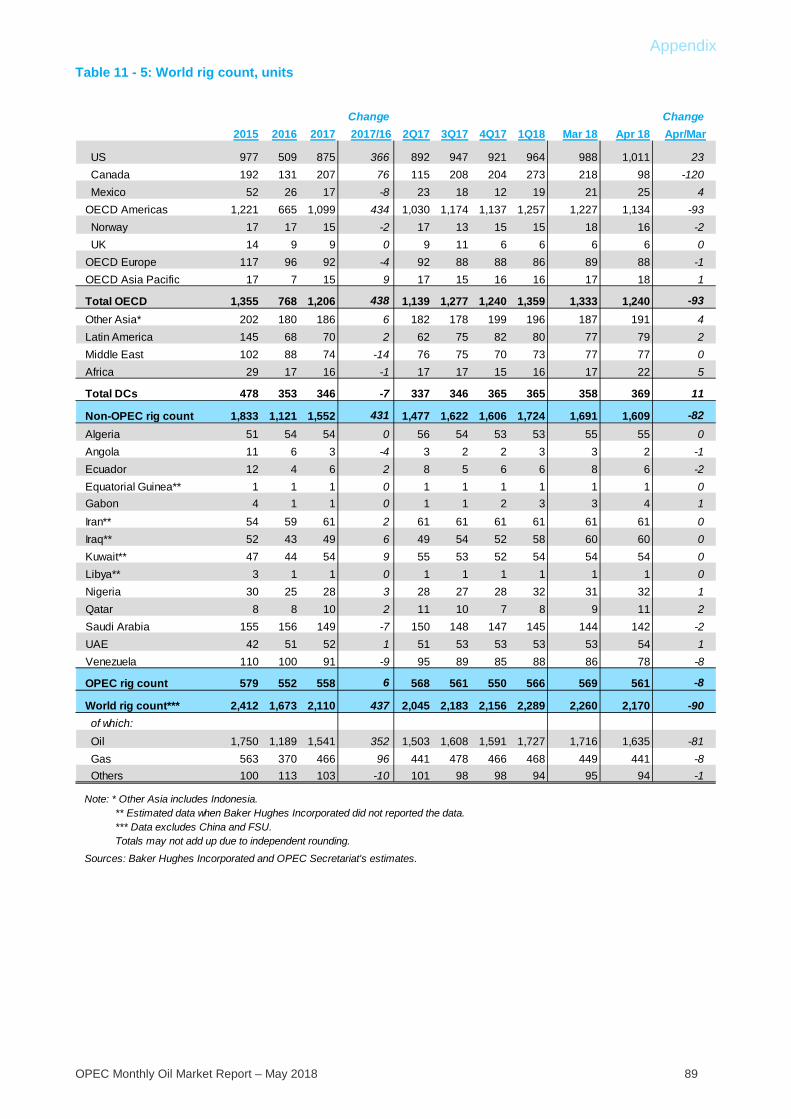
Appendix
OPEC Monthly Oil Market Report – May 2018 89
Table 11 - 5: World rig count, units
Change Change2015 2016 2017 2017/16 2Q17 3Q17 4Q17 1Q18 Mar 18 Apr 18 Apr/Mar
US 977 509 875 366 892 947 921 964 988 1,011 23 Canada 192 131 207 76 115 208 204 273 218 98 -120 Mexico 52 26 17 -8 23 18 12 19 21 25 4OECD Americas 1,221 665 1,099 434 1,030 1,174 1,137 1,257 1,227 1,134 -93 Norway 17 17 15 -2 17 13 15 15 18 16 -2 UK 14 9 9 0 9 11 6 6 6 6 0OECD Europe 117 96 92 -4 92 88 88 86 89 88 -1OECD Asia Pacific 17 7 15 9 17 15 16 16 17 18 1
Total OECD 1,355 768 1,206 438 1,139 1,277 1,240 1,359 1,333 1,240 -93Other Asia* 202 180 186 6 182 178 199 196 187 191 4Latin America 145 68 70 2 62 75 82 80 77 79 2Middle East 102 88 74 -14 76 75 70 73 77 77 0Africa 29 17 16 -1 17 17 15 16 17 22 5
Total DCs 478 353 346 -7 337 346 365 365 358 369 11
Non-OPEC rig count 1,833 1,121 1,552 431 1,477 1,622 1,606 1,724 1,691 1,609 -82Algeria 51 54 54 0 56 54 53 53 55 55 0Angola 11 6 3 -4 3 2 2 3 3 2 -1Ecuador 12 4 6 2 8 5 6 6 8 6 -2Equatorial Guinea** 1 1 1 0 1 1 1 1 1 1 0Gabon 4 1 1 0 1 1 2 3 3 4 1Iran** 54 59 61 2 61 61 61 61 61 61 0Iraq** 52 43 49 6 49 54 52 58 60 60 0Kuwait** 47 44 54 9 55 53 52 54 54 54 0Libya** 3 1 1 0 1 1 1 1 1 1 0Nigeria 30 25 28 3 28 27 28 32 31 32 1Qatar 8 8 10 2 11 10 7 8 9 11 2Saudi Arabia 155 156 149 -7 150 148 147 145 144 142 -2UAE 42 51 52 1 51 53 53 53 53 54 1Venezuela 110 100 91 -9 95 89 85 88 86 78 -8
OPEC rig count 579 552 558 6 568 561 550 566 569 561 -8
World rig count*** 2,412 1,673 2,110 437 2,045 2,183 2,156 2,289 2,260 2,170 -90 of which: Oil 1,750 1,189 1,541 352 1,503 1,608 1,591 1,727 1,716 1,635 -81 Gas 563 370 466 96 441 478 466 468 449 441 -8 Others 100 113 103 -10 101 98 98 94 95 94 -1
Note: * Other Asia includes Indonesia. ** Estimated data when Baker Hughes Incorporated did not reported the data. *** Data excludes China and FSU. Totals may not add up due to independent rounding.
Sources: Baker Hughes Incorporated and OPEC Secretariat's estimates.
Glossary of Terms
90 OPEC Monthly Oil Market Report – May 2018
Glossary of Terms
Abbreviations b barrels b/d barrels per day bp basis points bb billion barrels bcf billion cubic feet cu m cubic metres mb million barrels mb/d million barrels per day mmbtu million British thermal units mn million m-o-m month-on-month mt metric tonnes q-o-q quarter-on-quarter pp percentage points tb/d thousand barrels per day tcf trillion cubic feet y-o-y year-on-year y-t-d year-to-date
Glossary of Terms
OPEC Monthly Oil Market Report – May 2018 91
Acronyms ARA Amsterdam-Rotterdam-Antwerp BoE Bank of England BoJ Bank of Japan BOP Balance of payments BRIC Brazil, Russia, India and China CAPEX capital expenditures CCI Consumer Confidence Index CFTC Commodity Futures Trading Commission CIF cost, insurance and freight CPI consumer price index DCs developing countries DUC drilled, but uncompleted (oil well) ECB European Central Bank EIA US Energy Information Administration Emirates NBD Emirates National Bank of Dubai EMs emerging markets EV electric vehicle FAI fixed asset investment FCC fluid catalytic cracking FDI foreign direct investment Fed US Federal Reserve FID final investment decision FOB free on board FPSO floating production storage and offloading FSU Former Soviet Union FX Foreign Exchange FY fiscal year GDP gross domestic product GFCF gross fixed capital formation GoM Gulf of Mexico GTLs gas-to-liquids HH Henry Hub HSFO high-sulphur fuel oil ICE Intercontinental Exchange IEA International Energy Agency IMF International Monetary Fund IOCs international oil companies IP industrial production ISM Institute of Supply Management LIBOR London inter-bank offered rate LLS Light Louisiana Sweet LNG liquefied natural gas LPG liquefied petroleum gas LR long-range (vessel) LSFO low-sulphur fuel oil MCs (OPEC) Member Countries MED Mediterranean MENA Middle East/North Africa MOMR (OPEC) Monthly Oil Market Report
Glossary of Terms
92 OPEC Monthly Oil Market Report – May 2018
MPV multi-purpose vehicle MR medium-range or mid-range (vessel) NBS National Bureau of Statistics NGLs natural gas liquids NPC National People’s Congress (China) NWE Northwest Europe NYMEX New York Mercantile Exchange OECD Organisation for Economic Co-operation and Development OPEX operational expenditures OIV total open interest volume ORB OPEC Reference Basket OSP Official Selling Price PADD Petroleum Administration for Defense Districts PBoC People’s Bank of China PMI purchasing managers’ index PPI producer price index RBI Reserve Bank of India REER real effective exchange rate ROI return on investment SAAR seasonally-adjusted annualized rate SIAM Society of Indian Automobile Manufacturers SRFO straight-run fuel oil SUV sports utility vehicle ULCC ultra-large crude carrier ULSD ultra-low sulphur diesel USEC US East Coast USGC US Gulf Coast USWC US West Coast VGO vacuum gasoil VLCC very large crude carriers WPI wholesale price index WS Worldscale WTI West Texas Intermediate WTS West Texas Sour
OPEC Monthly Oil Market Report – May 2018 93
Contributors to the OPEC Monthly Oil Market Report Editor-in-Chief Dr. Ayed S. Al-Qahtani, Director, Research Division email: aalqahtani(at)opec.org
Editor Behrooz Baikalizadeh, Head, Petroleum Studies Department email: bbaikalizadeh(at)opec.org
Analysts Crude Oil Price Movements Eissa Alzerma email: ealzerma(at)opec.org
Commodity Markets Hector Hurtado email: hhurtado(at)opec.org
World Economy Afshin Javan email: ajavan(at)opec.org Imad Al-Khayyat email: ial-khayyat(at)opec.org Joerg Spitzy
email: jspitzy(at)opec.org
World Oil Demand Hassan Balfakeih email: hbalfakeih(at)opec.org
World Oil Supply Mohammad Ali Danesh email: mdanesh(at)opec.org
Product Markets and Refinery Operations Tona Ndamba email: tndamba(at)opec.org
Tanker Market and Oil Trade Anisah Almadhayyan email: aalmadhayyan(at)opec.org
Stock Movements Aziz Yahyai email: ayahyai(at)opec.org
Technical team Nadir Guerer email: nguerer(at)opec.org Aziz Yahyai email: ayahyai(at)opec.org Viveca Hameder email: vhameder(at)opec.org
Statistical services Adedapo Odulaja, Head, Data Services Department (aodulaja(at)opec.org), Hossein Hassani, Statistical Systems Coordinator (hhassani(at)opec.org), Pantelis Christodoulides (World Oil Demand), Klaus Stoeger (World Oil Supply), Mouhamad Moudassir (World Economy), Mohammad Sattar (Crude Oil Price Movements, Tanker Market, Oil Trade), Ryszard Pospiech (Commodity Markets, Tanker Market, Stock Movements), Mihni Mihnev (Product Markets and Refinery Operations)
Editing, production, design and circulation James Griffin, Maureen MacNeil, Scott Laury, Matthew Quinn, Hataichanok Leimlehner, Liane-Sophie Hamamciyan, Andrea Birnbach
94 OPEC Monthly Oil Market Report – May 2018
Disclaimer
The data, analysis and any other information contained in the Monthly Oil Market Report (the “MOMR”) is for informational purposes only and is not intended as a substitute for advice from your business, finance, investment consultant or other professional. The views expressed in the MOMR are those of the OPEC Secretariat and do not necessarily reflect the views of its Governing Bodies and/or individual OPEC Member Countries.
Whilst reasonable efforts have been made to ensure the accuracy of the MOMR’s content, the OPEC Secretariat makes no warranties or representations as to its accuracy, currency reference or comprehensiveness, and assumes no liability or responsibility for any inaccuracy, error or omission, or for any loss or damage arising in connection with or attributable to any action or decision taken as a result of using or relying on the information in the MOMR.
The MOMR may contain references to material(s) from third parties whose copyright must be acknowledged by obtaining necessary authorization from the copyright owner(s). The OPEC Secretariat shall not be liable or responsible for any unauthorized use of third party material(s). All rights of the Publication shall be reserved to the OPEC Secretariat, including every exclusive economic right, in full or per excerpts, with special reference but without limitation, to the right to publish it by press and/or by any communications medium whatsoever, including Internet; translate, include in a data base, make changes, transform and process for any kind of use, including radio, television or cinema adaptations, as well as sound-video recording, audio-visual screenplays and electronic processing of any kind and nature whatsoever.
Full reproduction, copying or transmission of the MOMR is not permitted in any form or by any means by third parties without the OPEC Secretariat’s written permission, however the information contained therein may be used and/or reproduced for educational and other non-commercial purposes without the OPEC Secretariat’s prior written permission, provided that OPEC is fully acknowledged as the copyright holder.

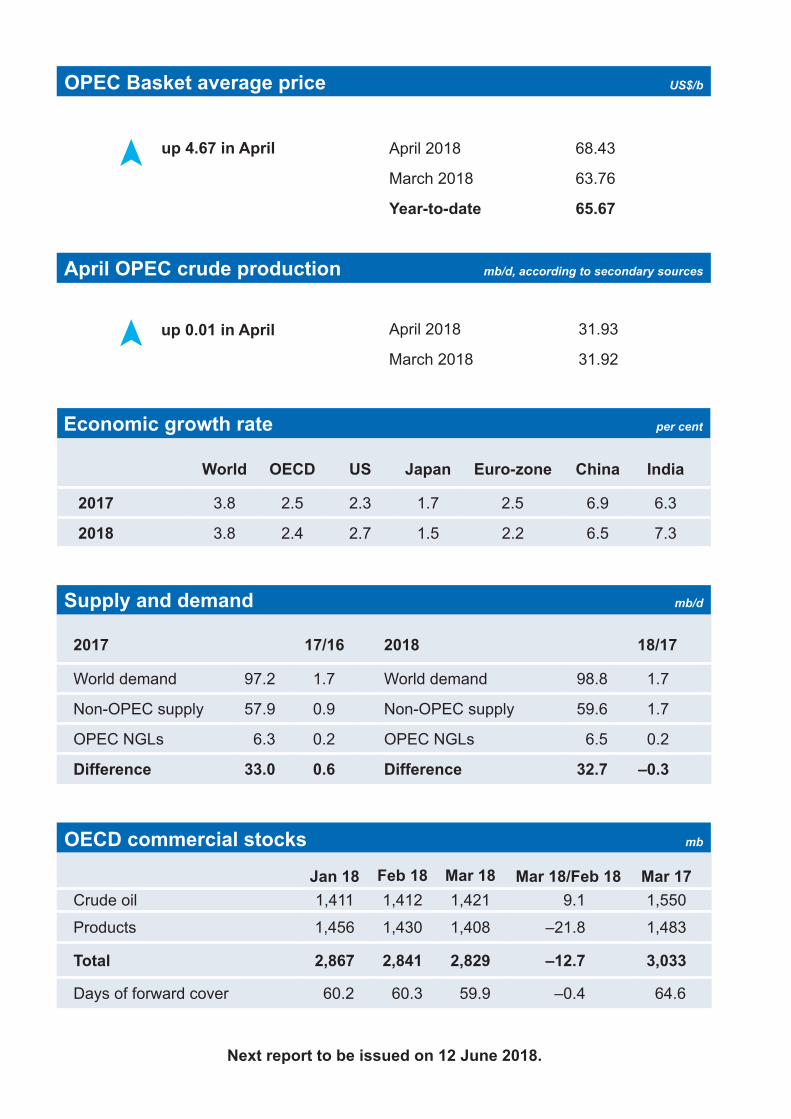
Next report to be issued on 12 June 2018.
OPEC Basket average price US$/b
April OPEC crude production mb/d, according to secondary sources
Economic growth rate per cent
up 4.67 in April
up 0.01 in April
April 2018 68.43
March 2018 63.76
Year-to-date 65.67
April 2018 31.93
March 2018 31.92
World OECD US Japan Euro-zone China India
2017 3.8 2.5 2.3 1.7 2.5 6.9 6.3
2018 3.8 2.4 2.7 1.5 2.2 6.5 7.3
Supply and demand mb/d
OECD commercial stocks mb
2017 17/16 2018 18/17
World demand 97.2 1.7 World demand 98.8 1.7
Non-OPEC supply 57.9 0.9 Non-OPEC supply 59.6 1.7
OPEC NGLs 6.3 0.2 OPEC NGLs 6.5 0.2
Difference 33.0 0.6 Difference 32.7 –0.3
Jan 18 Feb 18 Mar 18 Mar 18/Feb 18 Mar 17Crude oil 1,411 1,412 1,421 9.1 1,550
Products 1,456 1,430 1,408 –21.8 1,483
Total 2,867 2,841 2,829 –12.7 3,033
Days of forward cover 60.2 60.3 59.9 –0.4 64.6