OPEC Oil Market Outlook - International Energy Forum (IEF) · OPEC Oil Market Outlook Prepared by...
26
8 th IEA-IEF-OPEC Symposium on Energy Outlooks IEF Secretariat, Riyadh 14th February 2018 OPEC Oil Market Outlook Prepared by OPEC Secretariat
Transcript of OPEC Oil Market Outlook - International Energy Forum (IEF) · OPEC Oil Market Outlook Prepared by...
8th IEA-IEF-OPECSymposiumonEnergyOutlooksIEFSecretariat,Riyadh14thFebruary2018
OPECOilMarketOutlook
Prepared by OPEC Secretariat

2©2018OrganizationofthePetroleumExportingCountries
Disclaimer
2
“The data, analysis and any other information ('Content') contained in this presentation is for informational purposes and isintended solely for the use of the person(s) to whom it is addressed and may be legally privileged and/or confidential. Anyunauthorized use, disclosure or copying of this Presentation or any parts of it or its attachment(s) by any unintended recipientis strictly prohibited. If you have received this Presentation in error, please immediately return or destroy it. The Content ofthis Presentation is not intended as a substitute for advice from your business, finance, investment consultant or otherprofessional. Whilst reasonable efforts have been made to ensure the accuracy of the Content of this Presentation, the OPECSecretariat makes no warranties or representations as to its accuracy, currency or comprehensiveness and assumes noliability or responsibility for any error or omission and/or for any loss arising in connection with or attributable to any actionor decision taken as a result of using or relying on the Content of this Presentation. Nothing in this Presentation shall beconstrued as interpreting or modifying any legal obligations under any agreement, treaty, law or other texts; or expressingany legal opinions or having probative legal value in any proceedings. This Presentation may contain references tomaterial(s) from third parties whose copyright must be acknowledged by obtaining necessary authorization from thecopyright owner(s). The OPEC Secretariat will not be liable or responsible for any unauthorized use of third party material(s).The views expressed in this Presentation are those of the OPEC Secretariat and do not necessarily reflect the views ofindividual OPEC Member Countries. The material contained in this Presentation may not be used and/or reproduced for anypurposes without prior written permission from the OPEC Secretariat”.

© 2018 Organization of the Petroleum Exporting Countries
Outline
3
● Short-term Market Outlook– Review of the oil market 2014-2016– Declaration of Cooperation– Projection for the oil market in 2018– Supply/demand balance in 2018– Concluding remarks
● Medium to Long-term Market Outlook– Key assumptions– Energy outlook– Oil outlook– Key takeaways

© 2018 Organization of the Petroleum Exporting Countries
World oil supply growth outpaced oil demand growth during 2014-2016, y-o-y change, mb/d
From2014to2016,worldsupplygrewby5.5mb/d,whilewordoildemandincreasedby4.1mb/d.
0.92
-0.16
0.18
2.29
1.90
1.20
0.11
1.53
1.30
0.97
0.11
-0.71
-2 -1 0 1 2 3 4 5
World demand
OPEC crude
OPEC NGLs
Non-OPEC production 3.1 mb/d
2014 2015 2016
2.0mb/d
0.4 mb/d
4.1 mb/d
5.5mb/d
Source:OPECSecretariat. 4

© 2018 Organization of the Petroleum Exporting Countries
Rise in OECD commercial inventories, mb
2,562
2,706
2,989 2,985
2,888
2,500
2,600
2,700
2,800
2,900
3,000
3,100
2013 2014 2015 2016 2017
427mb
OECDcommercialinventoriesattheendoftheyear
8 mb
386 mb
109 mb
0
100
200
300
400
500
Oct
14
Dec
14Fe
b 15
Apr 1
5Ju
n 15
Aug
15O
ct 1
5De
c 15
Feb
16Ap
r 16
Jun
16Au
g 16
Oct
16
Dec
16Fe
b 17
Apr 1
7Ju
n 17
Aug
17O
ct 1
7De
c 17
Difference to 5-year average
Source:OPECSecretariat.
5

© 2018 Organization of the Petroleum Exporting Countries
OPEC landmark decisions in 2016
Algiers Accord
• 170th(Extraordinary)MeetingoftheConference–28September2016;Algiers
Vienna Decision• 171stMeetingoftheConference–30November2016;Vienna
• Adjustmentof1.2mb/dfromOPEC-11countries
Joint Declaration of Cooperation
• OPECandnon-OPECMinisterialMeeting–10December2016;Vienna
• Adjustmentof0.6mb/dfrom11non-OPECparticipatingcountries
6

© 2018 Organization of the Petroleum Exporting Countries
Drop in OECD commercial oil stock since Declaration of Cooperation by component and region
7Sources:Euroilstock,IEA,METI,OPECSecretariatandUSEIA.
221100
119
8
339
109
0100200300
Jan 17 Dec 17
Crude Products Total
By component-231mb
23574
17
16
87
19
339
109
0100200300
Jan 17 Dec 17
Americas Asia Pacific Europe OECD Total
By region-231 mb
129%
0%
20%
40%
60%
80%
100%
120%
140%
Jan
Feb
Mar
Apr
May Jun
Jul
Aug
Sep
Oct
Nov
Dec
Percentage conformity
Yearly average 107%

© 2018 Organization of the Petroleum Exporting Countries Sources:CFTC,CMEGroup,IntercontinentalExchangeandOPECSecretariat.
Crude oil prices improvedDriven by a sizeable stocks draw as well as signs of bullish market sentiment
8
40
50
60
70
80
1FM 6FM 11FM 16FM
US$/b ICEBrentforwardcurve
Current
Ayearago
6monthsago
45.84
67.62
253545556575
Jan-16
Mar-16
May-16
Jul-1
6
Sep-16
Nov-16
Jan-17
Mar-17
May-17
Jul-1
7
Sep-17
Nov-17
Jan-18
US$/b ICEBrent
921 1,074
-600-300
0300600900
1,2001,500
Jan-16
Mar-16
May-16
Jul-1
6
Sep-16
Nov-16
Jan-17
Mar-17
May-17
Jul-1
7
Sep-17
Nov-17
Jan-18
‘000contracts Combinednetlongpositions(ICEBrent&NYMEXWTI)
Long
Short
Net
1.84
14.16
0
5
10
15
Jan-16
Mar-16
May-16
Jul-1
6
Sep-16
Nov-16
Jan-17
Mar-17
May-17
Jul-1
7
Sep-17
Nov-17
Jan-18
Ratio Ratiototallong/short

© 2018 Organization of the Petroleum Exporting Countries
PerformanceoftheworldeconomyGDPchangefromthepreviousyear,%
9
Note:*2018=Forecast.Sources:OPECSecretariat,IMF,Markit andHaver Analytics.
2.9
6.57.2
1.81.9
4.9
1.62.2
2.72.4
3.8
2.5
6.96.5
1.91.0
4.8
1.82.5
2.32.5
3.8
-5.0 -2.0 1.0 4.0 7.0 10.0
OPEC
ChinaIndia
RussiaBrazil
Non-OECD
JapanEuro-zone
USOECD
World
2017 2018*
GDPgrowthinselectedcountries

© 2018 Organization of the Petroleum Exporting Countries
Oil demand growth remains healthy in 2017-2018,while non-OPEC supply recovers during the same period
1.60 1.59
-0.5
0.0
0.5
1.0
1.5
2.0
2.5
2014 2015 2016 2017 2018*
Non-OECD OECD World
WorldoildemandgrowthY-o-ychange,mb/d
Note:*2018=Forecast.
Source:OPECSecretariat. 10
0.86
1.40
-1.0
-0.5
0.0
0.5
1.0
1.5
2.0
2.5
2013 2014 2015 2016 2017 2018*
US Canada Othernon-OPEC Total
Non-OPECsupplygrowthY-o-ychange,mb/d

© 2018 Organization of the Petroleum Exporting Countries
Medium- and Long-term outlook
11
●–––––
● Medium- and Long-term Market Outlook– Key assumptions– Energy outlook– Oil outlook– Key takeaways

©2018OrganizationofthePetroleumExportingCountries
Theworldisexperiencinganeraofdemographicchange
● Global population to increase by 1.8 billion, reaching almost 9.2 billion in 2040
● India to become the most populated country in the early 2020s and population in China peaks in 2028
● Population growth in OECDsupported by migration
● Population growth will decelerate
Population by region (millions)
12
0.0
0.4
0.8
1.2
1.6
2.0
0
2,000
4,000
6,000
8,000
10,000
2015 2020 2025 2030 2035 2040
%millionNon-OECD OECDOECDannualgrowth Non-OECDannualgrowth

©2018OrganizationofthePetroleumExportingCountries
Economicgrowthinthelong-term
● Long-term global GDP growth estimated at an average rate of 3.5% p.a.
● Long-term economic growth will be driven by Developing Countries, with growth in the OECD constrained by weaker demographics
● The size of the global economy in 2040 is estimated to be 126% that of 2016
● The Reference Case assumes an evolutionary development of technology and energy policy in the long-term
Long-term real GDP growth rates (%, 2011 PPP)
13

©2018OrganizationofthePetroleumExportingCountries
Globalprimaryenergydemandwillincreaseby35%
14
World primary energy demand by fuel type
+35%
● Energy demand increases by 96 mboed and oil remains dominant
● Gas contributes most to future demand growth and coal peaks
● Renewables record the fastestgrowth rate (6.8%)

©2018OrganizationofthePetroleumExportingCountries
Energydemandwillbedrivenbynon-OECDcountries
15
● Energy demand increases by 96 mboed and oil remains dominant
● Gas contributes most to future demand growth and coal peaks
● Renewables record the fastest growth rate (6.8%)
● Growth is concentrated in non-OECD countries
● India & China are the two largest contributors to demand growth
Growth in primary energy demand by region & Fuel, 2015–2040

©2018OrganizationofthePetroleumExportingCountries
Oildemandinthelong-term
● In long term, global oil demandwill increase by 15.8 mb/d, reaching 111.1 mb/d by 2040
● The transportation sector will remain the main consumer of oil
● Strong growth is also foreseen in the petrochemicals sector
● Demand growth decelerates over the long-term
World oil demand by sector
16

©2018OrganizationofthePetroleumExportingCountries
Total liquids supply, 2016-2040
17
● Non-OPEC liquids supply peaks at close to 64 mb/d in 2025-2030
● In the long-term, non-OPEC liquids modestly decline to 60.4 mb/d by 2040
● US tight oil is the most important contributor to non-OPEC supply, but peaks after 2025
● Demand for OPEC crude risessteadily after 2025 to reach 41.4 mb/d by 2040
Liquidssupplyinthelong-term

©2018OrganizationofthePetroleumExportingCountries
ThemajorityofnewrefiningcapacityexpansionlocatedinDevelopingcountries
● Total capacity additions until 2040 estimated at 19.6 mb/d
● The majority of new refining capacity expansion located in Developing countries, driven by rising oil demand
● Expansion led by Asia-Pacific and the Middle East accounting for almost 70% of the total
Crude distillation capacity additions,2017–2040
18

©2018OrganizationofthePetroleumExportingCountries
Keytakeaways
● During 2014 – 2016 global oil supply outpaced world oil demand growth, leading to excess supply in the market and a strong deterioration in oil prices.
● The Declaration of Cooperation was a necessary response to the growing market imbalance. ● Assuming OPEC and non-OPEC continue at full conformity in the coming months, the
market rebalancing is expected by the end of the year.● In the long-term, energy demand increases by 35% between 2015 and 2040● Global oil demand will increase by 15.8 mb/d, reaching 111.1 mb/d by 2040● US tight oil is the most important contributor to non-OPEC supply, but peaks after 2025,
raising the need for more OPEC crude● Refining capacity expansion takes place predominantly in developing countries, led by Asia-
Pacific and the Middle East
19
www.opec.org
Thankyou
8th IEA-IEF-OPECSymposiumonEnergyOutlooksIEFSecretariat,Riyadh14thFebruary2018
AcomprehensiveinteractiveversionoftheWOOisavailableatwww.opec.org
20

© 2018 Organization of the Petroleum Exporting Countries
Market balance expected by the end of 2018
Note:*1Q18-4Q18=Forecast.
Source:OPECSecretariat.
2,500
2,600
2,700
2,800
2,900
3,000
3,100
3,200
1Q14
2Q14
3Q14
4Q14
1Q15
2Q15
3Q15
4Q15
1Q16
2Q16
3Q16
4Q16
1Q17
2Q17
3Q17
4Q17
1Q18*
2Q18*
3Q18*
4Q18*
mb
5-yearaverage
ExceptedOECDstocklevels353
40
-31
-200
-100
0
100
200
300
400
1Q14
2Q14
3Q14
4Q14
1Q15
2Q15
3Q15
4Q15
1Q16
2Q16
3Q16
4Q16
1Q17
2Q17
3Q17
4Q17
1Q18*
2Q18*
3Q18*
4Q18*
mbDifferencetofive-yearaverage
OPEC-12andnon-OPECparticipantsproduceat fullconformity
21

©2018OrganizationofthePetroleumExportingCountries
OildemandintheEconomicGrowthsensitivities
● Two alternative sensitivities: Higher GDP growth (HG) and Lower GDP growth (LG)
● Demand in 2040:– Reference Case: 111.1 mb/d– HG: 113.8 mb/d– LG: 107.5 mb/d
● Overall uncertainty from GDP growth is in the range of 6 mb/d in 2040
Long-term oil demand (mb/d)
22

©2018OrganizationofthePetroleumExportingCountries
OildemandinthepenetrationofEVsSensitivityCase
● Sensitivity Case: Penetration of EVs is higher than in the reference case
● Annual EV sales reach 80 million by 2040
● Oil demand in 2040 is reduced by 2.5 mb/d compared to the Reference Case, to total 108.6 mb/d
● Global oil demand plateaus around this level in the second half of the 2030s
Long-term oil demand (mb/d) in the reference Case and the Sensitivity Case
23

©2018OrganizationofthePetroleumExportingCountries
OildemandintheefficiencyimprovementsSensitivityCase
● Accelerated Efficiency (AE) Case assumes more aggressive efficiency improvements
● Overall demand reduction in the AE case is 3.2 mb/d by 2040, reaching 107.9 mb/d
● Two-thirds of the demand reduction takes place in DCs
Long-term oil demand (mb/d)
24

©2018OrganizationofthePetroleumExportingCountries
LiquidssupplyintheUpside/DownsideSensitivities
● Based on the Upside Sensitivity, demand for OPEC crude would be curbed in the medium-term; reaching 36.8 mb/d by 2040
● By contrast, in a Downside Sensitivity Case, demand for OPEC crude stays relatively flat at 33 mb/d until mid-2020s; then rises to 45 mb/d by 2040
Supply sensitivities: impact on demand for OPEC crude
25
© 2018 Organization of the Petroleum Exporting Countries
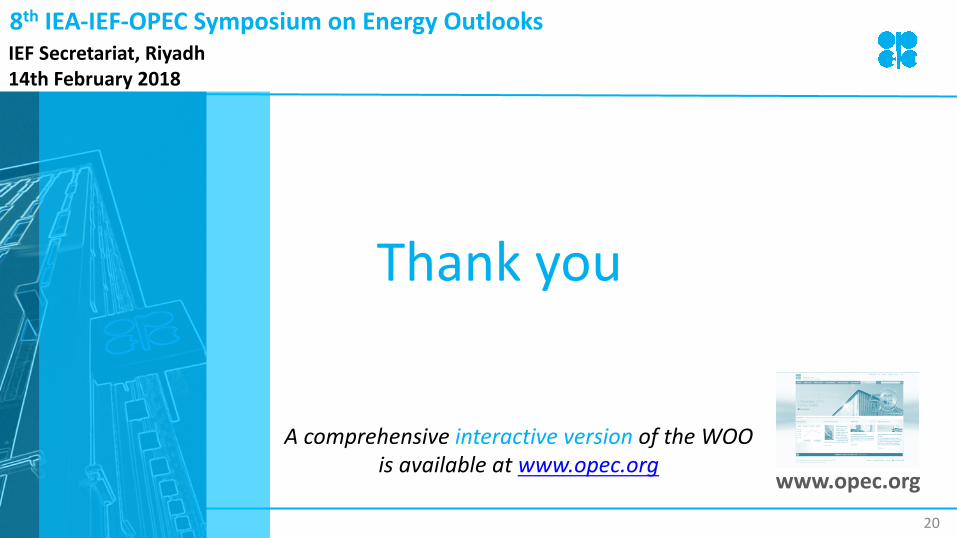
DeepcutinglobalE&Pspending,2014- 2016
Spending (US$bn) Change(2016/14)
2014 2015 2016 US$bn %
Barclays 670 494 383 -287 -42.8
RystadEnergy 637 473 350 -286 -45.0
WoodMackenzie 760 596 438 -322 -42.4
IHS 710 550 375 -335 -47.2
ICEBrent
Yearlyaverage(US$/b)
Change
2013 108.70
2014 99.45 -9%
2015 53.60 -46%
2016 45.13 -16%
Source:Barclays,IHS,WM,Rystad,OPECSecretariat.
26