last April's OPEC Oil Market Report - OPEC : Home Monthly Oil Market Report – April 2016 1 Oil...
96
Monthly Oil Market Report OPEC 13 April 2016 Feature article: Summer products market outlook Oil market highlights Feature article Crude oil price movements Commodity markets World economy World oil demand World oil supply Product markets and refinery operations Tanker market Oil trade Stock movements Balance of supply and demand 1 3 5 11 16 34 45 59 65 69 77 85
Transcript of last April's OPEC Oil Market Report - OPEC : Home Monthly Oil Market Report – April 2016 1 Oil...
Monthly Oil Market ReportO P E C
13 April 2016
Feature article:Summer products market outlook
Oil market highlights
Feature article
Crude oil price movements
Commodity markets
World economy
World oil demand
World oil supply
Product markets and refi nery operations
Tanker market
Oil trade
Stock movements
Balance of supply and demand
1
3
5
11
16
34
45
59
65
69
77
85

Organization of the Petroleum Exporting Countries
Helferstorferstrasse 17, A-1010 Vienna, AustriaE-mail: prid(at)opec.orgWebsite: www.opec.org
OPEC Monthly Oil Market Report – April 2016 1
Oil market highlights Crude Oil Price Movements The OPEC Reference Basket increased by more than 20% to reach $34.65/b in March. ICE Brent ended up $6.26 at $39.79/b and Nymex WTI surged by $7.34 to $37.96/b. Speculators have amassed a near-record number of bullish bets on increasing oil prices. The Brent-WTI spread narrowed considerably in March to stand at $1.83/b, prompting renewed US buying interest in West African light sweet grades.
World Economy World economic growth is forecast at 3.1% in 2016, after estimated growth of 2.9% last year, both unchanged from the previous month. OECD growth in 2016 remains at 1.9%, slightly below the 2.0% seen in 2015. In the emerging economies, China and India continue to expand this year at 6.3% and 7.5%, respectively, unchanged from the previous report. Meanwhile, Brazil is forecast to move further into recession this year, contracting by 2.9%, while the contraction in Russia’s economy is unchanged at 1.1%.
World Oil Demand World oil demand is expected to grow by 1.54 mb/d in 2015, unchanged from the previous report, to average 92.98 mb/d. For 2016, global oil demand growth is anticipated to be around 1.20 mb/d, representing a minor downward revision of 50 tb/d from previous expectations, mainly reflecting the slower economic momentum in Latin America. Total consumption is projected to reach 94.18 mb/d in 2016.
World Oil Supply Non-OPEC supply growth in 2015 has been revised up slightly to stand at 1.46 mb/d to average 57.13 mb/d. In 2016, the expected contraction in non-OPEC oil supply will be slightly more than forecast, with output falling by 0.73 mb/d to average 56.39 mb/d. OPEC NGL production is expected to grow by 0.17 mb/d in 2016, up from 0.15 mb/d last year, unchanged from the previous report. In March, OPEC crude production increased by 15 tb/d to average 32.25 mb/d, according to secondary sources.
Product Markets and Refining Operations Product markets in the US were supported by strong domestic gasoline demand fueled by the switch to summer grade gasoline, which allowed refinery margins to remain healthy. In Europe, the lack of export opportunities in gasoline and fuel oil amid weakness in middle distillates caused margins to continue to fall. Meanwhile, refinery margins in Asia exhibited a slight recovery on the back of stronger regional demand and tightening sentiment due to refinery maintenance in the region.
Tanker Market Average dirty tanker freight rates in March rose by 5% compared to the previous month, mainly as VLCC freight rates increased in March supported by loading delays and ullage problems in the eastern ports. Clean tanker freight rates improved East of Suez but encountered a decline West of Suez impacted by limited tonnage demand. Global chartering activities were higher in March, while arrivals increased in European and far eastern ports.
Stock Movements OECD commercial oil stocks fell in February to stand at 3,026 mb. At this level, OECD commercial oil stocks are around 351.8 mb above the latest five-year average, with crude and products indicating a surplus of 240.7 mb and 111.1 mb, respectively. In terms of days of forward cover, OECD commercial stocks stood at 66.4 days, some 7.4 days higher than the latest five-year average
Balance of Supply and Demand Demand for OPEC crude in 2015 is estimated at 29.7 mb/d, unchanged from the previous month and 0.1 mb/d lower than the year before. In 2016, demand for OPEC crude is projected at 31.5 mb/d, broadly unchanged from the previous report and 1.8 mb/d higher than last year.

2 OPEC Monthly Oil Market Report – April 2016
OPEC Monthly Oil Market Report – April 2016 3
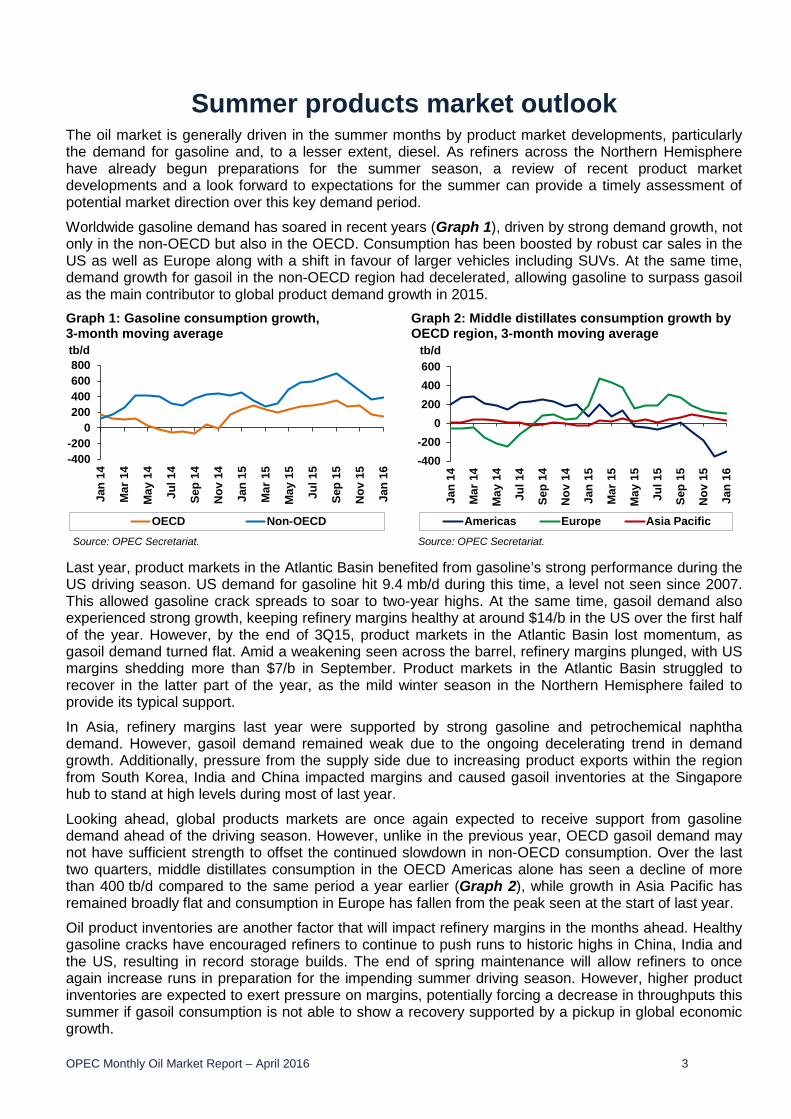
Summer products market outlook The oil market is generally driven in the summer months by product market developments, particularly the demand for gasoline and, to a lesser extent, diesel. As refiners across the Northern Hemisphere have already begun preparations for the summer season, a review of recent product market developments and a look forward to expectations for the summer can provide a timely assessment of potential market direction over this key demand period.
Worldwide gasoline demand has soared in recent years (Graph 1), driven by strong demand growth, not only in the non-OECD but also in the OECD. Consumption has been boosted by robust car sales in the US as well as Europe along with a shift in favour of larger vehicles including SUVs. At the same time, demand growth for gasoil in the non-OECD region had decelerated, allowing gasoline to surpass gasoil as the main contributor to global product demand growth in 2015. Graph 1: Gasoline consumption growth, 3-month moving average
Graph 2: Middle distillates consumption growth by OECD region, 3-month moving average
Last year, product markets in the Atlantic Basin benefited from gasoline’s strong performance during the US driving season. US demand for gasoline hit 9.4 mb/d during this time, a level not seen since 2007. This allowed gasoline crack spreads to soar to two-year highs. At the same time, gasoil demand also experienced strong growth, keeping refinery margins healthy at around $14/b in the US over the first half of the year. However, by the end of 3Q15, product markets in the Atlantic Basin lost momentum, as gasoil demand turned flat. Amid a weakening seen across the barrel, refinery margins plunged, with US margins shedding more than $7/b in September. Product markets in the Atlantic Basin struggled to recover in the latter part of the year, as the mild winter season in the Northern Hemisphere failed to provide its typical support.
In Asia, refinery margins last year were supported by strong gasoline and petrochemical naphtha demand. However, gasoil demand remained weak due to the ongoing decelerating trend in demand growth. Additionally, pressure from the supply side due to increasing product exports within the region from South Korea, India and China impacted margins and caused gasoil inventories at the Singapore hub to stand at high levels during most of last year.
Looking ahead, global products markets are once again expected to receive support from gasoline demand ahead of the driving season. However, unlike in the previous year, OECD gasoil demand may not have sufficient strength to offset the continued slowdown in non-OECD consumption. Over the last two quarters, middle distillates consumption in the OECD Americas alone has seen a decline of more than 400 tb/d compared to the same period a year earlier (Graph 2), while growth in Asia Pacific has remained broadly flat and consumption in Europe has fallen from the peak seen at the start of last year.
Oil product inventories are another factor that will impact refinery margins in the months ahead. Healthy gasoline cracks have encouraged refiners to continue to push runs to historic highs in China, India and the US, resulting in record storage builds. The end of spring maintenance will allow refiners to once again increase runs in preparation for the impending summer driving season. However, higher product inventories are expected to exert pressure on margins, potentially forcing a decrease in throughputs this summer if gasoil consumption is not able to show a recovery supported by a pickup in global economic growth.
-400-200
0200400600800
Jan
14
Mar
14
May
14
Jul 1
4
Sep
14
Nov
14
Jan
15
Mar
15
May
15
Jul 1
5
Sep
15
Nov
15
Jan
16
tb/d
OECD Non-OECDSource: OPEC Secretariat.
-400-200
0200400600
Jan
14
Mar
14
May
14
Jul 1
4
Sep
14
Nov
14
Jan
15
Mar
15
May
15
Jul 1
5
Sep
15
Nov
15
Jan
16
tb/d
Americas Europe Asia PacificSource: OPEC Secretariat.

4 OPEC Monthly Oil Market Report – April 2016

Crude Oil Price Movements
OPEC Monthly Oil Market Report – April 2016 5
Crude Oil Price Movements The OPEC Reference Basket (ORB) value was up more than 20% in March, moving significantly further away from the bottoms reached previously. Positive market sentiments continue to arise from the output freeze plan being considered by major crude exporters. Support also came from expected decreasing US production, higher refinery runs, declining production in several other regions and an increase in unplanned outages. Nevertheless, hurdles prevail as oversupply persists and inventories remain high. The ORB gained $5.93 to reach $34.65/b for the month, but declined 40.4% y-o-y. Meanwhile, the two main crude oil futures gained significantly in March. InterContinental Exchange (ICE) Brent ended up $6.26 to reach $39.79/b, while it dropped more than 35% on the year. Nymex WTI surged by $7.34 to reach $37.96/b, but also slipped about 31% for the year. Morevover, speculators have amassed a near-record number of bullish bets on increasing oil prices. By the end of the month, they held a net long position equivalent to almost 580 mb. The Brent-WTI spread narrowed sizably, prompting renewed US buying interest in West African light sweet grades. The ICE Brent-Nymex WTI spread narrowed $1.08 to $1.83/b. OPEC Reference Basket The ORB value moved significantly higher by the end of 1Q16 from the bottoms reached earlier in the year. The Basket was up more than 20% in March and was hovering near the $40/b level by the end of the month, a level last seen back in November. Although fundamentally nothing has changed much, as oversupply persists, positive market sentiments continue to arise from the output freeze plan being considered by major crude exporters. Support also came from expected decreasing US production, record refinery runs in Asia, declining non-OPEC production in several regions in Asia and Latin America, and rising unplanned outages. Healthy physical oil markets – particularly in Asia amid positive margins – and ongoing strategic stockpiles in China and the US, also helped. Graph 1.1: Crude oil price movement, 2015-2016
20
30
40
50
60
70
20
30
40
50
60
70
Mar
15
Apr 1
5
May
15
Jun
15
Jul 1
5
Aug
15
Sep
15
Oct
15
Nov
15
Dec
15
Jan
16
Feb
16
Mar
16
Apr 1
6
US$/bUS$/b
OPEC Basket WTI Brent Dated
Source: OPEC Secretariat.
Crude Oil Price Movements
6 OPEC Monthly Oil Market Report – April 2016
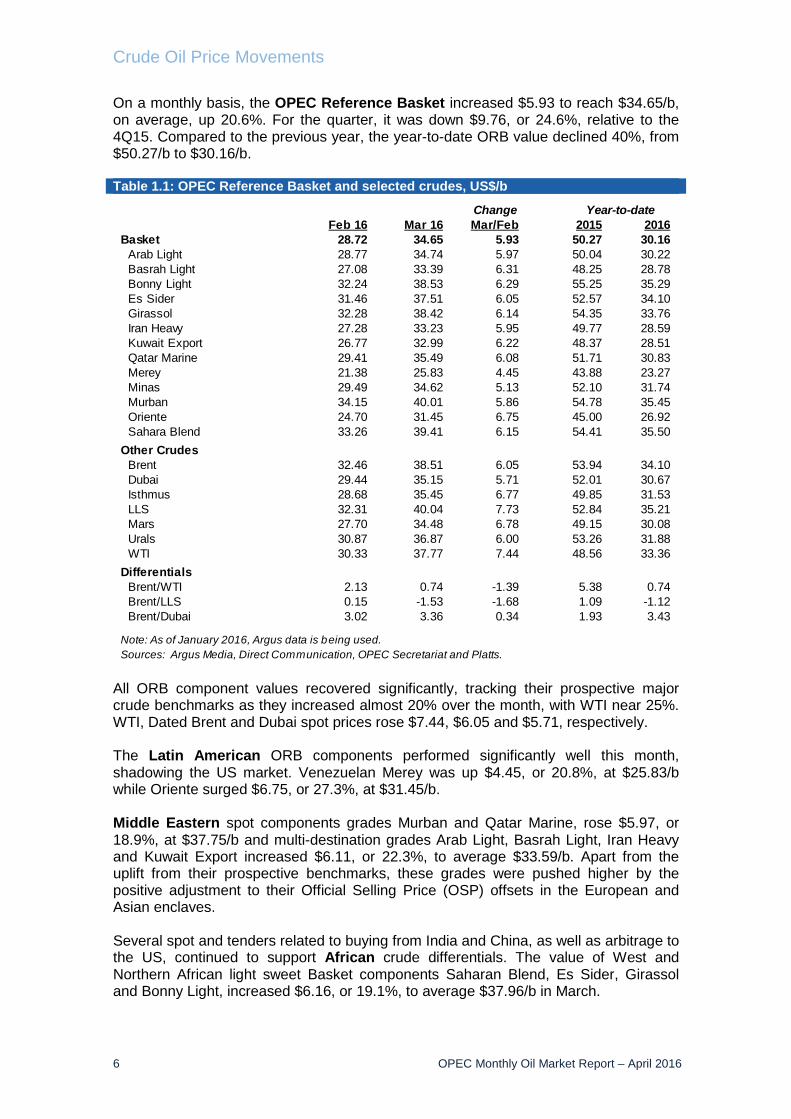
On a monthly basis, the OPEC Reference Basket increased $5.93 to reach $34.65/b, on average, up 20.6%. For the quarter, it was down $9.76, or 24.6%, relative to the 4Q15. Compared to the previous year, the year-to-date ORB value declined 40%, from $50.27/b to $30.16/b. Table 1.1: OPEC Reference Basket and selected crudes, US$/b
All ORB component values recovered significantly, tracking their prospective major crude benchmarks as they increased almost 20% over the month, with WTI near 25%. WTI, Dated Brent and Dubai spot prices rose $7.44, $6.05 and $5.71, respectively. The Latin American ORB components performed significantly well this month, shadowing the US market. Venezuelan Merey was up $4.45, or 20.8%, at $25.83/b while Oriente surged $6.75, or 27.3%, at $31.45/b. Middle Eastern spot components grades Murban and Qatar Marine, rose $5.97, or 18.9%, at $37.75/b and multi-destination grades Arab Light, Basrah Light, Iran Heavy and Kuwait Export increased $6.11, or 22.3%, to average $33.59/b. Apart from the uplift from their prospective benchmarks, these grades were pushed higher by the positive adjustment to their Official Selling Price (OSP) offsets in the European and Asian enclaves. Several spot and tenders related to buying from India and China, as well as arbitrage to the US, continued to support African crude differentials. The value of West and Northern African light sweet Basket components Saharan Blend, Es Sider, Girassol and Bonny Light, increased $6.16, or 19.1%, to average $37.96/b in March.
ChangeFeb 16 Mar 16 Mar/Feb 2015 2016
Basket 28.72 34.65 5.93 50.27 30.16 Arab Light 28.77 34.74 5.97 50.04 30.22 Basrah Light 27.08 33.39 6.31 48.25 28.78 Bonny Light 32.24 38.53 6.29 55.25 35.29 Es Sider 31.46 37.51 6.05 52.57 34.10 Girassol 32.28 38.42 6.14 54.35 33.76 Iran Heavy 27.28 33.23 5.95 49.77 28.59 Kuwait Export 26.77 32.99 6.22 48.37 28.51 Qatar Marine 29.41 35.49 6.08 51.71 30.83 Merey 21.38 25.83 4.45 43.88 23.27 Minas 29.49 34.62 5.13 52.10 31.74 Murban 34.15 40.01 5.86 54.78 35.45 Oriente 24.70 31.45 6.75 45.00 26.92 Sahara Blend 33.26 39.41 6.15 54.41 35.50Other Crudes Brent 32.46 38.51 6.05 53.94 34.10 Dubai 29.44 35.15 5.71 52.01 30.67 Isthmus 28.68 35.45 6.77 49.85 31.53 LLS 32.31 40.04 7.73 52.84 35.21 Mars 27.70 34.48 6.78 49.15 30.08 Urals 30.87 36.87 6.00 53.26 31.88 WTI 30.33 37.77 7.44 48.56 33.36Differentials Brent/WTI 2.13 0.74 -1.39 5.38 0.74 Brent/LLS 0.15 -1.53 -1.68 1.09 -1.12 Brent/Dubai 3.02 3.36 0.34 1.93 3.43
Note: As of January 2016, Argus data is being used.
Year-to-date
Sources: Argus Media, Direct Communication, OPEC Secretariat and Platts.
Crude Oil Price Movements
OPEC Monthly Oil Market Report – April 2016 7
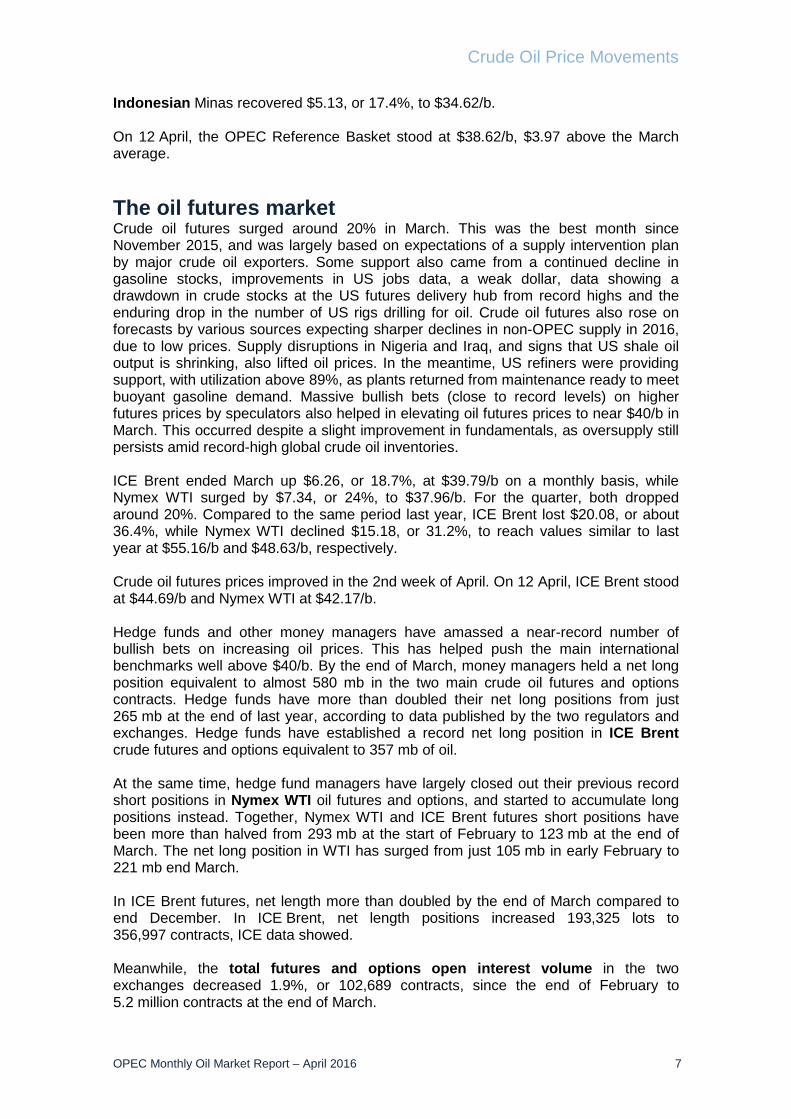
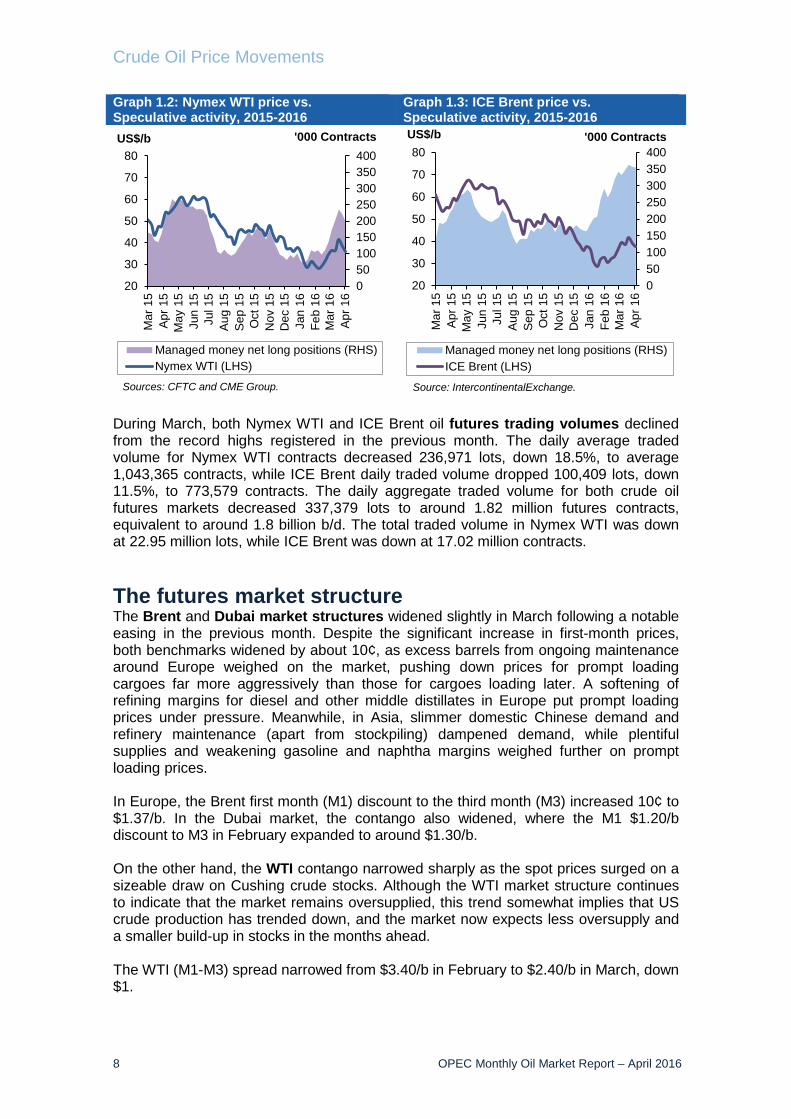
Indonesian Minas recovered $5.13, or 17.4%, to $34.62/b. On 12 April, the OPEC Reference Basket stood at $38.62/b, $3.97 above the March average. The oil futures market Crude oil futures surged around 20% in March. This was the best month since November 2015, and was largely based on expectations of a supply intervention plan by major crude oil exporters. Some support also came from a continued decline in gasoline stocks, improvements in US jobs data, a weak dollar, data showing a drawdown in crude stocks at the US futures delivery hub from record highs and the enduring drop in the number of US rigs drilling for oil. Crude oil futures also rose on forecasts by various sources expecting sharper declines in non-OPEC supply in 2016, due to low prices. Supply disruptions in Nigeria and Iraq, and signs that US shale oil output is shrinking, also lifted oil prices. In the meantime, US refiners were providing support, with utilization above 89%, as plants returned from maintenance ready to meet buoyant gasoline demand. Massive bullish bets (close to record levels) on higher futures prices by speculators also helped in elevating oil futures prices to near $40/b in March. This occurred despite a slight improvement in fundamentals, as oversupply still persists amid record-high global crude oil inventories. ICE Brent ended March up $6.26, or 18.7%, at $39.79/b on a monthly basis, while Nymex WTI surged by $7.34, or 24%, to $37.96/b. For the quarter, both dropped around 20%. Compared to the same period last year, ICE Brent lost $20.08, or about 36.4%, while Nymex WTI declined $15.18, or 31.2%, to reach values similar to last year at $55.16/b and $48.63/b, respectively. Crude oil futures prices improved in the 2nd week of April. On 12 April, ICE Brent stood at $44.69/b and Nymex WTI at $42.17/b. Hedge funds and other money managers have amassed a near-record number of bullish bets on increasing oil prices. This has helped push the main international benchmarks well above $40/b. By the end of March, money managers held a net long position equivalent to almost 580 mb in the two main crude oil futures and options contracts. Hedge funds have more than doubled their net long positions from just 265 mb at the end of last year, according to data published by the two regulators and exchanges. Hedge funds have established a record net long position in ICE Brent crude futures and options equivalent to 357 mb of oil. At the same time, hedge fund managers have largely closed out their previous record short positions in Nymex WTI oil futures and options, and started to accumulate long positions instead. Together, Nymex WTI and ICE Brent futures short positions have been more than halved from 293 mb at the start of February to 123 mb at the end of March. The net long position in WTI has surged from just 105 mb in early February to 221 mb end March. In ICE Brent futures, net length more than doubled by the end of March compared to end December. In ICE Brent, net length positions increased 193,325 lots to 356,997 contracts, ICE data showed. Meanwhile, the total futures and options open interest volume in the two exchanges decreased 1.9%, or 102,689 contracts, since the end of February to 5.2 million contracts at the end of March.
Crude Oil Price Movements
8 OPEC Monthly Oil Market Report – April 2016
Graph 1.2: Nymex WTI price vs. Speculative activity, 2015-2016
Graph 1.3: ICE Brent price vs. Speculative activity, 2015-2016
During March, both Nymex WTI and ICE Brent oil futures trading volumes declined from the record highs registered in the previous month. The daily average traded volume for Nymex WTI contracts decreased 236,971 lots, down 18.5%, to average 1,043,365 contracts, while ICE Brent daily traded volume dropped 100,409 lots, down 11.5%, to 773,579 contracts. The daily aggregate traded volume for both crude oil futures markets decreased 337,379 lots to around 1.82 million futures contracts, equivalent to around 1.8 billion b/d. The total traded volume in Nymex WTI was down at 22.95 million lots, while ICE Brent was down at 17.02 million contracts. The futures market structure The Brent and Dubai market structures widened slightly in March following a notable easing in the previous month. Despite the significant increase in first-month prices, both benchmarks widened by about 10¢, as excess barrels from ongoing maintenance around Europe weighed on the market, pushing down prices for prompt loading cargoes far more aggressively than those for cargoes loading later. A softening of refining margins for diesel and other middle distillates in Europe put prompt loading prices under pressure. Meanwhile, in Asia, slimmer domestic Chinese demand and refinery maintenance (apart from stockpiling) dampened demand, while plentiful supplies and weakening gasoline and naphtha margins weighed further on prompt loading prices. In Europe, the Brent first month (M1) discount to the third month (M3) increased 10¢ to $1.37/b. In the Dubai market, the contango also widened, where the M1 $1.20/b discount to M3 in February expanded to around $1.30/b. On the other hand, the WTI contango narrowed sharply as the spot prices surged on a sizeable draw on Cushing crude stocks. Although the WTI market structure continues to indicate that the market remains oversupplied, this trend somewhat implies that US crude production has trended down, and the market now expects less oversupply and a smaller build-up in stocks in the months ahead. The WTI (M1-M3) spread narrowed from $3.40/b in February to $2.40/b in March, down $1.
050100150200250300350400
20
30
40
50
60
70
80M
ar 1
5Ap
r 15
May
15
Jun
15Ju
l 15
Aug
15Se
p 15
Oct
15
Nov
15
Dec
15
Jan
16Fe
b 16
Mar
16
Apr 1
6
US$/b
Managed money net long positions (RHS)Nymex WTI (LHS)
'000 Contracts
Sources: CFTC and CME Group.
050100150200250300350400
20
30
40
50
60
70
80
Mar
15
Apr
15
May
15
Jun
15Ju
l 15
Aug
15
Sep
15
Oct
15
Nov
15
Dec
15
Jan
16Fe
b 16
Mar
16
Apr
16
US$/b
Managed money net long positions (RHS)ICE Brent (LHS)
'000 Contracts
Source: IntercontinentalExchange.
Crude Oil Price Movements
OPEC Monthly Oil Market Report – April 2016 9
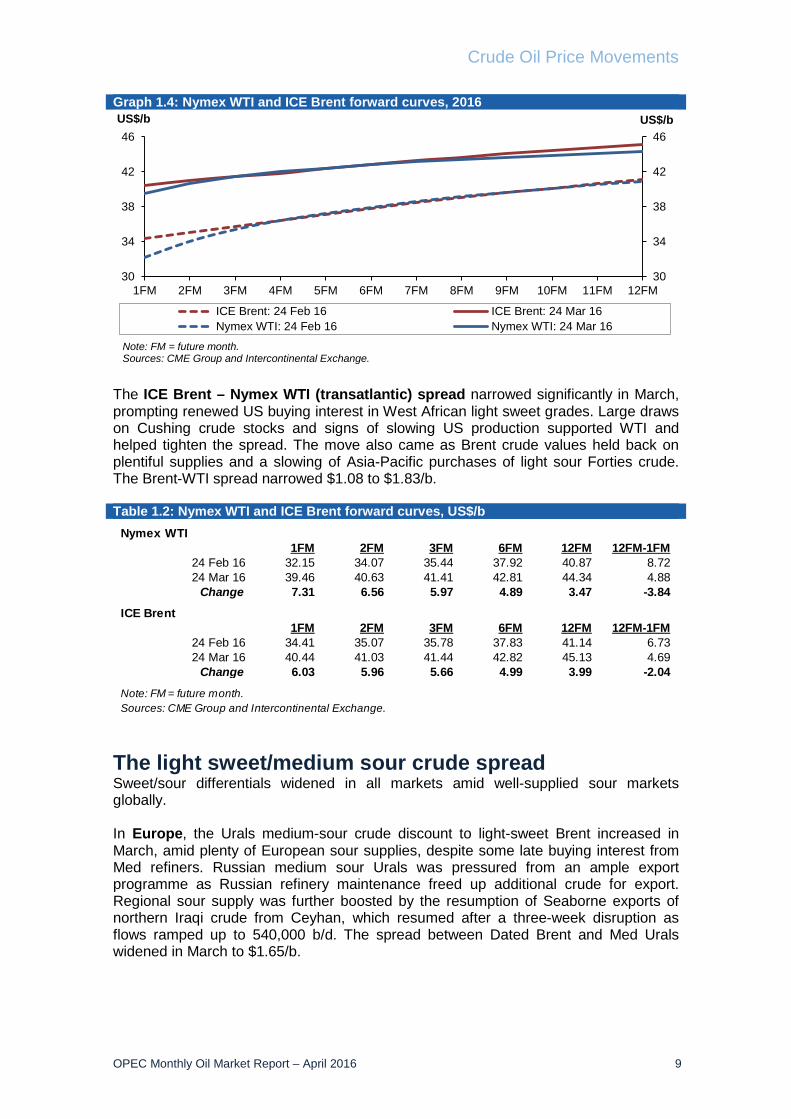
Graph 1.4: Nymex WTI and ICE Brent forward curves, 2016
The ICE Brent – Nymex WTI (transatlantic) spread narrowed significantly in March, prompting renewed US buying interest in West African light sweet grades. Large draws on Cushing crude stocks and signs of slowing US production supported WTI and helped tighten the spread. The move also came as Brent crude values held back on plentiful supplies and a slowing of Asia-Pacific purchases of light sour Forties crude. The Brent-WTI spread narrowed $1.08 to $1.83/b. Table 1.2: Nymex WTI and ICE Brent forward curves, US$/b
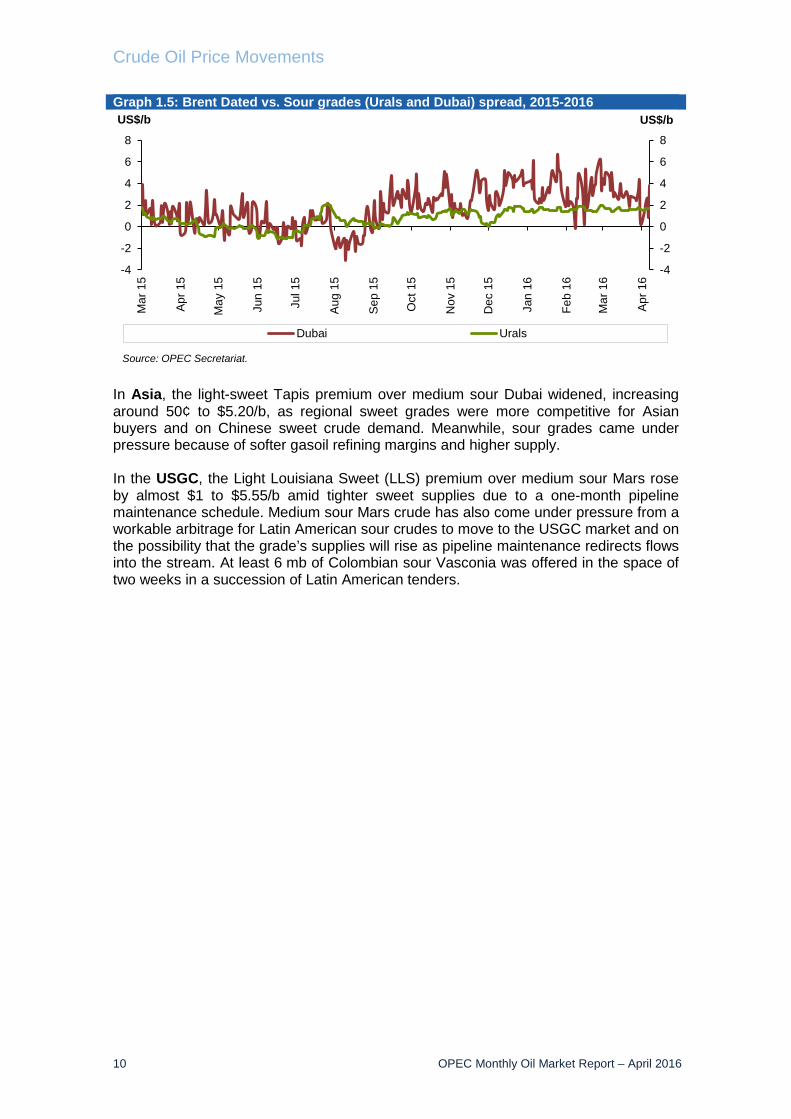
The light sweet/medium sour crude spread Sweet/sour differentials widened in all markets amid well-supplied sour markets globally. In Europe, the Urals medium-sour crude discount to light-sweet Brent increased in March, amid plenty of European sour supplies, despite some late buying interest from Med refiners. Russian medium sour Urals was pressured from an ample export programme as Russian refinery maintenance freed up additional crude for export. Regional sour supply was further boosted by the resumption of Seaborne exports of northern Iraqi crude from Ceyhan, which resumed after a three-week disruption as flows ramped up to 540,000 b/d. The spread between Dated Brent and Med Urals widened in March to $1.65/b.
30
34
38
42
46
30
34
38
42
46
1FM 2FM 3FM 4FM 5FM 6FM 7FM 8FM 9FM 10FM 11FM 12FM
US$/bUS$/b
ICE Brent: 24 Feb 16 ICE Brent: 24 Mar 16Nymex WTI: 24 Feb 16 Nymex WTI: 24 Mar 16
Note: FM = future month.Sources: CME Group and Intercontinental Exchange.
Nymex WTI 1FM 2FM 3FM 6FM 12FM 12FM-1FM
24 Feb 16 32.15 34.07 35.44 37.92 40.87 8.7224 Mar 16 39.46 40.63 41.41 42.81 44.34 4.88
Change 7.31 6.56 5.97 4.89 3.47 -3.84
ICE Brent1FM 2FM 3FM 6FM 12FM 12FM-1FM
24 Feb 16 34.41 35.07 35.78 37.83 41.14 6.7324 Mar 16 40.44 41.03 41.44 42.82 45.13 4.69
Change 6.03 5.96 5.66 4.99 3.99 -2.04
Note: FM = future month.Sources: CME Group and Intercontinental Exchange.
Crude Oil Price Movements
10 OPEC Monthly Oil Market Report – April 2016
Graph 1.5: Brent Dated vs. Sour grades (Urals and Dubai) spread, 2015-2016
In Asia, the light-sweet Tapis premium over medium sour Dubai widened, increasing around 50¢ to $5.20/b, as regional sweet grades were more competitive for Asian buyers and on Chinese sweet crude demand. Meanwhile, sour grades came under pressure because of softer gasoil refining margins and higher supply. In the USGC, the Light Louisiana Sweet (LLS) premium over medium sour Mars rose by almost $1 to $5.55/b amid tighter sweet supplies due to a one-month pipeline maintenance schedule. Medium sour Mars crude has also come under pressure from a workable arbitrage for Latin American sour crudes to move to the USGC market and on the possibility that the grade’s supplies will rise as pipeline maintenance redirects flows into the stream. At least 6 mb of Colombian sour Vasconia was offered in the space of two weeks in a succession of Latin American tenders.
-4
-2
0
2
4
6
8
-4
-2
0
2
4
6
8M
ar 1
5
Apr 1
5
May
15
Jun
15
Jul 1
5
Aug
15
Sep
15
Oct
15
Nov
15
Dec
15
Jan
16
Feb
16
Mar
16
Apr 1
6
US$/bUS$/b
Dubai Urals
Source: OPEC Secretariat.
Commodity Markets
OPEC Monthly Oil Market Report – April 2016 11
Commodity Markets Commodity prices generally advanced in March, with a large jump in crude oil prices leading gains in the group of energy commodities. Gains in the group of agriculture were led by rises in the sugar price, while metals showed a broad-based advance due to strengthening in the manufacturing and construction sectors in China. Precious metals advanced on a signal by the US Federal Reserve (Fed) of a lower path for interest rate increases in the US. Trends in selected commodity markets Commodity market sentiment was generally supported by a large percentage increase in crude oil prices during the month, on the prospect of a supply agreement among major oil-producing countries. Furthermore, a signal by the Fed of a lower path of interest rate increases for this year at its March meeting generally weakened the US dollar and supported both emerging and commodity market sentiments. Expectations of lower interest rates also helped precious metal prices add to the previous month’s gains. Metal prices were supported by strengthening of the Chinese yuan against the US dollar, while manufacturing activity in the US showed improvement. The manufacturing Purchasing Managers’ Index (PMI) for March improved in China to 49.7 versus 48.0 the previous month, close to the 50.0 mark that implies expansion/contraction. Meanwhile, at the US Institute of Supply Management, the PMI entered expansion territory, with a reading of 51.8 versus 49.5 in February. Also, China’s National Bureau of Statics reported price increases of newly constructed residential buildings in 47 of the largest 70 cities in February, which helped support copper and steel prices. The World Steel Association reported that steel output was down y-o-y by 3.3% worldwide and by 4.0% in China. Agricultural prices advanced, with gains in food, beverage and raw material groups. Sugar was the best performer, supported by strengthening of the Brazilian real, which reduced the advantage of exports, while in Thailand exports were forecast to be 20% less than a year ago due to crop damage caused by drought conditions, according to an official source. Coffee prices were also affected by strengthening of the Brazilian currency. Meanwhile, there were no major revisions to crop estimations for wheat, corn and soybeans by the US Department of Agriculture, which continues to expect plentiful stocks for the current year. Energy prices advanced significantly in respect to the previous month due to a recovery in crude oil prices in response to an upcoming meeting in Qatar to discuss a potential production agreement; the weakening of the US dollar also supported prices. Meanwhile, natural gas prices declined on average, as the winter season approached its end in the northern hemisphere and temperatures were above normal in Europe and the US due to the effects of meteorological phenomena “El Niño”, which translated into limited demand growth and hence higher inventories. In Europe, EU-28 reports from Gas Infrastructure Europe showed end-of-March inventories at 31.8 million cubic metres (mcm) which is 31% higher than a year ago. The price of oil in term contracts additionally pressured prices significantly.

Commodity Markets
12 OPEC Monthly Oil Market Report – April 2016
Table 2.1: Commodity price data, 2015-2016
Average energy prices in March increased by 14.8% m-o-m due to a 20.3% increase in crude oil. Natural gas prices decreased in the US by 13.1% m-o-m, while average prices in Europe declined by 14.3%. Graph 2.1: Major commodity price indices, 2014-2016
20406080100120140
20406080
100120140
Mar
14
Apr
14
May
14
Jun
14
Jul 1
4
Aug
14
Sep
14
Oct
14
Nov
14
Dec
14
Jan
15
Feb
15
Mar
15
Apr
15
May
15
Jun
15
Jul 1
5
Aug
15
Sep
15
Oct
15
Nov
15
Dec
15
Jan
16
Feb
16
Mar
16
IndexIndex
Energy Non-energy Agriculture Food
Base metals HH natural gas Gold
Source: World Bank, Commodity price data.
Base year 2010 = 100
% Change
Jan 16 Feb 16 Mar 16 Mar/Feb 2015 2016
Energy 40.5 41.3 47.4 14.8 67.27 43.06 Coal, Australia $/mt 49.8 50.7 52.1 2.8 61.2 50.9 Crude oil, average $/bbl 29.8 31.0 37.3 20.3 51.6 32.7 Natural gas, US $/mmbtu 2.3 2.0 1.7 -13.1 2.9 2.0Non-energy 74.6 75.8 78.0 2.8 86.7 76.2Agriculture 83.5 84.4 86.2 2.2 92.9 84.7Food 85.1 86.5 88.3 2.1 96.5 86.7 Soybean meal $/mt 333.0 326.0 325.0 -0.3 432.0 328.0 Soybean oil $/mt 727.0 758.0 761.0 0.4 774.3 748.7 Soybeans $/mt 367.0 369.0 375.0 1.6 411.3 370.3Grains 84.3 84.3 84.4 0.1 95.4 84.3 Maize $/mt 161.0 159.7 159.1 -0.3 174.2 159.9 Wheat, US, HRW $/mt 193.3 187.0 191.2 2.2 238.8 190.5 Sugar, world $/kg 0.3 0.3 0.3 16.3 0.3 0.3Base Metal 61.4 63.6 66.5 4.5 79.5 63.8 Aluminum $/mt 1,481.1 1,531.3 1,531.0 0.0 1,802.1 1,514.5 Copper $/mt 4,471.8 4,598.6 4,953.8 7.7 5,833.2 4,674.7 Iron ore, cfr spot $/dmtu 42.0 47.0 56.0 19.1 63.0 48.3 Lead $/mt 1,646.2 1,765.8 1,802.2 2.1 1,810.4 1,738.0 Nickel $/mt 8,507.3 8,298.5 8,717.3 5.0 14,392.8 8,507.7 Tin $/mt 13,808.1 15,610.1 16,897.6 8.2 18,370.0 15,438.6 Zinc $/mt 1,520.4 1,709.9 1,801.7 5.4 2,079.8 1,677.3Precious Metals Gold $/toz 1,097.9 1,199.5 1,245.1 3.8 1,218.8 1,180.9 Silver $/toz 14.1 15.2 15.5 2.0 16.8 14.9
Source: World Bank, Commodity price data.
World Bank commodity price indices (2010 = 100)
UnitCommodity Monthly averages Year-to-date
Commodity Markets
OPEC Monthly Oil Market Report – April 2016 13
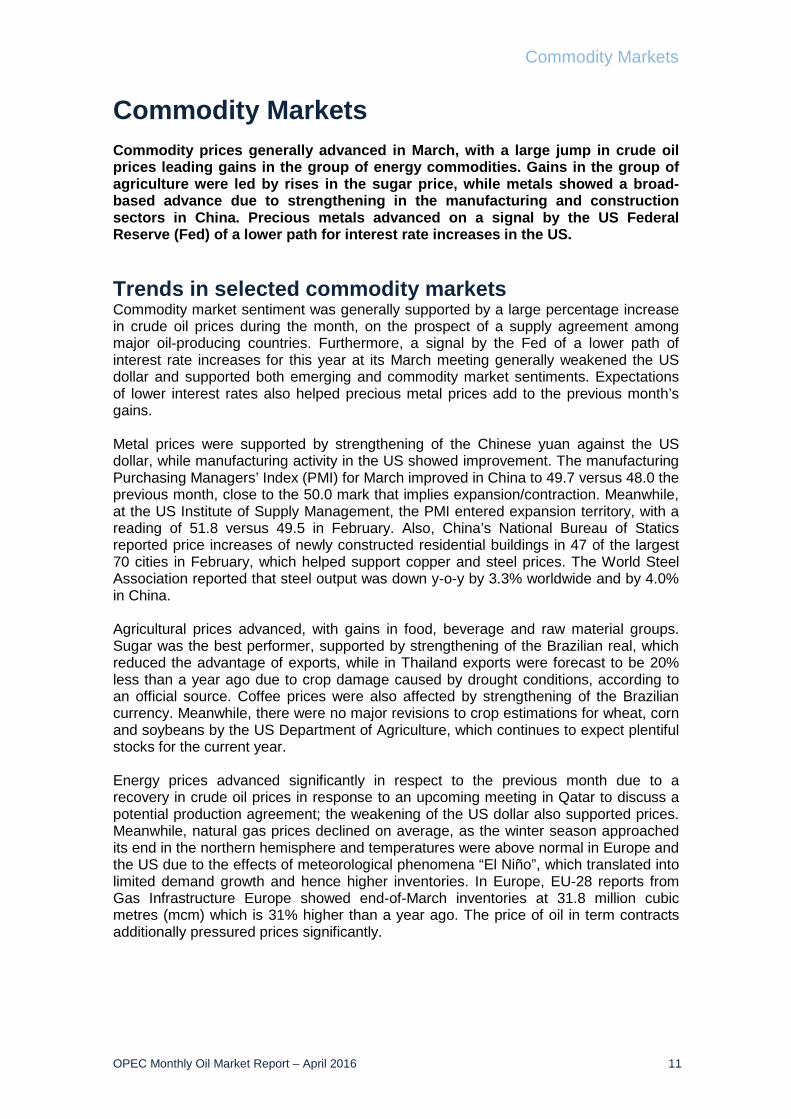
Agricultural prices advanced by 2.2% due to increases in average food, beverage and raw material prices by 2.1%, 4.3% and 1.2%, respectively. Sugar and palm oil were the main drivers of an increase in food prices, advancing by 16.3% and 7.2%, respectively. Average base metal prices increased by 4.5%, with advances among all group components except aluminium, which was unchanged. Copper prices were up by 7.7% and average iron ore prices jumped 19.1%. In the group of precious metals, gold prices extended the previous month’s gains with a 3.8% advance on lower expected interest rates, while silver prices advanced by 2.0% m-o-m. Graph 2.2: Inventories at the LME
In March, the Henry Hub natural gas index decreased. The average price was down 26¢, or 13.1%, to $1.70 per million British thermal units (mmbtu) after trading at an average of $1.96/mmbtu the previous month. The US Energy Information Administration (EIA) said utilities withdrew 25 billion cubic feet (bcf) of gas from storage during the week ending 25 March. This was slightly above the market median expectation of a 22 bcf decrease; however inventories are at a record high for this time of the year. Total working gas in storage stood at 2,468 bcf, or 68.3% higher than at the same time the previous year and 51.9% higher than the previous five-year average. The EIA noted that temperatures during the reported week were “higher than normal”.
0
1,000
2,000
3,000
4,000
5,000
0
200
400
600
800
1,000
Mar
15
Apr
15
May
15
Jun
15
Jul 1
5
Aug
15
Sep
15
Oct
15
Nov
15
Dec
15
Jan
16
Feb
16
Mar
16
'000 Tonnes'000 Tonnes
Copper Lead Nickel Tin Zinc Pr. Aluminium (RHS)
Sources: London Metal Exchange and Thomson Reuters.
Commodity Markets
14 OPEC Monthly Oil Market Report – April 2016
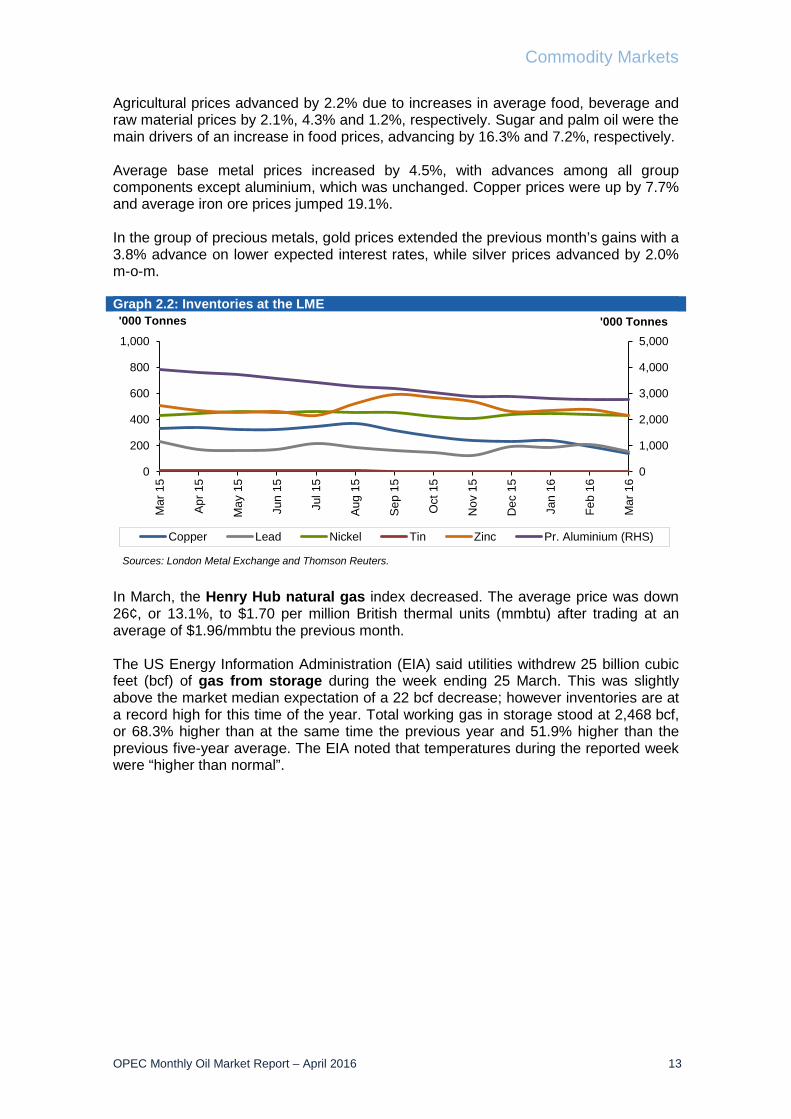
Investment flows into commodities Open interest volume (OIV) increased in March for select US commodity markets such as natural gas, livestock and precious metals, while decreasing for crude oil, natural gas, copper and agriculture. Meanwhile, monthly average speculative net length positions for the selected commodity groups increased. Table 2.2: CFTC data on non-commercial positions, ‘000 contracts
Agriculture’s OIV decreased by 2.6% to 4,929,000 contracts in March. Meanwhile, money managers decreased their combined net short positions to 134,471 lots, largely because of increasing net length in sugar, coffee and the soy complex. Graph 2.3: Speculative activity in key commodities, net length
Henry Hub’s natural gas OIV increased by 8.8% m-o-m to 1,073,755 contracts in March. Money managers decreased their net short positions by 7.7% to reach 143,372 lots, but sentiment was very bearish on record inventories. Copper’s OIV decreased by 8.3% m-o-m to 173,259 contracts in March. Money managers switched their stance to a net long position of 20,376 lots on improving manufacturing and construction prospects in China.
-400-300-200-1000100200300400500
-400-300-200-100
0100200300400500
Mar
15
Apr 1
5
May
15
Jun
15
Jul 1
5
Aug
15
Sep
15
Oct
15
Nov
15
Dec
15
Jan
16
Feb
16
Mar
16
'000 contracts'000 contracts
Agriculture Gold WTI Natural gas Livestocks Copper
Source: US Commodity Futures Trading Commission.
Feb 16 Mar 16 Feb 16 % OIV Mar 16 % OIV
Crude oil 1,832 1,768 75 4 184 10Natural gas 987 1,074 -156 -16 -144 -13Agriculture 5,062 4,929 -221 -4 -134 -3Precious metals 582 657 111 19 181 28Copper 189 173 -9 -5 20 12Livestock 510 552 52 10 84 15Total 9,162 9,153 -148 8 191 49Source: US Commodity Futures Trading Commission.
Open interest Net length
Commodity Markets
OPEC Monthly Oil Market Report – April 2016 15
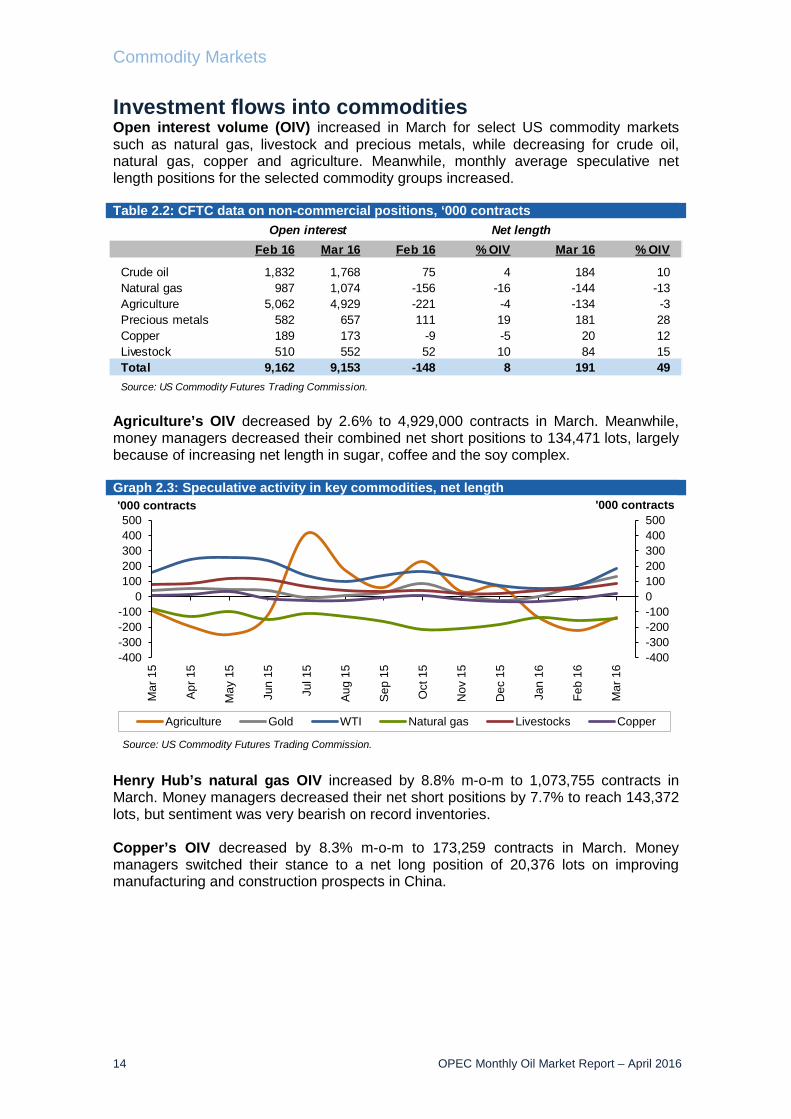
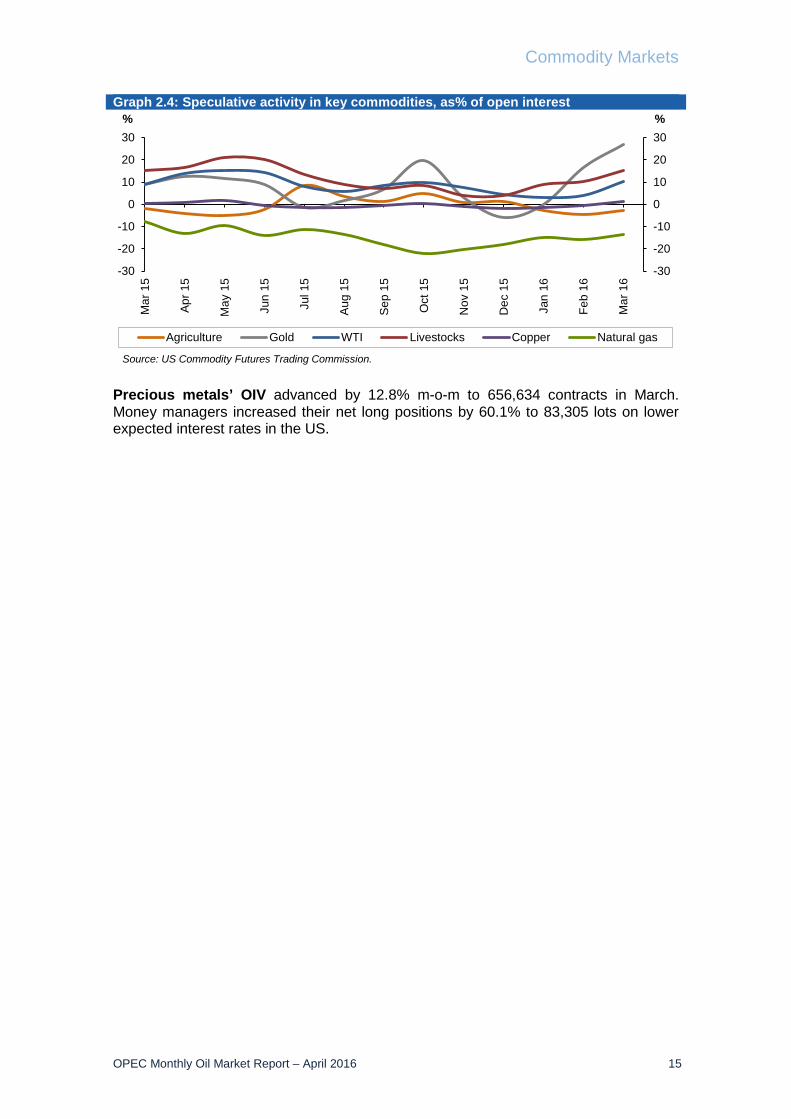
Graph 2.4: Speculative activity in key commodities, as% of open interest
Precious metals’ OIV advanced by 12.8% m-o-m to 656,634 contracts in March. Money managers increased their net long positions by 60.1% to 83,305 lots on lower expected interest rates in the US.
-30
-20
-10
0
10
20
30
-30
-20
-10
0
10
20
30M
ar 1
5
Apr
15
May
15
Jun
15
Jul 1
5
Aug
15
Sep
15
Oct
15
Nov
15
Dec
15
Jan
16
Feb
16
Mar
16
%%
Agriculture Gold WTI Livestocks Copper Natural gas
Source: US Commodity Futures Trading Commission.
World Economy
16 OPEC Monthly Oil Market Report – April 2016
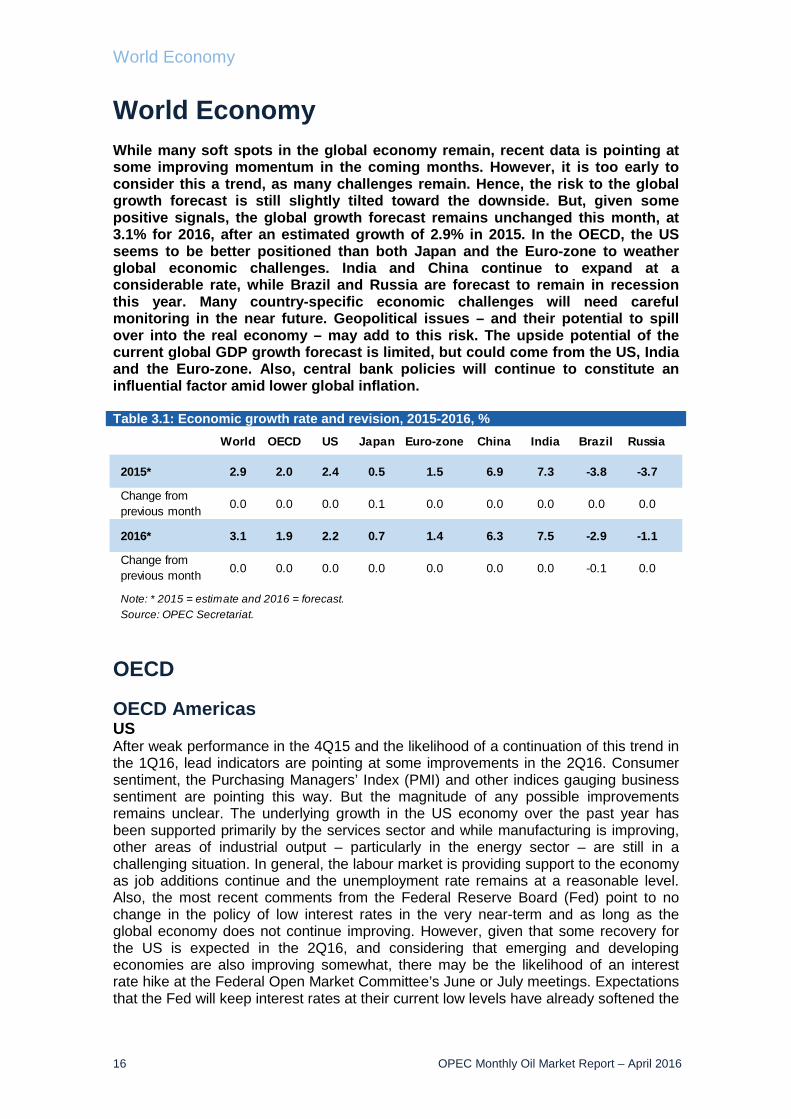
World Economy While many soft spots in the global economy remain, recent data is pointing at some improving momentum in the coming months. However, it is too early to consider this a trend, as many challenges remain. Hence, the risk to the global growth forecast is still slightly tilted toward the downside. But, given some positive signals, the global growth forecast remains unchanged this month, at 3.1% for 2016, after an estimated growth of 2.9% in 2015. In the OECD, the US seems to be better positioned than both Japan and the Euro-zone to weather global economic challenges. India and China continue to expand at a considerable rate, while Brazil and Russia are forecast to remain in recession this year. Many country-specific economic challenges will need careful monitoring in the near future. Geopolitical issues – and their potential to spill over into the real economy – may add to this risk. The upside potential of the current global GDP growth forecast is limited, but could come from the US, India and the Euro-zone. Also, central bank policies will continue to constitute an influential factor amid lower global inflation. Table 3.1: Economic growth rate and revision, 2015-2016, %
OECD OECD Americas US After weak performance in the 4Q15 and the likelihood of a continuation of this trend in the 1Q16, lead indicators are pointing at some improvements in the 2Q16. Consumer sentiment, the Purchasing Managers’ Index (PMI) and other indices gauging business sentiment are pointing this way. But the magnitude of any possible improvements remains unclear. The underlying growth in the US economy over the past year has been supported primarily by the services sector and while manufacturing is improving, other areas of industrial output – particularly in the energy sector – are still in a challenging situation. In general, the labour market is providing support to the economy as job additions continue and the unemployment rate remains at a reasonable level. Also, the most recent comments from the Federal Reserve Board (Fed) point to no change in the policy of low interest rates in the very near-term and as long as the global economy does not continue improving. However, given that some recovery for the US is expected in the 2Q16, and considering that emerging and developing economies are also improving somewhat, there may be the likelihood of an interest rate hike at the Federal Open Market Committee’s June or July meetings. Expectations that the Fed will keep interest rates at their current low levels have already softened the
World OECD US Japan Euro-zone China India Brazil Russia
2015* 2.9 2.0 2.4 0.5 1.5 6.9 7.3 -3.8 -3.7
Change from previous month 0.0 0.0 0.0 0.1 0.0 0.0 0.0 0.0 0.0
2016* 3.1 1.9 2.2 0.7 1.4 6.3 7.5 -2.9 -1.1
Change from previous month 0.0 0.0 0.0 0.0 0.0 0.0 0.0 -0.1 0.0
Note: * 2015 = estimate and 2016 = forecast.Source: OPEC Secretariat.
World Economy
OPEC Monthly Oil Market Report – April 2016 17
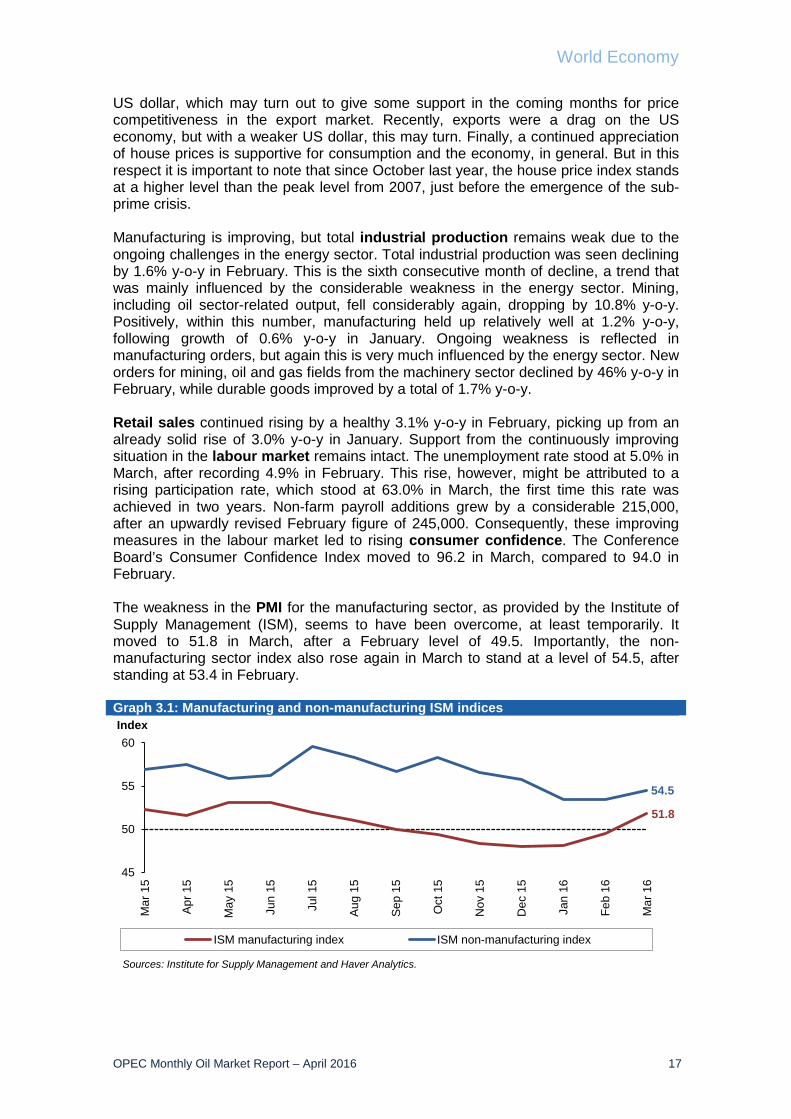
US dollar, which may turn out to give some support in the coming months for price competitiveness in the export market. Recently, exports were a drag on the US economy, but with a weaker US dollar, this may turn. Finally, a continued appreciation of house prices is supportive for consumption and the economy, in general. But in this respect it is important to note that since October last year, the house price index stands at a higher level than the peak level from 2007, just before the emergence of the sub-prime crisis. Manufacturing is improving, but total industrial production remains weak due to the ongoing challenges in the energy sector. Total industrial production was seen declining by 1.6% y-o-y in February. This is the sixth consecutive month of decline, a trend that was mainly influenced by the considerable weakness in the energy sector. Mining, including oil sector-related output, fell considerably again, dropping by 10.8% y-o-y. Positively, within this number, manufacturing held up relatively well at 1.2% y-o-y, following growth of 0.6% y-o-y in January. Ongoing weakness is reflected in manufacturing orders, but again this is very much influenced by the energy sector. New orders for mining, oil and gas fields from the machinery sector declined by 46% y-o-y in February, while durable goods improved by a total of 1.7% y-o-y. Retail sales continued rising by a healthy 3.1% y-o-y in February, picking up from an already solid rise of 3.0% y-o-y in January. Support from the continuously improving situation in the labour market remains intact. The unemployment rate stood at 5.0% in March, after recording 4.9% in February. This rise, however, might be attributed to a rising participation rate, which stood at 63.0% in March, the first time this rate was achieved in two years. Non-farm payroll additions grew by a considerable 215,000, after an upwardly revised February figure of 245,000. Consequently, these improving measures in the labour market led to rising consumer confidence. The Conference Board’s Consumer Confidence Index moved to 96.2 in March, compared to 94.0 in February. The weakness in the PMI for the manufacturing sector, as provided by the Institute of Supply Management (ISM), seems to have been overcome, at least temporarily. It moved to 51.8 in March, after a February level of 49.5. Importantly, the non-manufacturing sector index also rose again in March to stand at a level of 54.5, after standing at 53.4 in February. Graph 3.1: Manufacturing and non-manufacturing ISM indices
51.8
54.5
45
50
55
60
Mar
15
Apr 1
5
May
15
Jun
15
Jul 1
5
Aug
15
Sep
15
Oct
15
Nov
15
Dec
15
Jan
16
Feb
16
Mar
16
Index
ISM manufacturing index ISM non-manufacturing index
Sources: Institute for Supply Management and Haver Analytics.
World Economy
18 OPEC Monthly Oil Market Report – April 2016
The GDP growth forecast for the current year remains unchanged at 2.2%, given that most of the ongoing slowing growth dynamic from the 1Q16, followed by some improvement in the 2Q16, is already anticipated. This growth level is slightly lower than the last growth estimate for 2015 of 2.4%. But it remains to be seen how large the improvements in the 2Q16 will be. Canada While the Canadian economy remains in a weak position, it seems to have recovered somewhat. After being affected by relatively sluggish domestic demand amid falling oil prices and a decline in investments in the energy sector, some improvements are becoming apparent. Exports improved for a third consecutive month in February, rising by 2.1% y-o-y, following a 7.3% y-o-y appreciation in January. Consequently, industrial production also improved with the latest available data from January showing output rising by 1.0% y-o-y, after several months of decline. Positively, retail trade improved by 6.4% y-o-y in January, after a rise of 2.6% y-o-y in December. This positive development is also being reflected in the PMI for manufacturing, which, for the first time since mid-2015, moved above 50 to reach 51.1 in March. The GDP forecast for 2016 remains at 1.6%, clearly above the estimated GDP growth of 1.1% in 2015. OECD Asia Pacific Japan Japan’s economy remains challenged by various issues, ranging from ongoing low demand and a decline in exports, to low inflation and fiscal constraints. Monetary stimulus continues at an unprecedented level, but does not seem to be entirely achieving the desired effect. Also, large fiscal stimulus is not in the cards for now, given the high sovereign debt level and the need to lower it. So the economy remains in a very low-growth/no-growth area. While the manufacturing sector has recently performed relatively well, the most recent lead indicators again point to a slowdown in this area of the economy. This will make it even more important to monitor the services sector, which unfortunately also seems to be slowing down. Moreover, just recently the yen also rose considerably, making Japanese exports less competitive. So there are plenty of challenges still ahead this year. While the Bank of Japan (BoJ) continues to stick to its inflation rate target of 2%, the additional monetary easing it has been providing has not been as effective as expected. Consumer prices turned slightly positive in February, better than in January, when they were in decline, but they are far from the target level. Inflation stood at 0.3% y-o-y in February. Despite the fact that the BoJ has already pushed down interest rates into negative territory of -0.1%, the Japanese yen strengthened, due to its status as a safe-haven currency and the Fed’s rate policy. However, it shows that the success of the BoJ’s monetary policy is also dependent on a variety of factors that might hardly be influenced. Positively, excluding the two volatile groups of energy and food, the country’s overall inflation figures were rising by 0.9% in February. An encouraging sign came again from the February data for real income, which, despite having declined considerably in 2015, suggests that a positive trend may continue in 2016. Also, given the extremely tight labour market, which had an unemployment rate of only 3.3% in February, it seems likely that some support will come from this area in 2016. Average monthly earnings increased by 1.6% y-o-y in February, after an initial rise of 1.2% y-o-y in January. This compares to a decline of 1.5% in 2015.
World Economy
OPEC Monthly Oil Market Report – April 2016 19
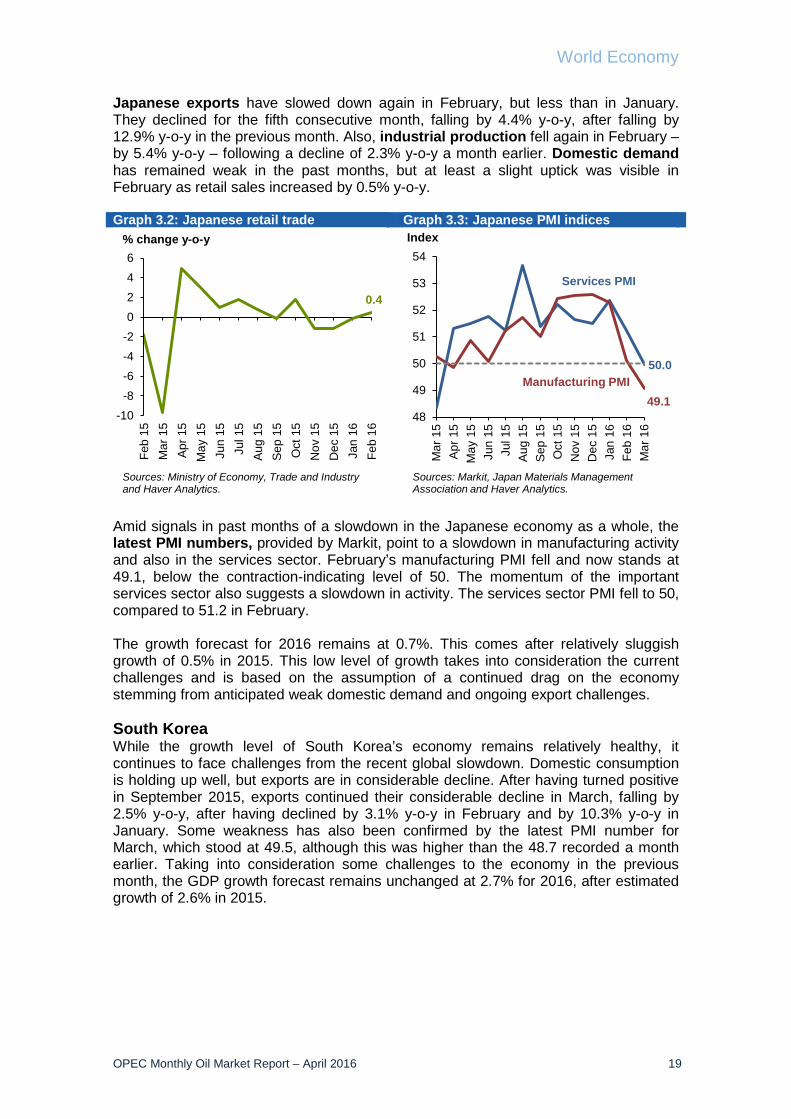
Japanese exports have slowed down again in February, but less than in January. They declined for the fifth consecutive month, falling by 4.4% y-o-y, after falling by 12.9% y-o-y in the previous month. Also, industrial production fell again in February – by 5.4% y-o-y – following a decline of 2.3% y-o-y a month earlier. Domestic demand has remained weak in the past months, but at least a slight uptick was visible in February as retail sales increased by 0.5% y-o-y. Graph 3.2: Japanese retail trade Graph 3.3: Japanese PMI indices
Amid signals in past months of a slowdown in the Japanese economy as a whole, the latest PMI numbers, provided by Markit, point to a slowdown in manufacturing activity and also in the services sector. February’s manufacturing PMI fell and now stands at 49.1, below the contraction-indicating level of 50. The momentum of the important services sector also suggests a slowdown in activity. The services sector PMI fell to 50, compared to 51.2 in February. The growth forecast for 2016 remains at 0.7%. This comes after relatively sluggish growth of 0.5% in 2015. This low level of growth takes into consideration the current challenges and is based on the assumption of a continued drag on the economy stemming from anticipated weak domestic demand and ongoing export challenges. South Korea While the growth level of South Korea’s economy remains relatively healthy, it continues to face challenges from the recent global slowdown. Domestic consumption is holding up well, but exports are in considerable decline. After having turned positive in September 2015, exports continued their considerable decline in March, falling by 2.5% y-o-y, after having declined by 3.1% y-o-y in February and by 10.3% y-o-y in January. Some weakness has also been confirmed by the latest PMI number for March, which stood at 49.5, although this was higher than the 48.7 recorded a month earlier. Taking into consideration some challenges to the economy in the previous month, the GDP growth forecast remains unchanged at 2.7% for 2016, after estimated growth of 2.6% in 2015.
0.4
-10-8-6-4-20246
Feb
15M
ar 1
5Ap
r 15
May
15
Jun
15Ju
l 15
Aug
15Se
p 15
Oct
15
Nov
15
Dec
15
Jan
16Fe
b 16
Sources: Ministry of Economy, Trade and Industry and Haver Analytics.
% change y-o-y
50.0
49.148
49
50
51
52
53
54
Mar
15
Apr 1
5M
ay 1
5Ju
n 15
Jul 1
5Au
g 15
Sep
15O
ct 1
5N
ov 1
5D
ec 1
5Ja
n 16
Feb
16M
ar 1
6
Index
Sources: Markit, Japan Materials Management Association and Haver Analytics.
Services PMI
Manufacturing PMI
World Economy
20 OPEC Monthly Oil Market Report – April 2016
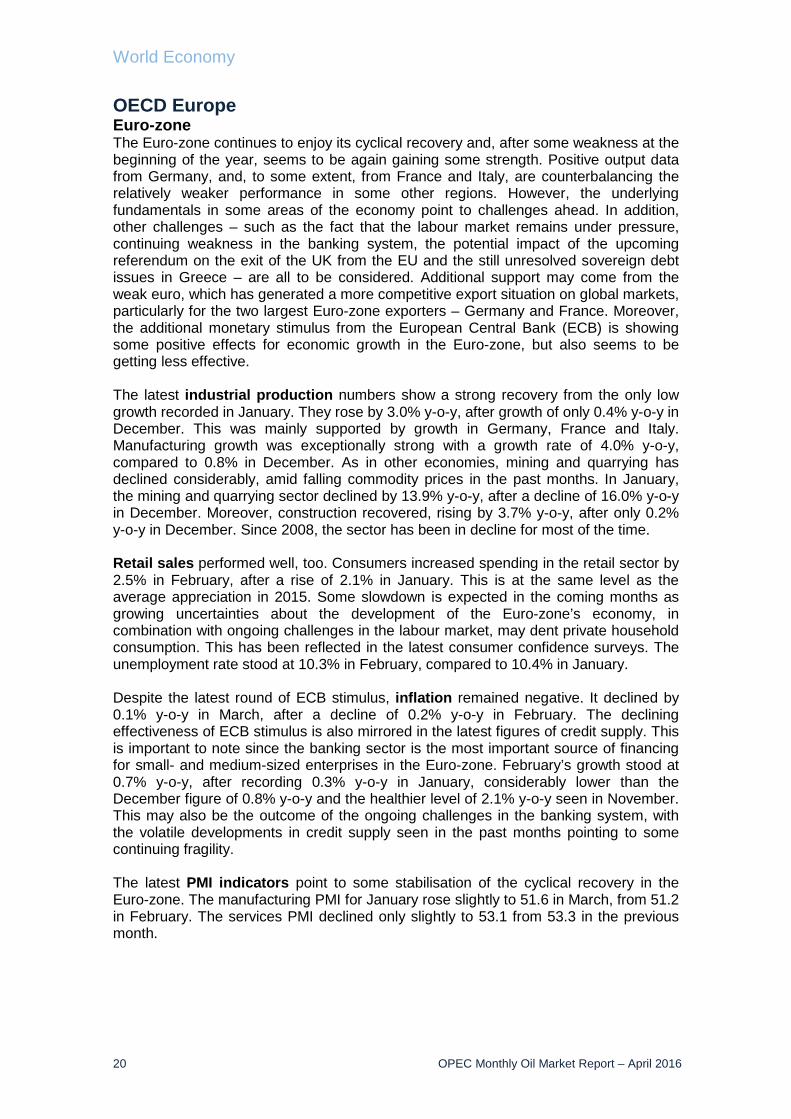
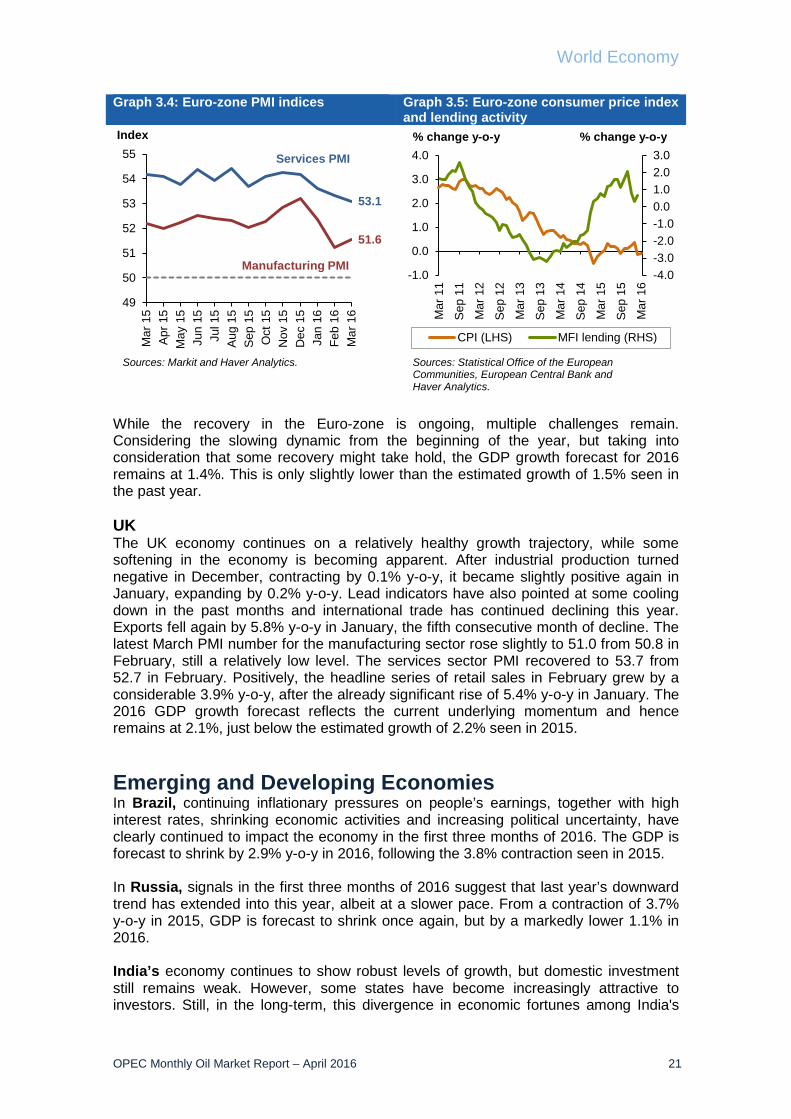
OECD Europe Euro-zone The Euro-zone continues to enjoy its cyclical recovery and, after some weakness at the beginning of the year, seems to be again gaining some strength. Positive output data from Germany, and, to some extent, from France and Italy, are counterbalancing the relatively weaker performance in some other regions. However, the underlying fundamentals in some areas of the economy point to challenges ahead. In addition, other challenges – such as the fact that the labour market remains under pressure, continuing weakness in the banking system, the potential impact of the upcoming referendum on the exit of the UK from the EU and the still unresolved sovereign debt issues in Greece – are all to be considered. Additional support may come from the weak euro, which has generated a more competitive export situation on global markets, particularly for the two largest Euro-zone exporters – Germany and France. Moreover, the additional monetary stimulus from the European Central Bank (ECB) is showing some positive effects for economic growth in the Euro-zone, but also seems to be getting less effective. The latest industrial production numbers show a strong recovery from the only low growth recorded in January. They rose by 3.0% y-o-y, after growth of only 0.4% y-o-y in December. This was mainly supported by growth in Germany, France and Italy. Manufacturing growth was exceptionally strong with a growth rate of 4.0% y-o-y, compared to 0.8% in December. As in other economies, mining and quarrying has declined considerably, amid falling commodity prices in the past months. In January, the mining and quarrying sector declined by 13.9% y-o-y, after a decline of 16.0% y-o-y in December. Moreover, construction recovered, rising by 3.7% y-o-y, after only 0.2% y-o-y in December. Since 2008, the sector has been in decline for most of the time. Retail sales performed well, too. Consumers increased spending in the retail sector by 2.5% in February, after a rise of 2.1% in January. This is at the same level as the average appreciation in 2015. Some slowdown is expected in the coming months as growing uncertainties about the development of the Euro-zone’s economy, in combination with ongoing challenges in the labour market, may dent private household consumption. This has been reflected in the latest consumer confidence surveys. The unemployment rate stood at 10.3% in February, compared to 10.4% in January. Despite the latest round of ECB stimulus, inflation remained negative. It declined by 0.1% y-o-y in March, after a decline of 0.2% y-o-y in February. The declining effectiveness of ECB stimulus is also mirrored in the latest figures of credit supply. This is important to note since the banking sector is the most important source of financing for small- and medium-sized enterprises in the Euro-zone. February’s growth stood at 0.7% y-o-y, after recording 0.3% y-o-y in January, considerably lower than the December figure of 0.8% y-o-y and the healthier level of 2.1% y-o-y seen in November. This may also be the outcome of the ongoing challenges in the banking system, with the volatile developments in credit supply seen in the past months pointing to some continuing fragility. The latest PMI indicators point to some stabilisation of the cyclical recovery in the Euro-zone. The manufacturing PMI for January rose slightly to 51.6 in March, from 51.2 in February. The services PMI declined only slightly to 53.1 from 53.3 in the previous month.
World Economy
OPEC Monthly Oil Market Report – April 2016 21
Graph 3.4: Euro-zone PMI indices Graph 3.5: Euro-zone consumer price index and lending activity
While the recovery in the Euro-zone is ongoing, multiple challenges remain. Considering the slowing dynamic from the beginning of the year, but taking into consideration that some recovery might take hold, the GDP growth forecast for 2016 remains at 1.4%. This is only slightly lower than the estimated growth of 1.5% seen in the past year. UK The UK economy continues on a relatively healthy growth trajectory, while some softening in the economy is becoming apparent. After industrial production turned negative in December, contracting by 0.1% y-o-y, it became slightly positive again in January, expanding by 0.2% y-o-y. Lead indicators have also pointed at some cooling down in the past months and international trade has continued declining this year. Exports fell again by 5.8% y-o-y in January, the fifth consecutive month of decline. The latest March PMI number for the manufacturing sector rose slightly to 51.0 from 50.8 in February, still a relatively low level. The services sector PMI recovered to 53.7 from 52.7 in February. Positively, the headline series of retail sales in February grew by a considerable 3.9% y-o-y, after the already significant rise of 5.4% y-o-y in January. The 2016 GDP growth forecast reflects the current underlying momentum and hence remains at 2.1%, just below the estimated growth of 2.2% seen in 2015. Emerging and Developing Economies In Brazil, continuing inflationary pressures on people’s earnings, together with high interest rates, shrinking economic activities and increasing political uncertainty, have clearly continued to impact the economy in the first three months of 2016. The GDP is forecast to shrink by 2.9% y-o-y in 2016, following the 3.8% contraction seen in 2015. In Russia, signals in the first three months of 2016 suggest that last year’s downward trend has extended into this year, albeit at a slower pace. From a contraction of 3.7% y-o-y in 2015, GDP is forecast to shrink once again, but by a markedly lower 1.1% in 2016. India’s economy continues to show robust levels of growth, but domestic investment still remains weak. However, some states have become increasingly attractive to investors. Still, in the long-term, this divergence in economic fortunes among India's
53.1
51.6
49
50
51
52
53
54
55M
ar 1
5Ap
r 15
May
15
Jun
15Ju
l 15
Aug
15Se
p 15
Oct
15
Nov
15
Dec
15
Jan
16Fe
b 16
Mar
16
Index
Sources: Markit and Haver Analytics.
Services PMI
Manufacturing PMI-4.0-3.0-2.0-1.00.01.02.03.0
-1.0
0.0
1.0
2.0
3.0
4.0
Mar
11
Sep
11
Mar
12
Sep
12
Mar
13
Sep
13
Mar
14
Sep
14
Mar
15
Sep
15
Mar
16
CPI (LHS) MFI lending (RHS)
Sources: Statistical Office of the European Communities, European Central Bank and Haver Analytics.
% change y-o-y % change y-o-y
World Economy
22 OPEC Monthly Oil Market Report – April 2016
states could lead to political instability. India’s manufacturing upturn gathered momentum in March with stronger inflows of new work leading firms to scale up output. India's merchandise exports and imports continued to contract in February, but the speed of contraction narrowed to single digits. Indian’s PMI, a composite single-figure indicator of manufacturing performance, was indicative of another improvement in business conditions across the sector. The Reserve Bank of India (RBI) cut its leading repurchase (repo) rate by 25 basis points (bp) to 6.5%, the lowest in more than five years. At the same time, the RBI raised the reverse repo rate charged by lenders to the central bank to 6.0%, in efforts to boost liquidity and improve the policy-transmission mechanism. China’s attempts to restructure the economy away from investment spending were given a public exposure during the annual meeting of the Chinese legislature, the National People's Congress (NPC). The most important figure unveiled at the NPC was the target of 6.5-7% for real GDP growth in 2016. It seems the Chinese government is determined to continue to support domestic demand, so that GDP growth does not deviate too much from the authorities’ target in 2016. And some further depreciation against the US dollar later on this year should provide some help to exports. China's 13th Five-Year Plan (FYP) was finalised and released in mid-March. The outlook for the document places considerable emphasis on growth in services and consumption. The Government will want to reduce employer social-insurance contributions, and cut taxes and fees under the new FYP. China’s manufacturing PMI, according to its National Bureau of Statistics (NBS), for March came in stronger than expected and the details showed broad-based improvement across the major components, including output and new orders. Table 3.2: Summary of macroeconomic performance of BRIC countries
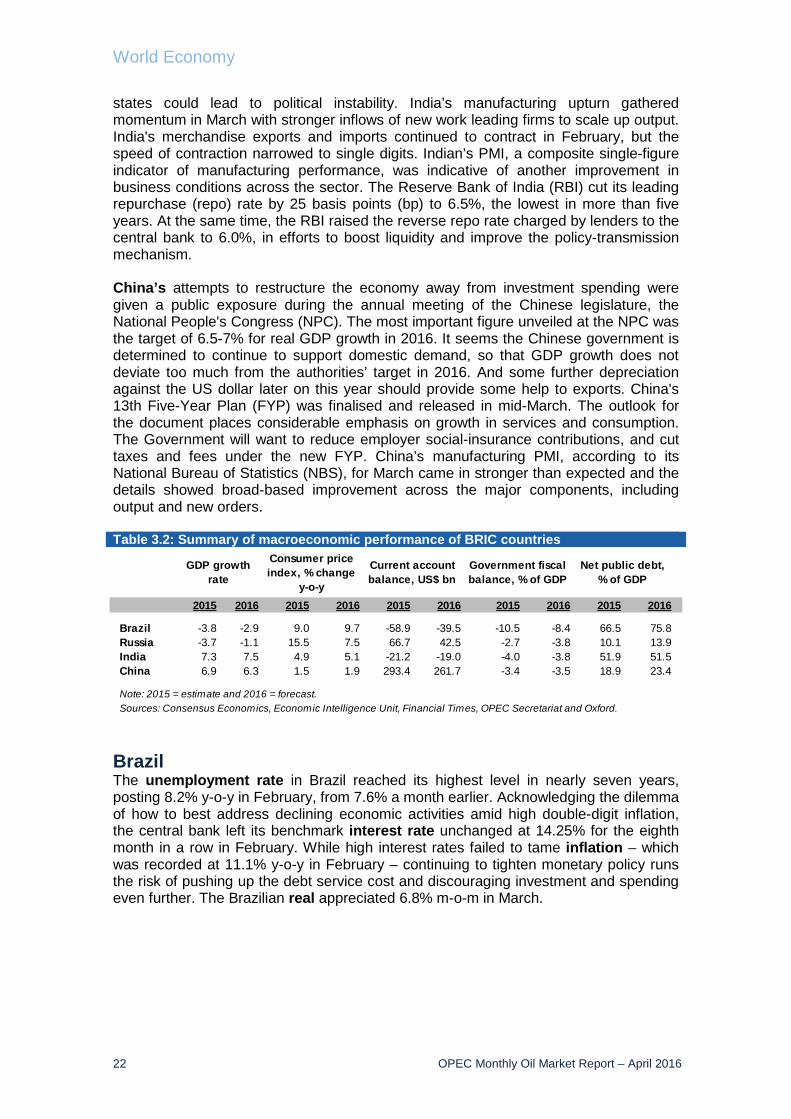
Brazil The unemployment rate in Brazil reached its highest level in nearly seven years, posting 8.2% y-o-y in February, from 7.6% a month earlier. Acknowledging the dilemma of how to best address declining economic activities amid high double-digit inflation, the central bank left its benchmark interest rate unchanged at 14.25% for the eighth month in a row in February. While high interest rates failed to tame inflation – which was recorded at 11.1% y-o-y in February – continuing to tighten monetary policy runs the risk of pushing up the debt service cost and discouraging investment and spending even further. The Brazilian real appreciated 6.8% m-o-m in March.
2015 2016 2015 2016 2015 2016 2015 2016 2015 2016
Brazil -3.8 -2.9 9.0 9.7 -58.9 -39.5 -10.5 -8.4 66.5 75.8Russia -3.7 -1.1 15.5 7.5 66.7 42.5 -2.7 -3.8 10.1 13.9India 7.3 7.5 4.9 5.1 -21.2 -19.0 -4.0 -3.8 51.9 51.5China 6.9 6.3 1.5 1.9 293.4 261.7 -3.4 -3.5 18.9 23.4
Sources: Consensus Economics, Economic Intelligence Unit, Financial Times, OPEC Secretariat and Oxford.Note: 2015 = estimate and 2016 = forecast.
GDP growth rate
Consumer price index, % change
y-o-y
Current account balance, US$ bn
Government fiscal balance, % of GDP
Net public debt, % of GDP
World Economy
OPEC Monthly Oil Market Report – April 2016 23
Graph 3.6: Brazilian unemployment rate
Graph 3.7: Brazilian inflation vs. Interest rate
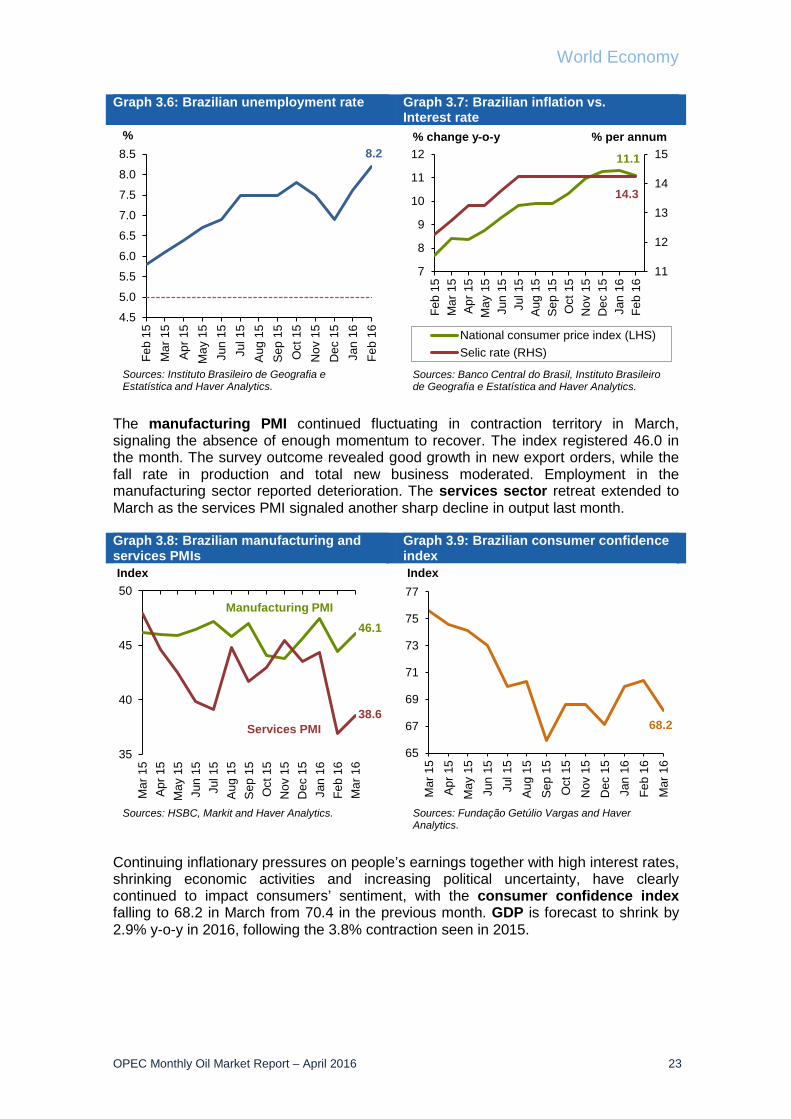
The manufacturing PMI continued fluctuating in contraction territory in March, signaling the absence of enough momentum to recover. The index registered 46.0 in the month. The survey outcome revealed good growth in new export orders, while the fall rate in production and total new business moderated. Employment in the manufacturing sector reported deterioration. The services sector retreat extended to March as the services PMI signaled another sharp decline in output last month. Graph 3.8: Brazilian manufacturing and services PMIs
Graph 3.9: Brazilian consumer confidence index
Continuing inflationary pressures on people’s earnings together with high interest rates, shrinking economic activities and increasing political uncertainty, have clearly continued to impact consumers’ sentiment, with the consumer confidence index falling to 68.2 in March from 70.4 in the previous month. GDP is forecast to shrink by 2.9% y-o-y in 2016, following the 3.8% contraction seen in 2015.
8.2
4.5
5.0
5.5
6.0
6.5
7.0
7.5
8.0
8.5Fe
b 15
Mar
15
Apr 1
5M
ay 1
5Ju
n 15
Jul 1
5Au
g 15
Sep
15O
ct 1
5N
ov 1
5D
ec 1
5Ja
n 16
Feb
16
%
Sources: Instituto Brasileiro de Geografia e Estatística and Haver Analytics.
11.1
14.3
11
12
13
14
15
7
8
9
10
11
12
Feb
15M
ar 1
5Ap
r 15
May
15
Jun
15Ju
l 15
Aug
15Se
p 15
Oct
15
Nov
15
Dec
15
Jan
16Fe
b 16
National consumer price index (LHS)Selic rate (RHS)
Sources: Banco Central do Brasil, Instituto Brasileiro de Geografia e Estatística and Haver Analytics.
% change y-o-y % per annum
46.1
38.6
35
40
45
50
Mar
15
Apr 1
5M
ay 1
5Ju
n 15
Jul 1
5Au
g 15
Sep
15O
ct 1
5N
ov 1
5D
ec 1
5Ja
n 16
Feb
16M
ar 1
6
Index
Sources: HSBC, Markit and Haver Analytics.
Services PMI
Manufacturing PMI
68.2
65
67
69
71
73
75
77
Mar
15
Apr 1
5M
ay 1
5Ju
n 15
Jul 1
5Au
g 15
Sep
15O
ct 1
5N
ov 1
5D
ec 1
5Ja
n 16
Feb
16M
ar 1
6
Index
Sources: Fundação Getúlio Vargas and Haver Analytics.
World Economy
24 OPEC Monthly Oil Market Report – April 2016
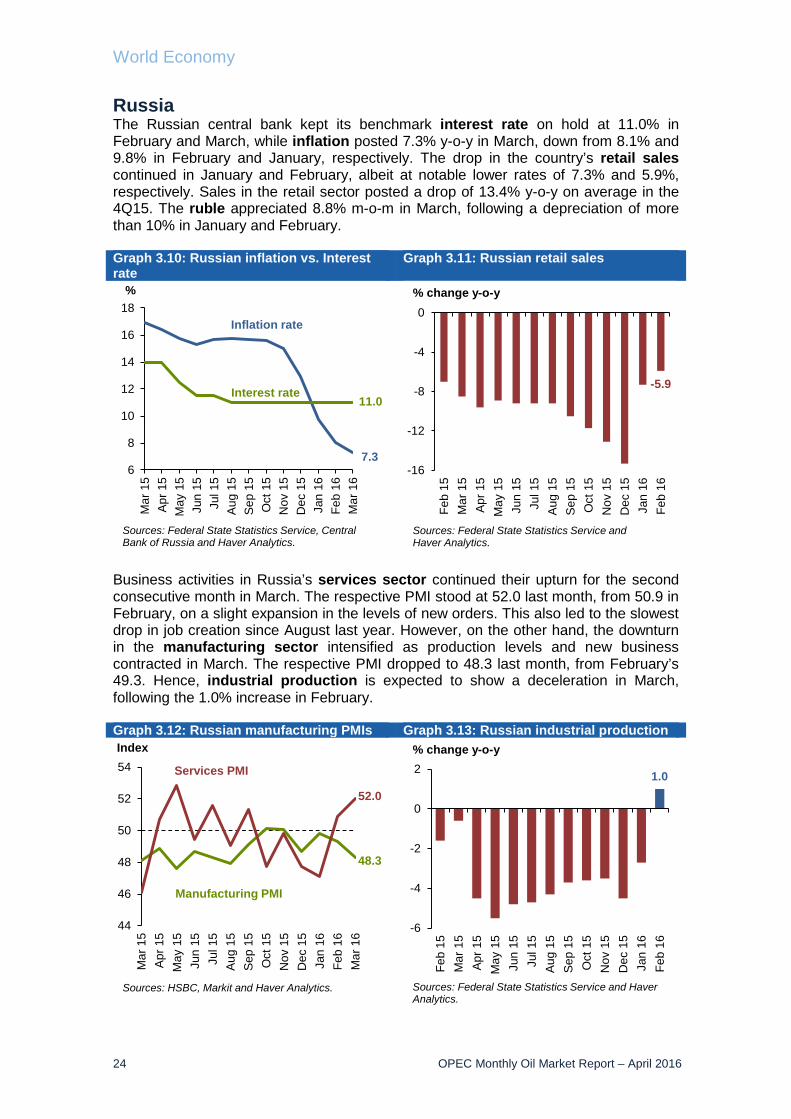
Russia The Russian central bank kept its benchmark interest rate on hold at 11.0% in February and March, while inflation posted 7.3% y-o-y in March, down from 8.1% and 9.8% in February and January, respectively. The drop in the country’s retail sales continued in January and February, albeit at notable lower rates of 7.3% and 5.9%, respectively. Sales in the retail sector posted a drop of 13.4% y-o-y on average in the 4Q15. The ruble appreciated 8.8% m-o-m in March, following a depreciation of more than 10% in January and February. Graph 3.10: Russian inflation vs. Interest rate
Graph 3.11: Russian retail sales
Business activities in Russia’s services sector continued their upturn for the second consecutive month in March. The respective PMI stood at 52.0 last month, from 50.9 in February, on a slight expansion in the levels of new orders. This also led to the slowest drop in job creation since August last year. However, on the other hand, the downturn in the manufacturing sector intensified as production levels and new business contracted in March. The respective PMI dropped to 48.3 last month, from February’s 49.3. Hence, industrial production is expected to show a deceleration in March, following the 1.0% increase in February. Graph 3.12: Russian manufacturing PMIs Graph 3.13: Russian industrial production
7.3
11.0
6
8
10
12
14
16
18
Mar
15
Apr 1
5M
ay 1
5Ju
n 15
Jul 1
5Au
g 15
Sep
15O
ct 1
5N
ov 1
5D
ec 1
5Ja
n 16
Feb
16M
ar 1
6
%
Sources: Federal State Statistics Service, Central Bank of Russia and Haver Analytics.
Inflation rate
Interest rate-5.9
-16
-12
-8
-4
0
Feb
15M
ar 1
5Ap
r 15
May
15
Jun
15Ju
l 15
Aug
15Se
p 15
Oct
15
Nov
15
Dec
15
Jan
16Fe
b 16
% change y-o-y
Sources: Federal State Statistics Service and Haver Analytics.
48.3
52.0
44
46
48
50
52
54
Mar
15
Apr
15
May
15
Jun
15Ju
l 15
Aug
15
Sep
15
Oct
15
Nov
15
Dec
15
Jan
16Fe
b 16
Mar
16
Index
Sources: HSBC, Markit and Haver Analytics.
Services PMI
Manufacturing PMI
1.0
-6
-4
-2
0
2
Feb
15M
ar 1
5Ap
r 15
May
15
Jun
15Ju
l 15
Aug
15Se
p 15
Oct
15
Nov
15
Dec
15
Jan
16Fe
b 16
% change y-o-y
Sources: Federal State Statistics Service and Haver Analytics.

World Economy
OPEC Monthly Oil Market Report – April 2016 25
Generally speaking, and after considering the available signals in the first three months of 2016, the downward trend seems to have extended into this year, but at a slower pace. From a contraction of 3.7% y-o-y in 2015, GDP is forecast to shrink once again though, by a markedly lower 1.1% in 2016. India India’s economy continues to show robust levels of growth, but domestic investment still remains weak. According to recent data, proposed industrial investment fell to a multi-year low in 2015 and, at a national level, this means that the business environment remains difficult and a problem that will transfer to 2017 as a downward risk. Investment in the industrial sector fell to a multi-year low in 2015, according to the Ministry of Commerce and Industry. Its data showed a 23% decline in proposed industrial investment, to INR 3.1 trillion ($47.8 bn), last year. In addition, the number of industrial investment proposals was at the second-lowest level in a decade, indicative of investor wariness to take up big-ticket projects. Proposals generally translate into actual investments with a gap of anywhere between six months and three years in India. The government's ambitious “Make in India” campaign, an initiative to increase manufacturing output and employment, entered its second year. Factors such as relatively high real interest rates, overcapacity in some industrial sectors and stressed corporate balance sheets contributed to the weak investment environment. Moreover, corporate balance sheets continue to be stressed. Meanwhile, there is some progress in some states in terms of investment in the industrial sector, also for facilitating increased domestic and foreign investment. It seems some states have become increasingly attractive to investors and, consequently, have benefited significantly from rising investment inflows. However, in the long-term, this divergence in economic fortune among India's states could lead to political instability. India’s manufacturing upturn gathered momentum in March, with stronger inflows of new work leading firms to scale up output. Along with improved domestic demand, producers also recorded an increase in new export business. These positive developments encouraged companies to buy more inputs, but workforce numbers were left broadly unchanged. On the price front, cost inflation accelerated, while charges were raised to the greatest extent since November 2014. India's CPI eased to a four-month low of 5.2% y-o-y in February 2016, down from 5.7% in January, and responding to easing pressure on food prices. Food price inflation in rural India fell to 6% y-o-y from 6.9% and in urban India to 4.2% y-o-y from 6.5%, in January. It seems the weak global oil prices remained determinants of the "fuel and light" category in India's consumer price basket, with fuel and light inflation easing to 4.6% y-o-y from 5.3% in January. The RBI cut its leading policy repo rate by 25 bp on 5 April for the first time since the last 50 bp cut in September 2015. At 6.5%, the repo rate now stands at its lowest level in more than five years. Concurrently, the RBI raised the reverse repo rate charged by lenders to the central bank by a similar amount to bring this to 6.0%, effectively lowering the interest rate corridor and boosting liquidity in the financial system to ensure greater transmission of a repo rate cut to the real economy. The repo rate cut was widely expected on the back of lower inflation and the central government's resolve to adhere to its fiscal-deficit target for the current financial year. However, it is unlikely the current repo rate cut alone will be sufficient to address overcapacity issues in the industrial sector – nor would it fully offset the lack of external demand.
World Economy
26 OPEC Monthly Oil Market Report – April 2016
Graph 3.14: Indian GDP growth Graph 3.15: Indian inflation vs. Repo rate
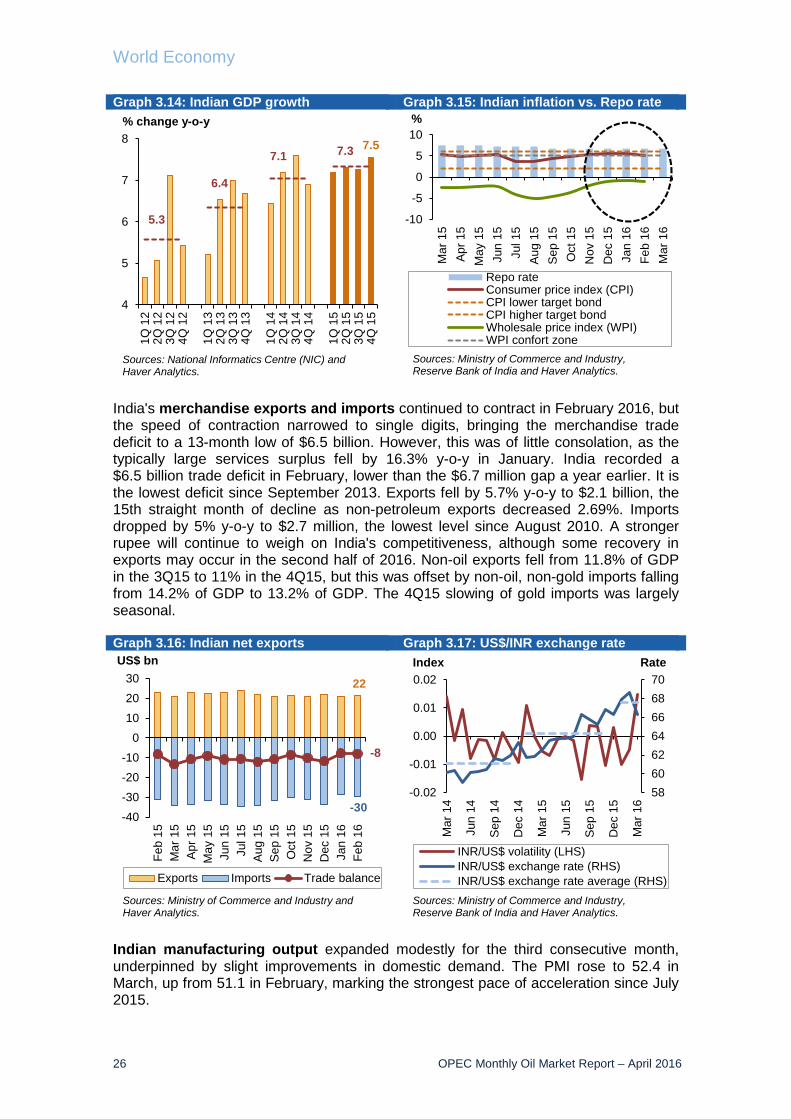
India's merchandise exports and imports continued to contract in February 2016, but the speed of contraction narrowed to single digits, bringing the merchandise trade deficit to a 13-month low of $6.5 billion. However, this was of little consolation, as the typically large services surplus fell by 16.3% y-o-y in January. India recorded a $6.5 billion trade deficit in February, lower than the $6.7 million gap a year earlier. It is the lowest deficit since September 2013. Exports fell by 5.7% y-o-y to $2.1 billion, the 15th straight month of decline as non-petroleum exports decreased 2.69%. Imports dropped by 5% y-o-y to $2.7 million, the lowest level since August 2010. A stronger rupee will continue to weigh on India's competitiveness, although some recovery in exports may occur in the second half of 2016. Non-oil exports fell from 11.8% of GDP in the 3Q15 to 11% in the 4Q15, but this was offset by non-oil, non-gold imports falling from 14.2% of GDP to 13.2% of GDP. The 4Q15 slowing of gold imports was largely seasonal. Graph 3.16: Indian net exports Graph 3.17: US$/INR exchange rate
Indian manufacturing output expanded modestly for the third consecutive month, underpinned by slight improvements in domestic demand. The PMI rose to 52.4 in March, up from 51.1 in February, marking the strongest pace of acceleration since July 2015.
7.5
5.3
6.4
7.1 7.3
4
5
6
7
81Q
12
2Q 1
23Q
12
4Q 1
2
1Q 1
32Q
13
3Q 1
34Q
13
1Q 1
42Q
14
3Q 1
44Q
14
1Q 1
52Q
15
3Q 1
54Q
15
Sources: National Informatics Centre (NIC) and Haver Analytics.
% change y-o-y
-10
-5
0
5
10
Mar
15
Apr 1
5M
ay 1
5Ju
n 15
Jul 1
5Au
g 15
Sep
15O
ct 1
5N
ov 1
5D
ec 1
5Ja
n 16
Feb
16M
ar 1
6
%
Repo rateConsumer price index (CPI)CPI lower target bondCPI higher target bondWholesale price index (WPI)WPI confort zone
Sources: Ministry of Commerce and Industry, Reserve Bank of India and Haver Analytics.
22
-30
-8
-40-30-20-10
0102030
Feb
15M
ar 1
5A
pr 1
5M
ay 1
5Ju
n 15
Jul 1
5A
ug 1
5S
ep 1
5O
ct 1
5N
ov 1
5D
ec 1
5Ja
n 16
Feb
16
US$ bn
Exports Imports Trade balance
Sources: Ministry of Commerce and Industry and Haver Analytics.
58606264666870
-0.02
-0.01
0.00
0.01
0.02
Mar
14
Jun
14
Sep
14
Dec
14
Mar
15
Jun
15
Sep
15
Dec
15
Mar
16
INR/US$ volatility (LHS)INR/US$ exchange rate (RHS)INR/US$ exchange rate average (RHS)
Index Rate
Sources: Ministry of Commerce and Industry,Reserve Bank of India and Haver Analytics.
World Economy
OPEC Monthly Oil Market Report – April 2016 27
Graph 3.18: Indian PMIs Graph 3.19: Indian industrial production breakdown
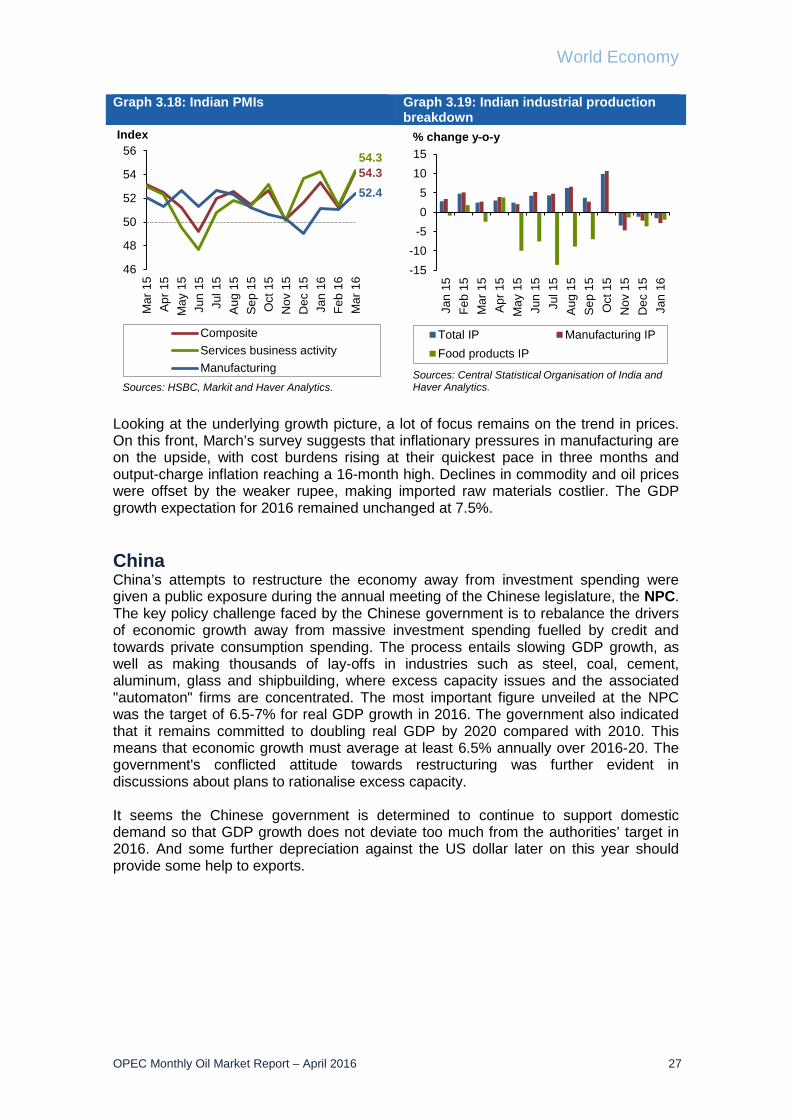
Looking at the underlying growth picture, a lot of focus remains on the trend in prices. On this front, March’s survey suggests that inflationary pressures in manufacturing are on the upside, with cost burdens rising at their quickest pace in three months and output-charge inflation reaching a 16-month high. Declines in commodity and oil prices were offset by the weaker rupee, making imported raw materials costlier. The GDP growth expectation for 2016 remained unchanged at 7.5%. China China’s attempts to restructure the economy away from investment spending were given a public exposure during the annual meeting of the Chinese legislature, the NPC. The key policy challenge faced by the Chinese government is to rebalance the drivers of economic growth away from massive investment spending fuelled by credit and towards private consumption spending. The process entails slowing GDP growth, as well as making thousands of lay-offs in industries such as steel, coal, cement, aluminum, glass and shipbuilding, where excess capacity issues and the associated "automaton" firms are concentrated. The most important figure unveiled at the NPC was the target of 6.5-7% for real GDP growth in 2016. The government also indicated that it remains committed to doubling real GDP by 2020 compared with 2010. This means that economic growth must average at least 6.5% annually over 2016-20. The government's conflicted attitude towards restructuring was further evident in discussions about plans to rationalise excess capacity. It seems the Chinese government is determined to continue to support domestic demand so that GDP growth does not deviate too much from the authorities’ target in 2016. And some further depreciation against the US dollar later on this year should provide some help to exports.
54.354.3
52.4
46
48
50
52
54
56M
ar 1
5A
pr 1
5M
ay 1
5Ju
n 15
Jul 1
5A
ug 1
5S
ep 1
5O
ct 1
5N
ov 1
5D
ec 1
5Ja
n 16
Feb
16M
ar 1
6
Index
CompositeServices business activityManufacturing
Sources: HSBC, Markit and Haver Analytics.
-15-10
-505
1015
Jan
15Fe
b 15
Mar
15
Apr
15
May
15
Jun
15Ju
l 15
Aug
15
Sep
15
Oct
15
Nov
15
Dec
15
Jan
16
Total IP Manufacturing IPFood products IP
Sources: Central Statistical Organisation of India and Haver Analytics.
% change y-o-y

World Economy
28 OPEC Monthly Oil Market Report – April 2016
Table 6.3: Chinese Five-Year Plan selected economic development targets
China's 13th FYP, which will shape economic planning and policy over the coming five years, was finalised and released in mid-March. The outlook of the document places considerable emphasis on growth in services and consumption, and stricter environmental standards, aligning with ongoing trends and projecting that they will persist for years to come. The government plan also places considerable emphasis on reducing operating costs for businesses, as a growth-promotion strategy simultaneously reduces employer and social insurance contributions, while also cutting taxes, fees, and payroll expenses. Graph 3.20: Chinese GDP growth rate, SAAR
Graph 3.21: Contributions to Chinese GDP growth
According to the latest data from China’s NBS, the country’s industrial profits grew by 4.8% y-o-y in the first two months of 2016, the first expansion recorded over the past year. According to the official announcement, the improvement is largely due to the extremely low base seen in the same period last year with a 4.2% y-o-y contraction. Moreover, a slower contraction in the producer price index (PPI) and a recovery in
6.8
7.7 7.7
7.3
6.9
6.0
6.4
6.8
7.2
7.6
8.0
8.4
1Q 1
22Q
12
3Q 1
24Q
12
1Q 1
32Q
13
3Q 1
34Q
13
1Q 1
42Q
14
3Q 1
44Q
14
1Q 1
52Q
15
3Q 1
54Q
15
Sources: China's National Bureau of Statistics and Haver Analytics.
% change y-o-y
4.6
2.5
-0.2-202468
10
4Q 1
3
1Q 1
4
2Q 1
4
3Q 1
4
4Q 1
4
1Q 1
5
2Q 1
5
3Q 1
5
4Q 1
5
Net exports of goods and servicesGross capital formationFinal consumption expenditure
Sources: China National Bureau of Statistics andHaver Analytics.
% change y-o-y
12th Actual 13th Unit2011-15 2011-15 2016-20
Nominal GDP 55.8 67.7 >92.7 CN¥ trillionAnnual real GDP growth 7.0 7.8 6.5 %Tertiary sector as a proportion of GDP 47.0 50.6 56.0 %
Urbanisation rate 51.5 56.1 >60 %Urban household registration (hukou) rate na 39.9 45.0 %Urban job creation 45 64 50 millionConstruction of affordable housing units 36 27 na million
R&D spending as a proportion of GDP 2.2 2.1 2.5 %Reduction in carbon emissions per unit of GDP 17.0 20.0 18.0 %Reduction in energy consumption per unit of GDP 16.0 18.2 15.0 %Farmland reserves 1.85 1.86 1.86 Mu* billionForest coverage rate 21.66 21.66 23.04 %
Note: * 1 Mu = 666.7 square metres.Sources: IHS Energy and Xinhua News Agency.
Five-Year Plan targets
World Economy
OPEC Monthly Oil Market Report – April 2016 29
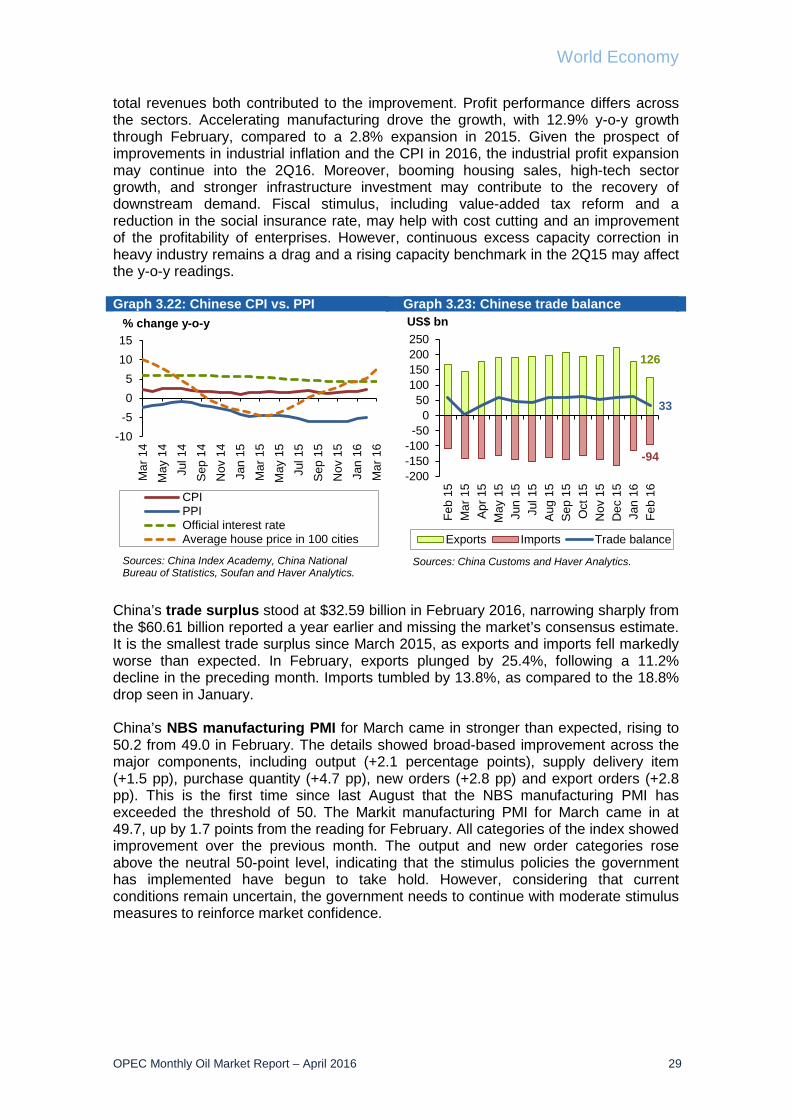
total revenues both contributed to the improvement. Profit performance differs across the sectors. Accelerating manufacturing drove the growth, with 12.9% y-o-y growth through February, compared to a 2.8% expansion in 2015. Given the prospect of improvements in industrial inflation and the CPI in 2016, the industrial profit expansion may continue into the 2Q16. Moreover, booming housing sales, high-tech sector growth, and stronger infrastructure investment may contribute to the recovery of downstream demand. Fiscal stimulus, including value-added tax reform and a reduction in the social insurance rate, may help with cost cutting and an improvement of the profitability of enterprises. However, continuous excess capacity correction in heavy industry remains a drag and a rising capacity benchmark in the 2Q15 may affect the y-o-y readings. Graph 3.22: Chinese CPI vs. PPI Graph 3.23: Chinese trade balance
China’s trade surplus stood at $32.59 billion in February 2016, narrowing sharply from the $60.61 billion reported a year earlier and missing the market’s consensus estimate. It is the smallest trade surplus since March 2015, as exports and imports fell markedly worse than expected. In February, exports plunged by 25.4%, following a 11.2% decline in the preceding month. Imports tumbled by 13.8%, as compared to the 18.8% drop seen in January. China’s NBS manufacturing PMI for March came in stronger than expected, rising to 50.2 from 49.0 in February. The details showed broad-based improvement across the major components, including output (+2.1 percentage points), supply delivery item (+1.5 pp), purchase quantity (+4.7 pp), new orders (+2.8 pp) and export orders (+2.8 pp). This is the first time since last August that the NBS manufacturing PMI has exceeded the threshold of 50. The Markit manufacturing PMI for March came in at 49.7, up by 1.7 points from the reading for February. All categories of the index showed improvement over the previous month. The output and new order categories rose above the neutral 50-point level, indicating that the stimulus policies the government has implemented have begun to take hold. However, considering that current conditions remain uncertain, the government needs to continue with moderate stimulus measures to reinforce market confidence.
-10-505
1015
Mar
14
May
14
Jul 1
4Se
p 14
Nov
14
Jan
15M
ar 1
5M
ay 1
5Ju
l 15
Sep
15N
ov 1
5Ja
n 16
Mar
16
CPIPPIOfficial interest rateAverage house price in 100 cities
Sources: China Index Academy, China National Bureau of Statistics, Soufan and Haver Analytics.
% change y-o-y
126
-94
33
-200-150-100
-500
50100150200250
Feb
15M
ar 1
5A
pr 1
5M
ay 1
5Ju
n 15
Jul 1
5A
ug 1
5S
ep 1
5O
ct 1
5N
ov 1
5D
ec 1
5Ja
n 16
Feb
16
US$ bn
Exports Imports Trade balance
Sources: China Customs and Haver Analytics.
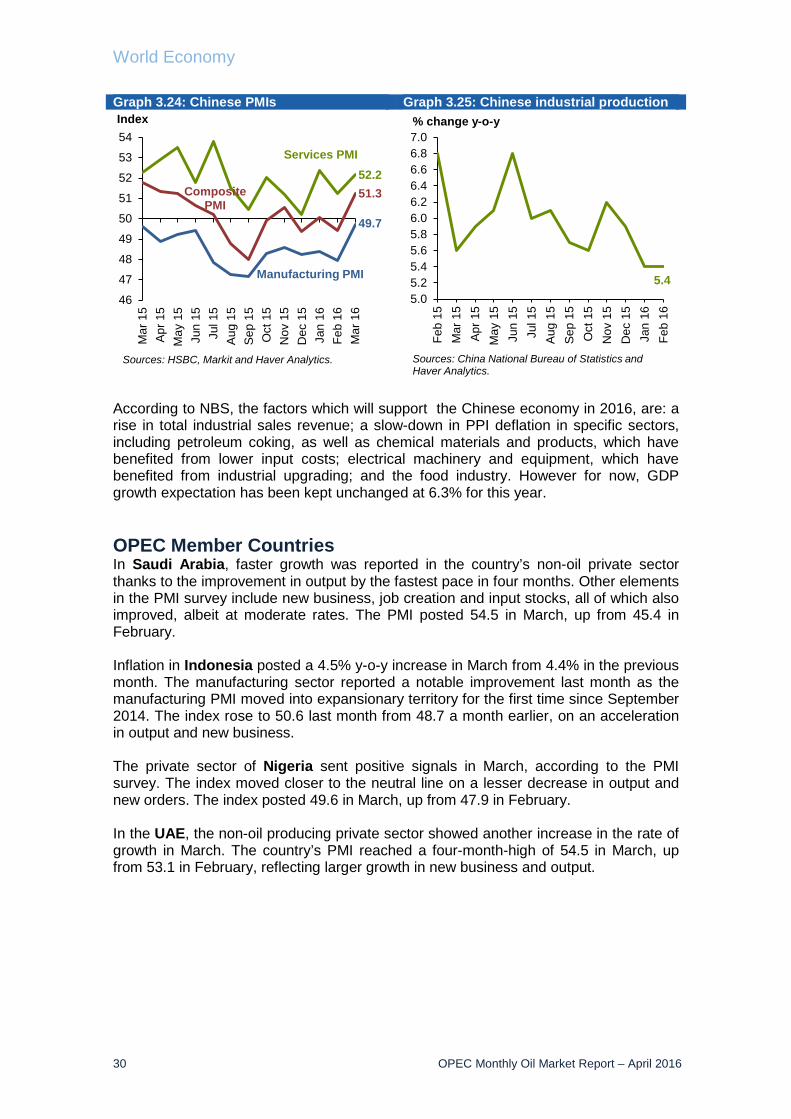
World Economy
30 OPEC Monthly Oil Market Report – April 2016
Graph 3.24: Chinese PMIs Graph 3.25: Chinese industrial production
According to NBS, the factors which will support the Chinese economy in 2016, are: a rise in total industrial sales revenue; a slow-down in PPI deflation in specific sectors, including petroleum coking, as well as chemical materials and products, which have benefited from lower input costs; electrical machinery and equipment, which have benefited from industrial upgrading; and the food industry. However for now, GDP growth expectation has been kept unchanged at 6.3% for this year. OPEC Member Countries In Saudi Arabia, faster growth was reported in the country’s non-oil private sector thanks to the improvement in output by the fastest pace in four months. Other elements in the PMI survey include new business, job creation and input stocks, all of which also improved, albeit at moderate rates. The PMI posted 54.5 in March, up from 45.4 in February. Inflation in Indonesia posted a 4.5% y-o-y increase in March from 4.4% in the previous month. The manufacturing sector reported a notable improvement last month as the manufacturing PMI moved into expansionary territory for the first time since September 2014. The index rose to 50.6 last month from 48.7 a month earlier, on an acceleration in output and new business. The private sector of Nigeria sent positive signals in March, according to the PMI survey. The index moved closer to the neutral line on a lesser decrease in output and new orders. The index posted 49.6 in March, up from 47.9 in February. In the UAE, the non-oil producing private sector showed another increase in the rate of growth in March. The country’s PMI reached a four-month-high of 54.5 in March, up from 53.1 in February, reflecting larger growth in new business and output.
51.3
49.7
52.2
46
47
48
49
50
51
52
53
54M
ar 1
5A
pr 1
5M
ay 1
5Ju
n 15
Jul 1
5A
ug 1
5S
ep 1
5O
ct 1
5N
ov 1
5D
ec 1
5Ja
n 16
Feb
16M
ar 1
6
Index
Sources: HSBC, Markit and Haver Analytics.
CompositePMI
Manufacturing PMI
Services PMI
5.45.05.25.45.65.86.06.26.46.66.87.0
Feb
15M
ar 1
5Ap
r 15
May
15
Jun
15Ju
l 15
Aug
15Se
p 15
Oct
15
Nov
15
Dec
15
Jan
16Fe
b 16
% change y-o-y
Sources: China National Bureau of Statistics and Haver Analytics.
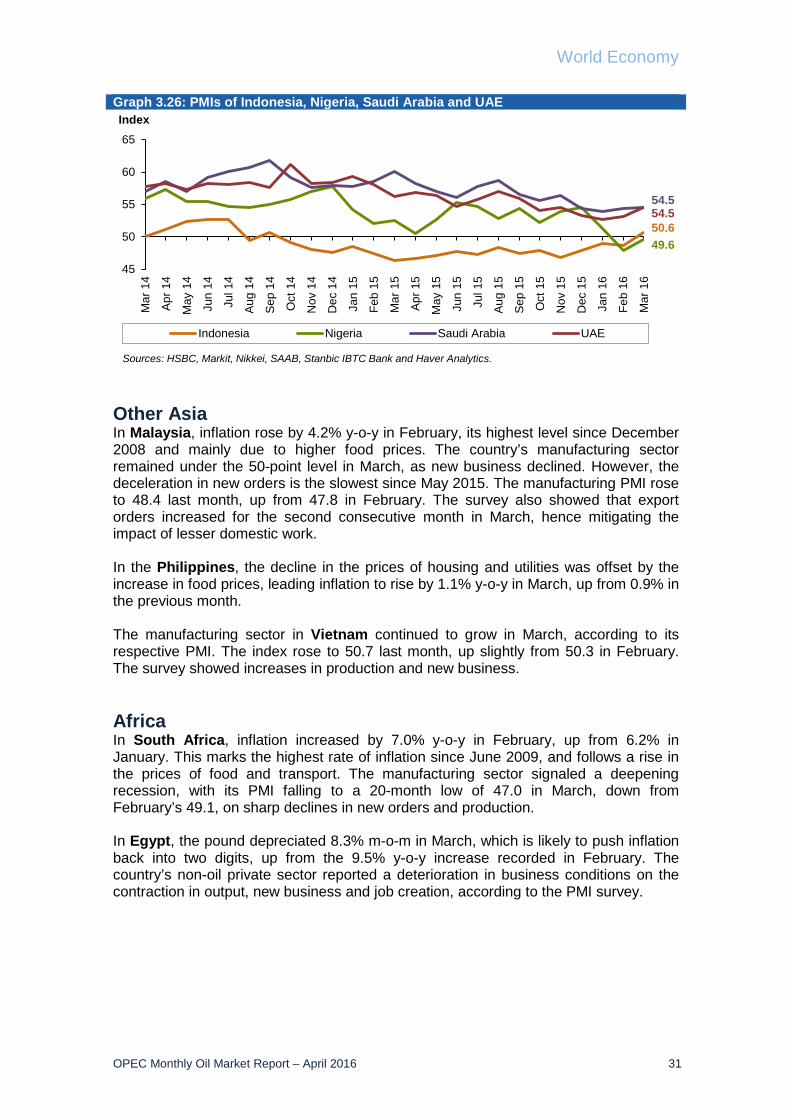
World Economy
OPEC Monthly Oil Market Report – April 2016 31
Graph 3.26: PMIs of Indonesia, Nigeria, Saudi Arabia and UAE
Other Asia In Malaysia, inflation rose by 4.2% y-o-y in February, its highest level since December 2008 and mainly due to higher food prices. The country’s manufacturing sector remained under the 50-point level in March, as new business declined. However, the deceleration in new orders is the slowest since May 2015. The manufacturing PMI rose to 48.4 last month, up from 47.8 in February. The survey also showed that export orders increased for the second consecutive month in March, hence mitigating the impact of lesser domestic work. In the Philippines, the decline in the prices of housing and utilities was offset by the increase in food prices, leading inflation to rise by 1.1% y-o-y in March, up from 0.9% in the previous month. The manufacturing sector in Vietnam continued to grow in March, according to its respective PMI. The index rose to 50.7 last month, up slightly from 50.3 in February. The survey showed increases in production and new business. Africa In South Africa, inflation increased by 7.0% y-o-y in February, up from 6.2% in January. This marks the highest rate of inflation since June 2009, and follows a rise in the prices of food and transport. The manufacturing sector signaled a deepening recession, with its PMI falling to a 20-month low of 47.0 in March, down from February’s 49.1, on sharp declines in new orders and production. In Egypt, the pound depreciated 8.3% m-o-m in March, which is likely to push inflation back into two digits, up from the 9.5% y-o-y increase recorded in February. The country’s non-oil private sector reported a deterioration in business conditions on the contraction in output, new business and job creation, according to the PMI survey.
50.649.6
54.554.5
45
50
55
60
65M
ar 1
4
Apr 1
4
May
14
Jun
14
Jul 1
4
Aug
14
Sep
14
Oct
14
Nov
14
Dec
14
Jan
15
Feb
15
Mar
15
Apr 1
5
May
15
Jun
15
Jul 1
5
Aug
15
Sep
15
Oct
15
Nov
15
Dec
15
Jan
16
Feb
16
Mar
16
Index
Indonesia Nigeria Saudi Arabia UAE
Sources: HSBC, Markit, Nikkei, SAAB, Stanbic IBTC Bank and Haver Analytics.
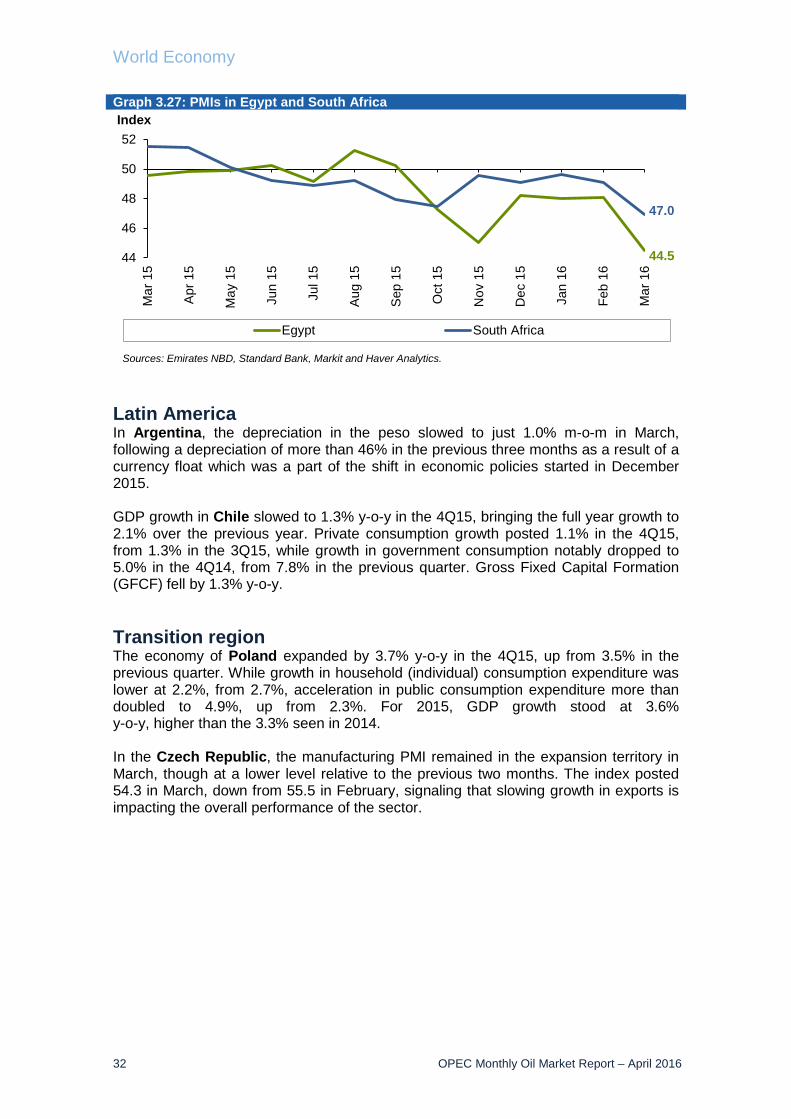
World Economy
32 OPEC Monthly Oil Market Report – April 2016
Graph 3.27: PMIs in Egypt and South Africa
Latin America In Argentina, the depreciation in the peso slowed to just 1.0% m-o-m in March, following a depreciation of more than 46% in the previous three months as a result of a currency float which was a part of the shift in economic policies started in December 2015. GDP growth in Chile slowed to 1.3% y-o-y in the 4Q15, bringing the full year growth to 2.1% over the previous year. Private consumption growth posted 1.1% in the 4Q15, from 1.3% in the 3Q15, while growth in government consumption notably dropped to 5.0% in the 4Q14, from 7.8% in the previous quarter. Gross Fixed Capital Formation (GFCF) fell by 1.3% y-o-y. Transition region The economy of Poland expanded by 3.7% y-o-y in the 4Q15, up from 3.5% in the previous quarter. While growth in household (individual) consumption expenditure was lower at 2.2%, from 2.7%, acceleration in public consumption expenditure more than doubled to 4.9%, up from 2.3%. For 2015, GDP growth stood at 3.6% y-o-y, higher than the 3.3% seen in 2014. In the Czech Republic, the manufacturing PMI remained in the expansion territory in March, though at a lower level relative to the previous two months. The index posted 54.3 in March, down from 55.5 in February, signaling that slowing growth in exports is impacting the overall performance of the sector.
44.5
47.0
44
46
48
50
52M
ar 1
5
Apr
15
May
15
Jun
15
Jul 1
5
Aug
15
Sep
15
Oct
15
Nov
15
Dec
15
Jan
16
Feb
16
Mar
16
Index
Egypt South Africa
Sources: Emirates NBD, Standard Bank, Markit and Haver Analytics.
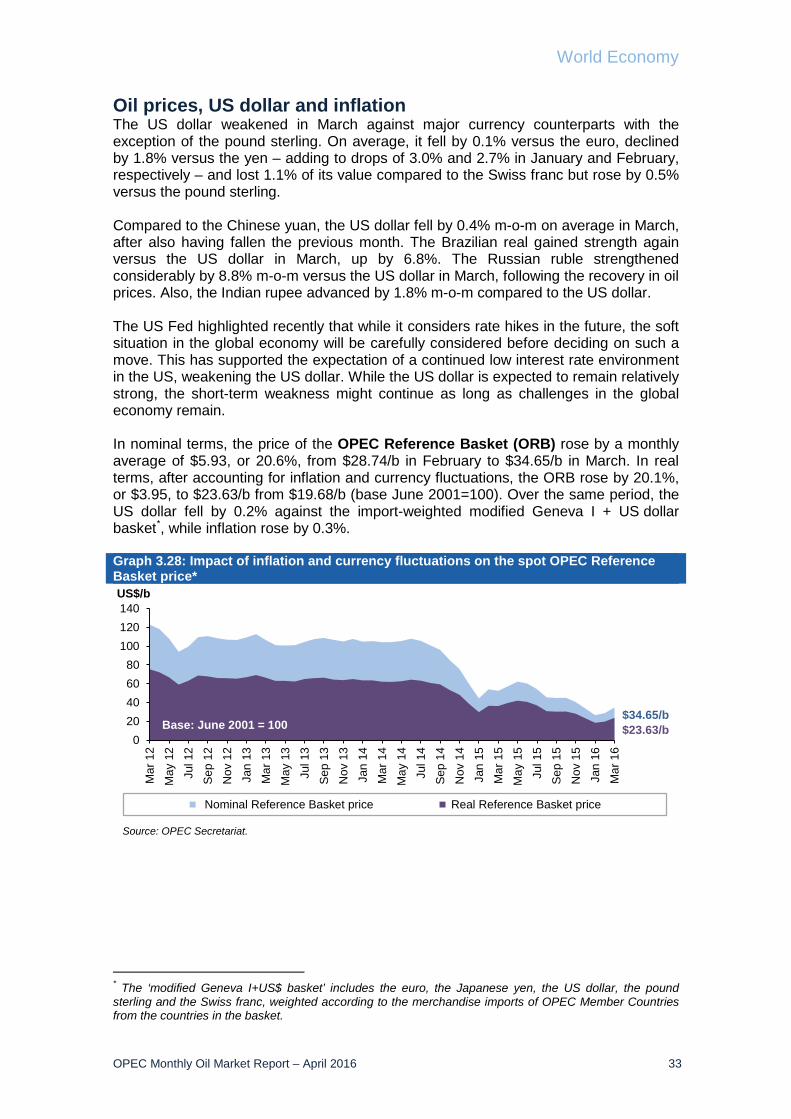
World Economy
OPEC Monthly Oil Market Report – April 2016 33
Oil prices, US dollar and inflation The US dollar weakened in March against major currency counterparts with the exception of the pound sterling. On average, it fell by 0.1% versus the euro, declined by 1.8% versus the yen – adding to drops of 3.0% and 2.7% in January and February, respectively – and lost 1.1% of its value compared to the Swiss franc but rose by 0.5% versus the pound sterling. Compared to the Chinese yuan, the US dollar fell by 0.4% m-o-m on average in March, after also having fallen the previous month. The Brazilian real gained strength again versus the US dollar in March, up by 6.8%. The Russian ruble strengthened considerably by 8.8% m-o-m versus the US dollar in March, following the recovery in oil prices. Also, the Indian rupee advanced by 1.8% m-o-m compared to the US dollar. The US Fed highlighted recently that while it considers rate hikes in the future, the soft situation in the global economy will be carefully considered before deciding on such a move. This has supported the expectation of a continued low interest rate environment in the US, weakening the US dollar. While the US dollar is expected to remain relatively strong, the short-term weakness might continue as long as challenges in the global economy remain. In nominal terms, the price of the OPEC Reference Basket (ORB) rose by a monthly average of $5.93, or 20.6%, from $28.74/b in February to $34.65/b in March. In real terms, after accounting for inflation and currency fluctuations, the ORB rose by 20.1%, or $3.95, to $23.63/b from $19.68/b (base June 2001=100). Over the same period, the US dollar fell by 0.2% against the import-weighted modified Geneva I + US dollar basket*, while inflation rose by 0.3%. Graph 3.28: Impact of inflation and currency fluctuations on the spot OPEC Reference Basket price*
* The ‘modified Geneva I+US$ basket’ includes the euro, the Japanese yen, the US dollar, the pound sterling and the Swiss franc, weighted according to the merchandise imports of OPEC Member Countries from the countries in the basket.
020406080
100120140
Mar
12
May
12
Jul 1
2Se
p 12
Nov
12
Jan
13M
ar 1
3M
ay 1
3Ju
l 13
Sep
13N
ov 1
3Ja
n 14
Mar
14
May
14
Jul 1
4Se
p 14
Nov
14
Jan
15M
ar 1
5M
ay 1
5Ju
l 15
Sep
15N
ov 1
5Ja
n 16
Mar
16
US$/b
Nominal Reference Basket price Real Reference Basket price
Source: OPEC Secretariat.
Base: June 2001 = 100$34.65/b$23.63/b
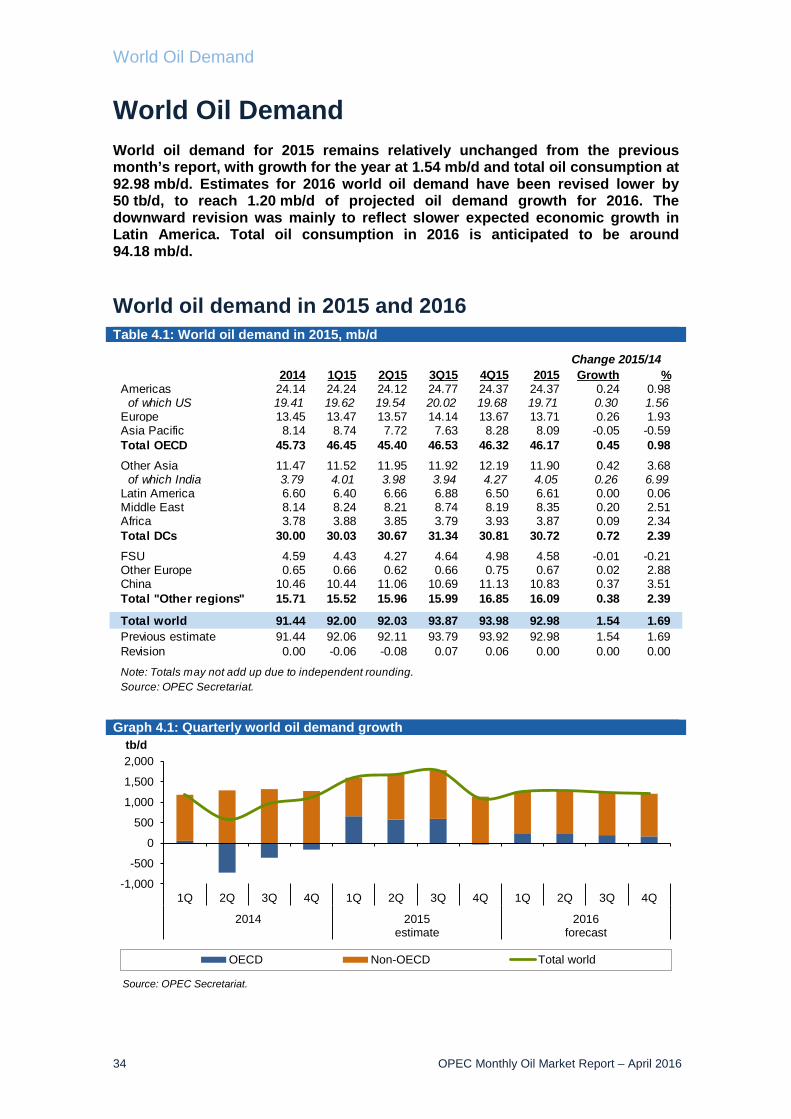
World Oil Demand
34 OPEC Monthly Oil Market Report – April 2016
World Oil Demand World oil demand for 2015 remains relatively unchanged from the previous month’s report, with growth for the year at 1.54 mb/d and total oil consumption at 92.98 mb/d. Estimates for 2016 world oil demand have been revised lower by 50 tb/d, to reach 1.20 mb/d of projected oil demand growth for 2016. The downward revision was mainly to reflect slower expected economic growth in Latin America. Total oil consumption in 2016 is anticipated to be around 94.18 mb/d. World oil demand in 2015 and 2016
Table 4.1: World oil demand in 2015, mb/d
Graph 4.1: Quarterly world oil demand growth
-1,000
-500
0
500
1,000
1,500
2,000
1Q 2Q 3Q 4Q 1Q 2Q 3Q 4Q 1Q 2Q 3Q 4Q
2014 2015estimate
2016forecast
tb/d
OECD Non-OECD Total world
Source: OPEC Secretariat.
2014 1Q15 2Q15 3Q15 4Q15 2015 Growth %Americas 24.14 24.24 24.12 24.77 24.37 24.37 0.24 0.98 of which US 19.41 19.62 19.54 20.02 19.68 19.71 0.30 1.56Europe 13.45 13.47 13.57 14.14 13.67 13.71 0.26 1.93Asia Pacific 8.14 8.74 7.72 7.63 8.28 8.09 -0.05 -0.59Total OECD 45.73 46.45 45.40 46.53 46.32 46.17 0.45 0.98Other Asia 11.47 11.52 11.95 11.92 12.19 11.90 0.42 3.68 of which India 3.79 4.01 3.98 3.94 4.27 4.05 0.26 6.99Latin America 6.60 6.40 6.66 6.88 6.50 6.61 0.00 0.06Middle East 8.14 8.24 8.21 8.74 8.19 8.35 0.20 2.51Africa 3.78 3.88 3.85 3.79 3.93 3.87 0.09 2.34Total DCs 30.00 30.03 30.67 31.34 30.81 30.72 0.72 2.39FSU 4.59 4.43 4.27 4.64 4.98 4.58 -0.01 -0.21Other Europe 0.65 0.66 0.62 0.66 0.75 0.67 0.02 2.88China 10.46 10.44 11.06 10.69 11.13 10.83 0.37 3.51Total "Other regions" 15.71 15.52 15.96 15.99 16.85 16.09 0.38 2.39
Total world 91.44 92.00 92.03 93.87 93.98 92.98 1.54 1.69Previous estimate 91.44 92.06 92.11 93.79 93.92 92.98 1.54 1.69Revision 0.00 -0.06 -0.08 0.07 0.06 0.00 0.00 0.00
Source: OPEC Secretariat.Note: Totals may not add up due to independent rounding.
Change 2015/14
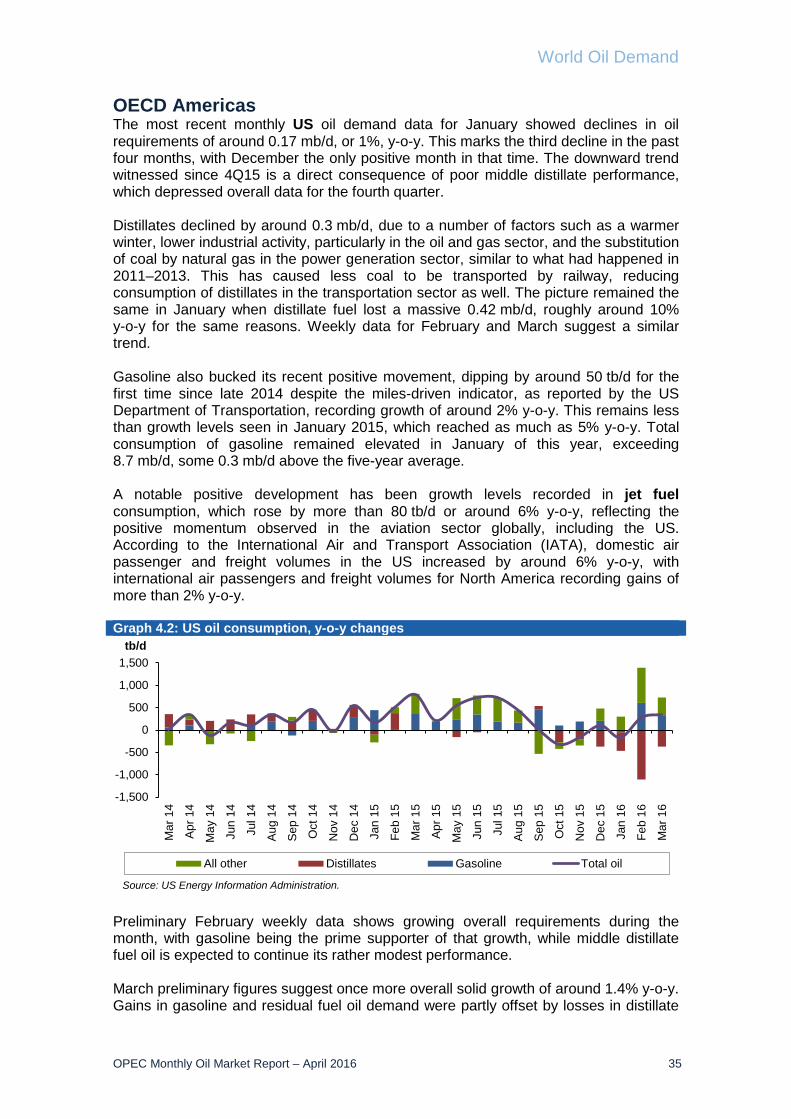
World Oil Demand
OPEC Monthly Oil Market Report – April 2016 35
OECD Americas The most recent monthly US oil demand data for January showed declines in oil requirements of around 0.17 mb/d, or 1%, y-o-y. This marks the third decline in the past four months, with December the only positive month in that time. The downward trend witnessed since 4Q15 is a direct consequence of poor middle distillate performance, which depressed overall data for the fourth quarter. Distillates declined by around 0.3 mb/d, due to a number of factors such as a warmer winter, lower industrial activity, particularly in the oil and gas sector, and the substitution of coal by natural gas in the power generation sector, similar to what had happened in 2011–2013. This has caused less coal to be transported by railway, reducing consumption of distillates in the transportation sector as well. The picture remained the same in January when distillate fuel lost a massive 0.42 mb/d, roughly around 10% y-o-y for the same reasons. Weekly data for February and March suggest a similar trend. Gasoline also bucked its recent positive movement, dipping by around 50 tb/d for the first time since late 2014 despite the miles-driven indicator, as reported by the US Department of Transportation, recording growth of around 2% y-o-y. This remains less than growth levels seen in January 2015, which reached as much as 5% y-o-y. Total consumption of gasoline remained elevated in January of this year, exceeding 8.7 mb/d, some 0.3 mb/d above the five-year average. A notable positive development has been growth levels recorded in jet fuel consumption, which rose by more than 80 tb/d or around 6% y-o-y, reflecting the positive momentum observed in the aviation sector globally, including the US. According to the International Air and Transport Association (IATA), domestic air passenger and freight volumes in the US increased by around 6% y-o-y, with international air passengers and freight volumes for North America recording gains of more than 2% y-o-y. Graph 4.2: US oil consumption, y-o-y changes
Preliminary February weekly data shows growing overall requirements during the month, with gasoline being the prime supporter of that growth, while middle distillate fuel oil is expected to continue its rather modest performance. March preliminary figures suggest once more overall solid growth of around 1.4% y-o-y. Gains in gasoline and residual fuel oil demand were partly offset by losses in distillate
-1,500
-1,000
-500
0
500
1,000
1,500
Mar
14
Apr
14
May
14
Jun
14
Jul 1
4
Aug
14
Sep
14
Oct
14
Nov
14
Dec
14
Jan
15
Feb
15
Mar
15
Apr
15
May
15
Jun
15
Jul 1
5
Aug
15
Sep
15
Oct
15
Nov
15
Dec
15
Jan
16
Feb
16
Mar
16
tb/d
All other Distillates Gasoline Total oil
Source: US Energy Information Administration.
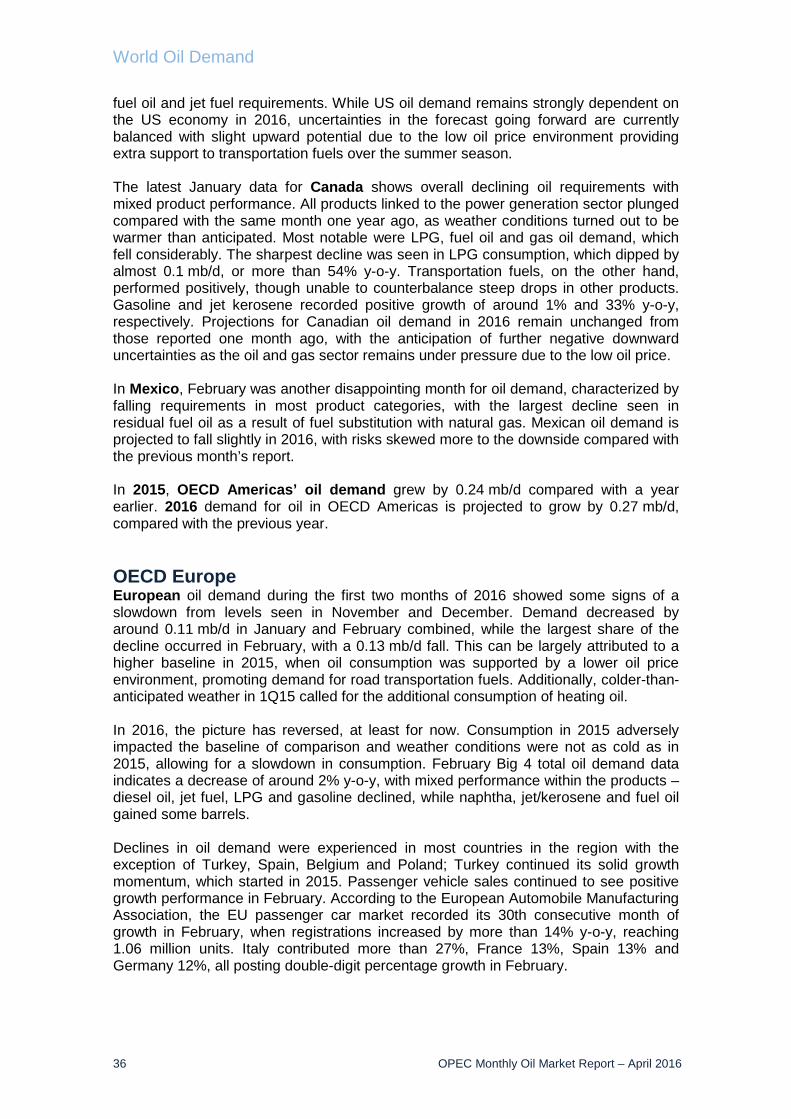
World Oil Demand
36 OPEC Monthly Oil Market Report – April 2016
fuel oil and jet fuel requirements. While US oil demand remains strongly dependent on the US economy in 2016, uncertainties in the forecast going forward are currently balanced with slight upward potential due to the low oil price environment providing extra support to transportation fuels over the summer season. The latest January data for Canada shows overall declining oil requirements with mixed product performance. All products linked to the power generation sector plunged compared with the same month one year ago, as weather conditions turned out to be warmer than anticipated. Most notable were LPG, fuel oil and gas oil demand, which fell considerably. The sharpest decline was seen in LPG consumption, which dipped by almost 0.1 mb/d, or more than 54% y-o-y. Transportation fuels, on the other hand, performed positively, though unable to counterbalance steep drops in other products. Gasoline and jet kerosene recorded positive growth of around 1% and 33% y-o-y, respectively. Projections for Canadian oil demand in 2016 remain unchanged from those reported one month ago, with the anticipation of further negative downward uncertainties as the oil and gas sector remains under pressure due to the low oil price. In Mexico, February was another disappointing month for oil demand, characterized by falling requirements in most product categories, with the largest decline seen in residual fuel oil as a result of fuel substitution with natural gas. Mexican oil demand is projected to fall slightly in 2016, with risks skewed more to the downside compared with the previous month’s report. In 2015, OECD Americas’ oil demand grew by 0.24 mb/d compared with a year earlier. 2016 demand for oil in OECD Americas is projected to grow by 0.27 mb/d, compared with the previous year. OECD Europe European oil demand during the first two months of 2016 showed some signs of a slowdown from levels seen in November and December. Demand decreased by around 0.11 mb/d in January and February combined, while the largest share of the decline occurred in February, with a 0.13 mb/d fall. This can be largely attributed to a higher baseline in 2015, when oil consumption was supported by a lower oil price environment, promoting demand for road transportation fuels. Additionally, colder-than-anticipated weather in 1Q15 called for the additional consumption of heating oil. In 2016, the picture has reversed, at least for now. Consumption in 2015 adversely impacted the baseline of comparison and weather conditions were not as cold as in 2015, allowing for a slowdown in consumption. February Big 4 total oil demand data indicates a decrease of around 2% y-o-y, with mixed performance within the products – diesel oil, jet fuel, LPG and gasoline declined, while naphtha, jet/kerosene and fuel oil gained some barrels. Declines in oil demand were experienced in most countries in the region with the exception of Turkey, Spain, Belgium and Poland; Turkey continued its solid growth momentum, which started in 2015. Passenger vehicle sales continued to see positive growth performance in February. According to the European Automobile Manufacturing Association, the EU passenger car market recorded its 30th consecutive month of growth in February, when registrations increased by more than 14% y-o-y, reaching 1.06 million units. Italy contributed more than 27%, France 13%, Spain 13% and Germany 12%, all posting double-digit percentage growth in February.
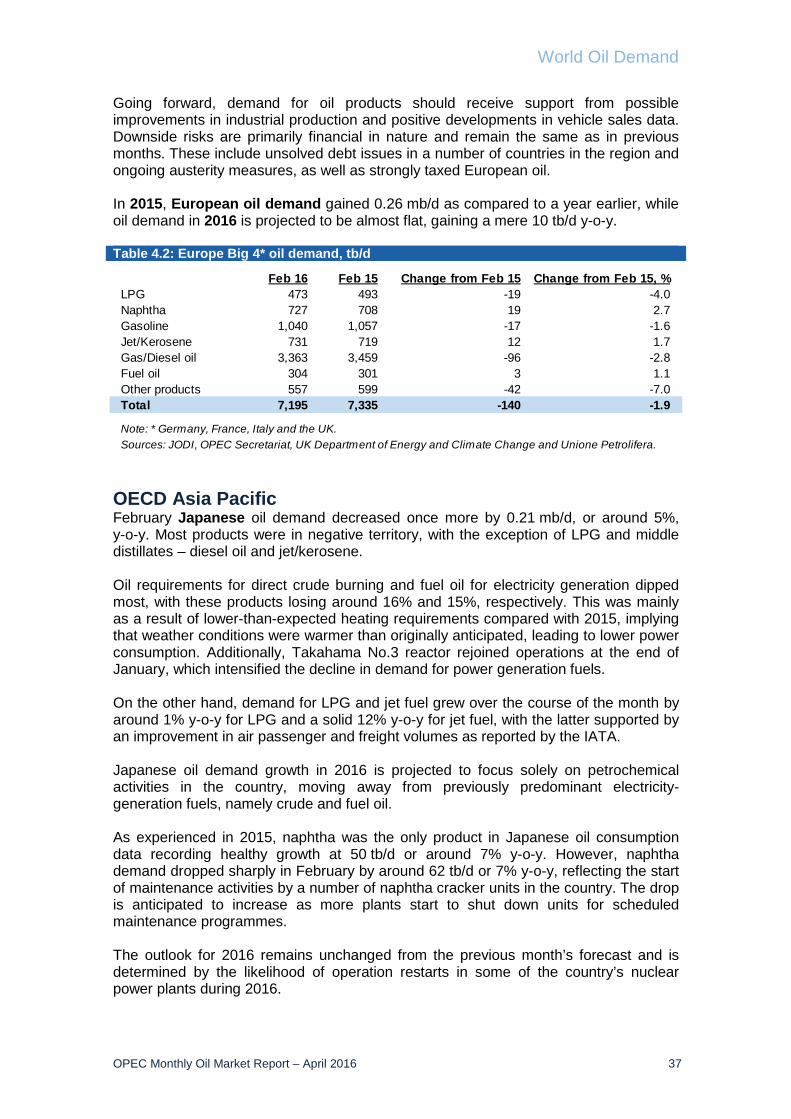
World Oil Demand
OPEC Monthly Oil Market Report – April 2016 37
Going forward, demand for oil products should receive support from possible improvements in industrial production and positive developments in vehicle sales data. Downside risks are primarily financial in nature and remain the same as in previous months. These include unsolved debt issues in a number of countries in the region and ongoing austerity measures, as well as strongly taxed European oil. In 2015, European oil demand gained 0.26 mb/d as compared to a year earlier, while oil demand in 2016 is projected to be almost flat, gaining a mere 10 tb/d y-o-y. Table 4.2: Europe Big 4* oil demand, tb/d
OECD Asia Pacific February Japanese oil demand decreased once more by 0.21 mb/d, or around 5%, y-o-y. Most products were in negative territory, with the exception of LPG and middle distillates – diesel oil and jet/kerosene. Oil requirements for direct crude burning and fuel oil for electricity generation dipped most, with these products losing around 16% and 15%, respectively. This was mainly as a result of lower-than-expected heating requirements compared with 2015, implying that weather conditions were warmer than originally anticipated, leading to lower power consumption. Additionally, Takahama No.3 reactor rejoined operations at the end of January, which intensified the decline in demand for power generation fuels. On the other hand, demand for LPG and jet fuel grew over the course of the month by around 1% y-o-y for LPG and a solid 12% y-o-y for jet fuel, with the latter supported by an improvement in air passenger and freight volumes as reported by the IATA. Japanese oil demand growth in 2016 is projected to focus solely on petrochemical activities in the country, moving away from previously predominant electricity-generation fuels, namely crude and fuel oil. As experienced in 2015, naphtha was the only product in Japanese oil consumption data recording healthy growth at 50 tb/d or around 7% y-o-y. However, naphtha demand dropped sharply in February by around 62 tb/d or 7% y-o-y, reflecting the start of maintenance activities by a number of naphtha cracker units in the country. The drop is anticipated to increase as more plants start to shut down units for scheduled maintenance programmes. The outlook for 2016 remains unchanged from the previous month’s forecast and is determined by the likelihood of operation restarts in some of the country’s nuclear power plants during 2016.
Feb 16 Feb 15 Change from Feb 15 Change from Feb 15, %LPG 473 493 -19 -4.0Naphtha 727 708 19 2.7Gasoline 1,040 1,057 -17 -1.6Jet/Kerosene 731 719 12 1.7Gas/Diesel oil 3,363 3,459 -96 -2.8Fuel oil 304 301 3 1.1Other products 557 599 -42 -7.0Total 7,195 7,335 -140 -1.9
Note: * Germany, France, Italy and the UK.Sources: JODI, OPEC Secretariat, UK Department of Energy and Climate Change and Unione Petrolifera.
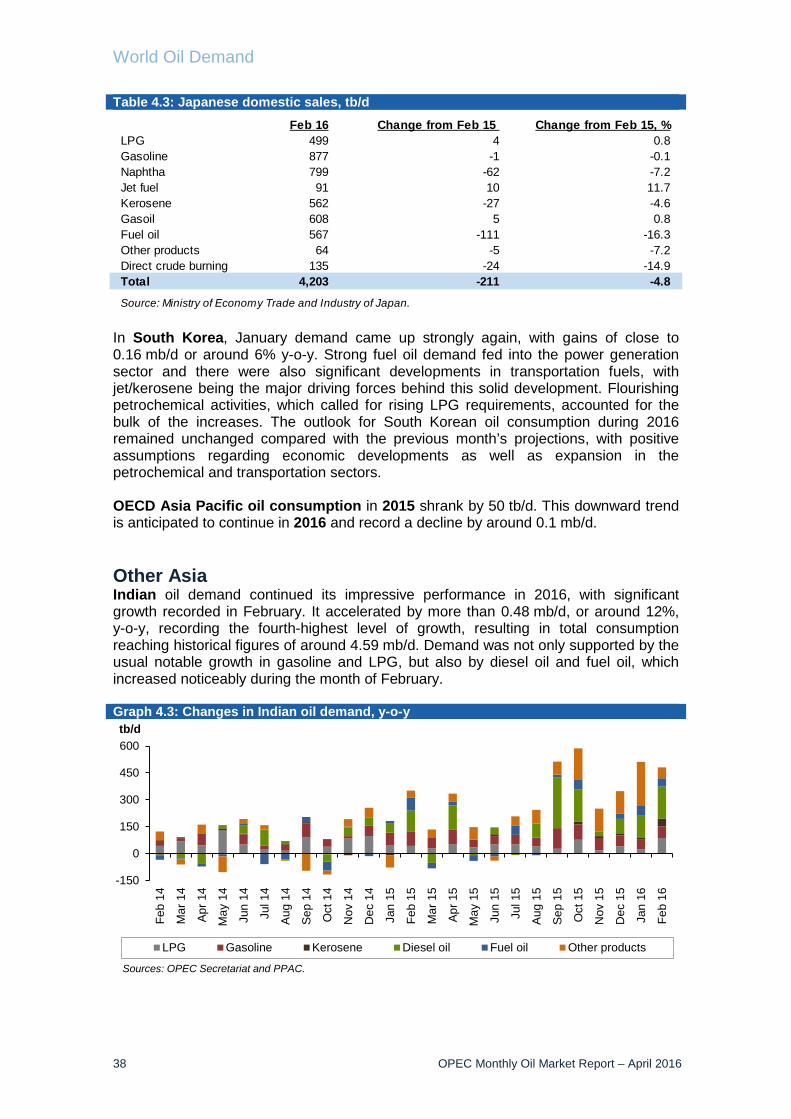
World Oil Demand
38 OPEC Monthly Oil Market Report – April 2016
Table 4.3: Japanese domestic sales, tb/d
In South Korea, January demand came up strongly again, with gains of close to 0.16 mb/d or around 6% y-o-y. Strong fuel oil demand fed into the power generation sector and there were also significant developments in transportation fuels, with jet/kerosene being the major driving forces behind this solid development. Flourishing petrochemical activities, which called for rising LPG requirements, accounted for the bulk of the increases. The outlook for South Korean oil consumption during 2016 remained unchanged compared with the previous month’s projections, with positive assumptions regarding economic developments as well as expansion in the petrochemical and transportation sectors. OECD Asia Pacific oil consumption in 2015 shrank by 50 tb/d. This downward trend is anticipated to continue in 2016 and record a decline by around 0.1 mb/d. Other Asia Indian oil demand continued its impressive performance in 2016, with significant growth recorded in February. It accelerated by more than 0.48 mb/d, or around 12%, y-o-y, recording the fourth-highest level of growth, resulting in total consumption reaching historical figures of around 4.59 mb/d. Demand was not only supported by the usual notable growth in gasoline and LPG, but also by diesel oil and fuel oil, which increased noticeably during the month of February. Graph 4.3: Changes in Indian oil demand, y-o-y
-150
0
150
300
450
600
Feb
14
Mar
14
Apr
14
May
14
Jun
14
Jul 1
4
Aug
14
Sep
14
Oct
14
Nov
14
Dec
14
Jan
15
Feb
15
Mar
15
Apr
15
May
15
Jun
15
Jul 1
5
Aug
15
Sep
15
Oct
15
Nov
15
Dec
15
Jan
16
Feb
16
tb/d
LPG Gasoline Kerosene Diesel oil Fuel oil Other products
Sources: OPEC Secretariat and PPAC.
Feb 16 Change from Feb 15 Change from Feb 15, %LPG 499 4 0.8Gasoline 877 -1 -0.1Naphtha 799 -62 -7.2Jet fuel 91 10 11.7Kerosene 562 -27 -4.6Gasoil 608 5 0.8Fuel oil 567 -111 -16.3Other products 64 -5 -7.2Direct crude burning 135 -24 -14.9Total 4,203 -211 -4.8
Source: Ministry of Economy Trade and Industry of Japan.
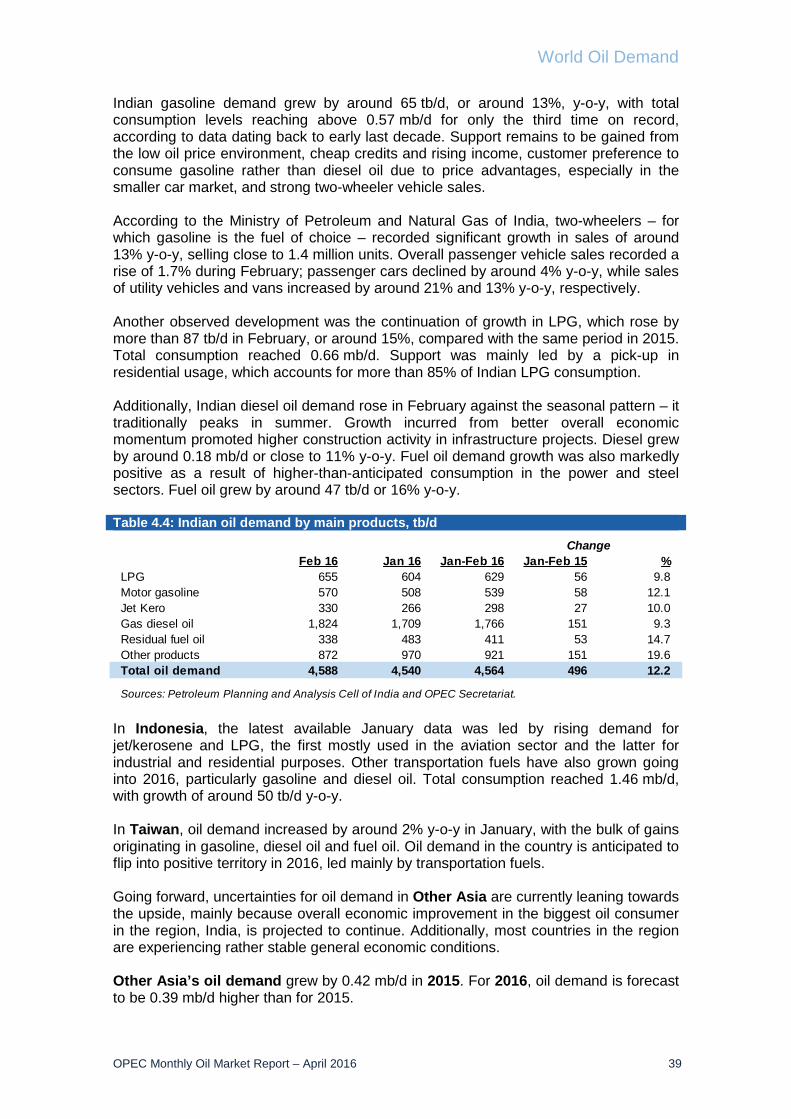
World Oil Demand
OPEC Monthly Oil Market Report – April 2016 39
Indian gasoline demand grew by around 65 tb/d, or around 13%, y-o-y, with total consumption levels reaching above 0.57 mb/d for only the third time on record, according to data dating back to early last decade. Support remains to be gained from the low oil price environment, cheap credits and rising income, customer preference to consume gasoline rather than diesel oil due to price advantages, especially in the smaller car market, and strong two-wheeler vehicle sales. According to the Ministry of Petroleum and Natural Gas of India, two-wheelers – for which gasoline is the fuel of choice – recorded significant growth in sales of around 13% y-o-y, selling close to 1.4 million units. Overall passenger vehicle sales recorded a rise of 1.7% during February; passenger cars declined by around 4% y-o-y, while sales of utility vehicles and vans increased by around 21% and 13% y-o-y, respectively. Another observed development was the continuation of growth in LPG, which rose by more than 87 tb/d in February, or around 15%, compared with the same period in 2015. Total consumption reached 0.66 mb/d. Support was mainly led by a pick-up in residential usage, which accounts for more than 85% of Indian LPG consumption. Additionally, Indian diesel oil demand rose in February against the seasonal pattern – it traditionally peaks in summer. Growth incurred from better overall economic momentum promoted higher construction activity in infrastructure projects. Diesel grew by around 0.18 mb/d or close to 11% y-o-y. Fuel oil demand growth was also markedly positive as a result of higher-than-anticipated consumption in the power and steel sectors. Fuel oil grew by around 47 tb/d or 16% y-o-y. Table 4.4: Indian oil demand by main products, tb/d
In Indonesia, the latest available January data was led by rising demand for jet/kerosene and LPG, the first mostly used in the aviation sector and the latter for industrial and residential purposes. Other transportation fuels have also grown going into 2016, particularly gasoline and diesel oil. Total consumption reached 1.46 mb/d, with growth of around 50 tb/d y-o-y. In Taiwan, oil demand increased by around 2% y-o-y in January, with the bulk of gains originating in gasoline, diesel oil and fuel oil. Oil demand in the country is anticipated to flip into positive territory in 2016, led mainly by transportation fuels. Going forward, uncertainties for oil demand in Other Asia are currently leaning towards the upside, mainly because overall economic improvement in the biggest oil consumer in the region, India, is projected to continue. Additionally, most countries in the region are experiencing rather stable general economic conditions. Other Asia’s oil demand grew by 0.42 mb/d in 2015. For 2016, oil demand is forecast to be 0.39 mb/d higher than for 2015.
Feb 16 Jan 16 Jan-Feb 16 Jan-Feb 15 %LPG 655 604 629 56 9.8Motor gasoline 570 508 539 58 12.1Jet Kero 330 266 298 27 10.0Gas diesel oil 1,824 1,709 1,766 151 9.3Residual fuel oil 338 483 411 53 14.7Other products 872 970 921 151 19.6Total oil demand 4,588 4,540 4,564 496 12.2
Sources: Petroleum Planning and Analysis Cell of India and OPEC Secretariat.
Change
World Oil Demand
40 OPEC Monthly Oil Market Report – April 2016
Latin America In February, oil demand in Brazil declined marginally by 16 tb/d, or around 1%, y-o-y, to average 2.34 mb/d. This decline was led by fuel oil and ethanol, which eased by around 37 tb/d each, or more than 35% and 14%, y-o-y, respectively. This reduction in fuel oil demand was attributed to improvements in hydro-power generation reducing consumption of fuel oil, as well as a higher base of comparison. Furthermore, a reduction in ethanol consumption was the result of an increase in prices for ethanol, minimizing its competitiveness against gasoline. Gasoline grew by around 52 tb/d or 8% y-o-y, minimizing the overall impact on total product demand growth. Demand for diesel increased marginally in February, adding some 14 tb/d to 2015 figures, for total consumption of 0.93 mb/d. This marginal increase occurred despite slower industrial output in various sectors, though a lower baseline was behind the gain. The other middle distillate fuel – jet/kerosene – reflected the slower momentum of the Brazilian economy, decreasing by around 6% y-o-y. However, demand for transportation fuels is in general expected to slightly pick up towards 2Q16 and 3Q16 as a result of the Olympic Games in August, which it is assumed will attract a large audience. Table 4.5: Brazilian inland deliveries, tb/d
Oil consumption in Argentina increased only marginally in January despite the growing use of transportation fuels. Fuel oil registered the most notable gain, increasing by around 23% y-o-y. Diesel oil and gasoline both grew, recording gains of more than 8% and 3% y-o-y. Total consumption remained hovering at around 0.68 mb/d and is so far anticipated to play a positive role in total Latin American oil consumption in 2016. Looking ahead, uncertainties for 2016 oil demand growth in Latin America remain much like those of the previous month, as economic conditions in Brazil are projected to remain rather slow. The low oil price environment, the Olympic Games in Brazil and any unusual weather-related conditions may bring more demand to the transportation and power generation sectors. Latin American oil demand was broadly unchanged in 2015 over a year earlier. During 2016, oil demand growth is forecast to be slightly higher than in 2015, reaching 15 tb/d of possible oil demand growth.
Feb 16 Feb 15 Change Change, %LPG 222 223 -1 -0.5Gasoline 752 700 52 7.5Jet/Kerosene 123 131 -8 -5.9Diesel 929 915 14 1.6Fuel oil 67 103 -36 -34.8Alcohol 247 285 -38 -13.4Total 2,340 2,356 -16 -0.7
Source: Agência Nacional do Petróleo, Gás Natural e Biocombustíveis of Brazil.
World Oil Demand
OPEC Monthly Oil Market Report – April 2016 41
Middle East As Saudi Arabia enters into a lower oil demand season, oil demand data for the month of February came as no surprise. Oil requirements declined during the month by around 0.15 mb/d, or about 7%, y-o-y. Total consumption was at around 2.07 mb/d. Other factors exacerbating the decline were cold and rainy weather in February, which heavily affected transportation fuel consumption, a possible reaction to subsidy reductions strongly impacting power generation consumption and the higher baseline of comparison, which affected consumption of all products. Oil requirements in Saudi Arabia usually peak during the summer season as demand for air conditioning rises, boosting total oil requirements to as much as 2.7–3.0 mb/d. Performance of all transportation fuels weakened, with the largest impact seen in diesel oil consumption, which fell by more than 10% y-o-y. Gasoline and jet/kerosene dropped at a lesser magnitude of around 5% and 3% y-o-y, respectively. Oil demand in Iraq declined in February, though only marginally. Total demand fell by around 15 tb/d, or 2%, y-o-y. All products were in a declining pattern with the exception of fuel oil, which posted solid growth of 10% y-o-y. Traditionally, oil demand in Iraq is driven by diesel oil – as both a transportation and industrial fuel – and this declined sharply in February, shedding around 23% from 2015 levels, indicating slower momentum in both the transportation and industrial sectors due to seasonality factors. Other products declined marginally below February 2015 levels. Other countries in the region showed positive performance in February. Oil demand in Kuwait increased by around 4% y-o-y, as did consumption in the UAE, which increased by a similar amount. Projections for oil demand in 2016 remain, as highlighted in the previous MOMR, highly dependent on the economic performance of major oil-producing countries in the region and measures to mitigate the impact of lower oil prices. Graph 4.4: Oil demand growth in the Middle East, y-o-y
Middle East oil demand for 2015 grew by 0.20 mb/d, and is anticipated to growth by around 0.15 mb/d in 2016.
-100
0
100
200
300
400
500
-100
0
100
200
300
400
500
1Q 2Q 3Q 4Q 1Q 2Q 3Q 4Q 1Q 2Q 3Q 4Q 1Q 2Q 3Q 4Q
2012 2013 2014 2015
tb/dtb/d
Saudi Arabia Iran, I.R. Kuwait UAE Others
Sources: Direct communication, JODI and OPEC Secretariat.
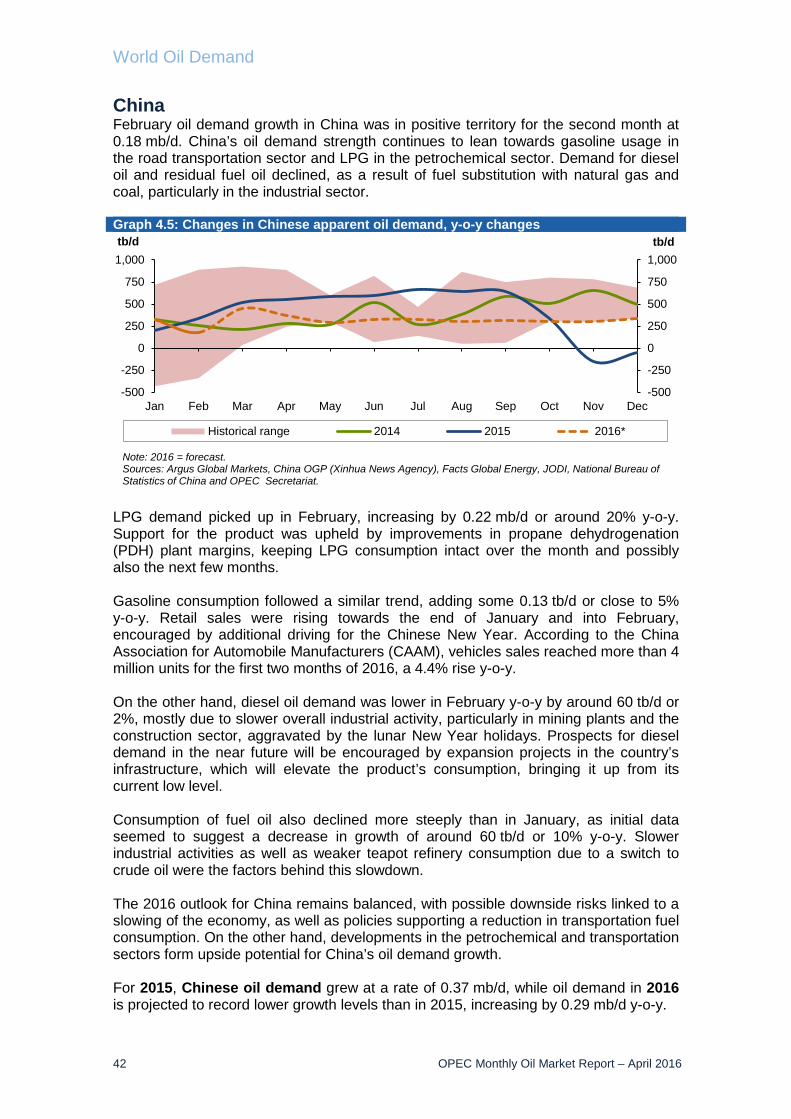
World Oil Demand
42 OPEC Monthly Oil Market Report – April 2016
China February oil demand growth in China was in positive territory for the second month at 0.18 mb/d. China’s oil demand strength continues to lean towards gasoline usage in the road transportation sector and LPG in the petrochemical sector. Demand for diesel oil and residual fuel oil declined, as a result of fuel substitution with natural gas and coal, particularly in the industrial sector. Graph 4.5: Changes in Chinese apparent oil demand, y-o-y changes
LPG demand picked up in February, increasing by 0.22 mb/d or around 20% y-o-y. Support for the product was upheld by improvements in propane dehydrogenation (PDH) plant margins, keeping LPG consumption intact over the month and possibly also the next few months. Gasoline consumption followed a similar trend, adding some 0.13 tb/d or close to 5% y-o-y. Retail sales were rising towards the end of January and into February, encouraged by additional driving for the Chinese New Year. According to the China Association for Automobile Manufacturers (CAAM), vehicles sales reached more than 4 million units for the first two months of 2016, a 4.4% rise y-o-y. On the other hand, diesel oil demand was lower in February y-o-y by around 60 tb/d or 2%, mostly due to slower overall industrial activity, particularly in mining plants and the construction sector, aggravated by the lunar New Year holidays. Prospects for diesel demand in the near future will be encouraged by expansion projects in the country’s infrastructure, which will elevate the product’s consumption, bringing it up from its current low level. Consumption of fuel oil also declined more steeply than in January, as initial data seemed to suggest a decrease in growth of around 60 tb/d or 10% y-o-y. Slower industrial activities as well as weaker teapot refinery consumption due to a switch to crude oil were the factors behind this slowdown. The 2016 outlook for China remains balanced, with possible downside risks linked to a slowing of the economy, as well as policies supporting a reduction in transportation fuel consumption. On the other hand, developments in the petrochemical and transportation sectors form upside potential for China’s oil demand growth. For 2015, Chinese oil demand grew at a rate of 0.37 mb/d, while oil demand in 2016 is projected to record lower growth levels than in 2015, increasing by 0.29 mb/d y-o-y.
-500
-250
0
250
500
750
1,000
-500
-250
0
250
500
750
1,000
Jan Feb Mar Apr May Jun Jul Aug Sep Oct Nov Dec
tb/dtb/d
Historical range 2014 2015 2016*
Note: 2016 = forecast.Sources: Argus Global Markets, China OGP (Xinhua News Agency), Facts Global Energy, JODI, National Bureau of Statistics of China and OPEC Secretariat.

World Oil Demand
OPEC Monthly Oil Market Report – April 2016 43
Table 4.6: World oil demand in 2016, mb/d
Uncertainties ahead for 2016 projections The forecast 2016 is subject to many uncertainties, mainly the pace of economic growth in major oil demand centers, the removal of subsidies in oil-producing countries, mild weather in the Northern Hemisphere and the diverse effects of oil prices in different regions. These will be examined one by one. First, economic developments in Latin America and China are of concern. There is great uncertainty as to whether weakening economic activity in Latin America and signals of a slowdown in China will be reflected in oil demand data, especially for China. So far, consumption data for industrial fuels and middle distillates in particular, are reflecting this slowdown in both regions. In Latin America, uncertainties for 2016 point downward, as the economic environment in Brazil is projected to remain rather slow for the rest of the year. In contrast, the Olympic Games should bring more demand from the transportation and power generation sectors in that country, with a particular focus on oil demand in 2Q16 and 3Q16. Elsewhere, economic development suggests a brighter outlook for certain countries, such as India and South Korea. Uncertainties for oil demand in India are currently leaning mainly towards the upside as overall economic activities are projected to remain positive, supporting not only industrial and manufacturing fuels led by middle distillates, but also transportation fuels. In South Korea, positive assumptions for economic development as well as expansion in the petrochemical and transportation sectors support this optimistic outlook. Second, the impact on oil demand so far cannot yet be clearly attributed to the removal of subsidies in some oil-producing countries, especially in the Middle East. Oil demand data from Saudi Arabia in the first two months of 2016 was lower-than-anticipated, however, this could be due to the 1Q16 being a low-demand season,
2015 1Q16 2Q16 3Q16 4Q16 2016 Growth %Americas 24.37 24.44 24.44 25.05 24.64 24.64 0.27 1.09 of which US 19.71 19.87 19.81 20.26 19.91 19.96 0.25 1.27Europe 13.71 13.50 13.59 14.14 13.66 13.72 0.01 0.07Asia Pacific 8.09 8.63 7.62 7.54 8.18 7.99 -0.09 -1.17Total OECD 46.17 46.57 45.65 46.73 46.48 46.36 0.18 0.39Other Asia 11.90 12.01 12.30 12.27 12.55 12.28 0.39 3.26 of which India 4.05 4.31 4.15 4.11 4.44 4.26 0.20 5.06Latin America 6.61 6.36 6.70 6.91 6.51 6.62 0.01 0.22Middle East 8.35 8.35 8.37 8.91 8.35 8.50 0.15 1.77Africa 3.87 3.99 3.96 3.90 4.05 3.98 0.11 2.85Total DCs 30.72 30.72 31.33 31.99 31.46 31.38 0.66 2.15FSU 4.58 4.44 4.32 4.68 5.03 4.62 0.04 0.82Other Europe 0.67 0.68 0.64 0.68 0.77 0.70 0.02 3.57China 10.83 10.73 11.35 10.99 11.42 11.13 0.29 2.71Total "Other regions" 16.09 15.86 16.32 16.35 17.22 16.44 0.36 2.21
Total world 92.98 93.15 93.30 95.07 95.16 94.18 1.20 1.29Previous estimate 92.98 93.27 93.42 95.05 95.15 94.23 1.25 1.34Revision 0.00 -0.12 -0.13 0.02 0.01 -0.05 -0.05 -0.06
Source: OPEC Secretariat.
Change 2016/15
Note: Totals may not add up due to independent rounding.
World Oil Demand
44 OPEC Monthly Oil Market Report – April 2016
as power generation fuel requirements for heavy distillates reach a peak in the summer, when air conditioning usage intensifies. Since subsidies were reduced in various countries around the region, including the UAE, Kuwait, Oman and others, overall projections for oil demand in the Middle East will be strongly dependent on the economic performance of major oil-producing countries in the region as well as the success of measures to mitigate the impact of lower oil prices. Third, warmer weather conditions in the Northern Hemisphere already reduced the consumption of light/middle distillate products in 1Q16, with lower heating fuel requirements being observed in the US, Canada and Europe. Possible changes in weather conditions, when compared with anticipated normal 4Q temperatures, will introduce uncertainty in middle distillate requirement projections going forward. Elsewhere, a warmer summer in the Middle East and Latin America should positively impact power generation fuel requirements. Last, sharp changes in oil prices tend to create a high degree of uncertainty going forward, as they not only affect requirements by end consumers – depending on to what degree the price impact is passed on to consumers – but also the overall economic activity of producing nations. A case in point is road transportation fuel demand from the US and, to a lesser extent, Europe, where there was significant reaction to the low oil price environment in 2015. Extra support is projected for transportation fuels over the summer driving season should prices remain at 2015 levels. With this in mind, current negative factors seem to outweigh positive ones and possibly imply downward revisions in oil demand growth, should existing signs persist going forward.
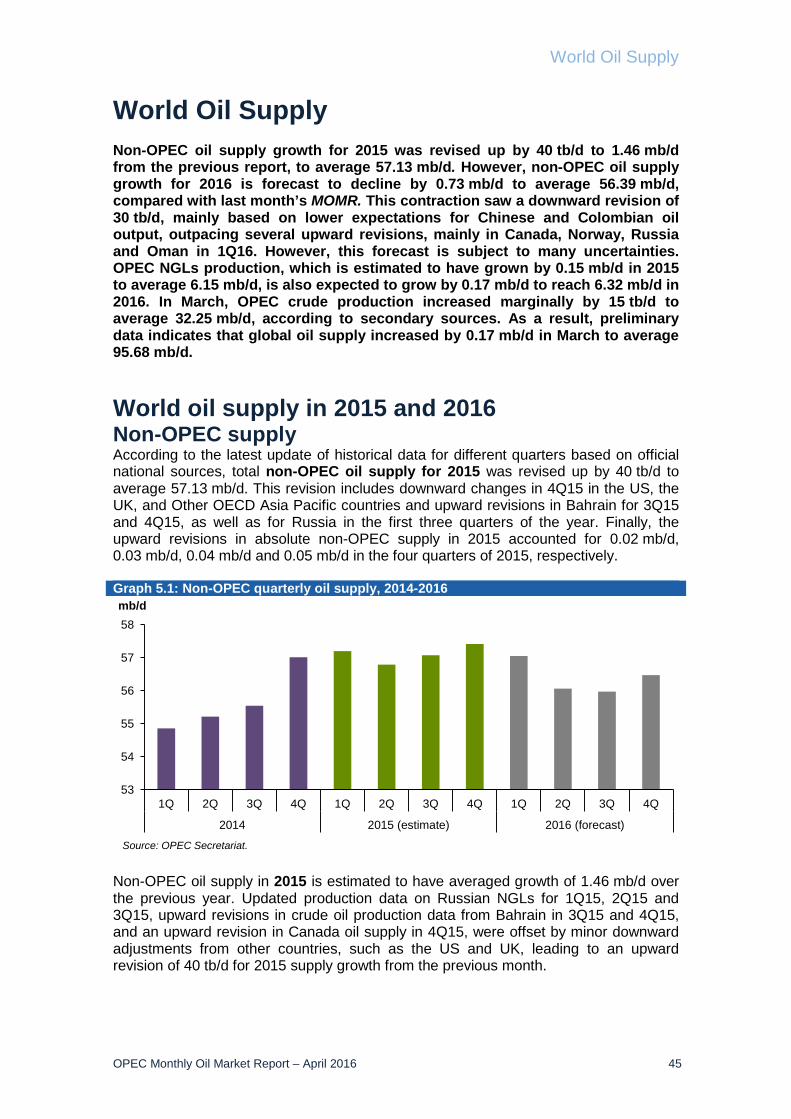
World Oil Supply
OPEC Monthly Oil Market Report – April 2016 45
World Oil Supply Non-OPEC oil supply growth for 2015 was revised up by 40 tb/d to 1.46 mb/d from the previous report, to average 57.13 mb/d. However, non-OPEC oil supply growth for 2016 is forecast to decline by 0.73 mb/d to average 56.39 mb/d, compared with last month’s MOMR. This contraction saw a downward revision of 30 tb/d, mainly based on lower expectations for Chinese and Colombian oil output, outpacing several upward revisions, mainly in Canada, Norway, Russia and Oman in 1Q16. However, this forecast is subject to many uncertainties. OPEC NGLs production, which is estimated to have grown by 0.15 mb/d in 2015 to average 6.15 mb/d, is also expected to grow by 0.17 mb/d to reach 6.32 mb/d in 2016. In March, OPEC crude production increased marginally by 15 tb/d to average 32.25 mb/d, according to secondary sources. As a result, preliminary data indicates that global oil supply increased by 0.17 mb/d in March to average 95.68 mb/d.
World oil supply in 2015 and 2016 Non-OPEC supply According to the latest update of historical data for different quarters based on official national sources, total non-OPEC oil supply for 2015 was revised up by 40 tb/d to average 57.13 mb/d. This revision includes downward changes in 4Q15 in the US, the UK, and Other OECD Asia Pacific countries and upward revisions in Bahrain for 3Q15 and 4Q15, as well as for Russia in the first three quarters of the year. Finally, the upward revisions in absolute non-OPEC supply in 2015 accounted for 0.02 mb/d, 0.03 mb/d, 0.04 mb/d and 0.05 mb/d in the four quarters of 2015, respectively. Graph 5.1: Non-OPEC quarterly oil supply, 2014-2016
Non-OPEC oil supply in 2015 is estimated to have averaged growth of 1.46 mb/d over the previous year. Updated production data on Russian NGLs for 1Q15, 2Q15 and 3Q15, upward revisions in crude oil production data from Bahrain in 3Q15 and 4Q15, and an upward revision in Canada oil supply in 4Q15, were offset by minor downward adjustments from other countries, such as the US and UK, leading to an upward revision of 40 tb/d for 2015 supply growth from the previous month.
53
54
55
56
57
58
1Q 2Q 3Q 4Q 1Q 2Q 3Q 4Q 1Q 2Q 3Q 4Q
2014 2015 (estimate) 2016 (forecast)
mb/d
Source: OPEC Secretariat.
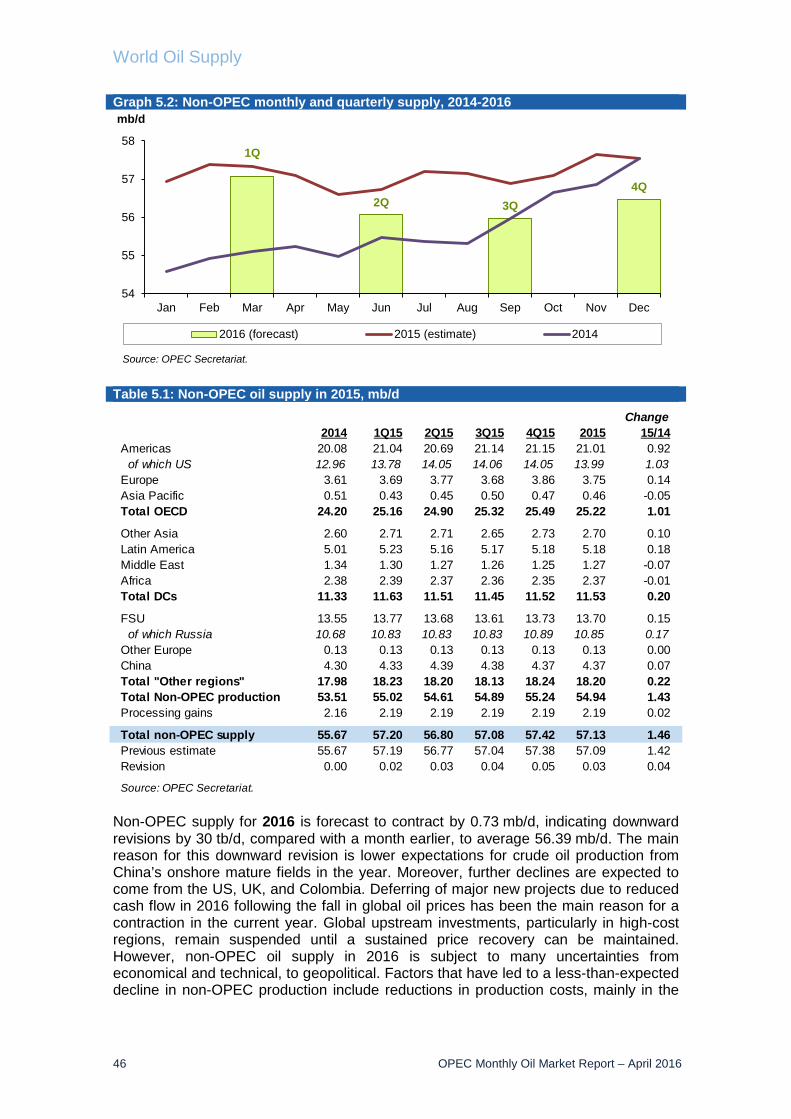
World Oil Supply
46 OPEC Monthly Oil Market Report – April 2016
Graph 5.2: Non-OPEC monthly and quarterly supply, 2014-2016
Table 5.1: Non-OPEC oil supply in 2015, mb/d
Non-OPEC supply for 2016 is forecast to contract by 0.73 mb/d, indicating downward revisions by 30 tb/d, compared with a month earlier, to average 56.39 mb/d. The main reason for this downward revision is lower expectations for crude oil production from China’s onshore mature fields in the year. Moreover, further declines are expected to come from the US, UK, and Colombia. Deferring of major new projects due to reduced cash flow in 2016 following the fall in global oil prices has been the main reason for a contraction in the current year. Global upstream investments, particularly in high-cost regions, remain suspended until a sustained price recovery can be maintained. However, non-OPEC oil supply in 2016 is subject to many uncertainties from economical and technical, to geopolitical. Factors that have led to a less-than-expected decline in non-OPEC production include reductions in production costs, mainly in the
1Q
2Q 3Q4Q
54
55
56
57
58
Jan Feb Mar Apr May Jun Jul Aug Sep Oct Nov Dec
mb/d
2016 (forecast) 2015 (estimate) 2014
Source: OPEC Secretariat.
Change2014 1Q15 2Q15 3Q15 4Q15 2015 15/14
Americas 20.08 21.04 20.69 21.14 21.15 21.01 0.92 of which US 12.96 13.78 14.05 14.06 14.05 13.99 1.03Europe 3.61 3.69 3.77 3.68 3.86 3.75 0.14Asia Pacific 0.51 0.43 0.45 0.50 0.47 0.46 -0.05Total OECD 24.20 25.16 24.90 25.32 25.49 25.22 1.01
Other Asia 2.60 2.71 2.71 2.65 2.73 2.70 0.10Latin America 5.01 5.23 5.16 5.17 5.18 5.18 0.18Middle East 1.34 1.30 1.27 1.26 1.25 1.27 -0.07Africa 2.38 2.39 2.37 2.36 2.35 2.37 -0.01Total DCs 11.33 11.63 11.51 11.45 11.52 11.53 0.20
FSU 13.55 13.77 13.68 13.61 13.73 13.70 0.15 of which Russia 10.68 10.83 10.83 10.83 10.89 10.85 0.17Other Europe 0.13 0.13 0.13 0.13 0.13 0.13 0.00China 4.30 4.33 4.39 4.38 4.37 4.37 0.07Total "Other regions" 17.98 18.23 18.20 18.13 18.24 18.20 0.22Total Non-OPEC production 53.51 55.02 54.61 54.89 55.24 54.94 1.43Processing gains 2.16 2.19 2.19 2.19 2.19 2.19 0.02
Total non-OPEC supply 55.67 57.20 56.80 57.08 57.42 57.13 1.46Previous estimate 55.67 57.19 56.77 57.04 57.38 57.09 1.42Revision 0.00 0.02 0.03 0.04 0.05 0.03 0.04
Source: OPEC Secretariat.
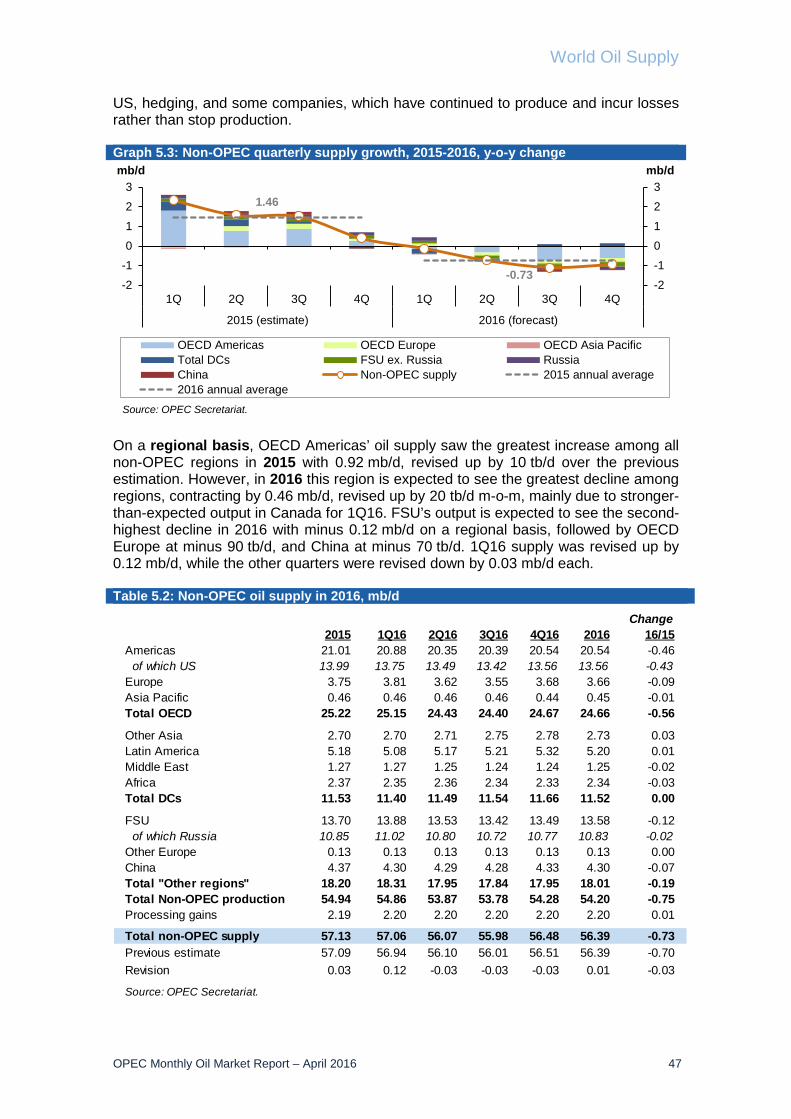
World Oil Supply
OPEC Monthly Oil Market Report – April 2016 47
US, hedging, and some companies, which have continued to produce and incur losses rather than stop production. Graph 5.3: Non-OPEC quarterly supply growth, 2015-2016, y-o-y change
On a regional basis, OECD Americas’ oil supply saw the greatest increase among all non-OPEC regions in 2015 with 0.92 mb/d, revised up by 10 tb/d over the previous estimation. However, in 2016 this region is expected to see the greatest decline among regions, contracting by 0.46 mb/d, revised up by 20 tb/d m-o-m, mainly due to stronger-than-expected output in Canada for 1Q16. FSU’s output is expected to see the second-highest decline in 2016 with minus 0.12 mb/d on a regional basis, followed by OECD Europe at minus 90 tb/d, and China at minus 70 tb/d. 1Q16 supply was revised up by 0.12 mb/d, while the other quarters were revised down by 0.03 mb/d each. Table 5.2: Non-OPEC oil supply in 2016, mb/d
1.46
-0.73-2
-1
0
1
2
3
-2
-1
0
1
2
3
1Q 2Q 3Q 4Q 1Q 2Q 3Q 4Q
2015 (estimate) 2016 (forecast)
mb/dmb/d
OECD Americas OECD Europe OECD Asia PacificTotal DCs FSU ex. Russia RussiaChina Non-OPEC supply 2015 annual average2016 annual average
Source: OPEC Secretariat.
Change2015 1Q16 2Q16 3Q16 4Q16 2016 16/15
Americas 21.01 20.88 20.35 20.39 20.54 20.54 -0.46 of which US 13.99 13.75 13.49 13.42 13.56 13.56 -0.43Europe 3.75 3.81 3.62 3.55 3.68 3.66 -0.09Asia Pacific 0.46 0.46 0.46 0.46 0.44 0.45 -0.01Total OECD 25.22 25.15 24.43 24.40 24.67 24.66 -0.56
Other Asia 2.70 2.70 2.71 2.75 2.78 2.73 0.03Latin America 5.18 5.08 5.17 5.21 5.32 5.20 0.01Middle East 1.27 1.27 1.25 1.24 1.24 1.25 -0.02Africa 2.37 2.35 2.36 2.34 2.33 2.34 -0.03Total DCs 11.53 11.40 11.49 11.54 11.66 11.52 0.00
FSU 13.70 13.88 13.53 13.42 13.49 13.58 -0.12 of which Russia 10.85 11.02 10.80 10.72 10.77 10.83 -0.02Other Europe 0.13 0.13 0.13 0.13 0.13 0.13 0.00China 4.37 4.30 4.29 4.28 4.33 4.30 -0.07Total "Other regions" 18.20 18.31 17.95 17.84 17.95 18.01 -0.19Total Non-OPEC production 54.94 54.86 53.87 53.78 54.28 54.20 -0.75Processing gains 2.19 2.20 2.20 2.20 2.20 2.20 0.01
Total non-OPEC supply 57.13 57.06 56.07 55.98 56.48 56.39 -0.73Previous estimate 57.09 56.94 56.10 56.01 56.51 56.39 -0.70Revision 0.03 0.12 -0.03 -0.03 -0.03 0.01 -0.03
Source: OPEC Secretariat.
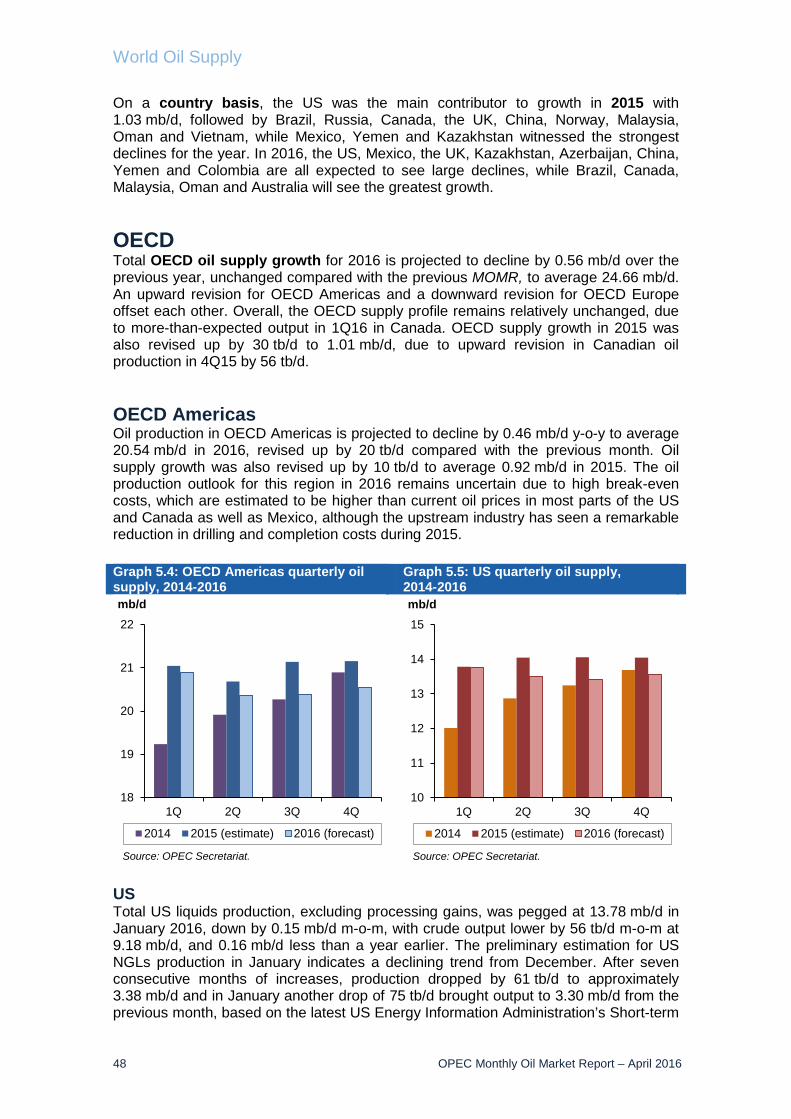
World Oil Supply
48 OPEC Monthly Oil Market Report – April 2016
On a country basis, the US was the main contributor to growth in 2015 with 1.03 mb/d, followed by Brazil, Russia, Canada, the UK, China, Norway, Malaysia, Oman and Vietnam, while Mexico, Yemen and Kazakhstan witnessed the strongest declines for the year. In 2016, the US, Mexico, the UK, Kazakhstan, Azerbaijan, China, Yemen and Colombia are all expected to see large declines, while Brazil, Canada, Malaysia, Oman and Australia will see the greatest growth. OECD Total OECD oil supply growth for 2016 is projected to decline by 0.56 mb/d over the previous year, unchanged compared with the previous MOMR, to average 24.66 mb/d. An upward revision for OECD Americas and a downward revision for OECD Europe offset each other. Overall, the OECD supply profile remains relatively unchanged, due to more-than-expected output in 1Q16 in Canada. OECD supply growth in 2015 was also revised up by 30 tb/d to 1.01 mb/d, due to upward revision in Canadian oil production in 4Q15 by 56 tb/d. OECD Americas Oil production in OECD Americas is projected to decline by 0.46 mb/d y-o-y to average 20.54 mb/d in 2016, revised up by 20 tb/d compared with the previous month. Oil supply growth was also revised up by 10 tb/d to average 0.92 mb/d in 2015. The oil production outlook for this region in 2016 remains uncertain due to high break-even costs, which are estimated to be higher than current oil prices in most parts of the US and Canada as well as Mexico, although the upstream industry has seen a remarkable reduction in drilling and completion costs during 2015. Graph 5.4: OECD Americas quarterly oil supply, 2014-2016
Graph 5.5: US quarterly oil supply, 2014-2016
US Total US liquids production, excluding processing gains, was pegged at 13.78 mb/d in January 2016, down by 0.15 mb/d m-o-m, with crude output lower by 56 tb/d m-o-m at 9.18 mb/d, and 0.16 mb/d less than a year earlier. The preliminary estimation for US NGLs production in January indicates a declining trend from December. After seven consecutive months of increases, production dropped by 61 tb/d to approximately 3.38 mb/d and in January another drop of 75 tb/d brought output to 3.30 mb/d from the previous month, based on the latest US Energy Information Administration’s Short-term
18
19
20
21
22
1Q 2Q 3Q 4Q
mb/d
2014 2015 (estimate) 2016 (forecast)
Source: OPEC Secretariat.
10
11
12
13
14
15
1Q 2Q 3Q 4Q
mb/d
2014 2015 (estimate) 2016 (forecast)
Source: OPEC Secretariat.

World Oil Supply
OPEC Monthly Oil Market Report – April 2016 49
Energy Outlook figures. Total US liquids output is expected to decline by 0.43 mb/d in 2016, to average 13.56 mb/d, revised down by 10 tb/d m-o-m, with the fall coming primarily from a drop in tight crude production as well as NGLs in different regions of the US in January, which led to a downward revision by 40 tb/d in 1Q16. The slowdown came mainly from North Dakota, which is down by 32 tb/d, New Mexico, down by 21 tb/d and the Gulf of Mexico (GoM), down by 18 tb/d, while oil production in Texas increased by 25 tb/d in January to 3.37 mb/d. On a yearly basis, crude oil output in 2015 mainly increased in Texas, GoM and North Dakota by 291 tb/d, 143 tb/d and 87 tb/d, respectively. At the same time, production in Alaska, Louisiana, Kansas and Utah all declined y-o-y. Total US liquids production for 2015 is estimated to be 13.99 mb/d, unchanged m-o-m. US oil supply growth in 2015 reached 1.03 mb/d, down by 700 tb/d compared to growth seen in 2014. Crude oil output averaged 9.43 mb/d, of which tight crude is estimated to be 4.61 mb/d. The remainder of the 4.82 mb/d came from conventional crude oil, including 1.54 mb/d from GoM production. According to this data, US crude oil supply grew by 0.72 mb/d in 2015, of which 0.14 mb/d was growth in GoM. The annual average output of conventional NGLs fell by 0.07 mb/d, and is estimated to stand at 1.35 mb/d, while growth in unconventional NGLs in the US was at 0.33 mb/d in 2015, reaching 1.93 mb/d. The average of total other liquids, such as biofuels, is estimated to stand at 1.28 mb/d, a growth of 0.05 mb/d in 2015. Graph 5.6: Trend of US oil production components, 2005-2016
According to Argus Media, oil and gas producers in Texas are seeking hundreds of drilling permits in anticipation of a further recovery in oil prices. Companies have applied for more than 2,300 drilling permits in the state since 1 January, according to data from the Texas Railroad Commission, which regulates the oil and gas industry. Permit requests could signal that operators are taking advantage of low-cost drilling to build an inventory ahead of an eventual recovery. Drilling previously accounted for 60–80% of a well's cost, but with the spread of horizontal drilling and hydraulic fracturing, drilling now accounts for between 27–38% of total costs, according to an IHS study commissioned by the EIA. Pioneer Natural Resources has said previously that it will add drilling rigs when prices for 2017 recover to $40–$50/b, highlighting how economic some core shale acreages have become. Nevertheless, the company is planning to cut its overall number of active rigs in the Permian by 50% to 12 by mid-2016. Analysts at SG Commodities said, “Any sustained WTI rally above $45/b would cause US shale producers to increase drilling and, after a time lag, production”. WTI crude prices increased by nearly 14% in March, but are still hovering below $40/b.
02468
101214
2005 2006 2007 2008 2009 2010 2011 2012 2013 2014 2015* 2016*
mb/d
Other crudes Gulf of Mexico crude Other NGLBiofuels + Other liquids Tight crude Unconventional NGL
Note: * 2015 = estimate and 2016 = forecast.Source: OPEC Secretariat.
Conventionalsources
Unconventionalsources
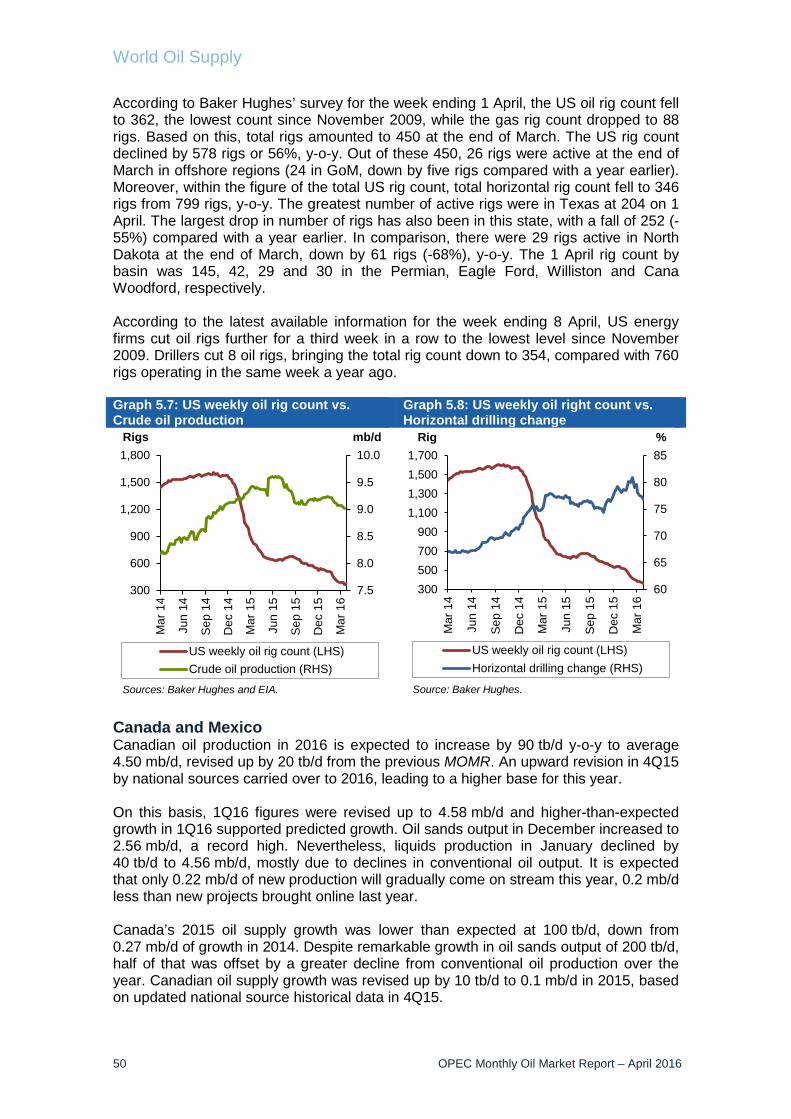
World Oil Supply
50 OPEC Monthly Oil Market Report – April 2016
According to Baker Hughes’ survey for the week ending 1 April, the US oil rig count fell to 362, the lowest count since November 2009, while the gas rig count dropped to 88 rigs. Based on this, total rigs amounted to 450 at the end of March. The US rig count declined by 578 rigs or 56%, y-o-y. Out of these 450, 26 rigs were active at the end of March in offshore regions (24 in GoM, down by five rigs compared with a year earlier). Moreover, within the figure of the total US rig count, total horizontal rig count fell to 346 rigs from 799 rigs, y-o-y. The greatest number of active rigs were in Texas at 204 on 1 April. The largest drop in number of rigs has also been in this state, with a fall of 252 (-55%) compared with a year earlier. In comparison, there were 29 rigs active in North Dakota at the end of March, down by 61 rigs (-68%), y-o-y. The 1 April rig count by basin was 145, 42, 29 and 30 in the Permian, Eagle Ford, Williston and Cana Woodford, respectively. According to the latest available information for the week ending 8 April, US energy firms cut oil rigs further for a third week in a row to the lowest level since November 2009. Drillers cut 8 oil rigs, bringing the total rig count down to 354, compared with 760 rigs operating in the same week a year ago. Graph 5.7: US weekly oil rig count vs. Crude oil production
Graph 5.8: US weekly oil right count vs. Horizontal drilling change
Canada and Mexico Canadian oil production in 2016 is expected to increase by 90 tb/d y-o-y to average 4.50 mb/d, revised up by 20 tb/d from the previous MOMR. An upward revision in 4Q15 by national sources carried over to 2016, leading to a higher base for this year. On this basis, 1Q16 figures were revised up to 4.58 mb/d and higher-than-expected growth in 1Q16 supported predicted growth. Oil sands output in December increased to 2.56 mb/d, a record high. Nevertheless, liquids production in January declined by 40 tb/d to 4.56 mb/d, mostly due to declines in conventional oil output. It is expected that only 0.22 mb/d of new production will gradually come on stream this year, 0.2 mb/d less than new projects brought online last year. Canada’s 2015 oil supply growth was lower than expected at 100 tb/d, down from 0.27 mb/d of growth in 2014. Despite remarkable growth in oil sands output of 200 tb/d, half of that was offset by a greater decline from conventional oil production over the year. Canadian oil supply growth was revised up by 10 tb/d to 0.1 mb/d in 2015, based on updated national source historical data in 4Q15.
7.5
8.0
8.5
9.0
9.5
10.0
300
600
900
1,200
1,500
1,800
Mar
14
Jun
14
Sep
14
Dec
14
Mar
15
Jun
15
Sep
15
Dec
15
Mar
16
mb/dRigs
US weekly oil rig count (LHS)Crude oil production (RHS)
Sources: Baker Hughes and EIA.
60
65
70
75
80
85
300500700900
1,1001,3001,5001,700
Mar
14
Jun
14
Sep
14
Dec
14
Mar
15
Jun
15
Sep
15
Dec
15
Mar
16
%Rig
US weekly oil rig count (LHS)Horizontal drilling change (RHS)
Source: Baker Hughes.

World Oil Supply
OPEC Monthly Oil Market Report – April 2016 51
Graph 5.9: Canada production by product type
Graph 5.10: Canada production by product type, y-o-y change
The rotary rig count was 49 rigs (11 oil rigs and 38 gas rigs) on 1 April, down by 51 rigs (-51%), y-o-y. Of these 49 rigs, 34 are active in Alberta, 11 in British Colombia and one in Saskatchewan. Moreover, three offshore rigs are active in the Province of Newfoundland. Graph 5.11: Canada quarterly oil supply, 2014-2016
Graph 5.12: Mexico quarterly oil supply, 2014-2016
Mexico’s oil supply is estimated to have declined by 0.2 mb/d to average 2.60 mb/d in 2015, unchanged from the previous month. Annual oil production for 2016 is expected to decline at a slower pace of 0.13 mb/d, with average supply anticipated to be 2.47 mb/d. Mexican liquids production in February declined by 70 tb/d m-o-m to average 2.52 mb/d. In February, both crude oil and NGLs declined compared with a month earlier. According to Energy Aspects, output from the Mexico’s Ku-Maloob-Zaap (KMZ), Cantarell and Ligero Marino fields was lower y-o-y by 14 tb/d, 73 tb/d and 18 tb/d, respectively. A fire at the Abkatun permanente platform in early February resulted in steeper declines at the Chuc, Homol and Ixtal fields. In the second quarter one year ago, a fire had led to a 70% reduction in output from the platform.
0.9
1.2
1.5
1.8
2.1
2.4
2.7
Mar10
Mar11
Mar12
Mar13
Mar14
Mar15
Mar16
mb/d
Synthetic crude + Crude bitumen
Conventional
Source: OPEC Secretariat.
-0.3
0.0
0.3
0.6
Mar10
Mar11
Mar12
Mar13
Mar14
Mar15
Mar16
mb/d
Synthetic crude + Crude bitumenConventional
Source: OPEC Secretariat.
3.83.94.04.14.24.34.44.54.64.7
1Q 2Q 3Q 4Q
mb/d
2014 2015 (estimate) 2016 (forecast)
Source: OPEC Secretariat.
2.2
2.3
2.4
2.5
2.6
2.7
2.8
2.9
1Q 2Q 3Q 4Q
mb/d
2014 2015 (estimate) 2016 (forecast)
Source: OPEC Secretariat.
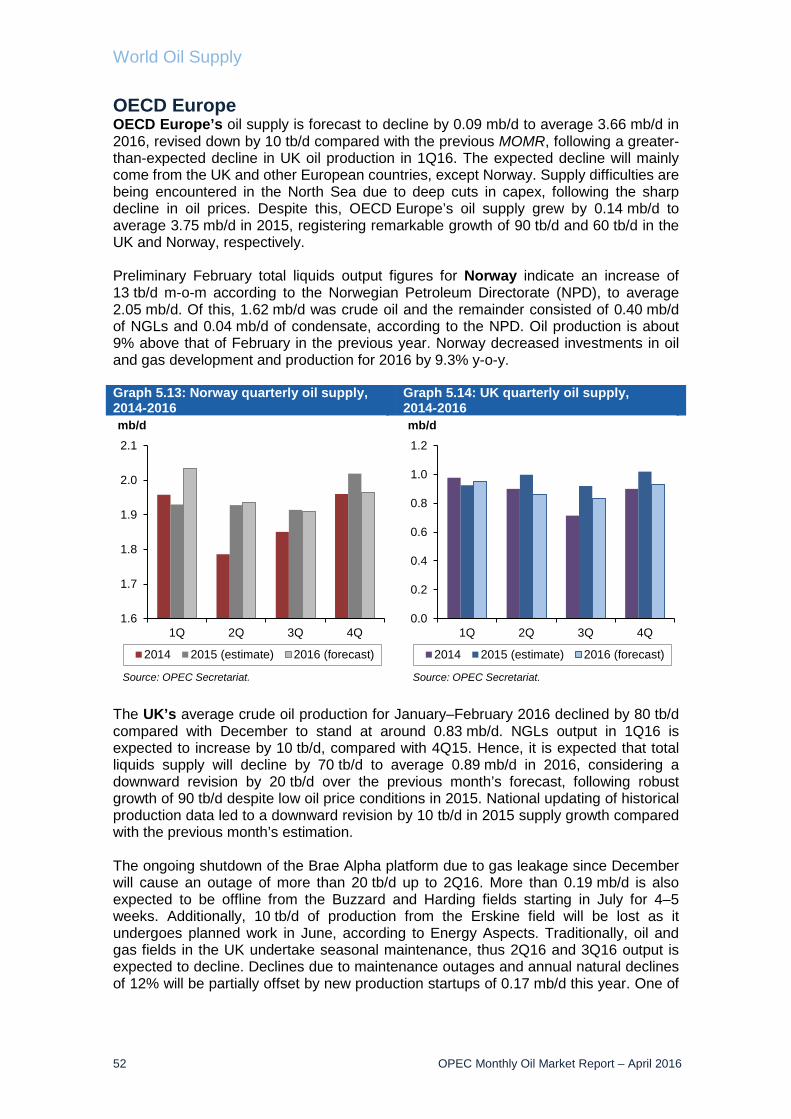
World Oil Supply
52 OPEC Monthly Oil Market Report – April 2016
OECD Europe OECD Europe’s oil supply is forecast to decline by 0.09 mb/d to average 3.66 mb/d in 2016, revised down by 10 tb/d compared with the previous MOMR, following a greater-than-expected decline in UK oil production in 1Q16. The expected decline will mainly come from the UK and other European countries, except Norway. Supply difficulties are being encountered in the North Sea due to deep cuts in capex, following the sharp decline in oil prices. Despite this, OECD Europe’s oil supply grew by 0.14 mb/d to average 3.75 mb/d in 2015, registering remarkable growth of 90 tb/d and 60 tb/d in the UK and Norway, respectively. Preliminary February total liquids output figures for Norway indicate an increase of 13 tb/d m-o-m according to the Norwegian Petroleum Directorate (NPD), to average 2.05 mb/d. Of this, 1.62 mb/d was crude oil and the remainder consisted of 0.40 mb/d of NGLs and 0.04 mb/d of condensate, according to the NPD. Oil production is about 9% above that of February in the previous year. Norway decreased investments in oil and gas development and production for 2016 by 9.3% y-o-y. Graph 5.13: Norway quarterly oil supply, 2014-2016
Graph 5.14: UK quarterly oil supply, 2014-2016
The UK’s average crude oil production for January–February 2016 declined by 80 tb/d compared with December to stand at around 0.83 mb/d. NGLs output in 1Q16 is expected to increase by 10 tb/d, compared with 4Q15. Hence, it is expected that total liquids supply will decline by 70 tb/d to average 0.89 mb/d in 2016, considering a downward revision by 20 tb/d over the previous month’s forecast, following robust growth of 90 tb/d despite low oil price conditions in 2015. National updating of historical production data led to a downward revision by 10 tb/d in 2015 supply growth compared with the previous month’s estimation. The ongoing shutdown of the Brae Alpha platform due to gas leakage since December will cause an outage of more than 20 tb/d up to 2Q16. More than 0.19 mb/d is also expected to be offline from the Buzzard and Harding fields starting in July for 4–5 weeks. Additionally, 10 tb/d of production from the Erskine field will be lost as it undergoes planned work in June, according to Energy Aspects. Traditionally, oil and gas fields in the UK undertake seasonal maintenance, thus 2Q16 and 3Q16 output is expected to decline. Declines due to maintenance outages and annual natural declines of 12% will be partially offset by new production startups of 0.17 mb/d this year. One of
1.6
1.7
1.8
1.9
2.0
2.1
1Q 2Q 3Q 4Q
mb/d
2014 2015 (estimate) 2016 (forecast)
Source: OPEC Secretariat.
0.0
0.2
0.4
0.6
0.8
1.0
1.2
1Q 2Q 3Q 4Q
mb/d
2014 2015 (estimate) 2016 (forecast)
Source: OPEC Secretariat.
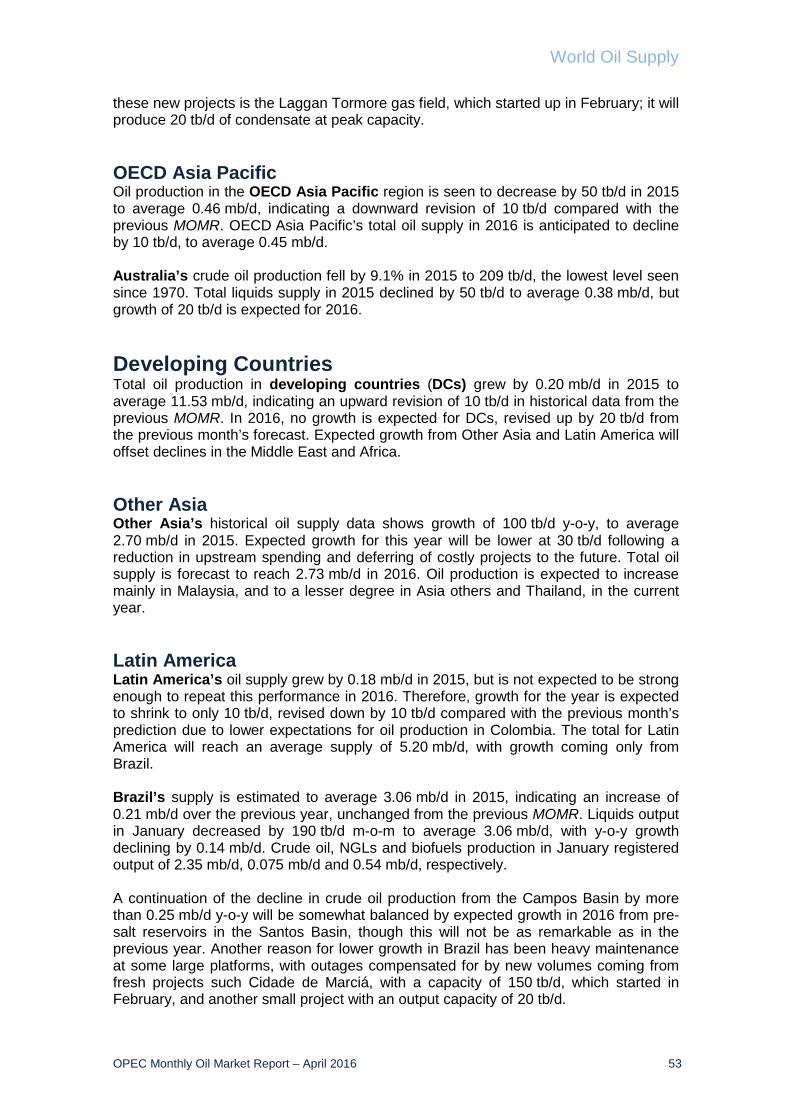
World Oil Supply
OPEC Monthly Oil Market Report – April 2016 53
these new projects is the Laggan Tormore gas field, which started up in February; it will produce 20 tb/d of condensate at peak capacity. OECD Asia Pacific Oil production in the OECD Asia Pacific region is seen to decrease by 50 tb/d in 2015 to average 0.46 mb/d, indicating a downward revision of 10 tb/d compared with the previous MOMR. OECD Asia Pacific’s total oil supply in 2016 is anticipated to decline by 10 tb/d, to average 0.45 mb/d. Australia’s crude oil production fell by 9.1% in 2015 to 209 tb/d, the lowest level seen since 1970. Total liquids supply in 2015 declined by 50 tb/d to average 0.38 mb/d, but growth of 20 tb/d is expected for 2016. Developing Countries Total oil production in developing countries (DCs) grew by 0.20 mb/d in 2015 to average 11.53 mb/d, indicating an upward revision of 10 tb/d in historical data from the previous MOMR. In 2016, no growth is expected for DCs, revised up by 20 tb/d from the previous month’s forecast. Expected growth from Other Asia and Latin America will offset declines in the Middle East and Africa. Other Asia Other Asia’s historical oil supply data shows growth of 100 tb/d y-o-y, to average 2.70 mb/d in 2015. Expected growth for this year will be lower at 30 tb/d following a reduction in upstream spending and deferring of costly projects to the future. Total oil supply is forecast to reach 2.73 mb/d in 2016. Oil production is expected to increase mainly in Malaysia, and to a lesser degree in Asia others and Thailand, in the current year. Latin America Latin America’s oil supply grew by 0.18 mb/d in 2015, but is not expected to be strong enough to repeat this performance in 2016. Therefore, growth for the year is expected to shrink to only 10 tb/d, revised down by 10 tb/d compared with the previous month’s prediction due to lower expectations for oil production in Colombia. The total for Latin America will reach an average supply of 5.20 mb/d, with growth coming only from Brazil. Brazil’s supply is estimated to average 3.06 mb/d in 2015, indicating an increase of 0.21 mb/d over the previous year, unchanged from the previous MOMR. Liquids output in January decreased by 190 tb/d m-o-m to average 3.06 mb/d, with y-o-y growth declining by 0.14 mb/d. Crude oil, NGLs and biofuels production in January registered output of 2.35 mb/d, 0.075 mb/d and 0.54 mb/d, respectively. A continuation of the decline in crude oil production from the Campos Basin by more than 0.25 mb/d y-o-y will be somewhat balanced by expected growth in 2016 from pre-salt reservoirs in the Santos Basin, though this will not be as remarkable as in the previous year. Another reason for lower growth in Brazil has been heavy maintenance at some large platforms, with outages compensated for by new volumes coming from fresh projects such Cidade de Marciá, with a capacity of 150 tb/d, which started in February, and another small project with an output capacity of 20 tb/d.
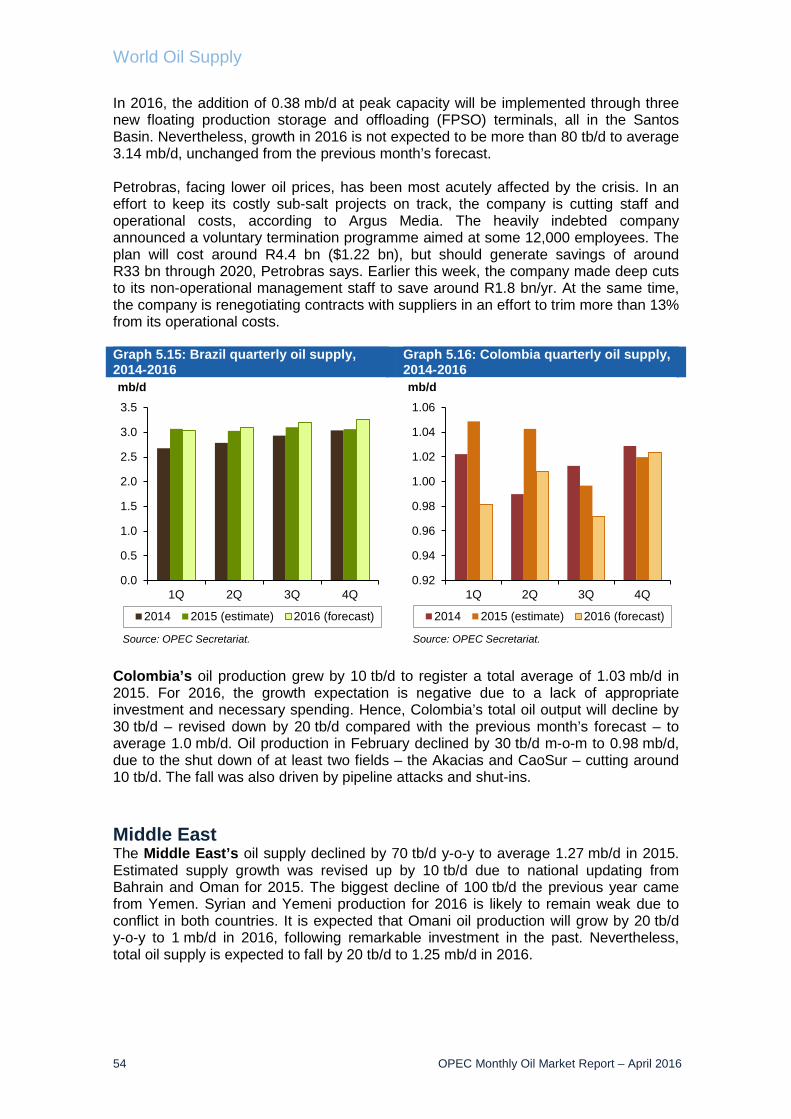
World Oil Supply
54 OPEC Monthly Oil Market Report – April 2016
In 2016, the addition of 0.38 mb/d at peak capacity will be implemented through three new floating production storage and offloading (FPSO) terminals, all in the Santos Basin. Nevertheless, growth in 2016 is not expected to be more than 80 tb/d to average 3.14 mb/d, unchanged from the previous month’s forecast. Petrobras, facing lower oil prices, has been most acutely affected by the crisis. In an effort to keep its costly sub-salt projects on track, the company is cutting staff and operational costs, according to Argus Media. The heavily indebted company announced a voluntary termination programme aimed at some 12,000 employees. The plan will cost around R4.4 bn ($1.22 bn), but should generate savings of around R33 bn through 2020, Petrobras says. Earlier this week, the company made deep cuts to its non-operational management staff to save around R1.8 bn/yr. At the same time, the company is renegotiating contracts with suppliers in an effort to trim more than 13% from its operational costs. Graph 5.15: Brazil quarterly oil supply, 2014-2016
Graph 5.16: Colombia quarterly oil supply, 2014-2016
Colombia’s oil production grew by 10 tb/d to register a total average of 1.03 mb/d in 2015. For 2016, the growth expectation is negative due to a lack of appropriate investment and necessary spending. Hence, Colombia’s total oil output will decline by 30 tb/d – revised down by 20 tb/d compared with the previous month’s forecast – to average 1.0 mb/d. Oil production in February declined by 30 tb/d m-o-m to 0.98 mb/d, due to the shut down of at least two fields – the Akacias and CaoSur – cutting around 10 tb/d. The fall was also driven by pipeline attacks and shut-ins. Middle East The Middle East’s oil supply declined by 70 tb/d y-o-y to average 1.27 mb/d in 2015. Estimated supply growth was revised up by 10 tb/d due to national updating from Bahrain and Oman for 2015. The biggest decline of 100 tb/d the previous year came from Yemen. Syrian and Yemeni production for 2016 is likely to remain weak due to conflict in both countries. It is expected that Omani oil production will grow by 20 tb/d y-o-y to 1 mb/d in 2016, following remarkable investment in the past. Nevertheless, total oil supply is expected to fall by 20 tb/d to 1.25 mb/d in 2016.
0.0
0.5
1.0
1.5
2.0
2.5
3.0
3.5
1Q 2Q 3Q 4Q
mb/d
2014 2015 (estimate) 2016 (forecast)
Source: OPEC Secretariat.
0.92
0.94
0.96
0.98
1.00
1.02
1.04
1.06
1Q 2Q 3Q 4Q
mb/d
2014 2015 (estimate) 2016 (forecast)
Source: OPEC Secretariat.
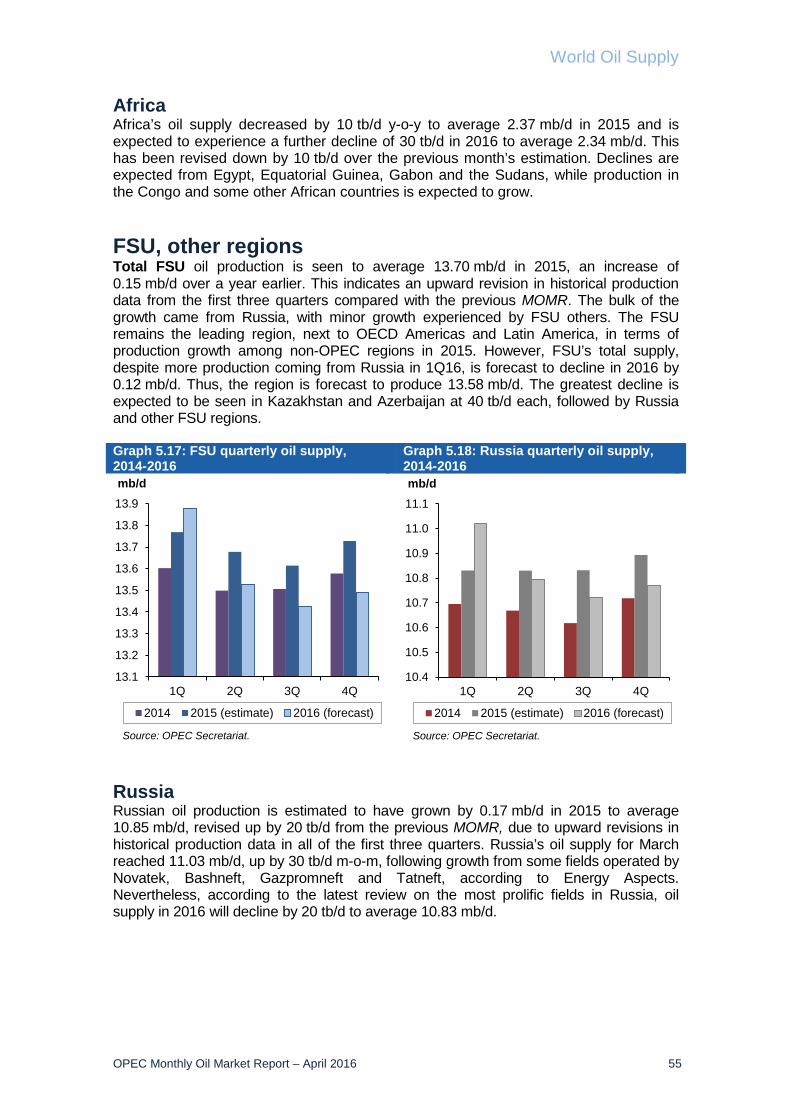
World Oil Supply
OPEC Monthly Oil Market Report – April 2016 55
Africa Africa’s oil supply decreased by 10 tb/d y-o-y to average 2.37 mb/d in 2015 and is expected to experience a further decline of 30 tb/d in 2016 to average 2.34 mb/d. This has been revised down by 10 tb/d over the previous month’s estimation. Declines are expected from Egypt, Equatorial Guinea, Gabon and the Sudans, while production in the Congo and some other African countries is expected to grow. FSU, other regions Total FSU oil production is seen to average 13.70 mb/d in 2015, an increase of 0.15 mb/d over a year earlier. This indicates an upward revision in historical production data from the first three quarters compared with the previous MOMR. The bulk of the growth came from Russia, with minor growth experienced by FSU others. The FSU remains the leading region, next to OECD Americas and Latin America, in terms of production growth among non-OPEC regions in 2015. However, FSU’s total supply, despite more production coming from Russia in 1Q16, is forecast to decline in 2016 by 0.12 mb/d. Thus, the region is forecast to produce 13.58 mb/d. The greatest decline is expected to be seen in Kazakhstan and Azerbaijan at 40 tb/d each, followed by Russia and other FSU regions. Graph 5.17: FSU quarterly oil supply, 2014-2016
Graph 5.18: Russia quarterly oil supply, 2014-2016
Russia Russian oil production is estimated to have grown by 0.17 mb/d in 2015 to average 10.85 mb/d, revised up by 20 tb/d from the previous MOMR, due to upward revisions in historical production data in all of the first three quarters. Russia’s oil supply for March reached 11.03 mb/d, up by 30 tb/d m-o-m, following growth from some fields operated by Novatek, Bashneft, Gazpromneft and Tatneft, according to Energy Aspects. Nevertheless, according to the latest review on the most prolific fields in Russia, oil supply in 2016 will decline by 20 tb/d to average 10.83 mb/d.
13.1
13.2
13.3
13.4
13.5
13.6
13.7
13.8
13.9
1Q 2Q 3Q 4Q
mb/d
2014 2015 (estimate) 2016 (forecast)
Source: OPEC Secretariat.
10.4
10.5
10.6
10.7
10.8
10.9
11.0
11.1
1Q 2Q 3Q 4Q
mb/d
2014 2015 (estimate) 2016 (forecast)
Source: OPEC Secretariat.
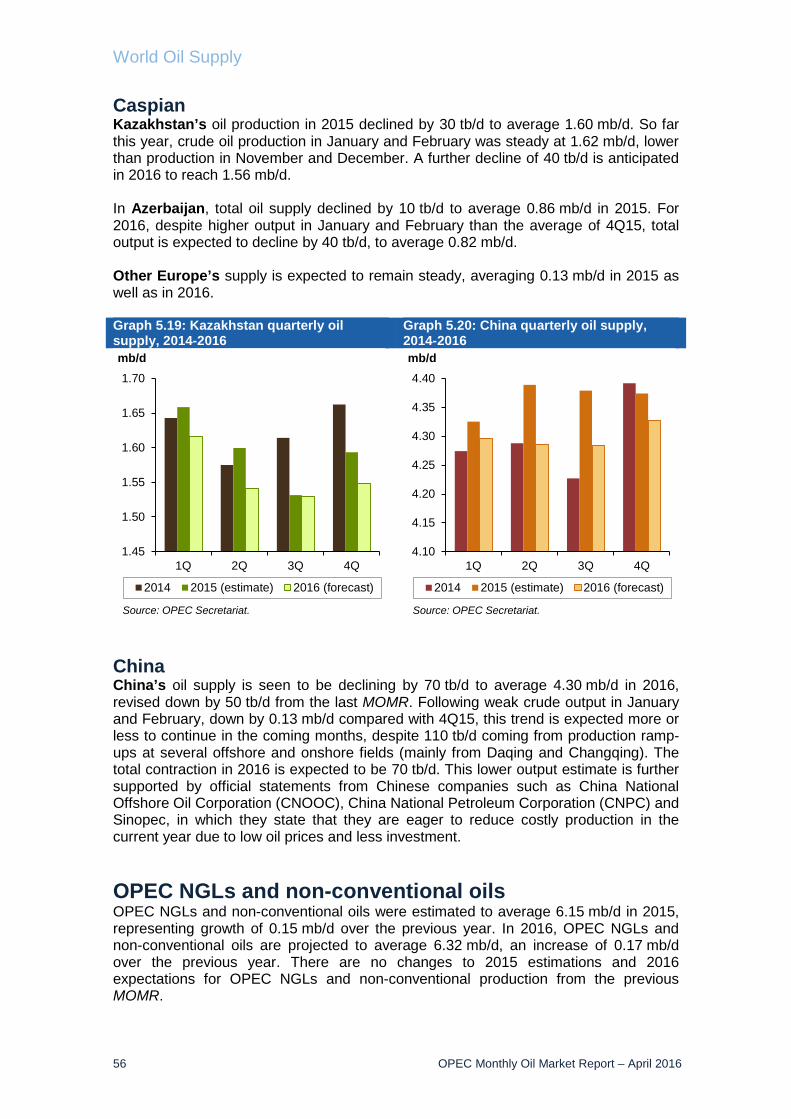
World Oil Supply
56 OPEC Monthly Oil Market Report – April 2016
Caspian Kazakhstan’s oil production in 2015 declined by 30 tb/d to average 1.60 mb/d. So far this year, crude oil production in January and February was steady at 1.62 mb/d, lower than production in November and December. A further decline of 40 tb/d is anticipated in 2016 to reach 1.56 mb/d. In Azerbaijan, total oil supply declined by 10 tb/d to average 0.86 mb/d in 2015. For 2016, despite higher output in January and February than the average of 4Q15, total output is expected to decline by 40 tb/d, to average 0.82 mb/d. Other Europe’s supply is expected to remain steady, averaging 0.13 mb/d in 2015 as well as in 2016. Graph 5.19: Kazakhstan quarterly oil supply, 2014-2016
Graph 5.20: China quarterly oil supply, 2014-2016
China China’s oil supply is seen to be declining by 70 tb/d to average 4.30 mb/d in 2016, revised down by 50 tb/d from the last MOMR. Following weak crude output in January and February, down by 0.13 mb/d compared with 4Q15, this trend is expected more or less to continue in the coming months, despite 110 tb/d coming from production ramp-ups at several offshore and onshore fields (mainly from Daqing and Changqing). The total contraction in 2016 is expected to be 70 tb/d. This lower output estimate is further supported by official statements from Chinese companies such as China National Offshore Oil Corporation (CNOOC), China National Petroleum Corporation (CNPC) and Sinopec, in which they state that they are eager to reduce costly production in the current year due to low oil prices and less investment. OPEC NGLs and non-conventional oils OPEC NGLs and non-conventional oils were estimated to average 6.15 mb/d in 2015, representing growth of 0.15 mb/d over the previous year. In 2016, OPEC NGLs and non-conventional oils are projected to average 6.32 mb/d, an increase of 0.17 mb/d over the previous year. There are no changes to 2015 estimations and 2016 expectations for OPEC NGLs and non-conventional production from the previous MOMR.
1.45
1.50
1.55
1.60
1.65
1.70
1Q 2Q 3Q 4Q
mb/d
2014 2015 (estimate) 2016 (forecast)
Source: OPEC Secretariat.
4.10
4.15
4.20
4.25
4.30
4.35
4.40
1Q 2Q 3Q 4Q
mb/d
2014 2015 (estimate) 2016 (forecast)
Source: OPEC Secretariat.
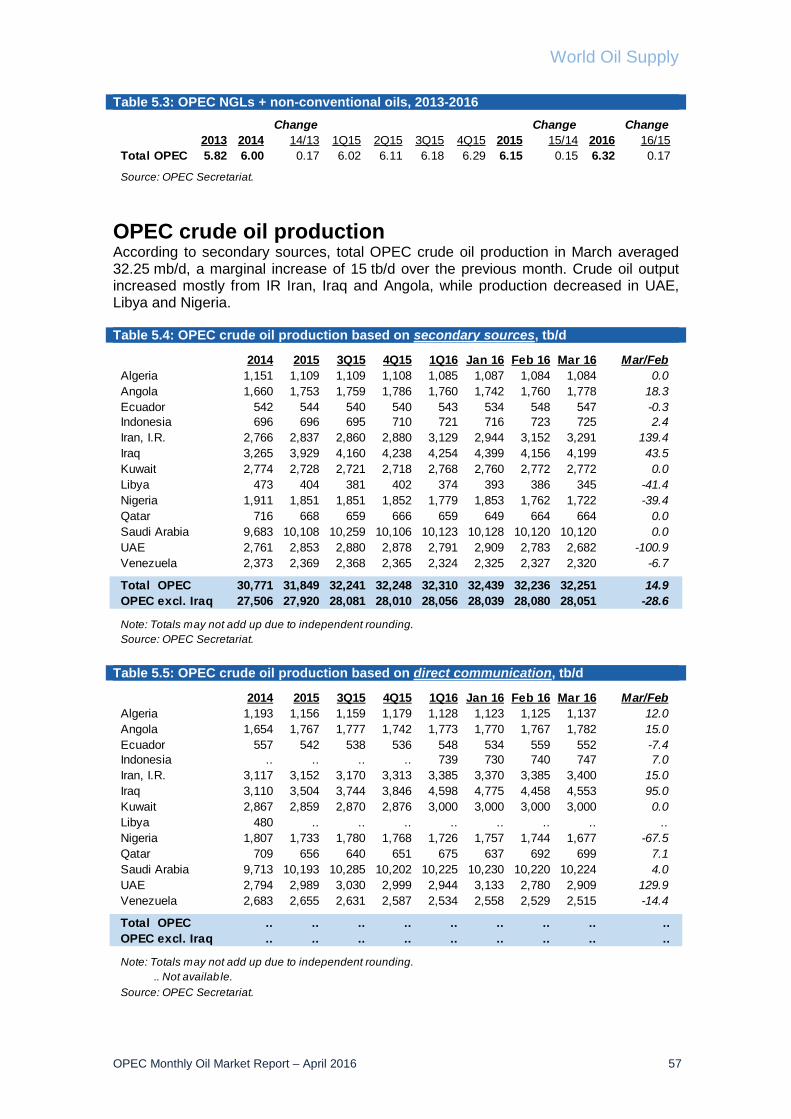
World Oil Supply
OPEC Monthly Oil Market Report – April 2016 57
Table 5.3: OPEC NGLs + non-conventional oils, 2013-2016
OPEC crude oil production According to secondary sources, total OPEC crude oil production in March averaged 32.25 mb/d, a marginal increase of 15 tb/d over the previous month. Crude oil output increased mostly from IR Iran, Iraq and Angola, while production decreased in UAE, Libya and Nigeria. Table 5.4: OPEC crude oil production based on secondary sources, tb/d
Table 5.5: OPEC crude oil production based on direct communication, tb/d
Change Change Change2013 2014 14/13 1Q15 2Q15 3Q15 4Q15 2015 15/14 2016 16/15
Total OPEC 5.82 6.00 0.17 6.02 6.11 6.18 6.29 6.15 0.15 6.32 0.17
Source: OPEC Secretariat.
2014 2015 3Q15 4Q15 1Q16 Jan 16 Feb 16 Mar 16 Mar/FebAlgeria 1,151 1,109 1,109 1,108 1,085 1,087 1,084 1,084 0.0Angola 1,660 1,753 1,759 1,786 1,760 1,742 1,760 1,778 18.3Ecuador 542 544 540 540 543 534 548 547 -0.3Indonesia 696 696 695 710 721 716 723 725 2.4Iran, I.R. 2,766 2,837 2,860 2,880 3,129 2,944 3,152 3,291 139.4Iraq 3,265 3,929 4,160 4,238 4,254 4,399 4,156 4,199 43.5Kuwait 2,774 2,728 2,721 2,718 2,768 2,760 2,772 2,772 0.0Libya 473 404 381 402 374 393 386 345 -41.4Nigeria 1,911 1,851 1,851 1,852 1,779 1,853 1,762 1,722 -39.4Qatar 716 668 659 666 659 649 664 664 0.0Saudi Arabia 9,683 10,108 10,259 10,106 10,123 10,128 10,120 10,120 0.0UAE 2,761 2,853 2,880 2,878 2,791 2,909 2,783 2,682 -100.9Venezuela 2,373 2,369 2,368 2,365 2,324 2,325 2,327 2,320 -6.7
Total OPEC 30,771 31,849 32,241 32,248 32,310 32,439 32,236 32,251 14.9OPEC excl. Iraq 27,506 27,920 28,081 28,010 28,056 28,039 28,080 28,051 -28.6
Note: Totals may not add up due to independent rounding.Source: OPEC Secretariat.
2014 2015 3Q15 4Q15 1Q16 Jan 16 Feb 16 Mar 16 Mar/FebAlgeria 1,193 1,156 1,159 1,179 1,128 1,123 1,125 1,137 12.0Angola 1,654 1,767 1,777 1,742 1,773 1,770 1,767 1,782 15.0Ecuador 557 542 538 536 548 534 559 552 -7.4Indonesia .. .. .. .. 739 730 740 747 7.0Iran, I.R. 3,117 3,152 3,170 3,313 3,385 3,370 3,385 3,400 15.0Iraq 3,110 3,504 3,744 3,846 4,598 4,775 4,458 4,553 95.0Kuwait 2,867 2,859 2,870 2,876 3,000 3,000 3,000 3,000 0.0Libya 480 .. .. .. .. .. .. .. ..Nigeria 1,807 1,733 1,780 1,768 1,726 1,757 1,744 1,677 -67.5Qatar 709 656 640 651 675 637 692 699 7.1Saudi Arabia 9,713 10,193 10,285 10,202 10,225 10,230 10,220 10,224 4.0UAE 2,794 2,989 3,030 2,999 2,944 3,133 2,780 2,909 129.9Venezuela 2,683 2,655 2,631 2,587 2,534 2,558 2,529 2,515 -14.4
Total OPEC .. .. .. .. .. .. .. .. ..OPEC excl. Iraq .. .. .. .. .. .. .. .. ..
Note: Totals may not add up due to independent rounding. .. Not availab le.Source: OPEC Secretariat.
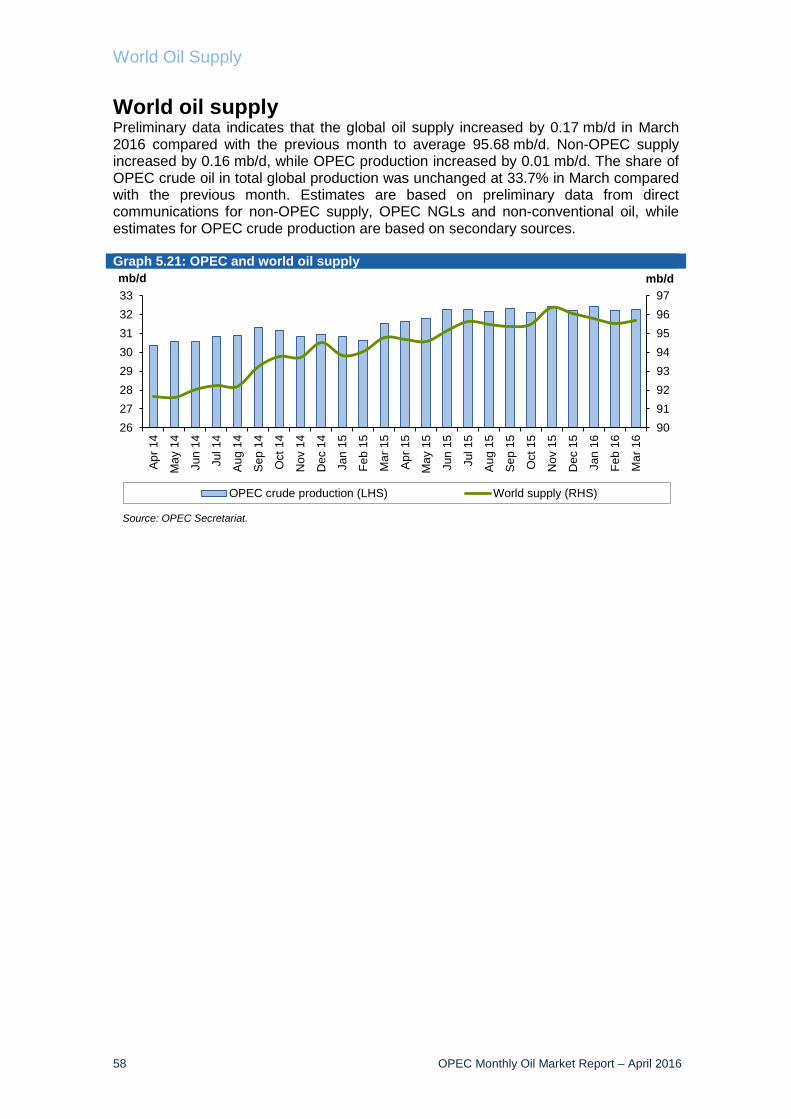
World Oil Supply
58 OPEC Monthly Oil Market Report – April 2016
World oil supply Preliminary data indicates that the global oil supply increased by 0.17 mb/d in March 2016 compared with the previous month to average 95.68 mb/d. Non-OPEC supply increased by 0.16 mb/d, while OPEC production increased by 0.01 mb/d. The share of OPEC crude oil in total global production was unchanged at 33.7% in March compared with the previous month. Estimates are based on preliminary data from direct communications for non-OPEC supply, OPEC NGLs and non-conventional oil, while estimates for OPEC crude production are based on secondary sources. Graph 5.21: OPEC and world oil supply
9091929394959697
2627282930313233
Apr
14
May
14
Jun
14
Jul 1
4
Aug
14
Sep
14
Oct
14
Nov
14
Dec
14
Jan
15
Feb
15
Mar
15
Apr
15
May
15
Jun
15
Jul 1
5
Aug
15
Sep
15
Oct
15
Nov
15
Dec
15
Jan
16
Feb
16
Mar
16
mb/dmb/d
OPEC crude production (LHS) World supply (RHS)
Source: OPEC Secretariat.

Product Markets and Refinery Operations
OPEC Monthly Oil Market Report – April 2016 59
Product Markets and Refinery Operations Product markets in the US were supported by strong domestic gasoline demand amid tightening sentiment fueled by the switch to summer-grade gasoline, which allowed refinery margins to recover. Meanwhile in Europe, the lack of export opportunities for gasoline and fuel oil amid middle distillate weakness caused margins to continue falling. Meanwhile, Asian margins saw a slight recovery on the back of stronger regional demand and the onset of refinery maintenance in the region. Graph 6.1: Refinery margins, 2015-2016
US product markets exhibited a positive performance, supported by the top of the barrel during March. Strong domestic gasoline demand and the temporarily tight sentiment fueled by some FCC units’ outages amid the transition to summer gasoline grade allowed the gasoline crack spreads to strengthen and thus support refinery margins. US Gulf Coast (USGC) refinery margins for WTI crude gained more than $1 versus the previous month’s levels, to average around $6/b in March Product markets in Europe continued being impacted during March by the lack of export opportunities for light distillates and fuel oil. Meanwhile, the crack spreads at the middle of the barrel continued low, due to the oversupply environment weighing on middle distillate fundamentals. The refinery margin for Brent crude in Northwest Europe (NWE) showed a decrease of 60¢ versus the previous month to average $4/b in March. Asian product markets saw a slight recovery in March, on the back of stronger regional demand and tightening sentiment being fueled by the start of refinery maintenance in the region. However, any additional uptick has been limited by high inventories in Singapore pressuring the market. Refinery margins in Singapore recovered 50¢ to average $8/b in March.
0
5
10
15
20
0
5
10
15
20
Mar
15
Apr
15
May
15
Jun
15
Jul 1
5
Aug
15
Sep
15
Oct
15
Nov
15
Dec
15
Jan
16
Feb
16
Mar
16
US$/bUS$/b
WTI (US Gulf) Brent (Rotterdam) Oman (Singapore)
Source: Argus Media.
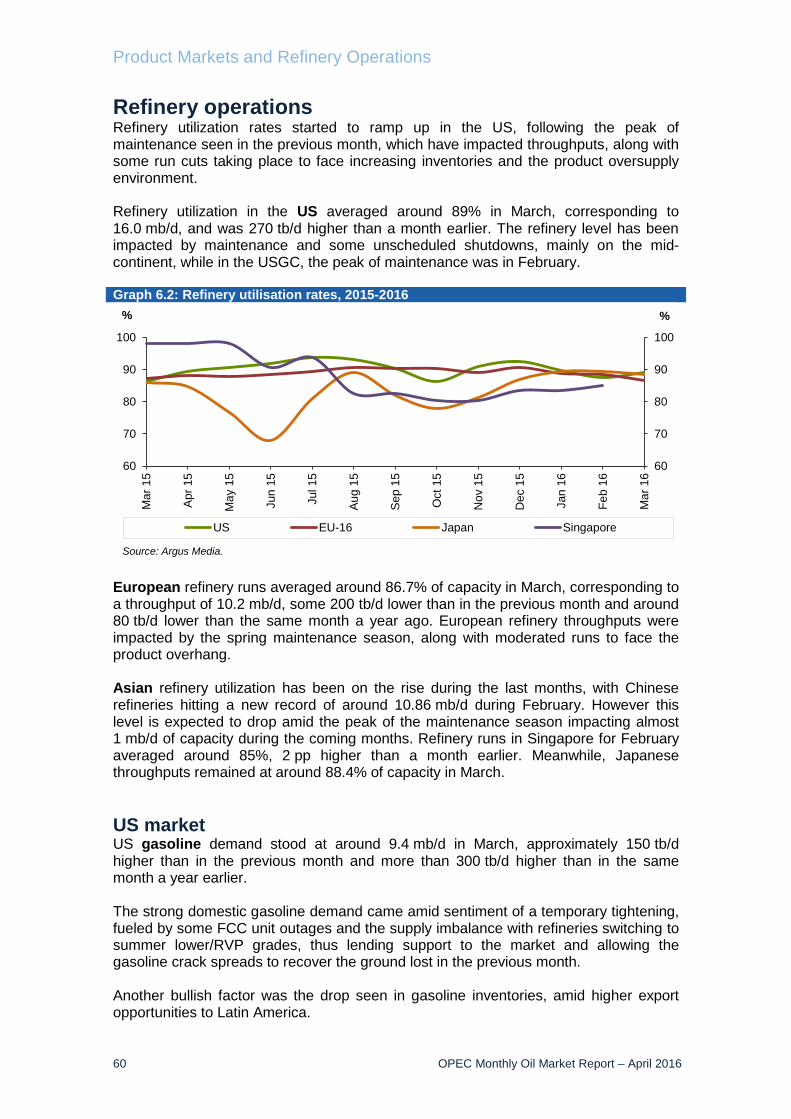
Product Markets and Refinery Operations
60 OPEC Monthly Oil Market Report – April 2016
Refinery operations Refinery utilization rates started to ramp up in the US, following the peak of maintenance seen in the previous month, which have impacted throughputs, along with some run cuts taking place to face increasing inventories and the product oversupply environment. Refinery utilization in the US averaged around 89% in March, corresponding to 16.0 mb/d, and was 270 tb/d higher than a month earlier. The refinery level has been impacted by maintenance and some unscheduled shutdowns, mainly on the mid-continent, while in the USGC, the peak of maintenance was in February. Graph 6.2: Refinery utilisation rates, 2015-2016
European refinery runs averaged around 86.7% of capacity in March, corresponding to a throughput of 10.2 mb/d, some 200 tb/d lower than in the previous month and around 80 tb/d lower than the same month a year ago. European refinery throughputs were impacted by the spring maintenance season, along with moderated runs to face the product overhang. Asian refinery utilization has been on the rise during the last months, with Chinese refineries hitting a new record of around 10.86 mb/d during February. However this level is expected to drop amid the peak of the maintenance season impacting almost 1 mb/d of capacity during the coming months. Refinery runs in Singapore for February averaged around 85%, 2 pp higher than a month earlier. Meanwhile, Japanese throughputs remained at around 88.4% of capacity in March. US market US gasoline demand stood at around 9.4 mb/d in March, approximately 150 tb/d higher than in the previous month and more than 300 tb/d higher than in the same month a year earlier. The strong domestic gasoline demand came amid sentiment of a temporary tightening, fueled by some FCC unit outages and the supply imbalance with refineries switching to summer lower/RVP grades, thus lending support to the market and allowing the gasoline crack spreads to recover the ground lost in the previous month. Another bullish factor was the drop seen in gasoline inventories, amid higher export opportunities to Latin America.
60
70
80
90
100
60
70
80
90
100
Mar
15
Apr 1
5
May
15
Jun
15
Jul 1
5
Aug
15
Sep
15
Oct
15
Nov
15
Dec
15
Jan
16
Feb
16
Mar
16
%%
US EU-16 Japan Singapore
Source: Argus Media.
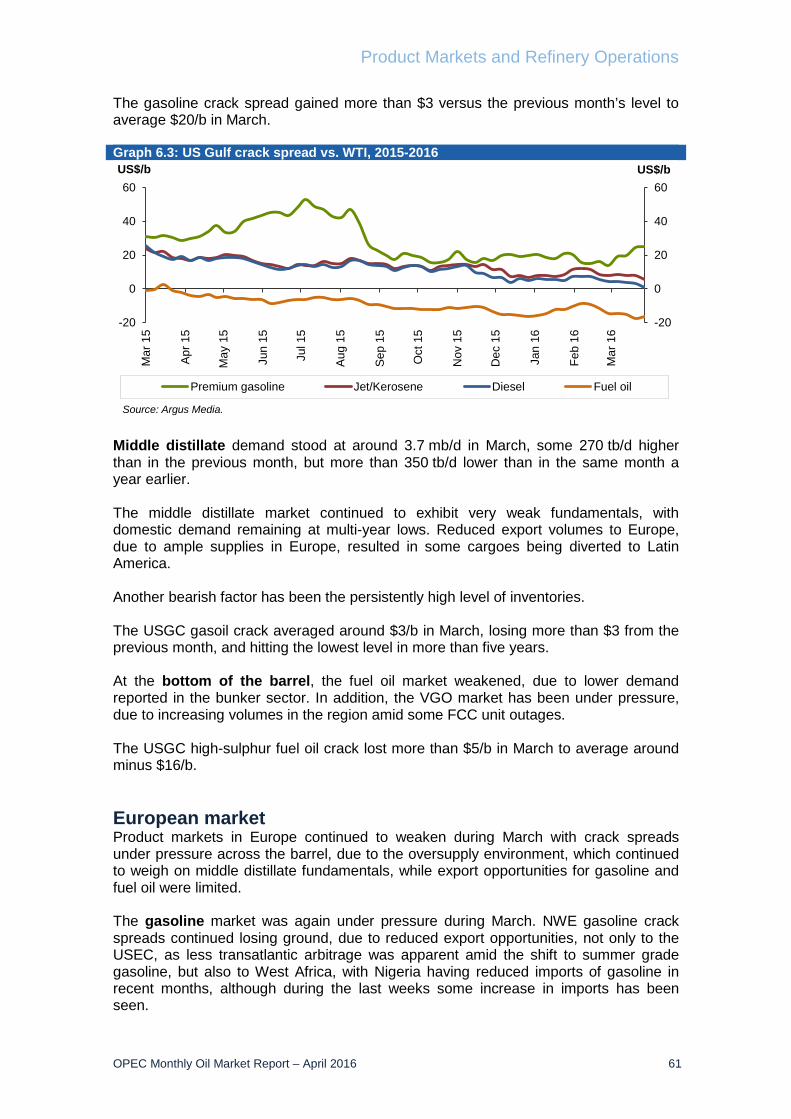
Product Markets and Refinery Operations
OPEC Monthly Oil Market Report – April 2016 61
The gasoline crack spread gained more than $3 versus the previous month’s level to average $20/b in March. Graph 6.3: US Gulf crack spread vs. WTI, 2015-2016
Middle distillate demand stood at around 3.7 mb/d in March, some 270 tb/d higher than in the previous month, but more than 350 tb/d lower than in the same month a year earlier. The middle distillate market continued to exhibit very weak fundamentals, with domestic demand remaining at multi-year lows. Reduced export volumes to Europe, due to ample supplies in Europe, resulted in some cargoes being diverted to Latin America. Another bearish factor has been the persistently high level of inventories. The USGC gasoil crack averaged around $3/b in March, losing more than $3 from the previous month, and hitting the lowest level in more than five years. At the bottom of the barrel, the fuel oil market weakened, due to lower demand reported in the bunker sector. In addition, the VGO market has been under pressure, due to increasing volumes in the region amid some FCC unit outages. The USGC high-sulphur fuel oil crack lost more than $5/b in March to average around minus $16/b. European market Product markets in Europe continued to weaken during March with crack spreads under pressure across the barrel, due to the oversupply environment, which continued to weigh on middle distillate fundamentals, while export opportunities for gasoline and fuel oil were limited. The gasoline market was again under pressure during March. NWE gasoline crack spreads continued losing ground, due to reduced export opportunities, not only to the USEC, as less transatlantic arbitrage was apparent amid the shift to summer grade gasoline, but also to West Africa, with Nigeria having reduced imports of gasoline in recent months, although during the last weeks some increase in imports has been seen.
-20
0
20
40
60
-20
0
20
40
60
Mar
15
Apr
15
May
15
Jun
15
Jul 1
5
Aug
15
Sep
15
Oct
15
Nov
15
Dec
15
Jan
16
Feb
16
Mar
16
US$/bUS$/b
Premium gasoline Jet/Kerosene Diesel Fuel oil
Source: Argus Media.
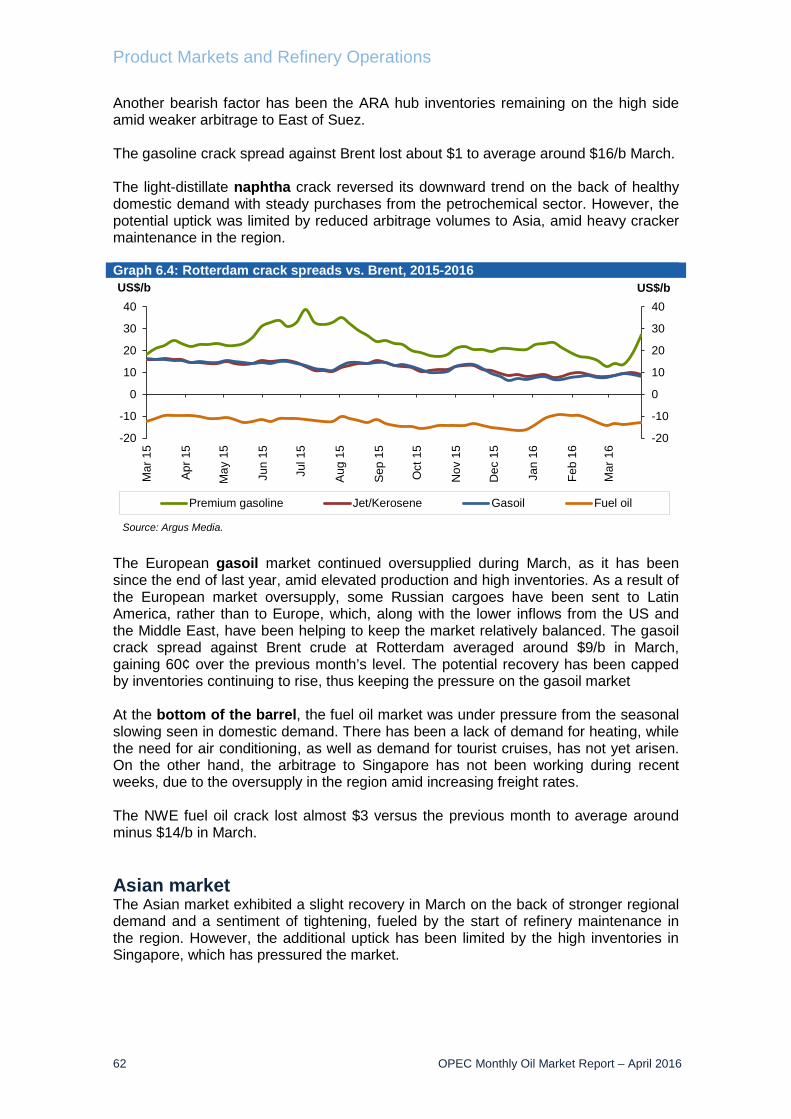
Product Markets and Refinery Operations
62 OPEC Monthly Oil Market Report – April 2016
Another bearish factor has been the ARA hub inventories remaining on the high side amid weaker arbitrage to East of Suez. The gasoline crack spread against Brent lost about $1 to average around $16/b March. The light-distillate naphtha crack reversed its downward trend on the back of healthy domestic demand with steady purchases from the petrochemical sector. However, the potential uptick was limited by reduced arbitrage volumes to Asia, amid heavy cracker maintenance in the region. Graph 6.4: Rotterdam crack spreads vs. Brent, 2015-2016
The European gasoil market continued oversupplied during March, as it has been since the end of last year, amid elevated production and high inventories. As a result of the European market oversupply, some Russian cargoes have been sent to Latin America, rather than to Europe, which, along with the lower inflows from the US and the Middle East, have been helping to keep the market relatively balanced. The gasoil crack spread against Brent crude at Rotterdam averaged around $9/b in March, gaining 60¢ over the previous month’s level. The potential recovery has been capped by inventories continuing to rise, thus keeping the pressure on the gasoil market At the bottom of the barrel, the fuel oil market was under pressure from the seasonal slowing seen in domestic demand. There has been a lack of demand for heating, while the need for air conditioning, as well as demand for tourist cruises, has not yet arisen. On the other hand, the arbitrage to Singapore has not been working during recent weeks, due to the oversupply in the region amid increasing freight rates. The NWE fuel oil crack lost almost $3 versus the previous month to average around minus $14/b in March. Asian market The Asian market exhibited a slight recovery in March on the back of stronger regional demand and a sentiment of tightening, fueled by the start of refinery maintenance in the region. However, the additional uptick has been limited by the high inventories in Singapore, which has pressured the market.
-20
-10
0
10
20
30
40
-20
-10
0
10
20
30
40
Mar
15
Apr
15
May
15
Jun
15
Jul 1
5
Aug
15
Sep
15
Oct
15
Nov
15
Dec
15
Jan
16
Feb
16
Mar
16
US$/bUS$/b
Premium gasoline Jet/Kerosene Gasoil Fuel oil
Source: Argus Media.
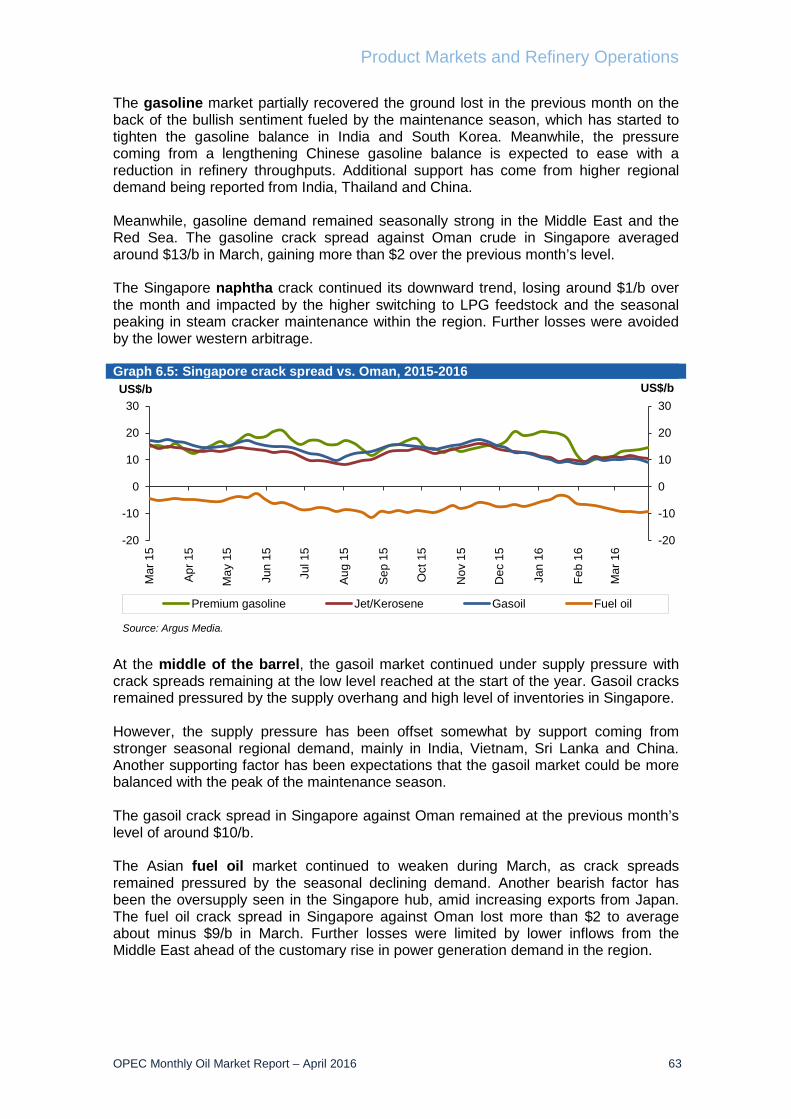
Product Markets and Refinery Operations
OPEC Monthly Oil Market Report – April 2016 63
The gasoline market partially recovered the ground lost in the previous month on the back of the bullish sentiment fueled by the maintenance season, which has started to tighten the gasoline balance in India and South Korea. Meanwhile, the pressure coming from a lengthening Chinese gasoline balance is expected to ease with a reduction in refinery throughputs. Additional support has come from higher regional demand being reported from India, Thailand and China. Meanwhile, gasoline demand remained seasonally strong in the Middle East and the Red Sea. The gasoline crack spread against Oman crude in Singapore averaged around $13/b in March, gaining more than $2 over the previous month’s level. The Singapore naphtha crack continued its downward trend, losing around $1/b over the month and impacted by the higher switching to LPG feedstock and the seasonal peaking in steam cracker maintenance within the region. Further losses were avoided by the lower western arbitrage. Graph 6.5: Singapore crack spread vs. Oman, 2015-2016
At the middle of the barrel, the gasoil market continued under supply pressure with crack spreads remaining at the low level reached at the start of the year. Gasoil cracks remained pressured by the supply overhang and high level of inventories in Singapore. However, the supply pressure has been offset somewhat by support coming from stronger seasonal regional demand, mainly in India, Vietnam, Sri Lanka and China. Another supporting factor has been expectations that the gasoil market could be more balanced with the peak of the maintenance season. The gasoil crack spread in Singapore against Oman remained at the previous month’s level of around $10/b. The Asian fuel oil market continued to weaken during March, as crack spreads remained pressured by the seasonal declining demand. Another bearish factor has been the oversupply seen in the Singapore hub, amid increasing exports from Japan. The fuel oil crack spread in Singapore against Oman lost more than $2 to average about minus $9/b in March. Further losses were limited by lower inflows from the Middle East ahead of the customary rise in power generation demand in the region.
-20
-10
0
10
20
30
-20
-10
0
10
20
30
Mar
15
Apr
15
May
15
Jun
15
Jul 1
5
Aug
15
Sep
15
Oct
15
Nov
15
Dec
15
Jan
16
Feb
16
Mar
16
US$/bUS$/b
Premium gasoline Jet/Kerosene Gasoil Fuel oil
Source: Argus Media.
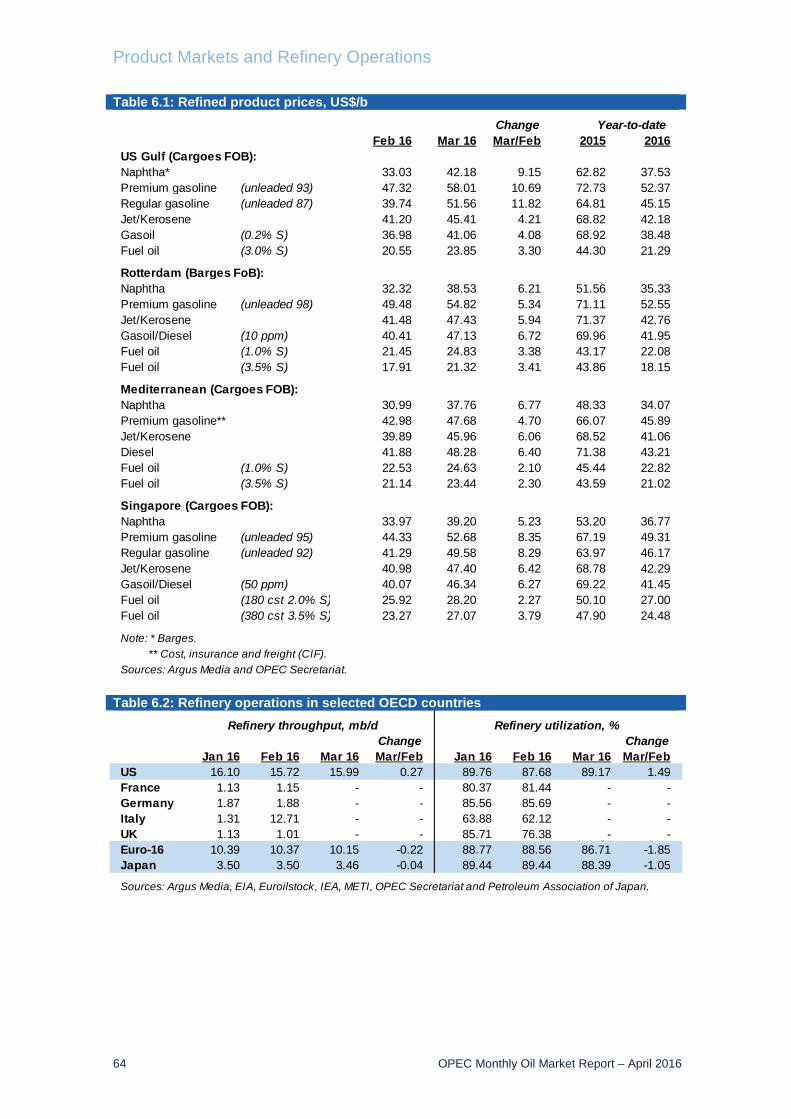
Product Markets and Refinery Operations
64 OPEC Monthly Oil Market Report – April 2016
Table 6.1: Refined product prices, US$/b
Table 6.2: Refinery operations in selected OECD countries
ChangeFeb 16 Mar 16 Mar/Feb 2015 2016
Naphtha* 33.03 42.18 9.15 62.82 37.53Premium gasoline (unleaded 93) 47.32 58.01 10.69 72.73 52.37Regular gasoline (unleaded 87) 39.74 51.56 11.82 64.81 45.15Jet/Kerosene 41.20 45.41 4.21 68.82 42.18Gasoil (0.2% S) 36.98 41.06 4.08 68.92 38.48Fuel oil (3.0% S) 20.55 23.85 3.30 44.30 21.29
Naphtha 32.32 38.53 6.21 51.56 35.33Premium gasoline (unleaded 98) 49.48 54.82 5.34 71.11 52.55Jet/Kerosene 41.48 47.43 5.94 71.37 42.76Gasoil/Diesel (10 ppm) 40.41 47.13 6.72 69.96 41.95Fuel oil (1.0% S) 21.45 24.83 3.38 43.17 22.08Fuel oil (3.5% S) 17.91 21.32 3.41 43.86 18.15
Naphtha 30.99 37.76 6.77 48.33 34.07Premium gasoline** 42.98 47.68 4.70 66.07 45.89Jet/Kerosene 39.89 45.96 6.06 68.52 41.06Diesel 41.88 48.28 6.40 71.38 43.21Fuel oil (1.0% S) 22.53 24.63 2.10 45.44 22.82Fuel oil (3.5% S) 21.14 23.44 2.30 43.59 21.02
Naphtha 33.97 39.20 5.23 53.20 36.77Premium gasoline (unleaded 95) 44.33 52.68 8.35 67.19 49.31Regular gasoline (unleaded 92) 41.29 49.58 8.29 63.97 46.17Jet/Kerosene 40.98 47.40 6.42 68.78 42.29Gasoil/Diesel (50 ppm) 40.07 46.34 6.27 69.22 41.45Fuel oil (180 cst 2.0% S) 25.92 28.20 2.27 50.10 27.00Fuel oil (380 cst 3.5% S) 23.27 27.07 3.79 47.90 24.48
Sources: Argus Media and OPEC Secretariat.
Year-to-date
Note: * Barges. ** Cost, insurance and freight (CIF).
US Gulf (Cargoes FOB):
Rotterdam (Barges FoB):
Mediterranean (Cargoes FOB):
Singapore (Cargoes FOB):
Change ChangeJan 16 Feb 16 Mar 16 Mar/Feb Jan 16 Feb 16 Mar 16 Mar/Feb
US 16.10 15.72 15.99 0.27 89.76 87.68 89.17 1.49France 1.13 1.15 - - 80.37 81.44 - -Germany 1.87 1.88 - - 85.56 85.69 - -Italy 1.31 12.71 - - 63.88 62.12 - -UK 1.13 1.01 - - 85.71 76.38 - -Euro-16 10.39 10.37 10.15 -0.22 88.77 88.56 86.71 -1.85Japan 3.50 3.50 3.46 -0.04 89.44 89.44 88.39 -1.05
Sources: Argus Media, EIA, Euroilstock, IEA, METI, OPEC Secretariat and Petroleum Association of Japan.
Refinery throughput, mb/d Refinery utilization, %
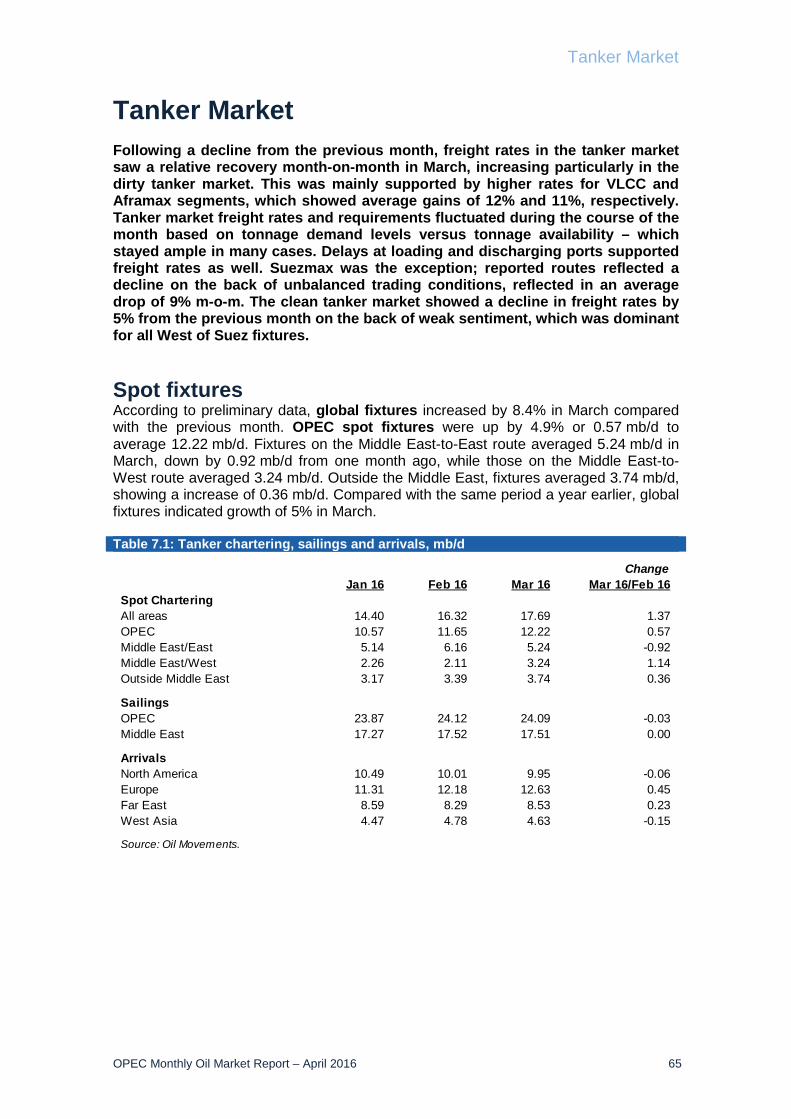
Tanker Market
OPEC Monthly Oil Market Report – April 2016 65
Tanker Market Following a decline from the previous month, freight rates in the tanker market saw a relative recovery month-on-month in March, increasing particularly in the dirty tanker market. This was mainly supported by higher rates for VLCC and Aframax segments, which showed average gains of 12% and 11%, respectively. Tanker market freight rates and requirements fluctuated during the course of the month based on tonnage demand levels versus tonnage availability – which stayed ample in many cases. Delays at loading and discharging ports supported freight rates as well. Suezmax was the exception; reported routes reflected a decline on the back of unbalanced trading conditions, reflected in an average drop of 9% m-o-m. The clean tanker market showed a decline in freight rates by 5% from the previous month on the back of weak sentiment, which was dominant for all West of Suez fixtures. Spot fixtures According to preliminary data, global fixtures increased by 8.4% in March compared with the previous month. OPEC spot fixtures were up by 4.9% or 0.57 mb/d to average 12.22 mb/d. Fixtures on the Middle East-to-East route averaged 5.24 mb/d in March, down by 0.92 mb/d from one month ago, while those on the Middle East-to-West route averaged 3.24 mb/d. Outside the Middle East, fixtures averaged 3.74 mb/d, showing a increase of 0.36 mb/d. Compared with the same period a year earlier, global fixtures indicated growth of 5% in March. Table 7.1: Tanker chartering, sailings and arrivals, mb/d
ChangeJan 16 Feb 16 Mar 16 Mar 16/Feb 16
Spot CharteringAll areas 14.40 16.32 17.69 1.37OPEC 10.57 11.65 12.22 0.57Middle East/East 5.14 6.16 5.24 -0.92Middle East/West 2.26 2.11 3.24 1.14Outside Middle East 3.17 3.39 3.74 0.36
SailingsOPEC 23.87 24.12 24.09 -0.03Middle East 17.27 17.52 17.51 0.00
ArrivalsNorth America 10.49 10.01 9.95 -0.06Europe 11.31 12.18 12.63 0.45Far East 8.59 8.29 8.53 0.23West Asia 4.47 4.78 4.63 -0.15
Source: Oil Movements.
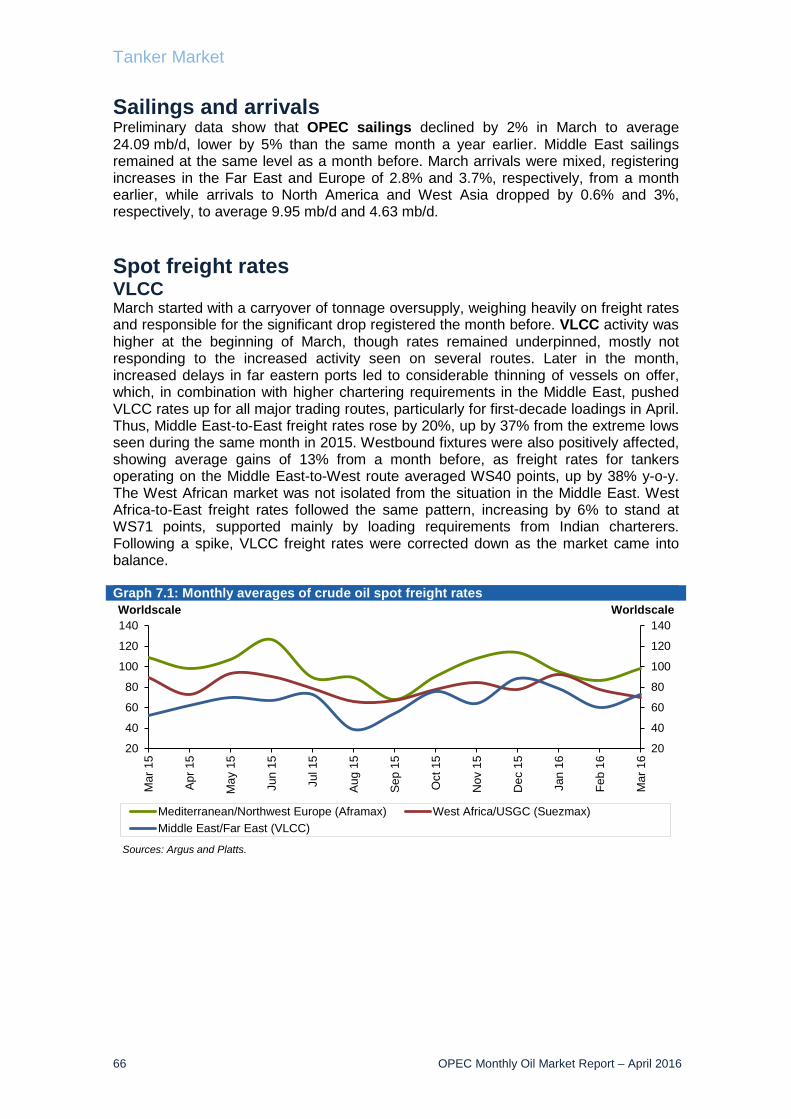
Tanker Market
66 OPEC Monthly Oil Market Report – April 2016
Sailings and arrivals Preliminary data show that OPEC sailings declined by 2% in March to average 24.09 mb/d, lower by 5% than the same month a year earlier. Middle East sailings remained at the same level as a month before. March arrivals were mixed, registering increases in the Far East and Europe of 2.8% and 3.7%, respectively, from a month earlier, while arrivals to North America and West Asia dropped by 0.6% and 3%, respectively, to average 9.95 mb/d and 4.63 mb/d. Spot freight rates VLCC March started with a carryover of tonnage oversupply, weighing heavily on freight rates and responsible for the significant drop registered the month before. VLCC activity was higher at the beginning of March, though rates remained underpinned, mostly not responding to the increased activity seen on several routes. Later in the month, increased delays in far eastern ports led to considerable thinning of vessels on offer, which, in combination with higher chartering requirements in the Middle East, pushed VLCC rates up for all major trading routes, particularly for first-decade loadings in April. Thus, Middle East-to-East freight rates rose by 20%, up by 37% from the extreme lows seen during the same month in 2015. Westbound fixtures were also positively affected, showing average gains of 13% from a month before, as freight rates for tankers operating on the Middle East-to-West route averaged WS40 points, up by 38% y-o-y. The West African market was not isolated from the situation in the Middle East. West Africa-to-East freight rates followed the same pattern, increasing by 6% to stand at WS71 points, supported mainly by loading requirements from Indian charterers. Following a spike, VLCC freight rates were corrected down as the market came into balance. Graph 7.1: Monthly averages of crude oil spot freight rates
20
40
60
80
100
120
140
20
40
60
80
100
120
140
Mar
15
Apr 1
5
May
15
Jun
15
Jul 1
5
Aug
15
Sep
15
Oct
15
Nov
15
Dec
15
Jan
16
Feb
16
Mar
16
WorldscaleWorldscale
Mediterranean/Northwest Europe (Aframax) West Africa/USGC (Suezmax)Middle East/Far East (VLCC)
Sources: Argus and Platts.

Tanker Market
OPEC Monthly Oil Market Report – April 2016 67
Suezmax The Suezmax market was unbalanced in March, continuing to show a significant drop in freight rates similar to that seen the previous month. Increasing Suezmax tonnage buildup was the main reason behind the drop in freight rates. The increase in activity levels at a later stage was not enough to reverse a declining trend, as freight rates were often flat, despite the relative benefit of a firming VLCC market and split cargo options, in addition to reported storage requirements. Suezmax average freight rates dropped on reported routes, despite some fluctuation on the back of ullage problems in the East, which caused uncertainty in loading programmes. Moreover, reduced delays in the Turkish Straits added to softening rates. Freight rates for tankers on the West Africa-to-US Gulf Coast (USGC) route declined by 11% to average WS69 points, and Northwest Europe (NWE)-to-USGC freight rates averaged WS70 points, down by 6% from a month earlier. Freight rates on both routes remained lower than for the same months in 2015, by 22% and 11%, respectively. Table 7.2: Spot tanker crude freight rates, Worldscale
Aframax Aframax freight rates saw a mixed pattern in March. As seen in larger vessels, Aframax also suffered from increased availability at the beginning of the month, in combination with moderate tonnage demand. In the North Sea and the Baltics, freight rates were mostly flat during the month, pinned to low levels. However, loading requirements were relatively better when April cargoes came into the market. The Aframax market achieved gains in March in both directions of the Mediterranean. Freight rates on the Mediterranean-to-Mediterranean and Mediterranean-to-NWE routes increased from one month ago by 16% and 13%, to average WS106 and WS98 points, respectively. Although Mediterranean rates for March are considered to be the highest in the first quarter of 2016, they remain relatively lower than in the previous year by 9% and 10%, respectively. Rates in the Caribbean were affected by delays in the US Gulf as vessels with confirmed loading schedules were limited. Rates in the Caribbean saw a significant drop later, mainly due to a lack of firm inquiries, and the tonnage position list was prolonged. Bad weather also affected rates negatively, as ship owners hesitated to offer their vessels under unconfirmed operating conditions. Thus, freight rates for Aframax tankers operating on the Caribbean-to-US East Coast (USEC) declined by 11% from the previous month to average WS117 points.
Size Change1,000 DWT Jan 16 Feb 16 Mar 16 Mar 16/Feb 16
CrudeMiddle East/East 230-280 79 60 73 13Middle East/West 270-285 58 35 41 5West Africa/East 260 83 67 72 5West Africa/US Gulf Coast 130-135 92 78 70 -9Northwest Europe/US Gulf Coast 130-135 83 67 63 -4Indonesia/East 80-85 126 111 147 36Caribbean/US East Coast 80-85 122 132 115 -17Mediterranean/Mediterranean 80-85 102 91 106 15Mediterranean/Northwest Europe 80-85 96 86 98 12
Sources: Argus and Platts.
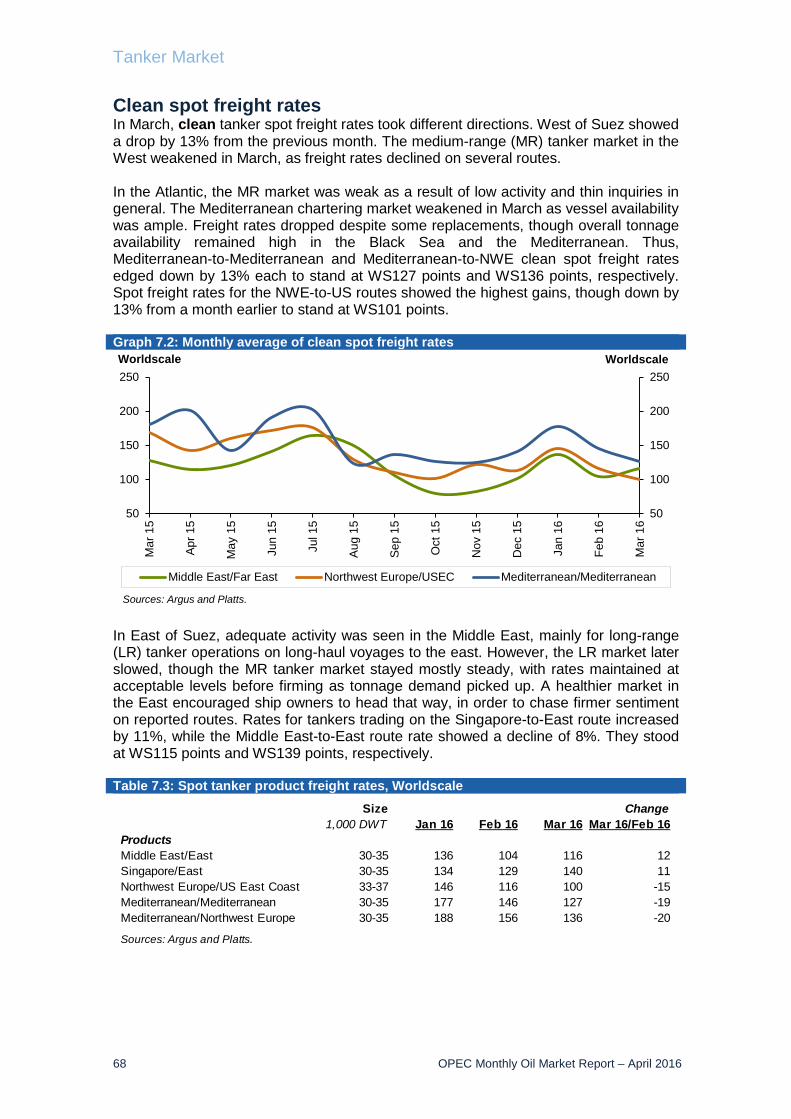
Tanker Market
68 OPEC Monthly Oil Market Report – April 2016
Clean spot freight rates In March, clean tanker spot freight rates took different directions. West of Suez showed a drop by 13% from the previous month. The medium-range (MR) tanker market in the West weakened in March, as freight rates declined on several routes. In the Atlantic, the MR market was weak as a result of low activity and thin inquiries in general. The Mediterranean chartering market weakened in March as vessel availability was ample. Freight rates dropped despite some replacements, though overall tonnage availability remained high in the Black Sea and the Mediterranean. Thus, Mediterranean-to-Mediterranean and Mediterranean-to-NWE clean spot freight rates edged down by 13% each to stand at WS127 points and WS136 points, respectively. Spot freight rates for the NWE-to-US routes showed the highest gains, though down by 13% from a month earlier to stand at WS101 points. Graph 7.2: Monthly average of clean spot freight rates
In East of Suez, adequate activity was seen in the Middle East, mainly for long-range (LR) tanker operations on long-haul voyages to the east. However, the LR market later slowed, though the MR tanker market stayed mostly steady, with rates maintained at acceptable levels before firming as tonnage demand picked up. A healthier market in the East encouraged ship owners to head that way, in order to chase firmer sentiment on reported routes. Rates for tankers trading on the Singapore-to-East route increased by 11%, while the Middle East-to-East route rate showed a decline of 8%. They stood at WS115 points and WS139 points, respectively. Table 7.3: Spot tanker product freight rates, Worldscale
50
100
150
200
250
50
100
150
200
250
Mar
15
Apr
15
May
15
Jun
15
Jul 1
5
Aug
15
Sep
15
Oct
15
Nov
15
Dec
15
Jan
16
Feb
16
Mar
16
WorldscaleWorldscale
Middle East/Far East Northwest Europe/USEC Mediterranean/Mediterranean
Sources: Argus and Platts.
Size Change1,000 DWT Jan 16 Feb 16 Mar 16 Mar 16/Feb 16
ProductsMiddle East/East 30-35 136 104 116 12Singapore/East 30-35 134 129 140 11Northwest Europe/US East Coast 33-37 146 116 100 -15Mediterranean/Mediterranean 30-35 177 146 127 -19Mediterranean/Northwest Europe 30-35 188 156 136 -20
Sources: Argus and Platts.
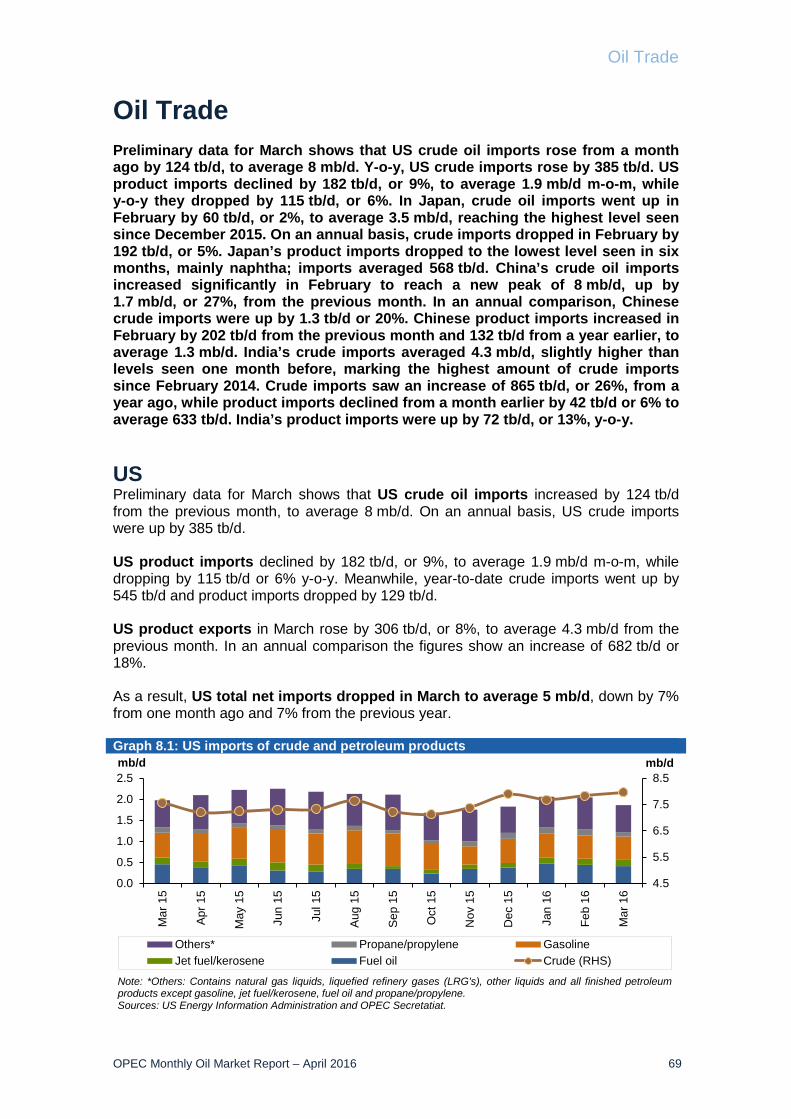
Oil Trade
OPEC Monthly Oil Market Report – April 2016 69
Oil Trade Preliminary data for March shows that US crude oil imports rose from a month ago by 124 tb/d, to average 8 mb/d. Y-o-y, US crude imports rose by 385 tb/d. US product imports declined by 182 tb/d, or 9%, to average 1.9 mb/d m-o-m, while y-o-y they dropped by 115 tb/d, or 6%. In Japan, crude oil imports went up in February by 60 tb/d, or 2%, to average 3.5 mb/d, reaching the highest level seen since December 2015. On an annual basis, crude imports dropped in February by 192 tb/d, or 5%. Japan’s product imports dropped to the lowest level seen in six months, mainly naphtha; imports averaged 568 tb/d. China’s crude oil imports increased significantly in February to reach a new peak of 8 mb/d, up by 1.7 mb/d, or 27%, from the previous month. In an annual comparison, Chinese crude imports were up by 1.3 tb/d or 20%. Chinese product imports increased in February by 202 tb/d from the previous month and 132 tb/d from a year earlier, to average 1.3 mb/d. India’s crude imports averaged 4.3 mb/d, slightly higher than levels seen one month before, marking the highest amount of crude imports since February 2014. Crude imports saw an increase of 865 tb/d, or 26%, from a year ago, while product imports declined from a month earlier by 42 tb/d or 6% to average 633 tb/d. India’s product imports were up by 72 tb/d, or 13%, y-o-y. US Preliminary data for March shows that US crude oil imports increased by 124 tb/d from the previous month, to average 8 mb/d. On an annual basis, US crude imports were up by 385 tb/d. US product imports declined by 182 tb/d, or 9%, to average 1.9 mb/d m-o-m, while dropping by 115 tb/d or 6% y-o-y. Meanwhile, year-to-date crude imports went up by 545 tb/d and product imports dropped by 129 tb/d. US product exports in March rose by 306 tb/d, or 8%, to average 4.3 mb/d from the previous month. In an annual comparison the figures show an increase of 682 tb/d or 18%. As a result, US total net imports dropped in March to average 5 mb/d, down by 7% from one month ago and 7% from the previous year. Graph 8.1: US imports of crude and petroleum products
4.5
5.5
6.5
7.5
8.5
0.0
0.5
1.0
1.5
2.0
2.5
Mar
15
Apr
15
May
15
Jun
15
Jul 1
5
Aug
15
Sep
15
Oct
15
Nov
15
Dec
15
Jan
16
Feb
16
Mar
16
mb/dmb/d
Others* Propane/propylene GasolineJet fuel/kerosene Fuel oil Crude (RHS)
Note: *Others: Contains natural gas liquids, liquefied refinery gases (LRG's), other liquids and all finished petroleumproducts except gasoline, jet fuel/kerosene, fuel oil and propane/propylene.Sources: US Energy Information Administration and OPEC Secretatiat.
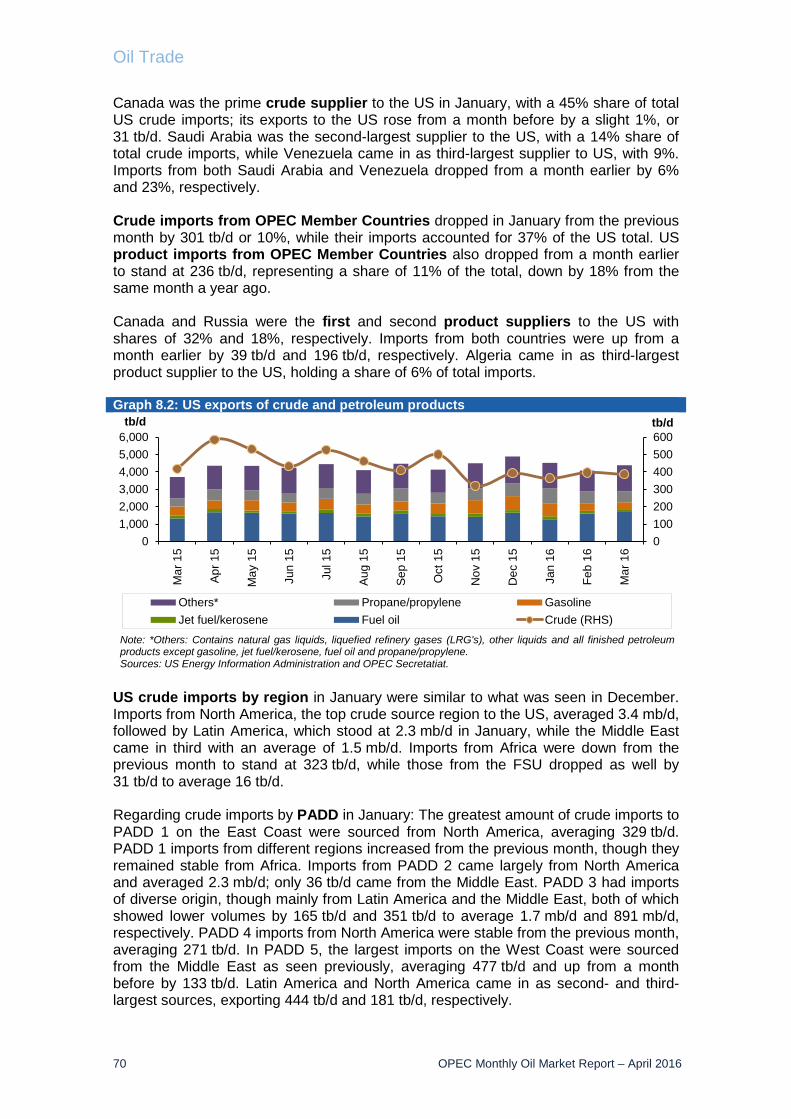
Oil Trade
70 OPEC Monthly Oil Market Report – April 2016
Canada was the prime crude supplier to the US in January, with a 45% share of total US crude imports; its exports to the US rose from a month before by a slight 1%, or 31 tb/d. Saudi Arabia was the second-largest supplier to the US, with a 14% share of total crude imports, while Venezuela came in as third-largest supplier to US, with 9%. Imports from both Saudi Arabia and Venezuela dropped from a month earlier by 6% and 23%, respectively. Crude imports from OPEC Member Countries dropped in January from the previous month by 301 tb/d or 10%, while their imports accounted for 37% of the US total. US product imports from OPEC Member Countries also dropped from a month earlier to stand at 236 tb/d, representing a share of 11% of the total, down by 18% from the same month a year ago. Canada and Russia were the first and second product suppliers to the US with shares of 32% and 18%, respectively. Imports from both countries were up from a month earlier by 39 tb/d and 196 tb/d, respectively. Algeria came in as third-largest product supplier to the US, holding a share of 6% of total imports. Graph 8.2: US exports of crude and petroleum products
US crude imports by region in January were similar to what was seen in December. Imports from North America, the top crude source region to the US, averaged 3.4 mb/d, followed by Latin America, which stood at 2.3 mb/d in January, while the Middle East came in third with an average of 1.5 mb/d. Imports from Africa were down from the previous month to stand at 323 tb/d, while those from the FSU dropped as well by 31 tb/d to average 16 tb/d. Regarding crude imports by PADD in January: The greatest amount of crude imports to PADD 1 on the East Coast were sourced from North America, averaging 329 tb/d. PADD 1 imports from different regions increased from the previous month, though they remained stable from Africa. Imports from PADD 2 came largely from North America and averaged 2.3 mb/d; only 36 tb/d came from the Middle East. PADD 3 had imports of diverse origin, though mainly from Latin America and the Middle East, both of which showed lower volumes by 165 tb/d and 351 tb/d to average 1.7 mb/d and 891 mb/d, respectively. PADD 4 imports from North America were stable from the previous month, averaging 271 tb/d. In PADD 5, the largest imports on the West Coast were sourced from the Middle East as seen previously, averaging 477 tb/d and up from a month before by 133 tb/d. Latin America and North America came in as second- and third-largest sources, exporting 444 tb/d and 181 tb/d, respectively.
0100200300400500600
01,0002,0003,0004,0005,0006,000
Mar
15
Apr
15
May
15
Jun
15
Jul 1
5
Aug
15
Sep
15
Oct
15
Nov
15
Dec
15
Jan
16
Feb
16
Mar
16
tb/dtb/d
Others* Propane/propylene GasolineJet fuel/kerosene Fuel oil Crude (RHS)
Note: *Others: Contains natural gas liquids, liquefied refinery gases (LRG's), other liquids and all finished petroleumproducts except gasoline, jet fuel/kerosene, fuel oil and propane/propylene.Sources: US Energy Information Administration and OPEC Secretatiat.
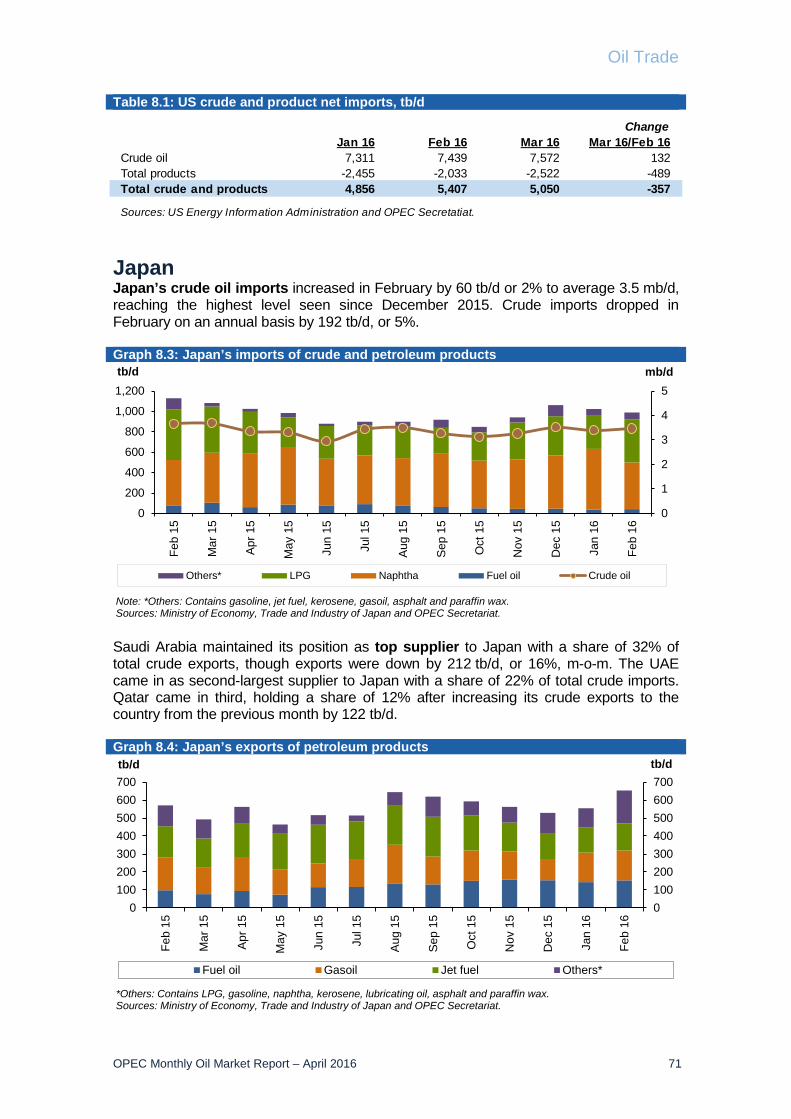
Oil Trade
OPEC Monthly Oil Market Report – April 2016 71
Table 8.1: US crude and product net imports, tb/d
Japan Japan’s crude oil imports increased in February by 60 tb/d or 2% to average 3.5 mb/d, reaching the highest level seen since December 2015. Crude imports dropped in February on an annual basis by 192 tb/d, or 5%. Graph 8.3: Japan’s imports of crude and petroleum products
Saudi Arabia maintained its position as top supplier to Japan with a share of 32% of total crude exports, though exports were down by 212 tb/d, or 16%, m-o-m. The UAE came in as second-largest supplier to Japan with a share of 22% of total crude imports. Qatar came in third, holding a share of 12% after increasing its crude exports to the country from the previous month by 122 tb/d. Graph 8.4: Japan’s exports of petroleum products
0
1
2
3
4
5
0
200
400
600
800
1,000
1,200
Feb
15
Mar
15
Apr
15
May
15
Jun
15
Jul 1
5
Aug
15
Sep
15
Oct
15
Nov
15
Dec
15
Jan
16
Feb
16
mb/dtb/d
Others* LPG Naphtha Fuel oil Crude oil
Note: *Others: Contains gasoline, jet fuel, kerosene, gasoil, asphalt and paraffin wax.Sources: Ministry of Economy, Trade and Industry of Japan and OPEC Secretariat.
0100200300400500600700
0100200300400500600700
Feb
15
Mar
15
Apr 1
5
May
15
Jun
15
Jul 1
5
Aug
15
Sep
15
Oct
15
Nov
15
Dec
15
Jan
16
Feb
16
tb/dtb/d
Fuel oil Gasoil Jet fuel Others*
*Others: Contains LPG, gasoline, naphtha, kerosene, lubricating oil, asphalt and paraffin wax.Sources: Ministry of Economy, Trade and Industry of Japan and OPEC Secretariat.
ChangeJan 16 Feb 16 Mar 16 Mar 16/Feb 16
Crude oil 7,311 7,439 7,572 132Total products -2,455 -2,033 -2,522 -489Total crude and products 4,856 5,407 5,050 -357
Sources: US Energy Information Administration and OPEC Secretatiat.

Oil Trade
72 OPEC Monthly Oil Market Report – April 2016
Japan’s product imports dropped in February by 130 tb/d to average 568 tb/d, the lowest figure in more than six months. The drop in Japanese product imports came as a result of lower imports of naphtha, which dropped by 23%. Moreover, Japan didn’t import any jet fuel in February. At the same time, Japan’s domestic retail sales rose by 0.5% from the previous year. Japanese product exports in February were up from the previous month by 99 tb/d to average 653 tb/d, the highest since May 2013. Accordingly, Japan’s net imports dropped in February by 169 tb/d m-o-m to average 3.4 mb/d, down by 342 tb/d y-o-y. Table 8.2: Japan’s crude and product net imports, tb/d
China China’s crude oil imports increased significantly in February to reach a new peak of 8 mb/d, up by 1.7 mb/d or 27% from the previous month. In an annual comparison, the country’s crude imports rose by 1.3 mb/d or 20%. Year-to-date, the figures reflect an increase of 521 tb/d, or 8%. In February, China reported high refinery runs and utilization, up by 520 tb/d. Saudi Arabia, Angola and Russia were the top crude suppliers to China in February, with shares of 17% 15% and 12%, respectively. In February, all top suppliers raised their exports to China by 383 tb/d, 491 tb/d and 241 tb/d, respectively, from one month before, to meet increasing import demand. Graph 8.5: China’s imports of crude and petroleum products
China’s product imports also increased in February by 202 tb/d from the previous month, and by 132 tb/d from a year earlier, to average 1.3 mb/d.
0
2,000
4,000
6,000
8,000
10,000
0
400
800
1,200
1,600
Feb
15
Mar
15
Apr 1
5
May
15
Jun
15
Jul 1
5
Aug
15
Sep
15
Oct
15
Nov
15
Dec
15
Jan
16
Feb
16
tb/dtb/d
Others LPG Naphtha Gasoline Jet fuelDiesel Fuel oil Asphalt Crude (RHS)
Sources: Argus China Petroleum and China, Oil and Gas Petrochemicals and OPEC Secretariat.
ChangeDec 15 Jan 16 Feb 16 Feb 16/Jan 16
Crude oil 3,508 3,402 3,462 60Total products 149 143 -85 -229Total crude and products 3,657 3,545 3,377 -169
Sources: Ministry of Economy, Trade and Industry of Japan and OPEC Secretariat.
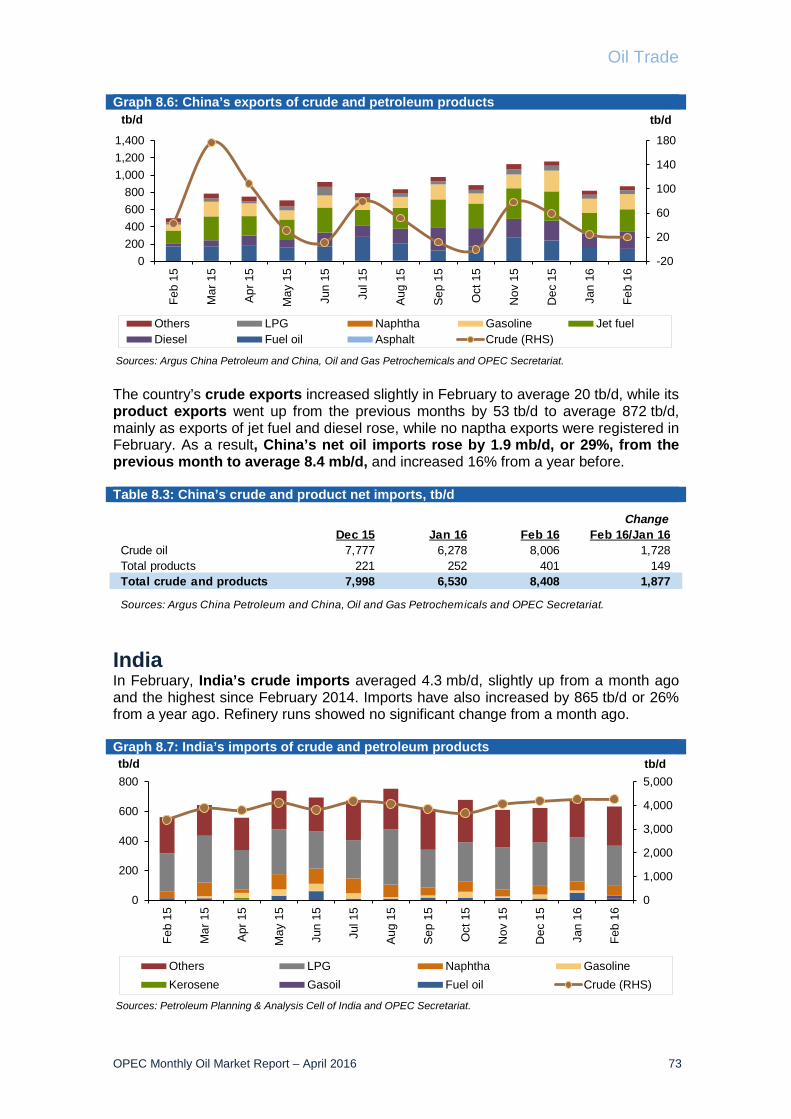
Oil Trade
OPEC Monthly Oil Market Report – April 2016 73
Graph 8.6: China’s exports of crude and petroleum products
The country’s crude exports increased slightly in February to average 20 tb/d, while its product exports went up from the previous months by 53 tb/d to average 872 tb/d, mainly as exports of jet fuel and diesel rose, while no naptha exports were registered in February. As a result, China’s net oil imports rose by 1.9 mb/d, or 29%, from the previous month to average 8.4 mb/d, and increased 16% from a year before. Table 8.3: China’s crude and product net imports, tb/d
India In February, India’s crude imports averaged 4.3 mb/d, slightly up from a month ago and the highest since February 2014. Imports have also increased by 865 tb/d or 26% from a year ago. Refinery runs showed no significant change from a month ago. Graph 8.7: India’s imports of crude and petroleum products
-20
20
60
100
140
180
0200400600800
1,0001,2001,400
Feb
15
Mar
15
Apr
15
May
15
Jun
15
Jul 1
5
Aug
15
Sep
15
Oct
15
Nov
15
Dec
15
Jan
16
Feb
16
tb/dtb/d
Others LPG Naphtha Gasoline Jet fuelDiesel Fuel oil Asphalt Crude (RHS)
Sources: Argus China Petroleum and China, Oil and Gas Petrochemicals and OPEC Secretariat.
0
1,000
2,000
3,000
4,000
5,000
0
200
400
600
800
Feb
15
Mar
15
Apr
15
May
15
Jun
15
Jul 1
5
Aug
15
Sep
15
Oct
15
Nov
15
Dec
15
Jan
16
Feb
16
tb/dtb/d
Others LPG Naphtha GasolineKerosene Gasoil Fuel oil Crude (RHS)
Sources: Petroleum Planning & Analysis Cell of India and OPEC Secretariat.
ChangeDec 15 Jan 16 Feb 16 Feb 16/Jan 16
Crude oil 7,777 6,278 8,006 1,728Total products 221 252 401 149Total crude and products 7,998 6,530 8,408 1,877
Sources: Argus China Petroleum and China, Oil and Gas Petrochemicals and OPEC Secretariat.
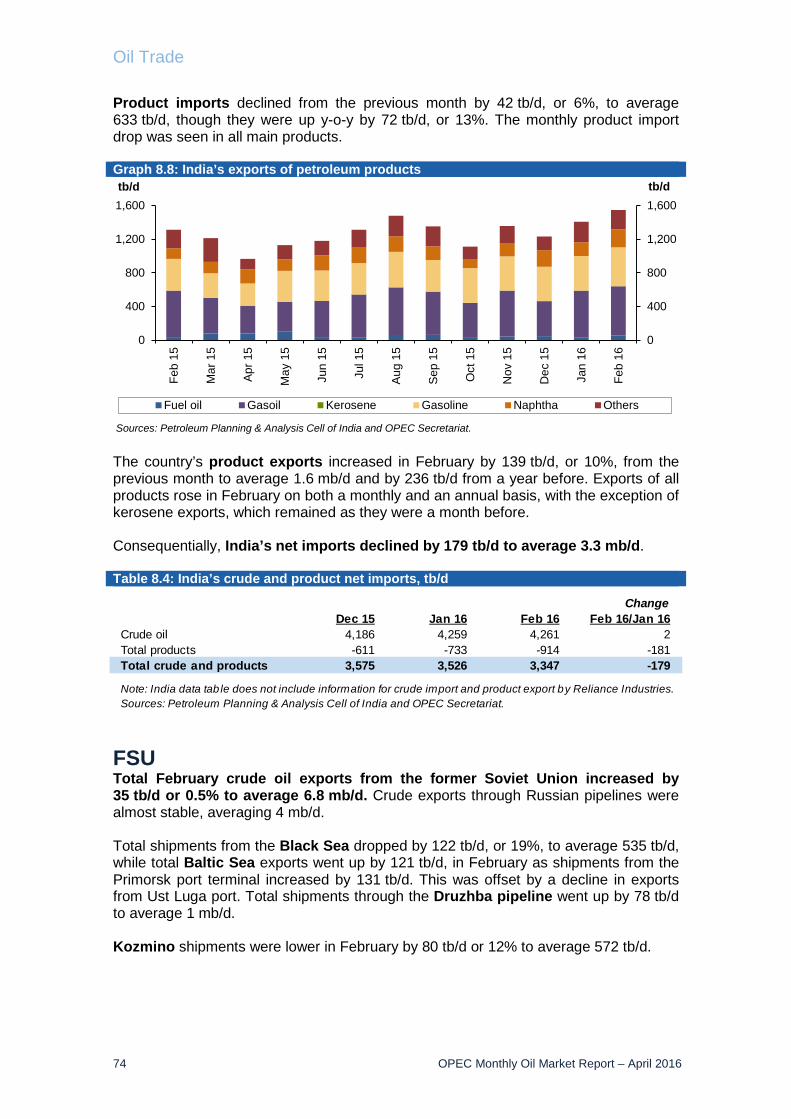
Oil Trade
74 OPEC Monthly Oil Market Report – April 2016
Product imports declined from the previous month by 42 tb/d, or 6%, to average 633 tb/d, though they were up y-o-y by 72 tb/d, or 13%. The monthly product import drop was seen in all main products. Graph 8.8: India’s exports of petroleum products
The country’s product exports increased in February by 139 tb/d, or 10%, from the previous month to average 1.6 mb/d and by 236 tb/d from a year before. Exports of all products rose in February on both a monthly and an annual basis, with the exception of kerosene exports, which remained as they were a month before. Consequentially, India’s net imports declined by 179 tb/d to average 3.3 mb/d. Table 8.4: India’s crude and product net imports, tb/d
FSU Total February crude oil exports from the former Soviet Union increased by 35 tb/d or 0.5% to average 6.8 mb/d. Crude exports through Russian pipelines were almost stable, averaging 4 mb/d. Total shipments from the Black Sea dropped by 122 tb/d, or 19%, to average 535 tb/d, while total Baltic Sea exports went up by 121 tb/d, in February as shipments from the Primorsk port terminal increased by 131 tb/d. This was offset by a decline in exports from Ust Luga port. Total shipments through the Druzhba pipeline went up by 78 tb/d to average 1 mb/d. Kozmino shipments were lower in February by 80 tb/d or 12% to average 572 tb/d.
0
400
800
1,200
1,600
0
400
800
1,200
1,600
Feb
15
Mar
15
Apr 1
5
May
15
Jun
15
Jul 1
5
Aug
15
Sep
15
Oct
15
Nov
15
Dec
15
Jan
16
Feb
16
tb/dtb/d
Fuel oil Gasoil Kerosene Gasoline Naphtha Others
Sources: Petroleum Planning & Analysis Cell of India and OPEC Secretariat.
ChangeDec 15 Jan 16 Feb 16 Feb 16/Jan 16
Crude oil 4,186 4,259 4,261 2Total products -611 -733 -914 -181Total crude and products 3,575 3,526 3,347 -179
Note: India data tab le does not include information for crude import and product export by Reliance Industries.Sources: Petroleum Planning & Analysis Cell of India and OPEC Secretariat.
Oil Trade
OPEC Monthly Oil Market Report – April 2016 75
Exports through the Lukoil system increased from the previous month in the Barents Sea as the Varandey platform increased by 10 tb/d, while in the Baltic Sea Kalinigrad port terminal exports were stable from the previous month. Russia Fareast total exports were also at the same level as the previous month, averaging 344 tb/d. Total exports for Central Asia stood at 205 tb/d, slightly up by 4 tb/d. Black Sea total exports went up by 81 tb/d, as a result of increased shipments from the Novorossiyk port terminal (CPC), which increased by 41 tb/d from a month ago. In the Mediterranean Sea, BTC supplies increased from the previous month by 82 tb/d, or 12%, to average 768 tb/d. FSU total product exports dropped by 278 tb/d, or 9%, from the previous month to average 3 mb/d. This fall resulted from a decline seen in fuel oil, naphtha and VGO exports, which dropped by 395 tb/d, 48 tb/d and 77 tb/d, respectively, from a month ago.
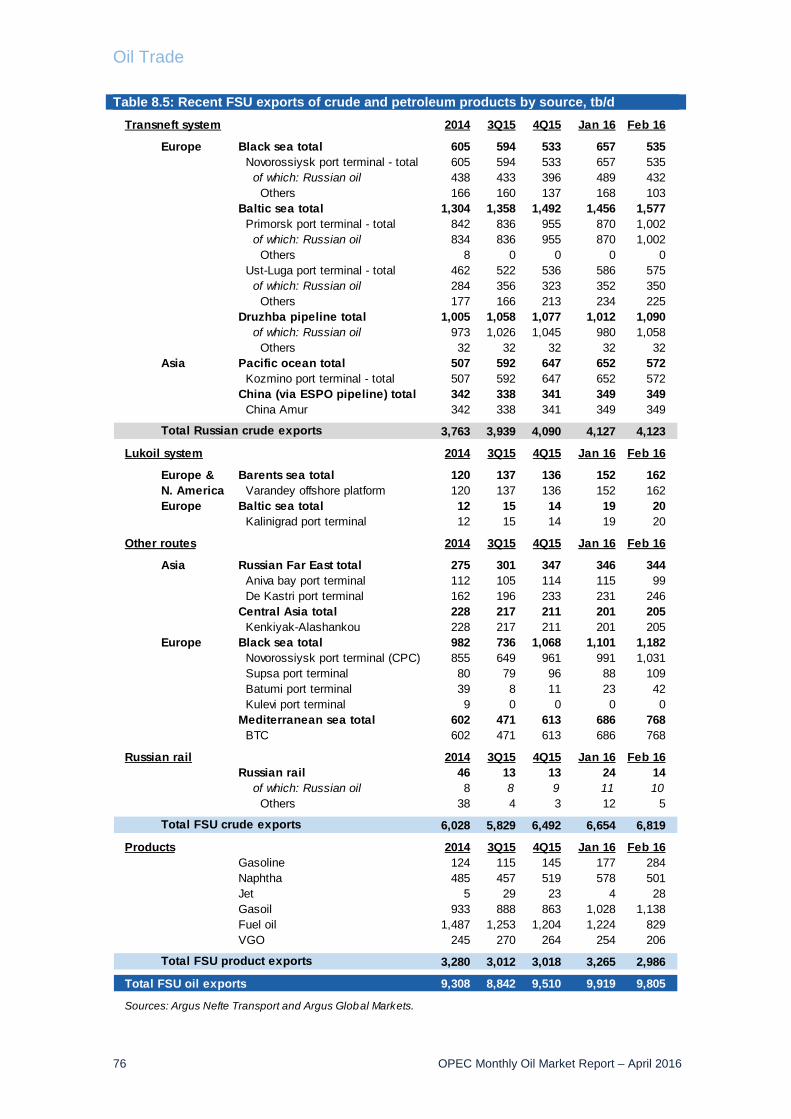
Oil Trade
76 OPEC Monthly Oil Market Report – April 2016
Table 8.5: Recent FSU exports of crude and petroleum products by source, tb/d
Transneft system 2014 3Q15 4Q15 Jan 16 Feb 16
Europe Black sea total 605 594 533 657 535 Novorossiysk port terminal - total 605 594 533 657 535 of which: Russian oil 438 433 396 489 432 Others 166 160 137 168 103Baltic sea total 1,304 1,358 1,492 1,456 1,577 Primorsk port terminal - total 842 836 955 870 1,002 of which: Russian oil 834 836 955 870 1,002 Others 8 0 0 0 0 Ust-Luga port terminal - total 462 522 536 586 575 of which: Russian oil 284 356 323 352 350 Others 177 166 213 234 225Druzhba pipeline total 1,005 1,058 1,077 1,012 1,090 of which: Russian oil 973 1,026 1,045 980 1,058 Others 32 32 32 32 32
Asia Pacific ocean total 507 592 647 652 572 Kozmino port terminal - total 507 592 647 652 572China (via ESPO pipeline) total 342 338 341 349 349 China Amur 342 338 341 349 349
3,763 3,939 4,090 4,127 4,123
Lukoil system 2014 3Q15 4Q15 Jan 16 Feb 16
Europe & Barents sea total 120 137 136 152 162N. America Varandey offshore platform 120 137 136 152 162Europe Baltic sea total 12 15 14 19 20
Kalinigrad port terminal 12 15 14 19 20
Other routes 2014 3Q15 4Q15 Jan 16 Feb 16
Asia Russian Far East total 275 301 347 346 344 Aniva bay port terminal 112 105 114 115 99 De Kastri port terminal 162 196 233 231 246Central Asia total 228 217 211 201 205 Kenkiyak-Alashankou 228 217 211 201 205
Europe Black sea total 982 736 1,068 1,101 1,182 Novorossiysk port terminal (CPC) 855 649 961 991 1,031 Supsa port terminal 80 79 96 88 109 Batumi port terminal 39 8 11 23 42 Kulevi port terminal 9 0 0 0 0Mediterranean sea total 602 471 613 686 768 BTC 602 471 613 686 768
Russian rail 2014 3Q15 4Q15 Jan 16 Feb 16Russian rail 46 13 13 24 14 of which: Russian oil 8 8 9 11 10 Others 38 4 3 12 5
6,028 5,829 6,492 6,654 6,819
Products 2014 3Q15 4Q15 Jan 16 Feb 16Gasoline 124 115 145 177 284Naphtha 485 457 519 578 501Jet 5 29 23 4 28Gasoil 933 888 863 1,028 1,138Fuel oil 1,487 1,253 1,204 1,224 829VGO 245 270 264 254 206
3,280 3,012 3,018 3,265 2,986
Total FSU oil exports 9,308 8,842 9,510 9,919 9,805
Sources: Argus Nefte Transport and Argus Global Markets.
Total Russian crude exports
Total FSU crude exports
Total FSU product exports
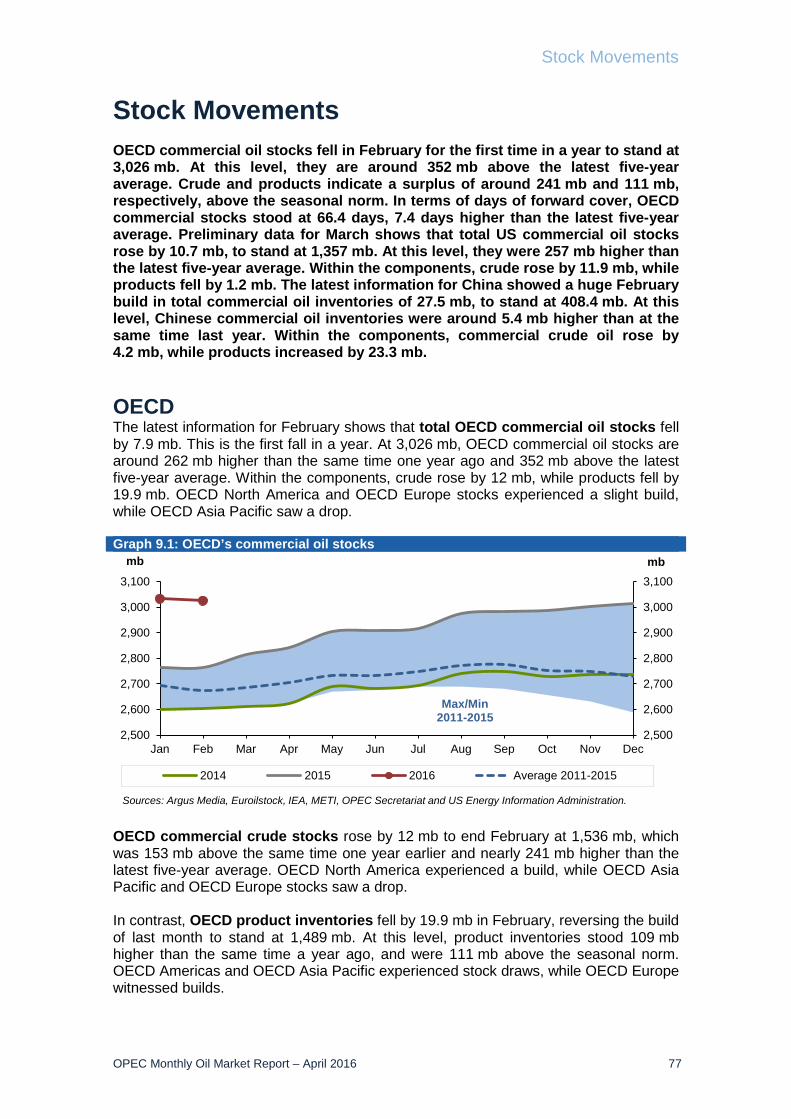
Stock Movements
OPEC Monthly Oil Market Report – April 2016 77
Stock Movements OECD commercial oil stocks fell in February for the first time in a year to stand at 3,026 mb. At this level, they are around 352 mb above the latest five-year average. Crude and products indicate a surplus of around 241 mb and 111 mb, respectively, above the seasonal norm. In terms of days of forward cover, OECD commercial stocks stood at 66.4 days, 7.4 days higher than the latest five-year average. Preliminary data for March shows that total US commercial oil stocks rose by 10.7 mb, to stand at 1,357 mb. At this level, they were 257 mb higher than the latest five-year average. Within the components, crude rose by 11.9 mb, while products fell by 1.2 mb. The latest information for China showed a huge February build in total commercial oil inventories of 27.5 mb, to stand at 408.4 mb. At this level, Chinese commercial oil inventories were around 5.4 mb higher than at the same time last year. Within the components, commercial crude oil rose by 4.2 mb, while products increased by 23.3 mb. OECD The latest information for February shows that total OECD commercial oil stocks fell by 7.9 mb. This is the first fall in a year. At 3,026 mb, OECD commercial oil stocks are around 262 mb higher than the same time one year ago and 352 mb above the latest five-year average. Within the components, crude rose by 12 mb, while products fell by 19.9 mb. OECD North America and OECD Europe stocks experienced a slight build, while OECD Asia Pacific saw a drop. Graph 9.1: OECD’s commercial oil stocks
OECD commercial crude stocks rose by 12 mb to end February at 1,536 mb, which was 153 mb above the same time one year earlier and nearly 241 mb higher than the latest five-year average. OECD North America experienced a build, while OECD Asia Pacific and OECD Europe stocks saw a drop. In contrast, OECD product inventories fell by 19.9 mb in February, reversing the build of last month to stand at 1,489 mb. At this level, product inventories stood 109 mb higher than the same time a year ago, and were 111 mb above the seasonal norm. OECD Americas and OECD Asia Pacific experienced stock draws, while OECD Europe witnessed builds.
2,500
2,600
2,700
2,800
2,900
3,000
3,100
2,500
2,600
2,700
2,800
2,900
3,000
3,100
Jan Feb Mar Apr May Jun Jul Aug Sep Oct Nov Dec
mbmb
2014 2015 2016 Average 2011-2015
Max/Min2011-2015
Sources: Argus Media, Euroilstock, IEA, METI, OPEC Secretariat and US Energy Information Administration.
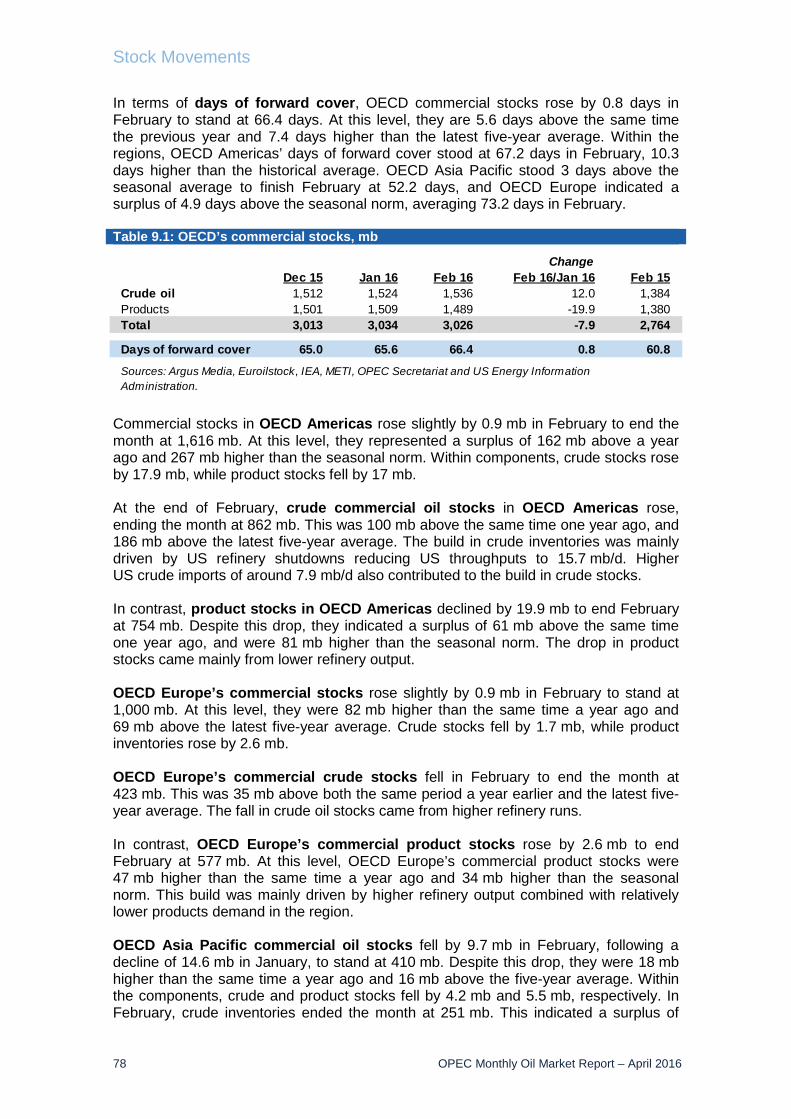
Stock Movements
78 OPEC Monthly Oil Market Report – April 2016
In terms of days of forward cover, OECD commercial stocks rose by 0.8 days in February to stand at 66.4 days. At this level, they are 5.6 days above the same time the previous year and 7.4 days higher than the latest five-year average. Within the regions, OECD Americas’ days of forward cover stood at 67.2 days in February, 10.3 days higher than the historical average. OECD Asia Pacific stood 3 days above the seasonal average to finish February at 52.2 days, and OECD Europe indicated a surplus of 4.9 days above the seasonal norm, averaging 73.2 days in February. Table 9.1: OECD’s commercial stocks, mb
Commercial stocks in OECD Americas rose slightly by 0.9 mb in February to end the month at 1,616 mb. At this level, they represented a surplus of 162 mb above a year ago and 267 mb higher than the seasonal norm. Within components, crude stocks rose by 17.9 mb, while product stocks fell by 17 mb. At the end of February, crude commercial oil stocks in OECD Americas rose, ending the month at 862 mb. This was 100 mb above the same time one year ago, and 186 mb above the latest five-year average. The build in crude inventories was mainly driven by US refinery shutdowns reducing US throughputs to 15.7 mb/d. Higher US crude imports of around 7.9 mb/d also contributed to the build in crude stocks. In contrast, product stocks in OECD Americas declined by 19.9 mb to end February at 754 mb. Despite this drop, they indicated a surplus of 61 mb above the same time one year ago, and were 81 mb higher than the seasonal norm. The drop in product stocks came mainly from lower refinery output. OECD Europe’s commercial stocks rose slightly by 0.9 mb in February to stand at 1,000 mb. At this level, they were 82 mb higher than the same time a year ago and 69 mb above the latest five-year average. Crude stocks fell by 1.7 mb, while product inventories rose by 2.6 mb. OECD Europe’s commercial crude stocks fell in February to end the month at 423 mb. This was 35 mb above both the same period a year earlier and the latest five-year average. The fall in crude oil stocks came from higher refinery runs. In contrast, OECD Europe’s commercial product stocks rose by 2.6 mb to end February at 577 mb. At this level, OECD Europe’s commercial product stocks were 47 mb higher than the same time a year ago and 34 mb higher than the seasonal norm. This build was mainly driven by higher refinery output combined with relatively lower products demand in the region. OECD Asia Pacific commercial oil stocks fell by 9.7 mb in February, following a decline of 14.6 mb in January, to stand at 410 mb. Despite this drop, they were 18 mb higher than the same time a year ago and 16 mb above the five-year average. Within the components, crude and product stocks fell by 4.2 mb and 5.5 mb, respectively. In February, crude inventories ended the month at 251 mb. This indicated a surplus of
ChangeDec 15 Jan 16 Feb 16 Feb 16/Jan 16 Feb 15
Crude oil 1,512 1,524 1,536 12.0 1,384Products 1,501 1,509 1,489 -19.9 1,380Total 3,013 3,034 3,026 -7.9 2,764
Days of forward cover 65.0 65.6 66.4 0.8 60.8
Sources: Argus Media, Euroilstock, IEA, METI, OPEC Secretariat and US Energy Information Administration.
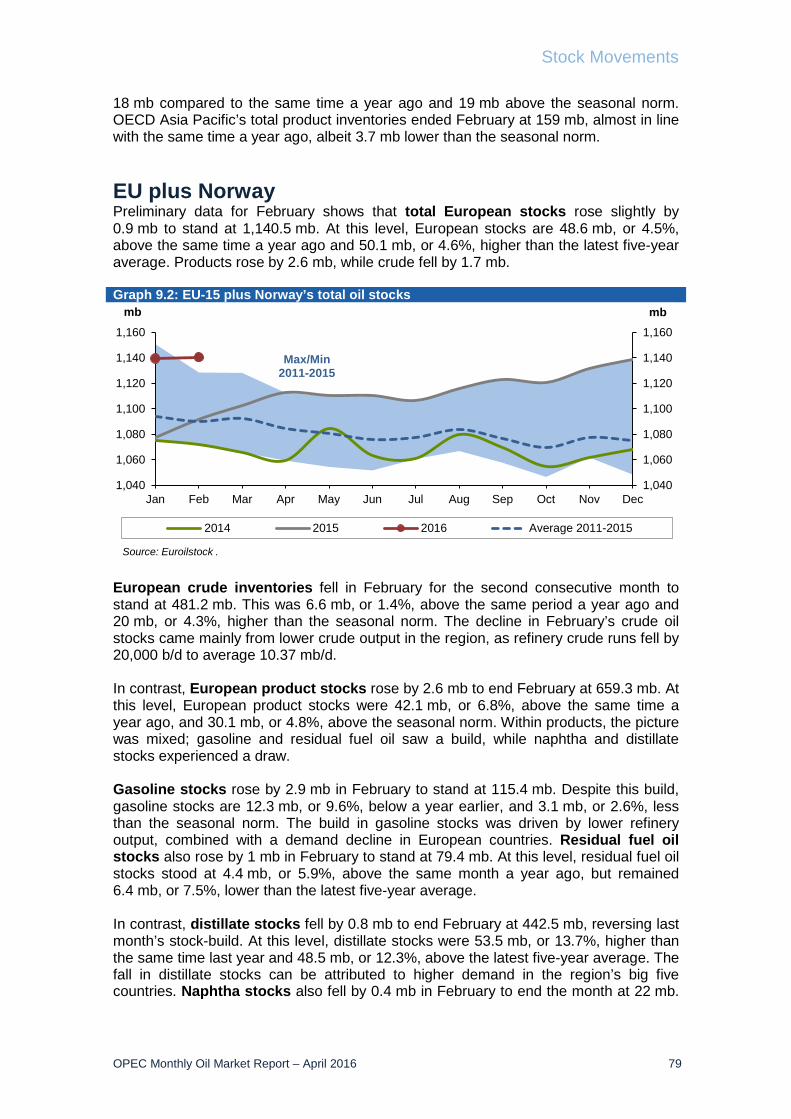
Stock Movements
OPEC Monthly Oil Market Report – April 2016 79
18 mb compared to the same time a year ago and 19 mb above the seasonal norm. OECD Asia Pacific’s total product inventories ended February at 159 mb, almost in line with the same time a year ago, albeit 3.7 mb lower than the seasonal norm. EU plus Norway Preliminary data for February shows that total European stocks rose slightly by 0.9 mb to stand at 1,140.5 mb. At this level, European stocks are 48.6 mb, or 4.5%, above the same time a year ago and 50.1 mb, or 4.6%, higher than the latest five-year average. Products rose by 2.6 mb, while crude fell by 1.7 mb. Graph 9.2: EU-15 plus Norway’s total oil stocks
European crude inventories fell in February for the second consecutive month to stand at 481.2 mb. This was 6.6 mb, or 1.4%, above the same period a year ago and 20 mb, or 4.3%, higher than the seasonal norm. The decline in February’s crude oil stocks came mainly from lower crude output in the region, as refinery crude runs fell by 20,000 b/d to average 10.37 mb/d. In contrast, European product stocks rose by 2.6 mb to end February at 659.3 mb. At this level, European product stocks were 42.1 mb, or 6.8%, above the same time a year ago, and 30.1 mb, or 4.8%, above the seasonal norm. Within products, the picture was mixed; gasoline and residual fuel oil saw a build, while naphtha and distillate stocks experienced a draw. Gasoline stocks rose by 2.9 mb in February to stand at 115.4 mb. Despite this build, gasoline stocks are 12.3 mb, or 9.6%, below a year earlier, and 3.1 mb, or 2.6%, less than the seasonal norm. The build in gasoline stocks was driven by lower refinery output, combined with a demand decline in European countries. Residual fuel oil stocks also rose by 1 mb in February to stand at 79.4 mb. At this level, residual fuel oil stocks stood at 4.4 mb, or 5.9%, above the same month a year ago, but remained 6.4 mb, or 7.5%, lower than the latest five-year average. In contrast, distillate stocks fell by 0.8 mb to end February at 442.5 mb, reversing last month’s stock-build. At this level, distillate stocks were 53.5 mb, or 13.7%, higher than the same time last year and 48.5 mb, or 12.3%, above the latest five-year average. The fall in distillate stocks can be attributed to higher demand in the region’s big five countries. Naphtha stocks also fell by 0.4 mb in February to end the month at 22 mb.
1,040
1,060
1,080
1,100
1,120
1,140
1,160
1,040
1,060
1,080
1,100
1,120
1,140
1,160
Jan Feb Mar Apr May Jun Jul Aug Sep Oct Nov Dec
mbmb
2014 2015 2016 Average 2011-2015
Max/Min2011-2015
Source: Euroilstock .
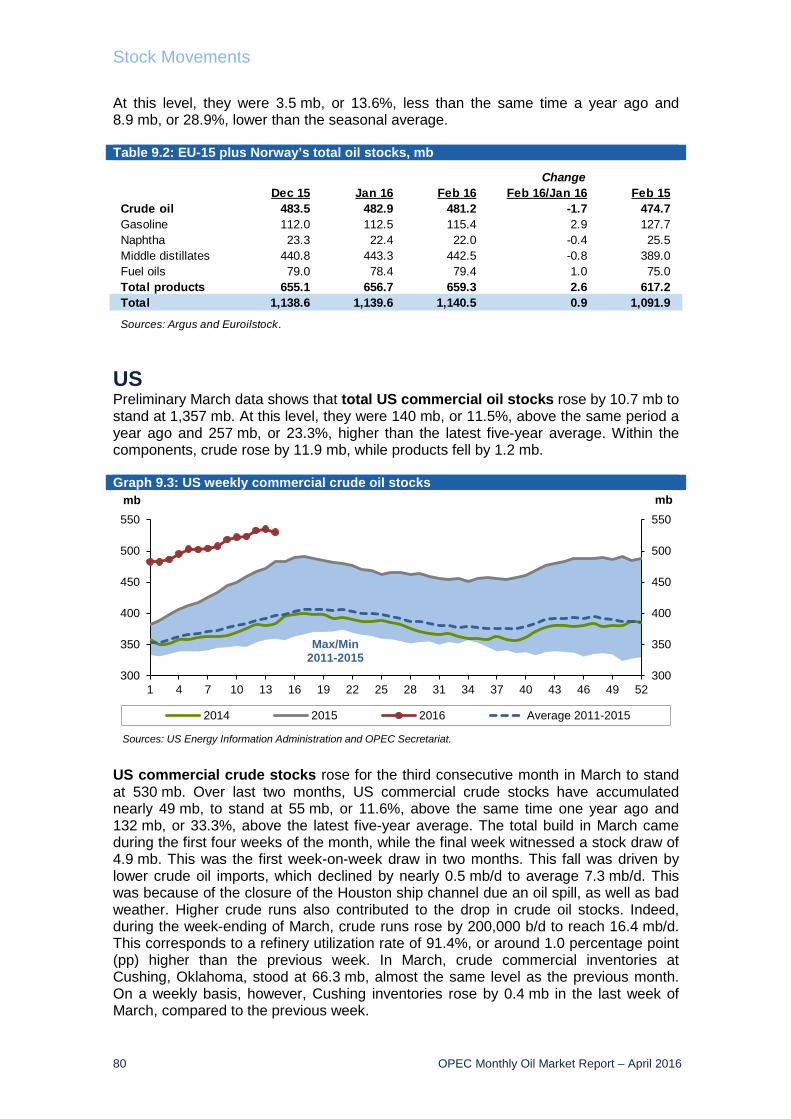
Stock Movements
80 OPEC Monthly Oil Market Report – April 2016
At this level, they were 3.5 mb, or 13.6%, less than the same time a year ago and 8.9 mb, or 28.9%, lower than the seasonal average. Table 9.2: EU-15 plus Norway’s total oil stocks, mb
US Preliminary March data shows that total US commercial oil stocks rose by 10.7 mb to stand at 1,357 mb. At this level, they were 140 mb, or 11.5%, above the same period a year ago and 257 mb, or 23.3%, higher than the latest five-year average. Within the components, crude rose by 11.9 mb, while products fell by 1.2 mb. Graph 9.3: US weekly commercial crude oil stocks
US commercial crude stocks rose for the third consecutive month in March to stand at 530 mb. Over last two months, US commercial crude stocks have accumulated nearly 49 mb, to stand at 55 mb, or 11.6%, above the same time one year ago and 132 mb, or 33.3%, above the latest five-year average. The total build in March came during the first four weeks of the month, while the final week witnessed a stock draw of 4.9 mb. This was the first week-on-week draw in two months. This fall was driven by lower crude oil imports, which declined by nearly 0.5 mb/d to average 7.3 mb/d. This was because of the closure of the Houston ship channel due an oil spill, as well as bad weather. Higher crude runs also contributed to the drop in crude oil stocks. Indeed, during the week-ending of March, crude runs rose by 200,000 b/d to reach 16.4 mb/d. This corresponds to a refinery utilization rate of 91.4%, or around 1.0 percentage point (pp) higher than the previous week. In March, crude commercial inventories at Cushing, Oklahoma, stood at 66.3 mb, almost the same level as the previous month. On a weekly basis, however, Cushing inventories rose by 0.4 mb in the last week of March, compared to the previous week.
300
350
400
450
500
550
300
350
400
450
500
550
1 4 7 10 13 16 19 22 25 28 31 34 37 40 43 46 49 52
mbmb
2014 2015 2016 Average 2011-2015
Max/Min2011-2015
Sources: US Energy Information Administration and OPEC Secretariat.
ChangeDec 15 Jan 16 Feb 16 Feb 16/Jan 16 Feb 15
Crude oil 483.5 482.9 481.2 -1.7 474.7Gasoline 112.0 112.5 115.4 2.9 127.7Naphtha 23.3 22.4 22.0 -0.4 25.5Middle distillates 440.8 443.3 442.5 -0.8 389.0Fuel oils 79.0 78.4 79.4 1.0 75.0Total products 655.1 656.7 659.3 2.6 617.2Total 1,138.6 1,139.6 1,140.5 0.9 1,091.9
Sources: Argus and Euroilstock.
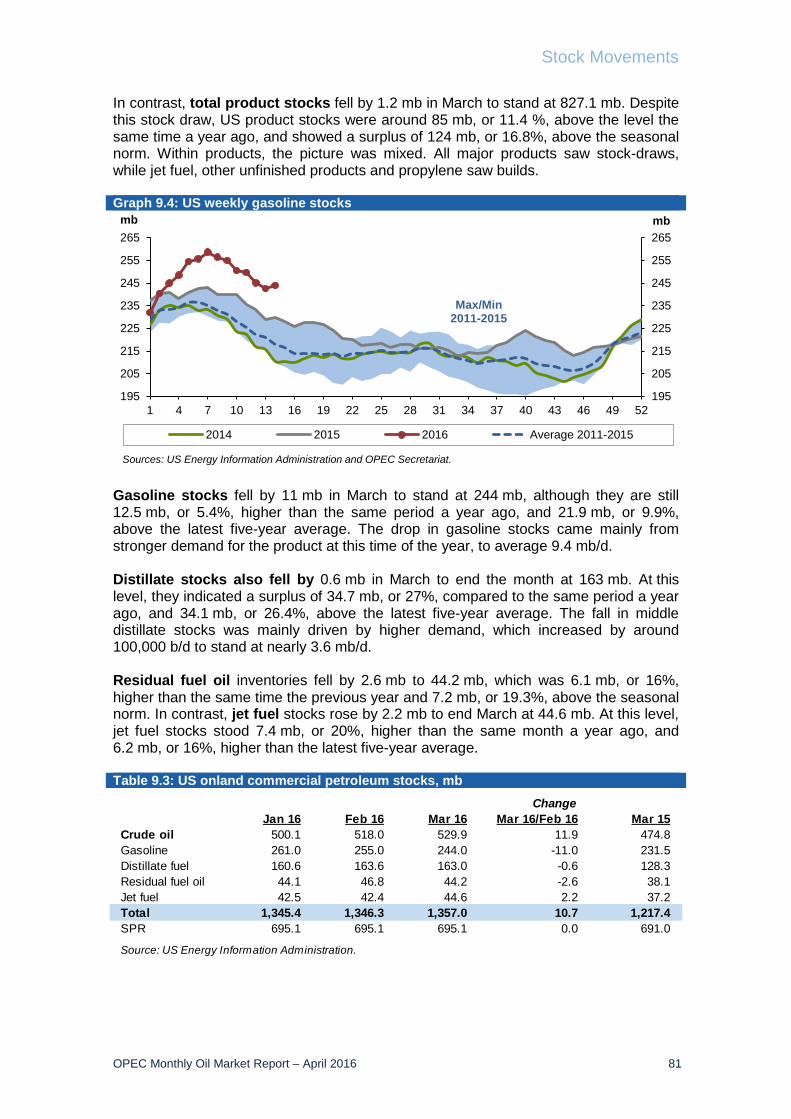
Stock Movements
OPEC Monthly Oil Market Report – April 2016 81
In contrast, total product stocks fell by 1.2 mb in March to stand at 827.1 mb. Despite this stock draw, US product stocks were around 85 mb, or 11.4 %, above the level the same time a year ago, and showed a surplus of 124 mb, or 16.8%, above the seasonal norm. Within products, the picture was mixed. All major products saw stock-draws, while jet fuel, other unfinished products and propylene saw builds. Graph 9.4: US weekly gasoline stocks
Gasoline stocks fell by 11 mb in March to stand at 244 mb, although they are still 12.5 mb, or 5.4%, higher than the same period a year ago, and 21.9 mb, or 9.9%, above the latest five-year average. The drop in gasoline stocks came mainly from stronger demand for the product at this time of the year, to average 9.4 mb/d. Distillate stocks also fell by 0.6 mb in March to end the month at 163 mb. At this level, they indicated a surplus of 34.7 mb, or 27%, compared to the same period a year ago, and 34.1 mb, or 26.4%, above the latest five-year average. The fall in middle distillate stocks was mainly driven by higher demand, which increased by around 100,000 b/d to stand at nearly 3.6 mb/d. Residual fuel oil inventories fell by 2.6 mb to 44.2 mb, which was 6.1 mb, or 16%, higher than the same time the previous year and 7.2 mb, or 19.3%, above the seasonal norm. In contrast, jet fuel stocks rose by 2.2 mb to end March at 44.6 mb. At this level, jet fuel stocks stood 7.4 mb, or 20%, higher than the same month a year ago, and 6.2 mb, or 16%, higher than the latest five-year average. Table 9.3: US onland commercial petroleum stocks, mb
195
205
215
225
235
245
255
265
195
205
215
225
235
245
255
265
1 4 7 10 13 16 19 22 25 28 31 34 37 40 43 46 49 52
mbmb
2014 2015 2016 Average 2011-2015
Max/Min2011-2015
Sources: US Energy Information Administration and OPEC Secretariat.
ChangeJan 16 Feb 16 Mar 16 Mar 16/Feb 16 Mar 15
Crude oil 500.1 518.0 529.9 11.9 474.8Gasoline 261.0 255.0 244.0 -11.0 231.5Distillate fuel 160.6 163.6 163.0 -0.6 128.3Residual fuel oil 44.1 46.8 44.2 -2.6 38.1Jet fuel 42.5 42.4 44.6 2.2 37.2Total 1,345.4 1,346.3 1,357.0 10.7 1,217.4SPR 695.1 695.1 695.1 0.0 691.0
Source: US Energy Information Administration.
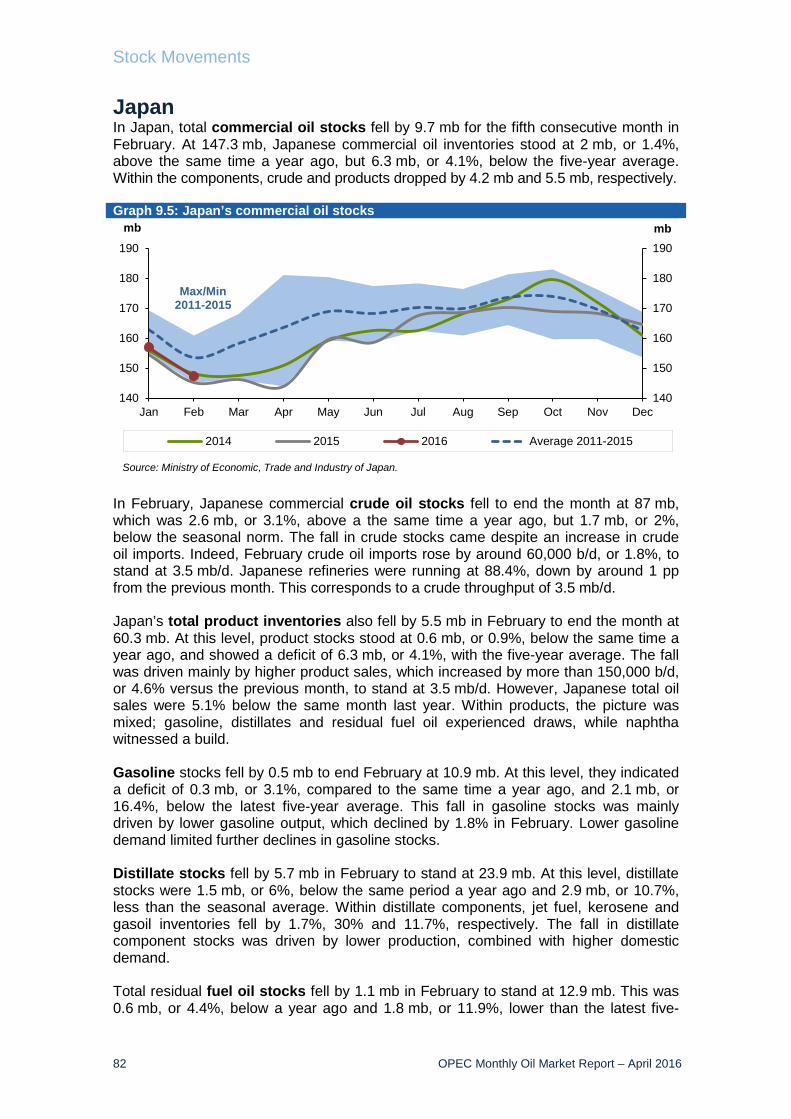
Stock Movements
82 OPEC Monthly Oil Market Report – April 2016
Japan In Japan, total commercial oil stocks fell by 9.7 mb for the fifth consecutive month in February. At 147.3 mb, Japanese commercial oil inventories stood at 2 mb, or 1.4%, above the same time a year ago, but 6.3 mb, or 4.1%, below the five-year average. Within the components, crude and products dropped by 4.2 mb and 5.5 mb, respectively. Graph 9.5: Japan’s commercial oil stocks
In February, Japanese commercial crude oil stocks fell to end the month at 87 mb, which was 2.6 mb, or 3.1%, above a the same time a year ago, but 1.7 mb, or 2%, below the seasonal norm. The fall in crude stocks came despite an increase in crude oil imports. Indeed, February crude oil imports rose by around 60,000 b/d, or 1.8%, to stand at 3.5 mb/d. Japanese refineries were running at 88.4%, down by around 1 pp from the previous month. This corresponds to a crude throughput of 3.5 mb/d. Japan’s total product inventories also fell by 5.5 mb in February to end the month at 60.3 mb. At this level, product stocks stood at 0.6 mb, or 0.9%, below the same time a year ago, and showed a deficit of 6.3 mb, or 4.1%, with the five-year average. The fall was driven mainly by higher product sales, which increased by more than 150,000 b/d, or 4.6% versus the previous month, to stand at 3.5 mb/d. However, Japanese total oil sales were 5.1% below the same month last year. Within products, the picture was mixed; gasoline, distillates and residual fuel oil experienced draws, while naphtha witnessed a build. Gasoline stocks fell by 0.5 mb to end February at 10.9 mb. At this level, they indicated a deficit of 0.3 mb, or 3.1%, compared to the same time a year ago, and 2.1 mb, or 16.4%, below the latest five-year average. This fall in gasoline stocks was mainly driven by lower gasoline output, which declined by 1.8% in February. Lower gasoline demand limited further declines in gasoline stocks. Distillate stocks fell by 5.7 mb in February to stand at 23.9 mb. At this level, distillate stocks were 1.5 mb, or 6%, below the same period a year ago and 2.9 mb, or 10.7%, less than the seasonal average. Within distillate components, jet fuel, kerosene and gasoil inventories fell by 1.7%, 30% and 11.7%, respectively. The fall in distillate component stocks was driven by lower production, combined with higher domestic demand. Total residual fuel oil stocks fell by 1.1 mb in February to stand at 12.9 mb. This was 0.6 mb, or 4.4%, below a year ago and 1.8 mb, or 11.9%, lower than the latest five-
140
150
160
170
180
190
140
150
160
170
180
190
Jan Feb Mar Apr May Jun Jul Aug Sep Oct Nov Dec
mbmb
2014 2015 2016 Average 2011-2015
Max/Min2011-2015
Source: Ministry of Economic, Trade and Industry of Japan.
Stock Movements
OPEC Monthly Oil Market Report – April 2016 83
year average. Within the fuel oil components, fuel oil A and fuel oil B.C fell by 9.1% and 6.9%, respectively. The fall in fuel oil was driven by higher domestic sales, which increased by 9.3% in the case of fuel oil A and by 1.6% for fuel oil B.C. In contrast, naphtha inventories rose by 1.7 mb in February to stand at 1.7 mb. This was 1.9 mb, or 17.9%, higher than the same time a year ago, but 2.2 mb, or 21.1%, less than the seasonal norm. This build was driven mainly by lower domestic sales, which declined by 13.5%. Table 9.4: Japan’s commercial oil stocks*, mb
China The latest information for China showed a massive build in total commercial oil inventories of 27.5 mb in February to stand at 408.4 mb. At this level, Chinese commercial oil inventories were around 5.4 mb higher than the same time last year. Within the components, commercial crude oil and products rose by 4.2 mb and 23.3 mb, respectively. In February, commercial crude stocks rose to 238.8 mb reversing the fall during the previous four months. Despite this build, they remained 16.7 mb below the same time last year. The build in crude oil commercial stocks is mainly attributed to higher crude imports, which increased by 1.7 mb/d to reach a new peak of 8 mb/d. A slight decline in domestic crude production limited further crude oil stock builds. Total product stocks in China rose by 23.3 mb, the fourth consecutive monthly rise, to stand at 169.6 mb. This is the highest level since February 2012. With this stock-build, product stocks were 22.1 mb higher than the same time a year ago. Within products, diesel oil and kerosene witnessed builds, while gasoline stocks fell. Diesel stocks saw a large rise of 26.5 mb in February to reach 95.8 mb, which is 9.8 mb higher than the same period a year ago. This strong build was driven by sluggish demand as plants and infrastructure projects slowed due to the holiday period. Kerosene stocks also rose by 1.2 mb to end February at 17.2 mb, which was 2.8 mb higher than the same time last year. In contrast, gasoline stocks went down by 4.4 mb to end February at 56.6 mb. The fall was mainly driven by higher gasoline demand due to more cars driving due to China’s lunar New Year.
ChangeDec 15 Jan 16 Feb 16 Feb 16/Jan 16 Feb 15
Crude oil 98.5 91.2 87.0 -4.2 84.4Gasoline 9.8 11.3 10.9 -0.5 11.2Naphtha 9.2 10.8 12.5 1.7 10.6Middle distillates 32.2 29.7 23.9 -5.7 25.5Residual fuel oil 14.8 14.0 12.9 -1.1 13.5Total products 66.0 65.8 60.3 -5.5 60.8Total** 164.5 157.0 147.3 -9.7 145.2
Note: * At end of month. ** Includes crude oil and main products only.Source: Ministry of Economy, Trade and Industry of Japan.
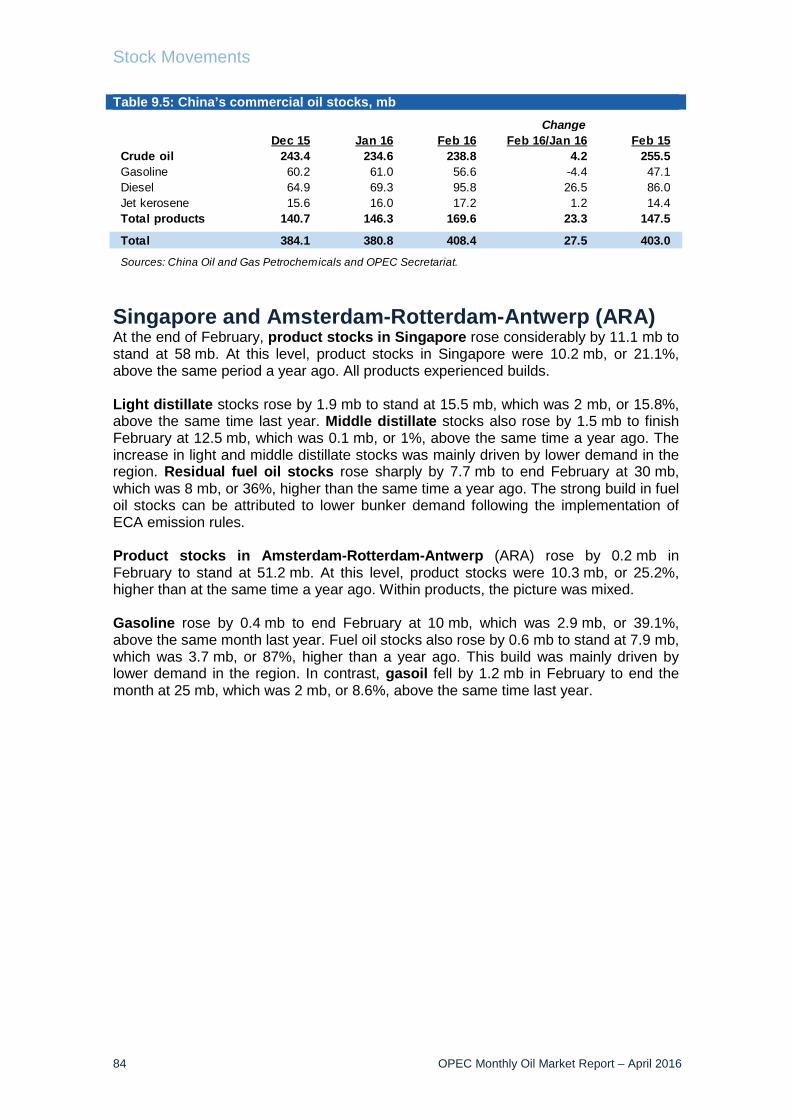
Stock Movements
84 OPEC Monthly Oil Market Report – April 2016
Table 9.5: China’s commercial oil stocks, mb
Singapore and Amsterdam-Rotterdam-Antwerp (ARA) At the end of February, product stocks in Singapore rose considerably by 11.1 mb to stand at 58 mb. At this level, product stocks in Singapore were 10.2 mb, or 21.1%, above the same period a year ago. All products experienced builds. Light distillate stocks rose by 1.9 mb to stand at 15.5 mb, which was 2 mb, or 15.8%, above the same time last year. Middle distillate stocks also rose by 1.5 mb to finish February at 12.5 mb, which was 0.1 mb, or 1%, above the same time a year ago. The increase in light and middle distillate stocks was mainly driven by lower demand in the region. Residual fuel oil stocks rose sharply by 7.7 mb to end February at 30 mb, which was 8 mb, or 36%, higher than the same time a year ago. The strong build in fuel oil stocks can be attributed to lower bunker demand following the implementation of ECA emission rules. Product stocks in Amsterdam-Rotterdam-Antwerp (ARA) rose by 0.2 mb in February to stand at 51.2 mb. At this level, product stocks were 10.3 mb, or 25.2%, higher than at the same time a year ago. Within products, the picture was mixed. Gasoline rose by 0.4 mb to end February at 10 mb, which was 2.9 mb, or 39.1%, above the same month last year. Fuel oil stocks also rose by 0.6 mb to stand at 7.9 mb, which was 3.7 mb, or 87%, higher than a year ago. This build was mainly driven by lower demand in the region. In contrast, gasoil fell by 1.2 mb in February to end the month at 25 mb, which was 2 mb, or 8.6%, above the same time last year.
ChangeDec 15 Jan 16 Feb 16 Feb 16/Jan 16 Feb 15
Crude oil 243.4 234.6 238.8 4.2 255.5Gasoline 60.2 61.0 56.6 -4.4 47.1Diesel 64.9 69.3 95.8 26.5 86.0Jet kerosene 15.6 16.0 17.2 1.2 14.4Total products 140.7 146.3 169.6 23.3 147.5
Total 384.1 380.8 408.4 27.5 403.0
Sources: China Oil and Gas Petrochemicals and OPEC Secretariat.
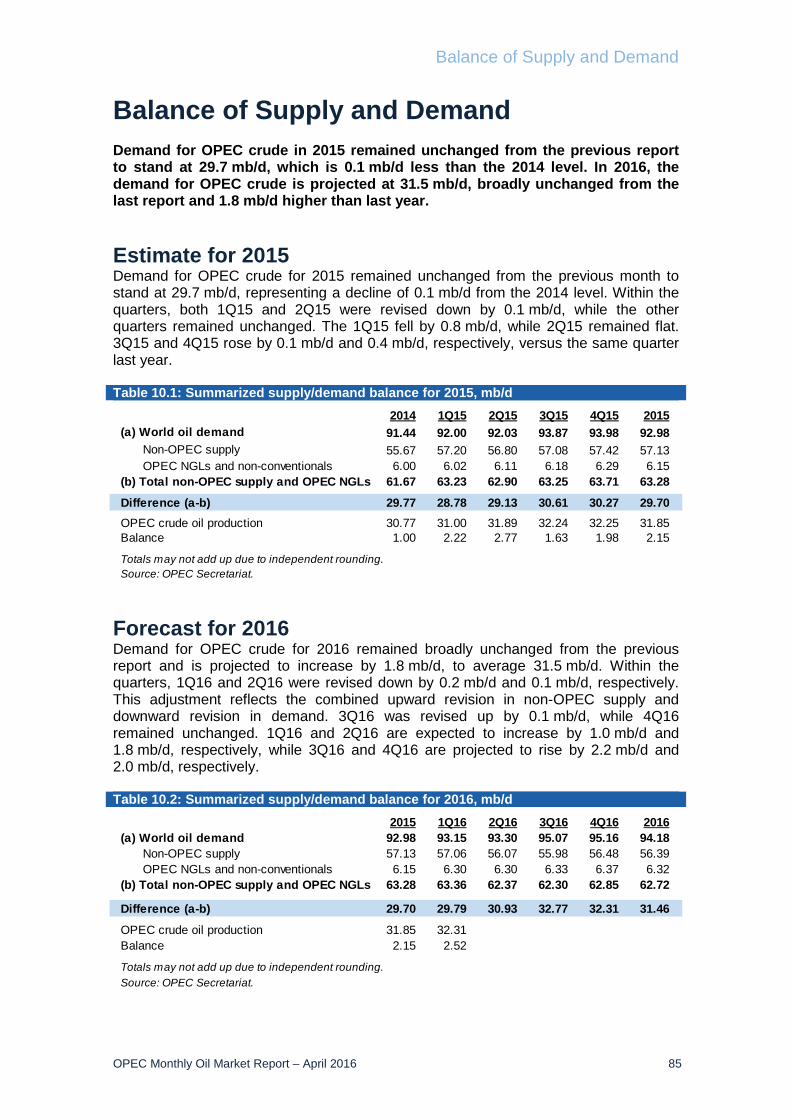
Balance of Supply and Demand
OPEC Monthly Oil Market Report – April 2016 85
Balance of Supply and Demand Demand for OPEC crude in 2015 remained unchanged from the previous report to stand at 29.7 mb/d, which is 0.1 mb/d less than the 2014 level. In 2016, the demand for OPEC crude is projected at 31.5 mb/d, broadly unchanged from the last report and 1.8 mb/d higher than last year. Estimate for 2015 Demand for OPEC crude for 2015 remained unchanged from the previous month to stand at 29.7 mb/d, representing a decline of 0.1 mb/d from the 2014 level. Within the quarters, both 1Q15 and 2Q15 were revised down by 0.1 mb/d, while the other quarters remained unchanged. The 1Q15 fell by 0.8 mb/d, while 2Q15 remained flat. 3Q15 and 4Q15 rose by 0.1 mb/d and 0.4 mb/d, respectively, versus the same quarter last year. Table 10.1: Summarized supply/demand balance for 2015, mb/d
Forecast for 2016 Demand for OPEC crude for 2016 remained broadly unchanged from the previous report and is projected to increase by 1.8 mb/d, to average 31.5 mb/d. Within the quarters, 1Q16 and 2Q16 were revised down by 0.2 mb/d and 0.1 mb/d, respectively. This adjustment reflects the combined upward revision in non-OPEC supply and downward revision in demand. 3Q16 was revised up by 0.1 mb/d, while 4Q16 remained unchanged. 1Q16 and 2Q16 are expected to increase by 1.0 mb/d and 1.8 mb/d, respectively, while 3Q16 and 4Q16 are projected to rise by 2.2 mb/d and 2.0 mb/d, respectively. Table 10.2: Summarized supply/demand balance for 2016, mb/d
2014 1Q15 2Q15 3Q15 4Q15 2015(a) World oil demand 91.44 92.00 92.03 93.87 93.98 92.98 Non-OPEC supply 55.67 57.20 56.80 57.08 57.42 57.13 OPEC NGLs and non-conventionals 6.00 6.02 6.11 6.18 6.29 6.15(b) Total non-OPEC supply and OPEC NGLs 61.67 63.23 62.90 63.25 63.71 63.28
Difference (a-b) 29.77 28.78 29.13 30.61 30.27 29.70OPEC crude oil production 30.77 31.00 31.89 32.24 32.25 31.85Balance 1.00 2.22 2.77 1.63 1.98 2.15
Totals may not add up due to independent rounding.Source: OPEC Secretariat.
2015 1Q16 2Q16 3Q16 4Q16 2016(a) World oil demand 92.98 93.15 93.30 95.07 95.16 94.18 Non-OPEC supply 57.13 57.06 56.07 55.98 56.48 56.39 OPEC NGLs and non-conventionals 6.15 6.30 6.30 6.33 6.37 6.32(b) Total non-OPEC supply and OPEC NGLs 63.28 63.36 62.37 62.30 62.85 62.72
Difference (a-b) 29.70 29.79 30.93 32.77 32.31 31.46
OPEC crude oil production 31.85 32.31Balance 2.15 2.52
Totals may not add up due to independent rounding.Source: OPEC Secretariat.
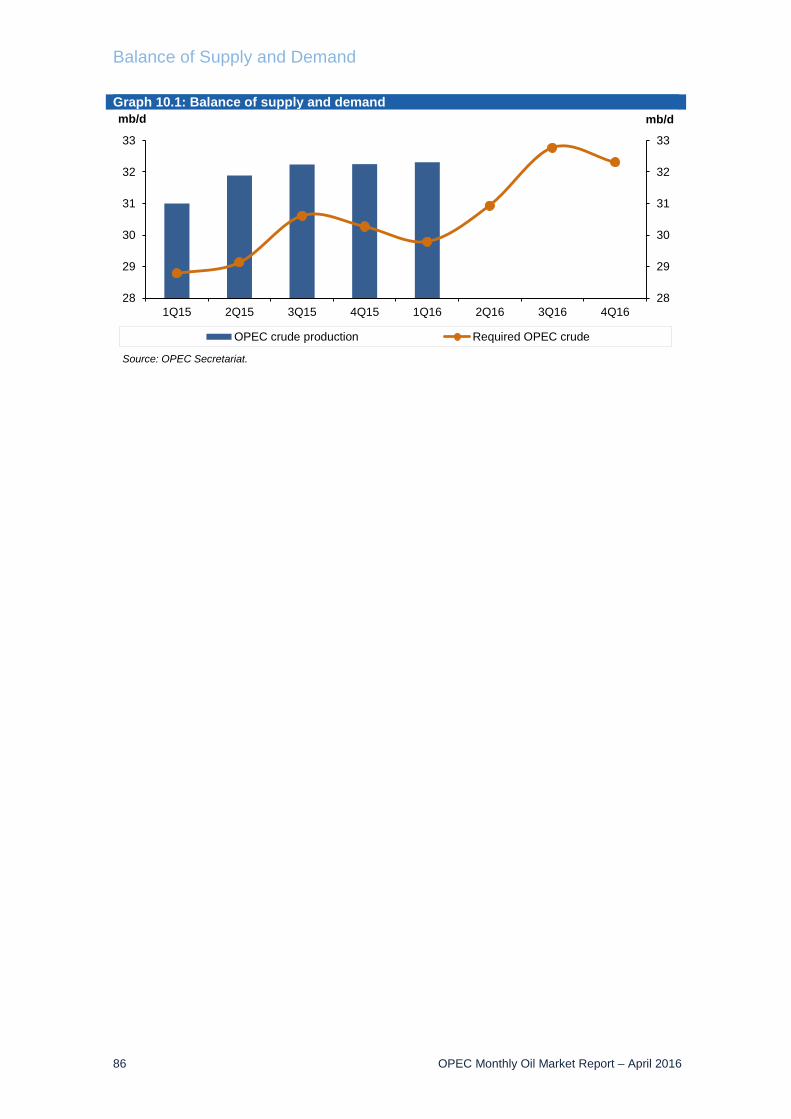
Balance of Supply and Demand
86 OPEC Monthly Oil Market Report – April 2016
Graph 10.1: Balance of supply and demand
28
29
30
31
32
33
28
29
30
31
32
33
1Q15 2Q15 3Q15 4Q15 1Q16 2Q16 3Q16 4Q16
mb/dmb/d
OPEC crude production Required OPEC crude
Source: OPEC Secretariat.

OPEC Monthly Oil Market Report – April 2016 87
Table 10.3: World oil demand and supply balance, mb/d2012 2013 2014 1Q15 2Q15 3Q15 4Q15 2015 1Q16 2Q16 3Q16 4Q16 2016
World demand
OECD 45.9 46.0 45.7 46.4 45.4 46.5 46.3 46.2 46.6 45.6 46.7 46.5 46.4
Americas 23.6 24.1 24.1 24.2 24.1 24.8 24.4 24.4 24.4 24.4 25.0 24.6 24.6
Europe 13.8 13.6 13.5 13.5 13.6 14.1 13.7 13.7 13.5 13.6 14.1 13.7 13.7
Asia Pacific 8.5 8.3 8.1 8.7 7.7 7.6 8.3 8.1 8.6 7.6 7.5 8.2 8.0
DCs 28.3 29.2 30.0 30.0 30.7 31.3 30.8 30.7 30.7 31.3 32.0 31.5 31.4
FSU 4.4 4.5 4.6 4.4 4.3 4.6 5.0 4.6 4.4 4.3 4.7 5.0 4.6
Other Europe 0.6 0.6 0.7 0.7 0.6 0.7 0.7 0.7 0.7 0.6 0.7 0.8 0.7
China 9.7 10.1 10.5 10.4 11.1 10.7 11.1 10.8 10.7 11.4 11.0 11.4 11.1
(a) Total world demand 89.1 90.5 91.4 92.0 92.0 93.9 94.0 93.0 93.1 93.3 95.1 95.2 94.2
Non-OPEC supply
OECD 21.1 22.2 24.2 25.2 24.9 25.3 25.5 25.2 25.2 24.4 24.4 24.7 24.7
Americas 16.7 18.2 20.1 21.0 20.7 21.1 21.2 21.0 20.9 20.4 20.4 20.5 20.5
Europe 3.8 3.6 3.6 3.7 3.8 3.7 3.9 3.8 3.8 3.6 3.5 3.7 3.7
Asia Pacific 0.6 0.5 0.5 0.4 0.4 0.5 0.5 0.5 0.5 0.5 0.5 0.4 0.5
DCs 11.0 11.1 11.3 11.6 11.5 11.4 11.5 11.5 11.4 11.5 11.5 11.7 11.5
FSU 13.4 13.6 13.5 13.8 13.7 13.6 13.7 13.7 13.9 13.5 13.4 13.5 13.6
Other Europe 0.1 0.1 0.1 0.1 0.1 0.1 0.1 0.1 0.1 0.1 0.1 0.1 0.1
China 4.2 4.2 4.3 4.3 4.4 4.4 4.4 4.4 4.3 4.3 4.3 4.3 4.3
Processing gains 2.1 2.1 2.2 2.2 2.2 2.2 2.2 2.2 2.2 2.2 2.2 2.2 2.2
Total non-OPEC supply 51.9 53.4 55.67 57.2 56.8 57.1 57.4 57.1 57.1 56.1 56.0 56.5 56.4
OPEC NGLs + non-conventional oils 5.7 5.8 6.0 6.0 6.1 6.2 6.3 6.1 6.3 6.3 6.3 6.4 6.3
(b) Total non-OPEC supply and OPEC NGLs 57.6 59.2 61.7 63.2 62.9 63.3 63.7 63.3 63.4 62.4 62.3 62.8 62.7
OPEC crude oil production (secondary sources) 31.9 31.0 30.8 31.0 31.9 32.2 32.2 31.8 32.3
Total supply 89.6 90.2 92.4 94.2 94.8 95.5 96.0 95.1 95.7
Balance (stock change and miscellaneous) 0.5 -0.3 1.0 2.2 2.8 1.6 2.0 2.1 2.5
OECD closing stock levels (mb)
Commercial 2,683 2,589 2,738 2,816 2,908 2,984 3,013 3,013
SPR 1,547 1,584 1,579 1,582 1,584 1,578 1,586 1,586
Total 4,230 4,174 4,317 4,398 4,492 4,562 4,599 4,599
Oil-on-water 879 909 924 864 916 924 1,017 1,017
Days of forward consumption in OECD
Commercial onland stocks 58 57 59 62 62 64 65 65
SPR 34 35 34 35 34 34 34 34
Total 92 91 93 97 97 98 99 99
Memo items
FSU net exports 8.9 9.0 9.0 9.3 9.4 9.0 8.8 9.1 9.4 9.2 8.7 8.5 9.0
(a) - (b) 31.4 31.3 29.8 28.8 29.1 30.6 30.3 29.7 29.8 30.9 32.8 32.3 31.5
Note: Totals may not add up due to independent rounding.Source: OPEC Secretariat.
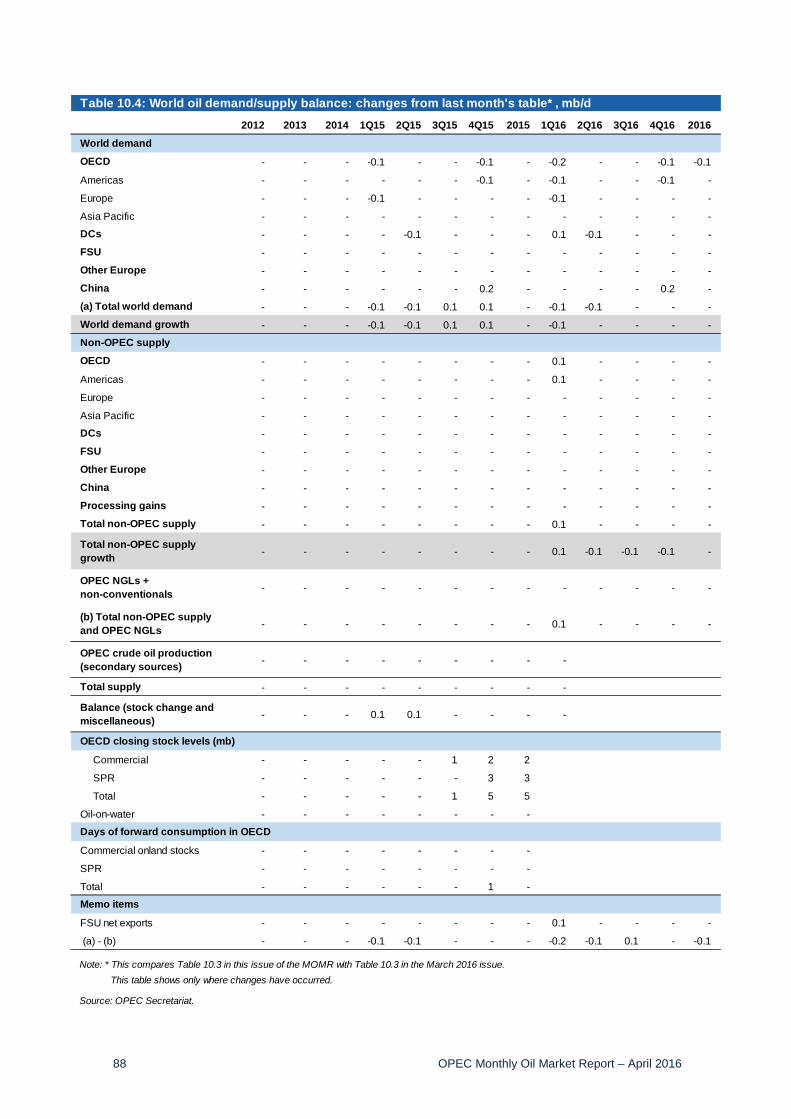
88 OPEC Monthly Oil Market Report – April 2016
Table 10.4: World oil demand/supply balance: changes from last month's table* , mb/d2012 2013 2014 1Q15 2Q15 3Q15 4Q15 2015 1Q16 2Q16 3Q16 4Q16 2016
World demand
OECD - - - -0.1 - - -0.1 - -0.2 - - -0.1 -0.1
Americas - - - - - - -0.1 - -0.1 - - -0.1 -
Europe - - - -0.1 - - - - -0.1 - - - -
Asia Pacific - - - - - - - - - - - - -
DCs - - - - -0.1 - - - 0.1 -0.1 - - -
FSU - - - - - - - - - - - - -
Other Europe - - - - - - - - - - - - -
China - - - - - - 0.2 - - - - 0.2 -
(a) Total world demand - - - -0.1 -0.1 0.1 0.1 - -0.1 -0.1 - - -
World demand growth - - - -0.1 -0.1 0.1 0.1 - -0.1 - - - -
Non-OPEC supply
OECD - - - - - - - - 0.1 - - - -
Americas - - - - - - - - 0.1 - - - -
Europe - - - - - - - - - - - - -
Asia Pacific - - - - - - - - - - - - -
DCs - - - - - - - - - - - - -
FSU - - - - - - - - - - - - -
Other Europe - - - - - - - - - - - - -
China - - - - - - - - - - - - -
Processing gains - - - - - - - - - - - - -
Total non-OPEC supply - - - - - - - - 0.1 - - - -
Total non-OPEC supply growth - - - - - - - - 0.1 -0.1 -0.1 -0.1 -
OPEC NGLs + non-conventionals - - - - - - - - - - - - -
(b) Total non-OPEC supply and OPEC NGLs - - - - - - - - 0.1 - - - -
OPEC crude oil production (secondary sources) - - - - - - - - -
Total supply - - - - - - - - -
Balance (stock change and miscellaneous) - - - 0.1 0.1 - - - -
OECD closing stock levels (mb)
Commercial - - - - - 1 2 2
SPR - - - - - - 3 3
Total - - - - - 1 5 5
Oil-on-water - - - - - - - -
Days of forward consumption in OECD
Commercial onland stocks - - - - - - - -
SPR - - - - - - - -
Total - - - - - - 1 -
Memo items
FSU net exports - - - - - - - - 0.1 - - - -
(a) - (b) - - - -0.1 -0.1 - - - -0.2 -0.1 0.1 - -0.1
Note: * This compares Table 10.3 in this issue of the MOMR with Table 10.3 in the March 2016 issue. This table shows only where changes have occurred.
Source: OPEC Secretariat.
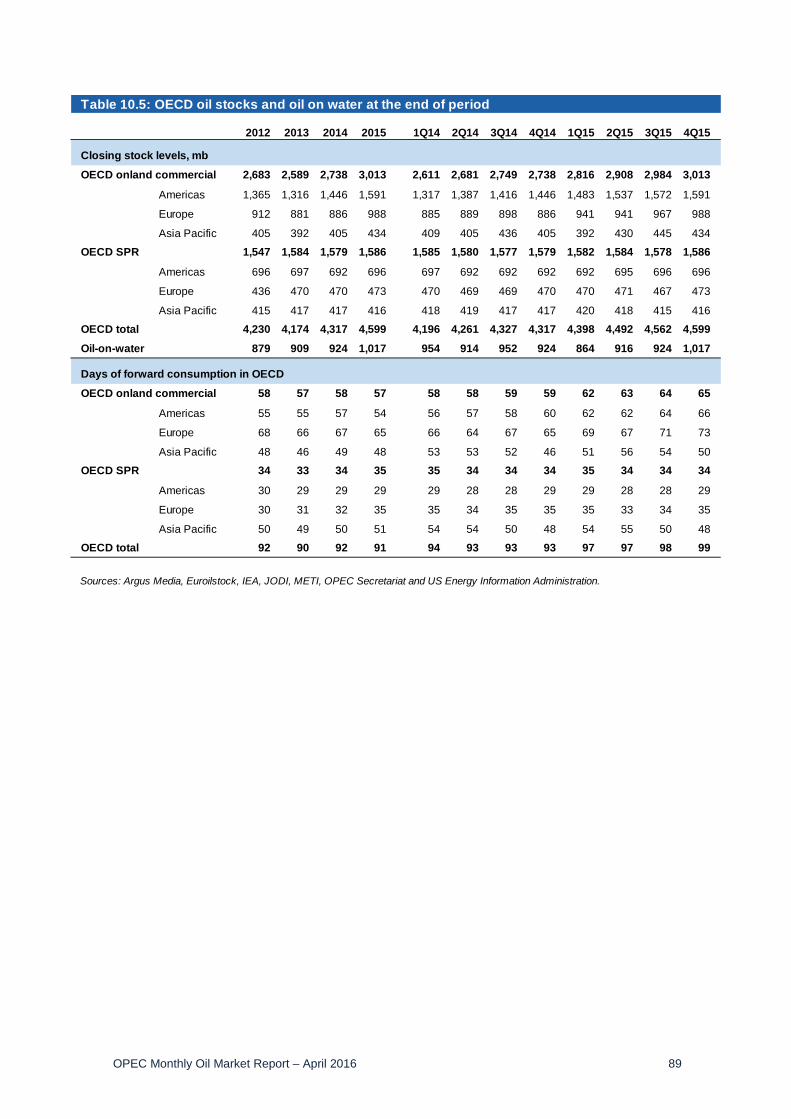
OPEC Monthly Oil Market Report – April 2016 89
Table 10.5: OECD oil stocks and oil on water at the end of period
2012 2013 2014 2015 1Q14 2Q14 3Q14 4Q14 1Q15 2Q15 3Q15 4Q15
Closing stock levels, mb
OECD onland commercial 2,683 2,589 2,738 3,013 2,611 2,681 2,749 2,738 2,816 2,908 2,984 3,013
Americas 1,365 1,316 1,446 1,591 1,317 1,387 1,416 1,446 1,483 1,537 1,572 1,591
Europe 912 881 886 988 885 889 898 886 941 941 967 988
Asia Pacific 405 392 405 434 409 405 436 405 392 430 445 434
OECD SPR 1,547 1,584 1,579 1,586 1,585 1,580 1,577 1,579 1,582 1,584 1,578 1,586
Americas 696 697 692 696 697 692 692 692 692 695 696 696
Europe 436 470 470 473 470 469 469 470 470 471 467 473
Asia Pacific 415 417 417 416 418 419 417 417 420 418 415 416
OECD total 4,230 4,174 4,317 4,599 4,196 4,261 4,327 4,317 4,398 4,492 4,562 4,599
Oil-on-water 879 909 924 1,017 954 914 952 924 864 916 924 1,017
Days of forward consumption in OECD
OECD onland commercial 58 57 58 57 58 58 59 59 62 63 64 65
Americas 55 55 57 54 56 57 58 60 62 62 64 66
Europe 68 66 67 65 66 64 67 65 69 67 71 73
Asia Pacific 48 46 49 48 53 53 52 46 51 56 54 50
OECD SPR 34 33 34 35 35 34 34 34 35 34 34 34
Americas 30 29 29 29 29 28 28 29 29 28 28 29
Europe 30 31 32 35 35 34 35 35 35 33 34 35
Asia Pacific 50 49 50 51 54 54 50 48 54 55 50 48
OECD total 92 90 92 91 94 93 93 93 97 97 98 99
Sources: Argus Media, Euroilstock, IEA, JODI, METI, OPEC Secretariat and US Energy Information Administration.
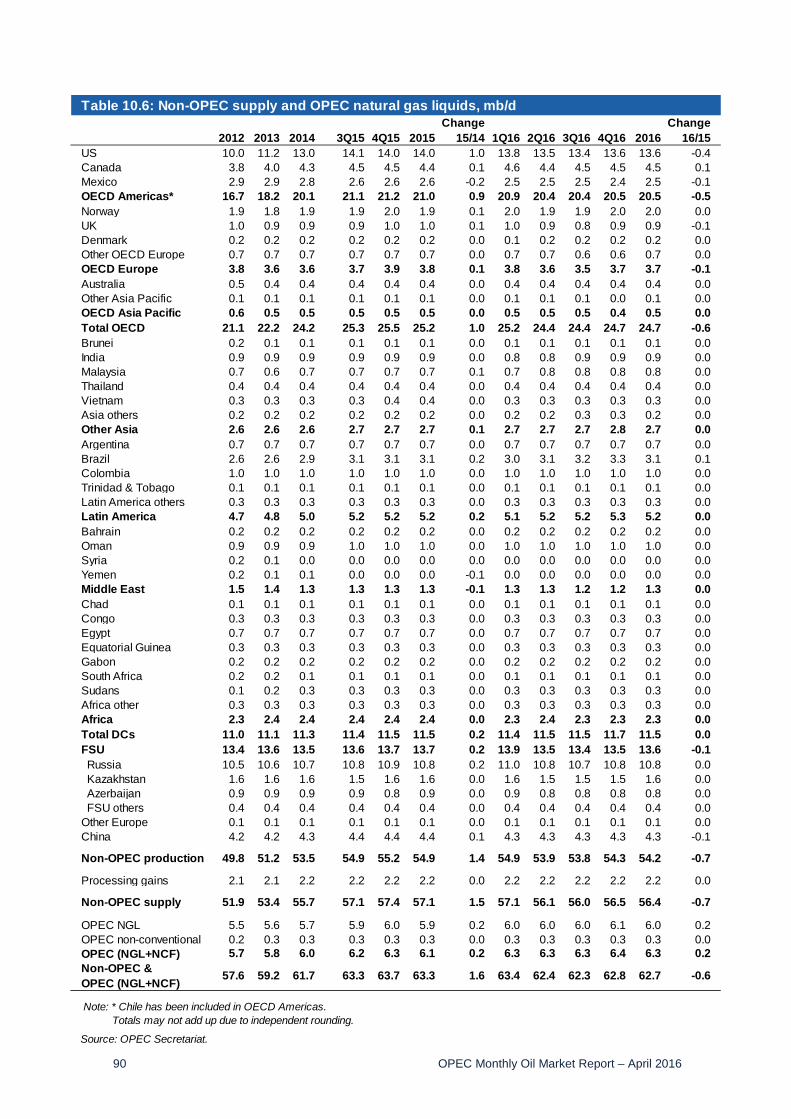
90 OPEC Monthly Oil Market Report – April 2016
Table 10.6: Non-OPEC supply and OPEC natural gas liquids, mb/dChange Change
2012 2013 2014 3Q15 4Q15 2015 15/14 1Q16 2Q16 3Q16 4Q16 2016 16/15US 10.0 11.2 13.0 14.1 14.0 14.0 1.0 13.8 13.5 13.4 13.6 13.6 -0.4Canada 3.8 4.0 4.3 4.5 4.5 4.4 0.1 4.6 4.4 4.5 4.5 4.5 0.1Mexico 2.9 2.9 2.8 2.6 2.6 2.6 -0.2 2.5 2.5 2.5 2.4 2.5 -0.1OECD Americas* 16.7 18.2 20.1 21.1 21.2 21.0 0.9 20.9 20.4 20.4 20.5 20.5 -0.5Norway 1.9 1.8 1.9 1.9 2.0 1.9 0.1 2.0 1.9 1.9 2.0 2.0 0.0UK 1.0 0.9 0.9 0.9 1.0 1.0 0.1 1.0 0.9 0.8 0.9 0.9 -0.1Denmark 0.2 0.2 0.2 0.2 0.2 0.2 0.0 0.1 0.2 0.2 0.2 0.2 0.0Other OECD Europe 0.7 0.7 0.7 0.7 0.7 0.7 0.0 0.7 0.7 0.6 0.6 0.7 0.0OECD Europe 3.8 3.6 3.6 3.7 3.9 3.8 0.1 3.8 3.6 3.5 3.7 3.7 -0.1Australia 0.5 0.4 0.4 0.4 0.4 0.4 0.0 0.4 0.4 0.4 0.4 0.4 0.0Other Asia Pacific 0.1 0.1 0.1 0.1 0.1 0.1 0.0 0.1 0.1 0.1 0.0 0.1 0.0OECD Asia Pacific 0.6 0.5 0.5 0.5 0.5 0.5 0.0 0.5 0.5 0.5 0.4 0.5 0.0Total OECD 21.1 22.2 24.2 25.3 25.5 25.2 1.0 25.2 24.4 24.4 24.7 24.7 -0.6Brunei 0.2 0.1 0.1 0.1 0.1 0.1 0.0 0.1 0.1 0.1 0.1 0.1 0.0India 0.9 0.9 0.9 0.9 0.9 0.9 0.0 0.8 0.8 0.9 0.9 0.9 0.0Malaysia 0.7 0.6 0.7 0.7 0.7 0.7 0.1 0.7 0.8 0.8 0.8 0.8 0.0Thailand 0.4 0.4 0.4 0.4 0.4 0.4 0.0 0.4 0.4 0.4 0.4 0.4 0.0Vietnam 0.3 0.3 0.3 0.3 0.4 0.4 0.0 0.3 0.3 0.3 0.3 0.3 0.0Asia others 0.2 0.2 0.2 0.2 0.2 0.2 0.0 0.2 0.2 0.3 0.3 0.2 0.0Other Asia 2.6 2.6 2.6 2.7 2.7 2.7 0.1 2.7 2.7 2.7 2.8 2.7 0.0Argentina 0.7 0.7 0.7 0.7 0.7 0.7 0.0 0.7 0.7 0.7 0.7 0.7 0.0Brazil 2.6 2.6 2.9 3.1 3.1 3.1 0.2 3.0 3.1 3.2 3.3 3.1 0.1Colombia 1.0 1.0 1.0 1.0 1.0 1.0 0.0 1.0 1.0 1.0 1.0 1.0 0.0Trinidad & Tobago 0.1 0.1 0.1 0.1 0.1 0.1 0.0 0.1 0.1 0.1 0.1 0.1 0.0Latin America others 0.3 0.3 0.3 0.3 0.3 0.3 0.0 0.3 0.3 0.3 0.3 0.3 0.0Latin America 4.7 4.8 5.0 5.2 5.2 5.2 0.2 5.1 5.2 5.2 5.3 5.2 0.0Bahrain 0.2 0.2 0.2 0.2 0.2 0.2 0.0 0.2 0.2 0.2 0.2 0.2 0.0Oman 0.9 0.9 0.9 1.0 1.0 1.0 0.0 1.0 1.0 1.0 1.0 1.0 0.0Syria 0.2 0.1 0.0 0.0 0.0 0.0 0.0 0.0 0.0 0.0 0.0 0.0 0.0Yemen 0.2 0.1 0.1 0.0 0.0 0.0 -0.1 0.0 0.0 0.0 0.0 0.0 0.0Middle East 1.5 1.4 1.3 1.3 1.3 1.3 -0.1 1.3 1.3 1.2 1.2 1.3 0.0Chad 0.1 0.1 0.1 0.1 0.1 0.1 0.0 0.1 0.1 0.1 0.1 0.1 0.0Congo 0.3 0.3 0.3 0.3 0.3 0.3 0.0 0.3 0.3 0.3 0.3 0.3 0.0Egypt 0.7 0.7 0.7 0.7 0.7 0.7 0.0 0.7 0.7 0.7 0.7 0.7 0.0Equatorial Guinea 0.3 0.3 0.3 0.3 0.3 0.3 0.0 0.3 0.3 0.3 0.3 0.3 0.0Gabon 0.2 0.2 0.2 0.2 0.2 0.2 0.0 0.2 0.2 0.2 0.2 0.2 0.0South Africa 0.2 0.2 0.1 0.1 0.1 0.1 0.0 0.1 0.1 0.1 0.1 0.1 0.0Sudans 0.1 0.2 0.3 0.3 0.3 0.3 0.0 0.3 0.3 0.3 0.3 0.3 0.0Africa other 0.3 0.3 0.3 0.3 0.3 0.3 0.0 0.3 0.3 0.3 0.3 0.3 0.0Africa 2.3 2.4 2.4 2.4 2.4 2.4 0.0 2.3 2.4 2.3 2.3 2.3 0.0Total DCs 11.0 11.1 11.3 11.4 11.5 11.5 0.2 11.4 11.5 11.5 11.7 11.5 0.0FSU 13.4 13.6 13.5 13.6 13.7 13.7 0.2 13.9 13.5 13.4 13.5 13.6 -0.1 Russia 10.5 10.6 10.7 10.8 10.9 10.8 0.2 11.0 10.8 10.7 10.8 10.8 0.0 Kazakhstan 1.6 1.6 1.6 1.5 1.6 1.6 0.0 1.6 1.5 1.5 1.5 1.6 0.0 Azerbaijan 0.9 0.9 0.9 0.9 0.8 0.9 0.0 0.9 0.8 0.8 0.8 0.8 0.0 FSU others 0.4 0.4 0.4 0.4 0.4 0.4 0.0 0.4 0.4 0.4 0.4 0.4 0.0Other Europe 0.1 0.1 0.1 0.1 0.1 0.1 0.0 0.1 0.1 0.1 0.1 0.1 0.0China 4.2 4.2 4.3 4.4 4.4 4.4 0.1 4.3 4.3 4.3 4.3 4.3 -0.1
Non-OPEC production 49.8 51.2 53.5 54.9 55.2 54.9 1.4 54.9 53.9 53.8 54.3 54.2 -0.7
Processing gains 2.1 2.1 2.2 2.2 2.2 2.2 0.0 2.2 2.2 2.2 2.2 2.2 0.0
Non-OPEC supply 51.9 53.4 55.7 57.1 57.4 57.1 1.5 57.1 56.1 56.0 56.5 56.4 -0.7
OPEC NGL 5.5 5.6 5.7 5.9 6.0 5.9 0.2 6.0 6.0 6.0 6.1 6.0 0.2OPEC non-conventional 0.2 0.3 0.3 0.3 0.3 0.3 0.0 0.3 0.3 0.3 0.3 0.3 0.0OPEC (NGL+NCF) 5.7 5.8 6.0 6.2 6.3 6.1 0.2 6.3 6.3 6.3 6.4 6.3 0.2Non-OPEC & OPEC (NGL+NCF) 57.6 59.2 61.7 63.3 63.7 63.3 1.6 63.4 62.4 62.3 62.8 62.7 -0.6
Note: * Chile has been included in OECD Americas.
Source: OPEC Secretariat.
Totals may not add up due to independent rounding.

OPEC Monthly Oil Market Report – April 2016 91
Table 10.7: World Rig CountChange Change
2012 2013 2014 2015 15/14 2Q15 3Q15 4Q15 1Q16 Feb 16 Mar 16 Mar/FebUS 1,919 1,761 1,862 977 -885 909 866 754 551 532 477 -55Canada 364 354 380 192 -188 99 191 169 172 211 88 -123Mexico 106 106 86 52 -34 59 42 39 36 39 27 -12Americas 2,390 2,221 2,327 1,221 -1,107 1,067 1,098 962 759 782 592 -190Norway 17 20 17 17 1 18 18 15 18 18 19 1UK 18 17 16 14 -2 14 13 12 9 8 10 2Europe 119 135 145 117 -28 116 109 110 104 107 96 -11Asia Pacific 24 27 26 17 -9 17 16 15 10 9 8 -1Total OECD 2,533 2,383 2,499 1,355 -1,144 1,200 1,222 1,087 873 898 696 -202Other Asia 217 219 228 202 -26 203 201 191 176 173 175 2Latin America 180 166 172 145 -27 143 149 128 83 83 75 -8Middle East 136 102 108 102 -6 98 100 106 98 97 94 -3Africa 7 16 28 11 -16 12 8 3 2 2 1 -1Total DCs 539 503 536 460 -75 456 458 428 359 355 345 -10Non-OPEC rig count 3,071 2,886 3,034 1,815 -1,219 1,656 1,681 1,516 1,232 1,253 1,041 -212
Algeria 36 47 48 51 3 52 51 49 52 52 54 2Angola 9 11 15 11 -4 12 8 11 9 8 8 0Ecuador 20 26 24 12 -12 15 12 4 3 4 3 -1Iran** 54 54 54 54 0 54 54 54 57 57 57 0Iraq** 58 83 79 52 -27 53 47 51 49 49 48 -1Kuwait** 31 32 38 47 8 49 44 42 41 43 41 -2Libya** 9 15 10 3 -8 3 1 1 1 1 1 0Nigeria 36 37 34 30 -4 29 28 28 27 25 27 2Qatar 8 9 10 8 -3 8 7 6 7 6 6 0Saudi Arabia 112 114 134 155 21 155 154 158 157 159 158 -1UAE 24 28 34 42 8 39 41 52 50 50 50 0Venezuela 117 121 116 110 -6 105 114 112 111 111 113 2OPEC rig count 513 576 596 574 -22 575 561 566 564 565 566 1
Worldwide rig count* 3,584 3,462 3,631 2,389 -1,241 2,231 2,242 2,082 1,796 1,818 1,607 -211of which: Oil 2,594 2,611 2,795 1,727 -1,068 1,616 1,606 1,471 1,268 1,284 1,128 -156 Gas 886 746 743 563 -180 516 536 509 422 426 374 -52 Others 106 109 95 100 5 98 99 102 106 108 105 -3
Note: Totals may not add up due to independent rounding. * Excludes China and FSU.na: Not available. ** Estimated figure when Baker Hughes Incorporated did Sources: Baker Hughes Incorporated & Secretariat's estimates. not reported the data.
92 OPEC Monthly Oil Market Report – April 2016
Contributors to the OPEC Monthly Oil Market Report Editor-in-Chief Omar S. Abdul-Hamid, Director, Research Division email: oabdul-hamid(at)opec.org Editor Hojatollah Ghanimi Fard, Head, Petroleum Studies Department email: h.ghanimifard(at)opec.org Analysts Crude Oil Price Movements Eissa Alzerma
email: ealzerma(at)opec.org
Commodity Markets Hector Hurtado email: hhurtado(at)opec.org
World Economy Afshin Javan email: ajavan(at)opec.org Imad Al-Khayyat email: ial-khayyat(at)opec.org Joerg Spitzy
email: jspitzy(at)opec.org
World Oil Demand Hassan Balfakeih email: hbalfakeih(at)opec.org
World Oil Supply Mohammad Ali Danesh email: mdanesh(at)opec.org
Product Markets and Refinery Operations Elio Rodriguez email: erodriguez(at)opec.org
Tanker Market and Oil Trade Anisah Almadhayyan email: aalmadhayyan(at)opec.org
Stock Movements Aziz Yahyai email: ayahyai(at)opec.org
Technical and editorial team Aziz Yahyai email: ayahyai(at)opec.org Douglas Linton email: dlinton(at)opec.org
Data services Adedapo Odulaja, Head, Data Services Department (aodulaja(at)opec.org), Hossein Hassani, Statistical Systems Coordinator (hhassani(at)opec.org), Pantelis Christodoulides (World Oil Demand and Stock Movements), Klaus Stoeger (World Oil Supply), Harvir Kalirai (World Economy), Mouhamad Moudassir (Product Markets and Refinery Operations), Mohammad Sattar (Tanker Market and Oil Trade), Anna Gredinger (Crude Oil Price Movements and Commodities) Editing, production, design and circulation Alvino-Mario Fantini, Maureen MacNeill, Scott Laury, Viveca Hameder, Hataichanok Leimlehner, Andrea Birnbach
OPEC Monthly Oil Market Report – April 2016 93
Disclaimer
The data, analysis and any other information contained in the Monthly Oil Market Report (the “MOMR”) is for informational purposes only and is not intended as a substitute for advice from your business, finance, investment consultant or other professional. The views expressed in the MOMR are those of the OPEC Secretariat and do not necessarily reflect the views of its Governing Bodies and/or individual OPEC Member Countries.
Whilst reasonable efforts have been made to ensure the accuracy of the MOMR’s content, the OPEC Secretariat makes no warranties or representations as to its accuracy, currency reference or comprehensiveness, and assumes no liability or responsibility for any inaccuracy, error or omission, or for any loss or damage arising in connection with or attributable to any action or decision taken as a result of using or relying on the information in the MOMR.
The MOMR may contain references to material(s) from third parties whose copyright must be acknowledged by obtaining necessary authorization from the copyright owner(s). The OPEC Secretariat shall not be liable or responsible for any unauthorized use of third party material(s). All rights of the Publication shall be reserved to the OPEC Secretariat, including every exclusive economic right, in full or per excerpts, with special reference but without limitation, to the right to publish it by press and/or by any communications medium whatsoever, including Internet; translate, include in a data base, make changes, transform and process for any kind of use, including radio, television or cinema adaptations, as well as sound-video recording, audio-visual screenplays and electronic processing of any kind and nature whatsoever.
Full reproduction, copying or transmission of the MOMR is not permitted in any form or by any means by third parties without the OPEC Secretariat’s written permission, however the information contained therein may be used and/or reproduced for educational and other non-commercial purposes without the OPEC Secretariat’s prior written permission, provided that OPEC is fully acknowledged as the copyright holder.
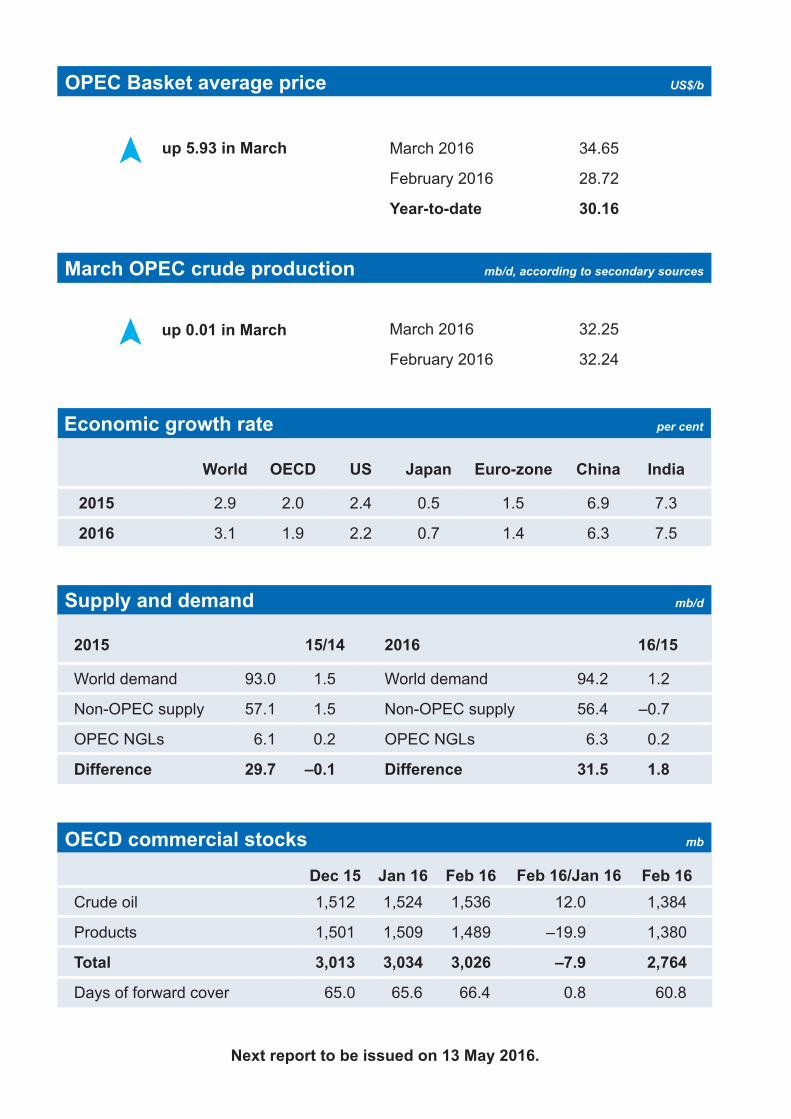
Next report to be issued on 13 May 2016.
OPEC Basket average price US$/b
March OPEC crude production mb/d, according to secondary sources
Economic growth rate per cent
up 5.93 in March
up 0.01 in March
March 2016 34.65
February 2016 28.72
Year-to-date 30.16
March 2016 32.25
February 2016 32.24
World OECD US Japan Euro-zone China India
2015 2.9 2.0 2.4 0.5 1.5 6.9 7.3
2016 3.1 1.9 2.2 0.7 1.4 6.3 7.5
Supply and demand mb/d
OECD commercial stocks mb
2015 15/14 2016 16/15
World demand 93.0 1.5 World demand 94.2 1.2
Non-OPEC supply 57.1 1.5 Non-OPEC supply 56.4 –0.7
OPEC NGLs 6.1 0.2 OPEC NGLs 6.3 0.2
Difference 29.7 –0.1 Difference 31.5 1.8
Dec 15 Jan 16 Feb 16 Feb 16/Jan 16 Feb 16Crude oil 1,512 1,524 1,536 12.0 1,384
Products 1,501 1,509 1,489 –19.9 1,380
Total 3,013 3,034 3,026 –7.9 2,764
Days of forward cover 65.0 65.6 66.4 0.8 60.8