Online Only Supplemental Material - Springer10.1007/s10654-015-0056... · Supplemental Table S1....
74
Online Only Supplemental Material
Transcript of Online Only Supplemental Material - Springer10.1007/s10654-015-0056... · Supplemental Table S1....

Online Only Supplemental Material
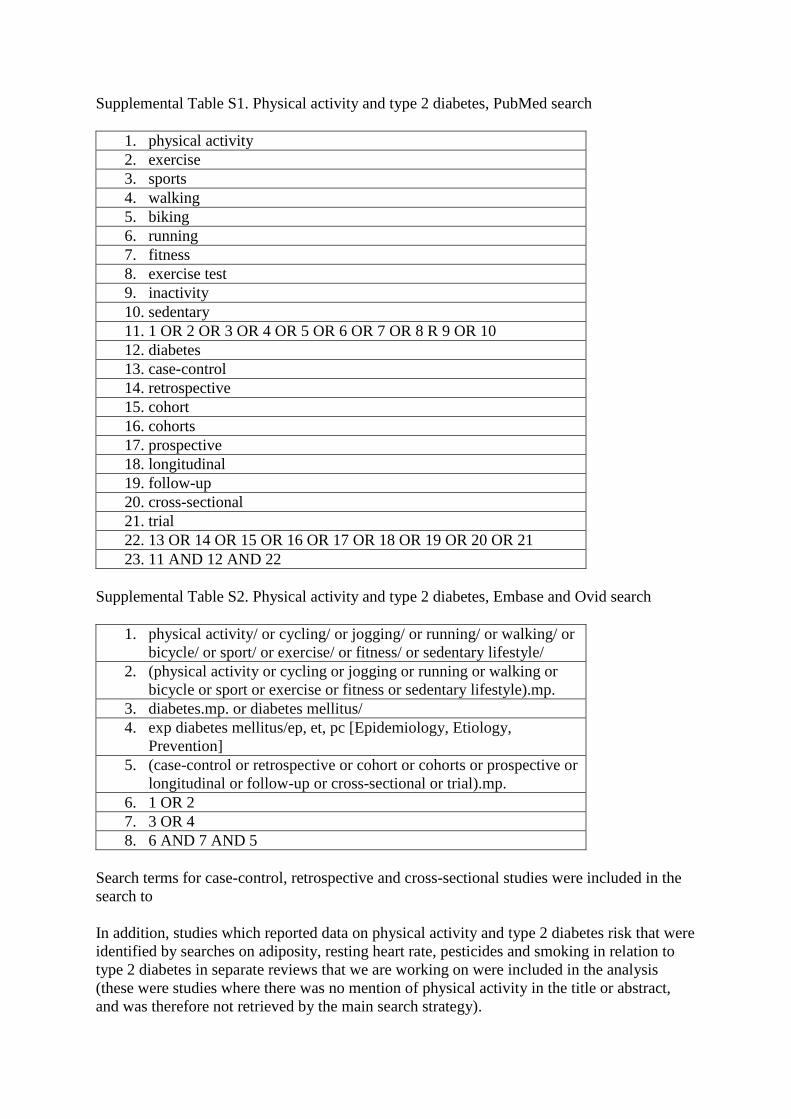
Supplemental Table S1. Physical activity and type 2 diabetes, PubMed search
1. physical activity
2. exercise
3. sports
4. walking
5. biking
6. running
7. fitness
8. exercise test
9. inactivity
10. sedentary
11. 1 OR 2 OR 3 OR 4 OR 5 OR 6 OR 7 OR 8 R 9 OR 10
12. diabetes
13. case-control
14. retrospective
15. cohort
16. cohorts
17. prospective
18. longitudinal
19. follow-up
20. cross-sectional
21. trial
22. 13 OR 14 OR 15 OR 16 OR 17 OR 18 OR 19 OR 20 OR 21
23. 11 AND 12 AND 22
Supplemental Table S2. Physical activity and type 2 diabetes, Embase and Ovid search
1. physical activity/ or cycling/ or jogging/ or running/ or walking/ or
bicycle/ or sport/ or exercise/ or fitness/ or sedentary lifestyle/
2. (physical activity or cycling or jogging or running or walking or
bicycle or sport or exercise or fitness or sedentary lifestyle).mp.
3. diabetes.mp. or diabetes mellitus/
4. exp diabetes mellitus/ep, et, pc [Epidemiology, Etiology,
Prevention]
5. (case-control or retrospective or cohort or cohorts or prospective or
longitudinal or follow-up or cross-sectional or trial).mp.
6. 1 OR 2
7. 3 OR 4
8. 6 AND 7 AND 5
Search terms for case-control, retrospective and cross-sectional studies were included in the
search to
In addition, studies which reported data on physical activity and type 2 diabetes risk that were
identified by searches on adiposity, resting heart rate, pesticides and smoking in relation to
type 2 diabetes in separate reviews that we are working on were included in the analysis
(these were studies where there was no mention of physical activity in the title or abstract,
and was therefore not retrieved by the main search strategy).
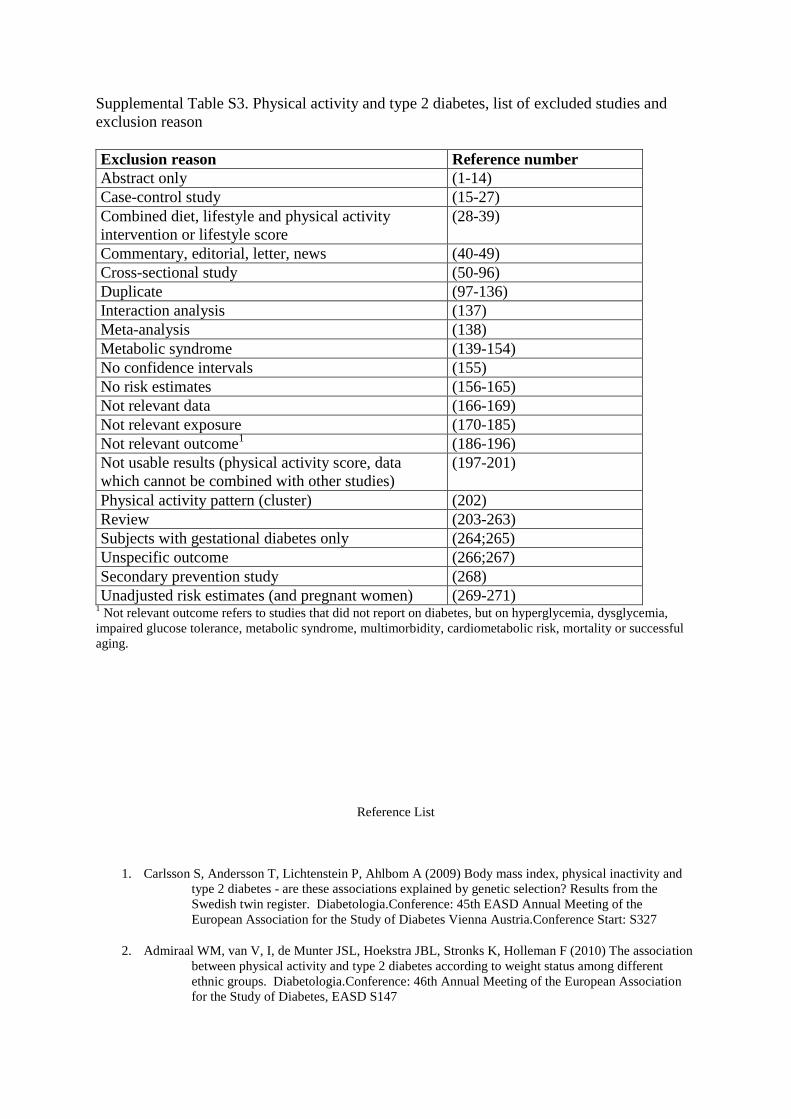
Supplemental Table S3. Physical activity and type 2 diabetes, list of excluded studies and
exclusion reason
Exclusion reason Reference number
Abstract only (1-14)
Case-control study (15-27)
Combined diet, lifestyle and physical activity
intervention or lifestyle score
(28-39)
Commentary, editorial, letter, news (40-49)
Cross-sectional study (50-96)
Duplicate (97-136)
Interaction analysis (137)
Meta-analysis (138)
Metabolic syndrome (139-154)
No confidence intervals (155)
No risk estimates (156-165)
Not relevant data (166-169)
Not relevant exposure (170-185)
Not relevant outcome1
(186-196)
Not usable results (physical activity score, data
which cannot be combined with other studies)
(197-201)
Physical activity pattern (cluster) (202)
Review (203-263)
Subjects with gestational diabetes only (264;265)
Unspecific outcome (266;267)
Secondary prevention study (268)
Unadjusted risk estimates (and pregnant women) (269-271) 1 Not relevant outcome refers to studies that did not report on diabetes, but on hyperglycemia, dysglycemia,
impaired glucose tolerance, metabolic syndrome, multimorbidity, cardiometabolic risk, mortality or successful
aging.
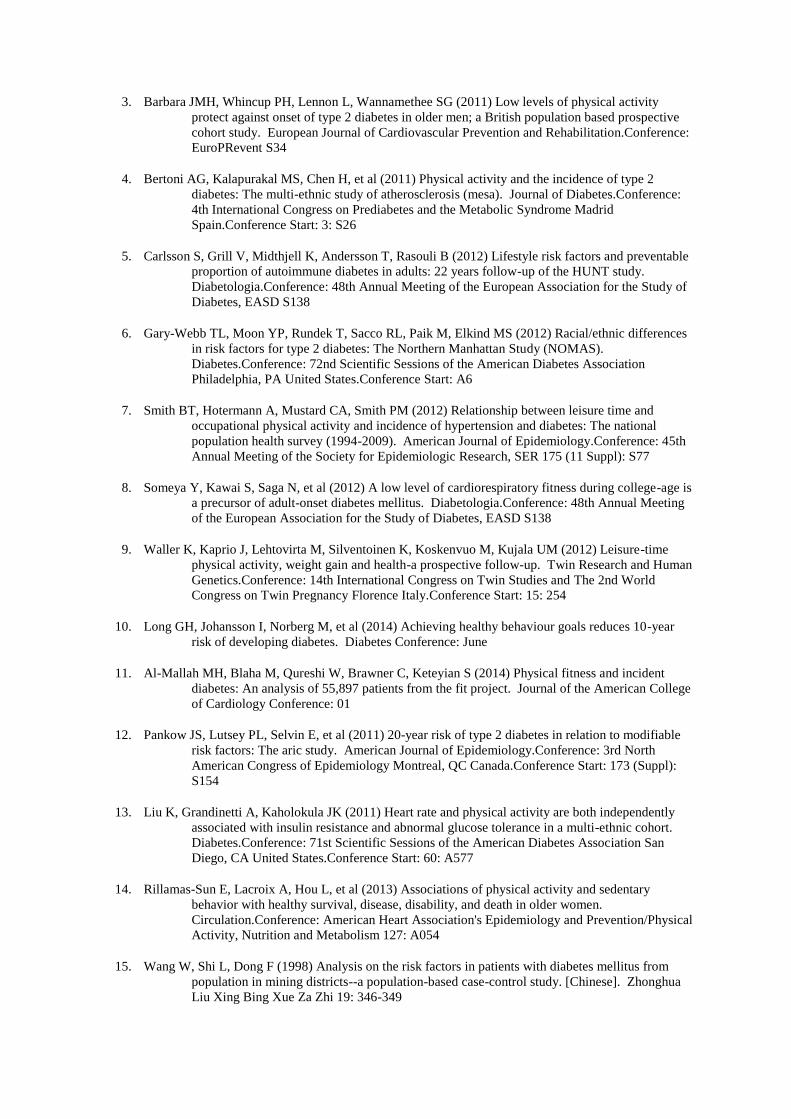
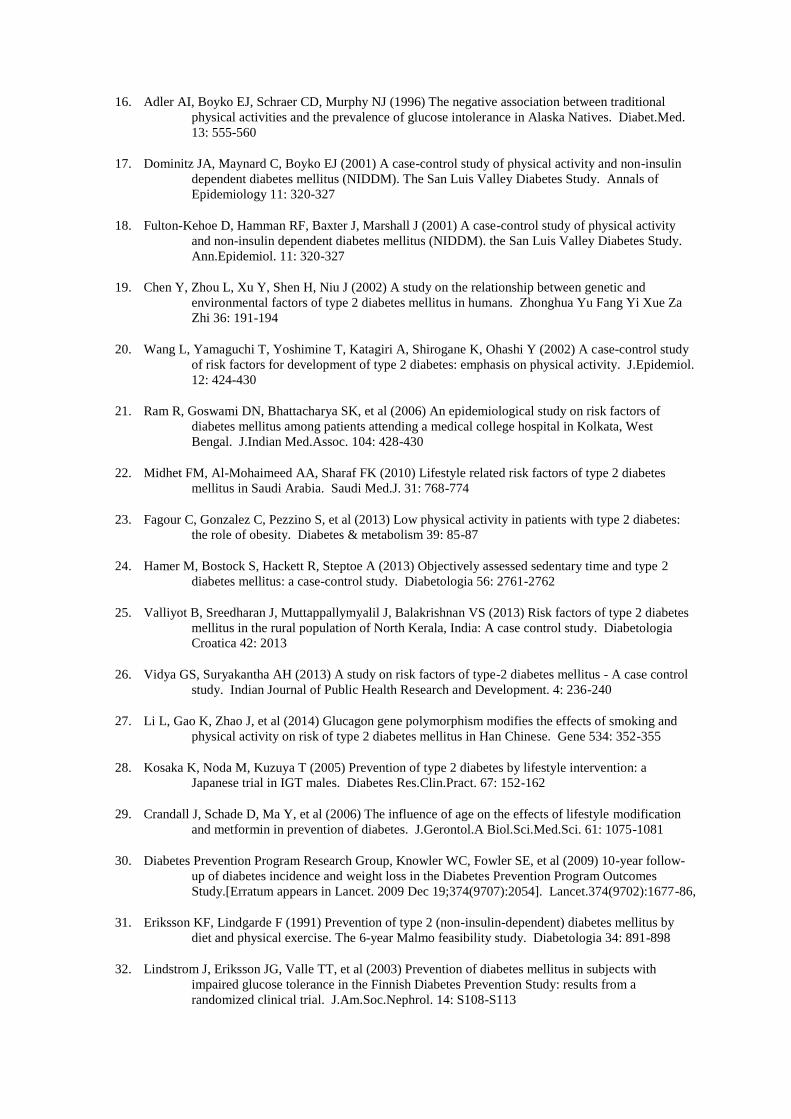
Reference List
1. Carlsson S, Andersson T, Lichtenstein P, Ahlbom A (2009) Body mass index, physical inactivity and
type 2 diabetes - are these associations explained by genetic selection? Results from the
Swedish twin register. Diabetologia.Conference: 45th EASD Annual Meeting of the
European Association for the Study of Diabetes Vienna Austria.Conference Start: S327
2. Admiraal WM, van V, I, de Munter JSL, Hoekstra JBL, Stronks K, Holleman F (2010) The association
between physical activity and type 2 diabetes according to weight status among different
ethnic groups. Diabetologia.Conference: 46th Annual Meeting of the European Association
for the Study of Diabetes, EASD S147
3. Barbara JMH, Whincup PH, Lennon L, Wannamethee SG (2011) Low levels of physical activity
protect against onset of type 2 diabetes in older men; a British population based prospective
cohort study. European Journal of Cardiovascular Prevention and Rehabilitation.Conference:
EuroPRevent S34
4. Bertoni AG, Kalapurakal MS, Chen H, et al (2011) Physical activity and the incidence of type 2
diabetes: The multi-ethnic study of atherosclerosis (mesa). Journal of Diabetes.Conference:
4th International Congress on Prediabetes and the Metabolic Syndrome Madrid
Spain.Conference Start: 3: S26
5. Carlsson S, Grill V, Midthjell K, Andersson T, Rasouli B (2012) Lifestyle risk factors and preventable
proportion of autoimmune diabetes in adults: 22 years follow-up of the HUNT study.
Diabetologia.Conference: 48th Annual Meeting of the European Association for the Study of
Diabetes, EASD S138
6. Gary-Webb TL, Moon YP, Rundek T, Sacco RL, Paik M, Elkind MS (2012) Racial/ethnic differences
in risk factors for type 2 diabetes: The Northern Manhattan Study (NOMAS).
Diabetes.Conference: 72nd Scientific Sessions of the American Diabetes Association
Philadelphia, PA United States.Conference Start: A6
7. Smith BT, Hotermann A, Mustard CA, Smith PM (2012) Relationship between leisure time and
occupational physical activity and incidence of hypertension and diabetes: The national
population health survey (1994-2009). American Journal of Epidemiology.Conference: 45th
Annual Meeting of the Society for Epidemiologic Research, SER 175 (11 Suppl): S77
8. Someya Y, Kawai S, Saga N, et al (2012) A low level of cardiorespiratory fitness during college-age is
a precursor of adult-onset diabetes mellitus. Diabetologia.Conference: 48th Annual Meeting
of the European Association for the Study of Diabetes, EASD S138
9. Waller K, Kaprio J, Lehtovirta M, Silventoinen K, Koskenvuo M, Kujala UM (2012) Leisure-time
physical activity, weight gain and health-a prospective follow-up. Twin Research and Human
Genetics.Conference: 14th International Congress on Twin Studies and The 2nd World
Congress on Twin Pregnancy Florence Italy.Conference Start: 15: 254
10. Long GH, Johansson I, Norberg M, et al (2014) Achieving healthy behaviour goals reduces 10-year
risk of developing diabetes. Diabetes Conference: June
11. Al-Mallah MH, Blaha M, Qureshi W, Brawner C, Keteyian S (2014) Physical fitness and incident
diabetes: An analysis of 55,897 patients from the fit project. Journal of the American College
of Cardiology Conference: 01
12. Pankow JS, Lutsey PL, Selvin E, et al (2011) 20-year risk of type 2 diabetes in relation to modifiable
risk factors: The aric study. American Journal of Epidemiology.Conference: 3rd North
American Congress of Epidemiology Montreal, QC Canada.Conference Start: 173 (Suppl):
S154
13. Liu K, Grandinetti A, Kaholokula JK (2011) Heart rate and physical activity are both independently
associated with insulin resistance and abnormal glucose tolerance in a multi-ethnic cohort.
Diabetes.Conference: 71st Scientific Sessions of the American Diabetes Association San
Diego, CA United States.Conference Start: 60: A577
14. Rillamas-Sun E, Lacroix A, Hou L, et al (2013) Associations of physical activity and sedentary
behavior with healthy survival, disease, disability, and death in older women.
Circulation.Conference: American Heart Association's Epidemiology and Prevention/Physical
Activity, Nutrition and Metabolism 127: A054
15. Wang W, Shi L, Dong F (1998) Analysis on the risk factors in patients with diabetes mellitus from
population in mining districts--a population-based case-control study. [Chinese]. Zhonghua
Liu Xing Bing Xue Za Zhi 19: 346-349
16. Adler AI, Boyko EJ, Schraer CD, Murphy NJ (1996) The negative association between traditional
physical activities and the prevalence of glucose intolerance in Alaska Natives. Diabet.Med.
13: 555-560
17. Dominitz JA, Maynard C, Boyko EJ (2001) A case-control study of physical activity and non-insulin
dependent diabetes mellitus (NIDDM). The San Luis Valley Diabetes Study. Annals of
Epidemiology 11: 320-327
18. Fulton-Kehoe D, Hamman RF, Baxter J, Marshall J (2001) A case-control study of physical activity
and non-insulin dependent diabetes mellitus (NIDDM). the San Luis Valley Diabetes Study.
Ann.Epidemiol. 11: 320-327
19. Chen Y, Zhou L, Xu Y, Shen H, Niu J (2002) A study on the relationship between genetic and
environmental factors of type 2 diabetes mellitus in humans. Zhonghua Yu Fang Yi Xue Za
Zhi 36: 191-194
20. Wang L, Yamaguchi T, Yoshimine T, Katagiri A, Shirogane K, Ohashi Y (2002) A case-control study
of risk factors for development of type 2 diabetes: emphasis on physical activity. J.Epidemiol.
12: 424-430
21. Ram R, Goswami DN, Bhattacharya SK, et al (2006) An epidemiological study on risk factors of
diabetes mellitus among patients attending a medical college hospital in Kolkata, West
Bengal. J.Indian Med.Assoc. 104: 428-430
22. Midhet FM, Al-Mohaimeed AA, Sharaf FK (2010) Lifestyle related risk factors of type 2 diabetes
mellitus in Saudi Arabia. Saudi Med.J. 31: 768-774
23. Fagour C, Gonzalez C, Pezzino S, et al (2013) Low physical activity in patients with type 2 diabetes:
the role of obesity. Diabetes & metabolism 39: 85-87
24. Hamer M, Bostock S, Hackett R, Steptoe A (2013) Objectively assessed sedentary time and type 2
diabetes mellitus: a case-control study. Diabetologia 56: 2761-2762
25. Valliyot B, Sreedharan J, Muttappallymyalil J, Balakrishnan VS (2013) Risk factors of type 2 diabetes
mellitus in the rural population of North Kerala, India: A case control study. Diabetologia
Croatica 42: 2013
26. Vidya GS, Suryakantha AH (2013) A study on risk factors of type-2 diabetes mellitus - A case control
study. Indian Journal of Public Health Research and Development. 4: 236-240
27. Li L, Gao K, Zhao J, et al (2014) Glucagon gene polymorphism modifies the effects of smoking and
physical activity on risk of type 2 diabetes mellitus in Han Chinese. Gene 534: 352-355
28. Kosaka K, Noda M, Kuzuya T (2005) Prevention of type 2 diabetes by lifestyle intervention: a
Japanese trial in IGT males. Diabetes Res.Clin.Pract. 67: 152-162
29. Crandall J, Schade D, Ma Y, et al (2006) The influence of age on the effects of lifestyle modification
and metformin in prevention of diabetes. J.Gerontol.A Biol.Sci.Med.Sci. 61: 1075-1081
30. Diabetes Prevention Program Research Group, Knowler WC, Fowler SE, et al (2009) 10-year follow-
up of diabetes incidence and weight loss in the Diabetes Prevention Program Outcomes
Study.[Erratum appears in Lancet. 2009 Dec 19;374(9707):2054]. Lancet.374(9702):1677-86,
31. Eriksson KF, Lindgarde F (1991) Prevention of type 2 (non-insulin-dependent) diabetes mellitus by
diet and physical exercise. The 6-year Malmo feasibility study. Diabetologia 34: 891-898
32. Lindstrom J, Eriksson JG, Valle TT, et al (2003) Prevention of diabetes mellitus in subjects with
impaired glucose tolerance in the Finnish Diabetes Prevention Study: results from a
randomized clinical trial. J.Am.Soc.Nephrol. 14: S108-S113
33. Knowler WC, Fowler SE, Hamman RF, et al (2009) 10-year follow-up of diabetes incidence and
weight loss in the Diabetes Prevention Program Outcomes Study. Lancet 374: 1677-1686
34. Penn L, White M, Oldroyd J, Walker M, Alberti KG, Mathers JC (2009) Prevention of type 2 diabetes
in adults with impaired glucose tolerance: the European Diabetes Prevention RCT in
Newcastle upon Tyne, UK. BMC Public Health 9: 342
35. Harati H, Hadaegh F, Momenan AA, et al (2010) Reduction in incidence of type 2 diabetes by lifestyle
intervention in a middle eastern community. Am.J.Prev.Med. 38: 628-636
36. Saito T, Watanabe M, Nishida J, et al (2011) Lifestyle modification and prevention of type 2 diabetes
in overweight Japanese with impaired fasting glucose levels: a randomized controlled trial.
Arch.Intern.Med. 171: 1352-1360
37. Lindstrom J, Peltonen M, Eriksson JG, et al (2013) Improved lifestyle and decreased diabetes risk over
13 years: long-term follow-up of the randomised Finnish Diabetes Prevention Study (DPS).
Diabetologia 56: 284-293
38. Knowler WC, Barrett-Connor E, Fowler SE, et al (2002) Reduction in the incidence of type 2 diabetes
with lifestyle intervention or metformin. N.Engl.J.Med. 346: 393-403
39. Wang Y, Hu G, Tuomilehto J, Jousilahti P (2012) Lifestyle factors predict further development of
diabetes: A large prospective population based-study in Finland. Circulation.Conference:
American Heart Association 126: A10866
40. Laaksonen DE, Lindstrom J, Tuomilehto J, Uusitupa M (2007) Increased physical activity is a
cornerstone in the prevention of type 2 diabetes in high-risk individuals. Diabetologia 50:
2607-2608
41. Lloyd CE, Barnett AH (2008) Physical activity and risk of diabetes. Lancet 371: 5-7
42. Horton ES (1991) Exercise and decreased risk of NIDDM. N.Engl.J.Med. 325: 196-198
43. Fagot-Campagna A, Saaddine J, Narayan KMV, Goldschmid M, Howard BV (1999) Re: Sex
differences in risk factors for clinical diabetes mellitus in a general population: A 12-year
follow-up of the Finnmark study [2]. American Journal of Epidemiology.149 (11) (pp 1073-
1074), 149: 1073-1074
44. McCarthy WJ, Kuo T (2009) Support for benefit of physical activity on satiety, weight control, and
diabetes risk. Archives of Internal Medicine. 169: 634-635
45. Gerstein HC (1993) Exercise in the prevention of diabetes mellitus in male physicians. Manson J.E.,
Nathan D.M., Krolewski A.S., et al. A prospective study of exercise and incidence of diabetes
among U.S. male physicians. JAMA 1992;268:63-7. Clinical Journal of Sport Medicine.3 (1)
(pp 61), 3: 61
46. Charatan F (2001) Exercise and diet reduce risk of diabetes, US study shows. BMJ 323: 359
47. Tuomilehto J, Lindstrom J, Eriksson JG, et al (2001) Lifestyle changes can prevent the development of
diabetes mellitus. CMAJ 164: 1885
48. Tuomilehto J, Lindstrom J, Eriksson JG (2001) Changes in diet and physical activity prevented type 2
diabetes mellitus in people with impaired glucose tolerance. Evidence-Based Medicine. 6:
176
49. Anonymous(2005) High BMI and low physical activity are independent risk factors for type 2 diabetes
in women. Evidence-Based Healthcare and Public Health.9 (2) (pp 155-156), 9: 155-156
50. Al-Mahroos F, McKeigue P (1998) Obesity, physical activity and prevalence of diabetes in Bahraini
Arab native population. Bahrain Medical Bulletin. 20: 114-118
51. King H, Zimmet P, Raper LR, Balkau B (1984) Risk factors for diabetes in three Pacific populations.
Am.J.Epidemiol. 119: 396-409
52. Ramaiya KL, Swai AB, McLarty DG, Alberti KG (1991) Impaired glucose tolerance and diabetes
mellitus in Hindu Indian immigrants in Dar es Salaam. Diabet.Med. 8: 738-744
53. Chou P, Chen HH, Hsiao KJ (1992) Community-based epidemiological study on diabetes in Pu-Li,
Taiwan. Diabetes Care 15: 81-89
54. Stern MP, Gonzalez C, Mitchell BD, Villalpando E, Haffner SM, Hazuda HP (1992) Genetic and
environmental determinants of type II diabetes in Mexico City and San Antonio. Diabetes 41:
484-492
55. Kujala UM, Kaprio J, Taimela S, Sarna S (1994) Prevalence of diabetes, hypertension, and ischemic
heart disease in former elite athletes. Metabolism 43: 1255-1260
56. Gause-Nilsson I, Suominen H, Laukkanen P, Schroll M, Steen B (1999) Body composition, smoking
and physical activity in 75-year-old men and women in three Nordic localities with special
reference to diagnosed diseases. The journal of nutrition, health & aging. 3: 172-176
57. Levitt NS, Steyn K, Lambert EV, et al (1999) Modifiable risk factors for Type 2 diabetes mellitus in a
peri-urban community in South Africa. Diabet.Med. 16: 946-950
58. Defay R, Delcourt C, Ranvier M, Lacroux A, Papoz L (2001) Relationships between physical activity,
obesity and diabetes mellitus in a French elderly population: the POLA study. Pathologies
Oculaires liees a l' Age. Int.J.Obes.Relat Metab Disord. 25: 512-518
59. Duc Son LN, Kusama K, Hung NT, et al (2004) Prevalence and risk factors for diabetes in Ho Chi
Minh City, Vietnam. Diabet.Med. 21: 371-376
60. Dunstan DW, Salmon J, Owen N, et al (2004) Physical activity and television viewing in relation to
risk of undiagnosed abnormal glucose metabolism in adults. Diabetes Care 27: 2603-2609
61. Rose S, Lawton B, Dowell A, Fenton A (2004) Risk factors for type 2 diabetes in postmenopausal New
Zealand women: a cross-sectional study. N.Z.Med.J. 117: U1206
62. Di Donato P, Giulini NA, Bacchi MA, et al (2005) Risk factors for type 2 diabetes in women attending
menopause clinics in Italy: a cross-sectional study. Climacteric. 8: 287-293
63. Panagiotakos DB, Pitsavos C, Chrysohoou C, Stefanadis C (2005) The epidemiology of Type 2
diabetes mellitus in Greek adults: the ATTICA study. Diabet.Med. 22: 1581-1588
64. Borodulin K, Tuomilehto J, Peltonen M, Lakka TA, Sundvall J, Jousilahti P (2006) Association of
leisure time physical activity and abdominal obesity with fasting serum insulin and 2-h
postchallenge plasma glucose levels. Diabet.Med. 23: 1025-1028
65. Hilding A, Eriksson AK, Agardh EE, et al (2006) The impact of family history of diabetes and lifestyle
factors on abnormal glucose regulation in middle-aged Swedish men and women.
Diabetologia 49: 2589-2598
66. Sakuta H, Suzuki T (2006) Physical activity and selected cardiovascular risk factors in middle-aged
male personnel of self-defense forces. Ind.Health 44: 184-189
67. Williams PT, Franklin B (2007) Vigorous exercise and diabetic, hypertensive, and
hypercholesterolemia medication use. Med.Sci.Sports Exerc. 39: 1933-1941
68. Yun S, Kabeer NH, Zhu BP, Brownson RC (2007) Modifiable risk factors for developing diabetes
among women with previous gestational diabetes. Prev.Chronic Dis. 4: A07
69. Khatib NM, Quazi ZS, Gaidhane AM, Waghmare TS, Goyal RC (2008) Risk factors of type-2 diabetes
mellitus in rural Wardha: A community based study. Int.J.Diabetes Dev.Ctries. 28: 79-82
70. Tiwari RR, Deb PK, Debbarma A, et al (2008) Risk factor analysis in self-reported diabetes in a rural
Kerala population. Int.J.Diabetes Dev.Ctries. 28: 91-94
71. Williams PT (2008) Reduced diabetic, hypertensive, and cholesterol medication use with walking.
Med.Sci.Sports Exerc. 40: 433-443
72. Williams PT (2008) Relationship of running intensity to hypertension, hypercholesterolemia, and
diabetes. Med.Sci.Sports Exerc. 40: 1740-1748
73. Ansari RM (2009) Effect of physical activity and obesity on type 2 diabetes in a middle-aged
population. J.Environ.Public Health 2009: 195285
74. Ning F, Pang ZC, Dong YH, et al (2009) Risk factors associated with the dramatic increase in the
prevalence of diabetes in the adult Chinese population in Qingdao, China. Diabet.Med. 26:
855-863
75. Milder IE, Klungel OH, Mantel-Teeuwisse AK, Verschuren WM, Bemelmans WJ (2010) Relation
between body mass index, physical inactivity and use of prescription drugs: the Doetinchem
Cohort Study. Int.J.Obes.(Lond) 34: 1060-1069
76. Pitanga FJ, Lessa I, Barbosa PJ, Barbosa SJ, Costa MC, Lopes AS (2010) [Physical activity in the
prevention of diabetes in black ethnicity: how much is required?]. Rev.Assoc.Med.Bras. 56:
697-704
77. Qin L, Corpeleijn E, Jiang C, et al (2010) Physical activity, adiposity, and diabetes risk in middle-aged
and older Chinese population: the Guangzhou Biobank Cohort Study. Diabetes Care 33:
2342-2348
78. Zhang Xuanping X, Geiss LS, Caspersen CJ, et al (2010) Physical activity levels and differences in the
prevalence of diabetes between the United States and Canada. Preventive Medicine. 50: 241-
245
79. Admiraal WM, van V, I, Munter JS Ld, Stronks K, Hoekstra JB, Holleman F (2011) The association of
physical inactivity with Type 2 diabetes among different ethnic groups. Diabet.Med. 28: 668-
672
80. Ghaderpanahi M, Fakhrzadeh H, Sharifi F, et al (2011) Association of physical activity with risk of
type 2 diabetes. Iran J.Public Health 40: 86-93
81. Kishore Kumar KJ, Chandrashekar, Vijaya KU, Rajendra CH, Ramakanth RM, Anandakumar L (2011)
Prevalence and risk factors of type - 2 diabetes mellitus in Kadapa urban population aged 30
years and above. Indian Journal of Public Health Research and Development. 2: 118-124
82. Li CL, Chen SY, Lan C, et al (2011) The effects of physical activity, body mass index (BMI) and waist
circumference (WC) on glucose intolerance in older people: a nationwide study from Taiwan.
Arch.Gerontol.Geriatr. 52: 54-59
83. Ekpenyong CE, Akpan UP, Ibu JO, Nyebuk DE (2012) Gender and age specific prevalence and
associated risk factors of type 2 diabetes mellitus in Uyo metropolis, South Eastern Nigeria.
Diabetologia Croatica.41 (1) (pp 17-28), 41: 17-28
84. George E, Kolt G, Rosenkranz R (2012) Chronic disease, physical activity and sitting time in
middleaged Australian males: Findings from The 45 and Up Study. Journal of Science and
Medicine in Sport.Conference: Be Active 15: S81
85. Maracy MR, Feizi A, Bagherynejad M (2012) The prevalence and correlated determinants of
hypertension and type 2 diabetes:A large community-based study in Isfahan, Iran. Pakistan
Journal of Medical Sciences. 28: 247-252
86. Modeneze DM, Vilarta R, Maciel EDS, Sonati JG, De Souza MESN, Boccaletto EMA (2012) Level of
physical activity of carriers of diabetes mellitus tipo 2(DM2) in a poor community in Brazil.
[Portuguese]. Medicina (Brazil). 45: 78-86
87. Siqueira F, Seus T, Silveira D, et al (2012) Prevalence of diabetes and physical activity among
Brazilian adults and the elderly: A countrywide analysis. Journal of Science and Medicine in
Sport.Conference: Be Active 15: S181
88. JM OC, Millar SR, Buckley CM, Kearney PM, Perry IJ (2013) The prevalence and determinants of
undiagnosed and diagnosed type 2 diabetes in middle-aged irish adults. PLoS.One. 8: e80504
89. Lee PG, Cigolle C, Ha J, Min L, Blaum CS, Herman WH (2013) Physical activity in U.S. adults with
diabetes and prediabetes, 2006-2010. Diabetes 62: A408
90. Sibai AM, Costanian C, Tohme R, Assaad S, Hwalla N (2013) Physical activity in adults with and
without diabetes: from the 'high-risk' approach to the 'population-based' approach of
prevention. BMC.Public Health 13: 1002
91. Siddhartha Sankar RS, Chandra SK, Bala KC, Surya Prabha ML, Nagaiah G, Deotale PG (2013) Risk
factors of type 2 diabetes mellitus in middle and elderly urban population of Hyderabad city.
Indian Journal of Public Health Research and Development. 4: 53-57
92. Tran DT, Jorm LR, Johnson M, Bambrick H, Lujic S (2014) Prevalence and risk factors of type 2
diabetes in older Vietnam-born australians. Journal of community health 39: 99-107
93. Fernandes RA, Zanesco A (2010) Early physical activity promotes lower prevalence of chronic
diseases in adulthood. Hypertens.Res. 33: 926-931
94. Etukumana EA, Puepet FH, Obadofin MO (2014) Risk factors for diabetes mellitus among rural adults
in Nigeria. Niger.J Med. 23: 213-219
95. Garcia LM, da Silva KS, Del Duca GF, da Costa FF, Nahas MV (2014) Sedentary behaviors, leisure-
time physical inactivity, and chronic diseases in brazilian workers: a cross sectional study.
Journal of Physical Activity & Health 11: 1622-1634
96. Su D, Zhang J, Wang H, et al (2014) [Joint association among physical activity, sedentary leisure time,
job intensity, adiposity and the risks of diabetes in adult population of Zhejiang province].
Zhonghua Liu Xing Bing Xue Za Zhi 35: 985-989
97. Manson JE, Nathan DM, Krolewski AS, Stampfer MJ, Willett WC, Hennekens CH (1992) A
prospective study of exercise and incidence of diabetes among US male physicians. JAMA
268: 63-67
98. Gurwitz JH, Field TS, Glynn RJ, et al (1994) Risk factors for non-insulin-dependent diabetes mellitus
requiring treatment in the elderly. J.Am.Geriatr.Soc. 42: 1235-1240
99. Perry IJ, Wannamethee SG, Walker MK, Thomson AG, Whincup PH, Shaper AG (1995) Prospective
study of risk factors for development of non-insulin dependent diabetes in middle aged British
men. BMJ 310: 560-564
100. Wei M, Gibbons LW, Mitchell TL, Kampert JB, Lee CD, Blair SN (1999) The association between
cardiorespiratory fitness and impaired fasting glucose and type 2 diabetes mellitus in
men.[Erratum appears in Ann Intern Med 1999 Sep 7;131(5):394]. Annals of Internal
Medicine.130(2):89-96,
101. Kilpelainen TO, Lakka TA, Laaksonen DE, et al (2007) Physical activity modifies the effect of SNPs
in the SLC2A2 (GLUT2) and ABCC8 (SUR1) genes on the risk of developing type 2
diabetes. Physiol Genomics 31: 264-272
102. Laaksonen DE, Siitonen N, Lindstrom J, et al (2007) Physical activity, diet, and incident diabetes in
relation to an ADRA2B polymorphism. Med.Sci.Sports Exerc. 39: 227-232
103. Simmons RK, Harding AH, Wareham NJ, Griffin SJ (2007) Do simple questions about diet and
physical activity help to identify those at risk of Type 2 diabetes? Diabet.Med. 24: 830-835
104. Le TD, Bae S, Ed HC, Singh KP, Blair SN, Shang N (2008) Effects of Cardiorespiratory Fitness on
Serum Ferritin Concentration and Incidence of Type 2 Diabetes: Evidence from the Aerobics
Center Longitudinal Study (ACLS). Rev.Diabet.Stud. 5: 245-252
105. Panagiotakos DB, Pitsavos C, Skoumas Y, Lentzas Y, Stefanadis C (2008) Five-year incidence of type
2 diabetes mellitus among cardiovascular disease-free Greek adults: findings from the
ATTICA study. Vasc.Health Risk Manag. 4: 691-698
106. Um HD, Lee DC, Lee SY, Kim YS (2008) [A prospective cohort study of exercise and the incidence of
type 2 diabetes in impaired fasting glucose group]. J.Prev.Med.Public Health 41: 45-50
107. Brito EC, Lyssenko V, Renstrom F, et al (2009) Previously associated type 2 diabetes variants may
interact with physical activity to modify the risk of impaired glucose regulation and type 2
diabetes: a study of 16,003 Swedish adults. Diabetes 58: 1411-1418
108. He MA, Workalemahu T, Cornelis MC, Hu FB, Qi L (2011) Genetic variants near the IRS1 gene,
physical activity and type 2 diabetes in US men and women. Diabetologia 54: 1579-1582
109. Steinbrecher A, Morimoto Y, Heak S, et al (2011) The preventable proportion of type 2 diabetes by
ethnicity: the multiethnic cohort. Ann.Epidemiol. 21: 526-535
110. Chae JS, Kang R, Kwak JH, et al (2012) Supervised exercise program, BMI, and risk of type 2 diabetes
in subjects with normal or impaired fasting glucose. Diabetes Care 35: 1680-1685
111. Xu F, Wang Y, Ware RS, et al (2012) Joint Impact of Physical Activity and Family History on the
Development of Diabetes Among Urban Adults in Mainland China: A Pooled Analysis of
Community-Based Prospective Cohort Studies. Asia Pac.J.Public Health [Epub ahead of
print]:
112. Neumann A, Norberg M, Schoffer O, et al (2013) Risk equations for the development of worsened
glucose status and type 2 diabetes mellitus in a Swedish intervention program. BMC Public
Health 13: 1014
113. Fretts AM, Howard BV, McKnight B, et al (2014) Life's Simple 7 and incidence of diabetes among
American Indians: the Strong Heart Family Study. Diabetes Care 37: 2240-2245
114. Xu F, Ware RS, Tse LA, et al (2014) Joint associations of physical activity and hypertension with the
development of type 2 diabetes among urban men and women in Mainland China. PLoS ONE
9: e88719
115. Long GH, Johansson I, Rolandsson O, et al (2015) Healthy behaviours and 10-year incidence of
diabetes: A population cohort study. Prev.Med. 71: 121-127
116. Ma Y, Hebert JR, Manson JE, et al (2012) Determinants of racial/ethnic disparities in incidence of
diabetes in postmenopausal women in the U.S.: The Women's Health Initiative 1993-2009.
Diabetes Care 35: 2226-2234
117. Ekelund U, Palla L, Wareham NJ (2011) Physical activity, abdominal and general obesity and the risk
of developing type 2 diabetes: A case-cohort study (InterAct). Diabetologia.Conference: 47th
Annual Meeting of the European Association for the Study of Diabetes, EASD 54 (Suppl 1):
S102
118. Hu FB, Manson JE, Stampfer MJ, et al (2001) Diet, lifestyle, and the risk of type 2 diabetes mellitus in
women. N.Engl.J.Med. 345: 790-797
119. Meisinger C, Thorand B, Schneider A, Stieber J, Doring A, Lowel H (2002) Sex differences in risk
factors for incident type 2 diabetes mellitus: the MONICA Augsburg cohort study.
Arch.Intern.Med. 162: 82-89
120. Hu FB, Li TY, Colditz GA, Willett WC, Manson JE (2003) Television watching and other sedentary
behaviors in relation to risk of obesity and type 2 diabetes mellitus in women. JAMA 289:
1785-1791
121. Lindstrom J, Tuomilehto J (2003) The diabetes risk score: a practical tool to predict type 2 diabetes
risk. Diabetes Care 26: 725-731
122. Sawada SS, Lee IM, Muto T, Matuszaki K, Blair SN (2003) Cardiorespiratory fitness and the incidence
of type 2 diabetes: prospective study of Japanese men. Diabetes Care 26: 2918-2922
123. Hu G, Lindstrom J, Valle TT, et al (2004) Physical activity, body mass index, and risk of type 2
diabetes in patients with normal or impaired glucose regulation. Arch.Intern.Med. 164: 892-
896
124. Hu G, Jousilahti P, Peltonen M, Bidel S, Tuomilehto J (2006) Joint association of coffee consumption
and other factors to the risk of type 2 diabetes: a prospective study in Finland.
Int.J.Obes.(Lond) 30: 1742-1749
125. Lee DC, Sui X, Church TS, Lee IM, Blair SN (2009) Associations of cardiorespiratory fitness and
obesity with risks of impaired fasting glucose and type 2 diabetes in men. Diabetes Care 32:
257-262
126. Villegas R, Shu XO, Yang G, et al (2009) Energy balance and type 2 diabetes: a report from the
Shanghai Women's Health Study. Nutr.Metab Cardiovasc.Dis. 19: 190-197
127. Waller K, Kujala UM, Rantanen T, et al (2010) Physical activity, morbidity and mortality in twins: a
24-year prospective follow-up. Eur.J.Epidemiol. 25: 731-739
128. Waller K, Kujala UM, Kaprio J, Koskenvuo M, Rantanen T (2010) Effect of physical activity on health
in twins: a 30-yr longitudinal study. Med.Sci.Sports Exerc. 42: 658-664
129. Wang H, Shara NM, Calhoun D, Umans JG, Lee ET, Howard BV (2010) Incidence rates and predictors
of diabetes in those with prediabetes: the Strong Heart Study. Diabetes Metab Res.Rev. 26:
378-385
130. Williams ED, Tapp RJ, Magliano DJ, Shaw JE, Zimmet PZ, Oldenburg BF (2010) Health behaviours,
socioeconomic status and diabetes incidence: the Australian Diabetes Obesity and Lifestyle
Study (AusDiab). Diabetologia 53: 2538-2545
131. Joseph J, Svartberg J, Njolstad I, Schirmer H (2011) Risk factors for type 2 diabetes in groups stratified
according to metabolic syndrome: a 10-year follow-up of the Tromso Study. Eur.J.Epidemiol.
26: 117-124
132. Onat A, Can G, Yuksel H, Ayhan E, Dogan Y, Hergenc G (2011) An algorithm to predict risk of type 2
diabetes in Turkish adults: contribution of C-reactive protein. J.Endocrinol.Invest 34: 580-
586
133. Fretts AM, Howard BV, McKnight B, et al (2012) Modest levels of physical activity are associated
with a lower incidence of diabetes in a population with a high rate of obesity: the strong heart
family study. Diabetes Care 35: 1743-1745
134. Danaei G, Pan A, Hu FB, Hernan MA (2013) Hypothetical midlife interventions in women and risk of
type 2 diabetes. Epidemiology 24: 122-128
135. Kawakami R, Sawada SS, Matsushita M, et al (2014) Reference values for cardiorespiratory fitness and
incidence of type 2 diabetes. J Epidemiol. 24: 25-30
136. Ford ES, Bergmann MM, Kroger J, Schienkiewitz A, Weikert C, Boeing H (2009) Healthy living is the
best revenge: findings from the European Prospective Investigation Into Cancer and Nutrition-
Potsdam study. Arch.Intern.Med. 169: 1355-1362
137. Xiu LL, Wahlqvist ML, Lee MS, Chen RC (2013) Cognitive impairment and limited dietary diversity
or physical inactivity are conjoint precursors of incident diabetes more so in elderly women
than men. Asia Pac.J Clin.Nutr. 22: 635-645
138. Jeon CY, Lokken RP, Hu FB, Van Dam RM (2007) Physical activity of moderate intensity and risk of
type 2 diabetes: a systematic review. Diabetes Care 30: 744-752
139. Laaksonen DE, Lakka HM, Salonen JT, Niskanen LK, Rauramaa R, Lakka TA (2002) Low levels of
leisure-time physical activity and cardiorespiratory fitness predict development of the
metabolic syndrome. Diabetes Care 25: 1612-1618
140. Zhu S, St-Onge MP, Heshka S, Heymsfield SB (2004) Lifestyle behaviors associated with lower risk of
having the metabolic syndrome. Metabolism 53: 1503-1511
141. Ekelund U, Brage S, Franks PW, Hennings S, Emms S, Wareham NJ (2005) Physical activity energy
expenditure predicts progression toward the metabolic syndrome independently of aerobic
fitness in middle-aged healthy Caucasians: the Medical Research Council Ely Study. Diabetes
Care 28: 1195-1200
142. Anderssen SA, Carroll S, Urdal P, Holme I (2007) Combined diet and exercise intervention reverses
the metabolic syndrome in middle-aged males: results from the Oslo Diet and Exercise Study.
Scand.J.Med.Sci.Sports 17: 687-695
143. Wilsgaard T, Jacobsen BK (2007) Lifestyle factors and incident metabolic syndrome. The Tromso
Study 1979-2001. Diabetes Res.Clin.Pract. 78: 217-224
144. Hassinen M, Lakka TA, Savonen K, et al (2008) Cardiorespiratory fitness as a feature of metabolic
syndrome in older men and women: the Dose-Responses to Exercise Training study (DR's
EXTRA). Diabetes Care 31: 1242-1247
145. Mendez-Hernandez P, Flores Y, Siani C, et al (2009) Physical activity and risk of metabolic syndrome
in an urban Mexican cohort. BMC Public Health 9: 276
146. Villegas R, Xiang YB, Yang G, et al (2009) Prevalence and determinants of metabolic syndrome
according to three definitions in middle-aged Chinese men. Metab Syndr.Relat Disord. 7: 37-
45
147. Cheriyath P, Duan Y, Qian Z, Nambiar L, Liao D (2010) Obesity, physical activity and the
development of metabolic syndrome: The atherosclerosis risk in communities study.
European Journal of Cardiovascular Prevention and Rehabilitation. 17: 309-313
148. Dong JM, Wang LC, Chen Q, et al (2010) [A nested case-control study on the relationship between
occupational physical activity, heredity factors and metabolic syndrome]. Zhonghua Liu Xing
Bing Xue Za Zhi 31: 379-383
149. Ilanne-Parikka P, Laaksonen DE, Eriksson JG, et al (2010) Leisure-time physical activity and the
metabolic syndrome in the Finnish diabetes prevention study. Diabetes Care 33: 1610-1617
150. Batista C, Soares JM (2013) Are former elite athletes more protected against metabolic syndrome?
Journal of Cardiology. 61: 440-445
151. Workalemahu T, Gelaye B, Berhane Y, Williams MA (2013) Physical activity and metabolic syndrome
among Ethiopian adults. Am.J.Hypertens. 26: 535-540
152. Churilla JR, Magyari PM, Ford ES, Fitzhugh EC, Johnson TM (2012) Muscular strengthening activity
patterns and metabolic health risk among US adults. J Diabetes 4: 77-84
153. Wagner A, Dallongeville J, Haas B, et al (2012) Sedentary behaviour, physical activity and dietary
patterns are independently associated with the metabolic syndrome. Diabetes Metab 38: 428-
435
154. Rosenberger HE, Goff DC, Isom S, Blackwell C, Whitt-Glover MC, Katula JA (2013) Relationship of
weekly activity minutes to metabolic syndrome in prediabetes: the healthy living partnerships
to prevent diabetes. J Phys.Act Health 10: 690-698
155. Schranz A, Tuomilehto J, Marti B, Jarrett RJ, Grabauskas V, Vassallo A (1991) Low physical activity
and worsening of glucose tolerance: results from a 2-year follow-up of a population sample in
Malta. Diabetes Res.Clin.Pract. 11: 127-136
156. Herman WH, Smith PJ, Thompson TJ, Engelgau MM, Aubert RE (1995) A new and simple
questionnaire to identify people at increased risk for undiagnosed diabetes. Diabetes Care 18:
382-387
157. Engstrom G, Janzon L (2002) Risk of developing diabetes is inversely related to lung function: a
population-based cohort study. Diabet.Med. 19: 167-170
158. Lindstrom J, Louheranta A, Mannelin M, et al (2003) The Finnish Diabetes Prevention Study (DPS):
Lifestyle intervention and 3-year results on diet and physical activity. Diabetes Care 26:
3230-3236
159. Lidfeldt J, Nerbrand C, Samsioe G, Agardh CD (2005) Women living alone have an increased risk to
develop diabetes, which is explained mainly by lifestyle factors. Diabetes Care 28: 2531-2536
160. Absetz P, Valve R, Oldenburg B, et al (2007) Type 2 diabetes prevention in the "real world": one-year
results of the GOAL Implementation Trial. Diabetes Care 30: 2465-2470
161. Gautier A, Balkau B, Lange C, Tichet J, Bonnet F (2010) Risk factors for incident type 2 diabetes in
individuals with a BMI of <27 kg/m2: the role of gamma-glutamyltransferase. Data from an
Epidemiological Study on the Insulin Resistance Syndrome (DESIR). Diabetologia 53: 247-
253
162. Vermunt PW, Milder IE, Wielaard F, et al (2012) A lifestyle intervention to reduce Type 2 diabetes
risk in Dutch primary care: 2.5-year results of a randomized controlled trial. Diabet.Med. 29:
e223-e231
163. Humphreys BR, McLeod L, Ruseski JE (2014) Physical activity and health outcomes: Evidence from
Canada. Health Economics (United Kingdom) 23: 33-54
164. Willis BL, Gao A, Leonard D, DeFina LF, Berry JD (2012) Midlife fitness and the development of
chronic conditions in later life. Archives of Internal Medicine. 172: 1333-1340
165. Ramachandran A, Snehalatha C, Shobana R, Vidyavathi P, Vijay V (1999) Influence of life style
factors in development of diabetes in Indians--scope for primary prevention.
J.Assoc.Physicians India 47: 764-766
166. Rathmann W, Haastert B, Icks A, et al (2005) The diabetes epidemic in the elderly population in
Western Europe: data from population-based studies. Gesundheitswesen 67 Suppl 1: S110-
S114
167. Repiso CG, Soriguer F, Martinez GR, et al (2013) Metabolically healthy obese and normal weight with
cardiometabolic risk factors phenotype: The [email protected] study. Annals of Nutrition and
Metabolism.Conference: Mediterranean Foods on Health and Disease - World Forum for
Nutrition Research Conference 62: 65-66
168. Djousse L, Driver JA, Gaziano JM, Buring JE, Lee IM (2013) Association between modifiable lifestyle
factors and residual lifetime risk of diabetes. Nutr.Metab Cardiovasc.Dis. 23: 17-22
169. Li G, Zhang P, Wang J, et al (2014) Cardiovascular mortality, all-cause mortality, and diabetes
incidence after lifestyle intervention for people with impaired glucose tolerance in the Da
Qing Diabetes Prevention Study: A 23-year follow-up study. The Lancet Diabetes and
Endocrinology 2: June
170. Snowdon DA, Phillips RL (1985) Does a vegetarian diet reduce the occurrence of diabetes?
Am.J.Public Health 75: 507-512
171. Ohlson L-O, Larsson B, Bjorntorp P, et al (1988) Risk factors for Type 2 (non-insulin-dependent)
diabetes mellitus. Thirteen and one-half years of follow-up of the participants in a study of
Swedish men born in 1913. Diabetologia. 31: 798-805
172. Pan X-R, Yang W-Y, Li G-W, Liu J (1997) Prevalence of diabetes and its risk factors in China, 1994.
Diabetes Care. 20: 1664-1669
173. Strandberg TE, Salomaa V (2000) Factors related to the development of diabetes during a 20-year
follow-up. A prospective study in a homogeneous group of middle-aged men. Nutr.Metab
Cardiovasc.Dis. 10: 239-246
174. Burke JP, Williams K, Haffner SM, Villalpando CG, Stern MP (2001) Elevated incidence of type 2
diabetes in San Antonio, Texas, compared with that of Mexico City, Mexico. Diabetes Care
24: 1573-1578
175. Paris RM, Bedno SA, Krauss MR, Keep LW, Rubertone MV (2001) Weighing in on type 2 diabetes in
the military: characteristics of U.S. military personnel at entry who develop type 2 diabetes.
Diabetes Care 24: 1894-1898
176. Eliasson M, Asplund K, Nasic S, Rodu B (2004) Influence of smoking and snus on the prevalence and
incidence of type 2 diabetes amongst men: the northern Sweden MONICA study.
J.Intern.Med. 256: 101-110
177. Bjorkelund C, Bondyr-Carlsson D, Lapidus L, et al (2005) Sleep disturbances in midlife unrelated to
32-year diabetes incidence: the prospective population study of women in Gothenburg.
Diabetes Care 28: 2739-2744
178. Maji D, Roy RU, Das S (2005) Prevention of type 2 diabetes in the prediabetic population. J.Indian
Med.Assoc. 103: 609-611
179. Nagaya T, Yoshida H, Takahashi H, Kawai M (2005) Increases in body mass index, even within non-
obese levels, raise the risk for Type 2 diabetes mellitus: a follow-up study in a Japanese
population. Diabet.Med. 22: 1107-1111
180. Yeh HC, Punjabi NM, Wang NY, Pankow JS, Duncan BB, Brancati FL (2005) Vital capacity as a
predictor of incident type 2 diabetes: the Atherosclerosis Risk in Communities study.
Diabetes Care 28: 1472-1479
181. Lindstrom J, Peltonen M, Eriksson JG, et al (2006) High-fibre, low-fat diet predicts long-term weight
loss and decreased type 2 diabetes risk: the Finnish Diabetes Prevention Study. Diabetologia
49: 912-920
182. Sakuta H, Suzuki T, Yyasuda H, Ito T (2006) Vital capacity and selected metabolic diseases in middle-
aged Japanese men. Can.Respir.J. 13: 79-82
183. Auchincloss AH, ez Roux AV, Mujahid MS, Shen M, Bertoni AG, Carnethon MR (2009)
Neighborhood resources for physical activity and healthy foods and incidence of type 2
diabetes mellitus: the Multi-Ethnic study of Atherosclerosis. Arch.Intern.Med. 169: 1698-
1704
184. Sakurai M, Nakamura K, Miura K, et al (2013) Family history of diabetes, lifestyle factors, and the 7-
year incident risk of type 2 diabetes mellitus in middle-aged Japanese men and women. J
Diabetes Investig. 4: 261-268
185. Thelin A, Holmberg S (2014) Type 2 diabetes among farmers and rural and urban referents: cumulative
incidence over 20 years and risk factors in a prospective cohort study. Asia Pac.J Clin.Nutr.
23: 301-308
186. Perry IJ, Wannamethee SG, Walker MK, Shaper AG (1993) Sporting activity and hyperglycemia in
middle-aged men. Diabetes Care 16: 581-583
187. Bourn DM, Mann JI, Mcskimming BJ, Waldron MA, Wishart JD (1994) Impaired glucose tolerance
and NIDDM: Does a lifestyle intervention program have an effect? Diabetes Care. 17: 1311-
1319
188. Kriska AM, Edelstein SL, Hamman RF, et al (2006) Physical activity in individuals at risk for diabetes:
Diabetes Prevention Program. Med.Sci.Sports Exerc. 38: 826-832
189. Laukkanen JA, Rauramaa R, Kurl S (2008) Exercise workload, coronary risk evaluation and the risk of
cardiovascular and all-cause death in middle-aged men. Eur.J.Cardiovasc.Prev.Rehabil. 15:
285-292
190. Smith AE, Annesi JJ, Walsh AM, Lennon V, Bell RA (2010) Association of changes in self-efficacy,
voluntary physical activity, and risk factors for type 2 diabetes in a behavioral treatment for
obese preadolescents: a pilot study. J.Pediatr.Nurs. 25: 393-399
191. Behre C, Bergstrom G, Schmidt C (2011) Increased leisure time physical activity is associated with
less prevalence of the metabolic syndrome in healthy middle-aged men. Journal of
Diabetes.Conference: 4th International Congress on Prediabetes and the Metabolic Syndrome
Madrid Spain.Conference Start: 3: 156
192. Ponsonby AL, Sun C, Ukoumunne OC, et al (2011) Objectively measured physical activity and the
subsequent risk of incident dysglycemia: the Australian Diabetes, Obesity and Lifestyle Study
(AusDiab). Diabetes Care 34: 1497-1502
193. Autenrieth CS, Kirchberger I, Heier M, et al (2013) Physical activity is inversely associated with
multimorbidity in elderly men: Results from the KORA-Age Augsburg Study. Preventive
Medicine.57 (1) (pp 17-19), 57: 17-19
194. Sossa C, Delisle H, Agueh V, Sodjinou R, Ntandou G, Makoutode M (2013) Lifestyle and dietary
factors associated with the evolution of cardiometabolic risk over four years in West-African
adults: The Benin study. Journal of Obesity. 298024
195. Almeida OP, Khan KM, Hankey GJ, Yeap BB, Golledge J, Flicker L (2014) 150 minutes of vigorous
physical activity per week predicts survival and successful ageing: a population-based 11-year
longitudinal study of 12 201 older Australian men. British journal of sports medicine 48: 220-
225
196. Van Dam RM, Schuit AJ, Feskens EJ, Seidell JC, Kromhout D (2002) Physical activity and glucose
tolerance in elderly men: the Zutphen Elderly study. Med.Sci.Sports Exerc. 34: 1132-1136
197. Carnethon MR, Sternfeld B, Schreiner PJ, et al (2009) Association of 20-year changes in
cardiorespiratory fitness with incident type 2 diabetes: the coronary artery risk development in
young adults (CARDIA) fitness study. Diabetes Care 32: 1284-1288
198. Williams PT (2008) Vigorous exercise, fitness and incident hypertension, high cholesterol, and
diabetes. Med.Sci.Sports Exerc. 40: 998-1006
199. Bhargava A (2003) A longitudinal analysis of the risk factors for diabetes and coronary heart disease in
the Framingham Offspring Study. Popul.Health Metr. 1: 3
200. Klimentidis YC, Chen Z, Arora A, Hsu CH (2014) Association of physical activity with lower type 2
diabetes incidence is weaker among individuals at high genetic risk. Diabetologia 57: 2530-
2534
201. Hamman RF, Wing RR, Edelstein SL, et al (2006) Effect of weight loss with lifestyle intervention on
risk of diabetes. Diabetes Care 29: 2102-2107
202. Lee PH (2014) Association between adolescents' physical activity and sedentary behaviors with change
in BMI and risk of type 2 diabetes. PLoS ONE 9: e110732
203. Arabia JJM, Suarez GR, Trochez JM (2013) The Role of exercise in the prevention of type 2 diabetes.
[Spanish]. Revista Argentina de Endocrinologia y Metabolismo. 50: 192-198
204. Duclos M, Oppert J-M, Verges B, et al (205) Physical activity and type 2 diabetes. Recommandations
of the SFD (Francophone Diabetes Society) diabetes and physical activity working group.
Diabetes and Metabolism. 39: 205-216
205. Oostdam N, van Poppel MNM, Wouters MGAJ, Van MW (2011) Interventions for preventing
gestational diabetes mellitus: A systematic review and meta-analysis. Journal of Women's
Health. 20: 1551-1563
206. Briazgounov IP (1988) The role of physical activity in the prevention and treatment of
noncommunicable diseases. World Health Stat.Q. 41: 242-250
207. King H, Kriska AM (1992) Prevention of type II diabetes by physical training. Epidemiological
considerations and study methods. Diabetes Care 15: 1794-1799
208. Fujimoto WY, Bergstrom RW, Boyko EJ, et al (1994) Diabetes and diabetes risk factors in second- and
third-generation Japanese Americans in Seattle, Washington. Diabetes Res.Clin.Pract. 24
Suppl: S43-S52
209. Helmrich SP, Ragland DR, Paffenbarger RS, Jr. (1994) Prevention of non-insulin-dependent diabetes
mellitus with physical activity. Med.Sci.Sports Exerc. 26: 824-830
210. Kriska AM, Blair SN, Pereira MA (1994) The potential role of physical activity in the prevention of
non-insulin-dependent diabetes mellitus: the epidemiological evidence. Exerc.Sport Sci.Rev.
22: 121-143
211. Lehmann R, Spinas GA (1994) Is prevention of diabetes mellitus possible?. [German]. Therapeutische
Umschau.Revue therapeutique. 51: 693-700

212. Lehmann R, Spinas GA (1994) Can diabetes mellitus be prevented?. [German]. Therapeutische
Umschau.51 (10) (pp 693-700), 51: 693-700
213. Manson JE, Spelsberg A (1994) Primary prevention of non-insulin-dependent diabetes mellitus.
Am.J.Prev.Med. 10: 172-184
214. Jako P (1995) [The role of physical activity in the prevention of certain internal diseases]. Orv.Hetil.
136: 2379-2383
215. Spelsberg A, Manson JE (1995) Physical activity in the treatment and prevention of diabetes.
Comprehensive Therapy. 21: 559-564
216. Colditz GA, Coakley E (1997) Weight, weight gain, activity, and major illnesses: the Nurses' Health
Study. Int.J.Sports Med. 18 Suppl 3: S162-S170
217. Santini C, Trevisani F, Lubich T, Bernardi M (1997) Sport and diabetes. II part. [Italian]. Medicina
dello Sport. 50: 399-408
218. Kriska A (2000) Physical activity and the prevention of type 2 diabetes mellitus: how much for how
long? Sports Med. 29: 147-151
219. Sawada S, Muto T, Tanaka H (2000) Epidemiologic study on physical activity and type 2 diabetes.
[Japanese]. Nippon rinsho.Japanese journal of clinical medicine. 58: 379-384
220. Blair SN, Cheng Y, Holder JS (2001) Is physical activity or physical fitness more important in defining
health benefits? Med.Sci.Sports Exerc. 33: S379-S399
221. Pfohl M, Schatz H (2001) Strategies for the prevention of type 2 diabetes. [Review] [53 refs].
Experimental & Clinical Endocrinology & Diabetes. 109: S240-S249
222. Kosaka K (2002) Primary prevention of type 2 diabetes mellitus according to lifestyle intervention--the
process and for the future. [Japanese]. Nippon rinsho.Japanese journal of clinical medicine.
60: 52-99
223. Hu FB (2003) Sedentary lifestyle and risk of obesity and type 2 diabetes. Lipids 38: 103-108
224. Kriska A (2003) Can a physically active lifestyle prevent type 2 diabetes? Exerc.Sport Sci.Rev. 31:
132-137
225. Ryan DH (2003) Diet and exercise in the prevention of diabetes. Int.J.Clin.Pract.Suppl 28-35
226. Tuomilehto J, Lindstrom J (2003) [The principal trials for prevention of type 2 diabetes have now
confirmed that type 2 diabetes can be prevented by life style changes. Prevention of type 2
diabetes by life style]. Journ.Annu.Diabetol.Hotel Dieu 77-89
227. Van Dam RM (2003) The epidemiology of lifestyle and risk for type 2 diabetes. Eur.J.Epidemiol. 18:
1115-1125
228. Hawley JA (2004) Exercise as a therapeutic intervention for the prevention and treatment of insulin
resistance. Diabetes Metab Res.Rev. 20: 383-393
229. Sigal RJ, Kenny GP, Wasserman DH, Castaneda-Sceppa C (2004) Physical activity/exercise and type 2
diabetes. Diabetes Care. 27: 2518-2539
230. Steyn NP, Mann J, Bennett PH, et al (2004) Diet, nutrition and the prevention of type 2 diabetes.
Public Health Nutr. 7: 147-165
231. Williamson DF, Vinicor F, Bowman BA (2004) Primary prevention of type 2 diabetes mellitus by
lifestyle intervention: implications for health policy. Ann.Intern.Med. 140: 951-957
232. Bassuk SS, Manson JE (2005) Epidemiological evidence for the role of physical activity in reducing
risk of type 2 diabetes and cardiovascular disease. J.Appl.Physiol 99: 1193-1204
233. Hu G, Lakka TA, Barengo NC, Tuomilehto J (2005) Physical activity, physical fitness, and risk of type
2 diabetes mellitus. Metab Syndr.Relat Disord. 3: 35-44
234. Irie M, Sasaki H, Ito C (2005) [Amount of exercise necessary for prevention of diabetes (amount of
leisure-time exercise)]. Nihon Rinsho 63 Suppl 2: 220-223
235. Karmisholt K, Gotzsche PC (2005) Physical activity for secondary prevention of disease. Systematic
reviews of randomised clinical trials. Dan.Med.Bull. 52: 90-94
236. Laakso M (2005) Prevention of type 2 diabetes. Curr.Mol.Med. 5: 365-374
237. Lamonte MJ, Blair SN, Church TS (2005) Physical activity and diabetes prevention. J.Appl.Physiol
99: 1205-1213
238. Meisinger C, Doring A, Heier M, Thorand B, Lowel H (2005) Type 2 diabetes mellitus in Augsburg--
an epidemiological overview. Gesundheitswesen 67 Suppl 1: S103-S109
239. Mensink M (2005) Lifestyle intervention, glucose tolerance and risk of developing type 2 diabetes
mellitus. Metabolic Syndrome and Related Disorders.3 (1) (pp 26-34), 3: 26-34
240. Schulze MB, Hu FB (2005) Primary prevention of diabetes: what can be done and how much can be
prevented? Annu.Rev.Public Health 26: 445-467
241. Burnet DL, Elliott LD, Quinn MT, Plaut AJ, Schwartz MA, Chin MH (2006) Preventing diabetes in the
clinical setting. J.Gen.Intern.Med. 21: 84-93
242. Hu G, Rico-Sanz J, Lakka TA, Tuomilehto J (2006) Exercise, genetics and prevention of type 2
diabetes. Essays Biochem. 42: 177-192
243. Hu G, Lakka TA, Kilpelainen TO, Tuomilehto J (2007) Epidemiological studies of exercise in diabetes
prevention. Appl.Physiol Nutr.Metab 32: 583-595
244. Hussain A, Claussen B, Ramachandran A, Williams R (2007) Prevention of type 2 diabetes: A review.
Diabetes Research and Clinical Practice.76 (3) (pp 317-326), 76: 317-326
245. McGavock J, Sellers E, Dean H (2007) Physical activity for the prevention and management of youth-
onset type 2 diabetes mellitus: focus on cardiovascular complications. Diab.Vasc.Dis.Res. 4:
305-310
246. Perez-Escamilla R, Putnik P (2007) The role of acculturation in nutrition, lifestyle, and incidence of
type 2 diabetes among Latinos. J.Nutr. 137: 860-870
247. Pi-Sunyer FX (2007) How effective are lifestyle changes in the prevention of type 2 diabetes mellitus?
Nutr.Rev. 65: 101-110
248. Raguso CA, Spada A, Jornayvaz FR, Philippe J (2007) [Physical activity in the prevention and control
of diabetes]. Rev.Med.Suisse 3: 1442-1448
249. Vuori I (2007) Physical activity and health: Metabolic and cardiovascular issues. Advances in
Physiotherapy.9 (2) (pp 50-64), 9: 50-64
250. Yates T, Khunti K, Bull F, Gorely T, Davies MJ (2007) The role of physical activity in the
management of impaired glucose tolerance: a systematic review. Diabetologia 50: 1116-1126
251. Gill JM, Cooper AR (2008) Physical activity and prevention of type 2 diabetes mellitus. Sports Med.
38: 807-824
252. Duclos M, Gautier J-F (2009) Physical activity and type 2 diabetes mellitus. [French]. Medecine des
Maladies Metaboliques. 3: 31-38
253. Duclos M, Sanz C, Gautier J-F (2010) Physical activity to prevent type 2 diabetes. [French]. Medecine
des Maladies Metaboliques. 4: 147-151
254. Lollgen H (2013) [Importance and evidence of regular physical activity for prevention and treatment of
diseases]. [Review] [German]. Deutsche Medizinische Wochenschrift 138: 2253-2259
255. Reiner M, Niermann C, Jekauc D, Woll A (2013) Long-term health benefits of physical activity -- a
systematic review of longitudinal studies. BMC Public Health 13: 813
256. Saunders LE, Green JM, Petticrew MP, Steinbach R, Roberts H (2013) What are the health benefits of
active travel? A systematic review of trials and cohort studies. PLoS ONE 8: e69912
257. Venables MC, Jeukendrup AE (2009) Physical inactivity and obesity: links with insulin resistance and
type 2 diabetes mellitus. Diabetes Metab Res.Rev. 25 Suppl 1: S18-S23
258. Lindstrom J, Absetz P, Hemio K, Peltomaki P, Peltonen M (2010) Reducing the risk of type 2 diabetes
with nutrition and physical activity - efficacy and implementation of lifestyle interventions in
Finland. Public Health Nutr. 13: 993-999
259. Qin L, Knol MJ, Corpeleijn E, Stolk RP (2010) Does physical activity modify the risk of obesity for
type 2 diabetes: a review of epidemiological data. Eur.J.Epidemiol. 25: 5-12
260. Ford ES, Li C (2006) Physical activity or fitness and the metabolic syndrome. Expert Review of
Cardiovascular Therapy. 4: 897-915
261. Orozco LJ, Buchleitner AM, Gimenez-Perez G, Roque IF, Richter B, Mauricio D (2008) Exercise or
exercise and diet for preventing type 2 diabetes mellitus. Cochrane Database Syst.Rev.
CD003054
262. Al Tunaiji H, Davis JC, Mackey DC, Khan KM (2014) Population attributable fraction of type 2
diabetes due to physical inactivity in adults: a systematic review. BMC Public Health 14: 469
263. Ardisson Korat AV, Willett WC, Hu FB (2014) Diet, lifestyle, and genetic risk factors for type 2
diabetes: a review from the Nurses' Health Study, Nurses' Health Study 2, and Health
Professionals' Follow-up Study. Curr.Nutr.Rep. 3: 345-354
264. Bao W, Tobias DK, Bowers K, Hu FB, Zhang C (2013) Physical activity and sedentary behaviors in
relation to type 2 diabetes risk among women at high risk. Diabetes 62: A355
265. Bao W, Tobias DK, Bowers K, et al (2014) Physical activity and sedentary behaviors associated with
risk of progression from gestational diabetes mellitus to type 2 diabetes mellitus: a prospective
cohort study. JAMA Intern Med. 174: 1047-1055
266. Wannamethee SG, Shaper AG, Walker M, Ebrahim S (1998) Lifestyle and 15-year survival free of
heart attack, stroke, and diabetes in middle-aged British men. Arch.Intern.Med. 158: 2433-
2440
267. Dunstan DW, Salmon J, Owen N, et al (2005) Associations of TV viewing and physical activity with
the metabolic syndrome in Australian adults. Diabetologia 48: 2254-2261
268. Yokochi M, Niinomi M, Kato Y, Yanbe Y, Tsushita K, Ohiso Y (2002) Effectiveness of long-term
intervention in physical activity of type 2 diabetics (prospective randomized controlled group
study for 1 year using a unique pedometer). [Japanese]. Journal of the Japan Diabetes
Society. 45: 867-874

269. Al Mamun A, Mannan M, O'Callaghan MJ, Williams GM, Najman JM, Callaway LK (2013)
Association between Gestational Weight Gain and Postpartum Diabetes: Evidence from a
Community Based Large Cohort Study. PLoS.One. 8: e75679
270. Carlsson S, Ahlbom A, Lichtenstein P, Andersson T (2013) Shared genetic influence of BMI, physical
activity and type 2 diabetes: A twin study. Diabetologia.56 (5) (pp 1031-1035), May
271. Ram J, Selvam S, Snehalatha C, et al (2014) Improvement in diet habits, independent of physical
activity helps to reduce incident diabetes among prediabetic Asian Indian men. Diabetes Res
Clin.Pract. 106: 491-495

Supplemental Table S4: Prospective studies of physical activity and type 2 diabetes risk
Author,
publication
year, country/
region
Study name or
description
Follow-up
period
Study size,
gender, age,
number of cases
Study
quality
Exposure Quantity RR (95% CI) Adjustment for confounders
Radford NB et al,
2015, USA
Cooper Center
Longitudinal Study
1998-2013, 3.1
years follow-up
6519 men and 2334
women, age 20-90
years: 93 cases
8 Cardiorespiratory fitness Per 1 MET (3.5 mL O2/min/kg) 0.81 (0.70-0.93) Age, gender, BMI, glucose, statin use
Fan S et al, 2015,
China
China Multicenter
Collaborative Study of Cardiovascular
Epidemiology &
China Cardiovascular
Health Study
1998-2007-
2008 & 2000-2001-
2007-2008, 7.9
years follow-up
6348 men and women,
age 35-74 years: 478 cases
7 Total physical activity
Total physical activity
1.00-1.39 PAL
1.40-1.59 1.60-1.89
>1.89
1.00-1.39 PAL 1.40-1.59
1.60-1.89
>1.89
1.00
0.82 (0.62-1.09) 0.63 (0.47-0.83)
0.47 (0.36-0.61)
1.00 0.92 (0.69-1.22)
0.70 (0.52-0.93)
0.55 (0.42-0.73)
Age, sex, geographic region,
education, cigarette smoking, alcohol, FH – DM
+ BMI
Koloverou E et al, 2014, Greece
ATTICA study 2001-2002 – 2012, 10 years
follow-up
1485 men and women, age 18-89 years: 191
cases
8 Total physical activity Active vs. inactive 0.51 (0.24-1.10) Age, sex, education, smoking, FH – DM, energy intake, abnormal WHt
ratio, fasting blood glucose,
hypercholesterolemia, hypertension
Kuwahara K et al,
2014, Japan
Japan Epidemiology
Collaboration in
Occupational Health Study
2003-2005 -
2011, 6.0 years
follow-up
3523 men, age 18-61
years: 199 cases
8 Cardiorespiratory fitness
Cardiorespiratory fitness
44.2 VO2max (ml/min/kg)
37.6
32.4 44.2 VO2max (ml/min/kg)
37.6
32.4
1.00
1.26 (0.87-1.83)
1.10 (0.75-1.63) 1.00
1.44 (1.01-2.07)
1.48 (1.03-2.13)
Age, baseline year, smoking status,
cigarettes per day, alcohol, sleep
duration, hypertension, FH – DM +BMI
Someya Y et al, 2014, Japan
Male Alumni of the Department of
Physical Education
of Juntendo University
1971-1991 -2009, 26 years
follow-up
570 men, age 23 years: 22 cases
6 Cardiorespiratory fitness
Sports club participation
353 sec (1500 m run time) 325
301
No Yes
1.00 0.40 (0.14-1.13)
0.26 (0.07-1.00)
1.00 0.80 (0.06-10.16)
Age, year of graduation, BMI, smoking, college sports club
participation at college age
Age, year of graduation, BMI, smoking
Mehlig K et al,
2014, Sweden
Prospective
Population Study of Women in
Gothenburg
1968-1969 –
2002, ~34 years follow-up
1448 women, age 38-
60 years: 139 cases
8 Leisure-time physical activity, non-obese
Leisure-time physical activity, obese
Active
Inactive Active
Inactive
1.00
1.79 (1.15-2.79) 2.43 (1.44-4.09)
11.7 (6.28-21.8)
Age, education, smoking, alcohol,
triglycerides, hypertension, FH - DM
Tsai AC et al, 2014, Taiwan
Taiwan Longitudinal Survey
on Aging
1999-2003, 4 years follow-up
2995 men and women, age ≥50 years: 225
cases
8 Leisure-time physical activity Inactive Moderate
High
1.00 0.95 (0.56-1.58)
0.59 (0.43-0.80)
Age, sex, smoking, alcohol, betel quid chewing, BMI, impairment of
instrumental activities of daily living,
hypertension, heart disease, chronic kidney disease, gout, Center for
Epidemiologic Studies Depression
Scale
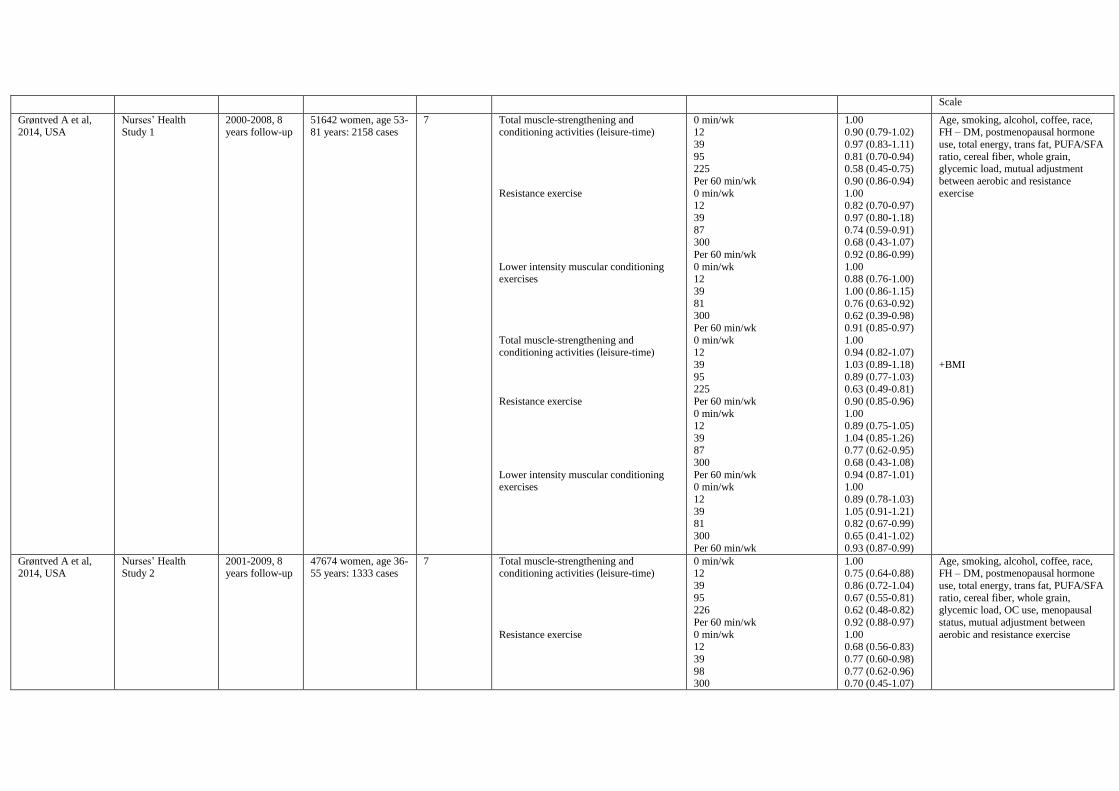
Grøntved A et al, 2014, USA
Nurses’ Health Study 1
2000-2008, 8 years follow-up
51642 women, age 53-81 years: 2158 cases
7 Total muscle-strengthening and conditioning activities (leisure-time)
Resistance exercise
Lower intensity muscular conditioning exercises
Total muscle-strengthening and conditioning activities (leisure-time)
Resistance exercise
Lower intensity muscular conditioning exercises
0 min/wk 12
39
95 225
Per 60 min/wk
0 min/wk 12
39
87 300
Per 60 min/wk
0 min/wk 12
39
81 300
Per 60 min/wk
0 min/wk 12
39
95 225
Per 60 min/wk
0 min/wk
12
39 87
300
Per 60 min/wk 0 min/wk
12
39 81
300
Per 60 min/wk
1.00 0.90 (0.79-1.02)
0.97 (0.83-1.11)
0.81 (0.70-0.94) 0.58 (0.45-0.75)
0.90 (0.86-0.94)
1.00 0.82 (0.70-0.97)
0.97 (0.80-1.18)
0.74 (0.59-0.91) 0.68 (0.43-1.07)
0.92 (0.86-0.99)
1.00 0.88 (0.76-1.00)
1.00 (0.86-1.15)
0.76 (0.63-0.92) 0.62 (0.39-0.98)
0.91 (0.85-0.97)
1.00 0.94 (0.82-1.07)
1.03 (0.89-1.18)
0.89 (0.77-1.03) 0.63 (0.49-0.81)
0.90 (0.85-0.96)
1.00
0.89 (0.75-1.05)
1.04 (0.85-1.26) 0.77 (0.62-0.95)
0.68 (0.43-1.08)
0.94 (0.87-1.01) 1.00
0.89 (0.78-1.03)
1.05 (0.91-1.21) 0.82 (0.67-0.99)
0.65 (0.41-1.02)
0.93 (0.87-0.99)
Age, smoking, alcohol, coffee, race, FH – DM, postmenopausal hormone
use, total energy, trans fat, PUFA/SFA
ratio, cereal fiber, whole grain, glycemic load, mutual adjustment
between aerobic and resistance
exercise
+BMI
Grøntved A et al, 2014, USA
Nurses’ Health Study 2
2001-2009, 8 years follow-up
47674 women, age 36-55 years: 1333 cases
7 Total muscle-strengthening and conditioning activities (leisure-time)
Resistance exercise
0 min/wk 12
39
95 226
Per 60 min/wk
0 min/wk 12
39
98 300
1.00 0.75 (0.64-0.88)
0.86 (0.72-1.04)
0.67 (0.55-0.81) 0.62 (0.48-0.82)
0.92 (0.88-0.97)
1.00 0.68 (0.56-0.83)
0.77 (0.60-0.98)
0.77 (0.62-0.96) 0.70 (0.45-1.07)
Age, smoking, alcohol, coffee, race, FH – DM, postmenopausal hormone
use, total energy, trans fat, PUFA/SFA
ratio, cereal fiber, whole grain, glycemic load, OC use, menopausal
status, mutual adjustment between
aerobic and resistance exercise
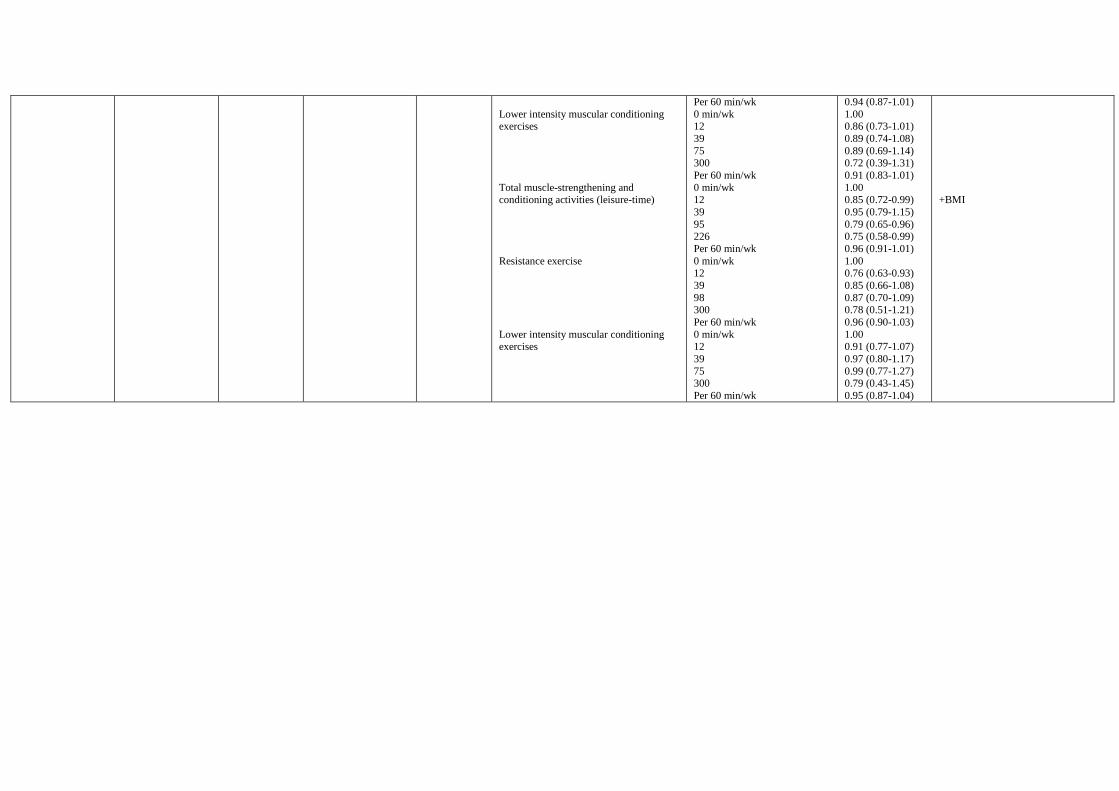
Lower intensity muscular conditioning exercises
Total muscle-strengthening and conditioning activities (leisure-time)
Resistance exercise
Lower intensity muscular conditioning exercises
Per 60 min/wk
0 min/wk 12
39
75 300
Per 60 min/wk
0 min/wk 12
39
95 226
Per 60 min/wk
0 min/wk 12
39
98 300
Per 60 min/wk
0 min/wk 12
39
75 300
Per 60 min/wk
0.94 (0.87-1.01)
1.00 0.86 (0.73-1.01)
0.89 (0.74-1.08)
0.89 (0.69-1.14) 0.72 (0.39-1.31)
0.91 (0.83-1.01)
1.00 0.85 (0.72-0.99)
0.95 (0.79-1.15)
0.79 (0.65-0.96) 0.75 (0.58-0.99)
0.96 (0.91-1.01)
1.00 0.76 (0.63-0.93)
0.85 (0.66-1.08)
0.87 (0.70-1.09) 0.78 (0.51-1.21)
0.96 (0.90-1.03)
1.00 0.91 (0.77-1.07)
0.97 (0.80-1.17)
0.99 (0.77-1.27) 0.79 (0.43-1.45)
0.95 (0.87-1.04)
+BMI
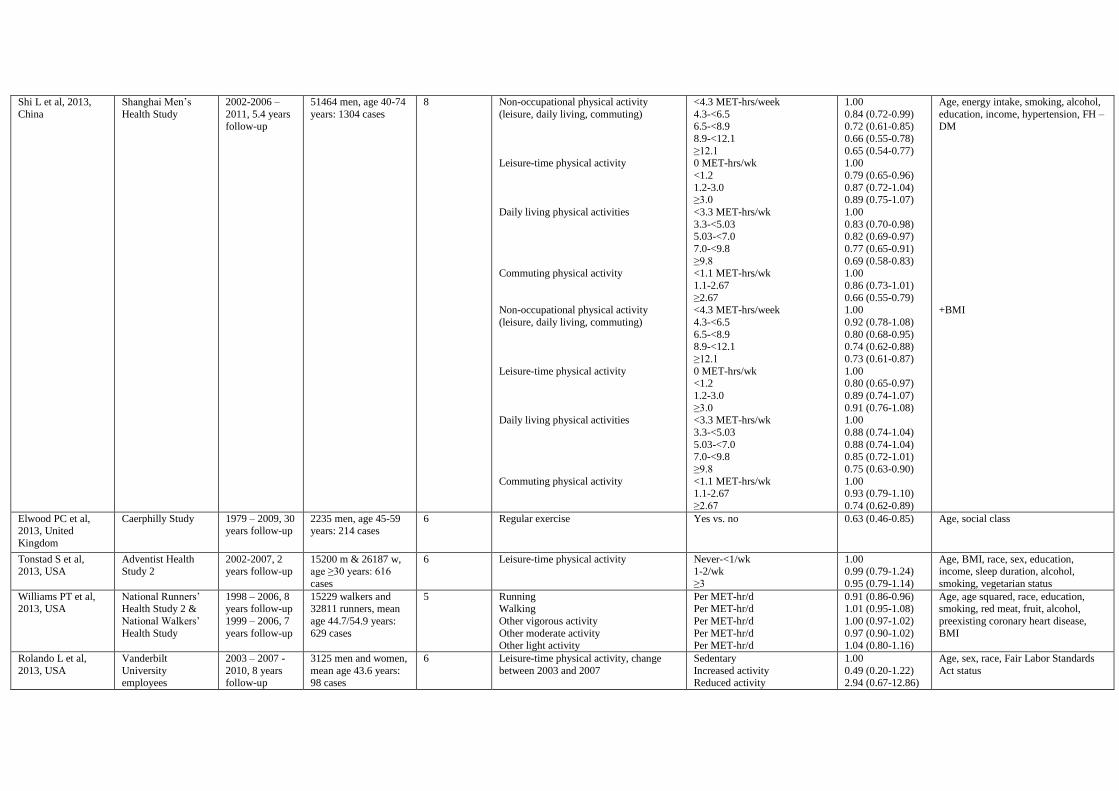
Shi L et al, 2013,
China
Shanghai Men’s
Health Study
2002-2006 –
2011, 5.4 years follow-up
51464 men, age 40-74
years: 1304 cases
8 Non-occupational physical activity
(leisure, daily living, commuting)
Leisure-time physical activity
Daily living physical activities
Commuting physical activity
Non-occupational physical activity
(leisure, daily living, commuting)
Leisure-time physical activity
Daily living physical activities
Commuting physical activity
<4.3 MET-hrs/week
4.3-<6.5 6.5-<8.9
8.9-<12.1
≥12.1 0 MET-hrs/wk
<1.2
1.2-3.0 ≥3.0
<3.3 MET-hrs/wk
3.3-<5.03 5.03-<7.0
7.0-<9.8
≥9.8 <1.1 MET-hrs/wk
1.1-2.67
≥2.67 <4.3 MET-hrs/week
4.3-<6.5
6.5-<8.9 8.9-<12.1
≥12.1
0 MET-hrs/wk <1.2
1.2-3.0
≥3.0
<3.3 MET-hrs/wk
3.3-<5.03
5.03-<7.0 7.0-<9.8
≥9.8
<1.1 MET-hrs/wk 1.1-2.67
≥2.67
1.00
0.84 (0.72-0.99) 0.72 (0.61-0.85)
0.66 (0.55-0.78)
0.65 (0.54-0.77) 1.00
0.79 (0.65-0.96)
0.87 (0.72-1.04) 0.89 (0.75-1.07)
1.00
0.83 (0.70-0.98) 0.82 (0.69-0.97)
0.77 (0.65-0.91)
0.69 (0.58-0.83) 1.00
0.86 (0.73-1.01)
0.66 (0.55-0.79) 1.00
0.92 (0.78-1.08)
0.80 (0.68-0.95) 0.74 (0.62-0.88)
0.73 (0.61-0.87)
1.00 0.80 (0.65-0.97)
0.89 (0.74-1.07)
0.91 (0.76-1.08)
1.00
0.88 (0.74-1.04)
0.88 (0.74-1.04) 0.85 (0.72-1.01)
0.75 (0.63-0.90)
1.00 0.93 (0.79-1.10)
0.74 (0.62-0.89)
Age, energy intake, smoking, alcohol,
education, income, hypertension, FH – DM
+BMI
Elwood PC et al, 2013, United
Kingdom
Caerphilly Study 1979 – 2009, 30 years follow-up
2235 men, age 45-59 years: 214 cases
6 Regular exercise Yes vs. no
0.63 (0.46-0.85) Age, social class
Tonstad S et al, 2013, USA
Adventist Health Study 2
2002-2007, 2 years follow-up
15200 m & 26187 w, age ≥30 years: 616
cases
6 Leisure-time physical activity Never-<1/wk 1-2/wk
≥3
1.00 0.99 (0.79-1.24)
0.95 (0.79-1.14)
Age, BMI, race, sex, education, income, sleep duration, alcohol,
smoking, vegetarian status
Williams PT et al, 2013, USA
National Runners’ Health Study 2 &
National Walkers’
Health Study
1998 – 2006, 8 years follow-up
1999 – 2006, 7
years follow-up
15229 walkers and 32811 runners, mean
age 44.7/54.9 years:
629 cases
5 Running Walking
Other vigorous activity
Other moderate activity Other light activity
Per MET-hr/d Per MET-hr/d
Per MET-hr/d
Per MET-hr/d Per MET-hr/d
0.91 (0.86-0.96) 1.01 (0.95-1.08)
1.00 (0.97-1.02)
0.97 (0.90-1.02) 1.04 (0.80-1.16)
Age, age squared, race, education, smoking, red meat, fruit, alcohol,
preexisting coronary heart disease,
BMI
Rolando L et al,
2013, USA
Vanderbilt
University employees
2003 – 2007 -
2010, 8 years follow-up
3125 men and women,
mean age 43.6 years: 98 cases
6 Leisure-time physical activity, change
between 2003 and 2007
Sedentary
Increased activity Reduced activity
1.00
0.49 (0.20-1.22) 2.94 (0.67-12.86)
Age, sex, race, Fair Labor Standards
Act status
Stringhini S et al,
2012, United Kingdom
The Whitehall 2
Study
1991/1993 –
2009, 14.2 years follow-up
7237 men and women,
age 35-55 years: 818 cases
7 Leisure-time physical activity Inactive
Moderately active Active
1.33 (1.13-1.56)
1.25 (1.04-1.50) 1.00
Age, sex, ethnicity
Grøntved A et al,
2012, USA
Health Professionals
Follow-up Study
1990 – 2008, 18
years follow-up
32002 men, age 44-79
years: 2278 cases
7 Aerobic exercise
Weight training
Aerobic exercise
Weight training
0 min/wk
27
97 360
0 min/wk
17 85
193
0 min/wk
27
97
360 0 min/wk
17
85 193
1.00
0.93 (0.81-1.06)
0.69 (0.60-0.80) 0.48 (0.42-0.55)
1.00
0.88 (0.79-0.98) 0.75 (0.61-0.92)
0.66 (0.46-0.93)
1.00
1.00 (0.88-1.15)
0.80 (0.69-0.92)
0.61 (0.53-0.70) 1.00
0.92 (0.82-1.02)
0.82 (0.67-1.00) 0.71 (0.49-1.00)
Age, smoking, alcohol, coffee, race,
family history of diabetes, total energy,
trans fat, polyunsaturated to saturated fat ratio, cereal fiber, whole grain,
glycemic load, weight training, other
physical activity, television viewing
+ BMI
Lee DC et al, 2012,
Korea
Korea National
Health Insurance Corporation Study
1996/1997 -
2005, 7.5 years follow-up
675496 men, age ≥18
years: 52995 cases
7 Leisure-time physical activity 0 min/wk
1-149 150-299
≥300
1.00
0.95 (0.93-0.97) 0.90 (0.87-0.93)
0.91 (0.88-0.94)
Age, smoking status, alcohol intake,
hypertension, parental diabetes, baseline glucose, BMI
Jefferis BJ et al,
2012, United Kingdom
General practices in
24 British Towns
1998/2000 –
2006, 7.1 years follow-up
3012 men, age 60-79
years: 135 cases
8 Leisure-time physical activity
Change in physical activity (baseline/2000)
None
Occasional Light
Moderate Moderately vigorous
Vigorous
None, occasional, light at both times
Moderate/None, occasional,
light None, occasional,
light/moderate
Moderate at both times
1.00
0.70 (0.40-1.24) 0.48 (0.25-0.92)
0.47 (0.23-0.93) 0.56 (0.28-1.12)
0.48 (0.23-1.02)
1.00 0.11 (0.07-0.77)
0.72 (0.40-1.32)
0.61 (0.37-0.99)
Age, region, social class, smoking
history, alcohol, coffee, total energy, dietary fiber, protein, carbohydrate,
total cholesterol, HDL cholesterol, triglycerides, BMI, waist
circumference
The InterAct Consortium, 2012,
Europe
European Prospective
Investigation into
Cancer and
Nutrition – InterAct
Study
1991-2007, 12.3 years follow-up
340234: case-cohort of 16154 men and
women, mean age
53/52 years (m/w):
11230 cases
8 Total physical activity, men Total physical activity, women
Leisure-time physical activity, men
Leisure-time physical activity, women
Total physical activity, BMI<25, men
Total physical activity, BMI 25-30
Per 1 category increase Per 1 category increase
Per 1 category increase
Per 1 category increase
Active
Moderately active
Moderately inactive Inactive
Active
Moderately active Moderately inactive
Inactive
0.87 (0.80-0.94) 0.93 (0.89-0.98)
0.90 (0.82-0.99)
0.94 (0.88-1.03)
1.00
0.83 (0.62-1.10)
1.32 (1.01-1.72) 1.81 (1.34-2.43)
1.00
1.09 (0.93-1.28) 1.15 (0.99-1.34)
1.36 (1.14-1.62)
Age, BMI, education, smoking status, alcohol, energy intake
Total physical activity, BMI >30
Total physical activity, BMI<25, women
Total physical activity, BMI 25-30
Total physical activity, BMI >30
Active
Moderately active Moderately inactive
Inactive
Active Moderately active
Moderately inactive
Inactive Active
Moderately active
Moderately inactive Inactive
Active
Moderately active Moderately inactive
Inactive
1.00
1.11 (0.87-1.40) 1.36 (1.08-1.71)
1.38 (1.08-1.78)
1.00 1.12 (0.88-1.41)
1.13 (0.90-1.40)
1.50 (1.17-1.93) 1.00
1.17 (0.96-1.43)
1.17 (0.97-1.41) 1.41 (1.15-1.72)
1.00
1.19 (0.91-1.55) 1.17 (0.92-1.48)
1.20 (0.94-1.54)
Steinbrecher A et al,
2012, USA
Multiethnic Cohort
Study
1993/1996 –
2007, 12.1 years follow-up
74913 men and
women, age 45-75 years: 8561 cases
7 Strenuous sports, men
Vigorous work
Moderate activity
Strenuous sports, women
Vigorous work
Moderate activity
Never
0.5-1.0 hrs/wk 2-3
≥4
Never 0.5-1.0 hrs/wk
2-3
≥4 ≤1 hrs/wk
2-3
4-6
7-10
≥11 Never
0.5-1.0 hrs/wk
2-3 ≥4
Never
0.5-1.0 hrs/wk 2-3
≥4
≤1 hrs/wk 2-3
4-6
7-10 ≥11
1.00
0.94 (0.87-1.02) 0.85 (0.77-0.94)
0.80 (0.72-0.88)
1.00 0.91 (0.85-0.98)
0.91 (0.83-1.00)
0.84 (0.77-0.92) 1.00
0.92 (0.84-1.00)
0.97 (0.89-1.06)
0.87 (0.78-0.97)
0.95 (0.86-1.05) 1.00
1.00 (0.91-1.09)
0.85 (0.75-0.96) 0.67 (0.57-0.79)
1.00
1.03 (0.95-1.12) 0.99 (0.87-1.13)
0.91 (0.78-1.06)
1.00 0.99 (0.90-1.09)
1.01 (0.92-1.12)
1.01 (0.90-1.12) 0.95 (0.85-1.06)
Age, education, hypertension,
ethnicity, BMI, processed red meat, dietary fiber, alcohol, smoking status
Doi Y et al, 2012,
Japan
Cardivascular risk
factor study in
Hisayama
1988-2002, 11.8
years follow-up
1935 men and women,
age 40-79 years: 286
cases
8 Regular exercise No
Yes
1.00
0.69 (0.43-1.10)
Age, sex, FH – DM, central obesity,
BMI, hypertension, smoking, fasting
plasma glucose
Xu F et al, 2012,
China
Nanjing
Community-based
cohort studies
2004-2007,
2007-2010, 3
years follow-up
4550 men and women,
age 35-64 years: 232
cases
6 Leisure-time physical activity <150 min/wk
≥150
1.00
0.45 (0.28-0.72)
Age, sex, residence area, education,
BMI, FH – DM, cigarette smoking,
alcohol, TV viewing, vegetables, meat,
hypertension
Reis JP et al, 2011,
USA
NIH-AARP Diet
and Health Study
1995/1996 –
2004/2006, 11 years follow-up
114996 men and
92483 women, age 50-71 years: 11031/6969
cases
6 Regular leisure-time physical activity,
men
Regular leisure-time physical activity,
women
No
Yes No
Yes
1.00
0.76 (0.73-0.79) 1.00
0.77 (0.73-0.82)
Age, race/ethnicity, education, marital
status, BMI, diet score, smoking, alcohol
Sawada SS et al,
2010, Japan
Tokyo Gas
Company
1985-1999, 14
years follow-up
4187 men, age 22-40
years: 274 cases
9 Cardiorespiratory fitness (baseline)
Change in cardiorespiratory fitness
<35 ml/kg/min 02
35-39.9
40-44.9 ≥45.0
-1.25 ml/kg/min
0.40
0.32
1.33
1.00
0.88 (0.66-1.18)
0.72 (0.50-1.02) 0.50 (0.31-0.81)
1.00
0.64 (0.46-0.89)
0.40 (0.27-0.58)
0.33 (0.21-0.50)
Age, BMI, SBP, cigarette smoking,
alcohol, FH – DM
+ baseline fitness
Joseph J et al, 2010,
Norway
The Tromsø Study 1994-1995 –
2005, 10.8 years follow-up
12431 men and 13737
women, age 25-98 years:
522 cases
8 Leisure-time physical activity, men
Leisure-time physical activity, women
Hard
Moderate Inactive
Hard
Moderate Inactive
1.00
1.03 (0.68-1.55) 1.69 (1.12-2.55)
1.00
0.81 (0.49-1.35) 1.13 (0.69-1.83)
Age, BMI, total cholesterol, TG, HDL-
cholesterol, hypertension, FH – DM, smoking
Shirom A et al,
2010, Israel
Clialit Health
Services
1988 – 2008, 20
years follow-up
968 men and women,
age 18-73 years: NA
7 Exercise index
H vs. low 0.75 (0.63-0.90) Age, sex, education, vigor, total
cholesterol, glucose, BMI, alcohol, smoking, depressive symptoms,
anxiety symptoms, chronic disease
diagnosis, past hospitalization
Pronk NP et al,
2010, USA
Achieve Your
Potential Health
assessment
2004 – 2006, 2
years follow-up
6489 men and women,
mean age 45 years: 78
cases
5 Leisure-time physical activity (moderate
or vigorous)
High vs. low 0.51 (0.30-0.86) Age, sex, smoking, alcohol, fruit and
vegetables, family history of diabetes,
family history of heart disease
Demakakos P et al, 2010, England
England Longitudinal Study
of Aging
2002/2003 – NA, 45.3
months
7466 men and women, age ≥50 years: 258
cases
6 Leisure-time physical activity at least once a week
None Low intensity
Vigorous/moderate intensity
1.00 0.87 (0.58-1.30)
0.64 (0.43-0.95)
Age, age squared, sex, marital status, education, total household wealth,
BMI, long-standing illness, CVD/non-
CVD comorbidities, smoking status, alcohol, elevated depressive symptoms
Longo-Mbenza B et
al, 2010, Congo
NA 2004/2005 –
2008,
807 men and women,
age ≥40 years: 93 cases
7 Total physical activity Inactive
Active
3.5 (1.2-10.6)
1.0
Age, metabolic syndrome, impaired
glucose tolerance
Waller K et al, 2010,
Finland
The Finnish Twin
Cohort
1975/1976 –
2004, 28 years
follow-up
20487 men and
women, mean age 33
years: 1082 cases
7 Leisure-time physical activity <0.59 MET-hrs/d
≥0.59
1.00
0.54 (0.37-0.78)
Age, sex, BMI, work-related physical
activity, social class, alcohol, smoking
Jee SH et al, 2010,
Korea
Korea National
Health Insurance
Corporation Study
1992/1995 –
2006, 14 years
follow-up
708261 men and
women, age 30-95
years: 89422 cases
7 Exercise, men
Exercise, women
Yes vs. no
Yes vs. no
0.94 (0.92-0.96)
1.03 (1.00-1.06)
Age, age squared, alcohol, BMI
Sieverdes JC et al,
2010, USA
Aerobics Center
Longitudinal Study
1970/2003 –
2004, 18 years
follow-up
23444 men, age 20-85
years: 589 cases
7 Leisure-time physical activity
Cardiorespiratory fitness
Sedentary
Walking, jogging, runner
Sport, fitness Low
Moderate
High
1.00
0.60 (0.48-0.74)
0.72 (0.55-0.94) 1.00
0.62 (0.49-0.78)
0.37 (0.28-0.50)
Age, examination year, survey
response pattern, BMI, smoking status,
alcohol, fasting glucose, hypercholesterolemia, hypertension,
family history of diabetes, family
history of cardiovascular disease
Brouwer BG et al,
2010, Netherlands
The SMART Study 1996/2006 -
2007, 4.7 years follow-up
3940 men and women
with cardiovascular disease or
cardiovascular risk
factors, age 18-79 years: 194 cases
6 Leisure-time physical activity 0 MET-hrs/wk
0.5-10.5 >10.5
1.00
0.81 (0.48-1.36) 0.65 (0.43-0.99)
Age, sex, smoking, alcohol, BMI,
metabolic syndrome, location of vascular disease, hypertension,
hyperlipidemia
Laaksonen MA et al,
2010, Finland
Mini-Finland Health
Survey
1978-1980 –
NA, 10 years
follow-up
4517 men and women,
age ≥30 years: 145
cases
7 Exercise No
Occasional or regular
1.00
0.72 (0.52-1.01)
Age, sex
Laaksonen MA et al,
2010, Finland
Health 2000 Survey 2000-2001 –
NA, 7 years
follow-up
4110 men and women,
age ≥30 years: 81
cases
7 Exercise No
Occasional or regular
1.00
0.65 (0.40-1.03)
Age, sex
Engberg S et al, 2010, Denmark
The Inter99 Study
1999/2001 – NA, 5 years
follow-up
4031 men and women, mean age 46 years:
189 cases
7 Total physical activity Commuting physical activity
Leisure-time physical activity
0 vs. 4-7 hrs/wk <15 vs. 60 min/day
0 vs. 4-6 hrs/wk
1.76 (0.98-3.14) NA
2.95 (1.35-5.68)
Age, sex, nationality, FH – DM, intervention group, high- or low-risk
group, energy intake
Sun F et al, 2009, Taiwan
Taiwan MJ Longitudinal
Health-check-up-
based Population Database
1997/2005 – 1998/2006, 3.2
years follow-up
73961 men and women, age 35-74
years: 3612 cases
7 Exercise <1 hr/wk ≥1
1.00 0.90 (0.81-0.99)
Age, sex, education, family history of diabetes, smoking, hypertension, BMI,
waist circumference, fasting plasma
glucose
Rathman W et al,
2009, Germany
KORA S4/F4 Study
1999/2001 –
2006/2008, 7
years follow-up
887 men and women,
age 55-74 years: 93
cases
7 Leisure time physical activity, all
Leisure time physical activity, men
Leisure time physical activity, women
Active
Inactive
Active Inactive
Active
Inactive
1.0
1.3 (0.8-2.0)
1.0 1.8 (1.02-3.3)
1.0
0.7 (0.4-1.5)
Age, sex
Fretts AM et al,
2009, USA
The Strong Heart
Family Study
1989/1991 –
1998/1999, 10
years follow-up
1651 American
Indians, age 45-74
years: 454 cases
8 Total physical activity (pedometer
measured)
Total physical activity
No activity
<30 MET-hrs/wk
30-106 >106
No activity
<30 MET-hrs/wk 30-106
>106
1.00
0.67 (0.46-0.99)
0.67 (0.45-0.99) 0.67 (0.45-0.99)
1.00
0.74 (0.50-1.09) 0.74 (0.49-1.10)
0.71 (0.48-1.07)
Age, study site, sex, education,
cigarette smoking, alcohol use, FH –
DM
+BMI
Chien KL et al,
2009, China
Chin-Shan
Community
Cardiovascular Cohort Study
1990 - NA, 9
years follow-up
1936 men and women,
age ≥35 years: 312
cases
8 Sports activity
Work activity
Leisure activity
1.75 (Likert scale)
2
2.25 3
2.375
2.75 2.875
3.125
2 2.25
2.75
3.5
1.00
0.82 (0.60-1.12)
0.65 (0.47-0.89) 0.68 (0.49-0.95)
1.00
0.75 (0.54-1.05) 0.75 (0.50-1.12)
0.97 (0.69-1.37)
1.00 1.09 (0.80-1.49)
1.07 (0.77-1.48)
1.24 (0.87-1.75)
Age, sex, BMI, metabolic syndrome,
smoking, alcohol, marital status,
education, occupation, hypertension, HDL-cholesterol, triglycerides,
glucose level, FH - DM
Mozaffarian D et al,
2009, USA
The Cardiovascular
Health Study
1989-1998, 10
years follow-up
4883 men and women,
age ≥65 years: 337 cases
8 Leisure time physical activity and
walking
<Median
≥Median
1.00
0.74 (0.58-0.93)
Age, sex, race, education, annual
income, smoking, dietary score, alcohol, BMI, waist circumference
Siegel LC et al,
2009, USA
Physicians’ Health
Study
1982-2006,
23.1 years
20757 men, age 40-84
years: 1836 cases
5 Vigorous physical activity
Vigorous physical activity
Rarely, never
1-3 times/mo
1/wk 2-4/wk
≥5
Rarely, never 1-3 times/mo
1/wk
2-4/wk
≥5
1.00
0.84 (0.72-0.98)
0.78 (0.68-0.91) 0.63 (0.55-0.73)
0.49 (0.41-0.59)
1.00 0.84 (0.72-0.98)
0.81 (0.70-0.93)
0.69 (0.61-0.79)
0.58 (0.48-0.69)
Age, alcohol use, smoking status,
history of high cholesterol, history of
hypertension
+BMI
Krishnan S et al,
2009, USA
Black Women’s
Health Study
1995-2005, 10
years follow-up,
45668 black women,
age 21-69 years: 2928 cases
8 Vigorous physical activity
Walking, casual
Walking, average
Walking, brisk
0 hrs/wk
<1 1-2
3-4
5-6 ≥7
No
<1 hrs/wk 1-2
3-4
≥5 No
<1 hrs/wk
1-2 3-4
≥5
No <1 hrs/wk
1-2
3-4 ≥5
1.00
0.90 (0.82-0.99) 0.77 (0.69-0.85)
0.53 (0.45-0.63)
0.49 (0.38-0.64) 0.43 (0.31-0.59),
1.00
1.04 (0.78-1.37) 1.09 (0.84-1.42)
1.21 (0.89-1.65)
1.21 (0.89-1.65) 1.00
1.02 (0.77-1.53)
0.96 (0.74-1.24) 1.04 (0.78-1.37)
0.95 (0.71-1.26)
1.00 0.91 (0.64-1.27)
0.78 (0.59-1.03)
0.69 (0.51-0.95) 0.67 (0.49-0.92)
Age, time period, FH – DM, years of
education, family income, marital status, cigarette use, alcohol use,
energy intake, coffee consumption, TV
watching, mutual adjustment between vigorous activity, and walking
Montgomery MP et
al, 2008, USA
Agricultural Health
Study
1999-2003, 5
years follow-up
31787 men and
women, age <40-≥70 years:
1176 cases
5 Summer exercise None
>0-2 hr/wk ≥3
1.00
0.77 (0.62-0.95) 0.76 (0.61-0.93)
Age, state
Sui X et al, 2008,
USA
Aerobics Center
Longitudinal Study
1971-2004, 17
years follow-up
6249 women, age 20-
79 years: 143 cases
8 Cardiorespiratory fitness
Cardiorespiratory fitness
1
2
3
1
2 3
1.00
0.76 (0.52-1.11)
0.49 (0.31-0.77)
1.00
0.86 (0.59-1.25) 0.61 (0.38-0.96)
Age, current smoking, alcohol,
hypertension, FH – DM, survey
response pattern
+ BMI
Li G et al, 2008,
China
China Da Qing
Diabetes Prevention Study
1986-2006, 20
years follow-up
RCT: 577 men and
women with IGT, mean age 45.2 years:
435 cases
7 Leisure-time physical activity increase H vs. l 0.51 (0.31-0.83) Age, clinic
Magliano DJ et al,
2008, Australia
The Australian
Diabetes, Obesity and Lifestyle Study
1999/2000 –
2004/2005, 5 years follow-up
5842 men and women,
age ≥25 years: 224 cases
7 Leisure-time physical activity 0 min/wk
1-149 min/wk 150 min/wk
1.00
0.97 (0.58-1.63) 0.64 (0.46-0.89)
Age, sex, waist circumference,
smoking status, education, hypertension, FH – DM, log FPG,
hypertriglyceridemia, low HDL
cholesterol, total cholesterol
Katzmarzyk PT et al, 2007, Canada
The Physical Activity
Longitudinal Study
1981/1988 - 2002-2004, 15.5
years follow-up
1543 men and women, age 18-69 years: 78
cases
7 Leisure-time physical activity Max METs
Sit-ups
Push-ups Grip strength
Trunk flexibility
Muskulosceletal fitness composite score
Per 12.3/9.5 kJ/kg/d m/w Per 1.6/1.6
Per 12.6/10.7
Per 12.2/12.2 Per 16.7/10.9 kg
Per 9.3/8.4 cm
H vs l
0.78 (0.59-1.02) 0.30 (0.14-0.60)
0.41 (0.26-0.64)
0.49 (0.28-0.81) 0.62 (0.33-1.20)
0.70 (0.48-1.02)
0.39 (0.23-0.63)
Age, sex, smoking status, alcohol consumption, parental history of
diabetes
Lecomte P et al,
2007, France
NA 1995-1997 –
2000-2002, 5
years follow-up
743 men, age 20-60
years: 127 cases
8 Total physical activity
Low vs. High 1.70 (0.98-2.95) Age, BMI, FH – DM, TG, glucose at
baseline
Burke V et al, 2007, Australia
Australian Aboriginal Cohort
1988-1999 – 2002, 12.9 years
follow-up
258 men and 256 women, age 15-88
years: 45/59 cases
9 Exercise
≥1 vs. <1/wk 1.19 (0.79-1.81) Age, sex, waist girth, location
Lucke J et al, 2007, Australia
Australian Longitudinal Study
on Women’s Health
1996 – 2001/2003, 6
years follow-up
28956 women, age 18-23/45-50/70-75 years:
6 Physical activity, age 18-23 Physical activity, age 45-50
Physical activity, age 70-75
Nil/low vs. moderate/high Nil/low vs. moderate/high
Nil/low vs. moderate/high
1.07 (0.70-1.64) 1.31 (1.08-1.60)
1.35 (1.13-1.62)
BMI, smoking, alcohol, education
Sato KK et al, 2007,
Japan
The Kansai
Healthcare Study
2000/2001 –
2004/2005, 4 years follow-up
8576 men, age 40-55
years: 878 cases
8 Walk to work
Regular leisure-time physical activity
0-10 min/d
11-20 ≥21
No
Yes
1.00
0.86 (0.70-1.06) 0.73 (0.58-0.92)
1.00
0.90 (0.72-1.11)
Age, BMI, fasting plasma glucose,
alcohol, smoking, parental history of diabetes
Rana JS et al, 2007,
USA
Nurses’ Health
Study
1986-2002, 16
years follow-up
68907 women, age 30-
55 years: 4030 cases
7 Moderate-vigorous physical activity
Moderate-vigorous physical activity
2.1 MET-h/wk
2.1-4.6
4.7-10.4 10.5-21.7
≥21.8
2.1 MET-h/wk 2.1-4.6
4.7-10.4
10.5-21.7 ≥21.8
1.00
0.71 (0.65-0.79)
0.68 (0.61-0.75) 0.52 (0.47-0.57)
0.42 (0.38-0.47)
1.00 0.79 (0.71-0.87)
0.77 (0.69-0.85)
0.64 (0.57-0.71) 0.60 (0.55-0.67)
Age, smoking status, alcohol
consumption, menopausal status,
postmenopausal hormone use, FH – DM
+ BMI
Holme I et al, 2007,
Norway
The Oslo Study 1972/1973 –
2000, 28 years follow-up
6382 men, age 40-49
years: 584 cases
6 Leisure-time physical activity Sedentary, light
Moderate Moderate, vigorous
Vigorous
1.00
0.87 (0.68-1.10) 0.87 (0.64-1.17)
0.42 (0.17-1.06)
Age, education, glucose, triglycerides,
BMI, hypertension, systolic blood pressure
Carlsson S et al,
2007, Norway
Nord-Trøndelag
Health Study (HUNT 1&2)
1984/1986 -
1995/1997, 11 years follow-up
38800 men and
women, age ≥20 years: 738 cases
7 Exercise Every day
2-3/wk 1/wk
<1/wk
Never Never
<1/wk
1/wk
1.00
1.21 (0.92-1.59) 1.24 (0.94-1.62)
1.61 (1.24-2.10)
2.03 (1.52-2.71) 1.00
0.79 (0.54-1.17)
0.61 (0.41-0.91)
Sex, smoking, BMI
2-3/wk
Every day
0.60 (0.40-0.89)
0.49 (0.37-0.66)
Schulze MB et al, 2007, Germany
European Prospective
Investigation into
Cancer and Nutrition – Potsdam
Study
1994/1998 – 2005, 7 years
follow-up
9729 men and 15438 women, age 35-65
years: 849 cases
8 Sports, biking, gardening Per hour per week 0.984 (0.973-0.995)
Age, waist circumference, height, hypertension, red meat, whole grain
bread, coffee, alcohol, smoking
Fossum E et al, 2007, Norway,
Sweden, USA
The LIFE Study
1995/1997 - NA, 4.8 years
follow-up
9185 men and women with hypertension and
left ventricular
hypertrophy, age 55-
80 years: 562 cases
5 Leisure-time physical activity Never ≤30 min twice/wk
>30 min twice/wk
1.00 0.95 (0.76-1.19)
0.66 (0.53-0.81)
Age, sex, smoking, alcohol, race, degree of left ventricular hypertrophy,
Framingham risk score
Onat A et al, 2007, Turkey
Turkish Adult Risk Factor Survey
1997/1998/ 2002/2003 –
NA, 8 years
follow-up
3248 men and women, age ≥28 years: 273
cases
7 Total physical activity, all Total physical activity, men
Total physical activity, women
Active vs. sedentary Active vs. sedentary
Active vs. sedentary
0.66 (0.49-0.89) 0.68 (0.46-0.98)
0.64 (0.39-1.04)
Age, sex, waist circumference
Villegas R et al, 2006, China
Shanghai Women’s Health Study
1997/2000 – 2002/2004, 4.6
years follow-up
70658 women, age 40-70 years: 1973 cases
8 Leisure-time physical activity
METs
Walking
Cycling
Stairs
Household
METs (DPA)
METs (LPA+DPA)
Zero
1.4 h/wk
1.5-3.5
3.5 zero
0.80 MET-h/wk
0.80-1.99
1.99
60 min/d
60-90 91-120
120
no yes
5 (flights/d)
5-9 10-15
15
1 h/d 1-2.5
2.6-3
3
7.85
7.85-11.26
11.27-15.2
15.2
8.20
8.20-11.82 11.83-16.00
16.00
1.00 0.89 (0.77-1.02)
1.05 (0.92-1.19)
0.83 (0.74-0.98) 1.00
0.88 (0.77-1.02)
1.01 (0.88-1.02) 0.91 (0.80-1.04)
1.00
1.03 (0.89-1.18) 1.05 (0.91-1.22)
0.91 (0.78-1.06)
1.00 0.81 (0.66-1.00)
1.00 0.90 (0.79-1.02)
0.85 (0.75-0.95)
0.79 (0.70-0.89) 1.00
0.96 (0.84-1.10)
0.93 (0.81-1.07) 0.98 (0.85-1.13)
1.00
0.98 (0.86-1.12) 0.95 (0.83-1.08)
0.88 (0.77-1.01)
1.00 1.08 (0.93-1.24)
1.06 (0.92-1.23)
0.91 (0.79-1.05)
Age, total energy, education level, income level, occupation, smoking,
alcohol, hypertension, chronic diseases
Jonker JT et al,
2006, USA
Framingham Heart
Study
1948-51 - 1989,
46 years follow-up
5209 men and women,
age 28-62 years: 329 cases
7 Total physical activity Low
Moderate High
1.00
0.62 (0.47-0.80) 0.60 (0.46-0.80)
Age, sex, education, marital status,
smoking, baseline diseases, exam of start follow-up
Lindström J et al,
2006, Finland
The Finnish
Diabetes Prevention
Study
1993-1998 –
2004, 7 years
follow-up
172 men and 350
women, age 40-65
years: 185 cases
7 Leisure-time physical activity ≥4 hrs/wk vs. 0 0.80 (0.57-1.12) Weight reduction, total fat, SFA, fiber
Laaksonen DE et al,
2005, Finland
The Finnish
Diabetes Prevention
Study
NA, 4.1 years
follow-up
487 men and women
with impaired glucose
tolerance, age 40-65 years: 107 cases
7 Change in leisure-time physical activity
Change in moderate-vigorous physical
activity
Change in low- intensity physical activity
-3.2
0.5
3.8 -1.5
0.5
2.6
-3.2
0.1
3.1
1.00
0.52 (0.31-0.89)
0.34 (0.19-0.62) 1.00
0.95 (0.54-1.65)
0.51 (0.27-0.97)
1.00
0.63 (0.34-1.17)
0.36 (0.19-0.67)
Age, sex, group, smoking status, BMI,
fasting and 2-hour plasma glucose,
insulin level, FH – DM, energy, total fat, SFA, fiber, BMI
Patja K et al, 2005, Finland
NA 1972-1992, 21 years follow-up
41372 men and women, age 25-64
years: 2770 cases
7 Total physical activity, never smokers
Total physical activity, former smokers
Total physical activity, current smokers
High Medium
Low
High Medium
Low
High Medium
Low
1.00 1.03 (0.92-1.16)
1.26 (1.09-1.46)
1.11 (0.93-1.33) 0.99 (0.82-1.19)
1.71 (1.31-2.21)
1.32 (1.13-1.54) 1.58 (1.37-1.82)
1.72 (1.42-2.10)
Age, study year, education, SBP, coffee, alcohol, BMI, sex
Hsia J et al, 2005, USA
Women’s Health Initiative
Observational Study
1994/1998 – 2002, 5.1 years
follow-up
87907 women: 2271 cases
6
Leisure-time physical activity
Walking
0-2.3 MET-hrs/wk 2.3-7.4
7.5-13.9
14-23.4 23.5-143.0
0 MET-hrs/wk
0.5-2.5 2.6-5.0
5.1-10.0
10.1-10.8
1.00 0.91 (0.80-1.03)
0.80 (0.70-0.91)
0.86 (0.75-0.99) 0.78 (0.67-0.91)
1.00
0.77 (0.68-0.87) 0.87 (0.77-0.99)
0.74 (0.64-0.85)
0.82 (0.70-0.95)
Age, BMI, alcohol, education, smoking, hypertension,
hypercholesterolemia, dietary fiber,
carbohydrate %
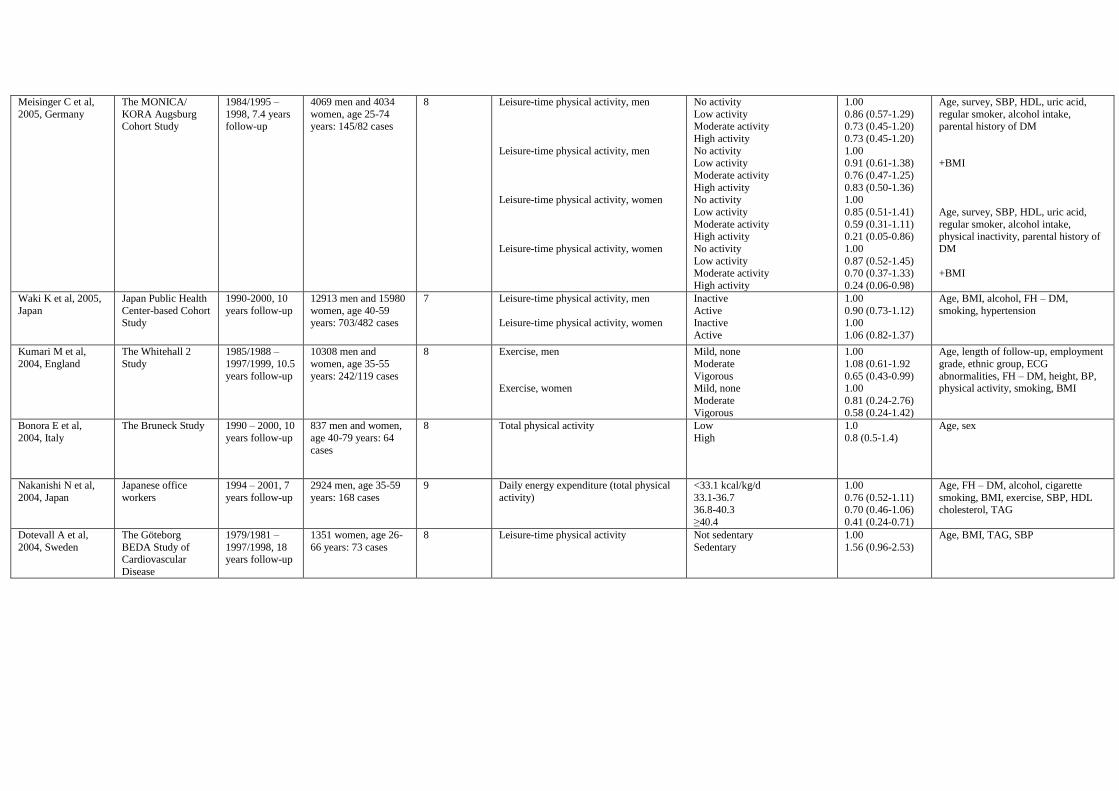
Meisinger C et al,
2005, Germany
The MONICA/
KORA Augsburg Cohort Study
1984/1995 –
1998, 7.4 years follow-up
4069 men and 4034
women, age 25-74 years: 145/82 cases
8 Leisure-time physical activity, men
Leisure-time physical activity, men
Leisure-time physical activity, women
Leisure-time physical activity, women
No activity
Low activity Moderate activity
High activity
No activity Low activity
Moderate activity
High activity No activity
Low activity
Moderate activity High activity
No activity
Low activity Moderate activity
High activity
1.00
0.86 (0.57-1.29) 0.73 (0.45-1.20)
0.73 (0.45-1.20)
1.00 0.91 (0.61-1.38)
0.76 (0.47-1.25)
0.83 (0.50-1.36) 1.00
0.85 (0.51-1.41)
0.59 (0.31-1.11) 0.21 (0.05-0.86)
1.00
0.87 (0.52-1.45) 0.70 (0.37-1.33)
0.24 (0.06-0.98)
Age, survey, SBP, HDL, uric acid,
regular smoker, alcohol intake, parental history of DM
+BMI
Age, survey, SBP, HDL, uric acid,
regular smoker, alcohol intake, physical inactivity, parental history of
DM
+BMI
Waki K et al, 2005,
Japan
Japan Public Health
Center-based Cohort Study
1990-2000, 10
years follow-up
12913 men and 15980
women, age 40-59 years: 703/482 cases
7 Leisure-time physical activity, men
Leisure-time physical activity, women
Inactive
Active Inactive
Active
1.00
0.90 (0.73-1.12) 1.00
1.06 (0.82-1.37)
Age, BMI, alcohol, FH – DM,
smoking, hypertension
Kumari M et al,
2004, England
The Whitehall 2
Study
1985/1988 –
1997/1999, 10.5
years follow-up
10308 men and
women, age 35-55
years: 242/119 cases
8 Exercise, men
Exercise, women
Mild, none
Moderate
Vigorous Mild, none
Moderate
Vigorous
1.00
1.08 (0.61-1.92
0.65 (0.43-0.99) 1.00
0.81 (0.24-2.76)
0.58 (0.24-1.42)
Age, length of follow-up, employment
grade, ethnic group, ECG
abnormalities, FH – DM, height, BP, physical activity, smoking, BMI
Bonora E et al,
2004, Italy
The Bruneck Study 1990 – 2000, 10
years follow-up
837 men and women,
age 40-79 years: 64
cases
8 Total physical activity Low
High
1.0
0.8 (0.5-1.4)
Age, sex
Nakanishi N et al,
2004, Japan
Japanese office
workers
1994 – 2001, 7
years follow-up
2924 men, age 35-59
years: 168 cases
9 Daily energy expenditure (total physical
activity)
<33.1 kcal/kg/d
33.1-36.7 36.8-40.3
≥40.4
1.00
0.76 (0.52-1.11) 0.70 (0.46-1.06)
0.41 (0.24-0.71)
Age, FH – DM, alcohol, cigarette
smoking, BMI, exercise, SBP, HDL cholesterol, TAG
Dotevall A et al,
2004, Sweden
The Göteborg
BEDA Study of Cardiovascular
Disease
1979/1981 –
1997/1998, 18 years follow-up
1351 women, age 26-
66 years: 73 cases
8 Leisure-time physical activity Not sedentary
Sedentary
1.00
1.56 (0.96-2.53)
Age, BMI, TAG, SBP
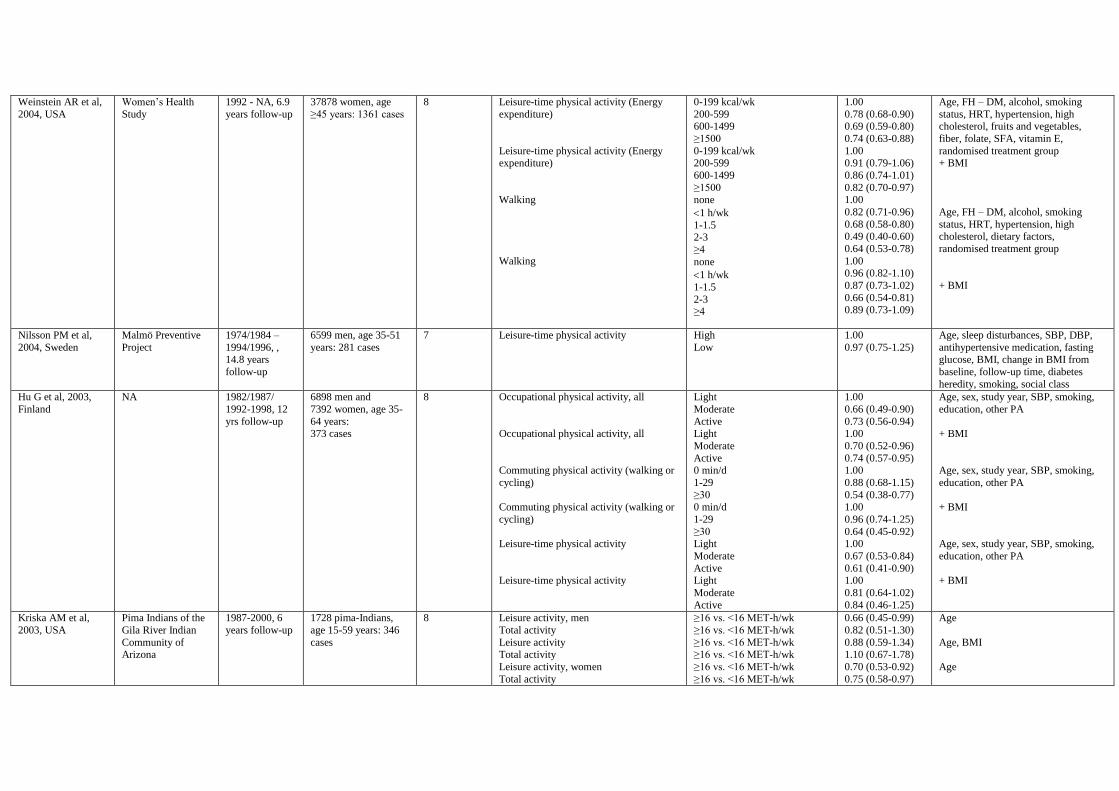
Weinstein AR et al,
2004, USA
Women’s Health
Study
1992 - NA, 6.9
years follow-up
37878 women, age
≥45 years: 1361 cases
8 Leisure-time physical activity (Energy
expenditure)
Leisure-time physical activity (Energy expenditure)
Walking
Walking
0-199 kcal/wk
200-599 600-1499
≥1500
0-199 kcal/wk 200-599
600-1499
≥1500 none
1 h/wk
1-1.5 2-3
≥4
none
1 h/wk
1-1.5
2-3 ≥4
1.00
0.78 (0.68-0.90) 0.69 (0.59-0.80)
0.74 (0.63-0.88)
1.00 0.91 (0.79-1.06)
0.86 (0.74-1.01)
0.82 (0.70-0.97) 1.00
0.82 (0.71-0.96)
0.68 (0.58-0.80) 0.49 (0.40-0.60)
0.64 (0.53-0.78)
1.00 0.96 (0.82-1.10)
0.87 (0.73-1.02)
0.66 (0.54-0.81) 0.89 (0.73-1.09)
Age, FH – DM, alcohol, smoking
status, HRT, hypertension, high cholesterol, fruits and vegetables,
fiber, folate, SFA, vitamin E,
randomised treatment group + BMI
Age, FH – DM, alcohol, smoking
status, HRT, hypertension, high cholesterol, dietary factors,
randomised treatment group
+ BMI
Nilsson PM et al,
2004, Sweden
Malmö Preventive
Project
1974/1984 –
1994/1996, , 14.8 years
follow-up
6599 men, age 35-51
years: 281 cases
7 Leisure-time physical activity High
Low
1.00
0.97 (0.75-1.25)
Age, sleep disturbances, SBP, DBP,
antihypertensive medication, fasting glucose, BMI, change in BMI from
baseline, follow-up time, diabetes
heredity, smoking, social class
Hu G et al, 2003,
Finland
NA 1982/1987/
1992-1998, 12
yrs follow-up
6898 men and
7392 women, age 35-
64 years: 373 cases
8 Occupational physical activity, all
Occupational physical activity, all
Commuting physical activity (walking or
cycling)
Commuting physical activity (walking or
cycling)
Leisure-time physical activity
Leisure-time physical activity
Light
Moderate
Active Light
Moderate
Active 0 min/d
1-29
≥30 0 min/d
1-29
≥30 Light
Moderate
Active Light
Moderate
Active
1.00
0.66 (0.49-0.90)
0.73 (0.56-0.94) 1.00
0.70 (0.52-0.96)
0.74 (0.57-0.95) 1.00
0.88 (0.68-1.15)
0.54 (0.38-0.77) 1.00
0.96 (0.74-1.25)
0.64 (0.45-0.92) 1.00
0.67 (0.53-0.84)
0.61 (0.41-0.90) 1.00
0.81 (0.64-1.02)
0.84 (0.46-1.25)
Age, sex, study year, SBP, smoking,
education, other PA
+ BMI
Age, sex, study year, SBP, smoking,
education, other PA
+ BMI
Age, sex, study year, SBP, smoking,
education, other PA
+ BMI
Kriska AM et al,
2003, USA
Pima Indians of the
Gila River Indian
Community of Arizona
1987-2000, 6
years follow-up
1728 pima-Indians,
age 15-59 years: 346
cases
8 Leisure activity, men
Total activity
Leisure activity Total activity
Leisure activity, women
Total activity
≥16 vs. <16 MET-h/wk
≥16 vs. <16 MET-h/wk
≥16 vs. <16 MET-h/wk ≥16 vs. <16 MET-h/wk
≥16 vs. <16 MET-h/wk
≥16 vs. <16 MET-h/wk
0.66 (0.45-0.99)
0.82 (0.51-1.30)
0.88 (0.59-1.34) 1.10 (0.67-1.78)
0.70 (0.53-0.92)
0.75 (0.58-0.97)
Age
Age, BMI
Age
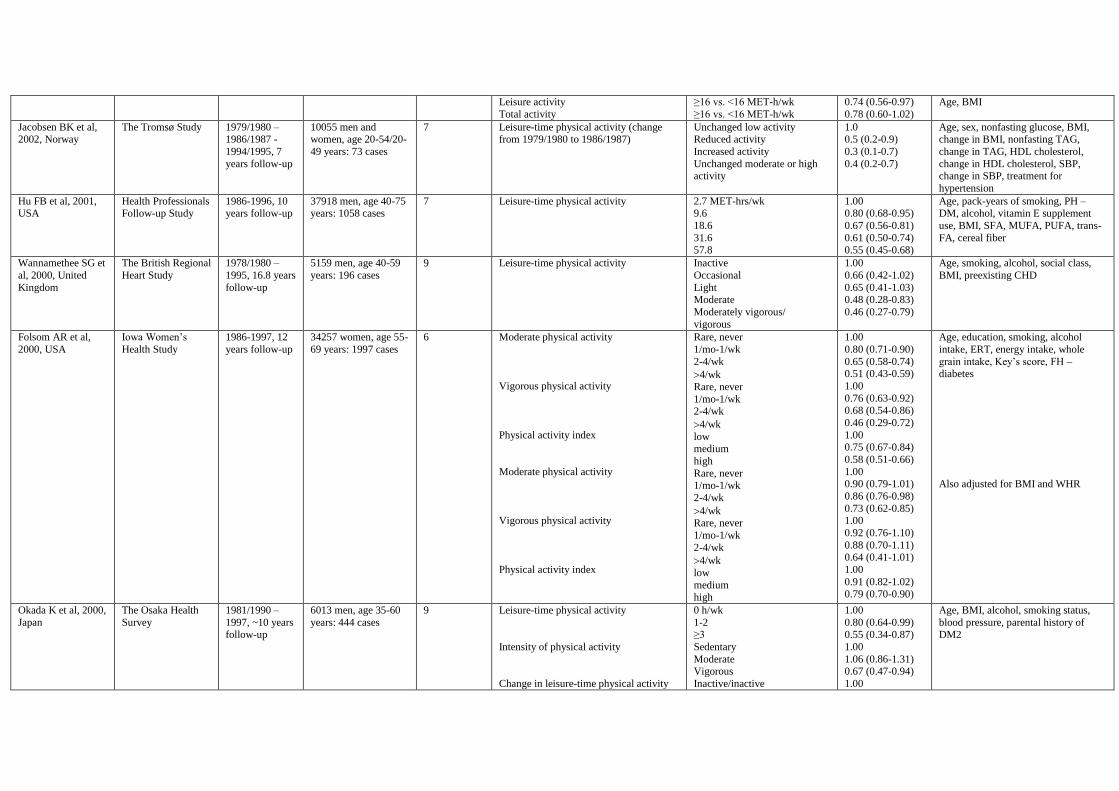
Leisure activity
Total activity
≥16 vs. <16 MET-h/wk
≥16 vs. <16 MET-h/wk
0.74 (0.56-0.97)
0.78 (0.60-1.02)
Age, BMI
Jacobsen BK et al, 2002, Norway
The Tromsø Study 1979/1980 – 1986/1987 -
1994/1995, 7
years follow-up
10055 men and women, age 20-54/20-
49 years: 73 cases
7 Leisure-time physical activity (change from 1979/1980 to 1986/1987)
Unchanged low activity Reduced activity
Increased activity
Unchanged moderate or high activity
1.0 0.5 (0.2-0.9)
0.3 (0.1-0.7)
0.4 (0.2-0.7)
Age, sex, nonfasting glucose, BMI, change in BMI, nonfasting TAG,
change in TAG, HDL cholesterol,
change in HDL cholesterol, SBP, change in SBP, treatment for
hypertension
Hu FB et al, 2001, USA
Health Professionals Follow-up Study
1986-1996, 10 years follow-up
37918 men, age 40-75 years: 1058 cases
7 Leisure-time physical activity 2.7 MET-hrs/wk 9.6
18.6
31.6
57.8
1.00 0.80 (0.68-0.95)
0.67 (0.56-0.81)
0.61 (0.50-0.74)
0.55 (0.45-0.68)
Age, pack-years of smoking, PH – DM, alcohol, vitamin E supplement
use, BMI, SFA, MUFA, PUFA, trans-
FA, cereal fiber
Wannamethee SG et
al, 2000, United
Kingdom
The British Regional
Heart Study
1978/1980 –
1995, 16.8 years
follow-up
5159 men, age 40-59
years: 196 cases
9 Leisure-time physical activity
Inactive
Occasional
Light Moderate
Moderately vigorous/
vigorous
1.00
0.66 (0.42-1.02)
0.65 (0.41-1.03) 0.48 (0.28-0.83)
0.46 (0.27-0.79)
Age, smoking, alcohol, social class,
BMI, preexisting CHD
Folsom AR et al,
2000, USA
Iowa Women’s
Health Study
1986-1997, 12
years follow-up
34257 women, age 55-
69 years: 1997 cases
6 Moderate physical activity
Vigorous physical activity
Physical activity index
Moderate physical activity
Vigorous physical activity
Physical activity index
Rare, never
1/mo-1/wk
2-4/wk
4/wk
Rare, never
1/mo-1/wk 2-4/wk
4/wk
low medium
high
Rare, never 1/mo-1/wk
2-4/wk
4/wk Rare, never
1/mo-1/wk
2-4/wk
4/wk
low
medium
high
1.00
0.80 (0.71-0.90)
0.65 (0.58-0.74) 0.51 (0.43-0.59)
1.00
0.76 (0.63-0.92) 0.68 (0.54-0.86)
0.46 (0.29-0.72)
1.00 0.75 (0.67-0.84)
0.58 (0.51-0.66)
1.00 0.90 (0.79-1.01)
0.86 (0.76-0.98)
0.73 (0.62-0.85) 1.00
0.92 (0.76-1.10)
0.88 (0.70-1.11) 0.64 (0.41-1.01)
1.00
0.91 (0.82-1.02)
0.79 (0.70-0.90)
Age, education, smoking, alcohol
intake, ERT, energy intake, whole
grain intake, Key’s score, FH – diabetes
Also adjusted for BMI and WHR
Okada K et al, 2000,
Japan
The Osaka Health
Survey
1981/1990 –
1997, ~10 years follow-up
6013 men, age 35-60
years: 444 cases
9 Leisure-time physical activity
Intensity of physical activity
Change in leisure-time physical activity
0 h/wk
1-2 ≥3
Sedentary
Moderate Vigorous
Inactive/inactive
1.00
0.80 (0.64-0.99) 0.55 (0.34-0.87)
1.00
1.06 (0.86-1.31) 0.67 (0.47-0.94)
1.00
Age, BMI, alcohol, smoking status,
blood pressure, parental history of DM2
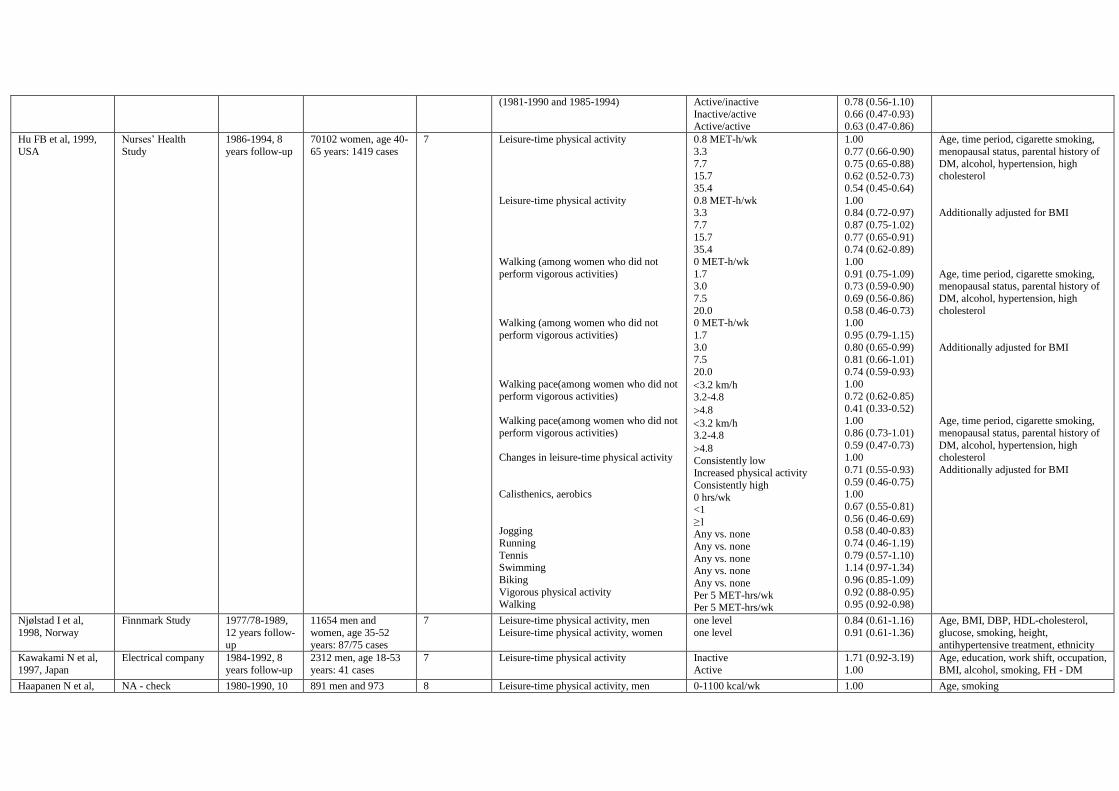
(1981-1990 and 1985-1994) Active/inactive
Inactive/active Active/active
0.78 (0.56-1.10)
0.66 (0.47-0.93) 0.63 (0.47-0.86)
Hu FB et al, 1999,
USA
Nurses’ Health
Study
1986-1994, 8
years follow-up
70102 women, age 40-
65 years: 1419 cases
7 Leisure-time physical activity
Leisure-time physical activity
Walking (among women who did not
perform vigorous activities)
Walking (among women who did not
perform vigorous activities)
Walking pace(among women who did not perform vigorous activities)
Walking pace(among women who did not
perform vigorous activities)
Changes in leisure-time physical activity
Calisthenics, aerobics
Jogging
Running
Tennis Swimming
Biking
Vigorous physical activity Walking
0.8 MET-h/wk
3.3
7.7 15.7
35.4
0.8 MET-h/wk 3.3
7.7
15.7
35.4
0 MET-h/wk
1.7 3.0
7.5
20.0 0 MET-h/wk
1.7
3.0 7.5
20.0
3.2 km/h 3.2-4.8
4.8
3.2 km/h 3.2-4.8
4.8
Consistently low Increased physical activity
Consistently high
0 hrs/wk <1
≥1 Any vs. none
Any vs. none
Any vs. none Any vs. none
Any vs. none
Per 5 MET-hrs/wk Per 5 MET-hrs/wk
1.00
0.77 (0.66-0.90)
0.75 (0.65-0.88) 0.62 (0.52-0.73)
0.54 (0.45-0.64)
1.00 0.84 (0.72-0.97)
0.87 (0.75-1.02)
0.77 (0.65-0.91)
0.74 (0.62-0.89)
1.00
0.91 (0.75-1.09) 0.73 (0.59-0.90)
0.69 (0.56-0.86)
0.58 (0.46-0.73) 1.00
0.95 (0.79-1.15)
0.80 (0.65-0.99) 0.81 (0.66-1.01)
0.74 (0.59-0.93)
1.00 0.72 (0.62-0.85)
0.41 (0.33-0.52)
1.00
0.86 (0.73-1.01)
0.59 (0.47-0.73) 1.00
0.71 (0.55-0.93)
0.59 (0.46-0.75) 1.00
0.67 (0.55-0.81)
0.56 (0.46-0.69) 0.58 (0.40-0.83)
0.74 (0.46-1.19)
0.79 (0.57-1.10) 1.14 (0.97-1.34)
0.96 (0.85-1.09)
0.92 (0.88-0.95) 0.95 (0.92-0.98)
Age, time period, cigarette smoking,
menopausal status, parental history of
DM, alcohol, hypertension, high cholesterol
Additionally adjusted for BMI
Age, time period, cigarette smoking, menopausal status, parental history of
DM, alcohol, hypertension, high
cholesterol
Additionally adjusted for BMI
Age, time period, cigarette smoking,
menopausal status, parental history of
DM, alcohol, hypertension, high cholesterol
Additionally adjusted for BMI
Njølstad I et al,
1998, Norway
Finnmark Study 1977/78-1989,
12 years follow-
up
11654 men and
women, age 35-52
years: 87/75 cases
7 Leisure-time physical activity, men
Leisure-time physical activity, women
one level
one level
0.84 (0.61-1.16)
0.91 (0.61-1.36)
Age, BMI, DBP, HDL-cholesterol,
glucose, smoking, height,
antihypertensive treatment, ethnicity
Kawakami N et al,
1997, Japan
Electrical company 1984-1992, 8
years follow-up
2312 men, age 18-53
years: 41 cases
7 Leisure-time physical activity Inactive
Active
1.71 (0.92-3.19)
1.00
Age, education, work shift, occupation,
BMI, alcohol, smoking, FH - DM
Haapanen N et al, NA - check 1980-1990, 10 891 men and 973 8 Leisure-time physical activity, men 0-1100 kcal/wk 1.00 Age, smoking

1997, Finland years follow-up women, age 35-63
years: 64/54 cases
Vigorous activity
Leisure-time physical activity, women
Vigorous activity
1101-1900
>1900 <1/wk
≥1/wk
0-900 kcal/wk 901-1500
>1500
<1/wk ≥1/wk
0.79 (0.32-1.91)
0.65 (0.35-1.19) 1.00
0.61 (0.35-1.09)
1.00 0.44 (0.15-1.35)
0.38 (0.18-0.78)
1.00 0.45 (0.19-1.05)
Lynch J et al, 1996,
Finland
Kuopio Ischemic
Heart Disease Risk
Factor Study
1984/1989 –
1991/1993, 4.2
years follow-up
897 men, age 42, 48,
54 and 60 years: 46
cases
7 Leisure-time physical activity
Cardiorespiratory fitness
low
≥5.5 METs and 40 min/wk
5.5 METs + ≥2 h/wk
1 (<25.8 mL 02/kg/min)
2
3 4 (36.0 mL 02/kg/min)
1.00
0.42 (0.22-0.79)
0.52 (0.28-0.99)
1.00
0.70 (0.31-1.46)
0.26 (0.09-0.74) 0.09 (0.02-0.44)
Age, BMI, WHR, serum TG, HDL,
SBP, alcohol, parental history of DM,
cardiorespiratory fitness and physical
activity mutually adjusted
Monterrosa AE et al,
1995, USA
The San Antonio
Heart Study
1979/1982 –
1987, 8 years follow-up
353 men and 491
women (Mexican-Americans), age 25-64
years: 57 cases
8 Leisure-time physical activity, men
Leisure-time physical activity, women
Per 1 time/wk
Per 1 time/wk
0.41 (0.18-0.93)
1.43 (0.85-2.41)
Age, socioeconomic status, structural
assimilation, weight control by dieting, sugar avoidance, alcohol, BMI
Burchfiel CM et al,
1995, USA
The Honolulu Heart
Program
1965/1968-
1974, 6 years follow-up
6815 Japanese-
Americans men, age 45-68 years: 391 cases
7 Total physical activity (per 24 hrs) Quintile 5 vs. 1-4 0.49 (0.34-0.72)
Age, BMI, subscapular/triceps skinfold
ratio, SBP, TAG, glucose, hematocrit, parental DM – history
Simonsick EM et al, 1993, USA
Established Populations for
Epidemiologic
Studies of the Elderly - East
Boston
1982/1983 – NA, 6 years
follow-up
East Boston 1874 men and women, age 65-
≥75 years: NA
6 Leisure-time physical activity
Inactive Moderately active
Highly active
1.00 0.85 (0.50-1.45)
1.11 (0.53-2.30)
Age, sex, education, work status, smoking, respiratory symptoms, MI,
stroke, diabetes, angina, self-rated
health, modified depression score
Simonsick EM et al, 1993, USA
Established Populations for
Epidemiologic
Studies of the Elderly - New
Haven
1982/1983 – NA, 6 years
follow-up
1488 men and women, age 65-≥75 years: NA
6 Leisure-time physical activity, New Haven
Inactive Moderately active
Highly active
1.00 1.54 (0.68-3.49)
0.59 (0.20-1.77)
Age, sex, education, work status, smoking, respiratory symptoms, MI,
stroke, diabetes, angina, self-rated
health, modified depression score
Simonsick EM et al,
1993, USA
Established
Populations for Epidemiologic
Studies of the
Elderly - Iowa
1982/1983 –
NA, 6 years follow-up
1815 men and women,
age 65-≥75 years: NA
6 Leisure-time physical activity, Iowa
Inactive
Moderately active Highly active
1.00
0.76 (0.42-1.38) 1.51 (0.83-2.75)
Age, sex, education, work status,
smoking, respiratory symptoms, MI, stroke, diabetes, angina, self-rated
health, modified depression score
Manson JAE et al,
1991, USA
Nurses’ Health
Study
1980-1988, 8
years follow-up
87253 women, age 34-
59 years: 1303 cases
8 Vigorous exercise
Vigorous exercise
0/wk
1
2 3
≥4
0/wk 1
1.00
0.74 (0.60-0.91)
0.55 (0.44-0.68) 0.73 (0.59-0.90)
0.63 (0.53-0.75)
1.00 0.89 (0.72-1.11)
Age
Age, BMI
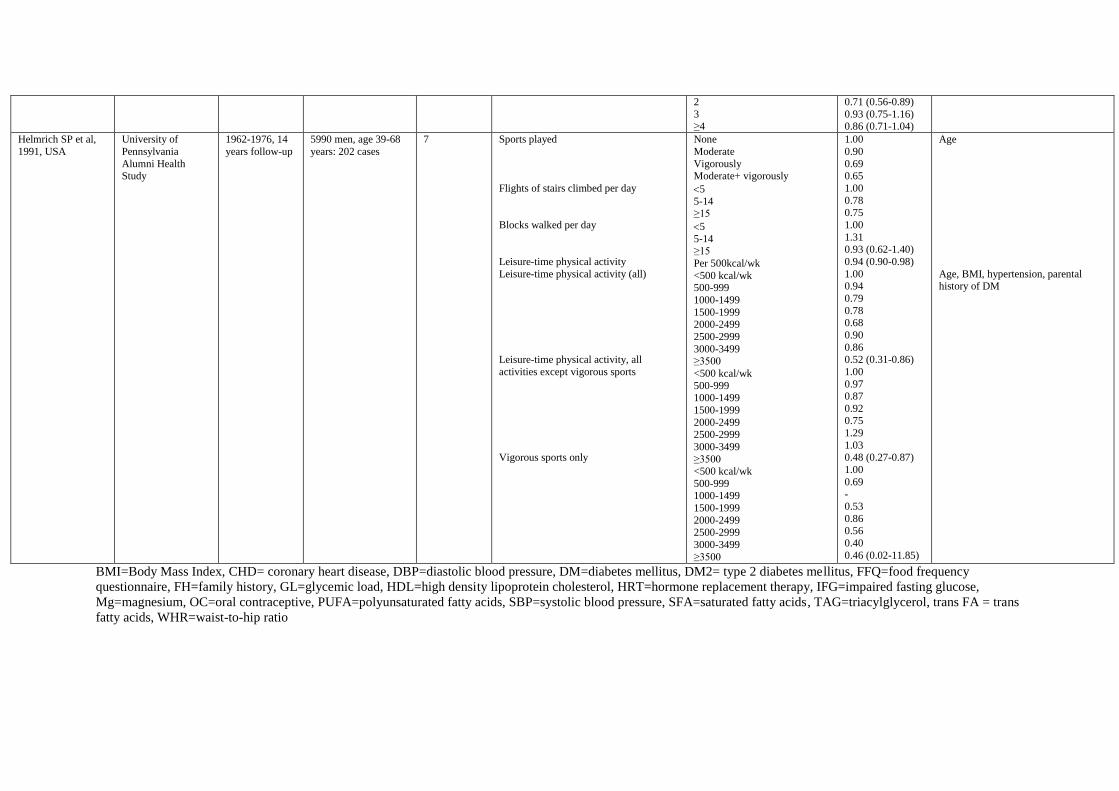
2
3 ≥4
0.71 (0.56-0.89)
0.93 (0.75-1.16) 0.86 (0.71-1.04)
Helmrich SP et al,
1991, USA
University of
Pennsylvania
Alumni Health Study
1962-1976, 14
years follow-up
5990 men, age 39-68
years: 202 cases
7 Sports played
Flights of stairs climbed per day
Blocks walked per day
Leisure-time physical activity
Leisure-time physical activity (all)
Leisure-time physical activity, all
activities except vigorous sports
Vigorous sports only
None
Moderate
Vigorously Moderate+ vigorously
5
5-14 ≥15
5
5-14
≥15
Per 500kcal/wk
<500 kcal/wk 500-999
1000-1499
1500-1999 2000-2499
2500-2999
3000-3499 ≥3500
<500 kcal/wk
500-999 1000-1499
1500-1999
2000-2499 2500-2999
3000-3499
≥3500 <500 kcal/wk
500-999 1000-1499
1500-1999
2000-2499 2500-2999
3000-3499
≥3500
1.00
0.90
0.69 0.65
1.00
0.78 0.75
1.00
1.31
0.93 (0.62-1.40)
0.94 (0.90-0.98)
1.00 0.94
0.79
0.78 0.68
0.90
0.86 0.52 (0.31-0.86)
1.00
0.97 0.87
0.92
0.75
1.29
1.03 0.48 (0.27-0.87)
1.00
0.69 -
0.53
0.86 0.56
0.40
0.46 (0.02-11.85)
Age
Age, BMI, hypertension, parental history of DM
BMI=Body Mass Index, CHD= coronary heart disease, DBP=diastolic blood pressure, DM=diabetes mellitus, DM2= type 2 diabetes mellitus, FFQ=food frequency
questionnaire, FH=family history, GL=glycemic load, HDL=high density lipoprotein cholesterol, HRT=hormone replacement therapy, IFG=impaired fasting glucose,
Mg=magnesium, OC=oral contraceptive, PUFA=polyunsaturated fatty acids, SBP=systolic blood pressure, SFA=saturated fatty acids, TAG=triacylglycerol, trans FA = trans
fatty acids, WHR=waist-to-hip ratio
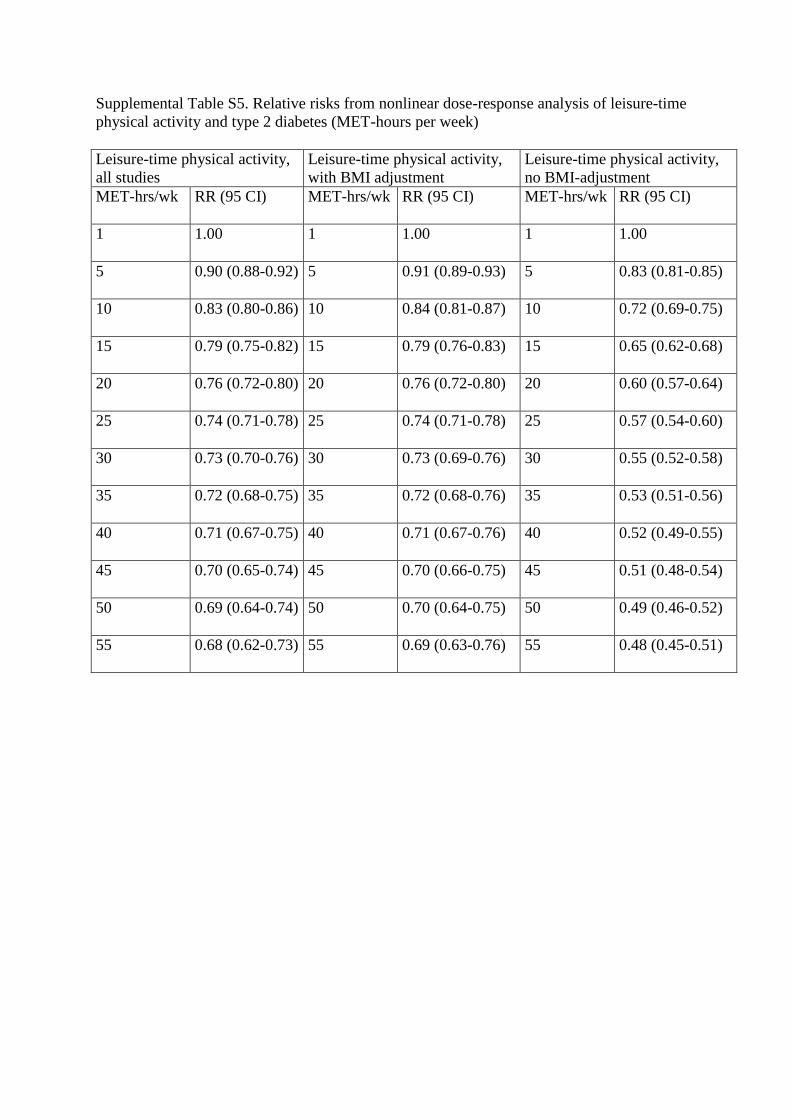
Supplemental Table S5. Relative risks from nonlinear dose-response analysis of leisure-time
physical activity and type 2 diabetes (MET-hours per week)
Leisure-time physical activity,
all studies
Leisure-time physical activity,
with BMI adjustment
Leisure-time physical activity,
no BMI-adjustment
MET-hrs/wk RR (95 CI) MET-hrs/wk RR (95 CI) MET-hrs/wk RR (95 CI)
1 1.00 1 1.00 1 1.00
5 0.90 (0.88-0.92) 5 0.91 (0.89-0.93) 5 0.83 (0.81-0.85)
10 0.83 (0.80-0.86) 10 0.84 (0.81-0.87) 10 0.72 (0.69-0.75)
15 0.79 (0.75-0.82) 15 0.79 (0.76-0.83) 15 0.65 (0.62-0.68)
20 0.76 (0.72-0.80) 20 0.76 (0.72-0.80) 20 0.60 (0.57-0.64)
25 0.74 (0.71-0.78) 25 0.74 (0.71-0.78) 25 0.57 (0.54-0.60)
30 0.73 (0.70-0.76) 30 0.73 (0.69-0.76) 30 0.55 (0.52-0.58)
35 0.72 (0.68-0.75) 35 0.72 (0.68-0.76) 35 0.53 (0.51-0.56)
40 0.71 (0.67-0.75) 40 0.71 (0.67-0.76) 40 0.52 (0.49-0.55)
45 0.70 (0.65-0.74) 45 0.70 (0.66-0.75) 45 0.51 (0.48-0.54)
50 0.69 (0.64-0.74) 50 0.70 (0.64-0.75) 50 0.49 (0.46-0.52)
55 0.68 (0.62-0.73) 55 0.69 (0.63-0.76) 55 0.48 (0.45-0.51)
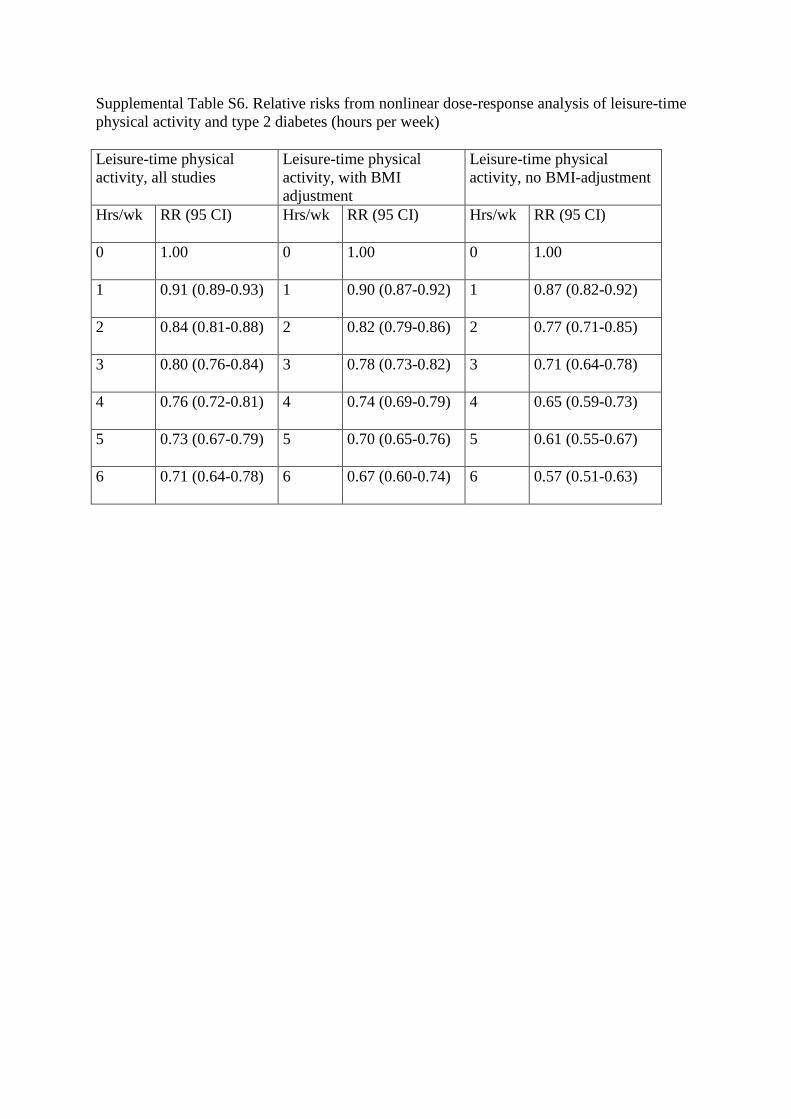
Supplemental Table S6. Relative risks from nonlinear dose-response analysis of leisure-time
physical activity and type 2 diabetes (hours per week)
Leisure-time physical
activity, all studies
Leisure-time physical
activity, with BMI
adjustment
Leisure-time physical
activity, no BMI-adjustment
Hrs/wk RR (95 CI) Hrs/wk RR (95 CI) Hrs/wk RR (95 CI)
0 1.00 0 1.00 0 1.00
1 0.91 (0.89-0.93) 1 0.90 (0.87-0.92) 1 0.87 (0.82-0.92)
2 0.84 (0.81-0.88) 2 0.82 (0.79-0.86) 2 0.77 (0.71-0.85)
3 0.80 (0.76-0.84) 3 0.78 (0.73-0.82) 3 0.71 (0.64-0.78)
4 0.76 (0.72-0.81) 4 0.74 (0.69-0.79) 4 0.65 (0.59-0.73)
5 0.73 (0.67-0.79) 5 0.70 (0.65-0.76) 5 0.61 (0.55-0.67)
6 0.71 (0.64-0.78) 6 0.67 (0.60-0.74) 6 0.57 (0.51-0.63)
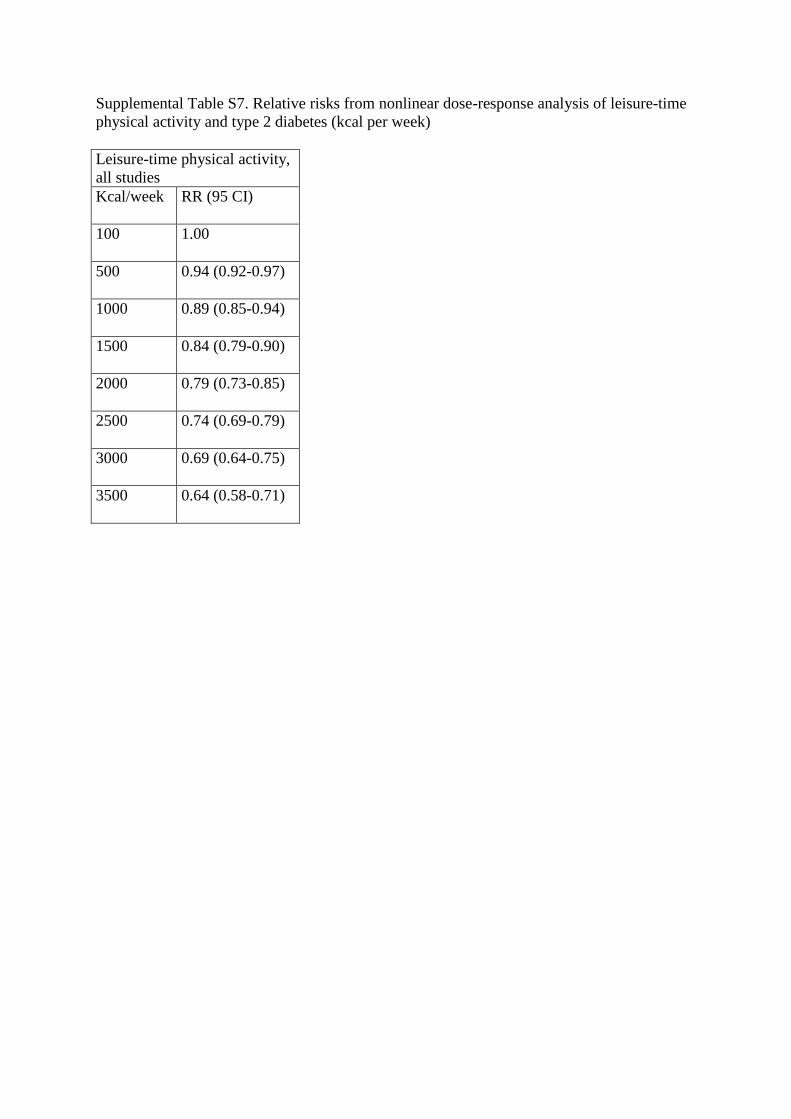
Supplemental Table S7. Relative risks from nonlinear dose-response analysis of leisure-time
physical activity and type 2 diabetes (kcal per week)
Leisure-time physical activity,
all studies
Kcal/week RR (95 CI)
100 1.00
500 0.94 (0.92-0.97)
1000 0.89 (0.85-0.94)
1500 0.84 (0.79-0.90)
2000 0.79 (0.73-0.85)
2500 0.74 (0.69-0.79)
3000 0.69 (0.64-0.75)
3500 0.64 (0.58-0.71)
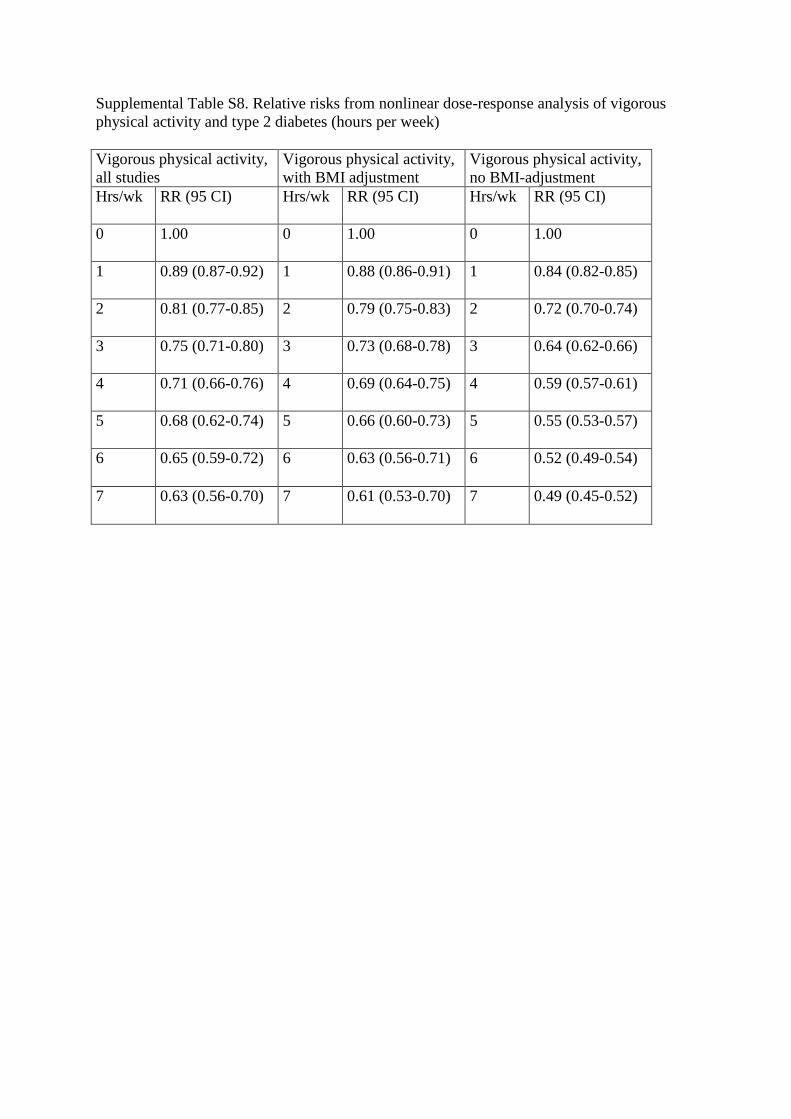
Supplemental Table S8. Relative risks from nonlinear dose-response analysis of vigorous
physical activity and type 2 diabetes (hours per week)
Vigorous physical activity,
all studies
Vigorous physical activity,
with BMI adjustment
Vigorous physical activity,
no BMI-adjustment
Hrs/wk RR (95 CI) Hrs/wk RR (95 CI) Hrs/wk RR (95 CI)
0 1.00 0 1.00 0 1.00
1 0.89 (0.87-0.92) 1 0.88 (0.86-0.91) 1 0.84 (0.82-0.85)
2 0.81 (0.77-0.85) 2 0.79 (0.75-0.83) 2 0.72 (0.70-0.74)
3 0.75 (0.71-0.80) 3 0.73 (0.68-0.78) 3 0.64 (0.62-0.66)
4 0.71 (0.66-0.76) 4 0.69 (0.64-0.75) 4 0.59 (0.57-0.61)
5 0.68 (0.62-0.74) 5 0.66 (0.60-0.73) 5 0.55 (0.53-0.57)
6 0.65 (0.59-0.72) 6 0.63 (0.56-0.71) 6 0.52 (0.49-0.54)
7 0.63 (0.56-0.70) 7 0.61 (0.53-0.70) 7 0.49 (0.45-0.52)
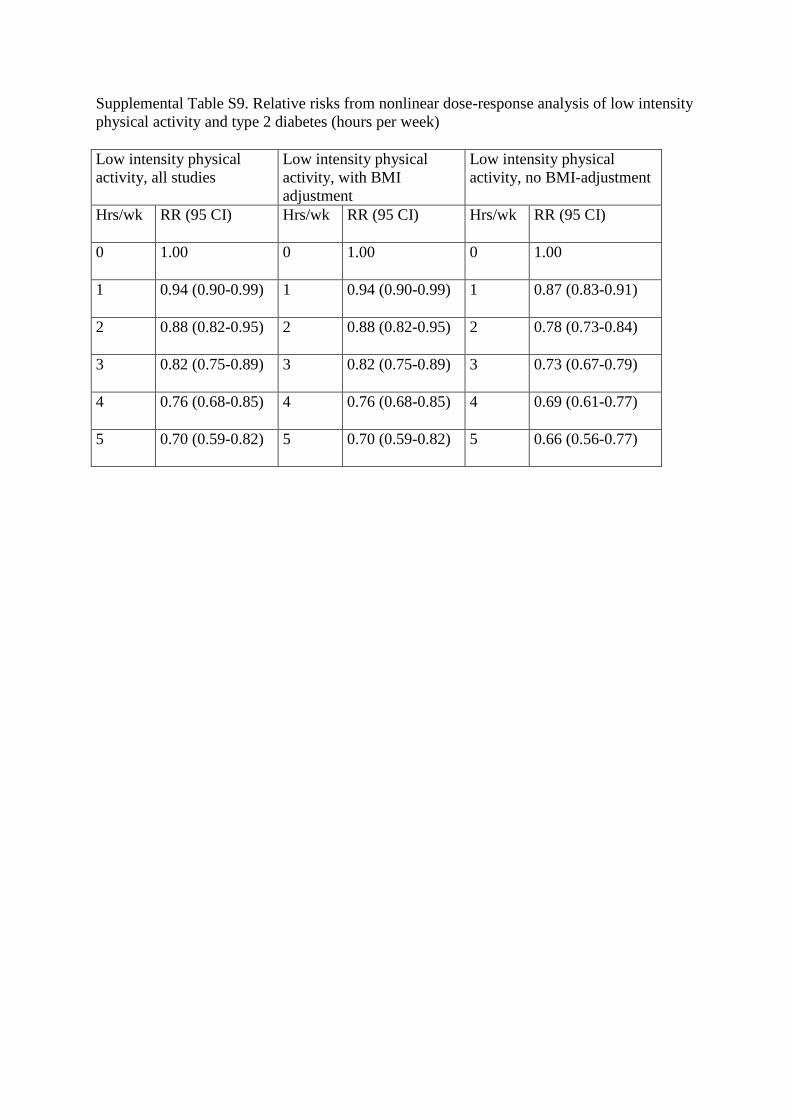
Supplemental Table S9. Relative risks from nonlinear dose-response analysis of low intensity
physical activity and type 2 diabetes (hours per week)
Low intensity physical
activity, all studies
Low intensity physical
activity, with BMI
adjustment
Low intensity physical
activity, no BMI-adjustment
Hrs/wk RR (95 CI) Hrs/wk RR (95 CI) Hrs/wk RR (95 CI)
0 1.00 0 1.00 0 1.00
1 0.94 (0.90-0.99) 1 0.94 (0.90-0.99) 1 0.87 (0.83-0.91)
2 0.88 (0.82-0.95) 2 0.88 (0.82-0.95) 2 0.78 (0.73-0.84)
3 0.82 (0.75-0.89) 3 0.82 (0.75-0.89) 3 0.73 (0.67-0.79)
4 0.76 (0.68-0.85) 4 0.76 (0.68-0.85) 4 0.69 (0.61-0.77)
5 0.70 (0.59-0.82) 5 0.70 (0.59-0.82) 5 0.66 (0.56-0.77)
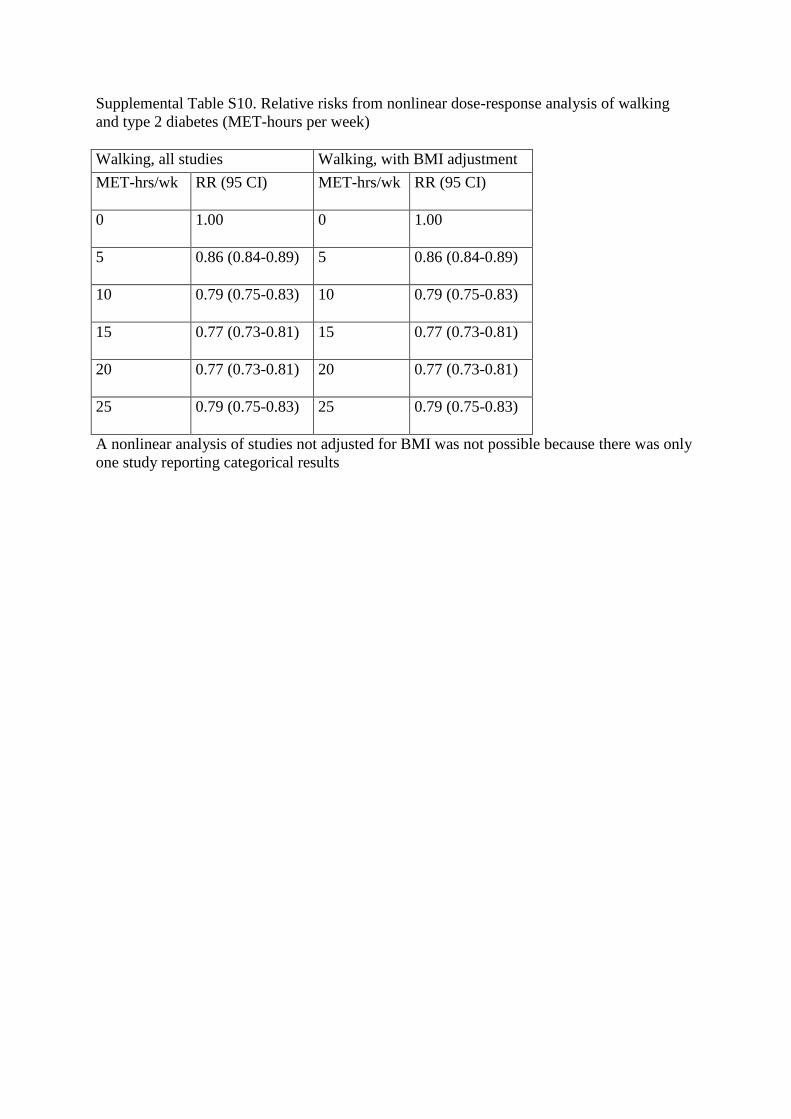
Supplemental Table S10. Relative risks from nonlinear dose-response analysis of walking
and type 2 diabetes (MET-hours per week)
Walking, all studies Walking, with BMI adjustment
MET-hrs/wk RR (95 CI) MET-hrs/wk RR (95 CI)
0 1.00 0 1.00
5 0.86 (0.84-0.89) 5 0.86 (0.84-0.89)
10 0.79 (0.75-0.83) 10 0.79 (0.75-0.83)
15 0.77 (0.73-0.81) 15 0.77 (0.73-0.81)
20 0.77 (0.73-0.81) 20 0.77 (0.73-0.81)
25 0.79 (0.75-0.83) 25 0.79 (0.75-0.83)
A nonlinear analysis of studies not adjusted for BMI was not possible because there was only
one study reporting categorical results
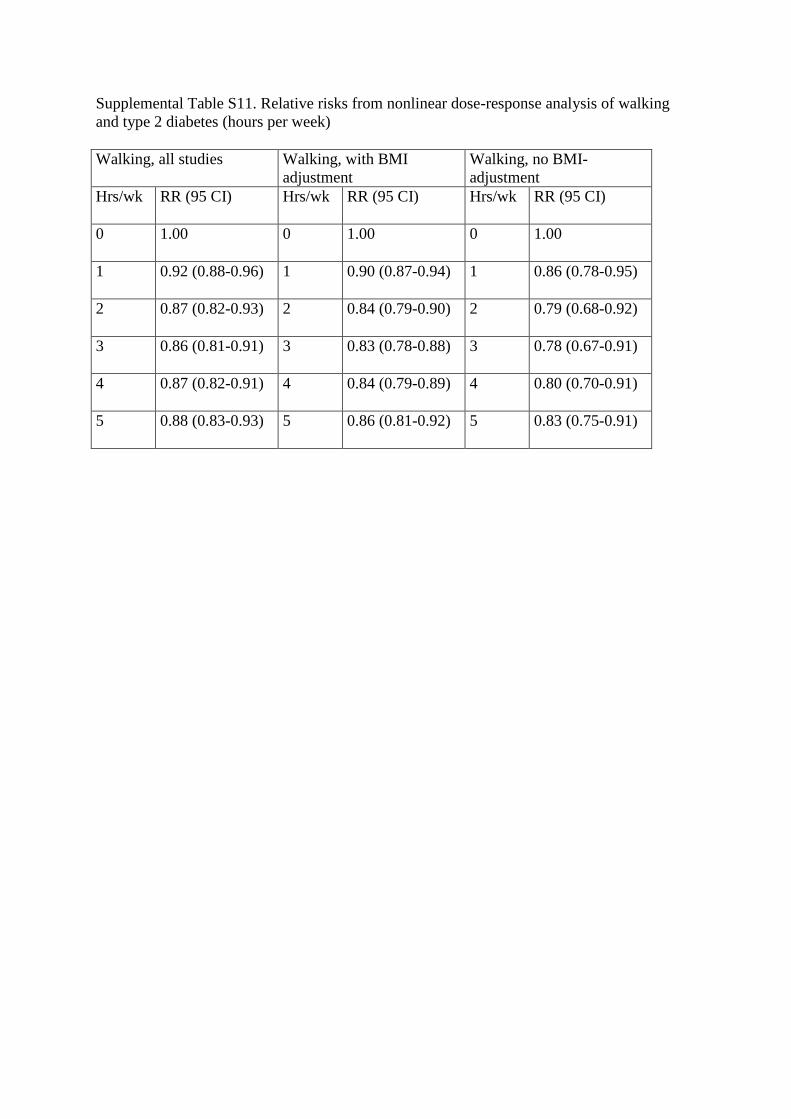
Supplemental Table S11. Relative risks from nonlinear dose-response analysis of walking
and type 2 diabetes (hours per week)
Walking, all studies Walking, with BMI
adjustment
Walking, no BMI-
adjustment
Hrs/wk RR (95 CI) Hrs/wk RR (95 CI) Hrs/wk RR (95 CI)
0 1.00 0 1.00 0 1.00
1 0.92 (0.88-0.96) 1 0.90 (0.87-0.94) 1 0.86 (0.78-0.95)
2 0.87 (0.82-0.93) 2 0.84 (0.79-0.90) 2 0.79 (0.68-0.92)
3 0.86 (0.81-0.91) 3 0.83 (0.78-0.88) 3 0.78 (0.67-0.91)
4 0.87 (0.82-0.91) 4 0.84 (0.79-0.89) 4 0.80 (0.70-0.91)
5 0.88 (0.83-0.93) 5 0.86 (0.81-0.92) 5 0.83 (0.75-0.91)
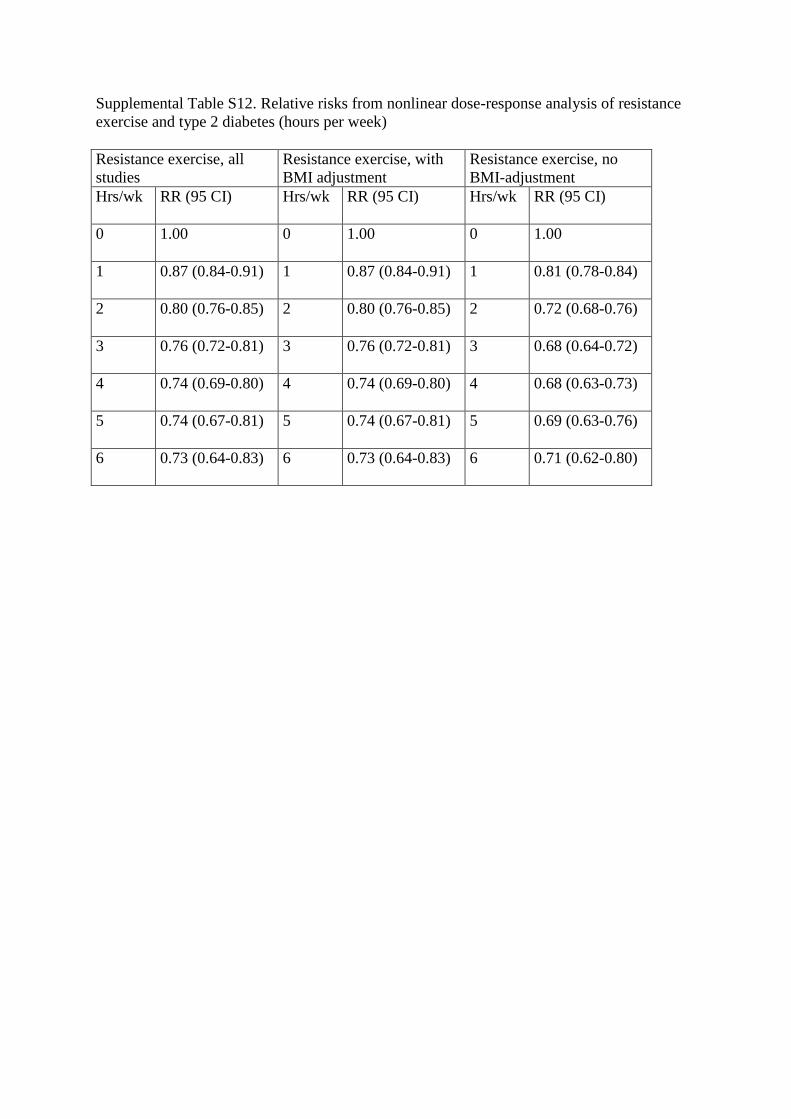
Supplemental Table S12. Relative risks from nonlinear dose-response analysis of resistance
exercise and type 2 diabetes (hours per week)
Resistance exercise, all
studies
Resistance exercise, with
BMI adjustment
Resistance exercise, no
BMI-adjustment
Hrs/wk RR (95 CI) Hrs/wk RR (95 CI) Hrs/wk RR (95 CI)
0 1.00 0 1.00 0 1.00
1 0.87 (0.84-0.91) 1 0.87 (0.84-0.91) 1 0.81 (0.78-0.84)
2 0.80 (0.76-0.85) 2 0.80 (0.76-0.85) 2 0.72 (0.68-0.76)
3 0.76 (0.72-0.81) 3 0.76 (0.72-0.81) 3 0.68 (0.64-0.72)
4 0.74 (0.69-0.80) 4 0.74 (0.69-0.80) 4 0.68 (0.63-0.73)
5 0.74 (0.67-0.81) 5 0.74 (0.67-0.81) 5 0.69 (0.63-0.76)
6 0.73 (0.64-0.83) 6 0.73 (0.64-0.83) 6 0.71 (0.62-0.80)
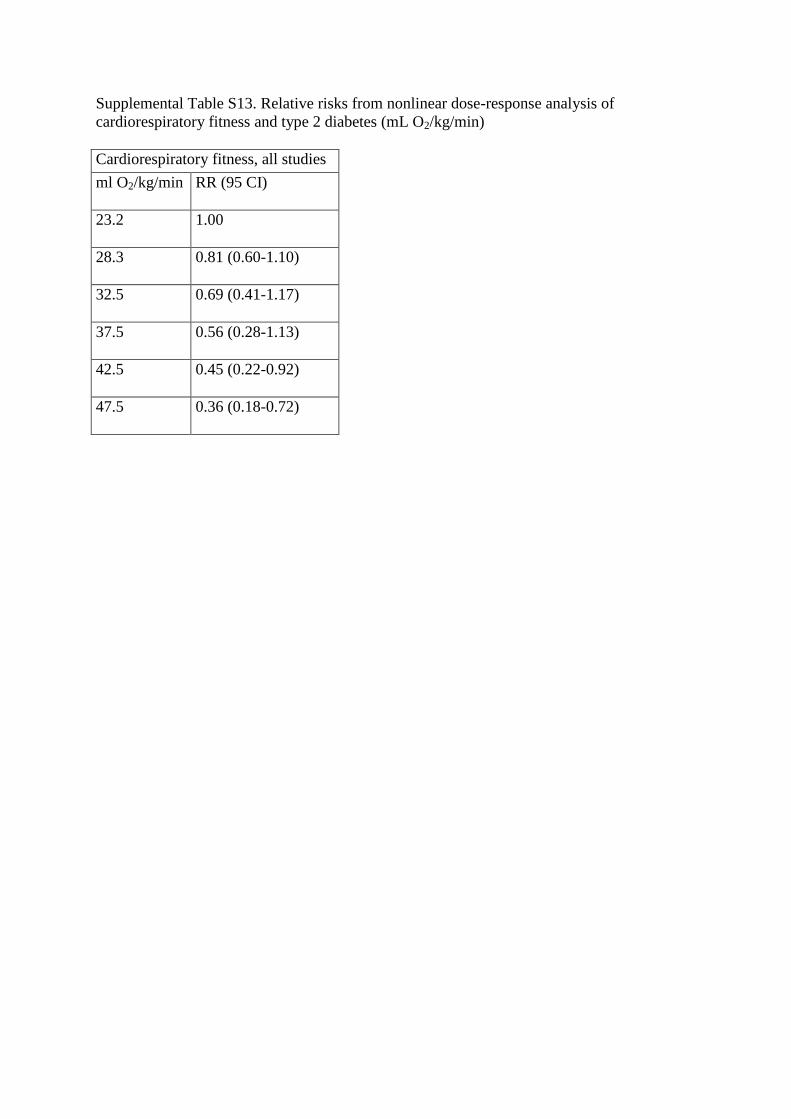
Supplemental Table S13. Relative risks from nonlinear dose-response analysis of
cardiorespiratory fitness and type 2 diabetes (mL O2/kg/min)
Cardiorespiratory fitness, all studies
ml O2/kg/min RR (95 CI)
23.2 1.00
28.3 0.81 (0.60-1.10)
32.5 0.69 (0.41-1.17)
37.5 0.56 (0.28-1.13)
42.5 0.45 (0.22-0.92)
47.5 0.36 (0.18-0.72)
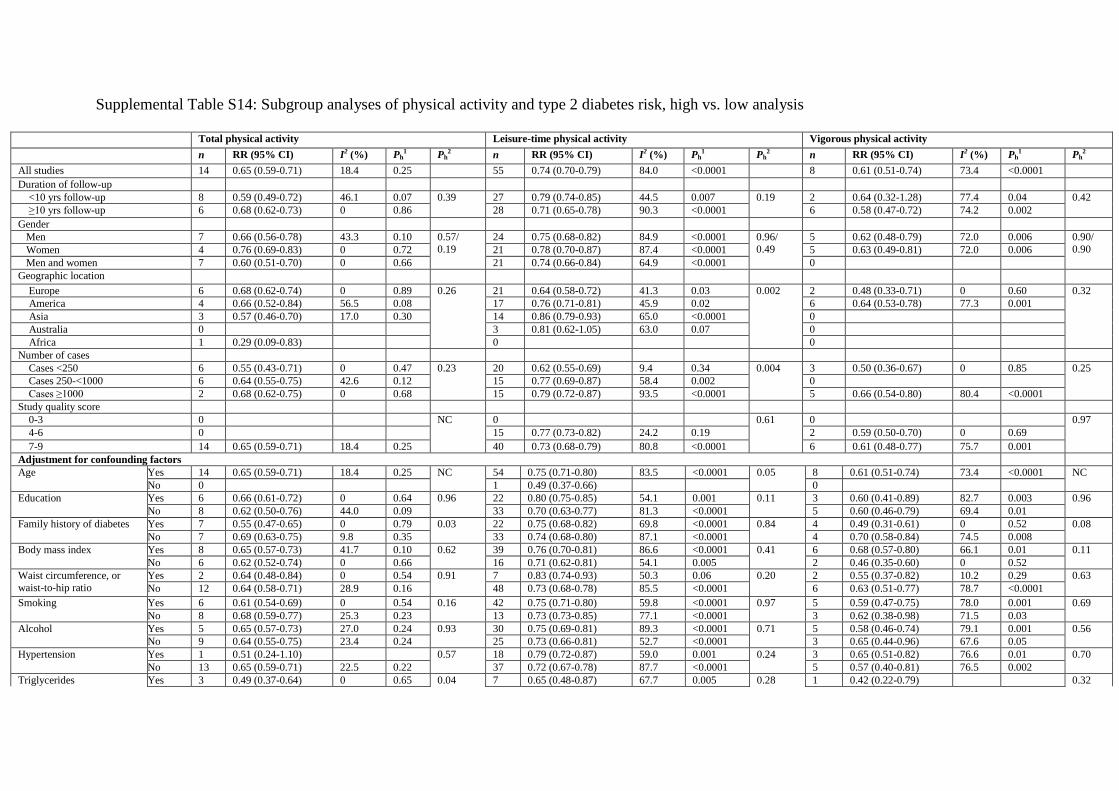
Supplemental Table S14: Subgroup analyses of physical activity and type 2 diabetes risk, high vs. low analysis
Total physical activity Leisure-time physical activity Vigorous physical activity
n RR (95% CI) I2 (%) Ph1 Ph
2 n RR (95% CI) I2 (%) Ph1 Ph
2 n RR (95% CI) I2 (%) Ph1 Ph
2
All studies 14 0.65 (0.59-0.71) 18.4 0.25 55 0.74 (0.70-0.79) 84.0 <0.0001 8 0.61 (0.51-0.74) 73.4 <0.0001
Duration of follow-up
<10 yrs follow-up 8 0.59 (0.49-0.72) 46.1 0.07 0.39 27 0.79 (0.74-0.85) 44.5 0.007 0.19 2 0.64 (0.32-1.28) 77.4 0.04 0.42
≥10 yrs follow-up 6 0.68 (0.62-0.73) 0 0.86 28 0.71 (0.65-0.78) 90.3 <0.0001 6 0.58 (0.47-0.72) 74.2 0.002
Gender
Men 7 0.66 (0.56-0.78) 43.3 0.10 0.57/
0.19
24 0.75 (0.68-0.82) 84.9 <0.0001 0.96/
0.49
5 0.62 (0.48-0.79) 72.0 0.006 0.90/
0.90 Women 4 0.76 (0.69-0.83) 0 0.72 21 0.78 (0.70-0.87) 87.4 <0.0001 5 0.63 (0.49-0.81) 72.0 0.006
Men and women 7 0.60 (0.51-0.70) 0 0.66 21 0.74 (0.66-0.84) 64.9 <0.0001 0
Geographic location
Europe 6 0.68 (0.62-0.74) 0 0.89 0.26 21 0.64 (0.58-0.72) 41.3 0.03 0.002 2 0.48 (0.33-0.71) 0 0.60 0.32
America 4 0.66 (0.52-0.84) 56.5 0.08 17 0.76 (0.71-0.81) 45.9 0.02 6 0.64 (0.53-0.78) 77.3 0.001
Asia 3 0.57 (0.46-0.70) 17.0 0.30 14 0.86 (0.79-0.93) 65.0 <0.0001 0
Australia 0 3 0.81 (0.62-1.05) 63.0 0.07 0
Africa 1 0.29 (0.09-0.83) 0 0
Number of cases
Cases <250 6 0.55 (0.43-0.71) 0 0.47 0.23 20 0.62 (0.55-0.69) 9.4 0.34 0.004 3 0.50 (0.36-0.67) 0 0.85 0.25
Cases 250-<1000 6 0.64 (0.55-0.75) 42.6 0.12 15 0.77 (0.69-0.87) 58.4 0.002 0
Cases ≥1000 2 0.68 (0.62-0.75) 0 0.68 15 0.79 (0.72-0.87) 93.5 <0.0001 5 0.66 (0.54-0.80) 80.4 <0.0001
Study quality score
0-3 0 NC 0 0.61 0 0.97
4-6 0 15 0.77 (0.73-0.82) 24.2 0.19 2 0.59 (0.50-0.70) 0 0.69
7-9 14 0.65 (0.59-0.71) 18.4 0.25 40 0.73 (0.68-0.79) 80.8 <0.0001 6 0.61 (0.48-0.77) 75.7 0.001
Adjustment for confounding factors
Age Yes 14 0.65 (0.59-0.71) 18.4 0.25 NC 54 0.75 (0.71-0.80) 83.5 <0.0001 0.05 8 0.61 (0.51-0.74) 73.4 <0.0001 NC
No 0 1 0.49 (0.37-0.66) 0
Education Yes 6 0.66 (0.61-0.72) 0 0.64 0.96 22 0.80 (0.75-0.85) 54.1 0.001 0.11 3 0.60 (0.41-0.89) 82.7 0.003 0.96
No 8 0.62 (0.50-0.76) 44.0 0.09 33 0.70 (0.63-0.77) 81.3 <0.0001 5 0.60 (0.46-0.79) 69.4 0.01
Family history of diabetes Yes 7 0.55 (0.47-0.65) 0 0.79 0.03 22 0.75 (0.68-0.82) 69.8 <0.0001 0.84 4 0.49 (0.31-0.61) 0 0.52 0.08
No 7 0.69 (0.63-0.75) 9.8 0.35 33 0.74 (0.68-0.80) 87.1 <0.0001 4 0.70 (0.58-0.84) 74.5 0.008
Body mass index Yes 8 0.65 (0.57-0.73) 41.7 0.10 0.62 39 0.76 (0.70-0.81) 86.6 <0.0001 0.41 6 0.68 (0.57-0.80) 66.1 0.01 0.11
No 6 0.62 (0.52-0.74) 0 0.66 16 0.71 (0.62-0.81) 54.1 0.005 2 0.46 (0.35-0.60) 0 0.52
Waist circumference, or
waist-to-hip ratio
Yes 2 0.64 (0.48-0.84) 0 0.54 0.91 7 0.83 (0.74-0.93) 50.3 0.06 0.20 2 0.55 (0.37-0.82) 10.2 0.29 0.63
No 12 0.64 (0.58-0.71) 28.9 0.16 48 0.73 (0.68-0.78) 85.5 <0.0001 6 0.63 (0.51-0.77) 78.7 <0.0001
Smoking
Yes 6 0.61 (0.54-0.69) 0 0.54 0.16 42 0.75 (0.71-0.80) 59.8 <0.0001 0.97 5 0.59 (0.47-0.75) 78.0 0.001 0.69
No 8 0.68 (0.59-0.77) 25.3 0.23 13 0.73 (0.73-0.85) 77.1 <0.0001 3 0.62 (0.38-0.98) 71.5 0.03
Alcohol Yes 5 0.65 (0.57-0.73) 27.0 0.24 0.93 30 0.75 (0.69-0.81) 89.3 <0.0001 0.71 5 0.58 (0.46-0.74) 79.1 0.001 0.56
No 9 0.64 (0.55-0.75) 23.4 0.24 25 0.73 (0.66-0.81) 52.7 <0.0001 3 0.65 (0.44-0.96) 67.6 0.05
Hypertension Yes 1 0.51 (0.24-1.10) 0.57 18 0.79 (0.72-0.87) 59.0 0.001 0.24 3 0.65 (0.51-0.82) 76.6 0.01 0.70
No 13 0.65 (0.59-0.71) 22.5 0.22 37 0.72 (0.67-0.78) 87.7 <0.0001 5 0.57 (0.40-0.81) 76.5 0.002
Triglycerides Yes 3 0.49 (0.37-0.64) 0 0.65 0.04 7 0.65 (0.48-0.87) 67.7 0.005 0.28 1 0.42 (0.22-0.79) 0.32
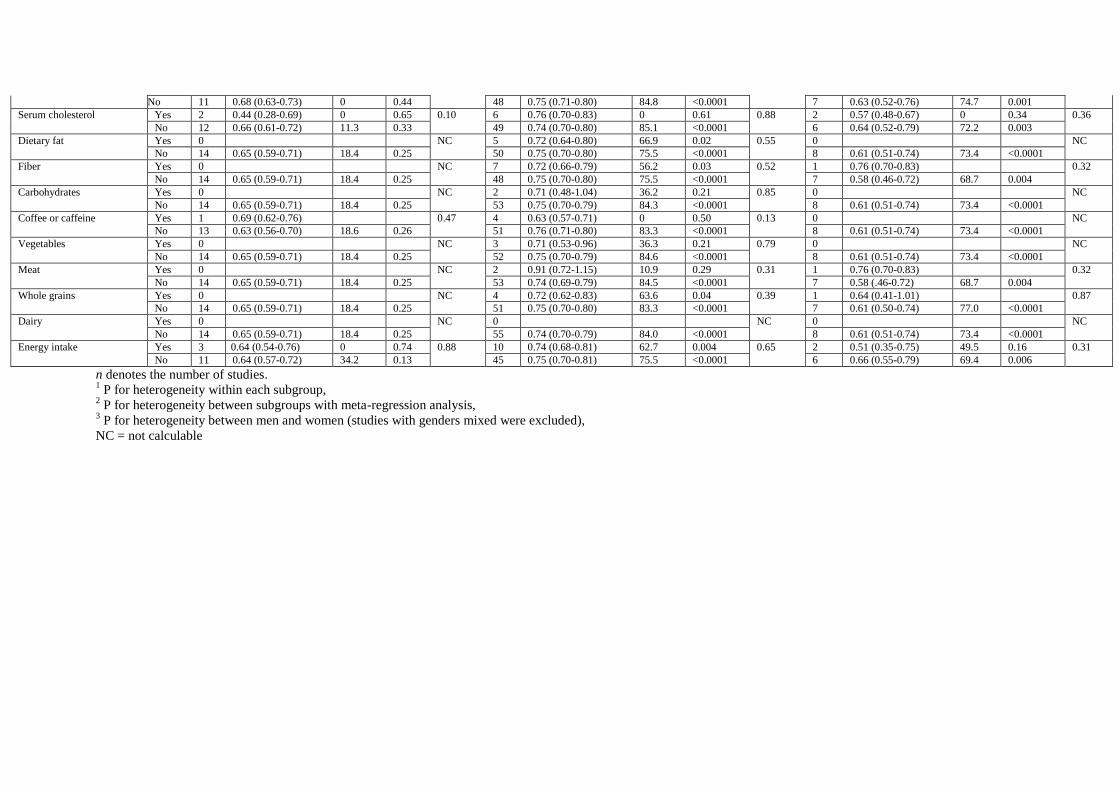
No 11 0.68 (0.63-0.73) 0 0.44 48 0.75 (0.71-0.80) 84.8 <0.0001 7 0.63 (0.52-0.76) 74.7 0.001
Serum cholesterol Yes 2 0.44 (0.28-0.69) 0 0.65 0.10 6 0.76 (0.70-0.83) 0 0.61 0.88 2 0.57 (0.48-0.67) 0 0.34 0.36
No 12 0.66 (0.61-0.72) 11.3 0.33 49 0.74 (0.70-0.80) 85.1 <0.0001 6 0.64 (0.52-0.79) 72.2 0.003
Dietary fat Yes 0 NC 5 0.72 (0.64-0.80) 66.9 0.02 0.55 0 NC
No 14 0.65 (0.59-0.71) 18.4 0.25 50 0.75 (0.70-0.80) 75.5 <0.0001 8 0.61 (0.51-0.74) 73.4 <0.0001
Fiber Yes 0 NC 7 0.72 (0.66-0.79) 56.2 0.03 0.52 1 0.76 (0.70-0.83) 0.32
No 14 0.65 (0.59-0.71) 18.4 0.25 48 0.75 (0.70-0.80) 75.5 <0.0001 7 0.58 (0.46-0.72) 68.7 0.004
Carbohydrates Yes 0 NC 2 0.71 (0.48-1.04) 36.2 0.21 0.85 0 NC
No 14 0.65 (0.59-0.71) 18.4 0.25 53 0.75 (0.70-0.79) 84.3 <0.0001 8 0.61 (0.51-0.74) 73.4 <0.0001
Coffee or caffeine Yes 1 0.69 (0.62-0.76) 0.47 4 0.63 (0.57-0.71) 0 0.50 0.13 0 NC
No 13 0.63 (0.56-0.70) 18.6 0.26 51 0.76 (0.71-0.80) 83.3 <0.0001 8 0.61 (0.51-0.74) 73.4 <0.0001
Vegetables Yes 0 NC 3 0.71 (0.53-0.96) 36.3 0.21 0.79 0 NC
No 14 0.65 (0.59-0.71) 18.4 0.25 52 0.75 (0.70-0.79) 84.6 <0.0001 8 0.61 (0.51-0.74) 73.4 <0.0001
Meat Yes 0 NC 2 0.91 (0.72-1.15) 10.9 0.29 0.31 1 0.76 (0.70-0.83) 0.32
No 14 0.65 (0.59-0.71) 18.4 0.25 53 0.74 (0.69-0.79) 84.5 <0.0001 7 0.58 (.46-0.72) 68.7 0.004
Whole grains Yes 0 NC 4 0.72 (0.62-0.83) 63.6 0.04 0.39 1 0.64 (0.41-1.01) 0.87
No 14 0.65 (0.59-0.71) 18.4 0.25 51 0.75 (0.70-0.80) 83.3 <0.0001 7 0.61 (0.50-0.74) 77.0 <0.0001
Dairy Yes 0 NC 0 NC 0 NC
No 14 0.65 (0.59-0.71) 18.4 0.25 55 0.74 (0.70-0.79) 84.0 <0.0001 8 0.61 (0.51-0.74) 73.4 <0.0001
Energy intake Yes 3 0.64 (0.54-0.76) 0 0.74 0.88 10 0.74 (0.68-0.81) 62.7 0.004 0.65 2 0.51 (0.35-0.75) 49.5 0.16 0.31
No 11 0.64 (0.57-0.72) 34.2 0.13 45 0.75 (0.70-0.81) 75.5 <0.0001 6 0.66 (0.55-0.79) 69.4 0.006
n denotes the number of studies. 1 P for heterogeneity within each subgroup,
2 P for heterogeneity between subgroups with meta-regression analysis,
3 P for heterogeneity between men and women (studies with genders mixed were excluded),
NC = not calculable
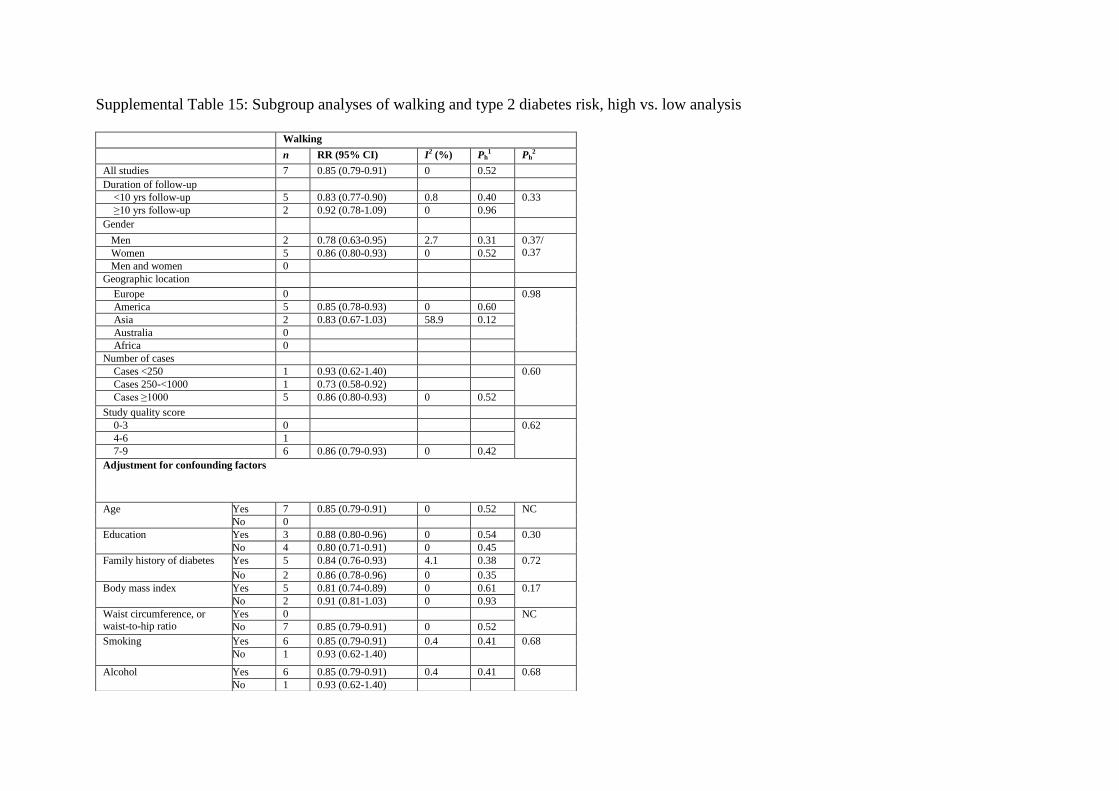
Supplemental Table 15: Subgroup analyses of walking and type 2 diabetes risk, high vs. low analysis
Walking
n RR (95% CI) I2 (%) Ph1 Ph
2
All studies 7 0.85 (0.79-0.91) 0 0.52
Duration of follow-up
<10 yrs follow-up 5 0.83 (0.77-0.90) 0.8 0.40 0.33
≥10 yrs follow-up 2 0.92 (0.78-1.09) 0 0.96
Gender
Men 2 0.78 (0.63-0.95) 2.7 0.31 0.37/
0.37 Women 5 0.86 (0.80-0.93) 0 0.52
Men and women 0
Geographic location
Europe 0 0.98
America 5 0.85 (0.78-0.93) 0 0.60
Asia 2 0.83 (0.67-1.03) 58.9 0.12
Australia 0
Africa 0
Number of cases
Cases <250 1 0.93 (0.62-1.40) 0.60
Cases 250-<1000 1 0.73 (0.58-0.92)
Cases ≥1000 5 0.86 (0.80-0.93) 0 0.52
Study quality score
0-3 0 0.62
4-6 1
7-9 6 0.86 (0.79-0.93) 0 0.42
Adjustment for confounding factors
Age Yes 7 0.85 (0.79-0.91) 0 0.52 NC
No 0
Education Yes 3 0.88 (0.80-0.96) 0 0.54 0.30
No 4 0.80 (0.71-0.91) 0 0.45
Family history of diabetes Yes 5 0.84 (0.76-0.93) 4.1 0.38 0.72
No 2 0.86 (0.78-0.96) 0 0.35
Body mass index Yes 5 0.81 (0.74-0.89) 0 0.61 0.17
No 2 0.91 (0.81-1.03) 0 0.93
Waist circumference, or waist-to-hip ratio
Yes 0 NC
No 7 0.85 (0.79-0.91) 0 0.52
Smoking
Yes 6 0.85 (0.79-0.91) 0.4 0.41 0.68
No 1 0.93 (0.62-1.40)
Alcohol Yes 6 0.85 (0.79-0.91) 0.4 0.41 0.68
No 1 0.93 (0.62-1.40)
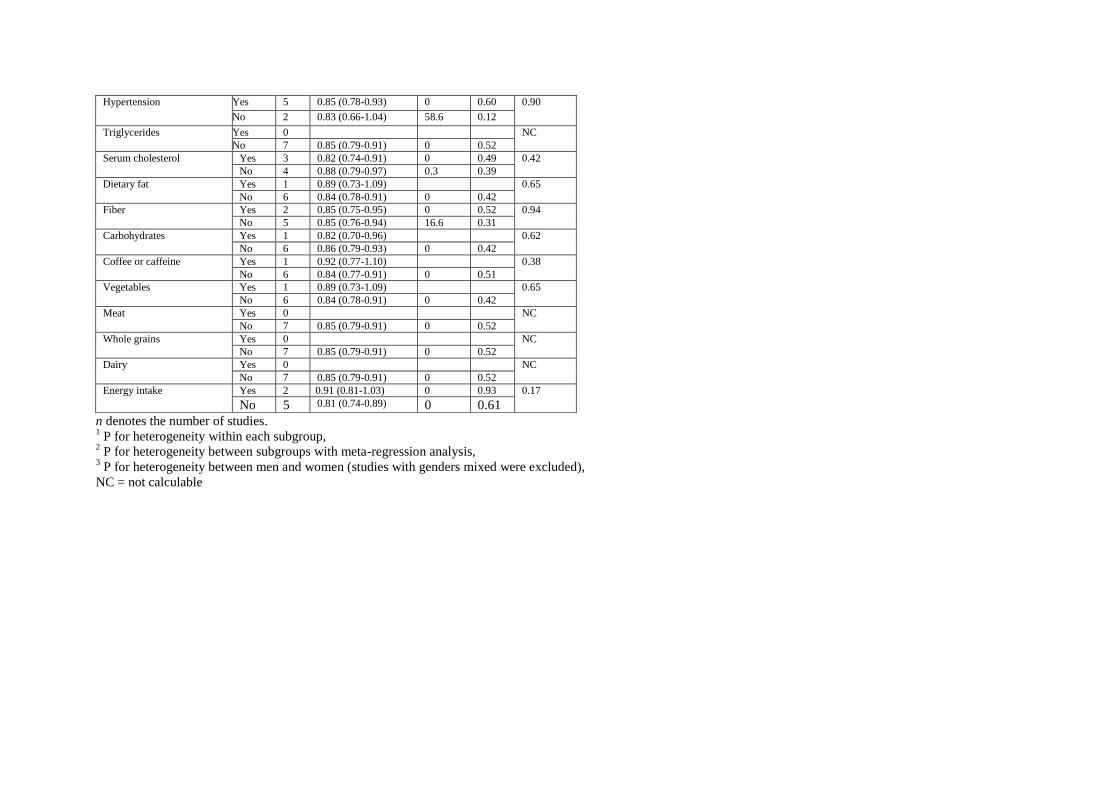
n denotes the number of studies. 1 P for heterogeneity within each subgroup,
2 P for heterogeneity between subgroups with meta-regression analysis,
3 P for heterogeneity between men and women (studies with genders mixed were excluded),
NC = not calculable
Hypertension Yes 5 0.85 (0.78-0.93) 0 0.60 0.90
No 2 0.83 (0.66-1.04) 58.6 0.12
Triglycerides
Yes 0 NC
No 7 0.85 (0.79-0.91) 0 0.52
Serum cholesterol Yes 3 0.82 (0.74-0.91) 0 0.49 0.42
No 4 0.88 (0.79-0.97) 0.3 0.39
Dietary fat Yes 1 0.89 (0.73-1.09) 0.65
No 6 0.84 (0.78-0.91) 0 0.42
Fiber Yes 2 0.85 (0.75-0.95) 0 0.52 0.94
No 5 0.85 (0.76-0.94) 16.6 0.31
Carbohydrates Yes 1 0.82 (0.70-0.96) 0.62
No 6 0.86 (0.79-0.93) 0 0.42
Coffee or caffeine Yes 1 0.92 (0.77-1.10) 0.38
No 6 0.84 (0.77-0.91) 0 0.51
Vegetables Yes 1 0.89 (0.73-1.09) 0.65
No 6 0.84 (0.78-0.91) 0 0.42
Meat Yes 0 NC
No 7 0.85 (0.79-0.91) 0 0.52
Whole grains Yes 0 NC
No 7 0.85 (0.79-0.91) 0 0.52
Dairy Yes 0 NC
No 7 0.85 (0.79-0.91) 0 0.52
Energy intake Yes 2 0.91 (0.81-1.03) 0 0.93 0.17
No 5 0.81 (0.74-0.89) 0 0.61
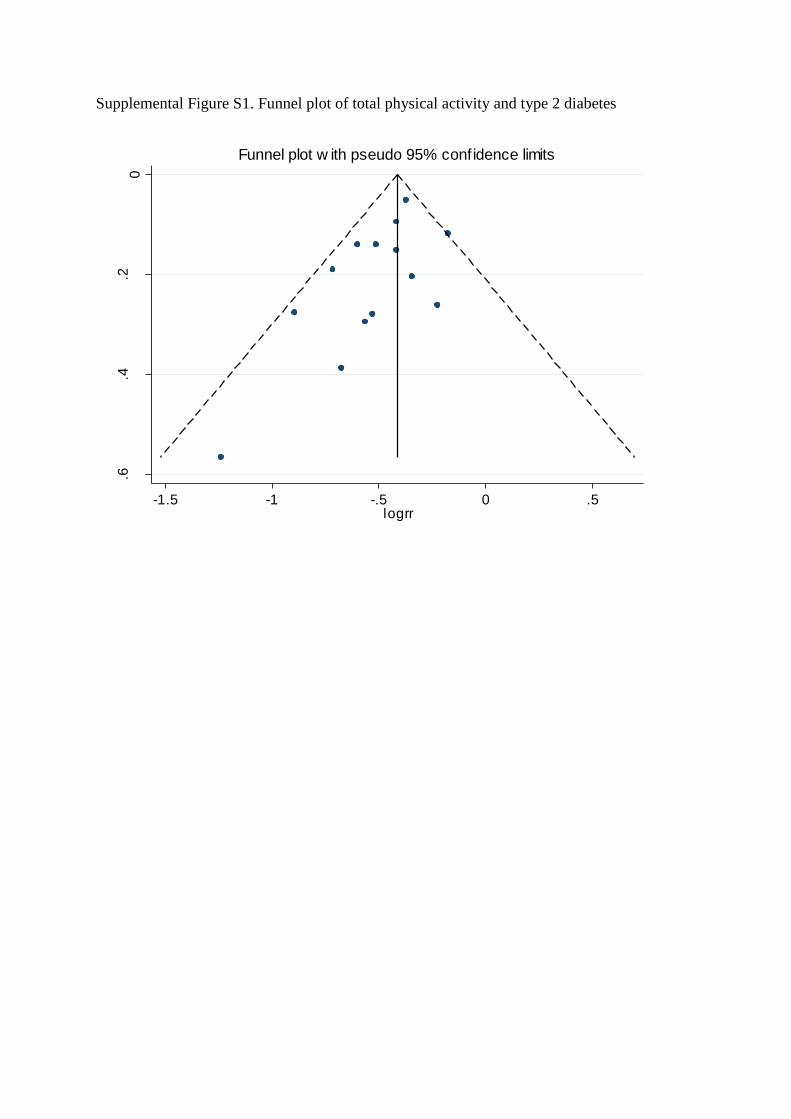
Supplemental Figure S1. Funnel plot of total physical activity and type 2 diabetes
0.2
.4.6
s.e
. o
f lo
grr
-1.5 -1 -.5 0 .5logrr
Funnel plot w ith pseudo 95% confidence limits
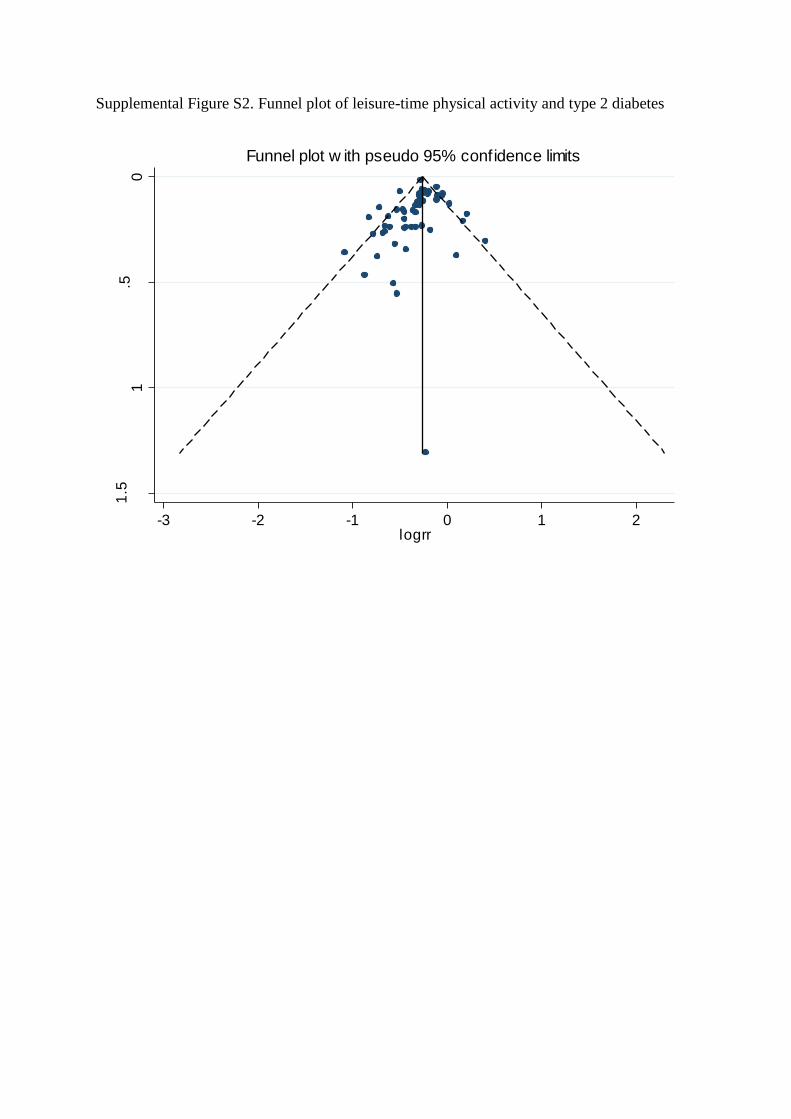
Supplemental Figure S2. Funnel plot of leisure-time physical activity and type 2 diabetes
0.5
11
.5
s.e
. o
f lo
grr
-3 -2 -1 0 1 2logrr
Funnel plot w ith pseudo 95% confidence limits

Supplemental Figure S3. Leisure-time physical activity and type 2 diabetes, dose-response analysis with and without BMI adjustment
A
B Leisure-time physical activity and type 2 diabetes (with BMI adjustment), nonlinear dose-response analysis, hours/week
Relative Risk .25 .5 .75 1 1.5 2
Study
Relative Risk
(95% CI)
Grøntved, 2014, NHS1 0.59 ( 0.44, 0.82)
Grøntved, 2014, NHS2 0.82 ( 0.62, 1.05)
Grøntved, 2012 0.66 ( 0.61, 0.72)
Lee, 2012 0.92 ( 0.89, 0.94)
Magliano, 2008 0.55 ( 0.35, 0.85)
Carlsson, 2007 0.55 ( 0.43, 0.70)
Schulze, 2007 0.92 ( 0.87, 0.98)
Okada, 2000 0.45 ( 0.27, 0.75)
Monterrosa, 1995 1.00 ( 0.56, 1.80)
Overall 0.73 ( 0.64, 0.83)
.4
.6
.8
1
RR
0 1 2 3 4 5 6 7Leisure-time physical activity (hrs/wk)
Best fitting cubic spline
95% confidence interval
Leisure-time physical activity and type 2 diabetes (with BMI adjustment), linear dose-response analysis per 5 hrs/week
C
D
Relative Risk
.25 .5 .75 1 1.5 2
Study
Relative Risk
(95% CI)
Grøntved, 2014, NHS1 0.59 ( 0.47, 0.73)
Grøntved, 2014, NHS2 0.66 ( 0.53, 0.86)
Grøntved, 2012 0.56 ( 0.51, 0.61)
Villegas, 2006 0.89 ( 0.77, 1.02)
Overall 0.67 ( 0.52, 0.85)
Leisure-time physical activity and type 2 diabetes (no BMI adjustment), linear dose-response analysis per 5 hrs/week
.4
.6
.8
1
RR
0 1 2 3 4 5 6 7Leisure-time physical activity (hrs/wk)
Best fitting cubic spline
95% confidence interval
Leisure-time physical activity and type 2 diabetes (no BMI adjustment), nonlinear dose-response analysis, hours/week
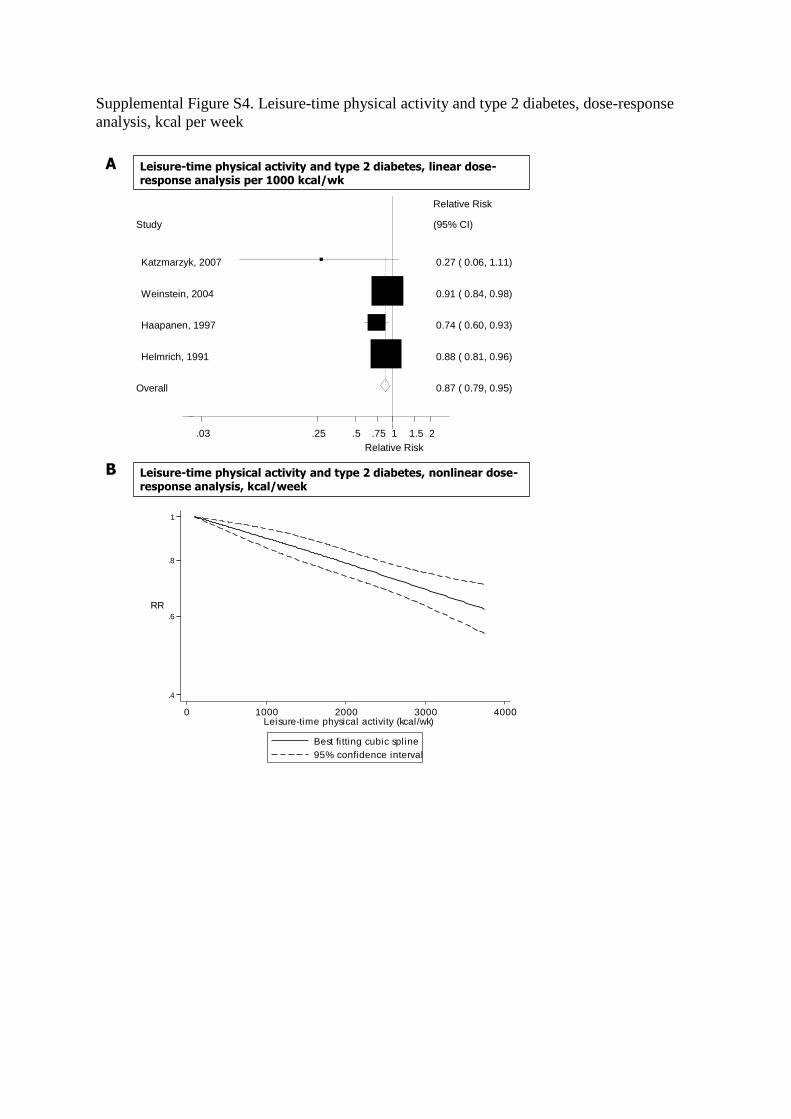
Supplemental Figure S4. Leisure-time physical activity and type 2 diabetes, dose-response
analysis, kcal per week
A
B Leisure-time physical activity and type 2 diabetes, nonlinear dose-response analysis, kcal/week
.4
.6
.8
1
RR
0 1000 2000 3000 4000Leisure-time physical activity (kcal/wk)
Best fitting cubic spline
95% confidence interval
Relative Risk
.03 .25 .5 .75 1 1.5 2
Study
Relative Risk
(95% CI)
Katzmarzyk, 2007 0.27 ( 0.06, 1.11)
Weinstein, 2004 0.91 ( 0.84, 0.98)
Haapanen, 1997 0.74 ( 0.60, 0.93)
Helmrich, 1991 0.88 ( 0.81, 0.96)
Overall 0.87 ( 0.79, 0.95)
Leisure-time physical activity and type 2 diabetes, linear dose-response analysis per 1000 kcal/wk
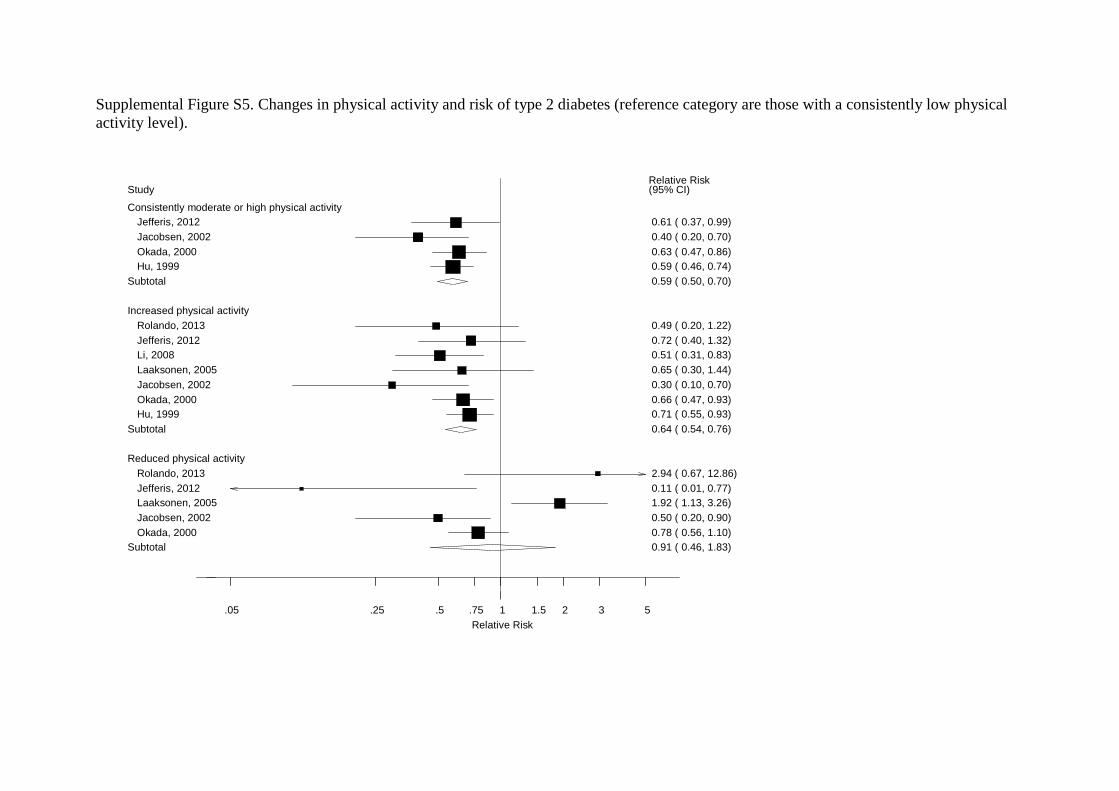
Supplemental Figure S5. Changes in physical activity and risk of type 2 diabetes (reference category are those with a consistently low physical
activity level).
Relative Risk
.05 .25 .5 .75 1 1.5 2 3 5
Study Relative Risk (95% CI)
Consistently moderate or high physical activity
Jefferis, 2012 0.61 ( 0.37, 0.99)
Jacobsen, 2002 0.40 ( 0.20, 0.70)
Okada, 2000 0.63 ( 0.47, 0.86)
Hu, 1999 0.59 ( 0.46, 0.74)
Subtotal 0.59 ( 0.50, 0.70)
Increased physical activity
Rolando, 2013 0.49 ( 0.20, 1.22)
Jefferis, 2012 0.72 ( 0.40, 1.32)
Li, 2008 0.51 ( 0.31, 0.83)
Laaksonen, 2005 0.65 ( 0.30, 1.44)
Jacobsen, 2002 0.30 ( 0.10, 0.70)
Okada, 2000 0.66 ( 0.47, 0.93)
Hu, 1999 0.71 ( 0.55, 0.93)
Subtotal 0.64 ( 0.54, 0.76)
Reduced physical activity
Rolando, 2013 2.94 ( 0.67, 12.86)
Jefferis, 2012 0.11 ( 0.01, 0.77)
Laaksonen, 2005 1.92 ( 1.13, 3.26)
Jacobsen, 2002 0.50 ( 0.20, 0.90)
Okada, 2000 0.78 ( 0.56, 1.10)
Subtotal 0.91 ( 0.46, 1.83)
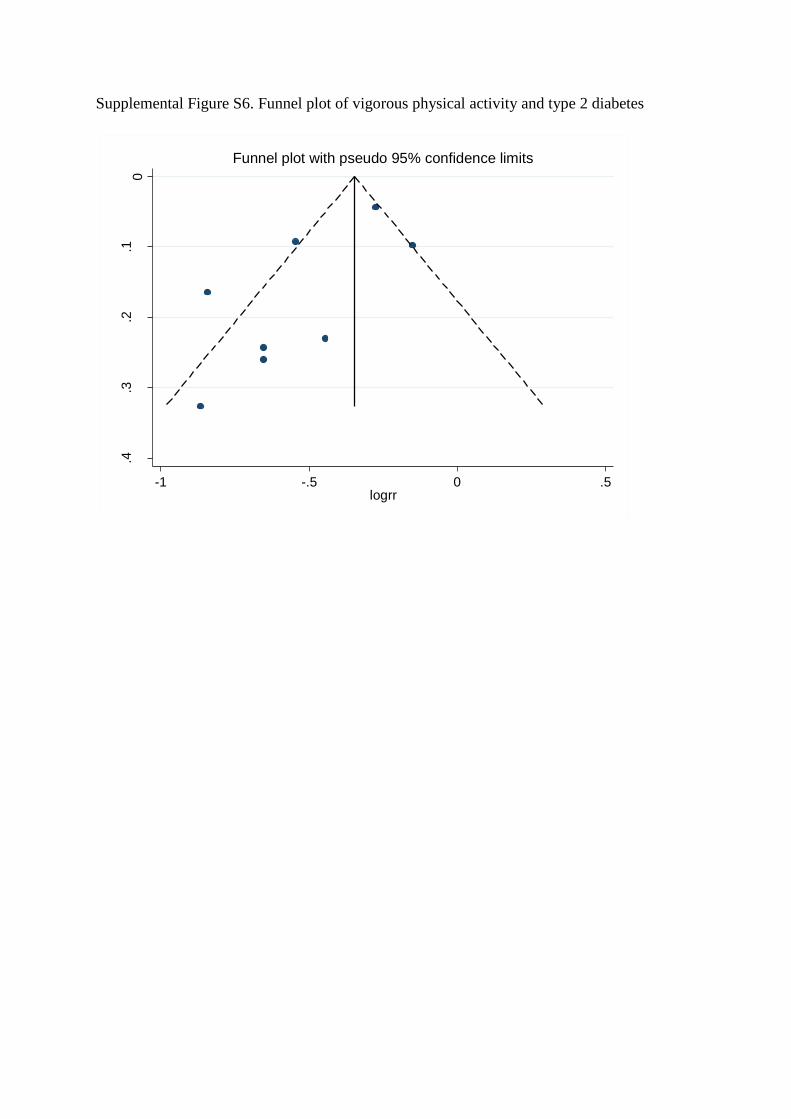
Supplemental Figure S6. Funnel plot of vigorous physical activity and type 2 diabetes
0.1
.2.3
.4
s.e
. o
f lo
grr
-1 -.5 0 .5logrr
Funnel plot with pseudo 95% confidence limits
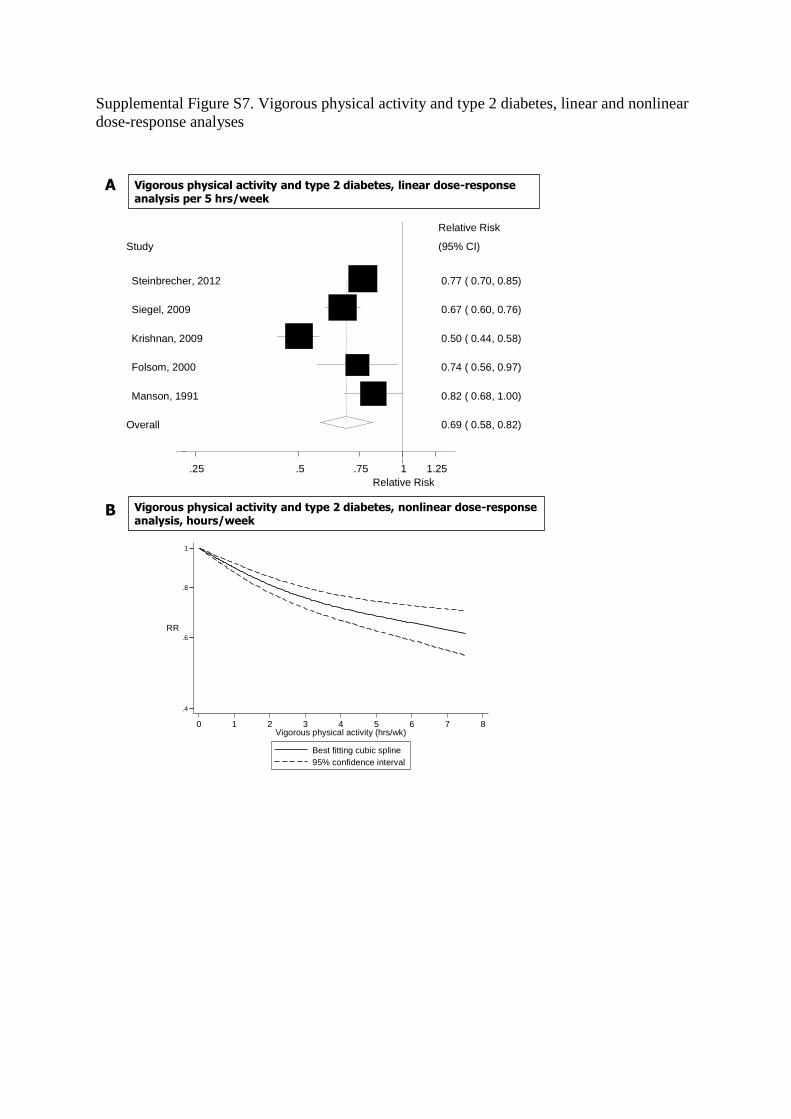
Supplemental Figure S7. Vigorous physical activity and type 2 diabetes, linear and nonlinear
dose-response analyses
A
B
Relative Risk
.25 .5 .75 1 1.25
Study
Relative Risk
(95% CI)
Steinbrecher, 2012 0.77 ( 0.70, 0.85)
Siegel, 2009 0.67 ( 0.60, 0.76)
Krishnan, 2009 0.50 ( 0.44, 0.58)
Folsom, 2000 0.74 ( 0.56, 0.97)
Manson, 1991 0.82 ( 0.68, 1.00)
Overall 0.69 ( 0.58, 0.82)
Vigorous physical activity and type 2 diabetes, linear dose-response analysis per 5 hrs/week
.4
.6
.8
1
RR
0 1 2 3 4 5 6 7 8Vigorous physical activity (hrs/wk)
Best fitting cubic spline
95% confidence interval
Vigorous physical activity and type 2 diabetes, nonlinear dose-response analysis, hours/week
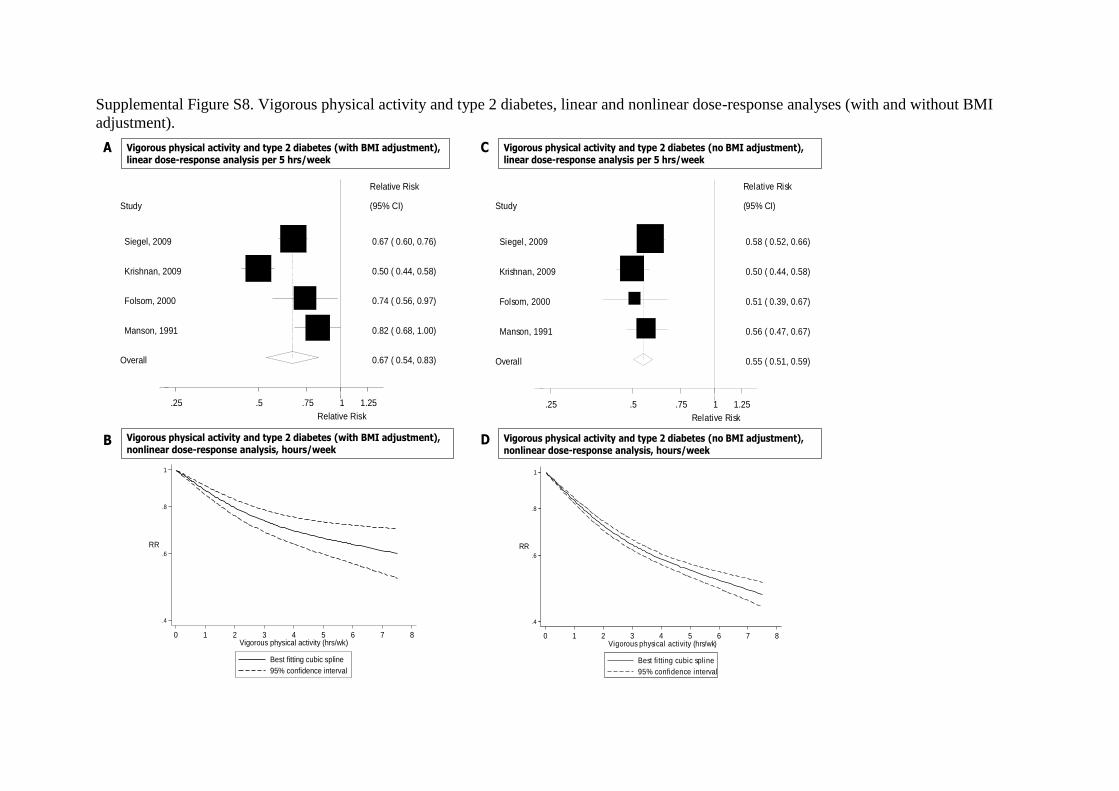
Supplemental Figure S8. Vigorous physical activity and type 2 diabetes, linear and nonlinear dose-response analyses (with and without BMI
adjustment).
A
B
Relative Risk
.25 .5 .75 1 1.25
Study
Relative Risk
(95% CI)
Siegel, 2009 0.67 ( 0.60, 0.76)
Krishnan, 2009 0.50 ( 0.44, 0.58)
Folsom, 2000 0.74 ( 0.56, 0.97)
Manson, 1991 0.82 ( 0.68, 1.00)
Overall 0.67 ( 0.54, 0.83)
Vigorous physical activity and type 2 diabetes (with BMI adjustment), linear dose-response analysis per 5 hrs/week
.4
.6
.8
1
RR
0 1 2 3 4 5 6 7 8Vigorous physical activity (hrs/wk)
Best fitting cubic spline
95% confidence interval
Vigorous physical activity and type 2 diabetes (with BMI adjustment), nonlinear dose-response analysis, hours/week
C
D
.4
.6
.8
1
RR
0 1 2 3 4 5 6 7 8Vigorous physical activity (hrs/wk)
Best fitting cubic spline
95% confidence interval
Vigorous physical activity and type 2 diabetes (no BMI adjustment), nonlinear dose-response analysis, hours/week
Relative Risk
.25 .5 .75 1 1.25
Study
Relative Risk
(95% CI)
Siegel, 2009 0.58 ( 0.52, 0.66)
Krishnan, 2009 0.50 ( 0.44, 0.58)
Folsom, 2000 0.51 ( 0.39, 0.67)
Manson, 1991 0.56 ( 0.47, 0.67)
Overall 0.55 ( 0.51, 0.59)
Vigorous physical activity and type 2 diabetes (no BMI adjustment), linear dose-response analysis per 5 hrs/week
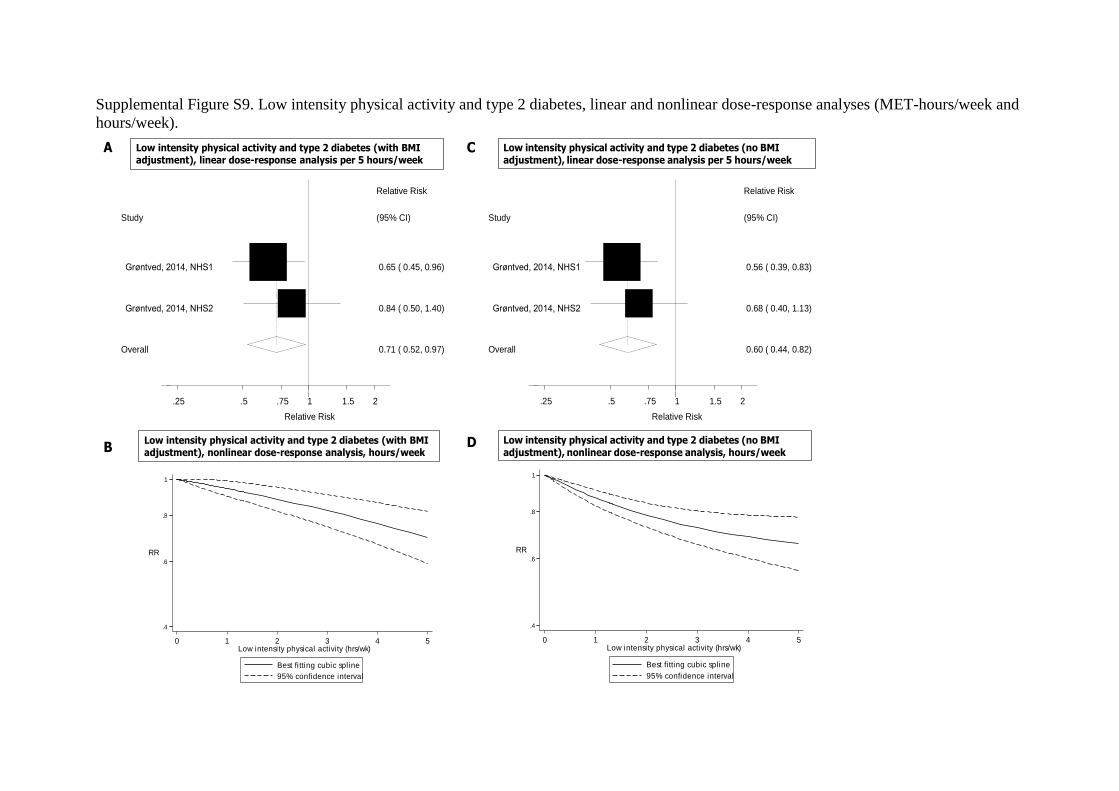
Supplemental Figure S9. Low intensity physical activity and type 2 diabetes, linear and nonlinear dose-response analyses (MET-hours/week and
hours/week).
A
B
.4
.6
.8
1
RR
0 1 2 3 4 5Low intensity physical activity (hrs/wk)
Best fitting cubic spline
95% confidence interval
Low intensity physical activity and type 2 diabetes (with BMI adjustment), nonlinear dose-response analysis, hours/week
Relative Risk
.25 .5 .75 1 1.5 2
Study
Relative Risk
(95% CI)
Grøntved, 2014, NHS1 0.65 ( 0.45, 0.96)
Grøntved, 2014, NHS2 0.84 ( 0.50, 1.40)
Overall 0.71 ( 0.52, 0.97)
Low intensity physical activity and type 2 diabetes (with BMI adjustment), linear dose-response analysis per 5 hours/week
C
D
.4
.6
.8
1
RR
0 1 2 3 4 5Low intensity physical activity (hrs/wk)
Best fitting cubic spline
95% confidence interval
Low intensity physical activity and type 2 diabetes (no BMI adjustment), nonlinear dose-response analysis, hours/week
Relative Risk
.25 .5 .75 1 1.5 2
Study
Relative Risk
(95% CI)
Grøntved, 2014, NHS1 0.56 ( 0.39, 0.83)
Grøntved, 2014, NHS2 0.68 ( 0.40, 1.13)
Overall 0.60 ( 0.44, 0.82)
Low intensity physical activity and type 2 diabetes (no BMI adjustment), linear dose-response analysis per 5 hours/week
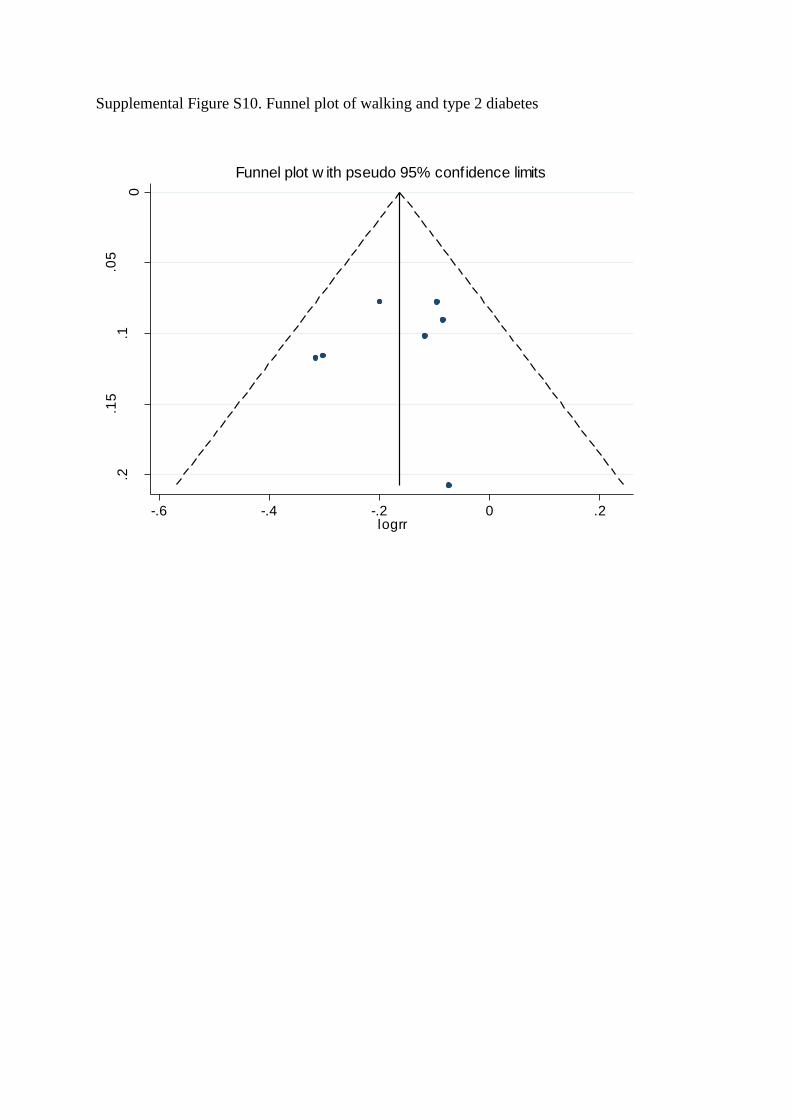
Supplemental Figure S10. Funnel plot of walking and type 2 diabetes
0
.05
.1.1
5.2
s.e
. o
f lo
grr
-.6 -.4 -.2 0 .2logrr
Funnel plot w ith pseudo 95% confidence limits
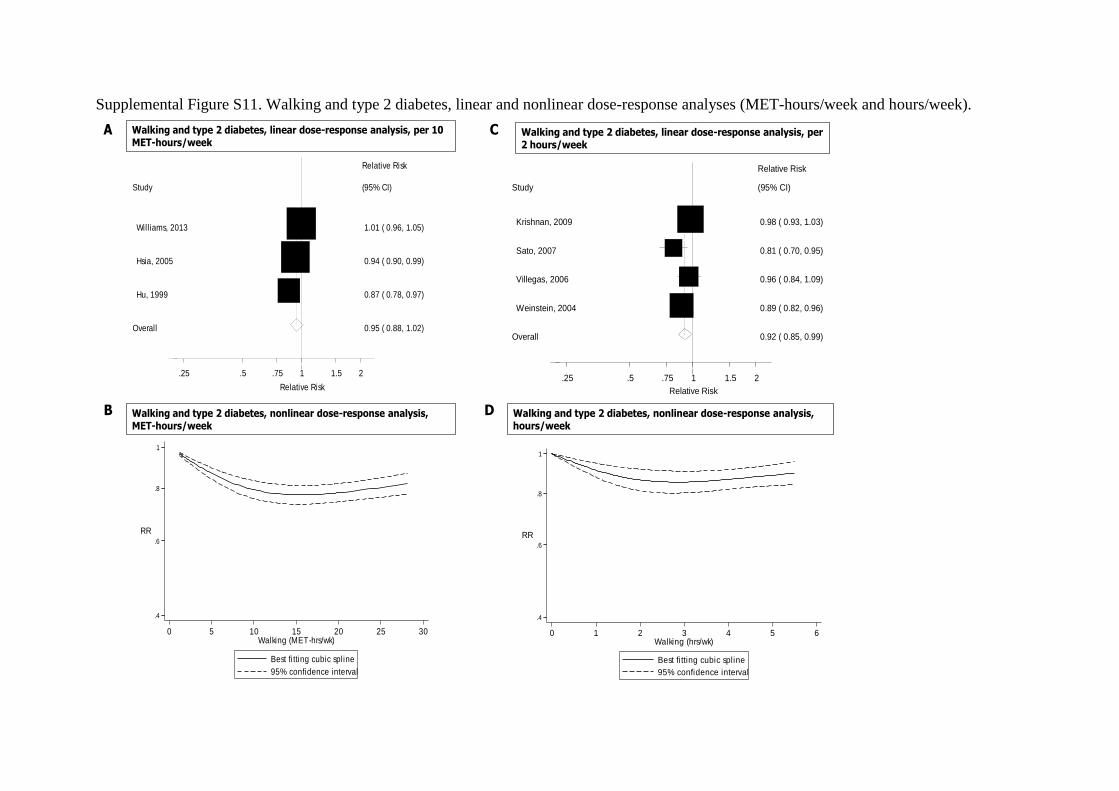
Supplemental Figure S11. Walking and type 2 diabetes, linear and nonlinear dose-response analyses (MET-hours/week and hours/week).
A
B
Relative Risk
.25 .5 .75 1 1.5 2
Study
Relative Risk
(95% CI)
Williams, 2013 1.01 ( 0.96, 1.05)
Hsia, 2005 0.94 ( 0.90, 0.99)
Hu, 1999 0.87 ( 0.78, 0.97)
Overall 0.95 ( 0.88, 1.02)
Walking and type 2 diabetes, linear dose-response analysis, per 10 MET-hours/week
.4
.6
.8
1
RR
0 5 10 15 20 25 30Walking (MET-hrs/wk)
Best fitting cubic spline
95% confidence interval
Walking and type 2 diabetes, nonlinear dose-response analysis, MET-hours/week
C
D Walking and type 2 diabetes, nonlinear dose-response analysis, hours/week
.4
.6
.8
1
RR
0 1 2 3 4 5 6Walking (hrs/wk)
Best fitting cubic spline
95% confidence interval
Relative Risk
.25 .5 .75 1 1.5 2
Study
Relative Risk
(95% CI)
Krishnan, 2009 0.98 ( 0.93, 1.03)
Sato, 2007 0.81 ( 0.70, 0.95)
Villegas, 2006 0.96 ( 0.84, 1.09)
Weinstein, 2004 0.89 ( 0.82, 0.96)
Overall 0.92 ( 0.85, 0.99)
Walking and type 2 diabetes, linear dose-response analysis, per 2 hours/week
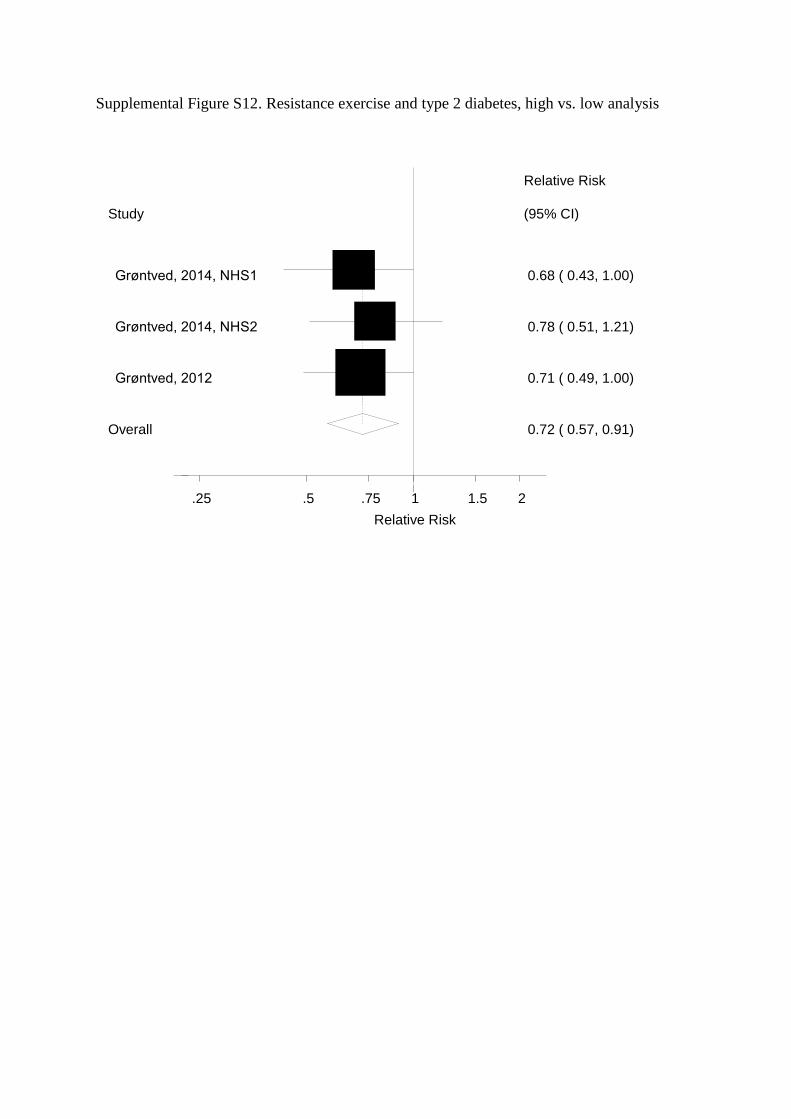
Supplemental Figure S12. Resistance exercise and type 2 diabetes, high vs. low analysis
Relative Risk
.25 .5 .75 1 1.5 2
Study
Relative Risk
(95% CI)
Grøntved, 2014, NHS1 0.68 ( 0.43, 1.00)
Grøntved, 2014, NHS2 0.78 ( 0.51, 1.21)
Grøntved, 2012 0.71 ( 0.49, 1.00)
Overall 0.72 ( 0.57, 0.91)
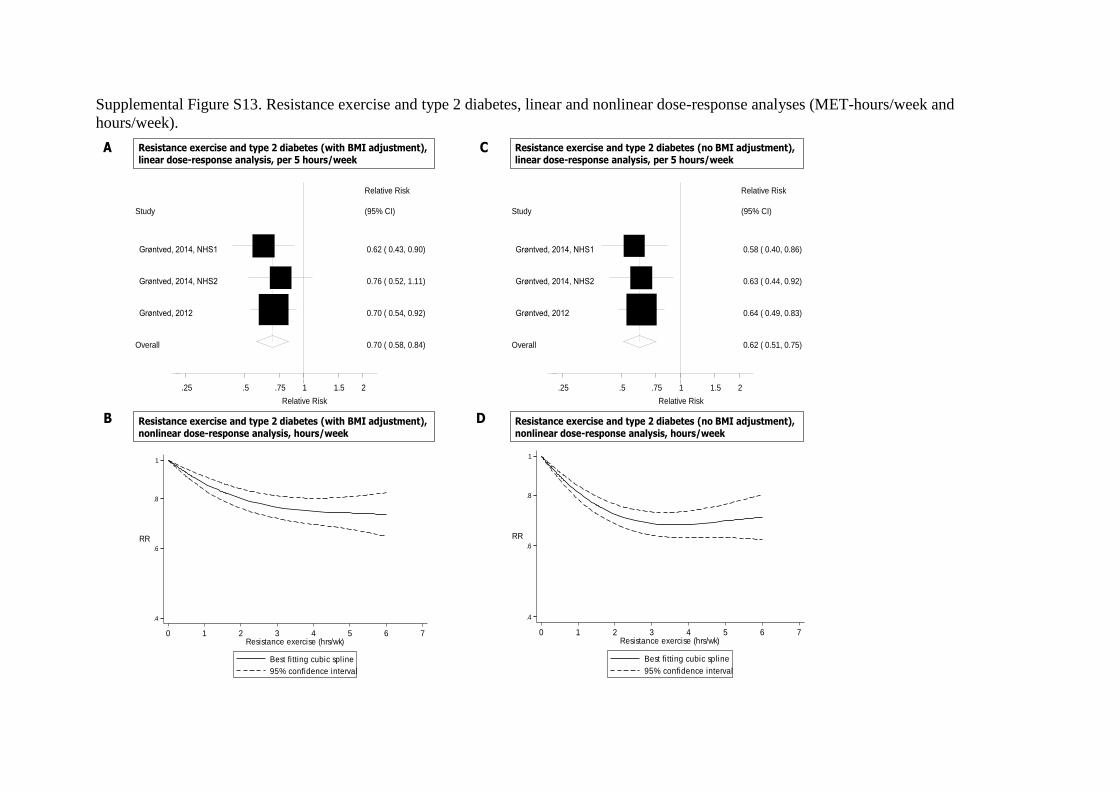
Supplemental Figure S13. Resistance exercise and type 2 diabetes, linear and nonlinear dose-response analyses (MET-hours/week and
hours/week).
A
B Resistance exercise and type 2 diabetes (with BMI adjustment), nonlinear dose-response analysis, hours/week
.4
.6
.8
1
RR
0 1 2 3 4 5 6 7Resistance exercise (hrs/wk)
Best fitting cubic spline
95% confidence interval
Relative Risk
.25 .5 .75 1 1.5 2
Study
Relative Risk
(95% CI)
Grøntved, 2014, NHS1 0.62 ( 0.43, 0.90)
Grøntved, 2014, NHS2 0.76 ( 0.52, 1.11)
Grøntved, 2012 0.70 ( 0.54, 0.92)
Overall 0.70 ( 0.58, 0.84)
Resistance exercise and type 2 diabetes (with BMI adjustment), linear dose-response analysis, per 5 hours/week
C
D
.4
.6
.8
1
RR
0 1 2 3 4 5 6 7Resistance exercise (hrs/wk)
Best fitting cubic spline
95% confidence interval
Resistance exercise and type 2 diabetes (no BMI adjustment), nonlinear dose-response analysis, hours/week
Relative Risk
.25 .5 .75 1 1.5 2
Study
Relative Risk
(95% CI)
Grøntved, 2014, NHS1 0.58 ( 0.40, 0.86)
Grøntved, 2014, NHS2 0.63 ( 0.44, 0.92)
Grøntved, 2012 0.64 ( 0.49, 0.83)
Overall 0.62 ( 0.51, 0.75)
Resistance exercise and type 2 diabetes (no BMI adjustment), linear dose-response analysis, per 5 hours/week

Supplemental Figure S14. Occupational physical activity and type 2 diabetes
Relative Risk
.25 .5 .75 1 1.5 2
Study
Relative Risk
(95% CI)
Steinbrecher, 2012 0.86 ( 0.79, 0.93)
Chien, 2009 0.97 ( 0.69, 1.37)
Hu, 2003 0.74 ( 0.57, 0.95)
Overall 0.85 ( 0.79, 0.92)
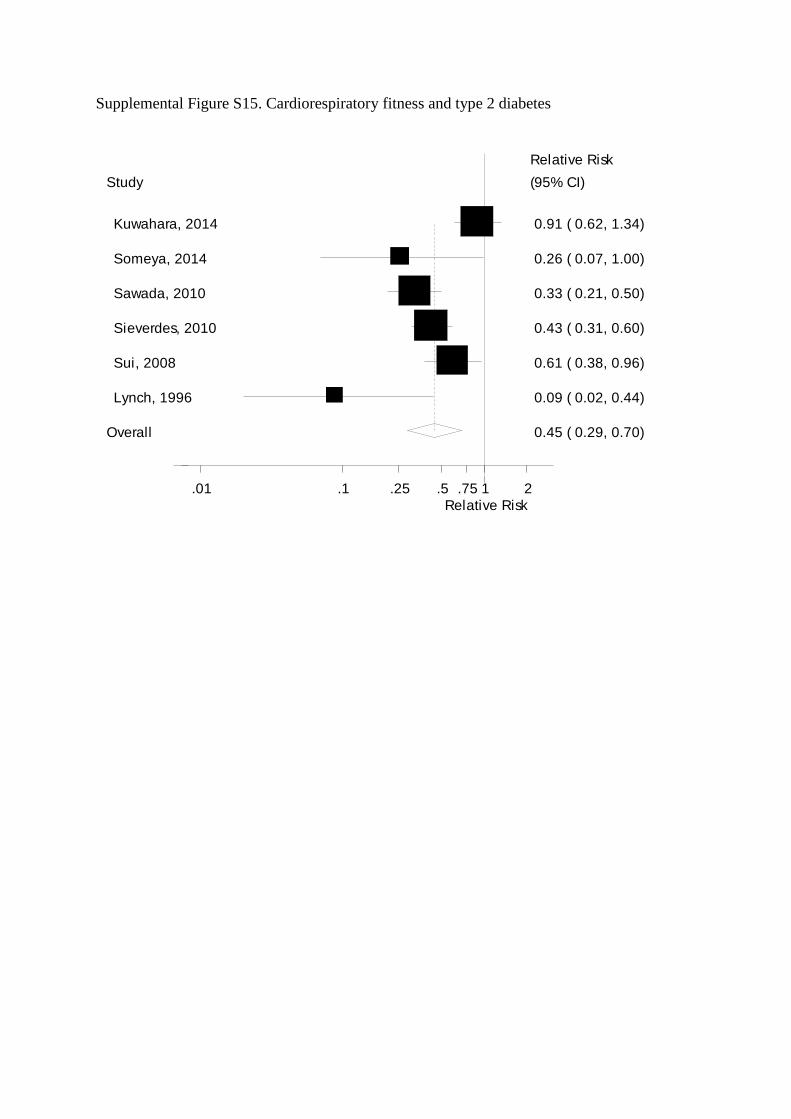
Supplemental Figure S15. Cardiorespiratory fitness and type 2 diabetes
Relative Risk
.01 .1 .25 .5 .75 1 2
Study
Relative Risk
(95% CI)
Kuwahara, 2014 0.91 ( 0.62, 1.34)
Someya, 2014 0.26 ( 0.07, 1.00)
Sawada, 2010 0.33 ( 0.21, 0.50)
Sieverdes, 2010 0.43 ( 0.31, 0.60)
Sui, 2008 0.61 ( 0.38, 0.96)
Lynch, 1996 0.09 ( 0.02, 0.44)
Overall 0.45 ( 0.29, 0.70)
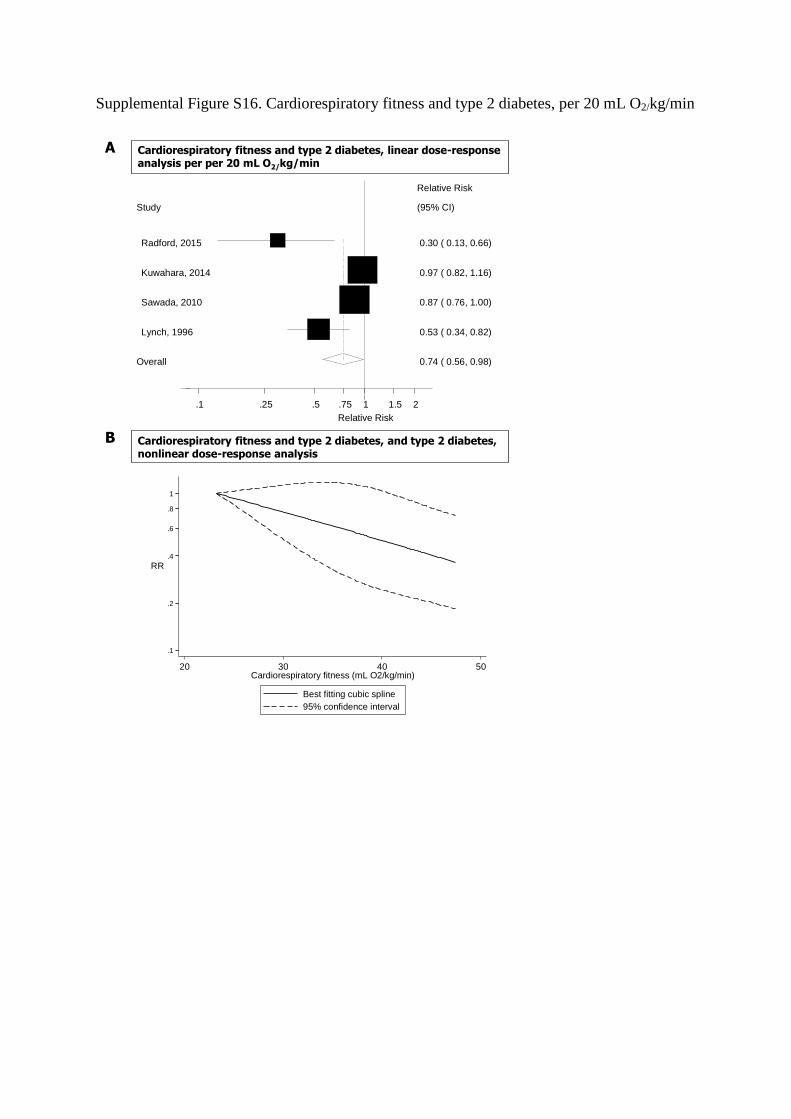
Supplemental Figure S16. Cardiorespiratory fitness and type 2 diabetes, per 20 mL O2/kg/min
A
B
.1
.2
.4
.6
.8
1
RR
20 30 40 50Cardiorespiratory fitness (mL O2/kg/min)
Best fitting cubic spline
95% confidence interval
Cardiorespiratory fitness and type 2 diabetes, and type 2 diabetes, nonlinear dose-response analysis
Relative Risk
.1 .25 .5 .75 1 1.5 2
Study
Relative Risk
(95% CI)
Radford, 2015 0.30 ( 0.13, 0.66)
Kuwahara, 2014 0.97 ( 0.82, 1.16)
Sawada, 2010 0.87 ( 0.76, 1.00)
Lynch, 1996 0.53 ( 0.34, 0.82)
Overall 0.74 ( 0.56, 0.98)
Cardiorespiratory fitness and type 2 diabetes, linear dose-response analysis per per 20 mL O2/kg/min
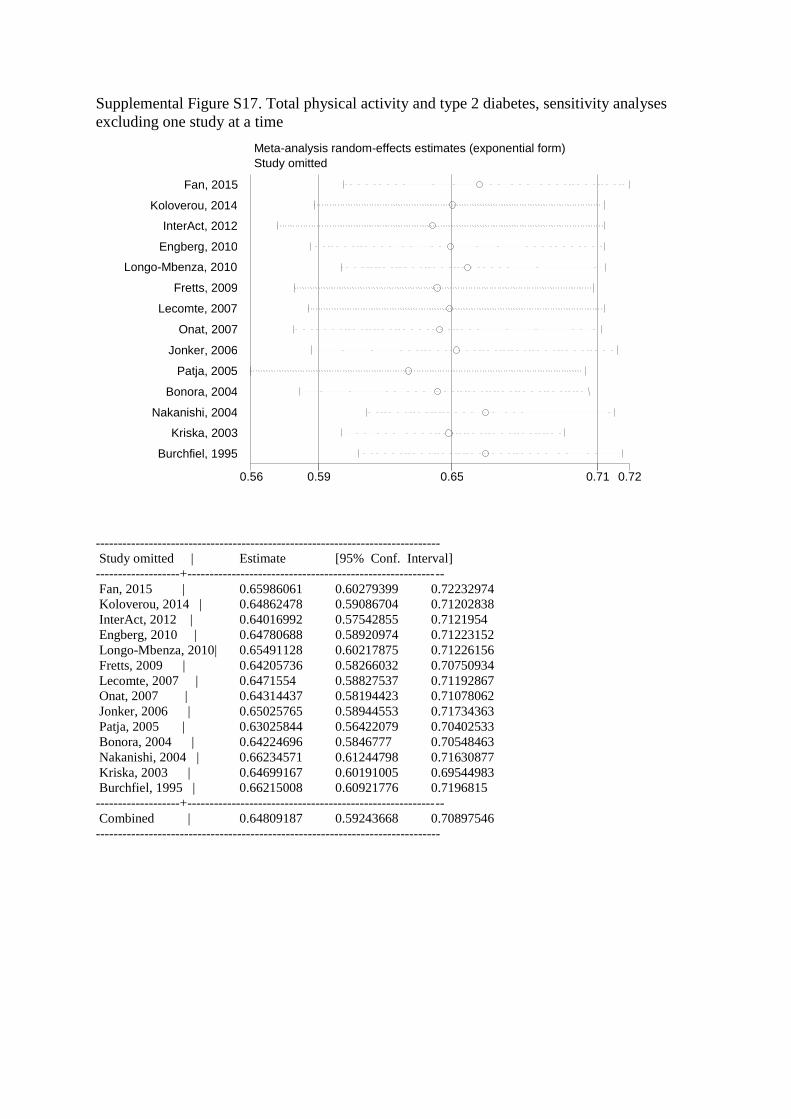
Supplemental Figure S17. Total physical activity and type 2 diabetes, sensitivity analyses
excluding one study at a time
------------------------------------------------------------------------------
Study omitted | Estimate [95% Conf. Interval]
-------------------+----------------------------------------------------------
Fan, 2015 | 0.65986061 0.60279399 0.72232974
Koloverou, 2014 | 0.64862478 0.59086704 0.71202838
InterAct, 2012 | 0.64016992 0.57542855 0.7121954
Engberg, 2010 | 0.64780688 0.58920974 0.71223152
Longo-Mbenza, 2010| 0.65491128 0.60217875 0.71226156
Fretts, 2009 | 0.64205736 0.58266032 0.70750934
Lecomte, 2007 | 0.6471554 0.58827537 0.71192867
Onat, 2007 | 0.64314437 0.58194423 0.71078062
Jonker, 2006 | 0.65025765 0.58944553 0.71734363
Patja, 2005 | 0.63025844 0.56422079 0.70402533
Bonora, 2004 | 0.64224696 0.5846777 0.70548463
Nakanishi, 2004 | 0.66234571 0.61244798 0.71630877
Kriska, 2003 | 0.64699167 0.60191005 0.69544983
Burchfiel, 1995 | 0.66215008 0.60921776 0.7196815
-------------------+----------------------------------------------------------
Combined | 0.64809187 0.59243668 0.70897546
------------------------------------------------------------------------------
0.56 0.65 0.59 0.71 0.72
Fan, 2015
Koloverou, 2014
InterAct, 2012
Engberg, 2010
Longo-Mbenza, 2010
Fretts, 2009
Lecomte, 2007
Onat, 2007
Jonker, 2006
Patja, 2005
Bonora, 2004
Nakanishi, 2004
Kriska, 2003
Burchfiel, 1995
Study omitted Meta-analysis random-effects estimates (exponential form)
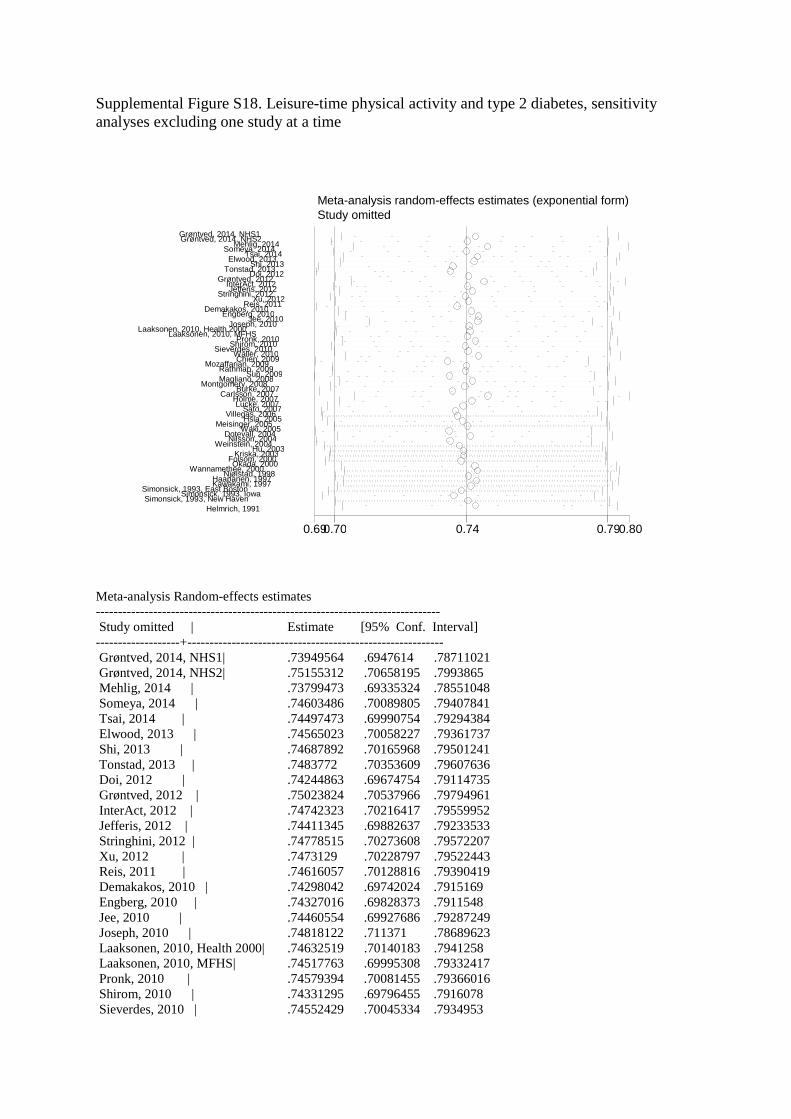
Supplemental Figure S18. Leisure-time physical activity and type 2 diabetes, sensitivity
analyses excluding one study at a time
Meta-analysis Random-effects estimates
------------------------------------------------------------------------------
Study omitted | Estimate [95% Conf. Interval]
-------------------+----------------------------------------------------------
Grøntved, 2014, NHS1| .73949564 .6947614 .78711021
Grøntved, 2014, NHS2| .75155312 .70658195 .7993865
Mehlig, 2014 | .73799473 .69335324 .78551048
Someya, 2014 | .74603486 .70089805 .79407841
Tsai, 2014 | .74497473 .69990754 .79294384
Elwood, 2013 | .74565023 .70058227 .79361737
Shi, 2013 | .74687892 .70165968 .79501241
Tonstad, 2013 | .7483772 .70353609 .79607636
Doi, 2012 | .74244863 .69674754 .79114735
Grøntved, 2012 | .75023824 .70537966 .79794961
InterAct, 2012 | .74742323 .70216417 .79559952
Jefferis, 2012 | .74411345 .69882637 .79233533
Stringhini, 2012 | .74778515 .70273608 .79572207
Xu, 2012 | .7473129 .70228797 .79522443
Reis, 2011 | .74616057 .70128816 .79390419
Demakakos, 2010 | .74298042 .69742024 .7915169
Engberg, 2010 | .74327016 .69828373 .7911548
Jee, 2010 | .74460554 .69927686 .79287249
Joseph, 2010 | .74818122 .711371 .78689623
Laaksonen, 2010, Health 2000| .74632519 .70140183 .7941258
Laaksonen, 2010, MFHS| .74517763 .69995308 .79332417
Pronk, 2010 | .74579394 .70081455 .79366016
Shirom, 2010 | .74331295 .69796455 .7916078
Sieverdes, 2010 | .74552429 .70045334 .7934953
0.69 0.74 0.70 0.79 0.80
Grøntved, 2014, NHS1 Grøntved, 2014, NHS2
Mehlig, 2014 Someya, 2014
Tsai, 2014 Elwood, 2013
Shi, 2013 Tonstad, 2013
Doi, 2012 Grøntved, 2012
InterAct, 2012 Jefferis, 2012
Stringhini, 2012 Xu, 2012
Reis, 2011 Demakakos, 2010
Engberg, 2010 Jee, 2010
Joseph, 2010 Laaksonen, 2010, Health 2000
Laaksonen, 2010, MFHS Pronk, 2010
Shirom, 2010 Sieverdes, 2010
Waller, 2010 Chien, 2009
Mozaffarian, 2009 Rathman, 2009
Sun, 2009 Magliano, 2008
Montgomery, 2008 Burke, 2007
Carlsson, 2007 Holme, 2007 Lucke, 2007
Sato, 2007 Villegas, 2006
Hsia, 2005 Meisinger, 2005
Waki, 2005 Dotevall, 2004 Nilsson, 2004
Weinstein, 2004 Hu, 2003
Kriska, 2003 Folsom, 2000 Okada, 2000
Wannamethee, 2000 Njølstad, 1998
Haapanen, 1997 Kawakami, 1997
Simonsick, 1993, East Boston Simonsick, 1993, Iowa
Simonsick, 1993, New Haven Helmrich, 1991
Study omitted Meta-analysis random-effects estimates (exponential form)
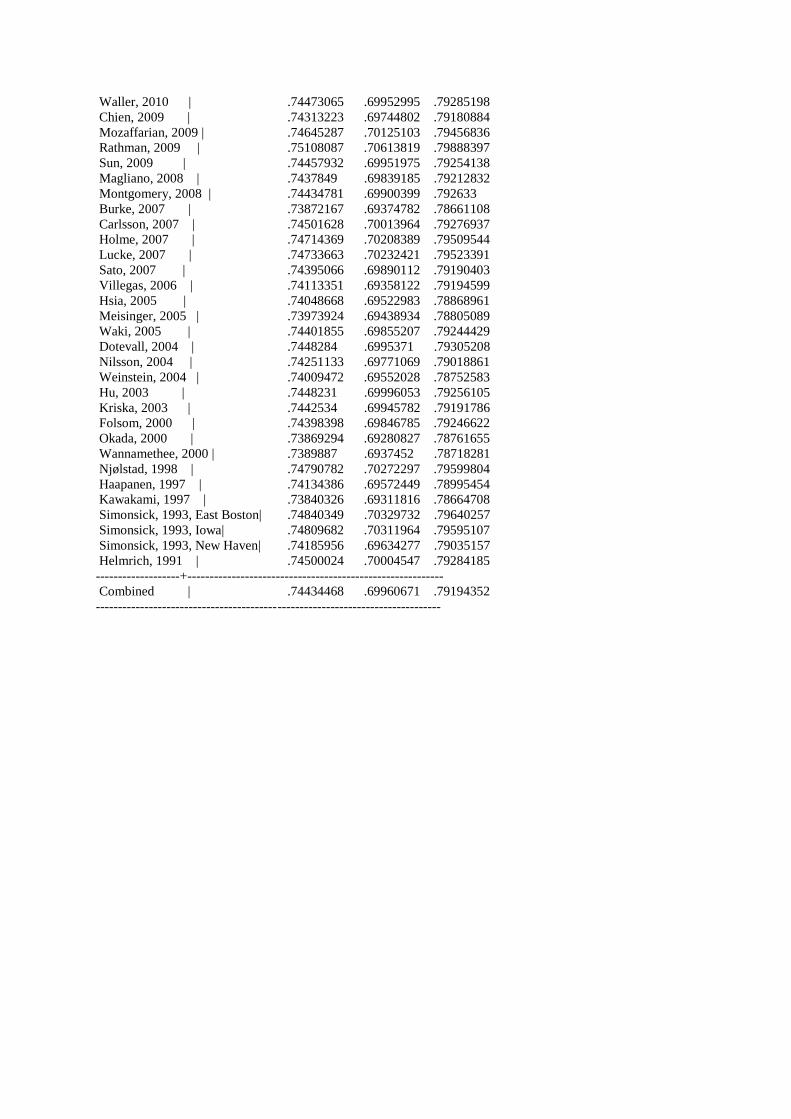
Waller, 2010 | .74473065 .69952995 .79285198
Chien, 2009 | .74313223 .69744802 .79180884
Mozaffarian, 2009 | .74645287 .70125103 .79456836
Rathman, 2009 | .75108087 .70613819 .79888397
Sun, 2009 | .74457932 .69951975 .79254138
Magliano, 2008 | .7437849 .69839185 .79212832
Montgomery, 2008 | .74434781 .69900399 .792633
Burke, 2007 | .73872167 .69374782 .78661108
Carlsson, 2007 | .74501628 .70013964 .79276937
Holme, 2007 | .74714369 .70208389 .79509544
Lucke, 2007 | .74733663 .70232421 .79523391
Sato, 2007 | .74395066 .69890112 .79190403
Villegas, 2006 | .74113351 .69358122 .79194599
Hsia, 2005 | .74048668 .69522983 .78868961
Meisinger, 2005 | .73973924 .69438934 .78805089
Waki, 2005 | .74401855 .69855207 .79244429
Dotevall, 2004 | .7448284 .6995371 .79305208
Nilsson, 2004 | .74251133 .69771069 .79018861
Weinstein, 2004 | .74009472 .69552028 .78752583
Hu, 2003 | .7448231 .69996053 .79256105
Kriska, 2003 | .7442534 .69945782 .79191786
Folsom, 2000 | .74398398 .69846785 .79246622
Okada, 2000 | .73869294 .69280827 .78761655
Wannamethee, 2000 | .7389887 .6937452 .78718281
Njølstad, 1998 | .74790782 .70272297 .79599804
Haapanen, 1997 | .74134386 .69572449 .78995454
Kawakami, 1997 | .73840326 .69311816 .78664708
Simonsick, 1993, East Boston| .74840349 .70329732 .79640257
Simonsick, 1993, Iowa| .74809682 .70311964 .79595107
Simonsick, 1993, New Haven| .74185956 .69634277 .79035157
Helmrich, 1991 | .74500024 .70004547 .79284185
-------------------+----------------------------------------------------------
Combined | .74434468 .69960671 .79194352
------------------------------------------------------------------------------
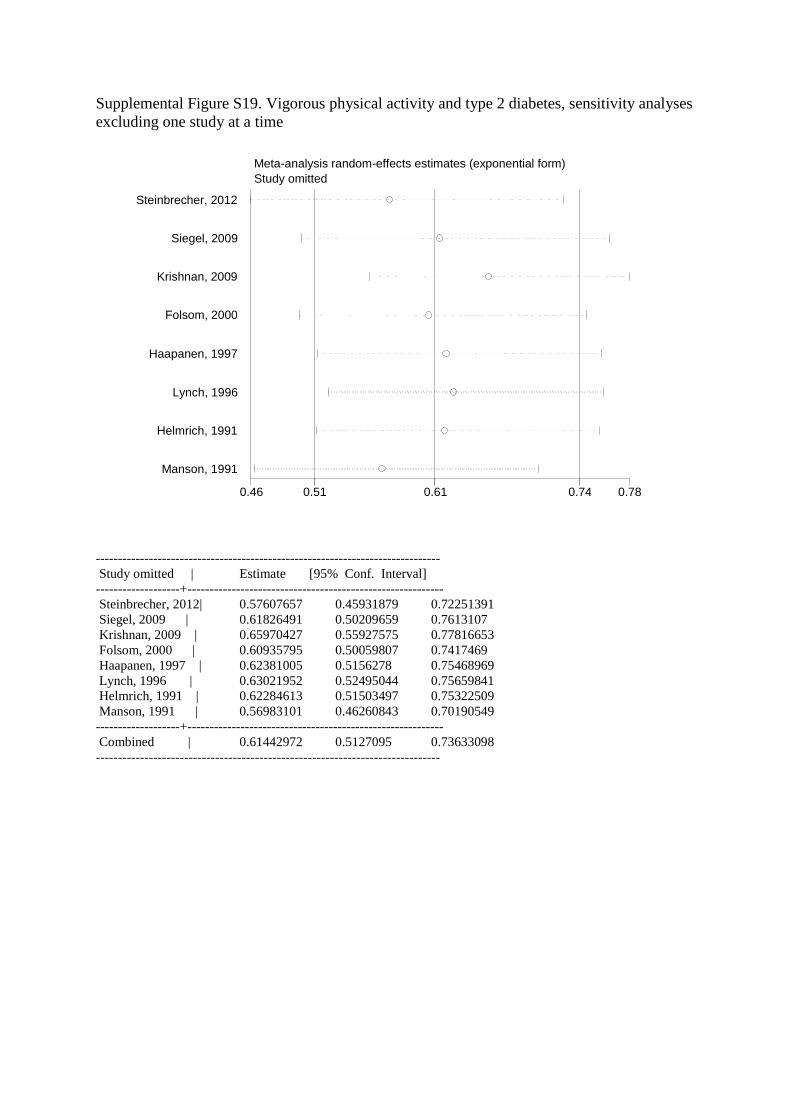
Supplemental Figure S19. Vigorous physical activity and type 2 diabetes, sensitivity analyses
excluding one study at a time
------------------------------------------------------------------------------
Study omitted | Estimate [95% Conf. Interval]
-------------------+----------------------------------------------------------
Steinbrecher, 2012| 0.57607657 0.45931879 0.72251391
Siegel, 2009 | 0.61826491 0.50209659 0.7613107
Krishnan, 2009 | 0.65970427 0.55927575 0.77816653
Folsom, 2000 | 0.60935795 0.50059807 0.7417469
Haapanen, 1997 | 0.62381005 0.5156278 0.75468969
Lynch, 1996 | 0.63021952 0.52495044 0.75659841
Helmrich, 1991 | 0.62284613 0.51503497 0.75322509
Manson, 1991 | 0.56983101 0.46260843 0.70190549
-------------------+----------------------------------------------------------
Combined | 0.61442972 0.5127095 0.73633098
------------------------------------------------------------------------------
0.46 0.61 0.51 0.74 0.78
Steinbrecher, 2012
Siegel, 2009
Krishnan, 2009
Folsom, 2000
Haapanen, 1997
Lynch, 1996
Helmrich, 1991
Manson, 1991
Study omitted Meta-analysis random-effects estimates (exponential form)

Supplemental Figure S20. Moderate physical activity and type 2 diabetes, sensitivity analyses
excluding one study at a time
-----------------------------------------------------------------------------
Study omitted | Estimate [95% Conf. Interval]
-------------------+---------------------------------------------------------
Steinbrecher, 2012| 0.63261563 0.54241472 0.73781651
Rana, 2007 | 0.73305333 0.5623855 0.95551383
Folsom, 2000 | 0.65500188 0.45567942 0.94151157
Lynch, 1996 | 0.70361102 0.52446669 0.94394642
Helmrich, 1991 | 0.71422064 0.53270376 0.95758873
-------------------+---------------------------------------------------------
Combined | 0.68036908 0.51613916 0.89685518
-----------------------------------------------------------------------------
0.46 0.68 0.52 0.90 0.96
Steinbrecher, 2012
Rana, 2007
Folsom, 2000
Lynch, 1996
Helmrich, 1991
Study omitted Meta-analysis random-effects estimates (exponential form)
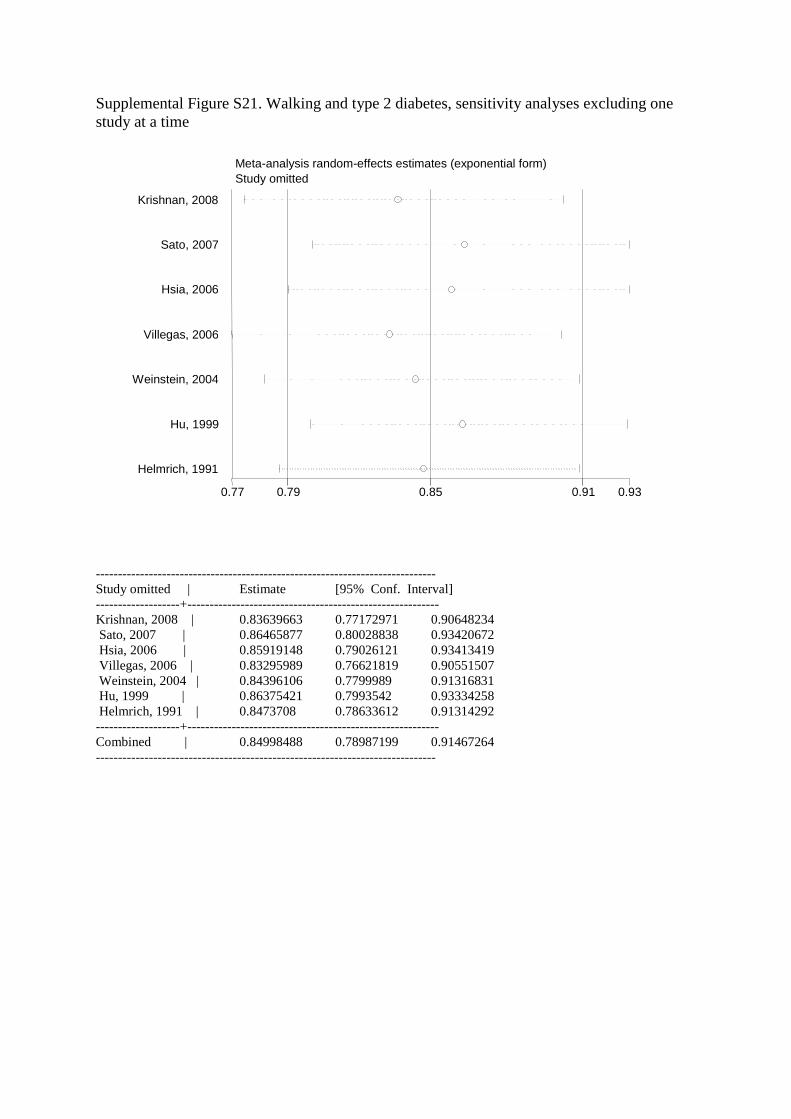
Supplemental Figure S21. Walking and type 2 diabetes, sensitivity analyses excluding one
study at a time
-----------------------------------------------------------------------------
Study omitted | Estimate [95% Conf. Interval]
-------------------+---------------------------------------------------------
Krishnan, 2008 | 0.83639663 0.77172971 0.90648234
Sato, 2007 | 0.86465877 0.80028838 0.93420672
Hsia, 2006 | 0.85919148 0.79026121 0.93413419
Villegas, 2006 | 0.83295989 0.76621819 0.90551507
Weinstein, 2004 | 0.84396106 0.7799989 0.91316831
Hu, 1999 | 0.86375421 0.7993542 0.93334258
Helmrich, 1991 | 0.8473708 0.78633612 0.91314292
-------------------+---------------------------------------------------------
Combined | 0.84998488 0.78987199 0.91467264
-----------------------------------------------------------------------------
0.77 0.85 0.79 0.91 0.93
Krishnan, 2008
Sato, 2007
Hsia, 2006
Villegas, 2006
Weinstein, 2004
Hu, 1999
Helmrich, 1991
Study omitted Meta-analysis random-effects estimates (exponential form)
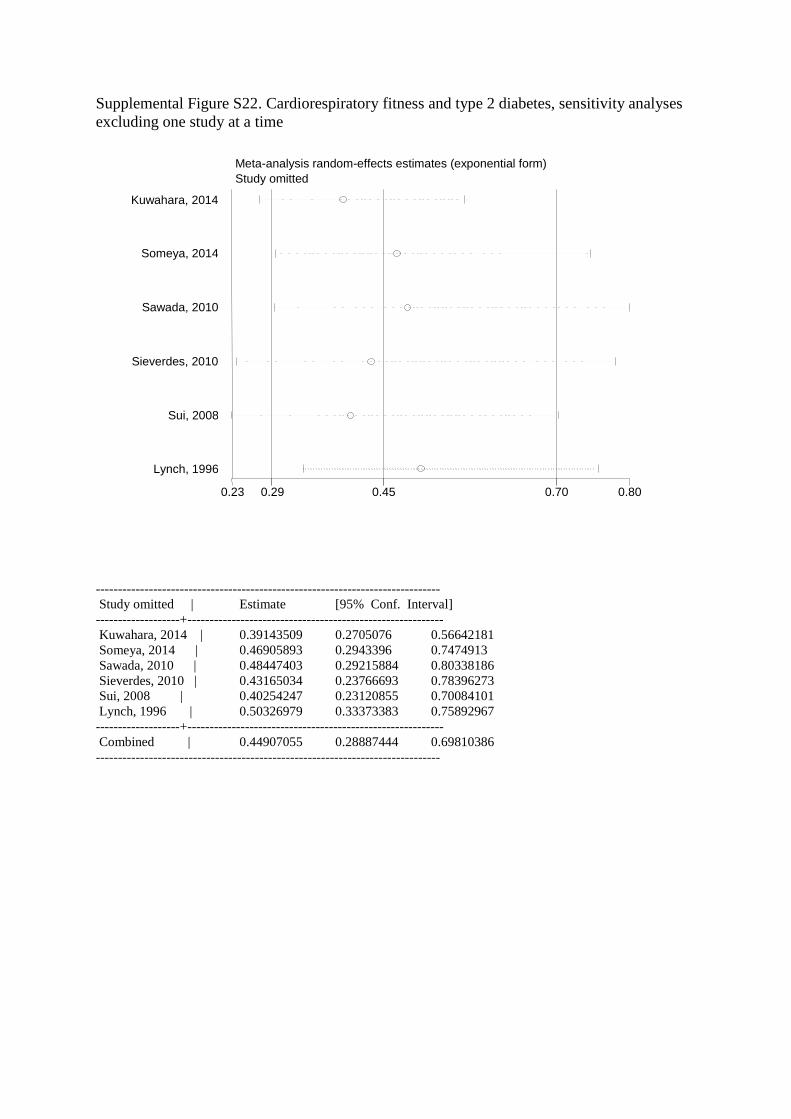
Supplemental Figure S22. Cardiorespiratory fitness and type 2 diabetes, sensitivity analyses
excluding one study at a time
------------------------------------------------------------------------------
Study omitted | Estimate [95% Conf. Interval]
-------------------+----------------------------------------------------------
Kuwahara, 2014 | 0.39143509 0.2705076 0.56642181
Someya, 2014 | 0.46905893 0.2943396 0.7474913
Sawada, 2010 | 0.48447403 0.29215884 0.80338186
Sieverdes, 2010 | 0.43165034 0.23766693 0.78396273
Sui, 2008 | 0.40254247 0.23120855 0.70084101
Lynch, 1996 | 0.50326979 0.33373383 0.75892967
-------------------+----------------------------------------------------------
Combined | 0.44907055 0.28887444 0.69810386
------------------------------------------------------------------------------
0.23 0.45 0.29 0.70 0.80
Kuwahara, 2014
Someya, 2014
Sawada, 2010
Sieverdes, 2010
Sui, 2008
Lynch, 1996
Study omitted Meta-analysis random-effects estimates (exponential form)