olahan no 1-2
29
FREQUENCIES VARIABLES=X1 Y /NTILES=4 /STATISTICS=STDDEV MEAN MEDIAN MODE SUM SKEWNESS SESKEW KURTOSIS SEKURT /BARCHART FREQ /ORDER=ANALYSIS. Frequencies Notes Output Created 21-Dec-2011 14:06:15 Comments Input Data D:\Tugas Akhir dikumpulkan\Statistik SPSS\data SPSS.sav Active Dataset DataSet1 Filter <none> Weight <none> Split File <none> N of Rows in Working Data File 11 Mi ss in g V al ue Ha nd li ng De fi ni ti on of Mi ssin g User- de fi ne d mis si ng valu es ar e t re at ed as missing. Cases Used Statistics are based on all cases with valid data. Syntax FREQUENCIES VARIABLES=X1 Y /NTILES=4 /STATISTICS=STDDEV MEAN MEDIAN MODE SUM SKEWNESS SESKEW KURTOSIS SEKURT /BARCHART FREQ /ORDER=ANALYSIS. Resources Processor Time 00:00:01.388 Elapsed Time 00:00:01.457 [DataSet1] D:\Tugas Akhir dikumpulkan\Statistik SPSS\data SPSS.sav Statistics X1 Y N Valid 11 11 Missing 0 0
-
Upload
riska-pristiani -
Category
Documents
-
view
216 -
download
0
Transcript of olahan no 1-2

8/3/2019 olahan no 1-2
http://slidepdf.com/reader/full/olahan-no-1-2 1/29
FREQUENCIES VARIABLES=X1 Y
/NTILES=4
/STATISTICS=STDDEV MEAN MEDIAN MODE SUM SKEWNESS SESKEW KURTOSIS SEKURT
/BARCHART FREQ
/ORDER=ANALYSIS.
Frequencies
Notes
Output Created 21-Dec-2011 14:06:15
Comments
Input Data D:\Tugas Akhir dikumpulkan\Statistik
SPSS\data SPSS.sav
Active Dataset DataSet1
Filter <none>
Weight <none>
Split File <none>
N of Rows in Working Data File 11
Missing Value Handl ing Def init ion of Missing User-def ined missing values are treated as
missing.
Cases Used Statistics are based on all cases with valid
data.
Syntax FREQUENCIES VARIABLES=X1 Y
/NTILES=4
/STATISTICS=STDDEV MEAN MEDIAN
MODE SUM SKEWNESS SESKEW
KURTOSIS SEKURT
/BARCHART FREQ
/ORDER=ANALYSIS.
Resources Processor Time 00:00:01.388
Elapsed Time 00:00:01.457
[DataSet1] D:\Tugas Akhir dikumpulkan\Statistik SPSS\data SPSS.sav
Statistics
X1 Y
N Valid 11 11
Missing 0 0

8/3/2019 olahan no 1-2
http://slidepdf.com/reader/full/olahan-no-1-2 2/29
Mean 1223.45 117.36
Median 937.00 81.00
Mode 183a 37a
Std. Deviation 1.019E3 107.642
Skewness .906 2.290
Std. Error of Skewness .661 .661
Kurtosis -.089 6.043
Std. Error of Kurtosis 1.279 1.279
Sum 13458 1291
Percentiles 25 320.00 42.00
50 937.00 81.00
75 2006.00 152.00
a. Multiple modes exist. The smallest value is shown
Frequency Table
X1
Frequency Percent Valid P ercent
Cumulative
Percent
Valid 183 1 9.1 9.1 9.1
250 1 9.1 9.1 18.2
320 1 9.1 9.1 27.3
474 1 9.1 9.1 36.4
669 1 9.1 9.1 45.5
937 1 9.1 9.1 54.5
1250 1 9.1 9.1 63.6
1602 1 9.1 9.1 72.7
2006 1 9.1 9.1 81.8
2488 1 9.1 9.1 90.9
3279 1 9.1 9.1 100.0
Total 11 100.0 100.0
Y
Frequency Percent Valid P ercent
Cumulative
Percent

8/3/2019 olahan no 1-2
http://slidepdf.com/reader/full/olahan-no-1-2 3/29
Valid 37 1 9.1 9.1 9.1
40 1 9.1 9.1 18.2
42 1 9.1 9.1 27.3
49 1 9.1 9.1 36.4
76 1 9.1 9.1 45.5
81 1 9.1 9.1 54.5
98 1 9.1 9.1 63.6
141 1 9.1 9.1 72.7
152 1 9.1 9.1 81.8
165 1 9.1 9.1 90.9
410 1 9.1 9.1 100.0
Total 11 100.0 100.0
Bar Chart

8/3/2019 olahan no 1-2
http://slidepdf.com/reader/full/olahan-no-1-2 4/29
REGRESSION
/DESCRIPTIVES MEAN STDDEV CORR SIG N
/MISSING LISTWISE
/STATISTICS COEFF OUTS R ANOVA COLLIN TOL CHANGE ZPP
/CRITERIA=PIN(.05) POUT(.10)
/NOORIGIN
/DEPENDENT Y
/METHOD=ENTER X1
/SCATTERPLOT=(*SRESID ,*ZPRED)
/RESIDUALS DURBIN HIST(ZRESID) NORM(ZRESID).
Regression
Notes
Output Created 21-Dec-2011 14:09:45
Comments
Input Data D:\Tugas Akhir dikumpulkan\Statistik
SPSS\data SPSS.sav
Active Dataset DataSet1
Filter <none>

8/3/2019 olahan no 1-2
http://slidepdf.com/reader/full/olahan-no-1-2 5/29
Weight <none>
Split File <none>
N of Rows in Working Data File 11
Missing Value Handl ing Def init ion of Missing User-def ined missing values are treated as
missing.
Cases Used Statistics are based on cases with no
missing values for any variable used.
Syntax REGRESSION
/DESCRIPTIVES MEAN STDDEV CORR
SIG N
/MISSING LISTWISE
/STATISTICS COEFF OUTS R ANOVA
COLLIN TOL CHANGE ZPP
/CRITERIA=PIN(.05) POUT(.10)
/NOORIGIN
/DEPENDENT Y
/METHOD=ENTER X1
/SCATTERPLOT=(*SRESID ,*ZPRED)
/RESIDUALS DURBIN HIST(ZRESID)
NORM(ZRESID).
Resources Processor Time 00:00:01.560
Elapsed Time 00:00:01.515
Memory Required 1468 bytes
Additional Memory Required for
Residual Plots912 bytes
[DataSet1] D:\Tugas Akhir dikumpulkan\Statistik SPSS\data SPSS.sav
Descriptive Statistics
Mean Std. Deviation N
Y 98.73 58.389 11
X1 1223.45 1018.738 11
Correlations
Y X1
Pearson Correlation Y 1.000 .987
X1 .987 1.000

8/3/2019 olahan no 1-2
http://slidepdf.com/reader/full/olahan-no-1-2 6/29
Sig. (1-tailed) Y . .000
X1 .000 .
N Y 11 11
X1 11 11
Variables Entered/Removedb
Model Variables EnteredVariablesRemoved Method
1 X1a . Enter
a. All requested variables entered.
b. Dependent Variable: Y
Model Summaryb
Model R R Square Adjusted R Square
Std. Error of the
Estimate Change Statistics Durbin-Watson
R Square Change F Change df1 df2 Sig. F Change
1 .987a .975 .972 9.711 .975 352.530 1 9 .000 1.527
a. Predictors: (Constant), X1
b. Dependent Variable: Y
ANOVAb
Model Sum of Squares df Mean Square F Sig.
1 Regression 33243.485 1 33243.485 352.530 .000a
Residual 848.697 9 94.300
Total 34092.182 10
a. Predictors: (Constant), X1
b. Dependent Variable: Y
Coefficients a
Model Unstandardized Coefficients
Standardized
Coefficients t Sig. Correlations Collinearity Statistics
B Std. Error Beta Zero-order Partial Part Tolerance VIF

8/3/2019 olahan no 1-2
http://slidepdf.com/reader/full/olahan-no-1-2 7/29
1 (Constant) 29.484 4.709 6.261 .000
X1 .057 .003 .987 18.776 .000 .987 .987 .987 1.000 1.000
a. Dependent Variable: Y
Collinearity Diagnosticsa
Model
Dimensi
on Eigenvalue Condition Index Variance Proportions
(Constant) X1
1 1 1.783 1.000 .11 .11
2 .217 2.868 .89 .89
a. Dependent Variable: Y
Residuals Statisticsa
Minimum Maximum Mean Std. Deviation N
Predicted Value 39.84 215.06 98.73 57.657 11
Std. Predicted Value -1.021 2.018 .000 1.000 11
Standard Error of Predicted
Value2.929 6.853 4.004 1.105 11
Adjusted Predicted Value 40.53 225.05 99.70 59.464 11
Residual -10.064 20.848 .000 9.212 11
Std. Residual -1.036 2.147 .000 .949 11
Stud. Residual -1.463 2.269 -.042 1.058 11
Deleted Residual -20.050 23.287 -.975 11.720 11
Stud. Deleted Residual -1.580 3.270 .048 1.303 11
Mahal. Distance .001 4.071 .909 1.147 11
Cook's Distance .001 1.062 .157 .312 11
Centered Leverage Value .000 .407 .091 .115 11
a. Dependent Variable: Y
Charts

8/3/2019 olahan no 1-2
http://slidepdf.com/reader/full/olahan-no-1-2 8/29

8/3/2019 olahan no 1-2
http://slidepdf.com/reader/full/olahan-no-1-2 9/29

8/3/2019 olahan no 1-2
http://slidepdf.com/reader/full/olahan-no-1-2 10/29
SAVE OUTFILE='D:\Tugas Akhir dikumpulkan\Statistik SPSS\SPSS bener\data no 1.sav'
/COMPRESSED.
NEW FILE.
DATASET NAME DataSet2 WINDOW=FRONT.
FREQUENCIES VARIABLES=X1 X2 Y
/NTILES=4
/STATISTICS=STDDEV MEAN MEDIAN MODE KURTOSIS SEKURT
/HISTOGRAM NORMAL
/ORDER=ANALYSIS.
Frequencies
Notes
Output Created 21-Dec-2011 14:17:17
Comments
Input Active Dataset DataSet2
Filter <none>
Weight <none>
Split File <none>
N of Rows in Working Data File 11

8/3/2019 olahan no 1-2
http://slidepdf.com/reader/full/olahan-no-1-2 11/29
Missing Value Handl ing Def init ion of Missing User-def ined missing values are treated as
missing.
Cases Used Statistics are based on all cases with valid
data.
Syntax FREQUENCIES VARIABLES=X1 X2 Y
/NTILES=4
/STATISTICS=STDDEV MEAN MEDIAN
MODE KURTOSIS SEKURT
/HISTOGRAM NORMAL
/ORDER=ANALYSIS.
Resources Processor Time 00:00:01.872
Elapsed Time 00:00:01.419
[DataSet2]
Statistics
X1 X2 Y
N Valid 11 11 10
Missing 0 0 1
Mean 1223.45 196.45 90.10
Median 937.00 163.00 78.50
Mode 183a 57a 40a
Std. Deviation 1.019E3 118.649 47.123
Kurtosis -.089 -1.014 -1.302
Std. Error of Kurtosis 1.279 1.279 1.334
Percentiles 25 320.00 84.00 47.25
50 937.00 163.00 78.50
75 2006.00 304.00 143.75
a. Multiple modes exist. The smallest value is shown
Frequency Table
X1
Frequency Percent Valid P ercent
Cumulative
Percent
Valid 183 1 9.1 9.1 9.1

8/3/2019 olahan no 1-2
http://slidepdf.com/reader/full/olahan-no-1-2 12/29
250 1 9.1 9.1 18.2
320 1 9.1 9.1 27.3
474 1 9.1 9.1 36.4
669 1 9.1 9.1 45.5
937 1 9.1 9.1 54.5
1250 1 9.1 9.1 63.6
1602 1 9.1 9.1 72.7
2006 1 9.1 9.1 81.8
2488 1 9.1 9.1 90.9
3279 1 9.1 9.1 100.0
Total 11 100.0 100.0
X2
Frequency Percent Valid P ercent
Cumulative
Percent
Valid 57 1 9.1 9.1 9.1
81 1 9.1 9.1 18.2
84 1 9.1 9.1 27.3
99 1 9.1 9.1 36.4
152 1 9.1 9.1 45.5
163 1 9.1 9.1 54.5
197 1 9.1 9.1 63.6
283 1 9.1 9.1 72.7
304 1 9.1 9.1 81.8
331 1 9.1 9.1 90.9
410 1 9.1 9.1 100.0
Total 11 100.0 100.0
Y
Frequency Percent Valid P ercent
Cumulative
Percent
Valid 40 1 9.1 10.0 10.0
42 1 9.1 10.0 20.0
49 1 9.1 10.0 30.0

8/3/2019 olahan no 1-2
http://slidepdf.com/reader/full/olahan-no-1-2 13/29
57 1 9.1 10.0 40.0
76 1 9.1 10.0 50.0
81 1 9.1 10.0 60.0
98 1 9.1 10.0 70.0
141 1 9.1 10.0 80.0
152 1 9.1 10.0 90.0
165 1 9.1 10.0 100.0
Total 10 90.9 100.0
Missing System 1 9.1
Total 11 100.0
Histogram

8/3/2019 olahan no 1-2
http://slidepdf.com/reader/full/olahan-no-1-2 14/29

8/3/2019 olahan no 1-2
http://slidepdf.com/reader/full/olahan-no-1-2 15/29
REGRESSION
/DESCRIPTIVES MEAN STDDEV CORR SIG N
/MISSING LISTWISE
/STATISTICS COEFF OUTS R ANOVA COLLIN TOL CHANGE ZPP
/CRITERIA=PIN(.05) POUT(.10)
/NOORIGIN
/DEPENDENT Y
/METHOD=ENTER X1 X2
/SCATTERPLOT=(*SRESID ,*ZPRED)
/RESIDUALS DURBIN HIST(ZRESID) NORM(ZRESID).
Regression
Notes
Output Created 21-Dec-2011 14:18:58
Comments
Input Active Dataset DataSet2
Filter <none>
Weight <none>
Split File <none>

8/3/2019 olahan no 1-2
http://slidepdf.com/reader/full/olahan-no-1-2 16/29
N of Rows in Working Data File 11
Missing Value Handl ing Def init ion of Missing User-def ined missing values are treated as
missing.
Cases Used Statistics are based on cases with no
missing values for any variable used.
Syntax REGRESSION
/DESCRIPTIVES MEAN STDDEV CORR
SIG N
/MISSING LISTWISE
/STATISTICS COEFF OUTS R ANOVA
COLLIN TOL CHANGE ZPP
/CRITERIA=PIN(.05) POUT(.10)
/NOORIGIN
/DEPENDENT Y
/METHOD=ENTER X1 X2
/SCATTERPLOT=(*SRESID ,*ZPRED)
/RESIDUALS DURBIN HIST(ZRESID)
NORM(ZRESID).
Resources Processor Time 00:00:04.587
Elapsed Time 00:00:01.941
Memory Required 1636 bytes
Additional Memory Required for
Residual Plots904 bytes
[DataSet2]
Descriptive Statistics
Mean Std. Deviation N
Y 100.55 56.557 11
X1 1223.45 1018.738 11
X2 196.45 118.649 11
Correlations
Y X1 X2
Pearson Correlation Y 1.000 .983 .990
X1 .983 1.000 .986

8/3/2019 olahan no 1-2
http://slidepdf.com/reader/full/olahan-no-1-2 17/29

8/3/2019 olahan no 1-2
http://slidepdf.com/reader/full/olahan-no-1-2 18/29
Model Unstandardized Coefficients
Standardized
Coefficients t Sig. Correlations Collinearity Statistics
B Std. Error Beta Zero-order Partial Part Tolerance VIF
1 (Constant) 14.138 8.772 1.612 .146
X1 .014 .016 .257 .888 .401 .983 .299 .042 .027 36.753
X2 .351 .138 .736 2.538 .035 .990 .668 .121 .027 36.753
a. Dependent Variable: Y
Collinearity Diagnosticsa
Model
Dimensi
on Eigenvalue Condition Index Variance Proportions
(Constant) X1 X2
1 1 2.759 1.000 .01 .00 .00
2 .237 3.412 .24 .01 .00
3 .004 26.244 .75 .99 1.00
a. Dependent Variable: Y
Residuals Statisticsa
Minimum Maximum Mean Std. Deviation N
Predicted Value 36.75 204.84 100.55 56.037 11
Std. Predicted Value -1.138 1.861 .000 1.000 11
Standard Error of Predicted
Value2.603 6.796 4.278 1.349 11
Adjusted Predicted Value 28.11 204.56 99.58 56.190 11
Residual -7.129 20.249 .000 7.652 11
Std. Residual -.833 2.367 .000 .894 11
Stud. Residual -.935 2.827 .046 1.061 11
Deleted Residual -8.969 28.885 .965 10.875 11
Stud. Deleted Residual -.926 84.490 7.476 25.548 11
Mahal. Distance .017 5.402 1.818 1.784 11
Cook's Distance .001 1.136 .152 .342 11
Centered Leverage Value .002 .540 .182 .178 11
a. Dependent Variable: Y

8/3/2019 olahan no 1-2
http://slidepdf.com/reader/full/olahan-no-1-2 19/29
Charts

8/3/2019 olahan no 1-2
http://slidepdf.com/reader/full/olahan-no-1-2 20/29

8/3/2019 olahan no 1-2
http://slidepdf.com/reader/full/olahan-no-1-2 21/29
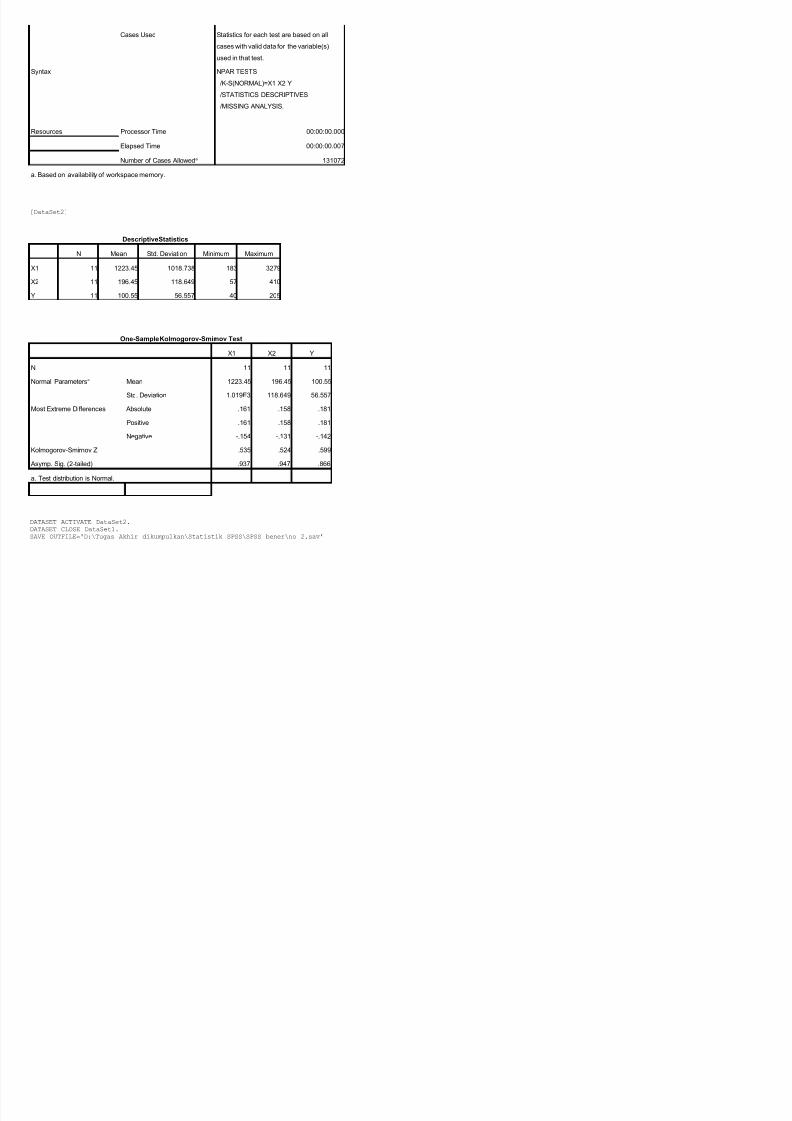
NPAR TESTS
/K-S(NORMAL)=X1 X2 Y
/STATISTICS DESCRIPTIVES
/MISSING ANALYSIS.
NPar Tests
Notes
Output Created 21-Dec-2011 14:20:17
Comments
Input Active Dataset DataSet2
Filter <none>
Weight <none>
Split File <none>
N of Rows in Working Data File 11
Missing Value Handl ing Def init ion of Missing User-def ined missing values are treated as
missing.
8/3/2019 olahan no 1-2
http://slidepdf.com/reader/full/olahan-no-1-2 22/29
Cases Used Statistics for each test are based on all
cases with valid data for the variable(s)
used in that test.
Syntax NPAR TESTS
/K-S(NORMAL)=X1 X2 Y
/STATISTICS DESCRIPTIVES
/MISSING ANALYSIS.
Resources Processor Time 00:00:00.000
Elapsed Time 00:00:00.007
Number of Cases Alloweda 131072
a. Based on availability of workspace memory.
[DataSet2]
Descriptive Statistics
N Mean Std. Deviation Minimum Maximum
X1 11 1223.45 1018.738 183 3279
X2 11 196.45 118.649 57 410
Y 11 100.55 56.557 40 205
One-Sample Kolmogorov-Smirnov Test
X1 X2 Y
N 11 11 11
Normal Parametersa Mean 1223.45 196.45 100.55
Std. Deviation 1.019E3 118.649 56.557
Most Extreme Differences Absolute .161 .158 .181
Positive .161 .158 .181
Negative -.154 -.131 -.142
Kolmogorov-Smirnov Z .535 .524 .599
Asymp. Sig. (2-tailed) .937 .947 .866
a. Test distribution is Normal.
DATASET ACTIVATE DataSet2.
DATASET CLOSE DataSet1.
SAVE OUTFILE='D:\Tugas Akhir dikumpulkan\Statistik SPSS\SPSS bener\no 2.sav'
/COMPRESSED

8/3/2019 olahan no 1-2
http://slidepdf.com/reader/full/olahan-no-1-2 23/29
/COMPRESSED.
* Curve Estimation.
TSET NEWVAR=NONE.
CURVEFIT
/VARIABLES=Y WITH X1
/CONSTANT
/MODEL=LINEAR
/PLOT FIT.
Curve Fit
Notes
Output Created 21-Dec-2011 15:32:18
Comments
Input Data D:\Tugas Akhir dikumpulkan\Statistik
SPSS\SPSS bener
o 2.sav
Active Dataset DataSet2
Filter <none>
Weight <none>
Split File <none>
N of Rows in Working Data File 11
Mi ss ing Val ue Hand li ng Defi ni tion of Missing User-de fined missi ng va lues are tr ea ted as
missing.
Cases Used Cases with a missing value in any variable
are not used in the analysis.
Syntax CURVEFIT
/VARIABLES=Y WITH X1
/CONSTANT
/MODEL=LINEAR
/PLOT FIT.
Resources Processor Time 00:00:00.577
Elapsed Time 00:00:00.548
Use From First observation
To Last observation
Predict From First Observation following the use period
To Last observation
Time Series Settings (TSET) Amount of Output PRINT = DEFAULT
Saving New Variables NEWVAR = NONE

8/3/2019 olahan no 1-2
http://slidepdf.com/reader/full/olahan-no-1-2 24/29
Maximum Number of Lags in
Autocorrelation or Partial
Autocorrelation Plots
MXAUTO = 16
Maximum Number of Lags Per
Cross-Correlation PlotsMXCROSS = 7
Maximum Number of New
Variables Generated Per
Procedure
MXNEWVAR = 60
Maximum Number of New
Cases Per Procedure MXPREDICT = 1000
Treatment of User-Missing
ValuesMISSING = EXCLUDE
Confidence Interval Percentage
ValueCIN = 95
Tolerance for Entering Variables
in Regression EquationsTOLER = .0001
Maximum Iterative Parameter
ChangeCNVERGE = .001
Method of Calculating Std.
Errors for AutocorrelationsACFSE = IND
Length of Seasonal Period Unspecified
Variable Whose Values Label
Observations in PlotsUnspecified
Equations Include CONSTANT
[DataSet2] D:\Tugas Akhir dikumpulkan\Statistik SPSS\SPSS bener\no 2.sav
Model Description
Model Name MOD_1
Dependent Variable 1 Y
Equation 1 Linear
Independent Variable X1
Constant Included
Variable Whose Values Label Observations in Plots Unspecified
Case Processing Summary
N
T l C 11

8/3/2019 olahan no 1-2
http://slidepdf.com/reader/full/olahan-no-1-2 25/29
Total Cases 11
Excluded Casesa 0
Forecasted Cases 0
Newly Created Cases 0
a. Cases with a missing value in any
variable are excluded from the analysis.
Variable Processing Summary
Variables
Dependent Independent
Y X1
Number of Positive Values 11 11
Number of Zeros 0 0
Number of Negative Values 0 0
Number of Missing Values User-Missing 0 0
System-Missing 0 0
Model Summary and Parameter Estimates
Dependent Variable:Y
Equation Model Summary Parameter Estimates
R Square F df1 df2 Sig. Constant b1
Linear .967 263.364 1 9 .000 33.755 .055
The independent variable is X1.

8/3/2019 olahan no 1-2
http://slidepdf.com/reader/full/olahan-no-1-2 26/29
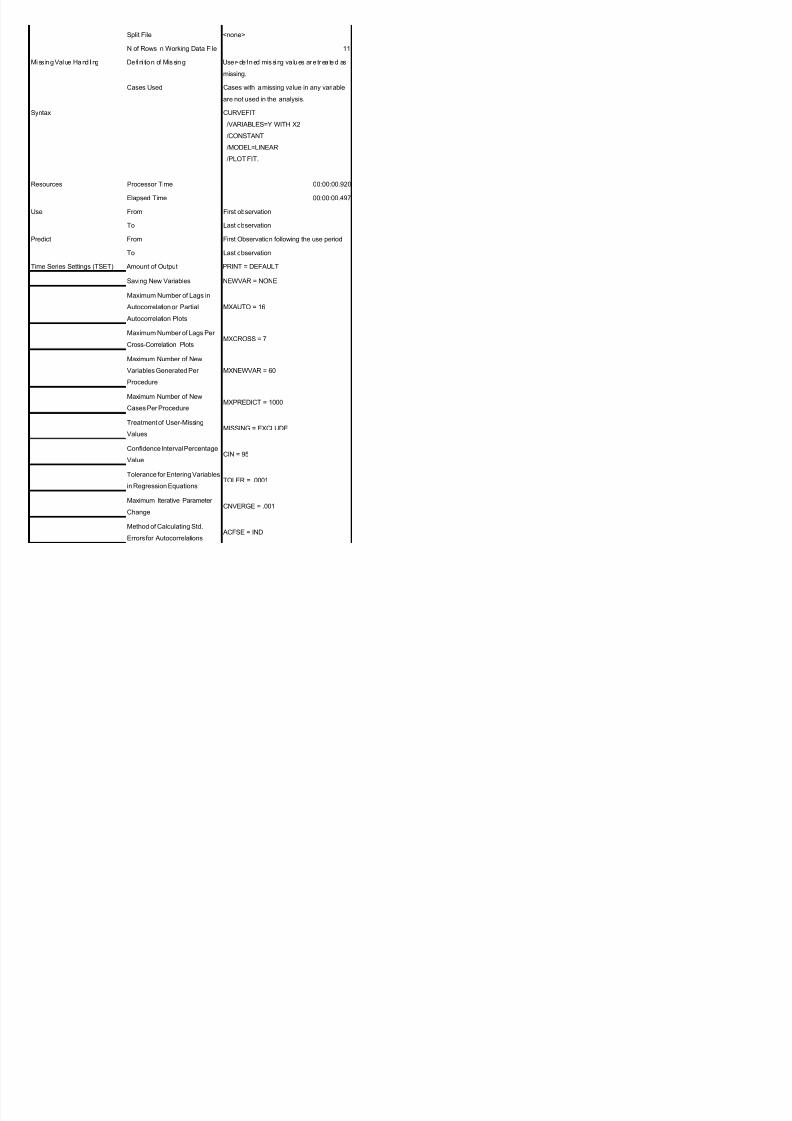
* Curve Estimation.
TSET NEWVAR=NONE.
CURVEFIT
/VARIABLES=Y WITH X2
/CONSTANT
/MODEL=LINEAR
/PLOT FIT.
Curve Fit
Notes
Output Created 21-Dec-2011 15:32:50
Comments
Input Data D:\Tugas Akhir dikumpulkan\Statistik
SPSS\SPSS bener
o 2.sav
Active Dataset DataSet2
Filter <none>
Weight <none>
Split File <none>
8/3/2019 olahan no 1-2
http://slidepdf.com/reader/full/olahan-no-1-2 27/29
Split File <none>
N of Rows in Working Data File 11
Mi ss ing Val ue Hand li ng Defi ni tion of Missing User-de fined missi ng va lues are tr ea ted as
missing.
Cases Used Cases with a missing value in any variable
are not used in the analysis.
Syntax CURVEFIT
/VARIABLES=Y WITH X2
/CONSTANT
/MODEL=LINEAR
/PLOT FIT.
Resources Processor Time 00:00:00.920
Elapsed Time 00:00:00.497
Use From First observation
To Last observation
Predict From First Observation following the use period
To Last observation
Time Series Settings (TSET) Amount of Output PRINT = DEFAULT
Saving New Variables NEWVAR = NONE
Maximum Number of Lags in
Autocorrelation or Partial
Autocorrelation Plots
MXAUTO = 16
Maximum Number of Lags Per
Cross-Correlation PlotsMXCROSS = 7
Maximum Number of New
Variables Generated Per
Procedure
MXNEWVAR = 60
Maximum Number of New
Cases Per ProcedureMXPREDICT = 1000
Treatment of User-Missing
ValuesMISSING = EXCLUDE
Confidence Interval Percentage
ValueCIN = 95
Tolerance for Entering Variables
in Regression EquationsTOLER = .0001
Maximum Iterative Parameter
ChangeCNVERGE = .001
Method of Calculating Std.
Errors for AutocorrelationsACFSE = IND
Length of Seasonal Period Unspecified

8/3/2019 olahan no 1-2
http://slidepdf.com/reader/full/olahan-no-1-2 28/29
Length of Seasonal Period Unspecified
Variable Whose Values Label
Observations in PlotsUnspecified
Equations Include CONSTANT
[DataSet2] D:\Tugas Akhir dikumpulkan\Statistik SPSS\SPSS bener\no 2.sav
Model Description
Model Name MOD_2
Dependent Variable 1 Y
Equation 1 Linear
Independent Variable X2
Constant Included
Variable Whose Values Label Observations in Plots Unspecified
Case Processing Summary
N
Total Cases 11
Excluded Casesa 0
Forecasted Cases 0
Newly Created Cases 0
a. Cases with a missing value in any
variable are excluded from the analysis.
Variable Processing Summary
Variables
Dependent Independent
Y X2
Number of Positive Values 11 11
Number of Zeros 0 0
Number of Negative Values 0 0
Number of Missing Values User-Missing 0 0
System-Missing 0 0

8/3/2019 olahan no 1-2
http://slidepdf.com/reader/full/olahan-no-1-2 29/29
Model Summary and Parameter Estimates
Dependent Variable:Y
Equation Model Summary Parameter Estimates
R Square F df1 df2 Sig. Constant b1
Linear .980 438.627 1 9 .000 7.847 .472
The independent variable is X2.