O’Hare Modernization Program (OMP) Surface … Draft 10/04/04 For Discussion Purposes Only Surface...
26
Final Draft 10/04/04 For Discussion Purposes Only Surface Transportation Modeling for the O’Hare Modernization Program 1 T:\015174022 OMP\Methodology\methodology 100404 rev.doc O’Hare Modernization Program (OMP) Surface Transportation Analysis Methodology Summary Introduction This report provides a general summary of some of the key methods and assumptions used in the surface transportation modeling process for the O’Hare Modernization Program (OMP). Two main methodological areas are discussed in this summary memorandum. The first is the travel demand modeling methodology and the second is the evaluation measures methodology. Additional detail on the methodology will be provided in the Surface Transportation Technical Notebook. Many resources were used to develop the information needed for the surface transportation analysis. The 2003 OMP Airport Layout Plan (ALP) and the OMP project matrix were key in determining the phases of the OMP program. A data collection effort was undertaken by Kimley-Horn and Associates, Inc. in 2002 to collect base year data for the OMP. This information as well as other resources cited in this report were used in developing the surface transportation analysis. The most significant components of the OMP affecting the surface transportation analysis are the construction of four parallel runways and a west terminal with western access. A secure people mover will be constructed between the West Terminal and Terminal 1, and a shuttle also will take passengers on the external roadways from the West Terminal and Terminal 1. Western access assumptions include: West Terminal and Terminal 1 passengers can access the Airport through either the east or west side of the airport. Passengers traveling to/from Terminals 2–6 can access the Airport through the West Terminal if they do not have checked baggage. Figure 1 shows the study area for the OMP Surface Transportation modeling and evaluation. The study area was bounded generally by River Road on the east, and Touhy Avenue/Higgins Road to the north. To the south, the study area was bounded by Irving Park Road, except between Busse Road and York Road where it extended to I-290. On the west, it was bounded by Busse Road south of Thorndale Avenue, extended west to I- 290 along Thorndale Avenue, and was bounded by Elmhurst Road north of Thorndale Avenue. A further study area confirmation was performed using model runs based on the CATS data, looking at intersections surrounding the study area. As a result of these exercises, the following intersections were added outside of the study area to be post- processed: Wood Dale Road and Irving Park Road Devon Avenue and Arlington Heights Road
-
Upload
truongdien -
Category
Documents
-
view
220 -
download
1
Transcript of O’Hare Modernization Program (OMP) Surface … Draft 10/04/04 For Discussion Purposes Only Surface...

Final Draft 10/04/04 For Discussion Purposes Only
Surface Transportation Modeling for the O’Hare Modernization Program
1
T:\015174022 OMP\Methodology\methodology 100404 rev.doc
O’Hare Modernization Program (OMP)
Surface Transportation Analysis Methodology Summary
Introduction
This report provides a general summary of some of the key methods and assumptions used in the surface transportation modeling process for the O’Hare Modernization Program (OMP). Two main methodological areas are discussed in this summary memorandum. The first is the travel demand modeling methodology and the second is the evaluation measures methodology. Additional detail on the methodology will be provided in the Surface Transportation Technical Notebook.
Many resources were used to develop the information needed for the surface transportation analysis. The 2003 OMP Airport Layout Plan (ALP) and the OMP project matrix were key in determining the phases of the OMP program. A data collection effort was undertaken by Kimley-Horn and Associates, Inc. in 2002 to collect base year data for the OMP. This information as well as other resources cited in this report were used in developing the surface transportation analysis.
The most significant components of the OMP affecting the surface transportation analysis are the construction of four parallel runways and a west terminal with western access. A secure people mover will be constructed between the West Terminal and Terminal 1, and a shuttle also will take passengers on the external roadways from the West Terminal and Terminal 1. Western access assumptions include:
West Terminal and Terminal 1 passengers can access the Airport through either the east or west side of the airport.
Passengers traveling to/from Terminals 2–6 can access the Airport through the West Terminal if they do not have checked baggage.
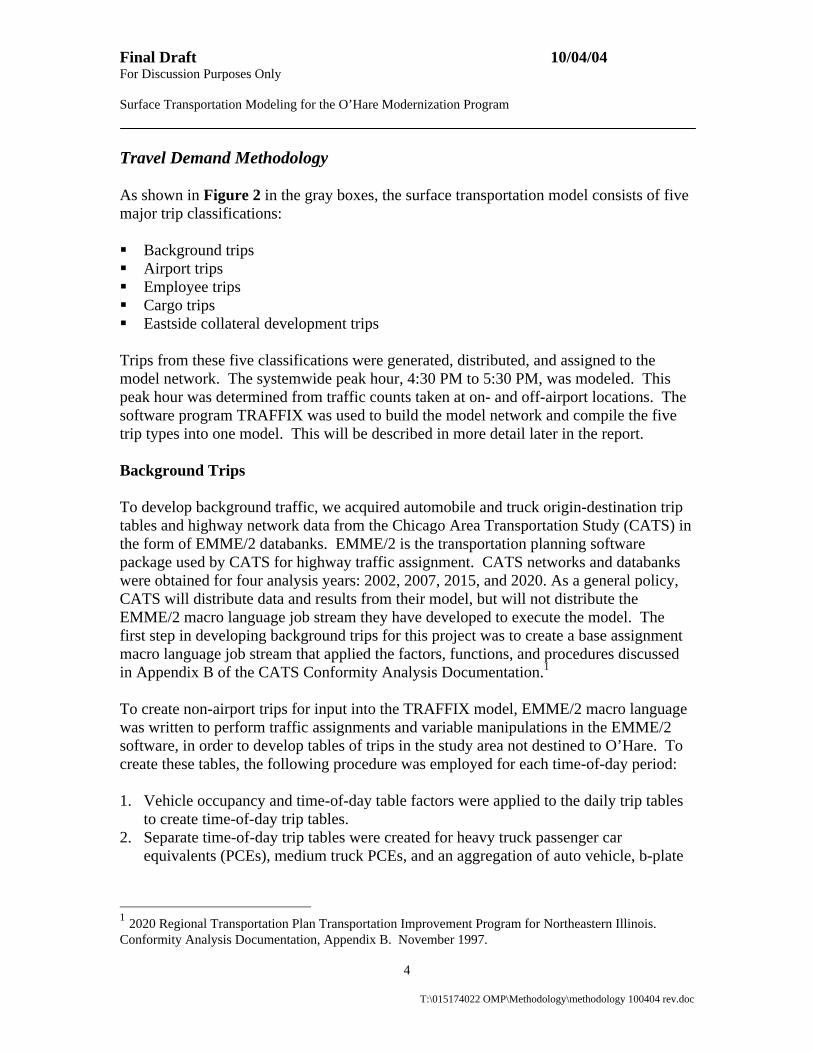
Figure 1 shows the study area for the OMP Surface Transportation modeling and evaluation. The study area was bounded generally by River Road on the east, and Touhy Avenue/Higgins Road to the north. To the south, the study area was bounded by Irving Park Road, except between Busse Road and York Road where it extended to I-290. On the west, it was bounded by Busse Road south of Thorndale Avenue, extended west to I-290 along Thorndale Avenue, and was bounded by Elmhurst Road north of Thorndale Avenue. A further study area confirmation was performed using model runs based on the CATS data, looking at intersections surrounding the study area. As a result of these exercises, the following intersections were added outside of the study area to be post-processed:
Wood Dale Road and Irving Park Road
Devon Avenue and Arlington Heights Road

Final Draft 10/04/04 For Discussion Purposes Only
Surface Transportation Modeling for the O’Hare Modernization Program
2
T:\015174022 OMP\Methodology\methodology 100404 rev.doc
Devon Avenue and Wood Dale Road
Irving Park Road and N. Addison Road
Irving Park Road and Prospect Avenue
Grand Avenue and Church Road
Figure 1. O’Hare Modernization Program Surface Transportation Study Area

Final Draft 10/04/04 For Discussion Purposes Only
Surface Transportation Modeling for the O’Hare Modernization Program
3
T:\015174022 OMP\Methodology\methodology 100404 rev.doc
Overall Approach
Figure 2 outlines the approach to the OMP Surface Transportation Modeling and Evaluation. Each component of this flow chart is discussed in this report.
Figure 2. O’Hare Modernization Program Surface Transportation Modeling Approach
CATS Travel Data
Flight Schedules
Background (Non-Airport)
Trips
Airport Trips Model (ALPS)
Cargo Trips
Base Year/ Design Year Traffic Data
Evaluation and Presentation of
Results
TRAFFIX Travel Estimate/ Projection
Eastside Development
Trips
Base Year Counts and Surveys for
Study Area
Employee Data
Employee Trips
CATS Network for Background Trips
(EMME/2)
Final Draft 10/04/04 For Discussion Purposes Only
Surface Transportation Modeling for the O’Hare Modernization Program
4
T:\015174022 OMP\Methodology\methodology 100404 rev.doc
Travel Demand Methodology
As shown in Figure 2 in the gray boxes, the surface transportation model consists of five major trip classifications:
Background trips
Airport trips
Employee trips
Cargo trips
Eastside collateral development trips
Trips from these five classifications were generated, distributed, and assigned to the model network. The systemwide peak hour, 4:30 PM to 5:30 PM, was modeled. This peak hour was determined from traffic counts taken at on- and off-airport locations. The software program TRAFFIX was used to build the model network and compile the five trip types into one model. This will be described in more detail later in the report.
Background Trips
To develop background traffic, we acquired automobile and truck origin-destination trip tables and highway network data from the Chicago Area Transportation Study (CATS) in the form of EMME/2 databanks. EMME/2 is the transportation planning software package used by CATS for highway traffic assignment. CATS networks and databanks were obtained for four analysis years: 2002, 2007, 2015, and 2020. As a general policy, CATS will distribute data and results from their model, but will not distribute the EMME/2 macro language job stream they have developed to execute the model. The first step in developing background trips for this project was to create a base assignment macro language job stream that applied the factors, functions, and procedures discussed in Appendix B of the CATS Conformity Analysis Documentation.1
To create non-airport trips for input into the TRAFFIX model, EMME/2 macro language was written to perform traffic assignments and variable manipulations in the EMME/2 software, in order to develop tables of trips in the study area not destined to O’Hare. To create these tables, the following procedure was employed for each time-of-day period:
1. Vehicle occupancy and time-of-day table factors were applied to the daily trip tables to create time-of-day trip tables.
2. Separate time-of-day trip tables were created for heavy truck passenger car equivalents (PCEs), medium truck PCEs, and an aggregation of auto vehicle, b-plate
1 2020 Regional Transportation Plan Transportation Improvement Program for Northeastern Illinois. Conformity Analysis Documentation, Appendix B. November 1997.

Final Draft 10/04/04 For Discussion Purposes Only
Surface Transportation Modeling for the O’Hare Modernization Program
5
T:\015174022 OMP\Methodology\methodology 100404 rev.doc
trucks, and light trucks. These trip tables excluded trips originating or destined to either of the O’Hare Traffic Analysis Zones (TAZ) (terminal or non-terminal).
3. A full assignment was performed for a given time-of-day scenario. The final loaded travel times from this assignment were saved to a network variable.
4. A network variable was created to mark links on the periphery of the study area and links to all TAZs within the study area as “gates.” Marking these links allows the storage of trip volumes that cross any pair of gates (i.e., pass through the study area).
5. The EMME/2 additional assignment option was used to assign the auto vehicle/B-plate truck/light truck, non-O’Hare submatrix to the network using travel times and paths from the full assignment.
6. Additional assignments were run using the stored paths and travel times from the full assignment to assign the non-O’Hare truck submatrices to the network.
7. A matrix of the gate-to-gate interchanges (traversal matrix) was stored for each of the non-O’Hare submatrices.
This procedure was repeated for each of the time-of-day periods. As noted in Appendix B of the Conformity Analysis Documentation, for time periods two through eight, the loaded link time from the final iteration of the previous time period’s full assignment was used as the link travel time for the first iteration of that period’s assignment.
Following completion of a run of all time-of-day periods, the submatrices for each time period were imported into a spreadsheet. The PM peak period used by CATS is from 4 PM to 6 PM. A conversion factor of 0.5 was applied in order to convert the two-hour PM peak period matrices to a PM peak hour.
Network – The CATS action scenarios (which include expansion of O’Hare) were used as the basis of future year networks. The 2015 CATS network was used as the basis for obtaining 2018 trips. Assumptions for the background network were based on information from the Transportation Improvement Program (TIP), 2020 Long Range Plan, and the Unified Work Plan, as summarized in the project matrix. The CATS networks were modified as necessary to reflect the OMP assumptions.
Trip Generation – Trip tables were provided for each EMME/2 databank provided by CATS. In some instances, it was necessary to interpolate trip tables for OMP analysis years that did not have a corresponding trip table developed by CATS. For example, CATS does not use a 2018 analysis year, so trip tables for 2018 were derived through linear interpolation of the 2015 and 2020 trip tables. Generation of trips entering and leaving the study area is captured in the traversal matrix, as described above. This traversal matrix captures all trips entering or leaving the study area boundary or any TAZ within the boundary, except those trips originating at or destined for the O’Hare TAZs.

Final Draft 10/04/04 For Discussion Purposes Only
Surface Transportation Modeling for the O’Hare Modernization Program
6
T:\015174022 OMP\Methodology\methodology 100404 rev.doc
Trip Distribution – As described above, a traversal matrix was calculated for the O’Hare study area (see Figure 1). This traversal matrix provides the distribution of all trips entering and leaving the study area.
Trip Assignment – Paths were assigned in TRAFFIX for trips from each gate to every other gate in the study area. The roadways that cross the study area boundary in the CATS network are gates in the TRAFFIX model, as are the TAZs that lie within the study area in the CATS network.
Airport Trips
Airport modeling was performed using the Advanced Landside Performance System, ALPS 2000TM (ALPS), software developed by Kimley-Horn and Associates, Inc. The ALPS program uses the flight schedule and assigned passenger and vehicle characteristics to quantify the overall flows of people, baggage, and vehicles throughout the airport for 24 hours.
The airport passenger and vehicle characteristics, such as mode split and vehicle occupancy, were obtained from the 2002 data collection effort and were used as an input into the ALPS model. More detail on the ALPS network, trip generation, distribution and assignment, and the ALPS calibration are provided in the following sections.
Network – The ALPS networks were based on existing conditions information and were modified based on the OMP project matrix and the OMP ALP for each alternative. The With Project roadway networks were based on the 2003 Future Year ALP. The Terminals 1, 2, 3, and 5 curbfronts were assumed to remain the same, the Terminal 4 curbfront was assumed to mirror the Terminal 3 curbfront, and the Terminal 6 curbfront was based on the Terminal 6 layout in the ALP and the access plans for Terminal 6. The west side terminal roadway layout was based on the ALP and plans for the OMP Project Definition Report.2 The locations of public parking facilities were based on parking location and supply in the project matrix and in the OMP Master Plan report.3
For these modeling purposes, the ALPS model network was simplified from the larger TRAFFIX network to represent only the roadways in the immediate vicinity of the airport. The ALPS model had a series of boundary nodes directly outside of the Airport boundaries.
Trip Generation – Trip generation is based on the approved origin/destination (O/D) air passenger flight activity data provided by Ricondo & Associates for each alternative year. Table 1 below shows the annual O/D enplanements for each
2 OMP Project Definition Report. Ricondo & Associates. 2003. 3 OMP Master Plan Report. Ricondo & Associates. 2003.

Final Draft 10/04/04 For Discussion Purposes Only
Surface Transportation Modeling for the O’Hare Modernization Program
7
T:\015174022 OMP\Methodology\methodology 100404 rev.doc
alternative. Arrival and departure curves, mode split, parking, and vehicle occupancy data were used in the ALPS model to convert the air passenger flight activity data into vehicular arrivals and departures at various airport locations (curbfronts and parking lots). The passenger early arrival curve, mode of arrival, parking locations, and visitor assumptions were based on data collected during the 2002 passenger survey. It was assumed that passengers departing the airport would have characteristics similar to passengers arriving at the airport.
Table 1. Annual O/D Enplanements by Alternative Year
With Project No Action Base Year 15,956,000 N/A 2007 18,434,500 18,404,500 2009 19,692,000 19,364,500 2013 22,702,500 21,504,000 2018 27,251,500 24,775,500
Trips were also generated for the O’Hare Hilton Hotel, which is located in the Core Terminal area and shares roadway and parking facilities with the Airport. Trips were generated for the Hilton based on ITE trip generation rates, which were adjusted to account for the unique characteristics of the O’Hare Hilton, an airport-oriented hotel, compared to a typical hotel.
Trip Distribution – General trip distribution to the ALPS boundary nodes was based on the 2002 passenger survey. These data were reconciled with traffic counts at parking lot entrances/exits and directional distributions of each mode. These trips were then distributed from the ALPS boundary nodes to the TRAFFIX gates. The TRAFFIX gates were then grouped together and assigned to the most logical ALPS boundary node based on TRAFFIX gate locations and the roadway network surrounding the ALPS boundary node. In very few cases, a TRAFFIX gate could be served by more than one ALPS boundary node. The airport trips were further distributed from the ALPS nodes to the TRAFFIX gates based on a select link analysis. This select link analysis was performed in EMME/2 to determine the distribution of airport trips entering/exiting the airport in the EMME/2 model. A weighted distribution of these trips was then used to distribute the trips to the TRAFFIX gates.
Trip Assignment – Paths are developed in the ALPS model based on the shortest travel time unless a path has been signed to indicate a specific manner of access and egress. Where multiple paths exist, a manual split of the path was used based on observed traffic patterns. The curbfront assignment is based on vehicles that are permitted to use each curb and the dwell time associated with the vehicles, as

Final Draft 10/04/04 For Discussion Purposes Only
Surface Transportation Modeling for the O’Hare Modernization Program
8
T:\015174022 OMP\Methodology\methodology 100404 rev.doc
measured during the 2002 Surface Transportation Survey. The trips were assigned using manual path assignment in TRAFFIX using the most likely path to distribute trips to/from the Airport.
Employee Trips
Network – Employee trips use the airport roadway network to access the parking facilities. All employee trips originate or terminate in the following parking areas:
Northwest Hangar Area
AMC Area
Southwest Cargo Area
Terminal Core Area (Lots A, B, and C)
Lot D
Lot E
Lot F
Trip Generation – Employee trip generation is based on the base year, non-confidential badge information obtained from the O’Hare Badging Office. This badge information includes employer, badge type, and home ZIP code for each badged employee. Badged employees with residential locations outside of the Chicagoland area were assumed to work only occasionally at the airport and were thus removed from the database. The remaining list of badged employees was then factored to determine the number of employees leaving the airport during a typical PM peak hour. The factors were based on information on employee behavior collected through surveys of the top ten airport employers. For future years, the number of terminal-based employees (such as flight crews, ticketing agents, and terminal security personnel) was generated using a relationship between the base year and respective future year enplanement growth. The increase in the number of cargo employees was generated using a relationship between the base year and respective future year cargo tonnage amounts.
In most cases, the individual employee parking lot information was based on data collected for each lot in 1999, such as peak hour entering and exiting vehicles. During the 2002 Surface Transportation Survey effort, the occupancy was recorded for nine of the larger employee parking areas around the airport. These lots contain a majority of the parking spaces for employees at the airport. Using this information, a relationship was developed between these lot occupancies observed in 1999 and the occupancies observed in 2002. This relationship was applied to the smaller employee lots to determine their occupancy and entering/exiting vehicles in 2002. For future years, the occupied spaces in each lot were determined by one of three methods:

Final Draft 10/04/04 For Discussion Purposes Only
Surface Transportation Modeling for the O’Hare Modernization Program
9
T:\015174022 OMP\Methodology\methodology 100404 rev.doc
Public parking lot occupancies were based on the results of the ALPS model for the future year with the appropriate employees included.
Occupancies of employee parking lots associated with cargo facilities were increased based on the increase in cargo tonnage from the base year to the future year.
Occupancies of all other employee parking lots were increased based on the increase in enplanements between the base year and the future year.
The entering/exiting volumes were then grown based on the increase in occupied spaces from the base year to the future year. This was done by first determining the ratio between the future year occupancy and the base year occupancy. The base year entering and exiting volumes were then multiplied by this ratio to obtain the future year entering and exiting volumes.
As an example, the estimated terminal and cargo employment for the 2018 With Project Alternative are shown in Table 2. Employees for all other alternatives were determined in a similar manner. For all future year alternatives, an additional modification was made for Transportation Security Administration (TSA) employees. We anticipate that the TSA will use more employees per security checkpoint in the future than were used in the base year as the TSA role increases.
Table 2. Estimated Growth in Employees
Base Year (2002) 2018 With Project Annual Enplanements 32,918,936
50,372,000
Terminal Employees 2,422
3,706
Annual Cargo Tonnage 1,288,818
2,565,890
Cargo Employees 645
1,284
Trip Distribution – Employee ZIP code information from the badging office was used to determine the cardinal direction of approach (north, south, east, or west) to the airport for all airport employees. Many employees also use the Chicago Transit Authority (CTA) Blue Line to travel to O’Hare. Data on the number of CTA passengers on the Blue Line was collected during the 2002 survey4. Based on past findings of the CTA, approximately two-thirds of the passengers using the Blue Line at this location were airport employees. These trips were further distributed to TRAFFIX gates using a select link analysis. This select link analysis was performed in EMME/2 to determine the distribution of employee trips entering/exiting the
4 2002 Surface Transportation Survey. Kimley-Horn and Associates, Inc. Revised July 2002.

Final Draft 10/04/04 For Discussion Purposes Only
Surface Transportation Modeling for the O’Hare Modernization Program
10
T:\015174022 OMP\Methodology\methodology 100404 rev.doc
airport in the EMME/2 model. A weighted distribution of these trips was then used to distribute the trips in the TRAFFIX model to the TRAFFIX gates.
Trip Assignment – Chicago Area Transportation Study (CATS) data were used to distribute the employee traffic among the roadway links exiting and entering the study area in each cardinal direction of travel. The assignment of employee traffic was based on the distribution of airport employee traffic used by CATS.
Employee Overflow – In some of the No Action alternatives, all employees could not be accommodated in their desired lots due to limited capacity, creating an overflow situation. This resulted in the need to accommodate the excess employees elsewhere, by reallocating them to other lots around the Airport. Employee parking in public lots was determined using a two-step process. First, a number of parking spaces were held in reserve during the airport trips modeling process to accommodate a minimum number of the employees desiring to park in the public lots. Next, the available occupancy in these lots was determined for the different alternatives based on the results from the ALPS analysis. Once the number of employees that could be accommodated in the public lots was determined, the remaining employees were overflowed to other lots around the Airport.
Cargo Trips (Truck Trips)
Network – All cargo trips terminate at the cargo areas listed below:
AMC/O’Hare Express Center Area
South Cargo Area
Northwest Cargo Area
O’Hare Express Center North Area (future year alternatives)
Trip Generation – The base year cargo (truck) trips were based on the existing driveway counts into and out of the cargo facilities. Truck trips were assumed to account for 10% of the driveway volumes based on truck traffic for similar developments. To determine the future cargo trips, a linear relationship between growth in cargo tonnage and growth in cargo trips was assumed. Based on the projected cargo tonnage in the future year, future cargo trips were determined.
Trip Distribution – The truck trip distribution was determined using the truck trips in the CATS data. The percentage of trips entering/leaving the study area on each roadway link was based on the relative volume of background truck traffic on each of those links. The medium and heavy traversal matrices from the EMME/2 model run were used to determine the origins/destinations of the cargo truck trips.

Final Draft 10/04/04 For Discussion Purposes Only
Surface Transportation Modeling for the O’Hare Modernization Program
11
T:\015174022 OMP\Methodology\methodology 100404 rev.doc
Trip Assignment – CATS data were used to distribute the cargo traffic among the roadway links exiting and entering the study area in each cardinal direction of travel.
Eastside Collateral Development Trips
Network – The Eastside Collateral Development is a group of land uses located on Airport property south of Higgins Road, west of Mannheim Drive, east of the Airport, and north of I-190. The Eastside Development roadway network is based on the O’Hare Eastside Plan prepared by Jones Lang Lasalle in 2000. The Eastside Development Traffic Impact Analysis report (Kimley-Horn and Associates, Inc., 2000) contains the details for the roadway network. This roadway layout was modified because of the closely spaced north parallel runway in the OMP. Other modifications were made to accommodate the 2003 Airport Layout Plan (ALP), including the relocation of the Lot E parking garage and the relocation of Bessie Coleman Drive.
Trip Generation – Trip generation was based on the Eastside Development Traffic Impact Analysis report; it was reduced due to the decrease in buildable land caused by the additional runways in the OMP and the shifting of Lot E parking to the north. The OMP-modified Eastside Collateral Development assumptions are shown in Table 3. Table 3 also shows the revised trip generation for the Eastside Development for the 2013/2018 With Project and the 2009 With Project Alternatives. In the 2009 With Project Alternative, the Eastside Development is not fully built-out; the office and warehouse parcels are built to 50%.
Table 3. PM Peak Hour Eastside Development Trip Generation
2009 With Project Alternative
2013/2018 With Project Alternative
Land Use In Out In Out
Single Corporate Office (1,000,000 sf) (50% Built in 2009 With Project Alternative)
77 619 153 1237
Police Facility1
(32,000 sf) 47 70 47 70
Warehouse/Cargo Space (500,000 sf) (50% Built in the 2009 With Project Alternative)
40 93 79 185
1There is not a specific land use for a police facility in the ITE Trip Generation Manual. The land use for a medical/dental office was used because it is expected that the trips generated by this land use will be similar to or greater than the trips generated by a police facility.

Final Draft 10/04/04 For Discussion Purposes Only
Surface Transportation Modeling for the O’Hare Modernization Program
12
T:\015174022 OMP\Methodology\methodology 100404 rev.doc
Trip Distribution – The trip distribution was based on the Eastside Development Traffic Impact Analysis report and revised due to changes in land use. Once the distribution out of the immediate Eastside Development area was determined, the trips were further distributed to TRAFFIX gates using a select link analysis. A select link analysis of trips entering/exiting the airport in EMME/2 was used to distribute the trips to the TRAFFIX gates. The select link analysis creates a weighted distribution based on the trips generated in the EMME/2 model for each gate in the TRAFFIX model.
Trip Assignment – The trip assignment used the roadway assignments from the Eastside Development Traffic Impact Analysis report as the starting point for the assigned paths. CATS data were used to distribute the Eastside Development trips beyond the immediate Eastside Development area. The assignment of Eastside Development traffic was based on the distribution of employee traffic used by CATS.
TRAFFIX Model
The TRAFFIX roadway network was defined based on the 2003 ALP, the CATS network in the OMP study area, and the assumptions detailed in the project matrix. All external gates and traffic analysis zones from the CATS network as well as all airport generators were represented in the TRAFFIX model as gates and zones that acted as sources and sinks (locations where traffic enters and leaves the network) for trips. Paths for each gate and zone to each gate and zone were manually input using the most likely path, taking into consideration factors such as projected travel time and shortest logical path. In general, paths were routed to the interstate highways, the highest functional class of road, whenever possible.
Origin/destination (O/D) matrices were formed for each of the trip classifications listed above (airport, background, cargo, eastside, and employee) based on the trip generation and distribution methodology for each trip classification. These O/D matrices were summed to create a master O/D matrix for the scenario. This matrix was then entered into the TRAFFIX model and assigned to the roadways in TRAFFIX using the defined paths.
Running the TRAFFIX model produced a file containing the turning movement volumes at each intersection. These volumes were then exported for use in the link and intersection analysis.
Calibration/Validation
The OMP surface transportation model was calibrated in two stages. First, calibration of individual trip types was performed. The most significant part of this effort was the calibration of the ALPS model.

Final Draft 10/04/04 For Discussion Purposes Only
Surface Transportation Modeling for the O’Hare Modernization Program
13
T:\015174022 OMP\Methodology\methodology 100404 rev.doc
R2 is a measure of goodness of fit that can range in value from 0 to 1. An R2 value that is close to one has a very good correlation between the modeled volumes and the count data. The aggregate R2 for a system model should be at least 0.885. For the OMP ALPS model, R2 was calculated as 0.98, which shows very high correlation between the count volumes and the model volumes.
Percent root mean squared error (%RMSE) is a measure that provides a normalized, weighted average of the differences between count volumes and model volumes on individual links. According to the Montana Department of Transportation (DOT), the aggregate %RMSE should be less than 30%6. For the OMP ALPS model, %RMSE was calculated as 12.48%.
For employee trips and cargo trips, calibration was performed at locations in the study network where these trips accessed the airport. Adjustments were made to the number and distribution of trips to better match the intersection counts performed during the data collection effort.
The TRAFFIX model was calibrated manually, primarily by applying adjustment factors to the O/D background trip tables derived from the CATS data. These additive and multiplicative adjustment factors were applied to individual O/D pairs to calibrate at the link and intersection level. The intersection entrances and exits at major facilities were also calibrated to the base year counts.
The Model Validation and Reasonableness Checking Manual7 was used to guide the OMP TRAFFIX model validation effort. At the first stage of the validation effort, the percent differences between count volumes and model volumes were calculated for individual links in the study area. Model volumes were compared to count volumes at 134 locations in the study area. At 78% of these locations, the model volume was within ±20% of the count volume. At 16% of these locations, the model volume was between ±20% and ±50% of the count volumes. At only 5% of the locations was the model volume greater than ±50% of the count volume. Figure 3 shows a scattergram of the model volumes versus the count volumes.
5 Model Validation and Reasonableness Checking Manual. Prepared for Travel Model Improvement Program, Federal Highway Administration. Barton-Aschman Associates, Inc. and Cambridge Systematics, Inc., February 1997 6 Ibid. 7 Ibid.

Final Draft 10/04/04 For Discussion Purposes Only
Surface Transportation Modeling for the O’Hare Modernization Program
14
T:\015174022 OMP\Methodology\methodology 100404 rev.doc
Model Volume vs. Count Volume
0
1000
2000
3000
4000
5000
6000
7000
8000
0 1000 2000 3000 4000 5000 6000 7000 8000
Count Volume
Mo
del
Vo
lum
e
Figure 3. Scattergram of Volumes
For the OMP TRAFFIX model, R2 was calculated as 0.9835, which shows very high correlation between the count volumes and the model volumes. The aggregate %RMSE and the %RMSE for several volume categories are shown in Table 4.
Table 4. Percent Root Mean Square Error
Count Volume
Range Number of
Observations
%RMSE
0-500 39 33.47 500-1,000 24 14.21
1,000-5,000 54 12.63 5,000+ 17 8.40
All Values 134 13.82
The %RMSE standard of 30% is met for the model as a whole (which has a %RMSE of 13.82%). As expected, the %RMSE is lower for high-volume facilities, where the difference between the model volumes and count volumes is a small percentage of the volume. On low-volume facilities, the absolute difference between count volumes and model volumes is still low, but comprises a higher percentage of the volume. It is acceptable for the %RMSE to be greater than 30% for these facilities.

Final Draft 10/04/04 For Discussion Purposes Only
Surface Transportation Modeling for the O’Hare Modernization Program
15
T:\015174022 OMP\Methodology\methodology 100404 rev.doc
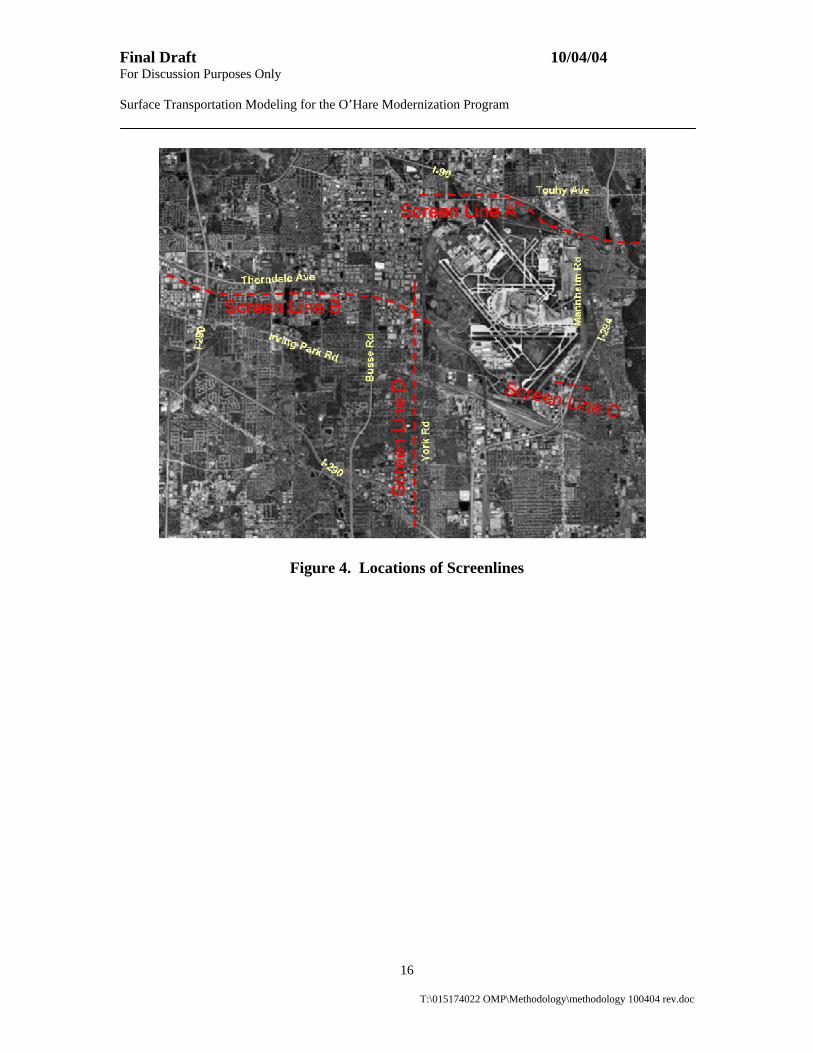
In addition to evaluating the percent difference for individual links, another essential element of the calibration is to look at the volumes crossing screenlines throughout the network. A reasonable standard for screenlines is that the count volumes and the modeled volumes should be within ±5% (Michigan DOT). Four screenlines were evaluated in the OMP model network. The volumes on these screenlines, along with the percent difference, are shown in Table 5. Two of the four screenlines meet the ±5% standard, and a third is very close to the standard. The locations of the screenlines are shown in Figure 4.
Table 5. Screenlines
Screenline
Location Count Volume
Model Volume
% Difference
A North of
Touhy Avenue 21,242 20,803 -2.1%
B South of
Thorndale Avenue 19,955 18,881 -5.4%
C South of
Irving Park Road 14,660 15,954 8.8%
D West of
York Road 14,925 14,418 -3.4%
Final Draft 10/04/04 For Discussion Purposes Only
Surface Transportation Modeling for the O’Hare Modernization Program
16
T:\015174022 OMP\Methodology\methodology 100404 rev.doc
Figure 4. Locations of Screenlines

Final Draft 10/04/04 For Discussion Purposes Only
Surface Transportation Modeling for the O’Hare Modernization Program
17
T:\015174022 OMP\Methodology\methodology 100404 rev.doc
Evaluation Measures Methodology
Once the surface transportation model was complete, the surface transportation components were evaluated. These components include:
Roadway elements
Intersection elements
Parking elements
Curbfront elements
The peak hour for the surface transportation analysis is 4:30 PM – 5:30 PM. This peak hour, the system-wide peak-hour, is a combination of the airport and off-airport peak.
Roadways
Roadway Link Volumes
Peak-hour link volumes were extracted from the TRAFFIX model output. Daily link volumes were derived by determining the percentage of total daily traffic occurring in the PM peak hour (4:30 PM – 5:30 PM) using temporal factors. The temporal factors were calculated from the machine traffic count data collected in 15-minute intervals during the 2002 Surface Transportation Survey. The modeled traffic volumes were then divided by the percentage of daily traffic occurring in the peak hour for on- and off-airport locations, in order to obtain a projection of daily traffic on selected links within the study area.
Roadway Link Width and Number of Lanes
Roadway link width and number of through lanes were provided for all alternatives. These factors were based on existing conditions and include the implementation of any planned improvements applicable to each future-year alternative based on the OMP project matrix.
Volume-to-Capacity Ratios
The overall operating performance of roadway links is determined by the relationship between traffic volumes and the capacity of the roadway. When this volume-to-capacity (V/C) ratio is greater than 1.0, the road is over capacity, based on a theoretical estimate of capacity as explained in the next paragraph.
The peak-hour V/C ratios were determined using traffic volumes from the TRAFFIX model. Link volumes reported by the model and the capacities of the roadways were used to determine the V/C ratios. Capacities of the roadways were determined using

Final Draft 10/04/04 For Discussion Purposes Only
Surface Transportation Modeling for the O’Hare Modernization Program
18
T:\015174022 OMP\Methodology\methodology 100404 rev.doc
Table A-1 in Appendix B of the CATS 2020 Regional Transportation Plan8 for Northeastern Illinois. This table estimates capacity based on characteristics such as roadway width, availability of on-street parking, and the surrounding land use. Roadway widths were determined using aerial photography, as well as field measurements and observations.
Link Speeds
The peak-hour link speeds for arterials were determined using a formula adapted from the Bureau of Public Roads (BPR) curves. The following formula has been used by CATS and other agencies:
98.30
075.0/153.0249.0ln
1
CVSSS
Where:
S0 = Initial speed on link (mph) S = Speed on link used for emission calculation (mph) V = Volume on link C = Capacity of Link
For freeways, the following equations are used:
115.1
1
115.1
1
15.1
1
80
80
CVforCV
SS
CVforCVCV
SS
Typically, the initial speed on the link was assumed to be the same as the posted speed limit. However, because speed limits are not posted on all of these links and because some of the links do not yet exist, reasonable speed limits were estimated when necessary.
The volumes were taken from the roadway link volume tables. Capacities were determined as described above.
To determine daily link speeds, the traffic volumes on each roadway during each hour of the day were estimated using the daily temporal distributions (discussed below) and the estimated total daily traffic. Based on these volumes, link speeds were
8 2020 Regional Transportation Plan Transportation Improvement Program for Northeastern Illinois. Conformity Analysis Documentation, Appendix B. November 1997.

Final Draft 10/04/04 For Discussion Purposes Only
Surface Transportation Modeling for the O’Hare Modernization Program
19
T:\015174022 OMP\Methodology\methodology 100404 rev.doc
calculated for each hour of the day using the same methodology used for the peak hour, as previously discussed. The daily speeds were determined by calculating the average of the hourly speeds, weighted by hourly volume.
Vehicle Classifications
Vehicle classifications were determined for both on-airport and off-airport facilities. For the on-airport facilities, vehicle classifications were taken from the ALPS model. For off-airport facilities, vehicle classifications provided by the Illinois Environmental Protection Agency for each analysis year were used.
Temporal Distributions
Temporal distributions were established for the roadway volumes based on machine traffic count information collected during the 2002 Surface Transportation Survey. Separate temporal distributions were calculated for the on-airport and off-airport roadways. To calculate the temporal distributions, the total volumes for all days from all relevant machine traffic count locations were summed for each hour of the day. The hourly sums were divided by the sum of all daily traffic to determine the percentage of the total daily traffic occurring in each hour of the day.
Intersections
Intersection Peak-Hour Approach Speed
Approach speeds were calculated for each approach of every signalized intersection under analysis for all alternatives. Existing approach speeds were gathered through field observations as part of the 1999 Surface Transportation Data Collection Program by Kimley-Horn and Associates, Inc.
Scatter plots were developed, based on data collected in the 1999 Surface Transportation Data Collection Program, to formulate a relationship between the approach volumes, the number of lanes, and the approach speeds. The first scatter plot shows peak-hour approach speeds versus peak-hour approach volumes across all relevant observations in the data collection report. The second scatter plot shows peak-hour approach speeds versus the number of lanes along the various approaches across all relevant observations in the data collection report. These two scatter plots are shown as Figures 5 and 6, respectively.
Figure 5 suggests that as the volume along an approach increases, the variability in observed speed decreases, and tends to converge towards 35 miles per hour (mph). Similiarly, Figure 6 shows that as the number of lanes along an approach increases,

Final Draft 10/04/04 For Discussion Purposes Only
Surface Transportation Modeling for the O’Hare Modernization Program
20
T:\015174022 OMP\Methodology\methodology 100404 rev.doc
the variability in observed speed decreases, and also tends to converge towards 35 mph.
Therefore, for approaches where forecast traffic volumes are expected to be greater than 3,000 vehicles per hour, or where the number of lanes on an intersection approach is expected to be 6 or more, an intersection approach speed of 35 mph was
Peak Hour Speeds Versus Number of Lanes at Intersection
0
10
20
30
40
50
60
0 1 2 3 4 5 6 7 8
No. Lanes at Intersection on Approach
Sp
eed
(m
ph
)
Figure 6. Peak-Hour Speeds Versus Number of Lanes at Intersection
Figure 5. Peak-Hour Volumes Versus Peak-Hour Speeds
Peak Hour Volumes Versus Peak Hour Speeds
0
500
1000
1500
2000
2500
3000
3500
4000
0 10 20 30 40 50 60
Observed Speeds (mph)
Ap
pro
ach
Vo
lum
es (
veh
/hr)

Final Draft 10/04/04 For Discussion Purposes Only
Surface Transportation Modeling for the O’Hare Modernization Program
21
T:\015174022 OMP\Methodology\methodology 100404 rev.doc
used. In cases where forecast traffic volumes along an approach are expected to be less than 1,000 vehicles per hour, or the number of lanes at an intersection for an approach is expected to be two or less, there is greater variability in approach speeds. In these situations, the approach speed observed in 1999 for the Surface Transportation Data Collection Program was used as the basis for the forecast approach speed. If the approach did not exist in 1999 (for instance, approaches associated with the future Eastside Collateral Development), then knowledge of the future approach characteristics was used to estimate the future travel speeds for the approach using the data shown in Table 6. Table 6 displays the intersection approach speeds used based on the number of lanes for an intersection approach and the forecast traffic volume for an approach. The values displayed in Table 6 are based on the data collected in the 1999 report
Table 6. Intersection Approach Speeds Based on Lanes and Volumes
Volume Range Lanes Lower Upper 3 4 5 2,500 3,000 37 36 37 2,000 2,500 35 34 35 1,500 2,000 32 31 32 1,000 1,500 32 31 32
0 1,000 30 30 30
Signalized Intersection Traffic Analysis
The signalized intersection analysis was conducted using Synchro, Version 5.0. This program uses the techniques described in the Highway Capacity Manual 2000 (HCM) to analyze the efficiency of traffic operations at signalized intersections. Inputs for Synchro include traffic volumes, lane configurations, and traffic signal timings (phasings, cycle lengths, and phase splits). Analyses were run for weekday afternoon peak-hour conditions. The Synchro analyses are provided for all of the intersections for each alternative.
Several global assumptions were made to perform the signalized intersection analyses. The global assumptions relevant to this analysis include:
120-second cycle lengths
4-second yellow phases
2-second red phases

Final Draft 10/04/04 For Discussion Purposes Only
Surface Transportation Modeling for the O’Hare Modernization Program
22
T:\015174022 OMP\Methodology\methodology 100404 rev.doc
Optimized phase splits
Uncoordinated signals
The 120-second cycle length assumption is consistent with the cycle lengths assumed for the signalized traffic analyses performed for the Eastside development traffic study. In addition, the 120-second cycle length is close to the actual cycle lengths observed in the 1999 Surface Transportation Data Collection Program conducted by Kimley-Horn and Associates, Inc.
The 4- and 2-second yellow and red phases, respectively, are based on field observations from the 1999 Surface Transportation Data Collection Program.
Phase splits were optimized for every intersection analysis. Field observations in 2002 indicated actuated signal operations for existing intersections; it is assumed that future intersections also will also have actuated signal operations.
Intersection Red Time Analysis
Intersection red times were determined for all signalized intersections in the study area for each alternative. The intersection red times were calculated by determining the amount of time a vehicle is at a stopped position during each cycle, based on the optimized phase splits determined in the Synchro analysis. Red times were calculated for all movements on all approaches at every intersection.
Intersection Layout Drawings
Intersection layout drawings at a scale of 1” = 100’ are provided for all analyzed intersections. Information used to create these drawings included data collected in the field, aerial photography, and in the future year alternatives, information presented on the ALP and in the OMP project matrix.
Parking Analysis
Parking Analysis Tables
The data contained in the parking tables includes:
Lot identification and location
Lot status (base year, expansion, relocation, new)
Primary lot user (employee, public, other)
Projected parking capacity, occupancy, and percent occupancy
Vehicle mix (percent autos and trucks)
Projected entering and exiting volumes (daily and PM peak hour)

Final Draft 10/04/04 For Discussion Purposes Only
Surface Transportation Modeling for the O’Hare Modernization Program
23
T:\015174022 OMP\Methodology\methodology 100404 rev.doc
Average travel distance from center of lot or structure to parking exit
Average travel speed in parking lot or structure
Exit delays (relevant only to parking areas with exit plazas, i.e., public parking and rental car areas)
Exit queues (relevant only to parking areas with exit plazas, i.e., public parking and rental car areas)
Exit lanes present/open during the peak and over a 24-hour period (relevant only to parking areas with exit plazas, i.e., public parking and rental car areas)
The following are assumptions that were used in the development of the parking analysis tables:
The project matrix prepared by Ricondo & Associates was used to determine the parking relocations, closures, openings, and expansions necessary for future parking conditions.
Public parking locations were based on existing locations for the base year and the ALP and the OMP project matrix for all future year alternatives.
Employee parking locations were assumed to remain in the same location as in the base year unless otherwise specified in the project matrix or in cases where employees were diverted due to overflow conditions.
Public parking demand (number of trips entering and exiting was taken from the surface transportation model).
Base year terminal employee parking demand (occupancy and entrances/exits) was assumed to increase from the 1997 demand based on the ratio of employee occupancy between 2002 and 1997.
Terminal employee parking demand (occupancy and entrances/exits) for future year alternatives was assumed to increase in relation to the total projected enplanement growth from 2002 to each future year, while the cargo lots were assumed to increase based on the total tonnage growth in cargo from 2002 to each future year.
Parking demand (occupancy and entrances/exits) associated with the rental car lots was assumed to increase with expected growth in O/D enplanements from 2002 to each future year.
Future year parking demand (occupancy and entrances/exits) associated with the Eastside development was modified for OMP based on the revised OMP Eastside Collateral Development plan.
Exit plaza delays and queue lengths were assumed to remain consistent with 1999 values for public parking facilities and the consolidated rental car facility. They are assumed to be negligible at the Commercial Vehicle Holding Area (CVHA), employee parking lots, and parking facilities associated with the Eastside development.

Final Draft 10/04/04 For Discussion Purposes Only
Surface Transportation Modeling for the O’Hare Modernization Program
24
T:\015174022 OMP\Methodology\methodology 100404 rev.doc
The vehicle mix (percent autos and percent heavy vehicles) and travel speeds within the lots were assumed to remain consistent with existing (2002) conditions for the public, employee, CVHA, and rental car facilities.
Parking associated with the Eastside development was assumed to consist of autos only and travel speeds in the parking structures associated with this development were assumed to be 10 mph.
Travel distances from the center of each parking lot and parking garage to the parking exit were estimated based on expansion or construction plans for existing and future public parking facilities and the future CVHA, as well as field measurements of 1999 employee parking facilities and the existing rental car area.
All of the parking structures or lots fall into one of the following categories:
1. Public parking 2. Employee parking 3. Airport services or “other” parking (rental car and commercial vehicle holding
area) 4. Parking related to Eastside development
On-Airport Parking Map
The on-airport parking map graphically portrays some of the information listed in the parking analysis tables. As a result, the sources of data and methodology for the drawing are the same as those listed above for the parking tables. The only additional information provided on the parking layout drawing that is not contained in the parking tables relates to the idling percentages (percent of vehicles idling while in the CVHA).
The idling percentages published in the 1999 Surface Transportation Data Collection Program by Kimley-Horn and Associates, Inc. were used as the basis for the idling percentages shown on the parking layout drawing.
The travel paths and distances shown in red on the parking layout drawing are representative of horizontal distances necessary to travel from the parking areas to their respective exits. However, both horizontal and vertical distances contribute to the total travel distance required to exit the parking structures. Therefore, tables are displayed on the parking figures to illustrate the total travel distances necessary to exit each level of the various parking structures.

Final Draft 10/04/04 For Discussion Purposes Only
Surface Transportation Modeling for the O’Hare Modernization Program
25
T:\015174022 OMP\Methodology\methodology 100404 rev.doc
Curbfront Analysis
Curbfront Volumes and Vehicle Classification
The curbfront volumes and vehicle classification were determined for all of the terminals and the Bus Shuttle Center using the ALPS model.
Curbfront Dwell Times
At the terminal curbfronts, no technology changes, curbfront layout changes, or enforcement strategy changes were assumed for the forecast years. Therefore, forecast year vehicle curbfront dwell times were assumed to be the same as those observed in the base year.
Curbfront Capacity Analysis
The curbfront capacity analysis shows the relative demand to capacity at the curbfronts. The percent of the curbfront utilized is based on the curbfront volumes, dwell time, vehicle length, curbfront lengths and the allowable percentage of double parked vehicles. This is calculated for all lane groups at every terminal for all scenarios.
Curbfront Dimensions
The curbfront dimension figures for each terminal and the Bus Shuttle Center are based on existing conditions for the base year and apply any future changes from the project matrix and ALP for the future years.
Curbfront Speeds
Curbfront speeds were estimated for each lane, along both the upper and lower curbfronts, at all terminals. Speed estimates were generated for both peak-hour conditions and daily conditions.
From past field studies at the airport in 1997 and 1999, the following findings were determined:
Curbfront speeds are not heavily influenced by traffic volumes, as long as the curbfront capacity is not exceeded.
Curbfront speeds vary by lane and depend on the overall layout of the curbfront (whether the curbfront has a 2-2-4 configuration (two inner lanes, two middle lanes, and four outer lanes separated by medians) or 2-4 configuration (two inner lanes and four outer lanes, separated by a median)).

Final Draft 10/04/04 For Discussion Purposes Only
Surface Transportation Modeling for the O’Hare Modernization Program
26
T:\015174022 OMP\Methodology\methodology 100404 rev.doc
Glossary
ALPS 2000TM – software developed by Kimley-Horn that uses the flight schedule and
assigned passenger and vehicle characteristics to quantify the overall flows of people, baggage, and vehicles throughout the airport for 24 hours.
Arrival distribution curve – a distribution applied to the passenger flight activity data which determines how early passengers arrive before their scheduled flight
B-plate truck – in Illinois, a truck weighing 8,000 lbs. or less CATS – Chicago Area Transportation Study, the Metropolitan Planning Organization
for the Chicago region Departure distribution curve – a distribution applied to the passenger flight activity
data which determines how long it takes passengers to leave the airport after the arrival of their flight
Eastside Collateral Development – a group of land uses located on Airport property south of Higgins Road, west of Mannheim Drive, east of the Airport, and north of I-190
EMME/2 – a travel demand modeling software package used by CATS for highway traffic assignment
Mode Split – the percentage of passengers using different travel modes to access and egress the airport
R2 – a measure of goodness of fit that describes how well a set of data fits a straight line
%RMSE – a statistical measure that provides a normalized, weighted average of the differences between actual data and modeled data
Traversal Matrix – a matrix showing the origins and destinations of all of the trips passing through (traversing) the study area