offshore wind report - POWER clusterpower-cluster.net/Portals/6/Offshore wind report...
245
Overcoming Challenges for the Offshore Wind Industry and Learning from the Oil and Gas Industry Overcoming Challenges for the Offshore Wind Industry and Learning from the Oil and Gas Industry Report: [012345-R001A] Author: Ian Edwards Issued: 4 th Feburary 2011 The Green House, Forrest Estate Dalry, Castle Douglas, DG7 3XS SCOTLAND, UK Tel: +44 (0) 1644 430 008
Transcript of offshore wind report - POWER clusterpower-cluster.net/Portals/6/Offshore wind report...

Overcoming Challenges for the Offshore Wind Industry and Learning from the Oil and Gas Industry
Overcoming Challenges for the Offshore Wind Industry and Learning from the Oil and Gas Industry
Report: [012345-R001A]
Author: Ian Edwards
Issued: 4th Feburary 2011
The Green House, Forrest Estate Dalry, Castle Douglas, DG7 3XS SCOTLAND, UK
Tel: +44 (0) 1644 430 008

Overcoming Challenges for the Offshore Wind Industry and Learning from the Oil and Gas Industry Page 2 of 245
Executive Summary The development of the offshore wind industry in Europe is driven by two key factors:
• Security of supply
• Global warming
The EU currently imports more than 50% of its energy, often from unstable parts of the world within a global energy market where demand may exceed supply. There is an obvious strategic requirement to reduce the EU’s dependence on imported energy by exploiting sources of energy from within the EU. Offshore wind energy is one component of the future energy mix which can reduce the EU’s reliance on imported energy, but it has no automatic right to be part of that energy mix. Offshore wind energy must, in the long term, become competitive with other European sources of energy.
It is generally accepted that man made sources of atmospheric pollution, often referred to as green house gases, and in particular carbon dioxide, are accelerating the rate at which the earth’s atmosphere is warming. Generating electrical energy from offshore wind is one way of producing electricity with low carbon dioxide emissions, which will help to reduce Europe’s carbon footprint. It also has the potential to generate a substantial proportion of the electricity Europe requires. In addition offshore wind farms are located away from and often out of sight of the general public and this generates a lower level of opposition to the construction of offshore wind farms than might be expected for onshore wind farms, This makes offshore wind an attractive way for Europe to reduce carbon emissions and comply with its obligations under the Kyoto protocol.
Challenges Faced by the Offshore Wind Energy Industry Safety, how it is maintained and improved, is a very important issue and particularly important in an offshore environment where there are more risks and it is more difficult to get help if an accident occurs. The offshore oil and gas industry has faced these challenges for more than forty years and has developed safe systems of work and methods to ensure that these systems are constantly reviewed and updated in the light of the experience gained during operations. This experience is available for the offshore wind industry to adopt and adapt. In discussions with senior managers in the offshore industry one of the key issues facing the offshore industries is complacency, which can lead to lapses in concentration and failure to follow procedures, i.e. by taking short cuts to save time. This tends to happen when an experienced service engineer has to follow a repetitive series of tasks. The challenge is to improve safety and in particular eliminate accidents caused by complacency in an industry where there may be many hundreds of identical machines to be serviced and maintained.
Recent consultants’ reports indicate that offshore wind has one of the highest costs of any energy generating technology which is currently available on a commercial scale, this still seems to be true even when the estimated costs of carbon capture and storage are included in the cost of fossil fuel powered thermally generated electricity. The high cost of energy generated by offshore wind farms is probably the biggest single challenge facing offshore wind and it is imperative that the industry reduces these costs as rapidly as possible. There is no “magic bullet” which will reduce the cost of offshore wind energy, it can only be achieved by optimizing every stage of development, manufacture, installation and operation. However, because wind energy does not require the purchase of a fuel, the anticipated increase in the cost of fossil fuels, caused by market forces and carbon taxes, is likely to make offshore wind power more competitive in the future.

Overcoming Challenges for the Offshore Wind Industry and Learning from the Oil and Gas Industry Page 3 of 245
The high cost of energy generated by wind farms means that a subsidy of approximately €100 per MW hr is required to make the electricity generated by offshore wind farms commercially viable. Subsidies are awarded by national governments and this brings an element of political uncertainty into the economics of offshore wind. Banks and financial institutions view this as a commercial risk i.e. subsidies may be reduced or removed by government, and this may affect the ability of wind farm owners to raise the capital required to build offshore wind farms.
The ability to raise the capital to build offshore wind farms is also hindered by the legacy of poor reliability for some early offshore wind farms, which makes offshore wind look “too risky” to investors, and the constraints resulting from the recent global financial crisis. Although the offshore wind industry cannot control the financial markets, it can and must improve the reliability of offshore wind farms and reduce the cost of energy, making it less reliant on subsidies. This is likely to be difficult to achieve because of the inherent conservatism of the financial community who like to see many years of successful track record, the incremental approach to the development of offshore wind farm technology which is still rooted in an onshore paradigm, and the absence of long term testing of new designs in the marine environment.
Because many renewable energy sources are intermittent, and based on the assumption that conditions will be favorable for renewable energy generation somewhere in Europe for most of the time, geographic dispersion of renewable energy generation will help to reduce intermittency. To achieve this on a European scale requires the construction of a super grid. Offshore farms can play an important role in the development of a super grid, by acting as connection nodes and using the export cables which have to be installed to make the wind farm operational as part of the super grid. For example, the UK Round 3 Dogger Bank wind farm is more or less in the centre of the Southern North Sea and could form a node in a super grid and allow the UK to be connected to Denmark, Germany, the Netherlands and Belgium. This would facilitate international trade in electricity and allow the Dogger Bank wind farm the option of exporting to five countries and the European grid. A super grid is likely to improve the utilization of offshore wind energy by allowing access to multiple markets with different demand profiles.
The offshore wind industry faces a series of challenges from the global supply chain, in particular the supply of:
• Copper, for cables, transformers, generators etc
• Rare earth minerals, for high permeability permanent magnets
• Large casting and forging, for bearings, shafts and gearing systems
• High powered semiconductors, for control, power conditioning and AC/DC conversion
• High modulus carbon fibre, for wind turbine blades
The offshore wind industry will have to compete with other industrial sectors for these materials, this may have the effect of increasing the capital cost of wind farms. There are also opportunities associated with these shortages to develop alternative technical solutions, e.g. the shortage of copper may lead to the development of aluminum conductors for submarine cables and super conductors for transformers and generators.
There are very few suitable harbours with long deepwater quays, lay down areas for marshaling components, and areas for assembling wind turbines (a minimum of 6 hectares is required) and additional space for factories to produce wind farm components, (because most wind turbine components are too big to be easily transported by road). Because large harbour developments take a

Overcoming Challenges for the Offshore Wind Industry and Learning from the Oil and Gas Industry Page 4 of 245
long time to plan and construct and generally require national or regional government financial assistance, there is an urgent requirement to start planning, funding and building these facilities if the EU 2020 targets for offshore wind are to be met.
There is a concern about the supply of suitable vessels capable of installing offshore wind farms. The market has responded by building new wind turbine installation vessels, so there is less concern about the capacity to install foundations and turbine assemblies. However, there is still a shortage of vessels capable of installing cables, both within array cables and export cables. The offshore oil and gas industry operates vessels capable of installing these cables but the global offshore oil and gas market is buoyant, so these vessels may not be available to install wind farm cables. Further, there is the potential for competition from the oil and gas industry for existing and new vessels, because the planned peak for installing offshore wind farms (2015 to 2020) is likely to coincide with a peak in oil and gas decommissioning activity and the installation of what will probably be the tail end of the construction of gas production platforms in the Southern North Sea.
There is insufficient capacity to manufacture the quantity of submarine cables required for the planned offshore wind farms. One industry source suggested that if all the existing submarine cable manufacturing capacity was added together and then multiplied by ten, there still wouldn’t be enough capacity. Whilst this may be an exaggeration, it does point to a significant shortfall in manufacturing capacity. Cable manufacturers have recognized the market opportunity and have or are building new quayside factories; however, several cable manufacturers have reported current backlogs of two years or more, which indicates that current supply is only just keeping up with demand.
There is a similar shortfall in the capacity to build offshore wind turbines, and an urgent need to build new factories adjacent to suitable harbour facilities. One turbine manufacturer reports the ability to manufacture approximately 200, 5MW or larger turbines per year from its factory. To achieve the EU 2020 targets, it is likely that between three and five turbines will have to be installed per day, or between approximately 1,000 and 1,800 per year. These quantities are for the offshore market and exclude the demand for onshore turbines, so there is currently a significant shortfall in the capacity to build offshore turbines.
A large offshore wind industry will require engineers and technicians to install and operate them. There is a concern over the availability of suitably qualified people which leads to a requirement to establish education and training courses to provide a supply of qualified personnel. There is an associated concern that because many of the basic qualifications required for the offshore wind industry are very similar to the offshore oil and gas industry there will be competition between the two industries for personnel. Operators of offshore wind farms are already reporting a migration of skilled workers from the offshore wind sector to the offshore oil and gas sector, because this sector is offering better pay and conditions. In the long term both industries have to attract more young people to offshore industries and to encourage them to take science and engineering subjects at school and university. A joint approach to this problem, coordinated by a group of trade and industry associations, is more likely to be successful and should aim to promote common courses in basic offshore technology, safety systems and survival techniques are offered, because it would provide young people with career options, before they have to take a specialist course in a particular technology.
Newly installed offshore wind farms normally have a five year manufacturer’s warranty, backed by an insurance policy and a five year service contract. During this period the original equipment

Overcoming Challenges for the Offshore Wind Industry and Learning from the Oil and Gas Industry Page 5 of 245
manufacturer supplies spare parts, consumables and is responsible for any repairs required. After the warranty expires the wind farm operator is free to select a different service contractor and to source consumables and spare parts and repairs from the open market. This is an opportunity to grow an independent and competitive wind turbine service and repair industry. Because wind turbine companies tend to be very secretive, and don’t normally release detailed technical information, it is likely to be a challenge to establish independent service companies with access to the technical information required to provide an effective service.
Learning from the Offshore Oil and Gas Industry Most of the technology developed for offshore oil and gas, and relevant to the offshore wind industry, is available in the public domain. A large part of this technology is directly available through existing companies, this is particularly true in design, where most of the learning has been incorporated into standard engineering practice.
The technologies developed for offshore construction vessels, dynamic positioning systems, saturation diving, ROVs, heave compensated winches and cranes etc. are all available, either in existing vessels or as components, which are available commercially, and can be incorporated into new vessels.
The supply chain which supports the day to day operation of the offshore oil and gas industry is readily transferable to a future offshore wind industry when permanently manned offshore installations are operational. Industry contacts have indicated that they are ready and waiting for the commercial opportunities to arise.
The perception that offshore wind can’t afford oil and gas prices is at best, only partly correct. The offshore oil and gas industry is highly competitive and has successfully addressed cost reductions through pan industry initiatives. The prices charged by oil and gas service companies reflect the cost of the ability to work in the North Sea all year round and the typically “one off” nature of the oil and gas industry. Several offshore wind projects have already suffered major delays and additional cost by selecting “cheap” solutions and have had to change to more appropriate vessels and procedures during the installation phase, indicating that the offshore wind industry has, in this area, not been willing to learn from the oil and gas industry. However, there is no logical reason why the repetitive nature of designing, manufacturing and installing offshore wind farms should not result in significant cost savings. The opportunity to optimize the supply chain and installation techniques as a result of the experience of installing multiple identical units is not an opportunity that the offshore oil and gas industry has had.
The major oil companies exploiting the North Sea have not competed for offshore technology, they have adopted an open and cooperative approach to many of the problems of working in the North Sea. This is particularly true of safety systems and the technology associated with the installation and maintenance of North Sea structures. The oil companies’ collective strategy has been to support collaborative research projects and resist technology developments which are protected by intellectual property rights. Their preference has been to foster a competent and highly competitive service sector, and encourage active competitive tendering, thus allowing market forces to control prices.
In contrast, the offshore wind industry is still dominated by turbine manufacturing companies who tend to be secretive and are unwilling to share their experience in installing and operating offshore

Overcoming Challenges for the Offshore Wind Industry and Learning from the Oil and Gas Industry Page 6 of 245
wind turbines. A more open approach may help to reduce risks and the perception of risk as seen from an investor’s point of view.
Many oil companies have transferred the operation and maintenance of offshore facilities to service companies, who are selected by competitive tender. This has led to the reduction in oil companies’ in- house offshore engineering expertise, and their ability to control the technology, equipment and procedures used to exploit their offshore oil and gas reserves. This trend has been highlighted in the recent oil spill disaster in the Gulf of Mexico, where BP had contracted virtually all the equipment and services being used to drill the well. This strategy reduces cost, but it also reduces the oil company’s ability to control the technology, equipment and procedures used. However, it does not change the company’s ultimately liability for the whole operation and leads to a situation where a company has liability but only limited control. Unfortunately, some owners of offshore wind farms are following the trend of subcontracting most aspects of developing, installing and operating offshore wind farms, preferring to place contracts on the basis of price of a per mega watt of offshore wind turbines installed. This is probably, in the long term, a high risk strategy for the wind farm owners, especially when the relatively immature status of offshore wind farm technology is taken into account. It is probably better for wind farm owners to take more in-house responsibility for the technology on which they will rely for long term financial prosperity.
Whilst the offshore wind industry can and has learnt many things from the offshore oil and gas industry and there are areas where both industries can collaborate to their mutual advantage, the offshore oil and gas industry will compete with the offshore wind industry for resources, and because fossil fuel energy prices are likely to rise as demand rises and supply is constrained, the offshore oil and gas industry may well be able to out bid the offshore wind industry. This element of competition and the associated higher prices for resources, may prevent offshore wind from installing the planned capacity and make it harder for offshore wind energy to reduce its cost of energy.

Overcoming Challenges for the Offshore Wind Industry and Learning from the Oil and Gas Industry Page 7 of 245
Table of Contents
Executive Summary ......................................................................................................................... 2
Challenges Faced by the Offshore Wind Energy Industry ......................................................................... 2
Learning from the Offshore Oil and Gas Industry ..................................................................................... 5
Table of Contents ............................................................................................................................ 7
Table of Figures ............................................................................................................................. 13
Abbreviations ................................................................................................................................ 15
List of Tables ................................................................................................................................. 18
Acknowledgements ....................................................................................................................... 19
How to use this report ................................................................................................................... 19
1 Introduction .................................................................................................................. 19
Background to Power Cluster ................................................................................................................. 19
Methodology .......................................................................................................................................... 20
Mind Mapping ........................................................................................................................................ 20
Analysis of the Two Industries to Identify Areas of Commonality and Potential Synergies. ............. 21
Green Grouping ...................................................................................................................................... 23
Amber Group .......................................................................................................................................... 23
Red Group ............................................................................................................................................... 24
Summary of the analysis of the initial mind map ................................................................................... 25
Reviewed Relevant Literature ........................................................................................................ 25
Summary of Four Workshops ......................................................................................................... 26
Natural Power ........................................................................................................................................ 26 Access and Egress ................................................................................................................................... 26 Foundation Types ................................................................................................................................... 27 Turbine Concepts .................................................................................................................................... 27 Safety ...................................................................................................................................................... 27 Offshore Construction Techniques ......................................................................................................... 27 Marine Operations ................................................................................................................................. 27 Auxiliary power supplies ......................................................................................................................... 27 Commercial Risk ..................................................................................................................................... 27 Government Policy ................................................................................................................................. 28 Skills Shortage ......................................................................................................................................... 28 Cables ..................................................................................................................................................... 28 Grid Connection ...................................................................................................................................... 28

Overcoming Challenges for the Offshore Wind Industry and Learning from the Oil and Gas Industry Page 8 of 245
Project Life Cycle Information ................................................................................................................ 29
AREG Meeting ......................................................................................................................................... 29 Safety ...................................................................................................................................................... 29 Turf Wars ................................................................................................................................................ 29 Oil and Gas Technology Too Expensive? ................................................................................................ 29 Wind Industry Norms/Oil and Gas Norms .............................................................................................. 29 Supply Chain Organisation...................................................................................................................... 30 Oil and Gas Offshore Skills ...................................................................................................................... 30 Capacity .................................................................................................................................................. 30 Perception that Market Will Only Last for Five Years ............................................................................. 30 Can it be Done a Different Way? ............................................................................................................ 30 Size of AC/DC Converters ....................................................................................................................... 30 Access and Egress ................................................................................................................................... 30 Energy Export and Offshore Grids .......................................................................................................... 31
East of England Energy Group ................................................................................................................ 31 Safety ...................................................................................................................................................... 31 Marine Operations ................................................................................................................................. 31 Access and Egress ................................................................................................................................... 31 Where is the Offshore Wind Industry? ................................................................................................... 31 Standards ................................................................................................................................................ 32 Reliability ................................................................................................................................................ 32 R&D Component in License Fee ............................................................................................................. 32 Small Component, Small Company ........................................................................................................ 32 Capacity? ................................................................................................................................................ 32 Top Level Contracting Strategy Defines Operating Cost? ....................................................................... 32
Workshop in Stavanger .......................................................................................................................... 33 Safety ...................................................................................................................................................... 33 Standardisation ...................................................................................................................................... 33 Commercial ............................................................................................................................................. 33 Design ..................................................................................................................................................... 33 Reliability ................................................................................................................................................ 34 Marine Operations ................................................................................................................................. 34 Problem of Intermittence ....................................................................................................................... 34 Management .......................................................................................................................................... 34 Maintenance and Operation .................................................................................................................. 35 Power Trading - a Lot to be Learnt ......................................................................................................... 35
Study of 1,801 companies .............................................................................................................. 35
All Energy 2010 ....................................................................................................................................... 36
Offshore Europe 2009 ............................................................................................................................. 37
Exhibiting at Both All Energy and Offshore Europe ................................................................................ 38
Discussion ............................................................................................................................................... 39
Political/Economic/Legal – The Framework ................................................................................... 40
Political ................................................................................................................................................... 40

Overcoming Challenges for the Offshore Wind Industry and Learning from the Oil and Gas Industry Page 9 of 245
Global Warming and CO2 ....................................................................................................................... 40 EU 2020 Targets for Reductions in CO2 Emissions ................................................................................. 42 Disparate Energy Policies of European Union States ............................................................................. 43 Renewable Energy, Nuclear, Gas and Clean Coal Debate ...................................................................... 44 European “Super Grid” ........................................................................................................................... 46
Economic ................................................................................................................................................ 49
The Cost of Offshore Wind and the Requirement for Subsidies .............................................................. 49 The Unsubsidized Cost of Offshore Wind ............................................................................................... 49 True Cost of Fossil Fuel and Nuclear Generation ................................................................................... 51 Security of Supply – Imported Hydrocarbons ......................................................................................... 52 Subsidies ................................................................................................................................................. 52 Consumers’ Expectations ....................................................................................................................... 53 Raising the Large Capital Sums Required ............................................................................................... 53 The Long Term Cost of Maintenance and Repair ................................................................................... 54 Supply, Demand, Intermittency and Dispatching Electrical Power Across National Boundaries ........... 57
Legal ....................................................................................................................................................... 59 Disparate Legal Systems and Associated Requirements ........................................................................ 59 EU 2020 Targets, What Happens in Reality if You Don’t Comply? ......................................................... 60 Comparison with the Oil and Gas Industry ............................................................................................. 61
Technical/Supply Chain/Environmental ......................................................................................... 63
Technical ................................................................................................................................................. 63 Safety ...................................................................................................................................................... 63 Implementing an Effective Safety Culture .............................................................................................. 63 Taking Safety “Too Far” .......................................................................................................................... 63 Making Sure the Right Technology is in Place ........................................................................................ 64 Overcoming the Problem of Complacency ............................................................................................. 68 Effective Safety Training ......................................................................................................................... 69 Effective Supervision .............................................................................................................................. 71 Resolving Cost and Safety issues ............................................................................................................ 72 Potential Use of Robotics ....................................................................................................................... 74 Opportunities for Cross Industry Collaboration ..................................................................................... 77 Common Work Force .............................................................................................................................. 77 Training and Competence ...................................................................................................................... 77 Common Safe Systems of Work – Common Permit to Work Systems ................................................... 77 Common Supply Chain and Logistics ...................................................................................................... 80 Construction and Maintenance Vessels ................................................................................................. 81 Common Standards ................................................................................................................................ 82 Common Design Standards .................................................................................................................... 82 Standardisation ...................................................................................................................................... 85 Ensuring the Most Appropriate Technology is Employed ...................................................................... 87 Foundation ............................................................................................................................................. 89 Towers .................................................................................................................................................... 95 Generators .............................................................................................................................................. 98 Gearboxes and Bearings ....................................................................................................................... 101 Blades ................................................................................................................................................... 103

Overcoming Challenges for the Offshore Wind Industry and Learning from the Oil and Gas Industry Page 10 of 245
Cables ................................................................................................................................................... 106 AC/DC Equipment ................................................................................................................................. 110 Installation ............................................................................................................................................ 113
Supply Chain ......................................................................................................................................... 126 Mind Map of Supply Chain ................................................................................................................... 126 Current Status of Cross-over Between Oil and Gas and Offshore Wind .............................................. 135 Synergy Versus Competition map ........................................................................................................ 135 Trends ................................................................................................................................................... 136
Environmental ...................................................................................................................................... 137 Consistent Environmental Standards ................................................................................................... 137 Site Specific and Strategic Environmental Assessments ....................................................................... 142 Resolving Conflicts Between Energy Production, the Natural Environment and Other Uses of the Sea and Airspace. ........................................................................................................................................ 148
Removing Barriers – Making it Happen ........................................................................................ 151
Structural barriers ................................................................................................................................. 151 Ability to Raise Capital, Loans and Equity ............................................................................................. 151 Infrastructure ....................................................................................................................................... 153 Harbours, Marshalling Yards and Assembly Areas ............................................................................... 153 Grid and Transmission Infrastructure ................................................................................................... 154 Raw Material Supply Chain ................................................................................................................... 154 Barriers to Adopting New Technology .................................................................................................. 154 Safety Culture/Knowledge/Systems ..................................................................................................... 158 Personnel and Training ......................................................................................................................... 158
Market Barriers .................................................................................................................................... 159 Buoyant Offshore Markets Constraining Resources ............................................................................. 159 Offshore Oil and Gas Industry .............................................................................................................. 159 Onshore Wind Farm Development ....................................................................................................... 160 Cost and Risk of Offshore Wind ............................................................................................................ 160 Competing Technologies, Gas, Nuclear, Clean Coal and Other Renewables Sources .......................... 160 Intermittency, Load Balancing and Energy Storage .............................................................................. 160 Possible Mitigation ............................................................................................................................... 160 Market Forces ....................................................................................................................................... 160 Cost and Risk ........................................................................................................................................ 161 Competing Technologies ...................................................................................................................... 161 Intermittency, Load Balancing and Energy Storage .............................................................................. 161
Conclusions and Recommendations ............................................................................................. 162
Conclusions ........................................................................................................................................... 162 Economics ............................................................................................................................................. 162 Supply Chain ......................................................................................................................................... 163 Technology ........................................................................................................................................... 164 Turbine design ...................................................................................................................................... 164 Generator design .................................................................................................................................. 165 Tower design ........................................................................................................................................ 165 Blades ................................................................................................................................................... 165

Overcoming Challenges for the Offshore Wind Industry and Learning from the Oil and Gas Industry Page 11 of 245
Grid connection .................................................................................................................................... 166 Access and egress ................................................................................................................................. 166 Wider technology issues ....................................................................................................................... 166 Personnel and Training ......................................................................................................................... 167
Recommendations ................................................................................................................................ 167 Economics ............................................................................................................................................. 167 Supply Chain ......................................................................................................................................... 168 Technology ........................................................................................................................................... 169 Turbine design ...................................................................................................................................... 169 Generator design .................................................................................................................................. 169 Tower design ........................................................................................................................................ 169 Blades ................................................................................................................................................... 169 Grid connection .................................................................................................................................... 169 Access and egress ................................................................................................................................. 170 Wider technology issues ....................................................................................................................... 170 Personnel and Training ......................................................................................................................... 170
APPENDIX 1 – DETAILED ANALYSIS OF MIND MAP ....................................................................... 172
1.0. Analysis of the Two Industries to Identify Areas of Commonality and Potential Synergies. .......... 172 1.1. Green Grouping ............................................................................................................................. 173 1.1.1. Manning ...................................................................................................................................... 174 1.1.2. Regulation ................................................................................................................................... 174 1.1.3. Design ......................................................................................................................................... 175 1.1.4. Construction and Installation ..................................................................................................... 177 1.1.5. Abandonment ............................................................................................................................. 180 1.2. Amber Group ................................................................................................................................. 181 1.2.1. Product ....................................................................................................................................... 182 1.2.2. Drilling ........................................................................................................................................ 183 1.2.3. Capitalisation .............................................................................................................................. 183 1.2.4. Cash Flow .................................................................................................................................... 183 1.2.4. Design ......................................................................................................................................... 184 1.2.5. Construction and Installation ..................................................................................................... 184 1.2.6. Abandonment ............................................................................................................................. 185 1.3. Red Group ...................................................................................................................................... 185 1.3.1. Cash Flow .................................................................................................................................... 185 1.3.2. Product ....................................................................................................................................... 186 1.3.3. Regulation ................................................................................................................................... 186 1.3.4. Maintenance and Operation ...................................................................................................... 186 1.4. Group by Group Comparison ......................................................................................................... 187 1.4.1. Product ....................................................................................................................................... 187 1.4.2. Manning ...................................................................................................................................... 188 1.4.3. Capitalisation .............................................................................................................................. 188 1.4.4. Cash flow .................................................................................................................................... 189 1.4.5. Regulation ................................................................................................................................... 189 1.4.6. Designs ........................................................................................................................................ 189 1.4.7. Construction & Installation ......................................................................................................... 190 1.4.8. Maintenance and Operation ...................................................................................................... 192

Overcoming Challenges for the Offshore Wind Industry and Learning from the Oil and Gas Industry Page 12 of 245
1.4.9. Abandonment ............................................................................................................................. 192
1.5. Summary of the analysis of the initial mind map .......................................................................... 193
APPENDIX 2 - REVIEWED RELEVANT LITERATURE ......................................................................... 194
APPENDIX 3 – ISO STANDARDS FOR OIL AND GAS ........................................................................ 202
APPENDIX 4 – SUPPLY CHAIN REPORTS REVIEWED ....................................................................... 230
APPENDIX 5 – COMPANIES CONSULTED ON THE MAIN CONCLUSION AND RECOMMENDATIONS . 232
APPENDIX 6 - REFERENCING DOCUMENTS, IN THE CONTEXT OF THE POWER CLUSTER REPORT .... 233
1. Introduction ......................................................................................................................... 233
2. Background ......................................................................................................................... 233
3. Copyright .......................................................................................................................................... 234
4. Guidelines ......................................................................................................................................... 234
5. Conclusion ......................................................................................................................................... 235
Useful internet sites .............................................................................................................................. 236
References .................................................................................................................................. 237

Overcoming Challenges for the Offshore Wind Industry and Learning from the Oil and Gas Industry Page 13 of 245
Table of Figures Figure 1 Example Mind Map ................................................................................................................... 21 Figure 2 Top Level Mind Map by Group ................................................................................................. 22 Figure 3 All Energy 2010 ......................................................................................................................... 37 Figure 4 Offshore Europe 2009 .............................................................................................................. 38 Figure 5 All Energy 2010 & Offshore Europe .......................................................................................... 39 Figure 6 Cost Electricity in £/MWh for Different Types of Power Station .............................................. 40 Figure 7 From Figure 10 page 8 - P. Brohan et al 2005........................................................................... 41 Figure 8 Annual Greenhouse Gas Emissions by Sector ........................................................................... 41 Figure 9 from “The UK Renewable Energy Strategy” – page 14 chart 2 ................................................. 43 Figure 10 Example of a Proposed European Super Grid ......................................................................... 47 Figure 11 Capital Cost of Offshore Wind Farms ..................................................................................... 49 Figure 12 Time to Market ....................................................................................................................... 67 Figure 13 Decision Making Framework Mapped Against Capability Level Adapted from the UKOOA Framework. ............................................................................................................................................ 74 Figure 14 Torque Tool on a T bar ............................................................................................................ 75 Figure 15 Highly Structured Wellhead .................................................................................................... 75 Figure 16 Technip Deep Blue .................................................................................................................. 82 Figure 17 ISO Standards for the Oil & Gas Industry ................................................................................ 86 Figure 18 Installing Middelgrunden Foundations ................................................................................... 90 Figure 19 Pile manufacturing .................................................................................................................. 91 Figure 20 Model of Pile-soil Interaction ................................................................................................. 92 Figure 21 OWEC Tower for Alpha Ventus ............................................................................................... 93 Figure 22 Tripod Structure ...................................................................................................................... 93 Figure 23 Modes of Resonance for Jacket Structures (courtesy of RePower) ........................................ 95 Figure 24 Onshore Lattice Tower ........................................................................................................... 96 Figure 25 Lattice Tower .......................................................................................................................... 96 Figure 26 Composite Core Towers .......................................................................................................... 97 Figure 27 Typical Grid Fault .................................................................................................................... 99 Figure 28 Sketch of Wind Direction in a Gust ....................................................................................... 101 Figure 29 Du-Sulzer 12 RT 2-Stroke Diesel Engine ................................................................................ 102 Figure 30 90m Mast being Shipped ...................................................................................................... 104 Figure 31 AREVA M5000 as a Downwind Turbine for the SWAY Floating Wind Turbine ..................... 106 Figure 32 Nexan XLPE Insulated - Type: 2XS2YRAA Submarine Cable .................................................. 108 Figure 33 Land-based Converter 80m x 25m ........................................................................................ 110 Figure 34 Corona Ionization ................................................................................................................. 111 Figure 36 Current Fed Integrated IGBT H Bridge Inverter .................................................................... 112 Figure 35 Three Phase Press Pack IGBT Inverter .................................................................................. 112 Figure 37 LBT1 Cable Burial and Installation Machine ......................................................................... 115 Figure 38 Fred Olsen Windcarrier ......................................................................................................... 119 Figure 39 GraylocTM Clamp ................................................................................................................... 124 Figure 40 Raw Materials Mind Map ..................................................................................................... 127 Figure 41 BTM Supply Chain Map ........................................................................................................ 128 Figure 42 Table from BVG Associates 2009 - Caption Added ............................................................... 130 Figure 43 Predicted Growth of Wind Turbine Use of SiC ..................................................................... 133 Figure 44 Market Forecast for Power Modules .................................................................................... 134 Figure 45 Synergy versus Competition Map ......................................................................................... 136

Overcoming Challenges for the Offshore Wind Industry and Learning from the Oil and Gas Industry Page 14 of 245
Figure 46 UK SEA Areas ........................................................................................................................ 143 Figure 47 Planning Process ................................................................................................................... 144 Figure 48 Block Diagram for an SEA ..................................................................................................... 145 Figure 49 Stages in an EIA ..................................................................................................................... 146 Figure 50 Horns Rev Wake – copyright Vattenfall ................................................................................ 149 Figure 51 Port of Mostyn, 45,000 m2, 25 Turbines - Not Big Enough! ................................................. 153 Figure 52 Early wind turbine concepts ................................................................................................. 156 Figure 53 Top Level Mind Map by Group ............................................................................................. 173 Figure 54 Floatel in Operation: http://www.floatel.se/bilder/gallery/P4270016.JPG ......................... 178 Figure 55 Construction Class Mono Hull: http://www.subsea7.com/cms/files/Seven%20Sisters%20(VSS).pdf .................................................. 178 Figure 56 Maintenance Semi Submersibles.......................................................................................... 179 Figure 57 Thialf Installing a Jacket Structure ........................................................................................ 180 Figure 58 Castellated Cut ...................................................................................................................... 181 Figure 59 Transition Piece Being Fitted to a Monopile......................................................................... 182 Figure 60 Excalibur Working on North Hoyle ....................................................................................... 191 Figure 61 Scroby Sands - UK & East of England Content ...................................................................... 195

Overcoming Challenges for the Offshore Wind Industry and Learning from the Oil and Gas Industry Page 15 of 245
Abbreviations ABS American Bureau of Shipping AC Alternating Current ALARP As Low As Reasonably Practicable API American Petroleum Institute AREG Aberdeen Renewable Energy Group ASC Advanced Supercritical Coal AUV Autonomous Underwater Vehicles BHmax Energy product Br Remanence BWEA British Wind Energy Association, renamed as RenewableUK CAPEX Capital Expenditure CBA Cost Benefit Analysis CCS Carbon Capture and Storage CCTG Combined Cycle Gas Turbine CDA Common Data Access CF Carbon Fibre CIP Common Induction Process CO2 Carbon Dioxide COSHH Control of Substances Hazardous to Health CPA Coast Protection Act 1949 (UK) CRINE Cost reduction In the New Era Cu Copper DC Direct Current DE Denmark DE Germany DECC Department of Energy and Climate Change Defra Department for Environment, Food and Rural Affairs DFIG Doubly Feed Induction Generator DfT Department of Transport DGPS Differential Geographic Positioning System DNV Det Norske Veritas DP Dynamically Positioned DTI Department of Trade and Industry (UK) EBS Emergency Breathing Systems EEEGR East of England Energy Group EEZ Exclusive Economic Zone EIA Energy Information Administration (USA) EIA Environmental Impact Assessment EU European Union EUREC European Renewable Energy Research Centres EWEA European Wind Energy Association FEPA Food and Environmental Protection Act 1985 (UK) FGD Flue Gas Desulphurisation FOAK First Of A Kind FPAL First Point Assessment Limited FPSO Floating Production Storage Offloading GPS Geographic Positioning System

Overcoming Challenges for the Offshore Wind Industry and Learning from the Oil and Gas Industry Page 16 of 245
Hci Coercivity HSE Health and Safety Executive HVDC High Voltage Direct Current Hz Hertz cycles per second IGBT Insulated Gate Bipolar Transistor IGCC Integrated Gasification Combined Cycle IMHH Industry Mutual Hold Harmless Scheme ISO International Standards Organisation ISSOW Integrated safe system of work ISSOW Integrated Safe System of Work ITF Industry Technology Facilitator kA Kilo Amps (amps x103) kW Kilo Watt LOGIC Leading Oil and Gas Industry Competiveness m Meter MCEU Marine Consents and Environment Unit MEA Monoethanolamine mks Meter Kilogram Second MP Member of Parliament MW Mega Watt MWh Mega Watt hour NETSO Network Systems Operator NL Netherlands NORSOK Norsk Sokkels Konkuranseposisjon NOVA Nova Technology Fund NSOAF North Sea Offshore Authorities Forum OFGEM Office of the Gas and Electricity Markets OFTO Offshore Transmission Operator OPEX Operational Expenditure OPITO Offshore Petroleum Industry Training Organisation (UK) OWEC Offshore Wind Energy Converter PLC Programmable Logic Controller POB Personnel On Board POWER Pushing Offshore Wind Energy Regions PWR Pressurized Water Reactor QA Quality Assurance QC Quality Control QRA Quantitative Risk Assessment R&D Research and Development ROC Renewable Obligation Certificate ROV Remotely Operated Vehicles rpm Revolutions per minute SAC Special Areas of Conservation SCADA Supervisory Control and Data Acquisition SEA Strategic Environmental Assessment Si Silicon SiC Silicon Carbide SPA Special Protected Area

Overcoming Challenges for the Offshore Wind Industry and Learning from the Oil and Gas Industry Page 17 of 245
SUT The Society of Underwater Technology SW Sweden SWATH Small Water plane Area Twin Hulled craft SWAY A spar like down wind turbine system Tc Curie temperature TEMPSCs Totally Enclosed Motor Propelled Survival Craft or lifeboats TEN-E Trans-European energy networks (TEN-E)
UK United Kingdom UKOOA United Kingdom Offshore Operators Association – renamed Oil and Gas UK UN Unidirectional WBG Wide Band Gap

Overcoming Challenges for the Offshore Wind Industry and Learning from the Oil and Gas Industry Page 18 of 245
List of Tables Table 1 All Energy Exhibitors 2010 ......................................................................................................... 36 Table 2 Offshore Europe 2009 ................................................................................................................ 38 Table 3 Carbon Capture and Storage for Coal Fired Power Stations - Source: Pöyry Energy Consulting ................................................................................................................................................................ 45 Table 4 EWEA Timetable for EU Super Grid ........................................................................................... 48 Table 5 EU Share of Energy Resources ................................................................................................... 52 Table 6 Maintenance Costs .................................................................................................................... 56 Table 7 Key Sectoral Trends Across UK1000........................................................................................... 66 Table 8 Opportunities for Cross Industry Collaboration ......................................................................... 84 Table 9 Units and Standards ................................................................................................................... 85 Table 10 Comparative Weights for Alpha Ventus Wind Farm ................................................................ 94 Table 11 Magnetic Properties of Rare Earth Magnets ........................................................................... 99 Table 12 Current in a Conductor in kA ................................................................................................. 107 Table 13 Physical Characteristics of Si and the Major WBG Semiconductors ...................................... 113 Table 14 UK Production of Carbon Fibre Composites - From Table 7: UK production of CF composite parts by product form and end use – 2008 ........................................................................................... 132 Table 15 Supply Chain Summary .......................................................................................................... 135 Table 16 Offshore Wind Farm Foundation Types , .............................................................................. 190

Overcoming Challenges for the Offshore Wind Industry and Learning from the Oil and Gas Industry Page 19 of 245
Acknowledgements This study has been co-funded by ERDF through the Interreg IV B North Sea Region programme. We would also like to acknowledge the contribution of WP (Work Package) 2 partners. In particular the East of England Energy Group (EEEGR), Suffolk County Council and Greater Stavanger Economic Development who made a significant contribution to this study.
In addition we would like to acknowledge the contribution made by members of both the wind industry and the offshore oil and gas industry who gave their time freely to attend workshops and answer innumerable questions. The answers to these questions form the basis of much of this report.
How to use this report This report is a wide ranging review of the problems faced by the offshore wind industry as it moves to larger wind farms situated far from shore and a study of the relationship between the emerging offshore wind industry and the established offshore oil and gas industry. The report is structured so that individual sections can be read in isolation and accessed via hyperlinks from the Table of Contents. The report also has over 250 references, and each reference contains where possible an internet address for the source of the reference. There is of course a risk that these external links will fail to connect as external websites come and go or are restricted, however using the reference title in a search engine should enable the reader to find the original document.
1 Introduction
Background to Power Cluster
The POWER cluster (PC) project is funded by the Interreg IVb programme with a total budget of €4,998,942 until June 30 2011. The partnership is led by BIS in Germany, and includes 18 partners from Germany, the UK, Denmark, The Netherlands, Norway and Sweden. PC is divided into four work packages (WP) WP1 Social Acceptance is to communicate the benefits of offshore wind energy to the public, WP2 Business, is to create a business platform to foster offshore wind energy development in the North Sea Region, WP3 Skills is to adapt and prepare the North Sea region workforce to the needs of offshore wind energy, and WP4 Cluster Development is to develop an offshore wind power cluster in the North Sea Region, moving from a network to a sustainable offshore wind cluster. The PC partnership builds on an already well developed transnational co-operation network, which developed through the POWER project (Pushing Offshore Wind Energy Regions.) The partnership is able to draw on a wide range of expertise not only in the offshore wind energy sector, but also in the oil, gas and other related marine sectors. PC will be able to develop a comprehensive approach to meeting the strategic challenges of the offshore wind energy industry in the North Sea region and make the region a better place to live, work and invest
WP2 is co-ordinated by Suffolk County Council and is at the heart of the PC project because industry involvement is essential to achieving the overall project objectives. This study is an integral part of WP2 as it provides suggestions for how some of the challenges facing the offshore wind industry can be met. Other key activities in WP2 include: POWER cluster Mapergy which is an interactive web based map to identify companies involved in the offshore wind industry. It is free to join and features include the ability to search for companies with specific services or products. Currently there are more than 600 companies represented from 7 different countries. Are you on the map?

Overcoming Challenges for the Offshore Wind Industry and Learning from the Oil and Gas Industry Page 20 of 245
At the heart of this study is the perception that because the emerging offshore wind industry shares many of the same challenges as the established offshore oil and gas industry, there are lessons to be learnt from the oil and gas industry, which will be of benefit to the offshore wind industry. By studying the two industries it may be possible to highlight ways in which the deployment of offshore wind power (making it happen) can be improved by learning lessons from the history of offshore oil and gas. The converse is also true, offshore oil and gas may be able to learn from the emerging offshore wind industry, simply because it has had the opportunity to design and build an industry from a “clean sheet of paper”, unencumbered by tens of years of traditional thinking.
It is also clear that the companies involved in both offshore wind and offshore oil and gas aren’t waiting for an EU funded study to show the way forward. Many companies see the emerging offshore wind industry as a prize well worth competing for and are actively engaged in looking for innovative ways of using and developing equipment and skills to compete for contracts in both industries. So the interplay between the two industries is actively developing as companies respond to the challenges and governments seek ways to incentivize and promote the development of the offshore wind industry.
Methodology
It is very easy to ask the question: “What can offshore wind learn from offshore oil and gas (and vice versa)?” However it is not an easy question to answer, it has many facets and much of what is discussed within the two industries is a matter of personal opinion, some of which is based on fact and many years of experience, while other opinions are based on “high level views“ with little or no detailed knowledge of either industry.
To gain a balanced view and insight into the way in which the synergies between the two industries are developing this study has:
• Analyzed the two industries to identify areas of commonality and potential synergies,
• Reviewed relevant literature,
• Conducted four workshops,
• Studied 1801 companies,
• Interviewed key industrial participants.
The outputs from these diverse lines of study have been analyzed, to allow conclusions to be drawn and recommendations made.
Mind Mapping
A process of mind mapping has been used to record and structure the various strands of research undertaken in this project. A mind map links ideas and concepts in a top down tree structure. For example a mind map of Section 0 Methodology, might look like this:

Overcoming Challenges for the Offshore Wind Industry and Learning from the Oil and Gas Industry Page 21 of 245
In essence a mind map is simply a way of logically organizing information which is generated from diverse sources at different times.
Analysis of the Two Industries to Identify Areas of Commonality and Potential Synergies. To simplify the comparison between offshore oil and gas and offshore wind a common set of high level categories has been used. To a certain extent these categories are “subjective catch alls” and have no significance other than that they allow the diverse strands of each industry to be captured and ordered in a way which makes a comparison easier.
The high level categories are:
• Product
• Manning
• Capitalisation
• Cash flow
• Regulation
• Designs
• Construction & Installation
• Operation and Maintenance
• Abandonment
Explain mind mapping
Provide an example of a mind map
Workshop strategy
Natural Power workshop
AREG workshop
EEEGR workshop
Stavanger workshop
All Energy 2010
Offshore Europe 2009
Both All Energy and Offshore Europe
1.2 Methodology
Mind mapping
Workshops
Interviews
Company profiles
Figure 1 Example Mind Map

Overcoming Challenges for the Offshore Wind Industry and Learning from the Oil and Gas Industry Page 22 of 245
Each one of these categories has been broken down into multiple levels of sub-categories. There are 521 sub-categories and the resulting mind map is too big to format on A4 paper. A full mind map is available for download as an Acrobat .pdf file from the Power Cluster website http://www.power-cluster.net/
Each item in the mind map has been analyzed and assigned to one of three categories:
Green: There is a clear and obvious synergy between the requirements of the two industries.
Amber: There may be some synergies between the two industries.
Red: There is clearly no synergy between the two industries.
These categories have then been rolled up to the nine top level groups. The resulting mind map is presented in Figure 2 Top Level Mind Map by Group.
Figure 2 Top Level Mind Map by Group
Product
Manning
Capitalisation
Cash flow
Regulation
Designs
Construction & Installation
Maintenance and operation
Abandonment
Product
Manning
Capitalisation
Cash flow
Regulation
Design
Construction & Installation
Maintenance and operation
Abandonment
What Can Offshore Wind Learn from Offshore Oil and Gas?
Wind
Oil & Gas

Overcoming Challenges for the Offshore Wind Industry and Learning from the Oil and Gas Industry Page 23 of 245
The grouping process it has been informed by four workshops and numerous discussions with representatives from the industry.
There are two simple ways of discussing the results of the analysis:
• To group the greens, ambers and reds from each industry and look for reasons why the match does or does not occur,
• To look at each group in turn and the reasons why they are similar or different.
Both these methods have been used to extract information from the analysis, The full analysis is presented in APPENDIX 1 – DETAILED ANALYSIS OF MIND MAP, the full analysis tends to be repetitive in nature, since the various aspects of the relationship are analyzed in different ways. A summary of the analysis is presented below, but is limited to considering only the green, amber and red categories.
Green Grouping
There are five green groups in the oil and gas map and no green groups in the wind map. The green groups in the oil and gas map are:
• Manning – Key synergy, common labour pool, common skills.
• Regulation – Key aspect of offshore regulation where developed for offshore oil and gas.
• Design – Offshore design methodologies have been pioneered by the oil and gas industry.
• Construction and installation – Many construction techniques developed for offshore oil and gas are equally valid for offshore wind.
• Abandonment – Techniques currently being developed for offshore oil and gas will be available for offshore wind.
These topics tend to represent areas where there are strong synergies, generally with oil and gas leading the way and offshore wind using and adapting what had already been developed. Almost all the learnings from the offshore oil and gas industry in these categories are already in the public domain and are freely available for use by the offshore wind industry. Many have been absorbed into standard industry practice and are routinely taught in undergraduate engineering courses.
In some areas the synergies are so significant that the two industries may compete, particularly in the availability of resources, both skilled human resources and capital equipment.
Amber Group
There are two in the amber group from the oil and gas sector and six from the offshore wind sector:
Offshore oil and gas:
• Product – The gas industry is moving towards a highly integrated market where gas can be bought and sold on a spot market, which is similar to the way electricity is sold. Some of the shallow seismic techniques developed to detect shallow gas, could be useful in the offshore wind industry.
• Capitalization – Methods of raising risk capital and then selling assets to less risk averse institutions could be used to finance offshore wind farms.

Overcoming Challenges for the Offshore Wind Industry and Learning from the Oil and Gas Industry Page 24 of 245
Offshore wind:
• Manning – Common labour pool, but very few offshore staff in the offshore wind industry as yet.
• Capitalization – Methods of raising capital used in one industry could be used in the other,
• Cash flow – Cash flow management is similar to the offshore oil and gas industry in the development, consenting and construction phases. Managing a mature offshore oil or gas field when the cash flow is small, may be similar to managing an offshore wind farm.
• Design – Some designs and design process being developed in offshore wind could be transferred to the offshore oil and gas industry.
• Construction and installation- Some techniques and capital equipment developed specifically for offshore wind could be transferred to the offshore oil and gas industry.
• Abandonment – Methods of abandoning offshore wind farms developed in the future could be transferred to offshore oil and gas.
In these areas the relevance of learning from offshore oil and gas and vice versa is not as clearly defined. There be some level of synergy but it is not necessarily that significant. However there are areas where new approaches developed in offshore wind can be applied to offshore oil and gas and the level of synergy between the two industries in these areas will probably grow, because it is logical to expect that learnings from offshore wind applicable to offshore oil and gas will increase as the offshore wind industry becomes more established and builds experience and expertise.
Red Group
In this group there is no obvious match between offshore wind and offshore oil and gas. However, care must be exercised not to make sweeping generalizations, because at a detailed level there may be some synergy. For example, there may, at first sight be little commonality between deepwater oil, gas and water separators and the offshore wind industry, but deepwater separators have high energy requirements and the power is delivered from the surface by cables and connectors. The electrical power transmission technology, which has been developed to allow deepwater separation to happen, may have a place in the offshore wind industry, since the power levels are the right order of magnitude (10-50MW) and the requirement to keep seawater out is common.1
From the oil and gas sector, only cash flow is categorized as Red, because the cash flow from oil and gas developments is initially very high and slowly declines over a period of many years, in contrast the cash flow from an offshore wind farm is low but constant. The cash flow from an oil and gas development is so large that it is more profitable to drive for early production (and cash flow) than to fine tune the development costs.
Offshore wind:
Product – Although both industries produce energy, oil and gas can be stored and stockpiles sold to meet demand. In contrast electricity has, in general, to be sold as it is produced.
Regulation - The electricity industry is highly regulated by governments, because in many ways it is inherently monopolistic, this is at the opposite end of the spectrum to the oil and gas industry, which tends to be capitalistic and highly competitive and relatively lightly regulated.

Overcoming Challenges for the Offshore Wind Industry and Learning from the Oil and Gas Industry Page 25 of 245
Maintenance and Operation – The electricity industry tends to be a fit and forget industry, where equipment is installed and run with minimum maintenance for 10’s of years. In contrast the oil and gas industry tends to modify and adapt equipment to meet the evolving nature of a oil and gas field.
Summary of the analysis of the initial mind map
The analysis indicates that there are several areas of synergy between the two industries. These can be categorized into three general domains:
• Areas where the offshore oil and gas industry has established industry standard practice, a foundation on which the offshore wind industry can build. This is particularly true in the areas of safety, design and materials science.
• Areas where the requirements of the two industries are very similar and coincide, particularly in the 2015 to 2020 period. This is particularly true for the manpower and equipment required to build, maintain, operate and decommission offshore assets. In these areas the two industries are likely to compete for resources, but would undoubtedly benefit from a collaborative approach to establishing basic training for offshore staff, common standards acceptable to both industries, and the establishment of standards in procurement which would apply equally to both supply chains. Building on the base provided by FPAL and Achilles would enable the supply chain to service both industries with the minimum of bureaucratic overhead.
• Areas which are less easily defined, but where an approach to say raising capital in one industry could be used as a template in the other. It may also be possible to persuade governments who are active in both offshore wind and oil and gas industries to “harmonize” regulations to make it simpler for companies to operate in both sectors and across national boundaries. This simplification would both reduce costs and reduce a confusion caused by having to be aware of the regulation changes as the operational unit moves from one economic zone to another, or moves from an offshore oil and gas asset to an offshore wind asset.
Exploiting the synergies between the two industries should improve safety:
• by removing confusion caused by multiple sets of similar rules and regulations,
• reducing costs by removing the requirement for multiple sets of qualifications and standards,
• speeding up the deployment of offshore wind by providing a common pool of equipment and people who can work across the two industries and national boundaries.
Reviewed Relevant Literature Twenty one reports have been reviewed for prior research on the basic question of how offshore wind might learn from offshore oil and gas. The reviews of the reports are presented in
Most of the 21 reports reviewed concentrate on the potential size of the offshore wind market, some look at the issues around what has to be done to build offshore wind farms, but the conclusions are generally high level, they point to the way forward, but don’t provide very much detail on what needs to be done on the ground to make the industry really happen. The exceptions are the reports from Scottish Enterprise and Highlands and Islands Enterprise, National Renewables Infrastructure Plan, Stage 1 and 2 Reports from 2010, these reports detail where fabrication yards factories might be built in Scotland. Some of the

Overcoming Challenges for the Offshore Wind Industry and Learning from the Oil and Gas Industry Page 26 of 245
reports cite the offshore oil and gas industry as a source of skills and technology, but there is little detailed analysis on how this might occur and no consideration of the potential competition for resources, human, physical (harbours, cranes, ships etc) or finance which might occur in the period 2015 to 2020, when the construction phase of offshore wind is likely to coincide with decommissioning of North Sea oil and gas platforms and new build of gas platforms in the Southern North Sea.
No direct evidence was found to suggest that there are reports in the public domain which have considered the detail of how the learnings from oil and gas might be transferred to offshore wind or the competitive effects which might exist between the two industries.
Summary of Four Workshops Four workshops were held to gather industry-wide information on how the offshore oil and gas industry might assist the development of the offshore wind industry. The workshops were held in:
• Dalry, Scotland - Natural Power Consulting Ltd,
• Aberdeen, Scotland - Aberdeen Renewable Energy Group,
• Lowestoft , England - East of England Energy Group,
• Stavanger, Norway – Greater Stavanger Economic Development.
The workshops were organized as open events, with a basic introduction and an opportunity for those attending to raise topics associated with the general question of “how can the experience gained in the offshore oil and gas industry assist the emerging offshore wind industry?”
In general it proved to be difficult to drive down to a significant level of detail in the discussions because the attendees had either an onshore wind background in the case of the Natural Power, or offshore oil and gas at the other three meetings. The meetings indicated that, in general, the onshore wind community isn’t very knowledgeable about offshore oil and gas and vice versa. The polarization of expertise at each meeting made it difficult to get a two way flow of information which had been hoped for and many of the attendees were using the meetings to gain a better understanding of the market opportunities for their respective companies.
Despite these limitations, many valid points were raised and the full report of each meeting are available on the Power Cluster Website; http://www.power-cluster.net/
Natural Power
Because Natural Power has limited experience in offshore engineering, the question was re-phrased as,” when thinking about offshore wind farms, what worries you most?” This focused the discussion on elements of offshore wind farms which are different to onshore wind farms. The following list of topics was discussed:
Access and Egress

Overcoming Challenges for the Offshore Wind Industry and Learning from the Oil and Gas Industry Page 27 of 245
How safe access and egress is maintained in a wide weather window, when the wind farms are located far from shore in an exposed location, was a concern. The following possible options were discussed:
• SWATH – Small Water plane Area Twin Hulled craft, which might offer a compromise between speed and vessel motion.
• Small in-field helicopter access, including concerns over hover time and range.
• Semi Submersible's service vessel incorporating offshore accommodation, but concerns were raised over the time it might take to transit between turbines.
• Boarding turbines, including eliminating the so called “leap of faith”, where the person making the transfer has to commit to moving from a moving vessel to a fixed structure.
• Permanently manned platforms including Flotels and fixed structures.
Foundation Types How to select the correct foundation design, to optimize cost and performance, over a range of water depths and geotechnical conditions. It’s clear that there are a limited number of designs; jacket structure, monopiles, tripods, and gravity bases.
Turbine Concepts The urgent need for turbine test beds which can be used to prove prototype systems in a known environment, with planning permission and a grid connection. The need to develop a specific marine turbine design which is hardened to the marine environment and optimised for offshore deployment, maintenance and offshore operation.
Safety General concerns about how to maintain high safety standards offshore, particularly personnel movements, working at height, working with high voltages and currents and appropriate survival training.
Offshore Construction Techniques There was a general concern that offshore construction techniques generally mirror onshore construction and a view that perhaps a more efficient method could be developed.
Marine Operations Marine operations and offshore logistics seemed like very obvious areas where offshore wind could learn and adopt practices from offshore oil and gas.
Auxiliary power supplies When there is no wind, turbines still require electrical power to keep the control systems operating, to maintain the heating and ventilating system for the electrical systems and to turn the turbine to face the new wind direction. The option of diesel generators was discussed, this then introduced the problem of offshore diesel supplies and switching and a feed from the national grid.
Commercial Risk There was discussion around how risk can best be shared and minimized, topics discussed included; sharing risk, using feed studies to optimize field layout, turbine types, grid connections and power purchase agreements. There was further discussion of:
• risk and reward contracts,
• who takes the weather risk during construction

Overcoming Challenges for the Offshore Wind Industry and Learning from the Oil and Gas Industry Page 28 of 245
• the problems of managing very large contracts,
• the interface between contractors and overall project management,
• the consenting risks,
• the necessity for untested integrated project contractors to deal with large projects,
• the combination of cumulative impacts which increase the risk of both delaying and delivering consents.
Carbon tax, feed-in tariffs and renewable obligation certificates (ROCs) were discussed, the main concern being the political risk of governments changing their minds and altering the level of subsidy after a developer has committed to an offshore wind farm. There was also concern over how level the playing field would be in a pan European context, especially when a European super grid is developed.
There was significant concern expressed over manufacturing capability and capacity, i.e. the manufacturers’ ability to supply the required number of turbines, towers, foundations and the general supply of steel required to build the number of turbines predicted in the market forecasts.
The accuracy of wind prospecting, on several levels was discussed, micro scale (i.e. within a wind farm), macro scale (i.e. North Sea), and the need to produce better models to screen potential sites, especially the wind shadow, caused by upwind turbines, which seems to be significantly underestimated in current models.
The cost of energy from offshore wind farms was also of concern, especially as it is significantly more expensive than say combined cycle gas turbines. Areas where cost might be reduced were cited as; consenting, cost of capital, installation, operation, decommissioning and insurance.
Government Policy How government policy might develop for new wind farms was discussed and particular concern was raised about how feed in tariffs and ROCs might develop. A lot of concern was expressed about how the UK’s regulatory system would work, particularly the relationship between OFGEM, NETSO and OFTO.
Skills Shortage The number of skilled people required to build and man the new industry was discussed, particularly the competition with the offshore oil and gas industry. The comment was made that people trained for the offshore wind industry were moving to offshore oil and gas, because the pay and benefits were better
Cables There was general concern about cables: the supply of cables, the maximum size of export cables requiring multiple cables to be laid, cable laying and trenching. There was a general discussion on how an offshore grid might work and what the tariff would be for using the grid. There was concern that it was likely that all the turbines would be generating at the same time, so there would be pressure on grid capacity.
Grid Connection There was discussion about how an offshore grid would develop and be integrated with national grid, which parts of the grid would be AC and which parts would be DC and how and where grid compliance would be enforced. There was serious concern that the UK system of offshore transmission would not deliver an integrated or effective grid solution, and was not fit for purpose

Overcoming Challenges for the Offshore Wind Industry and Learning from the Oil and Gas Industry Page 29 of 245
when looking at Round 3 large sites. There was also concern expressed about how the individual governments in the EU would regulate the flow of electrical power.
Project Life Cycle Information There was concern that project life cycle information was not being kept and stored for future reference. It was considered to be very important to have good management of maintenance and repairs records and production information, including; power exported, power imported, wind strength and direction. Life cycle data was considered to be very important in managing the effective operation of both individual wind turbines and wind farms, and particularly important when wind farms are sold to new operating companies.
AREG Meeting
The AREG meeting was dominated by representatives from the offshore oil and gas community and it would be fair to say that they didn’t have a detailed knowledge of the offshore wind industry. So the discussion was focused around the attendees’ perception of what the offshore wind industry might find useful to adopt from offshore oil and gas. The following points were discussed:
Safety There was a strong emphasis on safety culture, getting the approach to safety right from the CEO down through the organization’s structure; this was seen to be very important. The recommendation was for the offshore wind industry to adopt the oil and gas safety culture. There was also a recommendation to design systems to be safe, not to adapt a design to make them safe. There is a distinct difference between the two approaches, the latter involves making changes and adaptations to a working system to make it safe, the former ensures that the basic design philology is safe and is more likely to avoid design compromises.
Turf Wars There was a lot of concern over the potential conflict between OPITO and Renewables UK over who holds or defines the standards for safety training for the offshore industry. Whilst there are differences in the detail over what is relevant to the two industries, there was a strong feeling that there should be collaboration on basic safety training and that OPITO and Renewables UK should be leading this collaboration.
Oil and Gas Technology Too Expensive? There was quite lot of discussion around the perception that offshore oil and gas technology is too expensive for offshore wind. There was a strong consensus that offshore engineering costs what it takes to make it safe, workable and durable and that there should be no real cost differential on the basis of design. Offshore oil and gas does not pay more than it has to, it is a competitive industry, however, offshore wind does have the advantage of having many identical systems, which should allow for mass or series production techniques to be applied, thus reducing costs.
Wind Industry Norms/Oil and Gas Norms A series of expectations has evolved over the lifetime of the offshore oil and gas industry which effectively govern the terms and condition of people employed in the industry. It was generally felt that it would be helpful if these were followed by the offshore wind industry.

Overcoming Challenges for the Offshore Wind Industry and Learning from the Oil and Gas Industry Page 30 of 245
Supply Chain Organisation There was a lot of discussion around the supply chain, with a general feeling that much of the supply chain and the associated organizations are directly transferable to the offshore wind industry. This includes: 1st Point Assessment and pre-qualification to bid process, and CRINE and methods of reducing costs, particularly "standard" contracts. It was also felt that an organisation like CDA (Common Data Access) would be useful to hold information, e.g., environmental impact assessments, geotechnical surveys, wind resource maps, license agreements etc., this would make it much easier to transfer ownership of wind farms in the future.
A PILOT styled review of the supply chain was considered to be a useful exercise for the offshore wind industry.
Oil and Gas Offshore Skills The discussion on offshore skills and how these could be transferred to offshore wind energy companies was wide ranging and covered:
• the fear that companies new to offshore don't have enough experience to execute projects safely and effectively,
• that the offshore wind industry is not asking oil and gas service companies to bid for contracts,
• that oil and gas companies think of offshore wind as "high risk",
• that the offshore oil and gas market is buoyant, so there is no need to look for new markets.
Capacity There was a really strong opinion that the offshore industry doesn’t have enough capacity to cope with the demand from the existing oil and gas market, decommissioning of offshore platforms and the new offshore wind market. There aren’t enough skilled people, especially in design, installation and maintenance. There is a shortage of capital equipment, installation vessels and equipment, port facilities and manufacturing capacity. Cables were also of concern with a limited number of cable manufacturers, installation vessels, burial devices and protection systems, including rock dumping, concrete mattresses and sediment traps.
Perception that Market Will Only Last for Five Years Some oil and gas based companies see a peak in demand which will only last for the five year period 2015 to 2020, this makes them reluctant to risk capital for a limited market and drives then to build multi function vessels.
Can it be Done a Different Way? This open question was driven by the expediency of using existing equipment, if at all possible and the observation that offshore wind farm installation techniques mirror onshore installation and don’t seem to have been rethought to make them more appropriate to offshore conditions.
Size of AC/DC Converters DC transmission systems will be required to reduce the transmission losses from large wind farms distant from consumers. AC to DC converters are large and require large offshore platforms. DC to AC converters require significant land areas onshore. There was concern expressed that the industry hasn’t fully realized the size of the converters and that this may cause future problems.
Access and Egress Access and egress was discussed extensively and covered the following topics:

Overcoming Challenges for the Offshore Wind Industry and Learning from the Oil and Gas Industry Page 31 of 245
• safety of small boat transfer,
• semi subs and gangways,
• helicopter access, large helicopters to offshore accommodation mirrors offshore oil and gas, but there was uncertainty about small helicopters to access individual wind turbines,
• SWATHs and catamarans along with limited weather windows,
• the safe evacuation of a turbine in storms or medical emergencies.
Energy Export and Offshore Grids There was a series of questions raised in the UK context about OFGEM/Crown Estates/NETSO/OFTO, the relationship between them, whether this is the right framework, if there is sufficient confidence that it will work and how it would work with a European super grid. The comment was made that the system seemed to have been devised and driven by a fear of a monopoly in offshore generation and transmission.
East of England Energy Group
This meeting was attended by members of the East of England oil and gas supply chain, with little experience of offshore wind projects. Like the AREG and Stavanger meetings, the views expressed tend to represent an oil and gas perspective of how the offshore wind industry might benefit from the experienced gained in offshore oil and gas.
Safety Safety and an over arching safety culture was seen as a very high priority for the offshore wind industry. It was also felt that is essential that the safety culture is driven from senior management and should be the company’s top priority. The ethos of design for safety, not making a design safe, was very important to embed in the company’s philosophy.
Marine Operations Marine operations were thought to be an open opportunity for oil and gas supply chain which should be exploited.
Access and Egress In general there was a dislike of helicopter winch wire access and access from small boats which involved a “leap of faith” transferring from a moving boat to a stationary structure (or vice versa).
The discussion around safe access and egress included the following options:
• helicopters, large helicopter to accommodation unit, small in-field helicopters,
• walk to work i.e. no climbing ladder or helicopter wire lifts,
• semi-sub plus gangway, mono hull and gangway, Ampleman,
• small boat transfer,
• SWATHs and catamarans.
Where is the Offshore Wind Industry? This discussion was an informal review of the current status of the offshore wind industry, noting that it had its roots in offshore oil and gas, civil engineering, the nuclear industry and onshore wind. There are also some new companies entering the industry.

Overcoming Challenges for the Offshore Wind Industry and Learning from the Oil and Gas Industry Page 32 of 245
Standards There was a strong feeling that establishing standards was really important and that the offshore oil and gas industry had struggled to establish standards, a task which was not complete. The feeling was that established standards should be used wherever possible and that broad industry forums should be used to set new standards to maximize industry buy-in.
Reliability It was noted that early offshore wind farms had proved to be unreliable and that improving reliability was essential for the industry to be successful in the long term. It was suggested that aero turbine manufacturers might get involved in the design and that a degree of over-engineering might be required to make the systems more robust. There was also a view that a better understanding of offshore loadings was required.
R&D Component in License Fee There was a suggestion that a small component of the license fee collected by governments should be fed back directly into university research to improve future generations of offshore wind turbines.
Small Component, Small Company There was a discussion around how a small company making and developing components for offshore wind farms could access both markets and research funds. The market for wind farm components, especially the turbine manufacturers, seemed to be very closed and secretive. The following suggestions were made:
• to approach large service companies for funding in return for some form of limited exclusivity,
• to look to the venture capital markets,
• for the offshore wind industry to setup organisations like ITF and the NOVA fund to coordinate and assist in finding development money.
Capacity? Pressure on resources - 2015 to 2020
The group was concerned about the pressure on resources during the period 2015 to 2020. During this period, UK Round 3 offshore wind farm installations are scheduled to take place, there is a planned increase in the decommissioning of offshore oil and gas installations and there is likely to a final phase of gas production in the Southern North Sea. This was thought to put pressure on installation vessels, although new vessels are currently being commissioned and there may be some release of vessels from the offshore oil and gas market.
It was generally thought that there would be shortage of skilled people, because the oil and gas industry has an ageing workforce, more people will be required and because science and engineering aren’t popular options at undergraduate level. Further there is a shortage of people with technical skills, a lack of vocational training and apprenticeships, and limited numbers of people are being released from the armed forces with good technical skills.
A critical shortage of good dockside facilities with large storage and marshalling areas was perceived and thought to be difficult to overcome without extensive government support. These areas should also adjoin manufacturing facilities for turbines blades, towers and foundations, all of which are difficult or impossible to transport by road.
Top Level Contracting Strategy Defines Operating Cost?

Overcoming Challenges for the Offshore Wind Industry and Learning from the Oil and Gas Industry Page 33 of 245
There was a useful discussion about the relationship between the contracting strategy used to build the offshore wind farm, the long term operating costs and the associated problem of who takes the risk during construction. The group expressed the opinion that the wrong contracting strategy is likely to lead to increased long term operating costs because the installation contractors are focused on completing the installation at minimum cost and may take decisions which don’t optimise the operational effectiveness of the offshore wind farm. It was also clear that if an EPIC contract was used, the principle contractor would add a risk premium to the price, but if a developer project managed the installation and used multiple subcontractors, the price would be lower but the risk would lie with the developer. Concerns were raised that some developers may not have adequate project management skills to be able manage the interfaces and contain construction costs.
Workshop in Stavanger
The attendees at the Stavanger meeting were generally from an offshore oil and gas background, however some people had been associated with the Hywind project and had firsthand experience of installing a wind turbine in deepwater.
Safety The general consensus was summed up as: “Do what's right, don't just follow oil and gas” indicating the issue of safety should be thought through from first principles. Access and egress was considered to be a significant problem, especially over an extended weather window.
Standardisation It was generally considered that the offshore wind industry should adopt offshore oil and gas standards wherever possible. Standardisation was considered to be very important in controlling costs.
Commercial A comment from the Hywind team noted that there is a significant difference in culture and language between offshore oil and gas and offshore wind, further that these differences had caused schedule and contractual difficulties during the project. The need for standard contracts was highlighted and standard contracts available from both NORSOK and CRINE should be used if possible.
It was noted that offshore wind contracts are more onerous than typical oil and gas contracts. In offshore wind the turbine manufacturers are responsible for 5 year warranty, which contrasts with oil and gas equipment manufacturers typically supplying to quayside, with little further warranty.
There was concern that the business model for offshore wind isn’t sustainable and that it is difficult to make a profit in offshore wind without a subsidy. Subsidies carry a commercial risk and it was clear that subsidies would be removed over time, casting doubt on the long term sustainability of offshore wind.
Design There was significant concern over the current design of turbines which is based on serial production of onshore wind turbines. It was pointed out that there is no serial production of offshore wind turbines.
Turbines bigger than 5-7MW are expected to be developed in the next few years, but there has to be an upper limit on the size of turbines because the energy capture is a function of the diameter

Overcoming Challenges for the Offshore Wind Industry and Learning from the Oil and Gas Industry Page 34 of 245
squared, whilst the weight of the turbine is a function of the diameter cubed, which means bigger turbines will have a poor power to weight ratio. Bigger turbines mean bigger components and a new generation of machine tools may be required to make these large components. Bigger turbines also give rise to transport issues and larger and more expensive installation equipment. All these issues could mean longer lead times and more capital investment.
Reliability The group was concerned about the level of reliability of early offshore wind farms, noting that if reliability didn’t improve, then offshore wind would not be commercially viable. The perception was that the turbine manufacturers need a much better understanding of the marine environment and much of that could be gained from the offshore oil and gas industry. There was also concern about corrosion and it was felt that the use of an offshore oil and gas paint specification would help solve the problem.
There was a discussion around possible new designs for offshore wind turbines based on offshore oil and gas technology. It was also thought that it may be a mistake to force existing land-based 3 bladed upwind designs into the offshore environment which has significantly different constraints to the constraints imposed on land-based designs.
The discussion then turned to getting a big enough funding package together to develop a new multi mega watt design and the issue of making the design “bankable” within the time frame to 2015. There was also a discussion around floating systems for deep water.
Marine Operations The group then considered marine operations and there was consensus that there is already enough experience in offshore oil and gas. However, there was serious concern about the lack of harbour facilities with long deepwater quays and the large marshalling and storage areas required. The group also noted the lack of facilities to produce large numbers of foundation.
Problem of Intermittence The group had a long discussion about how offshore renewable energy would fit into the energy mix, where other forms of renewable energy, nuclear, and fossil fuel based (either carbon neutral or with CO2 sequestration) all had a part to play. They considered that; geographic diversity, a North Sea super grid, national land-based grid reinforcement, hydro, pumped storage and compressed air storage all had a part to play in making renewable energy work, but that it was essential that planning of the European energy supply, was done at an international level to ensure that it was effectively coordinated.
Management Large wind farms are very large projects, as big as anything ever undertaken; they need a very good and strong management team, with good management structure and interface management to integrate operations with different phases and contractors.
Contracts management, safety management, training and competence were all considered to be very important for a successful project. It was considered to be self-evident that a large number of engineers and technicians will be required and that they must be trained to recognised training standards, and that the current oil and gas industry could not supply the number of people required.

Overcoming Challenges for the Offshore Wind Industry and Learning from the Oil and Gas Industry Page 35 of 245
Maintenance and Operation There was discussion about the frequency of maintenance versus cost of maintenance and how to optimise the relationship by collecting operational data and analysing it in combination with fault tree analysis and smart diagnostics. This was felt to be important in making offshore wind turbines economically viable, because of the high cost of accessing large numbers of turbines.
Power Trading - a Lot to be Learnt Trading electrical power on a pan European scale was considered to be important to the future of offshore wind and it was felt that there is still a lot to be learnt about how to balance intermittent generation with a regular demand curve. Better weather and demand forecasting were considered to be important to effective international trading of electricity.
Study of 1,801 companies The offshore oil and gas industry shares many of the same problems as offshore wind, so there is a natural market driven migration of companies and skills from offshore oil and gas to offshore wind. There is also the potential for companies founded in offshore wind to migrate to offshore oil and gas, because offshore oil and gas has been established for approximately forty years, and offshore wind is comparatively recent, there is an expectation that most of the companies looking for new market opportunities will be migrating from offshore oil and gas to offshore wind. This natural, market driven migration automatically takes with it a substantial and valuable experience from oil and gas to the offshore wind industry. To test how much natural migration between the two industries is happening, two data sets have been analyzed:
• The companies exhibiting at All Energy 2010 held in Aberdeen
• The companies exhibiting at Offshore Europe held in Aberdeen in 2009
Both these data sets have an inherent bias. The All Energy data set is probably biased towards the renewable energy sector, because, although All Energy advertises itself as an exhibition for all energy sectors, it is clearly attractive to companies from the renewable energy sectors, whilst attracting relatively few companies from the traditional oil and gas sector. In contrast, Offshore Europe is an exhibition focusing on the offshore oil and gas sector and attracts relatively few companies from the renewables industry. By choosing two contrasting exhibitions, a relatively unbiased view many be obtained, although this is far from a scientifically unbiased set of samples.
For each company exhibiting at the two exhibitions a series of questions has been asked and the answers judged by visiting the company’s website, reading about the products and services offered and analyzing the company’s customer base and recent projects.
The questions asked were:
1) Does the company offer products and services which are appropriate to the offshore wind industry?
2) Is the company active in the offshore wind industry? 3) Is the company a “general supply company”?
The third question is necessary because some “general supply companies” exhibit at many specialist shows, and although their products or services would be very useful, and are probably used in both offshore wind and offshore oil and gas, they would be equally useful in many other industries. For
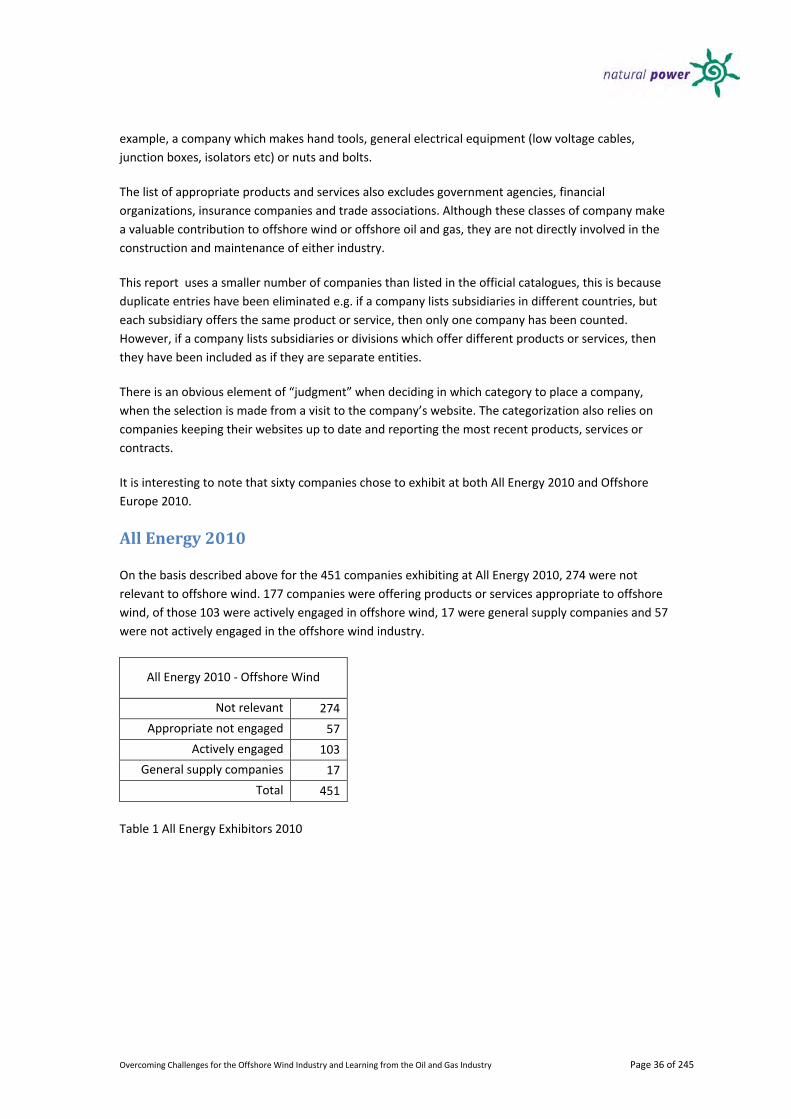
Overcoming Challenges for the Offshore Wind Industry and Learning from the Oil and Gas Industry Page 36 of 245
example, a company which makes hand tools, general electrical equipment (low voltage cables, junction boxes, isolators etc) or nuts and bolts.
The list of appropriate products and services also excludes government agencies, financial organizations, insurance companies and trade associations. Although these classes of company make a valuable contribution to offshore wind or offshore oil and gas, they are not directly involved in the construction and maintenance of either industry.
This report uses a smaller number of companies than listed in the official catalogues, this is because duplicate entries have been eliminated e.g. if a company lists subsidiaries in different countries, but each subsidiary offers the same product or service, then only one company has been counted. However, if a company lists subsidiaries or divisions which offer different products or services, then they have been included as if they are separate entities.
There is an obvious element of “judgment” when deciding in which category to place a company, when the selection is made from a visit to the company’s website. The categorization also relies on companies keeping their websites up to date and reporting the most recent products, services or contracts.
It is interesting to note that sixty companies chose to exhibit at both All Energy 2010 and Offshore Europe 2010.
All Energy 2010
On the basis described above for the 451 companies exhibiting at All Energy 2010, 274 were not relevant to offshore wind. 177 companies were offering products or services appropriate to offshore wind, of those 103 were actively engaged in offshore wind, 17 were general supply companies and 57 were not actively engaged in the offshore wind industry.
All Energy 2010 - Offshore Wind
Not relevant 274
Appropriate not engaged 57
Actively engaged 103
General supply companies 17
Total 451
Table 1 All Energy Exhibitors 2010

Overcoming Challenges for the Offshore Wind Industry and Learning from the Oil and Gas Industry Page 37 of 245
Figure 3 All Energy 2010
Because All Energy is effectively a renewable energy conference and exhibition, it attracts many companies in the bio-fuels, solar, land-based wind (from the utility scale to the micro scale) sectors of the energy market, so it not surprising that the majority of companies don’t offer products or services appropriate to offshore wind. Of the 177 companies with appropriate products or services 58% were actively engaged in offshore wind, just less than 10% were general supply companies, who are probably actively engaged, but it’s really difficult to tell, and approximately 32% were not engaged in offshore wind.
Looking in detail at those companies not engaged in offshore oil and gas it becomes apparent that most have their roots in the renewables sector rather than oil and gas. This perhaps is not a surprising result, since companies newly formed to service a specific sector of the renewables market, need to concentrate on their core markets and become profitable, before expanding into other and perhaps more difficult markets.
Offshore Europe 2009
Of the 1383 companies exhibited at Offshore Europe 2009, 561 companies or 40.56% were not offering products or services which are relevant to offshore wind. This not surprising, since despite its headline title, Offshore Europe is really an offshore oil and gas exhibition. A further 236 companies or 17.06% were general supply companies, of the remaining 586 companies or 42.37% were offering products or services relevant to offshore wind, 158 companies or 11.42% are already actively engaged in offshore wind. This means that in 2009 just over a quarter (26.96%) of all the companies who could possibly service offshore wind are already doing so.
All Energy 2010 - Offshore Wind
Not relevant
Appropriate not engaged
Actively engaged
General supply companies

Overcoming Challenges for the Offshore Wind Industry and Learning from the Oil and Gas Industry Page 38 of 245
Offshore Europe 2009
Not relevant 561 40.56%
Appropriate not engaged 428 30.95%
Actively engaged 158 11.42%
General supply companies 236 17.06%
Total 1383 100.00%
Table 2 Offshore Europe 2009
Figure 4 Offshore Europe 2009
Offshore Europe 2009 had more companies headquartered in the USA or Canada than All Energy 2010 and because the offshore wind industry is smaller in North America, the results may be biased towards companies not engaged in offshore wind.
Exhibiting at Both All Energy and Offshore Europe
Of the 60 companies who chose to exhibit at both exhibitions, 20 companies (33%) were not relevant to offshore wind, many of these were government bodies or trade associations, 29 (48%) companies had the direct skills required and all were actively engaged in offshore wind, and 10 companies were general supply companies who are probably actively engaged.
Offshore Europe 2009
Not relevant
Appropriate not engaged
Actively engaged
General supply companies

Overcoming Challenges for the Offshore Wind Industry and Learning from the Oil and Gas Industry Page 39 of 245
Both All Energy 2010 & Offshore Europe 2010
Not relevant 21
Appropriate not engaged 0
Actively engaged 29
General supply companies 10
Total 60
Figure 5 All Energy 2010 & Offshore Europe
Clearly companies who exhibit at both these major exhibitions that have products and services appropriate to the offshore wind industry are already involved. This is not a surprising result since it is largely a self selecting subset, however close examination of the 29 companies in this group shows that almost all the companies have their roots and origins in the offshore oil and gas industry. This suggests that market forces are already making it worthwhile for companies who traditionally operate in the offshore oil and gas sector to apply their skills in the emerging offshore wind industry.
Discussion
The results of an analysis of companies exhibiting at both Offshore Europe 2009 and All Energy 2010 indicate that there is already a substantial engagement of companies formed to service the offshore oil and gas industry in the offshore wind industry. Market forces are working and the obvious potential size of the market is attracting companies to bid for work in the offshore wind industry. However, it is clear from the workshops and discussions with oil and gas based companies that some companies are either fully booked with offshore oil and gas work, or concerned about the current perception that the construction phase of offshore wind will be a “bubble” lasting approximately 5 years from 2015 to 2020, which is too short a time span to justify the large capital investment required to effectively service the offshore wind industry. These companies are actively choosing not to become part of the offshore wind energy industry.
Both All Energy 2010 & Offshore Europe 2010
Not relevant
Appropriate not engaged (0)
Actively engaged
General supply companies

Overcoming Challenges for the Offshore Wind Industry and Learning from the Oil and Gas Industry Page 40 of 245
Political/Economic/Legal – The Framework Generating electrical energy from offshore wind is expensive compared with conventional thermal power stations (gas, coal or nuclear)2. If there was not a strong belief that it is important to move away from more conventional forms of generation and a political will to subsidise more expensive ways of generating electrical energy, then there would be no reason why the electricity generating industry would move towards generating a substantial part of Europe’s electrical energy from offshore wind. This section looks at the driving forces which motivate the industry.
Figure 6 Cost Electricity in £/MWh for Different Types of Power Station
Political
Global Warming and CO2
It generally believed that the planet is getting warmer, metrological data suggest that the earth is warming, further that the rate of increase has accelerated since the 1980’s. Figure 7 shows the annual temperature anomaly from 1850 with error bars. The data is taken from a world wide data set, both land-based and marine.

Overcoming Challenges for the Offshore Wind Industry and Learning from the Oil and Gas Industry Page 41 of 245
Figure 7 From Figure 10 page 8 - P. Brohan et al 20053
The warming of the earth is generally considered to be caused by “green house gases” being trapped within the earth’s atmosphere, which prevents heat being re-radiated back into space. There are several greenhouse gases, but the most obvious ones are carbon dioxide, methane and nitrous oxide. Carbon dioxide is the gas which is of most interest to the electricity generating industry, since it is one of the principle by-products of burning hydrocarbons in conventional thermal power stations.
Figure 8 Annual Greenhouse Gas Emissions by Sector4

Overcoming Challenges for the Offshore Wind Industry and Learning from the Oil and Gas Industry Page 42 of 245
The predicted effects of global warming include rises in sea level and climate changes, including more severe weather and changes in weather patterns5.
The scientific advice given to governments at international level is that it is very important to reduce the emissions of greenhouse gases to mitigate the effects of global warming.
The predictions from results of global warming models are major and irreversible impacts on weather patterns, ecosystems and raised sea levels, if these predictions actually happen it would severely disrupt the earth’s ability to sustain life in its current form.
These arguments have convinced many governments to implement action plans which are designed to reduce the emission of greenhouse gases in order to mitigate the disastrous effects of global warming.
There have been a significant number of high level government conferences at which the measures required to reduce the emission of greenhouse gases have been discussed. The key international agreement is the Kyoto Protocol, which is a protocol associated with the United Nations Framework Convention on Climate Change. This is an international environmental treaty for "stabilization of greenhouse gas concentrations in the atmosphere at a level that would prevent dangerous anthropogenic interference with the climate system."[6]
The Protocol was initially adopted on 11 December 1997 in Kyoto, Japan, and came into force on 16 February 2005. As of November 2009, 187 states have signed and ratified the protocol.[7]
Industrialised countries committed themselves to a reduction in four greenhouse gases and two groups of fluorocarbons gases produced by them, and all member countries gave general commitments to reduce greenhouse gases. Industrialised countries agreed to reduce their collective greenhouse gas emissions by 5.2% from the 1990 level, this does not include emissions by international aviation and shipping, however, the Kyoto commitments are in addition to the industrial gases, dealt with under the 1987 Montreal Protocol on Substances that Deplete the Ozone Layer.
The agreement allows for “emissions trading”, the “clean development mechanism” and for” joint implementation” which allows industrialised countries to meet their greenhouse gas emissions by purchasing greenhouse gas emission reduction credits from other countries.
The European Union has agreed mandatory targets for member states which are enshrined in European law and these targets are discussed in the next section.
EU 2020 Targets for Reductions in CO2 Emissions
The EU adopted8 an integrated energy and climate change policy in December 2008,9 including targets for 2020. The targets can be summarised as:
1. cutting greenhouse gases by 20% (30% if international agreement is reached) , 2. reducing energy consumption by 20% through increased energy efficiency, 3. meeting 20% of our energy needs from renewable sources.
Meeting 20% of the EU’s energy from all renewables sources is relevant to this report, and includes:
• land and marine based wind energy,
• tidal energy,

Overcoming Challenges for the Offshore Wind Industry and Learning from the Oil and Gas Industry Page 43 of 245
• wave energy,
• solar, photovoltaic and solar thermal,
• hydro power,
• land fill gas,
• etc.
Figure 9 from “The UK Renewable Energy Strategy10” – page 14 chart 2
The UK has taken the EU targets and produced “The UK Renewable Energy Strategy”11 which sets a target of 15% of the UK’s energy to be generated from renewable resources.
Figure 9 from “The UK Renewable Energy Strategy” – page 14 chart 212, provides an illustration of the likely sources of the UK’s energy in 2020. It is clear that offshore wind is destined to play a major role in the UK’s energy mix. Other EU member states have set their own targets. The Scottish government has set its own target for Scotland of 50% of electricity produced from renewable sources by 2020.
Disparate Energy Policies of European Union States The EU states have agreed to increase the use of renewable energy, however the methods for implementing the increased use of renewable energy are devolved to member states. This has led to a range of different targets and plans to meet these targets. The existing support schemes cover the following13:
• “feed-in tariffs exist in most of the Member States. These systems are characterised by a specific price, normally set for a period of around seven years, that must be paid by electricity companies, usually distributors, to domestic producers of green electricity;
• the green certificate system, currently in force in Sweden, the United Kingdom, Italy, Belgium and Poland. RES-E is sold at the conventional market price. In order to finance the additional cost of producing green electricity, and to ensure that it is generated in sufficient quantities, all

Overcoming Challenges for the Offshore Wind Industry and Learning from the Oil and Gas Industry Page 44 of 245
consumers are obliged to purchase a certain number of green certificates from RES-E producers according to a fixed percentage (quota) of their total electricity consumption/generation;
• tendering systems exist in two Member States (Ireland and France). Under this procedure, the State issues a series of invitations to tender for the supply of RES-E, which will be sold at market price. The additional cost is passed on to the final consumer in the form of a special tax;
• tax incentives used exclusively in Malta and Finland.”
Each country has its own set of laws and regulations governing support for renewable energy and these are detailed in a CMS report14, a detailed discussion is beyond the scope of this report. However, the general conclusion by the EU15 is that the disparate nature of different support systems makes it very difficult to consider the EU as a single market and that “state aid may distort the market”.
The differences in support structure will make EU-wide trading of electricity via a European super grid technically and economically challenging.
Renewable Energy, Nuclear, Gas and Clean Coal Debate Wind, wave, solar and tidal sources of energy are intermittent. As a direct consequence of this there may be times when there is little renewable energy being generated and demand for energy is high, for example if a mid-winter stationary high pressure area is located over the central North Sea, then there will little or no wind or wave energy generation from the North Sea area for several days, yet the accompanying cold weather is likely to give rise to a high demand for energy. Further, adding intermittent sources of energy to transmission grids may cause the grids to become unstable and call for more active management than the transmission companies have historically had to provide.
These arguments are used to justify the continuing use of conventional sources of energy which are continuous processes and have provided electrical power for many years:
• Wind doesn’t displace any carbon based generation16 because standby generation is still required.
• The nuclear lobby points to the firmness of nuclear power and its carbon free credentials.
• Clean coal technology can either pre-process coal into hydrogen and carbon dioxide, and remove the CO2 before firing or use a post firing technology which removes the CO2 from the exhaust gas. These techniques can be combined with advanced combustion cycles, increasing the operating temperature to “super critical” or oxy fuel cycles where the coal is burnt with oxygen which is extracted from the air. Both super critical and oxy fuel furnaces increase the basic efficiency of coal fired power stations and produce fuel gases which have a very high percent of CO2, approximately 90% for oxy fuel, this enables the oxy fuel flue gas to be sequestrated with minimal processing of the fuel gas. However both super critical and oxy fueled power stations are more expensive to run and operate. Table 3 provides information on the efficiency of carbon capture and storage retro fitted to a coal powered station, with super critical and oxy fueled options. Adding carbon capture and storage reduces the efficiency by 27% to 37%17.
• Thermal plants powered by combined cycle gas turbines are very efficient, and produce cheap electricity and when combined with technology to pre or post process the carbon dioxide, the carbon dioxide being sequestrated into geological formation, the power produced is “carbon free”. However, the process of separating the carbon dioxide requires energy, as does the process of compressing and injecting the carbon dioxide into a formation; both these processes reduce the efficiency of the conversion.

Overcoming Challenges for the Offshore Wind Industry and Learning from the Oil and Gas Industry Page 45 of 245
Existing plant CCS Option 1 CCS Option 2 CCS Option 3
Technology Sub critical coal Retrofit MEA to existing unit
Upgrade to super critical
and retrofit MEA
Upgrade to oxy fuel and retrofit
MEA
Gross gen’ capacity (MW) 485 485 485 485
Efficiency adjustment - 63% 83% 73%
Net sent out capacity (MW) 485 306 402 355
Carbon capture efficiency - 96% 87.5% 85%
Load factor 87% 87% 87% 87%
Sent out output (TWh) 3.7 2.3 3.1 2.7
Table 3 Carbon Capture and Storage for Coal Fired Power Stations - Source: Pöyry Energy Consulting
• It is also possible to use integrated gasification combined cycle power stations where a wide range of different carbon based fuels can be used. The fuel is converted into “syngas”, a mixture of hydrogen and carbon monoxide, and the waste heat from this process is used to drive steam turbine generator. The syngas is then burnt in a separate process, which first drives a gas turbine generator with the exhaust gas being used to make steam which in turn is used to generate electricity using a steam turbine. CO2 is removed from the exhaust gases. The thermal efficiency of an integrated gasification combined cycle power station can be as high as 45%18.
• Adding carbon capture and storage is estimated to add between 30% and 90% to the cost of electricity. And the long term cost of capturing and sequestrating carbon is estimated at approximately €40 per tonne, but could be over €100 per tonne for first generation plants.
To counter these arguments, environmentalists argue that nuclear has unquantifiable clean-up costs and generates nuclear waste which is dangerous for 100’s of years. Both gas and coal are using finite natural resources which may, for example, be more productively used as feed stock for industry. There are also philosophical concerns about the long term effects of carbon sequestration into geological formations, simply because they are almost certainly unknown. Further, the UK HSE has raised safety issues around the transport of CO2
19using pipelines.
Lobbyists from all sides try to influence the energy policies of both the member states and the European Parliament.
One solution put forward by the advocates of renewable energy is the concept of geographic diversity, the crux of the argument being that the wind is blowing (or more generally, there is renewable energy available) in some part of Europe most of the time and that peak demand occurs at different times in different countries. So by interconnecting different regions power can be moved to the demand.

Overcoming Challenges for the Offshore Wind Industry and Learning from the Oil and Gas Industry Page 46 of 245
A second argument is the use of energy storage, typically, flow cells, pumped storage hydro power schemes or compressed air storage:
• Flow cells are large batteries where the energy is stored in the electrolyte rather than on the battery plates20. They store electrical power directly, but have relatively limited capacity, however, they can respond to variation in demand very quickly21.
• Pumped storage hydro power systems work by pumping water from a low level reservoir into a high level reservoir when there is excess electrical power available and by reversing the process when extra electrical energy is required. Pumped storage was originally developed to absorb excess generating capacity from nuclear power plants which work best with a constant output (base load), but pumped storage systems have been used very effectively to store excess energy from renewable energy generation. Denmark uses the pumped storage schemes in Norway and Sweden22 to store excess wind power, buying the power back when required. Although pumped storage only recovers about 75% of the energy input, pumped storage is effective if the market price of the electricity is very low.
• Compressed air storage is similar in concept to pumped hydro storage, excess energy is used to compress air and store the high pressure air, often in a geological formation, and the energy is recovered by using the compressed air to drive a turbine and generator set. However, compressed air storage is not that simple, compressing the air generates a lot of heat which has to be removed and decompressing air requires heating to prevent the system freezing up. To overcome these problems compressed air storage is normally combined with intercoolers to remove heat during compression and a gas turbine system to provide heat during decompression23.
There are other forms of electrical energy storage which work well in some situations. For example flywheel systems, which store energy as rotational inertia, work well in transport systems, e.g., electric trains, metro systems and trams. Electrical energy is captured from regenerative braking systems during braking as the traction unit approaches the station, and is then fed back into the system as the traction unit accelerates away from the station. Hydraulic accumulators can be used to store energy as compressed gas to be released back into the hydraulic system as the load increases. Super capacitors and super cooled magnetic systems also provide short term energy storage for load leveling applications.
European “Super Grid” As Europe installed electrical generating, transmission and distribution systems in the late 19th and early 20th centuries, they naturally progressed from local systems, to regional and in most countries national grids. A national electricity grid allows electrical energy to be moved around the country or region and provides the electricity generators with more options by allowing electricity generated in one geographic location to be used in another. However, there is a cost associated with the flexibility, both in the capital and running cost of the grid and the resistive losses inherent in transporting electrical energy over a grid. To reduce these losses generating companies have historically located their plants near to load centers, the exception being hydro power, which by definition needs to be located in mountainous areas, and nuclear power plants which have generally been located next to a plentiful supply of cooling water and away from major population centers.
Renewable energy derived from wind and waves is generally abundant in the more remote parts of Europe, typically in the North and West, whilst solar energy is concentrated in southern parts of Europe. Tidal energy is coastal and usually associated with island chains or headlands, often in remote locations. Accessing these sources of energy will require extensive additions to national and regional

Overcoming Challenges for the Offshore Wind Industry and Learning from the Oil and Gas Industry Page 47 of 245
grids and more active management of the grid system to compensate for the intermittent nature of renewable energy.
Connecting European countries together is a natural extension to the historic development of electricity grids and would allow geographically dispersed renewable energy generation to be connected to European wide consumers. The EU has committed to studying the possibility of a European Super Grid and there have been several studies published which suggest possible layouts of a super grid24 25. Figure 10 Example of a Proposed European Super Grid, suggests ways of interconnecting areas rich in renewable resources with consumers in Europe. Proposals also include which links would be AC which link DC. There are additional plans to links North Africa with the European Mediterranean states to allow solar energy to be exported from North Africa and Southern European states to Northern Europe and wind and wave energy to be exported from the North and West of Europe to the South.
Figure 10 Example of a Proposed European Super Grid
In 2009 the EWEA published a timetable (Table 4 EWEA Timetable for EU Super Grid) of expectation for the then new European Parliament and Commission covering legislation and communication designed to lead to the development of a European super grid. The table illustrates the fact that the EU is very serious about the development of super grid, which is central to the EU’s energy policy because it addresses several key issues, security of the energy supply, reduction in greenhouse gas emissions, building a European competitive advantage and generating new employment opportunities.

Overcoming Challenges for the Offshore Wind Industry and Learning from the Oil and Gas Industry Page 48 of 245
Key legislative proposals and communications26:
Commission’s Blueprint for a North Sea Offshore Grid Expected to be published in 2010
Commission’s Mediterranean Energy Ring Expected to be
Expected to be published in 2010
Commission’s Baltic Energy Market Interconnection Plan
Expected to be published in 2009
Commission’s Energy Security and Infrastructure Instrument (to replace TEN-E)
Expected to be published in 2010
The European Network of Transmission System Operator’s Ten Year Network Development Plan
Expected to be published in 2010
Table 4 EWEA Timetable for EU Super Grid At a practical level there are concerns about the super grid in many areas:
• Although the technology required to implement a super grid is available, much of it derived directly from the offshore oil and gas industry, there are concerns over the industry’s capacity to build the grid. There are particular concerns over the ability of the supply chain to design, supply and install the many hundreds of kilometers of high power DC cables which will be required.
• It is currently not clear what the economic model will be for the grid, who will invest in it and how will they get a viable return on their investment. There is also an outstanding issue about who controls the grid and where the electrical energy flows. The EU document discusses “unbundling energy supply” i.e. preventing vertical integration of electricity companies, and making the market free so that electrical energy can be traded like any other commodity. This seems to conflict with the existing model where energy is generally purchased through a long term power purchase agreement at a fixed rate, with only a small percentage of the total electrical power being traded on the “spot market” (i.e. selling surplus energy or buying to make up a small shortfall caused by demand being a little higher than expected).
• There is concern about how national interest will be decoupled from the energy supply, this may be a difficult situation for politicians, if the electorate see energy generated within “their” region being sold at a high price to another region, when it could be used to reduce domestic energy prices.
• Current offshore wind farms are usually treated as spurs attached to a national grid and the offshore connection is not designed to be used as feed from other wind farms or countries, whereas from an engineering point of view it would make sense to interconnect adjacent offshore wind farms and develop an offshore grid which effectively runs in parallel with the onshore grid. This strategy would provide redundancy in the grid and improve security of supply and perhaps avoid lengthy planning delays often experienced when trying to establish new land-based transmission lines.
• The oil and gas industry used a different model where the export pipelines are often built with extra capacity over and above that required for the initial installation. This allows export pipelines to be shared between oil or gas fields and the pipeline is often co-owned by a number of oil companies. It has usually been seen as strategically advantageous, in the oil and gas industry, to be the first to exploit a new geographic area and establish an export pipeline system, revenue from the “ullage” or spare capacity in a pipeline is usually considered to be a useful part of the business case.

Overcoming Challenges for the Offshore Wind Industry and Learning from the Oil and Gas Industry Page 49 of 245
Economic
The Cost of Offshore Wind and the Requirement for Subsidies
The Unsubsidized Cost of Offshore Wind The cost of electrical energy produced by offshore wind farms is the sum of several factors:
• The amortized capital cost per unit of electrical power generated, simplistically, the annual repayment of the loan (capital and interest) divided by the annual power production by the wind farm.
• The annual operational costs of the wind farm divided by the total power produced.
• The cost of getting the power to market, i.e. the cost of grid connection and use.
There are numerous studies which investigate the cost of power produced by offshore wind farms, but very few reports which calculate the basic cost of generating energy from offshore wind farms. These studies have been reviewed and they all provide useful information on the way the cost is derived, although they do not report actual cost of power.
Figure 11 Capital Cost of Offshore Wind Farms, from the Garrad Hassan Report commissioned by BWEA , Charting the Right Course27 studies the capital cost of offshore wind farms in detail, but does not translate the capital cost into the cost of energy. It shows an increase in the capital cost of installing from approximately £1.5million/MW of installed capacity in the period 2000 to 2005 to around £3million/MW installed capacity in 2010.
Figure 11 Capital Cost of Offshore Wind Farms28

Overcoming Challenges for the Offshore Wind Industry and Learning from the Oil and Gas Industry Page 50 of 245
The TPWind Secretariat of the EU has produced a report which details the Implementation Plan29 and support available to the offshore wind industry. The report includes a revised formula for the “Levelised Cost of Electricity” which is used to calculate a key performance indicator. However although the report provides baseline assumptions it does not calculate any electricity cost. Further, some of the baseline assumptions seem to be optimistic or unrealistic, for example the baseline capital cost of offshore turbines is set at €2.5M/MW installed (for the wind farm, including export cable and shore side transformer), which is significantly less than the estimate made in the Garrad Hassan report30 of £3M/MW installed or approximately €3.6M/MW. The levelised cost does not include any cost of grid connection or transmission, which could be significant for offshore wind farms located in geographically remote regions.
A report by the University of Birmingham’s Department of Economics31 considers the factors which make up the cost of offshore wind farms, but does not calculate the cost of energy produced.
A very comprehensive report commissioned by the EWEA to look at the effect that wind energy would have on the market price of electricity and what is known as “the merit order effect32”, only considers the spot price of electricity, but does not calculate the cost of producing energy from offshore wind farms.
A report published by the International Energy Agency (IEA), “Projected Costs of Generating Electricity” – 2010 Edition33 reports the costs for electricity generated by offshore wind turbines ranging from 146 USD/MWh (United States) to 261 USD/MWh (Belgium). This is approximately equivalent to €113/MWh and €203/MWh respectively.
The wholesale price of electricity is also difficult to find in the public domain because most of the electricity is sold under long term power purchase agreements. These are bilateral agreements between generators and distributers and are not generally in the public domain.
The month ahead, Platts Pan-European price index34 fluctuated between € 39 /MWh and € 46 / MWh in the first quarter of 2010, which was lower than the same period in 2009.
The day to day spot market for electricity, through which only a small percentage of the total energy is supplied, is in the public domain. There is a very large variation in the price of power on the spot market which ranges from virtually zero to a high of over €1000/MWh in the Nordic countries last winter. For example, power was traded at €0.01/MWh in the Netherlands for a couple of hours in January and March when wind output from the North Sea was high and the load was reduced35P power traded at over €1000/MWh for short periods in Sweden on the 8th Jan and 22 February 2010. Generally the spot price of electricity exceeded €100/MWh in most countries in the first quarter of 2010.
A report in carboncommentary.com36 dated 14th June 2010 quoted the current base load price for electricity in the UK as £40 to £45/MWh, approximately €48 to €54/MWh
For the purpose of illustration, if the long term base load price of wholesale electricity is say €50/MWh and the cost of producing electricity from offshore wind energy is say €150/MWh, then a subsidy of approximately €100/MWh is required to make offshore wind viable to a commercial developer.
For example, in the UK the income stream for an offshore wind farm is typically made up of:

Overcoming Challenges for the Offshore Wind Industry and Learning from the Oil and Gas Industry Page 51 of 245
Income source £/MWh €/MWh
Sale of electricity from the power purchase agreement € 50.00
Income from 2 renewable energy certificates (ROC) 2 x £35.76=£71.52 € 86.12
Income from the ROC recycling fund 2 x £18.54=£37.06 € 44.64
Levy Exception Certificates € 5.00
Total € 185.76
This is within the range of values of construction cost published by the IEA and confirms that offshore wind farms require a subsidy of approximately €100/MWh to make them commercially viable. Other countries have different methods of subsidizing renewable energy; however the net effects of different methods of subsidizing offshore renewable energy are similar.
It is clear that the subsidy has to be paid for out of general taxation, so the consumer (in the widest sense) eventually pays for the additional cost of renewable energy, even though the payment is not direct and obvious.
True Cost of Fossil Fuel and Nuclear Generation The requirement for subsidies to make the renewable energy industry viable, as discussed in the previous section, may seem at odds with the headline cost of generating electricity from fossil fuels, which are substantially lower. However, the current cost of fossil fuel derived electricity is not considered by many to be a true cost, because it ignores the cost of the pollution it generates. This is a controversial issue, because it is not easy to quantify the cost of the pollution and arguments vary from the two extremes of, there are no costs, to the costs associated with global warming, higher sea levels and climate change being so high they can’t be calculated.
The EU and many member states have recognized the global warming potential of CO2 and are taxing the release of CO2 into the atmosphere. Many would argue that the current level of taxation is too low to reflect the true cost of global warming, others argue that it is an unfair tax which other countries don’t have to pay and puts the EU’s economy at a disadvantage. However, the EU’s stated policy37 is to increase the levels of taxation on burning fossil fuels to produce electricity, which will increase the price of electricity from these sources and help to make renewable energy more competitive and reduce the requirement for direct subsidy.
In a similar way the true cost of generating nuclear power is hotly debated and opinions vary widely, the key elements in the debate are the cost of decommissioning nuclear power plants and the cost of storing nuclear waste which is produced as a by-product of the generating process. The subject is complicated by the fact that some nuclear plants were specifically designed to produce enriched products for nuclear weapons so the decommissioning and nuclear waste cannot be completely attributed to the electricity generating industry. However, it is clear that the total cost of decommissioning and storing nuclear waste is very difficult to calculate, principally because many of the components of the waste will be radioactive for many thousands of years.
It is very difficult to see how the oil and gas industry can assist with the problem of CO2 emissions, the most direct impact may well be the use of depleted gas wells and oil and gas technology to assist in the sequestration of CO2.

Overcoming Challenges for the Offshore Wind Industry and Learning from the Oil and Gas Industry Page 52 of 245
Security of Supply – Imported Hydrocarbons The EU currently imports more than 54% of the energy it uses and is not in general a geographic area which is high in natural hydrocarbons38. Table 5 EU Share of Energy Resources, illustrates the EU’s low levels of natural resources. The reliance on imports of energy is considered to be a political and economic risk, especially when there is increasing demand for energy and a finite supply. These factors, along with the necessity to reduce the emission of CO2, are key drivers for the EU policy to increase the production of renewable energy.
Fuel EU share of proven
global reserves
Years of domestic
production
Oil 0.5% - 0.8% 7.7 - 7.8 years
Gas 1.4% - 2% 14.4 - 14.8 years
Coal 3.5% 50 years
Uranium 1.9% -
Table 5 EU Share of Energy Resources
Subsidies As discussed in 0, offshore wind farms require a subsidy to make them competitive with conventional hydrocarbon fired thermal generating plant. The basic philosophy behind the subsidy is to introduce and accelerate the construction and operation of renewable power generation. There are three reasons which drive the philosophy;
• to reduce greenhouse gases and the associated global warming,
• to improve security of supply,
• to avoid the cost of importing energy, which given the high global demand and finite supply is expected to increase.
The oil and gas industry has never had nor needed subsidies to make it commercially viable, so there is little to be learnt from the oil and gas sector. However, large energy companies many of whom are involved in both hydrocarbon and renewable energy supply are concerned about the long term viability of an industry which relies so heavily on subsidies. The questions which are at the back of executives’ minds are:
• What happens when the subsidies run out?
• What happens if the Government or the EU changes its mind and removes the subsidies?
• The corollary being, if subsidies are removed, who takes responsibility for unprofitable assets and the associated liabilities?
These uncertainties make it more difficult to finance offshore wind farms, subsidies are seen as a significant risk by many potential investors.
There is also a concern that in the long term, electricity prices will be forced up by a combination of higher world energy prices and taxes on pollution to the point where offshore wind energy is viable without a subsidy. Many view this as threat to the economic viability of the EU which may be “priced out of the market” by countries who are unwilling to include the cost of pollution in their energy cost.

Overcoming Challenges for the Offshore Wind Industry and Learning from the Oil and Gas Industry Page 53 of 245
There is also a view that because the marginal cost of wind energy is low (there is no fuel bill to pay), adding wind energy to the grid will reduce electricity prices and make the EU more competitive (the merit order effect) and that economies of scale and technical improvements will reduce the cost of offshore wind making it less reliant on subsidies. It is likely that all these effects will come into play over the next ten years, world energy prices will increase in line with supply and demand, and European electricity prices will follow, renewable energy will make up a large proportion of the European energy mix and the cost of offshore wind energy will reduce as technology is developed and economies of scale become possible.
Consumers’ Expectations Customers expect clean (non-polluting) reliable energy, with no power failure at the minimum possible cost. The modern world is almost totally reliant on the 100% availability of electrical energy. The absence of “mains power” would stop almost all commercial activity and significant disruption to domestic life, it would stop TV, radio and most communications, refrigerators and freezers would fail, etc. These expectations are very exacting and extend beyond the simple supply of electricity, to the quality of supply, i.e. voltage, frequency and power factors must all remain within tight limits.
It is the EU’s policy to add significant amounts of renewable energy to the electricity supply to help make the energy cleaner and to add a European wide transmission grid to aid the reliability of supply. The customers will expect the offshore wind industry and the offshore oil and gas industry to collaborate to ensure that the renewable energy is brought on-line, safely, cheaply and on time.
Raising the Large Capital Sums Required The capital sums required to bring offshore renewable energy into production to meet the 2020 targets are of the same order of magnitude as those required during the peak of the construction phase of the North Sea oil and gas industry. The principle difference is the expected rate of return, successful North Sea oil or gas development would repay the capital cost of development within months, whilst the repayment period for an offshore wind farm may be many years.
The recent global financial crisis has constrained the growth of offshore wind power and has been particularly hard on independent project developers who require significant external financial investment to develop an offshore wind farm. It has not affected large utility companies to the same extent because they can continue to fund development from their balance sheet.
As discussed in 0 and 0 the move to deeper water further from shore, which is inherently more expensive to develop and maintain, means that government support will remain vital in order for the offshore wind industry to continue to develop.
The decision of the European Investment Bank to directly invest in the funding of offshore wind farms, injecting €255 million into six offshore projects39, signals the EU’s continuing drive to ensure that the twin strategic objectives of making Europe less dependent on imported energy and reducing the emission of greenhouse gases is still on track, further the intervention of the European Investment Bank is seen as being crucial given the current financial climate.
Commercial banks remain risk averse and are hesitant to invest in an industry where there are few precedents and the banks may not have an established procedure for evaluating the risk reward profile of the potential investment. Further there is competition amongst developers for loans in a market with a limited number of banks prepared to lend to offshore wind projects. However, there

Overcoming Challenges for the Offshore Wind Industry and Learning from the Oil and Gas Industry Page 54 of 245
have been some refinancing deals where institutional investors have taken equity positions in offshore wind farms40, releasing capital to develop the next round of offshore wind farms.
In contrast, although the oil and gas industry has seen a fall in investment in 2009, down by 18%41, investment by national oil companies has remained steady because they have sufficient financial strength to fund development from their balance sheet. Independent oil and gas exploration companies have seen their valuation fall because they are more dependent on external finance to fund ongoing operations. The fall in value of independent oil and gas companies has made them targets for takeover bids by larger companies who see independents as an economic method of gaining access to new reserves.
The difference in the financial position of the two industries is significant, but not unexpected.
• The oil and gas industry has had approximately 100 years to build up financial strength and a degree of independence from the financial markets, although they are not immune to changes in the global economy, their products are embedded into the culture of the developed world.
• The offshore wind industry is part of a larger electricity industry which is equally well embedded into the everyday culture of the developed world, however the offshore wind industry is new, viewed as technically risky by financial institutions and is to some extent a political invention, driven from strategic requirements to reduce greenhouse gases and reduce European dependence on imported energy.
The key to improving the financial position of the offshore wind industry is to execute well managed projects which are profitable, and to work towards reducing the cost of energy generated from offshore wind farms, so that the product is viable without subsidy. The offshore oil and gas sector can help achieve these objectives by applying and transferring skills as generally discussed in this report, the aim being to build an offshore wind industry which is largely self sustaining. There is an area of concern regarding the way in which the offshore wind industry is being regulated. The EU seems to be reluctant to allow electricity companies to become vertically integrated and own the full chain of components from offshore generation, though transmission and distribution to retail activities, preferring an “unbundled industry”. This is in stark contrast to the oil and gas industry, where many companies are highly vertically integrated owning assets from oil field, through pipelines and refineries, to retail distribution and retail outlets. It can be argued that it is the vertical integration of oil and gas companies that has allowed them to grow into strong financial enterprises which don’t require government support and use market mechanism and competition to regulate prices.
The Long Term Cost of Maintenance and Repair The offshore wind industry is relatively new and currently undergoing a phase of rapid expansion with new and bigger turbines being introduced by manufacturers. As a direct consequence there is limited experience of the long term maintenance and repairs which will be required to keep wind turbines operating at peak production. So there is a significant risk that maintenance and repair bills will be higher than predicted, simply because the industry is in its infancy and there is no sure way of knowing what the repair and maintenance cost of an offshore turbine will be over a 20 to 25 year operational life.
The perception of risk has been increased because of several high profile failures of early offshore wind farms, which have exhibited multiple failures in gearboxes, generators and transformers (ref: section 0). Many of these failures have been within the manufacturer’s warranty period and the direct

Overcoming Challenges for the Offshore Wind Industry and Learning from the Oil and Gas Industry Page 55 of 245
cost of repair has been borne by manufacturer’s warranty insurance, however, the wind farm operators have suffered the consequential loss of production because the turbines have not been available for operation. One of the effects of these early failures has been a significant increase in warranty insurance costs.
The cost and weather restrictions associated with accessing offshore turbines make a significant contribution to the cost of maintenance and repair. In extreme cases bad weather conditions may prevent access to turbines located in the central North Sea for several weeks during winter months.
The most complete set of data available in the public domain appears to be that from the UK round one wind farms, North Hoyle, Kentish Flats, Scroby Sands and Barrow. Data for the first 3 years of operation has been published as a condition of the capital grant scheme from which these wind farms benefited. A summary of the maintenance costs available from the twelve published reports is presented in Table 6 Maintenance Costs.
The International Energy Agency (IEA) has studied the difference between onshore and offshore wind farm costs; they give some indication of the uncertainty that surrounds operations and maintenance. The data, provided by six countries and the European utilities organisation, Eurelectric, were published in the 2010 edition of the IEA’s Projected Costs of Generating Electricity. The Netherlands reported the lowest estimate of $11/MWh, while Germany reported the highest, at $46/MWh.

Overcoming Challenges for the Offshore Wind Industry and Learning from the Oil and Gas Industry Page 56 of 245
Round 1 Wind Farm
Productivity Cost of maintenance
Availability Capacity
factor Accessibility
per MW installed
per turbine per
MWh
North Hoyle 1 84.00% 36.00% n/a £49,000.00 £98,000.00 £14.50
North Hoyle 2 89.10% 34.30% n/a £41,000.00 £83,333.33 £13.70
North Hoyle 3 87.40% 35.00% n/a £47,000.00 £93,333.33 £15.10
Kentish Flats 1 87.00% 28.92% 91.51% £26,100.00 £78,300.00 £10.31
Kentish Flats 2 73.50% 25.00% 75.62% £26,900.00 £80,800.00 £12.30
Kentish Flats 3 89.20% 33.50% 75.73% £23,200.00 £69,700.00 £7.90
Scroby Sands 1 84.18% 28.90% 60.82% £28,574.00 £57,148.00 £10.02
Scroby Sands 2 75.10% 24.60% 79.18% £27,495.00 £54,991.00 £9.65
Scroby Sands 3 83.83% 27.60% 68.22% £28,832.00 £57,665.00 £12.57
Barrow 1 67.00% 24.00% 51.00% £22,133.00 £66,400.00 £22.34
Barrow 2 78.00% 36.70% 53.40% £39,400.00 £118,200.00 £12.96
Table 6 Maintenance Costs
The UK data indicates a minimum cost of £7.90/MWh and a maximum of £22.34/MWh (€9.57 to €27.06 per MWh) which lie in the lower region of the IEA estimates; however the period reported was also covered by the manufacturer’s warranty, and the cost of major repairs is not known or included, although the lost production, in the sense of lower availability does increase the cost maintenance expressed in £/MWh.
The UK data is now several years old, the most recent being 2008, and it relates to Round One offshore wind sites which were powered by Vestas V80 and V90 machines. Both the V80 and V90 machines experienced significant mechanical problems with bearings, gear boxes, generators and transformers which caused significant down time, although by the end of the reporting period, these problems were well known and understood, with many components being exchanged proactively before they failed in service. These were expensive design errors which have been attributed to

Overcoming Challenges for the Offshore Wind Industry and Learning from the Oil and Gas Industry Page 57 of 245
inadequate testing in the marine environment (ref: section 0) and it is unlikely that wind turbine manufacturers will make the same mistakes again.
Assuming that the wholesale price of electricity is approximately €50/MWh, the maintenance costs reported above are too high to be viable in the long term, with the German maintenance cost of €46/MWh being almost equal to the whole sale price of electricity. Even the lowest UK maintenance cost of approximately €10/MWh is approximately 20% of the wholesale price. For electricity generated by offshore wind energy to be competitive without subsidy in the long term, maintenance costs will probably have to fall below 10% (currently about €5/MWh) of the wholesale price of electricity.
The offshore oil and gas industry has a long record of keeping “up-lift costs” under control and has developed a series of techniques and tools to assist in this, they include:
• Using standard maintenance management tools to manage and schedule maintenance tasks, these tools can track maintenance requirements, print work instructions, manage spares and inventories of spares and much more. The most common tool is IBM’s Maximo which is used by over 50% of the oil and gas installations in the North Sea. Whilst there is no intention to recommend Maximo for the offshore wind industry, the use of a standard tool mimimises training requirements and allows personnel to readily transfer between installations.
• Sharing helicopter flights and supply vessels, avoiding part loads and reducing the number of capital assets required.
• Using standard contracts and industry wide prequalification procedures.
• Using maintenance contractors and regular re-bidding of the work, i.e. use the market to keep contractors prices under control and to encourage innovation during the bidding process.
• Using engineering analytical tools to understand how frequently items should be maintained and inspected. Offshore oil and gas operators have managed to reduce some inspection regimes from annual to every 5 years and to reduce the scope of the inspection to areas where the analysis indicates that there may be problem.
• Using remotely operated vehicles to eliminate expensive diving operations.
• Sharing operational experience. Offshore oil and gas operators have learnt to share their experience of maintenance, arguing that an overall reduction in cost benefits over the whole industry makes it more competitive with other forms of energy generation.
Supply, Demand, Intermittency and Dispatching Electrical Power Across National Boundaries
The complex relationship between supply, demand, intermittency and dispatch has already been discussed in several earlier sections of this report, see Sections; 0, 0, 0 and 0. From a European perspective the problem is, at an executive level, very simple:
• Europe’s energy requirements are growing,
• Europe has very few naturally occurring sources of hydrocarbons,
• The worldwide demand for energy is increasing, with the probability that the cost of energy imports will increase as hydrocarbon reserves are depleted.
These three facts mean that Europe could face the situation where its economic stability is threatened. The strategy currently being implemented to avoid the possibility of future shortfall in energy supply and the economic damage that would follow is based on two strands42 43:

Overcoming Challenges for the Offshore Wind Industry and Learning from the Oil and Gas Industry Page 58 of 245
1. Reducing energy consumption by 20% through increased energy efficiency, 2. Meeting 20% of our energy needs from renewable sources.
Meeting 20% of Europe’s energy needs from renewable energy implies that perhaps 40% or more of Europe’s electricity will need to come from renewable energy sources. Further, if the logic which underlies the top level drivers is correct and the world uses up its hydrocarbon reserves, then most of Europe’s energy will eventually have to come from renewable energy or nuclear sources, so it is seen as very important to put infrastructure in place which is robust and capable of meeting future requirements.
As previously discussed many sources of renewable energy are intermittent, so managing the intermittency is key to the successful implementation of the strategy. In a similar way the demand side, although well understood, is very uneven and linked into the daily and cultural life of Europe.
A key aspect of the European energy strategy is to take full advantage of the geographic diversity of Europe. As discussed in 0, within the proposed European Super Grid demand will vary with time across Europe with different time zones, cultural patterns and weather systems. The availability of renewable energy also varies across Europe, often simplified to the statement, “the wind is always blowing somewhere in Europe”. So by interconnecting Europe with a high capacity, high efficiency super grid, supply and demand can be matched for a significant proportion of the year. The shortfall in energy supply will be generated from, by preference, stored renewable energy, or when this is not possible conventional fossil fuel or nuclear power plants.
To make this long term vision of an integrated European energy system work, an effective Trans-European electrical energy market and means of dispatching power across national borders is essential. This implies a dynamic market-driven energy industry where a substantial proportion of a country’s energy 0 is bought or sold over the super grid on some basis; 3 years ahead, 1 year ahead, 1 month ahead, 1 day ahead or for the next hour, to cope with the dynamic change in the supply of renewable energy, and the perhaps more predictable changes in demand. Although these markets are developing44 45 46, they are essentially at odds with the traditional and conservative energy supply industry, which is used to working with long term power purchase agreements and a secure national supply including an adequate online “spinning reserve” i.e. having sufficient generating capacity readily available to cope with a major system fault, e.g. a power station going off line or a fault on a high voltage transmission line.
Because many European energy companies are privately owned and heavily regulated, there is a reluctance47 48 to change from a well established business model. There is an unwillingness to make the necessary capital investment to change the paradigm, from one of reliance on large conventional power stations with a secure and reliable supply, to one where significant proportions of the companies’ power is sourced from intermittent renewable sources and energy traded over the super grid. However, the EU is leading the way with the Third Package of internal energy markets legislation49, which is due to come into effect in March 201150. The aims are, to quote51;
• to separate production and supply from transmission networks
• to facilitate cross-border trade in energy
• more effective national regulators
• to promote cross-border collaboration and investment
• greater market transparency on network operation and supply

Overcoming Challenges for the Offshore Wind Industry and Learning from the Oil and Gas Industry Page 59 of 245
• increased solidarity among the EU countries
Although the road map set out by the EU is clear in its intent, there are technical, financial, operational and political difficulties to be overcome. The oil and gas industry has technology which will help overcome the challenges of laying high power underwater cables, which will be an essential part of the super grid. The technical challenges surrounding the European grid probably don’t lie in the underlying technology, but in the ability of the industry to deliver the grid on time i.e. it’s more an issue of capacity than technology. The financial problems are in raising the capital to install the hardware and establishing effective methods of paying for the use of the grid. These issues must be resolved, in the context of:
• a highly regulated Industry,
• regulation which governs the profits the transmission system operators are allowed to make,
• how the financial markets see the profits in terms of risk and reward compared with other global investment opportunities.
Operationally, the movement of electricity around Europe is likely to be constrained by the grid for some time; this will give rise to conflicts over who has rights to use the grid where it is constrained and this will require clear rules and unbiased implementation. The politicians have a significant task in preparing citizens for the increases in the cost of electrical power and changes in the way in which electrical power is sold, which will be significantly different to the status quo.
Legal
The current legislation regarding renewable energy varies in different EU member states. Further, the national legislation is often in a state of flux as the electrical supply industry is transformed from the old model of large vertically integrated energy supply companies, often either state owned or newly privatized, to an “unbundled model” where the generators and retailers of electrical power compete and the transmission and distribution systems operators are effectively very heavily regulated independent monopolies. The EU52 is also seeking to establish a single European market for electricity and, with a set of European legislation which is common to all states, to enforce the 2020 renewable energy targets and demand National Governments to legislate to implement their individual National Renewable Energy Action Plans.
Disparate Legal Systems and Associated Requirements Under EU legislation the top level objectives are set by the EU and the member states are free to decide how to comply with the objectives within EU and national law. National governments are free to decide how the 2020 targets are implemented, which sectors of the country’s economy have to deliver cuts in CO2 emissions and how the 20% renewable energy obligation is meet.
“The 2001 and 2009 Directives do not prescribe an EU-wide support system. Instead, it allows the member states to apply support schemes or measures of co-operation provided for in the 2009 Directive (e.g. arrangements for statistical transfers of specified amounts of renewable energy, joint projects between member states, joint projects between one or more member states and third countries, and joint support schemes).”53
All EU governments were tasked with submitting a national renewable energy action plan in July 2010, the action plans must:

Overcoming Challenges for the Offshore Wind Industry and Learning from the Oil and Gas Industry Page 60 of 245
"set out the sectoral targets, the technology mix they expect to use, the trajectory they will follow and the measures and reforms they will undertake to overcome the barriers to developing renewable energy" 54 .
At the time of writing this report 19 action plans had been submitted.
The EU has published a statistical review of the 19 action plans published so far 55, which compares the targets set by individual countries. Although it would be possible to extract the individual mechanisms which will be used to achieve each country’s targets, it is considered beyond the scope of this report.
EU member states having different incentives, rules and regulations to drive and control the move towards renewable energy, may seem chaotic and lead to one member state or region being favoured over another because ,for example, the incentives might be better or because it might be easier to get planning permission. However, planning and environmental legislation has a much greater remit than renewable energy and is enshrined within national law and customs. It is not practical to try and insist on having a “level playing field” throughout the twenty seven member states.
This leads to differences in the way in which renewable energy is subsidised as discussed in section 0, and differences in national policy in the areas of:
• planning, planning law and processes,
• protection of the environment,
• grid access,
• the applicability of EU state aid rules.
EU 2020 Targets, What Happens in Reality if You Don’t Comply? The EU Commission seems to be set on taking a hard line if countries do not comply with their national renewable energy action plans. The Commission has taken action to try and enforce previous renewable energy targets and since 2004 has started 61 legal proceedings against member states for non-compliance with the renewable electricity part of Directive 2001/77/EC. Sixteen of these have not yet been resolved and this has been taken to mean that the law is not robust enough and a further strengthening of European laws has been made56.
The new directive: DIRECTIVE 2009/28/EC OF THE EUROPEAN PARLIAMENT AND OF THE COUNCIL of 23 April 2009 - on the promotion of the use of energy from renewable sources and amending and subsequently repealing Directives 2001/77/EC and 2003/30/EC, makes the wording much stronger:
“In the light of the positions taken by the European Parliament, the Council and the Commission, it is appropriate to establish mandatory national targets consistent with a 20 % share of energy from renewable sources and a 10 % share of energy from renewable sources in transport in Community energy consumption by 2020.” 57 (emphasis added).
Member states must submit a progress report at the end of 2011 and every two years thereafter (Article 22). If a member state falls below its indicative trajectory, it must submit an amended national action plan setting out ‘adequate and proportionate measures to rejoin’ the indicative trajectory (Article 4(4)). Member states are also obliged to report to the Commission on:
• joint projects between member states and projects with ‘third countries’,

Overcoming Challenges for the Offshore Wind Industry and Learning from the Oil and Gas Industry Page 61 of 245
• the responsibilities of the national administrative bodies, and the relevant authorisation, certification and licensing procedures,
• technical specifications relating to renewable energy equipment, building codes designed to increase the share of renewable energy in the building sector and reduce overall energy consumption,
• ensuring that new or renovated public buildings fulfil ‘an exemplary role’ in the context of the Directive,
• the efficiency of biomass conversion technologies, heat pumps and solar thermal energy equipment,
• the provision of information and guidance to the relevant actors as regards, for example, support measures for renewable energy and certification schemes,
• systems for guaranteeing the origin of energy from renewable sources,
• the improvement of grid infrastructure to accommodate more electricity production from renewable sources,
• biofuels and bioliquids – including sustainability criteria and verification thereof, and the calculation of the greenhouse gas impact of biofuels and bioliquids,
• the use of energy from renewable sources in transport.
The Commission is required to commence infringement proceedings against member states that do not meet their 2020 renewable energy obligation, but there are no binding interim targets and this may be seen as a significant weakness in the Directive.
To take proceedings against a member state for not meeting interim targets would require the use of a “technicality” i.e. not complying with a reporting procedure or some other detail of the Directive. These infringement proceedings would not be very effective, since they don’t attack the core problem and could potentially take years to produce results 58.
Comparison with the Oil and Gas Industry The complex set of international rules and regulations which promote and control renewable energy in Europe are in stark contrast to the rules and regulations governing the offshore oil and gas industry. The oil and gas industry legislation is, by and large, the sole domain of the host country, there is no oversight or target setting by the EU. The legislation has largely been enacted to:
• control the oil and gas companies,
• prevent them exploiting the reserves too quickly,
• stop oil and gas companies gaining licenses with the intent of holding them in a portfolio of prospects with no intent to exploit the reserve in the foreseeable future,
• derive revenue from licenses in addition to taxes on the hydrocarbons produced, corporation tax and supplementary charges.
In the UK there are two basic types of license59, an exploration license, which lasts for three years and can be granted for any block not already licensed and production licenses, which for offshore blocks have three variations, traditional licenses, promotional licenses and frontier licenses, promotional and frontier licenses are modified versions of traditional licenses.
Traditional licenses have three terms, an initial four year period during which an agreed exploration work program must be completed, a four year period during which a minimum of one field plan must

Overcoming Challenges for the Offshore Wind Industry and Learning from the Oil and Gas Industry Page 62 of 245
be submitted and approved and an eighteen year production period. Normally 50% of the licensed area has to be relinquished after the first term.
Promotional licenses reduce the license fee by 90% for the first two years, but insist on a “definite drilling program” by the end of the second year.
Frontier licenses apply to large, difficult (i.e. deep) or unexplored areas. The license fee is reduced by 90% for an initial screening phase after which 75% of the area licensed has to be relinquished.
The application process is essentially a contest during which the applicants understanding of the geology of the block and the financial, technical and environmental ability of the applicants to exploit the block are tested. The DTI/DECC have created a “Marks Scheme” to rank applicants and it is normally the applicant with the highest mark which is awarded the block.
There are conditions placed on the license, the operator must collect data on the hydrocarbons produced and sold and permission must be sought and granted to start or restart the drilling of a well or the abandonment of well. There are also conditions placed on the design of well or the design of a well abandonment procedure. When a well is drilled an operating company must be appointed and approved by the DTI/DECC. There is also an obligation to deposit financial securities to meet decommissioning costs.
There is further legislation which covers environmental protection and health and safety, however, although the context is different in many ways between the two industries, the basic principles are common to both offshore wind and offshore oil and gas.
It is clear that whilst EU renewable energy legislation is driven by a series of high level EU objectives, security of supply and reduction in global warming being the most prominent, oil and gas legislation is driven by the need to control oil and gas production, maximize the recovery of oil and gas and raise revenue for the host country. Although both are controlling the supply of energy, they are very different in many respects.

Overcoming Challenges for the Offshore Wind Industry and Learning from the Oil and Gas Industry Page 63 of 245
Technical/Supply Chain/Environmental
Technical
Safety Implementing an Effective Safety Culture Safety is a key issue and must underlie everything a company does60. All companies now stress that safety is a key issue and that the culture has to be driven from the senior executives. Further the law makes it clear that a company’s executives are liable to criminal prosecution should safety flaws result in a serious accident. The reality is that implementing safety systems may seem expensive, but the costs associated with a serious accident are even higher in financial terms, and in the company’s reputation and personnel responsibility, with the potential for a significant fine or a jail sentence if senior managers are found to have failed in their duty of care.
The attitude to safety has changed a lot in the offshore oil and gas industry in the forty or so years it has been operational in the North Sea. The initial attitude was very much an “us and them” with safety often been seen by operating companies as getting in the way of efficient operations and “just costing money” with the UK Health and Safety Executive attempting to impose safety rules. The Piper Alpha Tragedy and the subsequent Cullen Inquiry and Report 61into offshore safety changed attitudes and made safety everyone’s responsibility. Since then the UK Health and Safety Executive has adopted a different role which includes; monitoring, providing guidance, issuing improvement notices and in extreme cases shutting facilities down if they consider there is significant risk of an accident. In essence safety is the company’s responsibility, and company policies cascade this to make it the responsibility of all its employees’. Companies have responded by having safety policies, procedures and training, setting goals and targets and measuring performance against their own internally set aims and objectives (collectively known as safe systems of work).
There are of course national differences between Health and Safety regulations in the North Sea, but since many of the companies working in the oil and gas sector are multinational organizations, there is a trend towards implementing the most exacting standards the company is likely to have to work under. After all, there is no point in having a set of policies and procedures for country “A” if these have to be changed when the ship moves a few miles across a medium line to work in the water of country “B”. Offshore workers can also legitimately ask, “why are safety standards higher if I work in country “A” rather than country “B”?” This trend has been reinforced by the adoption of a limited number of software packages which assist in the administration of work packages and permits to work.
In discussions with industry there seems to be a reluctance of some offshore wind developers to be driven by tried and tested standards developed over decades by the oil and gas industry, often based on painful and expensive experience. There appears to be a perception that by adopting these there is an implicit act of buying in to higher cost, rather than achieving better value. There is a question as to whether this is a cultural perception or a reality. The adoption of common standards for the implementation of offshore safety would bring benefits to both industries by allowing them to share the same cost base, share experience and improvements to safety systems and help eliminate confusion when personnel transfer from one industry to the other.
Taking Safety “Too Far” There is also a general view that some companies have taken the implementation of safety rules too far, to the point where people feel that the company is missing the point and trivializing some aspects

Overcoming Challenges for the Offshore Wind Industry and Learning from the Oil and Gas Industry Page 64 of 245
of safety, in essence applying safety rules without a filter of common sense. Examples of these “trivial” safety rules include holding the hand rail when walking up or down stairs, having to reverse into a parking space in the company car park, having to put a lid on a cold drink in an office environment, or having to issue at least one “stop card” per week, even though the member of staff may not have seen anyone breaching a safety rule. This leads to the situation where people loose faith that the company is really looking after serious safety issues, and that any serious safety issues are likely to get lost in a sea of trivia. A simple example of the way many people view the trivialization of safety was TV footage of Queen Elizabeth walking, unaided, down a stair case when she visited the Wimbledon Tennis Championship in 2010. In many oil and gas related companies, the Queen would have been given a red (stop) card for not holding the hand rail!
The key in many people’s minds is not to trivialize safety but to focus on getting the safety culture right and resolving key issues in a genuine attempt to improve safety. There also seems to be an inherent difficulty in criticizing anything related to safety, i.e. health and safety directives go unchallenged, even when they appear to defy common sense, this combined with a heavy handed top down approach, often seems to prevent a serious and well developed discussion about how appropriate a safety measure is to improving safety.
Making Sure the Right Technology is in Place Safety is more than a strong safety culture, training, having safe systems of work and a vigilant work force. The technology used must also be inherently safe and designed to the best available standards. To achieve this objective, the operating company should be in control of the technology used on its assets, be they oil and gas installations or offshore wind farms. If the operating company is not in control of the technology it relies upon for safe operation it risks equipment which is not “best in class” and the safest available, this may increase the risk of an accident but it won’t change the operating company’s liabilities which may be a consequence of an accident.
The oil and gas industry’s technical knowledge and understanding of the design issues is constantly evolving and improving and there have been very significant advances since the first North Sea oil and gas platforms were built in the late 1970’s. It is now standard practice to study failure modes and to ensure that designs have sufficient redundancy to still be safe after a significant number of failures. The level of redundancy built in to a design is usually determined by the criticality of the equipment, a more critical item of equipment having more levels of redundancy included in the design. However, cost is always an issue and additional levels of redundancy make equipment more expensive so it is important to tailor the design to the likelihood of a failure and the consequences should that failure occur.
To ensure offshore operations are as safe as practically possible, it is imperative that all the companies operating in the North Sea take advantage of improvements in technology as and when they become available.
However, the way in which the offshore oil and gas industry is structured makes it difficult to introduce new technology and this may slow down the rate at which safety is being improved. The average time it takes to introduce a new technology in the offshore oil and gas industry is approximately ten to fifteen years, compared to less than a year in the electronics industry.
The underlying problem seems to be the way in which oil and gas producing companies have restructured their business over the last twenty years or so, with an increasing focus on their core

Overcoming Challenges for the Offshore Wind Industry and Learning from the Oil and Gas Industry Page 65 of 245
activities, that is oil exploration and production, while generally excluding the more general engineering associated with offshore installations.
As a direct consequence of focusing on “core activities” oil and gas producing companies use a suite of products and services bought, by competitive tender, from specialist suppliers and service companies. In general the key internal resource in any oil and gas company are the geologists, geophysicists petro-chemists etc, the people who are trained to understand and interpret the data acquired by seismic, gravity and electromagnetic surveys and exploration drilling. This has led to a situation where many senior executives in the oil and gas majors have little or no understanding of the offshore engineering requirements. This was noted in a critical UK HSE report in 2007;
Ian Whewell, head of HSE’s offshore division until 2009, said:
“A ground-breaking piece of training was set up after a critical HSE report in 2007 identified flaws in management. Many senior managers in the offshore sector had risen through marketing and accountancy but had not come through the engineering ranks. There was a surprising lack of recognition of the full significance of managing major risks,”62
The emphasis by the oil companies on core competencies and leaving the market to provide the services has led to the oil companies slimming down their engineering departments, more or less eliminating non-core activities in their quest to become highly profitable commercial vehicles.
This has had some unwelcome side effects, because offshore oil and gas producing companies have reduced their engineering R&D budgets in areas outside their core activities 63. Table 7 taken from the UK Department for Business Innovation and Skills website64, shows that oil and gas producing companies have the lowest R&D spend as a percentage of CAPEX of any major UK industrial sector at just 3% in 2008, down from 4% 2007. The exception is that they have continued to fund early stage, collaborative R&D through university research and industry bodies, for example, ITF in the UK, The National Energy Technology Lab in the USA, Research & Development Corporation in Newfoundland and Labrador, etc. The logic being it is better to fund early stage collaborative research and to pay for development and commercialization through the purchase price of goods and services procured from the market. That is, the oil and gas producing companies expect to see a proportion of the profit made by manufacturing and service companies reinvested in R&D. Oil and gas producing companies also argue that it is difficult for them to fund R&D in specific manufacturing or service companies, without distorting the market, by effectively subsidizing particular companies. Major oil and gas producers also prefer to buy commoditised products, which are available from multiple vendors by competitive tender, they do not like to buy specially developed products which are protected by intellectual property right and sold at a premium by a single vender, unless there is no other option.

Overcoming Challenges for the Offshore Wind Industry and Learning from the Oil and Gas Industry Page 66 of 245
Table 7 Key Sectoral Trends Across UK1000
The inevitable side effect of reduced activity in engineering and non-core R&D is a loss of control over the development of key items of equipment, and these are often the items of equipment on which the oil and gas companies rely on to operate safely and profitably. Many oil companies have taken this process one step further in that they no longer own much of the equipment they rely on, it is hired from the market place. It is quite common for example for an oil company not to own the drilling rig, riser, BOP etc, but simply to pay for the hire of the personnel, equipment and the consumables used during the drilling program. Further some oil and gas production companies don’t own or operate the production facilities, but subcontract the day to day running of the rig to an operating company and charter the FPSO (Floating Production Storage Offloading) facility from a vessel owner.
Thus the oil and gas producing companies have to rely on what the market has to offer, which is in turn governed by the economics of the market in which the manufacturers and service companies operate. The key factors which determine the manufacturers’ and service companies’ desire and ability to innovate are:
• the company’s profitability,
• the appetite of the owner and share holders to invest profit in R&D,
• the state of the market and particularly the company’s position in relation to its competitors,
• the “time to market” for new products and services (which is often extended),
• the willingness of customers to buy new products or services, particularly at a premium price.
These factors are not unique to the offshore oil and gas industry, however, the last two items, the willingness of customers to buy new products and services and the time to market, are substantially different from other industries.
Oil producing companies are notoriously conservative in their buying policies, they like to see a significant track record of operation before committing to a new product or service and typical times to full market acceptance for a new product are of the order of 10 to 15 years 65 as illustrated in Figure 12 Time to Market. Neither of these factors, especially when combined with the oil and gas producers desire to buy at commodity prices, make it a particularly attractive place for service companies and manufacturers to invest in new technology.

Overcoming Challenges for the Offshore Wind Industry and Learning from the Oil and Gas Industry Page 67 of 245
Figure 12 Time to Market
There are obviously exceptions to the broad generalizations described above, but the general tenor of the offshore oil and gas industry is a conservative one where technology and working practices change slowly and oil companies have almost completely lost any control over the equipment which they rely upon to operate safely and profitably. They are relying on innovation and development from a service and manufacturing sector where the financial returns on innovation are uncertain and the pay back times extended.
Unfortunately, the offshore wind industry seems to have the same general structure, with major utility companies buying offshore wind energy parks from major turbine suppliers on a cost per Mega Watt installed basis, without having very much control over the detail of the technology used to implement the wind energy park. Further, the offshore wind energy market has been a relatively small fraction of the total market for wind turbines and wind turbine manufacturers have been supplying essentially the same wind turbines which were designed for use onshore. This has led to a very poor record of reliability for some of the early offshore wind farms, (see section 0) with significant numbers of failures in major components, typically gear boxes, generators and transformers 66. Because offshore wind turbines don’t have the same constraints as onshore wind turbines, it has been argued that fundamental design of offshore turbines should be different to onshore turbines, to ensure that they are optimized for the different operational and environmental conditions found offshore. However, it seems that for most offshore wind farms currently either under planning or construction, the land-based 3 bladed upwind turbine will be deployed, even though the basic design is probably fundamentally wrong.
The reasons given for this approach are the “bankability” of the project; financiers and utility companies are conservative and like to see many years of track record before they will fund the technology in a large offshore wind energy project. Further, large utility companies like to be able to buy a commodity by competitive tender. It can also be argued that utility companies and financiers don’t have in-house expertise to evaluate the risks associated with either using the current generation of turbines or a new “offshore design”.
It seems clear that the offshore wind industry will follow the lead of offshore oil and gas in implementing the recommendations inherent in the Cullen Report, making offshore safety everyone’s
Time (years)
0 5 10 15 20 25 30 35
E&P industry(15 tech. Cases)
ADSL (broadbandtelecom)
Medicine(Merck-average)
Consumer products (US average) – Idea to prototype
– Prototype to field test– Field test to commercial– Commercial to 50% market penetration
Expandables
0 5 10 15 20 25 30 35
E&P industry(15 tech. Cases)
ADSL (broadbandtelecom)
Medicine(Merck-average)
Consumer products (US average) – Idea to prototype
– Prototype to field test– Field test to commercial–
Source: McKinsey Survey
Expandables

Overcoming Challenges for the Offshore Wind Industry and Learning from the Oil and Gas Industry Page 68 of 245
responsibility and ensuring that the safety culture is driven from the company’s executive down. However, it is unclear how the offshore wind industry will improve on the recommendations set by Cullen. It can only be hoped that they don’t pursue the trivia which seem to have invaded some oil and gas producers and keep focused on how to tackle some of the key issues affecting safety, for example boredom and complacency, which are often the underlying cause of accidents in situations where task and procedure are executed repetitively.
Unfortunately, it seems like the offshore wind industry is already going down a road where major utility companies have very little control over the technology on which they will rely on for safe and efficient operation over many years, preferring to stay focused on their core business of selling electrical power to consumers. Sounds familiar?
Overcoming the Problem of Complacency The changes in the way safety is perceived and put into operation since the implementation of the Cullen Report are generally thought to have made a really significant improvement; the North Sea is much safer now than it used to be. However, accidents still happen and it continues to be very important to find ways of improving safety. One of the biggest problems highlighted in discussions with industry is the problem of complacency and it is common to both the oil and gas industry and the offshore wind industry. Many of the routine tasks which have to be performed to keep offshore equipment operational are repetitive and relatively simple to perform, although they take place in a hazardous environment. It is easy for the technicians to become bored, distracted and complacent; unfortunately the associated lapse in concentration can lead to accidents. This is a well known natural human response67 68:
“The word ‘complacency’ has negative connotations, but it is not intended to be derogatory when used in this context; we are referring to the natural human response to a very familiar situation. When we do something for the first time, we are intent on what we are doing and we are painfully aware of the hazards; by the time we have done it without incident a thousand times, we have lost that stimulation; we have become confident that nothing will go wrong; and our guard is lowered. So complacency is not a criticism, but is an aspect of human nature – one that every experienced mariner will recognize”69
So, overcoming the problem of complacency is not trivial, it’s a natural human reaction and other industries have worked hard to find ways to combat it. The airline industry uses a combination of techniques:
• extensive training using simulators,
• a pilot and co-pilot system of operate and active checks (not box ticking),
• rotating tasks, so the captain and co-pilot rotate the task of flying the plane,
• regular competency checks, both by senior test pilots and the use of simulators,
• carefully managing the hours worked with regard to time zones and human biorhythms.
The general advice to combat boredom and complacency is:
• establish a top down safety culture,
• review safety systems regularly to ensure they are appropriate and workable,
• ensure work is distributed evenly so everyone has useful things to do,
• rotate working rosters so that work patterns vary,
• don’t “dumb down” to the point where the task is meaningless,

Overcoming Challenges for the Offshore Wind Industry and Learning from the Oil and Gas Industry Page 69 of 245
• do not take unnecessary risk,
• follow the procedure,
• train, retrain and test regularly,
• conduct regular exercises and discuss lessons learned from accident investigation reports.
Since complacency is a natural reaction to the familiarity of a task, keeping the work force “fresh” by designing change into the work rosters seems like the most effective way of combating the potential dangers.
Because the problems of boredom and complacency are common to both offshore wind and offshore oil and gas industries, perhaps there is an opportunity to run jointly funded R&D programs to investigate the best methods of combating these difficult safety-related problems.
Effective Safety Training One of the key aspects of safety offshore is effective training. In the offshore oil and gas industry OPITO70 has taken the lead and has published a series of standards which effectively govern offshore safety training. OPITO does not provide training but sets the standards for commercial organisations to work to. OPITO also approves training courses, i.e. provides assurance that training courses meet OPITO standards.
OPITO has set a minimum level of training71 which has been taken as mandatory by many offshore operating companies and when this is combined with a current offshore medical certificate and a current “Basic Offshore Safety Induction & Emergency Training72” certificate, it provides a base level set of certification required to work offshore.
An OPITO approved “Minimum Safety Training Standards” course includes nine modules and an assessment. The nine modules are:
1. Introduction to the Hazardous Offshore Environment 2. Working Safely (including Safety Observations Systems 3. Risk Assessment 4. Permit to Work 5. Platform Integrity 6. Mechanical Lifting 7. Manual Handling 8. Control of Substances Hazardous to Health (COSHH) 9. Working at Height
It should be stressed that these are minimum standards and that further training is often considered to be essential before specific tasks can be performed offshore. It is common practice for all offshore safety training certificates to be registered on the “Vantage73” data base and accessed via the internet. This allows operators to check online that offshore workers have necessary valid offshore certificated at the point of departure. It also allows offshore administrators to assign cabins and lifeboats and gives them ready access to medical and next of kin records should the need arrive. Vantage has been extended to a method of tracking “Personnel On Board74” (POB) and because it has global access and needs only a valid registration card (complete with photograph) it is simple and efficient to use.
The offshore oil and gas industry is also working towards other common standards, including;

Overcoming Challenges for the Offshore Wind Industry and Learning from the Oil and Gas Industry Page 70 of 245
• Common Induction Process (CIP)
• Integrated safe system of work (ISSOW)
• Common Permit To Work
It has taken the offshore oil and gas industry a long time to realize and implement simple standards which make the industry more efficient and make it easier to spot personnel who are trying to cheat the system by not having the required minimum training and who may be a hazard to themselves and others in an offshore environment.
The offshore wind industry at least in the UK appears to be taking an independent line. The organisation Renewables UK announced in 1st January 2010 that it has taken responsibility for and taken over:
“the standards and approvals protocols for health and safety training for wind energy and marine renewables sector in the UK75 ”
Renewables UK argue that:
“At present there are no suitable schemes or qualifications that can easily address the identified gaps in knowledge”
This decision seems to be a retrograde step and has the potential to divide the workforce between those are qualified to work in the oil and gas sector and those qualified to work in the offshore wind industry at a time when the offshore wind industry will almost certainly need all the experienced and skilled people it can attract from the offshore oil and gas industry. Further, Renewables UK will not pursue a passport type scheme (no doubt a reference to the Vantage system) and will introduce new standards specific to the offshore wind industry.
Discussion with senior members of the oil and gas industry suggest that they see no reason why offshore wind should not be accommodated with the current systems with amended and adapted courses, keeping common components in place, and describe the decision by Renewables UK as a “turf war”.
Logically there is no obvious reason why basic qualifications which already cover offshore job descriptions ranging from catering staff, though instrument technicians and electricians to roustabouts, divers, ROV operators, crane operators to the Offshore Installation Manager, and include; working at height, working with mega watt power installations and working with SCADA control systems, cannot be adapted for personnel working on offshore renewable energy generating plant. Further, it is interesting to note that the Vantage system tracks over a million personnel movements per year to and from over 420 locations and is already in use in UK, Ireland, Denmark, the Netherlands, Angola, Nigeria, Azerbaijan, Tunisia, Trinidad and Indonesia.
There are also arguments to support the introduction of a European or International set of qualifications for offshore safety training (under the ISO banner). The industry is inherently multinational and multidisciplinary, so there is a key requirement for staff to be transferable between offshore industries and between nations; many companies already work across national and industrial boundaries, the requirements fit well with the EU’s aim to have a transnational electricity industry with international cooperation playing an essential part.

Overcoming Challenges for the Offshore Wind Industry and Learning from the Oil and Gas Industry Page 71 of 245
Effective Supervision Effective supervision is harder to achieve than good basic safety training, it is a “softer skill” and although supervisory skills can be taught, not all people make good supervisors.
The North Sea Offshore Authorities Forum (NSOAF)76 defines 12 key aspects of supervision as:
1. “Selection, training & assessment of supervisors 2. Supervisory roles, responsibilities and accountabilities 3. Organisational support for supervisors 4. Supervision delivery and planning / performance indicators 5. Contractors and supervision 6. Valuing subordinates / workgroup participation / decision making 7. Communication / handovers 8. Supervisory worksite visits 9. Learning culture / supervision and accidents/incidents 10. Process safety 11. Procedures & instructions 12. Leadership”
Supervisors are recognized as key figures in managing safety prevention barriers. In order to carry out this duty they must have the relevant competencies i.e. technical, situational awareness / risk perception and “soft skills”.
The North Sea Offshore Authorities Forum acknowledges that there is a general lack of skilled, knowledgeable, experienced supervision personnel, at a time when the industry is buoyant and it is also necessity to fill supervision posts due to the retirements of experienced supervisors.
An international audit of supervision in the North Sea oil and gas industry was undertaken by the North Sea Offshore Authorities Forum (NSOAF)77 in 2008 and 2009. The key findings of the report were;
“Key Strengths:
• The importance of supervision is well recognized and understood by personnel at all levels. Therefore, supervision aspects were observed to be well covered in the various management systems.
• The need for supervisors to have management skills such as, inter personal communication, safety leadership, intervention, coaching etc. commonly called ‘Soft Skills’ is recognized and accepted. Training exists for these as well as company initiatives for improvement in these areas.
• The need for effective competency assurance is recognized and accepted.
• Management consider that offshore supervisory input to the offshore resource and activity planning process is crucial.
Key Challenges:
• The assurance of contractor supervision competency,
• The provision of adequate supervision,
• Monitoring of supervisory performance,
• The assurance of supervisory knowledge and management of safety barriers.”

Overcoming Challenges for the Offshore Wind Industry and Learning from the Oil and Gas Industry Page 72 of 245
It is clear from the NSOAF78 report that the requirement for supervisory skills and the management of these skills is well understood by the senior management of most companies engaged in the offshore oil and gas industry, however, there seems to be a problem in recruiting good supervisors and ensuring that there are sufficient skilled supervisors available to ensure that tasks are carried out safely and efficiently.
There is very little reported in the public domain about supervisory skills in the offshore wind industry, perhaps because the industry is relatively new and the issue of offshore supervision has been in the hands of the established offshore contractors and the turbine manufacturers who have often been contracted to provide construction and maintenance services for, typically, the first five years of operation.
Resolving Cost and Safety issues Resolving cost and safety is notoriously difficult to do; there are often conflicting drivers and where, to quote Magne Ognedal of the Petroleum Safety Authority Norway:
“The challenge is to balance rigor with practicality.79”
In an environment where:
“the oil and gas industry views compliance as an obligation rather than an opportunity.80”
The task resolves down to a consideration of the concept of “As Low As Reasonably Practicable81” or ALARP, which is a process which recognizes the requirement to reduce risk to a minimum in an environment where cost, or economic factors are important.
It is the process of establishing the balance between what is an acceptable risk is and what is an acceptable cost. There are numerous sources 82 of guidance on how the principle of ALARP should be used and who should be involved in the ALARP process. Perhaps the most useful illustration of ALARP is a framework taken from a UKOOA document published in 1998 and used in a paper written by J.E. Strutt, J.V. Sharp, E. Terry, R. Miles written in 200683 84.
“The framework defines three broad categories of decision for a project, namely:
A. Nothing new or unusual.
• No major risk implications.
• Established practice.
• No major stakeholder implications.
• No significant economic implications.
B. Business risk or life cycle implications.
• Some risk trade off.
• Some uncertainty or deviation from standard or best practice.
• Some significant economic implications.
C. Very novel or challenging project.
• Strong stakeholder views and perceptions.

Overcoming Challenges for the Offshore Wind Industry and Learning from the Oil and Gas Industry Page 73 of 245
• Significant risk trade-off or risk transfer and large uncertainties with possible lowering of safety standards and major economic implications.
The UKOOA framework identifies seven decision making methods in general use throughout industry, namely the use of:
1. Codes and standards 2. Independent verification 3. Good practice 4. Engineering judgment 5. Quantitative risk assessment with cost benefit analysis 6. Company values 7. Societal values
The diagram presented in Figure 13 Decision Making Framework Mapped Against Capability Level Adapted from the UKOOA Framework. Figure 13 Decision Making Framework Mapped Against Capability Level Adapted from the UKOOA Framework. describes a common sense approach where a more complicated and unusual project requires people of a higher calibre to make the decision as to whether the principle of ALARP has been met.
Note the use of Quantitative Risk Assessment (QRA)85 and Cost Benefit Analysis (CBA)86, which are in themselves difficult concepts to use and require extensive experience in order to achieve consistent results.
It is clear that the offshore oil and gas industry along with other hazardous industries have progressed over many years along a path of improving the process of optimizing the difficult trade-off between cost and safety. The offshore wind industry will no doubt take full advantage of this previous work, often derived from the analysis of accidents and hard won experience. However, there are words of caution. In the interview with Magne Ognedal referred to in this section, he warns of the lack of experienced health and safety professionals, noting that it takes years of experience to become a proficient health and safety professional. Magne Ognedal is also clear that there is no point in bringing forward new projects unless the team has a full complement of experienced health and safety staff and that new projects have been delayed in Norway because of a lack of experienced health and safety staff.

Overcoming Challenges for the Offshore Wind Industry and Learning from the Oil and Gas Industry Page 74 of 245
Figure 13 Decision Making Framework Mapped Against Capability Level Adapted from the UKOOA Framework.
Potential Use of Robotics To improve safety in underwater operations, the principle objectives are to:
• remove divers from the water (which is considered to be a hazardous environment),
• allow underwater operations to be performed in deepwater, the maximum depth a commercial diver will operate at is normally 180m, although it is possible to dive to around 300m,
• to reduce costs.
The offshore oil and gas industry has developed techniques to perform underwater tasks remotely, using remotely operated vehicles (ROVs) and more recently autonomous underwater vehicles (AUVs).
There are basically three categories of task currently performed by ROVs and AUVs:
• Inspection tasks, which include visual observation, sonar surveys, magnetic survey and cathodic protection surveys,
• Intervention tasks, where the vehicle manipulates an item, for example, turning a valve, removing and replacing a wellhead choke valve, fitting a wellhead debris cap, injecting fluid, making an electrical connection, etc.,
• Construction tasks, where an ROV may for example dig a trench, pull a pipeline into a connector, connect or disconnect a crane hook, assist in the positioning of an object on the seabed87.
Intervention and construction tasks are achieved using one of the two standard approaches to underwater remote operation:

Overcoming Challenges for the Offshore Wind Industry and Learning from the Oil and Gas Industry Page 75 of 245
• using a manipulator arm in a relatively unstructured environment where the minimum adaption to the original equipment is required,
• using a special purpose tool in a highly structured environment, where the equipment is modified to provide guidance and location for the tool.
An unstructured environment relies on highly skilled operators, it has more potential for mistakes and damage to occur, but is simpler and cheaper to implement.
Figure 14 Torque Tool on a T bar88
A highly structured environment requires a lower level of operator skill and is much more robust, but the equipment has to be designed to incorporate the guidance and location mechanisms. Figure 15 Highly Structured Wellhead is an example of how all the values and other equipment which require ROV intervention have been mounted in locations whish are easy to access. The ROV docks onto dedicated docking points, from which the offsets for the valve to be manipulated are, know. The tool can then be positioned using a Cartesian (x,y,z,) carriage using a know procedure.
Figure 15 Highly Structured Wellhead
Observation tasks generally require the ROV or AUV to carry a sensor package and navigate accurately so that the data collected can be referenced to a plan or more commonly geo-referenced to a

Overcoming Challenges for the Offshore Wind Industry and Learning from the Oil and Gas Industry Page 76 of 245
coordinate system. A video inspection of a structure can normally be referenced to drawings of the structure using an audio commentary based on visual observations. Pipeline and seabed surveys normally require geo-referencing to the GPS datum WG84 and this is achieved in the case of an ROV with an ultra short base line acoustic system, which positions the ROV relative to the vessel and a high accuracy DGPS system which fixes the ship with reference to world coordinates. If the survey is being carried out by an AUV, an inertial platform would normally be used to track the AUV, the inertial system would take its reference from either an array of seabed transponders or from an ultra short baseline system on a surface vessel.
In the 1970’s there was a wide range of different proprietary ROV interfaces proposed by offshore contractors, each contractor was attempting to establish a position in the market with a de facto standard. However, pressure from the offshore operators and a realization that multiple standards were holding the deployment of underwater robotics back, led to the development of American Petroleum Institute (API) standard, API 17 which was later translated into ISO standard, ISO 13628-8 2006.
The oil and gas industry has developed a world class capability in underwater robotics with hundreds of ROVs operational worldwide, operating down to 3000m or more. It is also developing a significant fleet of AUVs capable of surveying autonomously for several days at a time, returning very high quality data.
The oil and gas industry has also developed an equivalent remotely operated capability for downhole equipment which has to withstand the high temperature and pressure of a live oil well and the harsh mechanical and chemical environment. Downhole equipment ranges from relatively simple wireline logging tools which measure temperature and pressure to sophisticated packages used for directional drilling and measurement whilst drilling.
The oil and gas industry has not developed an equivalent capability for topside equipment. This is probably because most offshore platforms are permanently manned, so there is not a perceived requirement for remote or autonomous systems.
The offshore wind industry can and has taken direct advantage of many of the ROV and AUV technologies available in the market place. These technologies make a substantial contribution to improving offshore safety by taking divers out of the water. They also have the potential to reduce cost by eliminating the use of expensive saturation diving (required for operations below approximately 30m) and to increase both the tidal current window and the weather window during which construction, maintenance and inspection can take place.
There is also the possibility of using some of the underlying knowledge of how to make remote and autonomous systems work in other areas, perhaps, for example, the routine maintenance of wind turbines, where it may be possible to develop a highly structured environment, which is common to many hundreds of wind turbines, and allow unmanned routine maintenance to be performed.

Overcoming Challenges for the Offshore Wind Industry and Learning from the Oil and Gas Industry Page 77 of 245
Opportunities for Cross Industry Collaboration Common Work Force There are many potential advantages in having a common work force, trained to the same basic standards and committed to working offshore:
• It would make it relatively easy for people to transfer between the two industries.
• Basic training could be common.
• It would provide service companies with flexibility when servicing contracts, allowing them to swap staff between industries as contracts are won and lost.
• It would provide a more attractive career path for young people, knowing that they would be qualifying to work in both industries, providing more security in terms of employment and more opportunities for career progression.
• It would help generate a pool of experienced offshore professionals capable of staffing and running a European wide offshore energy industry.
However a common work force will require training to a common basic standard, which will have to be recognized by both industries.
Training and Competence Sharing basic training and competence testing between the two offshore energy industries would help to reduce costs by allowing training companies to amortize overheads over a larger number of trainees. It would provide a common focal point for the introduction of improvements to safety training and would simplify record keeping in offshore passport systems like Vantage.
Common Safe Systems of Work – Common Permit to Work Systems All safe systems of work are based on a common set of principles, but differ in detail which is generally a result of company specific methodologies. It is beyond the scope of this report to detail all the aspects of a safe system of work, but at a company level it should address the following five principle topics
• Setting a policy
The company should have a clear policy for health and safety. Every level of management should be committed to the policy - top management commitment is essential.
It is also important to integrate health and safety functions with other management functions, influencing all activities including; selecting people, equipment and materials, the way work is done and how you design and provide goods and services.
• Organisation
To make a health and safety policy effective companies’ staff must be involved and committed. This is often called 'creating a positive health and safety culture' and is essential for offshore workers who are closest to the hazards and whose health and safety are likely to benefit the most. To help create a positive health and safety culture it is important to recruit competent people, and then provide training and support. In the working environment it is essential to allocate responsibilities, to ensure that the work force is committed and that they are given clear instructions by their supervisor. It is also important to foster cooperation and good communications (spoken, written or visual) between individuals and groups.

Overcoming Challenges for the Offshore Wind Industry and Learning from the Oil and Gas Industry Page 78 of 245
• Planning and setting standards
Planning is the key to ensuring successful implementation of a health and safety policy. This involves setting objectives and implementing standards of performance. A health and safety plan should be written and the following topics should be addressed:
identifying hazards and assessing risks, and deciding how the risks can be eliminated or mitigated
complying with relevant health and safety legislation agreeing targets with managers and supervisor and measuring their performance co-operation with contractors to ensure that they are also compliant with health
and safety regulations ensuring that designs, processes, equipment, products and services, all comply
with safe systems of work ensuring that contingency plans are in place to deal with unforeseen problems.
• Measuring performance
The company should set targets for realistic improvements in safety, a record of any accidents or near misses must be kept and then the safety record can be measure against your targets, to find out if the company’s health and safety plan is working. If it is not working revise the plan so it is more effect.
• Learning from experience - audit and review
The results from measuring performance and audits should be used to improve the approach to health and safety management with particular attention to:
the degree of compliance with health and safety performance standards (including legislation),
areas where standards are absent or inadequate, achievement of stated objectives within given timescales, incident data - analyses of immediate and underlying causes, trends and common
features. This approach to managing health and safety is tried and tested. It has strong similarities to quality management systems used by many successful companies. It can help to protect people and control loss. All five steps are fundamental.
Safe system of Work
From an employee’s point of view safe systems of work should consist of89:
• Basic Safety Induction and Emergency Training (BOSIET), which requires attendance at a course, normally three days duration, includes:
A briefing about the offshore industry Helicopter escape training Personal survival training The use of Totally Enclosed Motor Propelled Survival Craft or lifeboats
(TEMPSCs) and life rafts Post escape first aid

Overcoming Challenges for the Offshore Wind Industry and Learning from the Oil and Gas Industry Page 79 of 245
Fire fighting (the use of basic extinguishers and self-rescue breathing apparatus) Permit to work system Emergency Breathing Systems (EBS)
• Company Induction - Carried out by the employer as soon as the employee starts work.
• Pre-flight briefing - Completed at the Heliport prior to travel
• Installation specific induction - Completed as soon as personnel arrive on the installation or rig.
• Team and on-the job induction - Completed before starting work and at the start of every job.
• Specialised Training – this is job and task specific training, perhaps a manufacturer’s course on a specific item of equipment. There may be a requirement for further specialised training in emergency response and continuous development training to allow career progression.
All training should be reviewed at regular intervals to ensure that it still meets the companies’ requirements and personnel should attend appropriate refresher courses to ensure that the training is effective and up to date.
Permit to Work System
The permit to work system is of key importance, since this is the mechanism which ensures that overall safety of a task is maintained, it authorises work to take place, controls who is working and on which items of equipment, and ensures that two or more tasks do not conflict.
Essential features of permit-to-work systems are90:
• Clear identification of who may authorise particular jobs (and any limits to their authority) and who is responsible for specifying the necessary precautions.
• Training and instruction in the issue, use and closure of permits.
• Monitoring and auditing to ensure that the system works as intended.
• Clear identification of the types of work considered hazardous.
• Clear and standardised identification of tasks, risk assessments, permitted task, duration and supplemental or simultaneous activity and control measures.
Minutes of the meeting of the Offshore Industry Advisory Committee held on 11th November 200991 discussed a common permit to work system for the oil and gas industry. It was noted that the concept had been discussed following Lord Cullen’s report into the Piper Alpha disaster, but that no real progress had been made. It was also noted that a common permit to work system had been requested by the workforce, a request that has been echoed by discussions with major offshore contracting companies whose work force frequently move work location.
The issue from the oil company’s point of view is one of risk and cost, there is always a major risk when well established work practices are superseded with new procedures and systems. There is a significant cost implementing a new permit to work system, especially when the cost and down time of retraining the work force is considered. The argument is why replace a system which works and is compliant with health and safety regulations, with a new system with all the problems of training and changing well established work practices.

Overcoming Challenges for the Offshore Wind Industry and Learning from the Oil and Gas Industry Page 80 of 245
From a contractor’s point of view, especially a contractor who moves staff regularly between installations, the additional cost associated with the training and induction which is required before contractor’s staff are allowed to work on a different installation can be significant. From the point of view of the people who have to attend all these different training and induction courses, it is the tedium of having to sit through days of instruction, when to an experienced offshore worker, the basic principles are well understood and what they are looking for is the critical difference in the safe system of work and in particular the permit to work system.
Petrotechnics Ltd92 have developed software to implement an Integrated Safe System of Work (ISSOW), including a permit to work system, which has been adopted by several major oil companies operating in the North Sea. This illustrates that a system based on a common platform is possible although each implementation of the software will have customer defined variations on the basic software.
In summary, the principles behind safe systems of work and permit to work systems are well established and common to all offshore installations. Because each oil and gas installation is different and because companies implement their health and safety system in different ways there have to be differences in detail. However, many would argue that there are unnecessary differences in the way these systems are implemented, which gives rise to confusion when personnel transfer between installations. The differences also give rise to additional training requirements, which are often considered tedious and may be counterproductive.
The offshore wind industry can learn from the experience of the offshore oil and gas industry and implement a common integrated safe system of work, including a common permit to work system, before the industry grows to a point where it becomes “too difficult”, which is clearly the case for the offshore oil and gas industry in the UK.
Common Supply Chain and Logistics As the offshore wind industry moves further offshore and into deeper water, much of the day today supply chain which is already in place to service the offshore oil and gas industry becomes relevant to the offshore wind industry. Personnel will probably live and work offshore using some form of onshore/offshore work pattern which has become very familiar in the offshore oil and gas industry. The offshore accommodation will either be on fixed installations or floatels moored close to the wind farms. These accommodation units will require food, water, fuel (to supply stand-by generators) and waste disposal services on a regular basis. They are also very likely to use helicopters as the principle means of transporting workers to and from the offshore accommodation. These are, at a basic level, identical to the requirements of oil and gas installations, so there is no technical reason why supply boats can’t be tasked with supplying offshore wind and offshore oil and gas from the same fleet of ships, and if commercially viable on the same trip.
In a similar way, helicopter services to and from platforms could be shared, using the same mechanism as already exists within the UK offshore oil and gas sector (UK Flightshare93), as well as the more obvious sharing of airports and harbours. There may also be the possibility of sharing warehousing and other shore side facilities to reduce duplication and costs. This probably requires this sector of the supply chain to take a proactive stance, or a combined industry task force, similar to the LOGIC94 initiative in the oil and gas industry to put forward collaborative service contracts to both industries.

Overcoming Challenges for the Offshore Wind Industry and Learning from the Oil and Gas Industry Page 81 of 245
The oil and gas industry has a very well established methodology for contracting services, which consists of “First Point Assessment95” and a set of standards contracts96. First Point Assessment is a data base of prequalified companies indexed by the service they provide. The intent is to minimize the duplication which could occur during the process of generating an invitation to tender and subsequent issuing of contracts, by providing buyers with a list of suitably qualified companies and a set of standard contracts. The prequalification ensures that all the companies on the database have at least the minimum; Health, Safety, Environmental and training policies and procedures in place to UK and Norwegian standards. First Point Assessment verification is in addition to the normal expectation of ISO 9000 accreditation for quality assurance and quality control. First Point Assessment is currently used by companies in the UK, Ireland and The Netherlands.
Discussions with the service sector of the supply chain indicates that it is ready and willing to service the offshore wind industry, but with the comment that while expansion in the market has been predicted for some time, they have yet to see any substantial business from the offshore wind sector and are reluctant to invest until they can see clear evidence that the industry will develop as predicted. The service sector of the offshore oil and gas industry sees the addition of offshore wind to the PILOT/LOGIC initiatives as a logical extension to a system which is already in place and works well and would welcome a truly international version of a similar system.
Construction and Maintenance Vessels There are limited opportunities for the two industries to collaborate on installation and maintenance vessels. There are two reasons for this. The first reason is that the operational requirements, particularly during the installation phase are significantly different for the two industries.
• The offshore wind industry requires cranes with hook heights of over 100m to install large turbines, and pile driving hammers capable of driving piles of 5.597m diameter or more to significant penetration depth (50m or more depending on the structure of the seabed). Although they are unlikely to be required to operate in water depths greater than 60m (with the exception of the Norwegian HyWind project)
• The vessels used in the construction sector of the offshore oil and gas industry tend to be focused on loads of 200 tonnes or more and water depths down to 3,000m. There is more emphasis on heave compensation and deepwater pipe and riser installation.
• Umbilical and pipe lay vessels may find it easier to transfer to the offshore wind industry, because there is little difference between a large export cable, or cables laid as part of the European Super Grid, and a flexible flow line. They both require large reels to store and transport the product with tensioners to ensure that the product is lowered safely to the seabed. Further, the requirement for trenching and burying the product is identical. Current generations98 of pipe lay vessels can typically carry approximately 6,000tonne of cable/flexible flow line in carousels on deck and a further 2,500tonne of cable/flexible flow line on reels below deck.

Overcoming Challenges for the Offshore Wind Industry and Learning from the Oil and Gas Industry Page 82 of 245
Figure 16 Technip Deep Blue99
The second reason is the ownership of most offshore installation vessels, where it is common for a vessel owner to work with a contractor when building a new vessel. The vessel owner pays for the basic hull and machinery and agrees a long term charter with the offshore contractor, who pays for the additional equipment, offshore cranes, ROV and dive systems, etc. Ships are relatively long term capital assets, with typical operational lives of twenty five years or more and vessel owners are reluctant to commit to a new build unless they can see a significant market in the years ahead. They will then build a vessel to meet that market demand. Thus the capability of the vessels and their applicability to different market sectors is frequently set by vessel owners, so the opportunity to collaborate is often limited by the vessel’s inbuilt capability.
There is more scope for collaboration with maintenance vessels; however, this market has yet to form for the larger deepwater offshore wind farms. Most oil and gas maintenance vessels are prevented from servicing existing offshore wind farms by their operational draft, which is typically 5m or more, simply because the earlier offshore wind farms were generally built in shallow water.
Common Standards Common standards are dealt with in more detail in Section 0 Standarisation, however there are many opportunities for collaboration in the area of standards. A commonly held view in discussions with the industry was that the offshore wind industry should get standards under control as soon as possible, because the process of standardisation is still ongoing in the oil and gas industry and it is causing problems and additional expense. The further view was to adopt existing standards wherever possible and not to invent new standards which duplicate existing work.
Common Design Standards As noted in Appendix 1 Sections 1.1.3. Design and 1.1.4. Construction and Installation, much of the improvement in the process of design which has been pioneered by the offshore oil and gas industry has already passed into accepted practice as design codes and best practice which is inherent in software packages, university courses and design procedures used by major engineering companies. Thus the requirement for active collaboration is less important since this aspect is inherent within the offshore industry.

Overcoming Challenges for the Offshore Wind Industry and Learning from the Oil and Gas Industry Page 83 of 245
Industry Mutual Hold Harmless Scheme
On a large offshore project there may be 25 or more subcontractors working alongside each other. Unless there is specific provision to the contrary, these contractors will be "third parties" to each other because there is no contractual arrangement between them.
In the event of an accident which causes injury, these "third party" contractors will be liable to each other for any injury and loss they cause through their negligence. This could give rise to multiple court actions and the associated cost to the industry, which could be enormous, because of the web of claim and counter claim which could be generated.
The Industry Mutual Hold Harmless Scheme100 (IMHH ) does not remove the risks but allows them to be managed more effectively.
“The principal liabilities addressed within the IMHH Deed are as follows:
1. Personal injury, sickness, disease or death.
2. Loss or damage to property.
3. Consequential loss (as defined in the IMHH Deed101).
Risks being specifically excluded are:
1. Those concerning loss or damage to property or consequential loss arising out of (i) the carriage of goods by sea;
2. Any activities involving transport by air.”
Most offshore oil and gas contractors have signed up to the IMHH agreement, which is valid in UK and Irish waters, and some of these contractors have already worked on offshore wind or renewable energy projects. The general industry view is that it would be logical to extend the IMHH agreement to offshore wind and would welcome a move to make the agreement extend to European waters, simply because IMHH makes contracting with multiple parties simpler and reduces the legal and administrative overhead.
Table 8 Opportunities for Cross Industry Collaboration, summarises the current state of collaboration between the industries. The overview presented by the table is one of two industries not collaborating to any great extent. The only areas where collaboration is taking place are those which are not controlled by the offshore industry, e.g. health and safety principles, airports and harbours (where they may be degree of competition for facilities and space), ships and engineering design, which are both driven by the market.
In discussions with both industries, many people believe this is an opportunity slipping away and it requires strong multinational leadership from both industries to prevent offshore wind and offshore oil and gas becoming two separate industries with little or no collaboration or sharing of resources, except where the market or regulators forces this to happen.

Overcoming Challenges for the Offshore Wind Industry and Learning from the Oil and Gas Industry Page 84 of 245
Opportunity Traffic light Comment
Common work force Some exchange happening
Training to a common basic standard, Renewables UK setting own standards
Recognized by both industries. Not resolved
Training and competence Common principles – different training
Sharing basic training and competence Renewables UK setting own standards
Simplify record keeping in offshore passport systems
Renewables UK rejecting an offshore passport system
Common safe systems of work Set by HSE
Common set of principles Set by HSE
Basic Safety Induction and Emergency Training (BOSIET),
Renewables UK setting own standards
Permit to work system Not resolved
Software to implement an Integrated Safe System of Work (ISSOW)
Not resolved
Common supply chain and logistics
Same fleet of ships Market driven
Helicopter services (UK Flight share) Not resolved
Airports Market driven
Harbours Market driven
Sharing warehousing and other shore side facilities
Not resolved
LOGIC102 initiative Not resolved
First Point Assessment Not resolved
Standards contracts Not resolved
Construction and maintenance vessels Market driven
Offshore installation vessels, Some use of O&G vessels in OW
ROV and dive systems, Market driven
Pipe/cable lay Market driven
Trenching and burying Market driven
Maintenance vessels Market not yet formed
Common standards Offshore wind not yet engaged in
Use existing standards wherever Standards process
Common design standards Market driven
Design codes Market driven
Best practice Market driven
Software packages, Market driven
University courses Market driven
Design procedures Market driven
Industry Mutual Hold Harmless Scheme Not resolved
Table 8 Opportunities for Cross Industry Collaboration

Overcoming Challenges for the Offshore Wind Industry and Learning from the Oil and Gas Industry Page 85 of 245
Standardisation An almost universal comment from discussions with the offshore oil and gas industry was the need to establish a range of standards in the offshore wind industry and a plea not to reinvent standards that already exist in other industries. It is clear that the lack of standards and confusion over different overlapping standards has had a significant detrimental effect on the offshore oil and gas industry, further the offshore oil and gas industry is still working to get a clear set of standards in place. One of the principle causes of confusion is the difference in measurement systems between the USA and most of the rest of the world. The USA still uses imperial units, feet, yards, miles, pounds, tons etc. Most of the rest of the world uses the metric (mks) system of meters, kilograms and seconds. This is further complicated by the difference between some of the units used in the USA and the original UK definitions, e.g. a UK mile and a UK ton are different from a USA mile and a USA ton.
Because USA based companies are very active in the offshore oil and gas industry many specifications are written in imperial units and the standards referred to are American Petroleum Institute standards (API). However there is an almost equivalent set of International Standards Organisations (ISO) metric standards.
Most new oil and gas developments in the North Sea are specified in metric units, however items made by the principle manufacturers of wellhead equipment still use a mixture of units and standards. For example, examination of the available specification sheets and brochures for four subsea equipment manufacturers, Table 9 Units and Standards, indicates that imperial units still dominate some designs, and some specifications contain a mixture of imperial and metric units in an apparently inconsistent way.
Company Dimensions Primary units (Secondary units)
Standards
Aker Subsea AS103 Dominantly Imperial but metric mixed in on some specifications
API and ISO
Arqus Subsea104 Imperial (metric) API and ISO
Cameron105 Imperial (metric) API and ISO
FMC Kongsberg106 Dominantly Imperial but metric mixed in on some specifications
API and ISO
Table 9 Units and Standards
Work is ongoing to harmonise the different standards, with API often adopting an ISO standard.
Figure 17 ISO Standards for the Oil & Gas Industry, illustrates the point that there is already a large set of standards which are applicable to the oil and gas industry, many of these will not be applicable to the offshore wind industry, but some could be readily used by the offshore wind industry and need to be identified.
Learning from the mistakes made by the offshore oil and gas industry and adopting an existing set of standards and extending them to cover items of equipment or services in the early stages of the offshore wind industry, will probably make significant long term savings for the offshore wind industry.

Overcoming Challenges for the Offshore Wind Industry and Learning from the Oil and Gas Industry Page 86 of 245
Figure 17 ISO Standards for the Oil & Gas Industry107

Overcoming Challenges for the Offshore Wind Industry and Learning from the Oil and Gas Industry Page 87 of 245
An analysis of the ISO database108 of standards indicates that there are approximately 198 standards directly associated with the oil and gas industry and just three directly related to the offshore wind industry, two of these address gearbox design and the third, lubrication for gearboxes. Of the 198 offshore oil and gas standards, approximately 102 could be relevant (from a simple inspection of the standards title) to the offshore wind industry. The list of standards is presented in, APPENDIX 3 – ISO STANDARDS FOR OIL AND GAS along with a first assessment as to whether they are likely to be of use to the offshore wind industry.
These numbers indicate that the offshore wind industry has not taken the establishment of standards as a critical part of the industry’s development; this probably reflects the status of standards in the early days of the offshore oil and gas industry, but it also indicates that insufficient attention is being paid to the advice being given by the oil and gas industry.
A specific example of one area in the offshore wind industry where the lack of an adequate standard is already causing confusion is guidance on site investigation for offshore wind farms.
There are no recognised guidelines on survey practice for wind farms similar to those outlined for oil and gas by UKOOA. The Society of Underwater Technology (SUT) 2005 guidance notes on “Site Investigation for Offshore Renewable Energy Projects” not yet ratified109.
This has caused confusion when specifying the survey requirements, both bathymetric and geotechnical, for offshore wind farms. The results of the offshore survey influence the positioning of turbines within the array, the type of foundation required and the requirements for cable installation and scour protection for both the foundation and the cables. Inadequate survey information can lead to expensive re-design during installation if, for example it proves impossible to drive pile to the design depth or additional sour protection has to be installed.
Ensuring the Most Appropriate Technology is Employed Because the offshore wind industry is relatively new and the technology being deployed in offshore wind farms is still evolving, the industry lacks the embedded experience which is inherent in more established industries. This lack of experience, in essence a common view held by industry professionals (engineers, managers, financiers etc.) on what works well and how to design for the offshore environment, gives rise too uncertainly and risk. These problems are exaggerated by the ultra conservative nature of the financial industry, which is looking for low risk, tried and tested solutions, in an industry which is not mature enough to know if it has any low risk solutions.
In contrast, the offshore oil and gas industry has 40 or more years of experience to call on, which is shared by all sectors of the industry. This does not mean that the offshore oil and gas industry is risk free, but the risks are understood and are concentrated in the areas of reservoir performance and the ever present weather risk. There is an inherent risk in new technology, but the industry mitigates this by evolving slowly and testing rigorously.
The lack of experience and the rapid rate of expansion, driven by the EU 2020 renewable energy targets, carry an inherent risk that inappropriate technology will be deployed on a large scale, simply because there has been no time to extensively field test technologies that are “mass produced”. In some ways this has already happened in the early offshore wind farms, where there have been multiple high profile failures in gearboxes, generators and transformers (as discussed in Section 0). More recent events110, where failures in the grout used to connect the transition piece to the monopile foundation have been reported in WindPower Monthly111, are symptomatic of an industry

Overcoming Challenges for the Offshore Wind Industry and Learning from the Oil and Gas Industry Page 88 of 245
which lacks experience. There simply hasn’t been enough long term testing and research to establish the correct procedure for making a successful grouted connection, which can be expected to withstand the oscillatory loads imposed on it over a 25 year operational life. The Windpower Monthly article also speculates that both the secretive nature of the offshore wind industry and the conservative way in which the industry is funded both contribute to the failure.
As noted elsewhere in this report it is very important to ensure that new turbines designed for use offshore are tested in the marine environment. It is equally important to establish a protocol which will help determine whether a turbine has “passed” an offshore test and is qualified for use offshore. Establishing the criteria for qualification is not a simple task because there are several elements which must be addressed and agreed between the certification agencies, turbine manufacturers, utility companies, developers, financiers and insurance companies. To be comprehensive, the protocol should include:
• The suitability of the test site, i.e. a comparison between the environment at the test site and the environment at the target wind farm.
• The length of time a qualification test should take.
• The criteria for failure.
• The conditions around repair and maintenance and how that affects the criteria for failure.
• How design defects and manufacturing defects in the test machine are considered when evaluating performance.
• The level of modification allowed between the test machine and production machines before retesting would be required.
• The level of public domain information released on the results of the testing process.
Although agreeing a protocol for offshore testing would undoubtedly be a test of diplomatic skill, the long term benefits would be significant and remove many of the objections to introducing new technology.
Other industries have developed solutions to the problem of rapidly developing technology combined with long operational life. For example, the aircraft industry is continuously developing new and better engines for the civil airliner fleet; however, an airliner may have a service life of 30 years or more, so there is a problem in understanding long term failure modes after the engines have gone into production and are flying commercially. The standard solution to this problem is to continue to test early examples of a particular engine type in a controlled environment under the guidance of a certifying authority. The basic aim is to have a test engine with eighteen months to two years more test flying hours than any engine in service. This approach helps to ensure that any long term problems are discovered, before they occur in an aircraft in service. It also ensures that there is sufficient time to develop and test a modification to fix the problem, before it is required by aircraft in service.
These techniques allow for a proactive long term study of failure modes but require extensive test facilities. The analogue in offshore wind would be instrumented test sites, designed and with planning permission to allow prototypes or early production machines to be tested over many years. The EU has recognized this requirement and it is built into the offshore wind R&D roadmap112 , which states the requirement for 5 to 10 European test sites, with €40 million already allocated to a test site in Aberdeen.

Overcoming Challenges for the Offshore Wind Industry and Learning from the Oil and Gas Industry Page 89 of 245
Other industries also share much more technical information on failures, particularly when there is a safety aspect to the failure mode. The mature debate on sharing information on failures, between companies which normally compete fiercely for contracts, concluded that a series of high profile failures does more to harm to the industry as a whole, reducing confidence and ultimate market size, than the harm done to a particular company when it shares safety information113 114 115.
To appreciate the wider benefits of standards, there are two outstanding examples which have literally changed the way in which the industrialized world operates; the IBM PC standard and the twist and lock standard for shipping containers. The release of the original IBM PC standard was probably an unwitting error on behalf of IBM. When the PC XT was released, IBM released a maintenance manual, which contained all the information you needed to maintain and repair a PC XT, this included circuit diagrams, component listings, software listings etc. All the information IBM would expect to make available to maintain one of the mainframe machines. However, this allowed virtually any skilled electronics engineer to build a “clone” and as they say the rest is history. The original twist and lock method of stacking road transportable containers on top of each other for transport by sea, was developed and patented in the USA by Malcolm McLean, this proved to be a very successful method and Malcolm McLean was persuaded to give the patent to the industry. The ability to transport goods from door to door in a standard secure container, combined with the ability to mechanise the loading and unloading process, revolutionized world trade making transport by sea faster and cheaper. It is worth noting that both these standards started as proprietary standards, but only became of global commercial significance when they became freely available.
Foundation The design and construction of foundations is generally well understood, there is a significant body of experience in offshore and civil engineering. The principle concern is the rate at which foundations will have to be manufactured to meet the EU 2020 targets.
There are three basic types of foundation, gravity base, monopiles, and structures (jacket, tripod, lattice, etc). The offshore wind industry currently favors;
• gravity base structures for shallow water, especially if there a potential problem with ice,
• monopiles for relatively shallow water (20m to 25m maximum water depth) and turbines up to approximately 3.5MW,
• structures for larger turbines (currently up to 5 to 6MW) in deeper water (approximately 45m).
There are technical limits and practical limitations on the maximum size, in terms of water depth and turbine size of each of the technologies:
Gravity base foundations
Gravity base foundations are normally built from reinforced concrete, although steel structures filled with ballast, after installation, have also been used. There is no practical maximum size limit to a gravity base foundation, very large concrete structures have been built and installed for the offshore oil and gas industry, for example the Ninian Central gravity base structure, built at Kishorn on the west coast of Scotland is the largest manmade object ever moved and weighed 600,000 tonnes.
The Middelgrunden116 offshore wind farm project installed in 2000, used gravity base structures weighing approximately 1,800 tonnes each and a purpose built crane barge to install the foundations

Overcoming Challenges for the Offshore Wind Industry and Learning from the Oil and Gas Industry Page 90 of 245
in 4m to 8m of water. The barge used the buoyancy of the semi-submerged foundation to reduce the load on the crane.
Figure 18 Installing Middelgrunden Foundations117
The limiting factor for gravity base foundation is the size of the structures required to withstand the overturning moment which increases as the water depth and turbine size increase. This is compounded by the size of installation aid required and the speed with which the foundations can be built. Gravity base structures get too expensive and difficult to install as the water depth and turbine size increase. It is likely that these limitations will restrict the use of concrete gravity foundations to relatively shallow water, and because their mass makes them very robust, they are likely to find application in areas where moving ice is likely to be encountered.
Gravity base structures do not affect the dynamic performance of the turbine, because they provide a massive rigid foundation very similar to that found on a conventional onshore turbine and this simplifies the adaptation of turbines to the offshore environment.
Monopiles
Monopiles are currently the dominant foundation for offshore wind farms, they provide a relatively simple method of installation and for turbines less than approximately 3.5MW and water depth of less than 20m to 25m they are an economic and effective foundation. As water depth and turbine sizes increase it becomes much more expensive to build and install a pile which is sufficiently long and strong to withstand the overturning moment. For example, a 5MW turbine in 15m to 20m of water will require a pile which is 5m in diameter, with a wall thickness of 100mm and a length of approximately 60m or more. A pile of this size would weigh approximately 750 tonne and would contain approximately 440m of weld118, making it very difficult to manufacture. Additionally it would require a very large pile hammer to install it.

Overcoming Challenges for the Offshore Wind Industry and Learning from the Oil and Gas Industry Page 91 of 245
Manufacturing difficulties for piles of this size occur because of inherent limitations in the steel industry, which makes heavy gauge steel plates from slabs which weigh between 10 and 30 tonnes. The slabs are then rolled into sheet steel, the width of which is limited by the sheet rolling mill, typically between 2m to 3.5m119 wide and 6m to 18m long. These steel plates are then rolled into cylinders (or rings) and long seam welded to make a section of the pile.
As the diameter of the pile increases it becomes more difficult to get a steel plate which is long enough and thick enough to form a section of a pile, without first welding two plates together (the circumference of a 5m piles requires a plate approximately 16m long). A further complication is welding steel plate which is 100mm or more thick. This requires complex weld procedures, which include machining a weld profile, and preheating the steel and completing the root weld and subsequent welds without letting the steel cool down. These procedures are required to
prevent the generation of brittle steel micro structures in the weld metal and in the heat affected zone around the weld, which would reduce the fatigue life of the pile. They also add significantly to the cost and time required to build a pile.
It is not practical to transport significant numbers of complete piles 60m long and 750tonnes in weight by road, so the sections of the piles would have to be welded together close to a deep water quay.
Despite their size and weight, monopiles are quite flexible and dynamic structures with natural resonant frequencies capable of coupling with the natural frequencies generated by the turbine. The wind farm designer must model the combination of turbine, tower, transition piece, monopile and include the support from the seabed strata supporting the monopole structure, to calculate the resonant frequencies of the complete turbine assembly to understand at what frequencies natural resonances occur. Figure 20 illustrates one method of calculating the pile-soil interaction using a spring friction model. This data is then compared to the spectrum of frequencies that the wind turbine can generate and the SCADA control system is optimized to avoid resonant frequencies.
Steel Foundary
•Slabs•10 to 30 tonne in weight
Plate rolling
•2m to 3.5m wide•6m to 18m long•100mm or more thick
Pipe rolling
•5m diameter - 16m circumference
•additional long seem welds
Welding 100mm thick plate
•weld profile machining •pre-heating•root and hot passes•thermal management
Figure 19 Pile manufacturing

Overcoming Challenges for the Offshore Wind Industry and Learning from the Oil and Gas Industry Page 92 of 245
Figure 20 Model of Pile-soil Interaction120
Structures
Steel structures are currently being deployed as foundations for turbines rated at 5MW or more in the deeper water offshore wind farms. Two basic types have been deployed to date, the OWEC slender jacket structure built by Burntisland Fabrications and a tripod solution built by Aker Solutions. Both types of structure have been installed on the Alpha Ventus project in approximately 30m of water. The OWEC towers carry Re Power 5M turbines and the tripods Multibrid M5000 turbines.

Overcoming Challenges for the Offshore Wind Industry and Learning from the Oil and Gas Industry Page 93 of 245
Figure 21 OWEC Tower for Alpha Ventus
Figure 22 Tripod Structure

Overcoming Challenges for the Offshore Wind Industry and Learning from the Oil and Gas Industry Page 94 of 245
Steel structures are more efficient load bearing structures than monopiles, they use a combination of triangulated structures to provide stiffness and a wider base which helps distribute the over-turning loads, which in turn allows multiple relatively slender piles, to be used to secure the foundation to the seabed. They use less steel than an equivalent monopile, but they are more labour intensive to construct.
The key to producing a design which is both light weight and economic is to optimize the tradeoffs between a series of apparently conflicting requirements:
• Overall weight traded against the use of stock steel sections, which may not be optimum in term of minimizing weight, but are a lot cheaper to buy.
• The use of steel castings for the nodal joints, which may be heavier, but can significantly reduce the amount of welding required. Are they more suitable for automated welding system than complex fabricated nodal joints and they can help speed-up production.
• Investing in jigging, tooling and automated processes, which are capital intensive and increase the overall overhead cost of the manufacturing process, but speed up production and reduce labour costs.
The OWEC design (and similar designs) has the potential to be mass produced at relatively low cost, because the tubular section of the lattice tower can be made from standard pipe sections and because of the symmetry of the design, prefabricated nodal joints can be used121.
The tripod designs are more difficult to mass produce, because they do not use standard steel sections, the wall thicknesses are greater, and so the welding procedures are more complicated and less likely to be amenable to automation. Further, the geometry of the joints between the tubular sections is complex, relatively difficult to manufacture and not easy to produce using automated techniques122.
It is likely that as wind farms move into deeper water and further offshore, jacket structures similar to the OWEC design will become the most common foundation. They are lighter and potentially much cheaper to build and install than tripods or gravity bases and it is currently impossible to build monopiles which are strong enough to carry the loads imposed by turbines with outputs of 5MW or more in deep water.
Structure Primary Steel Secondary steel Piles Total weight
Jacket 425 tonne 85 tonne 315 tonne 825 tonne
Tripod 840 tonne 85 tonne 370 tonne 1295 tonnes
Table 10 Comparative Weights for Alpha Ventus Wind Farm
Slender jacket structures and to a lesser extent tripods are relatively flexible dynamic structures with natural resonant frequencies within the range produced by the wind turbine. Figure 23 illustrates the exaggerated effect of first and second order bending and torsion. Wind farm designers have to model the combination of foundation, tower, nacelle and blades to predict the resonate frequencies of the combined structure and design the turbine control system to avoid operating at those frequencies.

Overcoming Challenges for the Offshore Wind Industry and Learning from the Oil and Gas Industry Page 95 of 245
Figure 23 Modes of Resonance for Jacket Structures (courtesy of RePower)
The key to producing low cost foundations is to choose a design which uses the existing capabilities of the steel industry, preferably using steel sections which are already mass produced. If a design relies on the steel industry introducing new capital equipment or producing products which are near or at the upper end of its capability in terms of mass and linear dimensions, then it is very unlikely that the steel products can be produced in sufficient volume or sufficiently quickly to meet the 2020 renewable energy targets.
To produce foundations of whatever type, quickly enough to meet the 2020 targets, will require a significant expansion of the fabrication yards. These yards require large areas of land close to deepwater quays. Because some of the processes involved in construction require dry and relatively clean conditions, e.g. welding and applying protective coatings, and there is also likely to be a requirement to fit extraction fans and air cleaning equipment to remove pollutants and solvents in line with EU environmental regulations, large fabrication sheds are required. The protected environment would enable foundations to be built without weather dependency.
There are relatively few suitable sites around the North Sea. Most of these are former sites for the production of oil and gas jackets structure. Because the planning and construction process for a new site may take many years to complete, it is imperative that the existing sites are brought back into production as soon as possible, to enable the 2020 targets to be met.
Towers The design of turbine towers has stabilized on tubular structures. However, the criteria which led to this convergence in design are routed in onshore turbines and not necessarily valid for offshore wind farms, especially farms which are not visible from the shore. There is a possibility that more efficient structures could be used, which would reduce the capital cost of offshore wind turbines.
Turbine towers are traditionally built from tubular sections; however tubular sections are not very efficient structures in terms of their strength, stiffness and weight123. Tubular sections are used in onshore and near shore turbines because they are more aesthetically pleasing than lattice structures and they protect equipment installed within the tower. Tubular towers have also been used for

Overcoming Challenges for the Offshore Wind Industry and Learning from the Oil and Gas Industry Page 96 of 245
environmental reasons, for example to prevent birds (notably raptors) from nesting in the lattice structures and then being hit by rotating blades.
From a purely structural engineering perspective a lattice structure which extends from the seabed to the nacelle without a discontinuity is the most efficient structure124. The structure would look like a conventional high voltage pylon used in transmission lines. Figure 24 Lattice Tower, illustrates the concept. A structure of this type has no discontinuities typical of other designs e.g. transition pieces; this allows the structure to flex uniformly and avoids areas of high stress which would cause fatigue problems. Unfortunately, this idealized design is currently not considered to be practical, however a variation of the design which splits the lattice structure at say 10m above sea level may well be practical and would reduce cost and weight in a similar way to the way in which jacket structures reduce the cost and weight compared to other forms of foundation. Figure 25 illustrates a typical onshore lattice tower.
An alternative tower structure which has been proposed is a double walled tube made from relatively thin steel, the annulus being filled with ridge foam. This is taking an idea which is commonly used in the manufacture of yachts, performance cars and gliders and applying it to turbine towers125. The advantages are reduction in weight and improved rigidity; however, the structures become less robust and are susceptible to impact damage, particularly during construction. Figure 26 Composite Core Towers, illustrates the concept. Composite core towers may provide a useful reduction in the weight of the tower, but the concept would require a substantial R&D program to develop efficient production methods and extended field trials to convince financiers that the development was bankable.
Figure 25 Lattice Tower Figure 24 Onshore Lattice Tower

Overcoming Challenges for the Offshore Wind Industry and Learning from the Oil and Gas Industry Page 97 of 245
Figure 26 Composite Core Towers126
In the foreseeable future it is likely that conventional tubular turbine towers will be the most popular system installed in offshore wind turbines. However lattice towers are likely to be able to provide substantial savings in weight and cost, but will require a substantial development and testing program before they become an acceptable alternative to conventional tubular towers.
Conventional tubular towers are already in mass production for onshore wind farms, so the steel and fabrication industries are already investing in the plant and equipment required to build them, and although larger turbines in deeper water require towers with greater diameters and wall thickness, these increases in size are still within the capability of current steel industry capacity.
The dynamics and natural resonant frequencies of tubular towers are well understood, so wind turbine control systems are already designed to avoid these frequencies. However, tubular towers require a transition piece to form the joint between the tower and the foundation. The transition piece forms a discontinuity in the structure which leads to increased stress and associated fatigue problems. This makes the transition piece more difficult to engineer and construct, adding significantly to the cost of the offshore wind turbine.

Overcoming Challenges for the Offshore Wind Industry and Learning from the Oil and Gas Industry Page 98 of 245
Generators There is a general concern that some generator designs are derived from a basis of design which is not relevant to offshore wind turbines. These designs persist because manufacturers have invested in refining the designs and because both the manufacturers and the financial institutions have confidence in the design and the associated track record. However, generator designs for offshore wind turbines are still developing, with new design concepts under development which aim to improve reliability, reduce weight and improve efficiency.
Early wind turbines used fixed speed generators which were synchronized with the national grid. These generators required gear boxes to increase the rotational speed of the shaft to typically 1500rpm to synchronize with a 50Hz grid or 1800rpm for a 60Hz grid. Tightly controlling the speed of the blades could induce large loads in the gearbox, because if the wind increased in strength, the output of the generator had to increase to absorb more torque from the rotor, thus keeping the rotor speed constant, which would increase the load in the gearbox. The reverse was also true, if the wind dropped suddenly, the generator output had to be reduced, to keep the rpm of the blade constant. This could reverse the loads in the gearbox causing additional wear. If a grid fault occurred, the turbine was disconnected and shut down.
Subsequent generations of wind turbines used variable speed rotors and doubly-fed induction generators (DFIG), which allow the rpm of the blades to vary from approximately 30% above synchronous speed to 30% below synchronous speed. The frequency of the output of the generators is kept synchronized to the grid by energizing the rotor with a variable frequency and voltage using a 4 quadrant converter and filter, if the turbine blades are rotating at 30% more than synchronous speed, the frequency feed to the rotor will be 30% less than synchronous speed (i.e. a slip of -0.3).
This works well for stable grid conditions but under grid fault conditions it can lead to the generator control system becoming unstable with very high rotor voltages and currents, which may destroy the 4 quadrant converter127. The initial solution to this problem was to disconnect the wind turbine from the grid if a grid fault occurred. However, as wind penetration increased and started to become a significant contributor to a country’s power supply, grid operators introduced grid ride through codes. These codes are designed to ensure that generating capacity stays on line for a short period of time during fault conditions. The overall strategy is based on the premise that a grid fault is normally a transient event, it could be caused by a major power station “tripping” i.e. no longer supplying power to the grid, or it could be a failure in the transmission system, e.g. a transformer failing or damage to a transmission line. The grid will normally recover from the fault by isolating the fault, bringing online spinning reserve and/or by re-directing power through stand-by circuits. These corrective actions normally take a second or two to enable. It is therefore very important that the remaining generating capacity stays online, if all the generators disconnect because they have experienced a grid fault, a full black out of the grid would occur.
When grid fault happens the demand (or load) exceeds the supply, the generators that remain online see what looks like a “short circuit”, the voltage goes down and the current goes up. A typical grid fault may look like Figure 27, where the voltage drops to zero for 140msec and then slowly recovers over approximately 1 second to 80% of the nominal grid voltage.

Overcoming Challenges for the Offshore Wind Industry and Learning from the Oil and Gas Industry Page 99 of 245
Figure 27 Typical Grid Fault128
It is very difficult for a DFIG generator to cope with the requirement to stay online (ride through) during a grid fault, and it has taken the major wind turbine manufacturers significant effort to make DFIG generators capable of riding through grid faults in compliance with grid ride through codes. However, the problem now appears to be solved, there are literally hundreds of academic papers on the subject, and doubly fed induction generators are used in the majority of commercial wind turbines installed to date.
An alternative generator technology uses permanent magnets in the rotor (as opposed to electro magnets in an induction machine). This is a return to the earliest form of generator which used permanent magnets to generate electrical power, but these were quickly out classed by induction machines as the world adopted AC power systems. Permanent magnet machines have become more efficient in recent years following the discovery and development of rare earth magnetic materials, which are capable of providing very strong permanent magnetic fields. Permanent magnet generators also have the advantage of not requiring slip rings, which require regular maintenance, and are used to energise the rotor in induction machines.
Magnet Br (T) Hci (kA/m) (BH)max (kJ/m3)
Tc (°C)
Nd2Fe14B (sintered) 1.0–1.4 750–2000 200–440 310–400
Nd2Fe14B (bonded) 0.6–0.7 600–1200 60–100 310–400
SmCo5 (sintered) 0.8–1.1 600–2000 120–200 720
Sm(Co,Fe,Cu,Zr)7 (sintered)
0.9–1.15 450–1300 150–240 800
Alnico (sintered) 0.6–1.4 275 10–88 700–860
Sr-ferrite (sintered) 0.2–0.4 100–300 10–40 450
Table 11 Magnetic Properties of Rare Earth Magnets129
Where:
Br = Remanence, which measures the strength of the magnetic field

Overcoming Challenges for the Offshore Wind Industry and Learning from the Oil and Gas Industry Page 100 of 245
Hci = Coercivity, the material's resistance to becoming demagnetized
BHmax = Energy product, the density of magnetic energy
Tc = Curie temperature, the temperature at which the material loses its magnetism
Table 11 Magnetic Properties of Rare Earth Magnets, illustrates the very high magnetic fields which can be obtained from rare earth magnets. These very high permanent magnetic fields allow very high efficiency generators to be built. However, very high magnetic fields lead to very high forces and this has two effects:
• Any item made of magnetic material, e.g. a spanner or screw driver, will be attracted to the permanent magnet with a very high force if it gets too close to the magnet. The force is such that it can cause serious injury or damage. So there are significant safety issues when working close to the permanent magnets, either during construction or maintenance and effective procedures for working on permanent magnet generators have to be devised and implemented.
• The static magnetic fields between the magnets in the rotor and the iron cores of the stator are high and if the design is not optimized, the supporting framework which transfers the load can lead to very heavy generators, although there are some elegant designs which solve this problem under development130 131.
Permanent magnet generators are often used as direct drive, i.e. no gearbox as manufactured, for example, by North Wind, or with a single stage gearbox as manufactured by Clipper Wind and Areva. These types effectively generate DC power, and require full power converters to convert to 3 phase AC synchronized to the grid. The full power converters are designed to cope with grid faults and provide grid ride through capability, but they add an additional level of complication and cost to the power management system.
In addition to rare earth magnets, there is the possibility of using high temperature super conductors for the generator stators. High temperature super conductors have the potential to reduce the size and weight of the generator by 50% or more. Practical high temperature super conducting motors have already been demonstrated in power ratings up to 35MW, and 10MW generators are considered to be practical by 2015.132
For large wind farms situated in the middle of the North Sea, it is likely that power will be exported using high a voltage DC link to reduce the losses in the subsea transmission lines. The use of a DC link has several potential impacts on the design of generators. The generators no longer have to be grid compliant, i.e. synchronized to the grid and have grid fault ride through capability, this function is provided by the DC to AC converter positioned onshore and connected to the grid. This removes any grid restrictions from the wind farm and may allow for some innovative within-farm power collection systems133. However, it not possible to easily increase the voltage of a DC power source, and this is essential to reduce transmission line losses, which in turn, means that the output of the wind turbine generators has to be converted to AC so transformers can be used to increase the voltage, before the power is rectified to DC for transmission.
Wind turbine generators have developed from synchronous machines, where the speed of the blades is synchronized to the grid frequency, to doubly fed induction generators, which allow the speed of

Overcoming Challenges for the Offshore Wind Industry and Learning from the Oil and Gas Industry Page 101 of 245
the blade to vary, to permanent magnet generators using rare earth magnets. There is still significant scope for improving the design of generators, to make them lighter and more robust.
Gearboxes and Bearings The principle concern associated with bearings and gearboxes is the large number of premature failures experienced in offshore turbines. This indicates that either the designers have not assessed the environmental loads correctly, or there has been some failure in the detail of the design or a manufacturing problem. Widespread failure in gearboxes and bearings significantly increased the cost of maintenance and destroys confidence in the viability of offshore turbines. There is also a concern that the supply chain required to produce the large steel components will not be able to meet demand and that a large capital investment will be required to increase the rate at which these components can be manufactured, especially if turbine size increases much beyond 5-8MW.
Not all wind turbines require gearboxes, some manufacturers design and build direct drive systems using permanent magnets, as discussed in the previous section. Other manufacturers use single stage gear boxes or two stage gear boxes to increase the rotational speed of the input shaft that feeds the generator. The principle advantage of using a gearbox lies in the physics of the generation process, cutting the magnetic flux faster generates more electrical power. So a high speed generator can be a lot smaller than the equivalent low speed generator. The disadvantage is that a gearbox adds weight and complexity to the wind turbine and experience with early offshore wind turbines, as reported in section 0, indicates that gearboxes have been a significant source of early failure. The reported failures have occurred in turbines which have been used successfully in onshore wind farms, so the question of what is different between the onshore and offshore wind resource has arisen. The offshore wind resource is generally less turbulent than onshore, which gives a better wind resource and a higher capacity factor. However, the lower turbulence implies a more regular structured vertical boundary layer, which is significantly different from onshore wind farms where the boundary layer is broken down by the terrain.
A typical structure is a “gust of wind”, a local increase in wind speed which often has a shallow “U” shape when seen from above. The lack of obstacles which generate turbulence allows a relatively well structured gust of wind to form, which may be several hundred meters wide. Gusts of wind on the water will be familiar to anyone who spends time on the water, particularly if they have sailed or raced sailing dinghies.
Figure 28 Sketch of Wind Direction in a Gust

Overcoming Challenges for the Offshore Wind Industry and Learning from the Oil and Gas Industry Page 102 of 245
Gusts of wind are stochastic in position as they move across the sea and it is likely that periodically a gust will catch one side of a blade and then a subsequent gust will hit the other side of the blade. The asymmetric increases in wind speed associated with the gust will cause a slow oscillating torque in the main shaft of the turbine, horizontal and at right-angles to the principle axis of the shaft. These off-axis torques have the potential to bend the main input shaft causing miss alignments in the bearings and gear boxes, which in turn can increase wear. They may also be a partial cause of the failure in the grouted connection between the monopile and the transition piece reported in 0.
It is possible to accommodate off-axis torque with the correct design, for example using “plumber blocks”, which allow for misalignment of the shaft, or tapered roller bearings which are designed to take out the end thrust, but are more tolerant of axial misalignment. Anecdotal evidence suggests that some of the earlier wind turbines had better designs134, with some smaller turbines working for twenty years with minimum maintenance and no gearbox failures. This is attributed to better design and a degree of over-design, which makes the gearboxes and bearings more robust.
As a caveat to the comments made above, the torques being carried by the input shaft of a 5MW wind turbine revolving at say 10rpm are very high. For comparison the Emma Maersk,135 the world’s largest container vessel is powered by a 82MW main engine (the biggest diesel engine ever built), but the propeller revolves at approximately 100rpm136 so the torque transmitted by the propeller shaft is only 64% more than the torque transmitted by a 5MW wind turbine and would be the same for an 8.2MW turbine.
Figure 29 Du-Sulzer 12 RT 2-Stroke Diesel Engine

Overcoming Challenges for the Offshore Wind Industry and Learning from the Oil and Gas Industry Page 103 of 245
This puts the required engineering at the “Heavy” end of the engineering spectrum, where the normal expectation is to deliver, perhaps 10’s of units per year. The offshore wind industry will need to install thousands of units per year to achieve the 2020 targets, and it remains to be seen if there is sufficient capacity to manufacture the heavier components required. Larger turbines, and there are plans for 7MW and 10MW machines, will require even heavier components which may be more difficult to source.
Blades The blade is the power generating part of the turbine and it is essential that it has the correct blade configuration, aerofoil shape and is controlled to have the optimum angle of attack. There is concern that the current generation of turbines being installed offshore has not been optimized for the offshore environment, they are at best marinised version of turbines designed for onshore wind farms using a set of constraints which are not relevant to offshore wind farms. There is a further concern that blade manufacturing technology has not yet developed to a point where the full viscoelastic properties of composite construction have been optimized to reduce weight and provide self-tuning capabilities in varying wind strengths.
The manufacturers’ literature suggests that there is lot of research137 being carried out into blade design and optimizing power output. There is a series of conflicting requirements in the optimization process:
• Varying wind speeds, which range from extracting the maximum power from low wind speed and making the “cut in speed” as low as possible, to maintaining control of the turbine at high wind speeds, especially when the wind is turbulent with strong gusts, by maximizing the “cut out” speed. The wind difference in wind speed (typically 4 to 25 msec-1) would ideally require different aerofoil sections, but because the foil is solid, only one section is possible.
• The blade should be as light as possible to minimize the rotational inertia, but must be stiff to avoid excessive flexing, which might cause the blade to collide with the tower.
• Controlled blade flex, in the form of a controlled twist in the blade as the wind speed increases, allows the angle attack of the foil to change automatically, which can aid control and “soften” the effect of gusts (rapid changes in wind speed, but this can conflict with the requirement to keep the blade stiff to prevent collision with the tower).
• The rotational speed of the blade should be optimized for power production, but high tip speed generates more noise (noise increases as the fourth power of tip speed)
• The blade must be stronger at the root to withstand the bending loads, which compromises the aerofoil shape.
Blade construction techniques have progressed from laminated wood blades using standard aerofoil sections, through wood and glass fibre composite blades to all composite structures using epoxy resins and mixtures of glass and carbon fibre. Most blades are constructed in two halves and then glued together; the glued joint is a weak point in the structure, since the reinforcing fibres are discontinuous at the join.
Siemens have a patented technology (IntegralBlade) 138which uses a single piece external mould and an inflated internal bladder, which consolidates the laminate prior to curing at relatively high temperatures (150 to 180 deg C). This method has the advantage of providing a continuous blade structure, which is stronger and lighter than a blade constructed in two sections and then glued together.

Overcoming Challenges for the Offshore Wind Industry and Learning from the Oil and Gas Industry Page 104 of 245
In other industries, different techniques are used for producing aerofoils or similar composite structures. For example, in the oil and gas industry filament winding machines are used to make continuous lengths of glass or carbon epoxy pipe. The glass (and/or carbon) fibre strands are wound onto a thin walled pipe after being coated with epoxy resin. The angles at which the fibres are laid down are optimized for flexibility to allow the pipe to be spooled on reels which are road transportable. The angles used are the subject of several patents. The tension applied to the strands ensures that the resulting composite is well consolidated with a high fibre to matrix ratio. The epoxy resin is cured by an oven at the end of the production line and current machines make diameters from 50mm to 150mm. The process is automatic with minimum labor costs and is capable of producing continuous lengths of up to ten kilometers.
Helicopter blades are made with a similar filament winding process, using a male aluminum former or mandrel. Two or more independently controlled winding heads traverse the former dispensing glass or carbon fibres which have been coated in epoxy resin. Multiple layers of composite can be laid down at angle, including longitudinal. When the lay-up is complete, the blade is vacuum bagged and the aluminum former is heated to cure the epoxy resin. Expansion and subsequent contraction of the aluminum former also allows the former to be removed when the blade has cooled down. Eurocopter also has a technology which uses piezoelectric actuators to control rotor flaps to reduce noise levels.
Sail boat masts are constructed using different techniques depending on the manufacturer. Small masts are normally filament wound, larger masts use hand lay-up of “pre-preg” carbon fibre (carbon fibre matting saturated with epoxy resin which is stored in refrigerators to delay the curing) using either an internal mandrel or two external female moulds. The moldings are then glued together. It is common practice to use an autoclave with pressure up to 6bar and temperatures up to 180 deg C. Masts in excess of 90m have been constructed to date.
Controlling and optimising blade geometry
Figure 30 90m Mast being Shipped

Overcoming Challenges for the Offshore Wind Industry and Learning from the Oil and Gas Industry Page 105 of 245
In comparison with other uses of aerofoil sections to generate lift of power, the wind industry only uses a limited set of controls, for pitch (or angle of attack) of the blade and the torque absorbed by the generator. Generator control is limited by the maximum rating of the generator, and is controlled by the excitation current in the rotor of an induction generator, or by the impedance of the converter in a permanent magnet generator. Aircraft use flaps on the trailing edge and slots on the leading edge to alter the aerofoil section for take-off and landing. Sail boats use a combination of varying the slot between the foresail and main sail, sail tension to alter the camber of the sail, mast bend to alter the position of the maximum camber and twist (angle of attack), and reefing to reduce the area in strong winds. Early wind mills used a combination of reefing and the natural twist of the main spar to control the speed of the mill.
There is probably scope for further improvement in the control of wind turbines to improve the power curve, reducing the cut-in wind speed, achieve rated power at lower wind speeds and increase the maximum wind speed at which power can be produced. The latter is particularly important because conventional control strategies will shut down a wind turbine when the wind exceeds the maximum rated speed (typically 25msec-1) for more than 20 seconds, the algorithm will then wait for a period, generally about 15 minutes, before trying to restart the machine, this to prevent repeated and rapid cycling between on and off in gusty conditions. However, the net result is a reduction in the energy yield from the site in conditions where maximum power output might be expected. Finding a way of continuing to produce power at high wind speeds is important in improving the reliability of power production from a grid operator point of view. Enercon139 have a system which effectively “idles” the turbine at a lower rotational speed in high winds, i.e. it keeps the blades spinning but not producing full power, and enables full power to be produced as soon as the wind drops below the maximum rated speed, this improves the quality of power generation by eliminating the waiting period referred to above.
There are several restrictions imposed on current offshore wind turbine blade design which have been inherited from previous generations of onshore wind turbines. The three bladed upwind design has been developed to be aesthetically “acceptable” and tip speeds have been limited to approximately 80 m sec-1 to keep noise levels down (blade tip noise increases as the 4th power of tip speed). Neither of these restrictions is valid for wind farms out of sight of land. The three bladed upwind design imposes limits on blade flexibility, the angle of the nacelle (typically 5deg noise up) and the degree to which the nacelle has to protrude upwind of the tower(typically 5 to 7m). All these restrictions are to prevent the blade from hitting the tower in high winds.

Overcoming Challenges for the Offshore Wind Industry and Learning from the Oil and Gas Industry Page 106 of 245
Using a downwind design eliminates these restrictions and would allow flexible blades to be used, which would be lighter and allow the viscoelastic properties of the composite to be used to automatically twist the blade and reduce power output as the wind increases. There would be no requirement for an upwind protrusion, which simplifies yaw control and the nacelle could be horizontal. It is worth noting that AREVA have qualified their M5000140 turbine for downwind operation for the SWAY floating wind turbine concept.
Changing the design to a two bladed rotor further reduces the weight of the rotor and makes installation simpler, although it does reduce the efficiency of the turbine slightly, but this can be compensated for by increasing the tip speed of the blade, which also reduces the torque the main shaft has to be designed for (assuming the same output power).
There is strong evidence to suggest, as noted above, that the current generation of offshore wind turbines which are being installed or planned to be installed, are not optimized for use offshore and that the technology used to construct blades can be further developed to reduce weight and cost and to provide optimum aerodynamic efficiency.
Cables There are two basic types of cable used in offshore wind turbines; inter-array cables and export cables. Both types of cable are commercially available and have substantial track records in both the
Figure 31 AREVA M5000 as a Downwind Turbine for the SWAY Floating Wind Turbine

Overcoming Challenges for the Offshore Wind Industry and Learning from the Oil and Gas Industry Page 107 of 245
offshore oil and gas industry and the electrical power transmission industry. The principle concerns are:
• optimizing the layout of turbines,
• how they are connected to the transformer platform,
• the time taken to install infield cables through J tube pull-ins,
• preparing the cables and connecting them to the power electronics in the turbines or on the transformer platform.
If turbines are connected in series, there are (in general) two J tube pull-ins and connections per turbine, which cannot be completed until both the turbine and the cables have been installed. Further, since the ends of the cables have to be protected from seawater ingress and mechanical damage during the pull-in process, very little can be done in the way of advance preparation to speed-up the connection process.
Inter-array cables are generally relatively short cables, typically 1km in length and they connect individual turbines. There is still uncertainty over whether the inter-array cables will be AC or DC, however they are likely to be rated to at least 33kV and connected to a group of turbines, either in series or in the form of a ring main. If 5MW turbines are used in series, the currents carried by individual conductors in a three phase cable can be very high, even if the inter-array voltage is 33kV. For example if single 5MW turbines are operating with a power factor of 1 the current in each conductor can be calculated using the formula below with the results tabulated in Table 12.
I = kW / ( √3 x pf x VLL ), in kA
Where;
kW = the output power of the turbine
pf =power factor
VLL= the line to line voltage
I=conductor current in kA
No of turbines kW kA Cu mm2
1 5,000 0.087
2 10,000 0.175
3 15,000 0.262 70
4 20,000 0.349 120
5 25,000 0.437 150
6 30,000 0.524 240
7 35,000 0.612 400
8 40,000 0.699 500
9 45,000 0.787 630
10 50,000 0.874 -
Table 12 Current in a Conductor in kA

Overcoming Challenges for the Offshore Wind Industry and Learning from the Oil and Gas Industry Page 108 of 245
Table 12 shows that if eight or more 5MW turbines are connected in series, the current in each phase or conductor in the final length of cable connecting the transformer platform has reached the maximum practical cable size. The largest cable in the NEXAN 36KV range has an 800mm2copper cross section, and is rated at 852 amps, which isn’t quite high enough to take 10, 5MW turbines in series, however, it has an outer diameter of 157mm and a weight of 48.9kg/m.
Figure 32 Nexan XLPE Insulated - Type: 2XS2YRAA Submarine Cable
Cables of this size are difficult to install, because they have a relatively large bend radius and they are heavy. This makes it more difficult to pull the cable through the “J” tube and more difficult to form the cables into the terminations. The very high currents make it very important to avoid any poor high resistance connections; these would get hot very quickly and have the potential to cause a fire. Doubling the infield voltage to 66KV would halve the current in the cable, however the cable would require better electrical insulation and the power electronics in both the turbine and transformer station would be more expensive because of the higher voltage rating, so although the cross section of copper required to carry the current is smaller, the overall dimensions and bend radius of the cable may not be that much smaller than the lower voltage option.
Export cables could be either AC or DC. AC cables are inherently limited in length by cables losses, these losses consist of the currents required to charging the inherent capacitance of a 3 core 3 phase cable. The charging current is given by141:
IC = 2πfCE
Where;
IC = charging current
f=frequency of the AC power
C-=capacitance of the cable
E = voltage

Overcoming Challenges for the Offshore Wind Industry and Learning from the Oil and Gas Industry Page 109 of 245
The useful power which can be transmitted by the cable is:
IP = IT - IC
Where;
IT = The rated current carrying capacity of the cable
IP = The current carried by the cable
The useful power which can be transferred by a subsea AC power cable is also limited by the possibility of the capacitance giving rise to high frequency harmonics currents and the dielectric and inductive element of the cable construction, e.g.:
• Dielectric losses which are generally small
• I2 R losses in the conductor, normally the dominant factor
• I2 R losses in the metallic shield and steel wire armor due to induced currents, these induced currents can be large, but depend on the geometry of the cable construction.
The point at which the loss in an AC cable becomes too high to be economically viable also depends on the ability of both the wind farm and the connection to the grid to provide reactive power and the comparative cost of an equivalent DC power transmission system, but is generally considered to be approximately 100km.
The three phases of an AC single link will be contained in one cable. It would be normal to lay two cables to provide redundancy, usually laid in two separate trenches, to minimize the chances of the same event damaging both cables. If more than one cable is required to carry the full output of a wind farm it would be possible to lay more than one cable in a trench, providing they are not so close together that thermal effects would adversely affect the current carrying capability of the system.
DC links are not subject to inductive and capacitive leakage currents, except for a brief period when the cable is powered up or down, or when the current carried by the cable varies quickly, i.e. transient conditions. However, a DC link has different sources of power loss, notably the AC to DC converter positioned offshore and the DC to AC converter located at the grid connection point. Losses in

Overcoming Challenges for the Offshore Wind Industry and Learning from the Oil and Gas Industry Page 110 of 245
conversion to and from DC are typically 1.4 to 1.6%142 for each converter station, in addition to the normal resistive losses (I2 R) associated with power transmission. DC systems have the advantage of isolating the offshore wind farm from the national grid. Grid ride through capability can be provided by the converter station connected to the grid. Further, the converter station can provide reactive power which will help stabilize the grid and this will allow relatively large amounts of offshore wind power to be connected to relatively weak parts of the national grid.
Other additional costs associated with a DC link are the capital cost of the DC to AC converter and the infrastructure required to house the converters143. Onshore there will be a requirement for a relatively large building. Figure 33 illustrates the typical size of the converter (80m x 25m) offshore, a dedicated platform will have to be built to house the converter.
A single circuit DC system would normally consist of two cables operating positive and negative with respect to earth potential, both cables can be installed in the same trench and installed as a pair, although separating the cables by approximately 1m reduces the capacitance between the cables. A dual circuit would consist of two pairs of cables laid in two separate trenches, to minimize the risk of both circuits being damaged by the same event.
In summary, cable connections, both within the field and export cables are well understood, the main areas of concern are the difficulty and cost of terminating heavy cables during the installation phase and the ability of the industry to supply the quantity of cable required to meet the 2020 renewable energy targets.
AC/DC Equipment Wind farms rely on a series of high power electronic equipment to control and condition the electrical energy as it flows from the generator on the turbine to the grid connection point. The basic functions which have to be performed by the power electronics are:
• switching, both routine and under fault conditions,
• converting from AC to DC and vice versa,
• frequency control and synchronization to the national grid,
• voltage control.
Most of this equipment has an extensive track record in onshore power systems, so the areas of concern are:
Figure 33 Land-based Converter 80m x 25m

Overcoming Challenges for the Offshore Wind Industry and Learning from the Oil and Gas Industry Page 111 of 245
• the way in which the equipment is protected from the marine environment,
• the use of high voltage DC transmission systems.
Protection from the marine environment, in particular from the effects of sea salt, which when wet is conductive, is very important. The conductivity can cause electrical faults by allowing power to flow in unintended directions, particularly to earth. The conductivity can also cause accelerated corrosion. Providing AC power systems are adequately protected they should not increase the risk of failure.
Offshore144 145it would be normal to use gas insulated switch gear for both AC and DC systems, this prevents contamination from a salt laden atmosphere.
DC power transmission is not new, but has not got the track record of AC power transmission systems. There is a fundamental difference between AC and DC power when considering power control. Both the voltage and current wave forms of an AC power flow pass through zero twice every cycle while a DC power flow does not. AC power is therefore easier to control, for example a control system can wait until the zero cross, before disconnecting a system, which reduces the problem of corona discharge (the air becoming ionized and continuing to provide a conducting path after the contact has opened). In a DC flow of power, the control system has to bring the system voltage down to zero before disconnecting a system. If the circuit is switched whilst the there is a high DC voltage present, a corona discharge is almost inevitable and it can be difficult to extinguish. Under normal operating conditions this is not a problem, switching sequences are carefully controlled by reducing the voltage prior to switching to prevent corona discharge, however in a fault condition corona discharges can cause a lot of damage.
Figure 34 Corona Ionization146
Corona discharge can also affect air insulated components, i.e. where terminals are separated from metallic objects which are earthed or carry the opposite potential. This reinforces the requirement referred to above, for offshore high voltage equipment to be housed in an environment which is protected from the salt laden marine environment. This is particularly important for high voltage DC equipment.

Overcoming Challenges for the Offshore Wind Industry and Learning from the Oil and Gas Industry Page 112 of 245
Because DC is equipment is more reliant on high voltage high power control systems, there is a concern that the semiconductors used in these devices are working near their fundamental operating limits. The most commonly used semiconductor is silicon, which has relatively narrow “band gap”, the
voltage across the semiconductor junction. The band gap effectively limits the maximum operational voltage of a device; if higher operational voltages are required several devices have to be stacked in series. Figure 35 and
Figure 36 illustrate press pack configuration, where multiple IGBT’s are assembled in one module to perform a specific function.
The use of large numbers of devices in a stack reduces the reliability of the module and the requirement for large heats sinks because silicon has a relatively low thermal conductivity, making the modules larger with a bigger heat exchangers.
Figure 36 Current Fed Integrated IGBT H Bridge Inverter147
Figure 35 Three Phase Press Pack IGBT Inverter
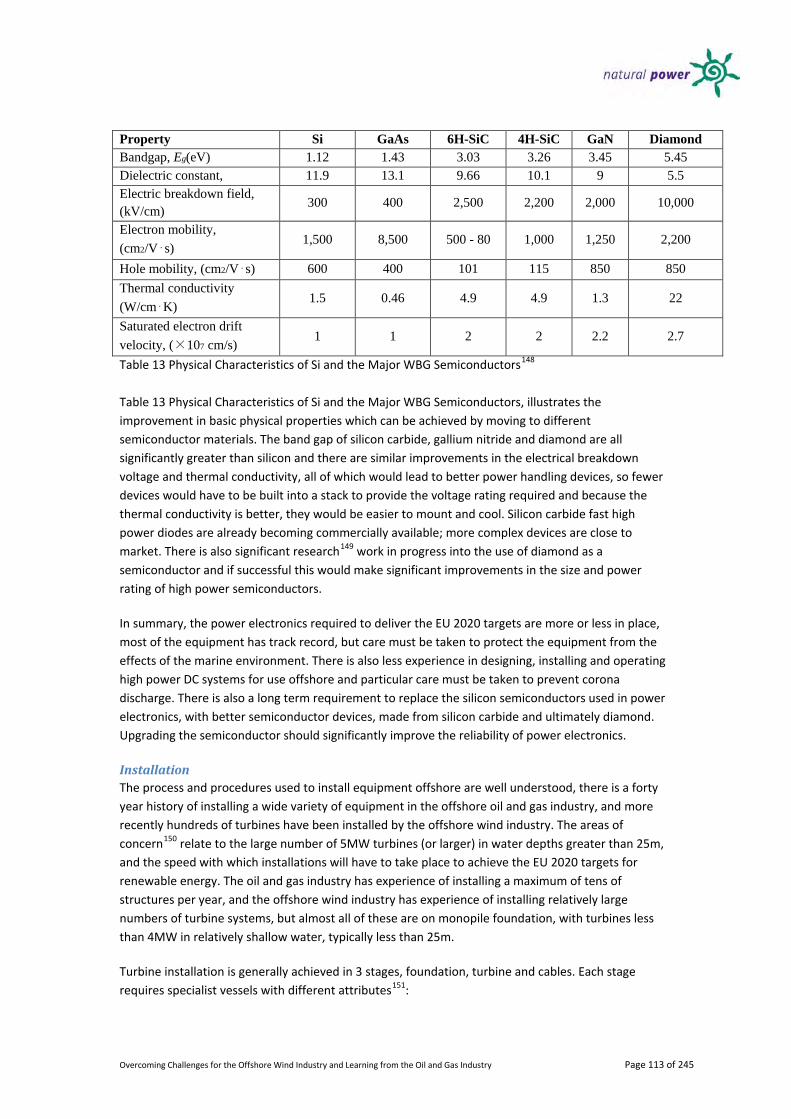
Overcoming Challenges for the Offshore Wind Industry and Learning from the Oil and Gas Industry Page 113 of 245
Property Si GaAs 6H-SiC 4H-SiC GaN Diamond Bandgap, Eg(eV) 1.12 1.43 3.03 3.26 3.45 5.45 Dielectric constant, 11.9 13.1 9.66 10.1 9 5.5 Electric breakdown field, (kV/cm) 300 400 2,500 2,200 2,000 10,000
Electron mobility, (cm2/V⋅s)
1,500 8,500 500 - 80 1,000 1,250 2,200
Hole mobility, (cm2/V⋅s) 600 400 101 115 850 850 Thermal conductivity (W/cm⋅K)
1.5 0.46 4.9 4.9 1.3 22
Saturated electron drift velocity, (×107 cm/s)
1 1 2 2 2.2 2.7
Table 13 Physical Characteristics of Si and the Major WBG Semiconductors148 Table 13 Physical Characteristics of Si and the Major WBG Semiconductors, illustrates the improvement in basic physical properties which can be achieved by moving to different semiconductor materials. The band gap of silicon carbide, gallium nitride and diamond are all significantly greater than silicon and there are similar improvements in the electrical breakdown voltage and thermal conductivity, all of which would lead to better power handling devices, so fewer devices would have to be built into a stack to provide the voltage rating required and because the thermal conductivity is better, they would be easier to mount and cool. Silicon carbide fast high power diodes are already becoming commercially available; more complex devices are close to market. There is also significant research149 work in progress into the use of diamond as a semiconductor and if successful this would make significant improvements in the size and power rating of high power semiconductors.
In summary, the power electronics required to deliver the EU 2020 targets are more or less in place, most of the equipment has track record, but care must be taken to protect the equipment from the effects of the marine environment. There is also less experience in designing, installing and operating high power DC systems for use offshore and particular care must be taken to prevent corona discharge. There is also a long term requirement to replace the silicon semiconductors used in power electronics, with better semiconductor devices, made from silicon carbide and ultimately diamond. Upgrading the semiconductor should significantly improve the reliability of power electronics.
Installation The process and procedures used to install equipment offshore are well understood, there is a forty year history of installing a wide variety of equipment in the offshore oil and gas industry, and more recently hundreds of turbines have been installed by the offshore wind industry. The areas of concern150 relate to the large number of 5MW turbines (or larger) in water depths greater than 25m, and the speed with which installations will have to take place to achieve the EU 2020 targets for renewable energy. The oil and gas industry has experience of installing a maximum of tens of structures per year, and the offshore wind industry has experience of installing relatively large numbers of turbine systems, but almost all of these are on monopile foundation, with turbines less than 4MW in relatively shallow water, typically less than 25m.
Turbine installation is generally achieved in 3 stages, foundation, turbine and cables. Each stage requires specialist vessels with different attributes151:

Overcoming Challenges for the Offshore Wind Industry and Learning from the Oil and Gas Industry Page 114 of 245
• The installation of foundations requires heavy lifting equipment and pile driving.
• The installation of turbines requires vessels capable of lifting say 500 tonnes to approximately 100m, it also requires the lifting equipment to be very stable because of the high precision required when mating turbine components.
• Cable installation requires vessels capable of transporting and laying the cable, and there is a requirement to pull the cable up a J tube for termination within the turbine tower.
There is also a requirement to transport the foundations and turbine components to the work site.
North Hoyle offshore wind farm
As an example of a typical shallow water wind farm, the North Hoyle construction sequence has been reviewed. North Hoyle is a UK round one wind farm in 6m to 12m of water approximately 6km to 10km from shore. The construction sequence152 was as follows:
Foundations:
Thirty tubular steel monopiles were floated to site and installed by the barge Excalibur. Piles were installed using a combined drive - drill - technique. The pile was initially driven through upper layers; a hole was then drilled into the underlying firmlayers and the pile finally driven into this hole.
The transition piece was installed and grouted in place using jack-up vessel the Wind.
J-tubes and turbine access ladders were installed by the barge Forth Guardsmen.
Erection of towers:
The towers were delivered by barge, lifted onto the transition pieces then bolted into place. The first 27 towers were installed by the MEB JB1 and Seacore Excalibur vessels, with the final three towers being installed by the Mayflower Resolution.
Installation of nacelles and blades:
Nacelles were delivered to site by barge and lifted into position by the construction jack-up vessels. Nacelles were bolted into place on top of the towers. Nacelles were installed on the towers in a “bunny-ears” configuration, with two blades attached. The third blade of each machine was bolted onto the hub of the nacelle after the nacelle was in position on top of the tower.
Power cable installation and connection:

Overcoming Challenges for the Offshore Wind Industry and Learning from the Oil and Gas Industry Page 115 of 245
Inter-array cables were installed by a new remotely operated system LBT1153. The cables were wound directly onto a drum on the LBT1 and were unrolled into a trench cut by the vessel on the seabed.
The export cables were installed by a plough, which was towed behind the vessel the Pontra Maris. The export cables were connected to land-based cables installed into buried ducts to the substation.
Installation issues:
Late delivery for the Mayflower Resolution had a significant impacted on the North Hoyle build programme, however major delays were avoided by procuring and adapting existing construction vessels MEB-JB1 and Seacore Excalibur.
Delays of varying degrees to nacelle installation were caused by ground conditions, weather conditions (preventing lifts) and also storm damage to one of the construction vessels. Some delays to blade installation were caused by high wind speeds preventing safe lifting.
The salient points which emerge from this round one wind farm are:
• It took 8 months to complete the installation of 30 2MW turbines.
• Late delivery of a new vessel caused delays, but the project management team were able to source alternative vessels and minimise the delay.
• A new remotely operated vehicle was used to trench and lay the infield cables, apparently very successfully.
• There seem to have been problems with “punch through” of the legs of the jack-up crane barge. Punch through occurs when the leg of a jack-up unexpectedly (and quickly) sinks further into the seabed, in effect the load imposed on the seabed exceeds the shear strength of the sediment. This can occur if the load is redistributed over the legs, during say a lifting operation. Punch through can be very dangerous if it occurs during a lifting operation which requires precise positioning of heavy components at height.
• High winds and stormy conditions caused delays and damage, even during a summer construction period in a relatively sheltered location.
Figure 37 LBT1 Cable Burial and Installation Machine

Overcoming Challenges for the Offshore Wind Industry and Learning from the Oil and Gas Industry Page 116 of 245
Thanet offshore wind farm The Thanet offshore wind farm has recently been completed, it consists of 100 3MW turbines and is located 12km offshore in 20m to 25m of water. Thanet has been under construction since 2008, with onshore construction starting in January 2008 and works offshore commencing in spring 2009. The first turbine was erected in December 2009, the last turbine was installed in June 2010154 and the work scope was completed in September 2010.
The jack-up vessel SeaJack installed the piles which were transported by barge to Ramsgate and then loaded two at a time onto the SeaJack. This implies a 24km round trip for the SeaJack for every two piles installed, the Sea Jack is not self propelled and requires two tugs to move the vessel. The transition pieces were installed by MPI Resolution and the SeaJack in a separate operation and grouted in place. MPI Resolution installed turbines at a rate of one every eighteen hours, excluding transit and loading time, the MPI Resolution carried nine Vestas V90-3 turbine assemblies (tower, nacelle and blades) in each load out. The installation of 100 turbines took 193 days, including weather delays, load out and transit times. The cables were installed by SubOcean155 using a combination of vessels and techniques, including a cable plough, which was used to install cables in a chalk seabed. SubOcean used a dynamically positioned vessel, the Polar Prince to pull the plough. The Polar Prince has a significantly better sea keeping ability than flat bottomed barges and was able to continue working when the other vessels had to take shelter. The dynamically positioned vessel, Norman Mermaid and the cable laying barge UR101 were also used to install cables. The heavy lift crane ship the Stanislav Yudin156 was used to install the transformer jacket structure and the transformer topside. The jack-up Excalibur157 was used to complete the installation of the transformer platform. In total around thirty-five different vessels were used to complete the project, this included personnel transport vessels and tugs. The salient points from the Thanet project aree:
• Constructed in 20m to 25m water depth, which allows DP vessel to operate effectively
• Offshore construction time for 100 turbines was eighteen months, for piles turbines, cables, transformer platform and commissioning.
• A cable plough was used for in-field cable burial, some of which was in a chalk seabed,
• A combination of vessels were used, some sourced from the offshore oil and gas industry,
• Complex contractual arrangements with approximately 60 different companies working on the project and 35 different vessels.
• Storms and high winds delayed installation, although the DP support vessels sourced from the North Sea oil and gas industry were less affected by adverse weather and did not have to seek shelter in port.
• Mr Ole Bigum Nielson from Vattenfall has noted that158:

Overcoming Challenges for the Offshore Wind Industry and Learning from the Oil and Gas Industry Page 117 of 245
o Offshore work is complex and expensive and you can't control the weather but at least you can do very good planning and know how you can handle bad weather.
o You need a plan B and even a plan C in my mind. o Keep it simple. Don't try to make complex constructions offshore. o Be proactive and again don't postpone for tomorrow what you can do today. If you
have nice weather today use it, because even if a weather forecast tells you it will be fantastic tomorrow it can easily change and you need to make the most of the opportunity.
o Don’t have lot of contractors involved - with Vattenfall contracting seven main suppliers and a further 70 suppliers to work on Thanet, was too many.
o Place the transformer substation in the corner of a site, as opposed to in the middle of a wind farm, it can be complicated getting a big vessel to the substation between turbines. While putting it in the middle saves cables, I think what you gain by putting it in the corner outweighs the cabling issues.
Alpha Ventus offshore wind farm The Alpha Ventus offshore wind farm is designed as a first phase R&D project and uses two different types of foundation (jacket tower and tripod) and two different 5MW wind turbines (RE Power 5M and AREVA M5000). Five RE Power 5M turbines have been installed on OWEC lattice towers and 5 AREVA Multibrid M5000 turbines have been installed on tripods. The wind farm is 45km offshore in approximately 30m of water. It took seven months to complete the offshore installation, although this does not include the delay from the initial attempts to install the first turbine in September 2008, the seven months starts from the first offshore activity in the spring of 2009. Thirty-four different companies contracted to install the wind farm. Twenty-five different vessels were used. The principle vessels were;
• Odin, used to install the foundations for the Multibrid turbines,
• Thialf, used to install the foundation for the RE Power turbines,
• JB-115, used to install the jacket foundations for the RE Power turbines,
• JB-114, Installed the Multibrid turbines,
• Goliath installed the RE Power Turbines,
• Buzzard transported the RE Power turbines,
• Stemat 82, used to install the in-field turbines. The salient points from the Alpha Ventus project are;
• The use of 5MW turbines in relatively deep water (30m), the combination of water depth and turbine size meant that monopiles could not be used,
• Use of pre-piled foundations for jacket structures,
• First use of tripod structures,
• First use of an optimized OWEC jacket structure,
• Mixture of jack-up installation vessels, flat bottomed barges and semi submersible heavy lift cranes,

Overcoming Challenges for the Offshore Wind Industry and Learning from the Oil and Gas Industry Page 118 of 245
• Construction was officially launched in 2007159, and an attempt to install the turbines in August 2008 was called off due to poor weather. The turbine installation was resumed in April 2009 with different vessels.
• Initial difficulties with construction vessels in 2008 prompted a change to more suitable equipment in 2009. “We learned that the construction process and the employed logistics must be very well attuned with one another in order to be built effectively,” adds Oliver Funk of Vattenfall160. “In this regard, we faced a very steep learning curve.” Dr. Frank Mastiaux, CEO e-on161, said in a presentation to the Eufores-Conference on the 16th of September 2010, that the Alpha Ventus project had:
“Been delay by 6 months because of a wrong approach for foundation installation. Lack of suitable installation vessels which lead to use of Thialf – a vessel 20 times bigger than needed. Waves are causing damages even 16 meters above sea level.”
The review of three different projects, which span shallow water UK Round One wind sites, deeper and larger UK Round Two wind farms and early deployment of 5MW turbines in Germany in relatively deep water, provide an insight into some of the problems which have arisen:
• All three projects had problems with adverse weather, delaying installation, damaging equipment.
• The vessels selected were not always appropriate, which in some cases caused significant delays and forced a change in vessel type.
• All the projects had a large number of contractors involved.
• All the projects used a large number of different vessels. However all the projects are successfully installed and are producing renewable electricity. There seems to be a view emerging from the companies responsible for installing these offshore wind farms that these projects were contractually too complicated and difficult to project manages.
The problems can be summarised as resulting from162:
• not having the correct contracting strategy,
• chartering unsuitable vessels.
Contracting strategy was covered in Appendix 1.2.4. Cash Flow, and elsewhere in this report. The issue of vessel selection can be investigated by comparing the vessel types, both existing and under contract to construct, for both the offshore oil and gas industry and the offshore wind industry.
The 4 C Offshore database163 of heavy lift and cable lay vessels has 105 entries, which consists of:
• Thirty one cable lay vessels with carousels, nineteen are ship shaped, the remaining twelve are barges. The database does not include many of the offshore oil and gas vessels which are equipped with carousels or reels, initially designed to install flexible flow lines or reeled pipeline, but which could be readily adapted to install power cables.
• There is one small high speed vessel with a 25 tonne reel.
• There are seventy-three heavy lift vessels in the database, seventeen of these are barges or catamarans, five are heavy lift ships, forty-three are jack-up vessels, two are semi jack-up vessels and four are heavy lift semisubmersible vessels.

Overcoming Challenges for the Offshore Wind Industry and Learning from the Oil and Gas Industry Page 119 of 245
Of the forty-three jack-up vessels twenty are new builds, with delivery dates of between 2010 and 2012, i.e. some of the vessels could be delivered before the end of 2010. There are only two new heavy lift ships, both destined for the oil and gas industry. These new build jack-up vessels are ship shaped giving them good transit speeds, typically between 12 and 14 knots. They also have maximum hook heights of 100m or more and maximum lifts are of the order of 1000tonne. Operational water depths are typically 45m, but some could operate to 60m. These vessels are targeted at the turbine installation market and could install monopiles, OWEC jacket structures or similar, small tripods and complete wind turbines, tower, nacelles and blades.
Typical of this new generation of vessels are the two vessels ordered by Fred Olsen, named Windcarrier 1 and 2 and illustrated in Figure 38164.
Huisman are promoting an innovative turbine installation concept called the Wind Turbine Shuttle165, this is based on a Small Water Plane Twin Hulled concept (SWATH) which uses a combination of a motion compensated crane and the inherent stability of a SWATH to install turbines without the use of jack-up legs. The SWATH vessels also provide high transit speed and low fuel consumption and can install turbines in any water depth.
If say thirty or forty-two jack-up vessels are working in the offshore wind industry, (and this a difficult approximation to make, since some are being built for oil and gas clients as drilling rigs or floatel accommodation and others have no declared owner), and each vessel works productively for 250 days per year, (which is probably an under estimate), and it takes 3 days to install a turbine and foundation combination, then the fleet could install 30 x 250/3 = 2,500 turbines per year. Although this is just a rough approximation, it indicates that there is probably sufficient capacity in the marketplace to be able to satisfy the demand for vessels. These approximate calculations assume that the vessels will be available to the offshore wind industry and that they do not get chartered by the offshore oil and gas industry to either install new gas platforms in the Southern North Sea or decommission old platforms.
Figure 38 Fred Olsen Windcarrier

Overcoming Challenges for the Offshore Wind Industry and Learning from the Oil and Gas Industry Page 120 of 245
It has proved to be difficult to obtain a definitive list of vessels servicing the North Sea oil and gas sector, this is presumably because the fleet is inherently mobile and can travel globally to wherever it is required. Three sources of information provide an estimate of the number and type of vessels working in the North Sea.
The database Supply Vessel .Net166 lists the following classes of supply vessel working in the North Sea:
Vessel Type Number
Multi-Purpose supply vessels 9
Platform supply vessels 28
Anchor handling tugs/supply vessels 20
Total 57
A list generated from the UK Automatic Identification System (AIS), which records all vessels within AIS range (approximately 30 nautical miles from the UK coastline) provides a real time figure of:
Vessel Type Number
Multi-Purpose supply vessels 5
Platform supply vessels 51
Anchor handling tugs/supply vessels 14
Total 70
The AIS list obviously misses all vessels not within 30 nautical miles of the UK coastline, i.e. vessels in-field and vessels in the Norwegian, German, Danish and Dutch sectors.
The vessels owned by the three principle offshore contracting companies can be traced from their websites, these are specialist vessels used in offshore construction and maintenance. However, this list is not a complete inventory of offshore construction vessels, since various ship owners also charter vessels into this market.
Subsea 7167:
Vessel Type Number
Construction vessels 3
Dive support vessel 7
ROV and survey vessels 3
Pipe lay and construction vessels 4
Pipe lay vessels 4
Total 21
Acergy168:
Vessel Type Number
Construction vessels 2
Dive support vessel 3
ROV and survey vessels 3
Pipe lay and construction vessels 6

Overcoming Challenges for the Offshore Wind Industry and Learning from the Oil and Gas Industry Page 121 of 245
Pipe lay vessels 6
Total 20
Technip169:
Vessel type Number
Construction vessels 9*
Dive support vessel 6
ROV and survey vessels
Pipe lay and construction vessels 1
Pipe lay vessels 5
Total 21
*2 of these are new builds due in service in 2011 This gives a total of sixty vessels in service with two new vessels due in 2011 being operated by the three principle oil and gas subsea contractors.
Although the vessel data is not complete, it is a representative sample of the capability available in the North Sea oil and gas market. Some of these vessels are capable of servicing the offshore wind energy industry, whether they are available is a different matter.
The supply vessels and tugs are well suited to servicing the requirements of the offshore wind industry, the supply boats naturally fit into the pattern which is expected to develop when large offshore wind farms are developed 100km or more offshore. The tugs are general purpose work horses capable of operating as supply vessels, towing barges and carrying wind turbine components or construction equipment.
The ROV and survey vessels are capable of site survey and inspection maintenance and repair work,
Many of the pipe lay vessels are equipped with reels and/or carousels and appropriate tensioning equipment and could lay cable, particularly export cables.
The saturation dive support vessels are well equipped to assist with cable tie-ins and J tube pull-ins, although it should be possible to engineer these to be diver-less. Saturation diving will become increasingly important as water depths increase, beyond 30m surface diving becomes increasingly difficult, time consuming and dangerous.
The construction vessels are generally equipped for deep water contracts, and may have the capability to work in 3000m of water or more. None of the vessels reviewed have the necessary crane hook height to install, towers, nacelles and blades or the crane capacity to install either monopiles or jacket structures. They may be able to install the smaller piles used to fix OWEC towers or similar structures to the seabed (the larger cranes have a capacity of 400tonnes, but more typically 200tonnes).

Overcoming Challenges for the Offshore Wind Industry and Learning from the Oil and Gas Industry Page 122 of 245
Oil and Gas Vessel Type Applicability to offshore wind
Multi-purpose supply vessels Direct Transfer
Platform supply vessels Direct Transfer
Anchor handling tugs/supply vessels Direct transfer
Construction vessels Cranes not large enough
Dive support vessel Could be used for J tube installation
ROV and survey vessels Direct Transfer
Pipe lay and construction vessels Could be used for cable laying
Pipe lay vessels Not relevant
There is no shortage of supply boats and anchor handling tugs which could service the offshore wind industry, especially in the post construction operational phase.
There are some ROV and survey vessels available, and there are probably more available than appear in this sample, because there are several specialist survey companies who do not compete with the major offshore construction companies, e.g. Guardline Surveys170. These vessels are required in the pre and post construction phases, they may also be required to perform inspection, maintenance and repair in the years ahead.
Saturation dive support vessels could be used for cable installation. Although saturation diving will become more important as turbines are installed in deeper water, these tasks could be designed so that they don’t require diver support.
Pipe lay and construction vessels could lay cable, both inter array cables and export cables, especially in deeper water. The offshore oil and gas vessels tend to have a deeper draft, and they have much better sea keeping than flat bottomed barges, so they will have less weather downtime. They are also capable of towing cable ploughs, which can be used to trench and bury cables.
The cranes on offshore oil and gas construction vessels are not large enough to handle turbine installation, they are not tall enough nor is their rated capacity high enough.
Pipe lay barges are not relevant to offshore wind.
Seabed protection:
There is a general requirement to protect the seabed from equipment placed on the seabed, this may be to prevent seabed scour caused by the local acceleration of tidal currents around structures; to protect cables, umbilicals or pipelines from damage by dropped objects, anchors; or to protect areas where pipelines or cables cross each other on the seabed. Seabed protection is also used to improve the load bearing properties of the seabed, by distributing the load over a wider area.
There are three principle types of seabed protection used; concrete mattresses, rock dumps and artificial seaweed.
Concrete mattresses consist of an array of concrete block cast onto a matrix of rope, so that the mattress is heavy yet flexible. The standard size is 10m x 3m (to facilitate road transport) and they are made in a range of thicknesses, from 150mm to 500mm. They can also be cast using different aggregates, which allows the density of the concrete to be varied from171 172 approximately 1.8 to 3.6 tonne/m3 . Concrete mattresses are very effective and have been used extensively in the North Sea

Overcoming Challenges for the Offshore Wind Industry and Learning from the Oil and Gas Industry Page 123 of 245
oil and gas industry. They generally require to be installed by divers using a dynamically positioned dive support vessel, although they have been installed by ROV in some deep water projects.
Rock dumps173 174, consist of layers of rock placed on the seabed. They are generally intended to prevent seabed scour, or to protect subsea pipelines or cables. Rocks of various sizes and densities can be used. Rock armoring or protection is an immediate and simple method of protecting or reinforcing, however the seabed or objects being protected must be able to withstand the impact and absorb the kinetic energy of the rocks falling from the installation vessel to the seabed. Rock dumping can also cause secondary problems, while it will protect the area where the rock is placed, it may cause secondary souring at the edge of the rock dump. Rock dumps can provide valuable marine habitats and are often rapidly colonized by mussels, oysters and other shellfish. Rock dumping does not require diver or ROV support.
Artificial seaweed or fronds, usually take the form of a plastic mat with long ribbons (or fronds) of plastic attached. They work by reducing the water velocity close to the seabed, which causes sediment being transported by the current to be deposited175. The sediment builds-up often 0.5m or more in thickness and is self limiting to the length of the fronds. These sediment traps can be very effective and can fill-up within the space of a few tidal cycles, they are also thought to be more environmentally friendly, since they trap sediment which is indigenous to the area. The mats are generally placed by divers and have to be pinned or anchored to the seabed, a task which is often limited to slack water, so the mats can be slow and expensive to deploy.
All three techniques of seabed protection work and although they were first developed for the offshore oil and gas industry they have been used successfully in the offshore wind industry.
Remote construction and intervention
The basic techniques for remote connection systems are a simple method of guiding the item to be placed and a remote method of connecting them together.
The guidance system normally uses three separate stages of guidance:
• Primary capture and guidance, this provides a large target to aim at, usually in the form of a cone and tubular section, this provides an initial “rattle fit”.
• As the object being inserted moves closer to the target, the tubular section guides the axial alignment of the system. The object is then guided by a secondary conical section which refines the lateral alignment, to a close fit.
• A tertiary tubular section refines the axial alignment and a final conical section achieves the required mating tolerance.
Similar systems can be used to achieve axial alignment using pins and slots.
For example, there have been many hundreds176 of successful pipeline pull-ins and connections performed at more than 500m water depth using ROV deployed tools on BP’s Schiehallion and Foinaven fields to the West of Shetland.
Primary Secondary
Tertiary

Overcoming Challenges for the Offshore Wind Industry and Learning from the Oil and Gas Industry Page 124 of 245
The remote connection system can either be an automated method of bolting flanges for example the Acergy’s MATIS™ 177system is capable of automatically assembling a bolted flange in 3000m, or an
external compression clamp (Grayloc® clamp), where the two pipe sections are joined and sealed by
tensioning an external band which forces the two sections together on wedge shaped surfaces, alternatively a shear ring could be used. Both Grayloc and shear rings distribute the load over the full circumference of the connection, this eliminates the stress concentrations which occur around the bolts in a bolted flange and allow relatively low strength materials to be used.
Figure 39 GraylocTM Clamp178

Overcoming Challenges for the Offshore Wind Industry and Learning from the Oil and Gas Industry Page 125 of 245
The sketch above illustrates the concept of how a blade might be attached to a hub using a shear ring, inserted tangentially into a grove. The blade could be pulled in vertically, and with the addition of a dowel and slot, which would control the angular alignment, might be used as the basis for the design of a remote method of installing a wind turbine blade into the pitch control system within a hub, using a derivative of standard subsea engineering practice.
In summary, there are many areas of commonality between installation requirements for offshore oil and gas and offshore wind. The supply boat fleet could service an offshore wind industry with permanently manned installations, without modification, further there are probably enough supply vessels currently available to meet the demands of both industries without building new ships, at least for the period up to 2015.
The oil and gas offshore construction fleet can be adapted to meet the requirements of the offshore wind industry, especially for laying cables, but none of the oil and gas construction vessels have a crane with enough capacity to (height or weight) to install monopiles, structures, towers, nacelles or blades. However there are a significant number of new build jack-up vessels on order, specifically designed to service the offshore wind industry.
Subsea protection systems are very similar for both industries and share the same contractors and pool of vessels.
There seems to have been very little consideration given to adapting construction techniques for use offshore, subsystems seem to be manually bolted together, in the same way that turbines are constructed onshore. There is probably scope for adapting some of the technology developed for remote subsea operations to the construction and repair of wind turbines. Ideally these techniques would improve safety by taking personnel out of hazardous locations, improving the weather window for construction, and speeding up the process.
Blade
Shear ring
Pitch control
Tapered Mandrel
Pull-in force

Overcoming Challenges for the Offshore Wind Industry and Learning from the Oil and Gas Industry Page 126 of 245
Supply Chain
The documents listed in APPENDIX 4 – SUPPLY CHAIN REPORTS REVIEWED have been reviewed, in addition to the documents in the reference list, with reference to the current status of the supply chain serving the forecast offshore market in the North Sea. This market is a subset of the total wind energy market, because it does not include onshore turbines or the manufacturing and installation aspects of turbines which have already been supplied. The supply chain under consideration is the future supply chain requirement for turbines of 5MW or larger in deeper water in the UK Round 3 sites and their equivalent elsewhere.
Many of the supply chain studies which have been reviewed look at the opportunity based on the historical precedent of turbines already installed and calculations of the numbers of turbines required to meet the EU 2020 targets. Studying the supply chain in this way is likely to miss bottlenecks which occur early in the supply chain and may cause fundamental restrictions on the speed at which the offshore wind industry can grow. Very few reports look at the detail of the supply chain, starting from the basic raw materials and working up through the manufacturing process to the companies who, for example, assemble wind turbines or foundations.
If larger turbines (5MW or larger) are required to achieve the economies of scale needed to bring down the cost of electricity generated by offshore to a level which does not require subsidy, then it is important to ensure that the full supply chain is able to meet the demand, since the unavailability or restricted supply of just one critical component could have a significant impact on where the EU 2020 renewable energy targets are met.
Mind Map of Supply Chain Figure 40 is a mind map drawn from raw materials input to wind farm components, to illustrate the dependence of offshore winds farms on component supply. Analyzing the industry in this way emphasizes the role of companies who manufacture wind farm components. Most of the well known wind turbine companies assemble parts built by other more general engineering companies. For example a turbine manufacturing company will most likely buy in generators, gearboxes, bearings, shafts, pitch and slew control systems etc, from other manufacturers. As turbines get bigger than, say 5MW, the larger components required may exceed the capability of many of the component manufacturing businesses.

Overcoming Challenges for the Offshore Wind Industry and Learning from the Oil and Gas Industry Page 127 of 245
Figure 40 Raw Materials Mind Map

Overcoming Challenges for the Offshore Wind Industry and Learning from the Oil and Gas Industry Page 128 of 245
The principle concern is the reliance on other sectors of industry to be able to supply components in the quantity and quality required to meet the EU’s 2020 renewable energy targets in parallel with the demand from other geographic areas for wind turbine components and from other industrial sectors. If the basic supply side of the industry is not currently equipped to manufacture the size of components required in the quantities envisaged in compliance with the necessary QA and QC, then it will be difficult to achieve the EU targets because there will be, at best, a time lag between order and delivery, as the supply side invests and installs the equipment required to manufacture the components.
BTM Consult ApS have mapped the supply chain (Figure 41) for the wind power industry. The report concluded that for the current wind energy industry, dominated by onshore turbines of less than 4MW, there are few supply chain problems, the market has responded by investing in new factories, built in the Far East (China in particular) to ramp up production to meet the demand. However the report hints that there may be shortages of components for the larger turbines which will most likely be used in offshore wind farms.
Figure 41 BTM Supply Chain Map
High flux permanent magnets
The supply of rare earth minerals, Samarium, Cobalt and Neodymium, required in the manufacture of powerful magnets is concentrated in China which has nearly 60% of the world’s resources. World demand for rare earth element is estimated at 134,000 tons per year, with global production around 124,000 tons annually179. World demand is projected to rise to 180,000 tons annually by 2012. The USA has recognized this shortfall and has legislation before Congress to establish a stockpile to

Overcoming Challenges for the Offshore Wind Industry and Learning from the Oil and Gas Industry Page 129 of 245
protect “green initiatives and defense applications”. Further, most European supplies of rare earth magnets are imported from China.
With the increasing use of permanent magnet generators in large offshore wind turbines, the shortfall in global supply and the dominance of one country, in both the supply of raw materials and finished product, must be considered as a threat to the EU’s renewable energy aspirations.
Copper
Copper is very important, it is the primary means of moving electrical energy from generator to consumer. The world demand for copper is greater than the supply180 and that has lead to an increase in the commodity price of copper, even though the world has been through a global recession. The forecast is for copper to remain in short supply because mines are not hitting their production targets and because of the extended lead time (up to 15 years) to bring a new copper mine into full production.
Drawn Copper Wire
Drawn copper wire is the basic element from which cables, transformers and generators are made. It is manufactured by drawing or rolling thick bars of very pure copper into thin copper wires. The supply requires copper refined by electrolysis and manufacturers with equipment and capacity to supply the market.
The forecast for production of drawn copper is mixed; many of the traditional markets for copper wire are switching to other products. For example telecommunications companies are increasingly using fibre optics and Cable TV companies are using satellite and wireless broadband systems to deliver TV. However, the short fall in commodity copper will probably impact on manufacturers’ ability to deliver high quality drawn copper wire for cables, transformers and generators.
Steel
Steel is made from refined iron, alloyed with small percentages of other elements, commonly carbon, chromium, molybdenum, manganese, titanium, etc. The chemistry of the alloy and subsequent processing is used to produce different types of steel, for example:
• high chromium alloys produce stainless steel,
• high carbon alloys produce very hard and often brittle steels,
• molybdenum and manganese alloys can be very tough and produce fatigue and tear resistant steels.
These specialist steels are produced in slabs or ingots for further processing.
High strength fatigue resistant steels for use in foundations and towers are rolled into cylindrical sections and welded together.
High carbon steels are typically cast for use in bearings, and special steels are cast in ingots and are hot forged to make the basic shapes for shafts and gears, which are then machined and heat treated.
Recent supply chain studies suggest that there is a limited capacity to produce large casting and forgings:

Overcoming Challenges for the Offshore Wind Industry and Learning from the Oil and Gas Industry Page 130 of 245
“There are currently bottlenecks in some parts of this supply chain, in particular: gearboxes, bearings, forgings, cables, transformers and vessels. These have lead to lead times of up to three years for some companies serving the offshore wind market181.”
“Product size is becoming a key strategic differentiator for component suppliers. As turbines scale to 3 MW and larger, logistical issues require component suppliers to adapt to OEM needs with new product dimensions -- and not all existing players are prepared to make those investments182.”
The BVG Associates report published in 2009 raised the issue of a limited number of companies able to produce large casting, forgings and gearboxes183.
Figure 42 Table from BVG Associates 2009 - Caption Added
BVG use an estimate of 30 tonnes of castings and 15 tonnes of forgings per MW for 5MW-scale turbines, and notes that the wind energy market for castings over 8 tonnes is expected to consume 50% of the estimated total global capacity of suitable sized castings by 2012. However, the market is responding and existing manufacturers are expanding their capacity and new companies are entering the market, especially in India, China and USA.
The report also notes that it is important to co-locate the manufacture of large components based on forging and casting to improve delivery and reduce costs, and speculates that the local availability of large components may become a key differentiator when turbine manufacturers choose a location for a new factory.

Overcoming Challenges for the Offshore Wind Industry and Learning from the Oil and Gas Industry Page 131 of 245
The key issue for the offshore wind industry is to ensure that the steel component supply chain is able to supply the large components required for 5MW turbines as they are developed.
Composites
Fibre reinforced composites are used to manufacture turbine blades and covers for the nacelle. The fibres are usually made from very fine strands of glass or carbons, and occasionally Kevlar. The matrix is normally a thermosetting resin, usually polyester or epoxy, and occasionally Vinylester. However, thermoplastics (the cyclic form of polybutylene terephthalate) are being considered as a matrix material, the advantages being that they offer faster product cycle times and are environmentally friendly because they can be more easily recycled.
Carbon epoxy blades would probably provide the best technical performance, however carbon fibre is very expensive. Most wind turbine blades are made from glass reinforced epoxy resins, however, the addition of relatively small amounts of unidirectional carbon fibres can make significant a difference to the stiffness of a turbine blade. This is particularly important for three bladed upwind designs, where excessive blade flexibility can cause the blade to clash with the tower. As turbine output powers increase and turbine blades get longer, it is anticipated that more carbon fibre will be required.
The supply of carbon fibre seems to be one of the most significant constraints in the construction of wind turbine blades.
As the amount used by the wind industry increases, existing manufacturers are looking to expand their manufacturing capability – Composites Technology estimated that by 2017 the wind energy industry could require 60,000 tonnes of carbon fibre per year, which is currently double the global production. 184
Table 14 shows that in 2008 the wind industry already used approximately one third of the carbon fibre composite components made in the UK and that figure is expected to increase significantly as large offshore wind turbines are manufactured in the period 2015 to 2020.

Overcoming Challenges for the Offshore Wind Industry and Learning from the Oil and Gas Industry Page 132 of 245
In addition to the UK and European market there will be a significant demand for carbon fibre from the USA , China and other world markets, for example , at the end of 2009, wind power in China accounted for 25.1GW of electrical generating capacity. China is now the largest producer of wind turbines and the second-largest producer of wind power, after the United States. “According to the Global Wind Energy Council, China is expected to remain one of the main drivers of global growth in the coming years with annual additions of more than 20 GW by 2014. This development is supported by a very aggressive government policy and the growth of the domestic industry. The Chinese government has an unofficial target of 150 GW of wind capacity by 2020”186.
In summary, the key issues in the supply chain for offshore wind turbine blades are:
• The supply of carbon fibres, required to make stiffer lighter blades.
• A requirement to increase automation, to improved quality and reduce costs.
• The requirement for quayside factories to minimize logistic and transport difficulties.
There will also be significant competition for blades from land-based wind farms in China, USA and elsewhere.
Semiconductors
The availability of high power semiconductors will become increasingly important as wind turbines get bigger and wind farms are built further offshore. Larger wind turbines require control electronics to handle both higher current and higher voltages. Longer transmission distances require the use of HVDC transmission cables, which in turn require high power rectifiers and inverters. The availability of power electronics systems relies on high power semiconductors, principally fabricated on silicon wafers, although other wide band gap semiconductor devices are under development.
The four largest sectors in the current market for high power semiconductors are187:
UK production of CF composite parts by product form and end use – 2008 (in tons of composite)
Product Form
CF Compound (Thermoset or Thermoplastic)
Continuous CF
Filament
CF Fabric, Multixial and Knitted
CF Prepreg (UD and fabric
based)
Total By
End Use
End Use
Aerospace/Defence 20 50 - 700 770
Automotive 10 50 40 150 250
Marine - 60 100 - 160
Wind Energy - 650 - 50 700
Industrial 10 50 40 50 150
Sports 5 20 - 20 45
Other 5 20 20 10 55
Total 50 900 200 980 2,130
Table 14 UK Production of Carbon Fibre Composites - From Table 7: UK production of CF composite parts by product form and end use – 2008185

Overcoming Challenges for the Offshore Wind Industry and Learning from the Oil and Gas Industry Page 133 of 245
• Rail traction
• Electricity transmission and distribution
• Wind turbine converters
• Ships and vessels
The rail traction market accounts for 65% of the total market, it is also worth noting that the extension of transmission lines, including the European super grid, within the transmission and distribution sector, will account for a significant proportion of the semiconductors manufactured. Figure 44 indicates that despite the predicted rapid growth of wind energy, it is still only a relatively small market sector within the overall market for power devices. Figure 43 illustrates the anticipated growth of Silicon Carbide (SiC) devices with wind turbines taking less than 10% of the market by 2019. However, there will be a component of the smart grids market which is directly related to the growth of renewable electricity generation.
Figure 43 Predicted Growth of Wind Turbine Use of SiC188

Overcoming Challenges for the Offshore Wind Industry and Learning from the Oil and Gas Industry Page 134 of 245
Figure 44 Market Forecast for Power Modules189
The consensus from reading the current market surveys and technology reviews is that high power semiconductors, as used in wind turbines and transmission systems are a rapidly growing and developing market. There is a lot of competition, not only for supplying devices, but in developing new technology which is more capable of handling the very high voltages and currents inherent in the development of large offshore wind farms.
In summary there are significant potential problems in the roots of the supply chain, with limited raw materials and competition for manufactured components from other regions and other industries. Further the solution to these supply problems is outside the direct control of the offshore wind industry and may directly affect subcontractors to the major component suppliers who service the wind turbine industry. This problem is particularly acute for very large wind turbines (greater than say 6MW) where some of the components are larger than can be manufactured by most of the current supply chain and will require significant investment in capital plant and equipment to manufacture the components in the quantities envisaged. Although larger turbines may be technically possible, these supply side restrictions may impose a limit on the maximum size of turbine which can be installed in the foreseeable future.

Overcoming Challenges for the Offshore Wind Industry and Learning from the Oil and Gas Industry Page 135 of 245
Supply chain sector Status
High flux permanent magnets Demand exceeds supply
Copper Demand exceeds supply
Steel Supply problems for large components
Composites Potential supply problems with Carbon Fibre
Semiconductors No problems foreseen
Table 15 Supply Chain Summary Table 15 summarizes the supply chain issues, the problems in sourcing rare earth elements and the shortage of copper being especially significant for generator manufacturers.
Current Status of Cross-over Between Oil and Gas and Offshore Wind Synergy Versus Competition map Figure 45 illustrates the relationship between the offshore oil and gas industry and the offshore wind industry. The two industries have many common requirements and this leads to a complex relationship of synergies and competition. Where there is a synergy, there is the potential for competition. In some areas, for example safety, any element of competition is set aside by mutual consent, since it common sense for both to share the knowledge associated with safety.
In other areas the relationship is more complex, for example, manning of both industries will be highly competitive, because there is a perceived shortage of people who have the necessary skill set and want to work in either industry. The industry in which a person chooses to work is a matter of personal choice and people can switch industries very quickly if one industry is significantly more attractive than the other. This is a classic case of supply and demand, with market forces working to pay a premium for suitably qualified people. The perception is that because science and engineering are seen as “hard subjects” at school and university, there is a shortage of recruits for both industries. The situation is made more acute by the onset of retirement of many skilled people who joined the offshore oil and gas industry in the 1970’sand 1980’s and the requirement to find replacement staff.

Overcoming Challenges for the Offshore Wind Industry and Learning from the Oil and Gas Industry Page 136 of 245
Figure 45 Synergy versus Competition Map
In other areas the degree of synergy and competition is governed by market forces, for example there is generally thought to be a shortage of vessels capable of laying in-field and export cables. The type of vessel required to lay cable and umbilicals is common to both industries and this gives rise to a high degree of synergy and competition.
The requirement for supply vessel services for manned offshore platforms is more or less identical, thus there is a high degree of synergy, but because there is an oversupply of supply vessels, it is unlikely there will be significant competition between the two industries.
Trends There is a worrying trend in the offshore wind industry, at least in the UK, to try and establish different training requirements to those which already exist within the offshore oil and gas industry. This may be a reaction to the perceived higher costs in the offshore oil and gas industry, the competition for staff and a desire to generate a pool of labor which is dedicated to the offshore wind industry. However, these tactics are unlikely to succeed in the long term as potential recruits to both offshore industries are more likely to be deterred if there are significant differences between the training qualifications for both industries, when the fundamental training requirements are very similar.
Offshore engineering and technology has generally been openly shared by oil and gas companies as discussed in Section 0. In contrast the offshore wind industry is still very secretive about the technology it uses. This is viewed as shortsighted and probably shorted lived, because when the offshore generating companies take full responsibility for maintenance of offshore wind farms at the

Overcoming Challenges for the Offshore Wind Industry and Learning from the Oil and Gas Industry Page 137 of 245
end of the warrantee period (typically 5 years) the maintenance market will open up to third party maintenance companies and the supply of spare parts will start to be sourced from companies other than the original equipment manufacturers. At this point there will be pressure on the turbine manufacturers to release technical information on the turbines from the offshore generating companies and the EU may view the “non availability” of information as anti competitive. If technical information is not made available parts will simply be “reverse engineered”. As soon as the market opens up, third party companies will be offering improved parts and turbine upgrades and much of the technology will become public domain. Patents provide some protection for the manufacturers, but patents are expensive to defend and the existence of patent protection often leads to a better alternative engineering solution being developed.
The offshore wind energy industry has recognized a shortage of vessels capable of transporting and installing turbines. This has led to a number of new vessels being ordered to fill the gap in the market. These new vessels generally have a crane capacity of approximately, 1000 tonnes and a deck loading capacity of 5,000 tonnes or more. Although these vessels are being built in response to a wind industry demand, they could be used for decommissioning offshore oil and gas platforms, so there is a synergy and a potential element of competition inherent in these new vessels.
Environmental
Consistent Environmental Standards Environmental impact is usually considered under a series of logical headings:
• Physical Environment o Marine Geology, Oceanography and Coastal Processes o Water Quality o Air Quality
• Biological Environment o Benthic and Epibenthic Environment o Fish Ecology o Marine Mammals o Underwater Noise and Vibration o Ornithology
• Human Environment o Commercial Fisheries o Shipping and Navigation o Civil and Military Aviation and Airborne Radar o Telecommunications and Interference o Archaeology and Cultural Heritage o Socio-Economic Characteristics o Landscape, Seascape and Visual o Airborne Noise o Infrastructure and Other Users
There is an EU wide strategic framework190 in place which governs the environmental impact of offshore wind farms and which provides the legislation under which the topics listed above have to be considered.
The environmental framework has three components:

Overcoming Challenges for the Offshore Wind Industry and Learning from the Oil and Gas Industry Page 138 of 245
• International treaties and conventions e.g. o London Convention (relating to dredging where the sediment is dumped at another
site), o OSPAR Convention (1992/1999), o Ramsar Convention (1971), o Bonn Convention (1979), o ASCOBANS (1992), Conservation of Small Cetaceans in the Baltic and North Seas o Convention on Environmental Impact Assessment in a Transboundary Context
(1991), o Convention on Biological Diversity (1992 Rio de Janeiro) and the designation of
Important Bird Areas (IBAs).
• EU directives e.g. o European Bird Directive 79/409/EEG (Special Protection Areas (SPAs), 1979), o European Habitat Directive 92/43/EEG (Special Areas of Conservation (SACs), 1992), o Treaty of Bern (1979), o European Council Directives, 85/337/EEC and 97/11/EC.
• National planning law. In-keeping with the principle of subsidiarity, each Member State decides on the particular policies and measures which it needs to adequately implement the Directives.
So at an international level there is a consistent framework governing environmental impact assessments. However, at a national level there seem to be differences in the way the framework is interpreted and there are many documents which stress the need for a consistent environmental policy for offshore wind farms within the EU191 192 193.
The national differences arise naturally because each country has a different set of organizations with responsibility for the environment. To illustrate these differences an overview of the regulations for the; United Kingdom, Denmark, The Netherlands, Ireland, Belgium and Germany are outlined below194 195 196.
United Kingdom:
For the UK, the guidance is set-out in:
Offshore Wind Farms: Guidance Note for Environmental Impact Assessment in Respect of FEPA and CPA Requirements197, and refers to the following UK acts of parliament:
• Food and Environmental Protection Act 1985 (FEPA),
• Section 34 of the Coast Protection Act 1949 (CPA),
• Electricity Works Regulations 2000.
Principle competent authorities are:
• The Crown Estate (Commissioners),
• Department of Trade and Industry (DTI), which is responsible for consenting environmental controls and licensing of energy facilities,
• The Department for Environment, Food and Rural Affairs (Defra),

Overcoming Challenges for the Offshore Wind Industry and Learning from the Oil and Gas Industry Page 139 of 245
• The Department for Transport (DfT),
• The National Assembly for Wales (NAW),
• The Scottish Executive (for Scotland),
• The Marine Consents and Environment Unit (MCEU).
Wind farm developers have to obtain all the necessary licenses or consents from the consenting authorities for the three phases of a development;
• The pre-exploitation phase,
• The exploitation phase,
• The decommissioning phase.
Denmark
For Denmark, the guidance is set-out in:
Government order on the, “Assessment of Environmental Impact from electricity production plants on the Sea”, Government decree 2000:815 of 28 August 2000. This sets out the procedures for the EIA and conforms to EU maritime legislation. However, the decision on whether this procedure is required is made by the Danish Energy Authority198
Principle competent authorities are:
• Danish Forest and Nature Agency (Ministry of the Environment),
• Danish Maritime Authority (Ministry for Economic and Business Affairs),
• Royal Danish Administration of Navigation and Hydrography (Ministry of Defence),
• Danish Civil Aviation Administration (Ministry of Transport),
• Danish Coastal Administration Agency (Ministry of Transport),
• National Working Environment Authority (Ministry of Employment),
• Counties,
• Municipalities.
Licenses are granted by Danish Energy Authority and the Ministry for Economic and Business Affairs.
The Netherlands:
For The Netherlands, the guidance is set-out in:
The “M.E.R.-richtlijn” (environmental effect report), Richtlijn 85/337/EEG. There are four official consultation rounds for the public in the course of this procedure.
Principle competent authorities are:
• Ministry of Transport, Public Works and Water Management,
• Ministries of Economic Affairs,
• Environment,
• Agriculture,
• Nature and Food Quality,
• National Coastguard.

Overcoming Challenges for the Offshore Wind Industry and Learning from the Oil and Gas Industry Page 140 of 245
Wind farm developers have to obtain a license or “Wbr-licence” (Wet Beheer Rijkswaterstaatwerken) from The Ministry of Transport, Public Works and Water Management for the three phases of a development:
• The pre-exploitation phase,
• The exploitation phase,
• The decommissioning phase.
There are several other regulations which have to be complied with:
• Sea Water Pollution Law (Wet Verontreiniging Zeewater),
• Environmental Administration Law (Wet Milieubeheer),
• Spatial Arrangement Law (Wet Ruimtelijke Ordening),
• Environmental Protection Law (Natuurbeschermingswet),
• Wreckage Law (Wrakkenwet),
• Monuments Law (Monumentenwet),
• Excavation Works Law (Ontgrondingenwet),
• North Sea Installations Law (Wet Installaties Noordzee),
• (Sea) Bottom Protection Law (Wet Bodembescherming),
• Mining Laws 1810, 1903 & EEZ (Mijnwetten 1810, 1903 & NCP buiten 12 mijl),
• Route Law (Trac wet) (This law is important for the seaways to be chosen.)
Ireland:
For Ireland, the guidance is set-out in:
The policy document ‘Offshore electricity generating stations – Note for intending developers’ which refers to the following legislation:
• Electricity Regulation Act 1999,
• Foreshore Act 1933,
• Foreshore (Amendment) Act 1992 (No. 17),
• Fisheries and Foreshore (Amendment) Act 1998 (No. 54),
• European Communities (EIA) Regulations 1989,
• Foreshore (EIA) Regulations 1990,
• European Communities (EIA)(Amendment) Regulations 1998,
• European Communities (EIA) Regulations 1999.
The Irish Government has incorporated the EU Directives (85/337/EEC and 97/11/EC) into Irish law.
The competent authority is:
• The Minister for Communications Marine and Natural
In consultation with other users of the waters concerned, environmental groups, local authorities, coastguard, aviation authority, etc.

Overcoming Challenges for the Offshore Wind Industry and Learning from the Oil and Gas Industry Page 141 of 245
There is a two stage license process, which allows the site to be investigated and an EIA and other documents to be drawn up in preparation for applying for a lease which allows construction and operation of the offshore wind farm.
Belgium:
For Belgium, the guidance is set-out in;:
• Royal Decree concerning the rules of the environmental impact assessment in application of the law of 20 January 1999 on the protection of the marine environment in marine areas under jurisdiction of Belgium,
• Royal Decree concerning the procedure of permit and authorization of certain activities in the marine areas under jurisdiction of Belgium, 7th September 2003,
• Royal Decree of 28 September 2008, to granting a domain concession for the development.
The competent authority is:
• Ministry of Social Affairs, Public Health and the Environment.
There are two stages in gaining consent to build an offshore wind farm:
• Exploration permission,
• Authorization to build the offshore wind farm.
Germany:
For Germany, the guidance is set out in;
Standards for Environmental Impact Assessments for offshore wind turbines in the marine environment, Federal Maritime and Hydrographic Agency (BSH) / 25th February 2003, which refers to:
• Federal Emission Control Act and permission must be gained from Federal Maritime and Hydrographic Authority (BSH) for both wind farms and export cables,
• EU Directive on Environmental Impact Assessment 97/11/EG, 85/337/EWG which has been implemented into German national law as of 3 August 2001,
• Permission must also be granted by the relevant federal state.
The competent authorities are:
• Federal Office for Maritime Traffic and Hydrography beyond the 12 mile limit,
• Regional governments within the 12 mile limit
Offshore wind farms are considered in three phases, pilot, extension and removal.
There is a considerable difference between the way in which national governments are implementing planning policy with the EU framework, ranging from specific regulations and procedures in some countries, to a more general approach which relies on existing laws and protocols.
In Belgium, Ireland and the UK, the rules are well defined. In Germany the authority is split between a federal organization beyond a twelve mile limit and regional government within the twelve mile limit.

Overcoming Challenges for the Offshore Wind Industry and Learning from the Oil and Gas Industry Page 142 of 245
In the Netherlands, no large scale wind farms are allowed with the twelve mile limit and there are no specific regulations for wind farms outside the twelve mile limit.
Site Specific and Strategic Environmental Assessments Both site specific (EIA) and strategic environmental assessments (SEA) consider the list of topics outlined at the start of this section. They are the mechanism which ensures that planning decisions are made in a well rounded way with due regard for every sector which may be affected by the plan if is implemented.
Strategic Environmental Assessments
An SEA is a broad tool to allow high level plans to be made and is part of the process of developing a strategic action plan (SAP); an EIA covers the same topics as an SEA but is specific to a particular location and is more detailed. SEAs and EIAs are regulated by European Directive 2001/42/EC “the assessment of the effects of certain plans and programs on the environment” (the Strategic Environmental Assessment (SEA) Directive) and the EIA Directive – Consolidated Directive 85/337/EEC as amended by 97/11/EC and 2003/35/EC. Figure 47 illustrates how an SEA and EIA fit into the overall planning process.
The directives apply to a wide range of planning and development, i.e. they are not specific to offshore wind farms. SEAs are performed for oil and gas developments, for example the UK government has undertaken SEAs for oil and gas developments in the areas defined in Figure 46. A revision of the UK SEA, known as SEA2 is currently being undertaken for all offshore energy resources, wind wave, tidal and offshore oil and gas.

Overcoming Challenges for the Offshore Wind Industry and Learning from the Oil and Gas Industry Page 143 of 245
Figure 46 UK SEA Areas199
The concepts underlying Strategic Action Plans, Strategic Environmental Assessments and Environmental Impact Assessments are not confined to the EU, and they have been implemented globally to aid the planning and development process, e.g. The Greater Mekong Sub-Region Economic Development program; Commission on the Protection of the Black Sea Against Pollution200and the Strategic Action Program for the Caspian Sea201.

Overcoming Challenges for the Offshore Wind Industry and Learning from the Oil and Gas Industry Page 144 of 245
Figure 47 Planning Process202
Strategic environmental assessments (SEAs) are generally commissioned by governments and cover a large area, often a whole country. They are used by governments to set strategic objectives and to identify areas of the seabed which are likely to be suitable for offshore wind farms. These areas are then offered to the wind farm developers in some form of “selection process”, where interested developers submit their proposal on how the sites might be developed. Figure 48 illustrates a block diagram for an SEA.

Overcoming Challenges for the Offshore Wind Industry and Learning from the Oil and Gas Industry Page 145 of 245
Figure 48 Block Diagram for an SEA203
Several member states have now completed SEAs for their territorial water and economic zones, which enables the long term planning of offshore wind farms and sites for both wave and tidal generation.

Overcoming Challenges for the Offshore Wind Industry and Learning from the Oil and Gas Industry Page 146 of 245
Environmental impact assessment (EIA)
A site specific environmental impact assessment (EIA) is the next stage, after the sites which may be viable for offshore wind farms have been selected and potential developers have been licensed to investigate the site in detail. The developer will carry out a detailed investigation of the site and submit an EIA as part of the processes of getting permission to build and operate an offshore wind farm.
Figure 49 illustrates the key stages in an EIA. For offshore wind farms an EIA can be quite complex, expensive and time consuming. This is especially true when the wind farm site is located 100km or more from the coast, when collecting environment data on, birds, mammals, fish, etc, becomes difficult because the standard methods of collecting data require vessel surveys, aerial surveys and data buoys. Collecting data in this way requires extensive time on site using expensive observation platforms. Further, these platforms may cause a significant disturbance and make it difficult to record the true state of the undisturbed environment.
An EIA may have unexpected results, for example the EIA performed in Liverpool Bay discovered large populations of Common Scoter, at least 20,000 individuals and over 10,000 Red-Throated Divers. This discovery has lead to an area in the Irish Sea, including the site of the proposed Shell Flat wind farm, being designated as Special Protected Areas. This does not mean that a wind farm cannot be built, but it does put additional hurdles in the path of a developer to ensure that a fragile bird population is not harmed204.
The consultation process can also be time consuming and expensive, for example for the Ormonde project in the UK there were more than 250 statutory and none statutory consultees205, who had to be kept informed of the progress of planning the offshore wind farm.
EIA’s are regularly completed by the oil and gas industry for both new developments and decommissioning projects. For example, an EIA has been completed by Premier Oil for the planned decommissioning of the Shelly Oil filed in 2010 and 2011206. The document has two interesting recommendations:
• That the 2km subsea pipeline which connected the subsea wells to the FPSO, which were rock dumped on installation, should remain in place and that the pipeline should rot in situ. Disturbing the rock dump to remove the pipeline would have worse environmental impact than leaving it in place. Although this is probably a sensible decision, it is at odds with the OSPAR convention and prompts the question, why was the pipeline rock dumped in the first
Figure 49 Stages in an EIA

Overcoming Challenges for the Offshore Wind Industry and Learning from the Oil and Gas Industry Page 147 of 245
place? Because there were more environmentally friendly options available in 2008 when the field was constructed.
• The FPSO Sevan Voyageur and the associated mooring system, which is not owned by Premier Oil, but by Sevan 300PTE Limited, does not really feature in the EIA after cessation of operation and a clean-up of the on-board oil processing facilities. The EIA argues that once disconnected the Sevan Voyageur becomes a vessel and can be move and reused elsewhere. There appears to be a joint liability for the mooring system and the EIA makes little reference to the removal of the 12 suction anchors, except to say that the process of installation will be reversed, and if that does not work Premier/Sevan will revert to DECC with alternative proposals. This indicates that there is some confusion over the liability for the environmental impact of the FPSO and the moorings system, which stems from the different ownership, despite the fact that the FPSO was an essential and integral part of the installation.
A second example of the use of an EIA by oil and gas operators is the EIA submitted by NEXAN for the Buzzard Oil field207. The Buzzard field is characterized by high but varying concentrations of hydrogen sulphide (H2S) which range from 0 to 600 parts per million by weight (ppm wt). The oil is exported via the Forties Pipeline System which has a maximum limit of 11.7 ppm wt of sulphur. The EIA considers various options but concludes that removing the H2S from the produced oil on the platform and disposing of the H2S by flaring, which reduces the H2S to SO2 (sulphur dioxide) is the best option. The emission of SO2 is controlled by:
• “Regulations for the Prevention of Air Pollution from Ships were adopted in the 1997 Protocol to MARPOL 73/78 and are included in Annex VI of the Convention as amended in 2008” which introduces a progressive reduction in the emission of oxides of sulphur208,
• United Nations Economic Commission for Europe (UNECE) implemented the Convention on Long-Range Transboundary Pollution, most recently the Gothenburg Protocol, signed by twenty-seven countries in 1999, which set country emission ceilings for sulphur dioxide (SO2), nitrogen oxides (NOx), volatile organic compounds (VOCs), and ammonia (NH3)209,
• The Large Combustion Plant (LCP) Directive 88/609/EEC, November 1988, amended by Directive 94/66/EEC in 1994, and revised in 2001 by (Directive 2001/80/EC)210.
Based on the 2006 data, the emission of 7.24 tonnes/day of SO2, equates to 75% of the UK continental shelf (UKCS) production emissions or approximately 2,500 tonne per year of sulphur dioxide. The EIS concludes that;” levels of SO2 are sufficiently low to be considered as negligible.”
In summary, the process of environmental assessment through the development of a strategic action plan, strategic environmental assessment and local environmental impact studies, is a well thought out and powerful methodology. It has been successfully employed globally in a wide range of projects, but seems to result in inconsistent decisions, which range from the designation of sites under investigation as Special Protected Areas, to allowing projects which emit significant pollution to proceed, to a lack of clarity as to who the responsible party is during decommissioning.

Overcoming Challenges for the Offshore Wind Industry and Learning from the Oil and Gas Industry Page 148 of 245
Resolving Conflicts Between Energy Production, the Natural Environment and Other Uses of the Sea and Airspace.
A head on collision between economic enterprise and environmental preservation was referred to as a “policy train wreck” by the US government Clinton administration211. In the case of offshore wind energy it is a head on collision between a government’s renewables policy and European conservation legislation. These head on collisions are very difficult to resolve, particularly for the renewable energy industry. The decision can often be reduced to a trade-off between reducing dependence on energy imports and the potentially catastrophic effects of global warming, against the harm which may be done to a local environment.
The problem is compounded by the lack of knowledge on both sides of the argument212:
• The offshore environment under threat is not well documented; it is very rare to have accurate knowledge of the exact state of the populations of birds, mammals, fish, shell fish, plankton, benthic fauna and flora, etc. We many have more knowledge of the human activities of fishing, marine transport, leisure pursuits, military and air traffic, but even this data is very difficult to collect.
• The effects of placing a wind farm in a particular area are equally difficult to know, it may encourage some parts of the natural environment by providing additional habitats or protecting it from fishing, or it may scare some species away to less favoured areas and be detrimental to that part of the environment.
• Human activity may not be affected, or it may have a radical effect on some parts of the population. For example, fishing with static gear, lobster pot or creels may be unaffected, whilst fishing with trawling gear may be prohibited within the wind farm.
• The effects of global warming are relatively long term, and although there is general agreement that global warming is happening, predictions of its effects are dependent on the way the earth climate is modeled and predictions of the quantities of global warming gasses released to the atmosphere.
Collecting more information is the key to better decision making, but that is not an easy task. Environments change with the seasons and there may be significant differences between successive years dependant on the weather patterns. For example, a recent report213 on the use of aerial surveys to detect changes in numbers of birds concludes that there is a low probability of detecting a change of less than 50% in populations of birds, simply because of the natural spatial and temporal changes in bird numbers. The report also warns that just because we cannot measure any changes, it does not mean that changes do not exist.
It may not be practical and advisable to wait for several years to establish accurate baseline data, before deciding if an offshore wind farm would have material environmental impact. EU member states have signed up to renewable energy targets to be delivered by 2020, and there are potential legal penalties if the targets are not delivered, so delay may not be an option. Delay may also increase the long term effects of global warming.
There is, as yet, no consensus on the likely long term effects of offshore wind farms, there have not been sufficient studies on completed wind farms to establish a shared body of knowledge and experience which would facilitate decision making. For example, it seems likely that there will be long term effects, because the wind farm takes a substantial amount of energy out of the atmospheric system. Figure 50 is a photograph of Horns Rev in atmospheric conditions where the dew point is just below ambient temperature, the energy taken from the atmosphere causes adiabatic cooling and the
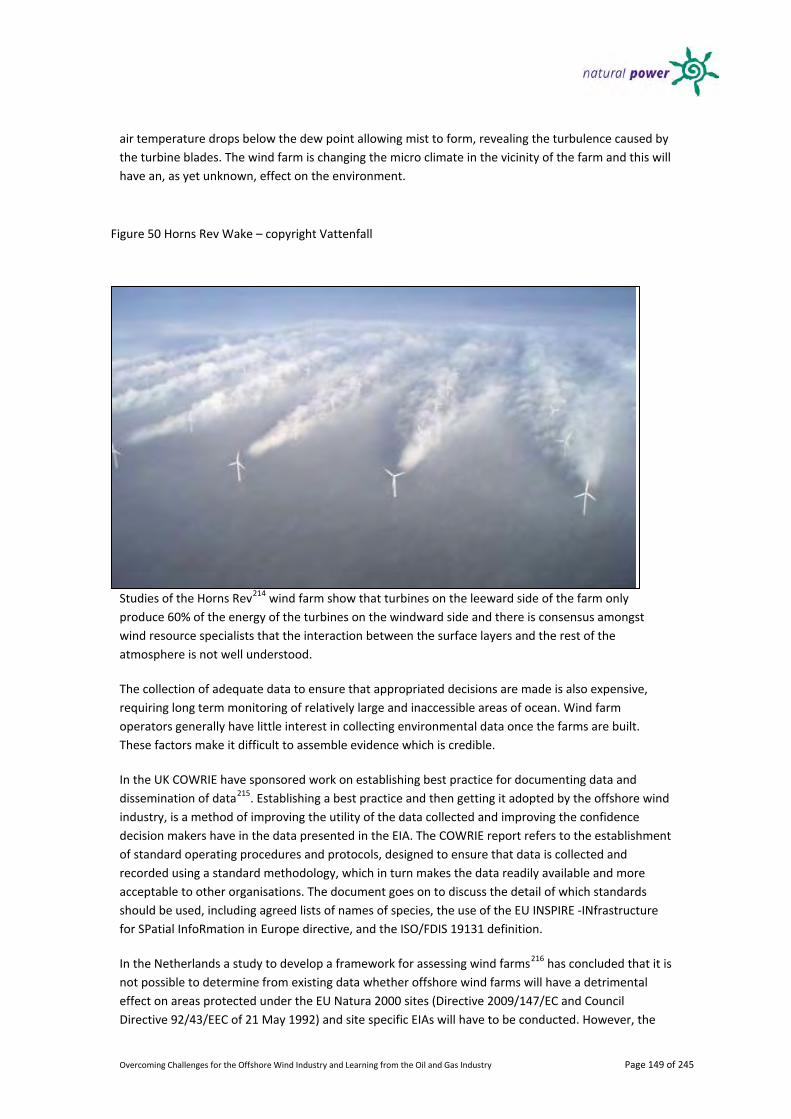
Overcoming Challenges for the Offshore Wind Industry and Learning from the Oil and Gas Industry Page 149 of 245
air temperature drops below the dew point allowing mist to form, revealing the turbulence caused by the turbine blades. The wind farm is changing the micro climate in the vicinity of the farm and this will have an, as yet unknown, effect on the environment.
Studies of the Horns Rev214 wind farm show that turbines on the leeward side of the farm only produce 60% of the energy of the turbines on the windward side and there is consensus amongst wind resource specialists that the interaction between the surface layers and the rest of the atmosphere is not well understood.
The collection of adequate data to ensure that appropriated decisions are made is also expensive, requiring long term monitoring of relatively large and inaccessible areas of ocean. Wind farm operators generally have little interest in collecting environmental data once the farms are built. These factors make it difficult to assemble evidence which is credible.
In the UK COWRIE have sponsored work on establishing best practice for documenting data and dissemination of data215. Establishing a best practice and then getting it adopted by the offshore wind industry, is a method of improving the utility of the data collected and improving the confidence decision makers have in the data presented in the EIA. The COWRIE report refers to the establishment of standard operating procedures and protocols, designed to ensure that data is collected and recorded using a standard methodology, which in turn makes the data readily available and more acceptable to other organisations. The document goes on to discuss the detail of which standards should be used, including agreed lists of names of species, the use of the EU INSPIRE -INfrastructure for SPatial InfoRmation in Europe directive, and the ISO/FDIS 19131 definition.
In the Netherlands a study to develop a framework for assessing wind farms216 has concluded that it is not possible to determine from existing data whether offshore wind farms will have a detrimental effect on areas protected under the EU Natura 2000 sites (Directive 2009/147/EC and Council Directive 92/43/EEC of 21 May 1992) and site specific EIAs will have to be conducted. However, the
Figure 50 Horns Rev Wake – copyright Vattenfall

Overcoming Challenges for the Offshore Wind Industry and Learning from the Oil and Gas Industry Page 150 of 245
report does contain very useful block diagrams which describe how to establish if wind farms have a detrimental effect on the environment.
It is important, if at all possible to get a consensus agreement, and to achieve that it is important to share information and identify a potential “train wreck” before it happens. To achieve this, a programme of extensive and early consultation should be planned and should include all the statutory and non statutory consultees.
In summary, making decisions on offshore wind farms is a difficult and complex task. Information on both the baseline and the likely effect is incomplete and difficult to collect, so any decision that is made has to take into account the uncertainty inherent in the evidence. The corollary of this is that any evidence put forward will have an element of personal opinion, which may or may not be backed by hard evidence, further these personal opinions may be deep rooted and difficult to counter without hard evidence.
Sharing and disseminating the available information with all the stakeholders at an early stage can often make it easier to arrive at a consensus decision.
In the long term collecting more information and developing better methods of measuring the environment, taking into account natural seasonal and spatial variations, will lead to a more objective method of resolving conflicting opinions.
There are a series of international agreements, protocols, EU directives and national laws to guide the decision making process. However, the decision often reduces to selecting the least worst option and the decision will often be made by a government minister who is a politician, not a technical expert, and will often rely on the advice of the competent government department.

Overcoming Challenges for the Offshore Wind Industry and Learning from the Oil and Gas Industry Page 151 of 245
Removing Barriers – Making it Happen
Structural barriers
Ability to Raise Capital, Loans and Equity The ability to raise the capital to build offshore wind farms is absolutely essential and dependent on two basic factors:
• The markets’ view of the commercial viability of wind farms and the perception of the associated risk.
• The availability of capital, either through commercial loans, equity, venture capital, from a company balance sheet or institutional loans from for example the European Central Bank.
Commercial viability and perception of commercial risk are directly linked to the cost of energy, both the actual cost of energy from offshore wind farms and the cost of alternative sources of energy.
Because the offshore wind industry has no fuel costs, the of cost of energy generated by offshore wind is dependent upon two factors:
• The capital cost of the wind farm,
• The operation and maintenance costs.
The installed capital cost must be minimized but this must not be done to the detriment of long term maintenance costs or the environment. The installed capital cost has two elements:
• The capital of the hardware installed, foundations, towers, turbine assemblies, cables and transmission systems etc, have to be reduced by optimizing the design of the components for mass production and investing in the capital equipment to build wind farm components quickly and economically. This involves building a new industry and developing new production techniques in factories close to deepwater quays. The closest historical similarity is probably the development and production of Liberty Ships in the USA during the Second World War.
• The installation cost of offshore wind farms, which is directly linked to the time taken to install and commission the farm, must be reduced. This can be achieved by developing efficient installation procedures and associated marine operations and using vessels optimized for turbine installation. The offshore wind industry is probably still at the start of a steep learning curve, especially for the installation of large turbines in deeper water 100km or more from the shore, and it is vital that the offshore wind industry learns the relevant lessons from offshore oil and gas, particularly for safe installation.
Operations and maintenance costs must be minimized by:
• Developing reliable turbines, which minimize offshore work.
• Developing turbines which do not require frequent maintenance visits.
• Developing safe methods of access and egress which allow turbines to be visited over a wide weather window.
• Establishing a well trained workforce who can perform maintenance effectively, efficiently and safely.

Overcoming Challenges for the Offshore Wind Industry and Learning from the Oil and Gas Industry Page 152 of 245
• Develop a supply chain which can supply components for turbine repair and maintenance on a competitive basis.
• Adopt the existing supply chain from the offshore oil and gas industry for the daily supply of goods and services for offshore platforms. The nature of the perceived technical risk of offshore wind farms by the financial sector has several elements:
• The lack of knowledge about the technology required to build cost effective and reliable offshore wind farms on the part of the financial community. This translates into a requirement to see a track record of reliable operation of wind farm equipment, even though the track record may not be appropriate, and reluctance to back new and innovative designs, which may form the basis more cost effective and reliable offshore wind farms. There is a key requirement for the provision of impartial and reliable expert advice to the financial community, which may prevent inappropriate technology from being installed. The industry cannot afford another series of high profile failures in wind turbine technology, similar to those experienced in many of the early offshore wind farms. These failures are generally believed to have been caused by the installation of onshore turbines with a “good track record” being installed in a marine environment.
• Only turbines which have been specifically designed for and tested in the offshore environment should be installed in offshore wind farms.
• To ensure that future generations of offshore wind turbines are reliable, the industry must establish a protocol for testing wind turbines in a representative offshore environment. This requires the establishment of recognized offshore test sites and a logical set of internationally agreed criteria to determine if a new wind turbine design is fit for purpose.
• The wind turbine manufacturers must adopt the same long term test philosophy as adopted by aero and power station turbine manufacturers, i.e. to continue testing prototype or early production models for many years after mass production has started, so that age related failures are detected before they appear in the commercial fleet of turbines. This provides the manufacturers with the opportunity to develop a repair or prevention strategy before there is a widespread commercial problem.
The commercial risk, as discussed in Section 0 is the significantly higher cost of offshore renewable energy over conventionally generated electricity, and the requirement for a subsidy of approximately €100 per MWh to make the electricity competitive, with say, a combined cycle gas fired power station. This level of subsidy is generally in place within EU member states, using a variety of mechanisms, which gives short term commercial confidence. However, investors require confidence that these subsidies are secure and stable over the life of the project. But, the continuation of subsidies is a political decision by member states, and because national governments can change with the normal democratic electoral cycle, there is always an element of doubt and concern over the level and longevity of any subsidy.
Capital markets have to be buoyant, which implies the absence of a global recession or banking crisis, so that finance is available to build wind farms. This is outside the direct control of the offshore wind industry, however, direct support by institutions like the European Central Bank217 is very important in providing the market with confidence that offshore wind is a worthwhile industry to invest in.
There must also be a supply of second owners for offshore wind farms, these second owners are typically pension funds and other institutional investors who typically purchase part of the equity in

Overcoming Challenges for the Offshore Wind Industry and Learning from the Oil and Gas Industry Page 153 of 245
wind farms after the initial construction and commissioning phase is complete and the farm has had the opportunity to settle down into routine operation. These second owners see wind farms as a safe long term investments and are an essential part of the supply of capital, with cash raised by the sale of the wind farm being recycled by the wind farm developers into new projects. The recent sale by DONG Energy of 30% of the Nysted Offshore Wind Farm to PensionDanmark218 is an indication that the financial markets are beginning to move to in this direction.
Infrastructure Harbours, Marshalling Yards and Assembly Areas The construction of offshore wind farms requires large onshore facilities close to deepwater quays (8m minimum water depth) in sheltered harbours, to marshal and assemble components. Estimates of the areas required vary, but are generally thought to be between 6 and 25 hectares (60,000 to 250,000 m2). These assembly areas must be close to the factories producing large wind turbine components, tower, blades and nacelles and preferably close to the facilities manufacturing foundations and piles, although foundations and piles are often installed in a separate operation, so they don’t necessarily need to be collocated with the turbine components.
Figure 51 Port of Mostyn, 45,000 m2, 25 Turbines - Not Big Enough!
Sites which meet these requirements are difficult to find and it is estimated that approximately 10 marshalling and assembly sites of this size will be required to service the installation of all the planned wind farms in the North Sea.
Without large marshalling and assembly sites, the EU’s 2020 targets for renewable energy are unlikely to be met and it is difficult to envisage how the required number of sites can be constructed and made operational in time without significant national government and EU intervention. It is probable that if appropriate harbour facilities are planned and built with additional land available for the

Overcoming Challenges for the Offshore Wind Industry and Learning from the Oil and Gas Industry Page 154 of 245
construction of factories, the wind turbine and foundation manufacturers will follow and build their manufacturing plants next to the harbours.
Urgent action is required by member states to finance, plan and build or convert harbours and make large areas of hard standing available for marshalling and assembly.
Grid and Transmission Infrastructure There is little point in installing significant amounts of offshore generating capacity if the grid infrastructure cannot get the power to the consumers. Adding a large offshore generating capacity to national grids and connect national grids to a European super grid radically changes the model used by electricity transmission operators. It will require a significant investment in transmission lines, over and above that directly required to bring offshore renewable electricity ashore. National governments and the European Commission must ensure that these grid improvements are in place and ready to receive the offshore renewable energy as it becomes available. Further, the grid improvement must go beyond that simply required to reinforce the local transmission system, it must take into account the requirement to move electrical power around Europe to help balance the multinational supply and demand equation.
To make the grid expansion happen requires capital and planning permission, raising the capital is perhaps the simpler of the two tasks, since obtaining planning permission for onshore overhead power lines is notoriously difficult. National transmission grid operators must be realistic about what can be achieved onshore and where appropriate opt for offshore subsea transmission lines using high voltage DC links.
It is critical that national governments and the European Commission guide and facilitate the development of robust national grids and an effective super grid, using subsea high voltage DC links where appropriate.
Raw Material Supply Chain Section 0 reviewed the supply chain from raw materials as they progress through the value chain towards wind turbine components. It is clear that there are several potential bottlenecks in the supply chain which could affect the ability of turbine and foundation manufacturers to deliver large turbines (5MW plus) to deepwater sites (25-30m or more). Of particular concern is the supply of large bearings, shaft and gearbox components, the availability of rare earth magnets and the raw materials used to manufacture them, and the supply of carbon fibres to manufacture the blades for large upwind turbines.
The supply of raw materials and components is vitally important if the EU 2020 targets are to be achieved. Manufacturing companies must work with national governments and the EU Commission to ensure that strategically important supplies are available.
Barriers to Adopting New Technology It is generally agreed that new technology is required to play its part in achieving the EU 2020 renewable energy targets, however the phrase, “New Technology” is often used by politicians without any real appreciation of what the new technology might be and how it can be introduced into the technology mix. There is also the problem of deciding which new technology is likely to be able to deliver a reduction in the cost of energy from offshore wind. Every inventor is naturally totally convinced that his invention with solve the problem and inventors are often very persuasive people and usually find the relatively small amount of money to build some form of model or proof of

Overcoming Challenges for the Offshore Wind Industry and Learning from the Oil and Gas Industry Page 155 of 245
concept prototype. The history of the wind industry is full of failed concepts, analogous to the early days of the aircraft industry as illustrated by the photographs below219.

Overcoming Challenges for the Offshore Wind Industry and Learning from the Oil and Gas Industry Page 156 of 245
Figure 52 Early wind turbine concepts

Overcoming Challenges for the Offshore Wind Industry and Learning from the Oil and Gas Industry Page 157 of 245
The offshore wind industry has been driven by a very conservative financial community and has developed in small incremental steps over a period of approximately ten years. However, the process of incremental improvement has locked the industry into a single geometry (3 blades, upwind) and although there are significant differences in the types of generator used, the technology development has been constrained by the difficulty in getting financial support for more novel designs.
Complexity arises when trying to decide which technology is likely to make a difference, and how to raise the risk capital required to develop the invention to a point where it becomes obvious whether it is worth further development into a commercial product. Raising capital is made more difficult because many financiers lack the engineering or scientific knowledge required to make a rational decision about a particular new technology.
The EU and national governments have key role to play in this area, by providing risk capital, but perhaps more importantly by funding a transparent review process aimed at deciding where to focus the available funds. Finding individuals and a process that is flexible enough to pick promising technologies is a very difficult task, and history teaches us that committees of “the Great and the Good” are not always the most appropriate method of selecting new technology. The opposite approach of a “skunk works220”, can lead to more technically innovative solutions. So the process of developing new technology has to have a place for an unconventional approach in a way which does not stifle innovation, yet provides common sense guidance to prevent money being wasted on projects which have little hope of success.
When a new technology has progressed to a point where a well tested proof of concept has been achieved, there is often a very wide funding gap to be bridged to take the technology to the pre-production prototype stage, which can be extensively tested (perhaps for 2 years or more)in the marine environment. It would be unusual for a prototype project to cost less than 200% of the anticipated long term production cost. This implies a cost of the order of €5 million per MW or more, so a 5MW preproduction turbine project would be expected to cost at least €25 million.
To fund projects of this size is expensive, especially when there is still a significant element of risk. There is also the problem of managing large scale prototype projects, because although scientific and engineering teams, who have developed the project to the proof of concept stage have all the accumulated experience and knowledge of the technology, they are often not well placed to manage a multimillion euro construction project. However, the team may feel a strong sense of ownership and wish to manage or control “their project” to commercial success and reap the associated rewards.
There is an equally large challenge to move the project on from a successful prototype to a production machine, which requires significant capital investment and a change of direction from technology development to optimizing production, and then selling the new machine to a developer for use on a wind farm.
There is a role for nation and EU organizations to help to control, manage and coach, the evolution from development through full scale prototyping to serial production. The transition requires the introduction of different skills, matched to the progress of the project, without losing the knowledge base which has been built up over the life of the project. It also requires the injection of capital at different stages and a degree of patience and a philosophy of long term investment, because the process of moving from tested proof of concept to a factory producing production machines may take five years or more.

Overcoming Challenges for the Offshore Wind Industry and Learning from the Oil and Gas Industry Page 158 of 245
In summary, to overcome the barriers to adopting new technology the industry must:
• Educate politicians about the process of developing and adopting new technology.
• Find effective ways of selecting technologies with a high likely hood of success, without stifling unconventional and innovative approaches.
• Fund new technologies, beyond proof of concept, through preproduction prototypes to commercial production machines.
• Control, manage and facilitate the changes in skill sets require to bring a new technology into production.
• Get the new technology adopted by financiers and developers for offshore wind farms.
Safety Culture/Knowledge/Systems Safety is high on everyone’s agenda and both the offshore wind industry and the offshore oil and gas industries are comparatively safe. However the offshore environment is inherently dangerous and this must be taken into account at all stages of an offshore wind farm’s development, construction and operation. There are now well developed systems, which are derived from knowledge gained over many man years of operational experience, for ensuring that personnel are safe 221and that equipment is not damaged. However it is very important that the industry does not get complacent and that it continues to improve both the physical environment, by designing safer systems, and the mental attitude of offshore personnel to safety.
To continue to improve the safety record of the offshore wind industry the industry must:
• Ensure that senior management is fully committed to safety, including allocating sufficient time and resources to ensure that all activities are as safe as they can be.
• Be rigorous in using the methodologies available and commit the time and resources to designing and planning operation to be safe.
• Execute the activity as planned, not be tempted to “cut corners” or save time by using alternative methods.
• Use good man management techniques to ensure that lines of command, communication and responsibility are clearly understood and that work patterns are varied to combat complacency.
• Learn from experience, both good and bad, and revise plans regularly to improve safety.
Personnel and Training Personnel must be carefully selected and well trained so that they are competent and capable of completing their assigned tasks efficiently and safely. Attracting enough people with the right skills is likely to be a difficult task for two reasons, there are fewer people taking basic secondary school and first degree qualifications in science and engineering subjects and there is competition for skilled workers from the oil and gas industry. A high proportion of basic training is common to both offshore oil and gas and offshore wind and this commonality can provide access to a large pool of personnel capable of working in offshore wind. Bespoke training for specific tasks will be necessary in addition to basic training.
To ensure that there are sufficient numbers of people available to construct and operate offshore wind farms, the offshore wind industry must work with national governments and academic organizations to:
• Promote science and engineering at secondary school level.
• Ensure that undergraduate engineering courses address the requirements of offshore wind.

Overcoming Challenges for the Offshore Wind Industry and Learning from the Oil and Gas Industry Page 159 of 245
• Promote specialist post graduate degrees which teach the detailed engineering associated with the offshore wind energy industry.
• Work with technical colleges to develop training courses for offshore wind farm technicians.
• Work with the oil and gas industry to develop safety training and offshore awareness courses common to both industries.
• Introduce common training standards which are internationally recognized throughout the offshore industries.
• Work to achieve a multinational, multi industry offshore passport scheme which tracks safety training, basic technical training, specialist competency and medical records, to maximize the flexibility in recruiting personnel and minimize the logistics costs when moving staff around different offshore locations.
• Offer competitive remuneration packages.
Market Barriers
There are two areas where market forces may form a barrier to the installation of significant numbers of offshore wind farms in the North Sea:
• Market competition for the resources required to build the wind farms, which may inflate the price of raw materials and components and make them hard to source.
• Competition from other carbon free or carbon neutral energy that can supply power at lower prices and with a higher availability.
Buoyant Offshore Markets Constraining Resources Offshore Oil and Gas Industry If the global offshore oil and gas industry remains buoyant in the period 2012 to 2020 it will compete with the offshore wind industry in a number of ways, as discussed in this report. The competition for resources may come from the development of new oil and gas resources, the redevelopment of existing oil fields (made viable because of high energy prices) and the decommissioning of depleted oil fields. All these activities require vessels, a supply chain and skilled manpower. The development of new fields requires new large high quality castings and forgings (for wellhead equipment) and the market the offshore oil and gas activities create will compete directly with the offshore wind industry. However, since the oil and gas industry does not rely on subsidy and historically the “net present value” of a hydrocarbon asset is more dependent on “time to market” than the development costs, the oil and gas industry is more prepared to pay higher prices for goods and services. This inherent difference in the financial structure of the two industries may put offshore wind at significant disadvantage, increasing the capital cost of offshore wind farms and extending delivery times for key components.

Overcoming Challenges for the Offshore Wind Industry and Learning from the Oil and Gas Industry Page 160 of 245
Onshore Wind Farm Development The offshore wind industry is likely to have to compete with a buoyant onshore wind industry for wind turbines and key technical staff. The global demand will probably be most noticeable from China, India, South American Countries and the USA. Both China and India are particularly important because they currently supply most of the steel and heavy castings and forgings used by the offshore wind industry. China is also dominant in the supply of rare earth magnets and high quality carbon fibre required for large turbine blades, and is becoming increasingly important in the supply of high power semiconductors which are essential for both wind turbines and high voltage DC transmission systems. There will also be an increase in the global demand for copper to build the transmission systems which are essential to move the electrical power from remote windy locations to centers of electrical demand, which will probably significantly increase the price of copper.
It will be interesting to observe how the international supply and demand balances out and whether China and India will use political pressure to favor domestic markets in preference to export markets for key components.
Cost and Risk of Offshore Wind The cost of energy produced by offshore wind farms may be too high to make them economically viable and when this is combined with the perceived risk of higher than predicted maintenance costs, premature failure of major components and grid integration issues. It may make it very difficult to raise the capital required to build offshore wind farms in the North Sea from commercial banks and the equity market. There may be more profitable and less risky alternative ventures available for capital markets to invest in, which may make it hard for offshore wind farms to raise the finance they require and it may increase the cost of capital as the finance industry demands a higher premium on what is perceived to be a high risk investment.
Competing Technologies, Gas, Nuclear, Clean Coal and Other Renewables Sources Although offshore wind is seen to be a good environmentally friendly source of energy, other sectors of both the renewables industry and the more conventional power industry are working to supply competing sources of environmentally friendly electrical energy. There is very little the offshore wind farms can do except compete for customers in an increasingly international market for power. If wind farms cannot compete on price with other sources of environmentally friendly electrical power, then the companies involved have to find ways of producing the power more efficiently and lobby national governments for additional subsidies.
Intermittency, Load Balancing and Energy Storage All wind energy is intermittent at a local level, either because there is very little wind or too much wind for wind turbines to operate. If a locally balanced grid is dependent on substantial quantities of wind energy, the intermittent nature of the supply makes balancing the grid difficult. The intermittency of wind energy makes it less valuable to a regional grid operator, who has to supply standby generation or “spinning reserve”, therefore, wind energy could have a low market value, which can threaten the viability of wind farms.
Possible Mitigation Market Forces The offshore wind industry cannot control global market forces. The market for offshore wind farms, although large, it is not large enough to be able to dominate the global supply of the goods and services it requires. If the peak of the construction phase of the North Sea offshore wind industry coincides with a peak in demand from the oil and gas industry and the construction of large onshore wind farms, then the installed cost of North Sea wind farms is likely to be high, with market forces

Overcoming Challenges for the Offshore Wind Industry and Learning from the Oil and Gas Industry Page 161 of 245
driving up global prices. The only option open to the North Sea industry is to “play the market”, i.e. to schedule to construction activities before or after the anticipated peak in demand for onshore wind turbines and offshore oil and gas activity and to be ready to take advantage of temporary dips in the market which may occur from time to time.
Cost and Risk Part of the cost of offshore wind farms and the associated perceived risk is in the direct control of the offshore wind industry. The industry must design efficient reliable turbines specifically for the marine environment and optimize the mass production of these turbines at realistic prices. The supply of turbines must also be matched with safe, efficient low cost methods of installing and maintaining offshore wind farms.
For the supply of raw materials and components, as noted in Section 0, the offshore wind industry is dependent on market force which it cannot control, but could develop strategies to avoid the high cost peaks in the supply and demand cycle.
Competing Technologies Competitive pressures for competing methods of generating environmentally friendly electrical power are outside the direct control of the offshore wind industry, it can only respond by being as cost effective as possible and ensure that the level of subsidy it receives reflects the strategic importance of having a significant European source of energy, which is relatively independent of global energy politics and economics.
Intermittency, Load Balancing and Energy Storage The offshore wind industry has an advantage over onshore wind, because offshore wind can generally provide power for a higher percentage of time. Further, if offshore wind can be combined with some form of energy storage, so that the supply becomes less intermittent, then it has a greater market value.
If offshore wind is combined with other sources of energy over a much wider area in a European super grid, then patterns of supply and demand tend to average out. The intermittency becomes less of a problem and the corresponding value of offshore wind energy is higher, however this comes at the cost of building and operating a large scale multinational grid.

Overcoming Challenges for the Offshore Wind Industry and Learning from the Oil and Gas Industry Page 162 of 245
Conclusions and Recommendations
Conclusions
These conclusions and recommendations must be considered in the context of the prerequisite for ensuring safe operations and the EU’s wider energy policy, which has two principle objectives:
• Ensuring security of energy supplies
• Reducing greenhouse gas emissions
The two objectives can be met by a combination of measures including:
• Reducing energy consumption, by being more efficient in our use of energy.
• Reducing the EU’s dependence on imported energy by using internal sources of energy.
• Capturing and storing carbon dioxide and other greenhouse gases produced as a by-product of using hydrocarbon fuels, as an energy source for electricity generation and manufacturing.
• Increasing the proportion of electrical energy generated by nuclear power stations.
• Using renewable energy sources.
• Using carbon neutral sources of energy.
Generating electricity using offshore wind turbines is only one of many possible methods of achieving the EU’s energy policy objectives. Although offshore wind farms have the potential to generate a significant proportion of the EU’s energy requirements in a clean and relatively environmentally friendly way, the power generated by offshore wind farms has to be competitive with other equally environmentally friendly methods of power generation. Power generated from offshore wind has no automatic right to be part of the EU’s future energy mix, it has to earn its place alongside other methods of achieving the improvement in security of supply and reductions in the emission of greenhouse gasses.
The offshore oil and gas industry can and has contributed to the development of the offshore wind industry, many of the engineering and operational principles which the offshore wind industry takes for granted have been developed in the oil and gas industry. There are also key areas in which it makes sense for the both offshore industries to collaborate. However, the oil and gas industry will also compete with the offshore wind industry for resources, especially in the period 2015 t0 2020.
Economics Electricity generated by offshore wind turbines is relatively expensive, probably the most expensive form of electricity generation currently available in significant quantities. To make it commercially viable a comparatively large subsidy is required (approximately €100 per MW hr). Further, the generating capacity is intermittent and often located at a significant distance from centres of demand.
These four factors;
• The requirement for a subsidy
• Expensive electricity
• Intermittent generating capacity
• Located remote from demand
Encapsulate the key challenges for the offshore wind industry.

Overcoming Challenges for the Offshore Wind Industry and Learning from the Oil and Gas Industry Page 163 of 245
The requirement for a subsidy introduces a political dimension, a risk that the subsidy will be withdrawn, which would leave the wind farm operators with a loss-making offshore wind farm and the risk of residual liabilities for decommissioning. The reliance on subsidies and the risk that subsidies might be withdrawn by future governments make it relatively difficult to raise the capital required to build offshore wind farms.
Expensive electricity presents an engineering and technology challenge to be: • better long term value for money. • more reliable. • cheaper to install. • inexpensive to maintain.
The capital cost is directly related to raw material cost, over which wind farm developers have little control, but good design, efficient manufacturing processes and new materials can mitigate against the high cost of raw materials. However, the current supply chain has several possible constrictions which could limit the speed of deployment of wind energy, (as discussed in Section 0) and the shortages could lead to suppliers charging high prices which may make it difficult to reduce the capital cost of offshore wind turbines.
Good design, which takes into account full life costs and does not make short term decisions to reduce the initial capital cost, can also reduce the long term cost of electricity and reduce risks to personnel by reducing the requirement to carry out repairs and maintenance.
The challenge is to bring the cost of offshore wind energy down to make wind farms viable without subsidy. Adopting many of the methods, practices and procedures developed in the offshore oil and gas industry can help reduce costs, particularly during installation. The natural upward pressure on global energy prices, caused by an increase in demand for energy from rapidly developing countries and finite hydrocarbon reserves will probably make this task less daunting than it currently appears.
Energy produced from wind will always be intermittent, but this can be minimized by locating wind farms in areas of high average wind speed and designing turbines with low cut-in and high cut-out wind speeds, and using geographic diversity and an interconnecting grid to reduce the periods when no wind energy is available.
The areas of high wind resource are generally on the North and West margins of Europe, remote from centres of population. This introduces an additional transmission cost, in both the construction and operation of long distance grids, and potential delays in being able to connect a wind farm to load centres. However, the construction of a large scale Super Grid connecting remote wind farms is an opportunity to address the problem of intermittency by connecting many wind farms together and presenting the grid operator with a less intermittent or firmer electricity supply.
Supply Chain There are different conclusions for different parts of the supply chain, depending on the current and future market conditions, some sections require urgent EU or government intervention, other sections are constrained by international supply and demand, whilst parts of the supply chain are already in place and ready to service the offshore wind industry.
There is an urgent and critical requirement for ports and sheltered harbours with large areas of hard standing, deepwater quays and land on which to build factories to manufacture blades, generators, turbine towers, foundation and piles. Without these facilities it is unlikely that the planned number of

Overcoming Challenges for the Offshore Wind Industry and Learning from the Oil and Gas Industry Page 164 of 245
offshore turbines will be installed in the period 2015 to 2020. A minimum of six yards each with at least six hectares of hard standing will be required by 2015.
There seem to be sufficient vessels either in service or under construction to install foundations and turbines in water depths up to say 45m, and a limited number of vessels capable of working in a water depth of 60m. However, these vessels could equally well service the oil and gas industry, especially in the Southern North Sea, to install new gas platforms and decommission old platforms, so there could be an element of competition for these new vessels.
There is currently an oversupply of supply vessels and tugs and it is likely that these vessels will be able to service permanently manned offshore wind installations in a very similar way to the existing service offered to offshore oil and gas installations.
There will probably be a shortfall in the number of vessels available and capable of installing both within array and export cables. There is a fleet of umbilical and flexible pipe installation vessels working in the oil and gas industry which could install cables, however, these vessels may not be available to the offshore wind industry. There are very few cable lay vessels dedicated to the offshore wind industry and many of these vessels are simple barges which have very limited operational capability and are unlikely to be able to function in the North Sea during the winter months. The shortage of cable installation vessels may cause delays in installing offshore wind farms.
There is a shortfall in manufacturing capacity for offshore electrical cables, particularly in high voltage DC cables and this shortfall is made worse by the current worldwide shortage of copper.
There is a general shortage of supply of wind turbines designed specifically for use offshore, and very few manufacturing facilities close to suitable ports and harbours. New factories to build turbines, towers and foundations close to suitable harbours are urgently required.
The supply chain, particularly for turbines larger than 5MW seems to be quite fragile, there are multiple concerns about the supply of:
• Large casting and forgings, for gears and bearings
• Carbon fibre, for large blades
• Rare earth minerals, for the high power magnets used in generators
• Copper for windings in transformers, generators and cables
• High power semiconductors for power conditioning and control
The offshore wind industry will be in competition with the onshore wind industry for turbines and will be competing for the same limited pool of raw materials and components. Further, turbine manufacturers may prefer to supply their own home onshore markets (particularly in China, India and the USA) before they sell to the more problematic international markets for offshore turbines.
Technology
Turbine design
Onshore wind turbine design has evolved over many early and from disparate designs into a three bladed up wind design, principally because it is considered to be a more pleasing design which generates a less adverse reaction from the public. Turbine blade tip speeds have also been limited to approximately 80 m sec-1 to reduce the noise generated by the turbine to levels which are generally

Overcoming Challenges for the Offshore Wind Industry and Learning from the Oil and Gas Industry Page 165 of 245
felt to be acceptable. Neither of these constraints is valid for wind farms sited many miles from the coastline. The tip speed constraint is being relaxed in some of the new offshore turbines, which allows an onshore turbine to be up-rated by approximately 20% with the same blades and nacelle configuration. However, there has been little evidence of change in the basic 3 bladed upwind configuration, with just a few companies publicizing different configurations of either two or three bladed downwind designs although none of these designs has progressed beyond early prototypes.
Generator design
Although the basic configuration hasn’t changed there has been a divergence in design within the nacelle. The “standard” onshore turbine used a two stage gearbox and an AC induction generator, synchronized to the grid, either mechanically or using a DFIG power control. Turbine manufacturers now offer a range of different generator configuration:
• Direct drive permanent magnet DC generators
• Direct drive induction DC generators
• Single stage gearboxes with DC generators
• Two stage gearboxes and permanent magnet DC generators
The market has not settled on a preferred configuration for use offshore, although there is a general belief that designs with fewer moving parts, i.e. direct drive permanent magnet systems are likely to be more reliable. The key aspects governing reliability of offshore wind turbines seem to be robust design which anticipates all the different loadings (including asymmetric wind loadings) which the turbine will have to withstand adequate and realistic testing in an offshore environment.
Tower design
In a similar way, offshore turbine towers are exclusively tubular structures, a design which was developed for onshore use for aesthetic and environmental reasons, even though tubular towers are not mechanically efficient. This leads to design anomalies where, for example, a lattice foundation structure is connected to a tubular tower by a transition piece, when a simple lattice structure from seabed to nacelle would be more efficient and have fewer stress concentrations.
Blades The technology used to build wind turbine blades has made significant progress, from simple wood composites using aerofoil sections derived from the aircraft industry to single piece mouldings using resin infusion techniques with advanced aerofoil sections specifically designed for wind turbines. However, there is probably room for further improvements in:
• Construction techniques to allow more accurate fibre placement, which could reduce weight and cost.
• The prediction of the visco-elastic properties of composites which might allow the automatic optimization of aerofoil shape and angle of attack with changing wind speed.
• Automation of production processes to reduce costs, increase production speed and the consistency of product.
• The use of new polymers and fibres to improve blade performance and allow more environmentally friendly recycling.
• The development of better more adaptive aerofoil sections to improve energy capture over a wider range of wind speeds and reduce noise emission.

Overcoming Challenges for the Offshore Wind Industry and Learning from the Oil and Gas Industry Page 166 of 245
Grid connection
The way in which power is fed from individual turbines, via intermediate power systems, to the onshore grid, has not developed to a point where one solution is obviously better than any other. In early offshore wind farms, the solution was relatively simple, all the turbines were connected in parallel with the grid and each turbine was grid compliant. Standard transformer systems were then used to increase the voltage to match the grid and reduce transmission losses.
In large offshore wind farms located 100km or more from the grid connection point, DC transmission from the wind farm to the shore becomes the only viable option, (note that this also shifts the point of grid compliance to the grid connection point). A DC export system introduces a series of technical compromises. Power is transmitted more efficiently at high voltages (resistive losses increase with the square of the current), but the most effective way of increasing the voltage is by using AC transformers, however, DC systems are required for long distance transmission. So the topography of the system, ie where the transformers and AC to DC and DC to AC converters are located, is an important design consideration which must take into account electrical losses in cables, transformers and AC/DC conversion systems.
The technical issues which arise from this discussion are:
• The requirement for better high power semiconductors, to reduce the number of components, improve high power switching and filtering devices and reduce losses.
• Better high voltage insulation, particularly in high voltage submarine cables.
• Optimized topographies for the power flows from offshore turbine to grid connection point.
The design of offshore wind farm power systems is further complicated by the requirement to integrate into a European super grid, where the export cable from a wind farm may form part of the super grid and be capable of dispatching power to more than one national grid.
Access and egress
Accessing turbines for maintenance and repair safely and reliably over a wide weather window has often been cited as a significant technical problem. The current practice in many near shore wind farms of using a small high speed personnel transfer vessel and an access ladder, is very unlikely to be a viable long solution for large wind farms in the middle of the North Sea. This system has a very limited operational weather window and requires a “leap of faith” when transferring from vessel to ladder. There seem to be two viable alternative options:
• helicopter access to a platform on the nacelle using a winch wire transfer,
• a dynamically stabilized gangway.
Both these systems are currently in use in offshore wind farms and it is likely that further refinement of both methods will solve the problem of access and egress.
Wider technology issues
In a wider discussion of technology, the offshore wind industry has inherited a wide range of technology originally developed by the offshore oil and gas industry. Almost all of this technology is available in the public domain and can be accessed via a series of specialist contractors. The list of

Overcoming Challenges for the Offshore Wind Industry and Learning from the Oil and Gas Industry Page 167 of 245
technologies is extensive and ranges from advanced engineering design, through vessels and underwater equipment to safety systems, as discussed in detail in Section 0.
The offshore wind industry has often been reluctant to use equipment and operational procedures developed in the offshore oil and gas industry, arguing that it is too expensive and “Gold Plated”. However, operational experience in wind farms being built in deeper water and further from the shore is proving that apparently cheap methods and systems can be very expensive, because they have very limited operational weather windows. The offshore oil and gas industry learnt this lesson in the 1970’s and 1980’s when vessels designed for use in the relatively benign Gulf of Mexico experienced excessive weather down time when operating in the North Sea. This led to the development of vessels and systems which are operational in North Sea conditions all year round. The offshore wind industry needs to be aware that the offshore oil and gas industry is very cost conscious and does not operate vessels and systems which are over specified and more expensive than they need to be and start taking advantage of the tried and tested methods and equipment developed by the offshore oil and gas industry.
Personnel and Training
The ability to recruit well educated, trained, multi skilled and internationally mobile personnel is a fundamental requirement for the offshore wind industry. This requirement has four basic components:
• A European wide education system which provides basic scientific and technical education for technicians and graduate engineers.
• Specialist post graduate courses, dedicated to offshore wind energy.
• Vocational training (including refresher courses) tailored to the offshore wind industry, including safety training and specialist training for the individual disciplines required to design, build, install and operate offshore wind farms.
• Agreed international levels of competence and methods of tracking individuals, certification, qualification and competency.
There is a need to encourage young people to become engineers and scientists, and to establish an internationally recognized modular system of education and training. To maximize the efficiency of the education and training establishments, it is important to recognize cross industry core competencies and where possible to establish courses which are recognized by both the offshore wind industry and the offshore oil and gas industry.
Recommendations
Economics • Ensure that a long term stable subsidy for the electricity produced by offshore wind farms is
sufficient for the power sold to be economically viable to enable further investment throughout the EU.
• Promote technology development to design wind farms: o Which provide better long term value for money o Are more reliable. o Are cheaper to install. o Are inexpensive to maintain.

Overcoming Challenges for the Offshore Wind Industry and Learning from the Oil and Gas Industry Page 168 of 245
• Develop technology and systems for interconnecting geographically dispersed load centers, wind farms and energy storage systems, whilst balancing electrical supply and demand.
• Develop a European “Super Grid” to connect remote offshore wind farms in areas of high average wind speed to areas of high demand.
Supply Chain By 2015 develop at least 6 large port facilities each with:
• At least 350m of deepwater quay space
• A minimum of 6 hectares of hard standing
• Additional areas for factories to build and assemble: o Blades, o Generators, o Turbine towers, o Foundation and piles.
Being aware that there may be competition from the offshore oil and gas industry, monitor the availability of vessels for wind farm installation and promote the building or conversion of vessels to install:
• Foundations,
• Turbine assembles,
• In-field cables,
• Export cables,
• Super grid transmission lines.
Promote the construction of submarine cable manufacturing plants located at the quayside to manufacture:
• In-field cables
• Export cables
• High voltage DC electrical cables
Promote the construction of factories to manufacture, at the six major ports referred to above to:
• Blades,
• Generators,
• Nacelles,
• Tower,
• Foundation.
Monitor the worldwide supply and markets for:
• Large casting and forgings, for gears and bearings,
• Carbon fibre, for large blades,
• Rare earth minerals, for the high power magnets used in generators,
• Copper for windings in transformers, generators and cables,
• High power semiconductors for power conditioning and control.

Overcoming Challenges for the Offshore Wind Industry and Learning from the Oil and Gas Industry Page 169 of 245
Promote the development of European sources of the raw materials and components or alternatives if the raw materials are not available within Europe.
Technology
Turbine design
Promote the development of dedicated marine offshore wind turbines, free of the constraints imposed on onshore turbines.
Develop and agree a protocol for the testing of marine turbines in the marine environment.
Develop and agree a protocol for the long term testing of wind turbine components.
Generator design
Promote the design of new high efficiency, high reliability, and light weight generator designs.
Tower design
Promote the design of cheaper and more mechanically efficient tower designs which are integrated with the turbine foundation to minimize discontinuities and associated fatigue problems.
Blades Promote improvements in:
• Construction techniques to allow more accurate fibre placement, which could reduce weight and cost.
• The prediction of the visco-elastic properties of composites which might allow the automatic optimization of aerofoil shape and angle of attack with changing wind speed.
• Automation of production processes to reduce costs, increase production speed and the consistency of product.
• The use of new polymers and fibres to improve blade performance and allow more environmentally friendly recycling.
• The development of better more adaptive aerofoil sections to improve energy capture over a wider range of wind speeds and reduce noise emission.
Grid connection
Promote the development of better connection topography for offshore wind farms which optimize the trade-off between cost and minimizing electrical losses.
Ensure that overall electrical design of offshore wind farms takes account of the future requirement for integration of wind farms into a European offshore super grid.
Promote the development of:
• Better high power semiconductors, to reduce the number of components, improve high power switching and filtering devices and reduce losses.
• Better high voltage insulation materials, particularly in high voltage submarine cables.

Overcoming Challenges for the Offshore Wind Industry and Learning from the Oil and Gas Industry Page 170 of 245
• Optimized topographies for the power flows from offshore turbine to grid connection point.
Access and egress
Carefully monitor the safety of access and egress in offshore wind farms and not normally manned oil and gas structures by establishing a common database of accidents and near misses which may occur. This will allow both industries to learn and improve methods of access and egress.
Promote the development of safe, all weather, access and egress.
Wider technology issues
Promote awareness that there is a vast amount of tried and tested technology which is freely available from the offshore oil and gas industry.
Dispel the myth that offshore oil and gas technology is expensive, it is no more expensive than it has to be, to complete the task safely over a wide range of weather conditions.
Be aware that although the oil and gas industry can provide technology and experience, it will also compete with the offshore industry for resources, particularly:
• Well trained personnel
• Vessels
• Raw materials
The offshore oil and gas industry has forty or more years of developing offshore safety systems, absorb and adapt these systems and learn from the mistakes which have been made and in particular:
• Do not use divers, use remotely operated technology wherever possible.
• Use vessels which are fit for purpose and can operate over a wide range of weather conditions.
• Use “walk to work” methods of transferring personnel offshore.
Personnel and Training
Promote education, training, and the concept of a multi skilled and internationally mobile offshore work force by:
• To establish an overarching group of trade associations from both the offshore wind and offshore oil and gas industries to coordinate common training standards for personnel working offshore. This should cover both basic offshore competences and basis offshore awareness and specialist skills.
• Encouraging young people to enrol on courses which provide basic scientific and technical education to help develop a supply of technicians and graduate engineers.
• Developing specialist post graduate courses, dedicated to offshore wind energy.
• Encouraging vocational training (including refresher courses) tailored to the offshore industry, including safety training and specialist training for the individual disciplines required to design, build, install and operate offshore wind farms.

Overcoming Challenges for the Offshore Wind Industry and Learning from the Oil and Gas Industry Page 171 of 245
• Agreeing internationally accepted standards of training and competence and methods of tracking individuals, certification, qualification and competency, which are valid in both the offshore wind industry and the offshore oil and gas industry.
Promote a common offshore safety culture led by senior executives, which uses common methods, standards and processes.

Overcoming Challenges for the Offshore Wind Industry and Learning from the Oil and Gas Industry Page 172 of 245
APPENDIX 1 – DETAILED ANALYSIS OF MIND MAP
1.0. Analysis of the Two Industries to Identify Areas of Commonality and Potential Synergies.
To simplify the comparison between offshore oil and gas and offshore wind a common set of high level categories has been used. To a certain extent these categories are “catch alls” and have no significance other than that they allow the diverse strands of each industry to be captured and ordered in a way which makes a comparison easier.
The high level categories are:
• Product
• Manning
• Capitalisation
• Cash flow
• Regulation
• Designs
• Construction & Installation
• Operation and Maintenance
• Abandonment
Each one of these categories has been broken down in multiple levels of sub-categories. There are 521 sub-categories and the resulting mind map is too big to format on A4 paper. A full mind map is available for download from the Power Cluster website http://www.power-cluster.net/
Each item in the mind map has been analyzed and assigned to one of three categories:
Green: There is a clear and obvious synergy between the requirements of the two industries.
Amber: There may be some synergies between the two industries.
Red: There is clearly no synergy between the two industries.
These categories have then been rolled up to the nine top level groups. The resulting mind map is presented in Figure 1 Example Mind Map

Overcoming Challenges for the Offshore Wind Industry and Learning from the Oil and Gas Industry Page 173 of 245
Figure 53 Top Level Mind Map by Group
The grouping process is clearly subjective, however it has input from the four workshops and numerous discussions with representatives from the industry.
There are two simple ways of discussing the results of the analysis:
• To group the greens, ambers and reds from each industry and look for reasons why the match does or does not occur,
• To look at each group in turn and the reasons why they are similar or different.
Both these methods have been used to extract information from the analysis.
1.1. Green Grouping There are five green groups in the oil and gas map and no green groups in the wind map. The green groups in the oil and gas map are:
• Manning
Product
Manning
Capitalisation
Cash flow
Regulation
Designs
Construction & Installation
Maintenance and operation
Abandonment
Product
Manning
Capitalisation
Cash flow
Regulation
Design
Construction & Installation
Maintenance and operation
Abandonment
What Can Offshore Wind Learn from Offshore Oil and Gas?
Wind
Oil & Gas

Overcoming Challenges for the Offshore Wind Industry and Learning from the Oil and Gas Industry Page 174 of 245
• Regulation
• Design
• Construction and installation
• Abandonment
These topics tend to represent areas where oil and gas lead the way and offshore wind is using and adapting what had already been developed.
1.1.1. Manning There is an obvious synergy in the way in which offshore installations are manned and the methods of training offshore workers. This includes a rigorous approach to ensuring that the correct safety culture is in place. The offshore wind industry can use the knowledge base accumulated by the North Sea offshore oil and gas industry to develop their own particular set of requirements which can then be added to a common core of training which covers both industries. The “life style” associated with both industries, working offshore with a period onshore, is likely to appeal to a similar set of people in both industries, and recruitment is also likely to be from similar areas, for example ex-military personnel or young single people. As offshore wind farms get larger and are sited further offshore they will incorporate offshore accommodation, simply because the transit times to and from a shore base become too long. Thus, the “2 weeks on/2 weeks off” cycle is likely to become as normal in offshore wind as it is in offshore oil and gas. Further the methods of transferring personnel on and offshore and supplying the offshore workforce are likely to converge, with helicopter transfer to fixed accommodation platforms being the preferred option and supply boats providing the supply chain for day to day supplies.
The offshore oil and gas supply chain or at least the section which services the basic requirements of offshore installations is in general geared up and waiting to service the offshore wind industry. There is also movement of personnel between the two industries, although the current movement tends to be from the offshore wind industry to the offshore oil and gas industry, principally because the remuneration packages are currently better in oil and gas.
1.1.2. Regulation
Regulation of the oil and gas industry started with very little regulation in place in the 1970’s and has become more sophisticated and effective with time. In general the regulation of the oil and gas industry has been retrospective and driven by events. That is, as it has become apparent that there is a significant problem in some aspect of the offshore oil and gas industry, governments have stepped in and regulated to help rectify the problem. This has been particularly true in the area of environment, with regulation brought to bear on, for example; flaring of excess gas, discharged produced water, disposal of drill cuttings, LSA scale in drill pipe and production tubular, and discharge of general waste. There has been a similar evolution in safety regulation, driven by public inquiries (particularly the Cullen Inquiry and report into the Pipe Alpha disaster) and coroner’s reports into fatal accidents.
In a similar way certifying authorities, e.g. DNV, Lloyds, ABS, Germanischer Lloyd, etc, most of whom are active in both offshore wind and offshore oil and gas, have established codes and guidance many of which have been incorporated into legislative frameworks.

Overcoming Challenges for the Offshore Wind Industry and Learning from the Oil and Gas Industry Page 175 of 245
Licensing rounds and methods of controlling and taxing oil and gas production have also been developed over the forty or so years offshore oil and gas has been active in the North Sea.
Governments and industry have naturally looked to the regulation in place in oil and gas when thinking about how to frame regulation for the offshore wind industry. Obviously some of the detail is irrelevant, however many of the principles can and have been applied. Much of what can be learnt by offshore wind from offshore oil and gas, by way of regulation has already been transferred, providing offshore wind with an established base from which it can develop its own set of regulations. For example the offshore safety regime in the UK sectors has been adapted from the existing offshore regulation currently enforced in the UK sector and the concept of putting up prescreened blocks of seabed for bid by offshore wind developers follows the model of licensing seabed to bidders in oil and gas exploration rounds.
1.1.3. Design The design of offshore structures in the North Sea started with adaptations of designs which originated from the offshore oil industry in the Gulf of Mexico. These early designs were adapted to the harsher conditions found in the North Sea and many lessons learnt in this process have been incorporated into current offshore design procedures. In parallel with this process of adaptation there has been a concerted effort to improve the understanding of critical design factors, particularly fatigue, and the way in which structural stress is analyzed. The R&D for these fundamental improvements in engineering science has a wider importance to other industries e.g.; aircraft, cars, civil engineering etc. Thus it has been commercially viable to incorporate these improvements in analytical techniques into standard software packages which have become readily available to the offshore wind industry and the engineering community in general.
The metallurgy of steel and its alloys and in particular the processes and procedures involved in welding steel have been studied extensively, partly driven by the offshore oil and gas industry, but also because it has a much wider engineering application. This has led to better steel structures which are stronger, lighter and less prone to fatigue damage. These improvements in the understanding of steel structures and how to build them, have been built into design codes, which have been used to build offshore wind installations and many other structures (ships, bridges, tower blocks, etc)
The corrosion of steel structures, which was initially a problem in North Sea oil and gas installations, has been largely solved by a series of university based projects, often funded jointly by the oil and gas industry and government. It is now possible to design a structure using a combination of corrosion allowances, surface coatings and cathodic protection, either passive using anodes or by using impressed current techniques, so that there are effectively no corrosion issues for the design life of the structure. Most of this work is in the public domain, and there are specialist companies who can model and advise on the best solution for a particular structure.
The North Sea oil and gas industry has also collected a vast quantity of environmental data over the last 40 years, this is mainly metocean data (wind strength and direction, wave height, period and direction), site survey data and seismic data.
The metocean data is of considerable utility when structures are designed; however the wind data probably isn’t sufficiently detailed to be useful for estimating energy yields from offshore wind farms as it is not collected at appropriate heights or with the required accuracy, nor does it contain any

Overcoming Challenges for the Offshore Wind Industry and Learning from the Oil and Gas Industry Page 176 of 245
information on wind shear. Further the very large mass of a typical oil and gas offshore structure disturbs the wind pattern around the rig. Metocean data has been used extensively as a starting point for designing offshore wind farm installations and is often considered sufficient for structural calculations, but a met mast is usually required to collect the detailed wind data required for energy capture analysis. The above presupposes that an oil or gas installation has been built in an area which is considered suitable for a wind farm, which may not be the case.
Site survey data is very useful if it can be recovered from the oil company’s archives. Industry sources suggest that this data is often stored by both the oil company commissioning the work and the survey company who surveyed the site. The survey company normally knows how to recover the data, but it is often unclear who owns the data and whether it can be released since it is not obviously covered by the UK government’s requirement to release seismic and well data. This confusion means that existing site survey data is seldom used.
The deep seismic data, which is core information to the oil and gas industry, has little relevance to offshore wind; however shallow seismic (collected to detect shallow gas pockets which can be very dangerous in the early stages of drilling an oil or gas well) can provide depth and geotechnical information which is very valuable when planning cable routes and piling operations. As yet there is little evidence that this source of information has been tapped by the offshore wind industry. This is probably because of the complex way in which seismic data is collected, owned and licensed. Seismic data is shot by multiple companies for different reasons, it could be commissioned by an oil and gas company, or it could be collected as a speculative venture by a seismic data collection company. In either case the data is likely to be licensed to other oil and gas companies, the licenses are normally for a single company and are not transferable. The situation is further complicated by the level of analysis, the raw field data is of little direct use, it is usually combined or “stacked” to provide a usable, but still unprocessed data in the sense of interpreting the data for signs of oil and gas. This data is then processed, often many times, to search for the presence of oil and/or gas.
There is a further complication in that seismic data in the UK is released under DECCS rules as follows222:
• For the purpose of data release, the start of the confidentiality period is deemed to be the well completion date for well data and the end of the calendar year when data acquisition was completed for seismic data. The relevant confidentiality periods are:
• For data acquired under offshore licences awarded up to and including the 19th round is 4 years.
• For data acquired under offshore licences awarded in the 20th and subsequent rounds is 3 years (or full licence relinquishment).
• For spec seismic data acquired under offshore Exploration licences guidelines are currently in place (subject to annual review) for a 10 year confidentiality period.
Other countries have similar periods of confidentiality, which are intended to strike a balance between protecting the commercial position of the company paying for the seismic survey and the national position of ensuring that oil reserves are exploited.
Data is normally released under licence through CDA (Common Data Access) using a web based system. The net result is that there is no simple way to access the vast amount of data stored which could be valuable to the offshore wind industry and even if it was easy to access, it might be expensive to process the data into a useful form.

Overcoming Challenges for the Offshore Wind Industry and Learning from the Oil and Gas Industry Page 177 of 245
The difficulty of accessing useful seismic data and processing it, seems to have been an active deterrent to the offshore wind industry and it has been simpler, but potentially much more expensive, to commission hydrographic and geotechnical surveys.
Summary
In general the process of design has already been transferred to the offshore wind industry, (with the caveat that most offshore wind installations are not normally manned and don’t carry an inventory of highly flammable material), and has allowed structures to be designed to, for example, withstand the 1 in 100 year storm with a reasonable degree of confidence.
1.1.4. Construction and Installation This is a major topic in its own right with many facets. The oil and gas industry has made many significant improvements to the process of installation of offshore structures since the first offshore installations were completed in the Southern North Sea in the 1960’s and 1970’s 223; most of these improvements are available to the offshore wind industry. However, there is one principle difference between the two industries; the offshore oil and gas industry consists of “one offs”, that is, each installation is different. In contrast, offshore wind will require multiple (hundreds) installations of identical machines. Cost effective multiple installations will require a degree of innovation which was not required in the oil and gas industry because each installation was unique and had a very high unit value which was not seen as a critical cost.
When the potential scale of the North Sea oil and gas industry became apparent in the 1970’s, a combination of large multinational companies and governments combined to establish an infrastructure to enable large offshore platforms, and the associated pipeline networks to be built and installed. This lead to the establishment of several fabrication yards around the North Sea and the construction and installation of approximately 470 platforms224. These platforms have taken several forms, steel jacket structures, concrete gravity base structures, and floating production and storage units used in conjunction with subsea wells and manifolds.
Unfortunately, as the demand for large offshore structures declined, many of the large construction yards were mothballed or sold for housing developments and many of the work force which built the structures have retired or moved on to other occupations.
In addition to fabrication yards, specialist installation vessels were developed, for example heavy lift crane barges, construction vessels, dive support vessels, ROV support vessels, pipelay vessels, cable, flexible and umbilical lay vessels and floatels. These vessels took a number of innovative forms including advanced mono hulled vessels with moon pools and semi submersible vessels, developed to reduce wave induced motion.

Overcoming Challenges for the Offshore Wind Industry and Learning from the Oil and Gas Industry Page 178 of 245
Figure 54 Floatel in Operation: http://www.floatel.se/bilder/gallery/P4270016.JPG
Figure 55 Construction Class Mono Hull: http://www.subsea7.com/cms/files/Seven%20Sisters%20(VSS).pdf

Overcoming Challenges for the Offshore Wind Industry and Learning from the Oil and Gas Industry Page 179 of 245
Figure 56 Maintenance Semi Submersibles
There have also been significant advances in diving techniques. Remotely Operated Vehicles (ROVs) and Autonomous Underwater Vehicles (AUVs) have made underwater work safer and more efficient. Port facilities have been expanded and enhanced, notably in Aberdeen, Montrose, Newcastle, Great Yarmouth and Lowestoft. To service industries an active supply chain has been developed and an associated skilled work force.
All these techniques and services are available to the offshore wind industry and many are being and have been used to install offshore wind farms. For example the installation of the Alpha Ventus wind farm owned jointly by EWE AG, E.ON Climate & Renewables, and Vattenfall Europe Windkraft has six jacket foundations and six steel tripod foundations.
The steel jackets were built by Burntisland Fabrications and although the design of the jackets is innovative and tailored to the requirements of the wind farm, they were built using standard construction techniques by a yard established to service the oil and gas industry and currently operating with a mixed order book, 50% from offshore wind and 50% the oil and gas industry in 2010.225 Thirty similar steel jackets are being constructed for the Vattenfall Ormonde Project along with a steel jacket for the offshore substation. Burntisland Fabrications is also building two substation jackets for the Greater Gabbard project.
The Alfa Ventus project also employed the crane barge Thialf to install the jacket structures, which weigh approximately 500 tonnes 226, this is well within the vessel’s maximum lift capability of 14,200 tonnes.227 It is also evident from the photographs of the lift that they were made at transit draft, i.e. the Thialf was not ballasted down into its normal semi submersible operational mode, indicating that this is a fair weather operation well within the vessel’s capability.

Overcoming Challenges for the Offshore Wind Industry and Learning from the Oil and Gas Industry Page 180 of 245
Figure 57 Thialf Installing a Jacket Structure
The export cable was laid and ploughed by Global Marine Systems, using vessels and ploughs originally developed for the oil and gas industry228. It is clear that the offshore wind industry is benefitting from the technology and capital equipment originally developed for the oil and gas industry. It can be argued that some of the equipment is over specified and too expensive for routine use in the offshore wind industry, however the fact that it is well proven and available is of significant benefit to the early stages of the offshore wind industry.
1.1.5. Abandonment The program of abandonment for the North Sea oil and gas industry is only just gathering momentum, with just a small percentage of platforms either abandoned or in the process of being abandoned. The time line for abandonment has been slipping into the future for over two decades, for several reasons:
• The discovery of relatively small satellite fields which can be tied back to existing platforms,
• Advances in subsea technology including the use of subsea wells, manifolds and flow lines,
• The use of well stimulation to increase the percentage oil or gas recovered from the reservoir,
• Improvements in topside processing techniques, especially the adoption of hydrocyclones to improve the separation of oil and water,
• The general increase in the price of crude oil, which has made continued production at relatively low recovery rates economically viable.

Overcoming Challenges for the Offshore Wind Industry and Learning from the Oil and Gas Industry Page 181 of 245
These factors have lead to significant field life extension programs and in consequence a delay in abandonment of platforms. In effect this means that oil andgas does not have the wealth of experience in abandonment that it has in other areas. However, there has been one notable technology development which has reduced the cost of abandoning fixed structures. The development of effective diamond wire cutting techniques now allows large structures to be economically cut into smaller sections and recovered using moderately sized cranes, thus opening up the market to more vessels.
Further, the development of a castellation cutting technique, which allows cut sections to maintain a degree of lateral stability, has significantly increased the weather window available for decommissioning.229
Figure 58 Castellated Cut
These techniques may well become useful when offshore wind farms are decommissioned, especially when decommissioning substation and accommodation platforms.
1.2. Amber Group There are two in the amber group from the oil and gas sector and six from the offshore wind sector:
Offshore oil and gas:
• Product
• Capitalization
Offshore wind:

Overcoming Challenges for the Offshore Wind Industry and Learning from the Oil and Gas Industry Page 182 of 245
• Manning
• Capitalization
• Cash flow
• Design
• Construction and installation
• Abandonment
These areas represent topics where the learning from offshore oil and gas and vice versa is not as clearly defined.
1.2.1. Product Within the mind map two areas where offshore oil and gas could assist offshore wind were highlighted; Seismic and Drilling. Seismic has already been discussed and revolves around the use of shallow seismic techniques, originally developed for the detection of shallow gas and for geotechnical surveys prior to the installation of structures, pipelines, umbilical or cables. These techniques can obviously be applied to the challenges of installing the structures required for offshore wind, particularly pile driving and trenching and burying cables, both within the array and export cables.
Figure 59 Transition Piece Being Fitted to a Monopile http://www.q7wind.nl/en/nieuws_fotos.asp

Overcoming Challenges for the Offshore Wind Industry and Learning from the Oil and Gas Industry Page 183 of 245
1.2.2. Drilling This is less obvious, but horizontal drilling techniques may be of use on the land fall approaches of export cables, especially where the cables have to pass through environmentally sensitive or heavily used areas, where the ability to drill under the sensitive area may allow planning permission to be granted. Drilling technology may also be useful when installing large monopiles or piling in a hard (rock) seabed or where the noise of pile hammering is unacceptable. The use of large diameter drilling and cementation techniques similar to those used when establishing a casing could also be of significant benefit. Cementation (grouting) techniques have already been used to secure transition pieces to monopile structures230.
1.2.3. Capitalisation This topic appears in both offshore oil and gas and offshore wind. The way in which capital is raised for offshore projects is complex and depends on several factors; the size of the development will determine whether a company can finance the investment itself off its balance sheet, or whether it needs to form a partnership and/or raise money from financial institutions. The current stage of development of the industry, or the corollary, the perceived risk involved in the project, means that more risky projects will attract different investors and demand different rates of return.
The oil and gas industry has been negotiating these kinds of agreements for over forty years and there are well established companies who specialize in brokering deals of this nature. The offshore wind industry has less experience in this area and may be able to learn from the extensive experience in the oil and gas industry. However, there is one significant difference; offshore wind currently depends on financial support from governments in the form of feed-in tariffs or renewable obligation certificates. These production subsidies are often combined with some form of government sponsored institutional investment, e.g. in the UK the Crown Estates is co-investing with others in offshore wind developments. The reliance on government for the financial success of an offshore wind farm changes the risk as perceived by the investment community as a whole. This is in stark contrast to the oil and gas industry large offshore where assets could be fully expensed (paid off) within a few months of product production. Further, the wind and the power sector are more heavily regulated than many industries. Electricity industry rates of returns and pay back times are therefore longer and typically require a twelve year funding package, however the regulations tend to provide stability and avoid the boom and bust cycles experienced by the oil and gas industry.
It may be possible for offshore oil and gas to benefit from new ways of raising capital pioneered by the offshore wind industry. This may be particularly relevant to the North Sea as new reserves get smaller and oil majors divest assets leading to a situation where investment in both mature assets and exploration are controlled by small oil and gas companies with correspondingly smaller balance sheets.
Both industries have to put in place a bond to cover de-commissioning charges and there may be similarities in the way these bonds are financed.
1.2.4. Cash Flow Projects in both industries have to survive relatively long periods of negative cash flow during the planning and consent stages, followed by a short but large negative cash flow during construction, before any positive cash flow is achieved. There may be bidirectional lessons on how to handle the period of negative cash flow and how to balance the negative Net Present Value (NPV) whilst getting the engineering design process refined to a point where construction costs can be minimized and fixed to a point where cost and schedule overruns can be avoided.

Overcoming Challenges for the Offshore Wind Industry and Learning from the Oil and Gas Industry Page 184 of 245
The North Sea offshore oil and gas industry has been working this challenge for approximately forty years and has tried a variety of forms of contracting where the risk and reward is shared. For example the BP Andrew project including the Cyrus tieback is a very good example of risk sharing which brought the project in on budget and on time. 231
Keeping the cash flow under control during the critical construction phase is very important for the overall success of the development. The North Sea offshore oil and gas industry has also developed techniques for managing the interface between companies and how work scopes mesh, with the minimum contractual difficulties. This is often the most difficult part of a development to implement without incurring cost over-runs and delays to the start of productive operations. It would be fair to say that despite the offshore oil and gas industry’s best efforts, no magic formula for getting it right has been derived, although some of the UK and Norwegian procedures for defining the scope of a contract available through Achilles and FPAL are probably the best available
1.2.4. Design There are aspects of design which have been pioneered by the offshore wind industry which could find application in the offshore oil and gas industry, for example the concept of a slender monopile structure has been used by Shell to develop not normally manned gas platforms, Cutter, Shamrock and Caravel in the UK sector and K17, LO9A and LO9B in the Dutch sector of the Southern North Sea. Building six of these more or less identical structures would have opened up the possibility of reducing CAPEX by allowing serial production techniques to be used.
It is possible that as the offshore wind industry matures and gains experience, new designs will emerge which can be transferred to the offshore oil and gas sector. These new designs are likely to be developed in areas of cable handling, both within array cables and export cables. This is likely because offshore wind will have to design systems to accommodate large numbers of cable installations from the seabed to a fixed structure, because current methods using “J” tubes and “hang off” arrangements are likely to be too complex and expensive for the large numbers of transactions required in giga watt wind farms.
1.2.5. Construction and Installation If the predicted number of offshore wind farms is actually built, additional construction vessels will need to be built and commissioned. It is likely that these vessels will be built as multipurpose vessels capable of servicing both the offshore wind industry and the offshore oil and gas industry. The logic behind building multipurpose vessels revolves around the perceived market uncertainly in offshore wind, particularly the reliance on government subsidy to make the farms commercially viable and the relatively short window during which peak construction will occur, currently thought to be 2015 to 2020. Major capital assets, like construction vessels, would normally have a design life of twenty-five years and many will operate much longer than that, so there is natural reluctance on the part of vessel owners to invest in an asset when the perceived market is predicted to peak over a five year period.
Multipurpose vessels will find a market in other industries and in other parts of the world, and this could help the offshore wind industry by ensuring a supply of modern vessels at reasonable charter rates.
In a similar way the extensive marine operation inherent in building large offshore wind farms will provide a valuable pool of experienced operators for the offshore oil and gas industry.

Overcoming Challenges for the Offshore Wind Industry and Learning from the Oil and Gas Industry Page 185 of 245
The expansion of port facilities, very large marshalling yards, storage areas and cranes, which will be required to service the boom in construction of offshore wind, will benefit offshore oil and gas, by providing more choice and better facilities than would have otherwise existed without the capital invested because of offshore wind.
1.2.6. Abandonment Since neither industry has really experienced a significant period of abandonment, there are opportunities for collaboration and sharing the resources required to decommission and abandon both offshore wind and offshore oil and gas. Offshore wind may go through a period of “repowering”, i.e. replacing turbines with more powerful and reliable models in a time scale much shorter than the nominal twenty to twenty-five year design life of wind turbines. This is likely because the early generation of offshore wind turbines was not designed for the offshore environment and the cost of operation may become too high to make the wind farm economically viable. The process of repowering is likely to require the replacement of nacelle and blades, it could also mean replacing the tower and, as a last resort, the foundation and array cables as well. This period of repowering may provide an additional market for the vessels normally employed in the offshore oil and gas market.
1.3. Red Group In this group there is no obvious match between offshore wind and offshore oil and gas. However, care must be exercised not to make sweeping generalizations, because at a detailed level there may be some synergy. For example, there may, at first sight be little commonality between deepwater oil, gas and water separators and the offshore wind industry, but deepwater separators have high energy requirements and the power is delivered from the surface by cables and connectors. The electrical power transmission technology, which has been developed to allow deepwater separation to happen, may have a place in the offshore wind industry, since the power levels are the right order of magnitude (10-50MW) and the requirement to keep seawater out is common.232
From the oil and gas sector, only cash flow is categorized as Red, from the offshore wind industry, Product, Regulation and Maintenance and Operation fall into the red category.
1.3.1. Cash Flow Cash flow profiles are similar for the two industries up to the point of first production, but totally different from there on. Offshore oil and gas is characterized by very high cash flow initially, followed by a steady decline, unless more wells or satellite fields are added to the asset, when the cash flow will dip as the CAPEX phase of the additional wells is executed, followed by a recovery in the cash flow as the wells come on stream.
In contrast, offshore wind farms see a steady cash flow from first production, the value of the cash flow is governed by the natural variation in wind strength from year to year. It is highly regulated by the market for electricity, simply because there is very little storage available for electricity and so electrical power must, by and large, be used as it is produced.
These differences in cash flow, driven by the nature of the primary resource, affect the way in which the two industries are managed. In oil and gas it is usually beneficial in terms of PNV to bring forward production, and to invest in optimizing the production equipment as the nature of the field changes with time. This normally leads to a continuous cycle of maintenance and improvements to the offshore production facility, often executed on an annual basis. In contrast the offshore wind industry favors a “fit and forget” strategy, where the turbines are maintained as infrequently as is

Overcoming Challenges for the Offshore Wind Industry and Learning from the Oil and Gas Industry Page 186 of 245
commensurate with reliable operation, simply because the cost of accessing large numbers of assets which produce relatively small amounts of power is very high and dominates the OPEX cost.
1.3.2. Product Although the product of the two industries is energy, the energy is in very different forms. Electricity is difficult to store and is generally sold as it is produced, oil and gas can easily be stored and sold at a later date. It is therefore possible to stockpile oil and gas if the demand is low and wait for a better price. The differences between offshore oil and gas and offshore wind make synergies in this area less likely.
1.3.3. Regulation The regulatory regimes for the two industries are substantially different. Offshore oil and gas tends to be driven by competition and an open market for the products, which because they can be transported and stored can be sold in any market at any time. The only likely restrictions on the ability to sell oil and gas might be the availability of tankers to transport the oil, or the availability of ullage and agreements on sharing pipeline capacity. Thus the profits of oil companies depend on their ability to control cost and to market and sell their product astutely.
Electrical power, as noted elsewhere, is generally sold as it is produced and it requires an extensive and dedicated transmission and distribution system. This makes it difficult for the electricity supply industry to function as a market because there is only one transmission and distribution system. Thus the supply of electricity tends to become a monopoly and is heavily regulated by governments. Government regulation effectively controls or limits the profits electricity companies can make by trying to balance the conflicting demands of consumers who want the lowest price possible and the electricity industry which needs a profit margin to enable it to reinvest in capital equipment and return an acceptable dividend to its share holders.
The offshore wind industry also has more severe environmental constraints because a wind farm may cover many square kilometers of sea. These concerns focus around the disturbance of sea birds, mammals and fish. There are also restrictions imposed by shipping lanes, the fishing industry and recreational sailors. In general these restrictions don’t apply to the offshore oil and gas industry. However, the offshore oil and gas industry has to comply with a different set of environmental regulations which govern flaring, the disposal of produced water and drill cuttings. There is also significant environmental regulation around an oil spill as the result of previous accidents, for example, the Exxon Valdez233, Braer Shetland oil spill234 and the recent Deepwater Horizon disaster 235. These regulations require oil companies to have adequate contingency plans in place for containment and disposal of any oil spilt.236237
In summary it is difficult to see how the offshore wind industry can learn and benefit from the regulatory regime in place around the offshore oil and gas industry and vice versa.
1.3.4. Maintenance and Operation There are significant differences between the maintenance strategies appropriate to the oil and gas industry and the offshore wind industry. Offshore wind is characterized by large numbers of independent generating units which are relatively difficult to access, requiring access by small boat and ladder, supply vessel and heave compensated dynamic gangway or helicopter. All these methods are weather dependant, expensive and time consuming. Wind turbines should also be relatively “maintenance free” and be equipped with comprehensive and effective remote monitoring and control, so that minor faults can be rectified or bypassed without visiting the turbine. Further, it

Overcoming Challenges for the Offshore Wind Industry and Learning from the Oil and Gas Industry Page 187 of 245
should not be necessary to modify or upgrade (because modifications and upgrades cost money to implement), the wind turbine more than say once during its operational life of perhaps twenty to twenty-five years.
Offshore oil and gas installations are generally permanently manned, with the exception of some of the smaller Southern North Sea and Irish Sea gas platforms. This means that there is crew on hand to carry out routine maintenance. In addition oil and gas platforms are frequently modified to meet the requirements of the changing nature of the product, typically an increase in water cut and to process the product from new wells or subsea tiebacks which may be added to the platform from time to time.
There is little commonality between the maintenance requirements at a strategic level, however there may be significant overlaps at a functional level. Both industries use steel structures in a hostile environment, so there will be commonality in some areas, e.g. structural inspection, cathodic protection and protective coatings. There may also be common areas in electrical equipment, ranging from sensors, through control systems to high power switch gear, motors, generators and cabling, although the “fit and forget strategy” inherent in the offshore wind industry may limit the supply chain opportunities.
Further overlaps occur in health and safety, ports management, weather, wave and current modeling, data storage and management systems, personnel tracking and control of spares.
1.4. Group by Group Comparison Comparing each group from the mind map and asking the question “where are the synergies” is an alternative way of analyzing the information.
1.4.1. Product Although the basic products are both aimed at supplying energy to consumers, they are very different in almost every way. The most likely place where synergy can occur is when offshore oil and gas platforms are powered from the shore in an attempt to reduce carbon emissions, or when the infrastructure is shared by a combined oil and gas and offshore wind development. There are several examples of offshore platforms being supplied from a shore based grid. The Beatrice Field238 in the Moray Firth is one; the Troll platform in the Norwegian sector is another239 . The Beatrice Field is also equipped with two 5MW wind turbines, which offset power taken from the national grid when there is sufficient wind energy available. The Troll field has been designed so that it is possible to connect a wind farm to the cable which is now providing power to the Troll platform and export wind energy back to the shore based grid.
The Ormonde project was also designed to combine an offshore “stranded gas” 240development with a wind farm. The basic concept put forward by Eclipse Energy was to use simple cycle gas turbines to generate electricity offshore and export it to the UK national grid, in parallel a wind farm would be developed and would share the export cable. By varying the output of the gas turbines, the development could dispatch firm power to the grid. Following the takeover of Eclipse Energy by Vattenfall in November 2008,241the wind farm is currently under construction, however, the simple cycle gas turbines are no longer mentioned in the project description242, so presumably Vattenfall have dropped the idea of combining an offshore gas powered generating system with an offshore wind farm.

Overcoming Challenges for the Offshore Wind Industry and Learning from the Oil and Gas Industry Page 188 of 245
From the projects described above synergies can be anticipated in power transmission, subsea cables, transformers, AC/DC transmission systems, switch gear, and methods of installing cables and high power electrical equipment.
1.4.2. Manning Both offshore oil and gas and offshore wind industries will be recruiting from the same pool of candidates, principally engineers and technicians, who will require a similar set of basic qualifications, particularly in the areas of offshore survival training, first aid and safe systems of work including permit to work systems, working to procedures, tool box talks, etc and a general awareness that working offshore is a remote and potentially hostile environment.
Staff will require additional training, some of which will be specific to the industry, but there are areas of commonality, particularly working at height, working with high voltage and high power electrical systems, instruments and electronic control systems supervisory control and data acquisition (SCADA) and programmable logic controller (PLC).
As offshore wind farms get bigger and further offshore, there will be requirement for a supply chain to service the offshore platforms and for catering crews to service the offshore accommodation platforms and crew. These services directly mirror the requirements in the offshore oil and gas industry so there are obvious synergies in these areas, but also competition for staff prepared to work an onshore offshore rota system.
In addition to the offshore crews, a shore based crew will be required to handle the administration and logistics for the offshore wind farms. These “back office” requirements are more or less identical for the two industries.
From the perspective of how to man the offshore wind industry, there are very obvious synergies between the two industries, particularly in the area of recruitment and basic training. This may also lead to competition between the two industries for the available pool of skilled people.
1.4.3. Capitalisation Both offshore oil and gas and offshore wind are highly capital intensive industries which carry a high risk factor through the early stages of development. In oil and gas, the reservoir may not perform as well as expected and in offshore wind there may be extended planning delays, not necessarily with the offshore wind farm, but with the associated “balance of plant”. Particularly sensitive are planning issues for the export cable landfalls and the siting of the onshore transformer or DC to AC converter station. There may also be hold-ups with the grid connection caused by transmission grid constraints.
There are several ways in which the capital can be raised: Large companies may fund the development from their balance sheet and perhaps look for co-investors to share the risk. Capital can be raised through the banks and money markets, but this tends to be expensive, especially in the post 2008/2009 banking crisis. There may also be government grants and “soft loans” available, for the offshore wind industry, designed to increase the proportion of renewable energy in the national energy mix. Money can also be raised by selling equity in the company. In reality all options may be used depending on the size of the farm and the company developing the wind farm.
It is common in both industries for the asset to be sold on at least in part, after the initial high risk stage, to more risk averse investors, the initial investors who took the risk preferring to sell a profitable enterprise at a premium, rather than treat the asset as a long term investment.

Overcoming Challenges for the Offshore Wind Industry and Learning from the Oil and Gas Industry Page 189 of 245
It may be beneficial for the offshore wind industry to study the way in which capital is raised in the oil and gas industry. However capital markets are fluid and it is likely to be the same institutions placing capital in both industries, so there could be an element of competition for capital rather than a synergistic relationship.
1.4.4. Cash flow As already discussed, post construction the cash flows for the two industries are very different. A successful offshore oil and gas development can expect a very high positive cash flow which slowly decreases with time, the risk factors being dominated by the volatile global price of oil. Whilst an offshore wind farm can expect a steady cash flow throughout the asset’s life, with little price volatility.
There seems to be very little synergy in the area of cash flow, except perhaps when an oil or gas asset is nearing the end of field life and the income has dropped to a few percent of the peak cash flow, it may be possible to learn from the offshore wind industry how to continue production with a low but relatively steady cash flow.
1.4.5. Regulation Although it may seem that offshore oil and gas is less regulated than offshore wind, principally because the electricity industry tends to be monopolistic, dictated by the way in which the product is delivered to the customer, there is likely be commonality in several areas, notably; safety, environment, marine equipment, ships, lifting and regulation governing staff, working time directive, offshore accommodation standards etc.
Electricity needs to move closer to oil and be traded as a commodity. Smarter grids with more storage at both large and small scale will enable this to happen by removing the requirement for electricity to be sold at the instant it is generated. This is analogous to the way in which the gas market has evolved, with the development of an international network of gas pipelines, local and national gas storage and international market in gas.
Many of these standards are being transferred automatically and directly from the offshore oil and gas industry (and the more general marine industry) to the offshore wind industry. Where the transfer isn’t totally obvious, existing rules are being used as a basis for new rules in the offshore wind industry. It is vital that this link is maintained and that new rules and regulations aren’t generated for offshore wind for the sake of it, when there are acceptable rules already in existence.
1.4.6. Designs Both industries share a common environment and very similar engineering challenges. The North Sea offshore oil and gas industry has been working and researching this environment for approximately forty years, so the offshore wind industry inherits a lot of learning and experience from offshore oil and gas. Much of the design experience, which ranges from metocean data, through design tools like finite element analysis and fatigue calculations to protective coatings and cathode protection have been incorporated into design tools and procedures which have been adopted by the engineering profession as a whole. When this is combined with the general improvements in material science, particularly the different alloys of steel and associate welding techniques, there is a significant reservoir of information for designers of offshore wind farms to draw on.
This doesn’t mean that all the problems have been solved or that improvements in design can’t be made, but there would be little excuse for repeating some of the mistakes in design made in the early days of the North Sea oil and gas industry.

Overcoming Challenges for the Offshore Wind Industry and Learning from the Oil and Gas Industry Page 190 of 245
In summary there are significant synergies in the design of offshore oil and gas installations and offshore wind farms, however most of the learning from the oil and gas industry has been absorbed into current engineering practice and is available to designers of offshore wind farms.
1.4.7. Construction & Installation The principle difference between the construction of offshore wind farms and offshore oil and gas installations is the number of units installed (a unit being defined as the foundation, tower, nacelle and blades). In oil and gas they are a small number of bespoke units, with a total of about 470 units installed over approximately forty years. A large offshore wind farm may have 200 or more identical units installed and to achieve the EU 2020 renewable energy targets multiple units will have to be installed every day. Typical wind farm units are smaller than many oil and gas installations, with the exception of some of the unmanned gas platforms in the Southern North Sea. The sheer number of units required calls into question the ability of the industry to construct the required number of units within the time span required by the EU targets. The corollary of this is a requirement to expand the number of yards and factories capable of building offshore wind turbine units.
Offshore wind farms have moved further and further offshore, grown in size and are now being installed in deeper water. When the first near shore (less than 10km from the shoreline) wind farms were installed, they were very close to the coast in shallow, sheltered water and they typically consisted of a standard land-based wind turbine on a gravity base structure or a monopole and were installed with flat bottomed barges originally designed for civil engineering work.243
Location Country Foundation Type
Helgoland, DE Gravity
Blekinge, SW Tripod
Vindeby, DK Box caisson
Lely, NL Monopile
Tuno, DK Box caisson
Dronten, NL Monopile
Bockstigen, SW Monopile
Middelgrunden DK Gravity
Nysted DK Gravity
Blyth UK Monopile
Horns Rev DK Monopile
North Hoyle UK Monopile
Scroby Sands UK Monopile
Kentish Flats UK Monopile
Table 16 Offshore Wind Farm Foundation Types 244, 245
The shallow water and proximity to the shore prevented offshore oil and gas industry construction vessels from being used, their operational draft was simply too big, typically 5m to 7.5m draft with a minimum operational draft of 15m.
As the wind turbines increased in size and moved further offshore to deeper water, (approximately 25m and deeper), offshore construction vessels were able to compete in the offshore wind turbine market. For example, as noted elsewhere, the Thialf heavy lift vessel installed jacket structures in the Thornton Bank Wind Farm. Flat bottomed barges are still being used to construct offshore wind

Overcoming Challenges for the Offshore Wind Industry and Learning from the Oil and Gas Industry Page 191 of 245
farms, but they have limited operational weather windows and are therefore likely to be phased out as construction moves into more exposed locations.
Wind farms in less than approximately 25m of water and with turbines of less than about 3.5MW had relatively simple foundations and the construction techniques mirrored onshore wind farms, requiring no more than a standard pile hammer and a tall crane, which was often mounted on a jack-up barge, for example Seacore Excalibur pile hammering foundation during the installation of North Hoyle.
Figure 60 Excalibur Working on North Hoyle
As wind turbines increase in size and they are installed in deeper water, monopole structures become impractical. Their design becomes too heavy, which is expensive and difficult to construct, the cranes required to lift the piles also become large and expensive and there are very few pile hammers available capable of driving the piles to the required depth. Alternative foundation designs have been devised to overcome these problems, i.e. steel jackets and tripods, and concrete gravity bases. Some of these alternative designs have been derived from designs used in the offshore oil and gas industry, although they are smaller and lighter than many of the large Central and Northern North Sea oil and gas structures. However, the dynamic characteristics of a wind turbine are substantially different from an oil and gas installation and for light weight lattice towers the resonant frequencies of both the turbine and the lattice structure have to be carefully considered. This progression is opening up the market to vessels, (equipment and installation techniques) and equipment originally designed for the offshore oil and gas industry. However, there is still significant global competition from the oil and gas industry for these construction assets and market predictions indicate that the surge in construction of offshore wind farms is likely to coincide with the decommissioning of North Sea oil and gas assets and a further round of subsea wells being tied into existing offshore structures.
So where are the synergies in this complex picture? There appear to be multiple synergies in this area:
• disused oil and gas construction yards could be brought back into service,
• existing yards could be modified and expanded for mass production,
• oil and gas offshore construction vessels and equipment could be redeployed into the wind industry especially on the deeper water sites.

Overcoming Challenges for the Offshore Wind Industry and Learning from the Oil and Gas Industry Page 192 of 245
However the timing of the major installation phase of offshore wind may coincide with decommissioning of North Sea platforms and a further round of optimizing production from oil and gas reserves. If this timing is realized it will put offshore oil and gas in direct competition with offshore wind for construction and particularly installation resources.
1.4.8. Maintenance and Operation In many ways the maintenance of offshore wind farms is very different to that for offshore oil and gas installations, where there is generally staff permanently manning the installation. In offshore wind the problems with access and egress dominate maintenance costs. In near shore wind farms the maintenance crew is ferried from the shore on a daily basis, which is time consuming, can be uncomfortable and may leave the maintenance crew feeling sea sick and not able to work as well as they could do. As wind farms get larger and further offshore, the expectation is that staff will be accommodated on fixed platforms and ferried to individual turbines by small boat or helicopter as required. When problems of access and egress are combined with the “fix and forget” minimum maintenance strategies which are likely to be adopted by wind farm operators, it is likely that turbines will only be visited once every three to six months or even longer.
However, if you look at the skill sets, training and people required to maintain both infrastructures, there are a lot of similarities and it may be possible to have basic training common to both industries. It is clear that offshore wind can learn a lot from the experience of offshore oil and gas, particularly in the areas of basic safety training, offshore survival, first aid and safe systems of work.
1.4.9. Abandonment Since neither industry has had to deal with large scale abandonment projects, although that may be imminent for the oil and gas industry, it is likely that by the time offshore wind farms require abandoning or re-powering, there will be significant experience in the offshore oil industry to be able to make a significant contribution to decommissioning and abandonment of offshore wind farms.

Overcoming Challenges for the Offshore Wind Industry and Learning from the Oil and Gas Industry Page 193 of 245
1.5. Summary of the analysis of the initial mind map The analysis indicates that there are several areas of synergy between the two industries. These can be categorized into three general domains:
• Areas where the offshore oil and gas industry has established industry standard practice, a foundation on which the offshore wind industry can build. This is particularly true in the areas of safety, design and materials science.
• Areas where the requirements of the two industries are very similar and coincide, particularly in the 2015 to 2020 period. This is particularly true for the manpower and equipment required to build, maintain, operate and decommission offshore assets. In these areas the two industries are likely to compete for resources, but would undoubtedly benefit from a collaborative approach to establishing basic training for offshore staff, common standards acceptable to both industries, and the establishment of standards in procurement which would apply equally to both supply chains. Building on the base provided by FPAL and Achilles would enable the supply chain to service both industries with the minimum of bureaucratic overhead.
• Areas which are less easily defined, but where an approach to say raising capital in one industry could be used as a template in the other. It may also be possible to persuade governments who are active in both offshore wind and oil and gas industries to “harmonize” regulations to make it simpler for companies to operate in both sectors and across national boundaries This simplification would both reduce costs and reduce a confusion caused by having to be aware of the regulation changes as the operational unit moves from one economic zone to another, or moves from an offshore oil and gas asset to an offshore wind asset.
Exploiting the synergies between the two industries should improve safety:
• by removing confusion caused by multiple sets of similar rules and regulations,
• reducing costs by removing the requirement for multiple sets of qualifications and standards,
• speeding up the deployment of offshore wind by providing a common pool of equipment and people who can work across the two industries and national boundaries.

Overcoming Challenges for the Offshore Wind Industry and Learning from the Oil and Gas Industry Page 194 of 245
APPENDIX 2 - REVIEWED RELEVANT LITERATURE Reviews of documents referred to in section 0 Reviewed Relevant Literature, the documents are listed in order of the date of publication:
Case Study: European Offshore Wind Farms- A Survey to Analyse Experiences and Lessons Learnt by Developers of Offshore Wind Farms. Power Project. By; Gerhard Gerdes (Deutsche WindGuard GmbH), Albrecht Tiedemann (Deutsche Energie-Agentur GmbH (dena)), drs. Sjoerd Zeelenberg (University of Groningen, Faculty of Spatial Planning) Published 2005.
The report details eight offshore wind farms, either in planning, under construction or operational. The report gives a very detailed description of each project and highlights the areas where, in retrospect, the project could have been made more efficient. The report indicates that there are four basic areas which have caused unexpected delays and cost over runs. During the consenting stage, the location, area and number of turbines allowed in the offshore wind farm has been altered, generally the alterations make the wind farms smaller and further from the coast. These changes have caused delays and associated and unnecessary additional cost, which range from re-planning and engineering the layout of the wind farm, to having to execute additional site surveys. The changes may also have had an impact on the economics of the wind farms with fewer turbines and longer export cables. The complexity of the logistics support required to marshal all the components on shore and ship them to the construction site has often been underestimated. Particularly the amounts of lay-down space required to stock and assemble the turbines, towers and foundations. Lack of space and poor logistics have slowed down the rate of installation on several offshore wind farm projects. During the planning of the construction phase, insufficient contingency time has been included for poor weather conditions holding up the installation and commissioning of wind turbines. The lack of contingency has driven several projects into a second season of construction, delaying the completion of the offshore wind farm and causing significant additional costs in addition to the obvious lost revenue. There have been several major technical failures caused by insufficient testing of prototypes in the marine environment and the lack of a coherent series of onshore tests, factory acceptance tests, preload out tests etc. This has caused significant additional work offshore, which as the report suggests is approximately five times more expensive than performing the same work onshore. Although most of these costs have been borne by the manufacturers, they have consequentially lost income for the site owner and this has probably led to increases in turbine cost as manufacturers try to regain a viable profit margin.
POWER - Offshore Wind Supply Chain Study for the East of England: By Douglas Westwood Ltd, June 2005.

Overcoming Challenges for the Offshore Wind Industry and Learning from the Oil and Gas Industry Page 195 of 245
The report paints a picture of a region with significant potential for offshore wind development and real aspirations to develop an industrial base and supply chain to service the offshore wind market. It identifies some existing capability to service the market, but that there is a reliance on companies based outside the region to provide some of the key elements required to build an offshore wind turbine. Figure 4.3 from the report illustrates the challenge as it existed in 2004.
Figure 61 Scroby Sands - UK & East of England Content
The report makes reference to the role of the offshore oil and gas industry in providing a base from which the offshore wind industry can develop, but states that in 2004, the dominant offshore activity in the East of England is servicing the existing offshore oil and gas industry, Further the lack of a “pipeline” of offshore wind projects is hampering the development of the supply chain. The report also includes a detailed market forecast for the North Sea Region for the period 2005 to 2012.
Catalogue of Energy Industry Classifications: Final Report - A report to EEEGR by Douglas-Westwood Limited Report number 326-04 June 2005.
This document provides the basic definitions for the energy industry classifications used in the Mapergy database.
Supply Chain Study on the Danish Offshore Wind Industry, Supply Chain in a Globalized World. POWER Project, By Offshore Center Danmark / AC Consult. August 2005
The report investigates the success of the Danish offshore wind industry and makes recommendations on how the offshore wind industry can remain competitive and a market leader. The report acknowledges the input and experience from the Danish offshore oil and

Overcoming Challenges for the Offshore Wind Industry and Learning from the Oil and Gas Industry Page 196 of 245
gas sector and especially the role of the port of Esbjerg and the co-location of offshore wind energy companies with offshore oil and gas companies. The report also notes that Demark is well placed to supply all the components of an offshore wind warm, but is also able to outsource components from other countries if that is more effective. The report foresees few major problems in expanding to meet global demand. The report makes little mention of the offshore oil and gas industry, but does note that the marine contractors were in general well organised and planned their logistics well.
Regional Offshore Wind Supply Chain Study for Lower-Saxony, Bremen and Schleswig Holstein, as part of the INTERREG IIIB North Sea Project – POWER – University of Flensburg, Logistik-Service-Agentur, Bremerhaven, ipc-project management, Lübeck. October 2005.
This report is an in-depth study of the supply chain in the North East part of Germany. It identifies and catalogues a large number of companies which could supply the offshore wind market, and calculates the size of the potential market and its value to the region. The report also highlights the bottlenecks and potential restrictions on the speed at which offshore wind farms could be installed, which ranges from a slow and bureaucratic planning system, through restrictions in resources, skilled personnel, steel, manufacturing capacity, to docks and harbours. The report does not discuss any of the technical problems associated with offshore wind farms but concentrates on the expansion required in the supply chain to meet the challenge and for the region to maximize the economic benefit. It makes no mention of “learning from the offshore oil and gas industry”.
Regional Council Kop Van Noord-Holland Kop & Munt Interreg Project Power: Pushing Offshore Wind Energy Regions Workpackage 2, Supply Chain Kop Van Noord-Holland Strong Contender For Offshore Wind Farm Maintenance. Published 2006.
This report provides information on what the port of Den Helder needs to do to become a preferred centre for the maintenance of offshore wind farms in the Dutch and German sectors of the North Sea. It works through the procedures inherent in the maintenance of offshore wind farms, from routine maintenance to the replacement of major components and translates them into the facilities and services the port of Den Helder would need to have to make it an attractive place for maintenance to locate and operate from. The report provides a good description of the maintenance requirements for an offshore wind farm, but does not directly refer to any learning that may come from the offshore oil and gas industry, but does refer to the synergies between the two industries, especially in relation to technicians, vessels and port facilities.

Overcoming Challenges for the Offshore Wind Industry and Learning from the Oil and Gas Industry Page 197 of 245
Transnational Offshore Wind Supply Chain Study; Power Project, Douglas-Westwood, May 2006.
This report consists of market and employment forecasts for the offshore wind industry, for the UK, Netherlands, Germany and Denmark. The report concludes that the region has the technical capability to overcome the challenges and cites as evidence the wind farms under construction in the southern North Sea in 2006. The challenges are outlined as Planning, Cost, Risk, Contracting, Financing, Technology, Politics. The report recognises that significant relevant expertise exists in the offshore oil and gas industry and recommends a series of seminars, direct company to company meetings, trade shows and technical publications to promote the transfer of technology. The report lists some of the areas where the learning from offshore oil and gas may be valuable, but does not discuss the issue in detail.
Quick Scan: the state of affairs of offshore wind energy projects in the North Sea region. Final Report. Sjoerd Zeelenberg (ed.) University of Groningen. September 2006
The report summarizes the status of wind farm projects in the North Sea region in 2006. The report is now outdated, since most of the projects envisaged are now built or under construction.
Challenging Offshore Wind: Guiding Experiences from the North Sea Region: A Report about the major challenges and opportunities in the deployment of the offshore wind potential in the North Sea Region. By the University of Groningen; Netherlands; June 2007.
This is a very useful report which collects together in one document the challenges in offshore wind reported in other Power Reports. The report draws a number of very valid conclusions and makes recommendations, many of which are still valid today, approximately four years on from when the report was written. The report doesn’t mention learning from the offshore oil and gas industry, the only place oil and gas is referred to is in the description of the Scroby Sands project, where the authors note that many of the contractors had an oil and gas background.
AREG Strategy Report, Focusing on Marine Renewables. Sunflower Blue Ltd, August 2008.
This report was produced by the author for the Aberdeen Renewable Energy Group and considers ways in which Aberdeen City and Aberdeenshire can promote the transition from an offshore oil and gas based economy to an offshore renewable energy based economy. The report concludes that the principle barriers to the transition are the lack of suitable docks and harbours with sufficient lay-down and marshalling space to allow for efficient assembly and load-out of offshore wind turbines, and the current buoyant nature of the offshore oil and gas industry, which inhibits the oil and gas supply chain from taking up the challenge of offshore wind.

Overcoming Challenges for the Offshore Wind Industry and Learning from the Oil and Gas Industry Page 198 of 245
Offshore Wind Power: Big Challenge, Big Opportunity - Maximising the Environmental, Economic and Security Benefits – Carbon Trust – 14/10/2008.
This is comprehensive report which works through the economics of offshore wind in the context of other potential sources of energy and concludes that the actions required are:
Reduce costs,
Provide developers sufficient returns with an efficient incentive mechanism,
Remove regulatory barriers to deployment,
Government to commit, industry to respond,
Maximise UK benefit,
Lead the change.
Although the report quantifies the effects of various scenarios and concludes that substantial savings could be made, it doesn’t suggest practical methods of actually implementing the changes required. It cites the offshore oil and gas industry as a source of skills and technology, but doesn’t provide any detail on how these skills may be harnessed.
UK Offshore Wind: Staying on Track, Forecasting Offshore Wind Build for the Next Five years, BWEA, written by Garrad Hassan Ltd, no date on the document, but looks to be published in 2009.
This short BWEA report looks at the effect on offshore wind farms in the UK sectors as a result of the 2009 UK budget. The report also considers the effects of the reduction in size of offshore wind farms as they go through the planning and consent process. The report concludes that there is a short fall in construction activity in the 2013 to 2015, which may slow down the rate at which UK Round 3 sites can be built, simply because the offshore construction industry will not invest in the required resources unless it can see continuity of projects coming forward of a sufficiently long period of time to justify the capital investment. The report does not discuss how the offshore oil and gas industry might contribute to or assist the offshore wind industry.
UK Offshore Wind: Charting the Right Course: Scenarios for offshore capital costs for the next five years. BWEA report, written by Garrad Hassan Ltd, no date on the document, but looks like it was published in 2009246.

Overcoming Challenges for the Offshore Wind Industry and Learning from the Oil and Gas Industry Page 199 of 245
The report investigates the capital cost of installing an offshore wind farm from several perspectives;
Historically, what it actually costs to install operational wind farms and the contract prices for wind farms under construction or where contracts to construct have been awarded.
The factors influencing the capital cost of offshore wind farms, which include the competition for turbines from onshore wind farms, commodity prices, the shortfall in wind turbine manufacturing, leading to a seller’s market, higher than forecast actual cost of early wind farms, the shortage of installation vessels, and the cost of insurance, driven by the unreliability of many wind turbines during the warranty period.
The report then models various scenarios for offshore wind farms for the period up to 2015.
The report acknowledges that if the 2020 targets for offshore wind are to be achieved, major investment decisions have to be made now by both the supply chain and the UK government.
The report is comprehensive and acknowledges the role offshore oil and gas can play in reducing the capital cost of offshore wind farms, but also notes that offshore wind will be in competition with offshore oil and gas for resources.
PILOT Report 2009, ‘A Powerful and Effective Partnership’
The annual report of the PILOT oil and gas initiative, this includes the UK’s offshore oil and gas industry safety record, production and investment. It forms a backdrop to the question of how the offshore oil and gas industry can help the offshore wind industry. The offshore wind industry is only mentioned once in the document and that is in the foreword by the then UK Secretary of State for Energy & Climate Change, Ed Miliband MP. The report predicts a steady influx of capital into the offshore oil and gas sector in the years ahead and reports on the latest initiatives in the supply chain code of practice.
Government Response to ‘Offshore Electricity Transmission’ – A further Joint Ofgem/DECC Regulatory Policy Update’ Annex 9, Transmission Owner Special Licence Conditions - URN 09/697 (DECC) & 23i/09 (Ofgem) 23 March 2009
This details the proposed change in UK regulation to allow the UK national grid to operate in the renewable economic zone.
Overview of Great Britain’s Offshore Electricity Transmission Regulatory Regime
JOINT DECC/OFGEM STATEMENT: 17 June 2009 :URN 09D/569 Ofgem ref: 67/09 The document details how the UK government is organizing the offshore transmission system in line with current and future EU directives which restrict the commercial

Overcoming Challenges for the Offshore Wind Industry and Learning from the Oil and Gas Industry Page 200 of 245
arrangements between the owners of the offshore generating asset and the offshore transmission system.247
What does the Round 3 Announcement Mean? Briefing note on offshore wind energy. BWEA, January 2010.
The announcement of the UK round 3 heralds the start of a process which should see the installation of over 32GW in the UK’s Renewable economic zone before 2020, which is a large increase in the size of the potential market. The BWEA lists the major obstacles to Round 3 as “a lack of offshore grid connections, rising productions costs and limited existing supply chain capacity.” The oil and gas industry is only mentioned once and that is in the context of an increase in the use of wind power reducing the reliance on imported oil and gas.
National Renewables Infrastructure Plan Stage 1 and 2 Reports from Scottish Enterprise and Highlands and Islands Enterprise 2010
These two reports identify 11 sites in Scotland which have the potential to produce approximately 750 complete offshore turbines per year to service the North Sea, Irish Sea and Atlantic seaboard of the UK. The reports also notes that approximately £250 million pounds will be required to make these sites into viable construction yards and manufacturing plants. These two reports are the only reports reviewed which work out what will be required and how that requirement might be met although it is confined to a Scottish context.
Offshore Wind Key Facts – Scottish Enterprise – January 2010
This short report presents an overview of the UK’s offshore wind farms and the size and timing of the market. It also breaks down the total cost of the components of an offshore wind farm into percentage of the total life time costs. The document is a useful quick reference document.
EUREC Research Priorities for Renewable Energy Technology by 2020 and Beyond248.
The document reviews the R&D requirements for all sources of renewable energy, the section on offshore wind provides a list of high level topics which wouldn’t surprise anyone closely connected to the industry.

Overcoming Challenges for the Offshore Wind Industry and Learning from the Oil and Gas Industry Page 201 of 245
ENERGY INDUSTRY MARKET FORECASTS - Renewable Energy - 2009--2014 - The Wind Market Scottish Enterprise Energy Team – by AEA Technology249
This is a wide ranging report which includes onshore wind and micro wind, it contains an extensive market survey and prediction of the market size, it also breaks down the market by wind farm component. It concludes that the supply chain opportunities for the UK and Scotland in particular are:
Provision of installation and maintenance vessels.
Cable laying and seabed grid infrastructure.
Manufacture and installation of anchors and platforms O&M contracts for anchors and platforms
Helicopter and other transport and accommodation for far offshore installations
Provision of port facilities
Provision of skilled personnel
Health and Safety
Training and centre’s of excellence The report cites the offshore oil and gas sector as a source of skills and resources which have the ability to fill many of these gaps, but does not consider the potential and significant competition for these skills and resources from an internationally buoyant offshore oil and gas industry.

Overcoming Challenges for the Offshore Wind Industry and Learning from the Oil and Gas Industry Page 202 of 245
APPENDIX 3 – ISO STANDARDS FOR OIL AND GAS
APPENDIX 3 – ISO STANDARDS FOR OIL AND GAS, presents a list of standards which are recognized in the oil and industry. Each standard is backed by an international committee of experts and is only recognized by ISO after extensive research and verification. Many of these standards are relevant to the offshore wind industry and the offshore wind industry should be encouraged to adopt existing standards rather than invent new ones.

Overcoming Challenges for the Offshore Wind Industry and Learning from the Oil and Gas Industry Page 203 of 245
s indust
Sequence Standard and/or project Stage ICS TC
1 4ISO 3183:2007 90.92 75.2 TC 67/SC 2 no
Petroleum and natural gas industries -- Steel pipe for pipeline transportation systems
77.140.75
2 5ISO/NP 3183 10.99 75.2 TC 67/SC 2 no
Petroleum and natural gas industries -- Steel pipe for pipeline transportation systems
77.140.75
3 18ISO/TR 10400:2007 60.6 75.180.10 TC 67/SC 5 no
Petroleum and natural gas industries -- Equations and calculations for the properties of casing, tubing, drill pipe and line pipe used as casing or tubing
4 21ISO 10405:2000 90.2 75.180.10 TC 67/SC 5 no
Petroleum and natural gas industries -- Care and use of casing and tubing
5 22ISO 10407:1993 90.92 75.180.10 TC 67/SC 4 no
Petroleum and natural gas industries -- Drilling and production equipment -- Drill stem design and operating limits
6 23ISO 10407-2:2008 60.6 75.180.10 TC 67/SC 4 no
Petroleum and natural gas industries -- Rotary drilling equipment -- Part 2: Inspection and classification of used drill stem elements
7 24ISO 10407-2:2008/Cor 1:2009 60.6 75.180.10 TC 67/SC 4 no
7 26ISO 10414-1:2008 60.6 75.180.10 TC 67/SC 3 no
Petroleum and natural gas industries -- Field testing of drilling fluids -- Part 1: Water-based fluids
8 28ISO/DIS 10414-2.2 40.6 75.180.10 TC 67/SC 3 no

Overcoming Challenges for the Offshore Wind Industry and Learning from the Oil and Gas Industry Page 204 of 245
Petroleum and natural gas industries -- Field testing of drilling fluids -- Part 2: Oil-based fluids
9 29ISO 10414-2:2002 90.92 75.180.10 TC 67/SC 3 no
Petroleum and natural gas industries -- Field testing of drilling fluids -- Part 2: Oil-based fluids
10 30ISO 10416:2008 60.6 75.1 TC 67/SC 3 no
Petroleum and natural gas industries -- Drilling fluids -- Laboratory testing
75.180.10
11 32ISO 10417:2004 90.92 75.180.10 TC 67/SC 4 no
Petroleum and natural gas industries -- Subsurface safety valve systems -- Design, installation, operation and redress
12 33ISO/NP 10417 10.99 75.180.10 TC 67/SC 4 no
Petroleum and natural gas industries -- Subsurface safety valve systems -- Design, installation, operation and redress
13 35ISO 10418:2003 90.92 75.180.10 TC 67/SC 6 no
Petroleum and natural gas industries -- Offshore production installations -- Analysis, design, installation and testing of basic surface process safety systems
14 36ISO/NP 10418 10.99 75.180.10 TC 67/SC 6 no
Petroleum and natural gas industries -- Offshore production installations -- Analysis, design, installation and testing of basic surface process safety systems
15 38ISO 10418:2003/Cor 1:2008 60.6 75.180.10 TC 67/SC 6 no
15 42ISO 10423:2009 60.6 75.180.10 TC 67/SC 4 no
Petroleum and natural gas industries -- Drilling and production equipment -- Wellhead and christmas tree equipment
16 46ISO 10424-1:2004 90.93 75.180.10 TC 67/SC 4 no

Overcoming Challenges for the Offshore Wind Industry and Learning from the Oil and Gas Industry Page 205 of 245
Petroleum and natural gas industries -- Rotary drilling equipment -- Part 1: Rotary drill stem elements
17 47ISO 10424-2:2007 90.92 75.180.10 TC 67/SC 4 no
Petroleum and natural gas industries -- Rotary drilling equipment -- Part 2: Threading and gauging of rotary shouldered thread connections
18 50ISO 10426-1:2009 60.6 75.02 TC 67/SC 3 no
Petroleum and natural gas industries -- Cements and materials for well cementing -- Part 1: Specification
91.100.10
19
52ISO 10426-1:2009/Cor 1:2010 60.6 91.100.10 TC 67/SC 3
yes
75.02
19 53ISO 10426-2:2003 90.92 91.100.10 TC 67/SC 3 yes
Petroleum and natural gas industries -- Cements and materials for well cementing -- Part 2: Testing of well cements
75.02
20 54ISO/DIS 10426-2 40.6 75.02 TC 67/SC 3 yes
Petroleum and natural gas industries -- Cements and materials for well cementing -- Part 2: Testing of well cements
91.100.10
21
55ISO 10426-2:2003/Cor 1:2006 60.6 75.02 TC 67/SC 3
91.100.10
21 56ISO 10426-2:2003/Amd 1:2005 60.6 91.100.10 TC 67/SC 3
Water-wetting capability testing 75.02
22 57ISO 10426-3:2003 90.93 91.100.10 TC 67/SC 3 yes
Petroleum and natural gas industries -- Cements and materials for well cementing -- Part 3: Testing of deepwater well cement formulations
75.02

Overcoming Challenges for the Offshore Wind Industry and Learning from the Oil and Gas Industry Page 206 of 245
23 58ISO 10426-4:2004 90.93 91.100.10 TC 67/SC 3 yes
Petroleum and natural gas industries -- Cements and materials for well cementing -- Part 4: Preparation and testing of foamed cement slurries at atmospheric pressure
75.02
24 59ISO 10426-5:2004 90.6 75.02 TC 67/SC 3 yes
Petroleum and natural gas industries -- Cements and materials for well cementing -- Part 5: Determination of shrinkage and expansion of well cement formulations at atmospheric pressure
91.100.10
25 60ISO 10426-6:2008 60.6 75.02 TC 67/SC 3 yes
Petroleum and natural gas industries -- Cements and materials for well cementing -- Part 6: Methods for determining the static gel strength of cement formulations
91.100.10
26 62ISO 10427-1:2001 90.93 75.180.10 TC 67/SC 3 yes
Petroleum and natural gas industries -- Equipment for well cementing -- Part 1: Casing bow-spring centralizers
27 63ISO 10427-2:2004 90.6 75.180.10 TC 67/SC 3 yes
Petroleum and natural gas industries -- Equipment for well cementing -- Part 2: Centralizer placement and stop-collar testing
28 64ISO 10427-3:2003 90.93 75.180.10 TC 67/SC 3 yes
Petroleum and natural gas industries -- Equipment for well cementing -- Part 3: Performance testing of cementing float equipment
29 65ISO 10428:1993 90.93 75.180.10 TC 67/SC 4 no
Petroleum and natural gas industries -- Sucker rods (pony rods, polished rods, couplings and sub-couplings) -- Specification
30 67ISO 10431:1993 90.93 75.180.10 TC 67/SC 4 yes
Petroleum and natural gas industries -- Pumping units -- Specification

Overcoming Challenges for the Offshore Wind Industry and Learning from the Oil and Gas Industry Page 207 of 245
31 68ISO 10432:2004 90.92 75.180.10 TC 67/SC 4 no
Petroleum and natural gas industries -- Downhole equipment -- Subsurface safety valve equipment
32 71ISO/NP 10432 10.99 75.180.10 TC 67/SC 4 no
Petroleum and natural gas industries -- Downhole equipment -- Subsurface safety valve equipment
33 74ISO/DIS 10437 40.6 27.04 TC 67/SC 6
Petroleum, petrochemical and natural gas industries -- Steam turbines -- Special-purpose applications
75.180.20
34 75ISO 10437:2003 90.92 75.180.20 TC 67/SC 6 no
Petroleum, petrochemical and natural gas industries -- Steam turbines -- Special-purpose applications
27.04
35 77ISO 10438-1:2007 90.93 75.180.20 TC 67/SC 6 yes
Petroleum, petrochemical and natural gas industries -- Lubrication, shaft-sealing and control-oil systems and auxiliaries -- Part 1: General requirements
36 79ISO 10438-2:2007 90.93 75.180.20 TC 67/SC 6 yes
Petroleum, petrochemical and natural gas industries -- Lubrication, shaft-sealing and control-oil systems and auxiliaries -- Part 2: Special-purpose oil systems
37 82ISO 10438-3:2007 90.93 75.180.20 TC 67/SC 6 yes
Petroleum, petrochemical and natural gas industries -- Lubrication, shaft-sealing and control-oil systems and auxiliaries -- Part 3: General-purpose oil systems
38 83ISO 10438-4:2007 90.93 75.180.20 TC 67/SC 6 yes
Petroleum, petrochemical and natural gas industries -- Lubrication, shaft-sealing and control-oil systems and auxiliaries -- Part 4: Self-acting gas seal support systems

Overcoming Challenges for the Offshore Wind Industry and Learning from the Oil and Gas Industry Page 208 of 245
39 85ISO 10441:2007 90.93 75.180.20 TC 67/SC 6 yes
Petroleum, petrochemical and natural gas industries -- Flexible couplings for mechanical power transmission -- Special-purpose applications
40 88ISO/FDIS 11960 50.2 77.140.75 TC 67/SC 5 yes
Petroleum and natural gas industries -- Steel pipes for use as casing or tubing for wells
75.180.10
41 90ISO 11960:2004 90.92 75.180.10 TC 67/SC 5 yes
Petroleum and natural gas industries -- Steel pipes for use as casing or tubing for wells
77.140.75
42
91ISO 11960:2004/Cor 1:2006 60.6 75.180.10 TC 67/SC 5
77.140.75
42 93ISO 11961:2008 60.6 75.180.10 TC 67/SC 5 yes
Petroleum and natural gas industries -- Steel drill pipe
77.140.75
43
95ISO 11961:2008/Cor 1:2009 60.6 75.180.10 TC 67/SC 5
77.140.75
43 96ISO/DIS 12211 40.2 27.060.30 TC 67/SC 6 yes
Petroleum, petrochemical and natural gas industries -- Spiral plate heat exchangers
75.180.20
44 97ISO/DIS 12212 40.6 27.060.30 TC 67/SC 6 yes
Petroleum, petrochemical and natural gas industries -- Hairpin-type heat exchangers
75.180.20
45 98ISO/NP TS 12489 10.99 75.180.01 TC 67 yes
Petroleum, petrochemical and natural gas industries -- Reliability modelling and calculation of safety systems
75.2
46 99ISO/DIS 12490 40.6 75.2 TC 67/SC 2 yes

Overcoming Challenges for the Offshore Wind Industry and Learning from the Oil and Gas Industry Page 209 of 245
Petroleum and natural gas industries -- Actuation, mechanical integrity and sizing for pipeline valves
47 100ISO/CD 12736 30.6 75.180.10 TC 67/SC 2 no
Petroleum and natural gas industries - Wet thermal insulation coatings for pipelines, flow lines, equipment and subsea structures
25.220.20
48 101ISO/NP TS 12747 10.99 75.2 TC 67/SC 2 yes
Petroleum and natural gas industries -- Pipeline transportation systems -- Recommended practice for pipeline life extension
49 102ISO/DIS 13085 40 75.180.10 TC 67 no
Petroleum and natural gas industries -- Aluminium alloy pipe for use as tubing for wells
77.150.10
50 103ISO/NP 13354 10.99 75.180.10 TC 67/SC 4 no
Petroleum and natural gas industries -- Shallow gas diverter equipment
51 104ISO 13500:2008 60.6 75.180.10 TC 67/SC 3 no
Petroleum and natural gas industries -- Drilling fluid materials -- Specifications and tests
52 107ISO 13500:2008/Cor 1:2009 60.6 75.180.10 TC 67/SC 3
52 108ISO 13500:2008/FDAmd 1 50.2 75.180.10 TC 67/SC 3
Barite 4,1
53 109ISO 13501:2005 90.92 75.180.10 TC 67/SC 3 no
Petroleum and natural gas industries -- Drilling fluids -- Processing systems evaluation
54 110ISO/DIS 13501 40.2 75.180.10 TC 67/SC 3 no
Petroleum and natural gas industries -- Drilling fluids -- Processing systems evaluation
55 111ISO/DIS 13503-1 40.6 75.1 TC 67/SC 3 no

Overcoming Challenges for the Offshore Wind Industry and Learning from the Oil and Gas Industry Page 210 of 245
Petroleum and natural gas industries -- Completion fluids and materials -- Part 1: Measurement of viscous properties of completion fluids
56 112ISO 13503-1:2003 90.92 75.1 TC 67/SC 3 no
Petroleum and natural gas industries -- Completion fluids and materials -- Part 1: Measurement of viscous properties of completion fluids
57 113ISO 13503-1:2003/Cor 1:2005 60.6 75.1 TC 67/SC 3
57 114ISO 13503-2:2006 90.6 75.1 TC 67/SC 3 no
Petroleum and natural gas industries -- Completion fluids and materials -- Part 2: Measurement of properties of proppants used in hydraulic fracturing and gravel-packing operations
58 115ISO 13503-2:2006/Amd 1:2009 60.6 75.1 TC 67/SC 3 no
Addition of Annex B: Proppand specification
59 116ISO 13503-3:2005 90.6 75.1 TC 67/SC 3 no
Petroleum and natural gas industries -- Completion fluids and materials -- Part 3: Testing of heavy brines
60 117ISO 13503-3:2005/Cor 1:2006 60.6 75.1 TC 67/SC 3
60 118ISO 13503-4:2006 90.6 75.1 TC 67/SC 3 no
Petroleum and natural gas industries -- Completion fluids and materials -- Part 4: Procedure for measuring stimulation and gravel-pack fluid leakoff under static conditions
61 119ISO 13503-5:2006 90.6 75.1 TC 67/SC 3 no
Petroleum and natural gas industries -- Completion fluids and materials -- Part 5: Procedures for measuring the long-term conductivity of proppants
62 120ISO/CD 13503-6 30.2 75.1 TC 67/SC 3 no
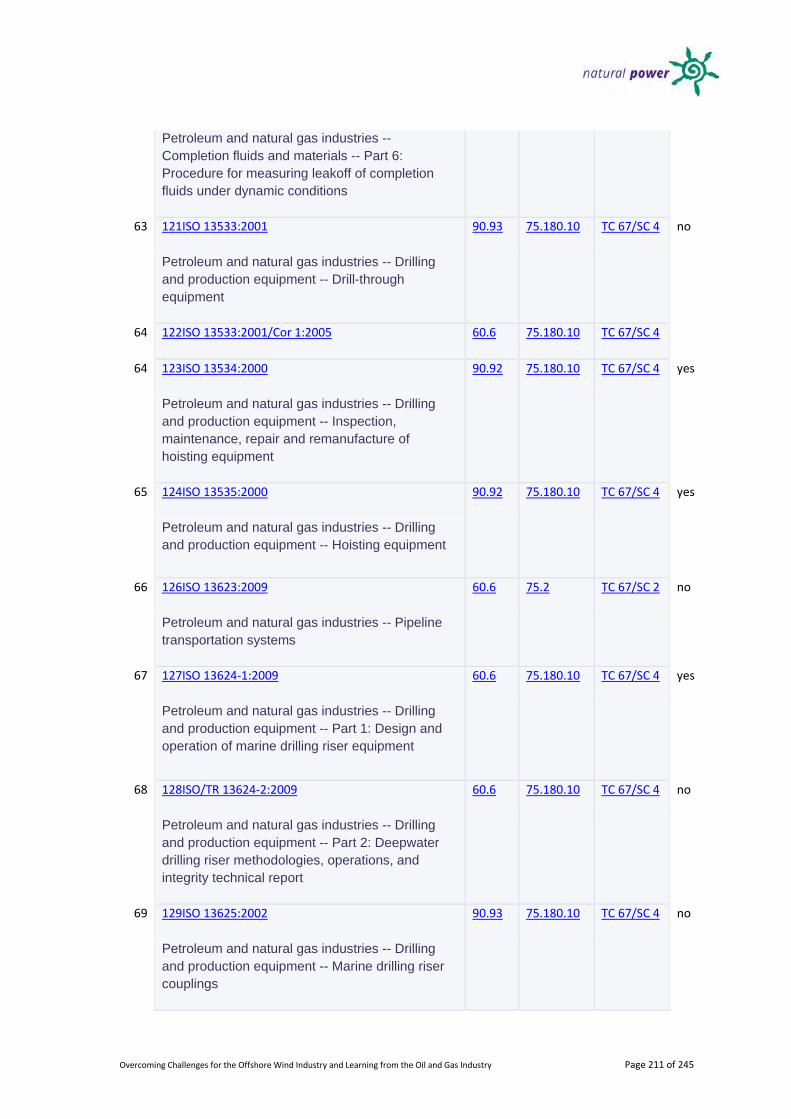
Overcoming Challenges for the Offshore Wind Industry and Learning from the Oil and Gas Industry Page 211 of 245
Petroleum and natural gas industries -- Completion fluids and materials -- Part 6: Procedure for measuring leakoff of completion fluids under dynamic conditions
63 121ISO 13533:2001 90.93 75.180.10 TC 67/SC 4 no
Petroleum and natural gas industries -- Drilling and production equipment -- Drill-through equipment
64 122ISO 13533:2001/Cor 1:2005 60.6 75.180.10 TC 67/SC 4
64 123ISO 13534:2000 90.92 75.180.10 TC 67/SC 4 yes
Petroleum and natural gas industries -- Drilling and production equipment -- Inspection, maintenance, repair and remanufacture of hoisting equipment
65 124ISO 13535:2000 90.92 75.180.10 TC 67/SC 4 yes
Petroleum and natural gas industries -- Drilling and production equipment -- Hoisting equipment
66 126ISO 13623:2009 60.6 75.2 TC 67/SC 2 no
Petroleum and natural gas industries -- Pipeline transportation systems
67 127ISO 13624-1:2009 60.6 75.180.10 TC 67/SC 4 yes
Petroleum and natural gas industries -- Drilling and production equipment -- Part 1: Design and operation of marine drilling riser equipment
68 128ISO/TR 13624-2:2009 60.6 75.180.10 TC 67/SC 4 no
Petroleum and natural gas industries -- Drilling and production equipment -- Part 2: Deepwater drilling riser methodologies, operations, and integrity technical report
69 129ISO 13625:2002 90.93 75.180.10 TC 67/SC 4 no
Petroleum and natural gas industries -- Drilling and production equipment -- Marine drilling riser couplings

Overcoming Challenges for the Offshore Wind Industry and Learning from the Oil and Gas Industry Page 212 of 245
70 130ISO 13626:2003 90.93 75.180.10 TC 67/SC 4 yes
Petroleum and natural gas industries -- Drilling and production equipment -- Drilling and well-servicing structures
71 131ISO/NP 13628-1 10.99 75.180.10 TC 67/SC 4 no
Petroleum and natural gas industries -- Design and operation of subsea production systems -- Part 1: General requirements and recommendations
72 132ISO 13628-1:2005 90.92 75.180.10 TC 67/SC 4 no
Petroleum and natural gas industries -- Design and operation of subsea production systems -- Part 1: General requirements and recommendations
73 134ISO 13628-1:2005/Amd 1:2010 60.6 75.180.10 TC 67/SC 4
Revised Clause 6
74 136ISO 13628-2:2006 90.6 75.180.10 TC 67/SC 4 no
Petroleum and natural gas industries -- Design and operation of subsea production systems -- Part 2: Unbonded flexible pipe systems for subsea and marine applications
75 138ISO 13628-2:2006/Cor 1:2009 60.6 75.180.10 TC 67/SC 4
75 139ISO 13628-3:2000 90.2 75.180.10 TC 67/SC 4 no
Petroleum and natural gas industries -- Design and operation of subsea production systems -- Part 3: Through flow line (TFL) systems
76 140ISO/FDIS 13628-4 50.2 75.180.10 TC 67/SC 4 no
Petroleum and natural gas industries -- Design and operation of subsea production systems -- Part 4: Subsea wellhead and tree equipment
77 141ISO 13628-4:1999 90.92 75.180.10 TC 67/SC 4 no

Overcoming Challenges for the Offshore Wind Industry and Learning from the Oil and Gas Industry Page 213 of 245
Petroleum and natural gas industries -- Design and operation of subsea production systems -- Part 4: Subsea wellhead and tree equipment
78 143ISO 13628-5:2009 60.6 75.180.10 TC 67/SC 4 yes
Petroleum and natural gas industries -- Design and operation of subsea production systems -- Part 5: Subsea umbilical's
79 144ISO 13628-6:2006 90.92 75.180.10 TC 67/SC 4 yes
Petroleum and natural gas industries -- Design and operation of subsea production systems -- Part 6: Subsea production control systems
80 145ISO/NP 13628-6 10.99 75.180.10 TC 67/SC 4 yes
Petroleum and natural gas industries -- Design and operation of subsea production systems -- Part 6: Subsea production control systems
81 147ISO 13628-7:2005 90.92 75.180.10 TC 67/SC 4 no
Petroleum and natural gas industries -- Design and operation of subsea production systems -- Part 7: Completion/workover riser systems
82 148ISO/CD 13628-8 30.6 75.180.10 TC 67/SC 4 yes
Petroleum and natural gas industries -- Design and operation of subsea production systems -- Part 8: Remotely operated tools and interfaces on subsea production systems
83 149ISO 13628-8:2002 90.92 75.180.10 TC 67/SC 4 yes
Petroleum and natural gas industries -- Design and operation of subsea production systems -- Part 8: Remotely Operated Vehicle (ROV) interfaces on subsea production systems
84 150ISO 13628-8:2002/Cor 1:2005 60.6 75.180.10 TC 67/SC 4
84 151ISO 13628-9:2000 90.92 75.180.10 TC 67/SC 4 yes

Overcoming Challenges for the Offshore Wind Industry and Learning from the Oil and Gas Industry Page 214 of 245
Petroleum and natural gas industries -- Design and operation of subsea production systems -- Part 9: Remotely Operated Tool (ROT) intervention systems
85 152ISO 13628-10:2005 90.6 75.180.10 TC 67/SC 4
Petroleum and natural gas industries -- Design and operation of subsea production systems -- Part 10: Specification for bonded flexible pipe
86 153ISO 13628-11:2007 90.2 75.180.10 TC 67/SC 4 no
Petroleum and natural gas industries -- Design and operation of subsea production systems -- Part 11: Flexible pipe systems for subsea and marine applications
87 154ISO 13628-11:2007/Cor 1:2008 60.6 75.180.10 TC 67/SC 4
87 155ISO/NP 13628-12 10.99 75.180.10 TC 67/SC 4 yes
Petroleum and natural gas industries -- Design and operation of subsea production systems -- Part 12: Dynamic production risers
88 156ISO/NP 13628-14 10.99 75.180.10 TC 67/SC 4 no
Petroleum and natural gas industries -- Design and operation of subsea production systems -- Part 14: Subsea high integrity pressure protection systems (HIPPS)
89 157ISO/DIS 13628-15 40.6 75.180.10 TC 67/SC 4 yes
Petroleum and natural gas industries -- Design and operation of subsea production systems -- Part 15: Subsea structures and manifolds
90 158ISO/DIS 13628-16 40.6 75.180.10 TC 67/SC 4 no
Petroleum and natural gas industries -- Design and operation of subsea production systems -- Part 16: Specification for flexible pipe ancillary equipment
91 159ISO/DIS 13628-17 40.6 75.180.10 TC 67/SC 4 no

Overcoming Challenges for the Offshore Wind Industry and Learning from the Oil and Gas Industry Page 215 of 245
Petroleum and natural gas industries -- Design and operation of subsea production systems -- Part 17: Guidelines for flexible pipe ancillary equipment
92 161ISO/FDIS 13678 50.2 75.180.10 TC 67/SC 5 no
Petroleum and natural gas industries -- Evaluation and testing of thread compounds for use with casing, tubing, line pipe and drill stem elements
93 162ISO 13678:2009 90.92 75.180.10 TC 67/SC 5 no
Petroleum and natural gas industries -- Evaluation and testing of thread compounds for use with casing, tubing, line pipe and drill stem elements
94 164ISO 13678:2000/Cor 1:2005 60.6 75.180.10 TC 67/SC 5
94 165ISO/DIS 13679.2 40.2 75.180.10 TC 67/SC 5 no
Petroleum and natural gas industries -- Procedures for testing casing and tubing connections
75.2
95 166ISO 13679:2002 90.92 75.2 TC 67/SC 5 no
Petroleum and natural gas industries -- Procedures for testing casing and tubing connections
75.180.10
96 168ISO 13680:2010 60.6 75.180.10 TC 67/SC 5 yes
Petroleum and natural gas industries -- Corrosion-resistant alloy seamless tubes for use as casing, tubing and coupling stock -- Technical delivery conditions
77.140.75
97 172ISO 13702:1999 90.92 75.180.10 TC 67/SC 6 yes
Petroleum and natural gas industries -- Control and mitigation of fires and explosions on offshore production installations -- Requirements and guidelines
98 173ISO/NP 13702 10.99 TC 67/SC 6 yes

Overcoming Challenges for the Offshore Wind Industry and Learning from the Oil and Gas Industry Page 216 of 245
Petroleum and natural gas industries -- Control and mitigation of fires and explosions on offshore production installations -- Requirements and guidelines
99 174ISO 13703:2000 90.93 75.180.10 TC 67/SC 6 yes
Petroleum and natural gas industries -- Design and installation of piping systems on offshore production platforms
100 175ISO 13703:2000/Cor 1:2002 60.6 75.180.10 TC 67/SC 6
100 176ISO 13704:2007 90.93 75.180.20 TC 67/SC 6 no
Petroleum, petrochemical and natural gas industries -- Calculation of heater-tube thickness in petroleum refineries
101 179ISO 13704:2007/Cor 1:2008 60.6 75.180.20 TC 67/SC 6
101 180ISO 13705:2006 90.92 75.180.20 TC 67/SC 6 no
Petroleum, petrochemical and natural gas industries -- Fired heaters for general refinery service
102 182ISO/NP 13705 10.99 75.180.20 TC 67/SC 6 no
Petroleum, petrochemical and natural gas industries -- Fired heaters for general refinery service
103 184ISO 13706:2005 90.92 75.180.20 TC 67/SC 6 yes
Petroleum, petrochemical and natural gas industries -- Air-cooled heat exchangers
27.060.30
104 185ISO/DIS 13706 40.6 27.060.30 TC 67/SC 6 yes
Petroleum, petrochemical and natural gas industries -- Air-cooled heat exchangers
75.180.20
105 188ISO 13847:2000 90.92 75.2 TC 67/SC 2 yes
Petroleum and natural gas industries -- Pipeline transportation systems -- Welding of pipelines
106 189ISO 13847:2000/Cor 1:2001 60.6 75.2 TC 67/SC 2

Overcoming Challenges for the Offshore Wind Industry and Learning from the Oil and Gas Industry Page 217 of 245
106 190ISO 13879:1999 90.93 75.02 TC 67 yes
Petroleum and natural gas industries -- Content and drafting of a functional specification
107 191ISO 13880:1999 90.93 75.02 TC 67 yes
Petroleum and natural gas industries -- Content and drafting of a technical specification
108 192ISO/TR 13881:2000 90.93 75.08 TC 67 yes
Petroleum and natural gas industries -- Classification and conformity assessment of products, processes and services
75.02
109 193ISO 14224:2006 90.93 75.180.01 TC 67 yes
Petroleum, petrochemical and natural gas industries -- Collection and exchange of reliability and maintenance data for equipment
75.2
110 195ISO 14310:2008 60.6 75.180.10 TC 67/SC 4 no
Petroleum and natural gas industries -- Downhole equipment -- Packers and bridge plugs
111 198ISO 14313:2007 60.6 75.2 TC 67/SC 2 no
Petroleum and natural gas industries -- Pipeline transportation systems -- Pipeline valves
112 199ISO 14313:2007/Cor 1:2009 60.6 75.2 TC 67/SC 2
112 200ISO 14691:2008 60.6 75.180.20 TC 67/SC 6 yes
Petroleum, petrochemical and natural gas industries -- Flexible couplings for mechanical power transmission -- General-purpose applications
113 202ISO 14692-1:2002 90.92 83.140.30 TC 67/SC 6 yes
Petroleum and natural gas industries -- Glass-reinforced plastics (GRP) piping -- Part 1: Vocabulary, symbols, applications and materials
75.2
114 203ISO 14692-2:2002 90.92 83.140.30 TC 67/SC 6 yes

Overcoming Challenges for the Offshore Wind Industry and Learning from the Oil and Gas Industry Page 218 of 245
Petroleum and natural gas industries -- Glass-reinforced plastics (GRP) piping -- Part 2: Qualification and manufacture
75.2
114
204ISO 14692-2:2002/Cor 1:2005 60.6 75.2 TC 67/SC 6
83.140.30
115 205ISO 14692-3:2002 90.92 83.140.30 TC 67/SC 6 yes
Petroleum and natural gas industries -- Glass-reinforced plastics (GRP) piping -- Part 3: System design
75.2
115
206ISO 14692-3:2002/Cor 1:2005 60.6 75.2 TC 67/SC 6
83.140.30
116 207ISO 14692-4:2002 90.92 83.140.30 TC 67/SC 6 yes
Petroleum and natural gas industries -- Glass-reinforced plastics (GRP) piping -- Part 4: Fabrication, installation and operation
75.2
116
208ISO 14692-4:2002/Cor 1:2006 60.6 75.2 TC 67/SC 6
83.140.30
117 209ISO 14693:2003 90.93 75.180.10 TC 67/SC 4 no
Petroleum and natural gas industries -- Drilling and well-servicing equipment
118 210ISO 14723:2009 60.6 75.2 TC 67/SC 2 no
Petroleum and natural gas industries -- Pipeline transportation systems -- Subsea pipeline valves
119 212ISO 15136-1:2009 60.6 75.180.10 TC 67/SC 4 no
Petroleum and natural gas industries -- Progressing cavity pump systems for artificial lift -- Part 1: Pumps
120 214ISO 15136-2:2006 90.6 75.180.10 TC 67/SC 4 no

Overcoming Challenges for the Offshore Wind Industry and Learning from the Oil and Gas Industry Page 219 of 245
Petroleum and natural gas industries -- Progressing cavity pump systems for artificial lift -- Part 2: Surface-drive systems
121 215ISO/NP 15136-3 10.99 75.180.10 TC 67/SC 4 no
Downhole equipment for petroleum and natural gas industries -- Progressing cavity pump systems for artificial lift -- Part 3: Drive strings
122 216ISO 15138:2007 90.93 75.180.10 TC 67/SC 6 yes
Petroleum and natural gas industries -- Offshore production installations -- Heating, ventilation and air-conditioning
123 220ISO 15156-1:2009 60.6 75.180.01 TC 67 no
Petroleum and natural gas industries -- Materials for use in H2S-containing environments in oil and gas production -- Part 1: General principles for selection of cracking-resistant materials
124 223ISO 15156-2:2009 60.6 75.180.01 TC 67 no
Petroleum and natural gas industries -- Materials for use in H2S-containing environments in oil and gas production -- Part 2: Cracking-resistant carbon and low-alloy steels, and the use of cast irons
125 226ISO 15156-3:2009 60.6 75.180.01 TC 67 no
Petroleum and natural gas industries -- Materials for use in H2S-containing environments in oil and gas production -- Part 3: Cracking-resistant CRAs (corrosion-resistant alloys) and other alloys
126 229ISO 15463:2003 90.93 75.180.10 TC 67/SC 5 no
Petroleum and natural gas industries -- Field inspection of new casing, tubing and plain-end drill pipe
127 230ISO 15463:2003/Cor 1:2009 60.6 75.180.10 TC 67/SC 5
127 231ISO/DTR 15464 30.99 75.180.10 TC 67/SC 5 no

Overcoming Challenges for the Offshore Wind Industry and Learning from the Oil and Gas Industry Page 220 of 245
Petroleum and natural gas industries -- Gauging and inspection of casing, tubing and line pipe threads -- Recommended practice
128 232ISO 15544:2000 90.93 75.180.10 TC 67/SC 6
Petroleum and natural gas industries -- Offshore production installations -- Requirements and guidelines for emergency response
128 233ISO 15544:2000/Amd 1:2009 60.6 75.180.10 TC 67/SC 6
129 234ISO 15546:2007 90.92 77.150.10 TC 67 no
Petroleum and natural gas industries -- Aluminium alloy drill pipe
75.180.10
130 236ISO/DIS 15546 40.6 77.150.10 TC 67 no
Petroleum and natural gas industries -- Aluminium alloy drill pipe
75.180.10
131 238ISO 15547-1:2005 90.93 75.180.20 TC 67/SC 6 yes
Petroleum, petrochemical and natural gas industries -- Plate-type heat exchangers -- Part 1: Plate-and-frame heat exchangers
27.060.30
132 239ISO 15547-2:2005 90.93 27.060.30 TC 67/SC 6 yes
Petroleum, petrochemical and natural gas industries -- Plate-type heat exchangers -- Part 2: Brazed aluminium plate-fin heat exchangers
75.180.20
133 240ISO/CD 15551 30 75.180.10 TC 67/SC 4 no
Petroleum and natural gas industries - Downhole equipment - Electric submersible pumps
134 241ISO 15589-1:2003 90.92 75.2 TC 67/SC 2 yes
Petroleum and natural gas industries -- Cathodic protection of pipeline transportation systems -- Part 1: On-land pipelines
135 242ISO/NP 15589-1 10.99 75.2 TC 67/SC 2 yes

Overcoming Challenges for the Offshore Wind Industry and Learning from the Oil and Gas Industry Page 221 of 245
Petroleum and natural gas industries -- Cathodic protection of pipeline transportation systems -- Part 1: On-land pipelines
136 243ISO 15589-2:2004 90.92 75.2 TC 67/SC 2 yes
Petroleum and natural gas industries -- Cathodic protection of pipeline transportation systems -- Part 2: Offshore pipelines
137 244ISO/DIS 15589-2 40.2 75.2 TC 67/SC 2 yes
Petroleum and natural gas industries -- Cathodic protection of pipeline transportation systems -- Part 2: Offshore pipelines
138 246ISO 15590-1:2009 60.6 75.2 TC 67/SC 2 yes
Petroleum and natural gas industries -- Induction bends, fittings and flanges for pipeline transportation systems -- Part 1: Induction bends
139 247ISO/NP 15590-2 10.99 75.2 TC 67/SC 2 yes
Petroleum and natural gas industries -- Induction bends, fittings and flanges for pipeline transportation systems -- Part 2: Fittings
140 248ISO 15590-2:2003 90.92 75.2 TC 67/SC 2 yes
Petroleum and natural gas industries -- Induction bends, fittings and flanges for pipeline transportation systems -- Part 2: Fittings
141 249ISO/NP 15590-3 10.99 75.2 TC 67/SC 2 yes
Petroleum and natural gas industries -- Induction bends, fittings and flanges for pipeline transportation systems -- Part 3: Flanges
142 250ISO 15590-3:2004 90.92 75.2 TC 67/SC 2 yes
Petroleum and natural gas industries -- Induction bends, fittings and flanges for pipeline transportation systems -- Part 3: Flanges
143 251ISO 15649:2001 90.93 75.2 TC 67/SC 6

Overcoming Challenges for the Offshore Wind Industry and Learning from the Oil and Gas Industry Page 222 of 245
Petroleum and natural gas industries -- Piping
144 252ISO 15663-1:2000 90.93 75.02 TC 67 yes
Petroleum and natural gas industries -- Life cycle costing -- Part 1: Methodology
145 253ISO 15663-2:2001 90.93 75.02 TC 67 yes
Petroleum and natural gas industries -- Life-cycle costing -- Part 2: Guidance on application of methodology and calculation methods
146 254ISO 15663-3:2001 90.93 75.02 TC 67 yes
Petroleum and natural gas industries -- Life-cycle costing -- Part 3: Implementation guidelines
147 256ISO 16070:2005 90.93 75.180.10 TC 67/SC 4 no
Petroleum and natural gas industries -- Downhole equipment -- Lock mandrels and landing nipples
148 257ISO/NP TS 16339 10.99 75.180.10 TC 67/SC 4 no
Petroleum and natural gas industry - Well control equipments for HPHT (High Pressure High Temperature) drilling operations
149 258ISO/NP 16441 10.99 75.2 TC 67/SC 2 no
Petroleum and Natural Gas Industries - Pipeline transportation systems - Actuation mechanical integrity and sizing for subsea pipeline valves
150 259ISO 16708:2006 90.93 75.2 TC 67/SC 2 yes
Petroleum and natural gas industries -- Pipeline transportation systems -- Reliability-based limit state methods
151 260ISO 16812:2007 90.92 27.060.30 TC 67/SC 6 yes
Petroleum, petrochemical and natural gas industries -- Shell-and-tube heat exchangers
75.180.20
152 261ISO/CD 16812 30.99 27.060.30 TC 67/SC 6 yes

Overcoming Challenges for the Offshore Wind Industry and Learning from the Oil and Gas Industry Page 223 of 245
Petroleum, petrochemical and natural gas industries -- Shell-and-tube heat exchangers
75.180.20
153 263ISO 17078-1:2004 90.93 75.180.10 TC 67/SC 4 no
Petroleum and natural gas industries -- Drilling and production equipment -- Part 1: Side-pocket mandrels
153 264ISO 17078-1:2004/Amd 1:2010 60.6 75.180.10 TC 67/SC 4
154 265ISO 17078-2:2007 60.6 75.180.10 TC 67/SC 4 no
Petroleum and natural gas industries -- Drilling and production equipment -- Part 2: Flow-control devices for side-pocket mandrels
155 266ISO 17078-2:2007/Cor 1:2009 60.6 75.180.10 TC 67/SC 4
155 268ISO 17078-3:2009 60.6 75.180.10 TC 67/SC 4 no
Petroleum and natural gas industries -- Drilling and production equipment -- Part 3: Running tools, pulling tools and kick-over tools and latches for side-pocket mandrels
156 269ISO 17078-4:2010 60.6 75.180.10 TC 67/SC 4 no
Petroleum and natural gas industries -- Drilling and production equipment -- Part 4: Practices for side-pocket mandrels and related equipment
157 270ISO 17776:2000 90.93 75.180.10 TC 67/SC 6 yes
Petroleum and natural gas industries -- Offshore production installations -- Guidelines on tools and techniques for hazard identification and risk assessment
158 271ISO 17824:2009 60.6 75.180.10 TC 67/SC 4 no
Petroleum and natural gas industries -- Downhole equipment -- Sand screens
159 273ISO 19900:2002 90.6 75.180.10 TC 67/SC 7 yes
Petroleum and natural gas industries -- General requirements for offshore structures

Overcoming Challenges for the Offshore Wind Industry and Learning from the Oil and Gas Industry Page 224 of 245
160 274ISO 19901-1:2005 90.6 75.180.10 TC 67/SC 7 yes
Petroleum and natural gas industries -- Specific requirements for offshore structures -- Part 1: Metocean design and operating considerations
161 275ISO 19901-2:2004 90.6 75.180.10 TC 67/SC 7 no
Petroleum and natural gas industries -- Specific requirements for offshore structures -- Part 2: Seismic design procedures and criteria
162 276ISO/FDIS 19901-3 50.2 75.180.10 TC 67/SC 7 yes
Petroleum and natural gas industries -- Specific requirements for offshore structures -- Part 3: Topsides structure
163 277ISO 19901-4:2003 90.6 75.180.10 TC 67/SC 7 yes
Petroleum and natural gas industries -- Specific requirements for offshore structures -- Part 4: Geotechnical and foundation design considerations
164 278ISO 19901-5:2003 90.6 75.180.10 TC 67/SC 7 yes
Petroleum and natural gas industries -- Specific requirements for offshore structures -- Part 5: Weight control during engineering and construction
165 279ISO 19901-6:2009 60.6 75.180.10 TC 67/SC 7 yes
Petroleum and natural gas industries -- Specific requirements for offshore structures -- Part 6: Marine operations
166 280ISO/DIS 19901-7 40.99 75.180.10 TC 67/SC 7 yes
Petroleum and natural gas industries -- Specific requirements for offshore structures -- Part 7: Station keeping systems for floating offshore structures and mobile offshore units
167 281ISO 19901-7:2005 90.92 75.180.10 TC 67/SC 7 yes

Overcoming Challenges for the Offshore Wind Industry and Learning from the Oil and Gas Industry Page 225 of 245
Petroleum and natural gas industries -- Specific requirements for offshore structures -- Part 7: Station keeping systems for floating offshore structures and mobile offshore units
168 282ISO 19902:2007 60.6 75.180.10 TC 67/SC 7 yes
Petroleum and natural gas industries -- Fixed steel offshore structures
169 283ISO 19903:2006 90.93 75.180.10 TC 67/SC 7 yes
Petroleum and natural gas industries -- Fixed concrete offshore structures
170 284ISO 19904-1:2006 90.93 75.180.10 TC 67/SC 7 yes
Petroleum and natural gas industries -- Floating offshore structures -- Part 1: Monohulls, semi-submersibles and spars
171 285ISO/DIS 19905-1 40.99 75.180.10 TC 67/SC 7 yes
Petroleum and natural gas industries -- Site-specific assessment of mobile offshore units -- Part 1: Jack-ups
172 286ISO/DTR 19905-2 30.92 75.180.10 TC 67/SC 7 yes
Petroleum and natural gas industries -- Site-specific assessment of mobile offshore units -- Part 2: Jack-ups commentary
173 287ISO/FDIS 19906 50.2 75.180.10 TC 67/SC 7 yes
Petroleum and natural gas industries -- Arctic offshore structures
174 288ISO/DIS 20312.2 40.6 75.180.10 TC 67 no
Petroleum and natural gas industries -- Design and operating limits of drill strings with aluminium alloy components
175 289ISO 20815:2008 60.6 75.2 TC 67 yes
Petroleum, petrochemical and natural gas industries -- Production assurance and reliability management
75.180.01

Overcoming Challenges for the Offshore Wind Industry and Learning from the Oil and Gas Industry Page 226 of 245
176 290ISO 21329:2004 90.93 75.2 TC 67/SC 2 no
Petroleum and natural gas industries -- Pipeline transportation systems -- Test procedures for mechanical connectors
177 291ISO 21457:2010 60.6 75.180.01 TC 67 yes
Petroleum, petrochemical and natural gas industries -- Materials selection and corrosion control for oil and gas production systems
178 292ISO/DIS 21809-1.3 40.6 75.2 TC 67/SC 2 yes
Petroleum and natural gas industries -- External coatings for buried or submerged pipelines used in pipeline transportation systems -- Part 1: Polyolefin coatings (3-layer PE and 3-layer PP)
179 293ISO 21809-2:2007 90.92 75.2 TC 67/SC 2 yes
Petroleum and natural gas industries -- External coatings for buried or submerged pipelines used in pipeline transportation systems -- Part 2: Fusion-bonded epoxy coatings
180 294ISO/NP 21809-2 10.99 75.2 TC 67/SC 2 yes
Petroleum and natural gas industries -- External coatings for buried or submerged pipelines used in pipeline transportation systems -- Part 2: Fusion-bonded epoxy coatings
180 295ISO 21809-2:2007/Cor 1:2008 60.6 75.2 TC 67/SC 2
181 296ISO 21809-3:2008 60.6 75.2 TC 67/SC 2 yes
Petroleum and natural gas industries -- External coatings for buried or submerged pipelines used in pipeline transportation systems -- Part 3: Field joint coatings
181 297ISO 21809-3:2008/DAmd 1 40.2 75.2 TC 67/SC 2
182 298ISO 21809-4:2009 60.6 75.2 TC 67/SC 2 yes

Overcoming Challenges for the Offshore Wind Industry and Learning from the Oil and Gas Industry Page 227 of 245
Petroleum and natural gas industries -- External coatings for buried or submerged pipelines used in pipeline transportation systems -- Part 4: Polyethylene coatings (2-layer PE)
183 299ISO 21809-5:2010 60.6 75.2 TC 67/SC 2 yes
Petroleum and natural gas industries -- External coatings for buried or submerged pipelines used in pipeline transportation systems -- Part 5: External concrete coatings
184 300ISO/NP 21809-6 10.99 75.2 TC 67/SC 2 yes
Petroleum and natural gas industries -- External coatings for buried or submerged pipelines used in pipeline transportation systems -- Part 6: Bitumen, asphalt and coal tar coatings
185 301ISO/NP 23251 10.99 75.180.20 TC 67/SC 6 no
Petroleum, petrochemical and natural gas industries -- Pressure-relieving and depressuring systems
186 302ISO 23251:2006 90.93 75.180.20 TC 67/SC 6 no
Petroleum, petrochemical and natural gas industries -- Pressure-relieving and depressuring systems
186 303ISO 23251:2006/Amd 1:2008 60.6 75.180.20 TC 67/SC 6
186 304ISO 23251:2006/Cor 1:2007 60.6 75.180.20 TC 67/SC 6
187 305ISO 23936-1:2009 60.6 75.180.01 TC 67 yes
Petroleum, petrochemical and natural gas industries -- Non-metallic materials in contact with media related to oil and gas production -- Part 1: Thermoplastics
188 306ISO/DIS 23936-2 40.2 75.180.01 TC 67 yes
Petroleum, petrochemical and natural gas industries -- Non-metallic materials in contact with media related to oil and gas production -- Part 2: Elastomers

Overcoming Challenges for the Offshore Wind Industry and Learning from the Oil and Gas Industry Page 228 of 245
189 307ISO/TS 24817:2006 90.93 75.180.20 TC 67/SC 6 yes
Petroleum, petrochemical and natural gas industries -- Composite repairs for pipe work -- Qualification and design, installation, testing and inspection
190 308ISO 25457:2008 60.6 75.180.20 TC 67/SC 6 no
Petroleum, petrochemical and natural gas industries -- Flare details for general refinery and petrochemical service
191 309ISO/TS 27469:2010 60.6 75.180.10 TC 67/SC 6 yes
Petroleum, petrochemical and natural gas industries - Method of test for fire dampers
192 310ISO/CD 27509 30.99 23.040.60 TC 67/SC 6 yes
Petroleum and natural gas industries -- Compact flanged connections
193 311ISO/DIS 27627 40 75.180.10 TC 67 no
Petroleum and natural gas industries -- Aluminium alloy drill pipe thread connection gauging
77.150.10
194 312ISO/NP 28300 10.99 75.180.20 TC 67/SC 6 yes
Petroleum, petrochemical and natural gas industries -- Venting of atmospheric and low-pressure storage tanks
195 313ISO 28300:2008 90.92 75.180.20 TC 67/SC 6 yes
Petroleum, petrochemical and natural gas industries -- Venting of atmospheric and low-pressure storage tanks
195 314ISO 28300:2008/Cor 1:2009 60.6 75.180.20 TC 67/SC 6
196 315ISO/FDIS 28460 50.2 75.2 TC 67 no
Petroleum and natural gas industries -- Installation and equipment for liquefied natural gas -- Ship-to-shore interface and port operations
197 316ISO 28781:2010 60.6 75.180.10 TC 67/SC 4 no

Overcoming Challenges for the Offshore Wind Industry and Learning from the Oil and Gas Industry Page 229 of 245
Petroleum and natural gas industries -- Drilling and production equipment --Subsurface barrier valves and related equipment
198 318ISO/TS 29001:2010 60.6 03.120.10 TC 67 yes
Petroleum, petrochemical and natural gas industries -- Sector-specific quality management systems -- Requirements for product and service supply organizations
75.02
198 102

Overcoming Challenges for the Offshore Wind Industry and Learning from the Oil and Gas Industry Page 230 of 245
APPENDIX 4 – SUPPLY CHAIN REPORTS REVIEWED Supply chain reports reviewed presented in date order:
UK Offshore Wind Report 2010 – Crown Estates Jul-05
POWER Offshore Wind Supply Chain Study for Denmark - Supply Chain in a Globalized World –
Offshore Center Danmark and AC Consult –
Sep-05
POWER Offshore Wind Energy Study For Germany –
Logistik Service Agentur, Universitat Flensburg & ipc Projectmanagement-
Sep-05
Pushing Offshore Wind Energy Regions - Transnational Supply Chain Study –
Douglas Westwood - Jun-06
UK Offshore Wind: Moving up a gear – BWEA – Dec-07
Policy for tomorrow - Issues raised by the Carbon Trust - offshore wind study –
Carbon Trust - Jun-08
Concrete Foundations for Offshore Wind Turbines –
Gifford – Feb-09
UK Ports for the Offshore Wind Industry: Time to Act – Department for Energy and Climate Change (DECC) –
BVG associates Feb-09
Cost of and financial support for offshore wind - Department for Energy and Climate Change (DECC) -
Ernst & Young LLP – Apr-09
Capture Ohio’s Offshore Wind Potential by Partnering with Leaders in Wind Manufacturing - Strategic Business Investment Division -
Ohio Energy Office – Apr-09
Offshore Wind - Dr Keith McLeay - Business Development Manager - Synergies Between Oil & Gas and Renewable Energy Business Breakfast -
Mott MacDonald May-09
Time Line for Wind Generation to 2020 and a Set of Progress Indicators –
Proxy - Jul-09
Competitive Concrete Foundations for Offshore Wind Turbines -
Gifford, Bierrum International –
Jul-09
ENSG ‘Our Electricity Transmission Network: A Vision for 2020’-
Jul-09
UK Offshore Wind: Charting the Right Course - Scenarios for offshore capital costs for the next five years – BWEA –
Garrad Hassan – Jul-09
The UK Carbon Industrial Strategy Executive Summary -
Department for Energy and Climate Change (DECC) –
Jul-09
Offshore Wind Turbine Market Overview - VEN Management – Jul-09
Freds Marine Energy Group (MEG) - Marine Energy Road Map –
Aug-09
Oceans of Opportunity - Harnessing Europe’s largest domestic energy resource -
By the European Wind Energy Association -
Sep-09
Wind Turbine Supply Chain Strategies: 2009-2020 –
Energybiz – Sep-09
PowerPark Demand & Need Report - BVG Associates Ltd Oct-09

Overcoming Challenges for the Offshore Wind Industry and Learning from the Oil and Gas Industry Page 231 of 245
Low Carbon – Offshore Wind - Identification of Expertise and Excellence in New Industry New Jobs (NINJ) Industrial Technologies – technopolis group – Centre for Urban and Regional Development studies –
GHK Nov-09
2010-2013 Supply Chain Assessment – BMT Consultants Feb-10
East of England - Offshore Wind – Powering the Future -
Mar-10
Low carbon innovation cluster an overview of the offshore wind sector, East of England –
East of England Development Agency –
Mar-10
Rebirth of UK Manufacturing - An Opportunity for a World Class Industry–
RenewableUK - Mar-10
The Offshore Valuation - A valuation of the UK’s offshore renewable energy resource -
The Offshore Valuation Group -
May-10
Offshore Wind Challenges and Opportunities – RenewableUK – May-10
WIND TURBINE COMPONENT SUPPLY CHAIN STRATEGIES: 2010-2025-
Emerging Energy Research -
Jun-10
Offshore Wind Energy Supply - Chain Opportunities – Northern Ireland - Carbon Trust -
Garrad Hassan - Jul-10
Scottish Offshore Wind: Creating an Industry - Final Report to Scottish Renewables -
IPA Energy + Water Economics -
Aug-10

Overcoming Challenges for the Offshore Wind Industry and Learning from the Oil and Gas Industry Page 232 of 245
APPENDIX 5 – COMPANIES CONSULTED ON THE MAIN CONCLUSION AND RECOMMENDATIONS
Company
ABB Limited
Beluga Offshore
Clipper Wind Power Marine Ltd
Enspec
Forewind/Stakraft
GE Energy
JRD Cable Systems Ltd
Kongsberg Maritime Ltd
NAREC
nkt Cables GmbH
NSW Cables GmbH
Repower UK Ltd
Schneider Electric Ltd
SeaJacks UK Ltd
Siemens Wind Power SA
Smartest Energy Ltd
ZF Great Britain Ltd

Overcoming Challenges for the Offshore Wind Industry and Learning from the Oil and Gas Industry Page 233 of 245
APPENDIX 6 - REFERENCING DOCUMENTS, IN THE CONTEXT OF THE POWER CLUSTER REPORT
1. Introduction
The question of how to avoid infringing both copyright and confidentiality has arisen in the context of the Power Cluster Report. The aim of the report is to review both the Offshore Oil and Gas Industry and the offshore renewable energy industry (and in particular offshore wind) and suggest ways in which the offshore renewable industry can learn from Offshore Oil and Gas Industry.
In order to compile the report it will be necessary to access and read a wide range of documentation which is in both the public domain and held privately.
Clear guidelines must be established on how to reference the documents used in the review and the level of formal permission which must be obtained before the information can be included in the report.
This document is not intended as a complete guide to copyright, but is the author’s interpretation and suggestion for guidelines, for referencing documents relevant to the Power Cluster Report.
2. Background
For the purposes of this document, there are three different classes of documentation to be considered:
1) Documents on which there is no copyright 2) Documents in the public domain which are subject to copyright 3) Documents not in the public domain
For documents in category 1, there is no problem, they can be freely referred to and reproduced, although it is still good practice to acknowledge the author and source. It is unlikely that the Power Cluster Project will encounter many documents which are out of copyright, most documents will be a few years old and authored by individuals or companies which have an active interest in offshore technology.
The second category is more problematic because:
• The rights of copyright are automatically acquired by anyone who authors a document.
• Copyright doesn’t have to be applied for or registered.
• Copyright is valid for 70 years from the death of the author.
• And because the bulk of the documents which will be required to complete this belong in this category.
It is therefore important to understand how these documents can be used and referenced without infringing copyright.
The third category is even more sensitive, it is essentially privileged information which may have significant commercial value. In this case it is very clear that written permission is required before the information is used in the review and that any restrictions on the use of the information are complied with. It is unlikely that documents of this nature will be used extensively in the Power Cluster Report,

Overcoming Challenges for the Offshore Wind Industry and Learning from the Oil and Gas Industry Page 234 of 245
however if it is felt that there are reports not in the public domain which are very relevant to the Power Cluster Report then the required permission to use the document will be obtained.
3. Copyright In essence copyright is the fair reward for the time and effort which goes into creating the work and prevents someone else from copying the work without seeking the permission of the author. However, there are exceptions or “permitted use” where the general public can use copyright material without the permission of the author.
Of particular interest is “fair dealing” in the UK or “fair use” in the USA. The UK definition of “fair dealing” is much more stringent than the US equivalent of “fair use” and more relevant to the Power Cluster Project.
Fair dealing is defined under the Copyright, Designs and Patents Act 1988 1 within sections 29 and 30.
1. Fair dealing for the purpose of research or private study. (Section 29(1)) 2. Fair dealing for the purpose of criticism or review. (Section 30(1)) 3. Fair dealing for the purpose of reporting current events. (Section 30(2))2
It is arguable that use of copyright material in the Power Cluster Project is fair dealing for the purpose of non-commercial research.
It is also clear that an important part of the Power Cluster Project is a review of the literature and the review may include criticism.
It is unlikely that the Power Cluster project would qualify under “reporting of current events”.
So it is clear that providing the authors of the Power Cluster Report stay within the definitions of “Fair Dealing” for the purposes of non-commercial research and review, permission does not have to be sought from the author.
4. Guidelines 1) If it can be established that the work is free of copyright, then any amount may be copied
and included in the report. The author and publication should be acknowledged, even though this isn’t strictly necessary.
2) If the work is in the public domain and the work is referenced along the line of “Jones and Jones 2006 conclude that …….” But no text or content is copied from Jones and Jones, then the author(s), date and publication should be included in the reference section. Nothing is copied, so there isn’t a copyright issue.
3) If the work is in the public domain and the work is referenced along the lines of “Blogs and Blogs 2007 state that “…………………….” and a section of the document is copied, then it should be clear within the context of the document that it is a quotation, further the included section should be as short as possible and be relevant to the point being made. The copyright material should be acknowledged in the reference section, with the author(s), date, publication and page number.
4) If the work is in the public domain and the work is referenced along the lines of, “the data from Andrews and Andrews 2008 has been re-analysed and forms the basis of the following
1 http://www.opsi.gov.uk/acts/acts1988/UKpga_19880048_en_1.htm 2 http://www.myitlawyer.com/2009/fair-dealing-exceptions-in-uk-copyright-law/

Overcoming Challenges for the Offshore Wind Industry and Learning from the Oil and Gas Industry Page 235 of 245
table/graph”, then it should be clear within the context of the document that the data was originally published by Andrews and Andrews, further the included data should be limited to the re-analysis and relevant to the point being made. The copyright material should be acknowledged in the reference section, with the author(s), date, publication and page number and if practical table or graph number.
5) If the work is not in the public domain then great care should be taken to ensure that the author/owner of the information has given permission to use the information in the Power Cluster Report. The permission should be given in writing in the form of a letter, or email. The owner or author of the information should be acknowledged in the reference, perhaps along the lines of: private correspondence, with the permission of Mr Smith ….. or perhaps the company name.
5. Conclusion Providing that documents and other reference material are used and included within the Power Cluster report in accordance the with the “fair dealing” exceptions allowed within the Copyright, Designs and Patents Act 1988, and that the authors and publications are acknowledged in an appropriate way, there is no need to approach each author for a license to use their work.
The exception is for work which is not in the public domain, where great care must be taken not to breach confidentiality and where explicit permission to use some or all of the information must be gained in writing.
The guidelines set out above represent current practice in both industry and academia and providing they are followed with common sense and integrity there should be no copyright issue when compiling the Power Cluster Report.

Overcoming Challenges for the Offshore Wind Industry and Learning from the Oil and Gas Industry Page 236 of 245
Useful internet sites
There are large numbers of websites which deal with this issue. A goggle search will bring up many thousands of “hits”. The following list of URL’s is by no means exhaustive, but provides some background information for those who wish to study this topic further.
http://sunsite.berkeley.edu/Copyright/
http://www.copyright.gov/fls/fl102.html
http://bubl.ac.uk/Link/c/copyright.htm
http://wapedia.mobi/en/Fair_use?t=9. This is very useful
http://wapedia.mobi/en/Copyright_law_of_the_United_Kingdom#Fair_dealing_and_other_exceptions
http://wapedia.mobi/en/Copyright_law_of_the_United_Kingdom?t=6.#11.
http://www.copyrightservice.co.uk/copyright/p09_fair_use
http://www.copyrightservice.co.uk/copyright/p08_berne_conventionir
http://www.ipo.gov.uk/types/copy/c-other/c-exception.htm
http://www.copyrightservice.co.uk/copyright/p01_uk_copyright_law
http://www.myitlawyer.com/2009/fair-dealing-exceptions-in-uk-copyright-law/ this is well written

Overcoming Challenges for the Offshore Wind Industry and Learning from the Oil and Gas Industry Page 237 of 245
References
1 Subsea compression opens options for stranded deepwater gas: Page 126 Offshore April 2006 • www.offshore-mag.com 2 UK Electricity Generation Costs Update June 2010 - Mott MacDonald - http://www.decc.gov.uk/assets/decc/statistics/projections/71-uk-electricity-generation-costs-update-.pdf
3 Uncertainty estimates in regional and global observed in temperature changes: a new dataset from 1850- P. Brohan, J. J. Kennedy, I. Harris, S. F. B. Tett & P. D. Jones - Accepted version: December 19th 2005 4 This figure was prepared by Robert A. Rohde from publicly available data and is part of the Global Warming Art project. - http://en.wikipedia.org/wiki/File:Greenhouse_Gas_by_Sector.png 5 Informing mitigation - Produced by the Met Office © Crown copyright 2009 09/0456d Met Office and the Met Office logo are registered trademarks 6 The United Nations Framework Convention on Climate Change.. http://unfccc.int/essential_background/convention/background/items/1353.php. Retrieved 15 November 2005. "Such a level should be achieved within a time-frame sufficient to allow ecosystems to adapt naturally to climate change, to ensure that food production is not threatened and to enable economic development to proceed in a sustainable manner" 7 "Kyoto Protocol: Status of Ratification" (PDF). United Nations Framework Convention on Climate Change. 2009-01-14. http://unfccc.int/files/kyoto_protocol/status_of_ratification/application/pdf/kp_ratification.pdf. Retrieved 2009-05-06 8 Texts adopted Other formats Wednesday, 17 December 2008 - Strasbourg Final edition Promotion of the use of energy from renewable sources - http://www.europarl.europa.eu/sides/getDoc.do?type=TA&reference=20081217&secondRef=TOC&language=EN 9 http://ec.europa.eu/climateaction/eu_action/index_en.htm 10 The UK Renewable Energy Strategy - Presented to Parliament by the Secretary of State for Energy and Climate Change by command of Her Majesty - July 2009 - http://www.decc.gov.uk/assets/decc/What%20we%20do/UK%20energy%20supply/Energy%20mix/Renewable%20energy/Renewable%20Energy%20Strategy/1_20090717120647_e_@@_TheUKRenewableEnergyStrategy2009.pdf
11 The UK Renewable Energy Strategy - Presented to Parliament by the Secretary of State for Energy and Climate Change by command of Her Majesty - July 2009 - http://www.decc.gov.uk/assets/decc/What%20we%20do/UK%20energy%20supply/Energy%20mix/Renewable%20energy/Renewable%20Energy%20Strategy/1_20090717120647_e_@@_TheUKRenewableEnergyStrategy2009.pdf
12 The UK Renewable Energy Strategy - Presented to Parliament by the Secretary of State for Energy and Climate Change by command of Her Majesty - July 2009 - http://www.decc.gov.uk/assets/decc/What%20we%20do/UK%20energy%20supply/Energy%20mix/Renewable%20energy/Renewable%20Energy%20Strategy/1_20090717120647_e_@@_TheUKRenewableEnergyStrategy2009.pdf
13 Commission Communication of 7 December 2005 "The support of electricity from renewable energy sources" [COM(2005) 627 final - Official Journal C 49 of 28 February 2006] - http://europa.eu/legislation_summaries/energy/renewable_energy/l24452_en.htm 14 Comparative study on the main renewable mechanisms in European jurisdictions 2010 – CMS - http://www.cmslegal.com/Hubbard.FileSystem/files/Publication/739d7c8c-4b7d-4121-b601-00a8caf4733d/Presentation/PublicationAttachment/4e694621-0a04-4438-bfad-03cbfe5a45a6/CMSLS_07017_Renewable_Energy.pdf 15 Commission Communication of 7 December 2005 "The support of electricity from renewable energy sources" [COM(2005) 627 final - Official Journal C 49 of 28 February 2006] - http://europa.eu/legislation_summaries/energy/renewable_energy/l24452_en.htm 16 http://www.instituteforenergyresearch.org/denmark/Danes_Fact_Sheet.pdf 17 Analysis of Carbon Capture and Storage Cost-Supply Curves for The Uk – Dti - January 2007 - http://webarchive.nationalarchives.gov.uk/+/http://www.berr.gov.uk/files/file36782.pdf 18 Clean Coal Technologies Integrated gasification combined cycle (IGCC) - http://www.iea-coal.org.uk/site/ieacoal_old/clean-coal-technologies-pages/clean-coal-technologies-integrated-gasification-combined-cycle-igcc?

Overcoming Challenges for the Offshore Wind Industry and Learning from the Oil and Gas Industry Page 238 of 245
19 http://www.hse.gov.uk/carboncapture/carbondioxide.htm 20 http://www.electrosynthesis.com/energy-storage.html 21 GRID-CONNECTED SOLAR ENERGY STORAGE USING THE ZINC-BROMINE FLOW BATTERY - Benjamin L. Norris – 2002 - http://www.zbbenergy.com/pdf/technicalpaper_grid.pdf 22 WIND ENERGY THE CASE OF DENMARK – Center for Politiske Studire - http://www.cepos.dk/fileadmin/user_upload/Arkiv/PDF/Wind_energy_-_the_case_of_Denmark.pdf 23 http://www.doc.ic.ac.uk/~matti/ise2grp/energystorage_report/node7.html 24 The Offshore Valuation Group - The Offshore Valuation - A valuation of the UK’s offshore renewable energy resource - http://www.offshorevaluation.org/downloads/offshore_vaulation_full.pdf 25 EWEA, Oceans of Opportunity, September 2009 - http://www.ewea.org/fileadmin/ewea_documents/documents/publications/reports/Offshore_Report_2009.pdf 26 Wind Energy: Action Plan for the new European Commission and Parliament – EWEA - http://www.ewea.org/fileadmin/ewea_documents/documents/publications/briefings/manifesto.pdf 27 BWEA - UK Offshore Wind: Charting the Right Course - Scenarios for offshore capital costs for the next five years – Garrad Hassan Ltd - http://www.bwea.com/pdf/publications/ChartingtheRightCourse.pdf 28 BWEA - UK Offshore Wind: Charting the Right Course - Scenarios for offshore capital costs for the next five years – Garrad Hassan Ltd - http://www.bwea.com/pdf/publications/ChartingtheRightCourse.pdf 29 Wind European Industrial Initiative Team - 2010 – 2012 Implementation Plan - Produced by the TPWind Secretariat May 2010 - http://ec.europa.eu/energy/technology/initiatives/doc/wind_implementation_plan_final.pdf 30 BWEA - UK Offshore Wind: Charting the Right Course - Scenarios for offshore capital costs for the next five years – Garrad Hassan Ltd - http://www.bwea.com/pdf/publications/ChartingtheRightCourse.pdf 31 The Economics of Offshore Wind - Richard Green and Nicholas Vasilakos - Department of Economics, University of Birmingham - http://www.economics.bham.ac.uk/research/2010-discussion/10-20.pdf 32 Wind Energy and Electricity Prices Exploring the ‘merit order effect’ - A literature review by Pöyry for the European Wind Energy Association - http://www.ewea.org/fileadmin/ewea_documents/documents/publications/reports/MeritOrder.pdf 33 Projected Costs of Generating Electricity – 2010 Edition - http://www.iea.org/Textbase/npsum/ElecCost2010SUM.pdf 34 Quarterly Report on European Electricity Markets Jan to March 2010 - http://ec.europa.eu/energy/observatory/electricity/doc/qreem_2010_quarter1.pdf 35 Quarterly Report on European Electricity Markets Jan to March 2010 - http://ec.europa.eu/energy/observatory/electricity/doc/qreem_2010_quarter1.pdf 36 http://www.carboncommentary.com/2010/06/14/1569 37 Firms, the Framework Convention on Climate Change & the EU Emission Trading System – Centre for Sustainability Management – Marcus Wagner - http://www2.leuphana.de/csm/content/nama/downloads/download_publikationen/47-4downloadversion.pdf 38 Wind Energy: Action Plan for the new European Commission and Parliament – EWEA - http://www.ewea.org/fileadmin/ewea_documents/documents/publications/briefings/manifesto.pdf 39 The European offshore wind industry - key trends and statistics 2009 – EWEA January 2010 - http://www.ewea.org/fileadmin/emag/statistics/2009offshore/pdf/offshore%20stats%2020092.pdf 40 The Financing Challenge For Offshore Wind – Sarwjit Sambhi Managing Director, Power Generation Centrica Energy - 22 January 2010 - https://www.centrica.co.uk/files/presentations/2010/20100122/20100122_Nomura_presentation.pdf
41 offshore-technology.com - Spend With Caution: The Post-Recession Oil and Gas Industry – April 2010 - http://www.offshore-technology.com/features/feature81877/ 42 Texts adopted Other formats Wednesday, 17 December 2008 - Strasbourg Final edition Promotion of the use of energy from renewable sources - http://www.europarl.europa.eu/sides/getDoc.do?type=TA&reference=20081217&secondRef=TOC&language=EN 43 http://ec.europa.eu/climateaction/eu_action/index_en.htm 44 Power Exchange Central Europe, http://www.pxenergy.eu/dokument.aspx?k=What-Is-PXE 45 THE ROLE OF ELECTRICITY TRADING AND POWER EXCHANGES FOR THE CONSTRUCTION OF A COMMON EUROPEAN ELECTRICITY MARKET - F.H.Boisseleau, Ph.D Researcher, Delft University ,The Netherlands and Paris Dauphine University, France - http://www.dauphine.fr/cgemp/Publications/Articles/Boisseleau%20(2002)%20role%20of%20electricity%20trading%20and%20power%20exchanges%20.pdf

Overcoming Challenges for the Offshore Wind Industry and Learning from the Oil and Gas Industry Page 239 of 245
46 OFGEM Electricity interconnector policy - Ref: 12/10 - http://www.ofgem.gov.uk/Europe/Documents1/Interconnector%20policy%20consultation.pdf
47 Commission threatens EU power giants - http://www.euractiv.com/en/energy/commission-threatens-eu-power-giants/article-160804 48 The Application of EC Competition Law in the Energy Sector - Ulrich Scholz and Stephan Purps - http://jeclap.oxfordjournals.org/content/1/1/37.full 49 Official Journal of the European Union - L 211- Volume 52 - 14 August 2009 - ISSN 1725-2555 - http://eur-lex.europa.eu/JOHtml.do?uri=OJ:L:2009:211:SOM:EN:HTML 50 OFGEM Electricity interconnector policy - Ref: 12/10 - http://www.ofgem.gov.uk/Europe/Documents1/Interconnector%20policy%20consultation.pdf
51 European Commission - Energising Europe – a real market with secure supply (Third legislative package) - http://ec.europa.eu/energy/gas_electricity/third_legislative_package_en.htm 52 Offshore Wind - Policy and Legislation - Energy Generation & Supply Knowledge Transfer Network - https://ktn.innovateuk.org/c/document_library/get_file?uuid=f8d05e1d-f9ee-423b-8404-b6734e837518&groupId=57391
53 National governments must achieve the EU 20:20:20 renewable energy targets - Written by: Keith Nuttall | 16 January 2009 - http://www.utilityweek.co.uk/features/europe/national-governments-must-achi.php 54 Europe's renewable energy masterplan starts to take shape - BusinessGreen.com Staff, BusinessGreen, 02 Jul 2010 - http://www.businessgreen.com/business-green/news/2265879/europe-renewable-energy-master 55 Renewable Energy Projections as Published in the National Renewable Energy Action Plans of the European Member States - This update covers 19 countries - L.W.M. Beurskens - M. Hekkenberg - ECN-E--10-069 10 September 2010 - http://www.ecn.nl/docs/library/report/2010/e10069.pdf 56 Communication from the Commission to the Council and the European Parliament - The Renewable Energy Progress Report - Commission Report in accordance with Article 3 of Directive 2001/77/EC, Article 4(2) of Directive 2003/30/EC and on the implementation of the EU Biomass Action Plan, COM(2005)628 {SEC(2009) 503 final} - http://eur-lex.europa.eu/LexUriServ/LexUriServ.do?uri=CELEX:52009DC0192:EN:NOT 57 DIRECTIVE 2009/28/EC OF THE EUROPEAN PARLIAMENT AND OF THE COUNCIL of 23 April 2009 - http://eur-lex.europa.eu/LexUriServ/LexUriServ.do?uri=OJ:L:2009:140:0016:0062:en:PDF 58 The 2009 EU Renewables Directive – how binding is ‘binding’? - September 13th, 2010 by Stuart Hohnen, University of Melbourne - http://www.energypolicyblog.com/2010/09/13/the-2009-eu-renewables-directive-%E2%80%93-how-binding-is-%E2%80%98binding%E2%80%99/ 59 The Technical and Legal guide to the UK oil and gas industry – Editors: John Wils and Ewan C Neilson. Aberlour Press - May 2007 – ISBN 978-0-9556223-0-4 60 Successful health and safety management - ISBN 978 0 7176 1276 5 - http://www.lustedconsulting.ltd.uk/hsg65.pdf
61 Cullen, D. (1990) The Public Inquiry into the Piper Alpha Disaster. Department of Energy. London, England: HMSO. 62 Leadership training helps cut accidents in offshore oil and gas industry - http://www.cipd.co.uk/news/_articles/leadership-training-helps-cut-accidents-in-offshore-oil-and-gas-industry.htm
63 http://www.spe.org/twa/print/archives/2010/2010v6n2/07_Technical_Leaders.pdf 64 Department for Business Innovation & Skills website http://www.innovation.gov.uk/rd_scoreboard/?p=17 65 ITI Energy: Mature oil and Gas members’ report 2004, Figure 21 - data from Time to Market Comparators (Source: McKinsey) 66 Danish Wind Turbines Take Unfortunate Turn By William Sweet / November 2004 - http://spectrum.ieee.org/energy/renewables/danish-wind-turbines-take-unfortunate-turn
67 INTEGRATION OF HUMAN FACTORS ENGINEERING INTO DESIGN – AN APPLIED APPROACH - K.P. McSweeney and J. Pray, ABS USA - B.N. Craig, Lamar University, USA - ABS TECHNICAL PAPERS 2009 - http://www.eagle.org/eagleExternalPortalWEB/ShowProperty/BEA%20Repository/References/Technical%20Papers/2009/Integ%20of%20Human%20Factors%20Eng%20into%20Design 68 Complacency has no place, warns HSE’s new head of offshore- Date: 10 September 2009 - Release No: E075:09 - http://www.hse.gov.uk/press/2009/e09075a.htm

Overcoming Challenges for the Offshore Wind Industry and Learning from the Oil and Gas Industry Page 240 of 245
69 The International Maritime - Human Element – Bulletin - Issue No. 16 January 2008 ISSN 1747-5015 - http://www.he-alert.org/documents/bulletin/Alert!_16.pdf 70 http//www/opito.com 71 OPITO APPROVED STANDARD - Offshore Oil & Gas Industry - Minimum Industry - Safety Training Standard - Revision 0 (27-Oct 2008); Amendment 11 (09-Feb 2010) - http://www.opito.com/uk/library/industry_training_standards/minimum_industry_safety_training_standard.pdf 72 http://www.oilandgas4u.com/index.php?option=com_content&task=view&id=14&Itemid=28 73 Vantage - Offshore Passport & Personnel Tracking System - Cogent Central Register - http://www.cogent-ssc.com/industry/oil_and_gas/health_safety/Vantage.php 74 http://www.stepchangeinsafety.net/ResourceFiles/Vantage%20POB%20Lflt.pdf 75 RenewableUK - Health & Safety Training & Approvals Update & FAQ’s - July 2010 - http://www.bwea.com/pdf/safety/training_update_faq.pdf 76 MULTI-NATIONAL AUDIT - ‘SUPERVISION’ - North Sea Offshore Authorities Forum - 2007-2009 - http://www.hse.gov.uk/Offshore/NSOAF-Supervision-report.pdf 77 MULTI-NATIONAL AUDIT - ‘SUPERVISION’ - North Sea Offshore Authorities Forum - 2007-2009 - http://www.hse.gov.uk/Offshore/NSOAF-Supervision-report.pdf 78 MULTI-NATIONAL AUDIT - ‘SUPERVISION’ - North Sea Offshore Authorities Forum - 2007-2009 - http://www.hse.gov.uk/Offshore/NSOAF-Supervision-report.pdf 79 Safety Factor – interview - Magne Ognedal, Petroleum Safety Authority Norway - http://www.offshore-technology.com/features/feature41080/ 80 Safety Factor – interview - Magne Ognedal, Petroleum Safety Authority Norway - http://www.offshore-technology.com/features/feature41080/ 81 http://www.hse.gov.uk/risk/theory/alarpglance.htm 82 ALARP Suite of Guidance - http://www.hse.gov.uk/risk/theory/alarp.htm 83 Capability maturity models for offshore organisational management - J.E. Strutt, J.V. Sharp, E. Terry, R. Miles – October 2006 - http://oikosistemata.yolasite.com/resources/ei-32-1094-maturemodel.pdf 84 UKOOA. Risk based decision making framework. UK Offshore Operators Association; 1998. - http://www.sciencedirect.com/science?_ob=ArticleURL&_udi=B6V7X-4M4KKC3-1&_user=10&_coverDate=12%2F31%2F2006&_rdoc=1&_fmt=high&_orig=search&_origin=search&_sort=d&_docanchor=&view=c&_searchStrId=1468445264&_rerunOrigin=google&_acct=C000050221&_version=1&_urlVersion=0&_userid=10&md5=b0b52aa2173f0deb20e596fd0a88450b&searchtype=a 85 Application of QRA in operational safety issues Prepared by Det Norske Veritas Ltd for the Health and Safety Executive – 2002 - http://www.hse.gov.uk/research/rrpdf/rr025.pdf 86 HSE principles for Cost Benefit Analysis (CBA) in support of ALARP decisions - http://www.hse.gov.uk/risk/theory/alarpcba.htm 87 ROV INTERVENTION INTERFACES - Donald K Faulds - Perry Slingsby Systems - PRESENTED AT UI2007 - http://www.perryslingsbysystems.com/assets/pdf/news/PSSL_ROV_intervention_UI_2007.pdf 88 Underwater Engineering Services Ltd - ROV TORQUE TOOL - KIS17H - http://www.uesltd.net/Products/ROV-Tools/ROV-TORQUE-TOOL-P58 89 Safety Training Courses - http://www.oilandgas4u.com/index.php?option=com_content&task=view&id=14&Itemid=28 90 Guidance on permit-to-work systems - A guide for the petroleum, chemical and allied industries - HSG250 - ISBN 978 0 7176 2943 5 - http://www.hse.gov.uk/pubns/priced/hsg250.pdf
91 11 November 2009 in Lord Cullen House, Aberdeen - http://www.hse.gov.uk/aboutus/meetings/iacs/oiac/minnov09.pdf 92 http://www.petrotechnics.com/index.html 93 UK Flightshare - http://www.ukflight-share.com/home.htm 94 Leading Oil and Gas Industry Competiveness (LOGIC) - http://www.logic-oil.com/index.cfm 95 http://www.achilles.com/en/FPAL/about-FPAL/ 96 Standard Contracts for the UK Offshore Oil & Gas Industry - http://www.logic-oil.com/contracts.cfm 97 Review of technical issues relating to foundations and geotechnics for offshore installations in the UKCS - http://www.hse.gov.uk/research/rrpdf/rr676.pdf 98 Technip – Deep Blue - http://www.technip.com/sites/default/files/technip/publications/attachments/DeepBlue.pdf 99 http://www.technip.com/en/experience-and-technologies/subsea 100 Industry Mutual Hold Harmless Scheme - http://www.imhh.com/about.cfm 101 http://www.imhh.com/deed.cfm 102 Leading Oil and Gas Industry Competiveness (LOGIC) - http://www.logic-oil.com/index.cfm 103 http://www.akersolutions.com/

Overcoming Challenges for the Offshore Wind Industry and Learning from the Oil and Gas Industry Page 241 of 245
104 http://www.argussubsea.com/products/AZ10_Brochure-Gen-II.pdf 105 http://www2.c-a-m.com/ 106 http://www.fmctechnologies.com/en/SubseaSystems/Technologies/SubseaProductionSystems/SubseaTrees/EHXT.aspx 107 http://info.ogp.org.uk/standards/downloads/StandardsIssued.pdf 108 International Standards Organisation – Oil and Gas Standards http://www.iso.org/iso/search.htm?qt=oil+and+gas&searchSubmit=Search&sort=rel&type=simple&published=on 109 EUROPEAN EXPERIENCES IN PRE-CONSENTING SURVEY ACTIVITIES - John Morse – Business Development Manager, Gardline Renewables – Poster session AWEA -2010 – Personal communication 110 Britain’s Huge Offshore Wind Farm Faces An Array of Challenges - http://enr.ecnext.com/comsite5/bin/comsite5.pl?page=enr_document&item_id=0271-57269&format_id=XML 111 Offshore monopile failure - a solution may be in sight - Windpower Monthly Magazine, 22 June 2010, 12:29pm - http://www.windpowermonthly.com/go/windalert/article/1011507/?DCMP=EMC-WindpowerWeekly 112 Wind European Industrial Initiative Team 2010 – 2012 Implementation Plan - http://ec.europa.eu/energy/technology/initiatives/doc/wind_implementation_plan_final.pdf 113 International Regulators Forum Global Offshore Safety - http://www.epmag.com/Offshore/OffshoreNews/2010/September/item67521.php 114 INTERNATIONAL REGULATORS FORUM GLOBAL OFFSHORE SAFETY - http://www.irfoffshoresafety.com/about/ 115 http://www.hse.gov.uk/offshore/liaison.htm 116 http://www.emu-consult.dk/includes/middelgrunden_munich.pdf 117 http://media.clemson.edu/public/restoration/wind/us/brokum_foundation_paper.pdf 118 Chris Bagley, TWI – personnel communications. 119 http://www.biztrademarket.com/transfersell_Shipbuilding-Steel-Plate_1139332.htm 120 Design Methods for Offshore Wind - Turbines at Exposed Sites (OWTES) - Sensitivity Analysis for Foundations of Offshore Wind Turbines - OWTES Task 4.1 - OWEC Tools Task B.1 - B.2 - Ir. M.B.Zaaijer (TUDelft, editor)- 18 April, 2005 121 Jacket Foundations for Wind Turbines - IABSE - Wednesday d. 24 March 2010 - Jacob Fisker Jensen – Ramboll - http://www.iabse.dk/Seminar_WindTurbine/JacketFoundations_RAMBOLL.pdf 122 Jacket substructures for the RePower 5M wind turbine - Marc Seidel - RePower Systems – Presentation - European Offshore Wind 2007 123 Vindkraft i kallt klimat - Tekniskt kunnande – en resurs för Norrland - Milan Veljkovic, VinterVind, Piteå, 2010.02.03. - http://www.winterwind.se/2010/presentation/05_LTU_Veljkovic_VV2010.pdf 124 Deepwater Offshore Windfarm - Design Fabrication And Installation Study - Final Report - Report Number - W/61/00635/00/Rep - Urn 04/1041 – Contractor - Talisman Energy UK Ltd - For The UK Dti. 125 Ruukki: New solutions for wind turbine towers - http://worldsteel.org/pictures/storyfiles/Wind%20power%20Ruukki.pdf 126 Structural Design of Hybrid-Towers for Wind Energy Converters - Prof. Dr.-Ing. Peter Schaumann and Dipl.-Ing. Christian Keindorf - Leibniz Universität Hannover, Germany 127 Control of Doubly Fed Induction Generators in a Wind Turbine During Grid Faults – Dawei Xiang, Li Ran, J Tavner, Shuchang Yang – Durham University – IEEE Transactions On Energy Conversion, Vol 21, No 3, September 2006 - http://dro.dur.ac.uk/1751/1/1751.pdf?DDD10+des0pt 128 BWEA response to grid code consultation – July 2004 - http://www.bwea.com/pdf/Grid%20Code%20H04.pdf 129 http://en.wikipedia.org/wiki/Rare-earth_magnet 130 Current and Future Developments of the C-GEN Lightweight Direct Drive Generator for Wave & Tidal Energy - N. Hodgins, A. McDonald, J. Shek, O. Keysan & M. Mueller - http://www.see.ed.ac.uk/~shs/Wave%20Energy/EWTEC%202009/EWTEC%202009%20(D)/papers/195.pdf 131 A lightweight low speed permanent magnet electrical generator for direct-drive wind turbines - M. A. Mueller and A. S. McDonald - http://www.ewec2008proceedings.info/ewec2008/allfiles2/320_EWEC2008fullpaper.pdf 132 Britain in the frame for 10MW offshore wind turbine from AMSC - http://www.newenergyfocus.com/do/ecco/view_item?listid=1&listcatid=32&listitemid=2246 133 Offshore Wind farm with Centralized Power Conversion and DC Interconnection – D Jovcic – N Strachan - Aberdeen University - http://www.abdn.ac.uk/~eng727/pap369_iet_final.pdf 134 Improving wind turbine gearbox reliability with O&M - Jack Wallace Jr., Frontier Pro Services - 01 March 2009 - http://www.renewableenergyfocus.com/view/1396/improving-wind-turbine-gearbox-reliability-with-om/
135 http://www.emma-maersk.com/specification/

Overcoming Challenges for the Offshore Wind Industry and Learning from the Oil and Gas Industry Page 242 of 245
136 http://www.allbusiness.com/manufacturing/machinery-manufacturing-general/4004678-1.html 137 Parametric modeling of large wind turbine blades – P. A. Bonnet & G Dutton – Energy Research Unit - http://www.supergen-wind.org.uk/Phase1/docs/Bonnet,Dutton_Abaqus_UK_2007.pdf 138 Wind Power Blades Energize Composites Manufacturing - By Joseph A. Grande – Plastics technology online – 2000 - http://www.ptonline.com/articles/200810fa2.html 139 http://www.enercon.de/en/_home.htm 140 http://www.modernenergyreview.com/pdfs/sway_webarticle_hr.pdf 141 http://www.nae.usace.army.mil/projects/ma/ccwf/app3c.pdf 142 The Cobra Cable - A feasibility study regarding an HVDC submarine cable inter connector between the Netherlands and Denmark - C.P.J. JANSEN, B.F. VAN HULST, P. DAMGAARD, K.H. SØBRINK - Paper 304 - Cigré SC B4 2009 Bergen Colloquium - http://www.cigrescb4norway.com/Documents/Papers/Session%203/304%20The%20Cobra%20Cable%20-%20A%20feasibility%20study%20regarding%20an%20HVDC%20submarine%20cable%20inter%20connector%20between%20the%20Netherlands%20and%20Denmark.pdf
143 HVDC in the UK….. The Energy Challenge 22 July 2008 - Peter Jones – ABB, Head of Technology - http://www.cigre-ngn-uk.org/resources/documents/NGN%20TE2%20(08)%20-%20Presentation%20-%20PeterJones.pdf 144 Study on the development of offshore grid for the connection of the round two wind farms – Econnect No:1312 - http://www.ensg.gov.uk/assets/econnect_r2.pdf 145 East Coast Transmission Network - Technical Feasibility Study – Crown Estates – Econnect Consulting - No 1845 – 2008 - http://www.thecrownestate.co.uk/east_coast_transmission_network_technical_feasibility_study.pdf 146 http://www.google.co.uk/imgres?imgurl=http://64.202.120.86/upload/image/articles/2007/ionic-wind/corona-discharge.jpg&imgrefurl=http://connect.in.com/corona-effect/photos-1-1-1-64434d55f4ead381c5ede61bee9ade2d.html&usg=__aPiJzCOlO9868mktDwVw8ql9GX4=&h=414&w=915&sz=29&hl=en&start=2&zoom=1&um=1&itbs=1&tbnid=dOJb_bApa1T1YM:&tbnh=67&tbnw=147&prev=/images%3Fq%3Dcorona%2Bdischarge%26um%3D1%26hl%3Den%26sa%3DX%26rlz%3D1R2ADFA_enGB359%26biw%3D737%26bih%3D623%26tbs%3Disch:1 147 Westcode product brief – Power Electronic Assemblies – Custom Solutions – Feb 2007 - http://www.westcode.com/publicity/prod_lit/plit05.pdf 148 http://www.ornl.gov/~webworks/cppr/y2001/rpt/118817.pdf 149 http://diamondad.com/diamonds-in-computers.html 150 http://www.renewableenergyfocus.com/view/8167/offshore-wind-do-we-have-what-it-takes/ 151 http://www.renewableenergyfocus.com/view/11231/vessel-supply-chain-shapes-up-for-offshore-wind/ 152 https://www.decc.gov.uk/assets/decc/what%20we%20do/lc_uk/ic_business/env_trans_fund/wind_grants/file41542.pdf 153 http://www.mpi-offshore.com/equipment-1/remote-operated-vehicle 154 Wind News - FINAL TURBINE ERECTED AT ‘WORLD’S LARGEST OFFSHORE WIND FARM’ - Monday 28 June 2010 - http://newenergyfocus.com/do/ecco/view_item?listid=1&listcatid=32&listitemid=4100§ion=Wind 155 http://www.maritimejournal.com/features/marine-civils/marine-renewable-energy/thanet_on_schedule 156 http://www.seawayheavylifting.com.cy/pages/what_we_do/offshore_wind.php 157 http://www.maritimejournal.com/features/marine-civils/marine-renewable-energy/thanet-offshore-windfarm-construction-forges-ahead 158 Wind News - VATTENFALL REVEALS LESSONS LEARNT FROM THANET OFFSHORE WIND FARM - Thursday 08 July 2010 - http://www.newenergyfocus.com/do/ecco/view_item?listid=1&listcatid=32&listitemid=4144 159 http://www.power-technology.com/projects/alpha-ventus/ 160 http://www.renewableenergyfocus.com/view/5340/germany-completes-its-first-large-offshore-wind-farm/ 161 http://www.eufores.org/fileadmin/eufores/Events/Parliamentary_Events/Offshore_September_2010/100916_Eufores_Offshore_E.ON.pdf 162 http://www.eufores.org/fileadmin/eufores/Events/Parliamentary_Events/Offshore_September_2010/100916_Eufores_Offshore_E.ON.pdf 163 http://www.4coffshore.com/windfarms/vessels.aspx 164 http://www.windcarrier.com/arch/_img/9084510.pdf 165 http://www.huismanequipment.com/en/products/new_concepts/wind_turbine_shuttle 166 http://www.supplyvessel.net/contact

Overcoming Challenges for the Offshore Wind Industry and Learning from the Oil and Gas Industry Page 243 of 245
167 http://www.subsea7.com/v_specs.php 168 http://www.acergy-group.com/public/Ourfleetandequipment 169 http://www.technip.com/en/publications/brochures 170 http://www.gardlinemarinesciences.com/page/gardlines-fleet/ 171 http://www.slp-eng.com/Submat/Concrete-Mattresses.asp#Pipeform 172 http://www.pipeshield.co.uk/ 173 IMMEDIATE DISPLACEMENT OF THE SEABED DURING SUBSEA ROCK INSTALLATION (SRI) - http://www.terra-et-aqua.com/dmdocuments/terra110_1.pdf 174 http://www.vanoord.com/gb-en/index.php 175 http://www.sscsystems.com/Scour-Control/How-The-Frond-System-Works.aspx 176 Optimizing costs through Subsea Engineering – John White & Stuart J Houston – Fuel Subsea Engineering - http://www.verderg.com/attachments/-01_Optimising%20Cost%20Control.pdf 177 http://83.138.167.74/publicroot/webresources/6Z8CEARDUN/$file/10.%20Acergy%20Group%20Presentation_OCTOBER.pdf 178 http://www.oceaneering.com/oceandocuments/brochures/subseaproducts/greyloc/GRLC%20-%20The%20Ultimate%20Connector%20A4.pdf 179 Rare Earth Elements: The Global Supply Chain- Marc Humphries - Analyst in Energy Policy - Congressional Research Service - July 28, 2010 - http://www.fas.org/sgp/crs/natsec/R41347.pdf 180 Dwindling mines spell hot times for copper - August 18 2010 19:09- http://www.ft.com/cms/s/0/d6be98c8-aaeb-11df-9e6b-00144feabdc0.html
181 Review of Engineering &Specialist Support Requirements For the Ocean Energy Sector - June 2009 - http://www.seai.ie/Renewables/Ocean_Energy/OE_Engineering_Support_Requirements/Engineering_Specialist_Support_Requirements_for_OE_Sector.pdf 182 Wind Turbine Supply Chain Strategies: 2009-2020 – EnergyBiz.com 183 BVG Associates for Crown Estate, Towards Round 3: Building the Offshore Wind Supply Chain - A review for The Crown Estate on how to improve delivery of UK offshore wind, May 2009 184 Technology Needs - To Support Advanced Composites in the UK - http://webarchive.nationalarchives.gov.uk/tna/+/http://www.bis.gov.uk/wp-content/uploads/publications/Composites-Tech-Needs.pdf/ 185 The UK Carbon Fibre Composites Industry Market Profile- A study by NetComposites/Connectra - May 2009 - http://www.bis.gov.uk/assets/BISCore/corporate/docs/C/09-1535-composites-carbon-fibre-study 186 http://www.netcomposites.com/news.asp?6326 187 http://www.doxtop.com/browse/ed0cab25/high-voltage-power-electronics.aspx 188 http://www.i-micronews.com/upload/Rapports/Yole_HVPE_report_sample.pdf 189 http://www.i-micronews.com/upload/Rapports/Yole_HVPE_report_sample.pdf 190 Strategy Framework Directive, OJ L 164, 25.6.2008, p. 19. - www.environmentalexchange.info 191 Concerted Action on Offshore Wind Energy in Europe - RTD strategy http://ec.europa.eu/energy/renewables/wind_energy/doc/ca_owee_rtd.pdf 192 Delivering Offshore Wind Power in Europe - POLICY RECOMMENDATIONS FOR LARGE-SCALE DEPLOYMENT OF OFFSHORE WIND POWER IN EUROPE BY 2020 - By the European Wind Energy Association - http://www.ewea.org/fileadmin/ewea_documents/images/publications/offshore_report/ewea-offshore_report.pdf 193 Offshore Windfarm Decommissioning: A proposal for guidelines to be included in the European Maritime Policy - http://ec.europa.eu/maritimeaffairs/contributions_post/247offshore_windfarm.pdf 194 http://www.offshorewindenergy.org/ca- owee/indexpages/Social_and_Environmental.php?file=envimpct_p5.php 195 East Anglia One – Offshore Wind Farm – Environmental Impact Scoping Report July 2010 196 “ Offshore Wind Energy - Implementing a New Powerhouse for Europe” Grid Connection, Environmental Impact, Assessment, Political Framework - http://www.greenpeace.org/raw/content/international/press/reports/offshore-wind-implementing-a.pdf 197 Offshore Wind Farms - Guidance Note for Environmental Impact Assessment in Respect of FEPA and CPA Requirements; Centre for Environment, Fisheries and Aquaculture Science (CEFAS); Crown; June 2004 198 Enabling Offshore Wind Developments; Shaw, S., Cremers, M.J., Palmers, G.; 3E – EWEA, Brussels 2002 199 http://www.offshore-sea.org.uk/site/scripts/sea_archive.php 200 http://www.blacksea-commission.org/_publ-Newsletter09.asp 201 http://www.iwlearn.net/iw-projects/Fsp_112955519569/reports/caspiansea_sap_2003.pdf

Overcoming Challenges for the Offshore Wind Industry and Learning from the Oil and Gas Industry Page 244 of 245
202 Introducing SEA and Biodiversity modelling in SEA – Joan Looijen – ITC – 2009 http://www.gms-eoc.org/CEP/Comp1/docs/DanangWorkshop/SEA_BiodiversityModelling.pdf 203 OFFSHORE WIND AND MARINE RENEWABLE ENERGY IN NORTHERN IRELAND STRATEGIC ENVIRONMENTAL ASSESSMENT (SEA) - Non-Technical Summary (NTS) - AECOM and Metoc - December 2009 - http://www.offshorenergyni.co.uk/Data/NTS_FINAL_DEC_09.pdf
1. 204 BIRDS AND OFFSHORE WIND FARMS: LESSONS FROM ROUND 1 AND 2 - www.iema.net/.../Tim%20norman%20birds/Tim%20norman%20birds.pdf 205 Personal connunciation, Rick Squires, Director PiEnergy 206 Doc No SH-OP-PL-0003 Shelley Field - Decommissioning Programmes - Doc No SH-OP-PL-0003 - http://www.premier-oil.com/Asp/uploadedFiles/File/decommissioning/SH-OP-PL-0003.pdf 207 https://www.og.decc.gov.uk/environment/permits/NexenBuzzard.htm 208 http://www.imo.org/environment/mainframe.asp?topic_id=233 209 http://www.ace.mmu.ac.uk/eae/acid_rain/older/International_Agreements.html 210 http://ec.europa.eu/environment/enveco/ex_post/pdf/lcpd.pdf 211 Cato Institute - Federal Ecosystem Management: A "Train Wreck" in the Making - by Allan K. Fitzsimmons – 1994 - http://www.cato.org/pubs/pas/pa-217.html
2. 212 BIRDS AND OFFSHORE WIND FARMS: LESSONS FROM ROUND 1 AND 2 - www.iema.net/.../Tim%20norman%20birds/Tim%20norman%20birds.pdf 213 Further use of aerial surveys to detect birds displaced by offshore wind farms – COWRIE EXTDISP-06-07 - http://www.offshorewindfarms.co.uk/Assets/EXTDISP_06_07_final%20GC.pdf 214 Wake effects at Horns Rev and their influence on energy production - Martin Méchali, Rebecca Barthelmie, Sten Frandsen, Leo Jensen, Pierre-Elouan Réthoré - http://www.dongenergy.com/SiteCollectionDocuments/NEW%20Corporate/PDF/Engineering/40.pdf 215 Establishing best practice for the documentation and dissemination of marine biological data - COWRIE DATA-07-08 - http://www.offshorewindfarms.co.uk/Assets/sDATA_14_11_08_FINALREPORT.pdf 216 Development of a framework for Appropriate Assessments of Dutch offshore wind farms – by TC Prins, F Twisk, MJ van den Heuvel-Greve, TA Troost & JKL van Beek – 2008 - http://www.noordzeeloket.nl/Images/Generieke%20passende%20beoordeling%20Deltares%20report%20Z4513_tcm14-3771.pdf 217 Belwind: EIB finances Europe’s largest offshore wind farm - http://www.eib.org/projects/news/eib-finances-europes-largest-offshore-wind-farm.htm 218DONG Energy and PensionDanmark Sign Nysted Offshore Wind Farm Agreement Thursday, September 09, 2010 - http://www.oilvoice.com/n/DONG_Energy_and_PensionDanmark_Sign_Nysted_Offshore_Wind_Farm_Agreement/caef6c952.aspx 219 Illustrated History of Wind Power Development - © 1996-2001 TelosNet Web Development and Darrell Dodge ALL RIGHTS RESERVED - http://www.telosnet.com/wind/index.html 220 http://www.lockheedmartin.com/aeronautics/skunkworks/name.html 221 Guidelines for onshore and offshore wind farms Health & Safety in the Wind Energy Industry Sector 2010 – Renewables UK - http://w.bwea.com/pdf/HSGuidelines.pdf 222 https://www.og.decc.gov.uk/information/data_release/index.htm 223 Brief History of the UK North Sea Oil and Gas Industry - http://www.abdn.ac.uk/oillives/about/nsoghist.shtml 224 http://www.pressandjournal.co.uk/Article.aspx/1843550 225 Offshore Wind in Scotland Fabrication Capabilities / Opportunities John Robertson Managing Director –BiFab: Presentation, All Energy 2009.
226 http://www.alpha-ventus.de/fileadmin/user_upload/Pressekit/av_Factsheet_091005_EN.pdf 227 Germany's First Offshore Wind Farm is Formally Commissioned: Press release Alpha Ventus 27/04/2010: http://www.alpha-ventus.de/index.php?id=80 228 SubTel Forum, Subsea Technologies issue 45: http://www.subtelforum.com/issues/STF_45.pdf 229 North Sea Decommissioning's New Service Sector, 17 Mar 2010 , http://www.offshore-technology.com/features/feature79640/ 230 Efficient connection between offshore foundation and wind turbine towers: Anders Møller Andersen; http://www.owen.eru.rl.ac.uk/documents/BWEA24/Nielsen31.pdf 231 http://www.ogj.com/ogj/en-us/index/article-tools-template._printArticle.articles.offshore.volume-56.issue-7.departments.drilling-production.collective-effort-drives-down-cost-of-shelved-andrew-development.html 232 Subsea compression opens options for stranded deepwater gas: Page 126 Offshore April 2006 • www.offshore-mag.com 233 http://www.eoearth.org/article/exxon_valdez_oil_spill 234 http://news.bbc.co.uk/onthisday/hi/dates/stories/january/5/newsid_2506000/2506223.stm

Overcoming Challenges for the Offshore Wind Industry and Learning from the Oil and Gas Industry Page 245 of 245
235 http://www.bp.com/bodycopyarticle.do?categoryId=1&contentId=7052055&nicam=UK%20Oil%20Spill%20Response&nisrc=Google&nigrp=UK%20Oil%20Spill%20Response&nipkw=deepwater%20horizon&niadv=Text%20Ad 236 http://www.epa.gov/oem/content/lawsregs/ncpover.htm 237 http://www.statoil.com/en/OurOperations/FarNorth/OilSpillResponse/Pages/default2.aspx 238 http://www.hi-energy.org.uk/Projects/pioneeringprojects-talisman-beatrice-project.html 239 http://www.offshore-mag.com/index/article-display/241764/articles/offshore/volume-65/issue-11/equipment-engineering/dc-link-from-norwegian-mainland-powers-troll-platforms.html 240 The Ormonde Project - Steve Palmer – Divisional Manager - http://www.offshore-power.net/Files/Dok/miniconference/ode.pdf
241 http://www.newenergyfocus.com/do/ecco/view_item?listid=1&listcatid=107&listitemid=1886 242 http://www.vattenfall.co.uk/en/ormonde.htm 243 Offshore wind power developments - An overview of realisations and planned projects - L.W.M. Beurskens & M. de Noord - http://www.ogj.com/ogj/en-us/index/article-tools-template._printArticle.articles.offshore.volume-56.issue-7.departments.drilling-production.collective-effort-drives-down-cost-of-shelved-andrew-development.html 244 Assessing Novel Foundation Options for Offshore Wind Turbines- by - B.W. Byrne, BE(Hons), BCom, MA, DPhil & G.T. Houlsby, MA, DSc, FREng, FICE - Oxford University, UK - http://www-civil.eng.ox.ac.uk/people/bwb/papers/MAREC011_paper.pdf 245 “PROSPECTS FOR OFFSHORE WIND ENERGY” - A report written for the EU (Altener contract XVII/4.1030/Z/98-395) by The British Wind Energy Association (BWEA). http://www.offshorewindenergy.org/reports/report_026.pdf 246 BWEA - UK Offshore Wind: Charting the Right Course - Scenarios for offshore capital costs for the next five years – Garrad Hassan Ltd - http://www.bwea.com/pdf/publications/ChartingtheRightCourse.pdf 247 http://ec.europa.eu/energy/gas_electricity/third_legislative_package_en.htm
248 EUR EC (Eu rope an Re newable Energy Rese arch Ce ntres ) Agency. May 2009 - http://www.energy.eu/publications/a06.pdf
249 http://www.scottish-enterprise.com/your-sector/energy/energy-support/~/media/publications/Energy%20Sector/National-renewables-infrastructure-plan.ashx