Official PDF , 40 pages
40
Living Standards Measurement Study Working Paper No. 65 FILE COPY Formal and Informal Sector Wage Determination in Urban Low-Income Neighborhoods in Pakistan Harold Alderman Valerie Kozel (!77 DocumentatiOn Cen .1350 Public Disclosure Authorized Public Disclosure Authorized Public Disclosure Authorized Public Disclosure Authorized Public Disclosure Authorized Public Disclosure Authorized Public Disclosure Authorized Public Disclosure Authorized
Transcript of Official PDF , 40 pages
Living StandardsMeasurement StudyWorking Paper No. 65 FILE COPY
Formal and Informal Sector Wage Determination in UrbanLow-Income Neighborhoods in Pakistan
Harold AldermanValerie Kozel
(!77
DocumentatiOn Cen
.1350
Pub
lic D
iscl
osur
e A
utho
rized
Pub
lic D
iscl
osur
e A
utho
rized
Pub
lic D
iscl
osur
e A
utho
rized
Pub
lic D
iscl
osur
e A
utho
rized
Pub
lic D
iscl
osur
e A
utho
rized
Pub
lic D
iscl
osur
e A
utho
rized
Pub
lic D
iscl
osur
e A
utho
rized
Pub
lic D
iscl
osur
e A
utho
rized
LSMS Working Papers
No. 1 Living Standards Surveys in Developing Countries
No. 2 Poverty and Living Standards in Asia: An Overview of the Main Results and Lessons of SelectedHousehold Surveys
No. 3 Measuring Levels of Living in Latin America: An Overview of Main Problems
No. 4 Towards More Effective Measurement of Levels of Living, and Review of Work of the United NationsStatistical Office (UNSO) Related to Statistics of Levels of Living
No. 5 Conducting Surveys in Developing Countries: Practical Problems and Experience in Brazil, Malaysia,and the Philippines
No. 6 Household Survey Experience in Africa
No. 7 Measurement of Welfare: Theory and Practical Guidelines
No. 8 Employment Data for the Measurement of Living Standards
No. 9 Income and Expenditure Surveys in Developing Countries: Sample Design and Execution
No. 10 Reflections on the LSMS Group Meeting
No. 11 Three Essays on a Sri Lanka Household Survey
No. 12 The ECIEL Study of Household Income and Consumption in Urban Latin America: An AnalyticalHistory
No. 13 Nutrition and Health Status Indicators: Suggestions for Surveys of the Standard of Living in DevelopingCountries
No. 14 Child Schooling and the Measurement of Living Standards
No. 15 Measuring Health as a Component of Living Standards
No. 16 Procedures for Collecting and Analyzing Mortality Data in LSMS
No. 17 The Labor Market and Social Accounting: A Framework of Data Presentation
No. 18 Time Use Data and the Living Standards Measurement Study
No. 19 The Conceptual Basis of Measures of Household Welfare and Their Implied Survey Data Requirements
No. 20 Statistical Experimentation for Household Surveys: Two Case Studies of Hong Kong
No. 21 The Collection of Price Data for the Measurement of Living Standards
No. 22 Household Expenditure Surveys: Some Methodological Issues
No. 23 Collecting Panel Data in Developing Countries: Does it Make Sense?
No. 24 Measuring and Analyzing Levels of Living in Developing Countries: An Annotated Questionnaire
No. 25 The Demand for Urban Housing in the Ivory Coast
No. 26 The Cote d'Ivoire Living Standards Survey: Design and Implementation
No. 27 The Role of Employment and Earnings in Analyzing Levels of Living: A General Methodology withApplications to Malaysia and Thailand
No. 28 Analysis of Household Expenditures
No. 29 The Distribution of Welfare in C6te d'lvoire in 1985
No. 30 Quality, Quantity, and Spatial Variation of Price: Estimating Price Elasticities from Cross-sectional Data
No. 31 Financing the Health Sector in Peru
No. 32 Informal Sector, Labor Markets, and Returns to Education in Peru
No. 33 Wage Determinants in C6te d'Ivoire
No. 34 Guidelines for Adapting the LSMS Living Standards Questionnaires to Local Conditions
(List continues on the inside back cover)
Formal and Informal Sector WageDetermination in Urban Low-Income
Neighborhoods in Pakistan
The Living Standards Measurement Study
The Living Standards Measurement Study (LSMS) was established by the WorldBank in 1980 to explore ways of improving the type and quality of household datacollected by statistical offices in developing countries. Its goal is to foster increaseduse of household data as a basis for policy decisionmaking. Specifically, the LSMSis working to develop new methods to monitor progress in raising levels of living,to identify the consequences for households of past and proposed governmentpolicies, and to improve communications between survey statisticians, analysts,and policymakers.
The LSMS Working Paper series was started to disseminate intermediate productsfrom the LSMS. Publications in the series include critical surveys covering differentaspects of the LSMS data collection program and reports on improvedmethodologies for using Living Standards Survey (LSS) data. More recentpublications recommend specific survey, questionnaire, and data processingdesigns, and demonstrate the breadth of policy analysis that can be carried out usingLSS data.
LSMS Working PaperNumber 65
Formal and Informal Sector WageDetermination in Urban Low-Income
Neighborhoods in Pakistan
Harold AldermanValerie Kozel
The World BankWashington, D.C.
Copyright © 1989The International Bank for Reconstructionand Development/THE WORLD BANK1818 H Street, N.W.Washington, D.C. 20433, U.S.A.
All rights reservedManufactured in the United States of AmericaFirst printing September 1989
This is a working paper published informally by the World Bank. To present the results ofresearch with the least possible delay, the typescript has not been prepared in accordancewith the procedures appropriate to formal printed texts, and the World Bank accepts noresponsibility for errors.
The findings, interpretations, and conclusions expressed in this paper are entirely those ofthe author(s) and should not be attributed in any manner to the World Bank, to its affiliatedorganizations, or to members of its Board of Executive Directors or the countries theyrepresent. Any maps that accompany the text have been prepared solely for the convenienceof readers; the designations and presentation of material in them do not imply theexpression of any opinion whatsoever on the part of the World Bank, its affiliates, or itsBoard or member countries concerning the legal status of any country, territory, city, or areaor of the authorities thereof or concerning the delimitation of its boundaries or its nationalaffiliation.
The material in this publication is copyrighted. Requests for permission to reproduceportions of it should be sent to Director, Publications Department, at the address shown inthe copyright notice above. The World Bank encourages dissemination of its work and willnormally give permission promptly and, when the reproduction is for noncommercialpurposes, without asking a fee. Permission to photocopy portions for classroom use is notrequired, though notification of such use having been made will be appreciated.
The complete backlist of publications from the World Bank is shown in the annual Index ofPublications, which contains an alphabetical title list and indexes of subjects, authors, andcountries and regions; it is of value principally to libraries and institutional purchasers.The latest edition is available free of charge from the Publications Sales Unit, Department F,The World Bank, 1818 H Street, N.W., Washington, D.C. 20433, U.S.A., or from Publications,The World Bank, 66, avenue d'1ena, 75116 Paris, France.
Harold Alderman is an economist at the International Food Policy Research Institute,Washington, D.C., and a consultant to the Welfare and Human Resources Division of theWorld Bank's Population and Human Resources Department. Valerie Kozel is an economistin the same department of the Bank.
Library of Congress Cataloging-in-Publication Data
Alderman, Harold, 1948-Formal and informal sector wage determination in urban low-income
neighborhoods in Pakistan / Harold Alderman, Valerie Kozel.p. cm. -- (LSMS working paper, ISSN 0253-4517 ; no.65)
Includes bibliographical references.ISBN 0-8213-1308-81. Wages--Pakistan. I. Kozel, Valerie, 1952- . II. Title.
III. Series.HD5070.5.A75 1989331.2'15'095492--dc20 89-22493
CIP
ABSTRACT
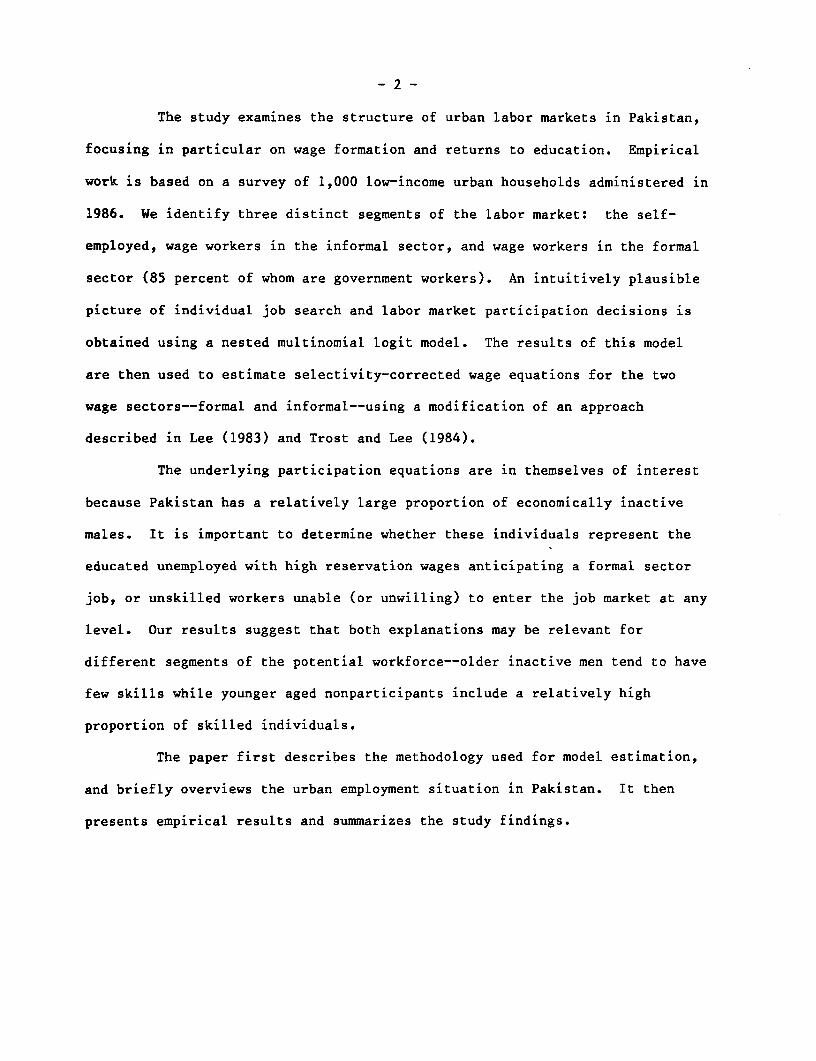
The paper examines the structure of urban labor markets in Pakistan,
focusing in particular on wage formation and returns to education for male
workers. Empirical work is based on a survey of 1,000 low-income urban
households administered in 1986 by the International Food Policy Research
Institute (IFPRI) and the Pakistan Institute of Development Economics
(PIDE). We identify three distinct segments of the labor market: the self-
employed, wage workers in the informal sector, and wage workers in the formal
sector, 85 percent of whom are government workers. An intuitively plausible
picture of individual job search and labor market participation decisions is
obtained using a nested multinomial logit model. The results of this model
are then used to estimate selectivity-corrected wage equations for the two
wage sectors -- formal and informal -- using a modification of an approach
described in Lee (1983) and Trost and Lee (1984).
The study found that the difference in average wages between the
formal and informal sector is primarily caused by differences in skills
(measured in terms of work experience and education), although there is an
appreciable premium on wages in the formal sector, particularly for college
educated men. A smaller although still significant premium was found for less
educated men. Further, we identified two distinct categories of economically
inactive individuals -- young, more educated men apparently waiting to find a
job in the formal sector rather than accepting less desirable employment in
the informal sector, and older, less qualified men who tend to live in
wealthier extended families receiving substantial remittances from within
Pakistan and abroad. In the latter case, unearned income helps these
individuals to remain outside the labor force. To be effective, employment
policy must address the very different kinds of constraints faced by
individuals in each of the categories.

- vii -
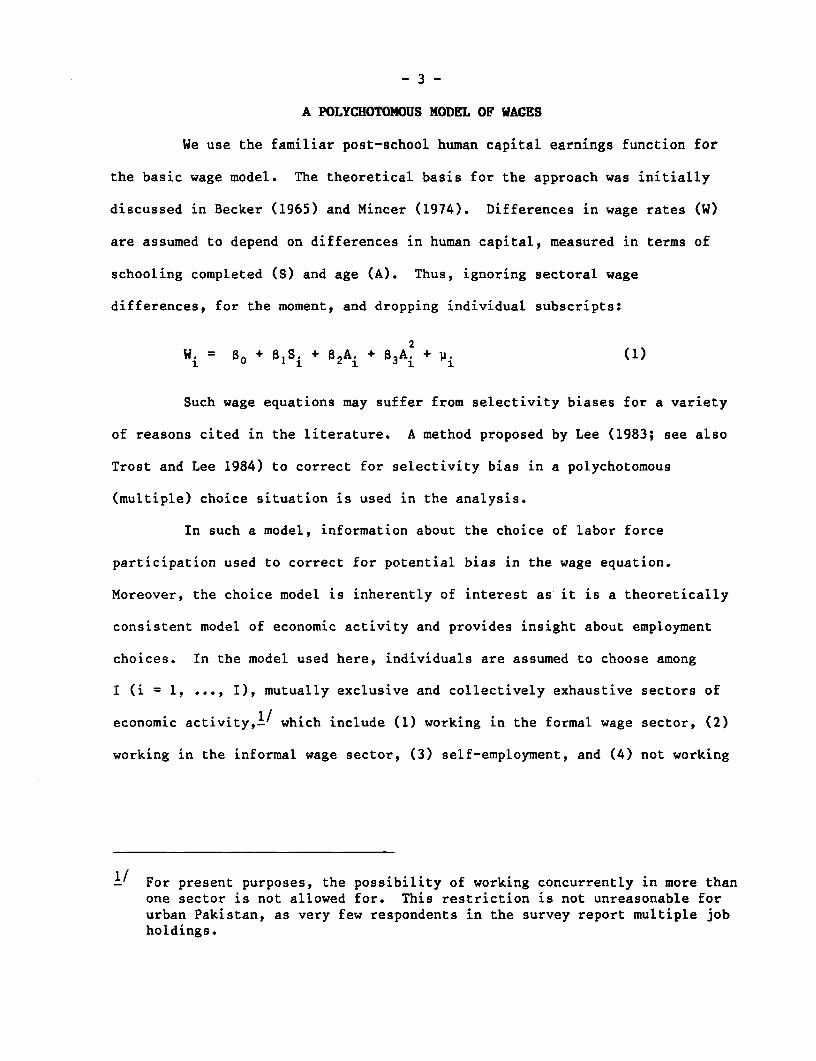
TABLE OF CONTENTS
Introduction .......... * ..**................. ........................l
A Polychotomous Model of Wages ....................................*..*....*..*....**. 3
Data and Context ..................................................9
Empirical Results.......-.............. .- o .... ...... 13
Labor Force Participation Equations ... ........ e.... 14Wage Equations. ........ ... . ..... ............ .e.21
Conclusions .. ..9-9 .....9...9..9...........99 ..99.....9 9......... . 25
References ....... .. ......... .. .......... 27
LIST OF TABLES
Table 1: Employment Activities, Weekly Hours Worked, and Wages ofIndividuals not enrolled in School, Males by Age........ 10
Table 2: Variable Means for Labor Supply Equations. .................12
Table 3: Labor Force Participation Models; Urban Pakistani Males,25 Years and Older.. .. ..... ..... 15
Table 4: Labor Force Participation Models; Urban Pakistani Males,10-25 Years Old..... .. . .. ..-. ... ...0.19
Table 5: Selectivity Corrected Wage Equations, Regulated andUnregulated Sectors. ...... o ............... o ..... 22
Table 6: Representative Wages Predicted in the Wage Equations.......24

INTRODUCTION
The analysis of wage formation and labor supply decisions must
confront the fact that labor markets are often not homogeneous. This may be
particularly true for developing countries in which a formal sector--often
regulated and unionized--exists in parallel to an informal wage-earning sector
as well as to a large group of self-employed traders and artisans. The
existence of qualitatively different sectors is not, however, in itself
evidence that skills are rewarded differently in different sectors; these
skills may themselves determine where employment will be. Nor are there
necessarily any a priori expectations about what direction wage differentials
may take if they occur. While nonmarket forces in the formal sector may raise
wages relative to informal sector, it may also be the case that the
government--which dominates the formal sector--pursues an equity-oriented wage
policy that compresses wages. Hence, Lindauer and Sabot (1983) found a
substantial wage premium for government employees in Tanzania while Corbo and
Stelcner (1983) found wages slightly higher in the private sector in Chile.
Regardless of the direction of the difference, its very existence
poses a problem. It is logical to expect workers to prefer the sector with
higher wages and some selection criteria--either by the employer based on
worker characteristics or employees based on their preferences and long-term
strategies--is likely operating. As recently reported by van der Gaag and
Vijverberg (1988), failure to account for the selection process within a
segmented market can result in misleading conclusions about the sign as well
as the magnitude of wage differences.
-2-
The study examines the structure of urban labor markets in Pakistan,
focusing in particular on wage formation and returns to education. Empirical
work is based on a survey of 1,000 low-income urban households administered in
1986. We identify three distinct segments of the labor market: the self-
employed, wage workers in the informal sector, and wage workers in the formal
sector (85 percent of whom are government workers). An intuitively plausible
picture of individual job search and labor market participation decisions is
obtained using a nested multinomial logit model. The results of this model
are then used to estimate selectivity-corrected wage equations for the two
wage sectors--formal and informal--using a modification of an approach
described in Lee (1983) and Trost and Lee (1984).
The underlying participation equations are in themselves of interest
because Pakistan has a relatively large proportion of economically inactive
males. It is important to determine whether these individuals represent the
educated unemployed with high reservation wages anticipating a formal sector
job, or unskilled workers unable (or unwilling) to enter the job market at any
level. Our results suggest that both explanations may be relevant for
different segments of the potential workforce--older inactive men tend to have
few skills while younger aged nonparticipants include a relatively high
proportion of skilled individuals.
The paper first describes the methodology used for model estimation,
and briefly overviews the urban employment situation in Pakistan. It then
presents empirical results and summarizes the study findings.
A POLYCHOTOMOUS MODEL OF WAGES
We use the familiar post-school human capital earnings function for
the basic wage model. The theoretical basis for the approach was initially
discussed in Becker (1965) and Mincer (1974). Differences in wage rates (W)
are assumed to depend on differences in human capital, measured in terms of
schooling completed (S) and age (A). Thus, ignoring sectoral wage
differences, for the moment, and dropping individual subscripts:
2
wi =So + s i + 82 Ai + 33Ai + Vi (1)
Such wage equations may suffer from selectivity biases for a variety
of reasons cited in the literature. A method proposed by Lee (1983; see also
Trost and Lee 1984) to correct for selectivity bias in a polychotomous
(multiple) choice situation is used in the analysis.
In such a model, information about the choice of labor force
participation used to correct for potential bias in the wage equation.
Moreover, the choice model is inherently of interest as it is a theoretically
consistent model of economic activity and provides insight about employment
choices. In the model used here, individuals are assumed to choose among
I (i = 1, ... , I), mutually exclusive and collectively exhaustive sectors of
economic activity,!' which include (1) working in the formal wage sector, (2)
working in the informal wage sector, (3) self-employment, and (4) not working
1/ For present purposes, the possibility of working concurrently in more thanone sector is not allowed for. This restriction is not unreasonable forurban Pakistan, as very few respondents in the survey report multiple jobholdings.
- 4 -
at all. In keeping with previous work (see, for example, Hill 1983; Trost and
Lee 1984; Khandker 1987), individual preferences are described by a well-
behaved utility function (U) whose arguments include leisure time (1), a
Hicksian composite commodity (C), and a vector of exogenous variables
affecting employment choices (R).
U = U(l, C; R) (2)
The function is maximized subject to time and income constraints.
The likelihood of being employed is a function of the market wage and
the individual's demand for leisure; if the wage offer (W.ii) in any sector i
for individual j exceeds the individual's shadow wage rate (Wrj), he or she
will participate in the labor market. Further, he or she will choose to work
in that labor market segment that yields the highest utility, where the
utility function is defined in terms of the market wage (W. ), exogenous or
nonwage income (Y.), the endowment of time (T.), and other exogenous variables
specific to the individual (Ri).
Vij = V(wip, Yj, Tj; R.) (3)
Yij is assumed to be a linear in parameters indirect utility function. It can
be decomposed into stochastic and nonstochastic elements, e.g.:
vij = 1i xij + 1iJ
where iXij represents the known or nonstochastic component for market sector
i and n.. is the (stochastic) disturbance term.:LJ
Following McFadden (1973, 1976, 1981) individuals are assumed to
choose outcome i from a set of K alternatives (k = formal wage, informal wage,
self-employed, inactive) if the utility associated with outcome i is higher
than for any other outcome. Thus, i is chosen if
Vi > Max Vk (k = 1, ... , K, i # k) (5)
Using the stochastic specification in (4),
Pi = Pr (Vi > Vk I k = 1, ... , K, i # k) (6)
= Pr (a.Xij . ni > 3kxkj + nkj ;
for all k = 1, ... , K, i # k)
= Pr (.i Xi j BkXkXk > nkj - lij )
If the ni's are distributed IID Gumbel, the difference in the stochastic
portions of the utility function (n k - iij ) has a logistic distribution and
model is multinomial logit. The choice probabilities can be computed in
closed form as:
exp (X.)
iji exp (8kXkj) (7)
k=1, ... , K
The model specified in (7) must conform to the independence from
irrelevant alternatives (IIA) property. Under IIA, the ratio of the
probability of choosing some alternative i to the probability of choosing k is
independent of the set of alternatives in the model. The condition is violated
if there is correlation between some of the unobserved or random components of
the indirect utility functions (for example, the nik's are not independent).
In such a case, alternatives can be partitioned into subsets within which IIA
holds, and a nested multinomial or GEV-type model used to account for between
subset IIA violations (McFadden, 1981; Amemiya 1981; Train 1986). It is
important to note that how one actually partitions the alternatives is deter-
mined by expected correlations within the error structure of the model, and
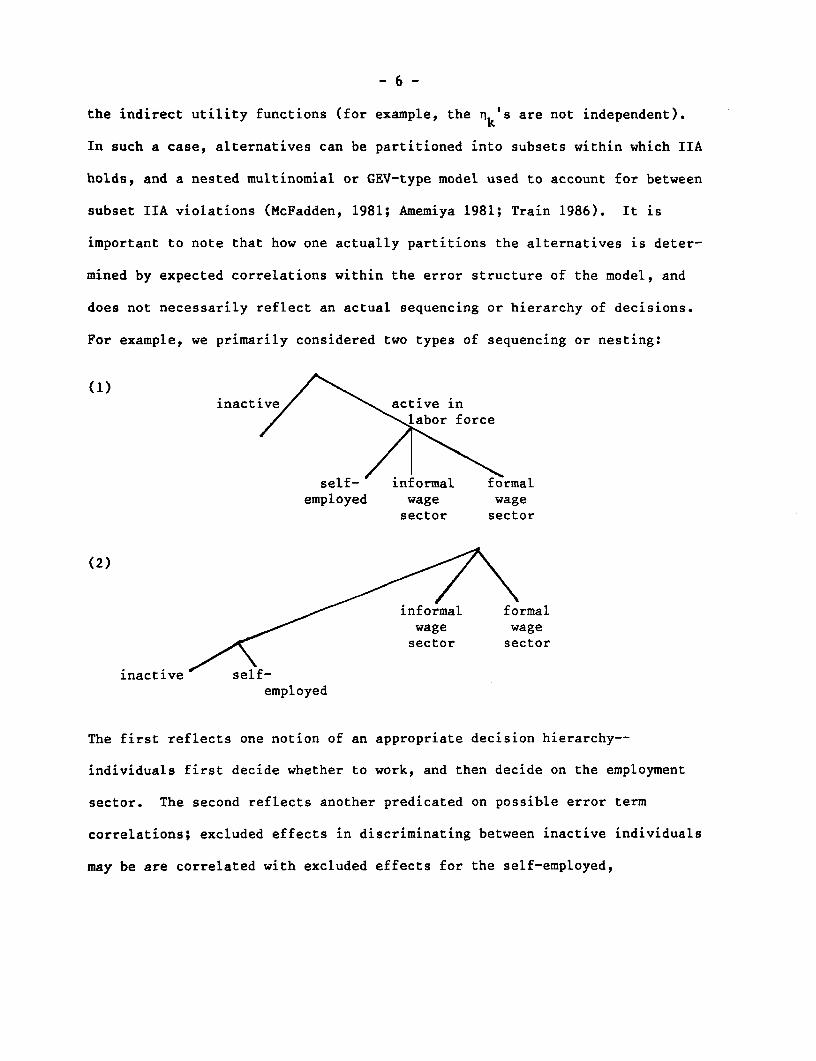
does not necessarily reflect an actual sequencing or hierarchy of decisions.
For example, we primarily considered two types of sequencing or nesting:
inactive a ctive in/ < ~~~aor force
(1)1
self- informal formalemployed wage wage
sector sector
(2)
informal formalj -- ~~~wage wage
sector sector
inactive self-employed
The first reflects one notion of an appropriate decision hierarchy--
individuals first decide whether to work, and then decide on the employment
sector. The second reflects another predicated on possible error term
correlations; excluded effects in discriminating between inactive individuals
may be are correlated with excluded effects for the self-employed,
particularly those self-employed individuals who work few hours in very
marginal activities. Note that the limiting case is a simple, non-nested,
four-way logit model.
The GEV model can be estimated sequentially or at a single pass using
full-information maximum likelihood. The former was chosen on the basis of
computational tractability, despite possible efficiency losses (Small and
Brownstone 1982). The model was estimated in two steps--a conditional logit
model is used to parametize the indirect utility function(s) for the lower
nest, and these results then used by means of an "inclusive value," for
example:
loge el$s/ )Xs (8)
to estimate the correct marginal probabilities in the upper-level nest. Note
that X is a scale parameter reflecting the degree of independence (thus
1 - X is a measure of correlation) between alternatives within a subset of
alternatives. To be consistent with random utility theory, X should lie in
the unit interval. If X = 1, the model collapses into the standard
multinomial logit model. A measure greater than one suggests specification
error or inappropriate decision sequencing (Ben-Akiva 1973, Hensher 1986).
The parameters from the sector choice model are used to estimate
selectivity-corrected wage equations for formal and informal sector employees
by means of an approach described in Lee (1983) and Trost and Lee (1984).
According to this method, the selectivity corrected wage equations are
estimated in two stages by first estimating the multiple-outcome labor
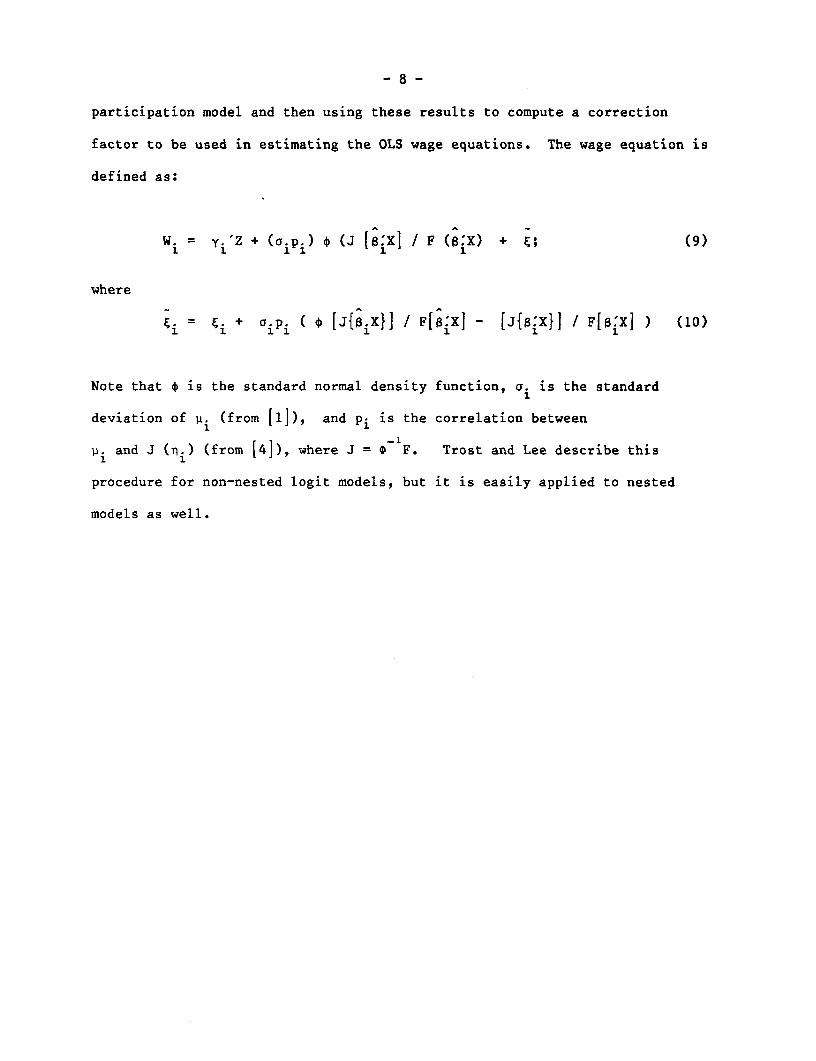
-8-
participation model and then using these results to compute a correction
factor to be used in estimating the OLS wage equations. The wage equation is
defined as:
Wi Yi Yi'Z + (a [3iX /J F (8:X) + (9)
where
=i si a ( [JifXI] / F[$8XJ - [,{i:X}J / F[B:X] ) (10)
Note that * is the standard normal density function, ai is the standard
deviation of pi (from [1]), and Pi is the correlation between1~~~~~~-
,pi and J (ni) (from L4]), where J = 0 F. Trost and Lee describe this
procedure for non-nested logit models, but it is easily applied to nested
models as well.
- 9 -
DATA AND CONTEXT
In most regions, the vast majority of adult males who are not
enrolled in school are in the labor force.21 In Pakistan, however, the male
labor force participation rate is surprisingly low, particularly among younger
age groups; according to the 1981 Population Census, some 17.7 percent of
urban males between the ages of 15 and 24 years were neither enrolled in
school nor in the labor force, and 12.6 percent of the men between the ages of
25 and 54 were likewise inactive. These numbers are substantiated by recent
Household Income and Expenditure Surveys (e.g. 1979 and 1984) and in the data
used for this study, a survey of 1,000 urban households residing in low-income
neighborhoods throughout Pakistan. The survey was conducted by the
International Food Policy Research Institute (IFPRI) and the Pakistan
Institute of Development Economics (PIDE) in 1986.31
As indicated in Table 1, the proportion of economically inactive men
in the sample is particularly high among younger age groups (10-14 years or
15-19 years of age, not presently enrolled in school). However, a surprising
proportion of men of "prime" working age are likewise inactive--some 11.4
percent of men between the ages of 20 and 54 are not in the labor force. With
the exception of the oldest group, whose members are past the mandatory
retirement age for many jobs, workers are equally as likely to be self-
employed as working for wages. The majority of wage employees are found in
21 For example, Lipton (1983) estimates that 95 percent of males between 15and 55 years of age are economically active.
3/ See Alderman et al. (1988) for details.
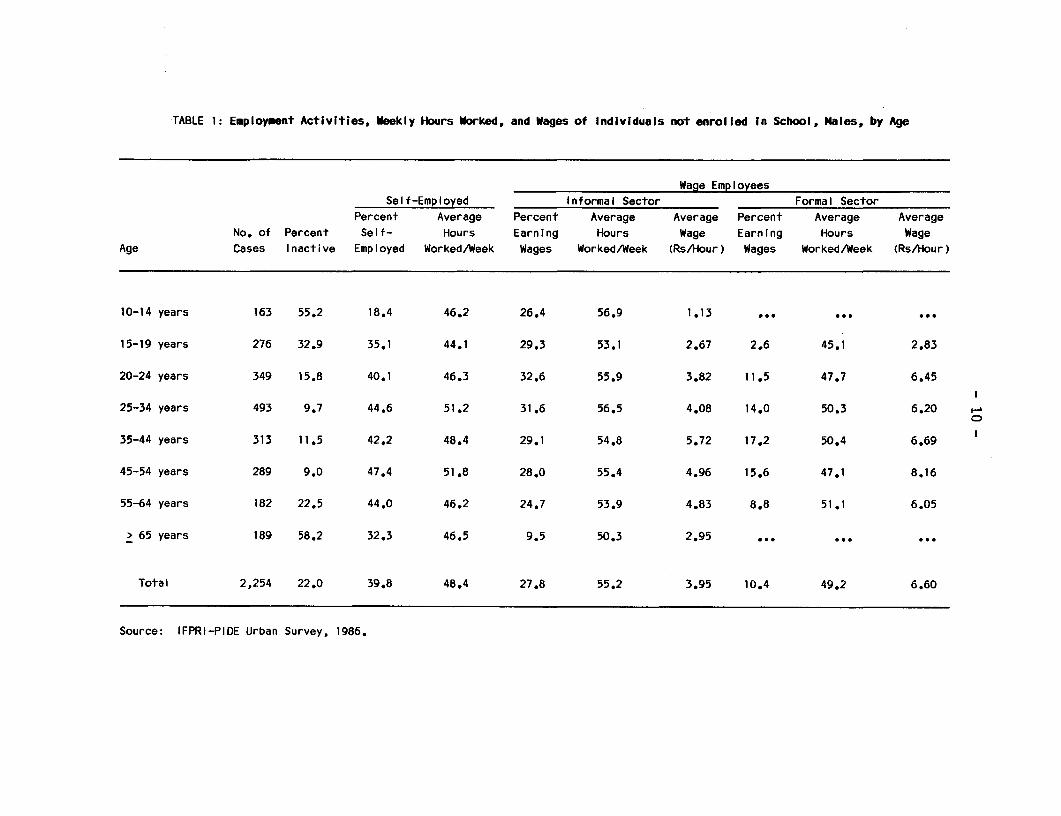
TABLE 1: Employment Activities, Weekly Hours Worked, and Wages of Individuals not enrolled in School, Males, by Age
Wage EmployeesSelf-Employed Informal Sector Formal Sector
Percent Average Percent Average Average Percent Average AverageNo, of Percent Self- Hours Earning Hours Wage Earning Hours Wage
Age Cases Inactive Employed Worked/Week Wages Worked/Week (Rs/Hour) Wages Worked/Week (Rs/Hour)
10-14 years 163 55.2 18.4 46.2 26.4 56.9 1.13 ...
15-19 years 276 32.9 35.1 44.1 29.3 53.1 2.67 2.6 45.1 2.83
20-24 years 349 15.8 40.1 46.3 32.6 55.9 3.82 11.5 47.7 6.45
25-34 years 493 9.7 44.6 51.2 31.6 56.5 4.08 14.0 50.3 6.20 i'
35-44 years 313 11.5 42.2 48.4 29.1 54.8 5.72 17.2 50.4 6.69
45-54 years 289 9.0 47.4 51.8 28.0 55.4 4.96 15.6 47.1 8.16
55-64 years 182 22.5 44.0 46.2 24.7 53.9 4.83 8.8 51.1 6.05
> 65 years 189 58.2 32.3 46.5 9.5 50.3 2.95 ... .....
Total 2,254 22.0 39.8 48.4 27.8 55.2 3.95 10.4 49.2 6.60
Source: IFPRI-PIDE Urban Survey, 1986.
the informal sector. Note that average wages peak somewhat earlier in the
informal sector and are also lower than in the formal sector,4/ and wage
workers in the informal sector typically work longer hours than those in the
formal sector.
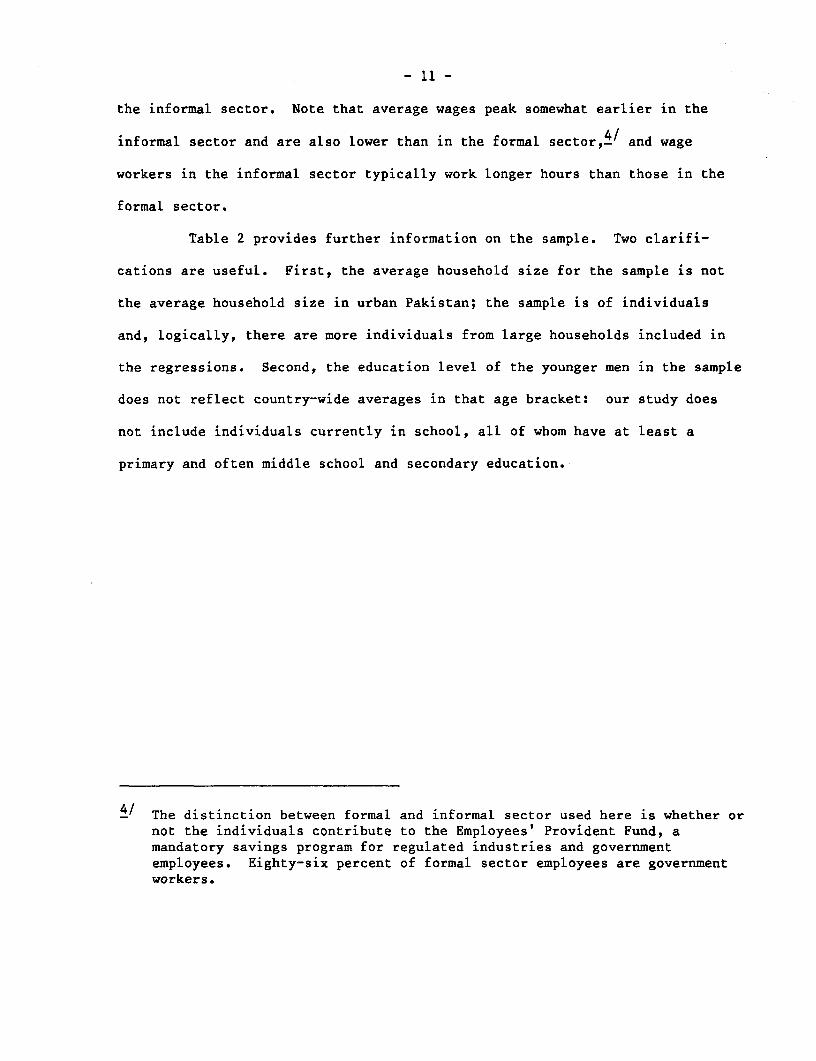
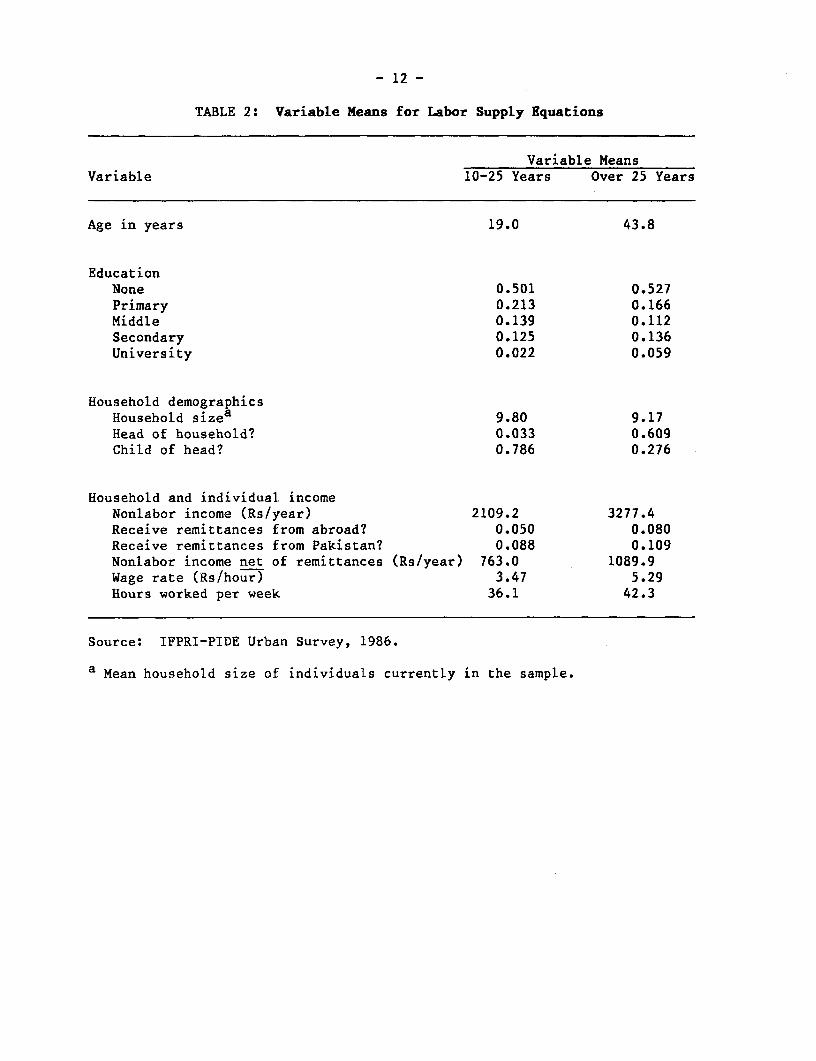
Table 2 provides further information on the sample. Two clarifi-
cations are useful. First, the average household size for the sample is not
the average household size in urban Pakistan; the sample is of individuals
and, logically, there are more individuals from large households included in
the regressions. Second, the education level of the younger men in the sample
does not reflect country-wide averages in that age bracket: our study does
not include individuals currently in school, all of whom have at least a
primary and often middle school and secondary education.
4I The distinction between formal and informal sector used here is whether ornot the individuals contribute to the Employees' Provident Fund, amandatory savings program for regulated industries and governmentemployees. Eighty-six percent of formal sector employees are governmentworkers.
- 12 -
TABLE 2: Variable Means for Labor Supply Equations
Variable MeansVariable 10-25 Years Over 25 Years
Age in years 19.0 43.8
EducationNone 0.501 0.527Primary 0.213 0.166Middle 0.139 0.112Secondary 0.125 0.136University 0.022 0.059
Household demographicsHousehold sizea 9.80 9.17Head of household? 0.033 0.609Child of head? 0.786 0.276
Household and individual incomeNonlabor income (Rs/year) 2109.2 3277.4Receive remittances from abroad? 0.050 0.080Receive remittances from Pakistan? 0.088 0.109Nonlabor income net of remittances (Rs/year) 763.0 1089.9Wage rate (Rs/hour) 3.47 5.29Hours worked per week 36.1 42.3
Source: IFPRI-PIDE Urban Survey, 1986.
a Mean household size of individuals currently in the sample.
- 13 -
EMPIRICAL RESULTS
For purposes of estimation, the sample was partitioned by age into
two groups: (1) males, 10-25 years old, not presently enrolled in school; and
(ii) males, 25 years and older. The partitioning allows for age-related
differences in basic determinants of labor force participation (where we do
expect differences) and wages (where we do not necessarily expect
differences). Consider, for example, labor force participation: in general,
one expects to find a positive relationship between wages (and thereby
education) and work participation. However, well-educated younger men may
have to wait for some period of time to obtain a "good" job, and thus be
unemployed despite high levels of education. In contrast, well-educated older
men are less likely to be outside the labor force. In the first case, one is
likely to find a negative relationship between work participation and
education, while in the second, a positive relationship.
The results which are the principal concern of this study--the impact
of education on wages and the differences in wages across sectors--are
presented in Tables 5 and 6. Before discussing the wage equations, however,
it is useful to discuss the underlying selection process. Tables 3 and 4 show
nested and non-nested labor force participation models for adult men and young
men, respectively. In both cases, estimation results indicate that nesting is
appropriate: the coefficient for the inclusive value in the upper-level nest
lies between 0 and 1, and is significantly different than 1. Furthermore, the
sequencing structure studied was found superior to alternative structures.5/
5/ These tended to yield inclusive value coefficients outside the unitinterval. This indicates inappropriate sequencing.
- 14 -
A plausible interpretation of these results is that the errors in the
estimates of the decision to be self-employed or inactive are correlated.
This rejects IIA and can be interpreted as implying that individuals perceive
similarities between self-employment and unemployment that do not hold between
these sectors and the wage sectors.
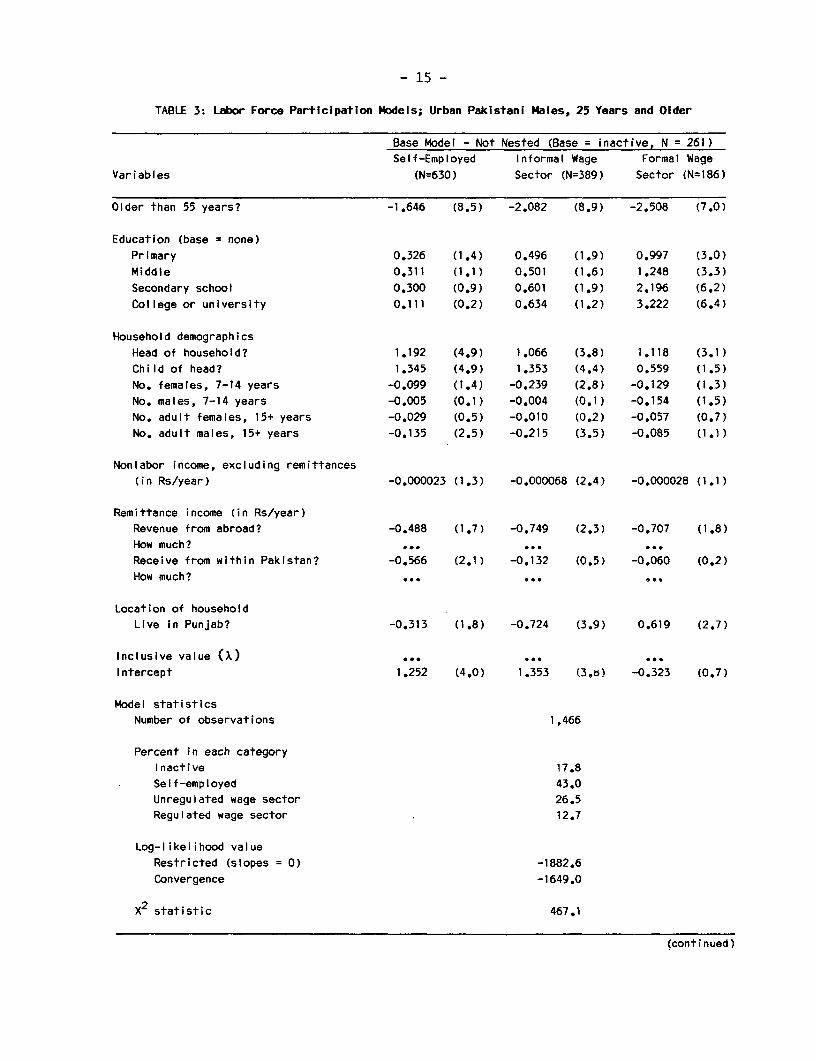
Labor Force Participation Equations
Table 3 presents results of logit equations for labor participation
of adult males. The reported coefficients represent the difference in
probability of being in a particular labor category relative to the inactive
category. Of particular note in these equations is the impact of household
demographics, the strong but variable impacts of educational achievement, and
the importance of exogenous (or nonlabor) income. Regarding demographics:
age and gender composition tends to be negatively (but generally not signif-
icantly) correlated with labor force participation. Effects are strongest for
adult males--the greater the number of adult men living in the household, the
lower the probability that any particular man is in the labor force. Indivi-
duals who are not part of the direct household lineage--neither the household
head nor offspring of the head--are also less likely to be employed. These
cousins, siblings, and other relatives that make up the extended family
network are apparently benefiting from an internal support network, but the
direction of causality from unemployment to residence in the non-natal family
or vice-versa cannot be directly inferred from the cross-sectional data.
Regarding education and exogenous income effects: own education
(particularly at secondary and university levels) has a strong and significant
- 15 -
TABLE 3: Labor Force Participation Models; Urban Pakistani Males, 25 Years and Older
Base Model - Not Nested (Base = inactive, N = 261)Self-Employed Informal Wage Formal Wage
Variables (N=630) Sector (N=389) Sector (N=186)
Older than 55 years? -1.646 (8.5) -2.082 (8.9) -2.508 (7.0)
Education (base = none)Primary 0.326 (1.4) 0.496 (1.9) 0.997 (3.0)
Middle 0.311 (1.1) 0.501 (1.6) 1.248 (3.3)
Secondary school 0.300 (0.9) 0.601 (1.9) 2.196 (6.2)
College or university 0.111 (0.2) 0.634 (1.2) 3.222 (6.4)
Household demographics
Head of household? 1.192 (4.9) 1.066 (3.8) 1.118 (3.1)
Child of head? 1.345 (4.9) 1.353 (4.4) 0.559 (1.5)
No. females, 7-14 years -0.099 (1.4) -0.239 (2.8) -0.129 (1.3)
No. males, 7-14 years -0.005 (0.1) -0.004 (0.1) -0.154 (1.5)
No. adult females, 15+ years -0.029 (0.5) -0.010 (0.2) -0.057 (0.7)
No. adult males, 15+ years -0.135 (2.5) -0.215 (3.5) -0.085 (1.1)
Nonlabor income, excluding remittances
(in Rs/year) -0.000023 (1.3) -0.000068 (2.4) -0.000028 (1.1)
Remittance income (in Rs/year)
Revenue from abroad? -0.488 (1.7) -0.749 (2.3) -0.707 (1.8)
How much? ... ...
Receive from within Pakistan? -0.566 (2.1) -0.132 (0.5) -0.060 (0.2)
How much? ... ...
Location of householdLive in Punjab? -0.313 (1.8) -0.724 (3.9) 0.619 (2.7)
Inclusive value (x) ... ...
Intercept 1.252 (4.0) 1.353 (3.) -0.323 (0.7)
Model statisticsNumber of observations 1,466
Percent in each categoryInactive 17.8
Self-employed 43.0Unregulated wage sector 26.5Regulated wage sector 12.7
Log-likelihood value
Restricted (slopes = 0) -1882.6
Convergence -1649.0
x2 statistic 467.1
(continued)
- 16 -
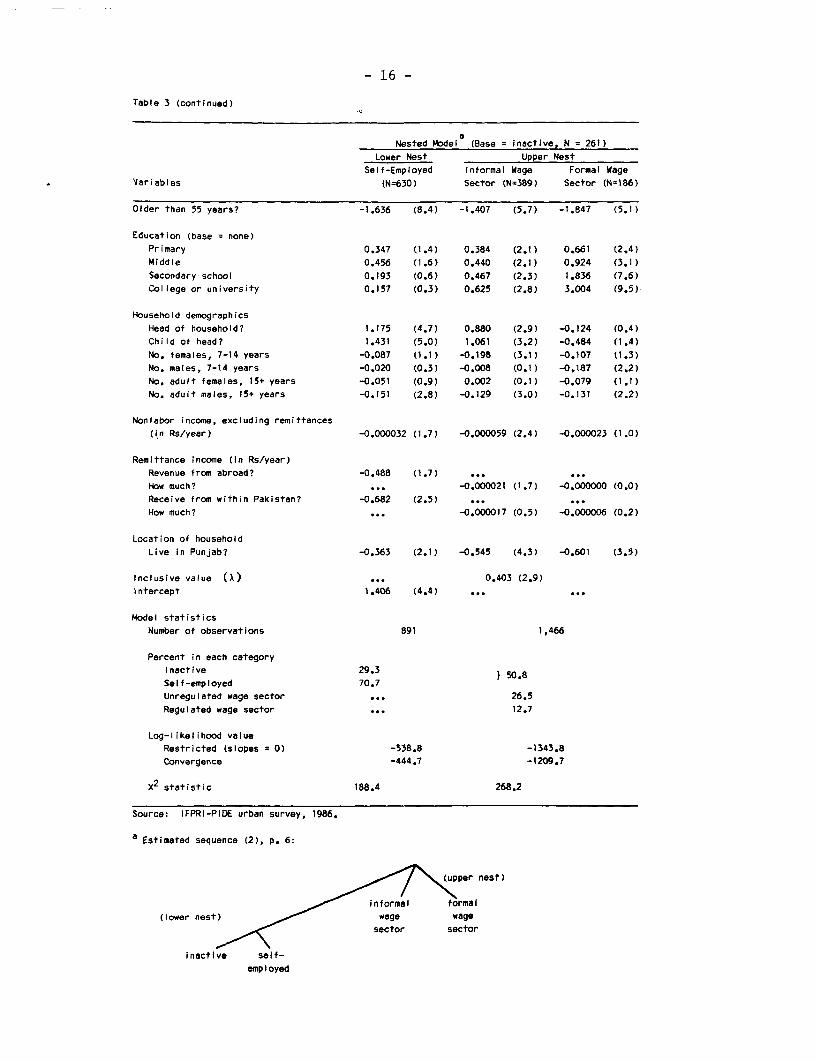
Table 3 (continued)
aNested Model (Base = inactive, N = 261)
Lower Nest Upper Nest
Self-Employed Informal Wage Formal WageVariables (N=630) Sector (N=389) Sector (N=186)
Older than 55 years? -1.636 (8.4) -1.407 (5.7) -1.847 (5.1)
Education (base = none)Primary 0.347 (1.4) 0.384 (2.1) 0.661 (2.4)
Middle 0.456 (1.6) 0.440 (2.1) 0.924 (3.1)
Secondary school 0.193 (0.6) 0.467 (2.3) 1.836 (7.6)
College or university 0.157 (0.3) 0.625 (2.8) 3.004 (9.5)
Household demographics
Head of household? 1.175 (4.7) 0.880 (2.9) -0.124 (0.4)
Child of head? 1.431 (5.0) 1.061 (3.2) -0.484 (1.4)
No. females, 7-14 years -0.087 (1.1) -0.198 (3.1) -0.107 (1.3)
No. males, 7-14 years -0.020 (0.3) -0.008 (0.1) -0.187 (2.2)
No. adult females, 15+ years -0.051 (0.9) 0.002 (0.1) -0.079 (1.1)
No. adult males, 15+ years -0.151 (2.8) -0.129 (3.0) -0.131 (2.2)
Nonlabor incorme, excluding remittances
(in Rs/year) -0.000032 (1.7) -0.000059 (2.4) -0.000023 (1.0)
Remittance income (in Rs/year)Revenue from abroad? -0.488 (1.7) ... ...
How much? ... -0.000021 (1.7) -0.000000 (0.0)Receive from within Pakistan? -0.682 (2.5) ... ...
How much? ... -0.000017 (0.5) -0.000006 (0.2)
Location of household
Live in Punjab? -0.363 (2.1) -0.545 (4.3) -0.601 (3.5)
Inclusive value (x) ... 0.403 (2.9)Intercept 1.406 (4.4) ... .-
Model statistics
Number of observations 891 1,466
Percent in each category
Inactive 29.3 1 50.8Self-employed 70.7
Unregulated wage sector ... 26.5Regulated wage sector ... 12.7
Log-likelihood value
Restricted (slopes = 0) -538.8 -1343.8
Convergence -444.7 -1209.7
x2 statistic 188.4 268.2
Source: IFPRI-PIDE urban survey, 1986.
a Estimated sequence (2), p. 6:
per nest)
informal formal
(lower nest) wage wagesector sector
inactive self-
employed

- 17 -
effect on the likelihood of working in the formal wage sector, and a weaker,
although still generally significant, effect on the likelihood of working in
the informal wage sector. In short, adult men who are either inactive or
self-employed are generally less educated than men who are working for
wages. In addition, the relationship between exogenous income and work
participation is particularly interesting for Pakistan. Consistent with what
theory predicts, equations show the "standard" income effect, e.g. as
exogenous income (net of remittances) rises, work participation falls,
particularly participation in the informal sector (not surprisingly, formal
sector coefficients, while negative, are not statistically significant). An
alternative way of stating the same result is that the higher the income level
the higher an individual's reservation wage, hence lowering the likelihood
that he will be in the labor force. We have identified separate income
effects for domestic and foreign remittances, which constitute an important
source of income for many Pakistani households.61 Interestingly, individuals
living in households who receive remittances, particularly remittances from
abroad, are notably less likely to be employed than individuals living in
households who do not receive remittances.
These results of the modeling exercise suggest important consi-
derations concerning employment policy. The low participation rates of
Pakistani men appear to be primarily related to low education endowments
(implying low expected wages) and high levels of exogenous income (implying
high reservation wages), derived in large part from foreign remittances. Our
6/ According to the IFPRI/PIDE survey, two-thirds of nonlabor income isderived from remittances.
- 18 -
results suggest that Pakistan has a large pool of uneducated and likely
inexperienced adult men, often residing in an extended family, who are ill-
equipped to enter the labor force, let alone find a job should exogenous
incomes fall. This suggests that the recent decrease in labor migration to
the Middle East and the concomitant (and continuing) drop in remittances may
have a much stronger impact on wages and unemployment than anticipated; not
only will returning migrants attempt to enter the domestic workforce, but some
tens of thousands of previously inactive men may choose to enter the labor
force as well.
Table 4 shows nested and non-nested participation models for young
Pakistani men. While exogenous income effects are similar to those found for
older men, other coefficients suggest that a rather different employment
decision process typifies the younger cohort. In particular, better educated
young men are generally more likely to be unemployed than working in either
part of the informal sector (e.g. self-employed or the unregulated wage
sector), and less likely to be unemployed than working in the formal wage
sector. This lends support to our earlier contention that inactive young men
are likely to have different characteristics than inactive older men; many of
them are better educated than those in their age cohort presently working in
the informal sector, and evidently not willing to begin work until they find a
job in the formal sector.
Young men who are heads of household tend to work with greater
frequency than non-heads, likely due to economic necessity. In addition, the
probability of employment falls with increasing levels of the household head's
education. This may reflect future schooling aspirations (the son is outside
the labor force because he plans shortly to attend college or some other
- 19 -
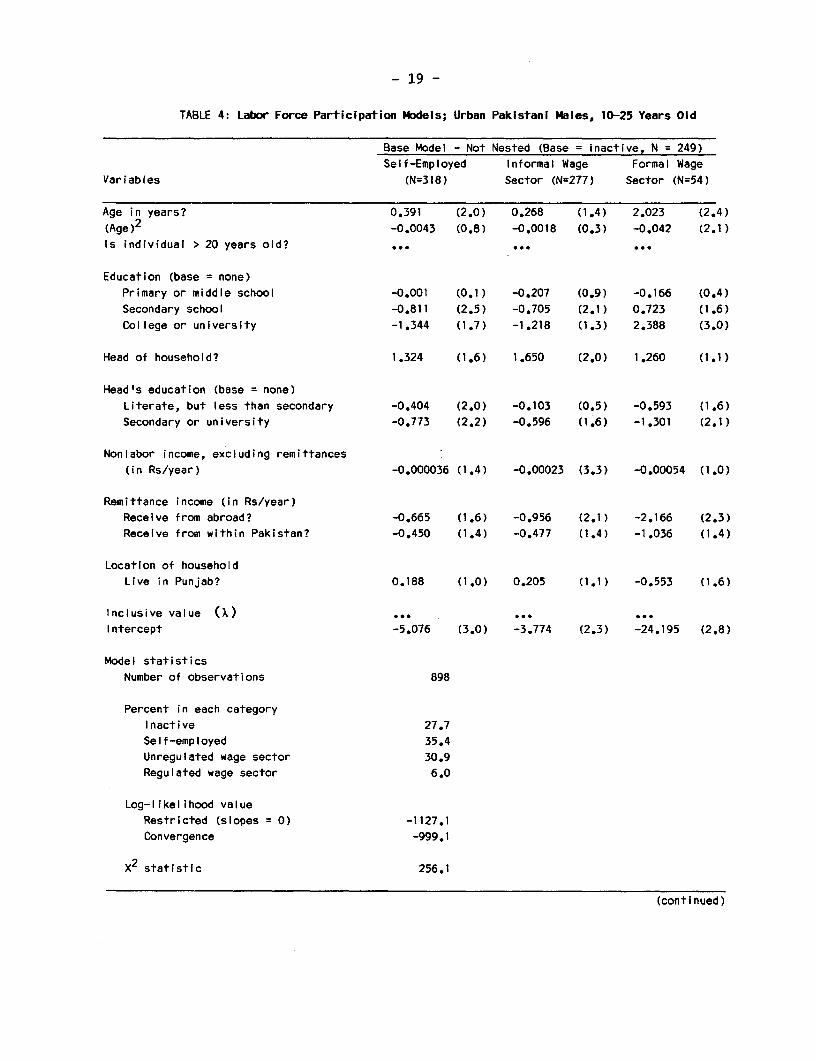
TABLE 4: Labor Force Participation Models; Urban Pakistani Males, 10-25 Years Old
Base Model - Not Nested (Base = inactive, N = 249)Self-Employed Informal Wage Formal Wage
Variables (N=318) Sector (N=277) Sector (N=54)
Age in years? 0.391 (2.0) 0.268 (1.4) 2.023 (2.4)(Age)2 -0.0043 (0.8) -0.0018 (0.3) -0.042 (2.1)
Is individual > 20 years old? ...
Education (base = none)
Primary or middle school -0.001 (0.1) -0.207 (0.9) -0.166 (0.4)Secondary school -0.811 (2.5) -0.705 (2.1) 0.723 (1.6)College or university -1.344 (1.7) -1.218 (1.3) 2.388 (3.0)
Head of household? 1.324 (1.6) 1.650 (2.0) 1.260 (1.1)
Head's education (base = none)Literate, but less than secondary -0.404 (2.0) -0.103 (0.5) -0.593 (1.6)
Secondary or university -0.773 (2.2) -0.596 (1.6) -1.301 (2.1)
Nonlabor income, excluding remittances(in Rs/year) -0.000036 (1.4) -0.00023 (3.3) -0.00054 (1.0)
Remittance income (in Rs/year)Receive from abroad? -0.665 (1.6) -0.956 (2.1) -2.166 (2.3)Receive from within Pakistan? -0.450 (1.4) -0.477 (1.4) -1.036 (1.4)
Location of household
Live in Punjab? 0.188 (1.0) 0.205 (1.1) -0.553 (1.6)
Inclusive value (X) ... ...Intercept -5.076 (3.0) -3.774 (2.3) -24.195 (2.8)
Model statistics
Number of observations 898
Percent in each category
Inactive 27.7
Self-employed 35.4
Unregulated wage sector 30.9Regulated wage sector 6.0
Log-likelihood valueRestricted (slopes = 0) -1127.1
Convergence -999.1
x2 statistic 256.1
(continued)
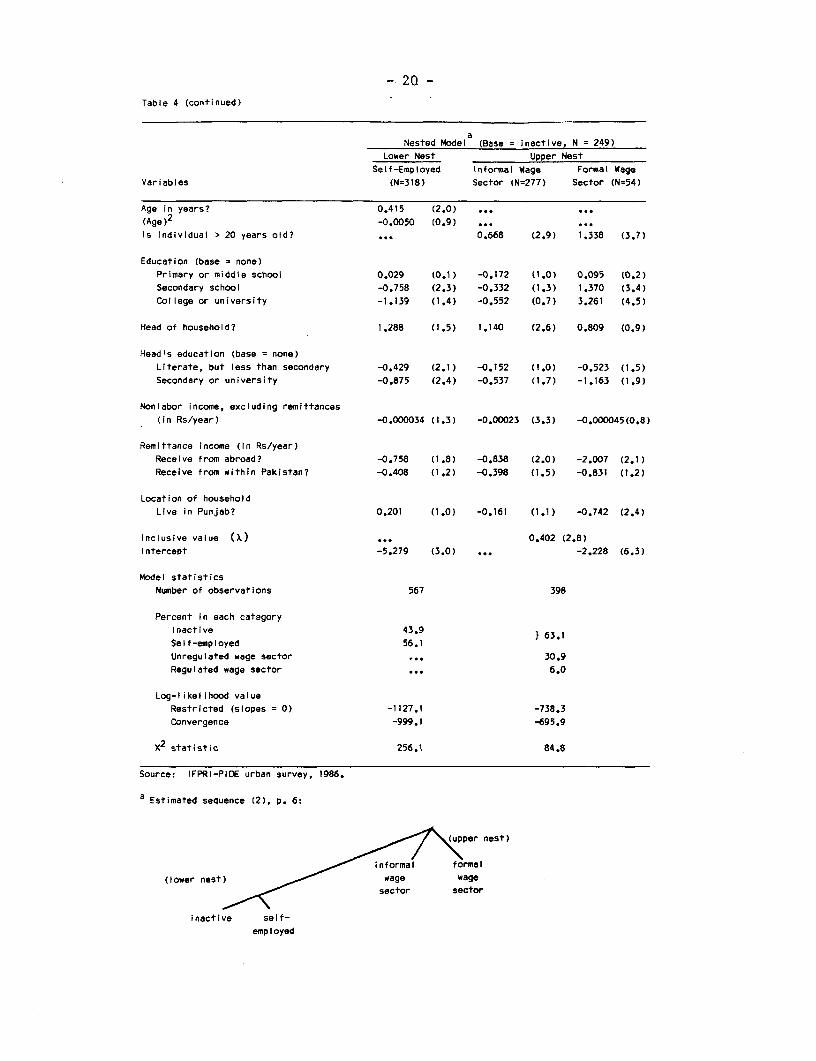
- 2Q -Table 4 (continued)
aNested Model (Base = inactive, N = 249)
Lower Nest Upper Nest
Self-Employed Informal Wage Formal Wage
Variables (N=318) Sector (N=277) Sector (N=54)
Age in years? 0.415 (2.0) ... ...
(Age)2
-0.0050 (0.9) ... ...
Is individual > 20 years old? ... 0.668 (2.9) 1.338 (3.7)
Education (base = none)Primary or middle school 0.029 (0.1) -0.172 (1.0) 0.095 (0.2)
Secondary school -0.758 (2.3) -0.332 (1.3) 1.370 (3.4)
College or university -1.139 (1.4) -0.552 (0.7) 3.261 (4.5)
Head of household? 1.288 (1.5) 1.140 (2.6) 0.809 (0.9)
Head's education (base = none)
Literate, but less than secondary -0.429 (2.1) -0.152 (1.0) -0.523 (1.5)
Secondary or university -0.875 (2.4) -0.537 (1.7) -1.163 (1.9)
Nonlabor income, excluding remittances
(in Rs/year) -0.000034 (1.3) -0.00023 (3.3) -0.000045(0.8)
Remittance income (in Rs/year)
Receive from abroad? -0.758 (1.8) -0.838 (2.0) -2.007 (2.1)
Receive from within Pakistan? -0.408 (1.2) -0.398 (1.5) -0.831 (1.2)
Location of household
Live in Punjab? 0.201 (1.0) -0.161 (1.1) -0.742 (2.4)
Inclusive value (x) ... 0.402 (2.8)
Intercept -5.279 (3.0) ... -2.228 (6.3)
Model statistics
Number of observations 567 398
Percent in each category
Inactive 43.9 } 63.1
Self-employed 56.1
Unregulated wage sector , 30.9
Regulated wage sector ... 6.0
Log-likelihood value
Restricted (slopes = 0) -1127.1 -738.3
Convergence -999.1 -695.9
x2 statistic 256.1 84.8
Source: IFPRI-PIDE urban survey, 1986.
a Estimated sequence (2), p. 6:
per nest)
informal formal
(lower nest) ~Ilwage wagesector sector
inactive self-
employed
- 21 -
training) or represent yet another income effect. Interestingly, the head's
education has the strongest (negative) effect on the probability of being
employed in the formal sector, contrary to the positive effect of own
education.
Wage Equations
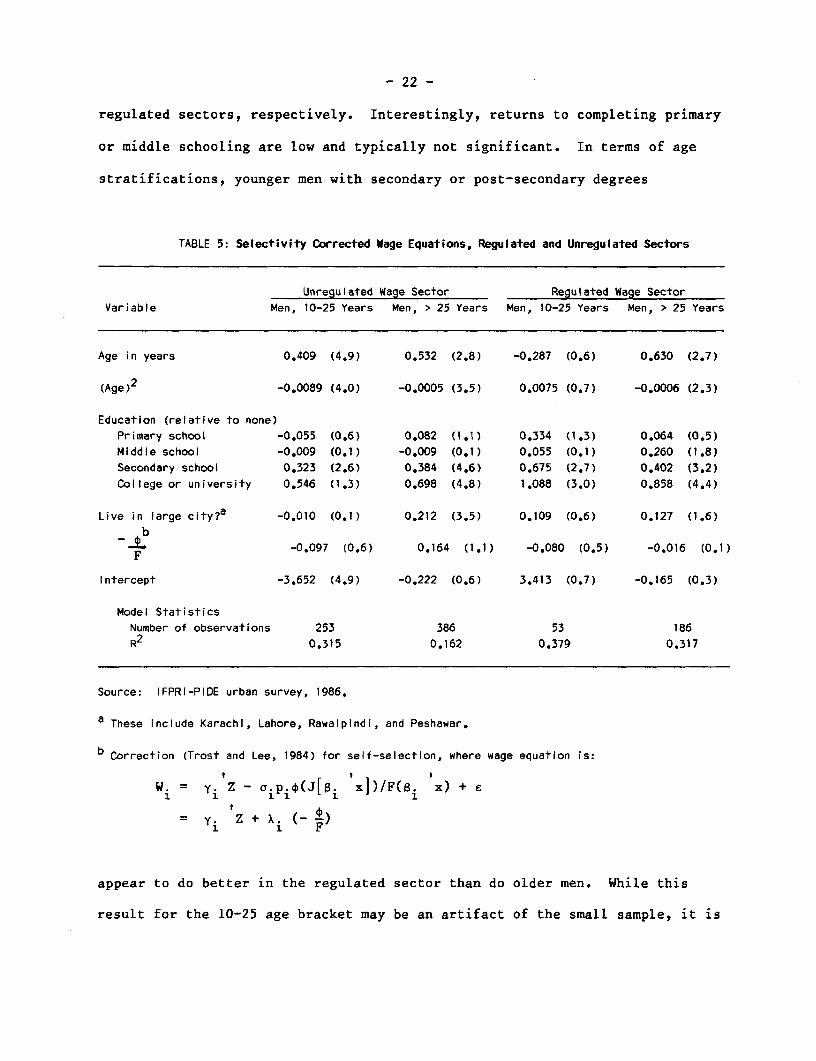
Table 5 presents selectivity-corrected wage equations. In the study,
schooling is represented by four dummy variables representing level completed
(primary, secondary, matric, university). This allows for different effects
of education at different levels. Age is used in lieu of work experience.
The age-based specification greatly simplifies estimates of returns to
education, one of desired outputs of the empirical work. In addition to
strict human capital variables, a regional dummy variable (residence in
Punjab) is included to account for labor market differences between urban
markets, and a dummy variable for large cities is included to control for
possible wage differences related to city (and labor market) size.
The percentage increase in wages attributable to higher education is
appreciable in both sectors and for both age groups. The most marked
difference between the regulated and unregulated wage sector is with regard to
the coefficient of post-secondary (e.g. college or university) education. The
wage increments attributable to (completing) post-secondary education are an
estimated 101 percent for adult men working in the unregulated wage sector, as
compared to 135 percent in the regulated sector, or roughly 7.1 and 9.7
percent, respectively, for every year of schooling completed. The effects of
secondary schooling are lower as expected. Moreover, they are quite similar
between the two sectors--47 percent and 49 percent for unregulated and
- 22 -
regulated sectors, respectively. Interestingly, returns to completing primary
or middle schooling are low and typically not significant. In terms of age
stratifications, younger men with secondary or post-secondary degrees
TABLE 5: Selectivity Corrected Wage Equations, Regulated and Unregulated Sectors
Unregulated Wage Sector Regulated Wage SectorVariable Men, 10-25 Years Men, > 25 Years Men, 10-25 Years Men, > 25 Years
Age in years 0.409 (4.9) 0.532 (2.8) -0.287 (0.6) 0.630 (2.7)
(Age)2 -0.0089 (4.0) -0.0005 (3.5) 0.0075 (0.7) -0.0006 (2.3)
Education (relative to none)
Primary school -0.055 (0.6) 0.082 (1.1) 0.334 (1.3) 0.064 (0.5)Middle school -0.009 (0.1) -0.009 (0.1) 0.055 (0.1) 0.260 (1.8)
Secondary school 0.323 (2.6) 0.384 (4.6) 0.675 (2.7) 0.402 (3.2)
College or university 0.546 (1.3) 0.698 (4.8) 1.088 (3.0) 0.858 (4.4)
Live in large city?a -0.010 (0.1) 0.212 (3.5) 0.109 (0.6) 0.127 (1.6)
bF -0.097 (0.6) 0.164 (1.1) -0.080 (0.5) -0.016 (0.1)
Intercept -3.652 (4.9) -0.222 (0.6) 3.413 (0.7) -0.165 (0.3)
Model Statistics
Number of observations 253 386 53 186R2 0.315 0.162 0.379 0.317
Source: IFPRI-PIDE urban survey, 1986.
a These include Karachi, Lahore, Rawalpindi, and Peshawar.
b Correction (Trost and Lee, 1984) for self-selection, where wage equation is:
w Ti Z - Cy x])/F(S. x) + e
i Yi i( F)
appear to do better in the regulated sector than do older men. While this
result for the 10-25 age bracket may be an artifact of the small sample, it is
- 23 -
consistent with the job search interpretation of the labor participation
equation for that group. Education effects in the unregulated sector were in
general found to be similar between age cohorts.
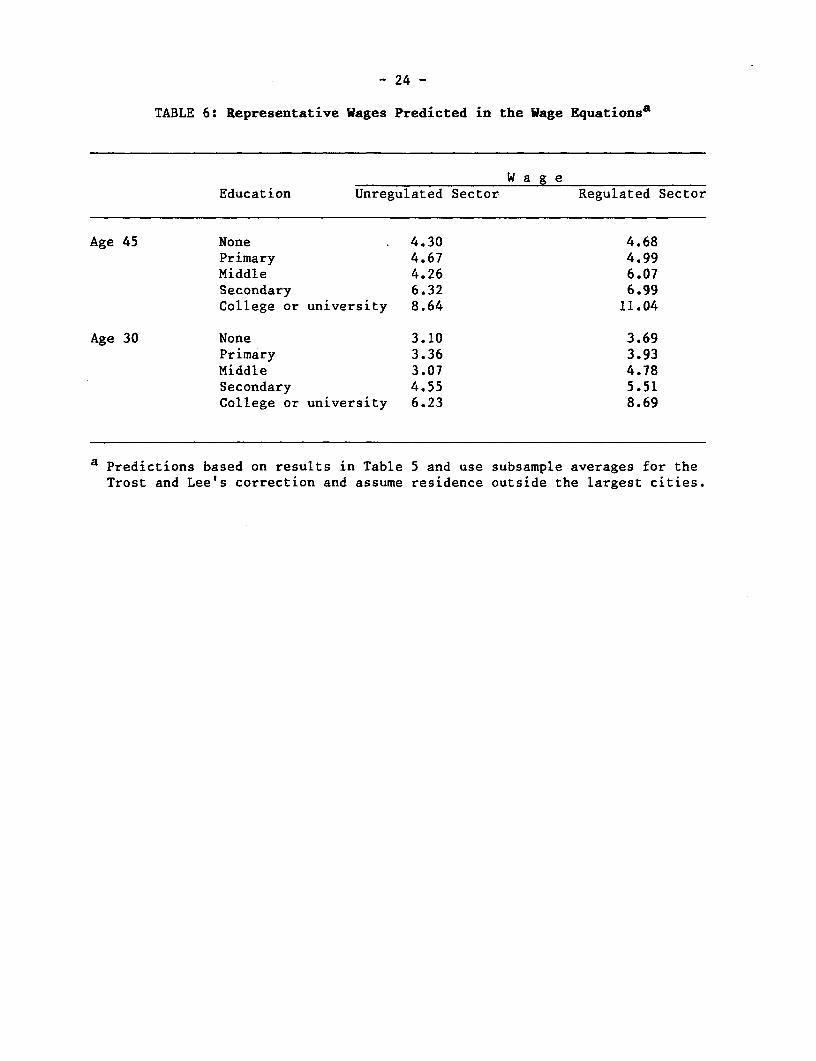
Table 6 shows estimated average wages for adult men aged 45 years and
30 years, by level of education. As expected, differentials between the
regulated and unregulated sectors increase with increasing levels of
education. For example, a 45-year-old man with primary education earns only 7
percent higher wages (4.67 Rs/hour as compared with 4.99 Rs/hour) in the
formal sector, while a college-educated 45- year-old man earns an estimated 28
percent higher wages (8.64 Rs/hour as compared with 11.04 Rs/hour).
If we compare Tables 1 and 6, it is clear that the difference in
average wages between regulated and unregulated sectors in Pakistan primarily
reflects differences in average levels of education between the sectors and
not differences in wages for equal skills, with the exception of the premium
for college graduates. This does not imply that the returns to individuals
are necessarily the same. The Employees Provident Fund, which is the
distinguishing characteristic of the formal sector, contributes 10 percent of
the individual's salary to a retirement fund. Moreover, as observed by van
der Gaag and Vijverberg (1988), other benefits such as paid vacations, health
insurance, and worker's compensation during illnesses, are more prevalent in
the formal sector.
- 24 -
TABLE 6: Representative Wages Predicted in the Wage Equationsa
W a g eEducation Unregulated Sector Regulated Sector
Age 45 None 4.30 4.68Primary 4.67 4.99Middle 4.26 6.07Secondary 6.32 6.99College or university 8.64 11.04
Age 30 None 3.10 3.69Primary 3.36 3.93Middle 3.07 4.78Secondary 4.55 5.51College or university 6.23 8.69
a Predictions based on results in Table 5 and use subsample averages for theTrost and Lee's correction and assume residence outside the largest cities.
- 25 -
CONCLUSIONS
Our results suggest that young, educated men in Pakistan's cities are
waiting to find employment in the formal sector rather than accepting a less
desirable job in the informal sector. Furthermore, this behavior makes good
sense; there appears to be an appreciable premium on wages in the formal
sector, particularly for college-educated males. Although wage premiums are
small for less educated men, (unmeasured) benefits are likely to be
substantially higher in the formal sector. There is also a higher probability
of finding employment in the formal sector as education levels increase. How-
ever, it is the difference in skills more than the premium itself which
accounts for the difference in average wages between the formal and informal
sectors.
Older men outside the labor force have very different characteristics
than younger men. In particular, they tend to be uneducated, likely have
little work experience, and often live in an extended family receiving
remittances from abroad. The likelihood of being (e.g. remaining) outside the
labor force is strongly influenced by exogenous or nonlabor income, which is
itself affected by remittance flows. Any significant drop in exogenous income
is likely to force some (previously inactive) men into the labor force, an
outcome which many of them are clearly ill-equipped to cope with. Thus, the
recent influx of workers returning from the Middle East may cause more severe
employment problems than previously anticipated. While the returning workers
will themselves likely find employment based on skills acquired in their
previous occupation, their remuneration will be far less than received in the
Middle East. The concomitant drop in household income may force previously
- 26 -
inactive and typically unskilled household members to seek, although not
necessarily find, employment.
Although not a formal test of market segmentation, the nesting
sequence which proved most suitable is plausible and consistent with a labor
market in which a number of self-employed individuals are marginalized in
petty trade and artisanal activities. While education explains entry into the
formal sector, household demographics and an alternative source of income
explains the difference in the probabilities of being inactive versus employed
in the informal sector. It was somewhat difficult to clearly distinguish
self-employed individuals from informal sector wage earners, particularly for
younger men. A more complete exploration of alternative nesting structures,
perhaps with detailed labor force histories and finer disaggregation of alter-
natives, may yield better insights. It is clear from our results, however,
that the urban labor market in Pakistan is far more heterogeneous than
conventional approaches typically allow for, and careful and more
disaggregated analyses can yield valuable insights regarding future employment
policy.
- 27 -
REFERENCES
Alderman, Harold, M. Ghaffar Chaudhry, and Marito Garcia. 1988. "Householdfood security in Pakistan: The ration shop system". Working papers onfood subsidies no. 4. Washington, D.C.: International Food PolicyResearch Institute, and Islamabad: Pakistan Institute of DevelopmentEconomics.
Amemiya, T. 1976. "Specification and estimation of a multinomial logitmodel". Technical Report No. 211, Institute of Mathematical Studies inthe Social Sciences, Stanford University.
Becker, Gary S. 1964. Human Capital. New York: Columbia University Press.
Ben-Akiva, Moshe. 1973. Structure of Passenger Travel Demand Models.Unpublished Ph.D. Thesis, Department of Civil Engineering, MassachusettsInstitute of Technology.
Corbo, Vittorio, and Morton Stelcner. 1983. "Earnings determination andlabour markets: Gran Santiago, Chile - 1978". Journal of DevelopmentEconomics, 12 (February/April): 251-266.
Government of Pakistan, Federal Bureau of Statistics. 1984. 1981 Populationcensus. Karachi.
_ 1984b. 1979 Household Income and Expenditure Survey. Karachi.
_ 1988. 1984 Household Income and Expenditure Survey. Karachi.
Hensher, David. 1986. "Sequential and full information maximum likelihoodestimation of a nested logit model". Review of Economics and Statistics,68 (November): 657-667.
Hill, Anne M. 1983. "Female labor force participation in developing anddeveloped countries - consideration of the informal sector". Review ofEconomics and Statistics, 65(3):459-468.
Khan, Shahrukh Rafi, and Mohammed Irfan. 1985. "Rates of returns to educa-tion and the determinants of earnings in Pakistan". Pakistan DevelopmentReview, XXIV (3 and 4): 671-680.
Khandker, Shahidur R. 1987. "Labor market participation of married women inBangladesh". Review of Economics and Statistics, 69(3): 536-541.
Lee, Lung-Fei. 1983. "Generalized econometric models with selectivity".Econometrica, 51 (March): 507-512.
Lindauer, David, and Richard Sabot. 1983. "The public/private wage differ-ential in a poor urban economy". Journal of Development Economics, 12(February/April): 137-152.
- 28 -
Lipton, Michael. 1983. Labor and poverty.' World Bank staff working papersno. 616. Washington, D.C.: World Bank.
McFadden, D. 1973. "Conditional logit analysis of qualitative choicebehavior", in Frontiers in Econometrics (ed. P. Zarembka). New York:Academic Press.
McFadden, D. 1976. "Quantal choice analysis: A Survey". Annals of Economicand Social Measurement, 5:363-390.
McFadden, D. 1981. "Econometric models of probabilistic choice", inStructural Analysis of Discrete Data with Econometric Applications, (eds.Manski, C., and D. McFadden). Cambridge, Mass: MIT Press.
Mincer, J. 1974. Schooling, Experience, and Earnings. New York: NBER andColumbia University Press.
Sahn, David, and Harold Alderman. "The effects of human capital on wages andthe determinants of labor supply in a developing country". Journal ofDevelopment Economics (forthcoming).
Small, Kenneth A., and David Brownstone. 1982. "Efficient estimation ofnested logit models: An application to trip timing". Research MemorandumNo. 296, Econometric Research Program, Princeton University.
Train, Kenneth. 1986. Qualitative Choice Analysis. Cambridge, Mass: MITPress.
Trost, Robert, and Lung-Fei Lee. 1984. "Technical training and earnings: Apolychotomous choice model with selectivity". Review of Economics andStatistics, 66 (February): 151-166.
van der Gaag, Jacques, and Wim Vijverberg. 1988. "A switching regressionmodel for wage determinants in the public and private sectors of adeveloping country". Review of Economics and Statistics, 70 (May): 244-252.
Distributors of World Bank PublicationsARGLNTINA FRANE MECO SMAWCubs sirbo, SEL W6ard BkPubtioations NPOEC Mundi-prt Lbra, SAGaleriaGuaaaos m avmeordlhia ApOftada Postal 224160 1117Fitda 165. 4th Fo-Ok 4S3/465 75116Pads I4060TIaIpanMedcl).F. 2M1 ad1333 BtasroALr
GERMANY, FEDERAL REPUBLIC OF MOROCCO SRI LANKA AND THE MALDIVEsAUSTRALIA, PAPUA NEWGUIE UNO-Valag Sodete d'EtadesMarkding Marocaine Lake Ho. eBokinbop
IJ SOLOMONISLANDS, PappbdndhAleeS 12 mMBozwtd.d'Afa P.O. Sa 244VANUATU, AND WESTERN SAMOA D0-ER SOM I Cuablac 100, e A.G ardinerDA. Books & 1kJo.naIn *0awat11-13 ste s GREECE NETHERLANDS Calat,o 2Mitdkho 3132 KEME InOr.Pubikatiesb vVictoria 24,Ippodmou Street Plata Plastirm P.O. 'a 14 SWEDEN
Afitsa11635 72D VA Lodurna Fornil8iartteAUSTRIA PdlozosFadkbod*oretagetGerald and Co GUATEMALA N BWZEALAN Regigata12 I Bx 16356CrabmEl ULworlasPledra Satt HiftaiLtray and balara6onServce, S.10327 StodialimA-1011 Wien ComtoCultural Piedra Santa PrivtelBag
2111 cSe6-9Dzima New Ma*Ae hr,mho,6iaa rauntBAHRAIN Guata a City AuckltMd Wenasrgen-Wlliao,ABBabrain R-serch and Conacltancy SWx 3O4
Asodateld. HONG KONG, MACAO NIGERIA S-104 25Stodhoh'P.O. Br 22103 Ada 200 lid. Lnivedty res LimitedMananATon317 61R. 14" Prnce Edwud Road,W. ThreeCratenalildlgnletidco SWtTZERLAND
Kowloon Private Md gag SO95 FroritifsBANGLADESH HongKog Ibadn Lffifr F PayDIMitr Inda ieDevdopma.t 6oGu
Astune Socdety.ASDAs) HUNGARY NORWAY Ca.pou'361Hou/e 56. Road A Kulturs Narveman InesvadiCorni CHI21lGaeyVii1Shartmondi R/Amo P.O. Bax 139 Batrbad Naremo uved2
LnAa 1209 1319dBad 62 P.O. Bo 6125 E ttd For. orffoe adarn,N.C6OAO 6 lI.AballePayot
BELGIUM INDIA Servic de6AbormnmnroPubllcatib desNatth,Undes Allied Pubheso Private lid. OMAN Cmpostal 3312Av. du Rdt 202 751 MonmtRoad MEMRE bInfmakon Sevi- CH 1002 L _ta1065 Bnads Madra -60002 PO. Box 1613 SeebAirport
IIRAZIL ~~~~~~~~~~~~~~~~~~~~~~~~~Muit TAN7ZANIABRAZIL Sraeh otm:a Oufted UJnivaat pre"PubliacbmTani-Intemadanra, 15JN. Hedl Mag PAKISTAN P.O. BSa 2899
idA. RSalad Ebtate Mrza Book Ageng DwroaSaRua PFtotoGaide, 209 Bamnbay-4D0DC3 65. Shnahr-eQuaid-eArom01409SA oFauI% SP P.O. BD No. 729 THAILAND
13/14 Asa ABl Road Lahorea3 Ctal Departmenti BotCANADA NevwDd - 1100D2 3D6 Silan RoadILe Dithuaeu PERU SangkDkC.P. 815,11MB Amphe 17 CttarmnianAvenue EditorilDreerorlo SA
JBSmrlt Quebec Calutta - 70D 072 Apartdo 3S24 TRINIDAD & TOBAGO. ANTIGUA34B0SE6 Lina RARBUDA, BARBADOS,
JayadevallostrdStulilig DOMINICA, GRENADA, GUYANA.CliINA 5th Mato Road Crdh,itagar PIIILIPPNSS JAMAICA, MONTSERRAT, ST.ChinaFinandal & Eomoic Publiohing Manglore-ow d1 Natioal Boak Stae K1TTS & NEVIS, ST. LWCLA
loule 2(11 Rizal Avau ST. VINCENT AGRENADINEStDaPo0SiDonglie 3-5-1129 KItadguda Cross Road PDO. Box 1934 Sysbonatim,Studies UnftBSatjg Hydasbad - SOD027 MftaManils 69 wafts Stret
CanepeCOLOMBIA Prooltan, Flat% 2nd Floor POLAND Trinidad,WesthIdierEnlaceLtda. NearThakareBe g,Nas.rW a ORPANApadoAeae 34270 Alhmedabad-39.009 Ptwc Kuilt.oyiNaukd TURXEYBogota Di. ECQI Warawa HandKt aep, AS.
FPtial Home Istilda Cadda Na. 469COSTARICA 16-AAhokMHg PORTUGAL B Cpogln6Libra Trelos Lucd.ow - 226 C01 Lrarda Poruga latnbLouCaSe 11-13 R-aDo Cartmo7l-74Av. Fenandez Gudl IDONESIA 1201L sbm UGANDASW Jose Pt Indira Limited Ugand. B Doohp
31. Sam Ratutlangi 37 SAUDt ARABIA,QATAt F.O. Box 7145COTE IYIVOIRE Jakarta Fnd jarr ] BookStoe KampalaCent. d'Editim etde DittusiHn P.O. BS alSI PO. Box 3196
AM tais 4 (CEDA) Riyadhl 11471 UNITED ARAB EMxIRATES04 B.P. 541 IRELAND MEMES lColEaAbidpn 4 Plateau TDC Publidh MEMS Information Services P.O. Ba, D97
12 North Fredeldk Stree BrwwAoha. SInol.CYPRUs Dublin I Al Abs StreetMEMRS BD ifn09 tion Servic Al Dah, Cantwr UNITED XINGDOMP0O. Box 2398 ITALY Firat Flato Mitrino Ltold.bacada 1La C _aionaria Saatdni SPA P.O. BOx 7188 P.o. Box 3
Via Benedetto Paria, 12D/10 Riyadh Allan, H _rpoCeCUM34 2PGDENMARK Canela Fostale 552 En-anSamfundLittneratur 53125 Florence Haji Abdu.l Alleza BuildingRosamons A116 11 KIng Datd Su-eat URUGUAYDK-IP7D Prederh beg C JAPAN FpO. Box 3969 VRGAY Nacmal dcl lbm
Ematen Soak Service Dommnor, 5.0 3se1116DOMINiCAN REPUBLC 37 NHamgo3-Onc.an B-kyoIL 113 MontevideoEditora Tallow C. pa A. Tokyo 33, Mohanmed HIsn Awad StreetR-bta,oadox looblola Ca.".i 309 P.O. Box S75 VENEZUELAApartado Prosl 2190 XENYA r.OdaK Libearla. dBEteASantoLandngo AfricaBookService(EA)Ltd. Aptdo. 60337
F.O. BSx 45245 SINGAPORE. TAIWAN, MYANMA Caracs 1060-AEL SALVADOR Nairobi BRUNEIFnAradm hIfntnatlon Publicarions YUGOSLAVIAAvanidd Mm-d Ereiq Aroj #530 KOREA, ESPUBUC OF Private, Ltd. YugOSLoAV KIgAEdifiioSISA,ltr.PFIo Pan Korea, Botk Co te° 02.06 let Fl, Pet-Pu InduOtr YLllOODBdgredeTrg RpublikeSan Salvador P.O. Box 101, Kwangwrhaou Bl,dg.
Seoul 24 New Indugria Road ZIMBABWEEGYPT, ARAB REPUBLIC OF Singape 1953 Inngo-Z.LnbAW weAl Ahtrm KUWAIT P.O. Box sr 124, Sau-thtoAl Galc Sre MMEMSB Idnornion Smeri SOUTH AFRICA HarOreCiro P.O. Bo 546s Foxbqkmm
Otttord UniverdyPram Sonuthrn,The Middle Eact Cever MALAYSIA AhdicaS Chow-ai Street Unvdersty of Malaya Cooperadtve P.O. BSx 1141Cdrabo Bodro , Limnited CapeTown600D
P.O. Box 1127, Jalan Panial SaruFINLAND uala Lunpur Faractmt o,ion.Alamninen K urapp Imntanor,at Suboription SviorP.O. BD 12S P.O. Box 410955300101 CrCThaIiHldokl0o Jc_bwurg 2D24
LSMS Working Papers (continued)
No. 35 The Demand for Medical Care in Developing Countries: Quantity Rationing in Rural Cate d'7voire
No. 36 Labor Market Activity in Cote d'Ivoire and Peru
No. 37 Health Care Financing and the Demand for Medical Care
No. 38 Wage Determinants and School Attainment among Men in Peru
No. 39 The Allocation of Goods within the Household: Adults, Children, and Gender
No. 40 The Effects of Household and Community Characteristics on the Nutrition of Preschool Children:Evidence from Rural Cote d'Ivoire
No. 41 Public-Private Sector Wage Differentials in Peru, 1985-86
No. 42 The Distribution of Welfare in Peru in 1985-86
No. 43 Profits from Self-Employment: A Case Study of CUte d'Ivoire
No. 44 The Living Standards Survey and Price Policy Reform: A Study of Cocoa and Coffee Production in CUted'Ivoire
No. 45 Measuring the Willingness to Pay for Social Services in Developing Countries
No. 46 Nonagricultural Family Enterprises in Cote d'Ivoire: A Descriptive Analysis
No. 47 The Poor during Adjustment: A Case Study of C6te d'Ivoire
No. 48 Confronting Poverty in Developing Countries: Definitions, Information, and Policies
No. 49 Sample Designs for the Living Standards Surveys in Ghana and Mauritania/Plans de sondage pour lesenquetes sur le niveau de vie au Ghana et en Mauritanie
No. 50 Food Subsidies: A Case Study of Price Reform in Morocco (also in French, 50F)
No. 51 C6te d'Ivoire: Estimates for Child Anthropometry from Two Surveys, 1985 and 1986
No. 52 Public-Private Sector Wage Comparisons and Moonlighting in Developing Countries: Evidence fromCUte d'Ivoire and Peru
No. 53 Socioeconomic Determinants of Fertility in C6te d'Ivoire
No. 54 The Willingness to Pay for Education in Developing Countries: Evidence from Rural Peru
No. 55 Rigidite de salaire: donn6e microeconomique et macroeconomique sur l'ajustement du marche du travaildans le secteur moderne (in French only)
No. 56 The Poor in Latin America during Adjustment: A Case Study of Peru
No. 57 The Substitutability of Public and Private Health Care for the Treatment of Children in Pakistan
No. 58 Identifying the Poor: Is "Headship" a Useful Concept?
No. 59 Labor Market Performance as a Determinanbt of Migration
No. 60 The Relative Effectiveness of Private and Public Schools: Evidence from Two Developing Countries
No. 61 Large Sample Distribution of Several Inequality Measures: With Application to C6te d'Ivoire
No. 62 Testing for Significance of Poverty Differences: With Application to Cote d'Ivoire
No. 63 Poverty and Economic Growth: With Application to Cote d'Ivoire
No. 64 The Child-Bearing Family in Sub-Saharan Africa: Structure, Fertility, and the Future
The World Bank
Headquarters European Office Tokyo Office1818 H Street, N.W 66, avenue d'Iena Kokusai BuildmgWashington, D C 20433, US A 75116 Paris, France 1-1 Marunouchi 3-chomeTelephone' (202) 477-1234 Telephone: (1) 40.69.30.00 Chiyoda-ku, Tokyo 100, JapanFacsumile: (202) 477-6391 Facsimile. (1) 47.20.19.66 Telephone: (3) 214-5001Telex. WUI 64145 WORLDBANK Telex. 842-620628 Facsimile (3) 214-3657 NRCA 248423 WORLDBK Telex- 781-26838Cable Address INTBAFRAD
WASHINGTONDC
o0-
- IB
oe o
OQDq-i
Di
o
0
ISSN ~ ~ ~ ~ ~ ~ ~ ^ 02C41 SN0-2310-