of their adaptation decisions in South India Adaptation of ...
16
Page 1/16 Adaptation of farmers to climate-change and determinants of their adaptation decisions in South India K. Nirmal Ravi Kumar Ranga Agricultural University (ANGRAU) M. Jagan Mohan Reddy ( [email protected] ) Professor Jayashankar Telangana State Agricultural University Research Article Keywords: Climate-change, Drought, South India, Adaptation strategies, Discriminant analysis, Multi-nomial logit model Posted Date: November 8th, 2021 DOI: https://doi.org/10.21203/rs.3.rs-1057104/v1 License: This work is licensed under a Creative Commons Attribution 4.0 International License. Read Full License
Transcript of of their adaptation decisions in South India Adaptation of ...

Page 1/16
Adaptation of farmers to climate-change and determinantsof their adaptation decisions in South IndiaK. Nirmal Ravi Kumar
Ranga Agricultural University (ANGRAU)M. Jagan Mohan Reddy ( [email protected] )
Professor Jayashankar Telangana State Agricultural University
Research Article
Keywords: Climate-change, Drought, South India, Adaptation strategies, Discriminant analysis, Multi-nomial logit model
Posted Date: November 8th, 2021
DOI: https://doi.org/10.21203/rs.3.rs-1057104/v1
License: This work is licensed under a Creative Commons Attribution 4.0 International License. Read Full License

Page 2/16
AbstractAgriculture, with its allied sectors, is the largest source of livelihood in India and now faces a serious challenge fromclimate-change. In this context, this study investigated, how farmers in India perceive climate-change, what adaptationstrategies they practice, and major determinants of their adaptation decisions. Primary data forms the database collectedfrom 400 sample farmers from southern States of India to employ Discriminant model and Multinomial Logit Model(MNLM). The results of Discriminant analysis revealed that off-farm income, income from agriculture and farmingexperience are the major discriminating variables with largest contributions to motivate the farmers for tackling climate-change. Findings from MNLM revealed that in addition to above three variables, access to climate-change informationand education background of the farmers are also the important determinants in adoption of climate-change adaptationstrategies viz., crop diversi�cation, integrating crops with livestock, change in the planting date and adoption of soil andwater conservation measures. The study highlighted increasing role of Government in the future to safeguard interests offarmers through offering a wide range of institutional, policy and technology support. Further, providing off-farmemployment opportunities to the farmers is crucial to sustain their livelihoods, as such activities are less sensitive toclimate-change.
1. IntroductionEnvironmental changes viz. climate change, land-use change and natural resource degradation have aggravatedvulnerability of agricultural production across the countries in the world. Among these, climate change has emerged asthe biggest developmental challenge especially for developing countries like India through disrupting the normal socio-economic settings, particularly of the poor (Sunita, 2009). Its adverse effects are much severe on agricultural sector inaffecting both food and nutrition security and sustainable development. So, it is imperative on the part of farmers to faceclimate change in agriculture through following various adaptation strategies that demand collaborative efforts fromdifferent stakeholders. Of course, the major driving force for taking up climatic adaptation strategies comes from farmers’perceptions to tackle the climate change phenomenon.
India experienced a series of droughts (Figure 1) and the one in 1987 was one of the worst, with an overallrainfall de�ciency of 19 per cent, which affected 59–60 per cent of the normal cropped area and a population of 285million. This was repeated in 2002 when the overall rainfall de�ciency for the country as a whole was again 19 per cent.Over 300 million people spread over 18 States are affected by drought along with around 150 million cattle. Food grainsproduction registered an unprecedented steep fall of 29 m. tonnes. After 2002, the drought in 2018 is considered to besecond severe one, affecting about 42 per cent of land area and 500 million people (almost 40% of the country’spopulation). With the advent of climate change since 1990s (Sunita, 2009), failed monsoon is the primary reason forfrequent droughts in India. Since it is not possible to avoid the adverse impacts of climate change (Figure 2), it is vital topromote adaptation strategies among the farmers to tackle it in their farm �elds. Before this, it is essential to analyzetheir perceptions about climate change adaptation strategies and determinants of the same for their effectiveimplementation. The earlier studies conducted in South Africa (Tshikororo et al, 2021), Ghana (Francis et al, 2021),Ethiopia (Belay et al, 2017), Uganda (Nabikolo et al, 2012), Fiji (John, 2008) etc., highlighted that farmers changed theircultivation practices as adaptation strategies in various ways viz., change in cropping calendar, crop varities, machineryfor cultivation practices, crop diversi�cation, integrating crops with livestock (farming systems approach), soil and waterconservation practices etc. Even strategies such as System of Rice Intensi�cation (SRI) and micro irrigation wereadopted by the farmers to combat water scarcity situation. They also implemented strategies for coping with decliningsoil productivity through increasing organic manure application, compost making and application, crop rotation, cropresidues retention (Belay, 2017; Tshikororo et al, 2021). In India, even the Government also started promoting formation ofFarmer-Producer Organizations (FPOs), when a single farmer could not afford adaptation strategies (Naveen et al, 2019).However, the study conducted by Niles et al. (2016) revealed an interesting �nding that the farmers’ attitude and

Page 3/16
perception towards climate change do not correlate to their actual adoption. So, it is equally important to analyze thedeterminants of different climatic adaptation strategies being followed by the farmers besides their perceptions to tackleclimate change phenomenon. With this background, this study was focused on better understanding of perceptions andpractices followed by the farmers to tackle climate change in four Southern States viz., Andhra Pradesh, Telangana, TamilNadu and Karnataka. As no prior research on these lines was conducted earlier in Southern parts of India, this study iscertainly a contributing one to highlight farmers’ perceptions as one of the major critical elements for tackling climatechange and to identify major determinants for practicing various adaptation strategies.
2. Review Of Literature:Francis and Tsunemi (2015) analyzed socio-economic factors that in�uence farmers’ adaptation to climate change inagriculture. The empirical results of the logistic regression model showed that education, household size, annualhousehold income, access to information, credit and membership of farmer-based organization are the most importantfactors that in�uence farmers’ adaptation to climate change. However, the researchers identi�ed unpredictability ofweather, high farm input cost, lack of access to timely weather information and water resources are the major constraintsof farmers’ adaptation to climate change.
Abrham et al (2017) analysed the smallholder farmers’ climate change adaptation strategies and determinants of theiradaptation decisions in the Central Rift Valley of Ethiopia. Findings of the study revealed that the farmers’ capacity tochoose effective adaptation options is in�uenced by household demography, as well as positively by farm size, income,access to markets, access to climate information and extension, and livestock production. So, the researchers suggestedthe need to support the indigenous adaptation strategies with a wide range of institutional, policy, and technologysupport. Creating opportunities for non-farm income sources is equally important, as such activities are less sensitive toclimate change. Furthermore, providing climate change information, extension services, and creating access to marketsare crucial.
Alex et al (2017) analysed the household determinants that contribute to climate change adaptation strategies in theMount Rwenzori area of South Western Uganda. A Multinomial Logistic Model (MNLM) was used to assess the drivers offarmers’ choice for adaptation practices, factors in�uencing the choice of adaptation, and barriers. The study concludeduse of different crop varieties, tree planting, soil and water conservation, early and late planting, and furrow irrigation arethe major adaptation practices. The �ndings of Discrete choice model indicated that age of the household head,experience in farming, household size, climate change shocks, land size, use of agricultural inputs, landscape position(location), and crop yield varied signi�cantly (p > 0.05) and in�uenced farmers’ choice of climate change adaptationpractices. Researchers concluded that inadequate information on adaptation methods and �nancial constraints are themajor barriers for adaptation and hence, suggested increasing support from government and other stakeholders.
Francis et al (2020) investigated the factors in�uencing adaptation strategies to climate change in the Black Volta Basinof Ghana. Multi-variate probit model revealed that gender, age, household size, farmer-based-organizations membership,farm income, years of education, districts of location of respondents, farm size and climate change awareness are themajor factors that in�uenced households’ adaptation to the changing climate. The researchers suggested that improvinghousehold heads’ adaptive capacity and increasing investments in climate-resilient programmes by governmental andnon-governmental organizations should deserve special attention.
Mpho et al (2021) analyzed the farmers’ socio-economic characteristics towards tackling climate change in LimpopoProvince, South Africa. They study the in�uence of socio-economic characteristics such as age, gender, farmingexperience and level of education on farmers’ perception about tackling climate change through employing DiscriminantAnalysis. The study concluded that formal education, agricultural education, age group, farming experience and off-farmoccupation signi�cantly contributed towards farmers’ perception regarding tackling of climate change.

Page 4/16
3. Methodology3.1. Sampling procedure: This study was conducted in four States of Southern India viz., Andhra Pradesh, Telangana,Tamil Nadu and Karnataka, as they occupy prominent positions in the cultivation of major crops like paddy, maize,groundnut, cotton, chillies, sun�ower, tobacco, tomato, banana, cashew, coconut and cardamom. More than half of theGross Area Sown (GAS) across these states viz., Andhra Pradesh (52%), Telangana (63%), Tamil Nadu (54%) andKarnataka (75%) is under rainfed condition. Further, in all these States, the share of marginal and small farmers in thetotal number of holdings was more than 80 per cent (2011 census). In Andhra Pradesh (Ananthapuramu, (540 mm),Telangana (Jogulamba Gadwal, 533 mm), Tamil Nadu (Tiruppur, 600.3 mm) and Karnataka (Chitradurga, 507.4 mm) arethe major drought prone districts due to scanty (normal) rainfall (India Meteorological Department, 2019).
According to Yamane (1967), the minimum sample size in the study should be:
n = = = 384.16
So, this study involved a cross-sectional survey of 400 sample farmers @ 100 random sample from each of the abovefour districts during 2019-20. Data are collected relating to perceptions of them towards tackling climate change and foridentifying the major determinants for climate change adaptation (drought coping) strategies followed by them in thestudy area. A structured questionnaire was employed among the sample farmers with the assistance from localAgricultural O�cers, who interacted directly with the farmers at the local level.
In the context of present study, two groups of farmers were made viz., farmers willing to tackle climate change (Yes = 1)and farmers not willing to tackle climate change (No = 0). As per the survey, 256 farmers are willing and practicingclimate change adaptation strategies and remaining 144 farmers are not willing to tackle climate change. Socio-economic characteristics of sample farmers (Table 1) were hypothesized to contribute to discriminating between the twocategories of farmers.
3.2. Empirical Models:3.2.1. Discriminant analysis: This multivariate statistical technique is employed (Tshikororo et al, 2021; Nguyen, 2017), asit is used to classify farmers into two (or more) mutually exclusive and exhaustive categories or groups based on a set ofindependent variables. That is, discriminant model is used to distinguish between two categories of farmers for tacklingclimate change: willing to tackle climate change and non-willing to tackle climate change coded as 1 and 0 respectively.These two possible categories are de�ned by number of factors, which simultaneously in�uence the farmers’ willingnessto tackle climate change. In this study, information related to independent variables (Table 1) are used to calculatediscriminant score Z for a given farmer as follows:
Zi = β0 + β1*X1 + β2*X2 + β3*X3 + β4*X4 + β5*X5 + + β6*X6 + β7*X7 + ε
where, Z is the discriminant score that maximizes the distinction between the two categories.
Z2p(1−p)
e2
((1.96)20.5(1−0.5)
0.052

Page 5/16
Table 1Description of explanatory variables used in the discriminant analysis
Variable Name Type of measure Expected sign
X1 Farming experience (FE) Quantitative variable (Years) +
X2 Trainings on climate-change adaptation
strategies (TRG)
Dummy; (0 = No, 1 = Yes) +
X3 Age of the farmer (AGE) Quantitative variable (Years) +
X4 Extension contacts (EC) Dummy; (0 = No, 1 = Yes) +
X5 Off-farm income (OFFI) Quantitative variable (Rs/-) +
X6 Farm Size (FS) Quantitative variable (hectares) +
X7 Agricultural Income (AI) Quantitative variable (Rs/-) +
Dependent variable: Climate-change adaptation strategies (CC): Dummy; (1 = Yes, 0 = No)
Before running discriminant analysis, it is important that data used must be independent and normally distributed(Khemakhem and Boujelbene, 2015). So, Kolomogorov- Smirnov test was employed to prove the data are normallydistributed. Further, multicollinearity among the independent variables was also tested through computing Pearson’scorrelation matrix. As the highest absolute value of correlation coe�cient between each of variable is less than 0.7,multicollinearity problem was ruled out in this study. In the next step, discriminant analysis (direct method) is appliedto the sample data.
3.2.2. Multinomial Logit Model (MNLM): To analyze the determinants for practicing different climate-changeadaptation strategies viz., crop diversi�cation (shift towards drought-resistant crops), integrating crop with livestock,change planting date and adoption of soil and water conservation practices, MNLM was employed (Belay, 2017;Diallo, 2020; Alex et al, 2017). Table 2 shows the description and expected signs of explanatory variables used in thisstudy. The estimation of MNLM was conducted by normalizing one category, which is named as ‘base category’. Theadaptation measures were grouped into above four major categories because, farmers used more than one strategy,and the base category was ‘No adaptation strategy.’ That is, Climate-change adaptation strategy – the dependentvariable (Dummy), 4 = crop diversi�cation, 3 = integrating crop with livestock, 2 = change planting date, 1 = adoptionof soil and water conservation practices and 0 = No adaptation strategy.

Page 6/16
Table 2Description of explanatory variables used in the MNLM
Variable Name Type of measure Expected sign
X1 Farming experience (FE) Quantitative variable (Years) +
X2 Trainings on climate-change adaptation
strategies (TRG)
Dummy; (0 = No, 1 = Yes) +
X3 Age of the farmer (AGE) Quantitative variable (Years) +/-
X4 Extension contacts (EC) Dummy; (0 = No, 1 = Yes) +
X5 Off-farm income (OFFI) Quantitative variable (Rs/-) +
X6 Farm Size (FS) Quantitative variable (acres) +/-
X7 Agricultural Income (AI) Quantitative variable (Rs/-) +
X8 Access to climate information (AC) Dummy; (0 = No, 1 = Yes) +
X9 Access to market (AM) Dummy; (0 = No, 1 = Yes) +
X10 Education (EDU) Quantitative variable (Years) +
X11 Livestock ownership (LO) Dummy; (0 = No, 1 = Yes) +
4. Results And Discussion:4.1. Descriptive Statistics: The descriptive analysis (Table 3) revealed a mean age of 45 years with a Standard Deviation(SD) of 7.97 for farmers who are practicing climate adaptation strategies and a mean age of 44 years and a SD of 8.09for farmers not willing to take up climate adaptation strategies. With respect to number of trainings (TRG) received on theimportance of climate adaptation strategies, contacts with local extension o�cers (EC), farming experience (FE) and farmsize (FS), the result did not reveal much variation between the two categories of adoption. However, it is interesting thatboth off-farm income and agricultural income of farmers practicing climate adaptation strategies (Rs.26503 (US$355.94) & Rs. 120717 (US$1621.23) respectively) are considerably higher compared to farmers not willing to practiceclimate adaptation strategies (Rs. 19811 (US$266.06) and Rs. 119900 (US$1610.26) respectively). This showed that thefarmers practicing climate adaptation strategies are bene�tted through getting higher off-farm income and agriculturalincome. On an average, the respondents had 45 years of age with 13 years of FE and derive around 83 per cent of annualincome from agriculture and remaining 17 per cent from off-farm sources.

Page 7/16
Table 3Descriptive statistics (Group means) across
selected categories of farmersCC Mean Std. Deviation
No (0) FE 11.69 3.08
TRG 0.52 0.50
AGE 44.19 8.09
EC 0.13 0.33
OFFI 19810.80 10324.70
FS 3.42 2.43
AI 119900.00 13729.10
Yes (1) FE 13.20 2.89
TRG 0.56 0.50
AGE 45.08 7.97
EC 0.14 0.41
OFFI 26502.60 11843.50
FS 3.55 2.50
AI 120717.00 12844.10
Total FE 12.66 3.04
TRG 0.54 0.50
AGE 44.76 8.01
EC 0.13 0.38
OFFI 24093.50 11755.60
FS 3.50 2.47
AI 120423.00 13158.20
4.2.: Model Adequacy: From the two categories considered in the dependent variable, the software has distilled onediscriminant function ie., Function 1. Results of the tests for model adequacy are presented through Table 4. The Box Mtest (regarding equality of population covariance matrices of the two categories of dependent variable) showed that Fcal
value (1.345) was found non-signi�cant (P= 0.105) implying equality of covariance matrices across the two categoriesie., adopters and non-adopters. This gives a clue for the researcher to proceed further in the analysis.
There are many other tests that su�ciently classify the two categories. The Wilks Lambda (λ) test (testing the nullhypothesis that means vectors of the two categories in the dependent variable are equal) inferred the value (0.102) isclose to '0' indicating better discriminating power of the model. That is, lower the value of Wilks’ λ, the higher is thesigni�cance of the discriminant function (0 value is most preferred one). The probability value for χ2 indicate that thediscriminating power between two groups is highly signi�cant (P = 0.000). This means that the discriminant functioncomputed in this procedure is statistically signi�cant at the 0.000 level and now the researchers can proceed to interpretthe results. Other tests like Pillai's trace (to test the assumption of equality of the mean vectors for the three categories or

Page 8/16
classes), Hotelling-Lawley trace (to test the assumption of equality of the mean vectors for the various classes) and Roy’sGreatest Root (to test the assumption of equality of the mean vectors for the various classes) are also found signi�cant(Tshikororo et al, 2021; Nguyen, 2017)
Table 4Tests of model adequacy
Test Statistic Value F Value DF1 DF2 P value
Box test (χ2 asymptotic approximation, -2Log(M)) 38.444 1.345 28 315510.51 0.105
Wilks’ λ 0.102 42.25** 7 0.000
Pillai's trace 0.116 6.414 8 391 < 0.0001
Hotelling-Lawley trace 0.131 6.414 8 391 < 0.0001
Roy’s Greatest Root 0.131 6.414 8 391 < 0.0001
** - Chi-square value
To know, whether a signi�cant difference exists between the means of two groups, a one way ANOVA is carried out.Each of the predictor variable is treated as a dependent variable and the category of dependent variable as anindependent variable and the results are present in Table 5. It is found that the signi�cant difference is observed incase of FE, OFFI and AI for which the P-values are less than 5 per cent level of signi�cance. However, in case of otherpredictors, no signi�cant difference was observed (P-value > 0.05).
Table 5Tests of Equality of Group Means
Variable Wilks' Lambda F df1 df2 Sig.
FE 0.943 24.004 1 398 0.000
TRG 0.998 0.682 1 398 0.409
AGE 0.997 1.121 1 398 0.290
EC 1.000 0.087 1 398 0.768
OFFI 0.925 32.199 1 398 0.000
FS 0.999 0.228 1 398 0.633
AI 0.999 0.355 1 398 0.032
Another way of evaluating the performance of the discriminant function is to investigate the eigenvalue and thecanonical correlation coe�cient (Table 6). An eigenvalue (0.113) indicates the proportion of variance explained ie., a largeeigenvalue is associated with a strong function and hence, 100 per cent of the variance was explained. This shows thatthe function is highly signi�cant and potential enough in classifying the categories. The canonical relation is a correlationbetween the discriminant scores and the levels of the dependent variable. A high canonical correlation coe�cient (0.948)indicates a function that discriminates well between two categories of dependent variable and also infers no overlappingamong them. Squaring the canonical correlation suggested that 89.8 per cent of the variation in the grouping variablewas explained (Halagundegowda, 2017; Nguyen, 2017). As shown through Table 4, unexplained error is 10.2 per cent(Wilks' λ: 0.102). So, out of total variation, 89.8 per cent of the variability is explained by this model (canon corr2 = 0.898).So, strong association is detected (canonical correlation = 0.948) between two groups namely, set of all independentvariables and two categories of farmers (dependent variable).

Page 9/16
Table 6Eigenvalue for Statistical Signi�cance
Functions Canon Correlation Eigen value Variance
Prop Cumulative
1 0.948 0.113 1.000 1.000
4.3. Relative Importance of the Discriminating Variables: Table 7 presents the summary data for the discriminant analysisand the analysis yielded one discriminant function for two categories of climate-change adaptation. The �ndings includeboth unstandardized and standardized discriminant (canonical) function coe�cients and they are meant for evaluatingthe relative contribution of each of the predictor variables as discriminators between two categories. When predictors aremeasured in different units, the magnitude of an unstandardized coe�cient provides little indication of its relativecontribution to the discriminant function. So, standardizing the coe�cients is necessary, so as to have a common scaleof measurement for comparative purposes as all the predictor variables (Kumari, 2017).
Table 7: Summary of Unstandardized and Standardized Canonical Discriminant
Function Coe�cients
Variables Unstandardized coe�cients Standardized coe�cients
Function 1 Function 1
Intercept -5.680
FE 0.175 0.517
TRG -0.170 -0.085
AGE 0.027 0.219
EC 0.319 0.122
OFFI 0.000 0.658
FS 0.045 0.112
AI 0.000 0.558
In the derived function, the sign indicates the direction of the relationship and magnitude indicate the extent ofcontribution to the group discrimination. It is important to note that the larger the standardized coe�cient (b), the larger isthe respective variable’s unique contribution to the group discrimination (irrespective of the sign of the coe�cient). All thepredictors except TRG are positively in�uencing the discrimination of groups. It is further apparent from the analysis thatOFFI (b5 = 0.658), AI (b7 = 0.558) and FE (b1 = 0.517) are the highest discriminating variables with largest contributions.This result means that appropriate attention should be given towards promoting off-farm employment opportunities,pro�tability of agriculture and as well as due recognition to the FE in order to motivate them to practice/implementclimate-change adaptation strategies. So, by using the variables and the standardized coe�cients, the requireddiscriminant equation (discriminator) is shown below:
Z = 0.517 FE – 0.085 TRG + 0.219 AGE + 0.122 EC + 0.658 OFFI + 0.112 FS + 0.558 AI
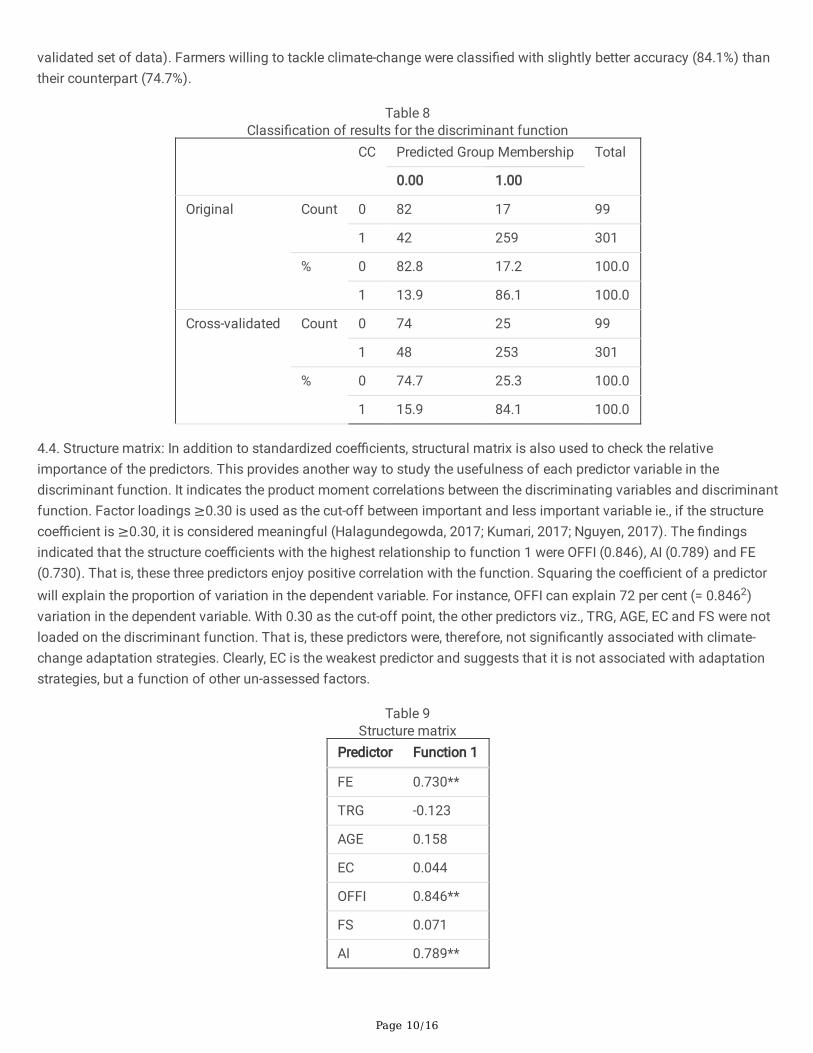
The classi�cation results (Table 8) reveal that 79 per cent of respondents were classi�ed correctly into ‘Willing’ or ‘Non-willing’ groups and this overall predictive accuracy of the discriminant function represents the ‘hit ratio’ (based on cross
Page 10/16
validated set of data). Farmers willing to tackle climate-change were classi�ed with slightly better accuracy (84.1%) thantheir counterpart (74.7%).
Table 8Classi�cation of results for the discriminant function
CC Predicted Group Membership Total
0.00 1.00
Original Count 0 82 17 99
1 42 259 301
% 0 82.8 17.2 100.0
1 13.9 86.1 100.0
Cross-validated Count 0 74 25 99
1 48 253 301
% 0 74.7 25.3 100.0
1 15.9 84.1 100.0
4.4. Structure matrix: In addition to standardized coe�cients, structural matrix is also used to check the relativeimportance of the predictors. This provides another way to study the usefulness of each predictor variable in thediscriminant function. It indicates the product moment correlations between the discriminating variables and discriminantfunction. Factor loadings ≥0.30 is used as the cut-off between important and less important variable ie., if the structurecoe�cient is ≥0.30, it is considered meaningful (Halagundegowda, 2017; Kumari, 2017; Nguyen, 2017). The �ndingsindicated that the structure coe�cients with the highest relationship to function 1 were OFFI (0.846), AI (0.789) and FE(0.730). That is, these three predictors enjoy positive correlation with the function. Squaring the coe�cient of a predictorwill explain the proportion of variation in the dependent variable. For instance, OFFI can explain 72 per cent (= 0.8462)variation in the dependent variable. With 0.30 as the cut-off point, the other predictors viz., TRG, AGE, EC and FS were notloaded on the discriminant function. That is, these predictors were, therefore, not signi�cantly associated with climate-change adaptation strategies. Clearly, EC is the weakest predictor and suggests that it is not associated with adaptationstrategies, but a function of other un-assessed factors.
Table 9Structure matrix
Predictor Function 1
FE 0.730**
TRG -0.123
AGE 0.158
EC 0.044
OFFI 0.846**
FS 0.071
AI 0.789**

Page 11/16
The group centroids are the averages of the Z values calculated by the estimated model, which can use to evaluate theexpected position of the concerned farmers’ categories. (Uddin, 2013). As can be seen in Table 10, the centroid of non-willing category is -0.447 and the centroid of the ‘willing’ category is 0.252. This implies that if someone’s score on thediscriminant function is positive (closer to 0.252), then that respondent is probably willing to tackle climate change. Onthe contrary, if a person’s score on the discriminant function is negative (closer to –0.447), then the data probably camefrom the ‘non-willing’ category. On calculating the cut score (halfway between the two centroids) ie., -0.097 and if anindividual person’s score on the discriminant function (calculated by plugging in their scores on predictor variables) isabove -0.097, then the respondent is probably from the ‘willing’ category. On the contrary, if the discriminant functionscore is below –0.097, then the respondent is probably from the ‘non-willing’ category.
Table 10Functions at group
centroidsCC Function 1
0.00 -0.447
1.00 0.252
Finally, the performance of the model was studied using the Receiver Operating Characteristic (ROC) curve (Figure 3). Theresults showed a large Area Under the Curve (AUC) of 71.4 per cent and signi�cant at 5 per cent level, which furthera�rmed that the model was correctly speci�ed.
4.5. Determinants for climate-change adaptation strategies:The �ndings of MNLM (Table 9) revealed that FE, AI, AC and EDU (at 1% level) and OFFI and AM (at 5% level) aresigni�cantly in�uencing the farmers to practice crop diversi�cation towards less-water consuming and drought resistantcrops. For integrating crops with livestock, FE, AI, AM and LO (at 1% level) and EC and FS (at 5% level) were the mostsigni�cant factors. Change in planting date was signi�cantly in�uenced by FE, AI and AC (at 1% level) and TRG and EDU(at 5% level). Regarding adoption of soil and water conservation practices, it was signi�cantly in�uenced by FE, OFFI, AIand AC (at 1% level) and EDU (at 5% level). A close perusal of the table further revealed that FE and AI are the crucialfactors that promote the farmers to take up the climate-change adaptation strategies in the selected States. The marginaleffects of FE indicated that, for every one year increase, the probabilities of practicing crop diversi�cation, integrating cropwith livestock, change in planting date and adoption of soil and water conser vation practices are increased by 1.06, 0.03,1.83 and 1.48 percents respectively. Similarly, the marginal effects of AI indicated that a unit increase in income canincrease the likelihood of practicing crop diversi�cation, integrating crop with livestock, change in planting date andadoption of soil and water conservation practices by 9.15, 8.51, 9.33 and 4.13 percents respectively. AC is anotherimportant variable that contributed to

Page 12/16
Table 9Parameter estimates of MNLM for climate change adaptation strategies by sample farmers
Variable Crop diversi�cation Integrating crop withlivestock
Change planting date Adoption of soil andwater conservationpractices
Coe�cient Marginaleffect
(∂Yj/∂Xij)
Coe�cient Marginaleffect
(∂Yj/∂Xij)
Coe�cient Marginaleffect
(∂Yj/∂Xij)
Coe�cient Marginaleffect
(∂Yj/∂Xij)
FE 0.1015
(0.0432)
0.0106**
(0.0025)
0.0708
(0.0264)
0.0026**
(0.0008)
0.1136
(0.0632)
0.0183**
(0.0071)
0.0277
(0.0019)
0.0148**
(0.0039)
TRG 0.2828
(0.0167)
0.0372
(0.0261)
0.1432
(0.1305)
0.0126
(0.04327)
0.3357
(0.1408)
0.0302*
(0.0125)
0.3624
(0.4956)
0.0246
(0.0023)
AGE -0.1158
(0.1019)
-0.0052
(0.0033)
-0.1747
(0.1238)
-0.0168
(0.0031)
-0.1499
(0.0261)
-0.0082
(0.0067)
0.1441
(0.0966)
0.0024
(0.0015)
EC 0.8211
(0.4019)
0.0978
(0.0522)
0.4985
(0.1957)
0.0156*
(0.0135)
0.6735
(0.2878)
0.0371
(0.0197)
0.3458
(0.1266)
0.0138
(0.0126)
OFFI 0.0013
(0.0005)
0.0676*
(0.0281)
-0.0516
(0.0412)
-0.0152
(0.0458)
0.0000177(0.000016)
0.0016
(0.0038)
0.0239
(0.0016)
0.0689**
(0.0251)
FS 0.0519
(0.0597)
0.0068
(0.0095)
0.0272
(0.0032)
0.0267*
(0.0115)
0.0033
(0.0011)
0.0341
(0.0279)
-0.1334
(0.0977)
-0.0053
(0.0042)
AI 4.9312
(1.9678)
0.0915**
(0.0017)
0.0016
(0.0001)
0.0851**
(0.0167)
0.0321
(0.0012)
0.09327**
(0.0052)
0.0164
(0.0053)
0.0413**
(0.0012)
AC 0.0129
(0.0028)
0.0147**
(0.0046)
0.3119
(0.3561)
0.0053
(0.0465)
0.1073
(0.0135)
0.0236**
(0.0064)
0.0816
(0.0279)
0.0117**
(0.0024)
AM 0.0799
(0.0366)
0.0161*
(0.0072)
0.1411
(0.0288)
0.0184**
(0.0071)
-0.2388
(0.4219)
-0.0288
(0.0511)
0.8454
(0.8011)
0.0343
(0.0219)
EDU 0.0159
(0.0016)
0.0275**
(0.0099)
-0.0428
(0.0657)
-0.0059
(0.0093)
0.0335
(0.0142)
0.0028*
(0.0012)
0.0933
(0.0423)
0.0138*
(0.0059)
Note: ** - Signi�cant at 1% level, * - Signi�cant at 5% level
the adaptation options among the selected farmers. As expected, the �ndings showed that the farmers’ access toclimate-change information had impacted the likelihood for adaptation to climate-change through practicing cropdiversi�cation (1.47%), change in planting date (2.36%) and adoption of soil and water conservation practices(1.17%). This implies that the farmers who enjoy better access to climate change information (i.e., seasonal or mid-term forecasting) made better informed adaptation decisions. These �ndings are similar to the �ndings from variousstudies (Adeagbo, 2021; Belay, 2017; Halagundegowda, 2017; Tshikororo, 2021). As expected by the researchers, EDUand livestock rearing had a positive association across all climate-change adaptation strategies. Other determinantslike AM (on crop diversi�cation (1.61%) and integrating crop with livestock (1.84%)), FS (on integrating crop withlivestock (2.67%)) and TRG (on change in planting date (3.02%)) have exerted signi�cant positive in�uence on theadoption of climate-change adaptation strategies.

Page 13/16
Variable Crop diversi�cation Integrating crop withlivestock
Change planting date Adoption of soil andwater conservationpractices
Coe�cient Marginaleffect
(∂Yj/∂Xij)
Coe�cient Marginaleffect
(∂Yj/∂Xij)
Coe�cient Marginaleffect
(∂Yj/∂Xij)
Coe�cient Marginaleffect
(∂Yj/∂Xij)
LO 0.4141
(0.3761)
0.0854
(0.0663)
0.1998
(0.0441)
0.0569*
(0.0053)
0.2774
(0.4957)
0.0496
(0.0447)
0.9334
(0.5721)
0.0549
(0.0408)
Constant 4.8531
(1.9621)
10.5932
(2.0886)
6.5866
(2.2876)
6.303853
(3.237694)
Note: ** - Signi�cant at 1% level, * - Signi�cant at 5% level
the adaptation options among the selected farmers. As expected, the �ndings showed that the farmers’ access toclimate-change information had impacted the likelihood for adaptation to climate-change through practicing cropdiversi�cation (1.47%), change in planting date (2.36%) and adoption of soil and water conservation practices(1.17%). This implies that the farmers who enjoy better access to climate change information (i.e., seasonal or mid-term forecasting) made better informed adaptation decisions. These �ndings are similar to the �ndings from variousstudies (Adeagbo, 2021; Belay, 2017; Halagundegowda, 2017; Tshikororo, 2021). As expected by the researchers, EDUand livestock rearing had a positive association across all climate-change adaptation strategies. Other determinantslike AM (on crop diversi�cation (1.61%) and integrating crop with livestock (1.84%)), FS (on integrating crop withlivestock (2.67%)) and TRG (on change in planting date (3.02%)) have exerted signi�cant positive in�uence on theadoption of climate-change adaptation strategies.
Summary and Conclusions:
Climate-change is considered as one of the biggest threats to global agriculture and India, in particular. So, it is essentialfor the farmers to plan and resort for different climate-change adaptation strategies to stabilize their annual income andsustain in the farm business. Discriminant analysis revealed that OFFI, AI and FE are the highest discriminating variableswith largest contributions. So, these variables are to be given due attention in the study area to motivate the farmers forpracticing climate-change adaptation strategies. The �ndings of MNLM revealed that FE and AI are the majordeterminants that contribute towards adoption of selected climate-change adaptation strategies followed by AC, EDU andOFFI. These �ndings highlight that the role of Government is crucial in the ensuing years to safeguard the interests offarmers through a wide-range of institutional, policy and technology support. Among the above determinants, creatingoff-farm employment (income) opportunities to the farmers deserves special mention, as those activities are lesssensitive to climate-change (Belay, 2017; Tshikororo, 2021). To conclude, the aspects like linking farmers to markets,improving access to climate-change information, knowledge about various climate-change adaptation strategies (long-term drought proo�ng measures) etc., should be included in the existing formal agricultural extension system of theMinistry of Agriculture and Farmers’ Welfare and other line Ministries to bene�t the farming community.
References1. Abrham Belay, John W. Recha, Teshale Woldeamanuel and John F. Morton, Smallholder farmers’ adaptation to
climate change and determinants of their adaptation decisions in the Central Rift Valley of Ethiopia, Agric & FoodSecur (2017) 6:24
2. Adeagbo, O. A., Ojo, T. O., & Adetoro, A. A. (2021). Understanding the determinants of climate change adaptationstrategies among smallholder maize farmers in South-West, Nigeria. Heliyon, 7(2), e06231.https://doi.org/10.1016/j.heliyon.2021.e06231

Page 14/16
3. Alex Zizinga, Richard Y. M. Kangalawe, Andrew Ainslie, Moses M. Tenywa, Jackson Majaliwa, Naome Jones Sarongaand Esther E. Amoako (2017) Analysis of Farmer’s Choices for Climate Change Adaptation Practices in South-Western Uganda, 1980–2009, Climate 2017, 5, 89, 1-15
4. Belay Abrham, John W. Recha, Teshale Woldeamanuel and John F. Morton. (2017), Smallholder farmers’ adaptationto climate change and determinants of their adaptation decisions in the Central Rift Valley of Ethiopia, Agric & FoodSecur (2017) 6:24,1-13
5. Bharati, R.C., Azad, N.K., Singh, K.M., Chakraborti, S., Chandra, N. and Singh, S.P. (2014). Factors Affecting Adoptionof Crop Insurance in Bihar. Journal of AgriSearch, 1(2): 102-107
�. Diallo, A., Donkor, E., & Owusu, V. (2020). Climate change adaptation strategies, productivity and sustainable foodsecurity in southern Mali. Climatic Change, 159, 309-327.
7. Francis Ndamani and Tsunemi Watanabe, Determinants of farmers’ adaptation to climate change: A micro levelanalysis in Ghana, Agrometeorology, Sci. agric. (Piracicaba, Braz.) 73 (3) • May-Jun 2016
�. Francis X. K. Mwinkom, Lawrence Damnyag, Simon Abugre, Suhiyini I. Alhassan. (2021), Factors in�uencing climatechange adaptation strategies in NorthWestern Ghana: evidence of farmers in the Black Volta Basin in Upper Westregion, SN Applied Sciences (2021) 3:548
9. Halagundegowda G.R., Abhishek Singh and H.K. Meenakshi (2017), Discriminant analysis for prediction andclassi�cation of farmers based on adoption of drought coping mechanisms, Agriculture Update, Volume 12(3), 635-64
10. India Meteorological Department, (2019) Southwest Monsoon – end of season report, New Delhi
11. John Asafu-Adjaye (2008), Factors affecting the adoption of soil conservation measures: A case study of Fijian canefarmers, Journal of Agricultural and Resource Economics, 33(1)
12. Kumari Mrinali, Singh K.M, Sinha D.K and Nasim Ahmad. (2017), Role of socio-economic variables in adoption ofcrop insurance: A Discriminant Function Approach, Economic Affairs, Vol. 62, No. 3, pp. 361-365
13. Mpho Tshikororo, Katlego Thaba, Tshimangadzo Ashely Nefale and Mashudu Tshikororo, Perception Driven FromFarmers’ Socio-economic Characteristics
14. Towards Tackling Climate Change, Journal of Agricultural Science; Vol. 13, No. 6; 2021
15. Nabikilo D, Bashaasha B, Mangheni MN, Majaliwa JGM (2012) Determinants of climate change adaptation amongmale and female headed farm households in Eastern Uganda, Afr Crop Sci J 20(Suppl s2): 203-212.
1�. Naveen P Singh, Bhawna Anand, Surendra Singh, Arshad Khan (2019), Mainstreaming climate adaptation in Indianrural developmental agenda: A micro-macro convergence, Climate Risk Management, 24, 30-41.
17. Nguyen Thuy Duong, Do Thi Thu Ha and Nguyen Bich Ngoc. (2017), The Application of Discriminant Model inManaging Credit Risk for Consumer Loans in Vietnamese Commercial Bank, Asian Social Science; Vol. 13(2), 176-186
1�. Niles, M. T., Brown, M., & Dynes, R. (2016). Farmer’s intended and actual adoption of climate change mitigation andadaptation strategies. Climatic Change, 135(2), 277-295. https://doi.org/10.1007/s10584-015-1558-0
19. Sunita Narain, Prodipto Ghosh, Nc Saxena, Jyoti Parikh and Preeti Soni, (2009), Climate Change – Perspectives fromIndia, United Nations Development Programme (UNDP), p.12
20. Tshikororo Mpho, Katlego Thaba, Tshimangadzo Ashely Nefale and Mashudu Tshikororo (2021), Perception DrivenFrom Farmers’ Socio-economic Characteristics Towards Tackling Climate Change, Journal of Agricultural Science;Vol. 13 (6): 41-47
21. Yamane, Taro. (1967). Statistics, An Introductory Analysis, 2nd Ed., New York: Harper and Row.
Figures

Page 15/16
Figure 1
Number of Drought years in India since Past 200 years
Figure 2
Climate change projections for India by 2030

Page 16/16
Figure 3
ROC curve