OECD Regional Outlook 2016 and related research
31
OECD REGIONAL OUTLOOK 2016 AND RELATED RESEARCH Joaquim Oliveira Martins Regional Development Policy Division, OECD Seminar: "Inovácie a výzvy v manažmente regionálneho rozvoja“ 22 February 2017 Bratislava, Slovak Republic
-
Upload
oecd-governance -
Category
Government & Nonprofit
-
view
134 -
download
0
Transcript of OECD Regional Outlook 2016 and related research

OECD REGIONAL OUTLOOK 2016
AND RELATED RESEARCH
Joaquim Oliveira Martins Regional Development Policy Division, OECD Seminar: "Inovácie a výzvy v manažmente regionálneho rozvoja“ 22 February 2017 Bratislava, Slovak Republic

OECD regional development policy
paradigm
Compensating lagging regions does not work:
• Creates dependency, not development
• Richer regions may become reluctant to support lagging regions
OECD promotes ‘place-based’ policies focusing on:
• Use of regional specific assets (or create absolute advantages to stimulate competition & experimentation across regions)
• Create complementarities among sectoral policies at the regional (or local) level
• Use of multi-level governance mechanisms for aligning objectives & implementation

The ultimate goal: ensuring well-being across regions in the Slovak Republic
Source: OECD Regional Well-Being Database: www.oecdregionalwellbeing.org
Note: Relative ranking of the regions with the best and worst outcomes in the
11 well-being dimensions, with respect to all 395 OECD regions. The eleven
dimensions are ordered by decreasing regional disparities in the country. Each
well-being dimension is measured by the indicators in the table below.

National productivity
performance needs the contribution of
all regions

Labour productivity growth has trended
downwards – even before the crisis
OECD Productivity database; moving averages (t, t-1, t-2) Source: OECD (2016) OECD Regional Outlook 2016: Productive regions for inclusive societies, http://dx.doi.org/10.1787/9789264260245-en
-1
-0.5
0
0.5
1
1.5
2
2.5
3
1997 1998 1999 2000 2001 2002 2003 2004 2005 2006 2007 2008 2009 2010 2011 2012 2013 2014
%
Japan United States Euro area (19 countries)
Financial crisis
In 2007, several US sectors were displaying poor productivity
performance, eg. Construction -12%
5
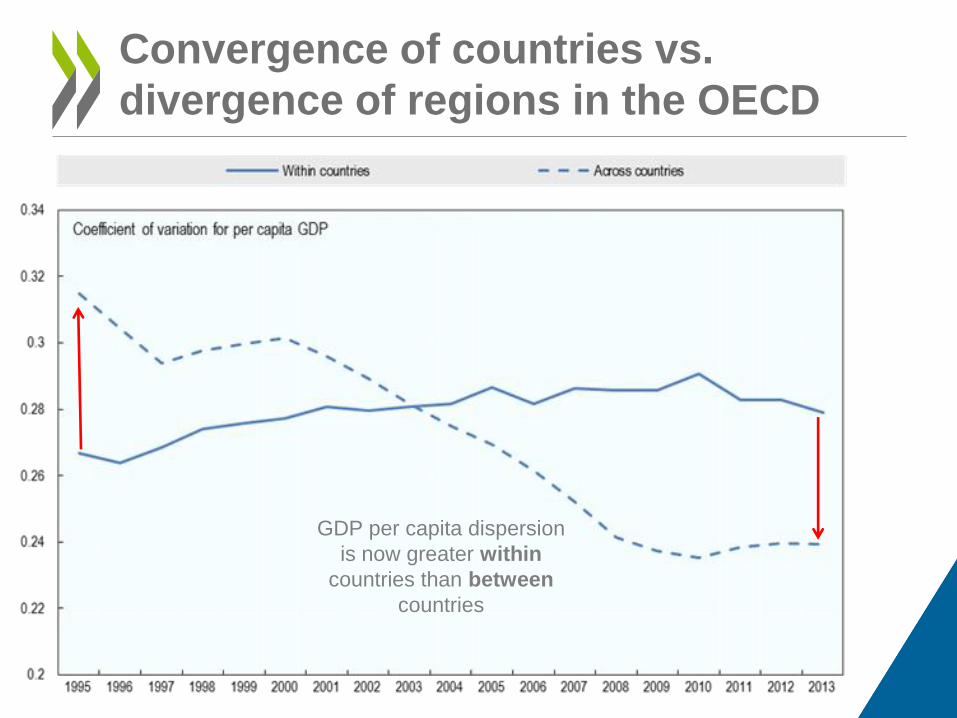
Convergence of countries vs.
divergence of regions in the OECD
GDP per capita dispersion
is now greater within
countries than between
countries
7
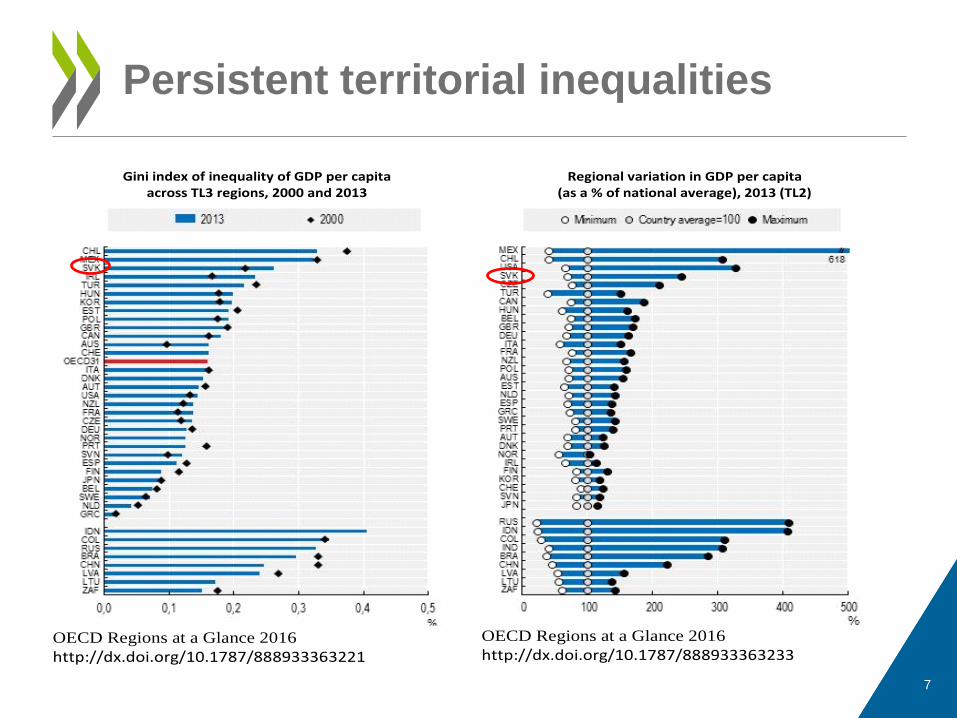
Persistent territorial inequalities
Gini index of inequality of GDP per capita
across TL3 regions, 2000 and 2013
OECD Regions at a Glance 2016
http://dx.doi.org/10.1787/888933363221
Regional variation in GDP per capita (as a % of national average), 2013 (TL2)
OECD Regions at a Glance 2016
http://dx.doi.org/10.1787/888933363233
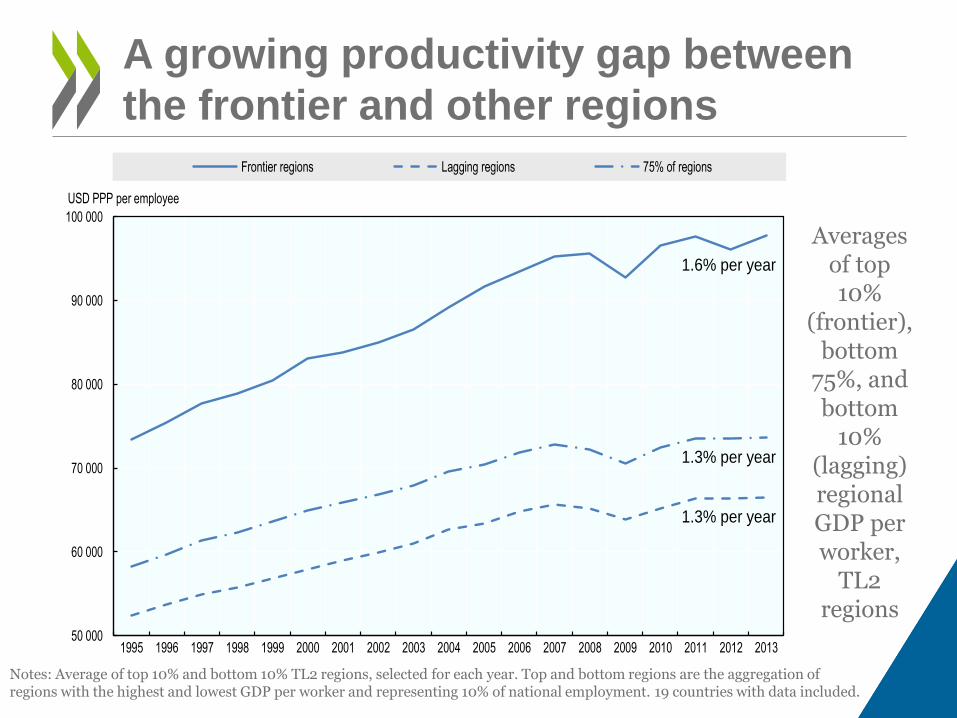
A growing productivity gap between
the frontier and other regions
Notes: Average of top 10% and bottom 10% TL2 regions, selected for each year. Top and bottom regions are the aggregation of regions with the highest and lowest GDP per worker and representing 10% of national employment. 19 countries with data included.
Averages of top 10%
(frontier), bottom
75%, and bottom
10% (lagging) regional GDP per worker,
TL2 regions
50 000
60 000
70 000
80 000
90 000
100 000
1995 1996 1997 1998 1999 2000 2001 2002 2003 2004 2005 2006 2007 2008 2009 2010 2011 2012 2013
USD PPP per employee
Frontier regions Lagging regions 75% of regions
1.6% per year
1.3% per year
1.3% per year

What are the frontier, catching-up and
diverging regions?
0
10
20
30
40
50
60
70
80
Mostly Urban (127) Intermediate (62) Mostly Rural (100)
%
Frontier (41) Catching-up (65) Keeping pace (107) Diverging (76)
70% of mostly urban frontier regions contain very large cities
75% of diverging mostly urban regions contain very large cities
TL2 regions, 2000-2013

Contribution of the different regional
productivity patterns to OECD growth
Type of regions
Employment
share in 2000
GDP share in
2000
Annual avg. GDP growth,
2000-13
GDP growth contribution
Frontier 16.1% 20.1% 1.7% 21.9%
Catching up 20.3% 18.2% 2.2% 25.3%
Keeping pace 38.9% 39.1% 1.3% 30.4%
Diverging 24.6% 22.6% 1.6% 22.4%
OECD average 1.6% Note: Frontier regions are fixed for the 2000-13 period. In four countries the values for 2000 or 2013 were extrapolated from growth rates over a shorter time period as data for 2000 or 2013 were not available. The countries are FIN (2000-12), HUN (2000-12), NLD (2001-13) and KOR (2004-13).
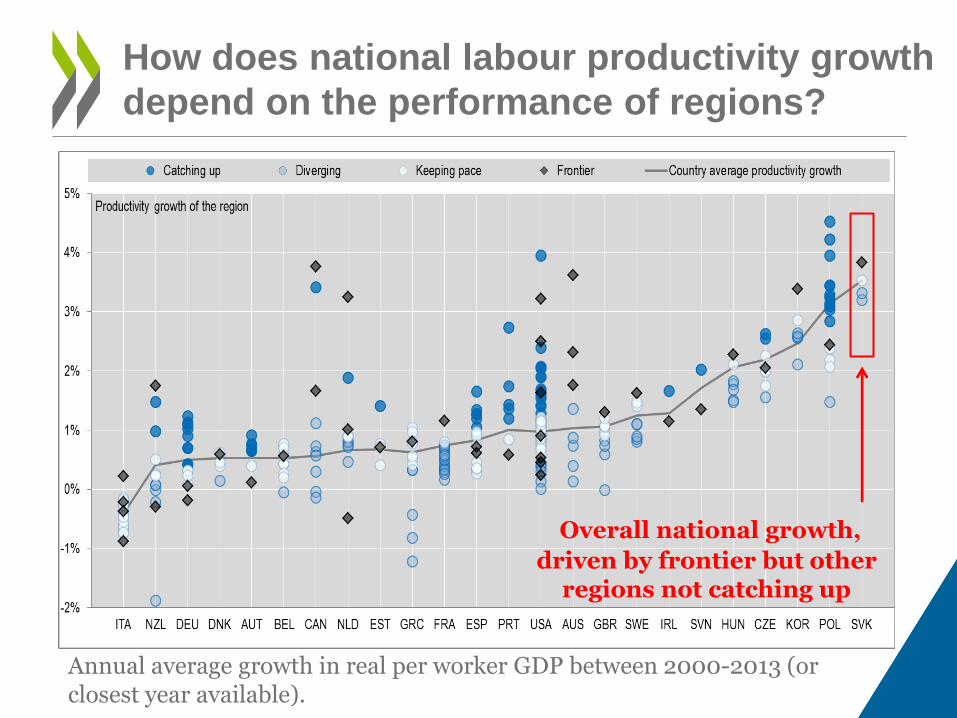
How does national labour productivity growth
depend on the performance of regions?
Annual average growth in real per worker GDP between 2000-2013 (or closest year available).
Overall national growth,
driven by frontier but other regions not catching up

Contribution to national labour productivity growth, 2000-12
12
Productivity and “catching up” dynamics:
Slovak Republic
Percentage contribution to national GDP growth, 2000-2012
Note: Difference between national labour productivity growth as calculated with and without the indicated region.
Note: The contribution is the product of a region’s GDP growth rate by its initial share of GDP.

What are the main drivers of regional
productivity catching-up?
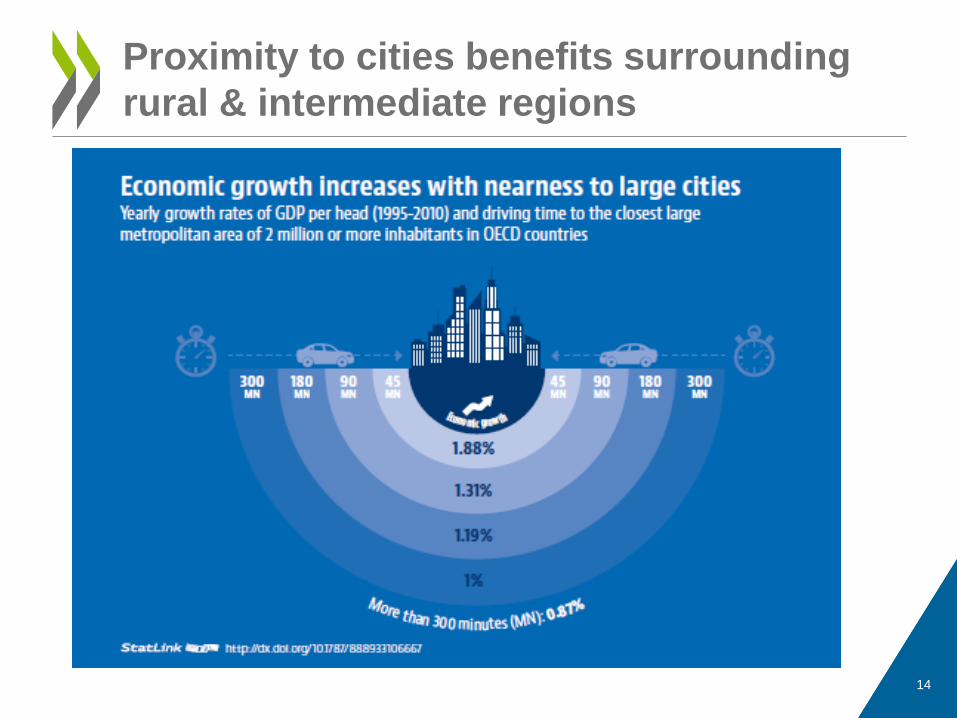
Proximity to cities benefits surrounding
rural & intermediate regions
14

Productivity trends by type of region
15
Rural remote regions present a higher variation in productivity growth rates than other types of regions
Annual average labour productivity
growth, 2000-12 Standard deviation
Coefficient of variation
Predominantly urban
1.01% 1.02% 1.019
Intermediate 1.07% 1.09% 1.024
Predominantly rural close to
cities 1.36% 1.32%
0.972
Predominantly rural remote
0.70% 1.15% 1.641
Note: Labour productivity is defined as real GDP per employee. GDP is measured at PPP constant 2010 US Dollars, using SNA2008 classification; employment is measured at place of work. The coefficient of variation represents the ratio of the standard deviation over the mean.
Source: OECD Regional Outlook 2016

Labour productivity of remote rural
areas has recently declined
88%
89%
90%
91%
92%
93%
94%
2000 2001 2002 2003 2004 2005 2006 2007 2008 2009 2010 2011 2012
Total RURAL
RURAL CLOSE TO CITIES
RURAL REMOTE
Productivity levels of Predominantly Urban regions = 100
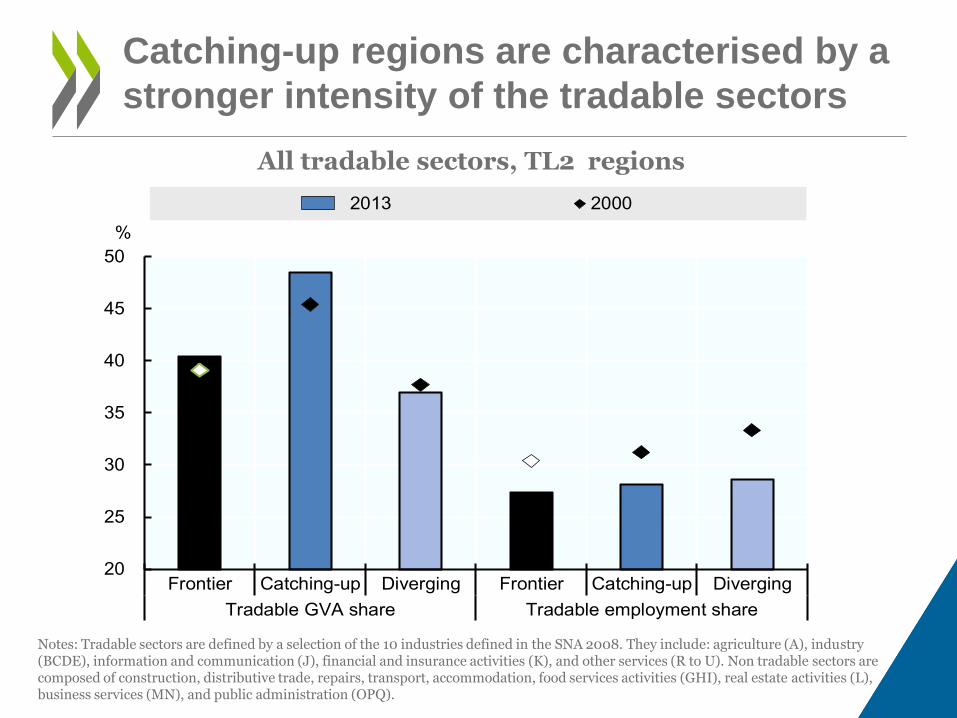
Catching-up regions are characterised by a
stronger intensity of the tradable sectors
All tradable sectors, TL2 regions
Notes: Tradable sectors are defined by a selection of the 10 industries defined in the SNA 2008. They include: agriculture (A), industry (BCDE), information and communication (J), financial and insurance activities (K), and other services (R to U). Non tradable sectors are composed of construction, distributive trade, repairs, transport, accommodation, food services activities (GHI), real estate activities (L), business services (MN), and public administration (OPQ).
20
25
30
35
40
45
50
Frontier Catching-up Diverging Frontier Catching-up Diverging
Tradable GVA share Tradable employment share
2013 2000
%

-0.5
0
0.5
1
1.5
2
2.5
Low-income andlow-growth regions
Other regions Frontier Catching up Keeping pace Diverging
%
Sectoral and regional contributions to productivity growth 2000-13
Employment shifts to faster growing sectors Employment shifts to initially more productive sectors Sectoral productivity growth Productivity growth
18
Productivity growth mainly by increased productivity within
sectors; sectoral changes noted in catching-up regions
1. Employment shifts towards sectors with high productivity levels
3. Sector becomes more productive
2. Employment shifts from faster growing to slower growing sectors

Structural change can create productivity
growth, but the transition can be costly
Productivity and employment growth in Norte (Portugal), 2000-13 Bubble size indicates percentage contribution to total GVA
-177 000 jobs
+20 000 jobs

Regional Policies and Governance

How can we reap greater benefits for
regions given the Outlook findings?
• Focus on productivity drivers and growth in all
regions through strategic investments
– And avoid stifling the performance of the leading region
• Consider how cites are linked together in a “system of cities” within a country
– And how cities are linked with their hinterland
• For rural areas, upgrade the approach to a “Rural Policy 3.0”
– Consider non-farm rural development, local capacity
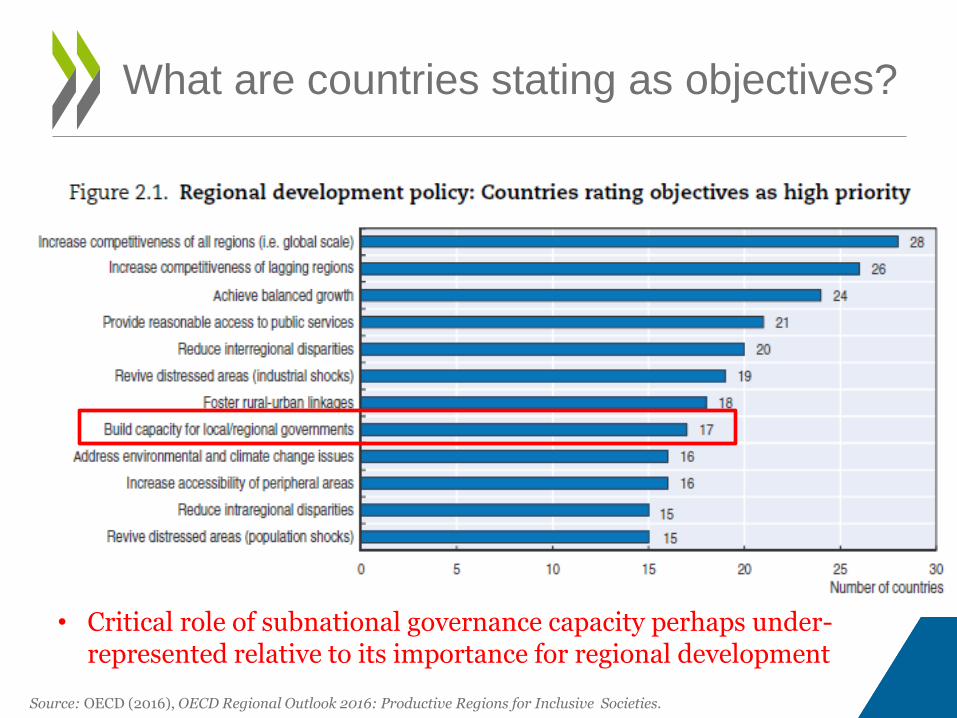
What are countries stating as objectives?
Source: OECD (2016), OECD Regional Outlook 2016: Productive Regions for Inclusive Societies.
• Critical role of subnational governance capacity perhaps under-represented relative to its importance for regional development
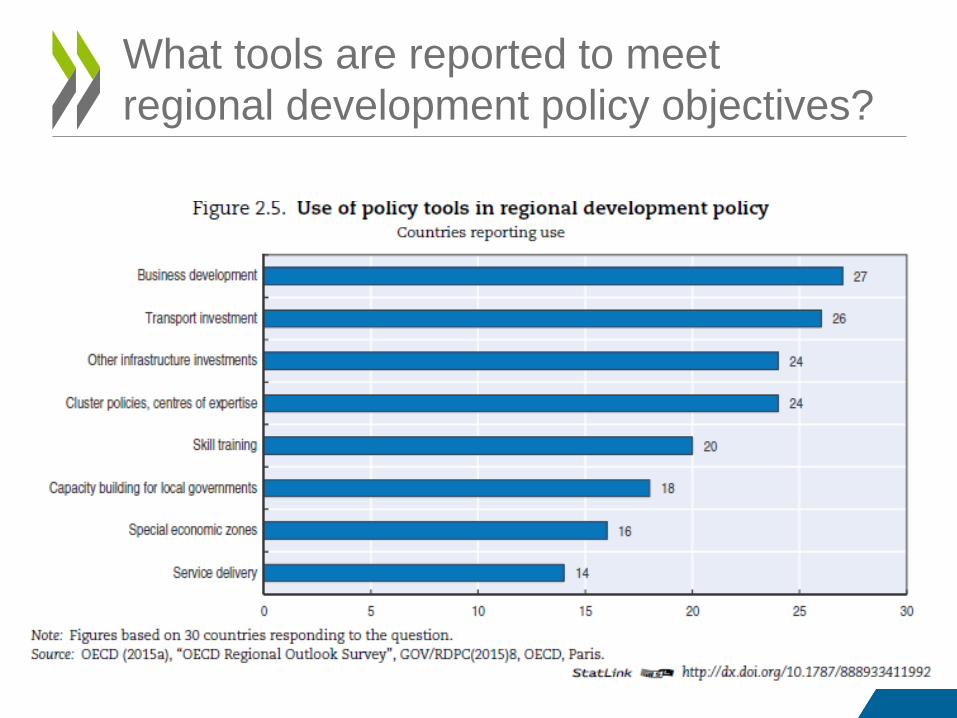
What tools are reported to meet
regional development policy objectives?

Frameworks for regional development
Source: OECD (2016), OECD Regional Outlook 2016: Productive Regions for Inclusive Societies.
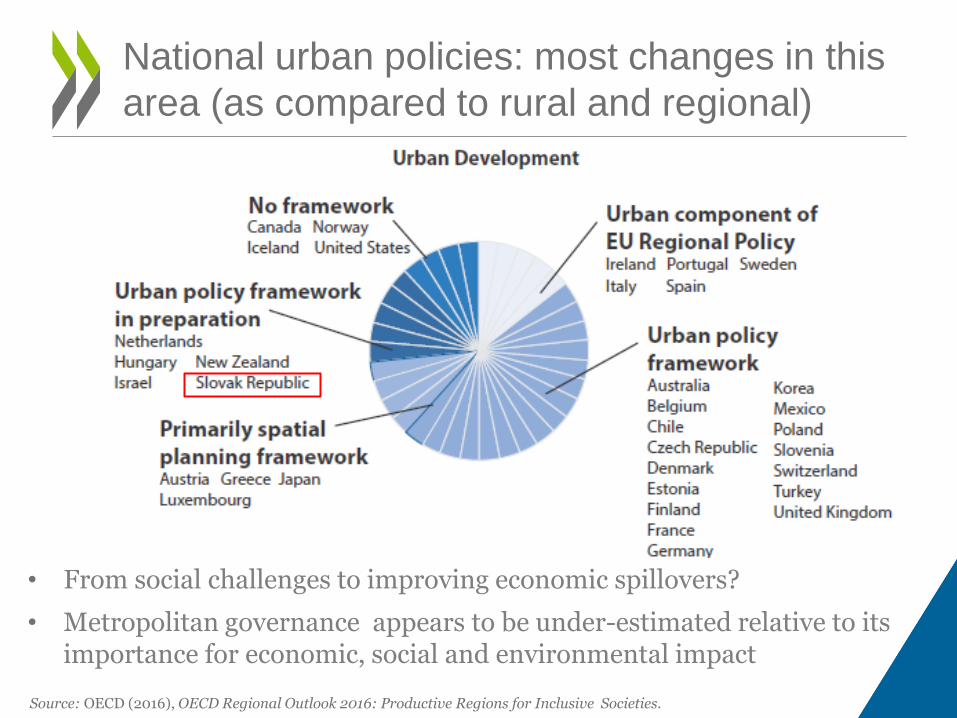
National urban policies: most changes in this
area (as compared to rural and regional)
• From social challenges to improving economic spillovers?
• Metropolitan governance appears to be under-estimated relative to its importance for economic, social and environmental impact
Source: OECD (2016), OECD Regional Outlook 2016: Productive Regions for Inclusive Societies.

EU countries typically base their rural strategies
on the EU Rural Development Programme
Source: OECD (2016), OECD Regional Outlook 2016: Productive Regions for Inclusive Societies.

Within OECD, EU countries more clearly tracking
spending and ensuring monitoring/evaluation
Source: OECD (2016), OECD Regional Outlook 2016: Productive Regions for Inclusive Societies.
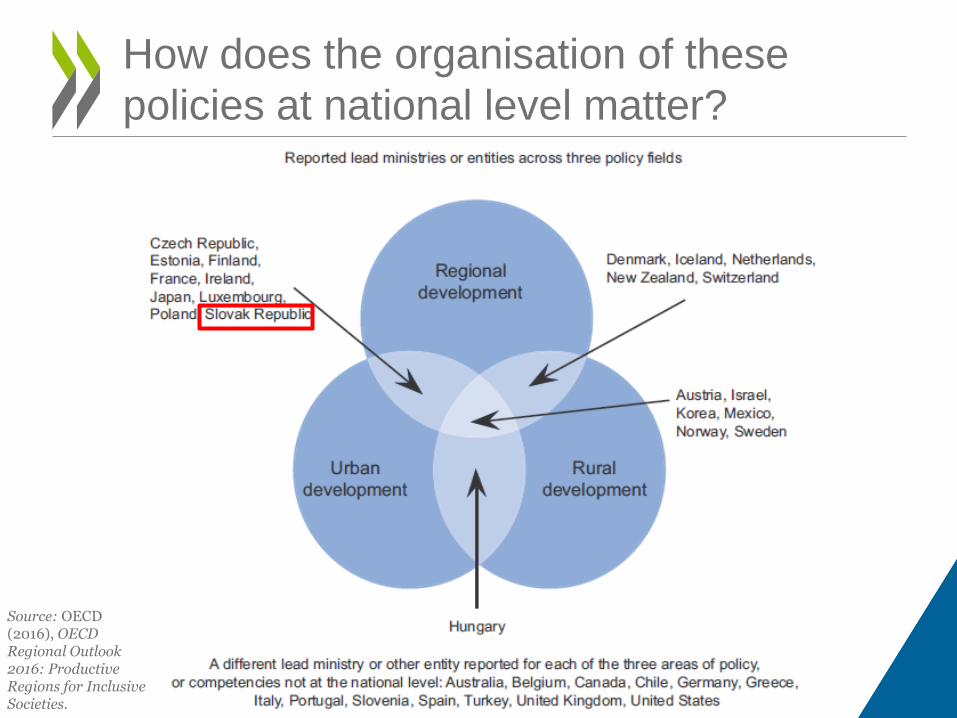
How does the organisation of these
policies at national level matter?
Source: OECD (2016), OECD Regional Outlook 2016: Productive Regions for Inclusive Societies.
• Economy-wide structural reforms help regional catching up, more so if complemented by regional development policies
– Product market regulations
– Labour market regulations
• Multi-level governance and territorial reforms: the “how” matters for place-based policies
– Administrative fragmentation of local jurisdictions associated with
• productivity penalty • greater segregation by income in metro areas
Other strategies to achieve a double
dividend of productivity and inclusion

• Regional productivity catching-up contributes significantly to national productivity growth
• It requires mobilisation of specific regional assets and an appropriate governance model across levels of government
• Thus, the decentralisation and regional governance agenda is a productivity & growth agenda for the whole country
Bottom-line

THANK YOU!