2009 OECD-FAO Agricultural Outlook 2009-2018 OECD … · OECD-FAO AGRICULTURAL OUTLOOK 2009-2018...
95
OECD-FAO Agricultural Outlook 2009-2018 « HIGHLIGHTS 2009
Transcript of 2009 OECD-FAO Agricultural Outlook 2009-2018 OECD … · OECD-FAO AGRICULTURAL OUTLOOK 2009-2018...

OECD-FAO Agricultural Outlook 2009-2018
www.agri-outlook.org
OECD-FAO Agricultural Outlook 2009-2018
This is the fifteenth edition of the Agricultural Outlook and the fifth time it has been prepared jointly by the Organisation for Economic Cooperation and Development (OECD) and the Food and Agriculture Organization of the United Nations (FAO). This edition covers the outlook for commodity markets during the 2009 to 2018 period, and brings together the commodity, policy and country expertise of both organisations. The report analyses world market trends for the main agricultural products, as well as biofuels. It provides an assessment of agricultural market prospects for production, consumption, trade, stocks and prices of the included commodities.
Looking forward, real commodity prices over the 2009-18 period are projected to remain at, or above the 1997-2006 average, the period just before the recent price hikes. An expected economic recovery, renewed food demand growth from developing countries and the emerging biofuel markets are the key drivers underpinning agricultural commodity prices and markets over the medium term. The projections and past trends are presented in the statistical annex, and can be viewed in more detail at the website www.agri-outlook.org.
This edition of the Outlook was prepared in a period of unprecedented financial market turmoil and rapidly deteriorating global economic prospects. Because macroeconomic conditions are changing so quickly, this report complements the standard baseline projections with an analysis of revised short–term GDP prospects and alternative GDP recovery paths. Lower GDP scenarios result in lower commodity prices, with reductions in crop and biofuel prices about one-half those for livestock products. A sensitivity analysis to highly uncertain crude oil prices shows the important links between energy and agricultural prices. The Outlook also reports on a survey of various actors in the agri-food chain in terms of the current impacts of the global economic crisis and credit market constraints. The issue of food security and the capacity of the agricultural sector to meet the rising demand for food remains very high on the international political agenda. This report provides a brief overview of critical factors such as land availability, productivity gains, water usage and climate change, and suggests that agricultural production could be significantly increased, provided there is sufficient investment in research, infrastructure and technological change, particularly in developing countries.
«HIGHLIGHTSHIGHLIGHTS
2009
2009 O
EC
D-FA
O A
gricultural O
utloo
k 2009-2018

OECD-FAO
AGRICULTURAL OUTLOOK
2009-2018
HIGHLIGHTS
The Outlook in Brief
Chapter 1. Overview
Chapter 2. How Resilient is Agriculture to the Global Economic Crisis?
Chapter 3. Can Agriculture Meet the Growing Demand for Food
Annex A. Statistical Tables

ORGANISATION FOR ECONOMIC CO-OPERATION
AND DEVELOPMENT
The OECD is a unique forum where the governments of 30 democracies work together to address
the economic, social and environmental challenges of globalisation. The OECD is also at the forefront
of efforts to understand and to help governments respond to new developments and concerns, such as
corporate governance, the information economy and the challenges of an ageing population. The
Organisation provides a setting where governments can compare policy experiences, seek answers to
common problems, identify good practice and work to co-ordinate domestic and international policies.
The OECD member countries are: Australia, Austria, Belgium, Canada, the Czech Republic,
Denmark, Finland, France, Germany, Greece, Hungary, Iceland, Ireland, Italy, Japan, Korea,
Luxembourg, Mexico, the Netherlands, New Zealand, Norway, Poland, Portugal, the Slovak Republic,
Spain, Sweden, Switzerland, Turkey, the United Kingdom and the United States. The Commission of
the European Communities takes part in the work of the OECD.
OECD Publishing disseminates widely the results of the Organisation‟s statistics gathering and
research on economic, social and environmental issues, as well as the conventions, guidelines and
standards agreed by its members.
THE FOOD AND AGRICULTURE ORGANIZATION (FAO)
OF THE UNITED NATIONS
The Food and Agriculture Organization of the United Nations leads international efforts to defeat
hunger. FAO‟s mandate is to raise levels of nutrition, improve agricultural productivity, better the
lives of rural populations and contribute to the growth of the world economy. Serving both developed
and developing countries, FAO acts as a neutral forum where all nations meet as equals to negotiate
agreements and debate policy. FAO is also a source of knowledge providing access to information in
print and electronic format. We help developing countries and countries in transition modernize and
improve agriculture, forestry and fisheries practices and ensure good nutrition for all. Since our
founding in 1945, we have focused special attention on developing rural areas, home to 70 per cent of
the world‟s poor and hungry people. FAO‟s activities comprise four main areas: putting information
within reach; sharing policy expertise; providing a meeting place for nations; bringing knowledge to
the field.
This work is published under the responsibilities of the Secretary-General of the
OECD and the Director General of FAO. The views expressed and conclusions
reached in this report do not necessarily correspond to those of the governments of
OECD countries, or the governments of FAO member countries. The designations
employed and the presentation of material in this information product do not imply
the expression of any opinion whatsoever of the part of the Food and Agriculture
Organization of the United Nations concerning the legal or development status of
any country, territory, city or area or of its authorities, or concerning the
delimitation of its frontiers or boundaries. Also available in French under the title:
Perspectives agricoles de l’OCDE et de la FAO 2009-2018
© OECD/FAO 2009
OECD freely authorises the use, including the photocopy, of this material for private, non-commercial purposes. Permission to photocopy portions of
this material for any public use or commercial purpose may be obtained from the Copyright Clearance Center (CCC) at [email protected] or the Centre français d‟exploitation du droit de copie (CFC) [email protected]. All copies must retain the copyright and other proprietary notices in
their original forms. All requests for other public or commercial uses of this material or for translation rights should be submitted to [email protected].

3
Foreword
The annual Agricultural Outlook report is prepared jointly by the Organisation for Economic
Co-operation and Development (OECD) and the Food and Agriculture Organization (FAO) of the United
Nations. The projections and assessments provided in this report are the result of close co–operation with
national experts in OECD and some non-member countries, reflecting the combined knowledge and
expertise of this wide group of collaborators. A jointly developed modelling system, based on the OECD's
Aglink and FAO‟s Cosimo models, facilitates consistency in the projections. The fully documented
outlook database, including historical data and projections, is available through the OECD-FAO joint
internet site www.agri-outlook.org.
This report covers biofuels, cereals, oilseeds, sugar, meats, and dairy products over the 2009-18
period. The market assessments are based on a set of underlying assumptions regarding macroeconomic
factors, agricultural and trade policies and production technologies. They also assume average weather
conditions and long-term productivity trends. The Agricultural Outlook presents a consistent view on the
evolution of global agricultural markets over the next decade and provides a baseline for further analysis of
alternative economic or policy assumptions.
In 2009, agricultural markets are characterised by a reduction in commodity prices following
their rapid rise over the 2006-08 period. This report examines the general and commodity-specific factors
behind the price declines. There is also a discussion on the evolution of retail food prices which have
come down but not as quickly as international commodity prices, and with considerable regional variation.
Looking forward, real commodity prices over the 2009-18 period are projected to remain at, or above, the
1997-2006 average. An expected economic recovery, renewed food demand growth from developing
countries and the emerging biofuel markets are the key drivers underpinning agricultural commodity prices
and markets over the medium term.
This year‟s Outlook is set against a backdrop of unprecedented financial turmoil and rapidly
deteriorating global economic prospects. With macroeconomic conditions changing so quickly, the
standard baseline projections are complemented with a scenario analysis of revised short–term GDP
prospects and alternative GDP recovery paths. A sensitivity analysis of commodity markets to crude oil
prices and a survey of the impact of the economic crisis on various actors in the agri-food chain also
contribute to the report‟s timely assessment of the resiliency of the sector to the global economic crisis.
The issue of food security is high on the political agenda as evidenced by the number of recent
high-level summits, including the first ever G8 Agriculture Ministerial in April 2009. Much of the
discussion is about the capacity of the agricultural sector to meet the rising demand for food. Is there more
land that can be brought into production? Can existing agriculture be more productive while becoming
more environmentally sustainable? Will there be enough water? What will be the effects of climate
change? This report provides a brief overview of several critical factors: land availability, productivity
gains, water usage and climate change.
4
Acknowledgements. This Agricultural Outlook was jointly prepared by the OECD and FAO
Secretariats.
At the OECD, the Outlook report was authored by the Agro-Food Trade and Markets Division of the
Trade and Agriculture Directorate: Wayne Jones (Division Head), Pavel Vavra (Outlook Co-ordinator),
Alexis Fournier, Linda Fulponi, Céline Giner, Franziska Junker, Pete Liapis, Garry Smith and
Martin Von Lampe. Additional Directorate contributions were provided by Hsin Huang/Jussi Lankowski
(carbon markets), Kevin Parris (water and climate change) and Sungbum Kim/Nicole Franz (fisheries).
Research and statistical assistance were provided by Armelle Elasri, Alexis Fournier, Claude Nenert and
Nicolas Ruiz. Meetings organisation and document preparation was provided by Christine Cameron with
assistance from Marina Giacalone. Technical assistance in the preparation of the Outlook database was
provided by Frano Ilicic. Many other colleagues in the OECD Secretariat and member country delegations
furnished useful comments on earlier drafts of the report.
At the FAO, the team of economists and commodity officers from the Trade and Markets Division
contributing to this edition consisted of Alexander Sarris (Division Head), Merritt Cluff (Team Leader),
Holger Matthey (baseline co-ordinator), Abdolreza Abbassian, El Mamoun Amrouk, Concepcion Calpe,
Piero Conforti, Cheng Fang, Adam Prakash, Grégoire Tallard, Peter Thoenes, Koji Yanagishima.
Carola Fabi contributed from the Statistics Division. Freddy Nachtergaele, Hubert George and Jacob Burke
contributed from the Natural Resources Management and Environment Department. Research assistance
and database preparation was provided by Claudio Cerquilini, Berardina Forzinetti, John Heine,
Marco Milo, and Barbara Senfter. Secretarial services were provided by Rita Ashton and Valentina Banti.
Background papers were prepared by consultants Allen Featherstone (financial crisis),
Wallace Huffman (technology and innovation), Colin Thirtle and Jenifer Piesse (agricultural productivity
growth).
Finally, the assistance and cooperation of the Executive Director, Peter Baron, and staff of the
International Sugar Organisation (ISO) in London, in reviewing the country level projections and
providing information on the market outlook for sugar and key emerging issues is gratefully
acknowledged.

5
Table of contents
Acronyms and abbreviations ........................................................................................................................... 7
The Outlook in Brief .................................................................................................................................. 10
Chapter 1. Overview .................................................................................................................................... 12
World markets at a glance .......................................................................................................................... 12 Main trends in commodity markets ........................................................................................................... 16 Main trends in food prices ......................................................................................................................... 26
Chapter 2. How Resilient is Agriculture to the Global Economic Crisis? ................................................... 32
The deepening of the financial and economic crisis .................................................................................. 32 Effects of the financial crisis on the agri-food sector: views from industry players .................................. 42 Agricultural futures markets and the speculative activity .......................................................................... 48
Chapter 3. Can Agriculture Meet the Growing Demand for Food? ............................................................. 52
Land and agriculture .................................................................................................................................. 54 Technology and productivity ..................................................................................................................... 59 Water and climate change .......................................................................................................................... 68 Summary and key messages ...................................................................................................................... 72
Annex A. Statistical Tables ...................................................................................................................... 81
Tables
Table 2.1. Futures market activity: total volume of open interest contracts and distribution over
commercial and non-commercial traders (Chicago Board of trade and New York Board of Trade) ........ 49 Table 2.2. Working's T-statistic as a measure of excess speculation ......................................................... 50 Table 3.1. Livestock total factor productivity growth ............................................................................... 65 Table 3.2. Annual total factor productivity growth rates for livestock, 1961-2001 ................................... 65 Table 3.3. Growth rates in public agricultural research expenditures ........................................................ 66 Table 3.4. Public agricultural research expenditures as a share of AgGDP .............................................. 67 Table 3.5. A selection of global projections for irrigation water withdrawals ........................................... 70 Table 3.6. Summary of key 2007 IPCC 4th Assessment for Agriculture by warming increments ........... 71
Figures
Figure 1.1. Nominal commodity prices projected 15-60% higher than 1997-2006 but substantially lower
than in the 2007-08 peak ............................................................................................................................ 13 Figure 1.2. Real crop prices to fall from peaks but to remain above 1997-2006 average.......................... 14 Figure 1.3. Crops production and consumption growth from 2006-08 average to 2018, per cent ............ 14 Figure 1.4. Livestock production and consumption growth from 2006-08 average to 2018, per cent ...... 15 Figure 1.5. Export growth from 2006-08 average to 2018, per cent .......................................................... 15

6
Figure 1.6. Outlook for world crop prices to 2018 .................................................................................... 24 Figure 1.7. Outlook for world livestock product prices to 2018 ................................................................ 26 Figure 1.8. Food price inflation for selected non-OECD countries ........................................................... 29 Figure 1.9. Food price inflation for selected OECD countries .................................................................. 29 Figure 1.10. Contribution of food to inflation for selected non-OECD countries ..................................... 30 Figure 1.11. Contribution of food to inflation for selected OECD countries ............................................ 30 Figure 2.1. Stylized depiction of economic downturn and two alternative recovery assumptions relative
to baseline (left panel), and aggregate annual income growth assumptions for OECD and non-OECD
regions across scenarios (right panel) ........................................................................................................ 35 Figure 2.2. Percentage change in biofuel and crop prices with lower income growth in alternative GDP
scenarios compared to baseline levels ....................................................................................................... 36 Figure 2.3. Percentage change in meat and dairy prices with lower income growth in alternative GDP
scenarios compared to baseline levels ....................................................................................................... 37 Figure 2.4. Changes in consumption of crop products in OECD and Non-OECD countries due to lower
GDP, relative to baseline projections ......................................................................................................... 38 Figure 2.5. Changes in consumption of livestock products in OECD and non-OECD countries due to
lower GDP, relative to baseline projections............................................................................................... 39 Figure 2.6. Baseline and alternative assumptions for crude oil prices ....................................................... 40 Figure 2.7. Impact of higher oil prices on commodity prices compared to baseline (percentage change) 41 Figure 3.1. Agricultural production index by region ................................................................................. 53 Figure 3.2. Gross and net arable land balances by region, 2002 ................................................................ 55 Figure 3.3. World trend of arable, harvested land areas, and multiple cropping intensity (1980=1)......... 57 Figure 3.4. Arable land by region .............................................................................................................. 58 Figure 3.5. Multiple cropping index in selected years ............................................................................... 59 Figure 3.6. Average Iowa corn yields ........................................................................................................ 61 Figure 3.7. Average wheat yields, Kansas and France .............................................................................. 62 Figure 3.8. Japan rice yields ...................................................................................................................... 62 Figure 3.9. Iowa soybean yields ................................................................................................................ 63 Figure 3.10. Dutch potato yields ................................................................................................................ 64
Boxes
Box 2.1. The sensitivity of the projections to changes in oil prices ........................................................... 40 Box 3.1. Agriculture, climate change and carbon markets ........................................................................ 56 Box 3.2. Agricultural water resource use in OECD countries ................................................................... 69 Box 3.3. Fisheries and aquaculture: responding to the growing demand for food .................................... 75

7
Acronyms and abbreviations
ACP
AMAD
AUSFTA
AI
BNGY
BNLY
BSE
Bt
BTL
CAFTA
CAP
CCC
CET
CIS
CPI
COOL
CRP
CMO
CO2
Cts/lb
Cwe
DBES
DDA
DDG
Dw
EBA
ECOWAP
ECOWAS
EISA Act
EPAs
ERS
Est
E85
EU
EU-15
EU-10
EU-27
FAO
FMD
FOB
FR
FSRI ACT
FCE Act
FTA
GDP
G-10
G-20 GDPD
GHG
GLB
GMO
HFCS
African, Caribbean and Pacific countries
Agricultural Market Access Database
Australia and United States Free Trade Agreement
Avian Influenza
Billion gallons per year
Billion litres per year
Bovine Spongiform Encephalopathy
Billion tonnes
Biomass to liquid
Central American Free Trade Agreement
Common Agricultural Policy (EU)
Commodity Credit Corporation
Common External Tariff
Commonwealth of Independent States
Consumer Price Index
Country of Origin Labelling
Conservation Reserve Program of the United States
Common Market Organisation for sugar (EU)
Carbon dioxide
Cents per pound
Carcass weight equivalent
Date-based Export Scheme
Doha Development Agenda
Dried Distiller‟s Grains
Dressed weight
Everything-But-Arms Initiative (EU)
West Africa Regional Agricultural Policy
Economic Community of West African States
Energy Independence and Security Act of 2007 (US)
Economic Partnership Agreements (between EU and ACP countries)
Economic Research Service of the US Department for Agriculture
Estimate
Blends of biofuel in transport fuel that represent 85% of the fuel volume
European Union
Fifteen member states of the European Union
Ten new member states of the European Union from May 2004
Twenty seven member states of the European Union (including Bulgaria and Romania from
2007)
Food and Agriculture Organization of the United Nations
Foot and Mouth Disease
Free on board (export price)
Federal Reserve (US central bank)
Farm Security and Rural Investment Act (US) of 2002
Food, Conservation and Energy Act of 2008 US Farm Bill
Free Trade Agreement
Gross Domestic Product
Group of 10 countries (see Glossary)
Group of 20 developing countries (see Glossary)
Gross Domestic Product Deflator
Green House Gases
Gross land balances
Genetically modified organism
High Fructose Corn Syrup

8
HS
IEA
iLUC
IPCC
Kt
LAC
La Niña
LDC‟s
LICONSA
Lw
MCI
MERCOSUR
MFN
Mha
MPS
Mt
MTBE
NAFTA
NLB
OECD
OIE
PCE
PIK
PROCAMPO
PPP
PRRS
PSE
Pw
R&D
RED
Rse
Rtc
RFS
Rwt
SFP
SMP
SPS
STRV
t
t/ha
TFP
TRQ
UK
UN
URAA
UNCTAD
US
USDA
VAT
v-CJD
WAEMU
WMP
WTO
Harmonised Commodity Description and Coding System
International Energy Agency
Indirect land-use change
Intergovernmental Panel on Climate Change
Thousand tonnes
Latin America and the Caribbean
Climatic condition associated with temperature of major sea currents
Least Developed Countries
Leche Industralizada
Live weight
Multiple cropping index
Common Market of the South
Most Favoured Nation
Million hectares
Market Price Support
Million tonnes
Methyl Tertiary Butyl Ether
North American Free Trade Agreement
Net land balances
Organisation for Economic Co-operation and Development
World Organisation for Animal Health
Private Consumption Expenditure
Payment in kind programme (US)
Mexican Farmers Direct Support Programme
Purchasing Power Parity
Porcine Reproductive and Respiratory Syndrome
Producer Support Estimate
Product weight
Research and Development
Renewable Energy Directive in the EU
Raw sugar equivalent
Ready to cook
Renewable Fuels Standard in the US, which is part of the Energy Policy Act of 2005
Retail weight
Single Farm Payment scheme (EU)
Skim milk powder
Sanitary and Phytosanitary measures
Short Tons Raw Value
Tonnes
Tonnes/hectare
Total factor productivity
Tariff rate quota
United Kingdom
The United Nations
Uruguay Round Agreement on Agriculture
United Nations Conference on Trade and Development
United States of America
United States Department of Agriculture
Value added tax
New Creutzfeld-Jakob-Disease
West African Economic and Monetary Union
Whole milk powder
World Trade Organisation

9
Symbols
AUD Dollars (Australia)
ARS Pesos (Argentina)
Bn Billion
BRL Real (Brazil)
CAD Dollars (Canada)
CNY Yuan (China)
EUR Euro (Europe)
gal
Ha
Gallons
Hectare
hl Hectolitre
INR Indian rupees
KRW Korean won
lb
Mn
MXN
NZD
p.a
RUR
THB
USD
ZAR
Pound
Million
Mexican pesos
Dollars (New Zealand)
Per annum
Ruble (Russia)
Thai baht
Dollars (United States)
South African rand

10
Box 1. THE OUTLOOK IN BRIEF
The macroeconomic environment underlying this medium-term outlook, based on the OECD’s and World Bank’s medium term economic projections from December 2008, continues to evolve rapidly due to the ongoing financial and economic crisis. Because of the turmoil in the economic environment the baseline projections must be interpreted with caution. The possible impacts of this deteriorating economic crisis on the baseline projections have been analyzed both qualitatively and quantitatively within the present report, although an assessment of the full impact of the current global credit crunch and economic contraction on agricultural markets goes beyond the scope of this Outlook.
A stronger than expected agricultural commodity supply response last year, particularly in developed countries, and much lower oil prices has resulted in significantly lower commodity prices from 2007-08 highs. Continued weakness in the general economy will further dampen commodity prices over the next 2-3 years, which should then strengthen with economic recovery.
The situation varies by commodity but average prices in real terms (adjusted for inflation) for the next 10 years are still projected at or above the levels of the decade prior to the 2007-08 peaks. Average crop prices are projected to be 10-20% higher in real terms relative to 1997-2006, while for vegetable oils real prices are expected to be more than 30% higher.
Meat prices in real terms are not expected to surpass the 1997-2006 average, while reduced consumer incomes in the beginning of the projection period will tend to encourage substitution to cheaper meats, favouring poultry over beef. Average dairy prices in real terms are likely to be slightly higher in 2009-18 relative to 1997-2006, driven up by rising energy and vegetable oil prices, with a 12% increase in average butter prices being the most notable.
Despite the significant impact of the global financial crisis and economic downturn on all sectors of the economy, agriculture is expected to be relatively better off, as a result of the recent period of relatively high incomes and a relatively income-inelastic demand for food.
Global economic prospects are now more pessimistic than earlier in the year when this outlook was prepared. In response, the outlook includes a special focus on the resiliency of agriculture to economic recession. The analysis suggests that the reduction in agricultural prices, production and consumption, associated with lower incomes is likely to be moderate, as long as economic recovery begins within 2-3 years.
This special focus provides an assessment of an even deeper and more prolonged recession with lower GDP and incomes than in the outlook baseline. Demand for higher cost livestock products, such as beef, pork and dairy, would be the most seriously affected. Beef prices would be about 9% below those projected in the baseline. The reductions in crop and biofuel prices associated with the lower GDP scenarios were only about one-half those for livestock products. Among cereals, maize prices were the most responsive to lower GDP, reflecting its use primarily as a feed ingredient rather than a biofuel feedstock.
The special focus also includes a survey of the impact of the financial market turmoil and economic crisis on agri-businesses, from input suppliers to retail. The sector seems to be weathering the recession fairly well to date. However, downstream sectors are experiencing difficulties in access to credit. Trade finance constraints are having significant impacts on firms and should these tight credit markets persist, firm viability could be in peril. Access to credit was viewed as the key issue, particularly by smaller agri-food firms in both OECD and non-OECD countries surveyed.
The special focus also examines the sensitivity of agricultural prices to crude oil prices. Energy and agricultural prices have become much more interdependent with industrialised farming, more processing and increased transport, as well as the emergence of the biofuels industry (particularly for maize, oilseeds and sugar feedstocks). Crude oil prices are highly volatile and some projections are well above those used in this outlook.
The crude oil price over the medium-term assumed for the baseline is about 60% higher than the 1997-2006 average in real terms, moderately increasing to USD 70 per barrel by the end of projection period. If crude oil prices increased to the USD 90 to USD 100+ per barrel level used in last year’s Outlook, agricultural prices would be significantly higher; with the largest impact on crops, driven mainly by reduced crop production with higher input costs, but also increased feedstock demand for biofuels.

11
Biofuel markets increasingly depend on government mandated use, but prospects remain uncertain, due to such unpredictable factors as the future trend in crude oil prices, changes in policy interventions and developments in second-generation technology. Biofuels will struggle to compete with relatively low fossil fuel prices as long as crude oil prices remain in the USD 60-70 range assumed for most of this Outlook, although biofuel support policies underpin ethanol and biodiesel prices and production. A projected rapid expansion of biofuel production to meet mandated use will continue to have inflating price impacts for such feedstocks as wheat, maize, oilseeds and sugar.
Once economic recovery begins most of the growth in agricultural production and consumption will continue to come from developing countries. This is particularly evident for livestock products where the primary drivers are income and population growth, with a trend towards higher animal protein diets and continuing urbanisation.
For almost all commodities, projected growth in imports and exports of developing countries exceeds that of the OECD area. Continued expanding South-South trade is a key feature of the Outlook. Nevertheless, OECD countries will continue to dominate exports of wheat, coarse grains and all dairy products.
A key focus of last year’s Outlook was the large hike in food prices associated with rising commodity prices. While commodity prices have since declined, food prices have remained high in many countries. Still, food inflation has come down. Over the 3 and 6 month periods ending February 2009, the decline in food price indices in many countries has been accelerating.
According to recent FAO work using longer term population and income projections, global food production needs to increase more than 40% by 2030 and 70% by 2050, compared to average 2005-07 levels. There is substantial additional land available for use in agriculture. Some 1.6 billion ha could be added to the current 1.4 billion ha of cropland. Over half of the additionally available land is found in Africa and in Latin America. These regions account for most of the available land that has the highest suitability class for rain-fed crop production. But historical expansion of arable land has been slow, and bringing more marginal land into
production can involve considerable investment and lower average yields, while possibly incurring social and environmental costs.
Crop and livestock productivity continues to rise at long term trend rates, at least in the most productive areas, and there is considerable potential for further increases over the next 10-20 years. To capitalize on this potential requires development and adaptation of new technologies but growth in public agricultural research expenditures is slowing. In many regions like Central and Eastern Europe and Sub-Saharan Africa, productivity can be significantly increased using existing technologies with better access to inputs, infrastructure development and extension services.
Agriculture accounts for over 40% of water use in OECD countries and use has been growing. Irrigation accounts for 99% of this use and major developing countries like China and India have large areas under irrigation. The FAO projects a substantial slowdown in expansion of area under irrigation, and future agricultural production will be increasingly conditioned by water availability.
Climate change is an important variable in future production possibilities as well. It will clearly add to the risks of water stress as well as the incidence and severity of floods, and likely shift production frontiers.
Behind this fairly positive outlook for agricultural commodity markets lies a more disturbing story about hunger and food insecurity for some one billion people. Food security is not only about solving the urgency in the short-term; it is also about addressing the longer term issues of poverty alleviation and economic growth. Greater investment in agriculture, more effective development aid and reforms to trade and domestic policies are all part of the solution.

12
CHAPTER 1
OVERVIEW
Preparation of the 2009 OECD-FAO Agricultural Outlook report, in this year of unprecedented global
economic turmoil, has been particularly difficult and requires additional caution on the part of readers
when interpreting the results as the macroeconomic situation is constantly unfolding.
The outlook baseline incorporates a serious global economic slowdown but reflects a less profound
recession than that foreseen by major economic institutions in late March 2009. The macroeconomic
assumptions in the baseline have GDP contracting in many regions of the world and, in the OECD area as
a whole, with a resumption of economic growth projected for 2010; higher growth then continues
throughout the remainder of the projection period. A special assessment of certain aspects of the impact of
the unfolding economic crisis on agriculture is provided in Chapter 2.
World markets at a glance
Such was the force of the 2008 high food price shock which reverberated across countries, especially
in the economically vulnerable ones, that some even raised questions about the future reliability of
international markets to deliver sufficient quantities of food at affordable prices. Since then agricultural
commodity prices have fallen substantially, but food prices in a number of developing countries have
remained high well into 2009.
Without doubt, the influence of the macroeconomic factors in determining the contours of the world
agricultural landscape has never been so profound. These forces transcend agricultural sectors, spilling
over from one commodity to another and also transcend geographical boundaries, given the greater
interdependence of the world economy. Continuing macroeconomic turbulence is likely to be a feature of
the near term period.
In the immediate aftermath of last year‟s high-price crisis, there has again been evidence of the rapid
responsiveness of global agriculture. High international commodity prices have transmitted signals to
farmers to allocate more resources and increase agricultural production. When measured at the global
level, the cereal sector for instance, reassuringly responded with a 7% expansion in output. However, not
all farmers responded similarly as high world prices are not transmitted to local producers in many
instances. A decomposition of the response of farmers by economic regions reveals that: output expansion
in developed countries amounted to over 13%, but developing countries together could only muster a 2%
increase in their cereal production.
This lack of response from a large part of the world underscores the need for policy reform and
additional investment in productive agriculture, particularly in many developing countries. Structural
problems are likely to persist, especially for the Least Developed Countries (LDCs), limiting their capacity
to produce. The projections for them are marked by growing net imports of basic food commodities. In
these countries, population numbers continue to increase rapidly and domestic production growth is unable
to keep pace with demand.
13
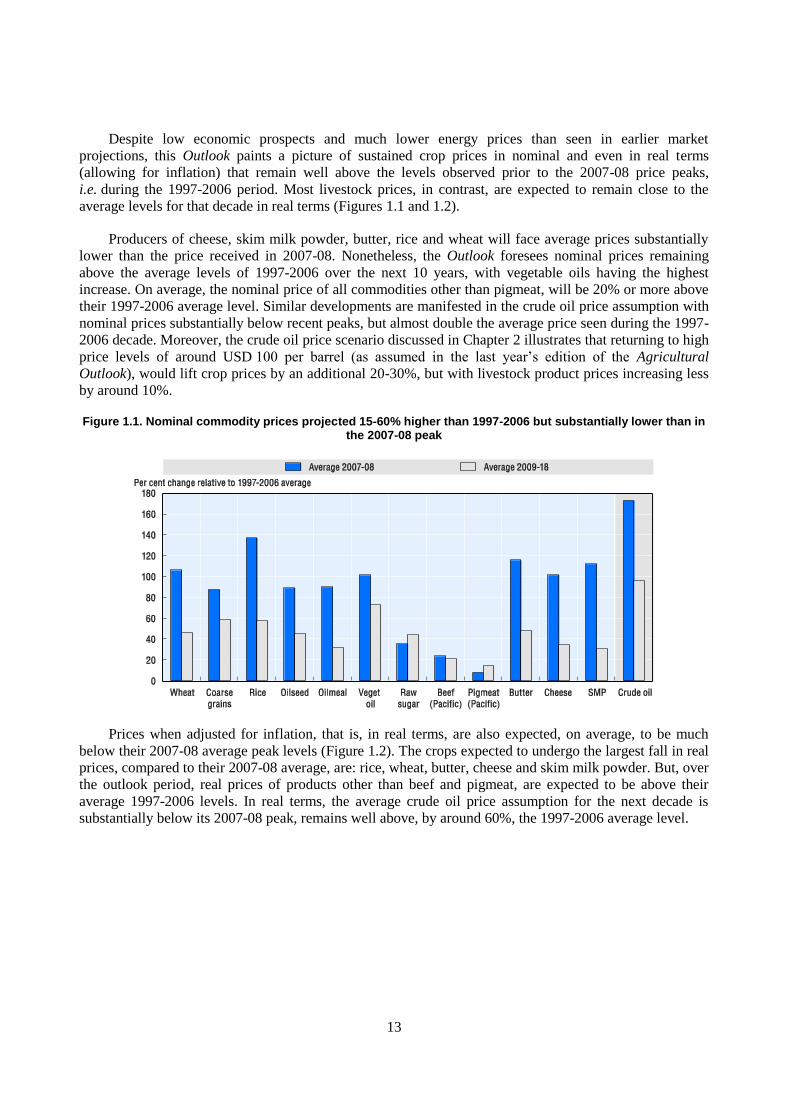
Despite low economic prospects and much lower energy prices than seen in earlier market
projections, this Outlook paints a picture of sustained crop prices in nominal and even in real terms
(allowing for inflation) that remain well above the levels observed prior to the 2007-08 price peaks,
i.e. during the 1997-2006 period. Most livestock prices, in contrast, are expected to remain close to the
average levels for that decade in real terms (Figures 1.1 and 1.2).
Producers of cheese, skim milk powder, butter, rice and wheat will face average prices substantially
lower than the price received in 2007-08. Nonetheless, the Outlook foresees nominal prices remaining
above the average levels of 1997-2006 over the next 10 years, with vegetable oils having the highest
increase. On average, the nominal price of all commodities other than pigmeat, will be 20% or more above
their 1997-2006 average level. Similar developments are manifested in the crude oil price assumption with
nominal prices substantially below recent peaks, but almost double the average price seen during the 1997-
2006 decade. Moreover, the crude oil price scenario discussed in Chapter 2 illustrates that returning to high
price levels of around USD 100 per barrel (as assumed in the last year‟s edition of the Agricultural
Outlook), would lift crop prices by an additional 20-30%, but with livestock product prices increasing less
by around 10%.
Figure 1.1. Nominal commodity prices projected 15-60% higher than 1997-2006 but substantially lower than in the 2007-08 peak
Prices when adjusted for inflation, that is, in real terms, are also expected, on average, to be much
below their 2007-08 average peak levels (Figure 1.2). The crops expected to undergo the largest fall in real
prices, compared to their 2007-08 average, are: rice, wheat, butter, cheese and skim milk powder. But, over
the outlook period, real prices of products other than beef and pigmeat, are expected to be above their
average 1997-2006 levels. In real terms, the average crude oil price assumption for the next decade is
substantially below its 2007-08 peak, remains well above, by around 60%, the 1997-2006 average level.

14
Figure 1.2. Real crop prices to fall from peaks but to remain above 1997-2006 average
The increases in most commodity prices in the period 2007-08 and lingering concerns about the
potential deleterious effects of climate change on agriculture have highlighted the issue of the potential
precariousness of the state of future food availability especially in developing countries. For the medium
term, however, the projections imply an increase worldwide of 10% or more for all products included in
the outlook suggesting more ample future supplies. As indicated in Figure 1.3 for crops and Figure 1.4 for
livestock products, relative to 2006-08 average, worldwide production of vegetable oils in 2018 is expected
to be more than 40% greater while that of oilseeds, oilmeals, poultry, butter and whole milk powder is
expected to be more than 30% greater. Other than wheat and coarse grains, the Outlook foresees
agricultural commodity production increasingly shifting away from developed countries towards
developing regions, especially among emerging and middle income countries. This shift is especially
pronounced for meat and dairy products.
Growth in consumption of agricultural products is also expected to relocate to the developing world
driven by stronger population and rising incomes. Relative to average consumption during 2006-08,
oilmeals use in developing countries will be almost 60% greater in 2018, while consumption of butter and
poultry will be some 50% greater and that of vegetable oils will be about 40% larger.
Figure 1.3. Crops production and consumption growth from 2006-08 average to 2018, per cent

15
Figure 1.4. Livestock production and consumption growth from 2006-08 average to 2018, per cent
Reflecting the changing global production and consumption landscape, international agricultural
markets are progressively becoming characterised by the emergence of non-traditional exporters that are
exploiting their emerging comparative advantage in agricultural production. Figure 1.5 reflects the
percentage change in exports in 2018 relative to average exports during 2006-08. This shows that trade will
continue to deliver products where they have ready markets as exports expand over the next decade. But,
butter and coarse grains exports from OECD countries are expected to contract by 2018 compared to their
averages during 2006-08. In contrast, a larger share of wheat, rice and especially oilmeal exports will be
delivered by OECD countries. Interestingly, over the next ten years, non-OECD countries are expected to
provide the fastest growth of value-added agricultural and food products such as beef, pork, poultry, butter,
cheese, skim milk powder and whole milk powder, if not always the largest share of trade in all these
products.
Figure 1.5. Export growth from 2006-08 average to 2018, per cent

16
Main trends in commodity markets
Grain markets find a new equilibrium
Prompted by exceptionally high farm gate prices and supported by favourable growing conditions,
farmers around the world delivered record wheat and coarse grain crops in 2008, even though the
production response was disproportionate between developed and developing countries. Importantly, the
growth in output enabled grain inventories to be replenished to levels that calmed and restored confidence
in markets. Higher inventories should, other things being equal, provide a buffer for an anticipated
contraction in global grain output in 2009 to more normal levels. With the prospect of lower prices over the
course of the Outlook than anticipated last year, there will be less incentive to expand new, less productive
arable area in many countries or in higher expenditures on yield enhancing inputs. Instead, relative price
changes will prompt mainly the reallocation of existing land and resources among grain and oilseed crops
with those crops offering the highest returns gaining the most ground. Therefore, much of the growth in
world grain output is expected to stem from productivity gains, but yield growth is not expected to match
the rate attained in the previous decade.
Declining growth in per capita demand for staple foods remains an important feature characterising
wheat and rice markets. Although the direct food consumption of grains is generally resilient to falling
household incomes, demand for grains from other sectors is much more exposed to macroeconomic
turbulence. For instance, demand from the biofuel sector for energy feedstocks, particularly for maize in
the United States and increasingly for wheat in Europe, is likely to be supported by mandates rather than
through competition with petroleum products which, with the help of tax concessions and other forms of
public support, was the case in the past few years. Feed grain demand by livestock sectors while continuing
to be an important growth driver, particularly in developing countries, will also be moderated by the
macroeconomic environment as the consumption for these commodities is much more sensitive to changes
in income, though prospects appear brighter ahead.
Wheat transactions fuel expanded grain trade
Growth prospects in global grain trade remain firm but only after several years of hesitant
performance. The economic downturn twinned with liquidity constraints looks likely to take their toll on
international grain trade and other commodity exchange as well. However, assuming that confidence
returns to markets early in the coming decade, world wheat trade is projected to expand at an average
annual rate of almost 2% over the remainder of the projection period. The US, the EU and Australia are set
to govern global wheat supplies, but by the end of the outlook, the CIS country group is expected to be the
dominant source of wheat exports. Developing countries will continue to fuel global wheat demand, such
as those situated in South and East Asia, as well as Africa such as Nigeria and Egypt to feed fast growing
local populations. Saudi Arabia is also projected to confirm its status as a major importer in view of the
recent change in its policy to gradually phase out large production subsidies. Overall rising per capita
incomes and expanding populations fuelling the food markets of developing countries are behind increased
imports and global demand that has outpaced domestic production capacity. But generally, growth in per
capita food consumption of wheat is expected to remain modest or even to decline in some countries,
notably in China. Diets in these countries are slowly shifting towards more value added food products in
the face of rising incomes; a phenomenon that has already taken place in much of the OECD area.
In the case of coarse grains, prospects for trade expansion beyond the rate of the preceding decade are
much more subdued. The growth in international demand for coarse grains will be predominantly driven
by increased feed demand from livestock industries in developing economies which are expected to resume
their rapid pace of expansion after several years of lacklustre growth. Imports by these countries as a

17
group, are expected to grow to 97 million tonnes, representing nearly three-quarters of the world total,
offsetting the anticipated decline in deliveries to developed countries.
Productivity increases support the rice sector but climate change could forestall progress
The high price event of 2008 demonstrates just how much political weight rice continues to carry
around the world, for the reasons behind the doubling of international quotations over 2006-08 had more to
do with government interventions and trade restrictions than with supply and demand fundamentals. The
totality of all uncoordinated policy interventions which were made in the hope of shielding domestic
markets from external events, only served to heighten international rice prices and volatility.
Soaring rice prices in 2007 and 2008 combined with an intensification of government support,
stimulated a strong expansion in paddy cultivation in 2008, demonstrating that the sector can quickly react
to improved economic incentives when they arise. The tendency for rice plantings to expand may well
continue in the next few years, especially in those countries that have renewed their commitments to rice
self-sufficiency goals. However, by the end of the outlook, the area under rice is expected to have changed
little from current levels reflecting offsetting country adjustments. Most of the world‟s largest producers
may witness a contraction, with the retrenchment likely to occur in the less efficient subsistence farming
sectors, while commercial rice cultivation may be expected to gain ground. Plantings are, however,
anticipated to keep rising in Sub-Saharan Africa where large tracks of land suitable to rice cultivation are
available. Among OECD countries, rice cultivation is projected to shrink, consistent with either prevailing
policies or a down grading of support or due to less favourable growing conditions. But the decline in
production is expected to be less pronounced than in the past decade, when most of the sectoral
adjustments were made.
As with the other cereal crops, productivity increases are foreseen to remain the principal engine of
production growth and lay behind a projected 9% expansion in rice production by 2018. The impact of
hybrids and genetically modified strains could be capped by other resource constraints, such as declining
soil fertility, and rising competition for land, water and labour. Rice continues to be primarily a basic food
staple and this importance is being extended to many parts of the world. However, where rice constitutes
the primary staple, especially in Asia, sustained income growth and dietary diversification is expected to
depress per capita rice consumption, by as much as 2 kg over the outlook. Rising demand elsewhere will
drive increased trade flows, especially shipments to Sub-Saharan African countries. OECD countries as a
group are projected to import more rice, led by the European Union amid stagnating production with policy
reform and rising consumption. Few upheavals are foreseen on the export side of the market, with
traditional exporters fulfilling their role over the outlook, but several LDCs in South East Asia could
emerge as important suppliers to the global market. Nevertheless, government interventions to regulate the
market will again likely be the overriding factor in shaping international rice flows and prices. Lessons
learnt from the recent high price episode suggest that world rice carryover stocks could significantly
increase over the projection period, but stock levels are not expected to revert to the record highs reached
in the late 1990s.
Edible oil demand drives the oilseed complex
Of all the arable crops, markets for oilseed commodities look set to undergo the greatest expansion.
By the end of the projection period, global oilseed production is expected to be double the level observed
20 years prior. While still high relative to other crops, the rate of growth over the next 10 years, however,
will not match that observed during the previous decade. Much of the foreseen expansion will be
concentrated in Brazil, the EU and Argentina, supported by land reallocation from competing crops,
diverted pasture lands and some new arable land being brought into production. Such positive prospects
are projected to materialise after a difficult few years that have confronted the sector, especially in South

18
America, where a price-led production expansion was constrained by adverse weather conditions and farm
liquidity problems. However, the importance of this region in driving the global oilseed sector should not
be underestimated: over the period 2009-18, Brazil‟s share of global exports is expected to grow from 30-
39%, and should emerge as the leading oilseed exporter, eventually surpassing the lead position held by the
United States. In addition, the differential export tax system in Argentina should deter oilseed exports and
encourage domestic crushing, paving the way for much larger shipments of oilmeals and vegetable oils in
coming years.
World oilseeds crush will continue to be dictated by vegetable oil demand. The pace of growth in this
sector will likely exceed the rate of expansion in oilseed production. Indeed, largely driven by sustained
income growth once the current economic crisis is overcome, vegetable oils, both from oilseed crops and
from palm, will remain the fastest growing commodity in terms of consumption covered in this outlook.
Much of the projected demand growth will arise from the food sector, where developing countries situated
in Asia could account for almost two-thirds of the global rise in use, but increasing biofuel mandates still
play an important role. The relative importance of vegetable oil as an energy feedstock will be increasingly
contingent on politically set biofuel mandates and other support policies as the profitability of biodiesel
production vis-a-vis fossil diesel prices remains a particular challenge. Current projections indicate that the
derived demand for vegetable oil in biodiesel production could represent 20% of global vegetable oil
consumption by the close of the outlook period.
The rising intensification of livestock sectors which is projected in developing countries is expected to
be a key demand driver for the protein meal market, in contrast to rather stagnant demand for this
commodity among OECD countries. At the end of the projection, China is expected to surpass the
European Union as the leading oilmeal consumer. Substantial growth is also anticipated in Brazil, the CIS
group and in India. Domestic demand in the latter country for protein meals has been declining for several
years to the benefit of exports, but a reversal could take place on account of projected low prices of oilmeal
relative to feedgrains. In the United States, oilmeal usage has likely been constrained by the increasing
availability of low cost dried distiller‟s grains, a by-product of ethanol production, which is expected to
displace almost 8% of future meal consumption by 2018. In spite of rapidly rising oilmeal consumption in
non-OECD countries, when consumption is expressed as a ratio of non-ruminant meat production, average
consumption levels in these countries remain far below levels in the OECD area. The contrast is even more
striking among least developed countries, where for a 1% share of global non-ruminant meat production,
their share of global protein meal usage amounts to just 0.5%.
Policy reform and energy demand set to shape sugar markets
An exception to last year‟s soaring price episode for most commodities was international sugar
markets where prices remained relatively low. If recent history can be taken as a guide, many non-sugar
factors, including the outlook for crude oil and other commodities, exchange rates and freight rate
developments affecting export competitiveness of sugar industries, and the performance of sugar futures
markets with further financial market integration can be expected to continue to affect sugar prices and
their volatility. As a consequence, the sugar market has entered a period of greater instability and
uncertainty given a growing number of price determinants in addition to traditional market fundamentals.
The outlook is further obscured by ongoing policy reform in sugar sectors in major producing and trading
regions such as in the EU as well as in North America.
After losing ground in the base year to other crops with expected higher returns, global sugarcane
production is projected to register a marked acreage expansion, which by 2018 would give rise to a
combined output increase of 2%. How much of this translates into additional sugar production will rest on
the allocation of sugarcane to ethanol production in Brazil, the world‟s leading sugar producer and
exporter, and a major ethanol producer based on sugarcane juice as the feedstock. The upswing in sugar

19
beet cultivation, on the other hand, is expected to be far less dramatic owing to a sharp contraction in the
EU harvested area, following policy reforms. The adoption of improved sugar varieties is expected to some
degree to sustain crop productivity over the outlook period; albeit at a slower rate when compared to the
last decade.
Relative to other commodities, the demand for sugar is relatively passive to changes in world prices
but much more responsive to income changes. This is evident from periods in the past when world
consumption slowed down sharply during times of recession. The unprecedented global financial crisis and
deepening economic downturn in the world economy in 2009 can be expected to have some immediate
impact on per capita consumption, but over the medium-term, high demand growth of the developing
countries should remain steadfast in the wake of fast population growth, and with diets increasingly geared
towards processed and convenience foodstuffs utilising sugar. The opposite development is projected in
OECD countries, where consumption could stagnate on account of declining population growth and dietary
shifts away from sugar amid increasing health awareness and concerns with obesity. Non-OECD countries
should account for virtually all the increase in world sugar production and consumption over the outlook.
By 2018, their share in both market aggregates could rise to the proximity of 80% of the world total.
The EU could emerge as the leading global sugar importer, on account of sectoral reform that has led
to a huge structural contraction in sugar production and sugar beet cultivation. The majority of sugar
inflows to the EU will be sourced under preferential import arrangements with the African, Caribbean and
Pacific (ACP) countries in the context of new Economic Partnership Agreements (EPAs) and with LDCs
under the Everything-But-Arms initiative, but uncertainty prevails regarding export capacity and incentives
in many of these countries. Under provisions in the North American Free Trade Agreement (NAFTA), the
United States‟ sweetener market became fully integrated with Mexico in 2008; in the same year, the US‟s
new multi-year farm legislation (the FCE Act) also came into effect. This will result in higher US market
prices that are expected to encourage increased sugar imports from the NAFTA member Mexico. The
Outlook foresees that the United States will re-surface as a major net importer of sugar (as is the case of the
EU), with some additional inflows originating outside NAFTA countries, especially from those that have
negotiated to fill the country‟s WTO tariff free quota and from third countries with Free Trade
Agreements.
With low production costs and the potential to bring substantial additional land into production,
Brazilian sugar production is expected to grow some 36% over the outlook, and could propel exports to
new heights. Overall outcomes hinge on the price relative between ethanol and sugar, which is foreseen to
regulate a 60% share of cane being diverted to ethanol production by 2018.
Poultry and pigmeat demand in non-OECD countries underpins the global meat sector
Meat prices also proved an exception to the high price event of last year. Falling profit margins as a
result of inflated feed costs, in some instances, prompted livestock farmers to liquidate herds, increasing
meat supplies and lowering prices. These additional supplies tended to dampen any upward pressure on
prices. In other instances, farmers downsized operations by not restocking herds after slaughter. But
perhaps the most important factor that capped price increases was the onset of a contraction in demand
induced by falling purchasing power around the world with the economic downturn. Of the meat sectors
hardest hit, beef meat and pigmeat stand out. Confronted with declining budgets, consumers are expected
to switch from higher priced animal proteins to less expensive meat products.
After the turning point is reached in the economic downturn, the remainder of the meat outlook is
characterised by moderate increases in production and consumption in developing countries and a more
stable path of development in the mature OECD markets. Overall global production growth - a little under
2% per year - is expected to be registered and this will be at a slower pace than witnessed in the past

20
10 years. The expansion of meat production in non-OECD countries could outpace growth in OECD
countries by a factor of 2:1, such that 87% of the expected growth in global production can be attributed to
non-OECD countries. Renewed investment, capacity building, improved infrastructures and the
introduction of modernised, intensive and integrated production technologies, are the main factors spurring
higher growth in these countries. This is especially true for poultry in the emerging economies of China,
Brazil and India, and to some extent in the CIS group of countries which could lower their import
dependency on meat products. As a result, some of the emerging countries, notably Brazil, will be able to
increase substantially their presence in supplying international meat markets. Given abundant land
resources, capital and technology in combination with policy reforms and disease controls, Brazil is
expected to assume one-third of total world meat exports by the end of the outlook; fuelling a 25% rise in
meat shipments compared to the 2006-08 period. A handful of major exporters including the United States,
Canada, Argentina and Australia, alongside Brazil, will remain the dominant traders in world markets. In
contrast, the export share of the EU is expected to further deteriorate over the outlook, owing to policy
reform and rising domestic consumption.
The resumption of a trend of increasing purchasing power in developing countries, will lead to dietary
changes that are increasingly orientated towards protein foodstuffs and additional protein of animal origin
and away from staple foods of vegetal origin. Overall meat consumption in developing countries is
expected to account for around 82% of projected global growth. Much of this expansion will take place in
Asia and the Pacific region, especially in China and also in Latin America, led by Brazil. Such growth will
reflect in particular the rise in consumption of cheaper sources of animal protein, mainly poultry and
pigmeat. Import dependency in meat products is likewise expected to grow in many dynamic developing
countries as demand surpasses the domestic capacity for meat production throughout the duration of the
outlook, although the credit crisis can be expected to slow meat trade to certain destinations in the short-
term. Among the developed countries, the United States is set to assume the mantle of world‟s largest meat
importer by 2018, followed closely by Japan and then the EU.
Another development in the outlook for meat demand concerns the further entrenchment of
established consumer preferences. In countries where pork consumption is traditionally high, such as in
Asia, pigmeat consumption will continue to grow at a faster rate than any other type of meat. Similarly, in
countries where beef meat production is important and international prices have little impact on domestic
production, such as in East Africa, beef meat will remain the preferred type of meat consumed.
Developing countries fuel dairy output growth but only few participate in export expansion
The spectacular increase in international dairy prices was followed by a rapid decline with prices
falling by half to two-thirds from the record levels of mid-2007. Prices were driven down by increased
production, responding to earlier price rises, and by retreating demand. The economic contraction is
expected to weaken demand and put pressure on dairy prices in the short term, but prices are projected to
strengthen when economic prosperity returns to global consumers. Dairy demand over the medium term is
expected to expand particularly in developing countries where increased consumption is not only governed
by income and population growth, but also driven by factors such as changing preferences, changing diets
and dietary diversification, all of which will be encouraged by further urbanisation with economic growth
and development. These drivers are likely to be reinforced by growth in dairy marketing, increased product
availability and retailing channels. Over the outlook, dairy products are expected to remain among the
agricultural commodities for which consumption exhibits the highest growth rates.
In tandem to these broader changes, the outlook foresees dairy sector as more competitive and more
responsive to market signals. Rising supply potential in developing countries stimulated by investment and
restructuring, will enable future production growth and improved domestic marketing linkages, placing
these countries in a stronger competitive position in regional and global markets. As a result, milk
21
production gains over the outlook period will be overwhelmingly driven by output growth in non-OECD
countries, which could capture as much as 81% of the anticipated total increase. Much of the expansion is
set to originate in Asia, including India, the largest producing country in the world, and also China and
Pakistan. Milk production growth will allow such gains to be transformed to higher butter output in South
Asia (India and Pakistan) and greater WMP production in South East Asia (China) - the two products and
the two sub regions set to drive the global dairy expansion. Brazil is also foreseen to fuel world dairy
output through higher WMP production. It remains, however, uncertain how much the milk production
expansion and needed investment activities in developing countries will be impinged by the unfolding
economic crises and financial credit constraints.
Among the OECD countries, New Zealand is to remain a country recording the strongest milk
production growth in percentage terms. In Australia, dairy cow inventories are expected to increase in 2009
for the first time in seven years with a return to normal seasonal conditions paving the way for the
country‟s more positive dairy outlook, but for such prospects to translate to material gains, much would
rest on future water availability. Policy interventions are expected to contribute to shaping the dairy
production outlook landscape. For instance, the EU has decided to abolish the long standing milk
production quota system in 2015 allowing efficient milk producers to expand. The United States has
confirmed support to its milk producers through provisions in the 2008 US Farm Act (FCE Act). Milk
production growth in the United States could account for more than 40% of additional milk production in
the OECD area.
In spite of an expected expansion in trade, international dairy markets will continue to be classified as
“thin” and hence susceptible to price swings. World exports of dairy products are expected to grow for all
products with only a few developing countries able to erode the shares of the traditional OECD exporters
of New Zealand, Australia, the EU and the United States. However, given that the composition of
international dairy product trade is expected to increasingly favour WMP and value added products, an
opportunity is presented for the Mercosur countries of Argentina, Brazil and Uruguay to challenge the
dominance of the traditional exporters.
Import markets will remain rather fragmented compared to those for exports. The six largest importers
of dairy products are expected to account for less than half of the world market. Developing countries are
expected to absorb 96% of global WMP deliveries, 92% of SMP shipments, 57% of traded butter and 44%
of cheese exports. Significantly narrowing the dairy trade deficit with OECD countries presents a challenge
for developing countries for the years to come. An important future endeavour, especially for developing
countries, will be the ability to maintain an image of dairy products as being healthy and safe. The need to
ensure the safety and quality of dairy products is expected to result in increasingly strict requirements for
producers in the future and more stringent testing of milk at various stages of distribution and processing.
Biofuel demand likely to be driven more by policy mandates than by markets
Prospects for biofuels are increasingly driven by quantitative mandates, either in the form of blending
requirements or set as minimum biofuel quantities to be used in the national transport sectors. Under these
circumstances, general uncertainties about other factors, including feedstock prices, crude oil prices and
changes in policy measures other than mandates, become less crucial, although this might change should
there arise significantly higher crude oil prices than those assumed in this outlook. However, two important
areas of uncertainty remain: the pace of commercialisation of second-generation biofuels; and the options
for waiving biofuel mandates if certain conditions related to food security, biofuel economics and
environmental issues are met.
With the exception of Brazilian ethanol production, the commercial viability of biofuel supply has
been, and still remains, a challenge for many sectors throughout the world. Recent developments have

22
shown that in spite of weakening feedstock prices which translate into falling production costs, even lower
crude oil prices have left biofuels struggling to compete with fossil fuels. It is not surprising, therefore, that
public support measures will be the most important drivers of ethanol and biodiesel markets throughout the
projection period.
With both total transportation fuel use and the share of diesel fuels rising across the world1, and
stimulated by rising mandated demand for blending with transportation fuel, global biofuel production is
foreseen to undergo a rapid expansion, going beyond doubling of base year levels, to reach 192 billion
litres by 2018 - 148 billion litres of ethanol and 44 billion litres of biodiesel. Such a prospect arises in spite
of the recent slump in crude oil prices and projection of only a moderate increase in the future.
The world reference ethanol price, which averaged USD 48/hl in 2008 is expected to fall by a fifth in
the current year, and then to trend gradually upwards to 2018. The strengthening of prices over the outlook
is the net result of an expansion in policy-induced use around the world and the dampening effect of rising
growth potential in Brazilian ethanol production and exports. Similarly, owing to the influence of
mandates, particularly in the United States and the European Union, biodiesel reference prices could
remain well above production costs of fossil diesel. International biodiesel prices are expected to fall in
2009 and then to steadily rise towards 2018.
United States, Brazil and the EU continue to dominate biofuels
Policy implementation in the United States - with the passage of the Energy Independence and
Security Act (EISA) and particularly the Renewable Fuels Standard - could pave the way for domestic
ethanol distilleries to produce 63 billion litres by 2018, 83% above the 2008 volume, but resulting in total
biofuel use to remain some 24 billion litres below the level mandated for that year. Cellulosic ethanol
could make some progress, but with only 5.4 billion litres expected to be produced will fall short of the
26.5 billion litre requirement set for 2018. In the EU, following the introduction of the new Renewable
Energy Directive which calls for a 10% share of renewable energy in the transport fuel mix by 2020,
ethanol production is set to rise markedly over the projection period, reaching an average share of 6.6% in
gasoline fuel usage by 2018. Imported ethanol will play an increasingly important role in fulfilling the
mandate, and inflows could rise to 3 billion litres by the end of the outlook. Ethanol in Brazil will remain a
rapidly expanding and increasingly export-oriented sector, and production should grow by around 9%
annually on average over the next ten years. With sugar cane juice remaining the cheapest of the main
feedstocks for ethanol, Brazil will continue to be very competitive in supplying an ever expanding
international market, where global trade could reach 13 billion litres by 2018.
The EU is particularly focused on biodiesel, and while this focus is expected to decline somewhat in
favour of ethanol, biodiesel could attain an energy share of 7.4% in fossil diesel usage by 2018. As a result,
the EU is projected to remain by far the largest biodiesel market, accounting for more than half of all
global biodiesel output throughout the outlook. Steadfast biodiesel demand will be met by both increased
domestic production and, particularly towards the end of the projection period, growing biodiesel imports.
Given high biodiesel prices, growth in biodiesel usage in the United States will almost entirely be driven
by mandates which require 3.8 billion litres of biodiesel to be used in 2012. By contrast, biodiesel use in
Brazil is assumed to grow rapidly following ambitious government targets, and could represent 4% of fuel
usage by 2018, compared to just under 2% in 2006-08.
1 Assumptions for transport fuel consumption are based on data obtained from IEA, national and other
sources. Assumed growth in major biofuel producing and using countries is generally close to or below
historical trends.

23
The stage was set last year for many developing countries, especially in Sub-Saharan Africa and in
South East Asia, to embark on ambitious renewable energy programmes. The recent high oil price event
spurred a myriad of project proposals, but most of them were put on hold at the onset of the economic
crisis as oil prices fell and future market prospects became uncertain, especially in the context of concerns
over longer term food security. A prime example of these constraints is given by jatropha curcas in Sub-
Saharan Africa where the potential has been extensively debated in recent years, but actual production has
been miniscule so far. Given the current investment climate, the OECD-FAO Agricultural Outlook presents
a conservative view on biofuel prospects in many of the developing countries over the projection period.
Agricultural commodity markets have responded strongly to high prices
A major feature of the previous year‟s outlook concerned the potential for high and protracted prices
of almost all agricultural products in real terms. While the relative importance of the many transitory and
permanent factors that lay behind today‟s price trends could change tomorrow, there is lessening evidence
to suspect that the world has undergone any structural upward shift in real agricultural commodity prices.
For such a tendency to occur, the underlying forces that provide momentum to agricultural product supply
will need to be continually outweighed by the forces that drive stronger demand for these products. But the
high price event of last year showed that price signals did provoke a significant supply response. Assisted
by a downturn in the global economy, this response was sufficient to calm markets and to restore some
confidence in the international arena, though at the expense of aggressive stock building and policy
measures to enhance self sufficiency.
However, further episodes of strong price fluctuations cannot be ruled out nor can future short-lived
crises. This is particularly evident when considering the heighten linkages between crop and energy prices.
Energy markets have long influenced the supply side of crop production, inter alia, through their direct
effect on fertiliser, production and transportation costs. However, with the emergence of the biofuel
sectors, particularly in the important crop production and exporting markets of OECD countries, have now
forged a more dynamic link to crude oil markets particularly for grains, oilseeds and sugar, but also
indirectly to other land competing crops. It is increasingly apparent that variability in crude oil prices now
substantially impacts crop prices, even though this link is weakened by the increasing importance of
quantitative biofuel mandates as illustrated in Chapter 2. In addition, given much more macroeconomic
interdependence and globalisation in the world today, the fragility of economies could be exposed from the
transmission of global financial and economic shocks onto domestic markets, profoundly affecting the
competitive positions of nations wishing to trade on international markets, or to build domestic capacity.
Finally, more frequent weather disturbances associated with climate change may render yields much more
variable, leading to instability in trade flows and hence international prices being prone to greater swings.
Productivity increases and higher stocks to contain prices but energy linkages to add pressure
World cereal inventories, having reached very low levels in recent years, are expected to increase over
the projection period, bolstering stock-to-use ratios to the tune of 30% for grains and 22% for rice, which
should help to buffer or restrain upward price movements. As a consequence, wheat prices in real terms are
projected to resume their long-term decline, albeit from a higher level and at a somewhat slower rate.
Coarse grain prices in real terms should also resume their downward trend, but only from around 2015
when the United States‟ mandate for maize-based ethanol reaches its maximum level. Concerning rice
quotations, the trend in falling real prices could stabilise, making rice slightly more expensive relative to
wheat. Nevertheless, in nominal terms most crop markets are expected to see increasing prices over the
outlook (Figure 1.6).
Rising demand for vegetable oils, both for food and to fuel the growing biodiesel sector is expected to
weigh heavily over the medium-term, leaving stock to use ratios in the oilseed complex under some

24
pressure. However, prices of oilseeds, oilseed meal and vegetable oil, once corrected for inflation, are
expected to remain stable over the outlook period, but would stay above long-term trend levels, especially
for vegetable oils and oilseeds and markedly increase in nominal terms (Figure 1.6).
Some strengthening in sugar prices and the white differential towards the end of the Outlook
Lower expected growth in sugar consumption and imports in the developing countries undergoing
economic contraction, could spell weaker sugar prices over the medium-term. However, thereafter a
recovery in demand growth accompanied by stock rundowns could see quotations firming by the end of the
projection period. The white sugar premium is projected to narrow in the near term when new refining
capacity comes on stream, but then to widen by 2018 when increasing supplies of raw sugar arrive on the
market together with rising sugar refining costs keeping white supplies relatively tight (Figure 1.6).
Figure 1.6. Outlook for world crop prices to 2018
Source: OECD and FAO Secretariats.
Meat quotations likely to fall in real terms but dairy product prices to hold firm
Notwithstanding the effects of falling incomes in the short-term, relatively stable feed costs and
domestic meat capacity growth in major exporting countries as well as traditional importing countries is

25
likely to bear down on real international meat prices, while in nominal terms prices are expected to
increase initially - staying relatively flat in the second half of the projection period (Figure 1.7).
Spurred by rising global incomes, world dairy product prices are expected to rebound from 2011
onwards, even in real terms. While this upward trend could dissipate in the second half of the projection
period, average prices in real terms over the outlook period are expected to stay slightly above the 1997-
2006 average, with butter quotations especially supported by rising energy and vegetable oil prices
(Figure 1.7).
However, it is likely that continued weakness in the general economy will somewhat dampen
commodity prices, at least, over the next 2-3 years. As demand for food is relatively income inelastic, less
adjustment in consumption patterns to recession can be expected especially in the higher income OECD
countries. Chapter 2 looks at this issue in more detail. The income scenarios discussed in Chapter 2, based
on assumptions of a deeper recession, suggest only moderately lower commodity prices and production
and consumption adjustments, when compared to outcomes from the outlook baseline, with livestock
producers facing a larger demand response to income changes than crop producers.
For the crop and biofuels products maize is the most responsive crop to the income fall, reflecting the
higher income elasticity from its primary use as a feed ingredient in livestock rations (see Chapter 2 for full
description). Nevertheless, it should be noted that the Chapter 2 scenario analysis does not take into
account reduced import demand due to cancelled import orders resulting from financial crises and credit
constraints. The impact of credit restrictions goes beyond the Aglink-Cosimo model capability but it is
discussed qualitatively in Chapter 2.

26
Figure 1.7. Outlook for world livestock product prices to 2018
Source: OECD and FAO Secretariats.
Main trends in food prices
Food prices remain high but are falling
Rising commodity prices in 2007-08 contributed to sharp increases in food prices, particularly in
developing countries where food is purchased in a less processed form. While commodity prices have
recently declined, this change has not yet worked its way through to food prices in all countries. Over the
past year, ending in February 2009, food price inflation continued to outpace overall inflation; however it
has come down from last year‟s high rates.
While the outlook does not project food prices, there is a great deal of interest in how fluctuations in
commodity markets translate into changes in the cost of food. For this reason, it is instructive to examine
how food prices around the world have changed in recent months as commodity prices have declined. The

27
food price evolution described here is based on the food price component of the Consumer Price Index,
CPI, and is simply the price changes of a fixed basket of foods measured at the retail level.2
The specific foods composing the basket are selected to reflect consumption patterns in different
urban areas.3 Thus, the measure provides a good indication of overall change in the cost of food that
consumers actually face when making purchases. Food is a particularly important component of the CPI in
low income countries because food purchases account for a large share of total consumer spending.
Detailed information on the CPI and food price data as well as the latter‟s contribution to inflation is
provided in the Annex Tables to this report.
How important is the food component in the CPI?
Food price increases are an important component of overall inflation, which is frequently a major
guide in the setting of wage-demands and other income assistance benefits. Inflationary pressures,
particularly those associated with food price increases, have also generated vociferous social tensions at
times and, thus, such indicators are closely watched by governments.
The weight of the food component in the CPI varies significantly across countries reflecting the
structure of household expenditures. In high income countries, the share of food in the CPI ranges from 10-
20% but in the low and middle income countries it is substantially higher, generally in the 40-60% range.
For example, the food component accounted for 47% of the CPI in Sri Lanka, 58% in Malawi, 47% in
India and 49% in Peru in 2008, but was only about 10% of the CPI in Germany, United Kingdom and the
United States and about 20% in Japan, Mexico, and Spain. While information on consumer expenditures
according to socio-economic groupings would provide greater understanding of the impacts of food price
increases in a given country, very few countries undertake their surveys in this fashion.
Rising food prices has meant larger shares of income being devoted to food expenditures, thus leaving
less money available for non-food items, such as housing, transportation, health and educational services
particularly in developing countries. Because of its importance and high visibility, food price inflation
continues to be a closely watched economic indicator. Governments have often responded to rising food
prices with a wide range of policies designed either to support incomes and/or to reduce food costs and this
in both OECD and non-OECD countries.
How fast have consumer food prices been rising?
Food price inflation measured over the past 12 months, ending February 2009, has declined from that
of a year ago in many countries. But for a number of countries it has continued to increase for instance in
Japan, Mexico, Korea, and the United Kingdom as well as for non-OECD countries such as Ghana, Kenya,
India, Pakistan, and South Africa. Food prices continued to increase in most countries through the summer
of 2008 along with commodity prices - agriculture and oil - as these worked their way through to food
prices with at different speeds. The speed and degree of transmission of commodity prices from
2 Data for OECD countries is taken from the OECD Main Economic Indicators, April, 2009 and for non-OECD countries from the
national statistical services.
3 The share of agricultural inputs to the cost of the food basket varies across countries, for instance in the United States the account for
only 20-25% of the total, with the remainder attributed to labour, energy and distribution costs. In low income countries the value of
the share of agricultural inputs in final food prices is much higher as other costs are generally lower and diets contain a larger share of
foods which are highly processed or subject to high distribution costs. Changes in agricultural food commodity prices and in food prices are generally highly correlated but the pass through effects depend on structure of consumption as well as a number of policy
variables which may affect international price transmission, where agricultural food commodities are a significant part of the
consumer‟s food basket. To better understand the linkages between these international prices and domestic food prices rigorous analysis of food systems and statistical properties are needed

28
international to domestic markets as well as their contribution to the composition of the food prices,
determines their impact on the food price index.4 Where transmission is rapid, complete and where
agricultural commodity content of food is large, food prices should adjust rapidly to changing commodity
prices. But if transmission is slow, then effects of previous commodity price increases also appear with a
lag. This may account for overall price increases occurring after commodity prices have come down.
A closer look at food price inflation over the recent 6 and 3-month intervals indicates that there has
been a marked slowing in food price increases in recent months and with many countries experiencing
negative rates of change. (Figures 1.8 and 1.9). For instance, the percentage change in the food price index
was negative in countries, such as Estonia, China, Chile, Bangladesh, Senegal, Pakistan, the US, Japan and
Spain. In China, for example, there has been a spectacular reversal in food price inflation: from over 20%
in 2007 to -1.9% in 2008 with a further acceleration in the decline over the past 6 months, at -4.75%, but
this decrease has now slowed. In the other countries, that is, Brazil, Russia and Indonesia, there has also
been a slowing of food price increases but they have not been as significant as in the case of China.
Annualizing the recent 3-month rate of increase would imply a halving of food price inflation from last
year in Brazil and about 25% reduction for Russia and Indonesia.5 But there is substantial variation among
countries and generalizations are not possible.
What has been the effect of food prices on overall inflation?
In high income countries, the contribution of food price increases to overall inflation has been quite
limited over the past year ending February 2009, generally below 1% (Figures 1.10 and 1.11). This is not
only because food prices increases were relatively moderate but because the share of food in the total
consumer basket is small. In the US, Italy and Japan food price increases contribute about half a percentage
point to inflation and less than .3 percentage points in countries such as Switzerland, France and Germany.
As would be expected, the impact of food price inflation on overall inflation in low income countries is
much larger. For example, food price increases contributed over 8 percentage points to an overall inflation
rate of 21% in Pakistan and 2.5 percentage points to an overall rate of 5.9% in Brazil. These are significant
contributions even if absolute numbers may not be very large.
This brief snapshot of food price changes in selected countries indicates a slowing of food price
inflation and in many cases there is deflation in food prices. This should not be misconstrued to imply that
food prices have fallen significantly yet in absolute terms, since the food price indices indicate that prices
remain high relative to pre 2007 levels, at least for the set of countries examined here.
4 Both food commodities and oil are important in components in food costs. In OECD countries oil accounts for about 20% of final
food prices, about the same as commodities on average.
5 For comparison purposes it would be necessary to annualise the 3-month change in prices. If deseasonalised, these rates can be simply
multiplied by 4.

29
Figure 1.8. Food price inflation for selected non-OECD countries
Source: OECD Secretariat.
Figure 1.9. Food price inflation for selected OECD countries
Source: Main Economic Indicators.

30
Figure 1.10. Contribution of food to inflation for selected non-OECD countries
(% change over previous year February to February)
Source: OECD Secretariat.
Figure 1.11. Contribution of food to inflation for selected OECD countries
(% change over previous year February to February)
Source: OECD Secretariat.
The Outlook and food security
This outlook paints a fairly positive picture for agricultural markets: an agri-food sector relatively
resilient to the current economic crisis, real commodity prices to remain above historical averages;
production, consumption and trade to increase in developing countries. But behind this scenario lies a more
disturbing story where world food insecurity has increased in the past couple of years, with extreme
poverty and rising hunger. High food costs, combined with the global credit crunch, falling international

31
trade and investment flows, lower remittances and budgetary pressures on development aid, are reversing
the progress made in combating global poverty, with an estimated one billion people now below the hunger
threshold. Chapter 3 examines the longer term supply side of the food security issue.

32
CHAPTER 2
HOW RESILIENT IS AGRICULTURE TO THE GLOBAL ECONOMIC CRISIS?
The deepening of the financial and economic crisis
Business is not as usual
This year‟s Agricultural Outlook was produced under particularly unusual circumstances. What
makes this year exceptional is the fact that the global macroeconomic environment – which forms the
bedrock of our agricultural market projections – continues to deteriorate.
Since the beginning of 2009 there has been a constant flow of increasingly pessimistic
macroeconomic news from virtually all sources. The OECD in its Interim Economic Report for March
2009 concluded that the world economy is in the midst of its deepest and most synchronised recession
since the post war period (OECD, 2009a). The result is lower output, reduced trade and capital flows and
higher unemployment world wide as well as a steep decline in consumer and business confidence. This
global downturn in economic activity is accompanied by a precipitous decline in international trade. The
collapse in international trade may explain why the crisis has spread so rapidly to so many economies.
Both the credit crisis and the drop in demand, amplified by the prevalence of global supply chains, are seen
as major causes of the collapse in international trade flows.
Moreover, it is not yet clear that the economic crisis and its consequences have bottomed out. Bank
lending remains tight, however there are signs that equity markets are beginning to pick up. Overall, the
prognosis about the depth and duration of the global contraction is highly uncertain and makes difficult any
projections of key macroeconomic indicators such as income growth, employment and trade over the
medium-term. Both the OECD and the World Bank have revised down their short-term expectations for
growth for 2009 and 2010, though both expect a rebound in 2010. However economic growth will likely
remain below potential and its recovery path uncertain.
What does it all mean for the Agricultural Outlook?
Because food is a basic necessity, the agri-food sector is expected to be more resilient than other
sectors to the present crisis. But this does not mean that it is immune to the economic contraction and
financial market turmoil. And the risks faced by agriculture are likely to be accentuated with any
deepening and prolongation of the period of economic downturn.
The decline in real income should dampen demand for agricultural commodities, and, all else equal,
decrease agricultural product prices. These impacts are likely to be less in high income countries where the
elasticity of demand with respect to changes in incomes are low for most agricultural products and where
food markets are close to saturation, than in low-income developing countries. The impacts can also differ
greatly among the various agricultural sub-sectors and commodities. For instance changes in the
composition of demand can be expected as some products such as meat and dairy which have higher
elasticity or response of demand to income changes.

33
Falling agricultural commodity prices in the economic downturn may help compensate consumers for
some of the income loss, while on the supply side, lower oil prices may help farmers, through reduced
costs of oil related inputs, to offset the cost-price squeeze. At the same time, both oil prices and income
changes can have implications for biofuel use and hence for the derived demand for feedstock
commodities. The net effect on the agricultural sector is thus complex and will depend on the product and
country being examined. The various outcomes for the main commodity markets of lower GDP and
income growth are discussed below.
Impact assessment of alternative scenarios
The baseline projections in this report reflect the medium-term economic projections from the OECD
and World Bank most recently available at the time of writing, which date to end-2008. These
macroeconomic assessments foresaw the deterioration in the global economy particularly in 2009, with a
turnaround projected for 2010 and included lower economic growth rates for most countries than in last
year‟s report. Nevertheless, both Organisations have since significantly revised downwards their
assessments for world economic prospects and GDP growth in the near term, without, however, providing
estimates for the period after 2010 and therefore limiting their direct incorporation in the present base
projections.
The medium-term macroeconomic projections were also subject to much lower assumptions on crude
oil prices relative to last year‟s Outlook. In the meantime, however, oil prices have continued their
descending path, and in December 2008 had reached levels significantly below USD 40 per barrel. Indeed,
in January 2009, the US Energy Information Administration of the Department of Energy published short-
term projections for crude oil prices indicating lower levels for both 2009 and 2010, compared to those
assumed in the December 2008 OECD Economic Outlook. Thus, the initial OECD medium term
assumptions were supplemented with short term updates for 2009 and 2010 from the US Energy
Information Administration which reflects the lower crude oil spot market prices and shows some
strengthening of crude oil prices concomitant with the projected economic recovery in 2010. From 2011
onwards, the medium-term crude oil price assumptions remain those used by OECD at the end of 2008 in
the context of its economic outlook, with prices moderately increasing to about USD 70 per barrel.
Two elements most directly linked to the economic contraction deserve a more detailed quantitative
assessment. As the recession is defined as a decline in real income (or GDP) over a sustained period of
time (usually 6 months), the initial baseline projections, as outlined in more detail in the second part of this
report, were made subject to a sensitivity analysis. This was based on alternative GDP growth estimates
based on the latest short-term updates provided by the OECD and World Bank, complemented by
relatively simple and transparent assumptions on longer-term growth (recovery) developments. The strong
decline in crude oil (and energy) prices as observed particularly during the second half of 2008 constitutes
another highly relevant element of the analysis for agriculture, and something that is, at least partly,
directly linked to the crisis: as growth in economies declines and indeed economic output shrinks in a
number of countries, energy consumption in general, and crude oil use in particular, decline, putting
downward pressure on oil prices. In order to isolate the possible impact of these two elements, the impacts
of alternative GDP growth and crude oil price assumptions are assessed individually. These additional
scenarios are described in some detail in this section, followed by an analysis of their impacts on the main
agricultural product markets in the following section. The sensitivity of agricultural product market
projections to higher oil prices than in the current baseline are discussed in Box 2.1.
Some of the wider ramifications for agriculture of the financial crisis cannot be quantified and are
addressed more qualitatively in the final part of this chapter. Changes in exchange rate settings are another
macroeconomic variable that can be expected to have important implications for agricultural markets,
although direct relationships with the evolving crisis cannot always be drawn. These implications were

34
discussed in last year‟s edition of the OECD-FAO Agricultural Outlook, 2008-2017 and are not repeated
here.
Lower income growth and different recovery scenarios
Two alternative scenarios were defined to partially analyse the potential implications of the further
deepening of the economic contraction that has taken place in 2009 and which assume a different speed of
recovery from recession over the coming decade. Both these scenarios build upon the most recent short
term macroeconomic updates published by OECD and the World Bank, and both adjust downwards growth
rates in GDP of all countries for 2009 and 2010. Data from the OECD‟s latest assessment cover the G-7
countries as well as the four major emerging economies: Brazil, Russia, India and China (the BRICs).
Adjustments were also made for all other countries based on the World Bank information (Annex A,
Table 1). Figures 4.6 and 4.7 in Chapter 4 show the magnitude of these adjustments for major economies
and regions.
These data do not provide any information about developments beyond 2010. In order to keep the
analysis simple and as transparent as possible, two recovery scenarios are proposed.
The first scenario lower GDP - faster recovery assumes that, following the depressed levels of GDP
for 2009 and 2010, incomes enter a rapidly increasing path and quickly approach the levels of the baseline
projections. While those levels are assumed to be fully reached only in 2018 - the final year of the
projections in this report - incomes are assumed to approach the base levels at a faster speed in the
beginning of the 2011-18 period, resulting in only small deviations from the base income levels after about
2015.
The second scenario lower GDP - slow recovery assumes the same level of lower GDP for 2009 and
2010 as in the first scenario. In this scenario income growth rates in each country in the recovery phase
after 2010 are assumed to be the same as in the baseline projections, but starting from the lower 2010
levels. As a consequence, income levels never reach those projected in the baseline. All countries are thus
assumed to face persistently lower income levels throughout the rest of the projection period, as compared
to the baseline projections. The alternative recovery assumptions are illustrated in Figure 2.1 below, with
the implied changes in aggregate annual growth rates for the OECD and non-OECD areas shown in the
right panel.

35
Figure 2.1. Stylized depiction of economic downturn and two alternative recovery assumptions relative to baseline (left panel), and aggregate annual income growth assumptions for OECD and non-OECD regions
across scenarios (right panel)
It is important to emphasise that the scenarios are not indicative of the full impact of the current
global financial turmoil and economic contraction on agricultural markets as they focus on only one
indicator, income growth. The results thus only partially illustrate the impact. Furthermore, it should be
clear from the design of these two scenarios that neither of them should be read as a worst- or best-case
scenario. Indeed, at present it is impossible to precisely assess the path of recovery or even when the world
will turn the corner, and thus the final depth and duration of the economic downturn. These scenarios are
not, therefore, indications of our expectations of future income growth. While the scenarios are based on
lower growth assessments, it should be recalled that the full baseline projections already implied
significantly depressed levels of income, when compared to last year‟s Agricultural Outlook.
It should also be understood that a number of the links between the depressed income levels and
agricultural market adjustments are not represented in the Aglink-Cosimo model. For example, the model
does not cover the possible (yet unknown) responses in total fuel consumption. To the degree biofuel use
and hence biofuel production depends on total fuel use (i.e. particularly in countries where biofuel
mandates are expressed in fuel shares rather than in absolute quantities), the simulation results therefore
likely underestimate the impact on agricultural markets from this source. Similarly, these scenarios do not
account for the possible impact of lower incomes on crude oil prices and any implications these may have
on agricultural markets.6 The scenarios, therefore, should be interpreted as a partial sensitivity analysis for
the baseline projections in this report, not as an analysis of the crisis.
6 It is interesting to note that while the deteriorated economic prospects should result in lower prices for
crude oil prices due to declining energy demand, quotations have actually increased during the first three
months of 2009. It is thus obvious that economic growth and prospects, although important, are far from
being the only determinant in the price equation for crude oil. Assessing the impact of lower incomes on
energy markets would go far beyond the scope of this report.
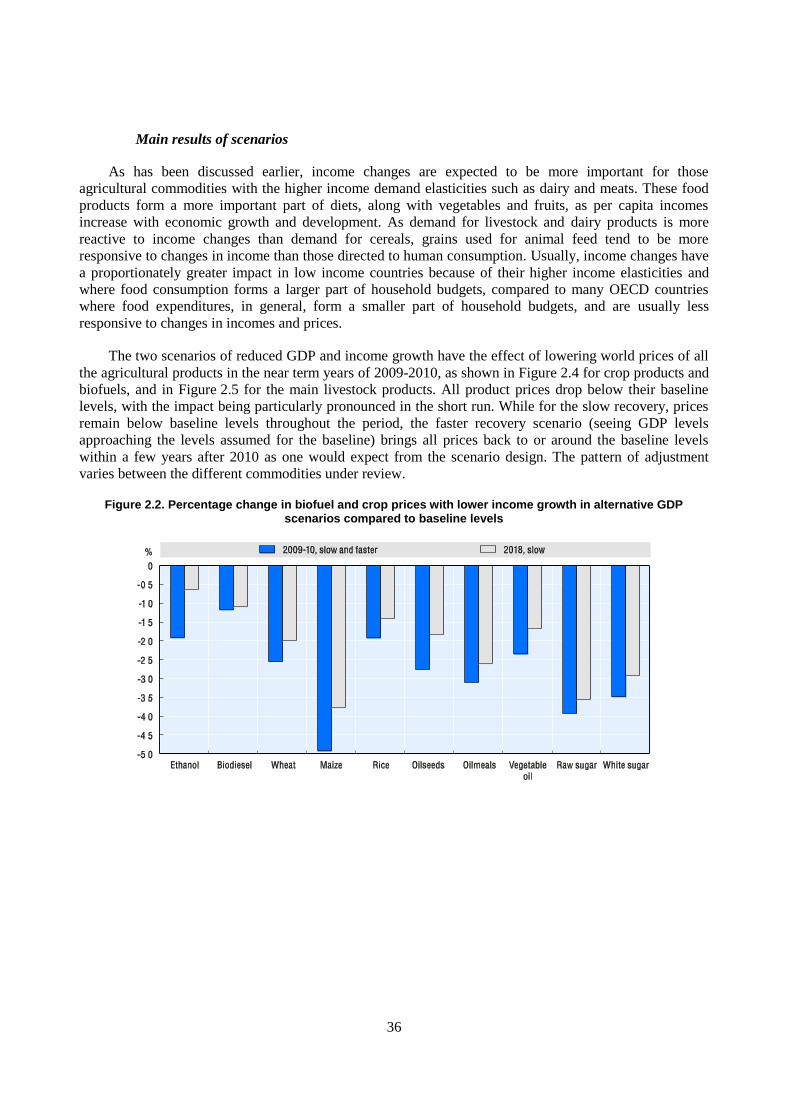
36
Main results of scenarios
As has been discussed earlier, income changes are expected to be more important for those
agricultural commodities with the higher income demand elasticities such as dairy and meats. These food
products form a more important part of diets, along with vegetables and fruits, as per capita incomes
increase with economic growth and development. As demand for livestock and dairy products is more
reactive to income changes than demand for cereals, grains used for animal feed tend to be more
responsive to changes in income than those directed to human consumption. Usually, income changes have
a proportionately greater impact in low income countries because of their higher income elasticities and
where food consumption forms a larger part of household budgets, compared to many OECD countries
where food expenditures, in general, form a smaller part of household budgets, and are usually less
responsive to changes in incomes and prices.
The two scenarios of reduced GDP and income growth have the effect of lowering world prices of all
the agricultural products in the near term years of 2009-2010, as shown in Figure 2.4 for crop products and
biofuels, and in Figure 2.5 for the main livestock products. All product prices drop below their baseline
levels, with the impact being particularly pronounced in the short run. While for the slow recovery, prices
remain below baseline levels throughout the period, the faster recovery scenario (seeing GDP levels
approaching the levels assumed for the baseline) brings all prices back to or around the baseline levels
within a few years after 2010 as one would expect from the scenario design. The pattern of adjustment
varies between the different commodities under review.
Figure 2.2. Percentage change in biofuel and crop prices with lower income growth in alternative GDP scenarios compared to baseline levels

37
Figure 2.3. Percentage change in meat and dairy prices with lower income growth in alternative GDP scenarios compared to baseline levels
Note: The two scenarios “lower GDP - slow recovery” and “lower GDP - faster recovery” are the same for the 2009-10 period - results are therefore shown only once in the first set of bars (2009-10, slow and faster). Given that markets in the “lower GDP - faster recovery” scenario return to, or approach levels very close to, the base projections, longer-term changes for 2018 are shown only for the “lower GDP - slow recovery” scenario (“2018, slow”).
Little impact on biofuel markets
Given that in many countries biofuel use is largely driven by policy-set mandates, and due to the
implicit assumption of transport fuel use being unresponsive to income changes, biofuel market projections
are affected only very little by the lower GDP assumptions. In particular the US Renewable Fuel Standard
sets lower bounds at the absolute levels of biofuels to be used in each year, and de facto puts an upper limit
to maize-based ethanol. Given that the mandates - like those in other countries such as the EU - are found
to be binding for most of the outlook period, biofuel use and production shows little impact. Lower
feedstock prices, however, tend to reduce production cost, resulting in slightly higher biofuel output in
2009 and 2010 notably from sugar cane (Brazil), wheat (Canada) and particularly vegetable oil (EU), and
causing slightly lower biofuel prices. Increasingly binding mandates result in quantities to remain largely
unaffected in later years, but prices particularly for biodiesel remain below their baseline levels unless
incomes return to their higher levels.
Crops affected moderately, but more than biofuels
As outlined above, food consumption of crops is much less income sensitive than that of livestock
products, and so the consumption of food grains - wheat and particularly rice - responds very little. This is
true for non-OECD regions, but even more so within the OECD where rice use indeed slightly increases
with lower incomes. Income elasticities for vegetable oil product are higher than those for cereals in both
developed and developing countries, and so vegetable oil use for food responds more significantly - while
the use for the production of biofuels slightly benefits from lower vegetable oil prices. Feed grains are
affected by the stronger impact on meat and dairy markets, and in fact feed use of both wheat and coarse
grains shows a stronger response to lower incomes than the food use of these commodities. Particularly in
many developing countries, sugar clearly represents the most income sensitive crop product, competing
with HFCS in food and beverage preparations, and in consequence sugar consumption both in the OECD
and elsewhere declines by more than 1% relative to the baseline in the first two years, and by even more
than that in later years if GDPs are persistently lower than in the baseline (Figure 2.4).

38
These impacts on crop consumption, while all remaining relatively modest, tend to become more
pronounced over time if GDPs persist to remain below baseline levels (slow recovery assumption), as
production responds with lower output to the reduced incentives and price effects hence become smaller
over time. If, in contrast, GDPs are assumed to return to their baseline levels (faster recovery scenario),
both consumption and price levels return to the levels projected in the baseline of this outlook.
It is worth noting that the impact particularly on wheat production is also higher in OECD countries.
This result is primarily due to the fact that yield responses are higher in developed as opposed to
developing countries since variable inputs are applied, and can be adjusted to affect yields. It is also a fact
that price responsiveness in these countries is higher. Wheat production in OECD shows twice the supply
response to the lower GDP, slower recovery scenario than does the non-OECD area. This higher
responsiveness of OECD countries was also demonstrated as its production responded most to the high
grain prices of 2008.
Figure 2.4. Changes in consumption of crop products in OECD and Non-OECD countries due to lower GDP, relative to baseline projections
Note: “2009-10” and “2018, slow” refer to the average changes in 2009-10 (both “lower GDP - slow recovery” and “lower GDP - faster recovery” scenarios) and in 2018 (“lower GDP - slow recovery” scenario. See note to Figures 2.2 and 2.3 for more details.
Livestock products are more sensitive to lower incomes
Compared to cereal and oilseed markets, those for livestock products are much more sensitive to
changes in incomes, particularly in the short run, consistent with generally higher income elasticities for
meat and dairy products and longer production processes for many of the livestock products. Within
OECD countries, this is particularly true for beef, pork and cheese, whereas consumption of poultry
meat - a relatively cheap type of meat - in that region shows only little reduction. Similarly, the
consumption of butter and milk powders changes only very little in the OECD, caused again by low
income responsiveness but also by significantly lower prices dampening the income response. In fact, the
much lower butter prices tend to even slightly increase OECD butter consumption.
Consumption particularly of dairy products is affected much more significantly outside the OECD
area. Most notably, the strong impact of lower GDPs over the entire projection period on international
cheese and particularly butter markets under the slow recovery scenario stems to a large extent from a
collapse of imports by the Russian Federation. Russia is the largest butter and cheese importer and the key
player on international markets for these products, but GDP prospects have been revised strongly
downwards for this country. Accordingly, consumption in Russia is heavily impacted and imports contract
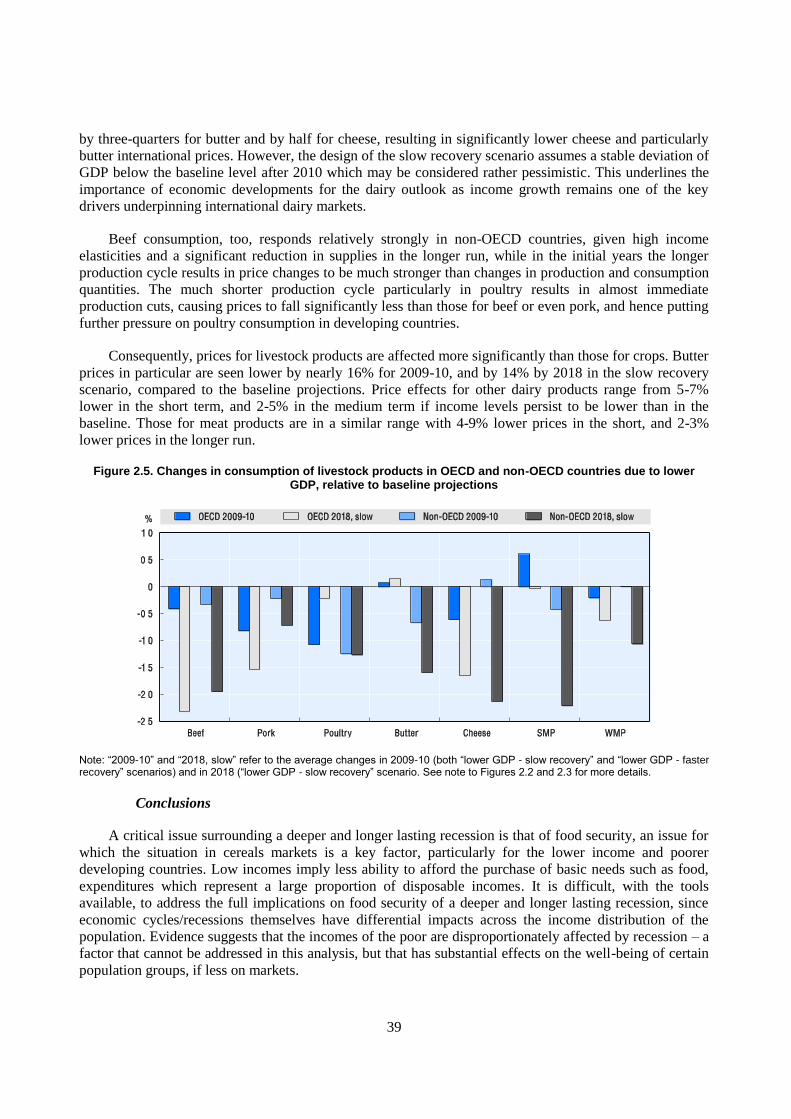
39
by three-quarters for butter and by half for cheese, resulting in significantly lower cheese and particularly
butter international prices. However, the design of the slow recovery scenario assumes a stable deviation of
GDP below the baseline level after 2010 which may be considered rather pessimistic. This underlines the
importance of economic developments for the dairy outlook as income growth remains one of the key
drivers underpinning international dairy markets.
Beef consumption, too, responds relatively strongly in non-OECD countries, given high income
elasticities and a significant reduction in supplies in the longer run, while in the initial years the longer
production cycle results in price changes to be much stronger than changes in production and consumption
quantities. The much shorter production cycle particularly in poultry results in almost immediate
production cuts, causing prices to fall significantly less than those for beef or even pork, and hence putting
further pressure on poultry consumption in developing countries.
Consequently, prices for livestock products are affected more significantly than those for crops. Butter
prices in particular are seen lower by nearly 16% for 2009-10, and by 14% by 2018 in the slow recovery
scenario, compared to the baseline projections. Price effects for other dairy products range from 5-7%
lower in the short term, and 2-5% in the medium term if income levels persist to be lower than in the
baseline. Those for meat products are in a similar range with 4-9% lower prices in the short, and 2-3%
lower prices in the longer run.
Figure 2.5. Changes in consumption of livestock products in OECD and non-OECD countries due to lower GDP, relative to baseline projections
Note: “2009-10” and “2018, slow” refer to the average changes in 2009-10 (both “lower GDP - slow recovery” and “lower GDP - faster recovery” scenarios) and in 2018 (“lower GDP - slow recovery” scenario. See note to Figures 2.2 and 2.3 for more details.
Conclusions
A critical issue surrounding a deeper and longer lasting recession is that of food security, an issue for
which the situation in cereals markets is a key factor, particularly for the lower income and poorer
developing countries. Low incomes imply less ability to afford the purchase of basic needs such as food,
expenditures which represent a large proportion of disposable incomes. It is difficult, with the tools
available, to address the full implications on food security of a deeper and longer lasting recession, since
economic cycles/recessions themselves have differential impacts across the income distribution of the
population. Evidence suggests that the incomes of the poor are disproportionately affected by recession – a
factor that cannot be addressed in this analysis, but that has substantial effects on the well-being of certain
population groups, if less on markets.

40
Box 2.1. The sensitivity of the projections to changes in oil prices
The strong decline in crude oil (and energy) prices as observed particularly during the second half of 2008 constitutes another highly relevant element of the analysis for agriculture, and something that is, at least partly, directly linked to the crisis: as growth in economies declines and indeed economic output shrinks in a number of countries, energy consumption in general, and crude oil use in particular, decline, putting downward pressure on oil prices. A downward correction seemed likely after prices peaked at more than USD 147 per barrel in July 2008, but thus has now been overtaken by events of the unfolding economic crisis. In terms of analysing the sensitivity of the projections to changes in key assumptions, the oil price affects both agricultural production and consumption decisions. It is therefore pertinent to examine the sensitivity of the commodity projections to alternative oil price expectations. This analysis is described and discussed in this box.
In order to allow for a quantitative assessment, a scenario has been designed for comparison with the baseline projections based on changing the oil price assumptions to the higher levels used in last years’ report i.e. the 2008 edition of the OECD-FAO Agricultural Outlook. At that time, the oil price was assumed to grow from USD 90 per barrel in 2008 to USD 104 in 2018, as represented in Figure 2.6.
Figure 2.6. Baseline and alternative assumptions for crude oil prices
As in the case of the income scenarios, a number of caveats are appropriate. First, as the model implicitly assumes transport fuel consumption to be unresponsive to price changes, in most cases, the simulated impact of changes in the oil prices is likely to underestimate the actual impact on biofuel consumption channelled through total fuel use - except where the latter is fixed by quantitative mandates. Second, higher oil prices themselves have an impact on economic growth, and, as in the inverse case of the income scenario, this impact cannot be captured with the existing tool. Finally, as for the use of many other models, the Aglink-Cosimo results of a major shock such as the doubling of oil prices in the early years of the projection, or even an increase by 50% towards the end of the simulation period, obviously need to be read with care. As a consequence, the results of this partial analysis should be interpreted as indicative.
As is evident from the Figure 2.7, the impacts found in this analysis are much larger than those for lower incomes - this is due to both the relative size of the shock and the importance of the different driving factors on agricultural markets. Another result that becomes clear from Figure 2.7 when compared with Figures 2.2 and 2.3 is that crop prices show a significantly higher sensitivity to oil price changes compared to livestock products, while the opposite was true for GDP shocks. Given the high energy share in total production costs particularly for crops through fertiliser, chemicals and fuel prices, energy prices have long influenced the supply on agricultural markets. With the emerging biofuel sector, an additional link is strengthening through the demand for biofuel feedstock commodities, particularly for cereals, vegetable oils and sugar, but indirectly also for other crops competing for the same land. Due to the increasingly mandate-driven dynamics in the biofuel sectors of many countries, however, this element today is less pronounced than would be under more market-driven conditions.

41
Figure 2.7. Impact of higher oil prices on commodity prices compared to baseline (percentage change)
Many biofuel mandates are less binding in the early years than towards the end of this outlook’s baseline. In consequence, while higher oil prices would result in global ethanol and biodiesel use to be about 10% and 20% higher than in the baseline, respectively, this effect becomes very small in 2018. The consumption impact for ethanol - less bound by mandates than biodiesel on a global level - is further dampened by significantly higher ethanol prices. Confirming earlier analysis, the impact on ethanol prices is roughly half the change in crude oil prices
Despite the higher biofuel use and production particularly in the short-term, the major link driving up crop prices remains through production costs. With much higher crude oil prices, all crop prices would follow substantially different paths than in the current baseline over the projection period to 2018. The growing importance of binding mandates, together with the fact that the changes in oil prices are larger at the beginning than towards the end of the simulation period, results in many of the price effects to be smaller in the longer term (+10 to +18% for cereals and oilseeds) than in the short-term (+13% to +28%). The reverse is the case for sugar where production adjustments with perennial crops take longer to work through and amount to 10-11% by 2018 (Figure 2.7). Generally speaking, today higher oil prices would mainly result in lower crop production because of their production cost effect, and then reallocate from food to fuel production. Both these effects result in lower food consumption of basic agricultural commodities.
In general, the impact of a higher crude oil price on the livestock sector is much smaller than for crops. The oil price affects livestock markets through both higher cost of energy use especially for energy and capital intensive production systems as found, for example, in poultry production, and through the impact on feed ingredient costs. On the other hand, the higher cost of feedstuffs is to a certain extent mitigated by increased availability of distilled dry grains (DDGs) a by-product of bioethanol production.
The increased cost of meat production results in reduced global meat production. Generally, the decrease of production is rather small, not exceeding 3.5% in any of the years of the projection period and for each of the different meat types. The largest impact is on the energy and feed intensive poultry sector (2-3% reduction in output compared to the base), and small for the less energy and feed intensive ruminant sector (0-1.5% reduction compared to the base). Global milk production declines more in the near term years due to lower milk yields, whereas the reductions in following years are increasingly attributable to lower cow inventories.
The decline in production translates into increased world market prices for meat and dairy. The changes in world prices however are quite modest. They are, on average over the outlook period between 4% and 7% higher in any of the years than in the base projections. In the case of butter the price are higher in the range of 16% (in early years) to 9% (at the end of the outlook) underpinned by higher vegetable oil prices which are themselves propelled by higher crude oil prices and biodiesel production.

42
Effects of the financial crisis on the agri-food sector: views from industry players7
The previous section focussed on the sensitivity of the baseline projections to lower income growth in
two stylised scenarios: real income declines and higher oil prices. This section examines in more detail
some of the broader issues arising from the financial crisis, such as credit constraints in domestic and
international trade as well as the consequences of income declines on demand and prices. Furthermore it
takes a wider approach in terms of activities covered by including both the upstream and downstream
portions of the agri-food sector.
Over the past decades, the agri-food sector has become not only more globalized through international
trade as it sources and sells across the globe but also more integrated into the modern financial system.
Consequently it is more subject to the exogenous fluctuations originating in the macro-economy. Impacts
on the specific agri-food sectors have now come to depend on the strength and depth of its linkages to the
financial system and the global economy
Surveying industry views on the impacts of the financial crisis
At present there is very limited data available to assess the impacts of financial crisis on the agro food
sector. To fill - even if only partially - this information gap, the OECD Secretariat carried out structured
interviews with over 45 firms/professional associations for the different activities along the agri-food chain
as well as with banks dealing with trade finance and agriculture. This information was supplemented with
information from publicly available annual reports, newsletters from firms and government websites.
Attempts were made to interview players from as many different geographic areas, sub-sectors and
activities as possible.8 The questions asked of participants focussed on the effects of the economic
downturn, indirect or direct credit constraints as well as specific questions on trade and trade credit impacts
of the financial crisis. Interviews with banks provided insights into credit allocation behaviour. Results
should be considered as simply indicative of present tendencies and not necessarily applicable to all agri-
food sectors in all OECD or non-OECD countries.
Impacts on the agricultural input industry
Demand for agro-chemicals is expected to remain weak at least through the first half 2009 and then
pick up through 2010, according to the multinational input supplier firms interviewed. This could indicate
a loss of confidence by farmers in future earnings as these types of inputs tend to move with expected
returns. The primary cause for the decline in sales is the global downturn and not farm credit availability.
The IFA (International Fertilizer Association) expected demand to remain weak through early 2009. For
the current crop year demand is expected to be down by 2.2%.9
Access to credit was also not seen as an obstacle to equipment purchases in North America according
to the AEM's (Association of Equipment Manufacturers) survey, of 2009. Sales have however declined by
24.9% in the US and 9.7% in Canada, in a year-on-year basis as of February 2009.10
This is a significant
7 In this survey agri-food refers to the entire agri-food chain from inputs to retail sales.
8 The non-OECD countries included Argentina, Brazil, Chile, South Africa, Ghana and Kenya.
9 According to the IFA declines in crop prices have their greatest impact on potash and phosphates fertiliser whose
demand is expected to fall by 4.7% and 8.5% respectively, while nitrogen demand should rise by half a percent.
10 AEM, Association of equipment manufacturers includes over 800 manufacturers of agricultural and construction
equipment in North America and includes foreign firm branches. Data from Ag Flash Reports- retail sales, February
2009, % changes are calculated on a yearly basis. For detailed survey results see: www.aem.com

43
change from the double-digit sales increases over the past two years. In those years, sales were fuelled by
increased commodity prices and rising net farm incomes, which have now reversed.
Taking a more global perspective on sales, specific firms have seen sales fall in certain non-OECD
markets due in part to the tightening in the access to credit. Importing firms are curtailing, delaying and
cancelling orders to deal with credit limitations, whenever this is feasible. This has been the case in
Argentina and Brazil where orders have been cancelled due to reported credit constraints. For instance, a
major agricultural machinery manufacturer, AGCO, expects sales in Brazil to be 20-30% lower this year,
due to tight credit and a weaker local currency making imports more expensive.11
It is difficult to
disentangle which sales changes are due to changed economic conditions or credit constraints, which were
important for countries like Brazil in late 2008.
Impacts on farmers
Downturn in farmer confidence
Recent rural confidence surveys conducted by the Rabobank, for the United States, Australia and New
Zealand indicate that farmer confidence has deteriorated over the past year and even in the recent quarter
reflecting the continued deterioration of the global economy, and commodity prospects. The future
negative impact of the global financial crisis rather than a reflection of own experience appears to
dominate sentiment. About 58% of Australian and 29% of New Zealand respondents judged that the
worsening of overseas markets and economies would have serious impacts on future sales and incomes via
both lower prices and their volatility as demand dampens. In both countries, farmers are streamlining
operations and finding cost cutting solutions to deal with the new conditions. Credit availability was not
considered to be a significant cause of concern in either Australia or New Zealand.
In the US, survey results suggest that over two thirds of farmers, regardless of region, revenue group
or farm size, expect a decline in incomes for 2009. This is in part due to global economic conditions
placing downward pressure on commodity prices. In response, farmers are adjusting behaviours in terms of
investments and about half have now implemented, or plan to invest in, risk management or marketing
strategies. Even in terms of machinery purchases, there appears to be an increase in purchases of used
machinery, though this market has also softened of late.
Farm credit situation
According to farmer/co-operative associations, in Western Europe in particular, there appears to be
little or no impact of the financial crisis on credit availability to the sector, given its generally low debt
situation. However conditions of access to credit are becoming tighter as in other sectors. This is being
evidenced through increased demands for additional collateral, more limited repayment periods and/or
increased financing costs. Most credit to agriculture is provided to meet operating expenses due to the lag
between planting, harvest and final sales.
In the US, credit availability is on trend with other years. However a most significant development in
the first quarter of 2009 has been the increased demand for short-term finance for operating expenses,
which corresponds to periods of declining prices and incomes as cash-flow falls (Board of the Governors
Federal Reserve, 2009). In addition there have been some signs of increasing delinquency rates and charge-
offs on agricultural loans implying an erosion of loan quality (Henderson, 2009).12
The recession now is
11
Brazil Ag Machinery Sales Slow in January, Kieran Gartaln, DTN, 11 February, 2009.
12 Delinquency rates on agricultural loans climbed steadily in 2008, rising by 30% during the year.
www.federalreserve.gov/releases/charge-off.
44
beginning to generate a number of concerns in the banking sector with respect to loan availability, costs of
funds and creditworthiness of borrowers and is leading to increased collateral requirements and reduced
loan maturities (Henderson, 2009). This is all the more so the case as farmland values are the main source
of collateral and these started to decline in the fourth quarter of 2008. If the recession lingers and
agricultural prices weaken further, asset values such as land may begin to decline, and the credit markets
for agriculture tighten further.
For many EU countries no significant declines in credit availability were signalled as of the fourth
quarter of 2008. According to farm co-operative associations such as Copa-Cogeca in Europe as well as
those of individual countries, credit conditions for the agriculture sector are relatively robust, compared to
other sectors of the economy. Producers in most major agricultural co-operatives have no difficulty in
obtaining bank credit at least for domestic activities. In this case, legal contracts using output as collateral
back up the funding arrangements. This is because it is easy, relatively speaking, to recoup funding or the
product when the contracts are between firms in the same country. Collateral requirements have been
increasing and standards for allocating credit have however tightened substantially since the beginning of
the year. This evaluation needs to be nuanced by country and by sector situations as there may be
substantial variations among them. Due to the tight credit situation, many agri-co-operatives are putting a
hold on investments in additional processing and storage facilities. Though no figures were given, the
changes in decisions were noted to be substantial. Banks were judged often to be overly cautious some of
the respondents suggested. This confirms what banks themselves say about their credit allocation
decisions - avoid or minimise risk.
Agricultural Policies in OECD Countries: Monitoring and Evaluation 2009 suggests that regardless
of the evolution of the volume of credit to the agri-food sector, lenders are expected to require higher levels
of collateral for a given loan. However for the moment the view held is „there are good reasons to argue
that the agricultural sector in most OECD countries is in a good position to confront this crisis, both
relative to the past and relative to other sectors (OECD 2009b).
Non-OECD perspectives
According to producer associations, traders and banks in Argentina, credit availability for cereals,
oilseeds and wine is not an issue as in general the industries self-finance their operations. However, due to
low prices and conflicts over government policies, traders as well as certain downstream agri-food firms
are experiencing difficulties in acquiring necessary inputs since farmers are reluctant to sell their output
and only as needed to meet expenses. Credit constraints are, however, severe in the dairy sector and this is
having serious financial consequences on firms. It is unclear whether this is a direct consequence of the
global financial crisis.
Tight credit for farmers last fall in Brazil forced the government to step in to ensure that funds are
available for the planting season, even though only about a third of agricultural credit originates from
banks. The government increased the amount of demand deposits that banks must lend to the agricultural
sector from 25-30%, temporarily.
In Chile, the fruit producer associations do not have credit availability problems at present. However,
there is much uncertainty and concern for future demand given the economic recession in their principal
trading partners, the EU and the US. A similar situation was reported by some producer groups in South
Africa.
In most developing countries the use of bank loans in agriculture is not common. When loans are
given they are for very limited time periods with strict selection criteria. In certain regions, loans from
input suppliers and traders are used by small and medium farmers. However, if input suppliers are also

45
relying on credit, a tightening of their financing will assuredly affect those to whom they are
selling/lending.
In the East Africa region, for countries such as Tanzania, Rwanda, Zambia and Mozambique, the
financial crisis has not generated any notable liquidity constraints. Most financial institutions are savings
banks and these give few loans to the private sector, preferring to lend to government agencies and
institutions. Banks give loans to farmers after harvest via warehouse receipts which permit farmers to
better manage the sales of their crops.
Bankers’ views
Some bankers were suggesting that an important consequence of the financial crisis will be a
structural change in bank lending be it for trade or other investment purposes. Greater emphasis will be
placed on income statements and repayment capacity and the extent to which firms are leveraged as well as
the market risks of their main sector operations. For many firms, the effects of these changes will only
begin to be seen in the coming months as loans come due and renewals under stricter criteria are applied.
Interviews with major banks involved in trade finance found that credit was being allocated in a more
selective manner as market risks rise. For instance, no new clients are being taken on unless these are
subsidiaries of existing clients, and an increased level of collateral is required for loans for all. Even the
very big firms/traders with longstanding large credit lines are now subject to increased pressures as credit
lines are subject to greater cost or collateral variations, even on a day-to-day basis. In addition, the costs of
credit are rising and several layers of credit guarantees may be required for any loan. Though higher
pricing can in part take this into account, some banks appeared more risk averse than others with respect to
certain elements, such as institutional and country risk. These risks appear to have risen in importance after
recent bank failures in OECD countries.
Another problem arises when destination countries for exports have weak legal systems. In these
cases, it is often difficult or impossible to obtain compensation or even make claims, making the risk too
high in spite of higher fees. In certain cases, banks are extremely reticent about credit lines for specific
export destinations, such as Ukraine, Russia and certain Baltic countries. It is not known whether this is a
sectoral issue particular to the agri-food trade or a more widespread one affecting all trade with these
countries. For certain emerging and developing countries, the constraint is exacerbated due to lack of
support from their own credit institutions and the inability to move successfully in the sea of trade finance
documentation. In a context of weakened economic growth and financial turmoil, banks are shying away
from all but the most secure transactions to avoid adding risk to their balance sheets. Again, not all banks
approach trade finance the same way but the trends are clear; more collateral/own equity and additional
required documented guarantees both for the importer and exporter so that the final transaction may have
several layers of guarantees.
Firm reputation is a basic ingredient for any credit evaluation, and thus in many instances small firms
are reported to have no more difficulty obtaining credit than large ones. However, in a recent bank survey
by the IMF and BAFT (Bankers Association for Finance and Trade) on private sector credit developments
for trade, indicated that as costs of trade credit are rising the demand for trade credit by small firms may be
reduced [Dorsey, 2009]. The same survey found that in commodity trade both country risk and the type of
trade coupled with fluctuating prices and long shipping times, has meant that banks are now shying away
from these operations.

46
Agri-food trade
From this preliminary analysis and anecdotal evidence it appears that trade credit constraints are
affecting the agri-food sector and, in a number of instances, quite severely. Difficulties in obtaining trade
credit/finance for transactions between non-OECD and OECD countries is frequently reported, such as for
Russia and Ukraine. However, even transactions between OECD countries and within the EU and within a
given country are experiencing credit access difficulties. In part this is due to the general lack of
confidence and increased caution on the part of credit providers that the present financial turmoil has
generated.
For firms that rely on exports of bulk commodities or semi-processed products for most of their
earnings, the trade credit issue is considered critical. With risk perceptions in a state of flux due to the
market turmoil, demanding counterparty guarantees are now required of importers and exporters and this is
increasing transaction costs and reducing trading opportunities. Risk for a given transaction is now not
only a function of a firm‟s creditworthiness but also of exchange rate and institutional risk, a belief
confirmed by bankers‟ responses. Exchange rate risk is of course a risk firms and traders must bear, but it
may affect the banks evaluation of the value of a transaction. While secondary markets for these risks exist,
the recent financial market turmoil and extreme exchange rate volatility, has to a large extent dried up their
liquidity. Thus as banks do not wish to add risky products to their balance sheets, trade credit is simply
more selectively allocated. This was noted by exporters whose traditional markets are now considered
more risky destinations. In some instances, exports must now be on a cash basis or not take place at all.
This restructuring of credit allocation may also imply that the traditional role of traders with private
information on different trading partner creditworthiness will again become important.
Firms which cannot get some ingredients may be forced to shut down temporarily or even exit their
business. It has been reported by importers that existing credit line guarantees have increased to an extent
that it is literally impossible to import goods. For instance, the inability to access credit for imports has
blocked production by agri-food processing firms in number of African countries, even though the firms
are financially sound. And similar experiences were noted by certain medium-sized African supermarkets
in sourcing from European suppliers.
On the export side one co-operative from Denmark expressed strong concern that trade in dairy and
pork exports were being held up due to lack of trade finance in importing countries due to these countries‟
exchange rate and institutional risks. Tightening of trade credit conditions and availability was felt to be
curtailing not only their export potential but also actual export activity, so much so that some even allude
to the possibility of having to exit the sector completely. For many small and medium sized firms even
export credit insurance has dried up in the present economic context. Difficulty in obtaining export credit
guarantees has led to a decline in sales particularly to specific trading partners and already risks the
economic viability of the firm.
Impacts on food manufacturers
All multinational food firms interviewed did very well in 2008 in spite of weaker earnings towards the
end of 2008. Most expected this weakening to continue in the initial part of 2009 as income continues to
decline and pricing strategies come under pressure. Maintaining market share when price becomes a much
more significant determinant of purchases than previously was seen a critical to coming out of the
recession with limited damage to the balance sheet and brand. This has motivated firms to develop product
lines that meet consumers‟ new demand for higher value.
The most severe impacts of tighter credit along with a decline in demand were noted by the food
manufacturing sector. Due to the structural characteristics of the sector, with many small and medium sized

47
firms, they often have difficulty in obtaining bank credit due to their low levels of equity and liquidity.
This situation may force already financially fragile firms to exit, generating further economic
consequences. In an internal survey of major European food manufacturing association, 40% of the firms
were affected by the downturn, of which 70% were small and medium sized. Over 30% reported that
financial guarantees for loans had become a constraint and new credit was increasingly difficult to obtain.
However, for the financially robust firms there were no credit reductions.
The financing of transactions between firms as noted previously remains an issue even within a
country. This was noted in the UK, where a firm‟s production can be blocked due to inability to obtain
inputs - raw or processed - due to credit constraints. Several firms in other countries, such as Belgium,
Italy and Spain, reported similar difficulties. This situation is likely due to the lack of trust and uncertainty
now dominating any form of credit transactions and should prove a temporary disruption. Once the balance
sheets of firms or their financial conditions are known more normal trading conditions should ensue. Banks
can then provide needed credit to the financially sound firms enabling sales and purchases to flow again,
even if they are likely to be more rigorous in their evaluation of balance sheets and thus more selective in
credit allocation.
A more rigorous evaluation of a firm‟s financial standing may mean that highly leveraged firms may
have difficulties in renewing loans. New firms without reputable credit histories may have to meet much
tougher standards in terms of greater collateral, higher cost and shorter repayment periods than was
previously the case. This could have implications for the structure of the sector, but it is too early to
identify or even speculate on what adjustments may be forthcoming.
Impacts on the food retailing and food service sectors
Both food retailers and food service firms/restaurants in the OECD area are being affected by the
economic recession as consumers reduce spending and reallocate expenditures across food products and
services. This is increasing competition among firms as they attempt to maintain market shares.
Retailers have observed a move by consumers toward the purchase of lower priced products that offer
almost equivalent product attributes. Retailers‟ private label products have benefited from a greater cost
consciousness among consumers. This trend began over a decade ago and may only be accelerating due to
the recession. While certain branded product categories remain strong, a number of brand name
manufacturers have also begun to modify their offerings in response to consumers‟ price concerns. While
quality continues to matter to consumers they appear to be making more trade-offs among product
attributes as they reduce total spending.
Restaurant meals are generally thought of as a discretionary expenditure. In France, Italy, the UK and
Australia, reductions are expected in away from home meals are expected. In the US, according to the
restaurant association, there has been a small decline in expenditures in real terms, but market shares are
shifting towards full service family and fast food chains, to the detriment of upmarket restaurants.
Summing up
Players in the agri-food sector, are experiencing both demand and credit effects of the financial
market turmoil though the intensity varies across activities along the chain. In general, the agri-food sector
is considered to be more resilient than others, but risks may intensify should the financial crisis and
recession be prolonged. Trade credit availability was a significant problem for manufacturers, processors
and producer cooperatives involved in trade.
Agricultural firms and producers in the OECD area generally expect a worsening of future sales
prospects and prices over the near term due to the deteriorating global economic conditions and sharp fall

48
in trade. Firms that are more capital intensive and rely more heavily on external finance could be more
seriously affected if the recession in the OECD area and general economic downturn elsewhere is both
deeper and its duration prolonged. While credit availability for farmers in most OECD countries is not yet
constrained as their financial situation coming into the outlook has been buoyed by high commodity prices,
despite rising input costs, in the past two years, there is a reported tightening of credit standards, increased
collateral demands and shorter repayment periods by banks.
Though demand in the downstream industries is slowing somewhat, most firms consider that demand
for their agri-food products will be less affected than that for products in the non-food sector. Tighter
access to credit was signalled by most firms in the downstream portion of the sector as an emerging
problem. Credit conditions are generally perceived to be deteriorating and in many cases restricted access
to credit is creating blockages along the chain which is limiting the ability to source raw materials or to
move products through different stages of production. But this may be a temporary situation until firms‟
balance sheets positions are known and interbank lending and transactions recover.
Since credit allocation by banks relies heavily on an evaluation of the firm‟s ability to repay the loan,
small and medium-sized firms are reported to be experiencing the greatest difficulty in getting credit due to
their limited equity. Highly leveraged large firms may also now be under greater scrutiny. It is too early to
fully understand the implications of changing risk evaluations in credit allocations for the food sector.
Regardless of the position in the food chain, firms involved in trade, imports or exports or both,
repeatedly and emphatically listed trade finance constraints as the most binding to their business, due to its
impacts on sales. Indeed, trade finance constraints may be exacerbating any downfall in demand and may
be putting in peril the economic viability of firms. In a world of global supply chains and distribution
systems such constraints may be a determinate factor for the financially fragile firm‟s survival in the short
run. If credit constraints, which affect small and medium firms more severely than larger firms, persist they
stimulate structural changes in the industry composition as well as in firms themselves.
The foregoing analyses of the financial crisis effects on the agri-food sector have reflected the short-
term consequences of the credit constraints and of the economic downturn. However, recovery in GDP
growth rates and international trade expected in 2010 and continuing thereafter through the projection
period, should generate a more favourable economic environment for agri-food firms in terms of demand.
In addition, if as expected the present tight credit situation loosens as the banking sector resolves its
balance sheet issues and resumes lending, then firm activity should pick up both domestically and in terms
of international trade. It is, however, likely that the financial crisis will have generated structural changes
in credit allocation strategies reflecting a different view of risk taking than before. This may increase
required assurances in all lending transactions as has already been indicated by bankers. Over the medium
term firms may need to learn to re-adapt business strategies to this evolving credit environment.
Agricultural futures markets and the speculative activity
Another consequence of the financial market turmoil over the past 18 months has been the significant
decrease in equity market values, which some suspect has affected the futures market activity of the large
long traders. Last year‟s Outlook signalled an increased use of futures markets by non-commercial traders
compared to previous periods with a rise in total contract volumes and their share of contracts. As volumes
have declined the shares of non-commercial open interest long contracts have also fallen except for sugar
Table 2.1. The share of index trader contracts (long) with respect to combined futures and options contracts
has, however, increased for corn, wheat and soybeans.

49
Table 2.1. Futures market activity: total volume of open interest contracts and distribution over commercial and non-commercial traders (Chicago Board of trade and New York Board of Trade)
Futures Corn Wheat Soybean Sugar Futures
Total open int.
2005 657 417 222 752 272 127 400 084
2008 1 452 992 449 237 596 447 979 085
2009 812 240 305 491 322 897 660 712
% Commercial
2005 61.6 55.4 59.5 43.8
2008 45.6 48.6 42.9 55.5
2009 50 0 48.0 47.0 50.5
% Non-comm.
2005 16.9 28.0 19.9 34.8
2008 43.2 42.3 46 33.7
2009 36.2 42.8 39.9 37.4
% index traders –long
2008 20.2 36.2 23.9 31.1
2009 21.7 40.6 24.9 24.0 1Source: Commodities Futures Trading Commission (CFTC), www.cftc.gov, Commitments of traders Long Report: 25/03/2005,
25/03/2008, 24/03/2009 for total open interest contract volume, and % of commercial and non-commercial long contracts.
2CFTC, Commitments of traders, futures and options combined, supplemental report, 25/03/08,24/03/2009.for index-trader positions.
3 CFTC, Commitments
of Traders, NYBOT, 25/03/05, 25/03/08, 24/03/09 for Sugar.
The role of speculators in futures markets has gained renewed interest in political circles13
. Frequently
questions arise as to whether or not there might be excess speculation in these markets and if so, can it
affect market prices.
Some observers contend that increased participation by speculators in futures markets has increased
so markedly in recent years, that it is now excessive and could be a cause of the very recent price gyrations
experienced in basic food commodity markets. However it is also probable that their increase reflects
expected profit opportunities that originate in the commodity market fundamentals themselves and are
signalled to them by hedger activity. Simply put, the increase in speculative activity is due to expected
changes in market fundamentals and not vice versa (Working, 1960; Irwin et al, 2008; Sanders et al; 2008,
Irwin 2009).
Does the increase in the number of non-commercial long contracts imply that there is excess
speculation? Futures markets are mainly hedging markets thus there would be unnecessary or excess
speculation if the contract volume held by speculators exceeded the amount necessary to meet hedging
needs of commercial traders (hedgers). Workings‟ T-statistic is used to calculate the excess speculation in
futures markets from data provided in the official COT (Commitment of Traders) reports of the CFTC
(Commodity Futures Trading Commission,www.CFTC.gov).14
A value of 1 for the T-statistic would
indicate that speculative activity was the minimum necessary to meet needs of hedgers‟ activities, both
long and short. Values above 1 indicate an excess of speculation, but as noted by Working, this technical
excess is economically necessary for a well-functioning market (Sanders et al., 2008). From previous
13
Speculators are defined as non-commercial traders, that is, those who enter the market without having an
underlying risk position associated with futures. Since there are limits on the non-commercial trades,
commercial traders have no interest in being classified as non-commercial and thus the non-commercial
category can be considered as those not having any underlying risk to hedge. The debate focuses on the
commercial definition which might include some form of underlying financial risk unrelated to
commodities.
14 Details on data assumptions and method are available from the OECD Secretariat.

50
studies, including some dating from the 1950s and 1970s through to 2008, the value of this indicator
statistic has ranged from 1.05 to 1.89 for a variety of commodities (Working, 1960; Peck, 1982; Leuthold,
1983; Sanders et al, 2008). These values were obtained before the entry of large non-commercial long
traders, such as index traders.15
Working‟s T-statistic is calculated from 1-1998 through 3-2009 for wheat-CBOT, corn, soybeans,
sugar and crude oil and results are shown in Table 2.2. They are all in excess of 1 but appear to be in line
with previous periods as well as findings of other research (Sanders, 2008). A maximum value of 1.27 is
found for wheat, but for the period 1998-2002 before the entry of large speculative traders. A closer look at
the values indicates that during the recent commodity price increase, 2006-2008, this indicator was lower
than in the 1998-2002 period.16
Values calculated for each year also find that they are lower in the recent 5-
year period than in the previous one. It does not appear that speculation has been excessive in the markets
examined given available data and Working‟s statistic.17
Table 2.2. Working's T-statistic as a measure of excess speculation
Time period Corn Crude oil Soybeans Sugar Wheat
1998-2009 1.13 1.08 1.14 1.08 1.23
1998-2002 1.13 1.04 1.15 1.07 1.27
2002-2009 1.13 1.10 1.13 1.09 1.20
2006-2008 1.11 1.12 1.13 1.10 1.20
Note:
1. T= 1+(SS/HS+HL) if HS>=HL and 1+SL/(HS+HL) if HS<HL, SS= Short Speculators, SL=Long speculators HL=Long Hedgers, HS = Short Hedgers,
Source: OECD Secretariat.
Some observers do suggest that speculators were responsible in part for recent price rises and not
simply to underlying market fundamentals (Robles et al., 2009, Masters, 2008).There is almost no
evidence that speculative positions in futures markets directly affect prices, though some have found some
evidence over specific intervals for certain commodities. Very preliminary in house econometric analysis
also does not indicate any statistical link between speculators positions and spot prices. Other recent
studies have found mixed results on directions of causation (EU, 2009). The topic certainly merits further
research to avoid a priori judgements in any policy decisions regarding the operation of these markets.
15
There are no statistical criteria to determine different degrees of excess speculation.
16 The calculation of the T statistic relies on the accuracy of the classification of traders in the COT reports and has been
discussed both at present in the past by researchers. A trader is commercial if he using the futures market to hedge an
underlying product. However the entry into the futures markets by banks/financial operators who operate to hedge
against their „underlying swaps‟ or OTCs or indices are non-commercial traders.
17 For further information on calculations and results see the website www.agr-outlook.org

51
REFERENCES
Board of Governors of the Federal Reserve System, (2009), Agricultural Finance Databook, E. 15 (125).
Dorsey, T. (2009), Survey of Private Credit by Banks, March 2009, IMF.
European Union (2008), “Monitoring Price Developments”, Commission Staff working document,
SEC(2008)2970.
Henderson, Jason (2009), “Agricultural Credit Conditions”, report to the Subcommittee on General Farm
Commodities and Risk Management, U.S. House of Representatives, April 1.
Irwin, S., D. Sanders and R. Merrin (2009), “Devil or Angel? The Role of Speculation in the Recent
Commodity Price Boom (and Bust)”. Invited paper Southern Agricultural Economics Association
Meetings, Atlanta, Ga., 2009.
Leuthold, R.M. (1983), “Commercial Use and Speculative Measures of Livestock Commodity Futures
Markets” Journal of Futures Markets 3: 113-35.
Masters, M. (2008), Testimony before the Committee on Homeland Security and Government Affairs, US
Senate, May.
OECD (2009a), General Assessment of the Macroeconomic Situation, OECD, March 31, 2009.
OECD (2009b), Agricultural Policies in OECD Countries: Monitoring and Evaluation Report 2009.
Peck, A., (1982), “Estimations of Hedging and Speculative Positions in Futures Markets Revisited”, Food
Research Institute Studies, Vol. XVIII-2,
Sanders, D., S. Irwin and R. Merrin, (2008) “The Adequacy of Speculation in Agricultural Futures
Markets: Too Much of a Good Thing? Marketing & Outlook Research Report 2008-02, Dept. of
Agricultural and Consumer Economics, University of Illinois. Urbana-Champaign.
Working, H. (1960), “Speculation on Hedging Markets”, Food Research Institute Studies, Vol. I-1: 3-31.
52
CHAPTER 3
CAN AGRICULTURE MEET THE GROWING DEMAND FOR FOOD?
There is unprecedented international interest in the issue of food security. This is not surprising given
the total number of undernourished people in the world reached 963 million in 2008, nearly 15% of the
world's population. The World Bank‟s 2008 World Development Report launched this revival by calling
for greater investment in agriculture in developing countries if the goals of halving extreme poverty and
hunger by 2015 are to be realized. An FAO conference in 2008 stressed that food security was one of the
biggest challenges of the century, noting that increased agricultural investment and enhanced productivity
was crucial. The 2008 G8 Summit in Japan called on agricultural ministers to draw up concrete proposals
on world food security and a UN Task Force on Global Food Security was set up to promote a unified
approach to emergency relief and renewed investment in agriculture.
Concerns have not diminished with the return to lower commodity prices after the highs of 2006-08.
In the first half of 2009, there was a high-level meeting on food security in Madrid at which OECD
countries met to reassess donor responses, and the OECD and FAO brought experts together in Paris to
advance the debate on some of the long-term issues relating to agricultural investment and to address the
challenges faced by many poor countries in promoting growth and poverty reduction as their economies
transform. While the emphasis by participants differed, it became clear that the remedy for food insecurity
needs to combine strategies to both increase investment in agriculture and reduce poverty.
The first G-8 Farming Summit was held in April, where Ministers of Agriculture of the G-8 countries
confirmed that agriculture and food security are at the core of the international agenda, while calling for
enhanced investment to improve agricultural productivity and expand production as a way to combat world
hunger. The G-8 Ministers‟ Declaration to world leaders also made reference to the need to reduce poverty,
to help farmers manage risk and to sustain the benefits of globalisation and open markets.18
An UN-backed
proposal for another world summit on food security in late 2009 is gaining support. The FAO has a major
programme of work underway on feeding the world in 2050 which is looking at available resources,
technological challenges, investment needs and policy approaches.
An underlying concern in much of this dialogue on food security is whether the industry will be
capable of meeting the growing demand for food associated with a projected world population of 9 billion
by 2050. Recent analysis19
shows that food availability in developing countries will need to increase almost
60% by 2030 and to double by 2050, equivalent to a 42% and 70% growth in global food production,
respectively. Will rising food prices drive more of the world‟s population into poverty and hunger? Can the
industry produce almost 50% more food by 2030 and double production by 2050? How much spare
18
Final Declaration of the G8 Agriculture Ministers meeting, 18-20 April, Cison di Valmarino, Italy:
http://www.g8agricultureministersmeeting.mipaaf.com/it/
19 FAO (2006): World Agriculture: Towards 2030/2050 - Interim report. Rome; and Bruinsma, J.
(2009, forthcoming): The resource outlook to 2050 - By how much do land, water use and crop yields need
to increase by 2050? Paper to the FAO Expert Meeting on “How to Feed the World in 2050”, Rome, 22-24
June 2009. Growth rates are based on 2005/07 average historical data.

53
capacity is there in terms of land and water? Will new technologies enable us to use scarce resources more
efficiently and increase productivity? How will climate change affect various regions in the world?
The FAO has constructed an agricultural production index that shows a sharp rise in world
agricultural output over the last 40 years in developing and Less Developed Countries (LDCs) (Figure 3.1).
The rate of growth has been impressive, although calculating this production index on per capita basis
would show smaller gains for the LDCs. A key assumption in the OECD-FAO Agricultural Outlook is that
this rising production trend will continue over the medium term, reflecting the potential for further gains in
productivity. For developed countries, increased production is also assumed, although at a slower rate
given the already relatively high levels of productivity. If these assumptions are wrong and production
does not rise as expected, the impact on commodity and food prices could be dramatic. A number of
studies claim yield growth has been slowing down, leaving a general impression that new technology is not
being generated as quickly as it once was.
Figure 3.1. Agricultural production index by region
(2000 = 1)
Rising food prices and the implications for food security was a central focus of last year‟s Outlook
report. It recognised that immediate humanitarian aid was required but that longer term solutions depended
primarily on fostering growth and development in poor countries to improve incomes and purchasing
power. On the supply side, the report called for a closer examination of the potential for, and constraints to,
increasing agricultural productivity and output, such as technological innovation and climate change. This
chapter responds to that challenge by taking a closer look at some of these longer term supply side issues,
specifically the available evidence on the amount of land available for agriculture, prospects for
agricultural productivity growth and the increasing competition for water resources.

54
Land and agriculture20
There is more arable land available…
Gross land balances (GLB) are defined as the total land that is potentially suitable for growing crops
but which is not currently being cultivated. GLB estimates have been made using agro-ecological
modelling (Fischer et al 2002)21
, taking into account existing soil, climate and terrain conditions in relation
to major crop requirements, under various assumptions of land management. These estimates indicate that
on a global basis, the total availability of land, which has from moderate to very high suitability for rain fed
crop production, is about 43 million square kms, (or 4.3 billion hectares). Currently cultivated world arable
land is estimated at about 1.4 billion hectares. Over half of the additionally available land is found in
Africa and in Latin America. Furthermore, with estimates of 2.435 and 2.084 million km2, respectively,
these regions account for most of the land that has the highest suitability class for rain-fed crop production.
These figures of suitable land are gross „optimistic‟ estimates, since they do not take into account the
fact that while certain areas of land may be suitable for cropping; they have already been allocated to other
competing and socially-acceptable land uses (e.g. forests, urban areas, protected areas). Suitable land
resources in these latter areas are thus effectively unavailable for conversion to cropland, except at high
social/environmental costs of conversion. For many purposes, it is therefore be more realistic, to consider
net estimates of the availability of suitable land.
The net land balance value (NLB) is derived from the GLB by excluding areas which are currently
allocated to either forests, urban areas or protected areas. As expected, the gross availability of suitable
cropland decreases when other competing land-use categories are taken into account. For 54 out of the 148
countries for which data are available, competing land uses reduce the gross land balance by more than
10%. The highest percentage decreases occurring when forested areas are excluded, notably in Latin
America, Africa and the Caribbean (Figure 3.2).
20
The background material for this section was contributed by H. George and F. Nachtergaele of the Natural
Resources Management and Environment Department at FAO, and Cheng Fang and Merritt Cluff from the
Trade and Markets Division. Some of the work reported here was extracted from an unpublished draft
report prepared in 2006 on State of Land & Water Resources (SoLAW) by the FAO Land and Water
Division.
21 One major drawback requiring further research is the effect of land degradation on the quality of the land,
which is not taken into account in the agro-ecological approach of Fischer et al (2002).

55
Figure 3.2. Gross and net arable land balances by region, 2002
Note: FAO estimates. Gross and net arable land available by region as a percent of total land area of the region that is potentially suitable for growing crops but which is not currently being cultivated. The net values shown progressively and cumulatively take into account non-cropland land uses (viz. urban, protected areas and forests) of suitable land.
The competing land use which contributes the most frequently to reducing notably the availability of
suitable cropland is forestry. However, the loss of suitable land to urban uses is also important. These
numbers suggest that at the world level, some 1 560 million hectares are effectively available for crop
expansion. Most of this available land available resides in Africa and Latin America, with the smallest
shares in North America and Europe. While there are significant quantities of land available for expansion,
it does not reside in the currently high output zones of temperate world agriculture. Indeed, further
expansion in both North America and Europe appears limited in relative terms.
The estimates of NLB do not include another possible source of competition, which is that for
growing livestock numbers. Livestock populations are growing and with higher incomes, and particularly
in populous countries such as India and China, meat consumption will increase in the future. Therefore,
pasture land will remain in high demand and may further limit crop expansion. Furthermore, the boom in
bio-fuel demand risks to further limit the amount of cropland available for food production, as feedstocks
are provided to biofuel production.
The emergence of carbon markets will also affect land availability because some of the options
(biofuels and sequestration) compete for the same land resources. The resulting increased competition for
land could increase land prices and may also shift production towards commodities with smaller carbon
footprints. Growing pressure to address climate change has created rapidly growing carbon markets that
are expected to reach billions of dollars in annual transactions within the next 10 years (Box 3.1). Carbon
market transactions have been doubling in volume every year with trading worth several hundred million
US dollars a year.
… but historical expansion of arable land has been slow
Arable land refers to land under temporary crops (double-cropped areas are counted only once),
temporary meadows for mowing or pasture, land under market and kitchen gardens and land temporarily
fallow (less than five years). Abandoned land resulting from shifting cultivation is not included
(FAOSTAT). Expansion of land in agricultural use has taken place in countries with growing needs for
food and employment, with limited access to technology packages that could increase intensification of

56
cultivation. Arable land in the world as a whole expanded slowly since 1961-63 (Figure 3.3). For 2006/07,
world arable land was estimated at 1.42 billion ha, 135.6 million ha (or 10.5%) above that of 1961-63,
growing slowly at an average annual growth rate of 0.2%.
Box 3.1. Agriculture, climate change and carbon markets
Carbon emission markets establish a market-based instrument for trading carbon credits. Carbon trading is seen to be an effective mechanism to curb emissions of greenhouse gases (GHG), while minimizing impacts on economic growth by providing flexibility in meeting emissions regulations. A key driver of carbon markets is the Kyoto Protocol, under which 38 industrialized countries agreed to cut their emissions of greenhouse gasses from 5-8% below 1990 levels between 2008-12.
The two main policy options that have gained most interest are carbon taxes and carbon emissions trading systems. In addition to emission reductions, the Protocol approves offsets through enhancement of sinks which absorb greenhouse gases. In the Protocol, agriculture is both an emitter of and a sink for greenhouse gases. In 2005, agriculture contributed about 10-12% of greenhouse gas emissions (GHGs). Agriculture accounts for about 50% of global methane and about 60% of global N2O emissions (IPCC 2007). The share of agriculture in total emissions of different gases varies considerably between countries.
There are at least four ways agriculture may participate in or be influenced by GHG mitigation efforts: reduction of emissions from agricultural production; enhancement of greenhouse gas absorption by creating or expanding sinks; provision of products which substitute for emission intensive products, such as biomass for bioenergy to replace fossil fuels; and through greenhouse gas mitigation policies on agricultural input and output prices (McCarl and Schneider, 2000).
GHG emissions mitigation options in the livestock sector include: reduction of soil carbon losses through improved grassland and pasture management; reduction of methane emissions of livestock through better diets and genetics, and better manure management; and reduction of nitrous oxide emissions through altered diet and improved manure storage and applications methods.
Withdrawing carbon from the atmosphere and storing it in agricultural and forest soils and biomass has the potential to sequester large amounts of carbon. For cropland the main options with the highest potential for storing carbon are afforestation, conversion of cropland to perennial grasses, and switching from conventional tillage (moldboard plough tillage) to reduced tillage or no-till. Options with lower carbon-storing potential include changing crop rotations, elimination of summer fallow, expanding the use of winter cover crops, and improved management of fertilizer, manure and irrigation (Antle 2009, Lewandrowski et al. 2004).
Establishing comparability between carbon emission reductions and carbon sequestration requires consideration of the temporary greenhouse mitigation effect of carbon sequestration relative to emission reduction (permanence) and the finite period of time that soil can accumulate additional carbon (soil carbon stock equilibrium). An additional policy issue is whether farmers are paid for carbon sequestered (gross sequestration) or whether they are paid for carbon sequestered and charged for carbon emitted (net sequestration). Given a carbon price of USD 125 per tonne of carbon permanently sequestered, a payment for gross sequestration would reduce emissions by 3.5 MMT at a cost of USD 1.5 billion while a payment for net sequestration would reduce emissions by 7 MMT at a cost of USD 300 million - twice as much carbon at one-tenth the average cost per tonne (Lewandrowski et al., 2004).
Many of the carbon sequestration activities or mechanisms have ancillary benefits and costs which need to be taken into account when designing carbon sequestration policies. For example, reduced tillage usually reduces soil erosion and nutrient runoff, but it may increase the use of herbicides for controlling perennial weeds and thus may ultimately increase herbicide runoff. Conversion of crop land to perennial grasses may improve wildlife habitats and increase species diversity. On the other hand policy measures that are designed for addressing water quality, such as establishment of green set-asides and buffer strips can contribute to carbon sequestration.
The expansion of global arable land has mainly occurred in Asia, Africa, and America (Figure 3.4).
Between 1961-63 to 2006-07, arable area increased from 154.5 million ha to 213.1 million ha in Africa (an
increase of 58.6 million ha or 38%), and from 412 million ha to 511.5 million ha in Asia. In America, with
the exception of North America, arable land also increased, but most of the increase was before 1990. In
Brazil alone, arable land increased by 35 million ha (or 145%) during the same period. In general, the
countries with low income and a food deficit had a greater expansion of arable land, driven by strong
domestic demand for agricultural products. For the group of Net Food Import and Developing Countries

57
(NFIDC), arable land increased by 55 million ha or by 34%. For the landlocked developing countries, the
arable land expanded by 73 million ha or by 160%. The net increase of arable land is a total of gross land
expansion minus land taken out of production for various reasons, such as degradation or loss of economic
viability. Deforestation has been a major factor linked to the arable land expansion in many developing
countries.
An opposite tendency has been observed in a number of the Newly Independent States over the last
20 years, where economic transformation led to a significant fall in area used for agricultural production.
For example, between 1990 and 2007 total area sown to crops declined from 117.7 million to 76.4 million
hectares in Russia and from 32.4 million to 26.1 million hectares in Ukraine (OECD 2009a)
In contrast, the developed world has experienced the contraction in arable land: in Europe, arable land
declined by 0.9% annually between 1961/63 and 2006/07. In Northern America the decline was 2%
annually. The longer-term forces determining such declines are sustained yield growth, and farm
consolidation combined with a continuing urban expansion, and also affected by phenomena such as policy
changes in the industrial countries and political and economic transition issues in the former centrally
planned countries.
Figure 3.3. World trend of arable, harvested land areas, and multiple cropping intensity (1980=1)
Source: Based on FAOSTAT data.
Cropping intensity has increased…
Multiple cropping is the practice of growing more than one crop on the same land during one year. It
involves several alternative patterns of crop management in space and time such as mixed cropping,
intercropping, relay-cropping, sequential cropping, double cropping, triple cropping, etc. (FAOSTAT). In
this analysis, the multiple cropping index (MCI) is calculated as the sum of area harvested for different
crops during the year, divided by the total arable land.22
Cropping intensities continue to rise with more multiple cropping and shorter fallow periods. An
increasing share of irrigated land in total agricultural land is the major factor for the more multiple
cropping. The overall cropping intensity in the world has risen steadily over the period 1961-63 to 2006-07
22
Total area and not cultivated area, as often no data are available.

58
(Figure 3.3). The highest growth is observed in Africa and Oceania (an increase by 25 percentage points
and 16 percentage points, respectively), while there is a significant reduction in Europe (a decrease by
8 percentage points).
Although the arable area expanded by 135.6 million ha between 1961/63 and 2006/07, harvested area
expanded by 229.5 million ha (or 23.6%) because of increases in cropping intensities. Of the increase in
area harvested, about half is attributable to the expansion of arable land, and half to the increase of MCI.
Figure 3.4. Arable land by region
Source: Based on FAOSTAT data.
… but there are large regional differences and the pace is slowing
The highest MCI are in Asia and lowest in Oceania, as shown in Figure 3.5. In South and East Asia,
about one-third of the arable land is irrigated, which is one of the reasons why the average cropping
intensities in Asia are considerable higher than in the other regions. While MCI has increased in all
regions, except Europe, there is a significant difference in among regions. The highest growth is observed
in Africa and Oceania.
Over this same period, harvested area increased 127% (13 million ha) in Oceania and 90% (93 million
ha) in Africa In both cases, about half the increase was from the arable land expansion and half from the
increase in MCI. Among sub-regions of Africa, Western Africa accounts for the largest increase (by
52 million ha or 137%). In Asia, harvested area expanded by 141.7 million ha or 33.6% during this period,
with about three-quarters of the increase due to arable land expansion and one-quarter to the increase of
cropping intensity. Contrary to other regions, Europe had a reduction of 88 million ha or 34%, mostly as a
result of the arable land area reduction.
The trends of MCI and harvested area in general are expected to continue, but at a slower pace. As
industrialisation and urbanisation continue in many developing countries, more cropland will be used for
industrial and residential developments. Rapid industrialisation will also continue to pull labour out of the
countryside and agriculture, and lead to less double cropping. Moreover, ever more intensive use of land in
production in some regions through multiple cropping is perceived as a leading factor for land degradation
and the undermining of its long-term productive potential (FAO 2003). However, a potential for big
increase in MCI and harvested area exists in some regions, such as Latin America and some African
countries.

59
Figure 3.5. Multiple cropping index in selected years
Note: MCI is calculated as the sum of area harvested divided by total arable land (not total cultivated area).
Source: Calculated based on FAOSTAT data.
Technology and productivity23
In developed countries, there have been a wide range of technical advances for agriculture - genetic
improvement, chemical fertilizers and pesticides, farm equipment and machinery, and cultural and
management practices. Research in both the public and private sectors has been the primary source of new
technologies, with the private sector becoming increasingly involved in new technology development and
marketing and being the exclusive source of GM (genetically modified) crops in OECD countries.
Technologies available to farmers are continuously changing. However, agricultural productivity, which is
a reflection of the adoption and diffusion of successful technologies, has slowed over 2000-06 relative to
the 1990s in the EU, North America, in high income Oceania and in large developing or transition
economies. Among developed countries, an exception to this pattern is Northeast Asia developed
countries, such as Japan and Korea, which experienced higher agricultural total factor productivity (TFP)
growth in the latter period.
For developing countries as a whole, there is some evidence that crop yield growth has actually
accelerated. One recent study on developing countries found crop yield increases for the 1980-2000 period
were higher than for 1961-80 for cereals (total), lentils, millet, potatoes, paddy rice, and wheat, while lower
for barley, cassava, sorghum and, to a lesser extent, maize (Evenson and Gollin, 2003). The study
concluded that the Green Revolution effects on crop yields in developing countries were not confined to
the period 1960-80. In fact, yields of many key crops in developing countries actually increased faster over
the 1980-2000 period.
In the context of examining the industry‟s prospects for a significant future supply response, it is
yields that are of significant importance and the primary focus of this section. For major crops, evidence of
what is happening to yields in frontier production regions is presented. For livestock, the best available
evidence is a more global comparison of total factor productivity developments.
23
Major contributions to this section were provided by W. Huffman, Iowa State University, Department of
Economics; J. Piesse of King‟s College London and University of Stellenbosch, Republic of South Africa;
C. Thirtle, Imperial College London and University of Pretoria, Republic of South Africa.

60
Crop yields continue to increase…
Within the OECD area, the leading production region for corn and oilseeds is the US Midwest, for
example, in the state of Iowa, which has rich soils, relatively abundant summer rainfall, temperate growing
season, and access to the most advanced corn and soybean varieties. Wheat is the main cereal crop of the
EU, and France is the leading producer under abundant resources. In contrast, wheat is produced in the US
Great Plains and Prairie Provinces of Canada under limited resources, especially water, which also limits
other inputs, such as fertilizer. The state of Kansas is the leading US producer of wheat. Japan is a high
technology producer of paddy rice, which is irrigated or flooded and well fertilized. The Netherlands is on
the frontier of potato production with abundant water, fertilizer and good pest control.
The (trend) rate of crop yield improvement in the three main cereal crops of corn, wheat and rice;
leading oil crop-soybeans; and the leading vegetable crop for providing energy (potato) in major producing
regions of the OECD is roughly unchanged over the past half century. The rate is highest for Dutch
potatoes, Iowa corn and French wheat at 324, 120, and 105 kg per hectare per year, respectively, and
significantly lower for Kansas wheat, Japanese rice and Iowa soybeans of roughly 25 to 32 kg per hectare
per year.24
Corn yields in Iowa, however, may be entering a new era, as of 2004, where yields are
increasing at a significantly faster rate than 120 kg per hectare per year.
Corn is an important animal feed and food staple, an excellent source of carbohydrates but low in
protein. The most important advance in the cultivation of corn was the introduction of hybrids in the early
1930s. Figure 3.6 plots actual corn yields in kilograms per hectare from 1866 to 2007. Since 1970, the
trend rate of increase in Iowa average corn yields has been 119 kg per hectare per year, with the state
average yield exceeding 10 tonnes per hectare in 2007. However, the state average yields in 2004-07 were
somewhat above the trend line, suggesting that a new era of even higher increases in the trend for Iowa
average corn yields. This may be due to the new corn varieties adopted by farmers that contain stacked GM
traits. For example, 2004 was the first year in which one-half of Iowa‟s corn acreage was planted to corn
varieties containing two or more stacked GM traits, and in 2007, varieties with triple stacked GM traits
were widely planted by Iowa farmers, with these hybrids containing Bt for corn borer resistance, IP for
corn rootworm and tolerance to the herbicide glycophate. In particular, the rootworm resistance provided
impressive improvement in plant root structures and plant standability under rootworm infested field
conditions.
24
Standard weights: 45 pounds of rough rice per bushel; 56 pounds of shelled corn per bushel, and 60 pounds
of wheat, soybeans, and potatoes per bushel. Also, one pound per acre equals 1.121 kilograms per hectare.

61
Figure 3.6. Average Iowa corn yields
Source: Huffman (2009).
Wheat production is widespread throughout the world and supplies much of the world's dietary
protein and food supply. The rate of increase in Kansas wheat yields over the 1950-2007 period was
24.27 kilograms per hectare per year, with average yield in 2007 at 2.15 tonnes per hectare (Figure 3.7).
Much of this increase was due to the development of new wheat varieties. Wheat yields in France averaged
2.3 tonnes per hectare in 1960 and have a strong linear trend upward over 1961-2007 at 104 kilograms per
hectare per year. The predicted wheat yield based on the linear trend is 7.6 tonnes per hectare in 2007 but
this was 15% above actual average yield. An as yet unpublished study by INRA argues that the reductions
in wheat yield growth in France since the early 1990s was due to climate change.25
While yield increases
may have slowed in recent years, French wheat yields have improved much faster than in Kansas, a
reflection of the use of lower quality land for wheat production in Kansas.
25
Gilles Charmet, INRA, Les causes du plafonnement du rendement en grandes cultures, presentation to the
2009 Salon International de l‟Agriculture.

62
Figure 3.7. Average wheat yields, Kansas and France
Source: Huffman (2009).
Rice is the world's most consumed cereal after wheat, providing more than 50% of the daily calories
ingested by more than half of the world population. Japanese country-wide average rice yields were
4.8 tonnes per hectare in 1960 and increased to 6.5 tonnes per hectare in 2007 (Figure 3.8). The trend rate
of increase in average yields is 29.6 kg per hectare per year. Paddy rice in Japan is intensive agriculture on
good quality land and the average rate of yield increase compares favourably to dry land low-resource
input wheat in Kansas. However, it lags behind wheat yield gains in France and dry land, resource
abundant corn yields in Iowa.
Figure 3.8. Japan rice yields
Source: Huffman (2009).
Soybean production is the leading source of vegetable oil in North and South America and China.
Figure 3.9 shows Iowa average soybean yield trends over a 60-year period. The average trend rate of

63
increase is 31.9 kg per hectare per year. In contrast to hybrid corn, the development of new soybean
varieties for the US Corn Belt has been primarily by the public sector up to the mid-1970s
(Huffman 1987). In 1970, the US passed a Plant Variety Protect Act providing better intellectual property
protection to new soybean varieties and private sector on soybean varieties have gradually replaced public
sector varieties. Currently, virtually of the planted soybean varieties in Iowa are developed and marketed
by private seed companies. Starting in 1996, varieties containing GM herbicide tolerance (HT) became
available to Midwestern farmers. The same linear yield trend is observed for the 1996-2008 period when
HT soybean varieties were being rapidly adopted by farmers.
Figure 3.9. Iowa soybean yields
Iowa State average soybean yields, 1950-2008
Source: Huffman (2009).
2008 was the international year of the potato. It is the world‟s number one non-grain food commodity,
with consumption expanding rapidly in developing countries, which now account for more than half of the
global harvest. Figure 3.10 plots Dutch potato yields from 1961. For over more than a half century, the
trend has been constant at 324 kg per hectare per year. The average potato yield in 2007 was about
44.7 tonnes per hectare. These comparisons show that trend yield increase in Dutch potatoes is large
relative to the yield increases in other major food crop sources of calories such as corn in the US Corn Belt,
wheat in France or rice in Japan.26
26
One notable difference between potato and corn grain is the water content. Number 2 yellow corn is
standardized to 14% moisture content. In contrast, potatoes are 72-75 % water (FAO 2009).

64
Figure 3.10. Dutch potato yields
Note: Ware, starch and seed potatoes.
Source: Huffman (2009).
… and livestock productivity growth has accelerated
Technical advances in livestock production are a result of genetic improvement of animals, improved
disease control, improved structures and improved management practices. Steady improvements in animal
genetics have occurred with the use of artificial insemination, which is now widespread and pervasive in
modern dairy, swine and poultry production. Cross-breeding was a new technique in swine production in
the 1950-60s, but it has since spread to beef herds as a means to improve genetics for rapid growth and
quality attributes of meat. Livestock production in the US, Spain, the Netherlands, Denmark, Belgium and
Germany have become specialized into large units for broilers and layers and also cattle finishing in the
US, which reduces labour intensity.
The largest dairy herds in OECD countries are in the US West and South - Florida, Arizona and
California where herd sizes are 5 000-10 000 cows. Extremely large dairy herds have not been adopted in
the US Upper Midwest and New York or in Europe where herd sizes are typically still 100-200 cows.
Switzerland and Norway have even smaller average dairy cow herd sizes. Totally automated dairy cow
feeding and milking exists in some advanced European countries, but not in the US where relatively cheap
immigrant farm workers have been integrated into factory-type specialized livestock operations.
A recent publication, Handbook of Agricultural Economics, 2007, provides a global comparison of
livestock productivity of 115 regions (92 developing and 23 high income regions) over two periods - 1961-
80 and 1981-99. The later period showed higher total factor productivity (TFP) growth with Asia showing
the fastest expansion followed by Latin America, with Sub-Saharan Africa remaining relatively stagnated
over the period (Table 3.1). Acceleration of TFP growth in the latter period was mainly the result of an
increased rate of expansion of the technical frontier.

65
Table 3.1. Livestock total factor productivity growth
1961–1980 1981–1999
Total factor productivity
Technical change
Efficiency Total factor productivity
Technical change
Efficiency
South Africa −0.73 0.67 −1.39 1.3 0.74 0.56
Sub-Saharan Africa 0.01 0.01 0 0.02 0.03 0
Africa 0.17 0.31 −0.14 0.63 0.21 0.43
China 0.32 1.04 −0.72 6.27 0.82 5.4
India −1.05 0.64 −1.67 1.66 1.62 0.05
Asia −0.75 1.11 −1.85 2.54 2.33 0.21
Mexico 0.39 0.77 −0.38 1.41 0.64 0.76
Brazil −2.38 1.1 −3.44 1.73 1.07 0.66
Latin America −0.44 1.01 −1.43 1.15 1.55 −0.39
Source: Alejandro Nin, Simeon Ehui and Samuel Benin (2007) using FAO (2003) data.
The report also estimated average productivity growth gains over the 1961-2001 period for ruminants
(beef and dairy) and non-ruminants (pigs and poultry) within the livestock sector. For developed,
developing and Least Developed Countries (LDCs), productivity growth gains were much higher for non-
ruminants (Table 3.2). For non-ruminants, productivity gains in developing countries slightly outpaced
developed countries, while for ruminants developed countries showed much higher average gains. LDCs
lagged well behind in non-ruminant livestock productivity gains but matched the gains of developing
countries for ruminants.
Table 3.2. Annual total factor productivity growth rates for livestock, 1961-2001
Region Total Livestock Ruminants Non-ruminants
Developed countries 1.04 0.93 2.11
Developing countries 0.57 0.38 2.38
Least developed countries 0.54 0.4 1.24
Source: Ludena et al. (2005).
The contribution of technical change and efficiency to TFP growth varies across regions and species.
Biological and natural resource differences lead to different production processes. TFP growth is driven by
land productivity and changes in output per head of animal stock in countries with high labour/land ratios
like China and India, while in countries with low labour/land ratios like Brazil, for example, increases in
livestock productivity have come from increases in labour productivity.
Expenditures on research and development continue to rise…
The 1950s and 1960s saw science increasingly applied to agriculture in developed countries with
rapidly rising productivity growth, whether measured by yields, labour productivity or TFP. New crop
varieties were being developed that could be fairly quickly adapted by developing countries. The 1960s
and 1970s saw this process extended to developing countries as the green revolution raised yields,
especially in the densely populated countries of Asia.
The international transmission of productivity enhancing technologies depends on the rate at which
new technology becomes available, the extent to which it is allowed and encouraged to spill over into other
jurisdictions and the capacity of the recipient countries to identify, customise and diffuse what is available.

66
For many developing countries, infrastructure and institutional weaknesses are more of a constraint to
increasing productivity than the level of research expenditure. To capitalize on the potential to improve
productivity growth in developing countries requires development, adaptation and adoption of appropriate
technologies. There is technology “on the shelf” for developing countries to adapt and those with good
institutional capability can prosper under these circumstances. South Africa is a case in point. Following
the establishment of majority rule, there were over 4 000 employees in the Agricultural Research Council.
Studies showed that the South African research system concentrated on adaptive R&D and had
consistently high rates of return (Thirtle et al., 1998; Townsend and Thirtle, 2001).
Public investment in agricultural research continues to rise in real terms but growth rates in public
agricultural research expenditures declined in the 1980s, and continued to fall in the 1990s (Beintema and
Stads, 2008). The average expenditure growth rate for 32 high income countries was .52% for the 1990-
2000 period, down from 2.43% the previous decade (Table 3.3). For Sub-Saharan Africa as a whole, the
growth rate was actually negative in the 1990s, and in about half of the 24 countries in the region for which
time-series data is available. The growth rate in public agricultural research expenditures declined but
remained positive for Asia and Pacific, Latin America and the Caribbean and West Asia and North Africa.
These regional trends hide a growing divide between the scientific haves and have-nots. In the Asia-Pacific
region, just two countries, China and India, accounted for 89% of the increase in regional spending from
1995 to 2000, and 67% of the regions total expenditure in 2000. In high income countries, public
agricultural research expenditures increased as a share of AgGDP to 2.35% over the 1980-2000 period,
while it has remained relatively flat (and much lower) in low and middle income countries (Table 3.4). The
private sector has become an increasingly important contributor to research and development in
agriculture.
Table 3.3. Growth rates in public agricultural research expenditures
Country group 1976-81 1981-91 1991-2000
Low & middle income : (percentage)
Sub-Saharan Africa (45) 0.94 1.02 -0.15
Asia-Pacific (26) 7.98 4.67 3.35
Latin America & the Caribbean (25) 8.54 1.86 0.32
West Asia & North Africa (12) na 4.12 2.93
Subtotal (108) 6.36 3.02 1.91
High income (32) 2.5 2.43 0.52
Global total (140) na 2.66 1.1
Note: n.a - not available.
Source: Beintema, N. M and Stads G. (2008), calculated by authors based on ASTI datasets, MOST (various years), OECD (various years), and Pardey et al. (2006); 1976-81 growth rates are from Pardey and Beintema (2001).

67
Table 3.4. Public agricultural research expenditures as a share of AgGDP
Agricultural R&D spending as a share of AgGDP
Country group 1981 1991 2000
Low & middle income : (percentage)
Sub-Saharan Africa (45) 0.86 0.76 0.65
Asia-Pacific (26) 0.33 0.37 0.39
Latin America & the Caribbean (25) 0.91 1.08 1.19
West Asia & North Africa (12) 0.6 0.6 0.74
Subtotal (108) 0.56 0.56 0.55
High income (32) 1.51 2.08 2.35
Global total (140) 0.91 1 0.98
Source: Beintema, N. M and Stads G. (2008), calculated by the authors based on ASTI datasets, MOST (various years), OECD (various years), and Pardey et al. (2006); GDP deflators are from World Bank (2008c).
… with private sector research and development a major driving force
The private seed industry has set as a goal doubling corn, soybean and cotton yields in the US by
2030. Average corn yield increases would need to be three times the trend growth over the 1970 to 2007
period, or about 6 bushels per acre per year. This is clearly an ambitious goal. They have successfully
tested drought tolerant corn varieties for the US Western Great Plains. The drought tolerance is to boost
yields by 7-10% in a one-year drought. However, this technology for drought tolerance enables the corn
plant to withdraw a larger share of the moisture in the subsoil and to avoid shutting down physiological
processes under water and heat stress. However, if the drought lasts for multiple years, these varieties are
unlikely to have advantages beyond the first year. For many areas faced with extended periods of
drought - Australia, the US Great Plains, Africa, the current technology may have limited application. New
third generation corn varieties developed for the US which have insect tolerance for three below ground
pests, have great potential for improving root structures and root volume of the corn plants, which
indirectly improves drought tolerance, but also improves nutrient uptake and standability against strong
wind and rain, which makes harvesting easier.
Over the next decade, private sector developed and marketed GM technology for wheat and rice
varieties remains uncertain. Monsanto, for example, is planning to re-enter the market with new wheat
varieties over the next decade. Wheat production in the US and Canada is largely low-resource input
agriculture, and new varieties have been developed primarily by public sector research. Over the next
decade the trend rate of yield increases, which are modest, are expected. In Australia, researchers there are
attempting to develop perennial wheat varieties, including salt tolerant ones that will over time yield
significantly more grain than annual wheat varieties. There is also an attempt to introduce new perennial
plants, e.g., chicory, wild relatives of lucerne, cocksfoot, and birdsfoot trefoil, as a pasture crop for cattle
and sheep. The goal is to increase the carrying capacity of grazing lands.
Research is also underway that will increase soybean yields. Soybean germplasm has been identified
that will significantly increase soybean yields in conjunction with second generation herbicide tolerant
varieties. The target increase is a 6-10% yield increase compared to elite conventional soybean varieties.
Soybean and canola varieties in North American are over 90% GM herbicide tolerant (HT), and other
oilseed crops are likely to come under competitive pressure to incorporate GM for HT because of the
indistinguishable nature of the oils.
The potential for future benefits from GM potato varieties developed by the private sector are large
and likely to be realized by 2019 in OECD countries, Argentina, Brazil, China and perhaps Russia. New
GM varieties for late blight and Colorado potato beetle resistance would create valuable biological pest
resistance to all sizes of potato farms, including home plots/gardens. Also, new GM traits for product-

68
enhanced potato varieties will be released for sale to farmers in the near future. They are expected to
contain high levels of anti-oxidants and vitamin C and low acrylamide levels.
Water and climate change
Competition for water will increase…
Water scarcity is an increasing threat in many regions, as water pollution and consumptive use reduce
available sources, while populations grow and competition between different uses increases. In 2005, 35%
of the population of the OECD was living in areas characterized by severe water stress, compared with
44% worldwide (OECD, 2008b). At a global level, some 1.2 billion people live in basins where the
physical scarcity of water is absolute (human water use has surpassed sustainable limits) (CA, 2007). By
2025, 1.8 billion people will be living in countries or regions with absolute water scarcity, and two-thirds
of the world population could be under stress conditions, mostly in non-OECD countries.
Water withdrawals are projected to increase at a much higher pace in developing relative to OECD
countries, and for non-agricultural compared to agricultural uses. At the same time, global demand for food
and non-food agricultural products will continue to increase mainly as a result of the growth in incomes,
population and urbanisation. This will chiefly be driven by developing countries, but agricultural
production in many of these countries will be much more constrained by pressures on the natural resource
base, including land and water, notably in China and India.
Agricultural water withdrawals are dominated by developments in irrigation, as this is assumed to
account for 99% of agricultural water withdrawals (the remainder is accounted for by livestock), and, in
particular, by China and India as the volumes involved in these countries are so large. Both FAO (2003)
and CA (2007) project a substantial slowdown in expansion of area under irrigation compared to past
decades. Future gains in irrigated agriculture will come from improved performances of existing irrigation
in all irrigated regions of the world, in order to meet the projected global increase in agricultural
commodity production.
OECD agricultural exporting countries are expected to be a continuing and expanding source of food
and non-food agricultural commodity exports, mainly to Asian, African and Middle Eastern countries.
Such an expansion in OECD agricultural production and exports will necessitate improved productivity in
agriculture, both in rainfed and irrigated farming systems (see Box 3.2 for developments in agricultural
water use in the OECD area).

69
Box 3.2. Agricultural water resource use in OECD countries
Agriculture accounted for 44% of total water use in 2002-04, although for a number of countries the share is over 60%. Agricultural water use grew by 2% over the period between 1990-92 and 2002-04, mainly driven by an increase in the area irrigated, compared to a 1% increase for all water uses; however, for some countries in more recent years this trend is reversing with agricultural water use diminishing compared to growth in other water-consuming sectors. The area irrigated rose by 8% compared to a reduction of 3% in the total agricultural area between 1990-92 and 2002-04, although in a number of countries the area irrigated has been decreasing. Agriculture abstracts an increasing share of its water supplies from groundwater, and the sector’s share in total groundwater utilisation, although data are limited, was above 30% in one-third of OECD countries in 2002.
Some positive developments: Increases in physical water productivity by agriculture, through better
management and uptake of more efficient technologies, such as drip irrigation and adoption of water-saving farm practices, has contributed to higher farm production. Overall, the OECD average water application rate per hectare irrigated declined by 9% between 1990-92 and 2002-04, while in most cases the volume of agricultural production increased. The adoption of drip irrigation, low pressure irrigation systems, and other water-saving technologies, are becoming more widespread, while there are also some improvements in flood irrigation systems (e.g. laser levelling of
fields, neutron probes for soil moisture measurement, scheduling of irrigation to plant needs, and faster flow regimes) and irrigation canal networks (e.g. replacing earth with concrete linings for irrigation canals).Pollutant discharges from farmland into water bodies have been declining recently in many OECD regions, but information on the trends in pollutants from irrigated land is patchy.
Some negative developments: Groundwater use for irrigation is above recharge rates in some regions, which is also undermining the economic viability of farming in affected areas and leading to harmful environmental impacts, such as reduced flows of connected surface waters. Farming is a major and growing source of groundwater pollution in some countries, mainly from nutrients, pesticides and salinity. This is of concern where groundwater provides a major share of drinking water supplies for both human consumption and farming. Over-exploitation of surface water resources in certain areas is damaging ecosystems by reducing water flows below minimum flow levels in rivers, lakes and wetlands, which is also detrimental to recreational, fishing and cultural uses of these aquatic ecosystems.
Sources: OECD (2009b); OECD, (2009d); OECD (2008a).
… but will agricultural water use still increase or will it decline?
A substantial level of variation can be noted among projections for 2025 (Table 3.5). Projections of
global irrigation water withdrawals differ for a number of reasons including, for example: data sources
(note the differences in base year global irrigation withdrawals in Table 3.5); definitions (irrigation water
use defined as total withdrawals or crop evapotranspiration; underlying model structures and estimates of
irrigation water use efficiency, and assumptions made in developing models. This highlights the need to
improve the base water use data in projection models and refine model specifications.
According to the Comprehensive Assessment of Water Management in Agriculture (CA, 2007), water
withdrawal for irrigation is expected to increase by 13% between 2000 and 2050, with all the increase
taking place in developing countries. Preliminary projections prepared in the framework of FAO‟s
Agriculture - Towards 2030 and 2050 (FAO, forthcoming) confirm these projections, with a global
increase in agricultural water withdrawal between 2006 and 2050 estimated to be in the order of 10%.
However, OECD (2008a) together with a study by Alcamo (2007), predict a decline in the world‟s
agricultural water withdrawal while other comparable studies project an increase (Table 3.5). What is
certain is that projected increases in global production will necessitate further improvements in water
efficiency by agriculture to avoid additional stress on scarce water resources in many regions.

70
Table 3.5. A selection of global projections for irrigation water withdrawals
Source 2000 2025 Change 2000 - 2025
Cubic kilometres Cubic kilometres %
OECD (2008b) 2874 26311 –8
Shen et al (2008) 2658 3388 – 36652 +27 to +38
IWMI (2007) 2630 2800 – 34002 +6 to +29
Alcamo et al (2007) 2498 2341 – 23664 –5 to –6
Shiklomanov (2000) 24883 3097 24
Seckler et al (2000) 24693 2915 18
Alcamo et al (2000) 24653, 4
2292 – 25592 –7 to +4
IFPRI (2008) 2245 2491 – 25941, 2
+11 to +15
Notes:
1. Projection year is 2030 instead of 2025.
2. Projections show data for a range of different scenarios
3. Base year is 1995 instead of 2000 4. Projections include total agricultural water withdrawals (i.e. including water for livestock)
Sources: OECD, adapted from CA (2007) and other sources.
… and what will be the effect of climate change?
The direction of future policies to address the management of water resources in agriculture are
projected to be greatly influenced by climate change and climate variability. A survey of OECD countries
reveals the incidence and severity of flood and droughts has been increasing for the majority of countries,
although there is significant regional variation within and across OECD countries (OECD, forthcoming
(b)). Many of these countries also project that with climate change the incidence and severity of flood and
drought events may continue to increase. Climate change is expected to affect the function and operation of
existing water infrastructure (e.g. irrigation systems) as well as water management. Moreover, current
water management practices may not be robust enough to cope with the impacts of climate change on, for
example, water supply reliability, flood risk, agriculture and ecosystems. The Intergovernmental Panel on
Climate Change (IPCC) report on climate change and water (Bates et al 2008), concludes that
“observational records and climate projections provide abundant evidence that freshwater resources are
vulnerable and have the potential to be strongly impacted by climate change, with wide-ranging
consequences for human societies”. Climate change‟s main water-related impacts with regard to
agriculture are expected to be felt in terms of shifting and more variable hydrological regimes. Specifically
concerning agriculture, the IPCC projects that changes in water quantity and quality due to climate change
are expected to affect food availability, stability, access and utilisation (Table 3.6).
Climate change is expected to have a dual effect on irrigated agriculture. First, higher evaporative
demand as a function of overall temperature increases will translate into higher levels and intensities of
water withdrawals. Second the anticipated increase in volatility of rainfed production will put pressure on
irrigated areas to buffer the global production risk, The demand for more reliable agricultural production
systems at local and regional level is expected to increase and trends toward more precision agriculture
with more secure supply chains are already evident. However, despite the long experience in dealing with
climatic variability in many arid and semi-arid countries, institutional rigidity persists and some of the
most productive areas of contiguous irrigation are at risk from institutional failures as much as hydro-
environmental constraints.

71
Table 3.6. Summary of key 2007 IPCC 4th Assessment for Agriculture by warming increments
Global mean annual temperature change relative to the 1980-99 (oC) baseline
Sub-sector Region +1oC to +2
oC +2
oC to +3
oC +3
oC to +5
oC
Food crops Global 550 ppm CO2 (approx. equal to +2
oC) increases crop yield by
17%; this increase is offset by temperature increase of 2
o C
assuming no adaptation and 3o
C with adaptation
Mid- to high latitudes
Cold limitation alleviated for all crops
Adaptation increases all crops above baseline yield
Adaptation of maize and wheat increases yield 10% to 15%; rice yield no change; regional variation is high
Low latitudes Wheat and maize yields reduced below baseline levels; rice is unchanged
Adaptation maintains yields of all crops above baseline; yields drop below baseline for all crops without adaptation
Adaptation maintains yields of all crops above baseline; yield drops below baseline for all crops without adaptation
Adaptation of maize, wheat, rice, maintains yields at current levels
Maize and wheat yields reduced below baseline regardless of adaptation, but adaptation maintains rice yield at baseline levels
Pastures and Livestock
Temperate Cold limitation alleviated for pastures; seasonal increased frequency of heat stress for livestock
Moderate production loss in swine and confined cattle
Semi-arid No increase in net primary productivity; seasonal increased frequency of heat stress for livestock
Reduction in animal weight and pasture production, and increased heat stress for livestock
Tropical Strong production loss in swine and confined cattle
Fibre Temperate Yields decrease by 9%
Real Agricultural Prices and Trade
Global Real agricultural prices: Real agricultural prices: Real agricultural prices:
–10% to –30% –10 to +30% +10 to +40%
Cereal imports of developing countries to increase by 10-40%
conclusions are based on the quantitative projections across a range of emission scenarios used by the IPCC, while adaptation to climate change is not included in these estimations. For the full documentation on the methodologies and scenarios used by the IPCC, see reference below.
Source: Easterling et al 2007.

72
Many other reports from OECD government agencies have reinforced the IPCC view on climate
change (e.g. Australia, CSIRO, 2008; Canada, Lemmen, et al, 2007; EU, European Parliament, 2008 and
Portuguese Ministry of Environment, 2007; United States, USEPA, 2008). Overall these reports have
indicated that in terms of the linkages between climate change, water resources and agriculture, farming
systems are increasingly vulnerable to changes in water availability and temperature, as well the growing
incidence and severity of flood and drought events, and this will require high levels of adaptive responses.
In some situations climate change will also lead to beneficial opportunities for agriculture, such as an
increase in wheat yield potential in Northern Europe and overall crop yields in North America.
Summary and key messages
So can agriculture meet the rising demand for food? This Chapter only provides a brief overview of
some of the supply-side issues but it does suggest that production could be increased considerably. The
three critical supply factors examined - land, productivity and water - do not appear to pose insurmountable
barriers to increasing agricultural production. However, there are substantial risks that must be managed
and investments that must be undertaken to ensure future food security. Moreover, growing societal
concerns about the environment, intensive farming, use of GM technology, food quality, etc. will
increasingly play a role in shaping the structure of agricultural production over the medium-term.
Bringing more land into production will involve higher costs and prices
There is substantial additional land available for use in agriculture. Most of the land available resides
particularly in Sub-Saharan Africa (SSA) and South America. Relatively much less land is available in the
currently high output zones of North America and Europe. In terms of numbers, of the world‟s land surface
of some 13.2 billion hectares, about 4.3 billion are moderately to highly suitable as rainfed cropland. After
adjustment for currently cultivated cropland of about 1.4 billion hectares and for forested and
urban/protected areas, some 1560 million hectares remain available for cropland expansion.
Despite the availability of additional land, however, land use in agriculture has actually grown very
slowly for decades, falling in some regions and growing in others, primarily in developing countries. The
best rainfed cropland is already being used, and expansion to other areas would incur higher input costs on
average. Existing land is also being used with increased cropping intensity as the practice of multiple-
cropping has spread, particularly in areas where land is relatively scarce, such as in Asia. Infringement on
forested areas would obviously make considerably more land available for agriculture but would incur high
social and environmental costs. Existing land is being used more intensively in most regions, as the
practice of multiple cropping has spread.
A key unanswered question is how much of the available cultivable land would actually be brought
into production under given market conditions? Projected price levels may not be sufficient given the past
record of higher value use elsewhere. If additional lower productivity land is brought into production, it is
not clear what the potential additional output would be as this depends on the quality of the land in
question. Additional analysis of the potential supply response is needed to address these critical issues.
Research and development is an investment priority
It would be a mistake to conclude that crop yields for major cereal, oilseed, and vegetable crops in all
producing areas of OECD countries (or of the world) could match those of the most productive regions or
that the trend rate of increase in crop yields is the same everywhere. However, evidence suggests that the
rate of increase in crop yields has been constant over roughly half a century, and in particular, the rate of
increase is not declining as some studies claim. A similar story can be made for global livestock
production, at least based on available information up to 2001.

73
Public and private agricultural research capital and public agricultural extension can introduce new
technologies that can enhance agricultural productivity. If the growth in public agricultural research
expenditures is slowing, this may have predictions for future gains in agricultural productivity.
Huffman (2009) suggests that the peak impact of R&D investment today on agricultural productivity will
not occur for almost a decade. Thus, the foundations for new agricultural technologies of 2018 are being
laid today. If investments in research are not keeping pace relative to those of recent decades, then
agricultural TFP growth 10 years from now may be lower than observed today.
Reforming institutions and infrastructure is a necessary condition
If there is less technology internationally available from the world‟s leading national agricultural
research stations, the effect on the urbanised countries may not be great. The Eastern and Central European
countries have a long way to go to increase efficiency levels to match Northern Europe, so reorganisation
matters more than technical progress.27
In Latin America, countries such as Brazil and Argentina are
industrialising and commercialising agriculture and have their own research capacity that may well
increase yields as a result. They are almost certain to increase labour productivity as agriculture is
mechanised and TFP should be driven by labour productivity growth. For the upper end of the
transforming countries the same is true, as China and India have the research capacity to generate yield
growth and the withdrawal of labour from agriculture will raise labour productivity and TFP.
It is the smaller countries, with less public research capacity and less industrialisation that may be at
risk from productivity stagnation if they do not attract private technology providers. All TFP studies show
that Sub-Saharan Africa (SSA) lags behind, but that productivity has been improving since the mid 1980s.
The key seems to be institutions, incentives and better policy and infrastructure. It is efficiency change,
rather than new technology and SSA could have reasonable growth in TFP and yields on this basis alone.
A major difference between Asia and Africa is that in Asia, yield growth has been translated into increased
labour productivity and better incomes. In SSA, yield increases have improved labour productivity very
little, so there is a difficult question as to whether the relatively land abundant countries can follow a path
of labour saving technical change.
Water use management in agriculture has to improve
Agriculture currently accounts for 44% of total OECD area water use, while for many countries the
share is over 60%. Moreover, agriculture water use has been growing faster (2%) than for other water users
(1%) between 1990-92 and 2002-04 for the OECD area. Changing dietary habits towards meat and dairy
products in developing countries are key drivers impacting on water use by agriculture. In some regions,
the expansion of biofuel and bioenergy production could place additional stress on water resources. The
economic and environmental costs of agricultural water pollution are high, with the impacts of intensive
groundwater use in agriculture constraining agricultural production, resulting in a wide range of social and
environmental externalities.
The anticipated growth in world population to 9 billion by 2050 will involve a major expansion in
demand for water, primarily for industrial uses but also in response to maintain the integrity and economic
27 A recent FAO report noted that world average grain yields have risen by approximately 1.5% per year
since 1991, with average annual gains ranging from 0.6% in Western Europe to 3.7% in Brazil. During the
same period, both Ukraine and Kazakhstan experienced a decrease in grain yields while Russia remained
stable. By 2016, grain yields in Russia, Kazakhstan and Ukraine are likely to increase by 11% (compared
to 2004-2006 levels), due to better farm management, increased application of agricultural inputs and plant
genetics. Still, the report suggested there is a much larger yield increase potential in these three countries
considering soil quality, climatic conditions and current levels of productivity. (FAO, 2008).

74
value of increasing environmental services (e.g. wetlands). Some 44% of the world‟s population are
already living in areas under severe water stress, mostly in non-OECD countries, and this share is projected
to rise. Given that agriculture is the dominant water user in most countries, it will be crucial that
agriculture substantially improves its efficiency in the use of water in the future.
Agriculture must adapt to climate change
Climate change will only add to the risks of water stress as well as the incidence and severity of
floods. The IPPC suggests that with a 3-5oC increase in global mean annual temperatures, developing
countries may need to increase cereal imports by 10-40% while real agricultural prices could be 10-40%
higher. Asian, African and Middle Eastern countries will encounter the greatest pressure on water
resources, especially from the future growth in non-agricultural water use. It is likely that OECD countries
will continue to be a major source of farm exports to these countries, which in turn will necessitate OECD
countries to further improve their management of water resources.
Two unknowns that will influence the future course of agricultural development centre on energy and
the environment. If oil prices rise, agriculture will need to adjust to more expensive fertiliser, fuel and
transport, while competition between food and biofuels could also become more intense. Rising concerns
and government regulations over climate change, biodiversity and resource management will push
agriculture towards greater sustainability and lower environmental costs. It remains to be seen how energy
efficient technologies can be developed.
Investment in agriculture is necessary but insufficient for food security
Care also needs to be taken to the wider political, social and economic framework that would
stimulate overall development, raise incomes and reduce poverty. In many cases, poverty is the underlying
cause of food insecurity, and policies to improve the purchasing power of poor households through broad
based economic development are essential. Hundreds of millions of people are simply not earning enough
income to buy food that is otherwise available, be it at the high prices that prevailed in 2008 or at the much
lower ones of a decade ago.
Within an objective of overall economic growth, the development of economically viable rural areas
must be a primary policy objective to fight poverty and to manage migration flows from rural to urban
areas. Agriculture can and should contribute to economic growth and rural development in developing
countries along with other sectors that have high growth potential. Necessary conditions for agriculture to
be an engine of growth usually include gains in productivity, integration of local and international markets
and the creation of productive rural employment.
Fisheries sustainability is critical to overall food supplies
While not usually associated with the Outlook report, fisheries should be a consideration in any
discussion about food security. Fish proteins accounted for 15% of total world animal protein supplies in
2003. Global fish production has increased about 8 times in volume since 1950 to reach some 145 million
tonnes in 2006. Capture fisheries production has stabilized at 90-95 million tonnes over the past decade
while aquaculture production has increased significantly and now contributes 36% of the total fish
production. FAO and other organisations have projected total fish production to increase by 10-15% over
the next ten years (Box 3.3).
The future potential of the industry is linked to the ability of policy makers to provide a conducive
policy landscape for sustainable and profitable operations. In recent years, national and international policy
debates have focused on sustainable and responsible fisheries and stock rebuilding, recognising that major
fish stocks are either overexploited or at very high levels of exploitation.

75
Box 3.3. Fisheries and aquaculture: responding to the growing demand for food28
Fish is highly nutritious, rich in micronutrients, minerals, essential fatty acids and proteins and therefore significantly contributes, quality-wise, to overall protein intake. Global per capita fish consumption has increased over the past four decades, rising to 16.4 kg in 2006. Regionally, two-thirds of the total food fish supplies is consumed in Asia (in particular, China) while under 5% is consumed in Africa. Fish consumption is closely related to income, among other things, with per capita fish consumption in developing countries at 14.4 kg in 2006 compared with 23.9 kg in developed countries.
Some 37% of fish production was traded internationally in 2004. The quantity of fish and fish products exported in 2004 was 53 million tonnes, a 13% increase compared to 1994. Over the same period, the value of exports increased by 51%, reaching a record value of USD 71.5 billion in 2004. Fish and fish products represent one of the most important commodity groups in the exports from developing countries. The share of fishery product exports in total agricultural trade (including forestry products) increased from 5% in 1976 to 14% in 2004 for these countries.
The FAO estimated fish production in 2020 to reach 163 million tonnes with aquaculture accounting for 70 million tonnes or 43%, up from 32% in 2004 (see Table below). A 2003 study by the International Food Policy Research Institute (IFPRI) estimated that total fish production would reach 170 million tonnes by 2020 (capture fisheries 116 million; aquaculture 54 million tonnes) with global per capita fish consumption increasing to 17.1 kg. It could be expected that the growing share of aquaculture may progressively increase competition for feed destined to livestock production.
Fish production in 2004 and projections
2004 2010 2020 2020
Information source FAO statistics2 SOFIA 2002
3 SOFIA 2002
3 IFPRI study
4
Total capture 95 93 93 116
Aquaculture 45.5 53 70 54
Total production 140.5 146 163 170
Percentage for food 75% 82% 85% 77%
Note: All figures - other than percentages - are in million tonnes.
2Based on latest statistics of the FAO Fishery Information, Data and Statistics Unit.
3FAO. 2002. The State of World Fisheries and Aquaculture 2002. Rome.
4International Food Policy research Institute. 2003. Fish to 2020: supply and demand in changing global markets, by C. Delgado,
N. Wada, M. Rosegrant, S. Meijer and M. Ahmed. Washington, DC.
Source: FAO, SOFIA 2006.
Various measures and instruments have been developed to achieve sustainable fisheries such as the FAO Code of Conduct for Responsible Fisheries. The Code of Conduct emphasizes efforts to deter Illegal, Unregulated and Unreported (IUU) fishing. Regional high seas fisheries management organisations, as well as national governments, have been under pressure to establish more efficient systems to manage fishery resources in a sustainable and responsible manner and stop IUU fishing, through strengthening monitoring, control and surveillance activities. Various programmes have been established and implemented in light of the call of the World Summit on Sustainable Development in 2002 to rebuild fish stock to sustainable levels by 2015.
As many fisheries in OECD countries are characterised by excessive capacity (i.e. too many vessels and fishermen) decommissioning or buy-back programmes of fishing fleets, and accompanying policy measures, have been adopted as a means of restructuring national fishing fleets in many countries. In 2008, the OECD Council approved policy guidelines and best practices for the design and implementation of decommissioning schemes.
Many countries are investing heavily in the sector expecting that future demand for high quality
seafood will be met by farmed fish. However, aquaculture has economic, environmental and social
implications which may be poorly evaluated or inadequately addressed within current policy frameworks.
28 Statistics in this Box are from the FAO if not otherwise indicated. Fisheries statistics are difficult to acquire and should be interpreted
with caution.

76
For example, the availability of suitable sites for aquaculture is often cited as one of the constraining
factors in the aquaculture industry in many OECD countries.
REFERENCES
Agricultural Economics Association Annual Meeting, Providence, RI, July.
Alcamo, J., M. Florke and M. Marker (2007), “Future Long-Term Changes in Global Water Resources
Driven by Socio-economic and Climatic Changes”, Journal of Hydrological Sciences, Vol. 52,
No. 2, April, pp.247-275.
Alcamo, J., T. Heinrichs and T. Rosch (2000), World Water in 2025 - Global Modelling Scenarios for the
World Commission on Water for the 21st Century, World Water Series Report No. 2, Center for
Environmental Systems Research, University of Kassel, Germany.
Alejandro Nin, Simeon Ehui and Samuel Benin (2007), “Livestock Productivity in Developing Countries:
An Assessment” (Chapter 47) in Handbook of Agricultural Economics: Agricultural Development:
Farmers, Farm Production and Farm Markets, Vol. 3.
Antle, J.M. (2009), Economics of Carbon Sequestration in Agricultural Soils. Consultant report prepared
for the Trade and Agriculture Directorate, OECD.
Bates, B.C., Z.W. Kundzewicz, S. Wu and J.P. Palutikof, Eds. (2008), Climate Change and Water,
Technical Paper of the Intergovernmental Panel on Climate Change, IPCC Secretariat, Geneva, 210
pp, http://www.ipcc.ch/ipccreports/tp-climate-change-water.htm
Beintema, N. M. and G. Stads (2008), Measuring Agricultural Research Investments: A Revised Global
Picture, ASTI Background Note October 2008) http://www.asti.cgiar.org/pdf/global_revision.pdf.
Bot, A.J., Nachtergaele, F.O. and Young, A. (2000), Land resource potential and constraints at regional
and country levels. World Soil Resources Reports, 90.
Comprehensive Assessment of Water Management in Agriculture (CA) (2007), Water for Food, Water for
life: A Comprehensive Assessment of Water Management in Agriculture, International Water
Management Institute, Columbo, Sri Lanka, and Earthscan Publications, London.
http://www.iwmi.cgiar.org/Assessment.
CSIRO (2008), An Overview of Climate Change Adaptation in Australian Primary Industries: Impacts,
Options and Priorities, National Climate Change Research Strategy for Primary Industries, CSIRO,
Australia.
Easterling, W.E., P.K. Aggarwal, P. Batima, K.M. Brander, L. Erda, S.M. Howden, A. Kirilenko, J.
Morton, J.-F. Soussana, J. Schmidhuber and F.N. Tubiello (2007), Food, Fibre and Forest Products,
in Climate Change 2007: Impacts, Adaptation and Vulnerability. Contribution of Working Group II

77
to the Fourth Assessment Report of the Intergovernmental Panel on Climate Change, M.L. Parry,
O.F. Canziani, J.P. Palutikof, P.J. van der Linden and C.E. Hanson, Eds., Cambridge University
Press, Cambridge, UK, 273-313, http://www.ipcc.ch/ipccreports/ar4-wg2.htm.
European Parliament (2008), Climate Change-Induced Water Stress and Its Impact on Natural and
Managed Ecosystems, Policy Department, Economic and Scientific Policy, European Parliament,
Brussels, Belgium.
Evenson, R.E. (2001), Economic Impacts of Agricultural Research and Extension. In G.L. Gardner and G.
Rausser, Eds., /Handbook of Agricultural Economics/, Vol. 1A (Agricultural Production).
New York, NY: Elsevier, pp. 574-628.
Evenson, R.E. and D. Gollin (2003), Crop Variety Improvement and Its Effect on Productivity: The Impact
of International Agricultural Research. Cambridge, MA: CABI.
Falck-Zepeda, J.B., G. Traxler and R.G. Nelson (2000), Recent Creation and Distribution from
Biotechnology Innovations: The Case of Bt Cotton and Herbicide-Tolerant Soybeans in 1997.
Agribusiness/ 16:21-32.
FAO (2009), World Agriculture: towards 2030-2050 An FAO Perspective. Rome, Italy.
FAO (2008), “Grain Production and Export Potential in CIS Countries”, a report prepared for an EBRD
seminar, Fighting Food Inflation through Sustainable Investment, 10 March, 2008, London.
FAO (2003), World Agriculture: towards 2015/2030 An FAO Perspective. Earthscan Publications,
London.
FAO and UNEP, (1999), The future of our land. Facing the challenges. Available at:
http://www.fao.org/DOCREP/004/X3810E/X3810E00.HTM
Fischer, G., van Velthuizen, H., Shah, M., and Nachtergaele, F.O., (2002), Global Agro-ecological
Assessment for Agriculture in the 21st Century: Methodology and Results. Research Report, IIASA,
Laxenburg, Austria, FAO, Rome, Italy, 119 pp. + CD-ROM.
Global Forests Resources Assessment, (2000), http:edcsns17.cr.usgs.gov/glcc/fao/index.html
Griliches, Z. (1960), Hybrid Corn and the Economics of Innovation. Science 132:275-280.
Huffman and Evenson (2006), Science for Agriculture: A Long-Term Perspective. Ames, IA: Blackwell
Publishing.
Huffman (2009), Technology and Innovation in World Agriculture: Prospects for 2010-2010. Iowa State
University, Department of Economics Working Paper #09077, April.
Huntington, T. G. (2006), Evidence for Intensification of the Global Water Cycle: Review and Synthesis,
Journal of Hydrology, Vol. 319, pp.83-95.
IFPRI (2008).
IWMI (2007), Water for food water for life: A comprehensive assessment of water management in
agriculture, International Water Management Institute, Columbo, Sri Lanka,
http://www.iwmi.cgiar.org/Assessment.

78
Irwin, S., D. Sanders and R. Merrin (2009), Devil or Angel? The Role of Speculation in the Recent
Commodity Price Boom (and Bust). Invited paper Southern Agricultural Economics Association
Meetings, Atlanta, Ga., 2009.
LandScan (2002), World Population. Oak Ridge National Laboratory, SEDAC, CIESIN, Columbia
University, USA. Available at http://www.ornl.gov/sci/landscan
Lemmen, D.S., Warren, F.J., Lacroix, J., and Bush, E. (editors), 2007: From Impacts to Adaptation:
Canada in a Changing Climate 2007, Government of Canada, Ottawa, Ontario, Canada,
http://adaptation.nrcan.gc.ca/assess/2007/toc_e.php
Lewandrowski, J., Peters, M., Jones, C., House, R., Sperow, M., Eve, M. and Paustian, K. (2004),
Economics of Sequestering Carbon in the U.S. Agricultural Sector. USDA/ERS, Technical Bulletin,
Number 1909.
Ludena, C.E., Hertel, T.W., Preckel, P.V., Foster, K., Nin Pratt, A. (2005). Disaggregate productivity
growth in livestock: A directional Malmquist Index approach, Presented at the American Beintema,
N. and Stads, G. (2008), Measuring Agricultural R&D investments: A revised global picture, IFPRI.
Washington, DC.
McCarl, B.A. and Schneider, U.A. (2000), U.S. Agriculture‟s Role in a Greenhouse Gas Emission
Mitigation World: An Economic Perspective. Review of Agricultural Economics, 22(1): 134-159.
OECD (2009a), Agricultural Policies in Emerging Economies: Monitoring and Evaluation 2008.
OECD (2009b), Managing water for all: An OECD perspective on pricing and financing,
www.oecd.org/water
OECD (2009c), Agricultural Policies in OECD Countries: Monitoring and Evaluation Report 2009.
OECD (2009d), Sustainable Management of Water Resources in Agriculture
OECD (2008a), Environmental Performance of OECD Agriculture Since 1990,
www.oecd.org/tad/env/indicators
OECD (2008b), OECD Environmental Outlook to 2030, Paris, France, www.oecd.org/env
Paarlberg, Robert. Starved for Science: How Biotechnology is Being Kept Out of Africa. Cambridge, MA:
Harvard University Press, 2008.
Piesse J and Thirtle C, (2009) Prospects for agricultural productivity growth: Will there be a slowdown in
developing countries? King‟s College London,
http://kcl.ac.uk/schools/sspp/mgmt/research/papers/international/piesse-productivity.html
Portuguese Ministry of Environment (2007), Water scarcity and drought: A priority of the Portuguese
Presidency, Lisbon, Portugal.
Seckler, D., D. Molden, U. Amarasinghe and C. de Fraiture (2000), Water issues for 2025: A Research
Perspective, IWMI, Columbo, Sri Lanka,

79
Shen, Y., T. Oki, N. Utsumi, S. Kanae and N. Hanasaki (2008), “Projection of future world water resources
under SRES scenarios: water withdrawal”, Journal of Hydrological Sciences, Vol. 53, No. 1,
February, pp.11-33.
Shiklomanov, I. (2000), “Appraisal and assessment of world water resources”, Water International,
Vol.25, No.1, pp.11-32.
Thirtle, C. and Piesse, J. (2008), Factor Endowments, Biased Technological Change, Wages and Poverty
Reduction: Can Genetically Modified Crops Bring a Green Revolution to SSA? International
Journal of Biotechnology, 10:2/3, 184-206.
Thirtle, C., Townsend, R., Amadi, J., Lusigi, A. and van Zyl, J. (1998), The Rate of Return on
Expenditures of the South African Agricultural Research Council, Agrekon, 37:4, 621-31.
Townsend, R and Thirtle, C (2001), Is Livestock Research Unproductive? Separating Health Maintenance
from Improvement Research, Agricultural Economics 25:3, 177-89.
USEPA (2008), The Effects of Climate Change on Agriculture, Land Resources, Water Resources, and
Biodiversity in the United States, US Environmental Protection Agency, Washington, D.C., United
States.
World Bank (2008), Agriculture for development, World Development Report, Washington, DC.
World Database on Protected Areas (2005), Available
at: http://maps.geog.umd.edu/WDPA/WDPA_info/English/DB_DataLayers.html.

Statistical Tables

1 ECONOMIC ASSUMPTIONS
Average
Calendar year (a) 2006-08est. 2009 2010 2011 2012 2013 2014 2015 2016 2017 2018
REAL GDP (b)
Base 3.1 1.7 2.7 3.2 3.2 3.0 2.7 2.7 2.7 2.7 2.7
Australia (c) Lower GDP-slow recovery % 3.1 0.5 2.4 3.2 3.2 3.0 2.7 2.7 2.7 2.7 2.7
Lower GDP-faster recovery 3.1 0.5 2.4 3.7 3.5 3.3 2.9 2.8 2.8 2.8 2.7
Base 2.1 -0.5 2.1 2.8 2.5 2.5 2.4 2.4 2.4 2.4 2.4
Canada Lower GDP-slow recovery % 2.1 -3.0 0.3 2.8 2.5 2.5 2.4 2.4 2.4 2.4 2.4
Lower GDP-faster recovery 2.1 -3.0 0.3 4.2 3.6 3.3 3.0 2.7 2.6 2.5 2.5
Base 2.3 -0.5 1.2 2.4 2.4 2.3 2.2 2.2 2.2 2.2 2.2
European Union Lower GDP-slow recovery % 2.3 -4.1 -0.3 2.4 2.4 2.3 2.2 2.2 2.2 2.2 2.2
Lower GDP-faster recovery 2.3 -4.1 -0.3 4.0 3.6 3.2 2.9 2.7 2.5 2.4 2.4
Base 1.7 -0.1 0.6 1.2 1.2 1.1 1.1 1.1 1.1 1.1 1.1
Japan Lower GDP-slow recovery % 1.7 -6.6 -0.5 1.2 1.2 1.1 1.1 1.1 1.1 1.1 1.1
Lower GDP-faster recovery 1.7 -6.6 -0.5 3.6 3.0 2.5 2.0 1.7 1.5 1.3 1.3
Base 4.8 2.7 4.2 4.9 4.8 4.7 4.5 4.4 4.4 4.4 4.4
Korea (c) Lower GDP-slow recovery % 4.8 -4.0 3.2 4.9 4.8 4.7 4.5 4.4 4.4 4.4 4.4
Lower GDP-faster recovery 4.8 -4.0 3.2 7.4 6.7 6.0 5.5 5.0 4.8 4.6 4.6
Base 3.3 0.4 1.8 3.4 3.7 3.7 3.7 3.8 3.8 3.8 3.8
Mexico (c) Lower GDP-slow recovery % 3.3 -2.0 1.8 3.4 3.7 3.7 3.7 3.8 3.8 3.8 3.8
Lower GDP-faster recovery 3.3 -2.0 1.8 4.1 4.3 4.2 4.0 4.0 3.9 3.8 3.8
Base 1.6 -0.4 1.9 2.4 3.0 2.9 2.9 2.8 2.8 2.8 2.8
New Zealand (c) Lower GDP-slow recovery % 1.6 -1.2 1.2 2.4 3.0 2.9 2.9 2.8 2.8 2.8 2.8
Lower GDP-faster recovery 1.6 -1.2 1.2 2.9 3.4 3.2 3.0 2.9 2.9 2.9 2.9
Base 3.0 1.3 1.6 3.8 3.9 3.8 3.7 3.6 3.6 3.6 3.6
Norway Lower GDP-slow recovery % 3.0 -2.1 0.5 3.8 3.9 3.8 3.7 3.6 3.6 3.6 3.6
Lower GDP-faster recovery 3.0 -2.1 0.5 5.3 5.0 4.6 4.2 3.9 3.8 3.7 3.7
Base 2.9 -0.2 1.6 2.6 2.6 2.5 2.4 2.4 2.4 2.4 2.4
Switzerland Lower GDP-slow recovery % 2.9 -1.8 1.5 2.6 2.6 2.5 2.4 2.4 2.4 2.4 2.4
Lower GDP-faster recovery 2.9 -1.8 1.5 3.2 3.0 2.8 2.6 2.5 2.5 2.4 2.4
Base 4.8 1.7 4.9 4.7 4.6 4.6 4.6 4.6 4.6 4.6 4.6
Turkey Lower GDP-slow recovery % 4.8 -2.0 1.5 4.7 4.6 4.6 4.6 4.6 4.6 4.6 4.6
Lower GDP-faster recovery 4.8 -2.0 1.5 6.9 6.3 5.8 5.4 5.1 4.9 4.8 4.7
Base 2.1 -0.9 1.6 2.9 3.2 3.2 3.2 3.2 3.2 3.2 3.2
United States Lower GDP-slow recovery % 2.1 -4.0 0.0 2.9 3.2 3.2 3.2 3.2 3.2 3.2 3.2
Lower GDP-faster recovery 2.1 -4.0 0.0 4.4 4.4 4.0 3.8 3.6 3.5 3.4 3.3
Base 7.9 1.5 4.0 3.5 3.6 3.4 3.4 3.3 3.3 3.2 3.1
Argentina Lower GDP-slow recovery % 7.9 -1.8 1.9 3.5 3.6 3.4 3.4 3.3 3.3 3.2 3.1
Lower GDP-faster recovery 7.9 -1.8 1.9 5.3 4.9 4.4 4.1 3.7 3.5 3.3 3.2
Base 4.8 2.8 4.6 3.8 3.5 3.5 3.5 3.4 3.4 3.4 3.4
Brazil Lower GDP-slow recovery % 4.8 -0.3 3.8 3.8 3.5 3.5 3.5 3.4 3.4 3.4 3.4
Lower GDP-faster recovery 4.8 -0.3 3.8 5.0 4.5 4.2 3.9 3.7 3.6 3.5 3.5
Base 11.0 7.5 8.5 7.7 7.7 7.5 7.5 7.5 7.5 7.5 7.5
China Lower GDP-slow recovery % 11.0 6.3 8.5 7.7 7.7 7.5 7.5 7.5 7.5 7.5 7.5
Lower GDP-faster recovery 11.0 6.3 8.5 8.0 7.9 7.7 7.6 7.6 7.6 7.5 7.5
Base 8.3 5.8 7.7 7.0 6.9 6.9 6.8 6.8 6.8 6.8 6.8
India Lower GDP-slow recovery % 8.3 4.0 7.0 7.0 6.9 6.9 6.8 6.8 6.8 6.8 6.8
Lower GDP-faster recovery 8.3 4.0 7.0 7.8 7.5 7.3 7.1 7.0 6.9 6.9 6.9
Base 7.2 3.0 5.0 4.3 4.5 4.9 4.8 4.7 4.6 4.5 4.5
Russia Lower GDP-slow recovery % 7.2 -5.6 0.7 4.3 4.5 4.9 4.8 4.7 4.6 4.5 4.5
Lower GDP-faster recovery 7.2 -5.6 0.7 8.6 7.7 7.2 6.4 5.7 5.2 4.9 4.8
Base 4.6 2.8 4.4 4.1 4.2 4.3 4.3 4.3 4.3 4.3 4.3
South Africa Lower GDP-slow recovery % 4.6 1.6 3.4 4.1 4.2 4.3 4.3 4.3 4.3 4.3 4.3
Lower GDP-faster recovery 4.6 1.6 3.4 4.7 4.7 4.7 4.6 4.5 4.4 4.4 4.4
Base 2.3 -0.4 1.6 2.7 2.8 2.7 2.7 2.7 2.7 2.7 2.7
OECD (d) (e) Lower GDP-slow recovery % 2.3 -4.0 0.1 2.7 2.8 2.7 2.7 2.7 2.7 2.7 2.7
Lower GDP-faster recovery 2.3 -4.0 0.1 4.3 4.0 3.6 3.3 3.1 3.0 2.9 2.9
For notes, see end of the table. Source: OECD and FAO Secretariats.

1 ECONOMIC ASSUMPTIONS (cont.d)
2008est
Calendar year (a) (million) 2009 2010 2011 2012 2013 2014 2015 2016 2017 2018
POPULATION
Australia % 1.0 1.0 1.0 1.0 1.0 1.0 0.9 0.9 0.9 0.9 0.9
Canada % 0.9 0.9 0.9 0.9 0.8 0.8 0.8 0.8 0.8 0.8 0.8
European Union % 0.2 0.2 0.1 0.1 0.1 0.1 0.1 0.1 0.1 0.0 0.0
Japan % 0.0 -0.1 -0.1 -0.1 -0.1 -0.2 -0.2 -0.2 -0.3 -0.3 -0.3
Korea % 0.3 0.3 0.3 0.2 0.2 0.2 0.2 0.1 0.1 0.1 0.0
Mexico % 1.2 1.2 1.1 1.1 1.0 1.0 0.9 0.9 0.9 0.8 0.8
New Zealand % 0.9 0.8 0.8 0.8 0.8 0.8 0.8 0.8 0.7 0.7 0.7
Norway % 0.6 0.6 0.6 0.6 0.6 0.6 0.6 0.6 0.6 0.6 0.6
Switzerland % 0.4 0.4 0.4 0.4 0.3 0.3 0.3 0.3 0.4 0.4 0.4
Turkey % 1.3 1.2 1.2 1.2 1.1 1.1 1.1 1.0 1.0 1.0 0.9
United States % 1.0 1.0 0.9 0.9 0.9 0.9 0.9 0.9 0.8 0.8 0.8
Argentina % 1.0 1.0 1.0 1.0 1.0 0.9 0.9 0.9 0.9 0.9 0.8
Brazil % 1.3 1.2 1.2 1.2 1.1 1.1 1.1 1.0 1.0 1.0 0.9
China % 0.6 0.6 0.6 0.6 0.6 0.5 0.5 0.5 0.5 0.5 0.5
India % 1.5 1.4 1.4 1.4 1.3 1.3 1.3 1.3 1.2 1.2 1.2
Russia % -0.5 -0.5 -0.5 -0.5 -0.5 -0.6 -0.6 -0.6 -0.6 -0.6 -0.6
South Africa % 0.5 0.5 0.4 0.4 0.4 0.4 0.4 0.4 0.4 0.4 0.4
OECD (c) % 0.6 0.5 0.5 0.5 0.5 0.5 0.4 0.4 0.4 0.4 0.4
World % 1.2 1.2 1.1 1.1 1.1 1.1 1.1 1.1 1.0 1.0 1.0
Average
Calendar year (a) 2006-08est. 2009 2010 2011 2012 2013 2014 2015 2016 2017 2018
PCE Deflator (b)
Australia % 3.1 3.6 2.4 2.4 2.5 2.5 2.5 2.5 2.5 2.5 2.5
Canada % 1.5 0.8 0.9 1.6 2.0 2.0 2.0 2.0 2.0 2.0 2.0
European Union % 2.5 1.7 1.4 1.7 1.9 1.9 1.9 1.9 1.9 1.9 1.9
Japan % -0.1 -0.2 -0.3 0.1 0.5 0.7 1.0 1.0 1.0 1.0 1.0
Korea % 3.3 3.9 2.9 3.0 3.0 3.0 3.0 3.0 3.0 3.0 3.0
Mexico % 4.4 5.2 3.9 3.2 3.2 3.2 3.2 3.2 3.2 3.2 3.2
New Zealand % 2.7 2.3 1.1 1.7 2.0 2.0 2.0 2.0 2.0 2.0 2.0
Norway % 2.1 2.7 1.8 2.0 2.0 2.0 2.0 2.0 2.0 2.0 2.0
Switzerland % 1.3 0.6 1.1 1.0 1.0 1.0 1.0 1.0 1.0 1.0 1.0
Turkey % 10.0 9.0 7.0 6.6 6.6 6.6 6.6 6.0 6.0 6.0 6.0
United States % 3.0 1.2 1.3 1.4 1.6 1.7 1.9 1.9 1.9 1.9 1.9
Argentina % 9.3 10.8 11.0 5.0 4.9 4.7 4.6 4.5 4.4 4.3 4.1
Brazil % 4.2 4.8 4.8 4.0 4.6 4.2 4.3 4.3 4.3 4.3 4.3
China % 4.5 5.5 4.5 4.2 4.0 3.9 3.8 3.7 3.6 3.4 3.3
India % 6.9 6.1 5.0 4.1 4.1 4.1 4.1 4.5 4.5 4.5 4.5
Russia % 11.9 11.0 8.0 9.2 8.1 7.7 7.3 6.9 6.6 6.3 5.9
South Africa % 7.2 9.1 6.7 7.7 7.7 7.7 7.6 6.0 6.0 6.0 6.0
OECD (d,e) % 2.9 2.1 1.8 1.9 2.2 2.3 2.4 2.3 2.3 2.4 2.4
EXCHANGE RATE
Australia AUD/USD 1.2 1.2 1.2 1.2 1.2 1.2 1.3 1.3 1.3 1.3 1.3
Canada CAD/USD 1.1 1.0 1.0 1.0 1.1 1.1 1.1 1.1 1.1 1.1 1.1
European Union EUR/USD 0.7 0.7 0.7 0.7 0.7 0.7 0.7 0.7 0.7 0.7 0.7
Japan JPY/USD 112.5 103.0 101.1 99.6 98.4 97.2 96.2 95.2 94.2 93.2 92.2
Korea '000 KRW/USD 1.0 1.1 1.1 1.1 1.1 1.1 1.1 1.1 1.1 1.1 1.1
Mexico MXN/USD 11.0 11.4 11.6 11.8 12.0 12.1 12.3 12.4 12.6 12.7 12.9
New Zealand NZD/USD 1.4 1.4 1.4 1.4 1.4 1.5 1.5 1.5 1.5 1.5 1.5
Argentina ARS/USD 3.1 3.3 3.5 3.6 3.7 3.8 3.8 3.9 4.0 4.1 4.1
Brazil BRL/USD 2.0 2.0 2.1 2.1 2.2 2.2 2.2 2.3 2.3 2.4 2.4
China CNY/USD 7.5 6.7 6.3 6.3 6.2 6.2 6.2 6.2 6.2 6.2 6.2
India INR/USD 43.3 47.2 46.2 47.7 49.1 50.6 51.9 53.3 54.7 56.2 57.7
Russia RUR/USD 27.1 31.1 32.6 33.1 33.2 33.1 32.9 32.6 32.3 31.8 31.2
South Africa ZAR/USD 7.3 9.0 9.2 9.6 10.0 10.5 10.9 11.4 11.8 12.3 12.8
WORLD OIL PRICE
Brent crude oil price (f) USD/barrel 79.0 43.3 54.5 60.7 61.9 63.1 64.3 65.5 66.7 67.9 69.1
Source: OECD and FAO Secretariats.
a) For OECD member countries, historical data for population, real GDP, private consumption expenditure deflator and exchange rate were obtained from the OECD Economic Outlook No. 84,
December 2008. For non-member economies, historical macroeconomic data were obtained from the World Bank, November 2008. Assumptions for the projection period draw on the recent medium term
macroeconomic projections of the OECD Economics Department, projections of the World Bank, responses to a questionnaire sent to member country agricultural experts and for population, projections
from the United Nations World Population Prospects Database, 2006 Revision (medium variant). Data for the European Union are for the euro area aggregates. b) Annual per cent change. The price
index used is the private consumption expenditure deflator. c) Not available from ECO department. of OECD. Using World Bank short term update (31-03-2009). d) Excludes Iceland. e) Annual weighted
average real GDP and CPI growth rates in OECD countries are based on weights using 1995 GDP and purchasing power parities (PPPs). (f) Short term update for crude oil price from the Energy
Information Administration.

2 WORLD PRICES (a)
Average
06/07-08/09est. 09/10 10/11 11/12 12/13 13/14 14/15 15/16 16/17 17/18 18/19
WHEAT
Base 269.1 211.3 197.7 206.1 215.1 218.1 216.8 217.3 218.9 219.1 219.6
Lower GDP-slow recovery Price (b) USD/t 269.1 208.0 190.7 199.4 211.3 215.2 212.3 211.7 213.8 214.8 215.2
Lower GDP-faster recovery 269.1 208.0 190.7 201.0 215.1 219.7 216.4 215.9 218.4 219.7 220.1
COARSE GRAINS
Base 184.9 164.1 160.4 166.4 172.5 170.9 172.1 173.9 168.0 165.1 165.1
Lower GDP-slow recovery Price (c) USD/t 184.9 158.7 149.8 158.2 168.1 165.6 165.0 166.8 161.7 159.0 158.9
Lower GDP-faster recovery 184.9 158.7 149.8 160.7 173.6 171.2 170.4 172.8 168.1 165.3 165.3
RICE
Base 504.7 417.5 345.6 347.7 378.5 412.9 415.3 408.0 409.8 409.5 411.9
Lower GDP-slow recovery Price (d) USD/t 504.7 412.6 335.9 337.3 371.8 409.1 409.8 399.1 400.2 402.1 406.1
Lower GDP-faster recovery 504.7 412.6 335.8 339.5 377.5 416.2 416.0 405.3 407.3 410.1 414.1
OILSEEDS
Base 440.7 334.4 344.5 357.6 385.5 375.9 373.0 383.8 392.5 391.0 398.2
Lower GDP-slow recovery Price (e) USD/t 440.7 326.9 333.3 348.6 379.3 370.3 365.8 375.6 384.8 383.9 390.9
Lower GDP-faster recovery 440.7 326.9 333.4 352.1 386.2 377.1 372.2 382.3 392.1 391.3 398.4
OILSEED MEALS
Base 329.9 234.0 235.6 244.9 259.2 253.3 251.2 259.7 265.0 263.2 270.1
Lower GDP-slow recovery Price (f) USD/t 329.9 228.4 226.7 237.3 253.7 247.8 244.5 252.2 257.8 256.5 263.0
Lower GDP-faster recovery 329.9 228.4 226.7 239.6 258.7 253.0 249.7 258.1 264.4 263.2 270.0
VEGETABLE OILS
Base 948.7 844.2 863.6 869.5 901.1 900.4 895.7 905.9 923.1 931.6 941.4
Lower GDP-slow recovery Price (g) USD/t 948.7 827.7 840.0 848.0 883.2 884.7 880.0 889.1 906.3 915.6 925.6
Lower GDP-faster recovery 948.7 827.7 840.5 856.6 898.3 901.9 896.9 905.8 923.3 932.7 942.8
SUGAR
Base 278.1 297.5 305.6 312.7 317.0 310.1 301.3 303.3 302.4 303.8 307.6
Lower GDP-slow recovery Price, raw sugar (h) USD/t 278.1 288.8 290.6 296.5 302.4 297.7 290.1 292.3 291.6 293.2 296.6
Lower GDP-faster recovery 278.1 288.8 290.6 300.8 310.8 308.6 301.7 304.2 303.1 304.4 308.0
BEEF AND VEAL
Base 319.4 323.3 299.3 299.5 318.3 322.4 332.5 330.7 328.0 324.8 325.0
Lower GDP-slow recovery Price, USA (i) USD/100 kg dw 319.4 292.5 271.3 282.0 303.6 311.0 323.3 321.6 318.9 316.1 316.2
Lower GDP-faster recovery 319.4 292.5 271.3 294.0 321.3 329.3 341.9 338.3 333.1 328.3 327.4
PIG MEAT
Base 145.1 146.9 142.1 147.7 160.9 157.6 155.3 151.3 154.1 157.8 163.2
Lower GDP-slow recovery Price, USA (j) USD/100 kg dw 145.1 133.9 136.3 149.6 158.4 154.2 153.8 149.1 150.7 155.0 160.9
Lower GDP-faster recovery 145.1 133.9 136.3 155.8 163.6 156.3 156.8 152.2 153.3 157.7 163.9
POULTRY MEAT
Base 162.0 179.0 165.7 162.4 167.5 168.6 177.7 177.8 175.8 172.2 174.1
Lower GDP-slow recovery Price, USA (k) USD/100 kg rtc 162.0 172.8 158.6 157.5 163.7 164.8 173.4 173.4 171.5 168.2 170.0
Lower GDP-faster recovery 162.0 172.8 158.6 159.9 167.5 168.8 177.7 177.8 175.9 172.5 174.3
SHEEP MEAT
Base 332.9 324.1 319.8 329.2 338.2 340.7 349.9 355.7 361.5 369.0 374.8
Lower GDP-slow recovery Price, New Zealand (l) NZD/100 kg dw 332.9 324.1 319.8 329.2 338.2 340.7 349.9 355.7 361.5 369.0 374.8
Lower GDP-faster recovery 332.9 324.1 319.8 329.2 338.2 340.7 349.9 355.7 361.5 369.0 374.8
BUTTER
Base 278.7 182.8 181.0 201.9 223.1 233.5 237.3 244.1 247.2 249.8 254.9
Lower GDP-slow recovery Price (m) USD/100 kg 278.7 158.3 149.3 169.5 189.1 201.0 206.2 210.6 211.3 213.2 218.5
Lower GDP-faster recovery 278.7 158.3 149.3 183.9 214.6 233.3 238.7 244.3 247.2 250.1 256.0
CHEESE
Base 379.5 269.8 248.5 266.3 283.3 291.0 299.6 304.3 309.5 313.5 317.8
Lower GDP-slow recovery Price (n) USD/100 kg 379.5 252.1 229.5 248.4 266.5 275.8 284.2 288.4 293.5 297.2 301.5
Lower GDP-faster recovery 379.5 252.1 229.5 256.5 279.4 290.5 300.2 304.9 310.0 314.0 318.5
SKIM MILK POWDER
Base 328.5 193.0 191.5 218.4 238.6 244.1 250.8 250.4 253.4 254.9 256.5
Lower GDP-slow recovery Price (o) USD/100 kg 328.5 184.7 181.3 212.8 231.9 238.1 244.3 244.1 246.9 248.9 250.3
Lower GDP-faster recovery 328.5 184.7 181.3 215.4 236.4 243.5 250.4 250.5 253.5 255.4 256.9
WHOLE MILK POWDER
Base 342.2 190.3 196.2 219.7 234.5 246.4 256.0 258.4 262.0 265.0 268.6
Lower GDP-slow recovery Price (p) USD/100 kg 342.2 182.0 185.8 210.1 226.0 238.3 248.2 250.5 253.9 256.8 260.4
Lower GDP-faster recovery 342.2 182.0 185.8 214.2 233.4 247.1 257.3 259.6 262.9 265.7 269.3
ETHANOL
Base 44.9 37.9 40.8 43.4 43.3 43.5 43.8 44.5 43.7 44.4 45.7
Lower GDP-slow recovery Price (s) USD/hl 44.9 37.4 39.7 42.6 43.0 43.1 43.3 44.0 43.5 44.1 45.4
Lower GDP-faster recovery 44.9 37.4 39.7 42.9 43.5 43.6 43.8 44.5 43.8 44.4 45.8
BIODIESEL
Base 113.4 117.4 118.1 119.9 125.9 125.1 125.9 128.7 132.4 134.8 137.1
Lower GDP-slow recovery Price (t) USD/hl 113.4 116.8 115.9 117.4 124.1 123.6 124.4 127.1 130.8 133.3 135.6
Lower GDP-faster recovery 113.4 116.8 115.9 118.3 125.6 125.2 126.0 128.6 132.4 134.9 137.2
est.: estimate. Source: OECD and FAO Secretariats.
j) Barrows and gilts, No. 1-3, 230-250 lb lw, Iowa/South Minnesota - lw to dw conversion factor 0.74. k) Wholesale weighted average broiler price 12 cities. l) Lamb schedule price, all grade average. The
price of sheep meat is an exogenous variable and does therefore not respond to any shocks. m) f.o.b. export price, butter, 82% butterfat, Oceania. n) f.o.b. export price, cheddar cheese, 39% moisture,
Oceania. o) f.o.b. export price, non-fat dry milk, 1.25% butterfat,Oceania. p) f.o.b. export price, WMP 26% butterfat, Oceania. q) Edible dry whey, Wisconsin, plant. r) Export price, New Zealand. s) Brazil,
Sao Paulo (ex-distillery). t) Producer price Germany net of biodiesel tariff.
a) This table is a compilation of price information presented in the detailed commodity tables further in this annex. Prices for crops are on marketing year basis and those for meat and dairy products on
calendar year basis (e.g. 07/08 is calendar year 2007). b) No.2 hard red winter wheat, ordinary protein, USA f.o.b. Gulf Ports (June/May), less EEP payments where applicable. c) No.2 yellow corn, US
f.o.b. Gulf Ports (September/August). d) Milled, 100%, grade b, Nominal Price Quote, NPQ, f.o.b. Bangkok (August/July). e) Weighted average oilseed price, European port. f) Weighted average meal
price, European port. g) Weighted average price of oilseed oils and palm oil, European port. h) Raw sugar world price, ICE Inc. No 11, f.o.b., bulk spot price (October/September). i) Choice steers, 1100-
1300 lb lw, Nebraska - lw to dw conversion factor 0.63.

3 WORLD TRADE PROJECTIONS
Average
IMPORTS 2006-08est. 2009-11 2012-2017 2018 2009-11 2012-2017 2018 2009-11 2012-2017 2018
World Trade kt 113 737 118 820 126 131 133 876 118 514 125 619 133 438 118 522 126 029 133 967
Wheat OECD kt 24 283 25 115 25 935 26 450 25 160 25 986 26 496 25 160 25 945 26 441
Developing kt 90 811 95 388 102 069 109 376 95 049 101 525 108 915 95 060 101 957 109 467
Least Developed Countries kt 10 855 11 391 11 884 12 557 11 332 11 769 12 447 11 332 11 856 12 568
World Trade kt 119 253 117 929 121 227 127 960 117 785 121 433 128 336 117 782 121 211 128 185
Coarse Grains OECD kt 57 916 53 915 53 127 53 067 52 823 51 976 52 052 52 922 53 020 53 225
Developing kt 79 448 83 947 88 948 96 600 84 753 90 267 98 000 84 687 89 122 96 726
Least Developed Countries kt 2 138 2 436 4 247 6 056 2 479 4 901 6 143 2 475 4 253 6 050
World Trade kt 31 807 34 238 36 769 38 692 33 976 36 326 38 215 34 018 36 672 38 657
Rice OECD kt 4 786 4 866 5 271 5 560 4 863 5 263 5 551 4 864 5 268 5 555
Developing kt 26 808 29 011 31 226 32 867 28 787 30 836 32 447 28 823 31 142 32 838
Least Developed Countries kt 6 988 7 458 7 346 7 707 7 405 7 268 7 628 7 414 7 331 7 703
World Trade kt 85 162 92 835 99 676 104 557 92 417 98 808 103 615 92 430 99 404 104 522
Oilseeds OECD kt 34 930 35 066 35 052 35 614 34 665 34 431 34 928 34 695 34 859 35 575
Developing kt 57 554 65 204 72 320 77 106 65 181 72 015 76 787 65 166 72 222 77 108
Least Developed Countries kt 281 357 415 466 360 417 467 360 416 466
World Trade kt 58 524 66 775 72 869 80 320 67 110 73 273 80 771 67 092 72 927 80 342
Oilseed Meals OECD kt 33 444 36 994 36 312 36 046 37 268 36 468 36 197 37 256 36 314 36 049
Developing kt 25 666 30 715 37 387 44 943 30 629 37 516 45 118 30 642 37 431 44 960
Least Developed Countries kt 325 402 515 614 403 511 611 403 514 614
World Trade kt 48 633 54 142 64 325 73 127 54 117 64 038 72 754 54 122 64 210 73 092
Vegetable Oils OECD kt 12 891 16 078 20 512 24 164 16 024 20 341 23 969 16 051 20 478 24 158
Developing kt 35 129 37 355 42 899 47 870 37 356 42 766 47 675 37 342 42 818 47 841
Least Developed Countries kt 3 912 4 320 5 200 5 979 4 293 5 157 5 924 4 297 5 193 5 977
World Trade kt 47 440 54 050 59 742 63 792 53 714 59 188 63 199 53 766 59 636 63 795
Sugar OECD kt 10 927 12 296 13 290 13 764 12 254 13 253 13 707 12 260 13 294 13 763
Developing kt 31 885 36 480 41 968 46 345 36 767 42 139 46 478 36 736 41 977 46 350
Least Developed Countries kt 5 955 6 870 8 478 10 062 6 891 8 485 10 051 6 889 8 488 10 063
World Trade kt 7 112 7 516 8 684 9 449 7 261 8 372 9 168 7 262 8 571 9 453
Beef (a) OECD kt 3 278 3 219 3 679 4 060 3 087 3 444 3 804 3 094 3 610 4 053
Developing kt 3 470 3 901 4 754 5 333 3 999 4 732 5 260 3 986 4 710 5 314
Least Developed Countries kt 152 214 301 336 216 304 337 216 301 334
Pigmeat (a) World Trade kt 5 356 5 370 5 891 6 424 5 082 5 462 5 863 5 108 5 777 6 411
OECD kt 2 876 3 119 3 501 3 822 2 859 3 186 3 487 2 884 3 430 3 811
Developing kt 2 199 2 351 2 760 3 212 2 235 2 584 2 916 2 242 2 707 3 204
Least Developed Countries kt 73 73 104 114 73 105 114 73 104 114
World Trade kt 9 310 10 148 11 258 12 312 10 343 11 428 12 572 10 320 11 263 12 308
Poultry OECD kt 2 291 2 452 2 710 2 784 2 737 3 089 3 227 2 718 2 798 2 788
Developing kt 5 701 6 649 7 661 8 827 6 798 7 765 8 817 6 791 7 667 8 819
Least Developed Countries kt 499 541 757 960 533 737 927 534 754 961
World Trade kt 905 876 893 917 844 838 862 846 875 914
Butter OECD kt 152 143 149 153 143 149 153 143 149 153
Developing kt 445 471 498 529 539 571 609 528 504 525
Least Developed Countries kt 11 18 18 22 22 21 28 21 18 22
World Trade kt 1 549 1 658 1 880 2 109 1 585 1 729 1 942 1 592 1 882 2 142
Cheese OECD kt 719 699 778 839 690 767 828 691 776 839
Developing kt 612 687 796 882 759 833 914 749 834 915
Least Developed Countries kt 13 32 36 44 35 38 48 34 36 44
World Trade kt 1 687 1 897 2 207 2 460 1 899 2 189 2 438 1 898 2 195 2 456
Whole Milk Powder OECD kt 96 97 97 97 98 98 98 98 97 97
Developing kt 1 585 1 790 2 100 2 353 1 811 2 104 2 354 1 808 2 093 2 349
Least Developed Countries kt 175 230 295 353 230 292 349 230 294 353
World Trade kt 1 134 1 214 1 290 1 362 1 198 1 257 1 327 1 201 1 286 1 365
Skim Milk Powder OECD kt 193 194 212 227 196 213 228 196 212 227
Developing kt 1 004 1 097 1 182 1 258 1 103 1 178 1 253 1 104 1 183 1 261
Least Developed Countries kt 41 43 46 51 43 46 50 43 46 51
For notes, see end of the table. Source: OECD and FAO Secretariats.
Base Lower GDP-slow recovery Lower GDP-faster recovery
Average Average Average

3 WORLD TRADE PROJECTIONS (cont.)
EXPORTS
Average
2006-08est. 2009-11 2012-2017 2018 2009-11 2012-2017 2018 2009-11 2012-2017 2018
Wheat OECD kt 71 792 78 471 83 569 86 145 76 770 81 490 83 873 76 935 83 210 86 159
Developing kt 17 802 17 004 18 665 20 279 17 010 18 670 20 281 17 010 18 672 20 297
Least Developed Countries kt 84 32 27 29 32 27 29 32 27 29
OECD kt 80 257 71 264 72 637 78 516 72 326 73 663 79 794 72 223 72 762 78 636
Coarse Grains Developing kt 29 932 30 027 31 213 31 615 29 228 30 709 30 861 29 325 31 187 31 731
Least Developed Countries kt 2 500 2 861 3 330 4 360 2 603 3 812 4 342 2 624 3 286 4 348
OECD kt 3 713 4 002 4 336 4 583 4 092 4 437 4 676 4 087 4 357 4 580
Rice Developing kt 27 368 29 551 31 731 33 402 29 300 31 284 32 928 29 318 31 623 33 371
Least Developed Countries kt 1 473 1 624 2 517 3 364 1 570 2 417 3 240 1 574 2 490 3 348
OECD kt 40 712 45 782 43 598 43 027 45 732 44 240 43 710 45 768 43 852 42 989
Oilseeds Developing kt 41 051 42 882 50 980 55 659 42 537 49 534 54 098 42 523 50 472 55 661
Least Developed Countries kt 18 18 18 18 18 18 18 18 18 18
OECD kt 10 855 14 118 16 929 19 974 14 793 17 294 20 334 14 743 16 913 19 970
Oilseeds Meals Developing kt 50 715 55 242 58 277 62 477 54 915 58 292 62 506 54 949 58 336 62 493
Least Developed Countries kt 19 19 19 20 19 19 20 19 19 20
OECD kt 3 143 3 373 3 581 4 578 3 452 3 583 4 571 3 444 3 568 4 583
Vegetable Oils Developing kt 42 788 47 137 56 348 63 528 46 934 55 932 63 030 46 956 56 220 63 487
Least Developed Countries kt 87 90 96 101 90 96 101 90 96 101
OECD kt 6 322 6 164 6 460 6 428 6 138 6 461 6 414 6 149 6 473 6 425
Sugar Developing kt 42 459 48 639 54 625 58 562 48 352 54 117 58 033 48 391 54 537 58 582
Least Developed Countries kt 2 171 2 351 2 536 2 764 2 441 2 641 2 865 2 435 2 550 2 759
OECD kt 3 354 3 800 4 026 4 280 3 748 3 846 4 079 3 742 3 945 4 266
Beef (a) Developing kt 4 167 4 466 5 569 6 180 4 299 5 457 6 120 4 300 5 535 6 197
Least Developed Countries kt 2 3 3 3 3 3 3 3 3 3
OECD kt 4 374 4 224 4 518 4 706 3 966 4 165 4 327 3 987 4 427 4 687
Pigmeat (a) Developing kt 1 284 1 294 1 555 1 834 1 244 1 457 1 630 1 252 1 531 1 840
Least Developed Countries kt 0 1 0 0 1 0 0 1 0 0
OECD kt 4 121 4 252 4 432 4 578 4 137 4 345 4 494 4 152 4 431 4 584
Poultry Developing kt 5 258 5 986 7 013 7 972 6 295 7 260 8 306 6 257 7 018 7 963
Least Developed Countries kt 6 7 8 10 8 8 10 8 8 10
OECD kt 698 663 663 680 648 624 638 650 650 677
Butter Developing kt 88 95 108 114 80 96 106 81 105 113
Least Developed Countries kt 0 1 2 1 1 1 1 1 2 1
OECD kt 1 258 1 310 1 398 1 451 1 291 1 329 1 374 1 292 1 379 1 445
Cheese Developing kt 326 358 462 529 304 387 440 311 488 564
Least Developed Countries kt 0 0 1 1 0 1 1 0 1 1
OECD kt 1 191 1 271 1 370 1 458 1 268 1 355 1 445 1 268 1 360 1 455
Whole Milk Powder Developing kt 592 719 927 1 090 722 923 1 080 722 925 1 088
Least Developed Countries kt 7 10 15 19 10 15 19 10 15 19
OECD kt 976 920 967 1 023 906 937 992 909 961 1 023
Skim Milk Powder Developing kt 128 151 182 202 146 175 194 147 183 206
Least Developed Countries kt 1 1 0 0 1 0 0 1 0 0
Biofuel (b) Ethanol World Trade Mil l 4 892 4 989 8 818 13 077 4 660 8 708 13 093 4 697 8 820 13 059
Biodiesel World Trade Mil l 2 096 4 034 5 533 6 711 4 051 5 538 6 726 4 051 5 537 6 717
a) Excludes trade of live animals. b) Sum of all positive net trade positions Source: OECD and FAO Secretariats.
est.: estimate.
Lower GDP-slow recovery Lower GDP-faster recovery
Average Average Average
Base

4 WORLD CEREAL PROJECTIONS
Average
Crop year (a) 2006-08est. 2009-11 2012-2017 2018 2009-11 2012-2017 2018 2009-11 2012-2017 2018
WHEAT
OECD (b)
Production mt 253.1 271.6 286.2 296.1 269.7 283.7 293.7 269.8 285.7 296.3
Consumption mt 207.3 217.1 226.8 234.6 217.1 226.5 234.3 217.1 226.6 234.5
Closing stocks mt 49.8 64.7 71.5 77.5 64.7 71.0 77.1 64.7 71.2 77.5
Non-OECD
Production mt 375.8 390.0 410.9 426.3 388.9 409.4 424.8 389.0 410.6 426.3
Consumption mt 421.4 442.9 467.1 484.3 440.3 463.5 480.4 440.6 466.3 484.1
Closing stocks mt 124.1 130.9 135.9 140.2 131.1 135.5 139.9 131.0 135.6 140.2
WORLD (c)
Production mt 628.9 661.6 697.1 722.4 658.7 693.2 718.5 658.8 696.3 722.7
Consumption mt 628.8 660.0 694.0 718.9 657.4 690.0 714.7 657.7 693.0 718.6
Closing stocks mt 174.0 195.5 207.4 217.7 195.8 206.5 217.0 195.7 206.9 217.8
Price (d) USD/t 269.1 205.0 217.5 219.6 199.3 213.2 215.2 199.9 217.5 220.1
COARSE GRAINS
OECD (b)
Production mt 545.1 592.5 638.8 668.4 589.4 633.8 663.3 589.5 637.4 668.5
Consumption mt 528.9 579.1 616.8 638.4 573.7 609.8 630.9 574.2 615.3 638.3
Closing stocks mt 97.6 96.8 96.4 111.1 98.7 96.3 111.0 98.4 95.7 110.8
Non-OECD
Production mt 511.0 542.0 585.3 615.2 538.6 580.2 609.8 538.7 584.2 615.3
Consumption mt 522.7 559.5 600.9 637.6 558.6 597.9 634.4 558.7 599.8 637.5
Closing stocks mt 145.6 153.1 169.3 181.8 153.2 168.7 181.3 153.0 169.0 181.8
WORLD (c)
Production mt 1056.1 1134.4 1224.1 1283.6 1128.0 1214.0 1273.1 1128.2 1221.6 1283.7
Consumption mt 1051.6 1138.7 1217.7 1276.0 1132.3 1207.7 1265.3 1132.9 1215.1 1275.8
Closing stocks mt 243.2 249.9 265.7 292.9 251.8 265.0 292.3 251.5 264.7 292.6
Price (e) USD/t 184.9 163.6 170.4 165.1 155.6 164.4 158.9 156.4 170.2 165.3
RICE
OECD (b)
Production mt 21.4 22.4 22.5 22.7 22.5 22.6 22.8 22.5 22.6 22.7
Consumption mt 22.8 23.0 23.3 23.6 23.1 23.3 23.6 23.1 23.3 23.6
Closing stocks mt 5.7 6.2 6.8 7.4 6.1 6.8 7.4 6.1 6.9 7.5
Non-OECD
Production mt 420.7 439.0 456.4 471.6 437.7 454.5 469.6 437.8 456.0 471.6
Consumption mt 417.6 437.2 455.5 471.2 435.9 453.6 469.1 436.1 455.1 471.0
Closing stocks mt 85.9 96.2 98.6 100.5 96.4 98.3 100.1 96.3 98.4 100.3
WORLD (c)
Production mt 442.1 461.4 478.9 494.4 460.1 477.1 492.3 460.2 478.5 494.3
Consumption mt 440.4 460.2 478.8 494.8 459.1 477.0 492.7 459.2 478.4 494.6
Closing stocks mt 91.6 102.4 105.5 107.9 102.5 105.1 107.5 102.4 105.3 107.9
Price (f) USD/t 504.7 370.3 405.7 411.9 361.9 398.7 406.1 362.6 405.4 414.1
est.: estimate. Source: OECD and FAO Secretariats.
a) Beginning crop marketing year - see Glossary of Terms for definitions. b) Excludes Iceland but includes the 8 EU members that are not members of the OECD. c) Source of historic
data is USDA. d) No.2 hard red winter wheat, ordinary protein, USA f.o.b. Gulf Ports (June/May), less EEP payments where applicable. e) No.2 yellow corn, US f.o.b. Gulf Ports
(September/August). f) Milled, 100%, grade b, Nominal Price Quote, NPQ, f.o.b. Bangkok (August/July)
Base Lower GDP-slow recovery Lower GDP-faster recovery
Average Average Average

5 WORLD OILSEED PROJECTIONS
Average
2006-08est. 2009-11 2012-2017 2018 2009-112012-2017 2018 2009-11 2012-2017 2018
OILSEEDS (Crop Year (a))
OECD (b)
Production mt 123.1 136.4 142.9 151.0 135.9 142.3 150.4 135.9 142.8 151.0
Consumption mt 119.6 125.2 134.4 143.7 124.3 132.5 141.7 124.4 133.8 143.7
crush mt 109.3 114.5 123.6 132.7 113.6 121.9 130.9 113.7 123.1 132.7
Closing stocks mt 16.8 15.6 15.2 15.2 15.9 15.1 15.2 15.8 15.1 15.2
Non-OECD
Production mt 184.5 207.4 234.8 255.8 206.3 232.5 253.4 206.3 234.1 255.8
Consumption mt 191.0 219.2 244.3 264.2 218.5 243.3 263.2 218.6 244.1 264.2
crush mt 164.2 187.4 210.6 229.1 186.7 209.7 228.2 186.8 210.5 229.2
Closing stocks mt 12.3 12.8 12.2 12.1 12.9 12.2 12.1 12.9 12.2 12.1
WORLD (c)
Production mt 307.6 343.8 377.7 406.8 342.1 374.8 403.8 342.2 377.0 406.8
Consumption mt 310.6 344.5 378.6 407.9 342.8 375.8 404.9 342.9 377.9 407.9
crush mt 273.5 301.9 334.2 361.9 300.4 331.6 359.1 300.5 333.6 361.9
Closing stocks mt 29.1 28.4 27.4 27.3 28.7 27.3 27.3 28.7 27.2 27.3
Price (d) USD/t 440.7 345.5 383.6 398.2 336.3 376.6 390.9 337.4 383.5 398.4
OILSEED MEALS (marketing year)
OECD (b)
Production mt 78.3 81.3 87.7 94.2 80.7 86.5 92.9 80.8 87.3 94.1
Consumption mt 100.9 104.1 107.1 110.2 103.2 105.7 108.7 103.3 106.7 110.2
Closing stocks mt 1.3 1.2 1.2 1.2 1.2 1.2 1.2 1.2 1.2 1.2
Non-OECD
Production mt 118.0 134.6 151.4 164.7 134.1 150.7 164.0 134.2 151.2 164.7
Consumption mt 89.8 106.3 126.5 143.2 106.2 126.1 142.7 106.2 126.4 143.2
Closing stocks mt 5.3 5.2 5.2 5.2 5.2 5.1 5.2 5.2 5.1 5.2
WORLD (c)
Production mt 196.3 215.9 239.0 258.9 214.8 237.2 256.9 214.9 238.5 258.8
Consumption mt 190.6 210.4 233.6 253.4 209.4 231.7 251.5 209.5 233.1 253.4
Closing stocks mt 6.5 6.5 6.4 6.4 6.5 6.4 6.4 6.5 6.4 6.4
Price (e) USD/t 329.9 238.2 258.6 270.1 230.8 252.1 263.0 231.5 257.8 270.0
VEGETABLE OILS (marketing year)
OECD (b)
Production mt 27.9 30.1 32.8 35.3 29.8 32.3 34.8 29.8 32.6 35.3
Consumption mt 37.8 42.8 49.7 54.9 42.4 49.0 54.2 42.5 49.5 54.9
Closing stocks mt 2.6 2.3 2.5 2.5 2.3 2.4 2.4 2.3 2.4 2.5
Non-OECD
Production mt 79.7 91.5 107.3 119.7 91.1 106.7 118.9 91.1 107.1 119.6
Consumption mt 70.0 79.0 90.7 100.4 78.8 90.2 99.8 78.8 90.5 100.3
Closing stocks mt 6.8 7.6 8.4 9.1 7.6 8.4 9.1 7.6 8.4 9.1
WORLD (c)
Production mt 107.6 121.6 140.1 155.0 120.9 138.9 153.7 121.0 139.8 154.9
of which palm oil mt 42.1 48.3 58.6 66.5 48.1 58.1 65.9 48.1 58.4 66.4
Consumption mt 107.7 121.9 140.4 155.3 121.3 139.2 154.0 121.3 140.0 155.2
Closing stocks mt 9.4 10.0 10.9 11.6 10.0 10.8 11.5 10.0 10.9 11.6
Oil price (f) USD/t 948.7 859.1 909.6 941.4 838.5 893.2 925.6 841.6 909.8 942.8
est: estimation. Source: OECD and FAO Secretariats.
a) Beginning crop marketing year - see Glossary of Terms for definitions. b) Excludes Iceland but includes the 8 EU members that are not members of the OECD. c)
Source of historic data is USDA. d) Weighted average oilseed price, European port. e) Weighted average meal price, European port. f) Weighted average price of
oilseed oils and palm oil, European port.
Base Lower GDP-slow recovery Lower GDP-faster recovery
Average Average Average

6 WORLD SUGAR PROJECTIONS (in raw sugar equivalent)
Average
Crop year (a) 2006-08est. 2009-11 2012-2017 2018 2009-11 2012-2017 2018 2009-11 2012-2017 2018
OECD
Production kt rse 35 954 34 515 35 033 35 303 34 295 34 936 35 266 34 317 35 035 35 327
Consumption kt rse 40 483 40 637 41 413 41 959 40 063 40 870 41 456 40 126 41 331 41 981
Closing stocks kt rse 18 833 18 247 17 327 17 176 18 829 19 359 20 344 18 790 18 395 18 310
NON-OECD
Production kt rse 130 408 139 996 152 875 166 231 138 339 150 676 163 770 138 513 152 466 166 215
Consumption kt rse 119 010 130 005 144 482 156 452 128 326 142 416 154 070 128 547 144 103 156 410
Closing stocks kt rse 59 033 61 051 65 261 64 218 61 269 65 027 63 733 61 227 65 105 64 107
WORLD
Production kt rse 166 362 174 511 187 908 201 534 172 634 185 612 199 035 172 830 187 500 201 542
Consumption kt rse 159 492 170 642 185 895 198 411 168 389 183 286 195 526 168 673 185 434 198 391
Closing stocks kt rse 77 866 79 298 82 588 81 394 80 098 84 386 84 077 80 016 83 500 82 416
Price, raw sugar (b) USD/t 278.1 305.3 306.3 307.6 292.0 294.6 296.6 293.4 305.5 308.0
Price, white sugar (c) USD/t 333.0 338.1 353.6 371.5 325.2 342.1 360.7 326.5 352.8 371.9
est: estimate. Source: OECD and FAO Secretariats.
a) Beginning crop marketing year - see the Glossary of Terms for definitions. b) Raw sugar world price, New York No 11, f.o.b. stowed Caribbean port (including Brazil), bulk
spot price, October/September. c) Raw sugar world price, ICE Inc. No 11, f.o.b., bulk spot price (October/September).
Base Lower GDP-slow recovery Lower GDP-faster recovery
Average Average Average
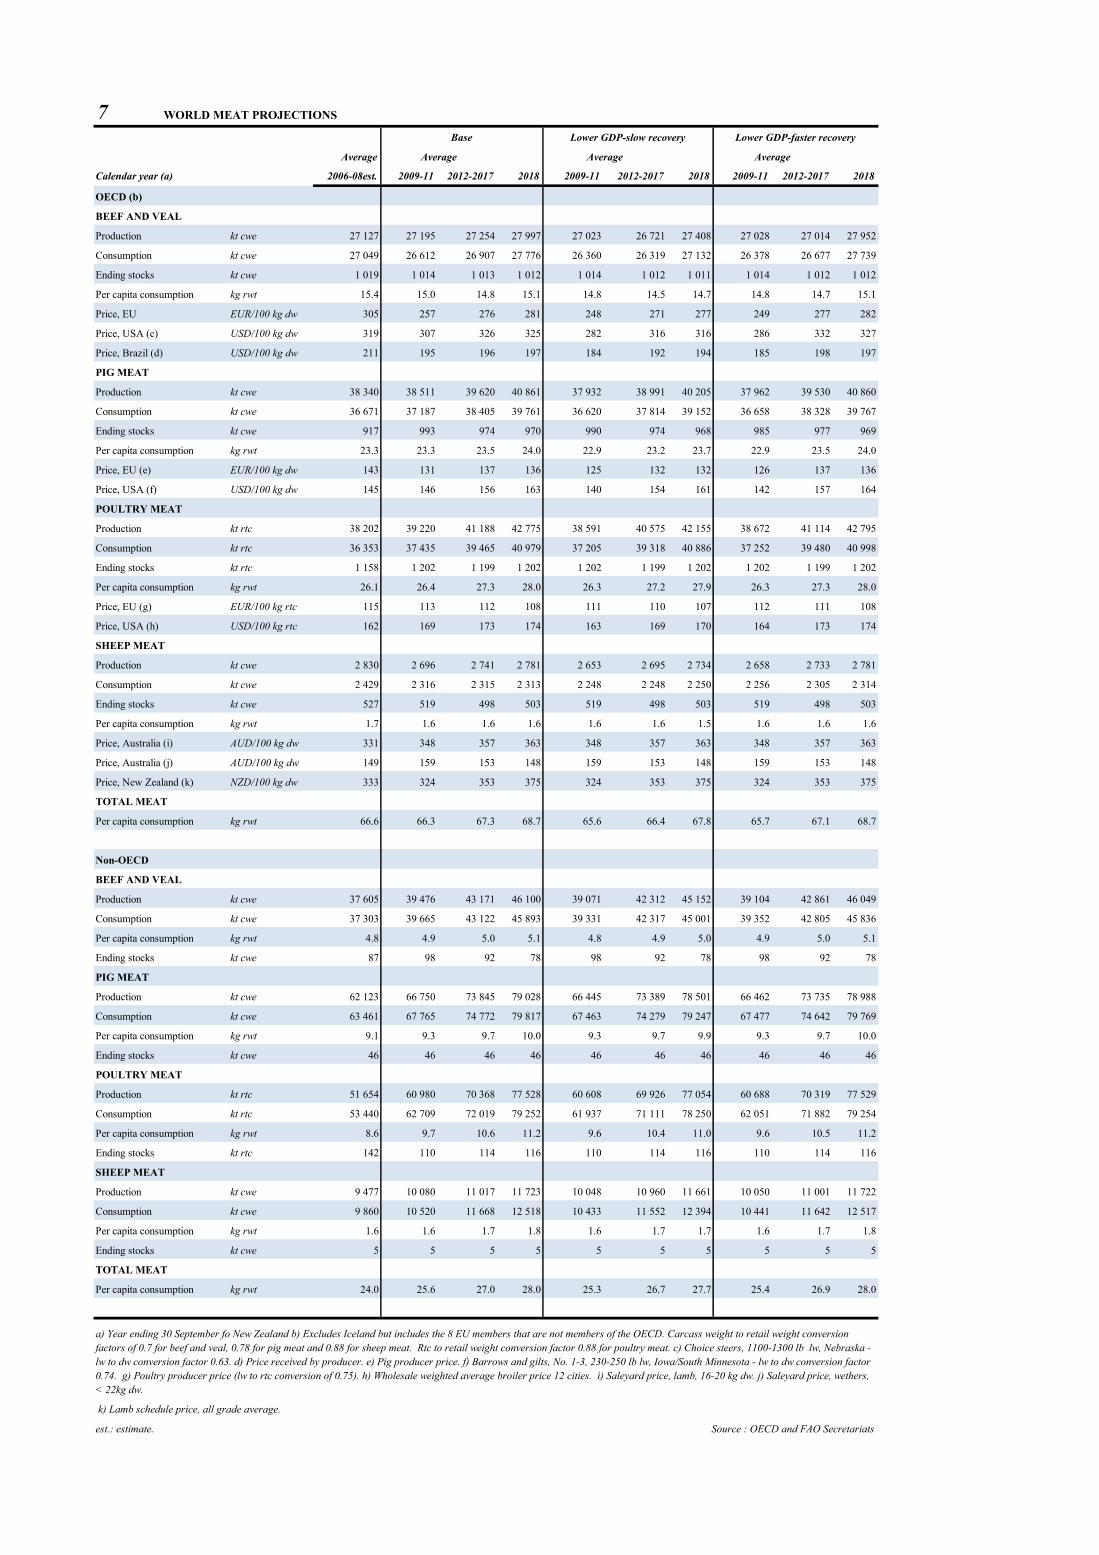
7 WORLD MEAT PROJECTIONS
Average
Calendar year (a) 2006-08est. 2009-11 2012-2017 2018 2009-11 2012-2017 2018 2009-11 2012-2017 2018
OECD (b)
BEEF AND VEAL
Production kt cwe 27 127 27 195 27 254 27 997 27 023 26 721 27 408 27 028 27 014 27 952
Consumption kt cwe 27 049 26 612 26 907 27 776 26 360 26 319 27 132 26 378 26 677 27 739
Ending stocks kt cwe 1 019 1 014 1 013 1 012 1 014 1 012 1 011 1 014 1 012 1 012
Per capita consumption kg rwt 15.4 15.0 14.8 15.1 14.8 14.5 14.7 14.8 14.7 15.1
Price, EU EUR/100 kg dw 305 257 276 281 248 271 277 249 277 282
Price, USA (c) USD/100 kg dw 319 307 326 325 282 316 316 286 332 327
Price, Brazil (d) USD/100 kg dw 211 195 196 197 184 192 194 185 198 197
PIG MEAT
Production kt cwe 38 340 38 511 39 620 40 861 37 932 38 991 40 205 37 962 39 530 40 860
Consumption kt cwe 36 671 37 187 38 405 39 761 36 620 37 814 39 152 36 658 38 328 39 767
Ending stocks kt cwe 917 993 974 970 990 974 968 985 977 969
Per capita consumption kg rwt 23.3 23.3 23.5 24.0 22.9 23.2 23.7 22.9 23.5 24.0
Price, EU (e) EUR/100 kg dw 143 131 137 136 125 132 132 126 137 136
Price, USA (f) USD/100 kg dw 145 146 156 163 140 154 161 142 157 164
POULTRY MEAT
Production kt rtc 38 202 39 220 41 188 42 775 38 591 40 575 42 155 38 672 41 114 42 795
Consumption kt rtc 36 353 37 435 39 465 40 979 37 205 39 318 40 886 37 252 39 480 40 998
Ending stocks kt rtc 1 158 1 202 1 199 1 202 1 202 1 199 1 202 1 202 1 199 1 202
Per capita consumption kg rwt 26.1 26.4 27.3 28.0 26.3 27.2 27.9 26.3 27.3 28.0
Price, EU (g) EUR/100 kg rtc 115 113 112 108 111 110 107 112 111 108
Price, USA (h) USD/100 kg rtc 162 169 173 174 163 169 170 164 173 174
SHEEP MEAT
Production kt cwe 2 830 2 696 2 741 2 781 2 653 2 695 2 734 2 658 2 733 2 781
Consumption kt cwe 2 429 2 316 2 315 2 313 2 248 2 248 2 250 2 256 2 305 2 314
Ending stocks kt cwe 527 519 498 503 519 498 503 519 498 503
Per capita consumption kg rwt 1.7 1.6 1.6 1.6 1.6 1.6 1.5 1.6 1.6 1.6
Price, Australia (i) AUD/100 kg dw 331 348 357 363 348 357 363 348 357 363
Price, Australia (j) AUD/100 kg dw 149 159 153 148 159 153 148 159 153 148
Price, New Zealand (k) NZD/100 kg dw 333 324 353 375 324 353 375 324 353 375
TOTAL MEAT
Per capita consumption kg rwt 66.6 66.3 67.3 68.7 65.6 66.4 67.8 65.7 67.1 68.7
Non-OECD
BEEF AND VEAL
Production kt cwe 37 605 39 476 43 171 46 100 39 071 42 312 45 152 39 104 42 861 46 049
Consumption kt cwe 37 303 39 665 43 122 45 893 39 331 42 317 45 001 39 352 42 805 45 836
Per capita consumption kg rwt 4.8 4.9 5.0 5.1 4.8 4.9 5.0 4.9 5.0 5.1
Ending stocks kt cwe 87 98 92 78 98 92 78 98 92 78
PIG MEAT
Production kt cwe 62 123 66 750 73 845 79 028 66 445 73 389 78 501 66 462 73 735 78 988
Consumption kt cwe 63 461 67 765 74 772 79 817 67 463 74 279 79 247 67 477 74 642 79 769
Per capita consumption kg rwt 9.1 9.3 9.7 10.0 9.3 9.7 9.9 9.3 9.7 10.0
Ending stocks kt cwe 46 46 46 46 46 46 46 46 46 46
POULTRY MEAT
Production kt rtc 51 654 60 980 70 368 77 528 60 608 69 926 77 054 60 688 70 319 77 529
Consumption kt rtc 53 440 62 709 72 019 79 252 61 937 71 111 78 250 62 051 71 882 79 254
Per capita consumption kg rwt 8.6 9.7 10.6 11.2 9.6 10.4 11.0 9.6 10.5 11.2
Ending stocks kt rtc 142 110 114 116 110 114 116 110 114 116
SHEEP MEAT
Production kt cwe 9 477 10 080 11 017 11 723 10 048 10 960 11 661 10 050 11 001 11 722
Consumption kt cwe 9 860 10 520 11 668 12 518 10 433 11 552 12 394 10 441 11 642 12 517
Per capita consumption kg rwt 1.6 1.6 1.7 1.8 1.6 1.7 1.7 1.6 1.7 1.8
Ending stocks kt cwe 5 5 5 5 5 5 5 5 5 5
TOTAL MEAT
Per capita consumption kg rwt 24.0 25.6 27.0 28.0 25.3 26.7 27.7 25.4 26.9 28.0
est.: estimate. Source : OECD and FAO Secretariats
a) Year ending 30 September fo New Zealand b) Excludes Iceland but includes the 8 EU members that are not members of the OECD. Carcass weight to retail weight conversion
factors of 0.7 for beef and veal, 0.78 for pig meat and 0.88 for sheep meat. Rtc to retail weight conversion factor 0.88 for poultry meat. c) Choice steers, 1100-1300 lb lw, Nebraska -
lw to dw conversion factor 0.63. d) Price received by producer. e) Pig producer price. f) Barrows and gilts, No. 1-3, 230-250 lb lw, Iowa/South Minnesota - lw to dw conversion factor
0.74. g) Poultry producer price (lw to rtc conversion of 0.75). h) Wholesale weighted average broiler price 12 cities. i) Saleyard price, lamb, 16-20 kg dw. j) Saleyard price, wethers,
< 22kg dw.
k) Lamb schedule price, all grade average.
Base Lower GDP-slow recovery Lower GDP-faster recovery
Average Average Average

8 WORLD DAIRY PROJECTIONS (BUTTER AND CHEESE)
Average
Calendar year (a) 2006-08est. 2009-11 2012-2017 2018 2009-11 2012-2017 2018 2009-11 2012-2017 2018
BUTTER
OECD (b)
Production kt pw 3 684 3 715 3 697 3 726 3 703 3 662 3 687 3 704 3 684 3 722
Consumption kt pw 3 181 3 244 3 228 3 231 3 248 3 231 3 236 3 246 3 227 3 231
Stock changes kt pw -24 -20 -15 -3 -20 -15 -3 -20 -15 -3
Non-OECD
Production kt pw 5 581 6 672 7 772 8 694 6 599 7 670 8 590 6 603 7 745 8 701
Consumption kt pw 6 184 7 233 8 327 9 262 7 146 8 186 9 115 7 151 8 288 9 266
WORLD
Production kt pw 9 266 10 387 11 469 12 419 10 303 11 332 12 278 10 307 11 429 12 423
Consumption kt pw 9 365 10 477 11 554 12 493 10 393 11 418 12 351 10 398 11 515 12 497
Stock changes kt pw -32 -20 -15 -3 -20 -15 -3 -20 -15 -3
Price (c) USD/100 kg 279 189 239 255 159 205 218 164 238 256
CHEESE
OECD (b)
Production kt pw 15 013 15 624 16 864 17 932 15 462 16 552 17 581 15 475 16 768 17 909
Consumption kt pw 14 459 15 013 16 238 17 315 14 861 15 984 17 029 14 874 16 158 17 297
Stock changes kt pw 15 1 7 6 1 7 6 1 7 6
Non-OECD
Production kt pw 4 629 5 014 5 473 5 897 4 984 5 407 5 828 4 983 5 446 5 897
Consumption kt pw 4 954 5 412 5 881 6 296 5 373 5 757 6 162 5 372 5 837 6 291
WORLD
Production kt pw 19 642 20 638 22 337 23 828 20 446 21 959 23 409 20 458 22 214 23 806
Consumption kt pw 19 414 20 425 22 119 23 611 20 234 21 740 23 192 20 246 21 995 23 588
Stock changes kt pw 18 1 7 6 1 7 6 1 7 6
Price (d) USD/100 kg 379 262 300 318 243 284 302 246 300 318
est.: estimate. Source : OECD and FAO Secretariats
a) Year ending 30 June for Australia and 31 May for New Zealand in OECD aggregate. b) Excludes Iceland but includes the 8 EU members that are not members of the
OECD. c) f.o.b. export price, butter, 82% butterfat, Oceania. d) f.o.b. export price, cheddar cheese, 39% moisture, Oceania.
Base Lower GDP-slow recovery Lower GDP-faster recovery
Average Average Average
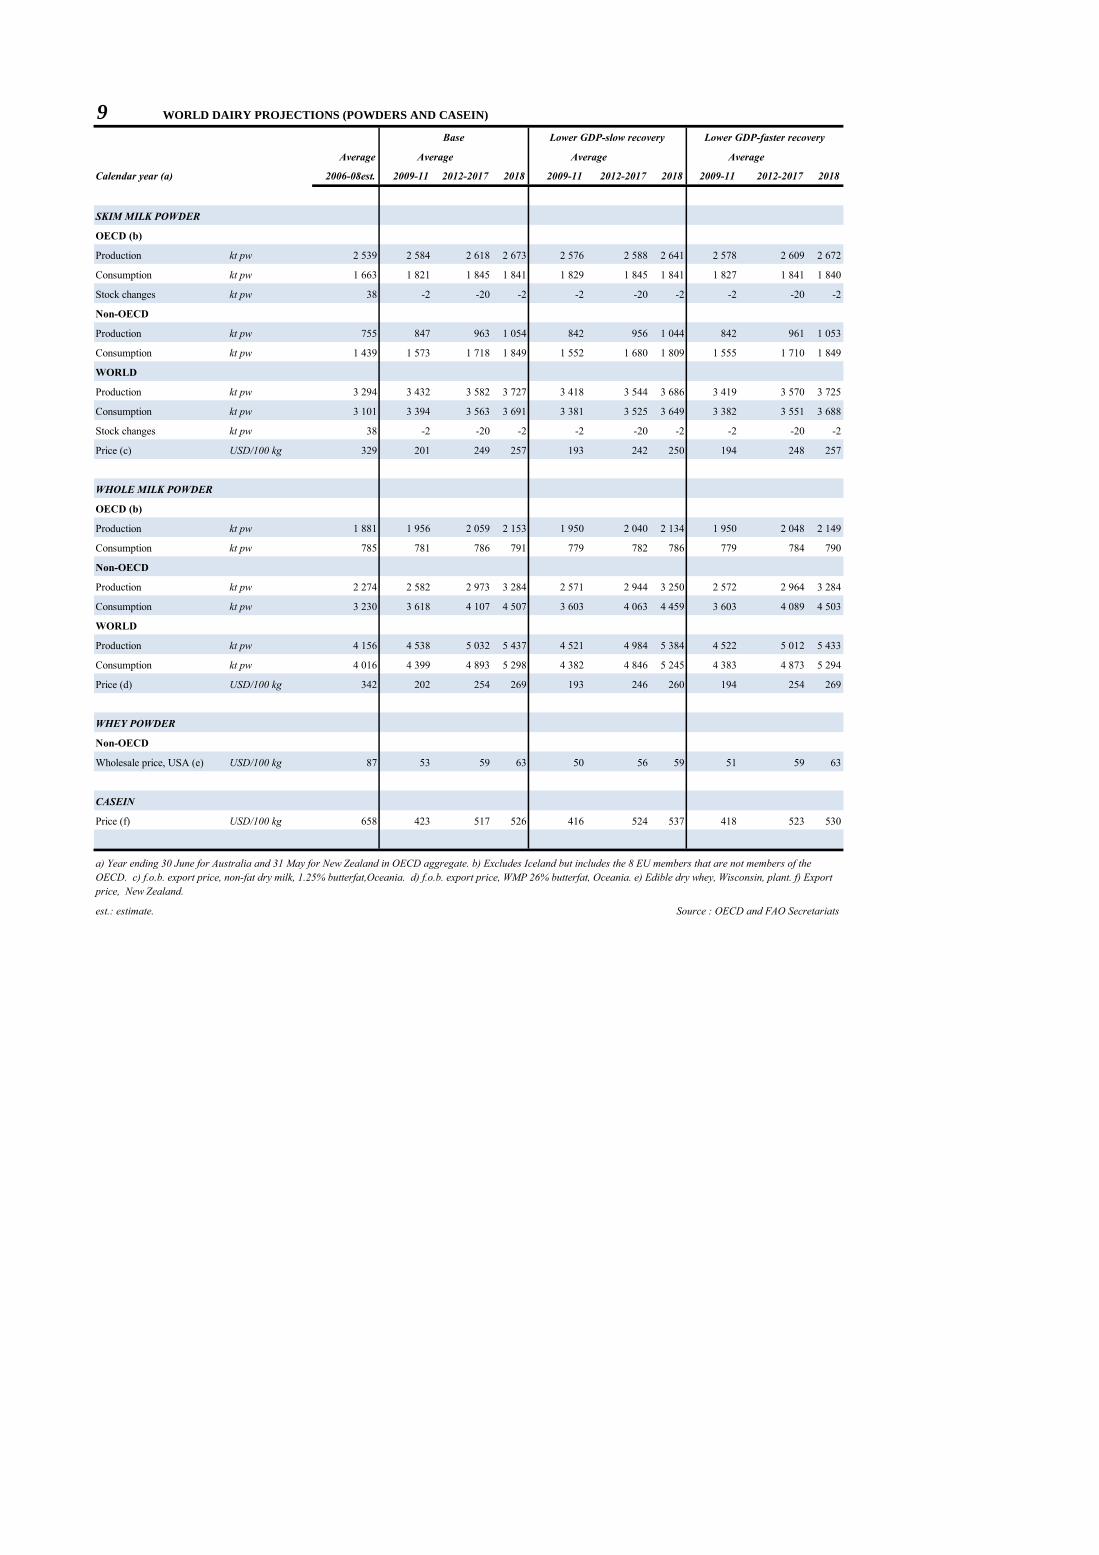
9 WORLD DAIRY PROJECTIONS (POWDERS AND CASEIN)
Average
Calendar year (a) 2006-08est. 2009-11 2012-2017 2018 2009-11 2012-2017 2018 2009-11 2012-2017 2018
SKIM MILK POWDER
OECD (b)
Production kt pw 2 539 2 584 2 618 2 673 2 576 2 588 2 641 2 578 2 609 2 672
Consumption kt pw 1 663 1 821 1 845 1 841 1 829 1 845 1 841 1 827 1 841 1 840
Stock changes kt pw 38 -2 -20 -2 -2 -20 -2 -2 -20 -2
Non-OECD
Production kt pw 755 847 963 1 054 842 956 1 044 842 961 1 053
Consumption kt pw 1 439 1 573 1 718 1 849 1 552 1 680 1 809 1 555 1 710 1 849
WORLD
Production kt pw 3 294 3 432 3 582 3 727 3 418 3 544 3 686 3 419 3 570 3 725
Consumption kt pw 3 101 3 394 3 563 3 691 3 381 3 525 3 649 3 382 3 551 3 688
Stock changes kt pw 38 -2 -20 -2 -2 -20 -2 -2 -20 -2
Price (c) USD/100 kg 329 201 249 257 193 242 250 194 248 257
WHOLE MILK POWDER
OECD (b)
Production kt pw 1 881 1 956 2 059 2 153 1 950 2 040 2 134 1 950 2 048 2 149
Consumption kt pw 785 781 786 791 779 782 786 779 784 790
Non-OECD
Production kt pw 2 274 2 582 2 973 3 284 2 571 2 944 3 250 2 572 2 964 3 284
Consumption kt pw 3 230 3 618 4 107 4 507 3 603 4 063 4 459 3 603 4 089 4 503
WORLD
Production kt pw 4 156 4 538 5 032 5 437 4 521 4 984 5 384 4 522 5 012 5 433
Consumption kt pw 4 016 4 399 4 893 5 298 4 382 4 846 5 245 4 383 4 873 5 294
Price (d) USD/100 kg 342 202 254 269 193 246 260 194 254 269
WHEY POWDER
Non-OECD
Wholesale price, USA (e) USD/100 kg 87 53 59 63 50 56 59 51 59 63
CASEIN
Price (f) USD/100 kg 658 423 517 526 416 524 537 418 523 530
est.: estimate. Source : OECD and FAO Secretariats
a) Year ending 30 June for Australia and 31 May for New Zealand in OECD aggregate. b) Excludes Iceland but includes the 8 EU members that are not members of the
OECD. c) f.o.b. export price, non-fat dry milk, 1.25% butterfat,Oceania. d) f.o.b. export price, WMP 26% butterfat, Oceania. e) Edible dry whey, Wisconsin, plant. f) Export
price, New Zealand.
Base Lower GDP-slow recovery Lower GDP-faster recovery
Average Average Average

10 BIOFUELS PROJECTIONS : ETHANOL
Growtha (%) Growth
a (%) Growth
a (%) Growth
a (%) Growth
a (%)
Volume Shares
Average Average Average Average Average
2006-08est. 2009 2006-08est. 2009 2006-08est. 2009 2006-08est. 2009 2018 2006-08est. 2009
North America
Canada 822 1 541 1 639 0.53 1 170 1 987 2 568 2.04 964 1 781 2 362 2.24 1.64% 2.89% 3.41% 0.90 5.00% -347 -446 -928 0.00
United States 27 783 39 557 63 143 4.87 30 321 40 794 70 897 5.92 28 617 39 136 69 172 6.09 3.54% 4.65% 7.63% 5.18 10.98% -2 538 -1 237 -7 754 0.00
Western Europe
EU(27) 4 203 5 666 13 958 9.87 5 322 7 299 16 938 9.19 2 896 4 886 14 440 11.72 1.37% 2.27% 6.61% 11.49 9.56% -1 119 -1 634 -2 981 0.00
Oceania Developed
Australia 106 593 1 011 3.28 106 593 1 011 3.28 106 593 1 011 3.28 0.37% 2.06% 3.30% 2.59 4.85% 0 0 0 0.00
Other Developed
Japan 0 0 0 0.00 0 0 0 0.00 0 0 0 0.00 0.00% 0.00% 0.00% 0.00 0.00% -551 -809 -984 0.00
South Africa 16 15 438 42.45 16 15 406 41.83 1 0 391 149.18 0.00% 0.00% 2.29% 148.79 3.38% 0 0 32 45.69
Sub-Saharian Africa
Ethiopia 71 73 83 1.12 65 68 83 1.95 0 2 15 22.70 0.00% 0.60% 4.51% 22.03 6.59% 6 5 1 -16.21
Mozambique 22 23 30 2.90 22 23 30 3.06 0 1 8 20.15 0.00% 0.67% 3.75% 17.98 5.50% 0 0 0 -5.33
Tanzania 27 29 93 13.17 31 35 81 9.54 0 3 50 27.53 0.00% 0.67% 6.93% 23.38 10.00% -4 -6 12 27.17
Latin America and Caribbean
Argentina 248 330 556 4.34 140 246 496 5.28 0 94 264 6.34 0.00% 1.35% 3.41% 5.05 5.00% 109 85 60 0.07
Brazil 18 659 23 853 52 583 8.81 14 855 19 782 40 946 7.91 13 723 18 605 39 512 8.18 33.40% 41.30% 71.64% 5.91 79.04% 3 804 4 071 11 638 12.71
Columbia 261 370 793 7.93 261 334 434 2.13 239 331 431 2.14 3.41% 4.80% 6.93% 3.31 10.00% 0 35 360 25.58
Mexico 57 66 88 2.99 141 172 232 2.99 0 0 0 0.00 0.00% 0.00% 0.00% 0.00 0.00% -84 -107 -144 0.00
Peru 17 43 192 13.22 10 10 89 11.65 0 0 79 69.19 0.00% 0.00% 5.36% 69.82 7.80% 7 33 103 39.54
Asia and Pacific
China 3 717 4 108 5 728 3.68 3 494 3 937 5 561 3.84 1 749 2 274 4 552 7.66 1.74% 1.99% 2.56% 2.76 3.77% 223 171 167 -0.25
India 1 799 2 126 3 940 4.83 1 901 2 161 4 049 6.18 224 377 2 245 16.32 1.28% 2.15% 13.58% 16.97 19.00% -102 -35 -109 -47.90
Indonesia 189 195 334 4.92 157 213 353 5.54 0 52 190 13.79 0.00% 0.20% 0.81% 14.80 1.20% 32 -18 -19 -23.96
Malaysia 64 71 91 2.14 103 92 93 0.15 0 0 0 16.99 0.00% 0.00% 0.00% 17.71 0.00% -40 -21 -2 0.00
Philippines 76 163 534 11.73 118 377 630 4.94 33 279 532 6.19 0.40% 3.41% 6.93% 6.89 10.00% -42 -213 -97 0.00
Thailand 474 911 2 855 11.42 483 929 2 348 9.37 211 561 1 977 12.36 1.91% 4.92% 16.15% 11.53 22.33% -9 -18 507 65.53
Turkey 66 96 222 9.37 104 162 282 6.09 57 108 228 8.14 0.73% 1.42% 3.27% 9.14 4.80% -38 -66 -60 0.00
Viet Nam 145 150 141 -0.56 135 134 136 0.12 0 0 0 5.89 0.00% 0.00% 0.00% 6.20 0.00% 10 16 6 -11.09
TOTAL 58 821 79 979 148 454 6.59 58 953 79 364 147 664 6.63 48 819 69 082 137 459 7.33 4.29% 5.54% 9.34% 5.46 13.32% -683 -194 -194 0.00
For notes, see end of the table.
a) Least-squares growth rate (see glossary).
est.: estimate, NA: Not available. Source: OECD and FAO Secretariats.
2009-18
NET TRADE (MIL L)
2018 2009-18 2018 2009-18 2018 2009-18 2018 2009-18 2018
Energy Shares
PRODUCTION (MIL L) DOMESTIC USE (MIL L) FUEL USE (MIL L)SHARE IN GAZOLINE TYPE FUEL
USE(%)

11 BIOFUELS PROJECTIONS : BIODIESEL
Growtha (%) Growth
a (%) Growth
a (%) Growth
a (%)
Volume Shares
Average Average Average Average
2006-08est. 2009 2006-08est. 2009 2006-08est. 2009 2018 2006-08est. 2009
North America
Canada 76 205 528 9.38 76 241 754 10.06 0.19% 0.59% 1.61% 8.53 2.00% 0 -35 -227 0.00
United States 2 236 3 198 5 230 5.31 1 218 1 638 3 785 7.07 0.39% 0.52% 1.06% 5.71 1.32% 1 018 1 560 1 445 3.14
Western Europe
EU(27) 6 704 9 567 18 374 7.12 7 290 10 839 22 278 8.04 2.80% 4.07% 7.39% 6.68 9.08% -742 -1 271 -3 904 0.00
Oceania Developed
Australia 486 925 1 049 1.45 486 925 1 049 1.45 2.24% 3.98% 3.98% 0.00 4.93% 0 0 0 0.00
Other Developed
South Africa 0 1 112 31.78 0 0 0 6.59 0.00% 0.00% 0.00% 0.00 0.00% 0 1 112 31.84
Sub-Saharian Africa
Ethiopia 38 59 83 3.74 0 5 21 15.03 0.24% 0.40% 1.12% 11.19 1.40% 38 54 62 1.55
Mozambique 38 67 103 4.76 0 3 22 20.15 0.24% 0.80% 4.45% 17.91 5.50% 38 64 81 2.67
Tanzania 2 11 60 17.55 0 1 11 19.11 0.00% 0.80% 8.16% 23.24 10.00% 0 9 49 17.28
Latin America and Caribbean
Argentina 608 1 705 3 848 6.91 0 210 631 7.14 0.00% 1.61% 4.04% 5.03 5.00% 608 1 495 3 217 6.95
Brazil 520 1 186 2 947 10.11 520 1 186 2 947 10.11 0.93% 2.05% 4.00% 7.44 4.95% 0 0 0 0.00
Columbia 73 188 424 9.04 73 173 206 1.93 1.75% 4.04% 4.04% 0.00 5.00% 0 15 218 26.65
Peru 97 124 180 4.17 48 59 185 11.39 0.00% 1.61% 4.04% 8.94 5.00% 49 64 -6 -40.02
Asia and Pacific
India 117 443 7 170 28.16 28 394 7 126 29.19 0.24% 0.80% 15.80% 28.40 19.00% 88 48 44 -1.65
Indonesia 245 435 1 230 11.35 146 233 362 4.86 0.00% 0.00% 0.00% 0.00 0.00% 99 202 868 15.62
Malaysia 277 566 966 5.98 122 282 386 2.74 0.00% 2.01% 4.04% 3.81 5.00% 154 284 580 8.81
Philippines 144 150 241 5.28 144 152 249 5.50 0.53% 1.61% 1.61% 0.00 2.00% 0 -2 -8 0.00
Thailand 217 413 1 211 11.71 217 415 1 185 11.43 0.54% 2.09% 5.27% 10.08 6.50% 0 -2 26 32.16
Turkey 0 0 1 38.89 0 35 109 12.27 0.24% 0.40% 1.12% 11.19 1.40% 0 -35 -108 0.00
Viet Nam 5 8 9 0.65 0 0 0 6.38 0.00% 0.00% 0.00% 0.00 0.00% 5 8 9 0.65
TOTAL 11 882 19 251 43 766 8.76 10 369 16 792 41 307 9.57 1.28% 2.00% 4.25% 7.94 5.25% 1 354 2 459 2 459 0.00
a) Least-squares growth rate (see glossary).
est.: estimate. Source: OECD and FAO Secretariats.
2009-18 2018 2009-18
Energy Shares
2018 2009-18 2018 2009-18 2018
PRODUCTION (MIL L) DOMESTIC USE (MIL L)SHARE IN DIESEL TYPE FUEL
USE (%)NET TRADE (MIL L)

OECD-FAO Agricultural Outlook 2009-2018
www.agri-outlook.org
OECD-FAO Agricultural Outlook 2009-2018
This is the fifteenth edition of the Agricultural Outlook and the fifth time it has been prepared jointly by the Organisation for Economic Cooperation and Development (OECD) and the Food and Agriculture Organization of the United Nations (FAO). This edition covers the outlook for commodity markets during the 2009 to 2018 period, and brings together the commodity, policy and country expertise of both organisations. The report analyses world market trends for the main agricultural products, as well as biofuels. It provides an assessment of agricultural market prospects for production, consumption, trade, stocks and prices of the included commodities.
Looking forward, real commodity prices over the 2009-18 period are projected to remain at, or above the 1997-2006 average, the period just before the recent price hikes. An expected economic recovery, renewed food demand growth from developing countries and the emerging biofuel markets are the key drivers underpinning agricultural commodity prices and markets over the medium term. The projections and past trends are presented in the statistical annex, and can be viewed in more detail at the website www.agri-outlook.org.
This edition of the Outlook was prepared in a period of unprecedented financial market turmoil and rapidly deteriorating global economic prospects. Because macroeconomic conditions are changing so quickly, this report complements the standard baseline projections with an analysis of revised short–term GDP prospects and alternative GDP recovery paths. Lower GDP scenarios result in lower commodity prices, with reductions in crop and biofuel prices about one-half those for livestock products. A sensitivity analysis to highly uncertain crude oil prices shows the important links between energy and agricultural prices. The Outlook also reports on a survey of various actors in the agri-food chain in terms of the current impacts of the global economic crisis and credit market constraints. The issue of food security and the capacity of the agricultural sector to meet the rising demand for food remains very high on the international political agenda. This report provides a brief overview of critical factors such as land availability, productivity gains, water usage and climate change, and suggests that agricultural production could be significantly increased, provided there is sufficient investment in research, infrastructure and technological change, particularly in developing countries.
«HIGHLIGHTSHIGHLIGHTS
2009
2009 O
EC
D-FA
O A
gricultural O
utloo
k 2009-2018