Oecd economic surveys, chile,2012
127
OECD Economic Surveys CHILE JANUARY 2012
-
Upload
felipe-rojas -
Category
News & Politics
-
view
941 -
download
0
Transcript of Oecd economic surveys, chile,2012

January 2012
OECD Economic Surveys
CHILESPECIAL FEATURES: REDUCING POVERTY: CASH TRANSFERS AND BETTER JOBS
Most recent editions
ISBN 978-92-64-12720-310 2012 03 1 P
ISSN 0376-64382012 SUBSCRIPTION (18 ISSUES)
ISSN 1995-378XSUBSCRIPTION BY COUNTRY
-:HSTCQE=VW\WUX:
Volu
me 2012/1
CH
ILEO
EC
D E
cono
mic S
urveys
Volume 2012/1January 2012
Please cite this publication as:
OECD (2012), OECD Economic Surveys: Chile 2012, OECD Publishing.http://dx.doi.org/10.1787/eco_surveys-chl-2012-en
This work is published on the OECD iLibrary, which gathers all OECD books, periodicals and statistical databases. Visit www.oecd-ilibrary.org, and do not hesitate to contact us for more information.
OECD Economic SurveysCHILE
JANUARY 2012
Australia, November 2010Austria, July 2011Belgium, July 2011Brazil, October 2011Canada, September 2010Chile, January 2012 China, February 2010Czech Republic, November 2011Denmark, January 2012Estonia, April 2011Euro area, December 2010European Union, September 2009Federal Republic of Yugoslavia, January 2003Finland, April 2010France, March 2011Germany, March 2010Greece, August 2011Hungary, February 2010Iceland, June 2011India, June 2011Indonesia, November 2010Ireland, October 2011Israel, December 2011
Italy, May 2011Japan, April 2011Korea, June 2010Luxembourg, May 2010Mexico, May 2011Netherlands, June 2010New Zealand, April 2011Norway, March 2010Poland, April 2010Portugal, September 2010Romania, October 2002Russian Federation, December 2011Slovak Republic, November 2010Slovenia, February 2011South Africa, July 2010Spain, December 2010Sweden, January 2011Switzerland, December 2011Turkey, September 2010Ukraine, September 2007United Kingdom, March 2011United States, September 2010
102012031cov.indd 1 11-Jan-2012 3:34:08 PM

OECD Economic Surveys: Chile2012
This document and any map included herein are without prejudice to the status of or
sovereignty over any territory, to the delimitation of international frontiers and boundaries
and to the name of any territory, city or area.
ISBN 978-92-64-12720-3 (print)ISBN 978-92-64-12721-0 (PDF)
Series: OECD Economic SurveysISSN 0376-6438 (print)ISSN 1609-7513 (online)
OECD Economic Surveys: ChileISSN 1995-378X (print)ISSN 1999-0847 (online)
The statistical data for Israel are supplied by and under the responsibility of the relevant Israeli authorities. The useof such data by the OECD is without prejudice to the status of the Golan Heights, East Jerusalem and Israelisettlements in the West Bank under the terms of international law.
Photo credits: Cover © iStockphoto.com/Brent Heit.
Corrigenda to OECD publications may be found on line at: www.oecd.org/publishing/corrigenda.
© OECD 2012
You can copy, download or print OECD content for your own use, and you can include excerpts from OECD publications, databases and
multimedia products in your own documents, presentations, blogs, websites and teaching materials, provided that suitable
acknowledgment of OECD as source and copyright owner is given. All requests for public or commercial use and translation rights should
be submitted to [email protected]. Requests for permission to photocopy portions of this material for public or commercial use shall be
addressed directly to the Copyright Clearance Center (CCC) at [email protected] or the Centre français d’exploitation du droit de copie (CFC)
Please cite this publication as:OECD (2012), OECD Economic Surveys: Chile 2012, OECD Publishing.http://dx.doi.org/10.1787/eco_surveys-chl-2012-en
TABLE OF CONTENTS
Table of contentsTable of contents
Executive summary . . . . . . . . . . . . . . . . . . . . . . . . . . . . . . . . . . . . . . . . . . . . . . . . . . . . . . . . . 8
Assessment and recommendations. . . . . . . . . . . . . . . . . . . . . . . . . . . . . . . . . . . . . . . . . . . 11
Bibliography. . . . . . . . . . . . . . . . . . . . . . . . . . . . . . . . . . . . . . . . . . . . . . . . . . . . . . . . . . . . 38
Annex A1. Progress in structural reform . . . . . . . . . . . . . . . . . . . . . . . . . . . . . . . . . . . . 39
Chapter 1. Reducing poverty in Chile: Cash transfers and better jobs . . . . . . . . . . . . . . 43
Introduction. . . . . . . . . . . . . . . . . . . . . . . . . . . . . . . . . . . . . . . . . . . . . . . . . . . . . . . . . . . . 44
Poverty and inequality in Chile. . . . . . . . . . . . . . . . . . . . . . . . . . . . . . . . . . . . . . . . . . . . 44
Cash transfers as an instrument to reduce poverty . . . . . . . . . . . . . . . . . . . . . . . . . . 49
Improving labour market outcomes for workers at risk of poverty . . . . . . . . . . . . . 62
Bibliography. . . . . . . . . . . . . . . . . . . . . . . . . . . . . . . . . . . . . . . . . . . . . . . . . . . . . . . . . . . . 78
Chapter 2. Building blocks for a better functioning housing market in Chile. . . . . . . . 83
A significant share of the population lives in poor housing conditions. . . . . . . . . . 84
House price growth has remained contained keeping housing affordable
for most Chileans . . . . . . . . . . . . . . . . . . . . . . . . . . . . . . . . . . . . . . . . . . . . . . . . . . . . . . . 89
A deeper housing finance market has facilitated access to credit . . . . . . . . . . . . . . 89
A more efficient and resilient mortgage market could improve access to credit . . 92
For poor households housing remains too expensive. . . . . . . . . . . . . . . . . . . . . . . . . 94
Housing subsidies have widened access to housing… . . . . . . . . . . . . . . . . . . . . . . . . 95
... but subsidies do not always reach those most in need. . . . . . . . . . . . . . . . . . . . . . 99
Making housing subsidies more efficient and equitable through better targeting . . 100
Housing subsidies have not always led to better living conditions. . . . . . . . . . . . . . 101
Better standards to improve housing quality and protect public health . . . . . . . . . 102
Measures to reduce segregation and avoid poverty traps. . . . . . . . . . . . . . . . . . . . . . 103
Housing support excessively promotes homeownership . . . . . . . . . . . . . . . . . . . . . . 104
Making housing support more tenure neutral would uncover hidden demand
and improve mobility. . . . . . . . . . . . . . . . . . . . . . . . . . . . . . . . . . . . . . . . . . . . . . . . . . . . 107
Owner-occupied housing receives a preferential tax treatment . . . . . . . . . . . . . . . . 108
A tax reform to reduce distortions, improve equity and promote
a more balanced housing market. . . . . . . . . . . . . . . . . . . . . . . . . . . . . . . . . . . . . . . . . . 109
Bibliography. . . . . . . . . . . . . . . . . . . . . . . . . . . . . . . . . . . . . . . . . . . . . . . . . . . . . . . . . . . . 113
Annex 2.A1 . . . . . . . . . . . . . . . . . . . . . . . . . . . . . . . . . . . . . . . . . . . . . . . . . . . . . . . . . . . . . 116
OECD ECONOMIC SURVEYS: CHILE © OECD 2012 3
TABLE OF CONTENTS
OECD ECONOMIC SURVEYS: CHILE © OECD 20124
Boxes
1. Recommendations to improve fiscal and monetary policies . . . . . . . . . . . . . . . 20
2. Recommendations to strengthen economic growth . . . . . . . . . . . . . . . . . . . . . . 25
3. Recommendations to improve anti-poverty policies and reduce inequality . . 29
4. Recommendations on labour market policies . . . . . . . . . . . . . . . . . . . . . . . . . . . 33
5. Recommendations on housing policy. . . . . . . . . . . . . . . . . . . . . . . . . . . . . . . . . . . 37
1.1. Cash transfers for poor families in Chile . . . . . . . . . . . . . . . . . . . . . . . . . . . . . . . . 51
1.2. The law proposal for Ingreso Ético Familiar . . . . . . . . . . . . . . . . . . . . . . . . . . . . . . . 53
1.3. Recommendations to improve anti-poverty policies . . . . . . . . . . . . . . . . . . . . . . 61
1.4. Recommendations to improve the functioning of the labour market . . . . . . . . 77
2.1. Economic consequences of the 2010 earthquake and tsunami . . . . . . . . . . . . . 87
2.2. Chile’s housing subsidies . . . . . . . . . . . . . . . . . . . . . . . . . . . . . . . . . . . . . . . . . . . . . 95
2.3. Recommendations to improve the functioning of Chile’s housing market . . . 112
Tables
1. Summary of the Economic Outlook 90, OECD projections . . . . . . . . . . . . . . . . . . . 13
2. Fiscal revenues per capita before and after equalisation. . . . . . . . . . . . . . . . . . . 29
1.1. Poverty across different groups, 2009 . . . . . . . . . . . . . . . . . . . . . . . . . . . . . . . . . . . 47
1.2. Real income increases by quintiles of per capita household income
between 1990 and 2009 . . . . . . . . . . . . . . . . . . . . . . . . . . . . . . . . . . . . . . . . . . . . . . . 49
1.3. Poverty rates and gaps depending on the poverty line, 2009 . . . . . . . . . . . . . . . 55
1.4. Fiscal disparities before and after equalisation. . . . . . . . . . . . . . . . . . . . . . . . . . . 61
2.1. Public sources of financing and reconstruction spending, 2010-13 . . . . . . . . . . 88
2.2. Mortgage and financial market features in OECD countries . . . . . . . . . . . . . . . . 91
2.3. An overview of the most important housing subsidies, 2011 . . . . . . . . . . . . . . . 96
2.4. An assessment of Chile’s housing subsidy programmes: key features,
equity and efficiency . . . . . . . . . . . . . . . . . . . . . . . . . . . . . . . . . . . . . . . . . . . . . . . . . 98
2.5. Recipients of housing subsidies by income quintile (% of total subsidies) . . . . 99
2.6. Fiscal revenues per capita before and after equalisation. . . . . . . . . . . . . . . . . . . 111
2.A1.1. Housing-related taxes: Interest rate deductibility, imputed rent
and capital gains tax . . . . . . . . . . . . . . . . . . . . . . . . . . . . . . . . . . . . . . . . . . . . . . . . . 116
2.A1.2. Housing related taxes: Property, wealth, inheritance and consumption taxes . . . 119
Figures
1. Inequality and poverty across OECD countries . . . . . . . . . . . . . . . . . . . . . . . . . . . 12
2. Inflation and inflation expectations . . . . . . . . . . . . . . . . . . . . . . . . . . . . . . . . . . . . 13
3. Sovereign wealth fund and copper prices . . . . . . . . . . . . . . . . . . . . . . . . . . . . . . . 14
4. Government expenditure by function. . . . . . . . . . . . . . . . . . . . . . . . . . . . . . . . . . . 15
5. Tax revenue from different sources across countries. . . . . . . . . . . . . . . . . . . . . . 16
6. Recurrent taxes on residential immovable property . . . . . . . . . . . . . . . . . . . . . . 18
7. The environmental impact of growth differs across countries. . . . . . . . . . . . . . 18
8. Potential growth in Chile . . . . . . . . . . . . . . . . . . . . . . . . . . . . . . . . . . . . . . . . . . . . . 21
9. Educational attainment and outcomes . . . . . . . . . . . . . . . . . . . . . . . . . . . . . . . . . 23
10. Per student expenditures in tertiary education. . . . . . . . . . . . . . . . . . . . . . . . . . . 24
11. Poverty rates in Chile. . . . . . . . . . . . . . . . . . . . . . . . . . . . . . . . . . . . . . . . . . . . . . . . . 26
12. Average household income by income decile . . . . . . . . . . . . . . . . . . . . . . . . . . . . 26
13. Young people and women in the labour market . . . . . . . . . . . . . . . . . . . . . . . . . . 30

TABLE OF CONTENTS
OECD ECONOMIC SURVEYS: CHILE © OECD 2012 5
14. Unemployment benefit replacement rates (net of taxes), 2009 . . . . . . . . . . . . . 32
15. Coverage with early childhood education and care across OECD countries . . . 33
16. Share of population living in poor housing conditions . . . . . . . . . . . . . . . . . . . . 34
17. Tenure structure across countries. . . . . . . . . . . . . . . . . . . . . . . . . . . . . . . . . . . . . . 36
18. Residential mobility in OECD countries . . . . . . . . . . . . . . . . . . . . . . . . . . . . . . . . . 37
1.1. Poverty rates in Chile. . . . . . . . . . . . . . . . . . . . . . . . . . . . . . . . . . . . . . . . . . . . . . . . . 45
1.2. Poverty and inequality in Latin America comparison . . . . . . . . . . . . . . . . . . . . . 46
1.3. Inequality and poverty across OECD countries . . . . . . . . . . . . . . . . . . . . . . . . . . . 47
1.4. Average household income by income decile . . . . . . . . . . . . . . . . . . . . . . . . . . . . 48
1.5. Intergenerational earnings elasticity estimates . . . . . . . . . . . . . . . . . . . . . . . . . . 48
1.6. Gini coefficients for the earnings of full-time employees . . . . . . . . . . . . . . . . . . 49
1.7. Tax and benefits for low and high income households . . . . . . . . . . . . . . . . . . . . 50
1.8. Share of transfers in pre-transfer household income by decile, 2009 . . . . . . . . 52
1.9. Inactive and unemployed people across income quintiles . . . . . . . . . . . . . . . . . 62
1.10. Informality and job quality across income quintiles . . . . . . . . . . . . . . . . . . . . . . 63
1.11. Young people and women in the labour market . . . . . . . . . . . . . . . . . . . . . . . . . . 64
1.12. Unemployment benefit replacement rates (net of taxes), 2009 . . . . . . . . . . . . . 68
1.13. Development of funds in the unemployment benefit system . . . . . . . . . . . . . . 69
1.14. Average compulsory payment wedge and average tax wedge . . . . . . . . . . . . . . 69
1.15. Employment protection legislation (EPL), 2008 . . . . . . . . . . . . . . . . . . . . . . . . . . . 71
1.16. Minimum wages across OECD countries . . . . . . . . . . . . . . . . . . . . . . . . . . . . . . . . 74
1.17. Coverage with early childhood education and care across OECD countries . . . 75
1.18. Union density and collective bargaining coverage . . . . . . . . . . . . . . . . . . . . . . . . 77
2.1. Share of population living in poor housing conditions . . . . . . . . . . . . . . . . . . . . 85
2.2. Housing quality . . . . . . . . . . . . . . . . . . . . . . . . . . . . . . . . . . . . . . . . . . . . . . . . . . . . . 86
2.3. Stock of inadequate housing . . . . . . . . . . . . . . . . . . . . . . . . . . . . . . . . . . . . . . . . . . 87
2.4. Exposure to air pollution by particulates . . . . . . . . . . . . . . . . . . . . . . . . . . . . . . . . 89
2.5. Real house prices to real wages . . . . . . . . . . . . . . . . . . . . . . . . . . . . . . . . . . . . . . . . 89
2.6. The size of the mortgage market in selected countries . . . . . . . . . . . . . . . . . . . . 90
2.7. Mortgage market developments . . . . . . . . . . . . . . . . . . . . . . . . . . . . . . . . . . . . . . . 91
2.8. Transaction costs . . . . . . . . . . . . . . . . . . . . . . . . . . . . . . . . . . . . . . . . . . . . . . . . . . . . 93
2.9. Affordability: share of household monthly income for mortgage payments . . 94
2.10. Public spending on housing and community amenities . . . . . . . . . . . . . . . . . . . 97
2.11. Number and value of housing subsidies . . . . . . . . . . . . . . . . . . . . . . . . . . . . . . . . 97
2.12. Social mobility: strength of the link between individual and parental earnings. . 102
2.13. Tenure structure. . . . . . . . . . . . . . . . . . . . . . . . . . . . . . . . . . . . . . . . . . . . . . . . . . . . . 105
2.14. Residential mobility in OECD countries . . . . . . . . . . . . . . . . . . . . . . . . . . . . . . . . . 106
2.15. Residential mobility in Chile by income quintile . . . . . . . . . . . . . . . . . . . . . . . . . 107
2.16. Recurrent taxes on residential immovable property . . . . . . . . . . . . . . . . . . . . . . 110
This book has...
StatLinks2A service that delivers Excel® files
from the printed page!
Look for the StatLinks at the bottom right-hand corner of the tables or graphs in this book. To download the matching Excel® spreadsheet, just type the link into your Internet browser, starting with the http://dx.doi.org prefix. If you’re reading the PDF e-book edition, and your PC is connected to the Internet, simply click on the link. You’ll find StatLinks appearing in more OECD books.
This Survey is published on the responsibility of the Economic andDevelopment Review Committee of the OECD, which is charged with theexamination of the economic situation of member countries.
The economic situation and policies of Chile were reviewed by the Committeeon 5 December 2011. The draft report was then revised in the light of thediscussions and given final approval as the agreed report of the whole Committee on14 December 2011.
The Secretariat’s draft report was prepared for the Committee by NicolaBrandt, Aida Caldera Sánchez, with statistical assistance from Roselyne Jamin,under the supervision of Patrick Lenain.
The previous Survey of Chile was issued in January 2010.

BASIC STATISTICS OF CHILE (2010 UNLESS NOTED)
THE LAND
Area (thousands sq. km) 756.6
POPULATION
Total (millions) 17.1Inhabitants per sq. km 22.6Net average annual increase over previous 10 years, per cent 1.1
EMPLOYMENT
Total employment (thousands) 7 131In % : Agriculture 10.6
Mining 3.1Manufacturing 11.3Services 75.1
Unemployment rate (in per cent) 8.1
GROSS DOMESTIC PRODUCT (GDP)
GDP at current prices and current exchange rate (USD billion) 203.5In % of GDP : Agriculture 3.1
Mining 19.2Manufacturing 11.1Services 66.5
Gross fixed capital formation (GFCF) as % of GDP 28.4
PUBLIC FINANCES (as % of GDP)
Current revenue 24.5Current expenditure 20.6Nominal balance 3.9Consolidated net debt (central government and central bank) –8.3
INDICATORS OF LIVING STANDARDS
GDP per capita USD PPPs (2010) 15 107Internet users, per 100 inhabitants (2010) 36.6Doctors, per 1 000 inhabitants (2008) 1.8Infant mortality per 1 000 live births (2009) 7.9Life expectancy at birth (total population, 2010) 78.6Income inequality (GINI coefficient, 2009) (after taxes and transfers) 0.49Poverty (% of people living with less than 50% of median income, 2009) 18.4
FOREIGN TRADE
Exports of goods (USD billion) 69.6In % of GDP 34.2Copper exports in % of total exports 57.8
Imports of goods (USD billion) 57.6In % of GDP 28.3
THE CURRENCY
Monetary unit: Peso Currency units per USD, average of daily figuresYear 2010 510.0November 2011 508.7
EXECUTIVE SUMMARY
Executive summary
Chile’s strong recovery lost some momentum as the world economy slowed, weakening copper
prices and consumer confidence in Chile. Given considerable uncertainties regarding the health of the
world economy, more supportive macroeconomic policies may be needed in the short run. In the
longer run, reducing poverty and inequality is a key challenge. Both remain high by OECD standards,
notwithstanding impressive progress. Redistributive transfers and progressive taxes are very
limited. Better education and job opportunities for the poor would enable more Chileans to contribute
to a more dynamic and productive economy and thus to higher welfare. The following measures
would help Chile overcome the challenging situation of the world economy in the short run and attain
stronger growth and a more inclusive society in the longer run:
● Supportive macro policies in the short-run. Given the uncertain global environment monetary
policy should remain on hold for now. A slow pace for consolidation is appropriate at the moment,
but once the external environment improves the government should return to a structural fiscal
balance to rebuild buffers against shocks.
● A strengthened fiscal rule and higher tax revenues to finance long-term spendingincreases. Chile’s structural fiscal balance target has led to low debt and large assets in the
sovereign wealth funds. The government plans to create an independent fiscal council, which
could validate the correct application of the rule and assess the target chosen by the government
as well as changes in the methodology applied. This shift should strengthen Chile’s fiscal
framework. There is also strong demand for higher quality education and social services in
Chile, which is likely to mount as the country develops. The government already plans
significant spending increases on such programmes, which will need to be financed on a
sustainable basis. Higher environmental taxes would be a particularly efficient source of
revenue. A reduction of regressive tax loopholes and of still-pervasive income taxes evasion
would also make the tax system more progressive.
● Higher cash transfers for the poor combined with support for recipients to find employment,as envisaged by the government through the new Ingreso Ético Familiar programme. The
government currently plans to target the bulk of the transfers to families living in extreme poverty.
Over time, it should consider opening all new transfers to a wider range of participants, for
example through a more gradual benefit withdrawal. This would also enhance work incentives for
beneficiaries and limit fraud. To assess whether transfers should increase over time the
government should evaluate the impact of higher cash transfers on recipients’ work incentives,
employment opportunities and capacity to invest in their human capital.
● Better access to quality housing along with measures to reduce residential segregation andenhance mobility. This could improve access for the poor to higher-quality education, social
services and jobs. Better targeting of housing subsidies will be essential to free resources for those
truly in need. At the same time the government should rethink subsidies, which are currently
directed exclusively at home ownership. Means-tested rental cash allowances coupled with more
OECD ECONOMIC SURVEYS: CHILE © OECD 20128

EXECUTIVE SUMMARY
balanced tenant-landlord regulations would strengthen the rental market, thus enhancing
residential mobility and potentially reducing segregation. Other measures that would contribute
to lowering segregation and inequality include: better enforcement of social housing quotas, more
investment in infrastructure and social services in poorer neighbourhoods and development of
unused land in urban areas.
OECD ECONOMIC SURVEYS: CHILE © OECD 2012 9


OECD Economic Surveys: Chile
© OECD 2012
Assessment and recommendations
Chile’s vigorous recovery after the global recession of 2008-09 and the devastating
earthquakes and tsunamis of early 2010 has lost some momentum, as the world economy
has turned down. GDP is projected to grow by 6½ per cent in 2011, but to ease to 4% in 2012.
Provided that confidence improves and the global economy picks up again later in 2012,
growth in Chile should rise to around 5% in 2013. However, as a small, very open economy
with a large share of copper in total exports (close to 60% in 2010) Chile would be vulnerable
to a sharper than expected global downturn, notwithstanding the fact that it recovered fast
after the global crisis of 2008/2009 and proved resilient to the earthquakes and tsunamis in
2010. Chile’s income gap with the most advanced OECD countries remains wide, mainly
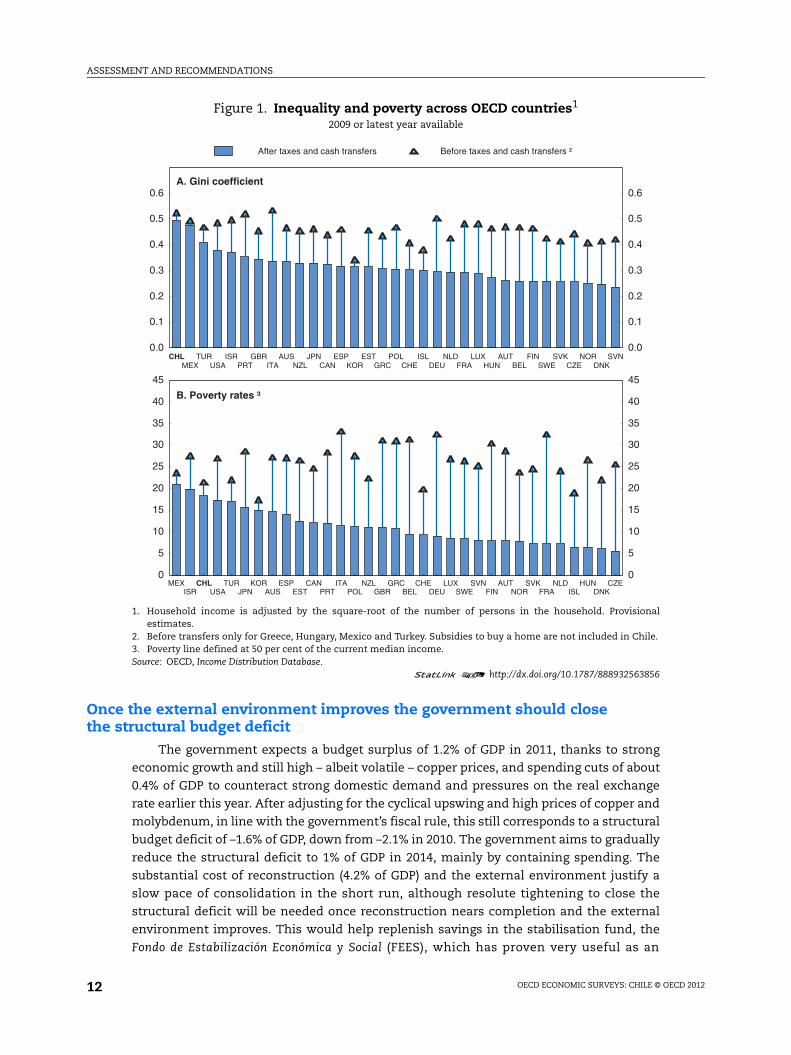
due to lower productivity. Poverty and inequality also remain high in comparison with
other OECD countries, in part because the tax-benefit system does very little to redistribute
income (Figure 1). Despite strong economic growth, inequality has been highly persistent
over the past 20 years – notwithstanding some modest improvements in the past few years
– and inter-generational social mobility is low. Chile’s main challenge is to sustain high
growth while distributing the gains more evenly across society. Better education and
stronger product-market competition will be needed to foster productivity and reduce
inequality. Efforts to enhance growth should be combined with measures to increase the
employment of the poor and to improve their living standards.
Demand is keeping growth up but there are signs of a slowdownEconomic growth in 2011 was driven by consumption, easy access to credit and
reconstruction of infrastructure and housing after the devastating earthquakes and
tsunami of 2010. But recent data and confidence indicators point to a moderation in
economic activity. Notwithstanding a recent slide in the copper price, the terms of trade
remain favourable, but the current account has moved into deficit, as imports have
expanded fast and both mining and industrial export volumes have grown only weakly.
The peso appreciated strongly during the first half of 2011, but has recently started to
depreciate amid declining copper prices. Concerns about overheating have decreased, as
growth and headline inflation have stabilised (Figure 2). Lower commodity prices and a
rapid succession of monetary policy rate increases during the first part of 2011 have helped
contain core inflation during the upswing. With commodity prices weakening and growth
set to slow, inflation should remain well within the central bank’s target range (3% +/–1).
11
ASSESSMENT AND RECOMMENDATIONS
Once the external environment improves the government should close the structural budget deficit
The government expects a budget surplus of 1.2% of GDP in 2011, thanks to strong
economic growth and still high – albeit volatile – copper prices, and spending cuts of about
0.4% of GDP to counteract strong domestic demand and pressures on the real exchange
rate earlier this year. After adjusting for the cyclical upswing and high prices of copper and
molybdenum, in line with the government’s fiscal rule, this still corresponds to a structural
budget deficit of –1.6% of GDP, down from –2.1% in 2010. The government aims to gradually
reduce the structural deficit to 1% of GDP in 2014, mainly by containing spending. The
substantial cost of reconstruction (4.2% of GDP) and the external environment justify a
slow pace of consolidation in the short run, although resolute tightening to close the
structural deficit will be needed once reconstruction nears completion and the external
environment improves. This would help replenish savings in the stabilisation fund, the
Fondo de Estabilización Económica y Social (FEES), which has proven very useful as an
Figure 1. Inequality and poverty across OECD countries1
2009 or latest year available
1. Household income is adjusted by the square-root of the number of persons in the household. Provisionalestimates.
2. Before transfers only for Greece, Hungary, Mexico and Turkey. Subsidies to buy a home are not included in Chile.3. Poverty line defined at 50 per cent of the current median income.Source: OECD, Income Distribution Database.
1 2 http://dx.doi.org/10.1787/888932563856
0.0
0.1
0.2
0.3
0.4
0.5
0.6
0.0
0.1
0.2
0.3
0.4
0.5
0.6
CHL TUR ISR GBR AUS JPN ESP EST POL ISL NLD LUX AUT FIN SVK NOR SVNMEX USA PRT ITA NZL CAN KOR GRC CHE DEU FRA HUN BEL SWE CZE DNK
A. Gini coefficient
After taxes and cash transfers Before taxes and cash transfers ²
0
5
10
15
20
25
30
35
40
45
0
5
10
15
20
25
30
35
40
45
MEX CHL TUR KOR ESP CAN ITA NZL GRC CHE LUX SVN AUT SVK NLD HUN CZEISR USA JPN AUS EST PRT POL GBR BEL DEU SWE FIN NOR FRA ISL DNK
B. Poverty rates ³
OECD ECONOMIC SURVEYS: CHILE © OECD 201212

ASSESSMENT AND RECOMMENDATIONS
Table 1. Summary of the Economic Outlook 90, OECD projections
2008 2009 2010 2011 2012 2013
Current prices CLP billion
Percentage changes, volume (2003 prices)
GDP at market prices 89 205.5 –1.5 5.1 6.6 4.0 4.7
Private consumption 52 860.0 0.9 10.4 9.4 6.4 7.0
Government consumption 10 603.2 7.5 3.3 3.6 2.4 2.4
Gross fixed capital formation 21 946.1 –15.9 18.8 16.3 7.7 8.8
Final domestic demand 85 409.3 –2.9 11.5 10.5 6.3 7.0
Stockbuilding1 567.2 –3.2 4.9 0.1 0.2 0.0
Total domestic demand 85 976.4 –5.8 16.4 10.3 6.4 6.9
Exports of goods and services 39 866.3 –6.4 1.9 7.4 4.6 4.7
Imports of goods and services 36 637.3 –14.6 29.5 15.2 9.5 9.1
Net exports1 3 229.1 3.2 –8.5 –2.1 –1.5 –1.5
Memorandum items
GDP deflator – 2.7 9.5 3.3 3.4 3.6
Private consumption deflator – 0.9 0.2 3.3 2.8 2.8
Consumer price index – 0.4 1.4 3.5 2.8 2.8
Unemployment rate – 10.8 8.1 7.0 7.3 7.1
Central government financial balance2 – –4.5 –0.4 1.2 –0.4 0.2
Current account balance2 – 1.5 2.1 –1.1 –2.2 –2.0
1. Contributions to changes in real GDP (percentage of real GDP in previous year), actual amount in the first column2. As a percentage of GDP.Source: OECD, OECD Economic Outlook 90 Database.
Figure 2. Inflation and inflation expectationsAt annual rates
1. Consumer price index (IPC).2. Eleven months ahead.Source: Central Bank of Chile.
1 2 http://dx.doi.org/10.1787/888932563875
2007 2008 2009 2010 2011
-2
0
2
4
6
8
10
12 %
-2
0
2
4
6
8
10
12%
Target range
Policy rate
Inflation¹Core inflationInflation expectations²
OECD ECONOMIC SURVEYS: CHILE © OECD 2012 13
ASSESSMENT AND RECOMMENDATIONS
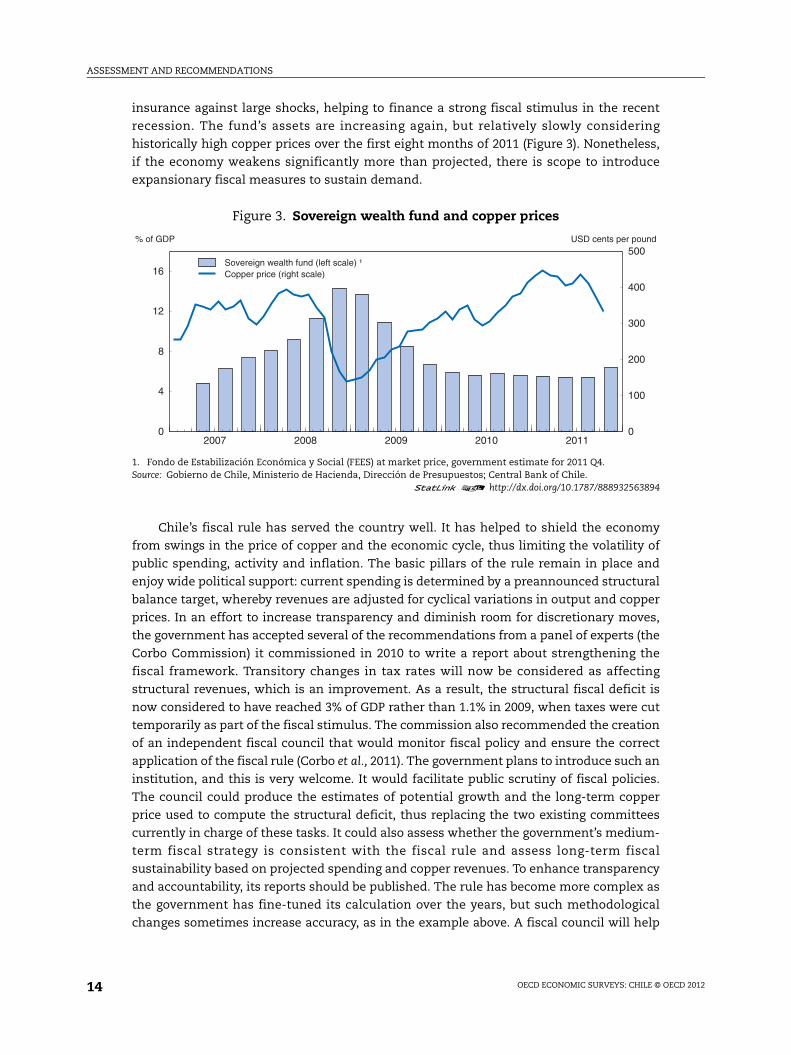
insurance against large shocks, helping to finance a strong fiscal stimulus in the recent
recession. The fund’s assets are increasing again, but relatively slowly considering
historically high copper prices over the first eight months of 2011 (Figure 3). Nonetheless,
if the economy weakens significantly more than projected, there is scope to introduce
expansionary fiscal measures to sustain demand.
Chile’s fiscal rule has served the country well. It has helped to shield the economy
from swings in the price of copper and the economic cycle, thus limiting the volatility of
public spending, activity and inflation. The basic pillars of the rule remain in place and
enjoy wide political support: current spending is determined by a preannounced structural
balance target, whereby revenues are adjusted for cyclical variations in output and copper
prices. In an effort to increase transparency and diminish room for discretionary moves,
the government has accepted several of the recommendations from a panel of experts (the
Corbo Commission) it commissioned in 2010 to write a report about strengthening the
fiscal framework. Transitory changes in tax rates will now be considered as affecting
structural revenues, which is an improvement. As a result, the structural fiscal deficit is
now considered to have reached 3% of GDP rather than 1.1% in 2009, when taxes were cut
temporarily as part of the fiscal stimulus. The commission also recommended the creation
of an independent fiscal council that would monitor fiscal policy and ensure the correct
application of the fiscal rule (Corbo et al., 2011). The government plans to introduce such an
institution, and this is very welcome. It would facilitate public scrutiny of fiscal policies.
The council could produce the estimates of potential growth and the long-term copper
price used to compute the structural deficit, thus replacing the two existing committees
currently in charge of these tasks. It could also assess whether the government’s medium-
term fiscal strategy is consistent with the fiscal rule and assess long-term fiscal
sustainability based on projected spending and copper revenues. To enhance transparency
and accountability, its reports should be published. The rule has become more complex as
the government has fine-tuned its calculation over the years, but such methodological
changes sometimes increase accuracy, as in the example above. A fiscal council will help
Figure 3. Sovereign wealth fund and copper prices
1. Fondo de Estabilización Económica y Social (FEES) at market price, government estimate for 2011 Q4.Source: Gobierno de Chile, Ministerio de Hacienda, Dirección de Presupuestos; Central Bank of Chile.
1 2 http://dx.doi.org/10.1787/888932563894
2007 2008 2009 2010 20110
4
8
12
16
% of GDP
0
100
200
300
400
500USD cents per pound
Sovereign wealth fund (left scale) ¹Copper price (right scale)
OECD ECONOMIC SURVEYS: CHILE © OECD 201214
ASSESSMENT AND RECOMMENDATIONS
to maintain the transparency of the fiscal framework and accountability, even when it
becomes more complex.
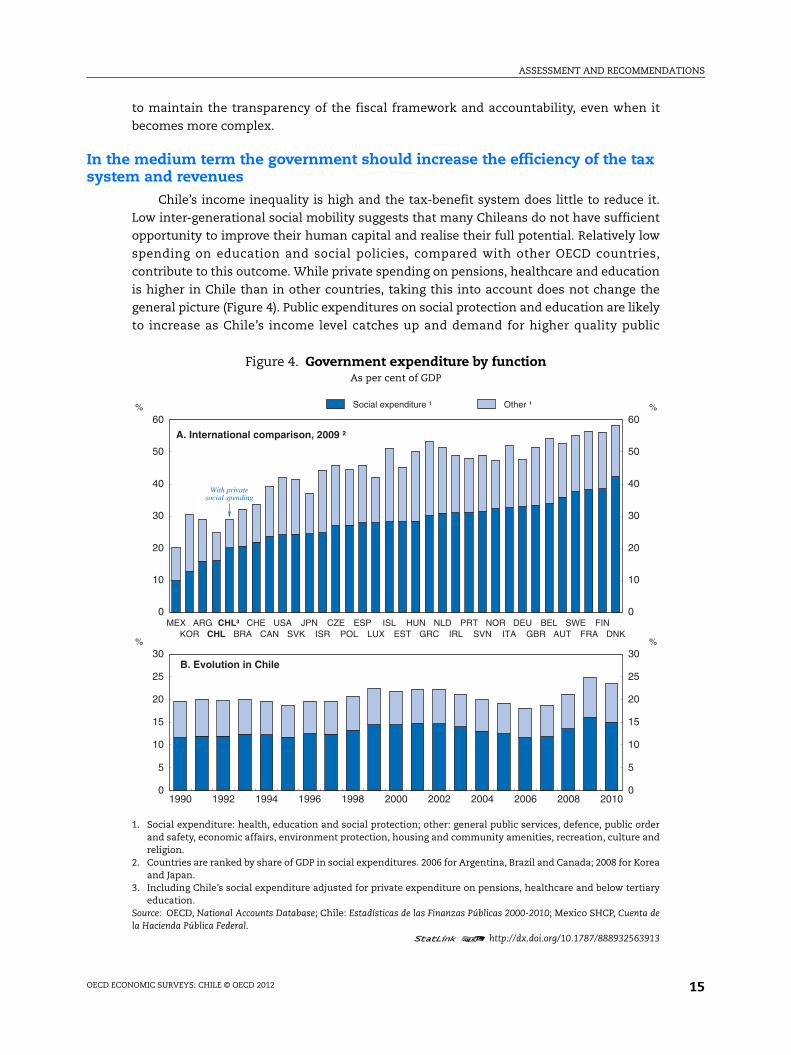
In the medium term the government should increase the efficiency of the tax system and revenues
Chile’s income inequality is high and the tax-benefit system does little to reduce it.
Low inter-generational social mobility suggests that many Chileans do not have sufficient
opportunity to improve their human capital and realise their full potential. Relatively low
spending on education and social policies, compared with other OECD countries,
contribute to this outcome. While private spending on pensions, healthcare and education
is higher in Chile than in other countries, taking this into account does not change the
general picture (Figure 4). Public expenditures on social protection and education are likely
to increase as Chile’s income level catches up and demand for higher quality public
Figure 4. Government expenditure by functionAs per cent of GDP
1. Social expenditure: health, education and social protection; other: general public services, defence, public orderand safety, economic affairs, environment protection, housing and community amenities, recreation, culture andreligion.
2. Countries are ranked by share of GDP in social expenditures. 2006 for Argentina, Brazil and Canada; 2008 for Koreaand Japan.
3. Including Chile’s social expenditure adjusted for private expenditure on pensions, healthcare and below tertiaryeducation.
Source: OECD, National Accounts Database; Chile: Estadísticas de las Finanzas Públicas 2000-2010; Mexico SHCP, Cuenta dela Hacienda Pública Federal.
1 2 http://dx.doi.org/10.1787/888932563913
0
10
20
30
40
50
60 %
0
10
20
30
40
50
60%
MEX ARG CHL³ CHE USA JPN CZE ESP ISL HUN NLD PRT NOR DEU BEL SWE FINKOR CHL BRA CAN SVK ISR POL LUX EST GRC IRL SVN ITA GBR AUT FRA DNK
A. International comparison, 2009 ²
With privatesocial spending
Social expenditure ¹ Other ¹
1990 1992 1994 1996 1998 2000 2002 2004 2006 2008 20100
5
10
15
20
25
30 %
0
5
10
15
20
25
30%
B. Evolution in Chile
OECD ECONOMIC SURVEYS: CHILE © OECD 2012 15

ASSESSMENT AND RECOMMENDATIONS
services becomes stronger. If properly designed, such spending increases would also
improve economic opportunities for the poor, thus enhancing Chile’s growth performance
and mitigating inequality. The government has indeed increased spending on education
and social policies significantly over recent years and envisages further increases. These
are long-term spending needs, which will require additional revenue sources. This should
be achieved through efficiency-enhancing measures, such as fighting tax evasion, closing
loopholes, reforming property taxation and introducing environmental taxes. Such
measures would correct distortions and aspects of the tax system that make it less
progressive, while helping to collect more revenue.
The overall tax base is dominated by indirect taxes (Figure 5), and the extent of VAT
evasion has been reduced to only 13% of potential revenue. However, one study puts the
rate of personal and corporate income tax evasion each at a bit below 50% (in 2003),
implying a loss of potential revenue of about 3 % of GDP (Joratt, 2009). Since then the rate
of corporate income tax evasion has declined to around 30% of potential revenues in 2009.
No recent estimates for personal income tax evasion are available, but assuming that these
followed a similar trend, the potential revenues loss from the personal and corporate
income tax would be around 2½ per cent of GDP. The tax authority should continue to
introduce best practice measures to identify tax fraud. There is considerable room for tax
avoidance in Chile, which can also facilitate evasion. One source is the large difference
between the top personal income tax rate (40%) and the corporate tax rate (17%,
temporarily increased to 20%), combined with numerous exemptions from capital gains
taxation, including on transactions of residential property and liquid assets traded on an
Figure 5. Tax revenue from different sources across countries20101
1. 2009 for Australia, Greece, Ireland, Japan, Mexico, Netherlands and Poland.2. Personal income tax collections include revenue from taxes on corporate income/profits in Chile and Mexico.Source: OECD, Revenue Statistics Database.
1 2 http://dx.doi.org/10.1787/888932563932
0
10
20
30
40
50% of GDP
0
10
20
30
40
50% of GDP
US
A
KO
R
AU
S
TU
R
JPN
IRE
SV
K
CH
E
GR
C
CA
N
PR
T
NZ
L
ES
P
PO
L
ISR
ES
T
CZ
E
GB
R
ISL
DE
U
LUX
HU
N
SV
N
NLD
AU
T
FIN
NO
R
FR
A
ITA
BE
L
SW
E
DN
K
CH
L ²
ME
X ²
VATSpecific goods and servicesSocial security contributions
Personal incomeCorporate incomeOther taxes
OECD ECONOMIC SURVEYS: CHILE © OECD 201216

ASSESSMENT AND RECOMMENDATIONS
exchange. This creates incentives for high-income individuals to keep their savings in
corporations created solely for that purpose (sociedades de inversion and sociedades
personales) and to declare parts of their income as corporate earnings. The government
should work to close these tax loopholes, for example by disallowing corporations which
have the sole purpose of tax avoidance. Broadening the tax base by limiting exemptions to
capital gains taxation would be another option. While this may limit or lock in some types
of investment, it would make for a more neutral tax system that is easier to administer
with fewer opportunities for tax avoidance.
One efficient way to increase tax revenues in the long run would be to raise mining
taxes, although this would involve difficult negotiations with the mining firms who
recently received an extension of tax stability guarantees in return for agreeing to higher
rates. Carefully designed taxes on natural resource rents are less harmful to growth than
other types of taxes. Chile’s current tax treatment of the mining industry is favourable by
international standards (Lopez, 2011), despite the recent increase in the royalty rate (from
5% to 8-9%). For instance, in Australia the effective net income tax on mining firms is
equivalent to more than twice the rate paid in Chile (Cenda, 2010). Colombia and Peru have
recently raised their mining taxes. There should be room for Chile to raise its taxes on
mining without discouraging investment, especially if these are accompanied with further
improvements in the business environment, as envisaged in the government’s
competitiveness agenda.
There is room to reform real estate taxation, for which there are many exemptions
that make this tax less progressive and distort investment decisions. As in most
OECD countries, homeowners’ imputed rental income is not subject to income tax.
However, mortgage interest payments are deductible from taxable income, with a generous
ceiling, and households generally do not pay capital gains tax on the sale of residential
property. The income from letting out houses smaller than 140 square meters that have
been built in line with certain provisions (Decreto con Fuerza de Ley No. 2, DFL2) is also tax
free. The government has recently limited the tax treatment for these so-called DFL2
properties to two houses per owner, but this does not apply to the existing stock of DFL2
properties. Such houses are generally exempted from inheritance tax and benefit from a
halving of property taxes up to 20 years after purchase. These advantages reduce tax
revenue by about ½ per cent of GDP, a bit more than half the amount currently spent on
housing subsidies. Partly as a result of this, property tax revenues are comparatively low in
Chile (Figure 6).
The first-best solution to make housing taxation more neutral – taxing homeowners’
imputed rental income – would be too complicated to implement. The government should
instead abolish loopholes and exemptions in the recurrent housing property tax and
consider higher rates, as taxes on real estate are generally less distortive than other taxes.
Revenues currently amount only to about half of their potential fiscal value, according to
government estimates. If raising property taxes sufficiently to replicate taxation of
imputed rents turned out to be politically too difficult, a gradual withdrawal of mortgage
interest deductibility would be warranted. More equal taxation relative to other
investments would avoid distortions and it would also make the tax system more
progressive, as wealthier homeowners tend to have higher value homes and benefit more
from income tax deductions. To limit distortions with respect to other assets, the value of
houses should be subject to the inheritance tax, and rental income should be subject to
income tax for all houses. Moreover, housing construction benefits from a reduced VAT
OECD ECONOMIC SURVEYS: CHILE © OECD 2012 17

ASSESSMENT AND RECOMMENDATIONS
rate, representing a distortion relative to other goods of final demand. The associated tax
benefit was capped in 2009, but limiting the benefit further would make the tax credit less
regressive and reduce the associated fiscal costs.
Chile could strengthen its environmental taxes to help make its economic growth less
carbon intensive (Figure 7). So far, the government has taken few measures to internalise
Figure 6. Recurrent taxes on residential immovable property1
As per cent of GDP, 2009
1. 2008 for Australia, Greece, Mexico, Netherlands, Poland and Portugal.Source: OECD, Tax Database and Development Center, Latin American Revenue Statistics.
1 2 http://dx.doi.org/10.1787/888932563951
Figure 7. The environmental impact of growth differs across countries2000-2008
1. The OECD area excludes Chile, Estonia, Israel and Slovenia.Source: OECD, Towards Green Growth: Monitoring Progress, OECD Indicators.
1 2 http://dx.doi.org/10.1787/888932563970
0.0
0.5
1.0
1.5
2.0
2.5
3.0
3.5
4.0%
0.0
0.5
1.0
1.5
2.0
2.5
3.0
3.5
4.0%
LUX CZE CHE AUT HUN BRA SVK SVN CHL PRT ESP KOR DNK IRL NZL FRA USA GBRGRC MEX TUR NOR ARG BEL DEU FIN NLD ITA SWE POL AUS ISL JPN ISR CAN
0 10 20 30 40 50 60 70-20
-10
0
10
20
30
40
50
60
70
Change in energy relatedCO2 emissions, %
Change of GDP, %
AUS
AUT
BEL
CANCHE
CHL
CZE
DEU
DNK
ESP
EST
FIN
FRA GBR
GRC
HUN
IRL
ISL
ISR
ITA
JPN
KOR
LUX
MEX
NLD
NOR NZL
OECD ¹POL
PRT
SVK
SVN
SWE
TUR
USA
Zone 1:no decoupling
Zone 2:relative, but no
absolute decoupling
Zone 3:absolute decoupling
OECD ECONOMIC SURVEYS: CHILE © OECD 201218
ASSESSMENT AND RECOMMENDATIONS
environmental externalities, such as greenhouse gas emissions. Chile’s environmental tax
revenues, which stem mainly from gasoline excise taxes, are low. Fossil fuels used in
industrial production processes and electricity generation are subject to VAT only, as are
highly-polluting solid fuels like coke and coal. Chile also has a price smoothing mechanism
for fossil fuels used in transport, which applies a subsidy or surtax to domestic prices when
they are outside a tolerance band around a weighted average of past and future prices on
international reference markets. This resulted effectively in a fossil fuel subsidy which cost
around 0.4% of GDP on average over 2000-09. The government has widened the tolerance
band significantly, from +/–5% to +/–12.5%, which is a step in the right direction. In the
future, the government wants to smooth prices through hedging operations on the
derivative markets, transferring net costs or benefits to consumers through lower taxes on
fossil fuels or surtaxes. Instead, however, the government should move towards
abandoning price smoothing altogether and internalise more of the externalities
associated with fossil fuels, perhaps by starting with higher taxes on road fuels in line with
their CO2 content and then broadening these taxes to other uses and fuels. Alternatively,
road fuels could be complemented with an emissions trading system.
The current monetary policy is broadly appropriateWith the economy running above full capacity, supportive fiscal policy and commodity
prices booming, the central bank was right to implement a quick withdrawal of monetary
stimulus. In Chile food and energy price shocks tend to pass through to headline and core
inflation much more quickly and strongly than in many other countries (Pedersen, 2010;
Pincheira and García, 2010). Thanks to early monetary policy reaction, the increase in
inflation since 2009 has been contained. Other factors also contributed to moderate
inflation growth, including comfortable profit margins in the food sector, which provided
room for suppliers to avoid raising prices one-to-one with international price increases.
The central bank has left the policy rate at 5.25% since July, close to its estimated neutral
level. With slowing inflation, well-anchored inflationary expectations and substantial
uncertainties regarding the global economy, monetary policy should remain on hold for the
moment. Should the downturn be stronger than expected, there is room for loosening.
In response to the strong copper price increases and – to a lesser extent – resurgent
capital inflows the real exchange rate appreciated strongly until mid-year, but has recently
depreciated strongly. For now, worries that capital inflows may contribute to a destabilising
boom-bust cycle are limited, as the new surge in capital inflows has been matched by an
almost equally strong increase in outflows, partly related to more flexible rules for pension
funds to invest abroad. Nevertheless, the Chilean central bank has implemented a foreign
exchange reserve purchase programme, with a total value of USD 12 billion in 2011. This
action has brought its reserve levels more in line with those in other emerging market
economies in a context of high uncertainty regarding commodity prices, fiscal stability and
the strength of the international recovery. Chile is well advised to accumulate some
reserves as a self-insurance against various shocks. However, accumulating foreign
exchange reserves through sterilised interventions is a costly way to do this, given the
interest rate differential with the United States.
Potential weaknesses in financial regulation need to be addressedThanks to careful regulation, Chile’s financial system is sound overall, with little
exposure to currency mismatches or the complex assets that have plagued financial
OECD ECONOMIC SURVEYS: CHILE © OECD 2012 19
ASSESSMENT AND RECOMMENDATIONS
institutions in other OECD countries. However, there are potential weaknesses. Household
indebtedness, while still lower than in most OECD countries, has almost doubled over the
last ten years, reaching 70% of disposable income in 2010. One of the fastest growing types
of credit has been credit cards issued by retailers, which are mainly directed at lower-
income households with difficulties in accessing bank credit. This now accounts for a third
of all outstanding consumer credit. So far, authorities consider that the total amount of
household debt is still manageable, but warrants close monitoring. The Superintendency of
Banks can effectively supervise credit cards issued by retailers only through information
provided by private auditors. The government should strengthen regulation to ensure that
all credit cards are regulated and supervised rigorously. The recent case of the country’s
fourth-largest retailer, who fraudulently underreported its credit-card portfolio in financial
statements, illegally rescheduled consumer credit without consulting card-holders, and is
now on the brink of bankruptcy, illustrates the need for stronger supervision and consumer
protection. The government is taking a number of measures in this direction. It has created
a financial consumer protection agency and required banks to report the cost of credit
more transparently. In addition, it plans to introduce a consolidated credit register for bank
and retail credit to households, which will be useful for credit issuers and the regulator to
assess risks, and to reverse the artificial segmentation of the credit market, which has
made market access more difficult and increased costs. The government has sent a draft
law to Congress to establish such a register, replacing a similar initiative launched in 2009,
which made little progress. This should become a priority. The register should include the
entire credit history of consumers.
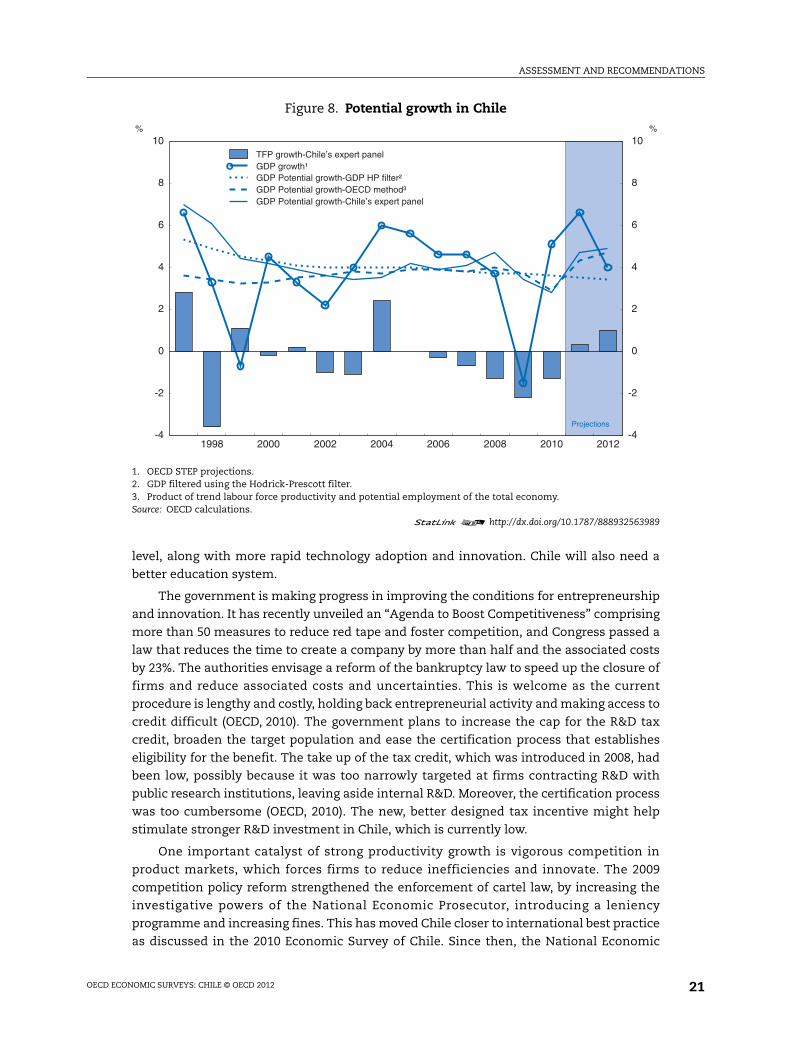
Stronger economic growth will require measures to reinforce productivity growth
The government has adopted the ambitious goal of attaining average annual growth
rates of 6% – a substantial increase from the average of the last ten years – and it wants to
create a million jobs over 2010-14. Yet, potential growth is estimated to be closer to 4-5%
percent than to 6% (Figure 8). Raising total factor productivity growth, which stagnated
over the last ten years, will require stronger competition to foster efficiency at the firm
Box 1. Recommendations to improve fiscal and monetary policies
● Once the external environment improves, and reconstruction nears completion returnto a structural fiscal balance to rebuild safety buffers in the sovereign wealth funds andensure medium-term fiscal sustainability.
● In the long term, to finance likely increases in spending on education and socialservices, continue fighting tax evasion and close tax loopholes associated with incomeand real estate taxes. Consider increasing mining taxes, immovable property andenvironmental tax rates.
● Strengthen the fiscal rule by establishing an independent fiscal council, as planned.
● With slowing growth and inflation, loosen monetary policy if the global economyworsens further.
● Introduce a consolidated credit register for household credit, including on debt fromnon-banks. Ensure that all credit card issuers are supervised rigorously.
OECD ECONOMIC SURVEYS: CHILE © OECD 201220
ASSESSMENT AND RECOMMENDATIONS
level, along with more rapid technology adoption and innovation. Chile will also need a
better education system.
The government is making progress in improving the conditions for entrepreneurship
and innovation. It has recently unveiled an “Agenda to Boost Competitiveness” comprising
more than 50 measures to reduce red tape and foster competition, and Congress passed a
law that reduces the time to create a company by more than half and the associated costs
by 23%. The authorities envisage a reform of the bankruptcy law to speed up the closure of
firms and reduce associated costs and uncertainties. This is welcome as the current
procedure is lengthy and costly, holding back entrepreneurial activity and making access to
credit difficult (OECD, 2010). The government plans to increase the cap for the R&D tax
credit, broaden the target population and ease the certification process that establishes
eligibility for the benefit. The take up of the tax credit, which was introduced in 2008, had
been low, possibly because it was too narrowly targeted at firms contracting R&D with
public research institutions, leaving aside internal R&D. Moreover, the certification process
was too cumbersome (OECD, 2010). The new, better designed tax incentive might help
stimulate stronger R&D investment in Chile, which is currently low.
One important catalyst of strong productivity growth is vigorous competition in
product markets, which forces firms to reduce inefficiencies and innovate. The 2009
competition policy reform strengthened the enforcement of cartel law, by increasing the
investigative powers of the National Economic Prosecutor, introducing a leniency
programme and increasing fines. This has moved Chile closer to international best practice
as discussed in the 2010 Economic Survey of Chile. Since then, the National Economic
Figure 8. Potential growth in Chile
1. OECD STEP projections.2. GDP filtered using the Hodrick-Prescott filter.3. Product of trend labour force productivity and potential employment of the total economy.Source: OECD calculations.
1 2 http://dx.doi.org/10.1787/888932563989
1998 2000 2002 2004 2006 2008 2010 2012-4
-2
0
2
4
6
8
10 %
-4
-2
0
2
4
6
8
10%
Projections
oTFP growth-Chile’s expert panelGDP growth¹GDP Potential growth-GDP HP filter²GDP Potential growth-OECD method³GDP Potential growth-Chile’s expert panel
OECD ECONOMIC SURVEYS: CHILE © OECD 2012 21
ASSESSMENT AND RECOMMENDATIONS
Prosecutor has trained its personnel and hired new experts. Yet the government will need
to do more to make the new law effective. Cartel fines remain too low (one recent fine
amounted to USD 13 million, a mere 0.1% of the company’s revenues in 2010), no advances
have been made in making price fixing a criminal offence, and the leniency programme is
hardly used, probably owing to low legal certainty, as participants are not exempted from
sanctions. The government should link maximum fines to firms’ revenues, establish legal
certainty for participants in leniency programmes and make price-fixing a criminal
offense. Stronger competition would lower rents and create opportunities for newcomers
with a potential to reduce inequality.
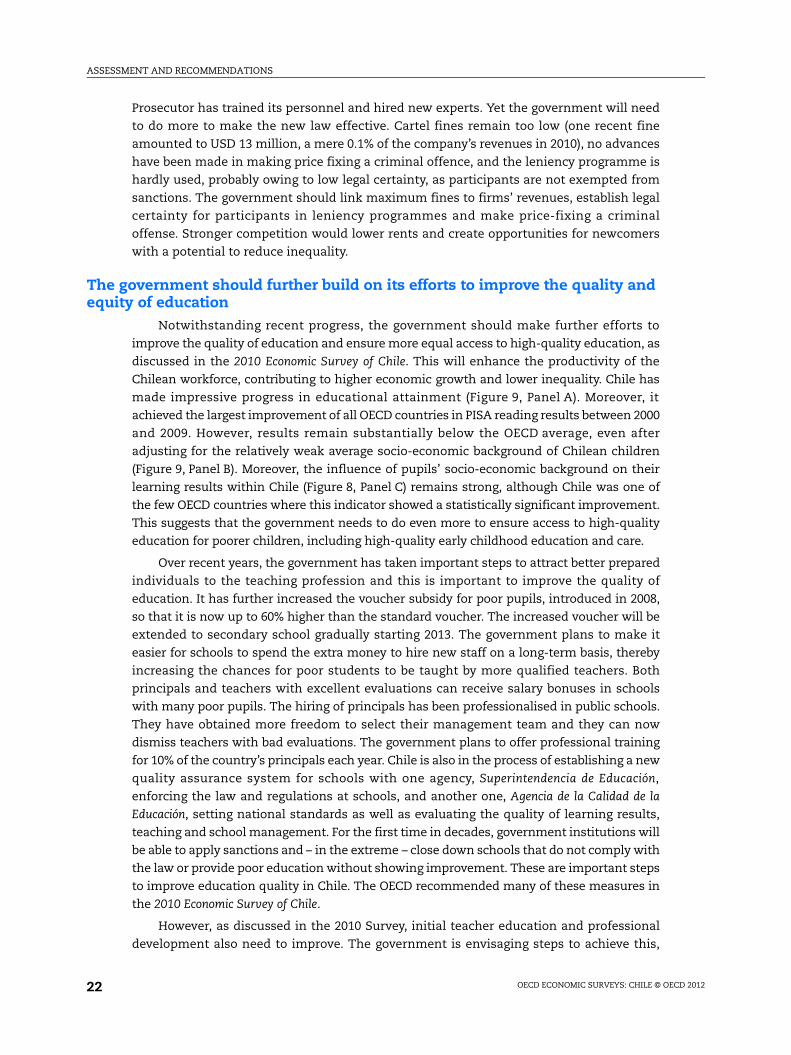
The government should further build on its efforts to improve the quality and equity of education
Notwithstanding recent progress, the government should make further efforts to
improve the quality of education and ensure more equal access to high-quality education, as
discussed in the 2010 Economic Survey of Chile. This will enhance the productivity of the
Chilean workforce, contributing to higher economic growth and lower inequality. Chile has
made impressive progress in educational attainment (Figure 9, Panel A). Moreover, it
achieved the largest improvement of all OECD countries in PISA reading results between 2000
and 2009. However, results remain substantially below the OECD average, even after
adjusting for the relatively weak average socio-economic background of Chilean children
(Figure 9, Panel B). Moreover, the influence of pupils’ socio-economic background on their
learning results within Chile (Figure 8, Panel C) remains strong, although Chile was one of
the few OECD countries where this indicator showed a statistically significant improvement.
This suggests that the government needs to do even more to ensure access to high-quality
education for poorer children, including high-quality early childhood education and care.
Over recent years, the government has taken important steps to attract better prepared
individuals to the teaching profession and this is important to improve the quality of
education. It has further increased the voucher subsidy for poor pupils, introduced in 2008,
so that it is now up to 60% higher than the standard voucher. The increased voucher will be
extended to secondary school gradually starting 2013. The government plans to make it
easier for schools to spend the extra money to hire new staff on a long-term basis, thereby
increasing the chances for poor students to be taught by more qualified teachers. Both
principals and teachers with excellent evaluations can receive salary bonuses in schools
with many poor pupils. The hiring of principals has been professionalised in public schools.
They have obtained more freedom to select their management team and they can now
dismiss teachers with bad evaluations. The government plans to offer professional training
for 10% of the country’s principals each year. Chile is also in the process of establishing a new
quality assurance system for schools with one agency, Superintendencia de Educación,
enforcing the law and regulations at schools, and another one, Agencia de la Calidad de la
Educación, setting national standards as well as evaluating the quality of learning results,
teaching and school management. For the first time in decades, government institutions will
be able to apply sanctions and – in the extreme – close down schools that do not comply with
the law or provide poor education without showing improvement. These are important steps
to improve education quality in Chile. The OECD recommended many of these measures in
the 2010 Economic Survey of Chile.
However, as discussed in the 2010 Survey, initial teacher education and professional
development also need to improve. The government is envisaging steps to achieve this,
OECD ECONOMIC SURVEYS: CHILE © OECD 201222
ASSESSMENT AND RECOMMENDATIONS
including improvements in accreditation standards. Although accreditation has been
mandatory for some years, a number of teacher candidates are still enrolled in special
programmes for initial teacher education (Programas Especiales de Titulación) which are
inadequate regarding the quality of their educators and teaching programmes (Ruffinelli
and Sepúlveda, 2005). The government will create a new agency, the Superintendencia de
Educación Superior, that would be responsible for quality assurance and enforcement of laws
in higher education, which could help in this respect. It is also in the process of developing
standards for teacher education, albeit voluntary. Furthermore, the government developed
an external exit exam for primary school teacher candidates, called Programa Inicia, which
has revealed serious knowledge deficiencies among many candidates. A proposed law
would make the exam mandatory for all candidate teachers to teach in publicly-subsidised
Figure 9. Educational attainment and outcomes
1. Excluding ISCED 3C short programmes.Source: OECD, Literacy in the Information Age 2000; Education at a Glance 2011; PISA 2009 Overcoming Social Background:Equity in Learning Opportunities and Outcomes, Vol. 2: Analysis, OECD, Paris.
1 2 http://dx.doi.org/10.1787/888932564008
0
20
40
60
80
100 %
0
20
40
60
80
100%
Secondary Tertiary
A. Upper secondary and tertiary attainment (age groups 25-34 and 55-64), 2009 ¹
TUR MEX PRT BRA FIN KOR OECD CHL
25-34 55-64
25-3455-64
350
400
450
500
550
600 Score
350
400
450
500
550
600Score
B. PISA reading mean score, 2009
OECD average
KOR CAN JPN NLD NOR POL USA DEU FRA GBR PRT GRC CZE LUX TUR MEX ARGFIN NZL AUS BEL CHE ISL SWE IRL DNK HUN ITA ESP SVK AUT CHL BRA
Unadjusted reading mean scoreAdjusted for socio-economic background
0
5
10
15
20
25
30%
0
5
10
15
20
25
30%
PER URY BEL CHL LUX USA AUT COL POL DNK SVN GBR SWE NLD IRL ISR ITA CAN NOR ESTHUN ARG TUR PAN DEU FRA NZL PRT SVK MEX CHE ESP BRA AUS GRC CZE KOR JPN FIN ISL
C. Impact of socio-economic background on PISA, 2009% of variance in performance explained by the PISA index of economic, social and cultural status (r-squared x 100)
OECD ECONOMIC SURVEYS: CHILE © OECD 2012 23
ASSESSMENT AND RECOMMENDATIONS
schools. Introducing a notion of pass and fail into the exam and gradually developing it
into a final exit exam as a prerequisite to obtain a teacher license would be one option to
control quality in teacher education, which remains very uneven, as discussed in the
2010 Survey. Applying stricter entry standards for teacher education would be an
alternative. The government has done this to some extent by offering scholarships for
students with good university entry exam results who choose the teaching profession.
Universities that accept students with these scholarships also have to introduce a
minimum score in the university entry exam for other teacher students.
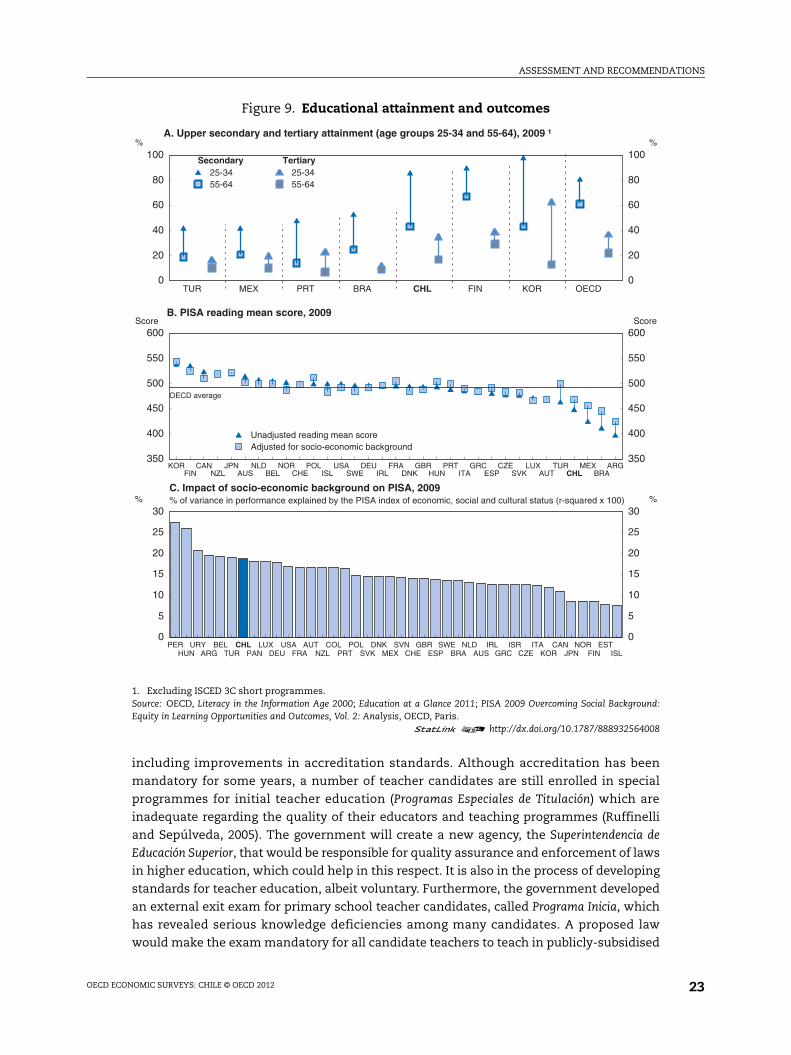
The coverage of tertiary education has increased impressively (Figure 8, Panel A).
Chileans spend substantially on tertiary education in terms of GDP, but public per student
spending as a ratio to GDP per capita is the second lowest across OECD countries
(Figure 10). In part this owes to comparatively high university fees relative to most
OECD countries (OECD and World Bank, 2009). These leave many students highly indebted
compared to the situation in most OECD countries (OECD and World Bank, 2009), with
limited mechanisms to reduce risks. Chilean budget figures show that between 2005 and
2012, public expenditure on tertiary education, including financial aid has almost doubled,
albeit from a low base. Chile has a wide array of scholarship programmes with different
eligibility criteria but a good part of them is only available to students from a group of
traditional universities belonging to the so-called “Consejo de Rectores”. A subsidised
student loan scheme (Fondo Solidario de Crédito Universitario) with a real interest rate of 2% is
similarly limited. Only a much more expensive scheme with a real interest rate of 6%, the
guaranteed student loan (Crédito con Aval del Estado), is available to students from other
Figure 10. Per student expenditures in tertiary education20081
1. 2009 for Chile.2. Including loan subsidies and scholarships.Source: OECD, Education at a Glance, 2011.
1 2 http://dx.doi.org/10.1787/888932564027
0 10 20 30 40 50 60 70
ITA
CZE
KOR
IRL
POL
NZL
ESP
AUS
FRA
DEU
BEL
NLD
PRT
DNK
JPN
MEX
SWE
GBR
CAN
USA
% of GDP per capita
Public ²Private
Chile
OECD
OECD ECONOMIC SURVEYS: CHILE © OECD 201224

ASSESSMENT AND RECOMMENDATIONS
higher-education institutions, including vocational training, which are more likely to be
attended by lower-income students Nevertheless, this scheme introduced in 2006
facilitated access to tertiary education for poorer students.
The government announced a broadening of scholarship schemes and credits for low-
income students. Interest on the guaranteed student loan scheme will be lowered to 2% and
the long-term goal is to allow all students, whose families belong to the poorest 40% of the
population, to study with scholarships. Students whose household income belongs to the
20% above that would receive a combination of grants and loans. These plans follow
standard OECD recommendations. The government should tie enhanced financing of
education demand to stricter quality standards for universities that enrol students who
receive subsidies. A new quality assurance agency, that the government plans to introduce
for higher education, would be a means to define and enforce such standards, as would
stricter accreditation. The government plans to introduce an income-contingent repayment
scheme for student loans, as recommended in the 2010 Survey. This would make tertiary
education more accessible, including for low-income students applying for technical
training, where skill shortages are particularly pronounced according to employers.
Higher cash transfers can help reduce poverty and strengthen economic growth
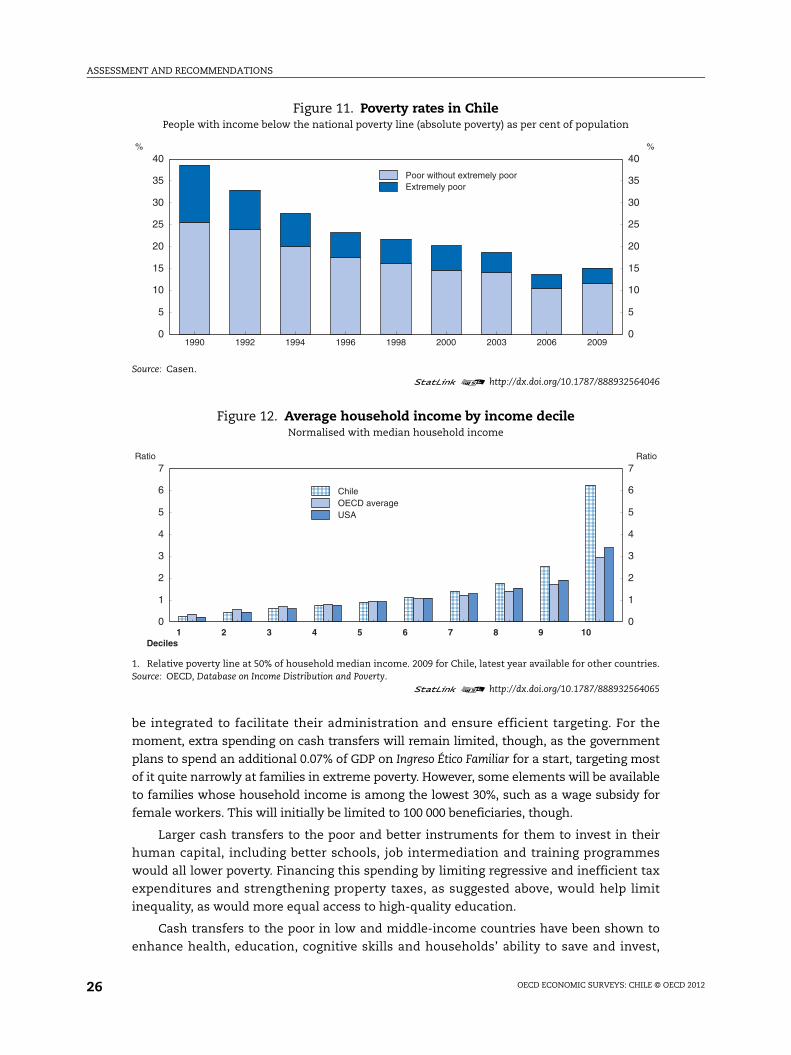
Poverty has declined substantially over the last twenty years (Figure 11) and it is now
among the lowest in Latin America, though it remains high in OECD comparison. The
income distribution is narrow at the lower end with income of many households hovering
around the poverty line. Moreover, the unusually large gap between top and mean incomes
contributes to a level of income inequality that is exceptionally high by OECD (Figure 12)
standards. Given a low share of progressive direct taxes in overall tax revenues, the
redistributive effect of the tax system is limited as well. Overall, taxes and benefits in Chile
hardly lower the Gini coefficient, in sharp contrast to most OECD countries (see Figure 1),
where they have a strong impact on the distribution of income.
The government is set to increase cash transfers to the poor through a new programme
called Ingreso Ético Familiar. This is welcome, as Chile’s cash transfers are well targeted to the
poor, yet they are too modest to achieve a substantive redistribution. The new cash transfer
should build on the infrastructure of existing ones. Over time different cash transfers should
Box 2. Recommendations to strengthen economic growth
● Ease bankruptcy procedures (OECD, 2010).
● Strengthen the new competition law by linking maximum fines to firms’ revenues,establishing legal certainty for participants in leniency programme and turning pricefixing into a criminal offense (OECD, 2010).
● Apply strict accreditation procedures to initial teacher education programmes andconsider using the new external exit exam to license teacher candidates based onminimum standards (OECD, 2010).
● Streamline and extend student loans and scholarship schemes, making them availableto every student of accredited institutions on the same terms, while strengtheningquality standards for all institutions that enroll students benefitting from subsidies.Introduce income-contingent repayment schemes (OECD, 2010).
OECD ECONOMIC SURVEYS: CHILE © OECD 2012 25
ASSESSMENT AND RECOMMENDATIONS
be integrated to facilitate their administration and ensure efficient targeting. For the
moment, extra spending on cash transfers will remain limited, though, as the government
plans to spend an additional 0.07% of GDP on Ingreso Ético Familiar for a start, targeting most
of it quite narrowly at families in extreme poverty. However, some elements will be available
to families whose household income is among the lowest 30%, such as a wage subsidy for
female workers. This will initially be limited to 100 000 beneficiaries, though.
Larger cash transfers to the poor and better instruments for them to invest in their
human capital, including better schools, job intermediation and training programmes
would all lower poverty. Financing this spending by limiting regressive and inefficient tax
expenditures and strengthening property taxes, as suggested above, would help limit
inequality, as would more equal access to high-quality education.
Cash transfers to the poor in low and middle-income countries have been shown to
enhance health, education, cognitive skills and households’ ability to save and invest,
Figure 11. Poverty rates in ChilePeople with income below the national poverty line (absolute poverty) as per cent of population
Source: Casen.1 2 http://dx.doi.org/10.1787/888932564046
Figure 12. Average household income by income decileNormalised with median household income
1. Relative poverty line at 50% of household median income. 2009 for Chile, latest year available for other countries.Source: OECD, Database on Income Distribution and Poverty.
1 2 http://dx.doi.org/10.1787/888932564065
0
5
10
15
20
25
30
35
40 %
0
5
10
15
20
25
30
35
40 %
1990 1992 1994 1996 1998 2000 2003 2006 2009
Poor without extremely poorExtremely poor
0
1
2
3
4
5
6
7Ratio
0
1
2
3
4
5
6
7Ratio
1 2 3 4 5 6 7 8 9 10Deciles
ChileOECD averageUSA
OECD ECONOMIC SURVEYS: CHILE © OECD 201226

ASSESSMENT AND RECOMMENDATIONS
often with high rates of return (Hanlon et al., 2010; Fiszbein and Schady, 2009). These are
important factors for workers’ productivity and their ability to earn better incomes. One
way to make the system more transparent and ensure that features such as the withdrawal
rate and overall transfer size can be managed efficiently would be to further integrate
different cash transfers for the poor over time, as planned. Ending poverty through higher
cash transfers alone would be affordable for Chile. Even though this may seem surprising
given still substantial poverty rates, OECD Secretariat calculations suggest that the country
would have to invest less than 1% of GDP to lift all households above the current national
poverty line (for similar results see also Larrañaga, 2009). This reflects in part the narrow
income distribution at the lower end. This calculation, however, is based on a pure
accounting exercise without considering behavioural adjustments.
Transfer size also plays a role for people’s ability to invest in their human capital and
for their work incentives. Research suggests that the positive impact of transfers on school
enrolment, health and cognitive skills increases with higher transfers, although there are
signs of diminishing returns. At the same time, larger transfers may at some point start to
undermine work incentives. There are only a few studies that have found a negative
impact of cash transfers in low-income and emerging countries on employment and labour
participation, but they are sometimes found in countries where transfers are relatively
large, such as South Africa. It may thus be sensible to tie additional benefit receipt to work
and job search requirements, if the government decided to increase cash transfers to the
poor substantially. Ingreso Ético will come with a requirement for adult members to enrol in
an employment programme, which could be a coach who helps recipients find a job and
improve their employability according to current thinking. In the future, once the basis of
Ingreso Ético is well established, the government could try out different increases in the
transfer size in pilot studies to assess whether this would be a cost-effective instrument to
further enhance well-being, human capital and employment.
The government plans to tie part of the benefit for the extremely poor to children’s
participation in health checks and regular school attendance. Families can receive an extra
bonus dependent on their children’s ranking in their class and there will be one-off
bonuses for jobless adults who find employment rapidly or complete secondary education.
The government also plans to introduce further bonuses for different achievements in the
areas of health, education and savings for families belonging to the three lowest income
deciles and a wage subsidy for women. While some studies suggest that well-designed
conditionality can have extra benefits, overall the evidence is mixed. At the same time,
conditionality can be costly to enforce. Unlike in other countries in the region, the
incidence of malnutrition among children in Chile is low (comparable to that in the richest
OECD countries), school attendance is compulsory and it is generally high, although in the
target group almost 60% of the children miss more than 5% of their classes. Thus
conditions regarding medical checkups and higher school attendance are in some sense
redundant, although they may create further incentives for poor families to comply with
the law. However, overall there should be a careful cost-benefit analysis for further
conditions. In particular, tying a large part of the benefits to children’s ranking in school
should be revisited, as it can be divisive. It will put a lot of pressure on teachers grading
these children and discourage parents from sending their children to better schools.
More generally, rather than tying different parts of the benefit to different conditions,
the government may want to consider a simpler design. This could be a base benefit for
households without market income, tied to work and job search requirements only, which
OECD ECONOMIC SURVEYS: CHILE © OECD 2012 27

ASSESSMENT AND RECOMMENDATIONS
is gradually withdrawn as household income increases. This would also be an opportunity
to open benefits to families within a wider income range over time. Given the narrow
distribution of low incomes in Chile, discrete cut-off points for benefits, which are used
today, exclude from cash transfers many households who are hardly richer than benefit
recipients. In addition, low-income households tend to move frequently into and out of
poverty in Chile (Neilson et al., 2008), but the proxy means test is rarely updated, so people
who have left poverty may continue to receive benefits, while others who qualify may not.
In such a context, withdrawing benefits gradually as income increases may be perceived as
fairer and it should have a positive effect on incentives to work and provide accurate
information when the government establishes eligibility.
The government plans to simplify the proxy means test for social programmes, update
it more frequently and improve the fight against fraud by cross-checking with administrative
data and using risk models. This is welcome. Currently, the test assigns scores to households
based on a wide range of information that is not routinely verified or updated and the
government uses econometric test to build the final score. The government will need to build
substantial administrative capacity to better verify the data provided by households and to
fight fraud. This will be costly, but also beneficial, as it would also help the government to
reduce tax evasion. To reduce costs and allow for more frequent updates, the government
should consider moving to a means test mainly based on declared income, perhaps
complemented with a few indicators, which are relevant for the programme. This should be
feasible, in particular if the government steps up its administrative capacity. Even in the
lower half of the income distribution, it is possible to verify all income sources with
administrative data for nearly 50% of all households (Comité de Expertos, 2010). This could
be complemented with random verifications at benefit recipients’ homes and workplaces.
Brazil runs a very successful cash transfer programme which is less narrowly targeted than
Chile’s, with a means test that considers declared income and the number of children only.
The quality of schools, healthcare, public employment and other social services will be
key for the ability of Ingreso Ético recipients to invest gainfully in human capital and reach their
full potential. Municipalities administer schools, as well as social and employment
programmes that accompany cash transfers for the poor, but they differ widely in resources
and the capacity of their personnel to administer these programmes. The main source of own
income for municipalities are property taxes, but these are subject to relatively high exemption
thresholds, and thus revenues in poor municipalities with a lot of low-value housing are very
weak. There is some redistribution of property tax revenues through the Fondo Común Municipal
and there are central government transfers for various municipal tasks, including for the
administration of cash transfers. However, the resulting degree of equalisation is weak
compared with other OECD countries. Table 2 shows the ratio of average revenues per capita
of the richest decile of municipalities to those of the poorest decile of municipalities, before
and after fiscal equalisation. Even after fiscal equalisation, the disparities remain large in
Chile.
The central government is currently envisaging larger transfers to municipalities with
low tax revenues and a scheme to improve the qualification of the personnel who
administer municipalities and this is welcome. Poorer municipalities need more resources
to provide their citizens with high-quality services that help them overcome poverty. In the
medium term, the government should consider developing fiscal equalisation further.
Increasing property tax revenues along the lines suggested above would provide
municipalities with vital extra resources.
OECD ECONOMIC SURVEYS: CHILE © OECD 201228
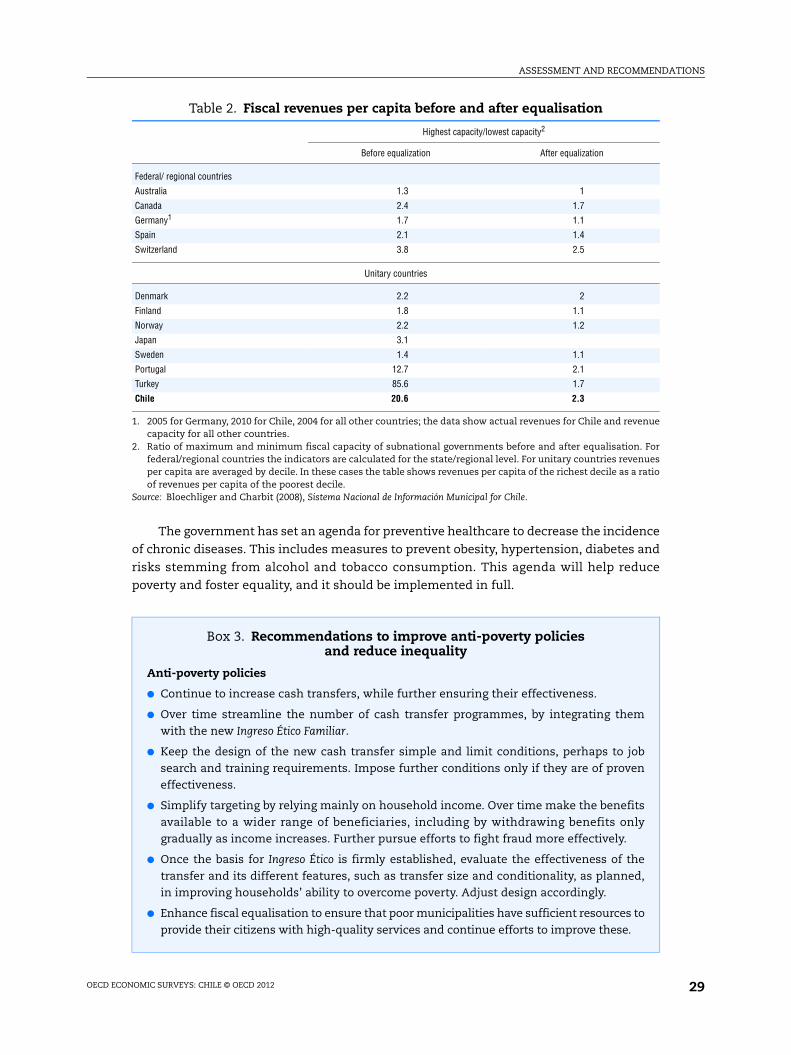
ASSESSMENT AND RECOMMENDATIONS
The government has set an agenda for preventive healthcare to decrease the incidence
of chronic diseases. This includes measures to prevent obesity, hypertension, diabetes and
risks stemming from alcohol and tobacco consumption. This agenda will help reduce
poverty and foster equality, and it should be implemented in full.
Table 2. Fiscal revenues per capita before and after equalisation
Highest capacity/lowest capacity2
Before equalization After equalization
Federal/ regional countries
Australia 1.3 1
Canada 2.4 1.7
Germany1 1.7 1.1
Spain 2.1 1.4
Switzerland 3.8 2.5
Unitary countries
Denmark 2.2 2
Finland 1.8 1.1
Norway 2.2 1.2
Japan 3.1
Sweden 1.4 1.1
Portugal 12.7 2.1
Turkey 85.6 1.7
Chile 20.6 2.3
1. 2005 for Germany, 2010 for Chile, 2004 for all other countries; the data show actual revenues for Chile and revenuecapacity for all other countries.
2. Ratio of maximum and minimum fiscal capacity of subnational governments before and after equalisation. Forfederal/regional countries the indicators are calculated for the state/regional level. For unitary countries revenuesper capita are averaged by decile. In these cases the table shows revenues per capita of the richest decile as a ratioof revenues per capita of the poorest decile.
Source: Bloechliger and Charbit (2008), Sistema Nacional de Información Municipal for Chile.
Box 3. Recommendations to improve anti-poverty policies and reduce inequality
Anti-poverty policies
● Continue to increase cash transfers, while further ensuring their effectiveness.
● Over time streamline the number of cash transfer programmes, by integrating themwith the new Ingreso Ético Familiar.
● Keep the design of the new cash transfer simple and limit conditions, perhaps to jobsearch and training requirements. Impose further conditions only if they are of proveneffectiveness.
● Simplify targeting by relying mainly on household income. Over time make the benefitsavailable to a wider range of beneficiaries, including by withdrawing benefits onlygradually as income increases. Further pursue efforts to fight fraud more effectively.
● Once the basis for Ingreso Ético is firmly established, evaluate the effectiveness of thetransfer and its different features, such as transfer size and conditionality, as planned,in improving households’ ability to overcome poverty. Adjust design accordingly.
● Enhance fiscal equalisation to ensure that poor municipalities have sufficient resources toprovide their citizens with high-quality services and continue efforts to improve these.
OECD ECONOMIC SURVEYS: CHILE © OECD 2012 29

ASSESSMENT AND RECOMMENDATIONS
The poor, women and youth need more assistance to improve their employability
The ability to secure employment will be essential for the poor and other
disadvantaged groups to leave poverty. In international comparison, the incidence of
inactivity and unemployment is high among the poor, youth and women (Figure 13).
Many local labour offices (Oficinas Municipales de Intermediación Laboral, OMIL) lack
sufficient financing and experienced personnel who are able to engage with local
businesses and use the programmes designed by the central government to support low-
skilled workers in upgrading their skills and finding a job. Some local labour offices do not
have basic equipment. The central government is in the process of providing them with
more funds and training, but resources remain small. These important efforts should
continue and be strengthened. The government has also introduced a national online tool
to facilitate job matching, the Bolsa Nacional de Empleo, and it has started engaging private
job intermediaries for candidates who are hard to place. It plans to integrate public and
Box 3. Recommendations to improve anti-poverty policies and reduce inequality (cont.)
Additional measures to reduce inequality
● Build on efforts to improve the quality of publicly-financed secondary education,including by further increasing the special voucher for poor children, and reforming thescholarship and loans system for tertiary education to make access more equitable.
● To finance higher spending on education and social services, phase out income,property and inheritance tax exemptions and loopholes, that make the tax system lessprogressive, and fight tax evasion.
● Improve product market competition by strengthening the anti-cartel law and thebusiness environment with the Agenda for Competiveness.
● Implement the preventive healthcare agenda in full.
Figure 13. Young people and women in the labour marketAverage 2000-09
Source: OECD, Labour Force Statistics Database.1 2 http://dx.doi.org/10.1787/888932564084
0
20
40
60
80%
15-64 All persons
15-24 15-64 Women
15-24
Labour force participation
0
20
40
60
80 %
15-64 All persons
15-24 15-64 Women
15-24
Employment ratio
Chile OECD
0
5
10
15
20
25
30 %
15-64 All persons
15-24 15-64 Women
15-24
Unemployment
OECD ECONOMIC SURVEYS: CHILE © OECD 201230

ASSESSMENT AND RECOMMENDATIONS
private job intermediation with publicly-funded training programmes and this is welcome.
OECD experience suggests that engaging private providers can be useful, but contracts and
remuneration schemes should ensure that private providers do not cherry pick, but instead
engage also with the more difficult cases and find durable employment for them. The
government needs to follow up on private agencies’ performance in providing training and
job intermediation as well as fight fraud. The government also plans to require Ingreso Ético
recipients to participate in employment programmes, possibly administered by a personal
coach. All of this is welcome in principle, but the government should make sure that efforts
to strengthen job intermediation are well co-ordinated.
More than 90% of the central government budget for training measures is currently
devoted to tax breaks for companies that decide to send their staff on training with
certified institutions. Take-up is strongest among larger companies for their higher-skilled
staff, the programme is obviously not available for the unemployed, and recent evaluations
suggest that it has little or no long-term effect on wages or employment. The central
government commissioned a technical report that evaluated existing training measures. It
should use this opportunity to expand effective programmes, phase out or reform
ineffective ones and focus training more on jobseekers with low qualifications. A better
integration of the national training agency Servicio Nacional de Capacitación y Empleo (SENCE)
with local labour offices is likely to make active labour market policies overall more
effective (OECD, 2009a). The government considers establishing a permanent commission
that will regularly review training programmes.
To better protect workers against unemployment and enhance efficiency, Chile should
build on recent efforts to strengthen unemployment benefits further. When the system was
introduced in 2002 the government started out with moderate benefits to assess
sustainability first. Since then benefits have increased somewhat. The system is based on
individual savings accounts and a complementary insurance fund, but savings in individual
accounts are low for most workers; a large minority have accumulated less than one month’s
minimum wage. Access to the insurance fund was very restrictive until recently, so that most
workers could benefit only from savings in their individual accounts. A recent reform eased
access to the insurance fund, thereby improving chances for workers with indefinite
contracts to obtain five monthly payments, declining from 50% to 30% of previous wages.
Temporary workers can now access the insurance fund for two monthly payments with
replacement rates of 35% and 30%. However, only around 15% of eligible workers exercise
their right to use the fund, suggesting a lack of information about the new system. To address
this, the government will require the administrator of the funds to carry out information
campaigns, and this is welcome. Once it is better established, strengthening unemployment
benefits further could help contribute to higher productivity, as this allows workers to search
longer for a better job match. While unemployment benefits can undermine work incentives,
this effect is unlikely to dominate in Chile because replacement rates and the duration of
benefit receipt are very low (Figure 14). Chile could gradually increase the unemployment
benefit duration and/ or replacement rates, while carefully evaluating the effect on the
quality of job matches and job search intensity.
Extending unemployment benefits would be an opportunity to limit severance pay
and make it more neutral. Currently, severance pay is the main pillar of protection against
unemployment, but it is not effective for many workers and it is likely to contribute to
labour market duality. Temporary workers and workers with short tenure, who are not
eligible for severance pay, account for the bulk of job turnover. Only 6% of dismissed
OECD ECONOMIC SURVEYS: CHILE © OECD 2012 31

ASSESSMENT AND RECOMMENDATIONS
workers are eligible for severance pay, suggesting that employers go to a considerable
length to avoid paying it. There seems to be a dual labour market, where a part of the
workforce has considerable job security, but the rest face unstable work relationships with
lower chances for training and career progression and a higher risk of paying the cost of
crises. Severance pay has been shown to reduce the employment chances of young
workers (Pages and Montenegro, 2009) and productivity and output growth (Caballero et al.,
2006; Micco and Pages, 2006). In return for lower severance pay, employers could be
required to provide higher contributions to the individual savings accounts of all workers
or to the unemployment insurance fund, which would avoid higher costs for indefinite
contracts and thus the ensuing distortions. This could enhance acceptance of the reform,
as workers consider severance pay as an acquired right.
The government needs to do more to promote female labour market participation, not
least because the incidence of poverty among jobless women is high. It plans to implement
a wage subsidy for women as part of Ingreso Ético, similar to a subsidy for low-wage workers
under 25 from poor families introduced in 2009. While OECD experience with in-work
benefits suggests that they are associated with positive, albeit small, employment effects,
the subsidy for young workers and the root causes of low female labour participation
should be evaluated before extending the scheme. Other measures that could help
promote female labour force participation include continuing efforts to increase the
number of publicly subsidised childcare places of high quality, as coverage remains low
despite considerable efforts over recent years to extend it (Figure 15). Residential
segregation may be an important cause of low female labour participation, because to
accept a full-time job mothers who need to commute for one to two hours would need
childcare for much longer than what is available. Measures to enhance residential mobility
and limit segregation suggested below will thus be very important.
In contrast, the provision in the labour law that obliges firms with more than
19 female employees to provide childcare should be scrapped or made gender-neutral to
avoid undermining women’s employment opportunities. The government has also
increased paid maternity leave from 12 to 24 weeks after childbirth. The extension in paid
maternity leave is welcome as OECD experience suggests that an increase from such a low
Figure 14. Unemployment benefit replacement rates (net of taxes), 2009Average for four family types and two earnings levels1
1. Unweighted averages (single and one-earner married couple with no children and lone parent and one earnermarried couple with two children) for earnings levels of 67% and 100% of average worker income, without socialassistance.
2. Initial phase of unemployment but following any waiting period.Source: OECD, Tax-Benefits Models.
1 2 http://dx.doi.org/10.1787/888932564103
0
20
40
60
80
100 %
0
20
40
60
80
100%
CHL TUR ITA USA EST CHE CAN CZE POL NLD SWE PRT FRA IRL AUT DEU BELKOR ISR JPN SVK HUN LUX GRC SVN ESP NOR ISL AUS GBR NZL FIN DNK
Over 60 months of unemployment Initial phase of unemployment²
OECD ECONOMIC SURVEYS: CHILE © OECD 201232

ASSESSMENT AND RECOMMENDATIONS
level can have beneficial effects on both child development and mothers’ attachment to
the labour market. At the same time the government has pursued fraud, which has been
widespread, more strictly and with success.
Figure 15. Coverage with early childhood education and care across OECD countries
Share of children in formal childcare or in educational pre-school programmes, 2008
Source: OECD, Family Database.1 2 http://dx.doi.org/10.1787/888932564122
Box 4. Recommendations on labour market policies
● Continue strengthening local labour offices to improve their capacity to help theunemployed. Make sure that private employment agencies have incentives to attend tolow-skilled workers.
● Evaluate training programmes, streamline based on results and focus more on low-skilled workers and women.
● Extend unemployment benefits further and limit severance pay, while increasingemployers’ contributions to individual savings accounts or the unemploymentinsurance fund. Evaluate the effects of longer unemployment benefit duration and/orhigher benefit levels to improve the design if needed.
● Evaluate the in-work benefit for poor, young workers and – if found successful – considerextending it to other groups.
● Continue efforts to extend the availability of affordable, high-quality nursery andkindergarten places, while lifting the requirement for firms to offer kindergarten placesonce they employ more than 19 women.
0
20
40
60
80
100%
0
20
40
60
80
100%
CZE MEX HUN AUT EST ISR FIN ITA IRL SVN KOR LUX FRA PRT NOR NLDSVK POL CHL GRC DEU JPN AUS OECD USA ESP NZL GBR SWE BEL ISL DNK
A. For 0-2 year olds
0
20
40
60
80
100 %
0
20
40
60
80
100%
TUR POL AUS IRL NLD FIN OECD PRT KOR ISR HUN SWE GBR NZL ISL ESP FRAGRC CHE USA CHL SVK SVN AUT CZE MEX LUX JPN DNL DEU NOR ITA BEL
B. For 3-5 year olds
OECD ECONOMIC SURVEYS: CHILE © OECD 2012 33
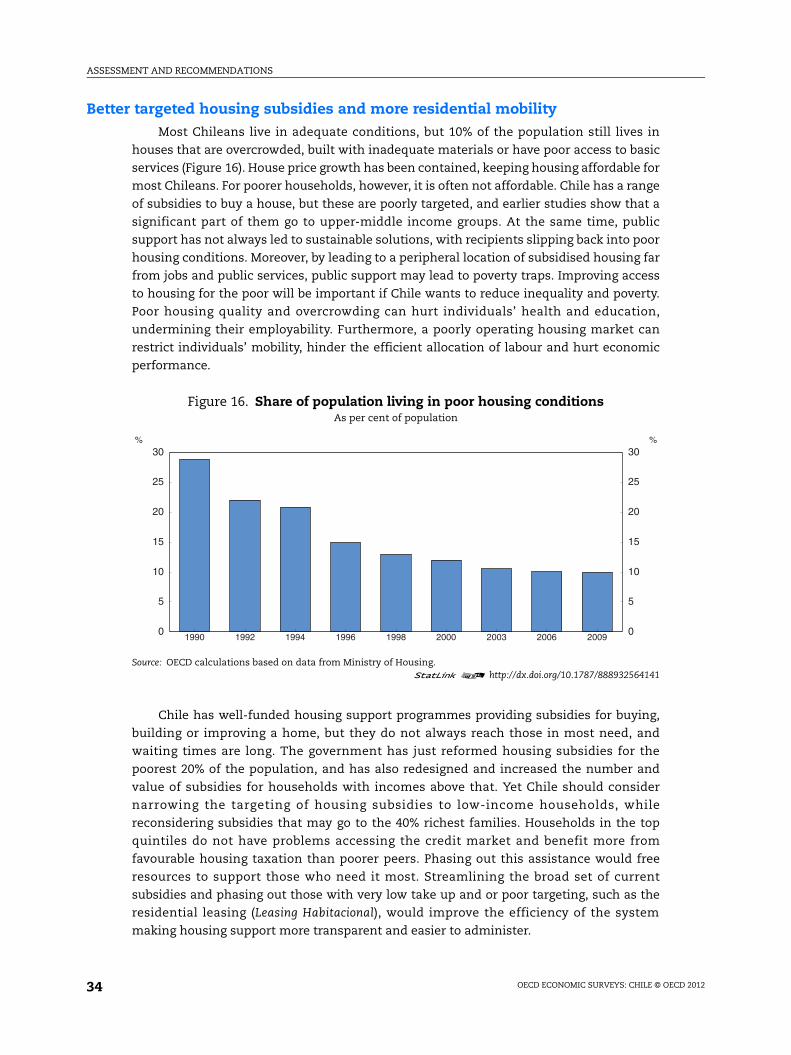
ASSESSMENT AND RECOMMENDATIONS
Better targeted housing subsidies and more residential mobilityMost Chileans live in adequate conditions, but 10% of the population still lives in
houses that are overcrowded, built with inadequate materials or have poor access to basic
services (Figure 16). House price growth has been contained, keeping housing affordable for
most Chileans. For poorer households, however, it is often not affordable. Chile has a range
of subsidies to buy a house, but these are poorly targeted, and earlier studies show that a
significant part of them go to upper-middle income groups. At the same time, public
support has not always led to sustainable solutions, with recipients slipping back into poor
housing conditions. Moreover, by leading to a peripheral location of subsidised housing far
from jobs and public services, public support may lead to poverty traps. Improving access
to housing for the poor will be important if Chile wants to reduce inequality and poverty.
Poor housing quality and overcrowding can hurt individuals’ health and education,
undermining their employability. Furthermore, a poorly operating housing market can
restrict individuals’ mobility, hinder the efficient allocation of labour and hurt economic
performance.
Chile has well-funded housing support programmes providing subsidies for buying,
building or improving a home, but they do not always reach those in most need, and
waiting times are long. The government has just reformed housing subsidies for the
poorest 20% of the population, and has also redesigned and increased the number and
value of subsidies for households with incomes above that. Yet Chile should consider
narrowing the targeting of housing subsidies to low-income households, while
reconsidering subsidies that may go to the 40% richest families. Households in the top
quintiles do not have problems accessing the credit market and benefit more from
favourable housing taxation than poorer peers. Phasing out this assistance would free
resources to support those who need it most. Streamlining the broad set of current
subsidies and phasing out those with very low take up and or poor targeting, such as the
residential leasing (Leasing Habitacional), would improve the efficiency of the system
making housing support more transparent and easier to administer.
Figure 16. Share of population living in poor housing conditionsAs per cent of population
Source: OECD calculations based on data from Ministry of Housing.1 2 http://dx.doi.org/10.1787/888932564141
0
5
10
15
20
25
30%
0
5
10
15
20
25
30%
1990 1992 1994 1996 1998 2000 2003 2006 2009
OECD ECONOMIC SURVEYS: CHILE © OECD 201234
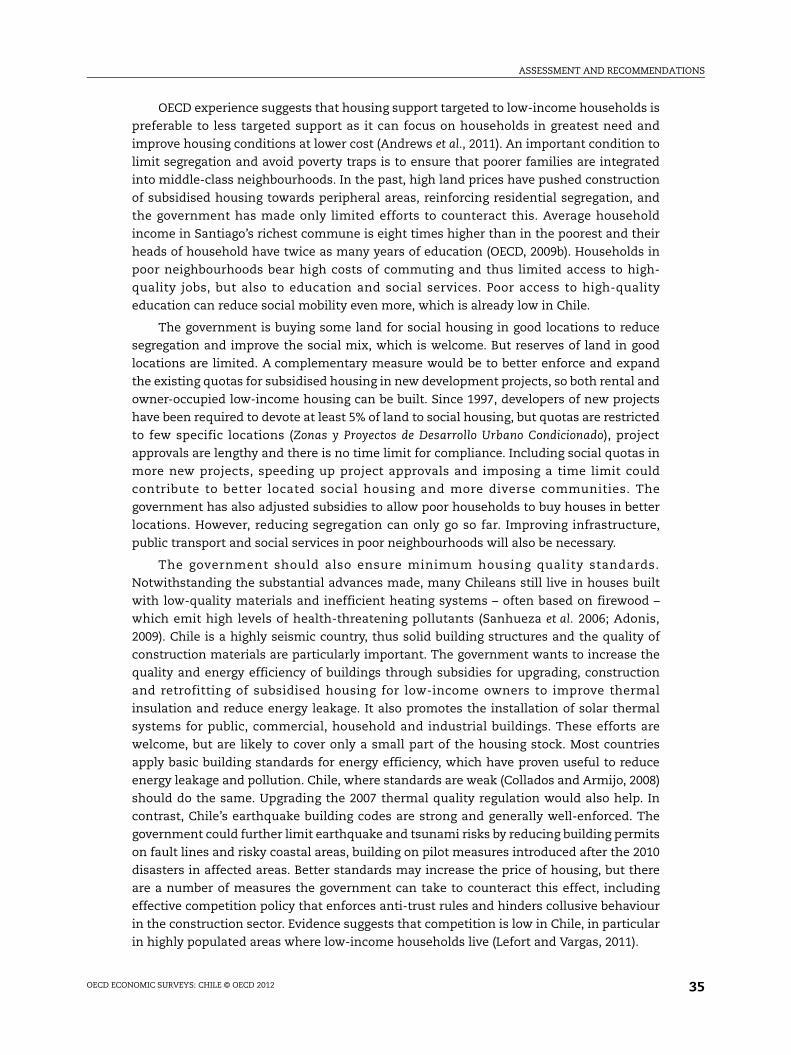
ASSESSMENT AND RECOMMENDATIONS
OECD experience suggests that housing support targeted to low-income households is
preferable to less targeted support as it can focus on households in greatest need and
improve housing conditions at lower cost (Andrews et al., 2011). An important condition to
limit segregation and avoid poverty traps is to ensure that poorer families are integrated
into middle-class neighbourhoods. In the past, high land prices have pushed construction
of subsidised housing towards peripheral areas, reinforcing residential segregation, and
the government has made only limited efforts to counteract this. Average household
income in Santiago’s richest commune is eight times higher than in the poorest and their
heads of household have twice as many years of education (OECD, 2009b). Households in
poor neighbourhoods bear high costs of commuting and thus limited access to high-
quality jobs, but also to education and social services. Poor access to high-quality
education can reduce social mobility even more, which is already low in Chile.
The government is buying some land for social housing in good locations to reduce
segregation and improve the social mix, which is welcome. But reserves of land in good
locations are limited. A complementary measure would be to better enforce and expand
the existing quotas for subsidised housing in new development projects, so both rental and
owner-occupied low-income housing can be built. Since 1997, developers of new projects
have been required to devote at least 5% of land to social housing, but quotas are restricted
to few specific locations (Zonas y Proyectos de Desarrollo Urbano Condicionado), project
approvals are lengthy and there is no time limit for compliance. Including social quotas in
more new projects, speeding up project approvals and imposing a time limit could
contribute to better located social housing and more diverse communities. The
government has also adjusted subsidies to allow poor households to buy houses in better
locations. However, reducing segregation can only go so far. Improving infrastructure,
public transport and social services in poor neighbourhoods will also be necessary.
The government should also ensure minimum housing quality standards.
Notwithstanding the substantial advances made, many Chileans still live in houses built
with low-quality materials and inefficient heating systems – often based on firewood –
which emit high levels of health-threatening pollutants (Sanhueza et al. 2006; Adonis,
2009). Chile is a highly seismic country, thus solid building structures and the quality of
construction materials are particularly important. The government wants to increase the
quality and energy efficiency of buildings through subsidies for upgrading, construction
and retrofitting of subsidised housing for low-income owners to improve thermal
insulation and reduce energy leakage. It also promotes the installation of solar thermal
systems for public, commercial, household and industrial buildings. These efforts are
welcome, but are likely to cover only a small part of the housing stock. Most countries
apply basic building standards for energy efficiency, which have proven useful to reduce
energy leakage and pollution. Chile, where standards are weak (Collados and Armijo, 2008)
should do the same. Upgrading the 2007 thermal quality regulation would also help. In
contrast, Chile’s earthquake building codes are strong and generally well-enforced. The
government could further limit earthquake and tsunami risks by reducing building permits
on fault lines and risky coastal areas, building on pilot measures introduced after the 2010
disasters in affected areas. Better standards may increase the price of housing, but there
are a number of measures the government can take to counteract this effect, including
effective competition policy that enforces anti-trust rules and hinders collusive behaviour
in the construction sector. Evidence suggests that competition is low in Chile, in particular
in highly populated areas where low-income households live (Lefort and Vargas, 2011).
OECD ECONOMIC SURVEYS: CHILE © OECD 2012 35
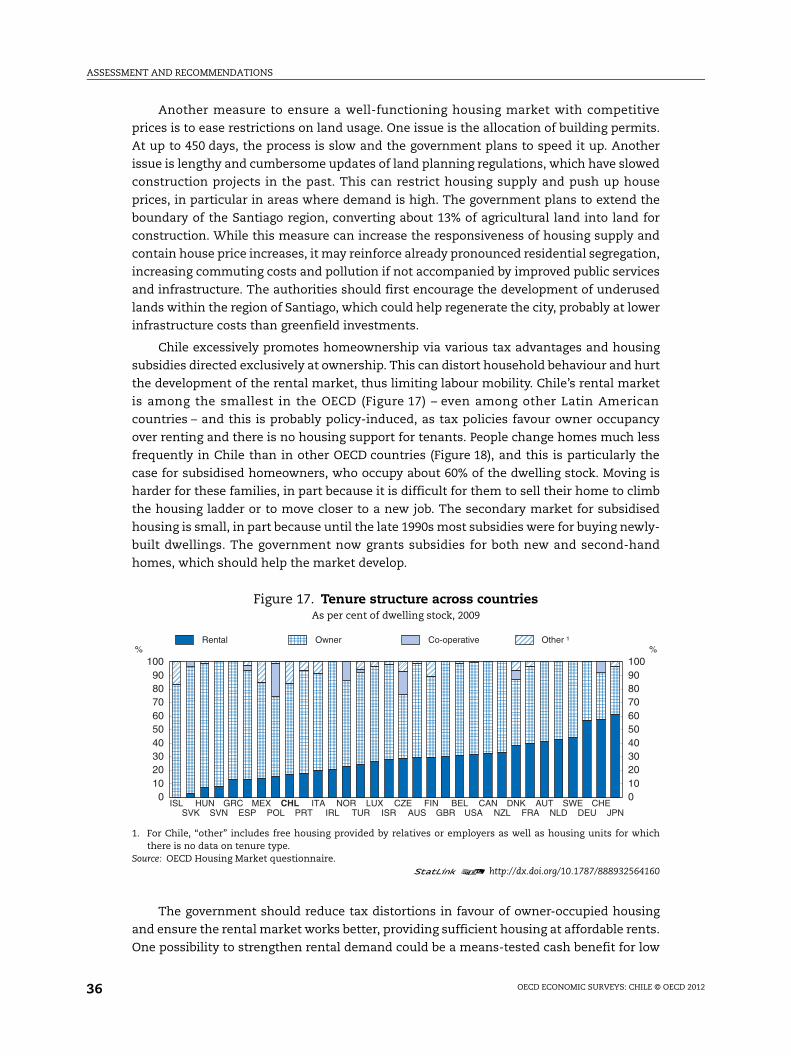
ASSESSMENT AND RECOMMENDATIONS
Another measure to ensure a well-functioning housing market with competitive
prices is to ease restrictions on land usage. One issue is the allocation of building permits.
At up to 450 days, the process is slow and the government plans to speed it up. Another
issue is lengthy and cumbersome updates of land planning regulations, which have slowed
construction projects in the past. This can restrict housing supply and push up house
prices, in particular in areas where demand is high. The government plans to extend the
boundary of the Santiago region, converting about 13% of agricultural land into land for
construction. While this measure can increase the responsiveness of housing supply and
contain house price increases, it may reinforce already pronounced residential segregation,
increasing commuting costs and pollution if not accompanied by improved public services
and infrastructure. The authorities should first encourage the development of underused
lands within the region of Santiago, which could help regenerate the city, probably at lower
infrastructure costs than greenfield investments.
Chile excessively promotes homeownership via various tax advantages and housing
subsidies directed exclusively at ownership. This can distort household behaviour and hurt
the development of the rental market, thus limiting labour mobility. Chile’s rental market
is among the smallest in the OECD (Figure 17) – even among other Latin American
countries – and this is probably policy-induced, as tax policies favour owner occupancy
over renting and there is no housing support for tenants. People change homes much less
frequently in Chile than in other OECD countries (Figure 18), and this is particularly the
case for subsidised homeowners, who occupy about 60% of the dwelling stock. Moving is
harder for these families, in part because it is difficult for them to sell their home to climb
the housing ladder or to move closer to a new job. The secondary market for subsidised
housing is small, in part because until the late 1990s most subsidies were for buying newly-
built dwellings. The government now grants subsidies for both new and second-hand
homes, which should help the market develop.
The government should reduce tax distortions in favour of owner-occupied housing
and ensure the rental market works better, providing sufficient housing at affordable rents.
One possibility to strengthen rental demand could be a means-tested cash benefit for low
Figure 17. Tenure structure across countriesAs per cent of dwelling stock, 2009
1. For Chile, “other” includes free housing provided by relatives or employers as well as housing units for whichthere is no data on tenure type.
Source: OECD Housing Market questionnaire.1 2 http://dx.doi.org/10.1787/888932564160
0102030405060708090
100%
0102030405060708090100
%
ISL HUN GRC MEX CHL ITA NOR LUX CZE FIN BEL CAN DNK AUT SWE CHESVK SVN ESP POL PRT IRL TUR ISR AUS GBR USA NZL FRA NLD DEU JPN
Rental Owner Co-operative Other ¹
OECD ECONOMIC SURVEYS: CHILE © OECD 201236
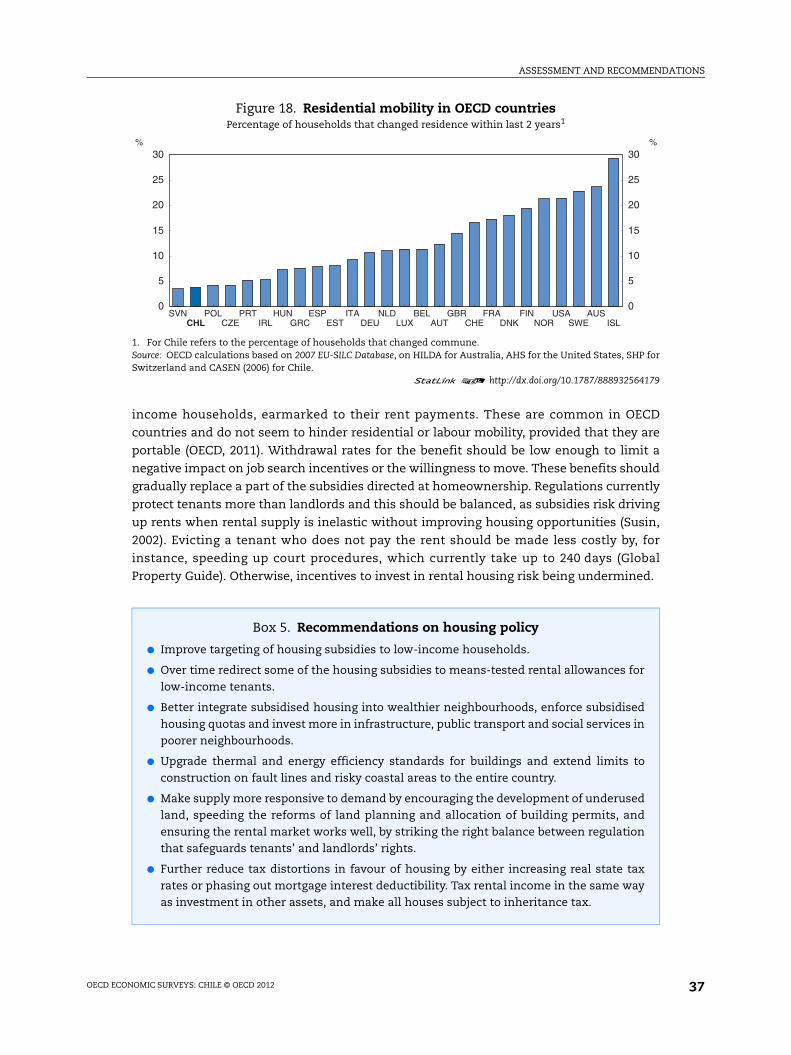
ASSESSMENT AND RECOMMENDATIONS
income households, earmarked to their rent payments. These are common in OECD
countries and do not seem to hinder residential or labour mobility, provided that they are
portable (OECD, 2011). Withdrawal rates for the benefit should be low enough to limit a
negative impact on job search incentives or the willingness to move. These benefits should
gradually replace a part of the subsidies directed at homeownership. Regulations currently
protect tenants more than landlords and this should be balanced, as subsidies risk driving
up rents when rental supply is inelastic without improving housing opportunities (Susin,
2002). Evicting a tenant who does not pay the rent should be made less costly by, for
instance, speeding up court procedures, which currently take up to 240 days (Global
Property Guide). Otherwise, incentives to invest in rental housing risk being undermined.
Figure 18. Residential mobility in OECD countriesPercentage of households that changed residence within last 2 years1
1. For Chile refers to the percentage of households that changed commune.Source: OECD calculations based on 2007 EU-SILC Database, on HILDA for Australia, AHS for the United States, SHP forSwitzerland and CASEN (2006) for Chile.
1 2 http://dx.doi.org/10.1787/888932564179
Box 5. Recommendations on housing policy
● Improve targeting of housing subsidies to low-income households.
● Over time redirect some of the housing subsidies to means-tested rental allowances forlow-income tenants.
● Better integrate subsidised housing into wealthier neighbourhoods, enforce subsidisedhousing quotas and invest more in infrastructure, public transport and social services inpoorer neighbourhoods.
● Upgrade thermal and energy efficiency standards for buildings and extend limits toconstruction on fault lines and risky coastal areas to the entire country.
● Make supply more responsive to demand by encouraging the development of underusedland, speeding the reforms of land planning and allocation of building permits, andensuring the rental market works well, by striking the right balance between regulationthat safeguards tenants’ and landlords’ rights.
● Further reduce tax distortions in favour of housing by either increasing real state taxrates or phasing out mortgage interest deductibility. Tax rental income in the same wayas investment in other assets, and make all houses subject to inheritance tax.
0
5
10
15
20
25
30 %
0
5
10
15
20
25
30%
SVN POL PRT HUN ESP ITA NLD BEL GBR FRA FIN USA AUSCHL CZE IRL GRC EST DEU LUX AUT CHE DNK NOR SWE ISL
OECD ECONOMIC SURVEYS: CHILE © OECD 2012 37
ASSESSMENT AND RECOMMENDATIONS
Bibliography
Adonis, M. (2009), “Contaminación de Interiores en la Pintana”, 70 Seminario Internacional, ArquitecturaBioclimática, Energía y Salud, Facultad de Arquitectura y Urbanismo, Universidad Central de Chile.
Andrews, D., A. Caldera Sánchez and Å. Johansson (2011), “Housing Markets and Structural Policies inOECD Countries”, OECD Economics Department Working Paper, No. 836, January 2011.
Bloechliger, H. and C. Charbit (2008), “Fiscal Equalisation”, OECD Economic Studies No. 44, OECD, Paris.
Caballero, R., K. Cowan, E. Engel and A. Micco (2006), “Effective Labor Regulation and MicroeconomicFlexibility”, Cowles Foundation Discussion Paper, No. 1480, Yale University.
Collados, E. and G. Armijo (2008), “Predicting the Impacts of an Energy Refurbishing Programme inChile: More than Energy Savings”, in Handbook of Sustainable Building Design and Engineering,Earthscan Ltd.
Comité de Expertos (2010), Ficha de Protección Social – Informe Final, Report for the Ministry of SocialAffairs (Mideplan), Santiago de Chile.
Corbo, V., et al. (2011), “Propuestas para Perfeccionar la Regla Fiscal; Informe Final”, Santiago de Chile.
CENDA (2010), “Royalty a la Minería Antecedentes para un Debate”, www.cendachile.cl/Home/publicaciones/temas/cobre/royalty-antecedentes-debate/preseentacion-y-minuta.
ECB (2003), “Structural Factors in the EU Housing Markets”, European Central Bank.
Joratt, M. (2009), “La Tributación Directa en Chile: Equidad y Desafios”, CEPAL, Serie Macroeconomía delDesarrollo No. 92, División de Desarrollo Económico.
Larrañaga, O. (2009), “Inequality, Poverty and Social Policy: Recent Trends in Chile”, OECD Social,Employment and Migration Working Papers, No. 85, OECD Publishing.
López, R. (2011), “Fiscal Policy in Chile – Promoting Faustian Growth?”, Department of Agricultural andResource Economics Working Paper 2011-01, University of Maryland, College Park, www.arec.umd.edu/libcomp/Areclib/Publications/Working-Papers-PDF-files/11-01.pdf.
Micco, A. and C. Pages (2006), “The Economic Effects of Employment Protection: Evidence fromInternational Industry-Level Data”, IZA Discussion Paper 2433, Forschungsinstitut zur Zukunft derArbeit (IZA), Bonn.
Neilson, C., et al. (2008), “The Dynamics of Poverty in Chile”, Journal of Latin American Studies, Vol. 40,pp. 251-273.
Nuñez, J.I. and L. Miranda (2010), “Intergenerational Income Mobility in a Less-Developed, High-Inequality Context: The Case of Chile”, The B.E. Journal of Economic Analysis & Policy, Vol. 10, Iss. 1,Article 33.
OECD (2009a), OECD Reviews of Labour Market and Social Policies – Chile, OECD, Paris.
OECD (2009a), OECD Territorial Review of Chile, OECD, Paris.
OECD (2010), OECD Economic Survey: Chile, OECD, Paris.
OECD (2011), “Housing and the Economy: Policies for Renovation”, in Going for Growth, OECD, Paris.
OECD and World Bank (2009), Reviews of National Policies for Education Tertiary Education in Chile, OECD,Paris.
Pagés, C. and C. Montenegro (2007), “Job Security and the Age Composition of Employment: Evidencefrom Chile”, Estudios de Economía, Vol. 34, No. 2, pp. 109-139.
Pedersen, M. (2010), “Propagation of Inflationary Shocks in Chile and an International Comparison ofPropagation of Shocks to Food and Energy Prices”, Central Bank of Chile Working Paper No. 566,Santiago de Chile.
Pincheira, P. and A. García (2007), “Shocks de Petróleo e Inflación, el Caso de Chile y una Muestra dePaíses Industriales”, Economía Chilena, Vol. 10, pp. 5-35.
Ruffinelli, A. and L. Sepúlveda (2005), “Sistematización de la Oferta de Programas Especiales dePedagogía en Educación Básica de las Instituciones de Educación Superior Chilenas”, UniversidadAlberto Hurtado, Centro de Investigación y del Desarrollo de la Educación, Santiago.
Sanhueza, P., R. Vargas and P. Mellado (2006), “Impacto de la Contaminación del Aire por PM10 sobre laMortalidad Diaria en Temuco”, Rev. Méd. Chile, Vol. 134, No. 6, Santiago.
Susin, S. (2002), “Rent Vouchers and the Price of Low-Income Housing”, Journal of Public Economics,Vol. 83, No. 1.
OECD ECONOMIC SURVEYS: CHILE © OECD 201238

ASSESSMENT AND RECOMMENDATIONS
ANNEX A1
Progress in structural reform
Past recommendations Actions taken and current assessment
A. Strengthening fiscal responsibility legislation further
Consider possibilities to further strengthen the fiscal rule. The government commissioned a report on improving fiscal institutions and plans to implement many of its recommendations, including setting up an independent fiscal council that would monitor fiscal policy and the correct application of the fiscal rule.
Consider strengthening the insurance element of the unemployment benefit system, by easing access to the Fondo Solidario further and allowing to some extent for higher benefits. Severance pay could be lowered in return, for example by keeping it flat rather than letting rights increase with job tenure.
Temporary easing of access for workers affected by the earthquake.
Complement reports about the size of tax expenditures with evaluations of their effectiveness and efficiency.
No action taken.
B. Making the most of pension reform
Gauge the willingness of own-account workers to pay for social protection through regular surveys, while strengthening enforcement capabilities when contribution becomes mandatory.
A panel household survey specifically focused on social security issues (Encuesta de Protección Social, EPS) was applied in 2009 (previously applied in 2006, 2004 and 2002). It includes detailed questions concerning employment status, history of retirement saving, and individual motives to contribute to the public social security system. Information campaign for own-account workers since October 2011.
Make health insurance mandatory for own-account workers at the same time and following the same timeframe as in the case of pension contributions, rather than delaying implementation until 10 years after approval of reform.
No action taken.
Ensure that options for correcting gender imbalances do not give women a higher retirement income than those accruing to men with the same contribution history, accounting for life-expectancy differentials.
No action taken.
Eliminate in a phased manner the gap that currently exists between the retirement age for males (65 years) and females (60 years) for contributory pensions.
No action taken.
Maintain the independence of the AFP regulator in the new proposed institutional setup.
The new Superintendencia de Pensiones kept the independent status.
C. Making the tax system more efficient
Reduce the stamp duties gradually. The government reduced the duty permanently by half.
Assess the net benefits of reducing the discrepancy between the top marginal rate for the personal income tax (currently at 40%) and the uniform corporate tax rate (currently at 17%).
The corporate tax rate has been temporarily increased from 17% to 20% to finance the reconstruction.
Assess compliance costs for micro- and small enterprises and continue to work to make the tax system more SME-friendly.Expand the ICT training programme for SMEs (MIPYME 10 000-2006).Further simplifying procedures to reduce the time it takes to pay taxes, especially by SMEs.
SMEs do not have to pay taxes on retained profits since 2010.
OECD ECONOMIC SURVEYS: CHILE © OECD 2012 39
ASSESSMENT AND RECOMMENDATIONS
Consider abolishing or limiting remaining VAT exemptions. The reduced VAT rate for housing construction was capped in 2009.
Consider strengthening subsidies for pension savings supporting low and medium income earners further, while capping tax benefits for high income earners.
Pension contributions above 900 UF pay income tax since 2010.
Close tax loopholes associated with corporations created for the sole purpose of deferring the payment of personal income taxes.
No action taken.
Consider increasing the property tax rate, if needed. Property taxes have been temporarily increased (for residential properties above 96 million pesos) during 2011 and 2012 to finance the reconstruction. The beneficial tax treatment for DFL2 properties, which includes a halving of property taxes up to 20 years after purchase, has been limited to two houses per owner.
D. Fostering further financial sector development and improving financial regulation
Gradually replace mandated quantitative restrictions by prudential regulations for pension fund portfolio composition to be issued by the industry regulator.
No action taken.
Continue pursuing efforts to establish a consolidated credit register for all credit card issuers, including non-banks. Bring all credit card issuers under the oversight of the Superintendency of Banks.
The government has sent a draft law to Congress to establish a consolidated credit register for bank and retail credit to households.
Take legislative action to establish group-wide financial supervision, among others by designating a based on the group’s main activity.
The government created the Financial Stability Council to better co-ordinate the work of different supervisors.
E. Boosting the efficiency of health care programmes
Extend the Solidarity Compensation Fund to FONASA as a means of further improving risk pooling.
A draft bill foresees risk pooling among private insurers as a first step to universal risk pooling across private and public insurers.
Consider a relaxation of mobility restrictions for FONASA beneficiaries under the Institutional Modality of care (while carefully evaluating the impact that this measure might have on insurance costs), and make the level of co-payments for homogeneous services equal for FONASA and ISAPRE policy holders.
No action taken.
Broaden the range of treatments that can be financed through diagnosis-related and prospective payments (PAD-PPP).
Since 2007 treatments for colon cancer, child and adult osteosarcoma, morbid obesity and traumatological surgery can be financed though PAD. The government is implementing diagnosis-related-group (DRG) financing.
Conduct service satisfaction surveys more frequently and disseminate the results broadly, including through health care insurers.
A Committee on Citizenship Participation in health issues is currently being established. A satisfaction survey will be conducted yearly by FONASA.
F. Facilitating access to better housing and neighbourhood conditions for vulnerable social groups
Use public land for new subsidised housing developments, available zoning and environmental regulations permitting.
The government is re-converting public land for new subsidised housing developments.
Consider the option of buying land in advance for new subsidised housing developments.
The government is buying some land for new subsidised housing developments.
Boost co-ordination among the different policymakers in charge of urban planning, transport, public works and environment at the central- and local-government levels.
There was strong co-ordination to develop master plans for the reconstruction after the 2010 earthquake In Santiago there was co-ordination for the transport system (“Coordinación General del Transporte de Santiago”, Transantiago), which has only a consultative role.
G. Education
Extend the grants available for small enterprises for labour training to those that currently operate informally, conditional on the recipient enterprise taking the necessary steps to formalise.
Two different fiscal incentives were introduced for formal labour force participation among youths through a wage subsidy conditional on their paying social security contributions. In 2011 the government introduced a training subsidy for employees in micro and small enterprises. The 2012 budget increases training funds for low-skilled workers, including the informal sector.
Expand the skill-certification system to cover the most common occupations in industry and construction.
A national Labour Skill Certification System was established in 2008 as part of the Chilecalifica programme, which aims to develop a lifelong learning and training system. It targets especially low skills. There are standards established in several sectors, including industry, tourism, construction and technical and mechanical installations.
Past recommendations Actions taken and current assessment
OECD ECONOMIC SURVEYS: CHILE © OECD 201240

ASSESSMENT AND RECOMMENDATIONS
Evaluate whether teacher salaries should increase further to make the profession more competitive and define teacher career paths for publicly funded schools with promotions closely linked to performance.
The government introduced bonuses for excellent teachers, in particular when they teach in difficult schools and increased wages for principals significantly The higher voucher for poor children can now be used to increase teacher salaries.
Implement teacher evaluation in all publicly funded schools. No action taken.
Make sure that deficient initial teacher education programmes are closed.
Some deficient programmes have been closed. Experts have been hired to review the accreditation system.
Upgrade the subject content knowledge of teachers, especially in the upper grades of primary schools, through richer curricula in initial teacher education programmes and post-graduate programmes for practicing teachers.
The government is developing – voluntary – standards for initial teacher education. A law foresees shortening primary school to 6 year, which will require specialised teachers teaching in grades 7-9.
Develop an induction programme over time No action taken.
Introduce external exit exams for initial teacher education. The pilot exit exam for teacher students, Inicia, will become mandatory for teachers at publicly financed schools for informational purposes.
Strengthen educational leadership by continuing efforts to train principals and by making sure they have sufficient time for teacher supervision and support.
The government plans to train 800 principals every year. Selection mechanisms were improved and there are now performance agreements between principals and municipalities.
Better prepare teachers for instructing pupils from different backgrounds and helping those at risk of falling behind.
There are now salary bonuses for teachers with excellent evaluations who teach in schools with many poor children.
Make sure that the prohibition of selection is implemented by schools, consider extending it to secondary schools and strengthening it by requiring lotteries at oversubscribed schools.
The Ministry is investigating complaints by parents. It is also creating an agency that will enforce this law in the future.
Create more equal and sufficiently flexible conditions for teacher employment and pay at all publicly funded schools.
Principals are now allowed to dismiss some teachers with bad evaluations. School managers have now more flexibility to aplly performance-based pay.
Make sure that teachers, school managers and parents have sufficient information how to read results of the national student achievement test, SIMCE, and complement it with richer quality indicators, including qualitative information and possibly value-added indicators.
The new Quality Agency is set to develop richer quality indicators. There were efforts to communicate SIMCE results in different ways.
Implement the legislated quality assurance system, while making sure that the newly created agencies interact efficiently.
The law that creates the Quality Agency and the Superintendency of Education has now been passed. Agencies will start to operate in 2012.
Make sure that all municipalities have qualified administrative and technical-pedagogical support staff.
The government improved the mechanism for selecting and supporting performance of directors of the municipal school administration.
Consider introducing higher subsidies at decreasing rates for several income brackets and limit top-up payments dependent on parents’ income.
No action taken.
Evaluate results of the increased subsidy for poor children systematically and inform and support schools to make sure that successful methods are disseminated quickly.
Evaluations are now in progress.
Require all publicly funded schools to enter the Subvención Escolar Preferencial system with extra subsidies for poor children and use the new quality assurance system to exercise scrutiny for all schools on an equal footing.
Entering the system remains voluntary. The new Quality Agency will evaluate results.
Consider allowing private fee-based schools to accept some voucher children, with no or limited top-up fees, or imposing quotas.
No action taken.
After significantly expanding access, systematically evaluate quality at pre-schools and make sure that initial education prepares pre-school teachers and aides to enhance children’s abilities and learning skills.
The government is working to further expand access to pre-schools. The Quality Agency will review pre-school education.
Hold schools accountable for their students’ university access exam results and improve children’s preparation for the exam at schools. Evaluate the university entry exam, consider enriching it beyond multiple-choice and moving to a centralised school exit exam over time.
Experts have been hired to evaluate the university entry exam.
Streamline scholarships and student loan schemes and make them available for all accredited tertiary education institutions.
The government plans to expand scholarship programmes for poor students significantly and unify the interest rate on different student loan schemes.
Consider the introduction of a matching mechanism in the differentiated voucher programme to prevent higher voucher receipts from substituting for municipality financed spending.
No action taken.
Past recommendations Actions taken and current assessment
OECD ECONOMIC SURVEYS: CHILE © OECD 2012 41
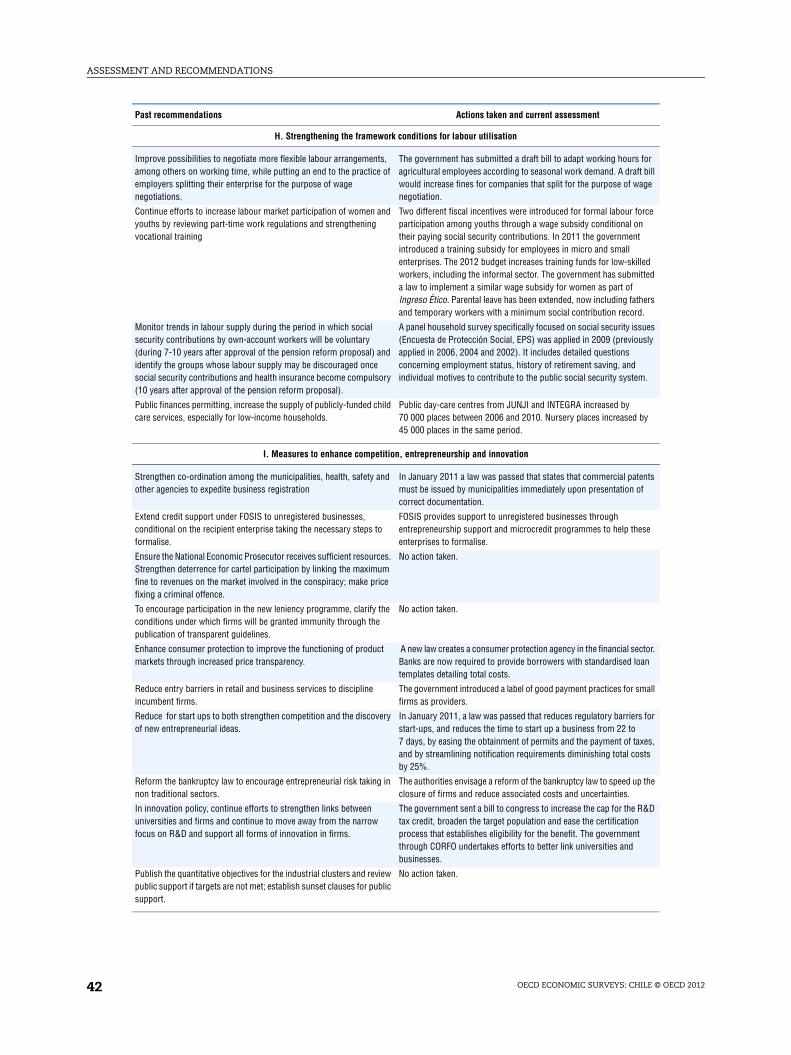
ASSESSMENT AND RECOMMENDATIONS
H. Strengthening the framework conditions for labour utilisation
Improve possibilities to negotiate more flexible labour arrangements, among others on working time, while putting an end to the practice of employers splitting their enterprise for the purpose of wage negotiations.
The government has submitted a draft bill to adapt working hours for agricultural employees according to seasonal work demand. A draft bill would increase fines for companies that split for the purpose of wage negotiation.
Continue efforts to increase labour market participation of women and youths by reviewing part-time work regulations and strengthening vocational training
Two different fiscal incentives were introduced for formal labour force participation among youths through a wage subsidy conditional on their paying social security contributions. In 2011 the government introduced a training subsidy for employees in micro and small enterprises. The 2012 budget increases training funds for low-skilled workers, including the informal sector. The government has submitted a law to implement a similar wage subsidy for women as part of Ingreso Ético. Parental leave has been extended, now including fathers and temporary workers with a minimum social contribution record.
Monitor trends in labour supply during the period in which social security contributions by own-account workers will be voluntary (during 7-10 years after approval of the pension reform proposal) and identify the groups whose labour supply may be discouraged once social security contributions and health insurance become compulsory (10 years after approval of the pension reform proposal).
A panel household survey specifically focused on social security issues (Encuesta de Protección Social, EPS) was applied in 2009 (previously applied in 2006, 2004 and 2002). It includes detailed questions concerning employment status, history of retirement saving, and individual motives to contribute to the public social security system.
Public finances permitting, increase the supply of publicly-funded child care services, especially for low-income households.
Public day-care centres from JUNJI and INTEGRA increased by 70 000 places between 2006 and 2010. Nursery places increased by 45 000 places in the same period.
I. Measures to enhance competition, entrepreneurship and innovation
Strengthen co-ordination among the municipalities, health, safety and other agencies to expedite business registration
In January 2011 a law was passed that states that commercial patents must be issued by municipalities immediately upon presentation of correct documentation.
Extend credit support under FOSIS to unregistered businesses, conditional on the recipient enterprise taking the necessary steps to formalise.
FOSIS provides support to unregistered businesses through entrepreneurship support and microcredit programmes to help these enterprises to formalise.
Ensure the National Economic Prosecutor receives sufficient resources. Strengthen deterrence for cartel participation by linking the maximum fine to revenues on the market involved in the conspiracy; make price fixing a criminal offence.
No action taken.
To encourage participation in the new leniency programme, clarify the conditions under which firms will be granted immunity through the publication of transparent guidelines.
No action taken.
Enhance consumer protection to improve the functioning of product markets through increased price transparency.
A new law creates a consumer protection agency in the financial sector. Banks are now required to provide borrowers with standardised loan templates detailing total costs.
Reduce entry barriers in retail and business services to discipline incumbent firms.
The government introduced a label of good payment practices for small firms as providers.
Reduce for start ups to both strengthen competition and the discovery of new entrepreneurial ideas.
In January 2011, a law was passed that reduces regulatory barriers for start-ups, and reduces the time to start up a business from 22 to 7 days, by easing the obtainment of permits and the payment of taxes, and by streamlining notification requirements diminishing total costs by 25%.
Reform the bankruptcy law to encourage entrepreneurial risk taking in non traditional sectors.
The authorities envisage a reform of the bankruptcy law to speed up the closure of firms and reduce associated costs and uncertainties.
In innovation policy, continue efforts to strengthen links between universities and firms and continue to move away from the narrow focus on R&D and support all forms of innovation in firms.
The government sent a bill to congress to increase the cap for the R&D tax credit, broaden the target population and ease the certification process that establishes eligibility for the benefit. The government through CORFO undertakes efforts to better link universities and businesses.
Publish the quantitative objectives for the industrial clusters and review public support if targets are not met; establish sunset clauses for public support.
No action taken.
Past recommendations Actions taken and current assessment
OECD ECONOMIC SURVEYS: CHILE © OECD 201242

OECD Economic Surveys: Chile
© OECD 2012
Chapter 1
Reducing poverty in Chile: Cash transfers and better jobs
Notwithstanding impressive progress, poverty and inequality remain high in Chilein OECD comparison, and the tax-benefit system does little to improve on this. Thegovernment plans to introduce a new cash transfer for the poor, the Ingreso ÉticoFamiliar. This is a welcome initiative. However, the transfer will be modest byOECD standards, at least initially, and it will be quite narrowly targeted at familiesliving in extreme poverty. Over time, the government should consider increasing thesize of this transfer and opening it to a wider range of beneficiaries through gradualbenefit withdrawal. Strong support for the poor to find jobs of decent quality will bekey to help them overcome poverty in a sustainable way. Ingreso Ético Familiarwill come with an employment programme for beneficiaries. This should build onthe existing infrastructure of active labour market policies, which will need toimprove at the same time. The government should strengthen the capacity of locallabour offices and use the current evaluation of training programmes to retain onlythose of proven effectiveness, while focusing them more on low-skilled workers andthe unemployed. Strengthening unemployment benefits, while limiting severancepay, would make employment protection more effective and do more to avoid labourmarket duality.
43
1. REDUCING POVERTY IN CHILE: CASH TRANSFERS AND BETTER JOBS
IntroductionChile has made remarkable progress in reducing poverty over the last 20 years and it
has now one of the lowest poverty rates in Latin America. Inequality has declined, as well,
although more recently and much more modestly. Nevertheless, poverty and inequality
remain high by OECD standards. Reducing poverty further would help reduce social
problems. At the same time, education, social and labour market policies that help the
poor invest in their human capital and strengthen their productivity would also contribute
to unleashing growth potential. While Chile is currently enjoying strong growth, in part
related to high commodity prices, the large share of poor workers with low productivity
can quickly become a bottleneck for innovation and diversification.
The Chilean government has set itself the ambitious goal to eradicate extreme poverty
by 2014, setting the foundations to eliminate poverty by 2018. One instrument to achieve
this will be the introduction of the Ingreso Ético Familiar, a new cash transfer system for the
poor. Higher cash transfers can help poor people save and invest in physical and human
capital and they would make the tax-benefit-system more progressive, in particular when
financed by closing regressive tax loopholes or increasing wealth taxes. The government
has set itself the goal to achieve annual average growth of GDP of 6% and create a million
new jobs – an increase by 15% – by 2014. Better job opportunities for the poor will be
important to help them overcome poverty.
This chapter analyses Chile’s opportunities to lower poverty and inequality further
through social and labour market policies. It is structured as follows: The first part gives an
overview over recent developments in poverty, income and wage inequality in Chile. The
second part discusses the factors that will be important to consider for the Chilean
government when designing its new cash transfer programme Ingreso Ético Familiar, in
particular targeting, conditionality, the size of transfers and the quality of complementary
government services. Perhaps the most important factor to help people leave poverty or
avoid falling into it will be to strengthen their capacity to find employment. Female
household heads and low-skilled workers, who are characterized by particularly low labour
market participation, low wages and a high incidence of poverty, will need strong help. The
third part of the chapter therefore discusses policies that would help more Chileans find a
job of decent quality. It discusses the role of job intermediation, training programmes, in-
work benefits, unemployment protection and family policies for more and better jobs.
Poverty and inequality in Chile
Recent developments
Chile has experienced a remarkable decline in poverty over the last 20 years, with
the share of people living below the national poverty line falling dramatically
(Figure 1.1). Relative poverty, as measured by the share of the population living with less
than 50% of the median income, has fallen as well. It is now among the lowest in Latin
America (Figure 1.2) although it remains higher than in most OECD countries
OECD ECONOMIC SURVEYS: CHILE © OECD 201244

1. REDUCING POVERTY IN CHILE: CASH TRANSFERS AND BETTER JOBS
(Figure 1.3). Like in other countries households frequently move into and out of poverty
in Chile (Neilson et al., 2008).
Children are in particular danger of being poor in Chile, while seniors are less likely to
be poor than working age individuals (Table 1.1). In fact, the presence of a pensioner in the
household lowers the probability of being poor, while the poverty risk increases
monotonically with the number of children in the family, reaching more than 50% for
households with more than 5 children (not shown). The low risk of poverty for people of
pension-age is probably evidence that Chile’s non-contributory pension scheme for the
poor is effective. Single-parented households have a particularly high incidence of poverty.
More than 85% of these households are headed by a female and the incidence of poverty
among single-parented households with a male head is actually much lower. The poverty
risk falls monotonically with the number of employed workers in the household, but
households which depend only on informal workers have a higher poverty risk than those
where some workers have a formal job.
Income inequality has started to decline, as well, although much more recently and
more modestly than poverty. It remains important even in Latin America comparison
(Figure 1.2) and is higher than anywhere in the OECD (Figure 1.3). The reason why income
inequality has hardly moved despite an impressive decline in poverty is that the largest
inequalities can be found at the top of the income distribution. The average income of the
top decile is almost three times as high as the average income of the decile just below that
(Figure 1.4). In contrast, income is distributed relatively equally among the rest of the
population.
Poverty would perhaps be less of an issue if people were able to overcome it relatively
easily by themselves. However, intergenerational social mobility is comparatively low in
Chile, which is typical for countries with high inequality (Causa and Johansson, 2009). The
intergenerational income elasticity, which measures the degree to which a man’s income
is determined by the income of his father, is higher in Chile than in other OECD countries
(Figure 1.5). Recent estimates range from 0.57 to 0.74 (Nuñez and Miranda, 2010). This
Figure 1.1. Poverty rates in ChilePeople with income below the national poverty line (absolute poverty) as per cent of population
Source: CASEN.1 2 http://dx.doi.org/10.1787/888932564198
0
5
10
15
20
25
30
35
40 %
0
5
10
15
20
25
30
35
40 %
1990 1992 1994 1996 1998 2000 2003 2006 2009
Poor without extremely poorExtremely poor
OECD ECONOMIC SURVEYS: CHILE © OECD 2012 45
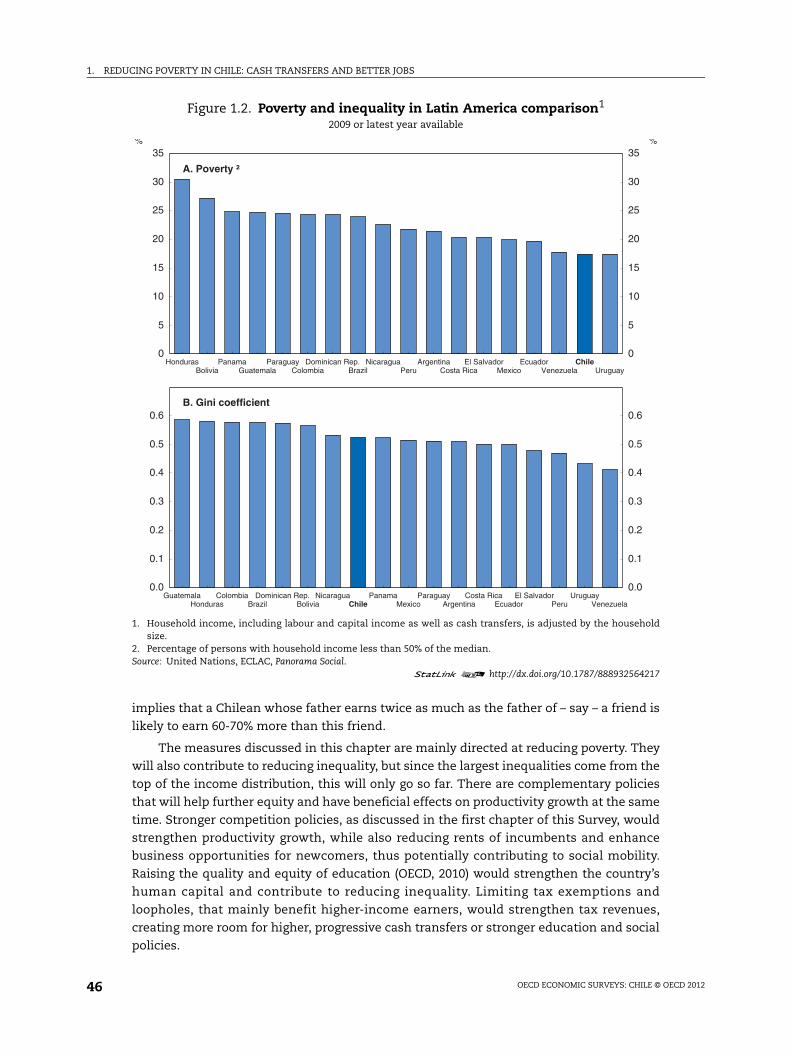
1. REDUCING POVERTY IN CHILE: CASH TRANSFERS AND BETTER JOBS
implies that a Chilean whose father earns twice as much as the father of – say – a friend is
likely to earn 60-70% more than this friend.
The measures discussed in this chapter are mainly directed at reducing poverty. They
will also contribute to reducing inequality, but since the largest inequalities come from the
top of the income distribution, this will only go so far. There are complementary policies
that will help further equity and have beneficial effects on productivity growth at the same
time. Stronger competition policies, as discussed in the first chapter of this Survey, would
strengthen productivity growth, while also reducing rents of incumbents and enhance
business opportunities for newcomers, thus potentially contributing to social mobility.
Raising the quality and equity of education (OECD, 2010) would strengthen the country’s
human capital and contribute to reducing inequality. Limiting tax exemptions and
loopholes, that mainly benefit higher-income earners, would strengthen tax revenues,
creating more room for higher, progressive cash transfers or stronger education and social
policies.
Figure 1.2. Poverty and inequality in Latin America comparison1
2009 or latest year available
1. Household income, including labour and capital income as well as cash transfers, is adjusted by the householdsize.
2. Percentage of persons with household income less than 50% of the median.Source: United Nations, ECLAC, Panorama Social.
1 2 http://dx.doi.org/10.1787/888932564217
0
5
10
15
20
25
30
35%
0
5
10
15
20
25
30
35%
Honduras Panama Paraguay Dominican Rep. Nicaragua Argentina El Salvador Ecuador ChileBolivia Guatemala Colombia Brazil Peru Costa Rica Mexico Venezuela Uruguay
A. Poverty ²
0.0
0.1
0.2
0.3
0.4
0.5
0.6
0.0
0.1
0.2
0.3
0.4
0.5
0.6
Guatemala Colombia Dominican Rep. Nicaragua Panama Paraguay Costa Rica El Salvador UruguayHonduras Brazil Bolivia Chile Mexico Argentina Ecuador Peru Venezuela
B. Gini coefficient
OECD ECONOMIC SURVEYS: CHILE © OECD 201246
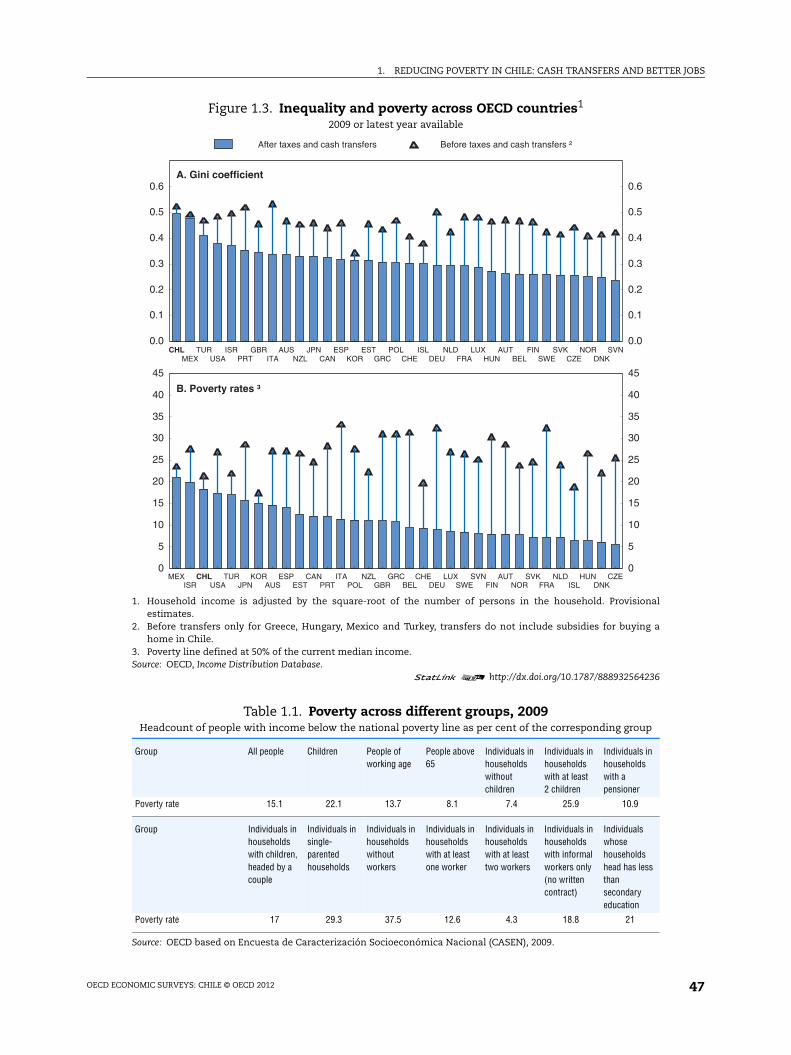
1. REDUCING POVERTY IN CHILE: CASH TRANSFERS AND BETTER JOBS
Figure 1.3. Inequality and poverty across OECD countries1
2009 or latest year available
1. Household income is adjusted by the square-root of the number of persons in the household. Provisionalestimates.
2. Before transfers only for Greece, Hungary, Mexico and Turkey, transfers do not include subsidies for buying ahome in Chile.
3. Poverty line defined at 50% of the current median income.Source: OECD, Income Distribution Database.
1 2 http://dx.doi.org/10.1787/888932564236
Table 1.1. Poverty across different groups, 2009Headcount of people with income below the national poverty line as per cent of the corresponding group
Group All people Children People of working age
People above 65
Individuals in households without children
Individuals in households with at least 2 children
Individuals in households with a pensioner
Poverty rate 15.1 22.1 13.7 8.1 7.4 25.9 10.9
Group Individuals in households with children, headed by a couple
Individuals in single-parented households
Individuals in households without workers
Individuals in households with at least one worker
Individuals in households with at least two workers
Individuals in households with informal workers only (no written contract)
Individuals whose households head has less than secondary education
Poverty rate 17 29.3 37.5 12.6 4.3 18.8 21
Source: OECD based on Encuesta de Caracterización Socioeconómica Nacional (CASEN), 2009.
0.0
0.1
0.2
0.3
0.4
0.5
0.6
0.0
0.1
0.2
0.3
0.4
0.5
0.6
CHL TUR ISR GBR AUS JPN ESP EST POL ISL NLD LUX AUT FIN SVK NOR SVNMEX USA PRT ITA NZL CAN KOR GRC CHE DEU FRA HUN BEL SWE CZE DNK
A. Gini coefficient
After taxes and cash transfers Before taxes and cash transfers ²
0
5
10
15
20
25
30
35
40
45
0
5
10
15
20
25
30
35
40
45
MEX CHL TUR KOR ESP CAN ITA NZL GRC CHE LUX SVN AUT SVK NLD HUN CZEISR USA JPN AUS EST PRT POL GBR BEL DEU SWE FIN NOR FRA ISL DNK
B. Poverty rates ³
OECD ECONOMIC SURVEYS: CHILE © OECD 2012 47
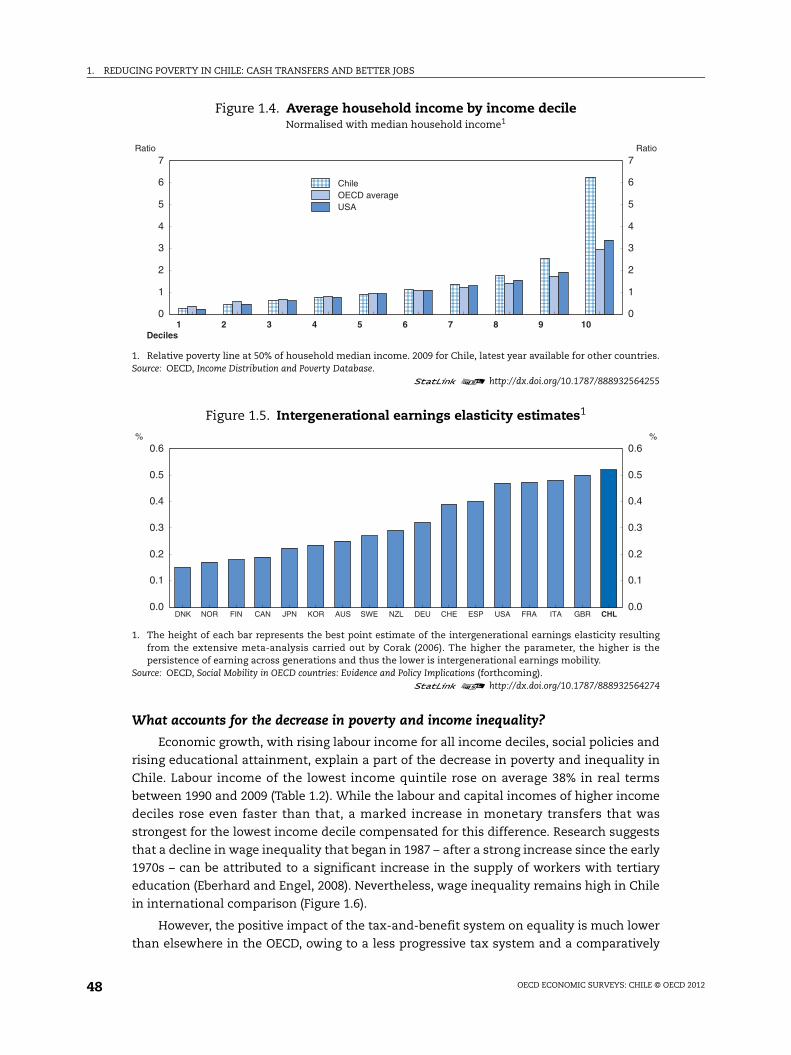
1. REDUCING POVERTY IN CHILE: CASH TRANSFERS AND BETTER JOBS
What accounts for the decrease in poverty and income inequality?
Economic growth, with rising labour income for all income deciles, social policies and
rising educational attainment, explain a part of the decrease in poverty and inequality in
Chile. Labour income of the lowest income quintile rose on average 38% in real terms
between 1990 and 2009 (Table 1.2). While the labour and capital incomes of higher income
deciles rose even faster than that, a marked increase in monetary transfers that was
strongest for the lowest income decile compensated for this difference. Research suggests
that a decline in wage inequality that began in 1987 – after a strong increase since the early
1970s – can be attributed to a significant increase in the supply of workers with tertiary
education (Eberhard and Engel, 2008). Nevertheless, wage inequality remains high in Chile
in international comparison (Figure 1.6).
However, the positive impact of the tax-and-benefit system on equality is much lower
than elsewhere in the OECD, owing to a less progressive tax system and a comparatively
Figure 1.4. Average household income by income decileNormalised with median household income1
1. Relative poverty line at 50% of household median income. 2009 for Chile, latest year available for other countries.Source: OECD, Income Distribution and Poverty Database.
1 2 http://dx.doi.org/10.1787/888932564255
Figure 1.5. Intergenerational earnings elasticity estimates1
1. The height of each bar represents the best point estimate of the intergenerational earnings elasticity resultingfrom the extensive meta-analysis carried out by Corak (2006). The higher the parameter, the higher is thepersistence of earning across generations and thus the lower is intergenerational earnings mobility.
Source: OECD, Social Mobility in OECD countries: Evidence and Policy Implications (forthcoming).1 2 http://dx.doi.org/10.1787/888932564274
0
1
2
3
4
5
6
7Ratio
0
1
2
3
4
5
6
7Ratio
1 2 3 4 5 6 7 8 9 10Deciles
ChileOECD averageUSA
0.0
0.1
0.2
0.3
0.4
0.5
0.6 %
0.0
0.1
0.2
0.3
0.4
0.5
0.6%
DNK NOR FIN CAN JPN KOR AUS SWE NZL DEU CHE ESP USA FRA ITA GBR CHL
OECD ECONOMIC SURVEYS: CHILE © OECD 201248
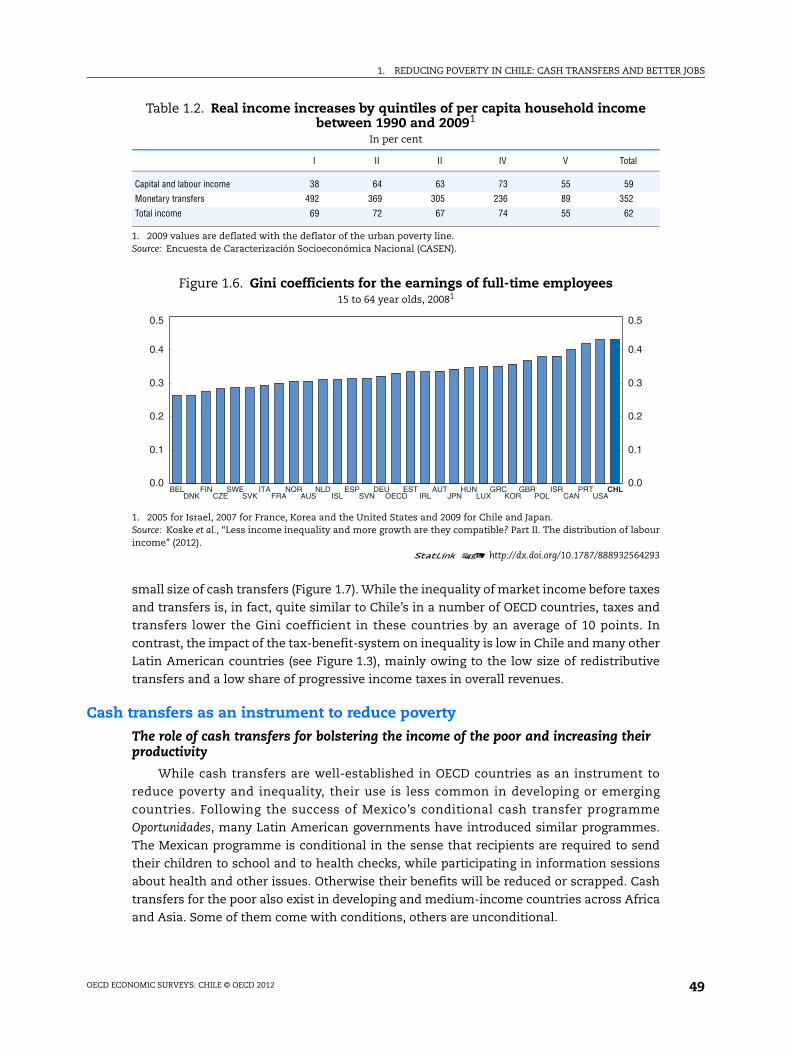
1. REDUCING POVERTY IN CHILE: CASH TRANSFERS AND BETTER JOBS
small size of cash transfers (Figure 1.7). While the inequality of market income before taxes
and transfers is, in fact, quite similar to Chile’s in a number of OECD countries, taxes and
transfers lower the Gini coefficient in these countries by an average of 10 points. In
contrast, the impact of the tax-benefit-system on inequality is low in Chile and many other
Latin American countries (see Figure 1.3), mainly owing to the low size of redistributive
transfers and a low share of progressive income taxes in overall revenues.
Cash transfers as an instrument to reduce poverty
The role of cash transfers for bolstering the income of the poor and increasing their productivity
While cash transfers are well-established in OECD countries as an instrument to
reduce poverty and inequality, their use is less common in developing or emerging
countries. Following the success of Mexico’s conditional cash transfer programme
Oportunidades, many Latin American governments have introduced similar programmes.
The Mexican programme is conditional in the sense that recipients are required to send
their children to school and to health checks, while participating in information sessions
about health and other issues. Otherwise their benefits will be reduced or scrapped. Cash
transfers for the poor also exist in developing and medium-income countries across Africa
and Asia. Some of them come with conditions, others are unconditional.
Table 1.2. Real income increases by quintiles of per capita household income between 1990 and 20091
In per cent
I II II IV V Total
Capital and labour income 38 64 63 73 55 59
Monetary transfers 492 369 305 236 89 352
Total income 69 72 67 74 55 62
1. 2009 values are deflated with the deflator of the urban poverty line.Source: Encuesta de Caracterización Socioeconómica Nacional (CASEN).
Figure 1.6. Gini coefficients for the earnings of full-time employees15 to 64 year olds, 20081
1. 2005 for Israel, 2007 for France, Korea and the United States and 2009 for Chile and Japan.Source: Koske et al., “Less income inequality and more growth are they compatible? Part II. The distribution of labourincome” (2012).
1 2 http://dx.doi.org/10.1787/888932564293
0.0
0.1
0.2
0.3
0.4
0.5
0.0
0.1
0.2
0.3
0.4
0.5
BEL FIN SWE ITA NOR NLD ESP DEU EST AUT HUN GRC GBR ISR PRT CHLDNK CZE SVK FRA AUS ISL SVN OECD IRL JPN LUX KOR POL CAN USA
OECD ECONOMIC SURVEYS: CHILE © OECD 2012 49

1. REDUCING POVERTY IN CHILE: CASH TRANSFERS AND BETTER JOBS
Studies show that cash transfers – whether conditional or unconditional – can help
improve beneficiaries’ wellbeing and their productivity on a wide range of dimensions.
They improve child nutrition and health (Aguëro et al., 2006; Duflo, 2003; Paxson and
Schady, 2007), language skills (Fernald and Hidrobo, 2011, Paxson and Schady, 2007) and
educational attainment (Case, Hosegood and Lund, 2005; for literature overviews see
Hanlon et al., 2010; Fiszbein and Schady, 2009) – all of which are important factors for
children to grow up to become an autonomous and productive person with a good capacity
to generate income. As an example, children’s nutrition with its positive influence on
health is important, because healthier children have been shown to achieve better results
in cognitive skills tests and earn significantly more as adults (Case and Paxson, 2008). The
programmes have also been shown to reduce child labour (Edmonds and Schady, 2009).
Research suggests that cash transfer programmes increase households’ capacity to
save and invest, thus generating higher income. Gertler et al. (2006) find that Mexico’s
Oportunidades programme helped poor rural households to invest in microenterprises and
Figure 1.7. Tax and benefits for low and high income householdsAs per cent of pre-transfer labour and capital income
1. Headed by working-age individuals. 2009 or latest year available.2. Pre-transfer income is net of taxes.Source: OECD, Income Distribution and Poverty Database.
1 2 http://dx.doi.org/10.1787/888932564312
-50
0
50
100
150
200
%
-50
0
50
100
150
200
%
CHE
♦
CHL
♦
JPN
♦
PRT
♦
NLD
♦
POL
♦
SVK
♦
NOR
♦
CAN
♦
EST
♦
CZE
♦
ISR
♦
FRA
♦
GBR
♦
FIN
♦
ISL
♦
KOR
♦
ESP
♦
LUX
♦
ITA
♦
USA
♦
AUT
♦
SVN
♦
DNK
♦
NZL
♦
DEU
♦
SWE
♦
BEL
♦
AUS
♦
MEX²TUR²
♦ Net taxes
A. Low-income households (bottom 20%)
Cash benefitsDirect taxes
-50
-40
-30
-20
-10
0
10
20
%
-50
-40
-30
-20
-10
0
10
20
%
DNK
♦
DEU
♦
NOR
♦
USA
♦
GBR
♦
SVN
♦
ISL
♦
AUT
♦
CHE
♦
LUX
♦
CHL
♦
CZE
♦
EST
♦
ESP
♦
KOR
♦
NLD
♦
FIN
♦
SWE
♦
NZL
♦
CAN
♦
ISR
♦
AUS
♦
BEL
♦
ITA
♦
POL
♦
PRT
♦
JPN
♦
SVK
♦
FRA
♦
♦ Net taxes
B. High-income households (top 20%)
Cash benefits Direct taxes
OECD ECONOMIC SURVEYS: CHILE © OECD 201250

1. REDUCING POVERTY IN CHILE: CASH TRANSFERS AND BETTER JOBS
agricultural activities with an estimated rate of return of 17%. In South Africa recipients of
the child support grant are twice as likely as comparable non-recipients to have a bank
account or some form of savings (Delany et al., 2008). Martínez (2004) shows that a
universal pension in Bolivia helped poor households increase their food consumption by
more than one and a half times the value of the pension. This resulted to a large extent
from increased home production of meat and vegetables thanks to a more intense use of
land when extra money was available to invest in animal ownership, crops and agricultural
inputs. This suggests that cash transfers can help households, who have no or limited
access to credit, to invest in improving their living standards.
Health, cognitive skills, education and people’s ability to invest are important factors
improving their productivity and well-being. Well-designed transfers could thus help Chile
reduce poverty, while improving the productivity of its workforce, thus also strengthening
the economy’s growth potential. The impact on poverty would thus be both direct –
through the transfer itself – and indirect, through the impact that transfers can have on
recipients’ health, education and skills and thus their ability to generate income.
Ultimately, if this contributes to stronger economic growth, poverty can be further reduced
through the effects that a general rise in incomes has on the low end of the income
distribution.
Cash transfers to date in Chile
Chile has a range of different cash transfers (Box 1.1) targeted with a proxy means test
that assigns scores to families based on employment, actual and imputed potential
income, health status and family composition (Ficha de Protección Social, FPS). Cash transfers
in Chile are currently rather small in size and quite narrowly targeted. Transfers connected
to Chile Solidario increase household income by around 10% for the lowest income decile,
and much less for income deciles above that (Figure 1.8). Only the non-contributory basic
Box 1.1. Cash transfers for poor families in Chile
Chile Solidario targets families who live in extreme poverty (with a score in the proxy meanstest, the Ficha de Protección Social, FPS, below 4.213). There is a special programme for the soleelderly, the homeless and children with a parent in prison. Beneficiaries are grantedpreferential access to a range of social services, including housing, employment, healthcare,education and childcare. With the support of a social worker Chile Solidario recipients designan action plan, which is supposed to help them exit poverty. The plan is based on79 minimum conditions out of which recipients are meant to achieve at least 13, in areas asdiverse as housing, employment, education, health and domestic violence. There are regularmeetings with the social worker to monitor progress. Benefits are decreasing over the first24 months falling from 26 USD per month to 14 USD. After that beneficiaries receive an exitgrant equivalent to 13.5 USD per month for 3 years. Given its relatively small size the benefitis mainly meant to motivate families to participate in the programme. Chile Solidarioparticipants have preferential access to a number of other cash transfers, provided theyqualify for them. This includes all cash transfers described in this box, but also the increasedschool voucher subsidy for poor children (Subvención Preferencial Escolar) and a subsidy forschools to help retain children in school the next year (Subvención pro Retención Escolar). Thesetwo subsidies go to the school, where the children are enrolled, not to its family. Preferentialaccess is important, because most social programmes in Chile are rationed.
OECD ECONOMIC SURVEYS: CHILE © OECD 2012 51

1. REDUCING POVERTY IN CHILE: CASH TRANSFERS AND BETTER JOBS
solidarity pension makes up a large share of pre-transfer income, although only for the
lowest income decile. As a comparison, the Mexican Oportunidades programme increases
pre-transfer consumption of households in the two lowest income deciles by 33% on
average (Fiszbein and Schady, 2009).
The government has recently made the decision to increase the cash transfers
associated with Chile Solidario significantly with the new transfer system, the Ingreso Ético
Familiar. The president sent the law proposal to Congress in late September 2011 and it is
now under debate (Box 1.2).
Box 1.1. Cash transfers for poor families in Chile (cont.)
Subsidio Único Familiar (SUF) is an allowance for poor families with pregnant women,school-age children or a disabled member who do not qualify for the contributory familyallowance for dependent employees, because nobody in the family is affiliated with asocial security institute. Thus, undeclared dependent employees and poor dependentworkers can qualify for the benefit, as well as the inactive or unemployed. The allowanceamounts to 6 776 Chilean pesos (13.5 USD) per month for households with a Ficha deProtección Social score below 11 734, which would correspond to the bottom 40% of theincome distribution. This transfer is conditional on regular medical controls for childrenunder 6 years and regular school attendance for children aged 6-18.
Figure 1.8. Share of transfers in pre-transfer household income by decile, 2009
1. Chile Solidario, Subsidio Único Familiar and water subsidy.2. Unemployment benefits and social security family allowance.Source: CASEN 2009.
1 2 http://dx.doi.org/10.1787/888932564331
Subsidio a la Cédula de Identidad is a financial support of 500 Chilean pesos (approximately1 USD) to obtain an identity card for people who receive Chile Solidario.
Subsidio al Pago del Consumo de Agua Potable y Servicio de Alcantarillado de Aguas Servidas(SAP) is a subsidy for obtaining drinkable water, which covers the bill for 15 m3 of water useeach month for Chile Solidario recipients who are connected to the network.
Pension Basica Solidaria (PBS) and Aporte Previsional Solidario (APS) are the non-contributorybasic solidarity pension and top-ups respectively for retired and disabled workers withsavings shortfalls in the private pension system. Recipients need to have a FPS score of12.185 or below to qualify.
0
20
40
60
80
100 %
0
20
40
60
80
100%
1 2 3 4 5 6 7 8 9 10Deciles
Non-targeted transfers ²
Non-contributory pension
Transfers linked to Chile Solidario ¹
OECD ECONOMIC SURVEYS: CHILE © OECD 201252
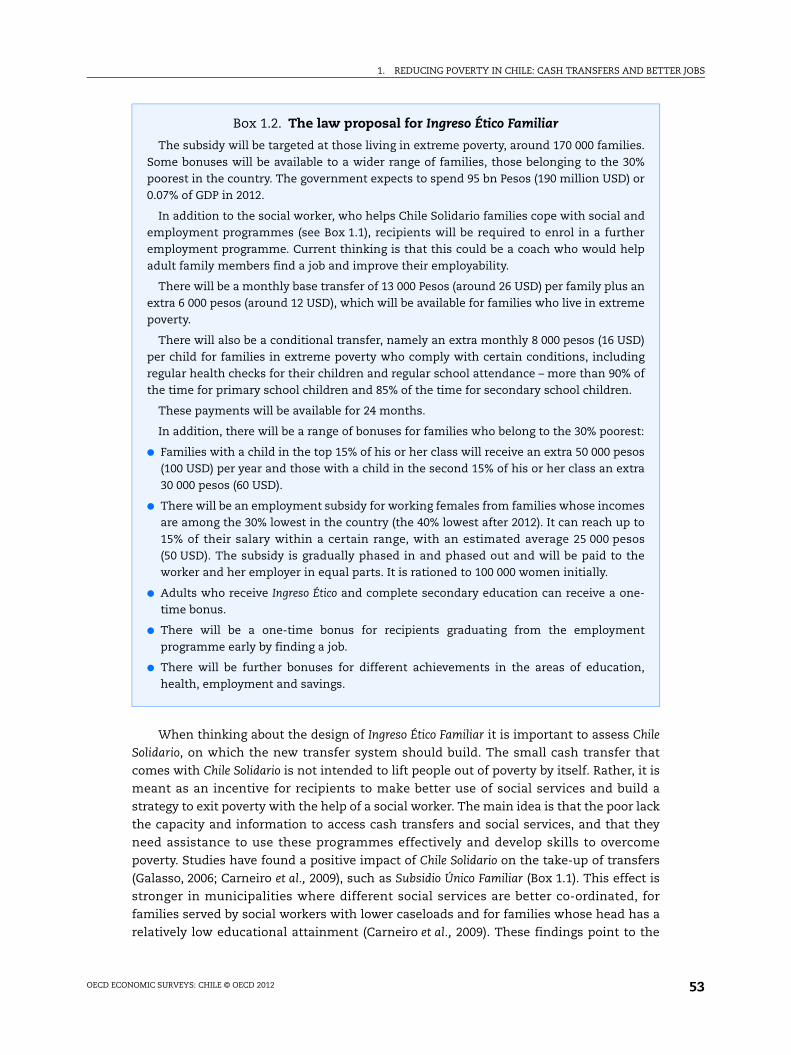
1. REDUCING POVERTY IN CHILE: CASH TRANSFERS AND BETTER JOBS
When thinking about the design of Ingreso Ético Familiar it is important to assess Chile
Solidario, on which the new transfer system should build. The small cash transfer that
comes with Chile Solidario is not intended to lift people out of poverty by itself. Rather, it is
meant as an incentive for recipients to make better use of social services and build a
strategy to exit poverty with the help of a social worker. The main idea is that the poor lack
the capacity and information to access cash transfers and social services, and that they
need assistance to use these programmes effectively and develop skills to overcome
poverty. Studies have found a positive impact of Chile Solidario on the take-up of transfers
(Galasso, 2006; Carneiro et al., 2009), such as Subsidio Único Familiar (Box 1.1). This effect is
stronger in municipalities where different social services are better co-ordinated, for
families served by social workers with lower caseloads and for families whose head has a
relatively low educational attainment (Carneiro et al., 2009). These findings point to the
Box 1.2. The law proposal for Ingreso Ético Familiar
The subsidy will be targeted at those living in extreme poverty, around 170 000 families.Some bonuses will be available to a wider range of families, those belonging to the 30%poorest in the country. The government expects to spend 95 bn Pesos (190 million USD) or0.07% of GDP in 2012.
In addition to the social worker, who helps Chile Solidario families cope with social andemployment programmes (see Box 1.1), recipients will be required to enrol in a furtheremployment programme. Current thinking is that this could be a coach who would helpadult family members find a job and improve their employability.
There will be a monthly base transfer of 13 000 Pesos (around 26 USD) per family plus anextra 6 000 pesos (around 12 USD), which will be available for families who live in extremepoverty.
There will also be a conditional transfer, namely an extra monthly 8 000 pesos (16 USD)per child for families in extreme poverty who comply with certain conditions, includingregular health checks for their children and regular school attendance – more than 90% ofthe time for primary school children and 85% of the time for secondary school children.
These payments will be available for 24 months.
In addition, there will be a range of bonuses for families who belong to the 30% poorest:
● Families with a child in the top 15% of his or her class will receive an extra 50 000 pesos(100 USD) per year and those with a child in the second 15% of his or her class an extra30 000 pesos (60 USD).
● There will be an employment subsidy for working females from families whose incomesare among the 30% lowest in the country (the 40% lowest after 2012). It can reach up to15% of their salary within a certain range, with an estimated average 25 000 pesos(50 USD). The subsidy is gradually phased in and phased out and will be paid to theworker and her employer in equal parts. It is rationed to 100 000 women initially.
● Adults who receive Ingreso Ético and complete secondary education can receive a one-time bonus.
● There will be a one-time bonus for recipients graduating from the employmentprogramme early by finding a job.
● There will be further bonuses for different achievements in the areas of education,health, employment and savings.
OECD ECONOMIC SURVEYS: CHILE © OECD 2012 53
1. REDUCING POVERTY IN CHILE: CASH TRANSFERS AND BETTER JOBS
role of the quality of complementary social services in ensuring success of cash transfer
programmes. Amior et al. (2010) suggest that neighbours’ participation in Chile Solidario also
has a positive effect on the take up of subsidies for households who do not receive Chile
Solidario themselves. The authors provide some evidence that this is due both to better
awareness of the existence of cash transfers and social programmes and a reduction of
transaction costs, perhaps because the Chile Solidario programme spreads information on
how to access these programmes to friends and neighbours. Studies have also found a
positive effect on school enrolment (Galasso, 2006), on access to housing and employment
programmes (Perticara, 2007; Galasso, 2006; Carneiro et al., 2009) and on housing conditions
(Larrañaga et al., 2009; Carneiro et al., 2009).
However, results on the effect of Chile Solidario on employment, income and poverty
are more mixed. While Galasso (2006) finds no positive effect on employment or income,
Perticara (2007) finds a positive effect in rural, but not in urban areas. Larrañaga et al. (2009)
find a positive impact on the number of employed people in participant households.
Carneiro et al. (2009) find a positive effect on the employment of second earners, but none
for household heads, including when they are single females. Gains in labour income per
capita and a reduction in poverty, including extreme poverty, is confined to rural areas and
to families with a head whose educational attainment is low according to this study.
Larrañaga et al. (2009) find a negative impact on market income for urban, although not for
rural households. The database they use does not allow the authors to assess the impact
on disposable income, including transfers. Given that Chile Solidario provides recipients
with preferential access to cash transfers, the authors conjecture that participants may
replace market income with transfers to some extent. One theory why the impact of Chile
Solidario in rural areas is stronger would be that access to information about cash transfers
and employment services in the absence of Chile Solidario is more difficult in these areas
than in cities, where people can more easily obtain information through neighbours or
other networks. Overall, these results suggests that better help is needed for transfer
recipients to find employment that allows them overcome poverty.
The role of transfer size
One aim of the new Ingreso Ético Familiar is to increase cash transfers and thus help lift
more people out of poverty. In principle, Chile can afford reducing poverty significantly
through transfers alone. Poverty gaps suggest that the country would have to invest less
than 1% of GDP to lift all citizens above the national poverty line or even 10% above that
(see Table 1.3), although it is important to note that this a static accounting exercise that
does not take into account behavioural changes. Another way to look at this is to ask which
share of their income relatively rich people would have to transfer to the poor to close the
poverty gap. For example, income that is more than 2½ times above the poverty line, or
within the top four income deciles, seems high enough to ask people to transfer part of
their earnings above that to the poor. An income surtax with a marginal tax rate of 3% for
income above this line would be sufficient to lift all Chileans out of poverty (Table 1.3).
Increasing cash incentives so that fiscal costs increase by 1% of GDP, however, may
undermine work incentives. Limiting cash transfers, while financing other social policies
that help people overcome poverty, including education, training and employment
programmes, may thus be preferable. Nevertheless, the poverty gap is a useful measure to
assess the scope of the poverty challenge. In China, as an example, closing the poverty gap
with a poverty line of 2 USD in purchasing power parity terms, which is well below the
OECD ECONOMIC SURVEYS: CHILE © OECD 201254

1. REDUCING POVERTY IN CHILE: CASH TRANSFERS AND BETTER JOBS
national poverty line in Chile, would require taxing richer individuals – those who earn
more than 2½ time the Chilean poverty line – with prohibitive rates of around 100%
(Ravallion, 2009). Compared to that, the Chilean problem is more manageable. However, for
the moment the sum that the government plans to invest in additional cash transfers,
0.07% of GDP, is an order of magnitude smaller than the poverty gap. In fact the stated aim
is to close the gap between families’ income, including subsidies they receive now, and the
national line for extreme poverty – not poverty – by no more than 85% with the monthly
transfers.
How many people can be lifted out of poverty with cash transfers is not the only aspect
to consider when deciding on the size of the transfer. Research has shown that transfer
size can matter for the impact on recipients’ ability to invest. Fernald et al. (2008) show that
a doubling of cumulative transfers in Mexico’s Oportunidades was associated with higher
height-for-age scores, a lower incidence of stunting and better motor and language
development. De Janvry and Sadoulet (2006) conclude that the marginal impact of transfers
on school enrolment is large, as every 10 USD results in an additional 1½ percentage points
in enrolment. They also note, however, that the impact of larger transfers depends much
on children’s and families’ characteristics and is larger for older children and those living
farther away from the nearest school. These researchers impose linearity on the
relationship between the size of transfers and enrolment, thus not allowing for declining
marginal impacts. Todd and Wolpin (2006) estimate a structural dynamic model of
Oportunidades incorporating fertility and schooling choices and conclude, based on model
simulations, that the positive impact on the number of years of schooling is linearly
increasing up to the actual transfer amount. Thereafter, it increases at a slightly
diminishing rate. Filmer and Schady (2011) find a strongly diminishing marginal impact on
schooling of cash transfers that were allocated randomly at different sizes to different
families in Cambodia. The role of the size of transfers for other dimensions, such as health
and ability to make productive investments, however, has been less well researched.
One problem might be that larger cash transfers could undermine people’s work
incentives, which would limit the positive impact on output and productivity. Research
suggests, though, that such fears may be exaggerated at least in an emerging country
context where these transfers tend to be small and beneficiaries have difficulties to make
ends meet even if they have access to them. Studies of conditional cash transfer
programmes in Brazil, Mexico, Nicaragua and Honduras suggest that they have no or very
small effects on adult labour participation or hours, which are in some cases positive
(Foguel and Paes de Barros, 2010; Parker and Skoufias, 2000; Alzúa et al., 2010). Eyal and
Wollard (2010) find a positive effect of South Africa’s child support grant on the probability
Table 1.3. Poverty rates and gaps depending on the poverty line, 2009
Poverty line in % of the national poverty line 0.50 0.75 0.90 1.00 1.10 1.25
Poverty line; monthly per capita household income in US PPP 83.19 124.34 149.43 166.21 182.69 207.34
Poverty rate 3.74 8.12 12.01 15.12 18.23 23.30
Poverty gaps1 as a % of GDP 0.10 0.28 0.48 0.65 0.86 1.27
Tax on income above 2½ times the urban poverty line that would close the poverty gap 0.48 1.33 2.24 3.06 4.07 5.96
1. The sum of all income shortfalls with respect to the poverty line in % of GDP.Source: OECD based on Encuesta de Caracterización Socioeconómica Nacional (CASEN).
OECD ECONOMIC SURVEYS: CHILE © OECD 2012 55

1. REDUCING POVERTY IN CHILE: CASH TRANSFERS AND BETTER JOBS
that mothers of recipient children participate in the labour force or are employed and a
negative effect on their unemployment rates. OECD (2011) confirms these positive effects
on labour market outcomes for poorer recipient mothers, while the positive impact on
labour force participation in the sample comprising all recipient mothers comes with a
higher probability of being unemployed.
Studies of programmes with larger cash transfers are more likely to find a negative
impact on labour force participation or hours worked, although there are nuances to these
results. Carvalho Filho (2008) finds that old-age pensions for rural workers in Brazil, which
typically correspond to a minimum wage, reduced total hours and the probability that
recipients worked. Bertrand et al. (2003) find a drop in hours worked for prime-aged
individuals living with pensioners in South Africa, who receive comparatively generous
benefits. The employment probability for prime-aged men falls according to these results,
although the same does not hold for women. OECD (2011) results suggest that the presence
of a pensioner in the household has a negative effect on females’ probability to be
employed, although there is no significant impact on their labour force participation. There
is a negative effect on male labour force participation, although broad labour force
participation is not affected significantly. This latter concept includes discouraged
individuals who would be willing to take up a job offer, but have stopped active job search.
However, there is a qualification to these results. Once migrating household members are
taken into account, there is a small positive impact on employment of prime-aged adults
with pensioners belonging to their household (Ardington et al., 2009). One interpretation
would be that increased household resources can be used to support migrants until they
become self-sufficient, while pensioners can look after small children, allowing prime-
aged adults to look for work elsewhere. Overall, these results suggest that cash transfers in
middle income countries probably have to be quite large to undermine work incentives.
This suggests that unless Chile was to increase benefits significantly above those in
Brazil or Mexico, the danger that there might be negative effects on work incentives is
likely to be limited. Once cash transfers increase beyond that, though, Chile might want to
monitor whether work incentives are undermined. Well enforced job search and work
requirements would then be a solution. Ingreso Ético Familiar recipients will, in fact, be
required to enrol in employment programmes, which may involve a coach who helps them
improve their employability and find employment according to current thinking.
Once the first phase of Ingreso Ético Familiar is firmly established Chile could
experiment in pilot studies with different increases in transfer sizes to study the impact on
health, education, skills and employment. This would be important information to decide
on possible future increases in transfer size. Ingreso Ético Familiar should build on existing
cash transfers and over time it should be better integrated with at least some of them. The
targeting mechanism for Ingreso Ético Familiar will take other transfers into account, but
there will still be different procedures and conditions for access. Stronger integration
would make the cash transfer system overall simpler, more transparent and easier to
administer.
The role of targeting
The proxy means test that Chile uses for a wide range of social programmes has been
successful in targeting various social programmes to the poorest, but it is probably quite
costly. Eligibility is determined through interviews based on a questionnaire, the Ficha de
Protección Social (FPS). Household’s earnings capacity is evaluated with econometric
OECD ECONOMIC SURVEYS: CHILE © OECD 201256

1. REDUCING POVERTY IN CHILE: CASH TRANSFERS AND BETTER JOBS
methods predicting household members’ potential income with information on their
educational attainment, occupational status and history. Declared earned income only
accounts for 10% of the score for potential earnings. Other variables that are considered are
household composition and health status among members. The Ministry of Social Affairs
transforms the indicators collected by interviewers at the municipal level into a score for
each household with a method that is not revealed to interviewers or potential
beneficiaries. A range of social programmes are then targeted based on discrete cut-off
scores that differ from programme to programme. A recent review (Comité de Expertos, 2010),
revealed a number of weaknesses. These are related to the incentives set through discrete
cut-off points with immediate benefit withdrawal and relatively loose verification of
complex information with weak sanctions.
Given the discrete cut-off points for eligibility potential beneficiaries have incentives
to make false declarations on their characteristics that they believe may have a strong
influence on their score, such as household composition and the educational attainment
and disability status of members. Until recently there were no systematic documentation
requirements for the information provided by households, it was up to interviewers and
municipalities how they verify the information they receive and controls or sanctions for
interviewees, interviewers or their supervising authorities were weak or non-existent.
Households can ask for a re-assessment, but only those who believe that they would have
a lower score than before are likely to do so. Otherwise, there is no mechanism to
systematically update the scores. There is evidence that the accuracy of information is
indeed questionable, as households and the incidence of disability according to the Ficha de
Protección Social are much more numerous than they should be according to household
survey data. More than 22% received a score that would correspond to the lowest decile of
the score distribution according to a simulation with household survey data, thus more
than double of what it should be (Comité de Expertos, 2010). These points to serious
underreporting of various aspects of potential income or overreporting of needs.
Following the recommendations of the expert committee, the government wants to
simplify the Ficha de Protección Social, to put more emphasis on verifiable data, thus allowing
for cross-checking the information provided by families with administrative data sources,
and to fight fraud with risk models. Scores will expire after two years and thus need to be
updated regularly. These initiatives are welcome.
Withdrawing benefits more gradually would be an important complementary measure
to attenuate incentives to make false declarations or avoid taking up employment. There is
some anecdotic evidence that Chile Solidario recipients sometimes try to avoid taking up
employment for fear of benefit loss (ClioDinamica, 2010). Opening the transfers to a wider
range of beneficiaries over time would also avoid households above the cut-off point not
receiving benefits, despite being relatively poor. This is a real issue in the Chilean context
where the income distribution is narrow at the lower end, as noted above. Currently the
government plans to keep targeting narrow under Ingreso Ético Familiar.
Given that Chile’s means test is complex and that applying stronger verification would
make it even more costly, one question is whether there would be more cost-effective
targeting mechanisms. Madeiro et al. (2008) show that Brazil’s targeted cash transfer
programme, Bolsa Familia, which is mainly based on declared income, is almost as well-
targeted as Mexico’s and Chile’s programme with their intricate proxy means tests. Chile
might therefore want to consider targeting benefits mainly based on declared income,
OECD ECONOMIC SURVEYS: CHILE © OECD 2012 57
1. REDUCING POVERTY IN CHILE: CASH TRANSFERS AND BETTER JOBS
perhaps complemented by a small set of needs indicators, such as the number of
dependent household members and disability among them. There could also be some
complementary indicators for the specific social programme for which the means test is
used, for example housing conditions in the case of housing subsidies. Household survey
data suggests that it is possible to verify all income sources with administrative data for
nearly 50% of all households in the lower half of the income distribution. In addition to
that, random checks will be needed to verify that households do not have informal income
in addition to their formal revenues. While this will require substantial investments in
authorities’ ability to verify benefit claims, this would hardly be more expensive than
verifying information based on the Ficha de Protección Social and carrying forward its
relatively complicated administration. Moreover, these investments are desirable by
themselves, as they would help the government to fight informality and tax evasion more
effectively.
Using declared income and updating the means test regularly rather than trying to
assess potential income with a complex methodology would have the added benefit that
the transfer could evolve into an income risk insurance over time. With a means test based
on potential income that is not frequently updated, people who fall into poverty will often
not be eligible for transfers. This would change if the means test was based on current,
declared income. Such a test would allow the government to use cash transfers to protect
households from income shocks, thus strengthening the automatic stabilisers of the
economy. Gradual benefit withdrawal would also be easier with a simpler targeting
mechanism.
Conditionality
Like many other cash transfer programmes in Latin America, Chile Solidario and
Subsidio Único Familiar require recipients to comply with certain conditions to receive the
transfers. In the case of Chile Solidario these conditions are personalised and developed by
the recipient family with the support of social workers. They can concern health,
education, employment housing, income, family life and legal documentation. The Subsidio
Único Familiar requires regular medical controls for children under 6 and regular school
attendance for children between 6 and 18. There will be similar conditions tied to the
Ingreso Ético Familiar transfer.
One issue is whether conditionality is really necessary or effective to achieve the
desired result. Monitoring conditionality is costly, and complying with the co-
responsibilities is time-consuming for the household. If the poor invest too little into
education or healthcare because they are credit-constrained and would be unable to satisfy
their basic needs when investing, then unconditional cash transfers would be sufficient to
solve the problem. They would also be more efficient, because they avoid enforcement
costs and possible distortions, for example through inefficiently high investment in health
or education.
Conditionality, on the other hand, may be justified if it enhances political acceptance
of the cash transfers. Another issue may be that parents are misinformed about the returns
to investments in education and health or their preferences may not be well aligned with
those of their children. However, in those cases better information may be more efficient
than imposing conditions on benefit recipients. Visits of social workers and mandatory
participation in workshops may play this role in providing better information in Chile.
OECD ECONOMIC SURVEYS: CHILE © OECD 201258

1. REDUCING POVERTY IN CHILE: CASH TRANSFERS AND BETTER JOBS
Some studies suggest that other characteristics than conditionality are more
important for the success of cash transfers. In a statistical meta-analysis of research
assessing the impact of cash transfer programmes on children’s nutrition, Manley et al.
(2011) find that the impact is not distinguishable for unconditional cash transfers and
those with healthcare conditions, while programmes with conditions related to work and
savings fare worse. Fernald et al. (2008) find that the cash component of the Oportunidades
programme was associated with greater height, as well as better cognitive and language
performance of children receiving the benefit, independently of conditions or nutritional
supplements. On the other hand, there is also evidence indicating that, with good design,
imposing conditionality can yield additional benefits. De Brauw and Hoddinott (2010) find
that conditionality by itself did increase the impact of Mexico’s Oportunidades on school
attendance. This impact was particularly strong during the transition to lower secondary
school, whereas there was no measurable effect on children continuing primary school.
Results obtained by Attanasio et al. (2005) suggest that this may be due to the costs of
schooling increasing with age. Thus, raising the grant for older children, while lowering it
for smaller children, as an alternative to conditionality, can increase the effectiveness of
the programme.
The conclusion for Chile would be that it is important to evaluate whether
conditionality comes with additional benefits. Ingreso Ético Familiar, as conceived now, would
have numerous different elements, some unconditional and many others tied to different
conditionalities (see Box 2.2). Choosing a simpler set-up with requirements for adults to
search for employment and enrol in training, if necessary to improve their employability,
would be much easier to administer and may well be the most effective way to help the poor
strengthen their capacity to improve their living standards. Unlike in other countries in the
region, the incidence of malnutrition among children in Chile is low (comparable to that in
the richest OECD countries), school attendance is compulsory and it is generally high,
although in the target group almost 60% of the children miss more than 5% of their classes.
Thus, conditions regarding medical checkups and higher school attendance are in some
sense redundant, although they may create further incentives for poor families to comply
with the law. However, this should be enforced for all children, not only the poor.
Some of the conditions to which the government plans to tie benefits may even have
harmful side effects. One example is the transfer that families, whose income is in the
lower third of the income distribution, can obtain based on their children’s ranking in their
class (Box 2.2). In particular, tying a large part of the benefits to children’s ranking in school
should be revisited, as it can be divisive. It will put a lot of pressure on teachers grading
these children and discourage parents from sending their children to better schools.
To go for a simpler model, the government could launch a political discussion on what
should be the base income that a household should receive when it can temporarily not
secure any income. This transfer could be tied to training and job search requirements,
along with support, and the transfer could be gradually withdrawn. This would be akin to
France’s Revenu de Solidarité Active (RSA). The transfer should be evaluated to understand
the features that are most effective in strengthening poor households’ capacity to
overcome poverty for good.
The quality of complementary social services
When trying to enhance the poor’s investment in human capital and their capacity to
generate income, imposing employment, education or health conditions on benefit
OECD ECONOMIC SURVEYS: CHILE © OECD 2012 59
1. REDUCING POVERTY IN CHILE: CASH TRANSFERS AND BETTER JOBS
recipients is not sufficient. If schools or health services in poor neighbourhoods are of poor
quality or not available at all, neither transfers nor conditions attached to them can be very
effective. In Chile school enrolment is high, but the government needs to do more to close
the gap in learning results between rich and poor children (OECD, 2010). The government
currently invests a lot in schooling for poorer children. As long as results are evaluated to
correct design, if needed, and ensure that the extra money is well spent, this may go a long
way in providing better access to high-quality schooling for poor children. Chile should
continue its efforts to invest more in the education of poor students.
Studies suggest that there are supply side constraints that can limit the success of
Chile Solidario (OECD, 2009). Workloads for social workers are high in many cases and there
is high turnover related to relatively low wages (Grupo de Politica Social, 2010). A study
noted that employment programmes within Chile Solidario were not very well tailored to
participant’s needs nor to the local characteristics of the labour market. The programmes
are often poorly co-ordinated with the business sector (Sur Profesionales Consultores, 2005).
According to household survey data only 2% of Chile Solidario recipients stated that they
had found a job through the local labour offices, and 4.5% thanks to Chile Solidario or the
social worker that attends to them.
Municipalities differ strongly in resources and the capacity of their personnel to
administer education and social programmes. The main source of own income for
municipalities are property taxes, but these are subject to relatively high exemption
thresholds, and thus revenues in poor municipalities with a lot of low-value houses are
very weak. There is some redistribution of property tax revenues through the Fondo Común
Municipal and there are central government transfers for various municipal tasks. However,
the resulting degree of equalisation is weak compared with other OECD countries
(Table 1.4). Average per capita revenues of the richest decile of municipalities is more than
twice as high as those of the poorest decile even after fiscal equalisation. Within Greater
Santiago the three richest municipalities have more than five times more resources per
inhabitant than the three poorest ones. The Gini coefficient for average per capita fiscal
revenues by decile also suggests that fiscal disparities across municipalities are high in
Chile and fiscal equalisation does relatively little to correct this.
The central government is currently envisaging larger transfers to municipalities with
weak tax revenues and a scheme to improve the qualification of the personnel who
administer municipalities and this is welcome. Poorer municipalities need stronger
resources to provide their citizens with high-quality services that help them overcome
poverty. In the medium term, the government should consider developing fiscal
equalisation further, either by devoting a larger share of municipal or central tax revenues
to the redistribution fund, or by increasing earmarked central government transfers to
poorer communities, as in the case of increased voucher subsidy for poor children.
Increasing property tax revenues along the lines suggested above would provide
municipalities with vital extra resources. If municipalities participated more in the
revaluation of housing and decided on tax rates within limits set by the central
government, this would also enhance accountability. The example of several
OECD countries, including Switzerland and Sweden, shows that a high degree of fiscal
equalisation is possible, while maintaining incentives for subnational governments to
collect more revenues at the margin.
OECD ECONOMIC SURVEYS: CHILE © OECD 201260
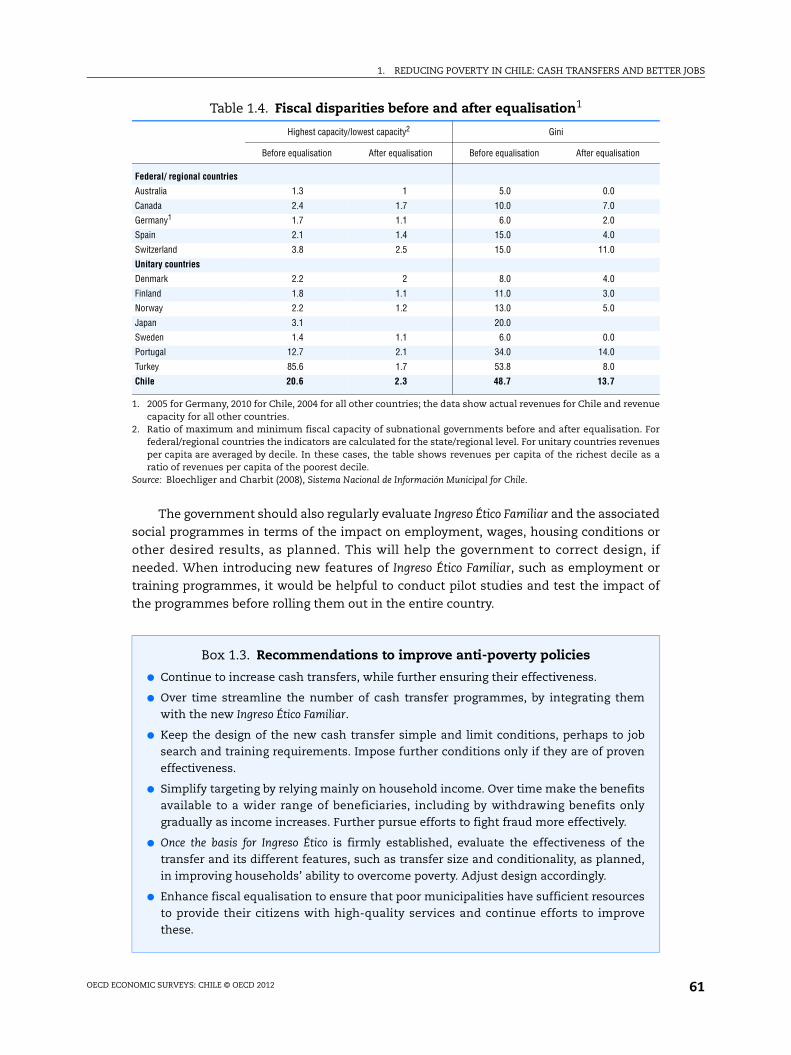
1. REDUCING POVERTY IN CHILE: CASH TRANSFERS AND BETTER JOBS
The government should also regularly evaluate Ingreso Ético Familiar and the associated
social programmes in terms of the impact on employment, wages, housing conditions or
other desired results, as planned. This will help the government to correct design, if
needed. When introducing new features of Ingreso Ético Familiar, such as employment or
training programmes, it would be helpful to conduct pilot studies and test the impact of
the programmes before rolling them out in the entire country.
Table 1.4. Fiscal disparities before and after equalisation1
Highest capacity/lowest capacity2 Gini
Before equalisation After equalisation Before equalisation After equalisation
Federal/ regional countries
Australia 1.3 1 5.0 0.0
Canada 2.4 1.7 10.0 7.0
Germany1 1.7 1.1 6.0 2.0
Spain 2.1 1.4 15.0 4.0
Switzerland 3.8 2.5 15.0 11.0
Unitary countries
Denmark 2.2 2 8.0 4.0
Finland 1.8 1.1 11.0 3.0
Norway 2.2 1.2 13.0 5.0
Japan 3.1 20.0
Sweden 1.4 1.1 6.0 0.0
Portugal 12.7 2.1 34.0 14.0
Turkey 85.6 1.7 53.8 8.0
Chile 20.6 2.3 48.7 13.7
1. 2005 for Germany, 2010 for Chile, 2004 for all other countries; the data show actual revenues for Chile and revenuecapacity for all other countries.
2. Ratio of maximum and minimum fiscal capacity of subnational governments before and after equalisation. Forfederal/regional countries the indicators are calculated for the state/regional level. For unitary countries revenuesper capita are averaged by decile. In these cases, the table shows revenues per capita of the richest decile as aratio of revenues per capita of the poorest decile.
Source: Bloechliger and Charbit (2008), Sistema Nacional de Información Municipal for Chile.
Box 1.3. Recommendations to improve anti-poverty policies
● Continue to increase cash transfers, while further ensuring their effectiveness.
● Over time streamline the number of cash transfer programmes, by integrating themwith the new Ingreso Ético Familiar.
● Keep the design of the new cash transfer simple and limit conditions, perhaps to jobsearch and training requirements. Impose further conditions only if they are of proveneffectiveness.
● Simplify targeting by relying mainly on household income. Over time make the benefitsavailable to a wider range of beneficiaries, including by withdrawing benefits onlygradually as income increases. Further pursue efforts to fight fraud more effectively.
● Once the basis for Ingreso Ético is firmly established, evaluate the effectiveness of thetransfer and its different features, such as transfer size and conditionality, as planned,in improving households’ ability to overcome poverty. Adjust design accordingly.
● Enhance fiscal equalisation to ensure that poor municipalities have sufficient resourcesto provide their citizens with high-quality services and continue efforts to improvethese.
OECD ECONOMIC SURVEYS: CHILE © OECD 2012 61
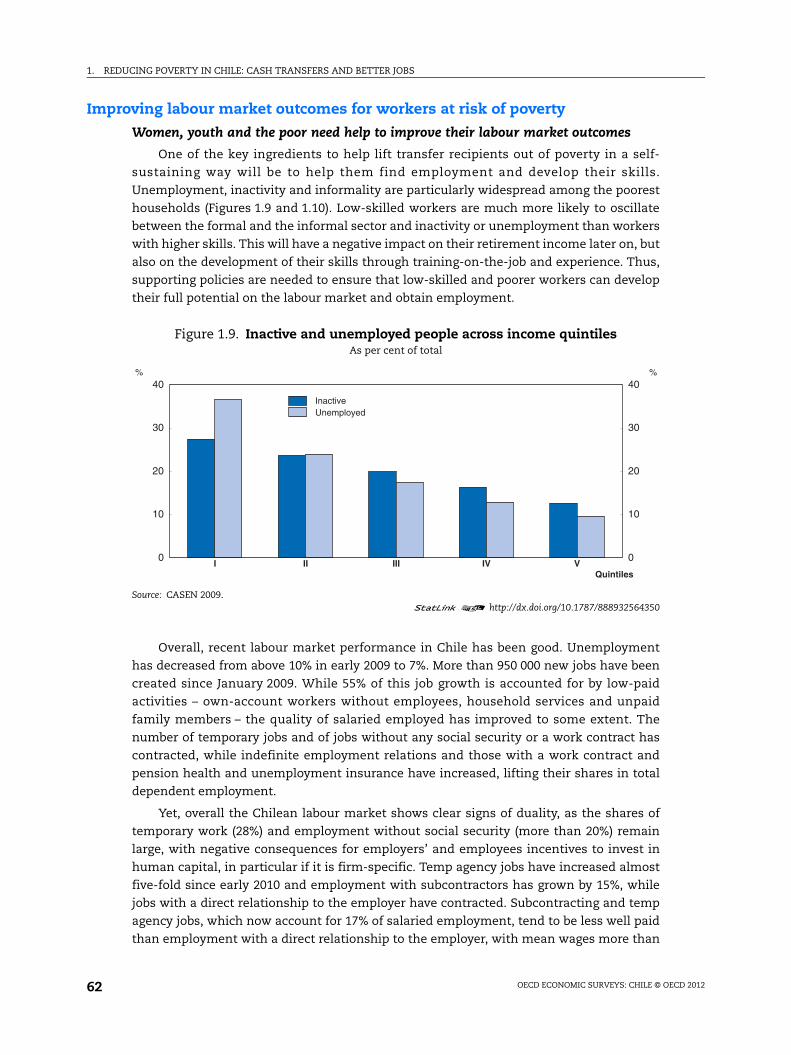
1. REDUCING POVERTY IN CHILE: CASH TRANSFERS AND BETTER JOBS
Improving labour market outcomes for workers at risk of poverty
Women, youth and the poor need help to improve their labour market outcomes
One of the key ingredients to help lift transfer recipients out of poverty in a self-
sustaining way will be to help them find employment and develop their skills.
Unemployment, inactivity and informality are particularly widespread among the poorest
households (Figures 1.9 and 1.10). Low-skilled workers are much more likely to oscillate
between the formal and the informal sector and inactivity or unemployment than workers
with higher skills. This will have a negative impact on their retirement income later on, but
also on the development of their skills through training-on-the-job and experience. Thus,
supporting policies are needed to ensure that low-skilled and poorer workers can develop
their full potential on the labour market and obtain employment.
Overall, recent labour market performance in Chile has been good. Unemployment
has decreased from above 10% in early 2009 to 7%. More than 950 000 new jobs have been
created since January 2009. While 55% of this job growth is accounted for by low-paid
activities – own-account workers without employees, household services and unpaid
family members – the quality of salaried employed has improved to some extent. The
number of temporary jobs and of jobs without any social security or a work contract has
contracted, while indefinite employment relations and those with a work contract and
pension health and unemployment insurance have increased, lifting their shares in total
dependent employment.
Yet, overall the Chilean labour market shows clear signs of duality, as the shares of
temporary work (28%) and employment without social security (more than 20%) remain
large, with negative consequences for employers’ and employees incentives to invest in
human capital, in particular if it is firm-specific. Temp agency jobs have increased almost
five-fold since early 2010 and employment with subcontractors has grown by 15%, while
jobs with a direct relationship to the employer have contracted. Subcontracting and temp
agency jobs, which now account for 17% of salaried employment, tend to be less well paid
than employment with a direct relationship to the employer, with mean wages more than
Figure 1.9. Inactive and unemployed people across income quintilesAs per cent of total
Source: CASEN 2009.1 2 http://dx.doi.org/10.1787/888932564350
0
10
20
30
40 %
0
10
20
30
40%
I II III IV VQuintiles
InactiveUnemployed
OECD ECONOMIC SURVEYS: CHILE © OECD 201262

1. REDUCING POVERTY IN CHILE: CASH TRANSFERS AND BETTER JOBS
20% lower than for regular work relationships. In addition, there is a risk that incentives to
invest in human capital are weakened, when the employment relationship is not direct.
Notwithstanding recent improvements, unemployment has been higher in Chile than
in the OECD on average, although this picture has changed somewhat after the recent
recession, as employment recovered quickly in Chile in contrast to a number of
OECD countries. The overall unemployment rate in Chile is now in line with the OECD
average. However, the youth and female unemployment rates are still well above the OECD
average, although the gap has narrowed compared to the average over the last 10 years,
which was substantial (Figure 1.11). Labour force participation, in turn, continues to
remain well below the OECD average in Chile, mainly owing to a particularly low female
labour force participation – among the lowest in the OECD.
Women earn much lower wages than men, with salaries of 85% of those of men, and
70% if the self-employed are included. Over the last 20 years, only the gender wage gap for
workers with more than 13 years of education has diminished with women’s salaries
Figure 1.10. Informality and job quality across income quintilesAs per cent of total in the quintile
Source: CASEN 2009.1 2 http://dx.doi.org/10.1787/888932564369
0
10
20
30
40
50
60%
0
10
20
30
40
50
60%
I II III IV VQuintiles
A. Share of workers without social security
0
10
20
30
40
50
60%
0
10
20
30
40
50
60%
I II III IV VQuintiles
B. Share of employees who do not have a contract
0
10
20
30
40
50
60%
0
10
20
30
40
50
60%
I II III IV VQuintiles
C. Share of workers who work in a company with less than 6 employees
OECD ECONOMIC SURVEYS: CHILE © OECD 2012 63
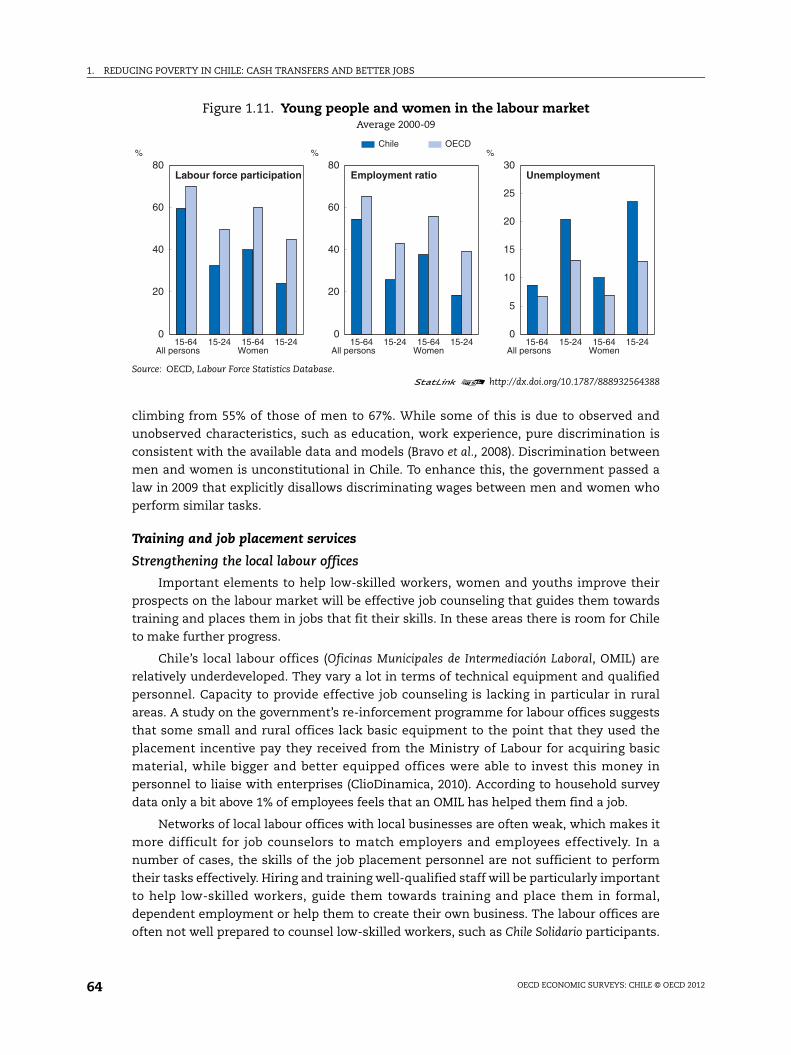
1. REDUCING POVERTY IN CHILE: CASH TRANSFERS AND BETTER JOBS
climbing from 55% of those of men to 67%. While some of this is due to observed and
unobserved characteristics, such as education, work experience, pure discrimination is
consistent with the available data and models (Bravo et al., 2008). Discrimination between
men and women is unconstitutional in Chile. To enhance this, the government passed a
law in 2009 that explicitly disallows discriminating wages between men and women who
perform similar tasks.
Training and job placement services
Strengthening the local labour offices
Important elements to help low-skilled workers, women and youths improve their
prospects on the labour market will be effective job counseling that guides them towards
training and places them in jobs that fit their skills. In these areas there is room for Chile
to make further progress.
Chile’s local labour offices (Oficinas Municipales de Intermediación Laboral, OMIL) are
relatively underdeveloped. They vary a lot in terms of technical equipment and qualified
personnel. Capacity to provide effective job counseling is lacking in particular in rural
areas. A study on the government’s re-inforcement programme for labour offices suggests
that some small and rural offices lack basic equipment to the point that they used the
placement incentive pay they received from the Ministry of Labour for acquiring basic
material, while bigger and better equipped offices were able to invest this money in
personnel to liaise with enterprises (ClioDinamica, 2010). According to household survey
data only a bit above 1% of employees feels that an OMIL has helped them find a job.
Networks of local labour offices with local businesses are often weak, which makes it
more difficult for job counselors to match employers and employees effectively. In a
number of cases, the skills of the job placement personnel are not sufficient to perform
their tasks effectively. Hiring and training well-qualified staff will be particularly important
to help low-skilled workers, guide them towards training and place them in formal,
dependent employment or help them to create their own business. The labour offices are
often not well prepared to counsel low-skilled workers, such as Chile Solidario participants.
Figure 1.11. Young people and women in the labour marketAverage 2000-09
Source: OECD, Labour Force Statistics Database.1 2 http://dx.doi.org/10.1787/888932564388
0
20
40
60
80%
15-64 All persons
15-24 15-64 Women
15-24
Labour force participation
0
20
40
60
80 %
15-64 All persons
15-24 15-64 Women
15-24
Employment ratio
Chile OECD
0
5
10
15
20
25
30 %
15-64 All persons
15-24 15-64 Women
15-24
Unemployment
OECD ECONOMIC SURVEYS: CHILE © OECD 201264
1. REDUCING POVERTY IN CHILE: CASH TRANSFERS AND BETTER JOBS
The fact that only 3% of Chile Solidario recipients are registered with OMILs may well be a
testimony to the weak confidence that these clients have in the value of OMIL services. The
low skills of these workers and the fact that they are used to informal and independent
work, but generally have little experience with formal, dependent employment, requires
experienced job counselors who are well prepared to work with these clients.
The government is working to improve the functioning of job intermediation services,
tripling resources allocated to local employment offices in 2011 (now 2.4 billion pesos, or
0.002% of GDP). The programme includes flat transfers and an incentive pay system for
successful job placement as well as training for the personnel of the local labour offices.
One question is whether it makes sense in the current context, where OMILs have such
different capacity, to assign performance bonuses. Maybe the focus in the first stage of
reinforcement should be to level the basic capacity of OMILs that are particularly weak. In
the second stage, when the capacity of different OMILs is more even, the central
government could then move towards assigning performance bonuses, as well.
The government has recently started a training programme for OMIL employees. The
seminars focus on skills to adjust intermediation services to individual clients as well as to
local labour market conditions and to build networks with local businesses. The aim is to
establish a permanent training programme for OMIL personnel provided by a university.
Chile should continue these important efforts. In particular, the government should
assess what needs to be done to ensure that local labour offices have comparable capacity
across the country. This may require more effective fiscal equalisation, as discussed above.
Low-income municipalities with many low-skilled citizens, who have difficulties in finding
jobs of decent quality, are in particular need of high-quality employment services and
weak municipal resources should not be an impediment to this.
There are good reasons to enhance the quality of job intermediation in Chile. OECD
experience suggests that job intermediation programmes are particularly successful in
reducing the time spent in unemployment, while increasing employment rates and
earnings (Kluve, 2010; Card et al., 2010), while classroom and on-the-job training
programmes yield only small effects in the shorter term, but bigger effects in the long term.
In a developing country context Betcherman et al. (2004) confirm that job placement
services are relatively effective and costs are comparatively low, although they are of
limited use by themselves when structural unemployment is high and there is little
demand for labour. The government plans to integrate private and public job
intermediation with publicly-funded training programmes and that will be welcome.
The government has also started to engage private providers into job intermediation
through the Bono de Intermediación Laboral, which pays job intermediation agencies for
placing jobseekers. OECD experience suggests that partial outsourcing of job
intermediation services can be cost effective. However, the public agency must be prepared
to monitor private agencies’ performance in providing job intermediation services and
training, compare with its own results and fight fraud. In Chile this will be particularly
important, as the role of private placement agencies is currently limited, with only ½ per
cent of employees stating that they have found their jobs thanks to a private agency. The
Ministry of Labour should conduct such evaluations, as this would be beyond the capacity
of municipal labour offices. The fees for the private agency have to be designed to reward
sustainable job placements and minimise fraud as well as the risk that private agencies
cherry pick and choose only the most employable candidates. Chile foresees higher
OECD ECONOMIC SURVEYS: CHILE © OECD 2012 65

1. REDUCING POVERTY IN CHILE: CASH TRANSFERS AND BETTER JOBS
payments for placing hard to place candidates, which is a sensible approach, but agencies
can choose freely from a pool of candidates open to all private agencies. Unless fees for the
hard to place are high enough, agencies may prefer to concentrate their efforts on workers
who are easier to place. Letting agencies bid for predefined pools of candidates, which are
diverse in terms of work experience and qualifications, would prevent agencies altogether
from cream-skimming and it would allow the government to compare their performance if
each of them had a pool with a similar composition. Agencies could be paid depending on
the share of candidates that they place with premia for finding jobs for hard to place
candidates. The government plans to pay out fees to agencies fully only after the candidate
has been retained for three months in the new job. Another possibility to create incentives
for agencies to search for longer-term employment would be to withhold part of the fee
until candidates have spent a year in their new job.
The government also created an electronic platform for job search, Bolsa Nacional de
Empleo. The tool has the potential to make it easier for job counselors to place their clients
and jobseekers can access the tool directly. In 2009 only 1% of employees stated that they
had found their job through this tool. At the time, it was only available for jobseekers
visiting an OMIL. Since then the government has made the tool available through the
internet, which has increased its use and potentially its effectiveness.
It is not yet clear how the envisaged employment programmes for Ingreso Ético Familiar
will fit into the structure of municipal labour offices, private placement services and
publicly-financed training programmes. The current thinking is that an employment coach
will attend to recipient families to help them improve their employability and find a job.
Chile should evaluate its different efforts to improve job intermediation services and make
sure that they are well co-ordinated or even integrated. Over time, it should retain only the
most effective of the different programmes. Concentrating efforts to train staff at
municipal labour offices that is specifically qualified to guide low-skilled workers towards
training and employment may well be more efficient than pursuing a patchwork of
different structures that could be difficult to administer and monitor.
Training, public employment programmes and wage subsidies in Chile
Training and other active labour market programmes can be useful in raising
jobseekers abilities to generate income. However, publicly financed programmes in Chile
are insufficiently targeted at those who need training most to overcome barriers towards
employment. Around 80% of total public training resources are devoted to Bono de
Franquicia Tributaria para la Capacitación, a programme that offers tax breaks to employers
who decide to send their employees on training with certified institutions. This
programme disproportionately benefits higher-income workers with higher education who
work in large enterprises with sophisticated human resource management. Less than 5%
of the programme’s resources go to workers with basic education or less (Castro and
Viñaspre, 2011; Larrañaga et al., 2011). Moreover, recent studies commissioned by the
government suggest that the programme has no measurable effect on salaries or
employment in the long run (Larrañaga et al., 2011). This may be related to institutional
problems. As an example, more than 70% of the training programmes financed by
Franquicia Tributaria lasted less than 18 hours.
There are other training programmes that are of doubtful effectiveness. One example is
Bonificación a la contratación de mano obra, which combines wage subsidies for a period of four
months with training subsidies for companies who hire a previously unemployed worker.
OECD ECONOMIC SURVEYS: CHILE © OECD 201266
1. REDUCING POVERTY IN CHILE: CASH TRANSFERS AND BETTER JOBS
The programme has a special arm for Chile Solidario recipients with higher subsidies for
young workers. A study found no significant impact of the programme on the probability
that beneficiaries remain in employment or receive higher wages (Agrouc, 2009).
On the other hand, several programmes directed at low-skilled workers seem to have
significantly positive impacts on employment and wages, especially when they are longer-
term and combine classroom training with practical work experience and job
intermediation (Larrañaga et al., 2011).
The central government created a commission that has evaluated existing training
measures. Based on the result the government plans to increase slots for successful
training programmes more than threefold in 2012 and it wants to reduce the tax break for
Franquicia Tributaria. This is welcome. The government should indeed use this opportunity
to gradually phase out or reform programmes that show little or no effect on beneficiaries’
wages or employability, such as Franquicia Tributaria, expand those that have proven useful
and develop more effective programmes to help groups with difficulties to find
employment, such as the low-skilled and women. Programmes of this type are currently
small-scale and they are dispersed across many different institutions. Streamlining and
developing Chile’s training programmes, to ensure that they are efficient, will be important
to help the poor improve their living standards. Chile should consider bundling training
and employment programmes at one institution, for example SENCE, to facilitate rigorous
evaluations and strategic planning. Better integrating SENCE with the network of local
labour offices and training job counselors might promote the flow of information between
both institutions and facilitate tailoring programmes to the need of job seekers (OECD,
2009). The plan to integrate job intermediation services and training programmes will be
helpful in this respect. The government also considers creating a permanent commission
that would regularly review training, job intermediation and other labour market
programmes and policies led by SENCE.
Effective and efficient protection for workers from the effects of unemployment
Should unemployment benefits be extended further?
The unemployment benefit system created in 2002 in Chile is mainly based on savings
in individual accounts with small complements from an insurance fund, called Fondo
Solidario. The system started out with moderate benefits, which allowed the government to
assess sustainability first. Until a reform in 2009, access to the insurance fund was very
restricted. As a result the fund was involved in only about 6% of the cases of benefit receipt.
Account balances for many workers are too low to ensure benefits providing adequate
protection. Workers on fixed-term contracts and low-wage workers in particular, who are
most likely to experience unemployment, contribute less regularly, owing to frequent
movements into and out of formality, and with relatively low average amounts. To this date
a large minority of workers has accumulated less than a monthly minimum wage in their
accounts, only around 10% of workers have more than 5 monthly minimum wages. The
replacement rate of unemployment benefits and the duration is short. In fact, Chile has the
lowest average replacement rate over 60 months in the OECD even after a recent reform
that extended benefit receipt for many workers (Figure 1.12) Around 85% of the workforce
is affiliated to the system, but only about half of these workers contribute to their accounts
every month. Around 20% of private salaried workers, who are obliged by law to contribute
to the system, do not.
OECD ECONOMIC SURVEYS: CHILE © OECD 2012 67
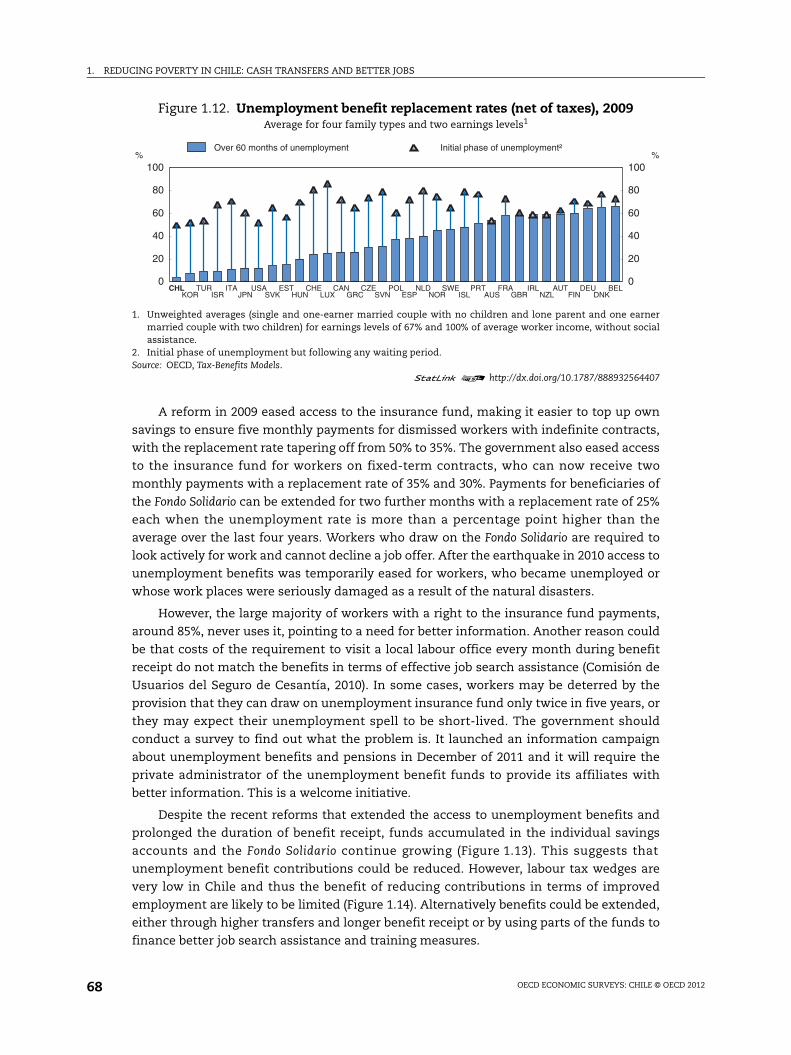
1. REDUCING POVERTY IN CHILE: CASH TRANSFERS AND BETTER JOBS
A reform in 2009 eased access to the insurance fund, making it easier to top up own
savings to ensure five monthly payments for dismissed workers with indefinite contracts,
with the replacement rate tapering off from 50% to 35%. The government also eased access
to the insurance fund for workers on fixed-term contracts, who can now receive two
monthly payments with a replacement rate of 35% and 30%. Payments for beneficiaries of
the Fondo Solidario can be extended for two further months with a replacement rate of 25%
each when the unemployment rate is more than a percentage point higher than the
average over the last four years. Workers who draw on the Fondo Solidario are required to
look actively for work and cannot decline a job offer. After the earthquake in 2010 access to
unemployment benefits was temporarily eased for workers, who became unemployed or
whose work places were seriously damaged as a result of the natural disasters.
However, the large majority of workers with a right to the insurance fund payments,
around 85%, never uses it, pointing to a need for better information. Another reason could
be that costs of the requirement to visit a local labour office every month during benefit
receipt do not match the benefits in terms of effective job search assistance (Comisión de
Usuarios del Seguro de Cesantía, 2010). In some cases, workers may be deterred by the
provision that they can draw on unemployment insurance fund only twice in five years, or
they may expect their unemployment spell to be short-lived. The government should
conduct a survey to find out what the problem is. It launched an information campaign
about unemployment benefits and pensions in December of 2011 and it will require the
private administrator of the unemployment benefit funds to provide its affiliates with
better information. This is a welcome initiative.
Despite the recent reforms that extended the access to unemployment benefits and
prolonged the duration of benefit receipt, funds accumulated in the individual savings
accounts and the Fondo Solidario continue growing (Figure 1.13). This suggests that
unemployment benefit contributions could be reduced. However, labour tax wedges are
very low in Chile and thus the benefit of reducing contributions in terms of improved
employment are likely to be limited (Figure 1.14). Alternatively benefits could be extended,
either through higher transfers and longer benefit receipt or by using parts of the funds to
finance better job search assistance and training measures.
Figure 1.12. Unemployment benefit replacement rates (net of taxes), 2009Average for four family types and two earnings levels1
1. Unweighted averages (single and one-earner married couple with no children and lone parent and one earnermarried couple with two children) for earnings levels of 67% and 100% of average worker income, without socialassistance.
2. Initial phase of unemployment but following any waiting period.Source: OECD, Tax-Benefits Models.
1 2 http://dx.doi.org/10.1787/888932564407
0
20
40
60
80
100 %
0
20
40
60
80
100%
CHL TUR ITA USA EST CHE CAN CZE POL NLD SWE PRT FRA IRL AUT DEU BELKOR ISR JPN SVK HUN LUX GRC SVN ESP NOR ISL AUS GBR NZL FIN DNK
Over 60 months of unemployment Initial phase of unemployment²
OECD ECONOMIC SURVEYS: CHILE © OECD 201268
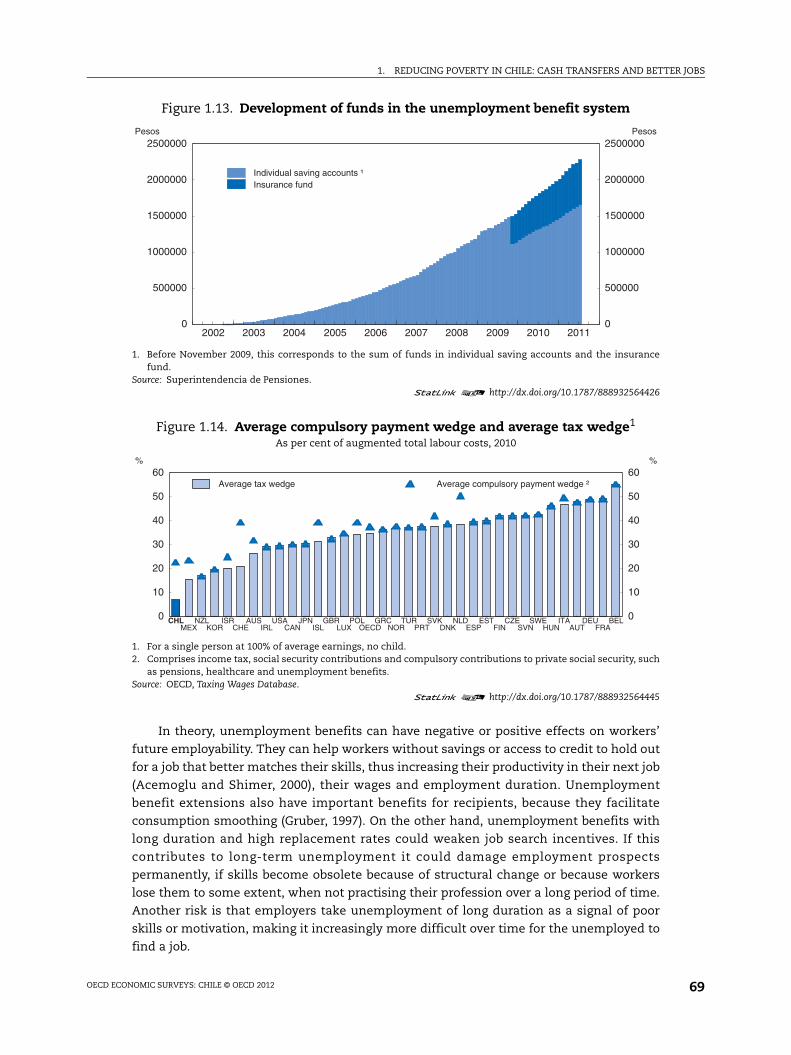
1. REDUCING POVERTY IN CHILE: CASH TRANSFERS AND BETTER JOBS
In theory, unemployment benefits can have negative or positive effects on workers’
future employability. They can help workers without savings or access to credit to hold out
for a job that better matches their skills, thus increasing their productivity in their next job
(Acemoglu and Shimer, 2000), their wages and employment duration. Unemployment
benefit extensions also have important benefits for recipients, because they facilitate
consumption smoothing (Gruber, 1997). On the other hand, unemployment benefits with
long duration and high replacement rates could weaken job search incentives. If this
contributes to long-term unemployment it could damage employment prospects
permanently, if skills become obsolete because of structural change or because workers
lose them to some extent, when not practising their profession over a long period of time.
Another risk is that employers take unemployment of long duration as a signal of poor
skills or motivation, making it increasingly more difficult over time for the unemployed to
find a job.
Figure 1.13. Development of funds in the unemployment benefit system
1. Before November 2009, this corresponds to the sum of funds in individual saving accounts and the insurancefund.
Source: Superintendencia de Pensiones.1 2 http://dx.doi.org/10.1787/888932564426
Figure 1.14. Average compulsory payment wedge and average tax wedge1
As per cent of augmented total labour costs, 2010
1. For a single person at 100% of average earnings, no child.2. Comprises income tax, social security contributions and compulsory contributions to private social security, such
as pensions, healthcare and unemployment benefits.Source: OECD, Taxing Wages Database.
1 2 http://dx.doi.org/10.1787/888932564445
2002 2003 2004 2005 2006 2007 2008 2009 2010 20110
500000
1000000
1500000
2000000
2500000Pesos
0
500000
1000000
1500000
2000000
2500000 Pesos
Individual saving accounts ¹Insurance fund
0
10
20
30
40
50
60 %
0
10
20
30
40
50
60%
CHL NZL ISR AUS USA JPN GBR POL GRC TUR SVK NLD EST CZE SWE ITA DEU BELMEX KOR CHE IRL CAN ISL LUX OECD NOR PRT DNK ESP FIN SVN HUN AUT FRA
Average tax wedge Average compulsory payment wedge ²
OECD ECONOMIC SURVEYS: CHILE © OECD 2012 69
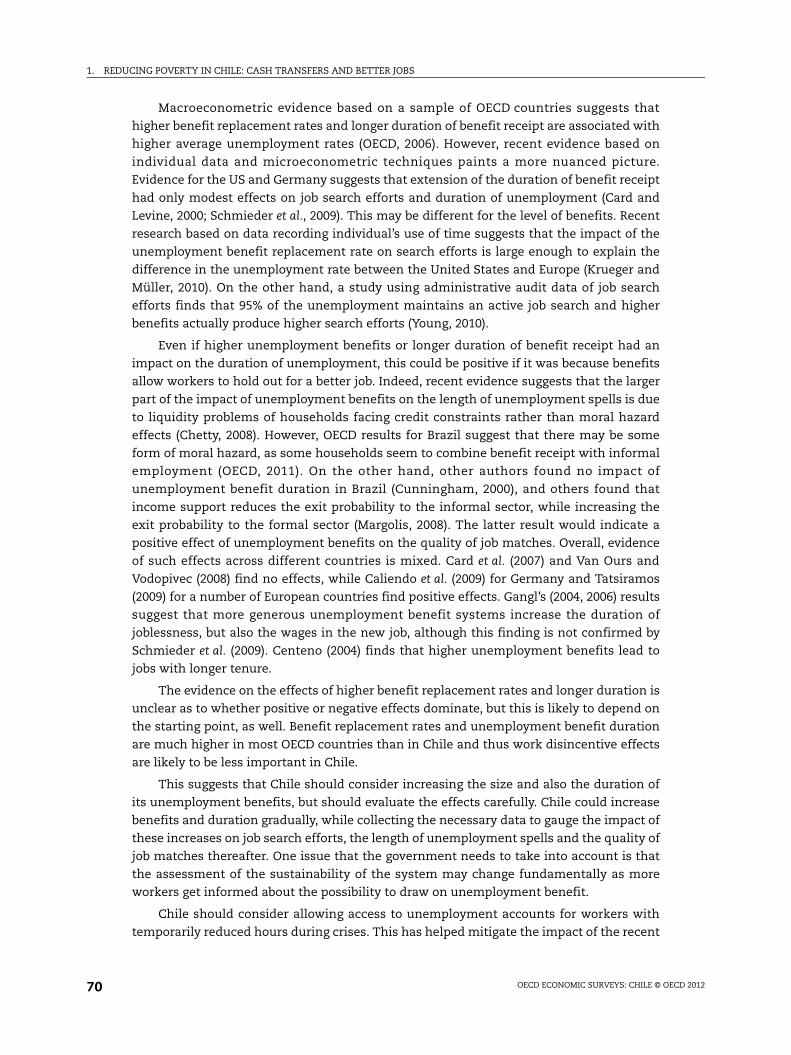
1. REDUCING POVERTY IN CHILE: CASH TRANSFERS AND BETTER JOBS
Macroeconometric evidence based on a sample of OECD countries suggests that
higher benefit replacement rates and longer duration of benefit receipt are associated with
higher average unemployment rates (OECD, 2006). However, recent evidence based on
individual data and microeconometric techniques paints a more nuanced picture.
Evidence for the US and Germany suggests that extension of the duration of benefit receipt
had only modest effects on job search efforts and duration of unemployment (Card and
Levine, 2000; Schmieder et al., 2009). This may be different for the level of benefits. Recent
research based on data recording individual’s use of time suggests that the impact of the
unemployment benefit replacement rate on search efforts is large enough to explain the
difference in the unemployment rate between the United States and Europe (Krueger and
Müller, 2010). On the other hand, a study using administrative audit data of job search
efforts finds that 95% of the unemployment maintains an active job search and higher
benefits actually produce higher search efforts (Young, 2010).
Even if higher unemployment benefits or longer duration of benefit receipt had an
impact on the duration of unemployment, this could be positive if it was because benefits
allow workers to hold out for a better job. Indeed, recent evidence suggests that the larger
part of the impact of unemployment benefits on the length of unemployment spells is due
to liquidity problems of households facing credit constraints rather than moral hazard
effects (Chetty, 2008). However, OECD results for Brazil suggest that there may be some
form of moral hazard, as some households seem to combine benefit receipt with informal
employment (OECD, 2011). On the other hand, other authors found no impact of
unemployment benefit duration in Brazil (Cunningham, 2000), and others found that
income support reduces the exit probability to the informal sector, while increasing the
exit probability to the formal sector (Margolis, 2008). The latter result would indicate a
positive effect of unemployment benefits on the quality of job matches. Overall, evidence
of such effects across different countries is mixed. Card et al. (2007) and Van Ours and
Vodopivec (2008) find no effects, while Caliendo et al. (2009) for Germany and Tatsiramos
(2009) for a number of European countries find positive effects. Gangl’s (2004, 2006) results
suggest that more generous unemployment benefit systems increase the duration of
joblessness, but also the wages in the new job, although this finding is not confirmed by
Schmieder et al. (2009). Centeno (2004) finds that higher unemployment benefits lead to
jobs with longer tenure.
The evidence on the effects of higher benefit replacement rates and longer duration is
unclear as to whether positive or negative effects dominate, but this is likely to depend on
the starting point, as well. Benefit replacement rates and unemployment benefit duration
are much higher in most OECD countries than in Chile and thus work disincentive effects
are likely to be less important in Chile.
This suggests that Chile should consider increasing the size and also the duration of
its unemployment benefits, but should evaluate the effects carefully. Chile could increase
benefits and duration gradually, while collecting the necessary data to gauge the impact of
these increases on job search efforts, the length of unemployment spells and the quality of
job matches thereafter. One issue that the government needs to take into account is that
the assessment of the sustainability of the system may change fundamentally as more
workers get informed about the possibility to draw on unemployment benefit.
Chile should consider allowing access to unemployment accounts for workers with
temporarily reduced hours during crises. This has helped mitigate the impact of the recent
OECD ECONOMIC SURVEYS: CHILE © OECD 201270

1. REDUCING POVERTY IN CHILE: CASH TRANSFERS AND BETTER JOBS
recession on employment in a number of OECD countries and may work better than the
programme that allows workers to go on training funded by unemployment benefits.
More generally, Chile could benefit from a more flexible approach to working hours.
The reference period for working time is a week. While part-time work is possible, it cannot
exceed 30 hours a week. For full-time workers daily working hours cannot exceed 10 hours,
weekly working hours cannot exceed 45 hours and workers cannot work less than five or
more than six days. One way to make the system more flexible would be to allow social
partners to negotiate monthly or annual working time that can be distributed freely over
the reference period, while the law could perhaps impose maximum average working
hours per week or a daily maximum that cannot be exceeded. The government recently
submitted a draft law to Congress that would allow social partners in the agricultural
sector to negotiate longer overtime within a monthly reference period under collective
agreements.
Should severance pay be reduced?
With a stronger protection through unemployment benefits, Chile could reconsider its
employment protection legislation. While employment protection for workers on
temporary contracts is about average in Chile according to the OECD’s employment
protection legislation (EPL) indicator (Figure 1.15), a large share of new jobs recently created
is informal or short-term as a result of subcontracting and the use of temporary work
agencies, as discussed above. This indicates that employers are reluctant to create longer-
term employment relationships. One reason may be that employment protection for
Figure 1.15. Employment protection legislation (EPL), 2008Scale from 0 (least restrictions) to 6 (most restrictions)
Source: OECD, OECD Indicators on Employment Protection Database.1 2 http://dx.doi.org/10.1787/888932564464
0
1
2
3
4
5
6
0
1
2
3
4
5
6
PRT DEU SWE FRA TUR SVK ESP GRC AUT JPN BEL ITA NZD AUS CAN USACZE NLD LUX CHL MEX FIN KOR NOR ISL POL HUN IRL DNK CHE GBR
A. Protection of regular workers against (individual) dismissal
0
1
2
3
4
5
6
0
1
2
3
4
5
6
TUR ESP FRA BEL PRT AUT HUN CHL DNK ISL CHE NLD NZD IRL USA CANLUX GRC NOR ITA POL FIN KOR DEU CZE JPN MEX SVK AUS SWE GBR
B. Temporay forms of employment
OECD ECONOMIC SURVEYS: CHILE © OECD 2012 71

1. REDUCING POVERTY IN CHILE: CASH TRANSFERS AND BETTER JOBS
workers with indefinite contracts is stronger in Chile than in most other countries, mainly
owing to relatively high severance pay that increases with seniority. This is still the main
pillar of worker protection against unemployment in Chile, as in many other countries in
the region.
OECD experience suggests that high costs of dismissal for permanent workers
combined with lax regulation of temporary contracts can lead to a dual labour market
(Blanchard and Landier, 2002; Dolado et al., 2002; OECD, 2004) where a part of the workforce
can become locked in unstable work relationships with lower chances for training and
career progression and a higher risks of paying the cost of crises. Sixty per cent of annual
labour turnover is accounted for by workers on contracts with limited duration (Dirección
del Trabajo, 2007), although approximately 70% of all dependent jobs are of indefinite
duration. This is an indication that employers react strongly to severance pay by
terminating job relationships, preferably with workers without entitlements. Only workers
with job tenures above 12 months are entitled to severance pay and this group is as small
as 6% of all formal and informal employees who become unemployed. Moreover, a
significant part of laid-off workers who do have a right to severance pay seem to receive
none or less than they are entitled to. Many firms going bankrupt have not provisioned for
severance pay, as there is no obligation to do so, and cannot pay (Cowan and Micco, 2005).
In that sense, severance pay does not serve as a very effective protection for laid-off
workers.
There is some evidence that severance pay that increases with job tenure has negative
effects on employment and participation rates of young workers in Chile, while favouring
prime-aged and older workers, although with no significant effects on aggregate
employment and labour participation (Pagés and Montenegro, 2009). This study finds that
the adverse effect on youth employment is essentially driven by the link between
severance pay and job tenure. Caballero et al. (2006) show that in countries with stricter job
security regulation the adjustment of employment to its optimum level after shocks is
slower, also reducing output and productivity growth. Micco and Pagés (2006) findings
suggest that job security legislation reduces employment and output in very volatile
sectors, mainly through a reduction in net entry.
Given that severance pay provides protection only for a small fraction of workers,
while probably contributing to labour market duality, Chile should reconsider its
employment protection. One possibility would be to limit severance pay, by making it flat
rather than increasing with seniority. The government should make severance pay
available to all workers, by increasing employer contributions to individual savings
accounts or the insurance fund. This would make the system more neutral.
Workers consider severance pay an acquired right and reforms are therefore politically
difficult to implement. A reform package that strengthens unemployment benefits while
limiting severance pay should be more acceptable to workers, while improving their
protection and providing them with more equal opportunities to find a high-quality job. If
entitled workers start to use the unemployment benefit system more, higher contributions
may be needed at some point to strengthen benefits, while maintaining the system’s
financial sustainability. However, this may still be efficient. García, Gonzalez y Navarro’s
(2009) research suggests that lowering severance pay while increasing wage taxes to
finance better unemployment protection for dismissed workers would have a positive
impact on well-being in Chile.
OECD ECONOMIC SURVEYS: CHILE © OECD 201272

1. REDUCING POVERTY IN CHILE: CASH TRANSFERS AND BETTER JOBS
What role for in-work benefits in Chile?
In 2009 Chile introduced an in-work benefit (subsidio al empleo joven) for low-wage
workers under 25 whose family belongs to the 40% poorest in the country according to their
score in the Ficha de Proteccion Social (FPS). The subsidy can reach up to 20% of wage income
for those workers with the lowest wages and is gradually withdrawn with rising wages,
with a third of the subsidy going to the employer and two thirds to the employee.
While no thorough evaluation of the Chilean scheme is available, OECD experience with
in-work benefits suggests that they are associated with positive, albeit small, employment
effects. When targeted on family income, as in Chile, they can also be a cost-effective
instrument to reduce income inequality, in particular when the income distribution is wide
(Immervoll and Pearson, 2009). In-work benefits can have a negative effect on incentives of
second earners when they are targeted on family income. In Chile, there may be an element
of this phenomenon, as the benefit is targeted on the wage rate of the young worker, on the
one hand, and the Ficha de Proteccion Social (FPS) score of her family, on the other. While the
subsidy is withdrawn gradually, as the wage increases, the withdrawal with respect to the
Ficha de Protección Social score is abrupt. This risks limiting the positive effect that the in-work
benefit is supposed to have on young people’s work incentives for those who live in families
with a FPS score close to cut-off point. It might even deter other members in the family to
take up employment for fear of losing the wage subsidy.
The government plans to introduce a similar wage subsidy for low-income women as
part of Ingreso Ético Familiar. However, before extending the benefit to other groups the
government should carefully evaluate the impact of the subsidy on young workers’
employment and on the income distribution. One way to avoid potential work disincentive
effects associated with abrupt benefit withdrawal would be to opt for a gradual phasing out
as workers’ FPS score increases. This would become easier if the FPS score were to depend
mainly on family income, as suggested above. Work incentives of the young and their
family members would be enhanced even more if the in-work benefit was targeted at
young workers’ wages only without considering their family income.
The minimum wage in Chile is relatively high in international comparison as a ratio of
the median wage, but this is partly because the wage distribution is so narrow at the lower
end. Expressing the minimum wage as a percentage of GDP per capita results in a different
picture (Figure 1.16). Like in-work benefits, minimum wages can enhance labour supply, as
they increase take-home pay for workers. Minimum wages can also help to reduce wage
inequality (Koeniger et al., 2007 and Checchi and García-Peñalosa, 2010), although they are
less effective than more targeted measures, as minimum wage earners may live in high-
income families. On the other hand, they avoid some of the efficiency problems associated
with better targeted measures, such a negative work incentives in the withdrawal range in
the case of in-work benefits. In combination with in-work benefits they can be particularly
useful, because the size of benefits needed to attain a given income is smaller with a wage
floor. The minimum wage also prevents the employer from lowering wages beyond it in
response to an in-work benefit, thus ensuring that a larger part of the benefit goes to
employees.
On the other hand, a minimum wage that is above many workers’ productivity can
reduce labour demand and thus employment. While evidence on the effect of minimum
wages on employment is very inconclusive, with many studies finding no impact on
employment and unemployment, including in Chile (see OECD, 2006; Martínez et al., 2001),
OECD ECONOMIC SURVEYS: CHILE © OECD 2012 73

1. REDUCING POVERTY IN CHILE: CASH TRANSFERS AND BETTER JOBS
some studies suggest that minimum wages may have a negative effect on employment
prospects of some groups, such as low-skilled or young workers (for an overview over the
literature see see Neumark and Wascher, 2007). The OECD therefore recommends
differentiated minimum wages with a lower rate for young workers. The part of the
Chilean in-work benefit that goes to employers lowers the labour costs for young workers
and is thus to some extent a substitute for a lower minimum wage rate for young workers,
although associated with fiscal costs. Chile has a reduced minimum wage for workers
under 18, but not for young workers above that age.
If a negative impact on employment dominated, minimum wages could actually have
a negative impact on income inequality despite compressing the wage distribution. Among
the few studies that explore this issue some find that this is indeed the case (Checchi and
García-Peñalosa, 2008), while a recent OECD study finds no significant effect on
employment with the positive impact of minimum wages on the wage distribution
dominating (Koske et al., 2012).
Figure 1.16. Minimum wages across OECD countries¹2009
Source: OECD; ILO Wage Report 2011; IMF, Word Bank; CASEN.1 2 http://dx.doi.org/10.1787/888932564483
0
20
40
60
80 %
0
20
40
60
80%
TUR CHL FRA NZL AUS PRT IRL BEL SVN GRC HUN NLD GBR SVK POL ESP LUX CAN KOR USA JPN
A. As a percentage of the median wage for full-time worker
0
10
20
30
40
50
60
70
80 %
0
10
20
30
40
50
60
70
80%
DNK NZL SWE FIN GBR BEL SVK GRC CAN ESP JPN CHL PRT TUR SVN LUX MEXCHE NOR AUS ITA FRA AUS NLD IRL ISR ISL KOR USA HUN EST CZE POL
B. As a percentage of GDP per capita
OECD ECONOMIC SURVEYS: CHILE © OECD 201274

1. REDUCING POVERTY IN CHILE: CASH TRANSFERS AND BETTER JOBS
Female labour market participation
The relatively weak position of women in the Chilean labour market is likely related to
a number of barriers to employment for them, in particular for single mothers with low
wages. While Chile has made important efforts to increase the number of nursery and
kindergarten places, coverage is still low in international comparison (Figure 1.17).
Moreover, residential segregation is likely to exacerbate the problem, as mothers who have
to commute for several hours a day would need childcare for much longer than what is
available to accept a full-time job. According to household survey data 10% of inactive
women cite difficulties to secure childcare as a reason. The government is making
substantial efforts to increase childcare coverage, which has increased from 33% to 40% for
children up to age 7. The government wants to increase enrolment of children below 4 by
3% by 2014 and ensure universal coverage for children in the two lowest income deciles for
children aged 4 and 5. These important efforts should continue.
Some labour regulations that are meant to favour women actually risk turning against
them. As an example, enterprises with more than 19 women have to provide a
kindergarten place for the first two years. Since children have both a father and a mother
the rationale for this regulation is not quite clear. Moreover, this regulation can deter
companies from employing more than 19 women. Chile should consider scrapping this
provision or, at a minimum, making it gender neutral by obliging firms with a certain
number of employees to provide childcare facilities or financial support for alternative
Figure 1.17. Coverage with early childhood education and care across OECD countries
Share of children in formal childcare or in educational pre-school programmes, 2008
Source: OECD, Family Database.1 2 http://dx.doi.org/10.1787/888932564502
0
20
40
60
80
100%
0
20
40
60
80
100%
CZE MEX HUN AUT EST ISR FIN ITA IRL SVN KOR LUX FRA PRT NOR NLDSVK POL CHL GRC DEU JPN AUS OECD USA ESP NZL GBR SWE BEL ISL DNK
A. For 0-2 year olds
0
20
40
60
80
100 %
0
20
40
60
80
100%
TUR POL AUS IRL NLD FIN OECD PRT KOR ISR HUN SWE GBR NZL ISL ESP FRAGRC CHE USA CHL SVK SVN AUT CZE MEX LUX JPN DNL DEU NOR ITA BEL
B. For 3-5 year olds
OECD ECONOMIC SURVEYS: CHILE © OECD 2012 75

1. REDUCING POVERTY IN CHILE: CASH TRANSFERS AND BETTER JOBS
providers. However, aiming to provide free childcare for the – say – 40% poorest families,
while asking for co-payments from richer families is likely to be a more effective way to
help families reconcile work and family life.
The government has extended state-funded maternal leave after birth from 12 to
24 weeks. It is capped at a monthly salary subject to social contributions of around
2 800 USD. The extension is longer for children with health problems and those with
siblings. The extra 12 weeks can be further increased to 18 weeks if the mother and her
employer agree on a part-time arrangement, in which case the mother can opt for 50% of
the corresponding benefit. Mothers can transfer their rights to the father for 6 weeks or
12 weeks if the parents take the leave on a part-time basis. At the same time, the
government has taken stricter measures to counteract the common practice to extend
maternity leave by providing sick certificates that some doctors issue without any medical
basis. The government also eased access to paid maternity leave for temporary workers
with a minimum record of social charges, regardless of whether they were employed at the
time of birth.
Studies have shown that parental leave can mitigate the negative effect of children on
women’s wages by shortening the time after which she returns to work (Burgess et al., 2008;
Berger and Waldfogel, 2004) and increasing the likelihood that women return to their pre-
birth job, thus allowing them to capitalise on the benefits of accumulated tenure with their
existing employer, such as seniority, training and access to internal labour markets (Baker
and Milligan, 2008). However, this holds true only for relatively short periods of leave, while
periods of leave that exceed one year can lead to a substantial loss of human capital and a
decrease in wages (Ruhm, 1999). Bassanini and Venn (2008) present some evidence that an
increase of maternity leave from short durations can increase productivity, with a stronger
effect when the leave is paid rather than unpaid. Plans to increase paid maternity leave
after childbirth are thus welcome.
Labour relations
Unionisation density and coverage are relatively low in Chile (Figure 1.18) and strongly
concentrated on the public sector. Chile’s legislation allows strikes and wage negotiations
only at the firm level, unless firms and unions agree otherwise. The common practice of
companies to obtain a tax identification number (RUT) for each of their subsidiaries, at
which point these are considered as a separate company, effectively results in wage
negotiations at the plant level.
There is little evidence that wage negotiations at the firm level have a negative effect
on employment outcomes. At the same time, stronger unions have been found to have
beneficial effects on wage equality. Empirical studies based on macro data (Koske et al., 2012)
suggest that, on average across countries, a rise in union density or union coverage is
associated with lower wage inequality. Calderón and Chong (2009) investigate the
relationship between unionisation and the Gini index, thus accounting for both wage and
employment effects. They find that unions lower inequality.
At a minimum, the government should put an end to the practice of breaking up
companies for the purposes of wage negotiations to build confidence in labour relations.
This might increase the scope for leaving more of the details of work arrangements to
collective negotiations, possibly leading to more working time flexibility and enhancing
co-operation of social partners in designing training programmes. In fact, the practice of
OECD ECONOMIC SURVEYS: CHILE © OECD 201276
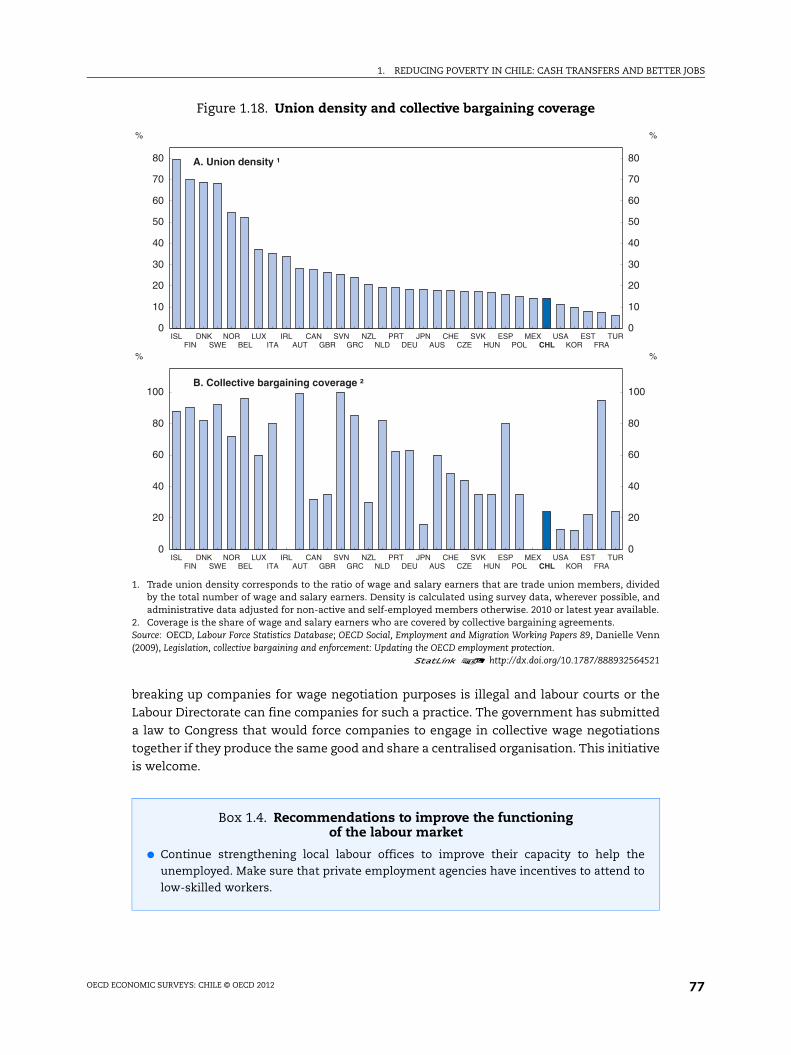
1. REDUCING POVERTY IN CHILE: CASH TRANSFERS AND BETTER JOBS
breaking up companies for wage negotiation purposes is illegal and labour courts or the
Labour Directorate can fine companies for such a practice. The government has submitted
a law to Congress that would force companies to engage in collective wage negotiations
together if they produce the same good and share a centralised organisation. This initiative
is welcome.
Figure 1.18. Union density and collective bargaining coverage
1. Trade union density corresponds to the ratio of wage and salary earners that are trade union members, dividedby the total number of wage and salary earners. Density is calculated using survey data, wherever possible, andadministrative data adjusted for non-active and self-employed members otherwise. 2010 or latest year available.
2. Coverage is the share of wage and salary earners who are covered by collective bargaining agreements.Source: OECD, Labour Force Statistics Database; OECD Social, Employment and Migration Working Papers 89, Danielle Venn(2009), Legislation, collective bargaining and enforcement: Updating the OECD employment protection.
1 2 http://dx.doi.org/10.1787/888932564521
Box 1.4. Recommendations to improve the functioningof the labour market
● Continue strengthening local labour offices to improve their capacity to help theunemployed. Make sure that private employment agencies have incentives to attend tolow-skilled workers.
0
10
20
30
40
50
60
70
80
%
0
10
20
30
40
50
60
70
80
%
ISL DNK NOR LUX IRL CAN SVN NZL PRT JPN CHE SVK ESP MEX USA EST TURFIN SWE BEL ITA AUT GBR GRC NLD DEU AUS CZE HUN POL CHL KOR FRA
A. Union density ¹
0
20
40
60
80
100
%
0
20
40
60
80
100
%
ISL DNK NOR LUX IRL CAN SVN NZL PRT JPN CHE SVK ESP MEX USA EST TURFIN SWE BEL ITA AUT GBR GRC NLD DEU AUS CZE HUN POL CHL KOR FRA
B. Collective bargaining coverage ²
OECD ECONOMIC SURVEYS: CHILE © OECD 2012 77
1. REDUCING POVERTY IN CHILE: CASH TRANSFERS AND BETTER JOBS
Bibliography
Aguëro, J., M. Carter and I. Woolard (2006), “The Impact of Unconditional Cash Transfers on Nutrition:The South African Child Support Grant”, Southern Africa Labour and Development Research UnitWorking Paper No. 06/08, SALDRU, University of Cape Town, Cape Town.
Acemoglu, D. and R. Shimer (2000), “Productivity Gains from Unemployment Insurance”, EuropeanEconomic Review, Vol. 44, pp. 1195-1224.
Agrouc (2009), “Evaluación de Impacto – Programa de Bonificación a la Contratación de Mano de Obra”,Consultancy Report, Santiago de Chile.
Alzúa, M.L., G. Cruces and L. Ripani (2010), “Welfare Programs and Labor Supply in DevelopingCountries. Experimental Evidence from Latin America”, Centro de Estudios Distributivos, Laborales ySociales Documento de Trabajo No. 95, Universidad de La Plata, La Plata, Argentina.
Amior, M., P. Carneiro, E. Galasso and R. Ginja (2010), “Understanding Participation in Social Programs:Evidence from Chile”, Working Paper retrieved at http://client.norc.org/jole/soleweb/11289.pdf.
Ardington, C., A. Case and V. Hosegood (2009), “Labor Supply Responses to Large Social Transfers:Longitudinal Evidence from South Africa”, American Economic Journal: Applied Economics Vol. 1, No. 1,pp. 22-48.
Attanasio, O., C. Meghir and A. Santiago (2010), “Education Choices in Mexico: Using a Structural Modeland a Randomized Experiment to Evaluate Progresa”, Institute for Fiscal Studies Working Paper No. 10/14,Institute for Fiscal Studies, London.
Baker, M. and K. Milligan (2008), “How does Job Protected Maternity Leave affect Mothers’Employment?”, Journal of Labor Economics, Vol. 26, No. 4, pp. 655-692.
Baird, S., C. McIntosh and B. Özler (2010), “Cash or Condition? Evidence from a Cash TransferExperiment”, The World Bank Policy Research Working Paper No. 5259, The World Bank, Washington, DC.
Bassanini, A. and D. Venn (2008), “The Impact of Labour Market Policies on Productivity inOECD Countries”, International Productivity Monitor, Vol. 17, pp. 3-15.
Berger, L.M. and J. Waldfogel (2004), “Maternity Leave and the Employment of New Mothers in theUnited States”, Journal of Population Economics, Vol. 17, No. 3, pp. 331-349.
Bertrand, M., S. Mullainathan and D. Miller (2003), “Public Policy and Extended Families: Evidence fromPensions in South Africa”, World Bank Economic Review, Vol. 17, pp. 27-50.
Box 1.4. Recommendations to improve the functioning of the labour market (cont.)
● Evaluate training programmes, streamline based on results and focus more on low-skilled workers and women. Integrate SENCE better with the local labour offices.
● Extend unemployment benefits further and limit severance pay, while increasingemployers’ contributions to individual savings accounts or the unemploymentinsurance fund. Evaluate the effects of longer unemployment benefit duration and/orhigher benefit levels to improve the design if needed.
● Evaluate the in-work benefit for poor, young workers and – if found successful – considerextending it to other groups. Consider making it dependent on individual worker’sincome only or phase it out more gradually with respect to family income.
● Continue efforts to extend the availability of affordable, high-quality nursery andkindergarten places, while lifting the requirement for firms to offer kindergarten placesonce they employ more than 19 women.
● Work to improve labour relations, including by strengthening union’s negotiation power,at a minimum by forcing firms to end the practice to obtain multiple tax identificationnumbers to artificially break up their company for wage negotiation purposes.
OECD ECONOMIC SURVEYS: CHILE © OECD 201278
1. REDUCING POVERTY IN CHILE: CASH TRANSFERS AND BETTER JOBS
Betcherman, G., K. Olivas and A. Dar (2004), “Impacts of Active Labor Market Programs: New Evidencefrom Evaluations with Particular Attention to Developing and Transition Countries”,Social Protection Discussion Paper Series No. 0402, The World Bank, Washington.
Blanchard, O. and A. Landier (2002), “The Perverse Effect of Partial Labour Market Reform: Fixed-TermContracts in France”, Economic Journal, Vol. 112, No. 480, pp. F214-244.
Blöchliger, H. and C. Charbit (2008), “Fiscal Equalisation”, OECD Economic Studies No. 44, OECD, Paris.
Bourgignon, F., F. Ferreira and P. Leite (2003), “Conditional Cash Transfers, Schooling and Child Labor –Micro-Simulating Bolsa Escola”, Delta Working Paper 2003-7, DELTA, Paris.
Bravo, D., C. Sanhueza and S. Urzúa (2008), “Ability, Schooling Choices and Gender Labor MarketDiscrimination: Evidence for Chile”, Inter-American Development Bank Research Network Working Paper#R-558, Inter-American Development Bank, Washington, DC.
Burgess, S., M. Knetter and C. Michelacci (2000), “Employment and Output Adjustment in the OECD: ADisaggregate Analysis of the Role of Job Security Provisions”, Economica, Vol. 67, No. 267, pp. 419-435.
Caballero, R., K. Cowan, E. Engel and A. Micco (2006), “Effective Labor Regulation and MicroeconomicFlexibility”, Cowles Foundation Discussion Paper No. 1480, Yale University, New Haven.
Calderón, C. and A. Chong (2009), “Labor Market Institutions and Income Inequality: An EmpiricalExploration”, Public Choice, Vol. 138, pp. 65-81.
Caliendo, M., K. Tatsiramos and A. Uhlendorff (2009), “Benefit Duration, Unemployment Duration andJob Match Quality: A Regression-Discontinuity Approach”, IZA Discussion Papers 4670, Institute forthe Study of Labor (IZA), Bonn.
Card, D. and P. Levine (2000), “Extended Benefits and the Duration of UI Spells: Evidence from the NewJersey Extended Benefit Program”, Journal of Public Economics, Vol. 78, pp. 107-138.
Card, D., R. Chetty and A. Weber (2007a), “Cash-On-Hand and Competing Models of IntertemporalBehavior: New Evidence from the Labor Market”, Quarterly Journal of Economics, Vol. 122, No. 4,pp. 1511-1560.
Card, D., J. Kluve and A. Weber (2010), “Active Labour Market Policy Evaluations”, The Economic Journal,Vol. 120, pp. F452-F477.
Carneiro, P., E. Galasso and R. Ginja (2009), “The Impact of Providing Psycho-Social Support to IndigentFamilies and Increasing their Access to Social Services: Evaluating Chile Solidario”, Working Paper,retrieved at www.ucl.ac.uk/~uctprcp/chile.pdf.
Carvalho Filho, I. (2008), “Old-Age Benefits and Retirement Decisions of Rural Elderly in Brazil”, Journalof Development Economics, Vol. 86, pp. 129-146.
Case, A., V. Hosegood and F. Lund (2005), “The Reach and Impact of Child Support Grants: Evidencefrom KwaZulu-Natal”, Development Southern Africa, Vol. 22, pp. 467-482.
Case, A. and C. Paxson (2008), “Stature and Status: Height, Ability and Labour Market Outcomes, Journalof Political Economy, Vol. 116, pp. 499-532.
Castro, C. and R. de Viñaspre (2011), “Foco y Uso de la Franquicia Tributaria”, presentation, retrieved atwww.mintrab.gob.cl/?page_id=3853.
Causa, O. and Å. Johansson (2009), “Intergenerational Social Mobility”, OECD Economics DepartmentWorking Papers, No. 707, OECD Publishing, doi: 10.1787/223106258208.
Centeno, M. (2004), “The Match Quality Gains from Unemployment Insurance”, Journal of HumanResources, Vol. 39, pp. 839-63.
Checchi, D. and C. García-Peñalosa (2010), “Labour Market Institutions and the Personal Distribution ofIncome in the OECD”, Economica, Vol. 77, pp. 413-450.
Chetty, R. (2008), “Moral Hazard versus Liquidity and Optimal Unemployment Insurance”, The Journalof Political Economy, Vol. 116, No. 2, pp. 173-234.
ClioDinamica Asesorías (2010), “Consultoría Programa Fortalecimiento de Oficinas Municipales deIntermediación Laboral – Informe Final”, Santiago de Chile.
Comisión de Usuarios del Seguro de Cesantía (2010), Octavo Informe Anual, Santiago de Chile,www.safp.cl/573/articles-3829_octavo_informe.pdf.
Comité de Expertos (2010), Ficha de Protección Social – Informe Final, Report for the Ministry of SocialAffairs (Mideplan), Santiago de Chile.
OECD ECONOMIC SURVEYS: CHILE © OECD 2012 79

1. REDUCING POVERTY IN CHILE: CASH TRANSFERS AND BETTER JOBS
Cowan, K. and A. Micco (2005), “El Seguro de Desempleo en Chile: Reformas Pendientes”, En Foco 53,Expansiva, Santiago de Chile.
Cunningham, W. (2000), “Unemployment Insurance in Brazil: Unemployment Duration, Wages andSectoral Choice”, World Bank, mimeo, retrieved at http://info.worldbank.org/etools/docs/library/76164/dc2001/proceedings/pdfpaper/cunninghamp.pdf.
De Brauw, A. and J. Hoddinott (2011), “Must Conditional Cash Transfer Programs be Conditioned to beEffective? The Impact of Conditioning Transfers on School Enrollment in Mexico”, Journal ofDevelopment Economics, doi:10.1016/j.jdeveco.2010.08.014.
De Janvry, A. and E. Sadoulet (2008), “Making Conditional Cash Transfer Programs More Efficient:Designing for Maximum Effect of the Conditionality”, The World Bank Economic Review, Vol. 20, No. 1,pp. 1-29.
Delany, A., Z. Ismail, L. Graham and Y. Ramkissoon (2008), Review of the Child Support Grant: Uses,Implementation and Obstacles, Community, Agency for Social Enquiry (CASE) for the Department ofSocial Development, Johannesburg: UNICEF.
Dirección del Trabajo (2007), ENCLA 2006 – Resultados de la Quinta Encuesta Laboral, Santiago.
Dolado, J.J., C. Garcia and J.F. Jimeno (2002), “Drawing Lessons from the Boom of Temporary Jobs inSpain”, Economic Journal, Vol. 112, No. 480, pp. F270-295.
Duflo, E. (2003), “Grandmothers and Granddaughters: Old Age Pension and Intrahousehold Allocationin South Africa”, The World Bank Economic Review, Vol. 17, No. 1, pp. 1-25.
Eberhard, J. and E. Engel (2008), “The Educational Transition and Decreasing Wage Inequality in Chile”,Working Paper retrieved at http://cowles.econ.yale.edu/~engel/pubs/ee_education-transition.pdf.
Edmonds, E. and N. Schady (2009), “Poverty Alleviation and Child Labour”, National Bureau of EconomicResearch Working Paper 15345, National Bureau of Economic Research, Cambridge, Massachusets.
Eyal, K. and I. Woolard (2011), “Female Labour Force Participation and South Africa’s Child SupportGrant”, Paper presented at the CSAE 25th Anniversary Conference 2011: Economic Development in Africa,St. Catherine’s College, Oxford, UK; retrieved at www.csae.ox.ac.uk/conferences/2011-EdiA/papers/467-Eyal.pdf.
Fernald, L., P. Gertler and M. Neufeld (2008), “Role of Cash in Conditional Cash Transfer Programmes forChild Health, Growth, and Development: an Analysis of Mexico’s Oportunidades”, The Lancet,Vol. 371, pp. 828-37.
Fernald, L. and M. Hidrobo (2011), “Effect of Ecuador’s Cash Transfer Program (Bono de DesarrolloHumano) on Child Development in Infants and Toddlers: A Randomized Effectiveness Trial”, SocialScience & Medicine, Vol. 72, pp. 1437-1446.
Filmer, D. and N. Schady (2011), “Does more Cash in Conditional Cash Transfer Programs Always Leadto Larger Impacts on School Attendance?”, Journal of Development Economics, Vol. 96, pp. 150-157.
Fiszbein, A. and N. Schady (2009), Conditional Cash Transfers: Reducing Present and Future Poverty, TheWorld Bank, Washington, DC.
Foguel, M. and R. Paes de Barros (2010), “The Effects of Conditional Cash Transfer Programmes onAdult Labour Supply: An Empirical Analysis Using a Time-Series-Cross-Section Sample of BrazilianMunicipalities”, Estudos Econômicos, Vol. 40, pp. 259-293.
Galasso, E. (2006), “With their Effort and One Opportunity – Alleviating Extreme Poverty in Chile”, TheWorld Bank Development Research Group, retrieved at www.iadb.org/res/publications/pubfiles/pubS-001.pdf.
Gangl, M. (2004), “Welfare States and the Scar Effects of Unemployment: A Comparative Analysis of theUnited States and West Germany”, American Journal of Sociology, Vol. 109, No. 6, pp. 1319-1364.
Gangl, M. (2006), “Scar Effects of Unemployment: An Assessment of Institutional Complementarities”,American Sociological Review, Vol. 71, pp. 986-1013.
García, C., W. González, L. Navarro (2009), “Mercado Laboral Chileno en Tiempos de Crisis: PolíticasMacroeconómicas y Reformas Pendientes”, in Perticará, M., J. Rodríguez and C. Sanhueza (eds.),Entre las Buenas Intenciones y las Buenas Soluciones: Mejores Políticas para el Mercado Laboral EdicionesUniversidad Alberto Hurtado.
Gertler, P., S. Martinez and M. Rubio-Codia (2006), “Investing Cash Transfers to Raise Long-Term LivingStandards”, World Bank Policy Research Working Paper 3994, The World Bank, Washington, DC.
OECD ECONOMIC SURVEYS: CHILE © OECD 201280

1. REDUCING POVERTY IN CHILE: CASH TRANSFERS AND BETTER JOBS
Gruber, J. (1997), “The Consumption Smoothing Benefits of Unemployment Insurance”, The AmericanEconomic Review, Vol. 87, pp. 192-205.
Grupo de Política Social (2010), A Ocho Años de su Inicio ¿Qué hacer con Chile Solidario?, retrieved at http://politicaspublicas.uc.cl/media/publicaciones/pdf/20100705184935.pdf.
Hanlon, J., A. Barrientos and D. Hulme (2010), Just Give Money to the Poor – The Development Revolution fromthe Global South, Kumarian Presse, Sterling, Virginia, USA.
Immervoll, H. and M. Pearson (2009), “A Good Time for Making Work Pay? Taking Stock of In-WorkBenefits and Related Measures across the OECD”, OECD Social, Employment and Migration WorkingPapers No. 81, OECD Publishing, doi: 10.1787/225442803245.
Kluve, J. (2010), “The Effectiveness of European Active Labor Market Programs ”, Labour Economics,Vol. 17, pp. 904-918.
Koeniger, W., M. Leonardi and L. Nunziata (2007), “Labor Market Institutions and Wage Inequality”,Industrial and Labour Relations Review, Vol. 60, pp. 340-356.
Koske, I., J.-M. Fournier and I. Wanner (2012), “Less Income Inequality and more Growth are theyCompatible? Part II: The Distribution of Labour Income”, OECD Economics Department WorkingPapers, 925, OECD, Paris.
Krueger, A. and A. Mueller (2010), “Job Search and Unemployment Insurance: New Evidence from TimeUse Data”, Journal of Public Economics, Vol. 94, pp. 298-307.
Larrañaga, O. (2009), “Inequality, Poverty and Social Policy: Recent Trends in Chile”, OECD Social,Employment and Migration Working Papers, No. 85, OECD Publishing.
Larrañaga, O., D. Contreras and J. Ruiz Tagle (2009), “Evaluación de Impacto de Chile Solidario Para LaPrimera Cohorte de Participantes”, Programa de las Naciones Unidas para el Desarrollo (PNUD),www.nip-lac.org/uploads/RuizTagle2009_EvaluacionImpactoChileSolidario.pdf.
Larrañaga et al. (2011), “Informe Final – Comisión Revisora del Sistema de Capacitación eIntermediación Laboral”, Report to the Ministry of Labour, Santiago de Chile.
Madeiro, M., T. Britto and F. Vears Soares (2008), “Targeted Cash Transfer Programmes in Brazil: BPCand the Bolsa Familia”, International Poverty Center Working Paper 46, United Nations PovertyProgramme, Brasilia, Brazil.
Manley, J., S. Gitter and V. Slavchevska (2010), “How Effective are Cash Transfer Programs atImproving Nutritional Status?”, Towson University Department of Economics Working Paper 2010-08,Towson, Maryland, USA.
Margolis, D. (2008), “Unemployment Insurance versus Individual Unemployment Accounts andTransitions to Formal versus Informal Sector Jobs”, Working Paper, retrieved at www.jma2011.fr/fichiers2009/A2/Margolis.pdf.
Martinez, S. (2004), “Pensions, Poverty and Household Investments in Bolivia”, University of California atBerkeley, Berkeley, California, USA; retrieved at http://emlab.berkeley.edu/pub/users/webfac/bardhan/e271_f04/martinez.pdf.
Martínez, C., G. Morales and R. Valdés (2001), “Cambios Estructurales en la Demanda por Trabajo enChile ”, Economía Chilena, Vol. 4, Santiago de Chile.
Micco, A. and C Pagés (2006), “The Economic Effects of Employment Protection: Evidence fromInternational Industry-Level Data”, IZA Discussion Paper 2433, Forschungsinstitut zur Zukunft derArbeit, Bonn.
Mideplan (2007), “Distribución del Ingreso e Impacto Distributivo del Gasto Social”, retrieved atwww.mideplan.gob.cl/btca/txtcompleto/mideplan/casen2006_distrib_ingreso_imp_distrib.pdf.
Muñoz, A. (2007), “Evaluaciones de Impacto de los Programas de Capacitación Laboral: la ExperienciaInternacional y de Chile”, Report for the Consejo Asesor Presidencial: Trabajo y Equidad, retrieved atwww.oei.es/etp/evaluaciones_impacto_programas_capacitacion_laboral.pdf.
Neilson, C. et al. (2008), “The Dynamics of Poverty in Chile”, Journal of Latin American Studies, Vol. 40,pp. 251-273.
Neumark D. and W. Washer (2009), “Minimum Wages and Employment”, IZA Discussion Paper SeriesNo. 2570, Institut zur Zukunft der Arbeit, Bonn.
OECD ECONOMIC SURVEYS: CHILE © OECD 2012 81

1. REDUCING POVERTY IN CHILE: CASH TRANSFERS AND BETTER JOBS
Nuñez, J. and L. Miranda (2010), “Intergenerational Income Mobility in a Less-Developed, High-Inequality Context: The Case of Chile”, The Berkeley Electronic Journal of Economic Analysis & PolicyVol. 10, No. 1; available at www.bepress.com/bejeap/vol10/iss1/art33.
OECD (2004), OECD Employment Outlook, OECD, Paris.
OECD (2006), OECD Employment Outlook – Boosting Jobs and Growth, OECD, Paris.
OECD (2008), Growing Unequal? Income Distribution and Poverty in OECD Countries, OECD, Paris.
OECD (2009), OECD Reviews of Labour Market and Social Policies – Chile, OECD, Paris.
OECD (2010), OECD Economic Survey Chile, OECD, Paris.
OECD (2011), OECD Employment Outlook, OECD, Paris.
Pagés, C. and C. Montenegro (2007), “Job Security and the Age Composition of Employment: Evidencefrom Chile”, Estudios de Economía, Vol. 34, No. 2, pp. 109-139.
Parker, S. and E. Skoufias (2000), The Impact of Progresa on Work, Leisure and Time Allocation, InternationalFood Policy Research Insitute, Washington, DC, USA.
Paxson, C. and N. Schady (2007), “Does Money Matter? The Effects of Cash Transfers on Child Healthand Development in Rural Ecuador, World Bank Policy Research Working Paper 4226, The World Bank,Washington, DC.
Perticara, M. (2007), Análisis Cuantitativo de Impacto del Sistema Chile Solidario, Ministry of Social Affairs,Santiago de Chile.
Ravallion (2007), “How Relevant is Targeting to the Success of an Anti-Poverty Programme”, PolicyResearch Working Paper 4385, The World Bank, Washington, DC.
Ravallion (2009), “Do Poorer Countries have less Capacity for Redistribution”, World Bank Policy ResearchWorking Paper 5046, The World Bank, Washington, DC.
Rodríquez, J. and S. Úrzua (2011), “Evaluación de Impacto de la Franquicia Tributaria”, Presentationretrieved at www.mintrab.gob.cl/wp-content/uploads/2011/07/Evaluación-de-Impacto-de-la-Franquicia-Tributaria-2.pdf.
Ruhm, C. (1998), “The Economic Consequences of Parental Leave Mandates: Lessons from Europe”, TheQuarterly Journal of Economics, Vol. 113, pp. 285-317.
Schmieder, J., T. von Waechter and Stefan Bender (2009), “The Effects of Unemployment Insurance onLabor Supply and Search Outcomes”, Columbia University Department of Economic Discussion PaperSeries 0910-08 retrieved at www.columbia.edu/~jfs2106/research/SchmiedervWachterBender2009.pdf.
Sur Profesionales Consultores (2005), “Evaluación de Cinco Programas de la Oferta Pública Social,Participantes del Sistema Chile Solidario”, Consultancy Report, Santiago de Chile.
Tatsiramos, K. (2009), “Unemployment Insurance in Europe: Unemployment Duration and SubsequentEmployment Stability”, Journal of the European Economic Association, Vol. 7, No. 6, pp. 1225-1260.
Todd, P. and K. Wolpin (2006), “Assessing the Impact of a School Subsidy Program in Mexico: Using aSocial Experiment to Validate a Dynamic Behavioral Model of Child Schooling and Fertility”, TheAmerican Economic Review, Vol. 96, pp. 1384-1417.
Van Ours, J.C. and M. Vodopivec (2008), “Does reducing Unemployment Insurance Generosity reduceJob Match Quality?”, Journal of Public Economics, Vol. 92, No. 3-4, pp. 684-695.
Young, C. (2010), Unemployment Insurance and Job Search Effort – Evidence from Random Audits, StanfordUniversity, Stanford, California, USA, www.stanford.edu/~cy10/public/UI%20and%20Job%20Search%20Effort.pdf.
OECD ECONOMIC SURVEYS: CHILE © OECD 201282
OECD Economic Surveys: Chile
© OECD 2012
Chapter 2
Building blocks for a better functioning housing market in Chile
Chile has made good progress in improving housing conditions, but still around 10%of the population lives in either overcrowded houses, or of inadequate quality and/or with poor access to basic services. Improving further housing conditions of thepoor is important for curbing poverty and reducing inequality. First, better targetingof housing subsidies will be essential to free resources for those truly in need. Thegovernment should also rethink subsidies, which are currently directed exclusivelyat ownership. Means-tested rental cash allowances coupled with more balancedtenant-landlord regulations would strengthen the rental market, thus enhancingresidential mobility and potentially reducing segregation. Second, betterenforcement of social housing quotas for new building projects coupled withinvestments in urban renewal and social services in poorer neighbourhoods anddeveloping unused land in urban areas could also help to reduce inequalities. Third,effective thermal and energy standards for buildings would improve the quality ofthe housing stock, protect public health and reduce air pollution. Limitingconstruction in fault lines and risky coastal areas could also increase Chile’sresilience to natural disasters. Fourth, taxing housing so owing is not favoured overrenting would reduce distortions and make the tax system less regressive. Finally,enhancing the responsiveness of housing supply to demand would ensure there is agood match between housing construction and demand, and avoid that publicsupport gets capitalised into housing prices.
83

2. BUILDING BLOCKS FOR A BETTER FUNCTIONING HOUSING MARKET IN CHILE
Chile has made important advances in improving access to housing during the past two
decades. Twenty years ago about 20% of the Chilean population was living in substandard
housing conditions, either in deteriorated housing, overcrowded houses or in informal
settlements lacking access to essential services such as electricity, sewerage, or drinking
water (Ozler, 2011). Chile has put in place ambitious housing subsidy programmes, that
coupled with investments in infrastructure and broader social policies, have helped to
improve Chileans’ living conditions. A key contributing factor has also been Chile’s
sustained good macroeconomic situation and stability that has resulted in increased
household income and savings and reduced the cost of access to housing finance. Today
most Chileans live in adequate housing and the number of people living in informal
settlements has sharply decreased. But, a still substantial 10% of the total population lives
in poor housing conditions.
House price growth has remained contained keeping housing affordable for most
Chileans. For poorer households, however, housing is too expensive. Chile has a range of
housing subsidies to help the less well-off access housing in ownership, but these do not
always reach those in most need, as a substantial part of subsidies goes to upper-middle
income groups. At the same time, public support has not always led to sustainable
solutions, with recipients slipping back into poor housing conditions. And, by leading to a
peripheral location of subsidised housing far from jobs and public services, public support
may have hindered social mobility and a faster decline in poverty and inequality.
Improving access to housing for the poor will be important if Chile wants to reduce
inequalities and poverty. Poor housing quality and overcrowding can hurt people’s health
and their opportunities to access high quality education, undermining their employability.
Housing support is also excessively focused on promoting home-ownership. The rental
market is tiny, there are no housing allowances for tenants and taxation excessively
favours owner-occupied housing over other investments. This can restrict people’s
mobility, the efficient allocation of labour and hurt economic performance in the long-run.
This chapter examines the main features of and recent developments in the Chilean
housing market. After assessing the factors hindering access to better housing for poorer
people, it discusses policy options to improve the functioning of the housing market so it
can deliver reasonable quality housing at affordable prices. The analysis draws on
information on housing policies collected through a survey administered to OECD member
countries in spring 2010, and extended to Chile in 2011 for the purpose of this chapter. The
information allows a comparison of key policy settings that influence the functioning of
the housing market, including public housing support for low-income households, housing
taxation, transaction costs and rules guiding the functioning of the rental market.
A significant share of the population lives in poor housing conditionsToday most Chileans live in adequate housing, though, there is still a substantial
number (Figure 2.1) living in poor housing conditions, mostly overcrowded housing, but
OECD ECONOMIC SURVEYS: CHILE © OECD 201284
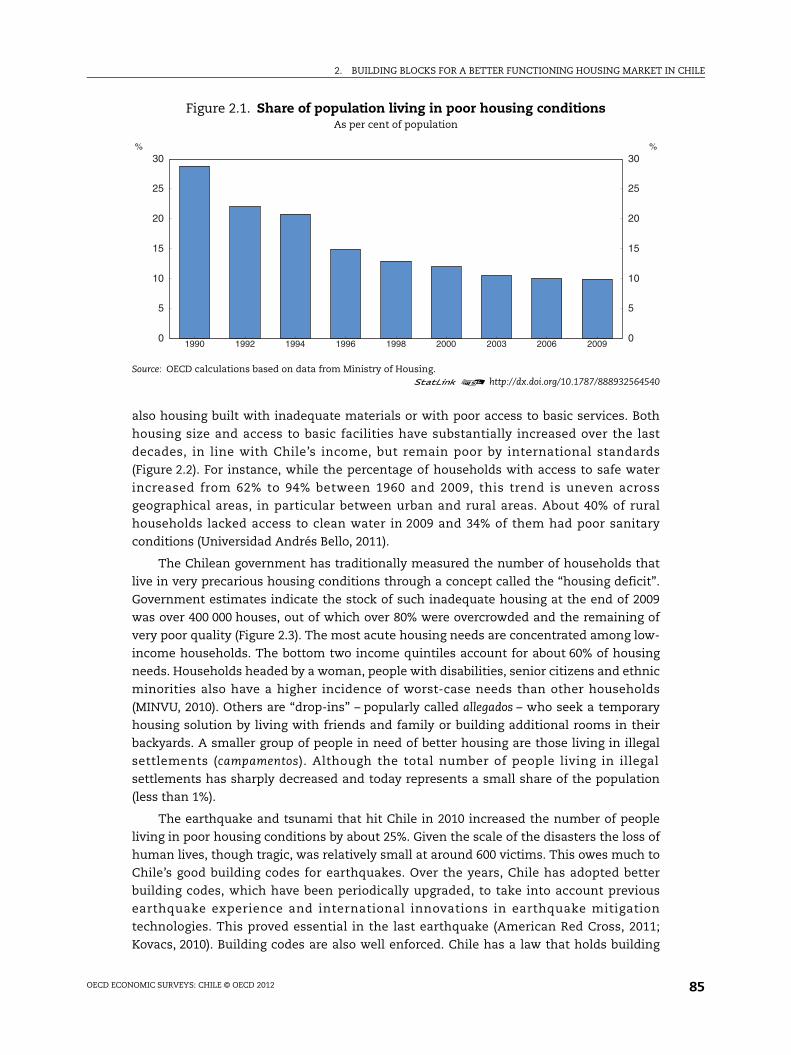
2. BUILDING BLOCKS FOR A BETTER FUNCTIONING HOUSING MARKET IN CHILE
also housing built with inadequate materials or with poor access to basic services. Both
housing size and access to basic facilities have substantially increased over the last
decades, in line with Chile’s income, but remain poor by international standards
(Figure 2.2). For instance, while the percentage of households with access to safe water
increased from 62% to 94% between 1960 and 2009, this trend is uneven across
geographical areas, in particular between urban and rural areas. About 40% of rural
households lacked access to clean water in 2009 and 34% of them had poor sanitary
conditions (Universidad Andrés Bello, 2011).
The Chilean government has traditionally measured the number of households that
live in very precarious housing conditions through a concept called the “housing deficit”.
Government estimates indicate the stock of such inadequate housing at the end of 2009
was over 400 000 houses, out of which over 80% were overcrowded and the remaining of
very poor quality (Figure 2.3). The most acute housing needs are concentrated among low-
income households. The bottom two income quintiles account for about 60% of housing
needs. Households headed by a woman, people with disabilities, senior citizens and ethnic
minorities also have a higher incidence of worst-case needs than other households
(MINVU, 2010). Others are “drop-ins” – popularly called allegados – who seek a temporary
housing solution by living with friends and family or building additional rooms in their
backyards. A smaller group of people in need of better housing are those living in illegal
settlements (campamentos). Although the total number of people living in illegal
settlements has sharply decreased and today represents a small share of the population
(less than 1%).
The earthquake and tsunami that hit Chile in 2010 increased the number of people
living in poor housing conditions by about 25%. Given the scale of the disasters the loss of
human lives, though tragic, was relatively small at around 600 victims. This owes much to
Chile’s good building codes for earthquakes. Over the years, Chile has adopted better
building codes, which have been periodically upgraded, to take into account previous
earthquake experience and international innovations in earthquake mitigation
technologies. This proved essential in the last earthquake (American Red Cross, 2011;
Kovacs, 2010). Building codes are also well enforced. Chile has a law that holds building
Figure 2.1. Share of population living in poor housing conditionsAs per cent of population
Source: OECD calculations based on data from Ministry of Housing.1 2 http://dx.doi.org/10.1787/888932564540
0
5
10
15
20
25
30%
0
5
10
15
20
25
30%
1990 1992 1994 1996 1998 2000 2003 2006 2009
OECD ECONOMIC SURVEYS: CHILE © OECD 2012 85
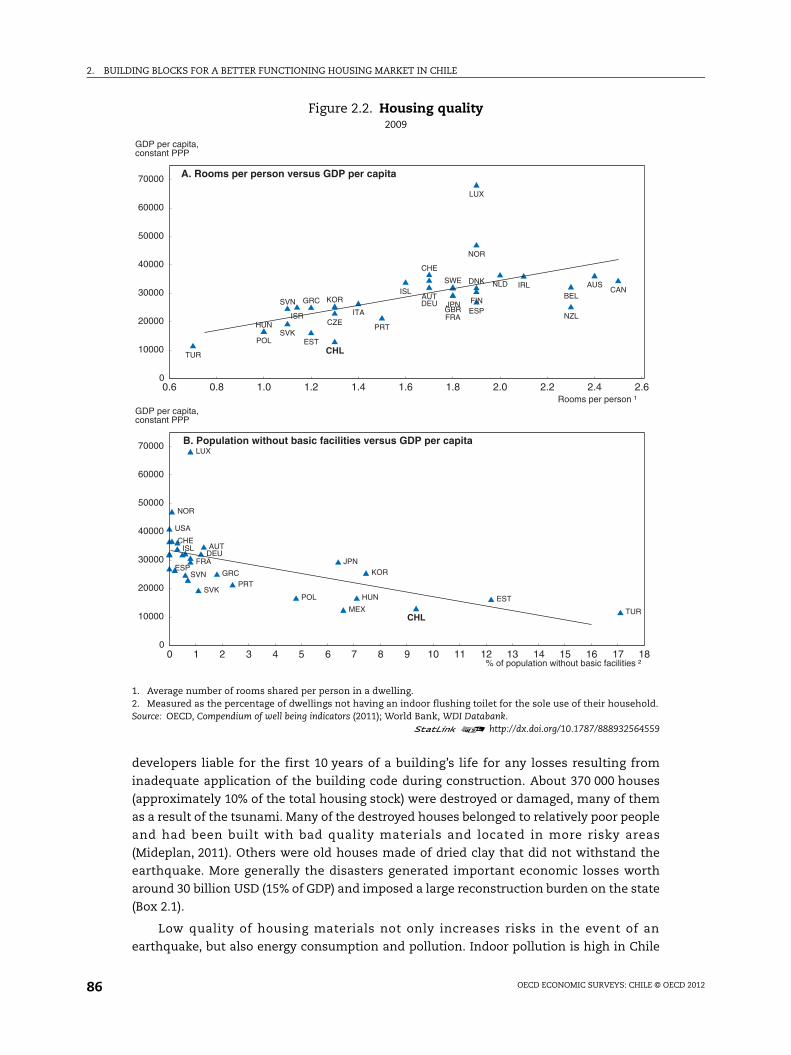
2. BUILDING BLOCKS FOR A BETTER FUNCTIONING HOUSING MARKET IN CHILE
developers liable for the first 10 years of a building’s life for any losses resulting from
inadequate application of the building code during construction. About 370 000 houses
(approximately 10% of the total housing stock) were destroyed or damaged, many of them
as a result of the tsunami. Many of the destroyed houses belonged to relatively poor people
and had been built with bad quality materials and located in more risky areas
(Mideplan, 2011). Others were old houses made of dried clay that did not withstand the
earthquake. More generally the disasters generated important economic losses worth
around 30 billion USD (15% of GDP) and imposed a large reconstruction burden on the state
(Box 2.1).
Low quality of housing materials not only increases risks in the event of an
earthquake, but also energy consumption and pollution. Indoor pollution is high in Chile
Figure 2.2. Housing quality2009
1. Average number of rooms shared per person in a dwelling.2. Measured as the percentage of dwellings not having an indoor flushing toilet for the sole use of their household.Source: OECD, Compendium of well being indicators (2011); World Bank, WDI Databank.
1 2 http://dx.doi.org/10.1787/888932564559
0.6 0.8 1.0 1.2 1.4 1.6 1.8 2.0 2.2 2.4 2.60
10000
20000
30000
40000
50000
60000
70000
GDP per capita, constant PPP
AUS
AUT BELCAN
CHL
CZE
DNK
EST
FIN
FRA
DEUGRC
HUN
ISLIRL
ISR ITAJPN
KOR
LUX
NLD
NZL
NOR
POL
PRTSVK
SVNESP
SWE
CHE
TUR
GBR
A. Rooms per person versus GDP per capita
Rooms per person ¹
0 1 2 3 4 5 6 7 8 9 10 11 12 13 14 15 16 17 180
10000
20000
30000
40000
50000
60000
70000
GDP per capita, constant PPP
AUT
CHL
EST
FRADEU
GRC
HUN
ISL
JPNKOR
LUX
MEX
NOR
POL
PRTSVK
SVNESP
CHE
TUR
USA
B. Population without basic facilities versus GDP per capita
% of population without basic facilities ²
OECD ECONOMIC SURVEYS: CHILE © OECD 201286
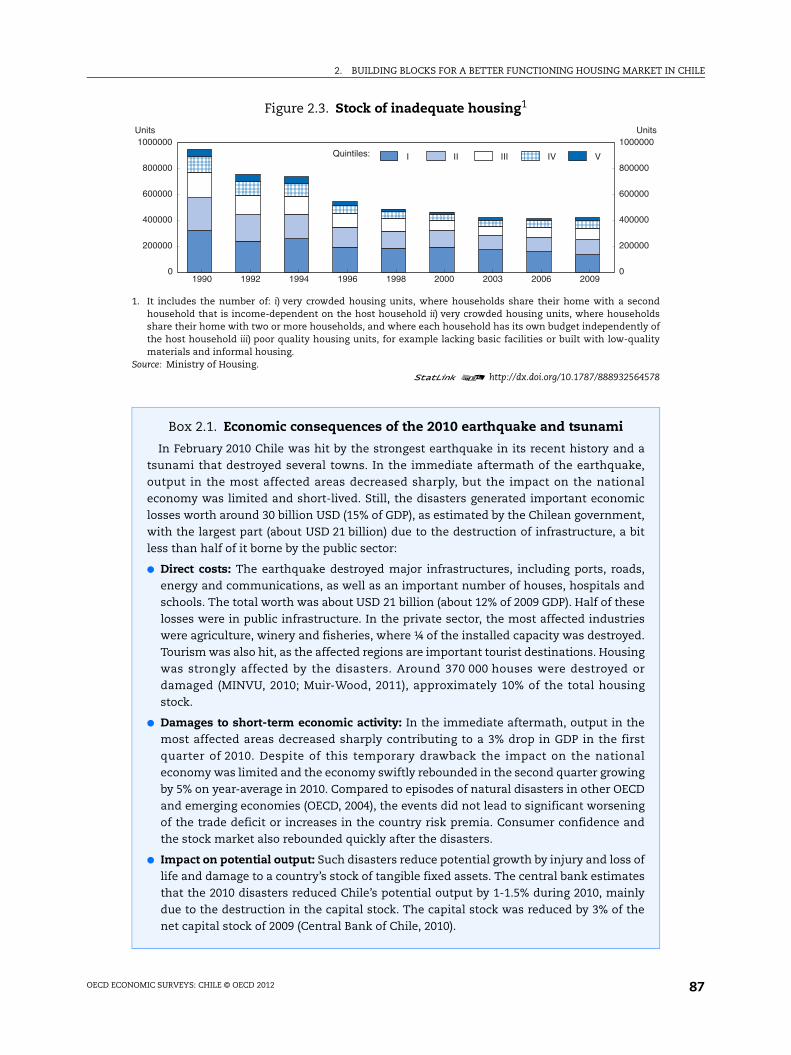
2. BUILDING BLOCKS FOR A BETTER FUNCTIONING HOUSING MARKET IN CHILE
Figure 2.3. Stock of inadequate housing1
1. It includes the number of: i) very crowded housing units, where households share their home with a secondhousehold that is income-dependent on the host household ii) very crowded housing units, where householdsshare their home with two or more households, and where each household has its own budget independently ofthe host household iii) poor quality housing units, for example lacking basic facilities or built with low-qualitymaterials and informal housing.
Source: Ministry of Housing.1 2 http://dx.doi.org/10.1787/888932564578
Box 2.1. Economic consequences of the 2010 earthquake and tsunami
In February 2010 Chile was hit by the strongest earthquake in its recent history and atsunami that destroyed several towns. In the immediate aftermath of the earthquake,output in the most affected areas decreased sharply, but the impact on the nationaleconomy was limited and short-lived. Still, the disasters generated important economiclosses worth around 30 billion USD (15% of GDP), as estimated by the Chilean government,with the largest part (about USD 21 billion) due to the destruction of infrastructure, a bitless than half of it borne by the public sector:
● Direct costs: The earthquake destroyed major infrastructures, including ports, roads,energy and communications, as well as an important number of houses, hospitals andschools. The total worth was about USD 21 billion (about 12% of 2009 GDP). Half of theselosses were in public infrastructure. In the private sector, the most affected industrieswere agriculture, winery and fisheries, where ¼ of the installed capacity was destroyed.Tourism was also hit, as the affected regions are important tourist destinations. Housingwas strongly affected by the disasters. Around 370 000 houses were destroyed ordamaged (MINVU, 2010; Muir-Wood, 2011), approximately 10% of the total housingstock.
● Damages to short-term economic activity: In the immediate aftermath, output in themost affected areas decreased sharply contributing to a 3% drop in GDP in the firstquarter of 2010. Despite of this temporary drawback the impact on the nationaleconomy was limited and the economy swiftly rebounded in the second quarter growingby 5% on year-average in 2010. Compared to episodes of natural disasters in other OECDand emerging economies (OECD, 2004), the events did not lead to significant worseningof the trade deficit or increases in the country risk premia. Consumer confidence andthe stock market also rebounded quickly after the disasters.
● Impact on potential output: Such disasters reduce potential growth by injury and loss oflife and damage to a country’s stock of tangible fixed assets. The central bank estimatesthat the 2010 disasters reduced Chile’s potential output by 1-1.5% during 2010, mainlydue to the destruction in the capital stock. The capital stock was reduced by 3% of thenet capital stock of 2009 (Central Bank of Chile, 2010).
0
200000
400000
600000
800000
1000000Units
0
200000
400000
600000
800000
1000000Units
Quintiles:
1990 1992 1994 1996 1998 2000 2003 2006 2009
I II III IV V
OECD ECONOMIC SURVEYS: CHILE © OECD 2012 87
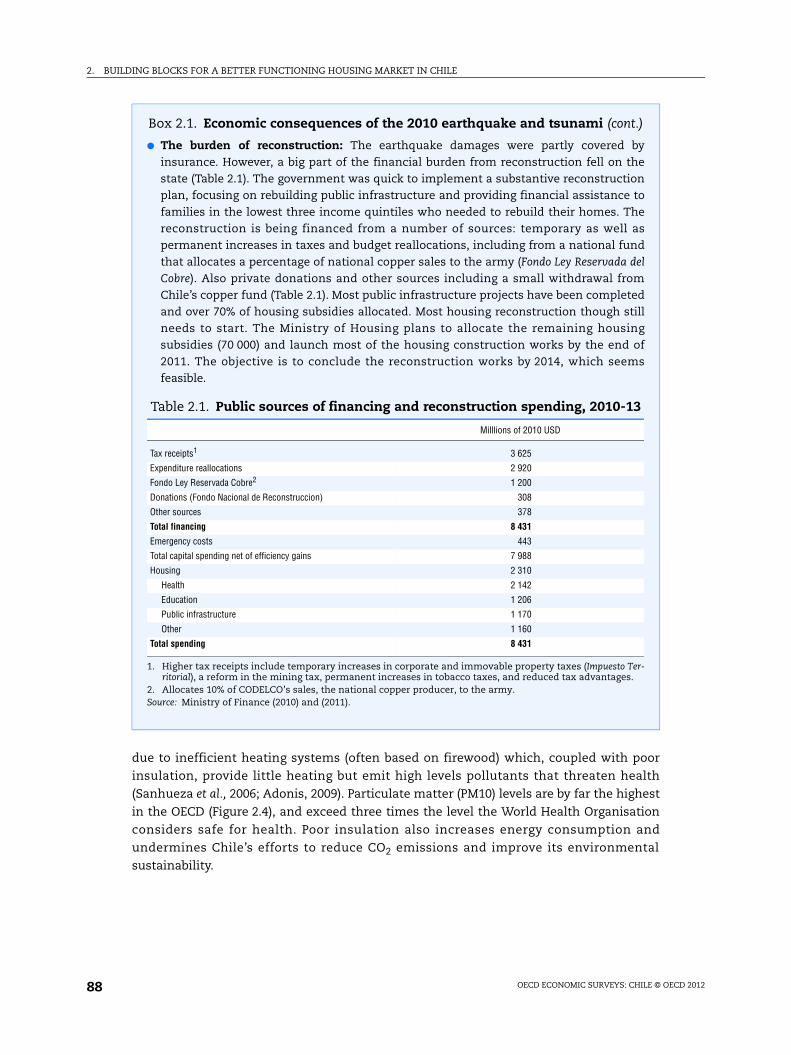
2. BUILDING BLOCKS FOR A BETTER FUNCTIONING HOUSING MARKET IN CHILE
due to inefficient heating systems (often based on firewood) which, coupled with poor
insulation, provide little heating but emit high levels pollutants that threaten health
(Sanhueza et al., 2006; Adonis, 2009). Particulate matter (PM10) levels are by far the highest
in the OECD (Figure 2.4), and exceed three times the level the World Health Organisation
considers safe for health. Poor insulation also increases energy consumption and
undermines Chile’s efforts to reduce CO2 emissions and improve its environmental
sustainability.
Box 2.1. Economic consequences of the 2010 earthquake and tsunami (cont.)
● The burden of reconstruction: The earthquake damages were partly covered byinsurance. However, a big part of the financial burden from reconstruction fell on thestate (Table 2.1). The government was quick to implement a substantive reconstructionplan, focusing on rebuilding public infrastructure and providing financial assistance tofamilies in the lowest three income quintiles who needed to rebuild their homes. Thereconstruction is being financed from a number of sources: temporary as well aspermanent increases in taxes and budget reallocations, including from a national fundthat allocates a percentage of national copper sales to the army (Fondo Ley Reservada delCobre). Also private donations and other sources including a small withdrawal fromChile’s copper fund (Table 2.1). Most public infrastructure projects have been completedand over 70% of housing subsidies allocated. Most housing reconstruction though stillneeds to start. The Ministry of Housing plans to allocate the remaining housingsubsidies (70 000) and launch most of the housing construction works by the end of2011. The objective is to conclude the reconstruction works by 2014, which seemsfeasible.
Table 2.1. Public sources of financing and reconstruction spending, 2010-13
Milllions of 2010 USD
Tax receipts1 3 625
Expenditure reallocations 2 920
Fondo Ley Reservada Cobre2 1 200
Donations (Fondo Nacional de Reconstruccion) 308
Other sources 378
Total financing 8 431
Emergency costs 443
Total capital spending net of efficiency gains 7 988
Housing 2 310
Health 2 142
Education 1 206
Public infrastructure 1 170
Other 1 160
Total spending 8 431
1. Higher tax receipts include temporary increases in corporate and immovable property taxes (Impuesto Ter-ritorial), a reform in the mining tax, permanent increases in tobacco taxes, and reduced tax advantages.
2. Allocates 10% of CODELCO’s sales, the national copper producer, to the army.Source: Ministry of Finance (2010) and (2011).
OECD ECONOMIC SURVEYS: CHILE © OECD 201288

2. BUILDING BLOCKS FOR A BETTER FUNCTIONING HOUSING MARKET IN CHILE
House price growth has remained contained keeping housing affordable for most Chileans
As opposed to many OECD countries, where prices rose strongly since the mid 1980s,
house prices have remained broadly stable in Chile during the last decade (Figure 2.5) in
line with fundamentals (Parrado et al., 2009). This has kept housing affordable for most
households. Price increases have been mostly driven by higher household income and
lower long term interest rates. However, this evidence should be treated with caution as
Chile’s house price data are patchy and only cover the Santiago region.
A deeper housing finance market has facilitated access to creditLower borrowing costs are a result of Chile’s successful macroeconomic policies and
institutions, which have granted stability, alongside the increase in the depth and
Figure 2.4. Exposure to air pollution by particulatesMicrograms per cubic meter, 2008¹
1. Average concentration of particulate matter (PM10) in cities with population larger than 100 000.Source: OECD, Compendium of well being indicators (2011).
1 2 http://dx.doi.org/10.1787/888932564597
0
10
20
30
40
50
60
70
0
10
20
30
40
50
60
70
SWE IRL LUX FRA AUS FIN HUN DEU CZE PRT OECD ITA ESP AUT NLD GRC POL CHLNZL EST GBR SVK ISL CAN NOR DNK USA BEL CHE JPN ISR SVN KOR MEX TUR
Figure 2.5. Real house prices to real wagesIndex 2000=100
1. For Chile house price data is average house price in CPI-Indexed Units of Account (UF) per square meter forproperty in the region of Santiago. Other countries real house price index.
Source: Collect GFK; INE; OECD Economic Outlook Database.1 2 http://dx.doi.org/10.1787/888932564616
2001 2002 2003 2004 2005 2006 2007 2008 2009 2010 201150
75
100
125
150
175
200
225
50
75
100
125
150
175
200
225Chile AUSBELCANESPFRAGBRIRL
NLDUSADEUJPN
OECD ECONOMIC SURVEYS: CHILE © OECD 2012 89
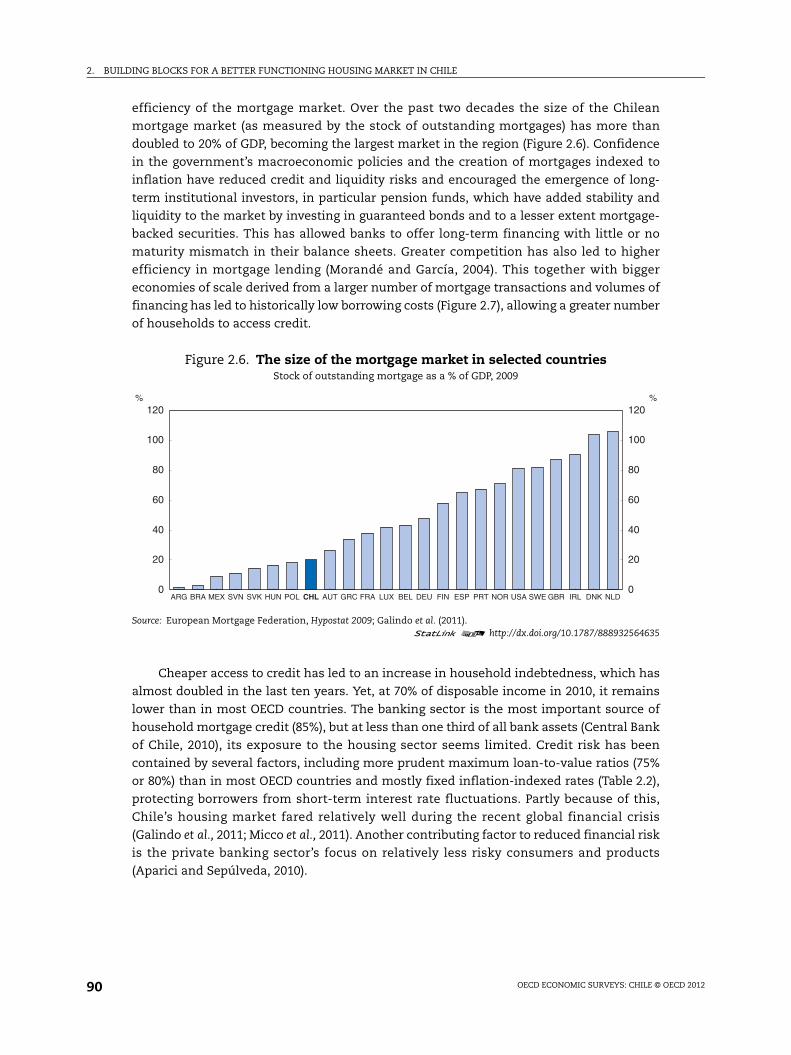
2. BUILDING BLOCKS FOR A BETTER FUNCTIONING HOUSING MARKET IN CHILE
efficiency of the mortgage market. Over the past two decades the size of the Chilean
mortgage market (as measured by the stock of outstanding mortgages) has more than
doubled to 20% of GDP, becoming the largest market in the region (Figure 2.6). Confidence
in the government’s macroeconomic policies and the creation of mortgages indexed to
inflation have reduced credit and liquidity risks and encouraged the emergence of long-
term institutional investors, in particular pension funds, which have added stability and
liquidity to the market by investing in guaranteed bonds and to a lesser extent mortgage-
backed securities. This has allowed banks to offer long-term financing with little or no
maturity mismatch in their balance sheets. Greater competition has also led to higher
efficiency in mortgage lending (Morandé and García, 2004). This together with bigger
economies of scale derived from a larger number of mortgage transactions and volumes of
financing has led to historically low borrowing costs (Figure 2.7), allowing a greater number
of households to access credit.
Cheaper access to credit has led to an increase in household indebtedness, which has
almost doubled in the last ten years. Yet, at 70% of disposable income in 2010, it remains
lower than in most OECD countries. The banking sector is the most important source of
household mortgage credit (85%), but at less than one third of all bank assets (Central Bank
of Chile, 2010), its exposure to the housing sector seems limited. Credit risk has been
contained by several factors, including more prudent maximum loan-to-value ratios (75%
or 80%) than in most OECD countries and mostly fixed inflation-indexed rates (Table 2.2),
protecting borrowers from short-term interest rate fluctuations. Partly because of this,
Chile’s housing market fared relatively well during the recent global financial crisis
(Galindo et al., 2011; Micco et al., 2011). Another contributing factor to reduced financial risk
is the private banking sector’s focus on relatively less risky consumers and products
(Aparici and Sepúlveda, 2010).
Figure 2.6. The size of the mortgage market in selected countriesStock of outstanding mortgage as a % of GDP, 2009
Source: European Mortgage Federation, Hypostat 2009; Galindo et al. (2011).1 2 http://dx.doi.org/10.1787/888932564635
0
20
40
60
80
100
120 %
0
20
40
60
80
100
120 %
ARG BRA MEX SVN SVK HUN POL CHL AUT GRC FRA LUX BEL DEU FIN ESP PRT NOR USA SWE GBR IRL DNK NLD
OECD ECONOMIC SURVEYS: CHILE © OECD 201290

2. BUILDING BLOCKS FOR A BETTER FUNCTIONING HOUSING MARKET IN CHILE
Figure 2.7. Mortgage market developments
1. Includes endorsable mortgage credit, mortgage bonds and non-endorsable mortgage credit.Source: Superintendencia de Bancos e Instituciones Financieras (SBIF) Chile; Banco Central de Chile, Informe de EstabilidadFinanciera (2010-I).
1 2 http://dx.doi.org/10.1787/888932564654
Table 2.2. Mortgage and financial market features in OECD countries
Regulatory limits on loan-to value Prevailing type of interest rateTypical maturity
(years)Mortgage equity
withdrawal
Australia 100% if insured Mainly variable 25 Yes
Austria . . Fixed (75%); variable (25%) 25 No
Belgium None Fixed (75%); mixed (19%); variable (6%)
20 No
Canada 95% if insured Fixed and mixed (92%); variable (8%) 25 Yes
Chile 75% and 25% of the borrower’s income for loans under UF 3 000. And 90% for state subsidised housing
Fixed (57%); mixed (4%); variable (39%)
25 No
Czech Republic . . Fixed (mixed) 20 . .
Denmark 0.8 Fixed (75%); mixed (10%); variable (15%)
30 Yes
Estonia . . Variable 30 . .
Finland None Fixed (2%); variable (97%); other (1%) 17 Yes
2001 2002 2003 2004 2005 2006 2007 2008 2009 2010 20112
4
6
8
%
2
4
6
8
%
Endosable mortgage credit(Mutuos hipotecarios endosables)
Mortgage bonds(Letras de credito)
A. Evolution of mortgage costs of different maturities
12 to 20 years More than 20 years
12 to 20 yearsMore than 20 years
2001 2002 2003 2004 2005 2006 2007 2008 2009 2010 20116
8
10
12
14
16
18
20 % of nominal GDP
0
250
500
750
1000
1250
1500Thousands
B. Evolution of banking mortgage lending ¹
Amount of credit (left scale)Number of credit operations (right scale)
OECD ECONOMIC SURVEYS: CHILE © OECD 2012 91
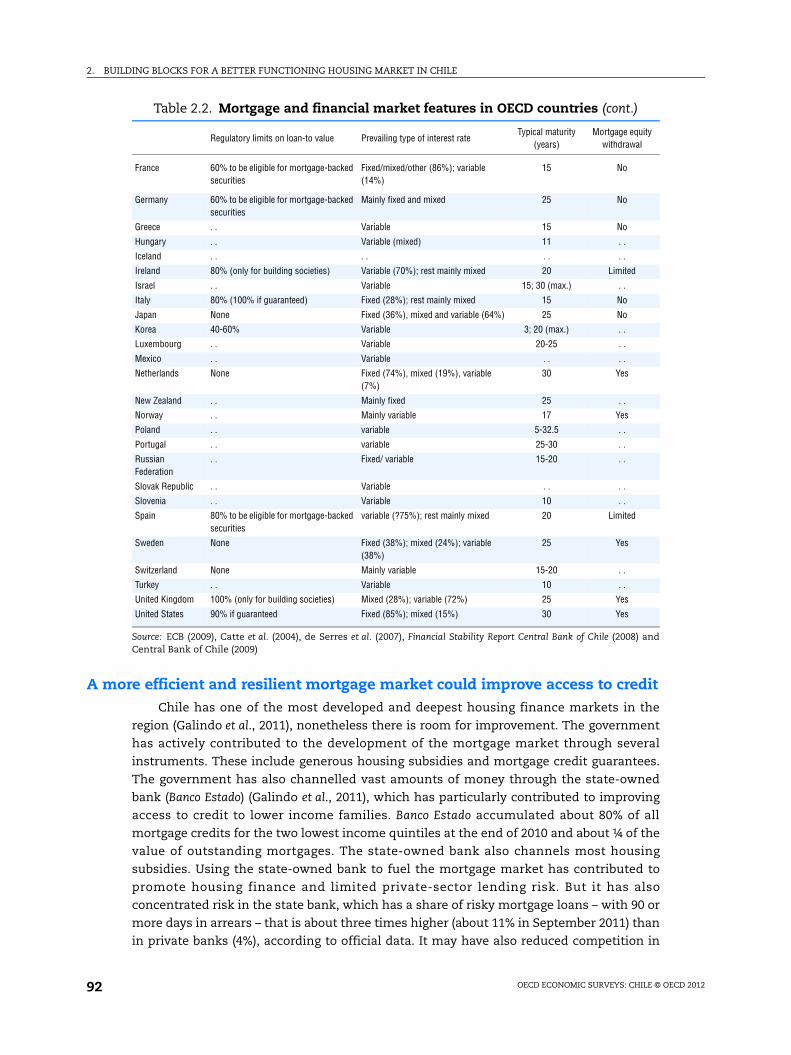
2. BUILDING BLOCKS FOR A BETTER FUNCTIONING HOUSING MARKET IN CHILE
A more efficient and resilient mortgage market could improve access to creditChile has one of the most developed and deepest housing finance markets in the
region (Galindo et al., 2011), nonetheless there is room for improvement. The government
has actively contributed to the development of the mortgage market through several
instruments. These include generous housing subsidies and mortgage credit guarantees.
The government has also channelled vast amounts of money through the state-owned
bank (Banco Estado) (Galindo et al., 2011), which has particularly contributed to improving
access to credit to lower income families. Banco Estado accumulated about 80% of all
mortgage credits for the two lowest income quintiles at the end of 2010 and about ¼ of the
value of outstanding mortgages. The state-owned bank also channels most housing
subsidies. Using the state-owned bank to fuel the mortgage market has contributed to
promote housing finance and limited private-sector lending risk. But it has also
concentrated risk in the state bank, which has a share of risky mortgage loans – with 90 or
more days in arrears – that is about three times higher (about 11% in September 2011) than
in private banks (4%), according to official data. It may have also reduced competition in
France 60% to be eligible for mortgage-backed securities
Fixed/mixed/other (86%); variable (14%)
15 No
Germany 60% to be eligible for mortgage-backed securities
Mainly fixed and mixed 25 No
Greece . . Variable 15 No
Hungary . . Variable (mixed) 11 . .
Iceland . . . . . . . .
Ireland 80% (only for building societies) Variable (70%); rest mainly mixed 20 Limited
Israel . . Variable 15; 30 (max.) . .
Italy 80% (100% if guaranteed) Fixed (28%); rest mainly mixed 15 No
Japan None Fixed (36%), mixed and variable (64%) 25 No
Korea 40-60% Variable 3; 20 (max.) . .
Luxembourg . . Variable 20-25 . .
Mexico . . Variable . . . .
Netherlands None Fixed (74%), mixed (19%), variable (7%)
30 Yes
New Zealand . . Mainly fixed 25 . .
Norway . . Mainly variable 17 Yes
Poland . . variable 5-32.5 . .
Portugal . . variable 25-30 . .
Russian Federation
. . Fixed/ variable 15-20 . .
Slovak Republic . . Variable . . . .
Slovenia . . Variable 10 . .
Spain 80% to be eligible for mortgage-backed securities
variable (?75%); rest mainly mixed 20 Limited
Sweden None Fixed (38%); mixed (24%); variable (38%)
25 Yes
Switzerland None Mainly variable 15-20 . .
Turkey . . Variable 10 . .
United Kingdom 100% (only for building societies) Mixed (28%); variable (72%) 25 Yes
United States 90% if guaranteed Fixed (85%); mixed (15%) 30 Yes
Source: ECB (2009), Catte et al. (2004), de Serres et al. (2007), Financial Stability Report Central Bank of Chile (2008) andCentral Bank of Chile (2009)
Table 2.2. Mortgage and financial market features in OECD countries (cont.)
Regulatory limits on loan-to value Prevailing type of interest rateTypical maturity
(years)Mortgage equity
withdrawal
OECD ECONOMIC SURVEYS: CHILE © OECD 201292

2. BUILDING BLOCKS FOR A BETTER FUNCTIONING HOUSING MARKET IN CHILE
the mortgage market for middle and low income households (Pardo, 2002). This could lead
to higher mortgage costs and a lower range of available mortgage products in this market
segment. The government should ensure there is sufficient competition in the banking
sector and to rely more on targeted housing support rather than on the provision of
mortgage credit through the state bank.
An efficient mortgage market, with low borrowing and transaction costs, is key for a
well functioning housing market. It can improve access to credit for middle-income
household but also free resources so the government can focus on helping the truly
disadvantaged or credit constrained households. For instance, average transaction costs
for buying a home (e.g. stamp duties, legal fees, notary fees, etc.) are low in Chile relative to
other OECD countries (Figure 2.8). And the fact that Chile subsidises the administrative
costs and guarantees loans for subsidy recipients, has reduced transaction costs by
reducing the legal and economic risk to issue credit to these households (IADB, 2007). But
Chile could further reduce transaction costs and mortgage approval times through better
mortgage contract standardisation; better access to information on the credit history of a
potential client, or for instance its tax credit record (IADB, 2007). This would improve the
functioning and transparency of the mortgage market and would also facilitate regulatory
oversight.
Chile should also improve the efficiency of its legal system as it affects borrowing costs
and financing costs for lenders and investors, and can be key in mitigating lending risks.
Effective foreclosure procedures are important in this respect. Mortgage foreclosure
procedures are clearly defined in the Banking Law and are relatively fast in Chile compared
to neighbouring countries, nonetheless eviction procedures can take more than a year
(IADB, 2007; Lex Mundi, 2008) and could be improved. Chile has an executive judgement
procedure in which non payments can be automatically relayed to the court (Morandé and
García, 2004), however, the owner protection legislation has precedence over an executive
procedure and allows the owner to appeal, thus postponing a court decision. Chile could
consider implementing a stronger foreclosure law by, for instance, speeding up legal
procedures. This would make the legislative framework more balanced, protecting
Figure 2.8. Transaction costsAs per cent of property value 20091
1. 2011 for Chile.Source: Calculations based on OECD Housing Market questionnaire.
1 2 http://dx.doi.org/10.1787/888932564673
0
2
4
6
8
10
12
14
16%
0
2
4
6
8
10
12
14
16%
BEL GRC ITA ESP MEX LUX FIN DEU POL IRL SWE SVN KOR NZL ISR NOR ISLFRA AUS TUR CZE PRT HUN AUT CAN NLD CHE CHL JPN SVK USA EST GBR DNK
Buyer Seller
OECD ECONOMIC SURVEYS: CHILE © OECD 2012 93
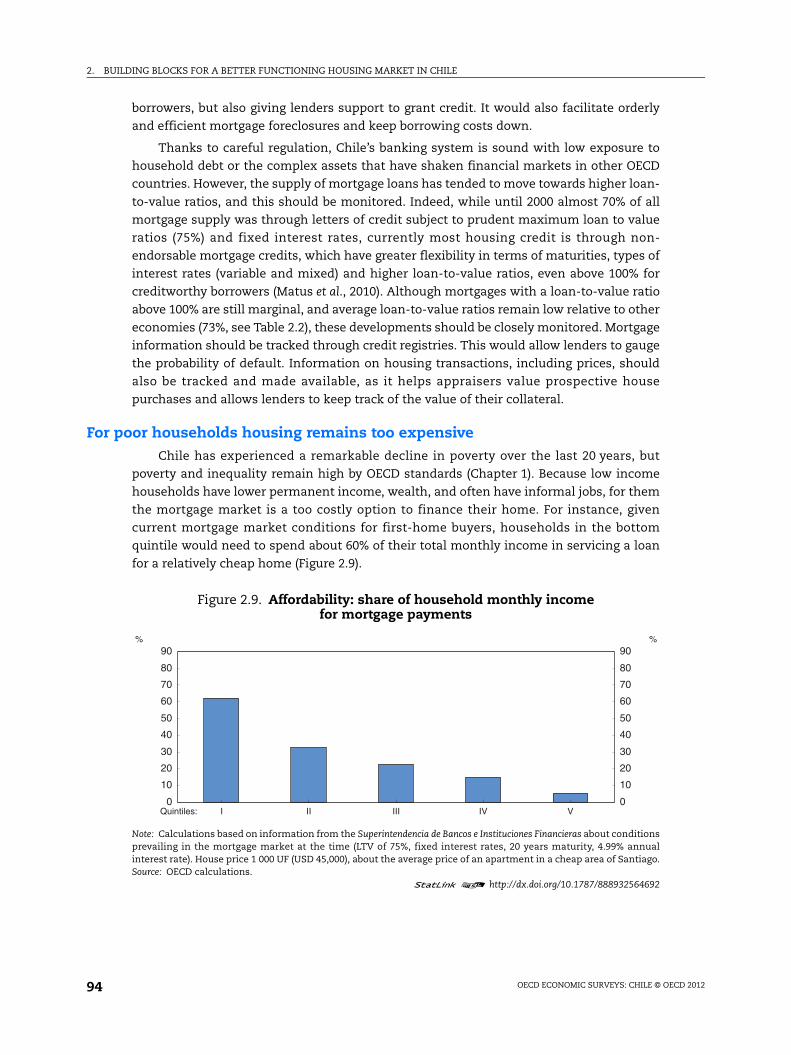
2. BUILDING BLOCKS FOR A BETTER FUNCTIONING HOUSING MARKET IN CHILE
borrowers, but also giving lenders support to grant credit. It would also facilitate orderly
and efficient mortgage foreclosures and keep borrowing costs down.
Thanks to careful regulation, Chile’s banking system is sound with low exposure to
household debt or the complex assets that have shaken financial markets in other OECD
countries. However, the supply of mortgage loans has tended to move towards higher loan-
to-value ratios, and this should be monitored. Indeed, while until 2000 almost 70% of all
mortgage supply was through letters of credit subject to prudent maximum loan to value
ratios (75%) and fixed interest rates, currently most housing credit is through non-
endorsable mortgage credits, which have greater flexibility in terms of maturities, types of
interest rates (variable and mixed) and higher loan-to-value ratios, even above 100% for
creditworthy borrowers (Matus et al., 2010). Although mortgages with a loan-to-value ratio
above 100% are still marginal, and average loan-to-value ratios remain low relative to other
economies (73%, see Table 2.2), these developments should be closely monitored. Mortgage
information should be tracked through credit registries. This would allow lenders to gauge
the probability of default. Information on housing transactions, including prices, should
also be tracked and made available, as it helps appraisers value prospective house
purchases and allows lenders to keep track of the value of their collateral.
For poor households housing remains too expensiveChile has experienced a remarkable decline in poverty over the last 20 years, but
poverty and inequality remain high by OECD standards (Chapter 1). Because low income
households have lower permanent income, wealth, and often have informal jobs, for them
the mortgage market is a too costly option to finance their home. For instance, given
current mortgage market conditions for first-home buyers, households in the bottom
quintile would need to spend about 60% of their total monthly income in servicing a loan
for a relatively cheap home (Figure 2.9).
Figure 2.9. Affordability: share of household monthly income for mortgage payments
Note: Calculations based on information from the Superintendencia de Bancos e Instituciones Financieras about conditionsprevailing in the mortgage market at the time (LTV of 75%, fixed interest rates, 20 years maturity, 4.99% annualinterest rate). House price 1 000 UF (USD 45,000), about the average price of an apartment in a cheap area of Santiago.Source: OECD calculations.
1 2 http://dx.doi.org/10.1787/888932564692
0
10
20
30
40
50
60
70
80
90 %
0
10
20
30
40
50
60
70
80
90%
Quintiles: I II III IV V
OECD ECONOMIC SURVEYS: CHILE © OECD 201294

2. BUILDING BLOCKS FOR A BETTER FUNCTIONING HOUSING MARKET IN CHILE
Housing subsidies have widened access to housing…Chile has put in place ambitious housing subsidy programmes that have helped to
widen access to housing during the last two decades. The main objective has been to
deliver home ownership and reduce the significant stock of inadequate housing (see
Figure 2.3). The instruments to achieve this objective have shifted over the years. Public
provision programs – directly building houses or supporting supply – were the main tool
during the 90s. These have been eliminated and replaced by demand-side targeted
subsidies or vouchers. The government gives subsidies to first-time homebuyers who
want to buy or build a home and who fulfil some basic eligibility criteria (Box 2.2),
including some minimum savings. Subsidies at up to 75% of the housing price are quite
generous to ensure that beneficiaries do not run into high debt burdens. Only relatively
better-off subsidy beneficiaries – in the second income quintile or above – are in fact
allowed to take on a mortgage to complement the subsidy. To reduce credit risks further
and ensure banks lend to subsidy beneficiaries, the government also gives some
guarantees to the bank. Such housing subsidy schemes are common in many Latin
American countries. The main idea is that applying for a subsidy will, first, encourage
families to save and, then, owning a home will improve their material and financial
capital, helping them to overcome poverty.
Box 2.2. Chile’s housing subsidies
There is a wide range of housing subsidy programs in Chile. The main features of themost important programmes in terms of public expenditure and number of subsidies(Fondo Solidario de Vivienda, Título I and Título II) are sumarised in Table 2.3. First-timehomebuyers can apply for a housing subsidy as long as they comply with some minimumeligibility criteria (Table 2.3). Subsidies are then allocated based on scores taking intoaccount different criteria, until funding is exhausted. Candidates who didn’t receive avoucher remain in the queue. Beneficiaries are issued a voucher with an expiry date (after21 months), which they can use to shop around for a home or to build their own home,adding their savings and – in the case of better-off households – their credit to theirfunding.
There are also other housing-related subsidies:
● Subsidies to improve housing quality: through upgrading, extension and thermalretrofitting (Reparación y Mejoramiento, Ampliacion de Vivienda, Acondicionamiento Térmico).
● Subsidies for the maintenance and repair of community facilities, public spaces orstreet pavements: (Programa Barrio).
● Leasing subsidy: The idea of the leasing programme (Leasing Habitacional) is to helpfamilies who cannot afford saving any money, even if little, to access homeownership.Recipients sign-up a rental contract with a real estate company with the obligation tobuy the home at the end of the contract. With the subsidy recipients can pay the rentalcharges and eventually the home.
● Residential mobility programme: The residential mobility programme (Movilidad
Habitacional) allows households who bought their home with a subsidy to sell it and buyanother (more expensive) home with the subsidy.
OECD ECONOMIC SURVEYS: CHILE © OECD 2012 95
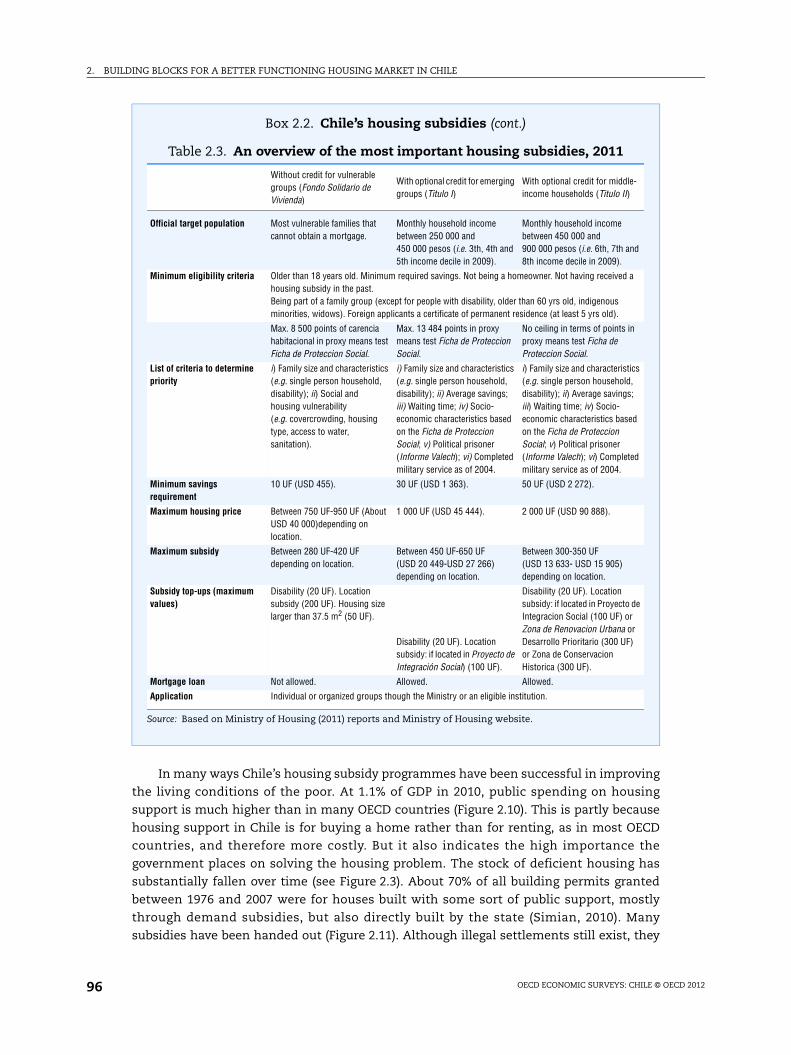
2. BUILDING BLOCKS FOR A BETTER FUNCTIONING HOUSING MARKET IN CHILE
In many ways Chile’s housing subsidy programmes have been successful in improving
the living conditions of the poor. At 1.1% of GDP in 2010, public spending on housing
support is much higher than in many OECD countries (Figure 2.10). This is partly because
housing support in Chile is for buying a home rather than for renting, as in most OECD
countries, and therefore more costly. But it also indicates the high importance the
government places on solving the housing problem. The stock of deficient housing has
substantially fallen over time (see Figure 2.3). About 70% of all building permits granted
between 1976 and 2007 were for houses built with some sort of public support, mostly
through demand subsidies, but also directly built by the state (Simian, 2010). Many
subsidies have been handed out (Figure 2.11). Although illegal settlements still exist, they
Box 2.2. Chile’s housing subsidies (cont.)
Table 2.3. An overview of the most important housing subsidies, 2011
Without credit for vulnerable groups (Fondo Solidario de Vivienda)
With optional credit for emerging groups (Titulo I)
With optional credit for middle-income households (Titulo II)
Official target population Most vulnerable families that cannot obtain a mortgage.
Monthly household income between 250 000 and 450 000 pesos (i.e. 3th, 4th and 5th income decile in 2009).
Monthly household income between 450 000 and 900 000 pesos (i.e. 6th, 7th and 8th income decile in 2009).
Minimum eligibility criteria Older than 18 years old. Minimum required savings. Not being a homeowner. Not having received a housing subsidy in the past. Being part of a family group (except for people with disability, older than 60 yrs old, indigenous minorities, widows). Foreign applicants a certificate of permanent residence (at least 5 yrs old).
Max. 8 500 points of carencia habitacional in proxy means test Ficha de Proteccion Social.
Max. 13 484 points in proxy means test Ficha de Proteccion Social.
No ceiling in terms of points in proxy means test Ficha de Proteccion Social.
List of criteria to determine priority
i) Family size and characteristics (e.g. single person household, disability); ii) Social and housing vulnerability (e.g. covercrowding, housing type, access to water, sanitation).
i) Family size and characteristics (e.g. single person household, disability); ii) Average savings; iii) Waiting time; iv) Socio-economic characteristics based on the Ficha de Proteccion Social; v) Political prisoner (Informe Valech); vi) Completed military service as of 2004.
i) Family size and characteristics (e.g. single person household, disability); ii) Average savings; iii) Waiting time; iv) Socio-economic characteristics based on the Ficha de Proteccion Social; v) Political prisoner (Informe Valech); vi) Completed military service as of 2004.
Minimum savings requirement
10 UF (USD 455). 30 UF (USD 1 363). 50 UF (USD 2 272).
Maximum housing price Between 750 UF-950 UF (About USD 40 000)depending on location.
1 000 UF (USD 45 444). 2 000 UF (USD 90 888).
Maximum subsidy Between 280 UF-420 UF depending on location.
Between 450 UF-650 UF (USD 20 449-USD 27 266) depending on location.
Between 300-350 UF (USD 13 633- USD 15 905) depending on location.
Subsidy top-ups (maximum values)
Disability (20 UF). Location subsidy (200 UF). Housing size larger than 37.5 m2 (50 UF).
Disability (20 UF). Location subsidy: if located in Proyecto de Integración Social) (100 UF).
Disability (20 UF). Location subsidy: if located in Proyecto de Integracion Social (100 UF) or Zona de Renovacion Urbana or Desarrollo Prioritario (300 UF) or Zona de Conservacion Historica (300 UF).
Mortgage loan Not allowed. Allowed. Allowed.
Application Individual or organized groups though the Ministry or an eligible institution.
Source: Based on Ministry of Housing (2011) reports and Ministry of Housing website.
OECD ECONOMIC SURVEYS: CHILE © OECD 201296

2. BUILDING BLOCKS FOR A BETTER FUNCTIONING HOUSING MARKET IN CHILE
Figure 2.10. Public spending on housing and community amenitiesAs per cent of GDP, 20091
1. 2006 for Canada and 2005 for New Zealand.Source: OECD, National Accounts Database; Chile, Estadísticas de las Finanzas Públicas 2000-2010.
1 2 http://dx.doi.org/10.1787/888932564711
Figure 2.11. Number and value of housing subsidies
1. The CPI-Indexed Unit of Account (UF) was 22136 Chilean pesos on 9 November 2011.2. Projected spending.Source: Observatorio Habitacional, MINVU.
1 2 http://dx.doi.org/10.1787/888932564730
0.00
0.25
0.50
0.75
1.00
1.25
1.50
1.75
2.00
2.25%
0.00
0.25
0.50
0.75
1.00
1.25
1.50
1.75
2.00
2.25%
EST BEL ISL FIN PRT AUT DEU SVK LUX SVN NLD HUN CZE USA GBR FRACHE GRC ISR DNK NZL NOR JPN SWE ITA CAN POL ESP CHL KOR IRL
2001 2002 2003 2004 2005 2006 2007 2008 2009 2010 20110
50
100
150
200
250Thousand
0
10
20
30
40
50
60
70 UF, millions
²
of Account(UF)¹ (right scale)
A. Subsidies for buying a home
Number (left scale) Value in CPI-Indexed Unit
2001 2002 2003 2004 2005 2006 2007 2008 2009 2010 20110
50
100
150
200
250Thousand
0
10
20
30
40
50
60
70 UF, millions
²
B. Subsidies for renovation and extension
OECD ECONOMIC SURVEYS: CHILE © OECD 2012 97

2. BUILDING BLOCKS FOR A BETTER FUNCTIONING HOUSING MARKET IN CHILE
are mostly a problem of the past, and basic services are available to most citizens (see
Figure 2.2).
An assessment of Chile’s housing subsidies regarding key design features as well as
their performance in terms of equity – targeting and coverage – and efficiency shows that
subsidy programmes are fairly transparent and visible (Table 2.4). For instance, eligibility
criteria and the dates for application are published on the internet and available from the
regional offices of the Ministry of Housing and municipalities upon request. Beneficiaries
Table 2.4. An assessment of Chile’s housing subsidy programmes: key features, equity and efficiency
Criterion Description Assessment
Transparency Clarity of the programme’s eligibility and participation criteria; Effective implementation by relevant authorities.
Fair. Eligibility and allocation criteria are published on the internet and available from the regional offices of the Ministry of Housing and municipalities upon request. Beneficiaries are chosen in open competitions by a clearly defined body and the list of beneficiaries published. However, subsidy programmes and eligibility criteria change relatively often and the weights given to different selection criteria is not obvious, which may make it difficult for people with poor skills to apply.
Visibility What is the degree of political visibility of the subsidy? Are citizens/taxpayers aware of the true cost of the subsidy?
Fair. Subsidies are explicit and up-front thus visible and the total amount of subsidies spending is reported in the budget and annual accounts of the Ministry of Housing and on the Ministry of Housing website. However, there are no ex-post evaluations of programme effectiveness.
Administrative simplicity
Whether subsidies are easy and relatively inexpensive to manage; households are aware of the existence of the subsidy: the average household needs help to register in the program?
Poor. There are many different categories of housing subsidies (with different subcategories) which can make it hard to administer. Households can ask for information and help to file their application and to municipalities and other associations, but the usefulness of this support depends on available resources.
Flexibility Extent to which programmes can be modified or stopped without major political unrest or disruptive effects on the economy.
Fair. Subsidy programmes are defined in legislative decrees and do not need Congress approval in order to be modified. Programmes have been substantially modified over the past 30 years. To the extent that subsidies have been in place for over 30 years and housing represents an important share of total construction stopping them altogether would be unpopular and likely affect economic activity.
Targeting/Vertical equity
Who are the official target of the subsidy? Are these the neediest? Does the subsidy not only use income criteria but gives different treatment for different types of households (e.g. households with children, female households).
Poor. In 2011, although 56% of all funding for housing is targeted to the first income quintile (Fondo Solidario de Vivienda), the remaining 44% is targeted to the quintiles above that up to the 9th decile. The selection procedure gives higher points for family size and other features but evidence suggests the means proxy test (Ficha de Proteccion Social) is an unreliable measure of income and household situation. There is no housing assistance for renters (17% of the population).
Coverage What share of the population effectively received the subsidies?
Poor. Although targeting has improved over time, earlier evidence suggests a significant proportion of subsidies still goes to the upper-middle income groups and only about 22% of beneficiaries come from the bottom quintile (e.g. Aparici and Sepúlveda, 2010).
Efficiency Could the same resources be used more efficiently? Are improvements in housing conditions sustainable? Is there evidence of crowding out of multiplier effects of spending)?
Poor. The number of bad quality housing has substantially decreased over time. But some of the targeted households can access housing through the finance market at reasonable costs. Some subsidised housing units are empty, others are rented, and some deteriorated fast. An excessive focus on homeownership may have squeezed the rental market.
OECD ECONOMIC SURVEYS: CHILE © OECD 201298

2. BUILDING BLOCKS FOR A BETTER FUNCTIONING HOUSING MARKET IN CHILE
are chosen in open competitions by the regional offices of the Ministry of Housing and the
list of beneficiaries is published. However, the eligibility and allocation criteria change
frequently and there is a large variety of subsidies with different eligibility criteria. This
makes it difficult for potential beneficiaries to apply, in particular when considering that
limited literacy is widespread among low-income households in Chile (OECD, 2000). It also
complicates administration of these programmes.
... but subsidies do not always reach those most in needAt the same time Chile’s housing subsidies do not always reach those most in need.
Although the targeting of housing subsidies has improved over time, earlier studies show
that a significant proportion of subsidies go to the upper-middle income groups (about
30%) and only about 22% of the beneficiaries come from the bottom quintile (Table 2.5).
This is in part because by definition programmes are not targeted only to the most
vulnerable, as in other OECD countries (Scanlon and Whitehead, 2011), but are more
universal. In addition to poorer households, better-off households belonging to the fourth
and even the fifth income quintile are also eligible (Table 2.3). Maximum eligible house
prices are meant to dissuade wealthier households from applying for subsidies, but this
ceiling is fairly high (about 90 000 USD), and the maximum size of the subsidy is
respectable (15% of the price of the house), which makes applying attractive even for
better-off families. For instance, the average price of an apartment in the Metropolitan
region of Santiago, which also includes very wealthy communes, such as Vitacura, is only
about 30% more expensive than that.
The selection and allocation mechanisms that determine who is eligible and who has
priority to receive housing support have some deficiencies that may help to explain why
some subsidies leak to richer families. There is no household-income ceiling. Instead
eligibility for most programmes is based on discrete cut-off scores based on a proxy means
test (Ficha de Protección Social) – that assigns scores to families based on employment, actual
and imputed potential income, health status and family composition – together with some
basic eligibility conditions, such as minimum savings, lack of homeownership and of prior
housing subsidy receipt (Table 2.3). Evidence suggests that there is a lot of fraud; and the
government is currently working on simplifying the system and implementing better
controls (Chapter 1).
Scores that are used to allocate subsidies are based on a wide range of criteria that
varies from programme to programme. All programmes give points for family size and
socio-economic characteristics. Sometimes, but not always, housing characteristics,
waiting time, savings and the score from the Ficha de Protección Social are also taken into
account. For instance, the government has recently added housing characteristics
(e.g. crowdedness, poor access to basic services, poor building quality) to the list of
eligibility criteria to allocate subsidies for low-income households and this is welcome.
These characteristics are related to true housing needs and are arguably difficult for the
Table 2.5. Recipients of housing subsidies by income quintile (% of total subsidies)
I II III IV V
21.8 23 23 20.1 12.1
Source: Aparici and Sepúlveda (2010) based on CASEN (2003).
OECD ECONOMIC SURVEYS: CHILE © OECD 2012 99
2. BUILDING BLOCKS FOR A BETTER FUNCTIONING HOUSING MARKET IN CHILE
household to manipulate and easy for authorities to verify. But housing characteristics are
not taken into account to allocate subsidies to higher income households. Instead other
features are used, which have little obvious justification from a poverty alleviation point of
view, such as completion of military service (Table 2.3). Although these criteria are meant
to target housing support better, their complexity may also render application more
difficult to understand for poorer households and possibly more costly to administer.
The fact that too many people are eligible may also explain why, regardless of positive
macroeconomic developments and general improvements in affordability, the number of
people waiting for a subsidy has sharply increased over time. The number of applications
for housing subsidies has increased over the last ten years, according to the OECD housing
questionnaire, and the number of savings accounts opened for the purpose of obtaining a
housing subsidy has increased sevenfold since 1990, to more than 3 and ½ million in
December 2010. At the average rate at which subsidies were allocated during the past
10 years (Figure 2.11) the average wait for any kind of subsidy would be more than 25 years,
if all the people with a housing saving account were to be allocated a subsidy.
Making housing subsidies more efficient and equitable through better targetingThe government is making efforts to improve the targeting of housing subsidies. It has
just reformed housing support for the poorest 20% of the population, and redesigned and
increased the number of subsidies for households with incomes above that. As a result, in
2011, 56% of housing subsidies are officially targeted to the first income quintile (through
the Fondo Solidario de Vivienda), which is welcome. Yet the government should consider
further narrowing the targeting of housing subsidies exclusively to low income
households, while reconsidering subsidies that may go to the 40% richest families, as the
middle income housing benefit. Resources are limited and the number of people waiting
for a subsidy greatly exceeds the number of available subsidies. Households in the top
quintiles do not generally have problems getting a mortgage and benefit more from
favourable taxation.
At the same time the government should also ensure that eligibility criteria truly
identify those most in need of housing. Eligibility criteria could be simplified further, by
replacing the proxy means test (Ficha de Protección Social) by information on declared
income, as recommended in Chapter 1 for other social cash transfer programmes. While
this might potentially require substantial investments in authorities’ ability to verify
claims, this would hardly be more expensive than investing in the authorities’ capacity to
verify information in the Ficha de Protección Social.
More should be done to streamline and evaluate the effectiveness of housing support.
Many programmes have been phased out in the past (e.g. progressive housing programme)
and new programmes have been introduced (e.g. Programa con crédito opcional para sectores
medios) without a clear assessment of why the programme needed to be replaced or
whether it had succeeded. This risks undermining the transparency of the system and
public trust in it (Castañeda and Lindert, 2005). Housing subsidies have also been used for
a wide range of objectives: help the poor, increase homeownership, improve the quality of
the housing stock, and encourage the private sector to finance low-income housing. These
are common and natural objectives of housing policies in countries with large housing
deficits. But a housing policy with multiple objectives makes housing support more
difficult to manage, more costly and harder to evaluate. Refocusing public housing support
OECD ECONOMIC SURVEYS: CHILE © OECD 2012100

2. BUILDING BLOCKS FOR A BETTER FUNCTIONING HOUSING MARKET IN CHILE
on helping low-income households would improve upon this. The authorities could also
evaluate ex-post the coverage of subsidies and their effectiveness in improving housing
conditions. They could use existing panel household data (CASEN) to check whether those
who received the subsidy were truly the neediest and whether their housing conditions
significantly improved.
Housing support would also be less complicated as well as easier to administer and to
evaluate if the broad set of subsidies were streamlined. For instance, evidence by Simian
(2010) suggests that the residential leasing subsidy (Leasing Habitacional) is very poorly
targeted and could be phased out. Even if this program was meant to help the poorest, the
number of subsidies is very small, the take up low and money mostly goes to households
in the top two income quintiles.
Housing subsidies have not always led to better living conditionsAt the same time, improvements in housing conditions have sometimes not been
sustainable. To provide housing for those in need and maintain the number of subsidised
units built each year, the government financed small and sometimes poor quality housing
(Vargas, 2006). The deficient quality of construction and upkeep in some cases led to
premature deterioration causing the beneficiaries to slip back into poor housing conditions
(Marcano and Ruprah, 2008).
The government often also bought the cheapest available land without providing the
basic public infrastructure. This concentrated the poor in certain areas, often in the
outskirts, especially in the city of Santiago, where the expansion of the city has been
mainly driven by housing policy (Sabatini et al., 2001; Gilbert, 2004). What is more, rising
land prices meant that construction companies built subsidised housing projects further
and further away from the city centre where land was cheaper, and supplied lower quality
of housing to keep prices low and margins high (Morandé and Gimenez, 2004). This led to
greater inequality, not only in terms of income, but also in education performance.
Santiago’s richest commune has an average household income eight times higher than the
poorest and household heads have twice as many years of education (OECD, 2009). These
inequalities risk being reinforced over generations, in a society where social mobility is
already low (Figure 2.12). For instance, richer municipalities have better education and
achieve better results on basic education performance tests than poorer ones (OECD, 2009).
Poor access to high quality education risks transmitting poverty from generation to
generation.
Given that many subsidised housing residents commute to the centre of Santiago for
work, the peripheral location of subsidised housing has also led to substantial costs in
terms of time, congestion and pollution. About half of all the jobs in the Santiago region,
where over 50% of the Chilean population live, are located in the central communes of
Santiago, Providencia and Las Condes (Rodríguez and Vignoli, 2008). Long commuting
distances not only imply greater costs in terms of money and time for subsidy recipients,
but also greater pollution for all citizens. Air pollution, caused by transport and the use of
small-scale burning of wood or coal, is an important problem in Chile, and in particular in
Santiago, which is one of the most polluted cities in the world. High pollution can lead to a
wide range of diseases and premature deaths (Sanhueza et al., 2006). Some studies even
suggest that high levels of pollution may account for almost half of annual deaths in the
city of Santiago (Ostro, 2008; Mancilla, 2007).
OECD ECONOMIC SURVEYS: CHILE © OECD 2012 101
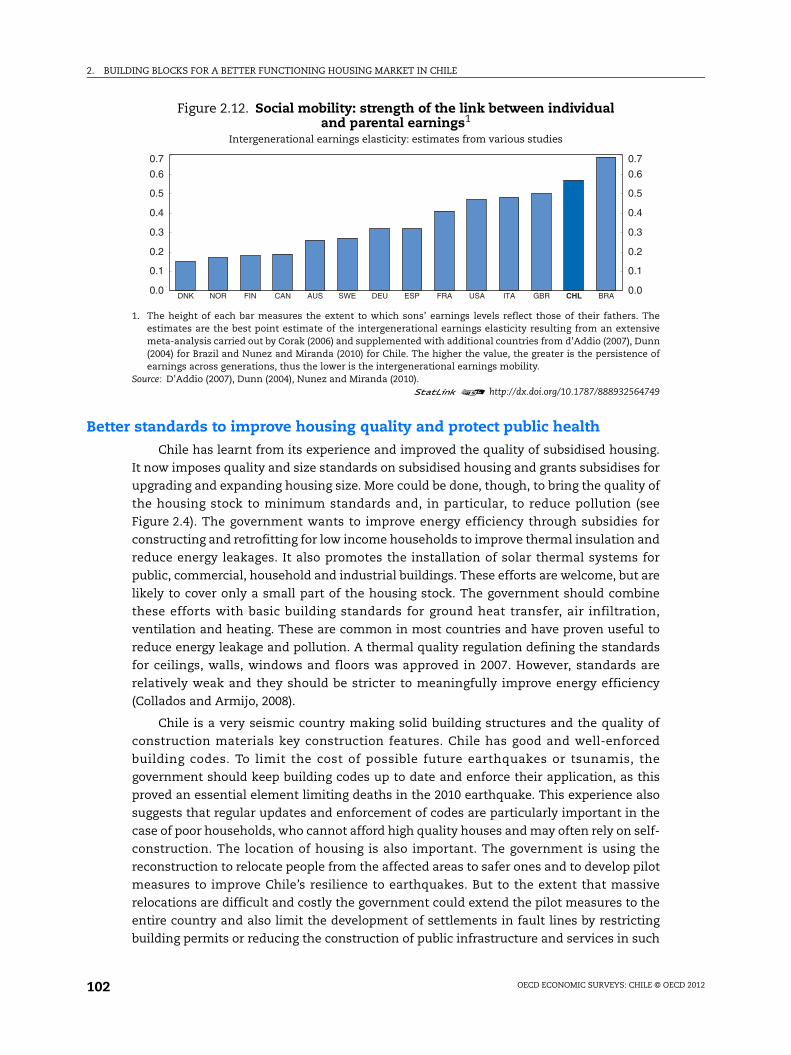
2. BUILDING BLOCKS FOR A BETTER FUNCTIONING HOUSING MARKET IN CHILE
Better standards to improve housing quality and protect public healthChile has learnt from its experience and improved the quality of subsidised housing.
It now imposes quality and size standards on subsidised housing and grants subsidises for
upgrading and expanding housing size. More could be done, though, to bring the quality of
the housing stock to minimum standards and, in particular, to reduce pollution (see
Figure 2.4). The government wants to improve energy efficiency through subsidies for
constructing and retrofitting for low income households to improve thermal insulation and
reduce energy leakages. It also promotes the installation of solar thermal systems for
public, commercial, household and industrial buildings. These efforts are welcome, but are
likely to cover only a small part of the housing stock. The government should combine
these efforts with basic building standards for ground heat transfer, air infiltration,
ventilation and heating. These are common in most countries and have proven useful to
reduce energy leakage and pollution. A thermal quality regulation defining the standards
for ceilings, walls, windows and floors was approved in 2007. However, standards are
relatively weak and they should be stricter to meaningfully improve energy efficiency
(Collados and Armijo, 2008).
Chile is a very seismic country making solid building structures and the quality of
construction materials key construction features. Chile has good and well-enforced
building codes. To limit the cost of possible future earthquakes or tsunamis, the
government should keep building codes up to date and enforce their application, as this
proved an essential element limiting deaths in the 2010 earthquake. This experience also
suggests that regular updates and enforcement of codes are particularly important in the
case of poor households, who cannot afford high quality houses and may often rely on self-
construction. The location of housing is also important. The government is using the
reconstruction to relocate people from the affected areas to safer ones and to develop pilot
measures to improve Chile’s resilience to earthquakes. But to the extent that massive
relocations are difficult and costly the government could extend the pilot measures to the
entire country and also limit the development of settlements in fault lines by restricting
building permits or reducing the construction of public infrastructure and services in such
Figure 2.12. Social mobility: strength of the link between individual and parental earnings1
Intergenerational earnings elasticity: estimates from various studies
1. The height of each bar measures the extent to which sons’ earnings levels reflect those of their fathers. Theestimates are the best point estimate of the intergenerational earnings elasticity resulting from an extensivemeta-analysis carried out by Corak (2006) and supplemented with additional countries from d’Addio (2007), Dunn(2004) for Brazil and Nunez and Miranda (2010) for Chile. The higher the value, the greater is the persistence ofearnings across generations, thus the lower is the intergenerational earnings mobility.
Source: D’Addio (2007), Dunn (2004), Nunez and Miranda (2010).1 2 http://dx.doi.org/10.1787/888932564749
0.0
0.1
0.2
0.3
0.4
0.5
0.6
0.7
0.0
0.1
0.2
0.3
0.4
0.5
0.6
0.7
DNK NOR FIN CAN AUS SWE DEU ESP FRA USA ITA GBR CHL BRA
OECD ECONOMIC SURVEYS: CHILE © OECD 2012102
2. BUILDING BLOCKS FOR A BETTER FUNCTIONING HOUSING MARKET IN CHILE
areas when possible. In the 2010 events most casualties were caused by the tsunami. The
government is working on a national early warning procedure for tsunamis and on
identifying risky coastal areas. Restricting building permits when needed could also be an
option. These measures may increase the price of housing and risk making it less
affordable for low-income households. But there are a number of measures the
government can take to ensure housing supply functions well that are discussed below and
this would help to counteract any upward pressure on prices.
Over the longer term, Chile may also need to develop policies to limit government
contingent liabilities due to natural catastrophes. One third of the damage resulting from
the 2010 disasters was covered by insurance and insurers processed claims relatively
quickly. But, very few houses are covered against earthquakes, about 24% according to
Muir-Wood (2011), imposing a big reconstruction burden on households and eventually on
the state (see Box 2.1). After the earthquake, the insurance regulatory authority
(Superintendencia de Valores y Seguros) reacted by speeding the processing of claims and
temporarily allowing insurers to shorten procedures to accelerate inspections and
payments. A bill presented in the Senate proposes compulsory earthquake insurance
purchase. Its design should emphasize adequate enforcement in order to increase
insurance penetration rates ensuring the schemes viability. In addition, the government
should perhaps consider subsidising the cost of catastrophe insurance for low-income
property owners who cannot afford it or provide some type of state guarantee to reduce the
cost of insurance.
Measures to reduce segregation and avoid poverty trapsThe government is buying some land for subsidised housing in more central locations
as a means to reduce segregation and improve the social mix. This is welcome as OECD
experience suggests that if social housing is not well integrated into different
neighbourhoods it can lead to segregation and poverty traps (Andrews et al. 2011). The new
policy approach may contribute to more mixed neighbourhoods, but reserves of land in
good locations are costly. A complementary and possibly less costly solution would be to
better enforce the existing quotas for subsidised housing, as a number of OECD countries
have done (e.g. Spain, Ireland) with good results. In Chile developers of new projects have
been required to devote at least 5% of land to subsidised housing since 1997, but these are
restricted to few specific locations (Zonas y Proyectos de Desarrollo Urbano Condicionado),
project approvals are lengthy and there is no time limit for compliance (Trivelli, 2011 and
Castillo, 2010). Expanding the existing quotas for subsidised housing to more new
development projects, favouring both rental and owner-occupied low-income housing,
could contribute to better located subsidised housing and more diverse communities.
Speeding up project approvals and imposing a time limit would also help. The government
has also adjusted subsidies to allow poor households to buy houses in better locations.
However, reducing segregation can only go so far. Improving infrastructure, public
transport and social services in poor neighbourhoods will also be necessary, as discussed
below.
As a complementary measure to speed up construction and make housing affordable
for poorer households the government plans to extend the boundary of Santiago
(metropolitan region) and add 13% of what is mostly farm land. While this measure can
encourage additional supply and increase affordability, it may reinforce residential
segregation as most poor people already live in peripheral areas. It can also increase
OECD ECONOMIC SURVEYS: CHILE © OECD 2012 103

2. BUILDING BLOCKS FOR A BETTER FUNCTIONING HOUSING MARKET IN CHILE
commuting costs and pollution more if not accompanied by improved public services and
infrastructure. An alternative to free land would be to encourage the development of waste
or underused lands within the region of Santiago. Estimates suggest these are substantial
and approximately of the same total size as what the expansion of the city boundary would
bring (Trivelli, 2011). Redeveloping under-used land has the advantage of sparing land for
other uses, such as agriculture or green areas, at the same time as it helps regenerate the
city probably at lower infrastructure costs than greenfield investments. Such land reserves
are typically located in areas where public services already exist, so the government often
needs to spend less in making them habitable. If the government were to pursue the
expansion of the boundary of Santiago, it should require developers to contribute with
some land for subsidised housing (to buy and to rent) when the new boundary is
negotiated. The UK is a good example of successful employment of the land-use planning
system to ensure that new land development projects include affordable housing. Thanks
to this approach owners and developers contributed to finance its costs (Scanlon and
Whitehead, 2011).
There are a number of other factors that may further be slowing the responsiveness of
housing supply. Chile should tackle these to ensure a good match between housing
construction and demand. The government plans to speed up the allocation of building
permits, which currently takes up to 450 days, slowing down construction projects.
Another issue is lengthy and cumbersome reforms of land planning regulations, which
have also slowed construction projects in the past (Echenique, 2004). The land planning law
(Ley General de Vivienda y Urbanismo) has not been substantially modified for the past forty
years and may be seriously outdated. The authorities should speed up the approval of land
planning regulations as its efficient design and enforcement. These measures will improve
the responsiveness of housing construction to changes in price signals and ensure that
public support, either through direct subsidies or tax advantages, does not get capitalized
into housing prices.
The responsiveness of housing supply is also affected by the degree of competition in
the residential construction industry (Barker, 2004). Evidence suggests that competition in
the construction industry is low in Chile relative to other non-manufacturing industries,
and in particular among large construction companies (Duffau and Pasten, 2009). This is
mostly due to high barriers to entry, such as high sunk costs of investment, but also
because public infrastructure tendering rules give advantages to large firms. There is also
some evidence of collusive behaviour in the residential construction market in Santiago, in
particular in areas where low-income households live (Lefort and Vargas, 2011). Low
competition in the residential construction sector can lead to higher housing prices and
lower supply than under more intense competition. Under lower competitive pressures
construction companies may also have fewer incentives to improve housing quality. The
government should ensure competition policy and anti-trust rules are effective and hinder
collusive behaviour in the construction sector.
Housing support excessively promotes homeownershipIncreasing homeownership has been among the main objectives of Chile’s housing
policy over the past 30 years. There is no direct housing support for tenants and
homeowners are directly and indirectly supported by the state. While most OECD countries
grant a favourable tax treatment to owner-occupied housing, Chile’s housing subsidies
focused exclusively on ownership are in sharp contrast with housing support in most
OECD ECONOMIC SURVEYS: CHILE © OECD 2012104
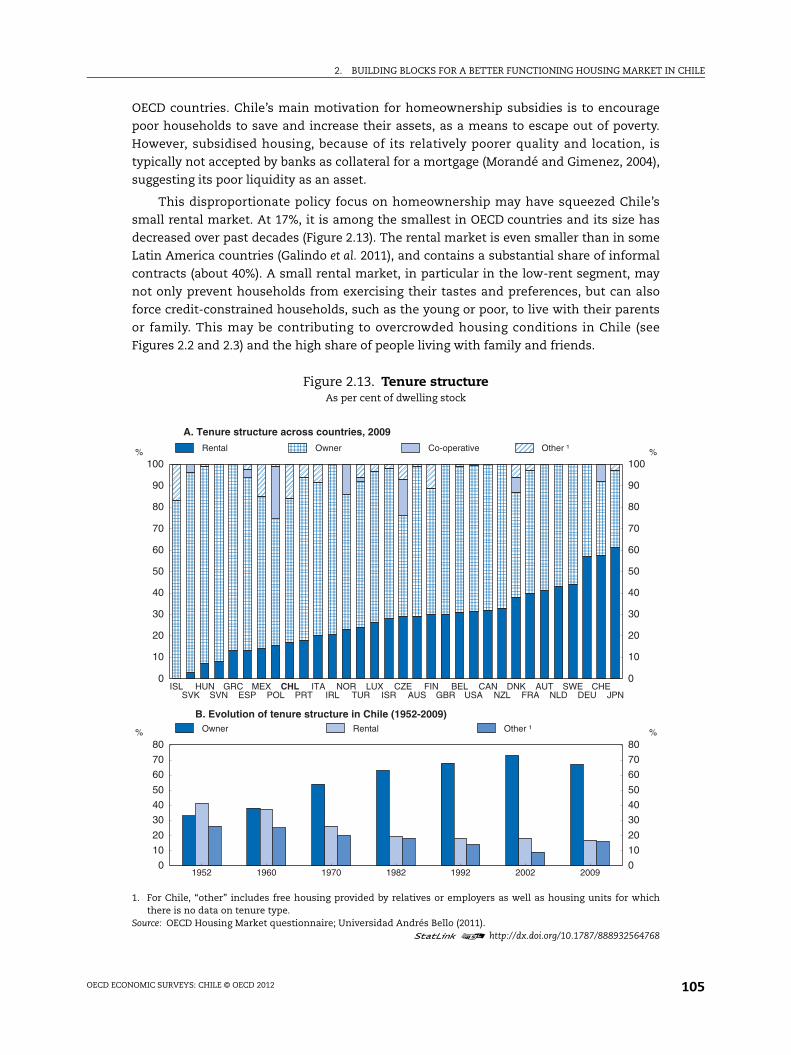
2. BUILDING BLOCKS FOR A BETTER FUNCTIONING HOUSING MARKET IN CHILE
OECD countries. Chile’s main motivation for homeownership subsidies is to encourage
poor households to save and increase their assets, as a means to escape out of poverty.
However, subsidised housing, because of its relatively poorer quality and location, is
typically not accepted by banks as collateral for a mortgage (Morandé and Gimenez, 2004),
suggesting its poor liquidity as an asset.
This disproportionate policy focus on homeownership may have squeezed Chile’s
small rental market. At 17%, it is among the smallest in OECD countries and its size has
decreased over past decades (Figure 2.13). The rental market is even smaller than in some
Latin America countries (Galindo et al. 2011), and contains a substantial share of informal
contracts (about 40%). A small rental market, in particular in the low-rent segment, may
not only prevent households from exercising their tastes and preferences, but can also
force credit-constrained households, such as the young or poor, to live with their parents
or family. This may be contributing to overcrowded housing conditions in Chile (see
Figures 2.2 and 2.3) and the high share of people living with family and friends.
Figure 2.13. Tenure structureAs per cent of dwelling stock
1. For Chile, “other” includes free housing provided by relatives or employers as well as housing units for whichthere is no data on tenure type.
Source: OECD Housing Market questionnaire; Universidad Andrés Bello (2011).1 2 http://dx.doi.org/10.1787/888932564768
0
10
20
30
40
50
60
70
80
90
100 %
0
10
20
30
40
50
60
70
80
90
100%
ISL HUN GRC MEX CHL ITA NOR LUX CZE FIN BEL CAN DNK AUT SWE CHESVK SVN ESP POL PRT IRL TUR ISR AUS GBR USA NZL FRA NLD DEU JPN
A. Tenure structure across countries, 2009
Rental Owner Co-operative Other ¹
0
10
20
30
40
50
60
70
80 %
0
10
20
30
40
50
60
70
80 %
1952 1960 1970 1982 1992 2002 2009
B. Evolution of tenure structure in Chile (1952-2009)Owner Rental Other ¹
OECD ECONOMIC SURVEYS: CHILE © OECD 2012 105
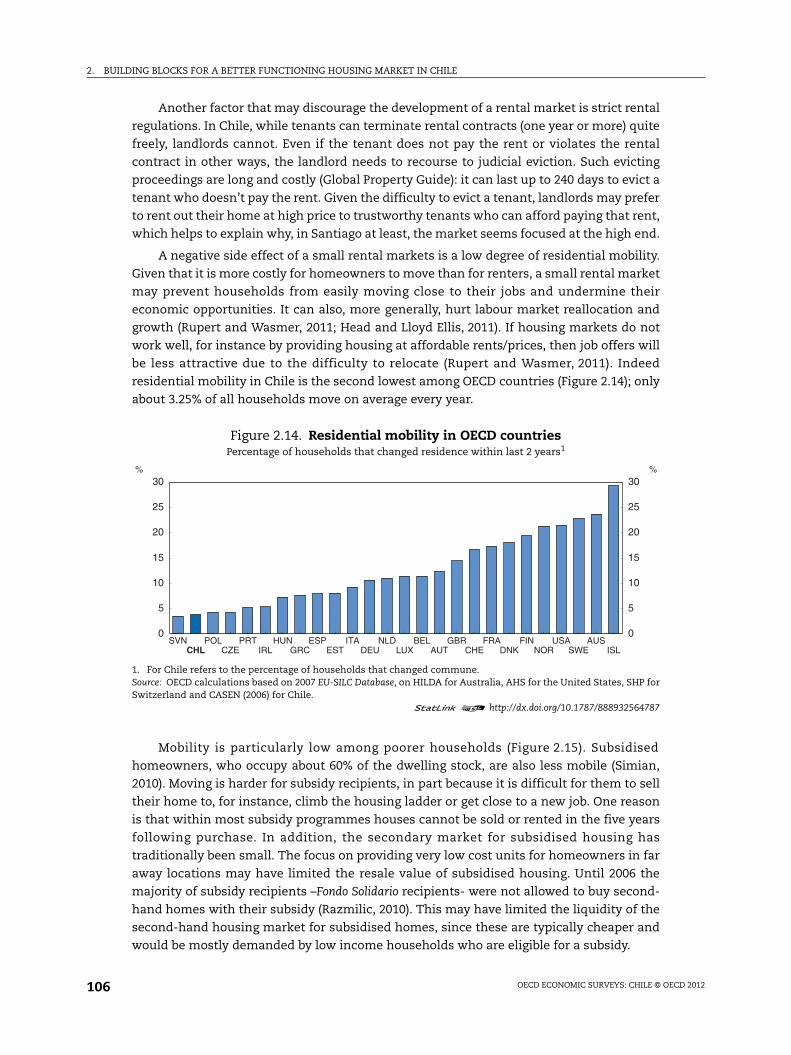
2. BUILDING BLOCKS FOR A BETTER FUNCTIONING HOUSING MARKET IN CHILE
Another factor that may discourage the development of a rental market is strict rental
regulations. In Chile, while tenants can terminate rental contracts (one year or more) quite
freely, landlords cannot. Even if the tenant does not pay the rent or violates the rental
contract in other ways, the landlord needs to recourse to judicial eviction. Such evicting
proceedings are long and costly (Global Property Guide): it can last up to 240 days to evict a
tenant who doesn’t pay the rent. Given the difficulty to evict a tenant, landlords may prefer
to rent out their home at high price to trustworthy tenants who can afford paying that rent,
which helps to explain why, in Santiago at least, the market seems focused at the high end.
A negative side effect of a small rental markets is a low degree of residential mobility.
Given that it is more costly for homeowners to move than for renters, a small rental market
may prevent households from easily moving close to their jobs and undermine their
economic opportunities. It can also, more generally, hurt labour market reallocation and
growth (Rupert and Wasmer, 2011; Head and Lloyd Ellis, 2011). If housing markets do not
work well, for instance by providing housing at affordable rents/prices, then job offers will
be less attractive due to the difficulty to relocate (Rupert and Wasmer, 2011). Indeed
residential mobility in Chile is the second lowest among OECD countries (Figure 2.14); only
about 3.25% of all households move on average every year.
Mobility is particularly low among poorer households (Figure 2.15). Subsidised
homeowners, who occupy about 60% of the dwelling stock, are also less mobile (Simian,
2010). Moving is harder for subsidy recipients, in part because it is difficult for them to sell
their home to, for instance, climb the housing ladder or get close to a new job. One reason
is that within most subsidy programmes houses cannot be sold or rented in the five years
following purchase. In addition, the secondary market for subsidised housing has
traditionally been small. The focus on providing very low cost units for homeowners in far
away locations may have limited the resale value of subsidised housing. Until 2006 the
majority of subsidy recipients –Fondo Solidario recipients- were not allowed to buy second-
hand homes with their subsidy (Razmilic, 2010). This may have limited the liquidity of the
second-hand housing market for subsidised homes, since these are typically cheaper and
would be mostly demanded by low income households who are eligible for a subsidy.
Figure 2.14. Residential mobility in OECD countriesPercentage of households that changed residence within last 2 years1
1. For Chile refers to the percentage of households that changed commune.Source: OECD calculations based on 2007 EU-SILC Database, on HILDA for Australia, AHS for the United States, SHP forSwitzerland and CASEN (2006) for Chile.
1 2 http://dx.doi.org/10.1787/888932564787
0
5
10
15
20
25
30 %
0
5
10
15
20
25
30%
SVN POL PRT HUN ESP ITA NLD BEL GBR FRA FIN USA AUSCHL CZE IRL GRC EST DEU LUX AUT CHE DNK NOR SWE ISL
OECD ECONOMIC SURVEYS: CHILE © OECD 2012106
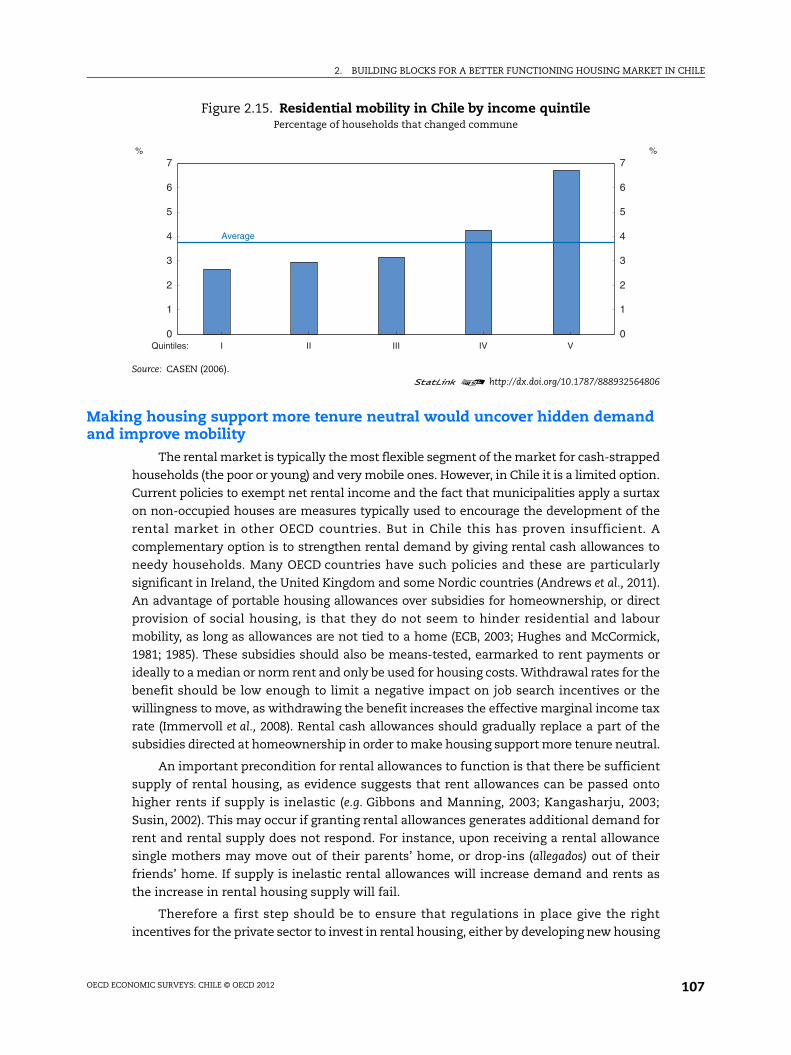
2. BUILDING BLOCKS FOR A BETTER FUNCTIONING HOUSING MARKET IN CHILE
Making housing support more tenure neutral would uncover hidden demand and improve mobility
The rental market is typically the most flexible segment of the market for cash-strapped
households (the poor or young) and very mobile ones. However, in Chile it is a limited option.
Current policies to exempt net rental income and the fact that municipalities apply a surtax
on non-occupied houses are measures typically used to encourage the development of the
rental market in other OECD countries. But in Chile this has proven insufficient. A
complementary option is to strengthen rental demand by giving rental cash allowances to
needy households. Many OECD countries have such policies and these are particularly
significant in Ireland, the United Kingdom and some Nordic countries (Andrews et al., 2011).
An advantage of portable housing allowances over subsidies for homeownership, or direct
provision of social housing, is that they do not seem to hinder residential and labour
mobility, as long as allowances are not tied to a home (ECB, 2003; Hughes and McCormick,
1981; 1985). These subsidies should also be means-tested, earmarked to rent payments or
ideally to a median or norm rent and only be used for housing costs. Withdrawal rates for the
benefit should be low enough to limit a negative impact on job search incentives or the
willingness to move, as withdrawing the benefit increases the effective marginal income tax
rate (Immervoll et al., 2008). Rental cash allowances should gradually replace a part of the
subsidies directed at homeownership in order to make housing support more tenure neutral.
An important precondition for rental allowances to function is that there be sufficient
supply of rental housing, as evidence suggests that rent allowances can be passed onto
higher rents if supply is inelastic (e.g. Gibbons and Manning, 2003; Kangasharju, 2003;
Susin, 2002). This may occur if granting rental allowances generates additional demand for
rent and rental supply does not respond. For instance, upon receiving a rental allowance
single mothers may move out of their parents’ home, or drop-ins (allegados) out of their
friends’ home. If supply is inelastic rental allowances will increase demand and rents as
the increase in rental housing supply will fail.
Therefore a first step should be to ensure that regulations in place give the right
incentives for the private sector to invest in rental housing, either by developing new housing
Figure 2.15. Residential mobility in Chile by income quintilePercentage of households that changed commune
Source: CASEN (2006).1 2 http://dx.doi.org/10.1787/888932564806
0
1
2
3
4
5
6
7 %
0
1
2
3
4
5
6
7%
Quintiles: I II III IV V
Average
OECD ECONOMIC SURVEYS: CHILE © OECD 2012 107

2. BUILDING BLOCKS FOR A BETTER FUNCTIONING HOUSING MARKET IN CHILE
for rent, or by upgrading existing housing units. Rental regulations currently protect tenants
more than landlords and this should be redressed. The government could promote the use
of standard written rental contracts so that landlords and tenants understand their rights
and responsibilities. This could contribute to reduce informal rental contracts. Evicting a
tenant who does not pay the rent should be made less costly by, for instance, speeding up
court procedures, which are currently quite slow. More legal certainty coupled with the
security of rental income provided by the government rental allowance could contribute to
stimulate investment in housing for rent to low income households.
Improving public transport and reducing commuting costs which are substantial, in
particular in Santiago, where most of the population live, would also facilitate mobility and
access to jobs, while contributing to improve the living conditions in poorer
neighbourhoods. The government has done great efforts to improve the functioning of the
public transport system in Santiago (Transantiago), which have borne some results. For
instance, accidents, which used to be very common before Transantiago was set up in 2007,
have decreased by more than half. Air pollution has also decreased substantially with the
introduction of new more environmentally friendly buses (Figueroa et al., 2011). However,
some deficiencies still remain. Commuting times have increased up to 50 minutes in one
direction according to recent estimates (Universidad Andrés Bello, 2011). Some areas of the
city are not well covered, which forces commuters to change several times lines or means
of transport increasing commuting time and costs. This penalizes poor households most.
The government has recently extended the coverage of a transport allowance for children
to low-income households, and this is welcome as such support can improve their mobility
and access to jobs. More should, however, be done to reduce commuting times and ensure
a good coverage of public transport in Santiago. Improving key services in poor
neighbourhoods, such as schools, and health services will also be a key ingredient to
reduce poverty and inequalities (Chapter 1).
Owner-occupied housing receives a preferential tax treatmentThe tax code gives incentives to own rather than to rent in Chile, with relatively light
taxation of housing relative to other investments. Tables 2.A1.1 and 2.A1.2 in the Appendix
compares the taxation of housing across OECD countries. As in most OECD countries, the
service income provided by owner-occupied housing (i.e. imputed rents) is not taxed as
income (Table 2.A1.1), but mortgage interest is deductible from taxable income up to a
generous limit (of about USD 7 600). Chile has housing property taxes (Impuesto Territorial)
that could in principle offset mortgage interest deductibility, but they have many
exemptions and are not large enough. Private households do not also pay capital gains tax
on the sale of any real state property, as long as they keep it for more than a year and if the
transaction is not habitual or between related parties.
Houses that are smaller than 140 square meters, which are 80% of the country’s stock
and most new construction, benefit from favourable tax treatment (Decreto con Fuerza de Ley
No. 2, DFL2), although the government has recently limited these to two houses per owner
effective for properties purchased after 2010. Private landlords’ rental income from those
so-called DFL2 properties is income tax free. DFL2 houses are also exempted from
inheritance tax if they are new and acquired through a real estate agent, and they are
subject to property taxes at only half the usual rate for up to 20 years. Exemptions from
inheritance tax create an asymmetry as other assets are taxed.
OECD ECONOMIC SURVEYS: CHILE © OECD 2012108

2. BUILDING BLOCKS FOR A BETTER FUNCTIONING HOUSING MARKET IN CHILE
Housing construction also benefits from a reduced VAT rate. This creates a distortion
relative to other construction and consumer goods that are taxed at the standard rate. It is
more expensive to administer, and can lead to tax evasion and avoidance. Overall these
preferential tax treatments translate into 0.5% GDP foregone revenue, according to
government figures (Servicio de Impuestos Internos).
Most OECD countries grant a preferential tax treatment to owner-occupied housing
based on the belief that homeownership has positive spillovers for society. For instance,
homeownership has been linked to better education outcomes for children, a greater
engagement in the community and higher probability of voting. Some studies show that
children from homeowners have better test scores and behaviour than renters’ children
(Haurin et al., 2002). Other studies show that homeowners are more active and informed
citizens and create more stable neighbourhoods (Di Pasquale and Glaeser, 1999). These
findings, however, tend to suffer from identification problems and it is not clear what is the
cause and the effect. For instance, children of homeowners may perform better at school
than those of renters simply because of unobserved socio-economic factors.
On the other hand, there is strong evidence that tax subsidies, such as mortgage
interest deductibility, can have negative side-effects. They tend to encourage excessive
leverage and get capitalized into house prices. Where housing supply is tight and demand
strong, such fiscal subsidies can also have a redistributive element, generating capital
gains for current owners at the expense of newcomers and actually hinder their access to
housing (Wolswijk, 2010). They are also regressive, both because wealthier households are
more likely to be homeowners in the absence of tax subsidies, and because they are subject
to higher marginal tax rates. For instance, most Chileans do not benefit from mortgage
interest deductibility, as 82% of tax payers fall below the income tax threshold. As a result,
the deduction provides larger benefits to wealthier households, who would probably buy
homes anyway, than to poorer ones, and has at best a small effect on homeownership.
A tax reform to reduce distortions, improve equity and promote a more balanced housing market
A reform to restore neutrality between housing and other investments would ideally
involve taxing housing income in the same way as investments in other assets, thus taxing
owners’ net imputed rental income and private landlords’ net rental income. This section
discusses the practical issues surrounding such tax reform.
Within a comprehensive income tax system, owner-occupied imputed rental income
should be taxed in the same way as other investment goods, with mortgage interests and
other running expenses (e.g. depreciation, property taxes) being deductible. In practice,
taxing imputed rents is complicated by the difficulties in estimating the rental value. Thus
few OECD countries do it (Table 2.A1.1), and those that do often substantially
underestimate imputed rents.A second-best solution is either to eliminate mortgage
interest deductibility or to scale-up taxes on immovable property sufficiently to equalise
what would be the taxation of net imputed rental income (on the assumption that imputed
rents are proportional to property value).
Chile should increase its revenues from residential property taxes (Impuesto Territorial).
This could offset the generous mortgage subsidy and go towards a more equal treatment of
housing relative to other investments. Revenues are low, in international comparison
(Figure 2.16), although such taxes are relatively efficient, easier to enforce and involve
OECD ECONOMIC SURVEYS: CHILE © OECD 2012 109
2. BUILDING BLOCKS FOR A BETTER FUNCTIONING HOUSING MARKET IN CHILE
fewer distortions. Enhancing property tax revenues is also important because Chilean
municipalities greatly rely on property taxes to finance key public services such as
education and basic health care, which fall under local responsibility (OECD, 2009). About
one third of total municipal funding comes from the Fondo Común Municipal, a national
revenue sharing mechanism set up in 1979 as a counterpart of the decentralization of
responsibilities towards municipalities. Half of the fund’s resources come from residential
property taxes and most municipalities derive most of their funding from it (Horst, 2009).
The resulting degree of equalisation is, however, weak compared with other
OECD countries and leaves some of the poorer municipalities in a weak position to finance
the minimum provision of goods and services (Table 2.6). Taxes on immovable property are
also a good way to finance local expenditures. They are fairly predictable sources of
funding, given that there are relatively less cyclical fluctuations in the tax base, and there
is less scope for tax avoidance (Valenzuela, 2008).
Property tax revenues are low partly because of the many loopholes and exemptions
in the property tax. Approximately 65% of properties do not pay any property tax at all, and
this reduces tax revenues by half according to government estimates (Servicio Impuestos
Internos, 1st semester 2011). Properties below a certain taxable price level (about
USD 34 523) are exempted. Besides owners of DFL2 houses a long list of public and private
institutions is also fully exempt from real estate taxes or pays, at most, 50% of the property
taxes (Valenzuela, 2010). Among those that receive the largest breaks are the police and the
army (Valenzuela, 2008), which has little justification in terms of income distribution or
poverty objectives. The government should phase out exemptions for DFL2 houses, and
reconsider the long list of public and private institutions that are exempt.
Property tax rates are also possibly too low. The 2006 revenue act (Ley 20.033, Ley de
rentas II) made reassessments of property values obligatory at least every five years. This
was an important step forward, as before that reassessments took place only every 10
years. But the law also capped the growth in aggregate property tax revenues to 10%. To
keep the increase in national revenues below this threshold, tax rates are typically lowered
and the minimum taxable price level is increased. In the 2006 revision, tax rates were
reduced by 2 percentage points across the board and the exempted price level increased by
Figure 2.16. Recurrent taxes on residential immovable property1
As per cent of GDP, 2009
1. 2008 for Australia, Greece, Mexico, Netherlands, Poland and Portugal.Source: OECD, Tax Database and Development Center, Latin American Revenue Statistics.
1 2 http://dx.doi.org/10.1787/888932564825
0.0
0.5
1.0
1.5
2.0
2.5
3.0
3.5
4.0%
0.0
0.5
1.0
1.5
2.0
2.5
3.0
3.5
4.0%
LUX CZE CHE AUT HUN BRA SVK SVN CHL PRT ESP KOR DNK IRL NZL FRA USA GBRGRC MEX TUR NOR ARG BEL DEU FIN NLD ITA SWE POL AUS ISL JPN ISR CAN
OECD ECONOMIC SURVEYS: CHILE © OECD 2012110

2. BUILDING BLOCKS FOR A BETTER FUNCTIONING HOUSING MARKET IN CHILE
30% leading to a revenue loss of USD 30 million in 2006 (Joratt, 2009). The government
should phase out the cap on the growth of aggregate property tax revenues. To increase
public acceptance of higher property taxes, the government could keep the current gradual
increases in individual taxes following a reassessment and even consider special
arrangements to reduce liquidity constraints for people with low incomes or illiquid assets.
These could include a better assessed minimum taxable price level.
If raising property taxes sufficiently is politically too difficult, an alternative is to phase
out mortgage interest deductibility. Many OECD countries have done this over recent years
(e.g. Australia, Canada, Germany, Spain, United Kingdom). Phasing out mortgage interest
deductibility is not easy either, not least because such breaks are typically quite generous
and construction and real estate lobbies are very powerful in most countries. It may be
easier for Chile though. As most Chileans do not benefit from the mortgage subsidy,
opposition may be weaker. To facilitate its political acceptance and to prevent sharp
changes in property values and household cash flows, the government should phase it out
gradually. It could for instance cap the mortgage interest deduction further, or limit the
rate at which it is deducted.
The government should also phase out rental income exemptions for the so-called
DFL2 properties. Deductions of all costs involved in producing that income should be
allowed, in the same way as with income from other investments (e.g. shares or investment
in small businesses). Likewise, DFL2 properties should be subject to the inheritance tax, as
are other assets in Chile and in line with common practice in the OECD (Table 2.A1.2).
Creating a good and flexible framework for housing construction and tenant-landlord
Table 2.6. Fiscal revenues per capita before and after equalisation
Highest capacity/lowest capacity2
Before equalization After equalization
Federal/ regional countries
Australia 1.3 1
Canada 2.4 1.7
Germany1 1.7 1.1
Spain 2.1 1.4
Switzerland 3.8 2.5
Unitary countries
Denmark 2.2 2
Finland 1.8 1.1
Norway 2.2 1.2
Japan 3.1
Sweden 1.4 1.1
Portugal 12.7 2.1
Turkey 85.6 1.7
Chile 20.6 2.3
1. 2005 for Germany, 2010 for Chile, 2004 for all other countries; the data show actual revenues for Chile and revenuecapacity for all other countries.
2. Ratio of maximum and minimum fiscal capacity of subnational governments before and after equalisation. Forfederal/regional countries the indicators are calculated for the state/regional level. For unitary countries revenuesper capita are averaged by decile. In these cases the table shows revenues per capita of the richest decile as a ratioof revenues per capita of the poorest decile.
Source: Bloechliger and Charbit (2008), Sistema Nacional de Información Municipal for Chile.
OECD ECONOMIC SURVEYS: CHILE © OECD 2012 111

2. BUILDING BLOCKS FOR A BETTER FUNCTIONING HOUSING MARKET IN CHILE
relations, as suggested above, would counteract any negative effects that higher taxation
may have on housing supply.
Exemptions from capital gains on property sales are also unusually generous. While
most OECD countries exempt capital gains from the sale of the principal residence, they
generally do tax capital gains on secondary homes to establish neutrality relative to other
assets that pay capital gains and avoid diverting savings excessively towards housing
(Table 2.A1.1). In a way, capital gains tax exemptions for housing property are less likely to
create distortions, given that other saving vehicles also have tax advantages (pension
funds, and saving funds), and a wide range of shares are exempt from capital gains. This
favourable treatment, however, implies a tax break for relatively affluent households who
own more expensive houses, it complicates the tax code and facilitates tax planning. The
government should consider limiting exemptions to capital gains taxation. While this may
limit or lock in some types of investment, it would make for a more neutral tax system that
is easier to administer with fewer opportunities for tax avoidance.
The reduced VAT rate for housing construction should be capped further. The tax
benefit was capped in 2009 for properties below a certain price (4 500 UF, USD 209 804),
which is a step in the right direction. But the maximum price threshold is still high. The
benefits are also greater for more expensive properties. Although neutrality considerations
would support charging the standard VAT on all new construction, this would reduce
housing supply incentives for low cost housing in the short term, which is not desirable,
given that poorer households have greater housing needs (Figure 2.3). The government
should however consider capping further the reduced VAT rate for housing construction as
this would make the tax benefit less regressive and would contribute to reducing fiscal
costs.
Box 2.3. Recommendations to improve the functioning of Chile’s housing market
● Improve targeting of housing subsidies to low-income households.
● Over time redirect some of the housing subsidies to means-tested rental allowances forlow-income tenants.
● Better integrate subsidised housing into wealthier neighbourhoods, encourage thedevelopment of underused land, better enforce subsidised housing building quotas andinvest more in infrastructure, public transport and social services in poorerneighbourhoods.
● Upgrade thermal and energy efficiency standards for buildings and extend limits toconstruction in fault lines and risky coastal areas to the entire country.
● Further reduce tax distortions in favour of housing by either increasing real state taxrates or phasing out mortgage interest deductibility. Tax rental income in the same wayas investment in other assets, and make all houses subject to inheritance tax.
● Make supply more responsive to demand by speeding the reforms of land planning andallocation of building permits, and ensuring the rental market works well, by strikingthe right balance between regulation that safeguards tenants’ and landlords’ rights.
OECD ECONOMIC SURVEYS: CHILE © OECD 2012112

2. BUILDING BLOCKS FOR A BETTER FUNCTIONING HOUSING MARKET IN CHILE
Bibliography
Adonis, M. (2009), “Contaminación de Interiores en la Pintana”, 70 Seminario Internacional, ArquitecturaBioclimática, Energía y Salud, Facultad de Arquitectura y Urbanismo, Universidad Central de Chile.
American Red Cross (2011), “Report on the 2010 Chilean Earthquake and Tsunami Response,” USDepartment of Interior, and US Geological Survey.
André, C. (2010), “Improving the Functioning of the Housing Market in the United Kingdom”, OECDEconomics Department Working Papers No. 867, OECD Publishing.
Andrews, D., A. Caldera Sánchez and Å. Johansson (2011), “Housing Markets and Structural Policies inOECD countries”, OECD Economics Department Working Paper No. 836, January 2011.
Aparici, G. and F. Sepúlveda (2010), “Mercado de Financiamiento de los hogares en el desarrollo de lacrisis financiera de 2008/2009”, Central Bank of Chile Working Paper No. 591.
Barker, K. (2004), Review of Housing Supply.
Castañeda, T. and K. Lindert (2005), “Designing and Implementing Household Targeting Systems:Lessons from Latin America and the United States”, The World Bank, Social Protection Discussion PaperNo. 526, 69 pp., Washington, DC.
Castillo, C., M.J. (2010), “Producción y gestión habitacional de los pobladores: Participación desde abajoen la construcción de vivienda y barrio en Chile”, Federación Iberoamericana de Ombudsman.
Central Bank of Chile (2009), “Endeudamiento de los Hogares en Chile: Análisis e Implicancias para laEstabilidad Financiera”, Banco Central de Chile.
Central Bank of Chile (2010), “Informe de Política Monetaria, Marzo”, Banco Central de Chile.
Collados, E. and G. Armijo (2008), “Predicting the Impacts of an Energy Refurbishing Programme inChile: More than Energy savings”, in Handbook of Sustainable Building Design and Engineering,Earthscan Ltd.
DiPasquale, D. and E. Glaeser (1999), “Incentives and Social Capital: Are Homeowners Better Citizens?”,Journal of Urban Economics, 45(2): pp. 354-384.
Duffau, A. and S. Pasten (2010), “Análisis de competencia del sector de la construcción chileno y susprocesos de licitaciones públicas de contratos de obras: Estructura, Agentes y Prácticas”, FiscalíaNacional Económica.
ECB (2003), “Structural Factors in the EU Housing Markets”, European Central Bank.
Echenique, M. (2004), “Crecimiento económico y mercado de suelo urbano: estudio comparativo denueve ciudades”, in DÍAZ y JIMÉNEZ (eds.), Concesiones y Suelo Urbano: Dos Claves para laInversión, SANTIAGO: Cámara Chilena de la Construcción.
Figueroa, E., et al. (2011), “Los impactos del Transantiago en la contaminación de Santiago: unaaproximación econométrica”, Departamento de Economía Universidad de Chile.
Galindo, A., Rebucci, Warnock and Warnock (2011), “Housing Finance in Latin America and theCaribbean”, forthcoming IDB Working Paper.
Gibbons, S. and A. Manning (2003), “The Incidence of UK Housing Benefit: Evidence from the 1990sReforms,” Centre for Economic Performance Working Paper, No. 597, London School of Economics andPolitical Science.
Gilbert, A. (2004), “Helping the poor through housing subsidies: lessons from Chile, Colombia andSouth Africa”, Habitat International, Vol. 28, Issue 1, March 2004, 13-40.
Haurin, D.R., T.L. Parcel and R.J. Haurin (2002), “The Impact of Homeownership on Child Outcomes”,Low Income Homeownership Working Paper Series Vol. 1, No. 14, Joint Center for Housing Studies,Harvard University.
Head, A., and H.L. Ellis (2011), “Housing Liquidity, Mobility, and the Labour Market”, Department ofEconomics Working Papers, No. 1197, Queen’s University.
Horst, B. (2009), “Fuentes de financiamiento para gobiernos subnacionales y descentralización fiscal”,en Un Mejor Estado: Propuestas de Modernización y Reforma, Consorcio para la Reforma del Estado,Santiago de Chile.
Hughes, G. and B. McCormick (1985), “Migration Intentions in the UK Which Households Want toMigrate and Which Succeed?”, The Economic Journal, Vol. 95, Supplement: Conference Papers,pp. 113-123.
OECD ECONOMIC SURVEYS: CHILE © OECD 2012 113

2. BUILDING BLOCKS FOR A BETTER FUNCTIONING HOUSING MARKET IN CHILE
Hughes, G. and B. McCormick (1981), “Do Council Housing Policies Reduce Migration BetweenRegions?”, The Economic Journal, Vol. 91 (December), pp. 919-937.
Immervoll, H. et al. (2008), “An Evaluation of the Tax-Transfer Treatment of Married Couples inEuropean Countries”, EPRU Working Paper Series 2008/3.
Inter-American Development Bank (2007), “Promoting Private Sector Participation in Low IncomeHousing Finance: Diagnosis and Policy Recommendations for Latin America and the Caribbean”.
Joratt, M. (2009), “La Tributación Directa en Chile: Equidad y Desafios”, CEPAL, Serie Macroeconomíadel Desarrollo No. 92, División de Desarrollo Económico.
Kangasharju, A. (2003), “Maksaako Asumisttuen Saaja Muita Korkeampaa Vuokraa” (Do the Receivers ofHousing Allowance Pay a Higher Rent?), Discussion Paper No. 101, Government Institute forEconomic Research (VATT).
Kovacs, P. (2010), “Reducing the Risk of Earthquake Damage in Canada: Lessons from Haiti and Chile,”Institute for Catastrophic Loss Reduction Working Paper No. 49.
Lefort and Vargas (2011), “Tacit collusion in the Santiago Housing Market”, Inter-American DevelopmentBank Working Papers No. 260.
Lex Mundi (2008), “Security over Collateral”, José María Eyzaguirre B. Claro & Cia.
Mancilla (2007), “Exceso de morbilidad respiratoria en niños y adultos mayores en una comuna deSantiago con alta contaminación atmosférica por partículas”, Revista Médica de Chile, Vol. 135, No. 2,Santiago.
Marcano and Ruprah (2008), “A Meta Impact Assessment of Housing Programmes in Chile”, WorkingPaper: OVE/WP-02/07, Office of Evaluation and Oversight, Inter-American Development Bank.
Matus, J. et al. (2010), “Caracterización de la Deuda Financiera de los Hogares Chilenos”, Banco Centralde Chile, forthcoming.
Micco, A. and E. Parrado (2011), “Understanding Housing Finance in Chile”, Inter-American DevelopmentBank Working Paper, forthcoming.
Mideplan (2011), “Encuesta Post-terremoto: Principales resultados, efectos en la calidad de vida de lapoblación afectada por el tsunami y el terremoto”.
Ministerio de Vivienda y Urbanismo (MINVU) (2010), “Cuenta sectorial”.
Ministry of Finance (2010), “Desafíos del Terremoto: Reconstrucción y su Financiamiento”.
Ministry of Finance (2011), “Programa de Reconstrucción del Terremoto y Maremoto del 27 de Febrerode 2010, Resumen Ejecutivo”.
Morandé, F. and C. García (2004), “Financiamiento de la vivienda en Chile”, Inter-American DevelopmentBank Working Paper No. 502.
Muir-Wood, R. (2011), “Designing Optimal Risk Mitigation and Risk Transfer Mechanisms to Improvethe Management of Earthquake Risk in Chile”, OECD Working Papers on Finance, Insurance and PrivatePensions, No. 12, OECD Publishing.
OECD (2000), “Literacy in Information Age – Final Report of the International Adult Literacy Survey”,OECD, Paris.
OECD (2004), “Large-scale Disasters. Lessons learned”, OECD, Paris.
OECD (2009), “OECD Territorial Review of Chile”, OECD Publishing.
Ozler, I. (2011), “The Concertación and Homelessness in Chile Market-based Housing Policies andLimited Popular Participation”, Latin American Perspectives.
Pardo, C.A. (2002), “Housing Finance in Chile: The Experience in Primary and Secondary MortgageFinancing”, Inter-American Development Bank, Sustainable Development Best Practices Series.
Parrado, E.H., P. Cox H., M. Fuenzaliza (2009) “Evolución de los precios viviendas en Chile”, Volumen 12– No. 1/April 2009.
Razmilic, S. (2010), “Property values, housing subsidies and incentives Evidence from Chile’s currenthousing policies”, Master Thesis in City Planning, Massachusetts Institute of Technology.
Rodríguez Vignoli, J. (2008), “Movilidad cotidiana, desigualdad social y segregación residencial encuatro metrópolis de América Latina”, Revista Eure, Vol. 34, No. 103, pp. 49-71.
OECD ECONOMIC SURVEYS: CHILE © OECD 2012114
2. BUILDING BLOCKS FOR A BETTER FUNCTIONING HOUSING MARKET IN CHILE
Rupert, P. and E. Wasmer (2011), “Housing and the Labour Market: Time to Move and AggregateUnemployment”, Science Po mimeo.
Sabatini, F., G. Cáceres, and J. Cerda (2001), “Residential Segregation Pattern Changes in Main ChileanCities: Scale Shifts and Increasing Malignancy”, Lincoln Institute of Land Policy, conference paperfor the course titled “International Seminar on Segregation in the City”, 26-28 July 2001.
Sanhueza, P., R. Vargas and P. Mellado (2006), “Impacto de la Contaminación del Aire por PM10 sobre laMortalidad Diaria en Temuco”, Rev. Méd. Chile, Vol. 134, No. 6, Santiago.
Scanlon, K. and C. Whitehead (2011), “French Housing in an International Context,” OECD EconomicsDepartment Working Papers No. 862.
Simian, J.M. (2010), “Logros y Desafios de la Politica Habitacional en Chile,” Estudios Públicos, 117(verano 2010).
Susin, S. (2002), “Rent Vouchers and the Price of Low-Income Housing”, Journal of Public Economics,Vol. 83, No. 1, January.
Trivelli, P. (2011), “La Propuesta de Modificacion del Plan Regulatorio de Santiago PRMS100 Requiereuna Justificación más sólida”, EURE, Vol. 37, No. 111, pp. 179-184.
Universidad Andrés Bello (2011), Chile en cifras, Observatorio de Tendencias Sociales, Datavoz,Santiago.
Valenzuela, P. (2008), “Análisis Descriptivo de la Situación Financiera de los Municipios en Chile”, Inter-American Development Bank.
Valenzuela, P. (2010), “Informe Preliminar sobre Descentralización en Chile”, Banco Interamericano deDesarrollo Documento de Trabajo No. 159.
Vargas M. (2006), “Causes of Residential Segregation The Case of Santiago, Chile”, Centre for Spatialand Real Estate Economics, Department of Economics, The University of Reading.
Wolswijk, G. (2010), “Fiscal aspects of housing in Europe”, in P. Arestis, P. Mooslechner and K.Wagner(eds.), Housing Market Challenges in Europe and the United States, Palgrave Macmillan.
OECD ECONOMIC SURVEYS: CHILE © OECD 2012 115

2. BUILDING BLOCKS FOR A BETTER FUNCTIONING HOUSING MARKET IN CHILE
ital gain rginal riod is ts held
attract
ith xed at res
are le
at come
ularly ed
nge. k utual
ertain
come,
hares 28% and
come,
ANNEX 2.A1
Table 2.A1.1. Housing-related taxes: Interest rate deductibility, imputed rent and capital gains tax
Mortgage interest deductibility
Tax on imputed rentsCapital gains tax (CGT)
Primary residence Secondary residence Other assets
Australia No No No Yes. 50% on the capital gain at the taxpayer’s marginal rate if the holding period is 1 year or more. Assets held for less than 1 year attract full capital gain tax.
Yes. 50% on the capat the taxpayer’s marate if the holding pe1 year or more. Assefor less than 1 year full capital gain tax.
Austria Yes. For incomes less than EUR 50 000.
No Exempt if held more than 2 years. Otherwise taxed at personal income tax rate.
Taxed at personal income tax rate. No tax after 10 years holding.
Yes
Belgium Yes. After 1 Jan. 2005, deductible up to EUR 2 770 for the first 10 years and EUR 2 080 thereafter.
The imputed rental income from a taxpayer’s main dwelling is subject to immovable withholding tax but not to income tax.
No Yes. 16.5% tax if held less than 5 years, no tax after 5 years holding. 33% tax if speculative intent.
Shares purchased wspeculative intent ta33% rate; other shaexempt.
Canada1 No No No 50% of capital gains are included in net taxable capital gains, taxed at marginal personal income rates.
50% of capital gainsincluded in net taxabcapital gains, taxed marginal personal inrates.
Chile Yes No Exempt if held for more than one year. Otherwise taxed at the personal income tax rate.
Exempt if held for more than one year or less than 4 years in the case of an apartment. Otherwise taxed at the personal income tax rate.
Exempt shares if substantially and regtraded on a recognisChilean stock exchaExempt shares of riscapital companies, mfunds, joint-stock companies up to a cthreshold.
Czech Republic Yes. Deductible up to a limit of CZK 300 000.
No Exempt if held for 2 years. Otherwise taxed at 15%. If sold within 2 years, exemption still applies if gains are used for housing.
15%. Exempt if held for 5 years.
Taxed as personal inflat rate of 15%.
Denmark Yes. The tax deduction on interest has a taxable value corresponding to approximative 33%.
No No No Capital gains from sare taxed at rates of below DKK 48, 300 42% thereafter.
Estonia Yes No Exempt. Holiday houses are exempt if held for more than 2 years.
Taxed as personal ingeneral rate 21%.
Finland Yes No Exempt if hold for less than 2 years; otherwise taxed at flat rate of 28%.
28% 28%
OECD ECONOMIC SURVEYS: CHILE © OECD 2012116

2. BUILDING BLOCKS FOR A BETTER FUNCTIONING HOUSING MARKET IN CHILE
come rate of
after
rate is
exempt.
ers
% of bject to l rtain re met.
lied is to s).
France Tax credit for interest on loan for principal residence for 5 years. The credit is equal to 20% up to EUR 3 750 per year, increased by EUR 500 per year for each dependent person. The limits are doubled for couples.
No No Exempt from capital gains taxation after 15 years holding.
Taxed as personal inand subject to a flat 28.1%.
Germany No No No No Exempt if asset sold10 years.
Greece Yes. Mortgage loans taken after 2002, a credit of 20% of the annual mortgage interest on principal home is granted (on the first EUR 200 000 of the loan).
Yes on principal dwellings larger than of 200 m2 and on second house larger than 150 m2.
No No No
Hungary No No Exempt if property held for more than 5 years. Otherwise taxed at 25%.
Exempt if property held for more than 5 years. Otherwise taxed at 25%.
Generally, a 25% taxapplicable.
Iceland An interest compensation payment is made to individuals who incur interest with respect to their residence.
Yes. 70% of rent taxed at 15%.
Exempt if held for more than 2 years. Gains from residence held for less than 2 years exempt if reinvested another residence.
Yes 15%
Ireland Yes. Relief of 20% on the interest of qualifying loans for 7 tax years (higher rates for first homebuyers). Mortgage interest relief is restricted to EUR 3 000 for singles and EUR 6 000 for married/widowed taxpayers.
No The primary residence is exempt from capital gains taxes, but the increase in value due to the development of the property is taxable.
Yes Taxed at 25%. First EUR 1 270 of gains
Israel No No No . . Taxed at 20%. For significant shareholdtaxed at 25%.
Italy Yes. Tax credit equal to 19% for principal owner-occupied dwellings with maximum tax credit EUR 760 and for construction or recovery of principal owner-occupied dwellings maximum tax credit is EUR 491.
Exempt in the case of principal owner-occupied dwellings.
No Exempt if held more than 5 years. For dwellings sold within 5 years, either flat tax of 20% or normal progressive income tax.
Yes. Qualified shareholdings 49.72the capital gain is suprogressive personaincome tax rate if ceholding restrictions a
Japan No No After 5 years holding taxed at 15%. Less than 5 years holding taxed at 30%.
After 5 years holding taxed at 15%. Less than 5 years holding taxed at 30%.
Yes. The tax rate app15% (7% from 20032011 for listed stock
Korea No No Exempt if held for more than 3 years. Otherwise taxed between 6-35%.
6-35% depending on the amount.
6-35%
Table 2.A1.1. Housing-related taxes: Interest rate deductibility, imputed rent and capital gains tax (cont.)
Mortgage interest deductibility
Tax on imputed rentsCapital gains tax (CGT)
Primary residence Secondary residence Other assets
OECD ECONOMIC SURVEYS: CHILE © OECD 2012 117
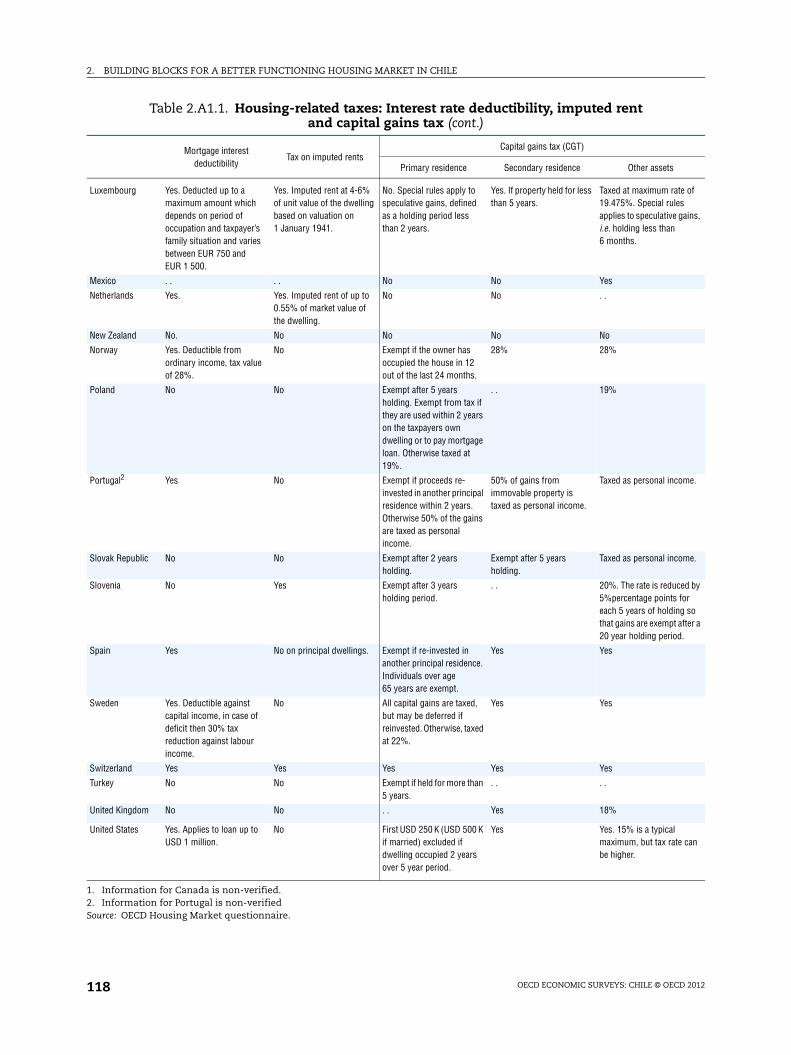
2. BUILDING BLOCKS FOR A BETTER FUNCTIONING HOUSING MARKET IN CHILE
ate of les e gains,
come.
come.
uced by s for ing so t after a od.
l te can
Luxembourg Yes. Deducted up to a maximum amount which depends on period of occupation and taxpayer’s family situation and varies between EUR 750 and EUR 1 500.
Yes. Imputed rent at 4-6% of unit value of the dwelling based on valuation on 1 January 1941.
No. Special rules apply to speculative gains, defined as a holding period less than 2 years.
Yes. If property held for less than 5 years.
Taxed at maximum r19.475%. Special ruapplies to speculativi.e. holding less than6 months.
Mexico . . . . No No Yes
Netherlands Yes. Yes. Imputed rent of up to 0.55% of market value of the dwelling.
No No . .
New Zealand No. No No No No
Norway Yes. Deductible from ordinary income, tax value of 28%.
No Exempt if the owner has occupied the house in 12 out of the last 24 months.
28% 28%
Poland No No Exempt after 5 years holding. Exempt from tax if they are used within 2 years on the taxpayers own dwelling or to pay mortgage loan. Otherwise taxed at 19%.
. . 19%
Portugal2 Yes No Exempt if proceeds re-invested in another principal residence within 2 years. Otherwise 50% of the gains are taxed as personal income.
50% of gains from immovable property is taxed as personal income.
Taxed as personal in
Slovak Republic No No Exempt after 2 years holding.
Exempt after 5 years holding.
Taxed as personal in
Slovenia No Yes Exempt after 3 years holding period.
. . 20%. The rate is red5%percentage pointeach 5 years of holdthat gains are exemp20 year holding peri
Spain Yes No on principal dwellings. Exempt if re-invested in another principal residence. Individuals over age 65 years are exempt.
Yes Yes
Sweden Yes. Deductible against capital income, in case of deficit then 30% tax reduction against labour income.
No All capital gains are taxed, but may be deferred if reinvested. Otherwise, taxed at 22%.
Yes Yes
Switzerland Yes Yes Yes Yes Yes
Turkey No No Exempt if held for more than 5 years.
. . . .
United Kingdom No No . . Yes 18%
United States Yes. Applies to loan up to USD 1 million.
No First USD 250 K (USD 500 K if married) excluded if dwelling occupied 2 years over 5 year period.
Yes Yes. 15% is a typicamaximum, but tax rabe higher.
1. Information for Canada is non-verified.2. Information for Portugal is non-verifiedSource: OECD Housing Market questionnaire.
Table 2.A1.1. Housing-related taxes: Interest rate deductibility, imputed rent and capital gains tax (cont.)
Mortgage interest deductibility
Tax on imputed rentsCapital gains tax (CGT)
Primary residence Secondary residence Other assets
OECD ECONOMIC SURVEYS: CHILE © OECD 2012118
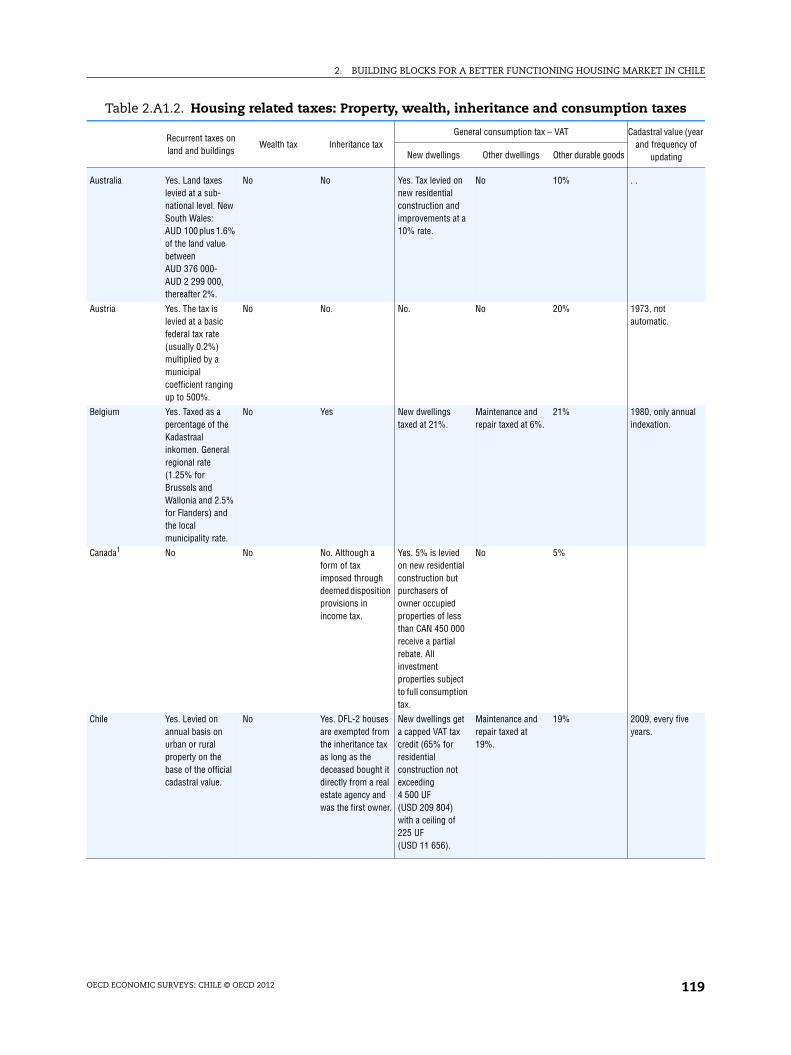
2. BUILDING BLOCKS FOR A BETTER FUNCTIONING HOUSING MARKET IN CHILE
es
lue (year ncy of ng
nnual
five
Table 2.A1.2. Housing related taxes: Property, wealth, inheritance and consumption tax
Recurrent taxes on land and buildings
Wealth tax Inheritance taxGeneral consumption tax – VAT Cadastral va
and frequeupdatiNew dwellings Other dwellings Other durable goods
Australia Yes. Land taxes levied at a sub-national level. New South Wales: AUD 100 plus 1.6% of the land value between AUD 376 000- AUD 2 299 000, thereafter 2%.
No No Yes. Tax levied on new residential construction and improvements at a 10% rate.
No 10% . .
Austria Yes. The tax is levied at a basic federal tax rate (usually 0.2%) multiplied by a municipal coefficient ranging up to 500%.
No No. No. No 20% 1973, not automatic.
Belgium Yes. Taxed as a percentage of the Kadastraal inkomen. General regional rate (1.25% for Brussels and Wallonia and 2.5% for Flanders) and the local municipality rate.
No Yes New dwellings taxed at 21%.
Maintenance and repair taxed at 6%.
21% 1980, only aindexation.
Canada1 No No No. Although a form of tax imposed through deemed disposition provisions in income tax.
Yes. 5% is levied on new residential construction but purchasers of owner occupied properties of less than CAN 450 000 receive a partial rebate. All investment properties subject to full consumption tax.
No 5%
Chile Yes. Levied on annual basis on urban or rural property on the base of the official cadastral value.
No Yes. DFL-2 houses are exempted from the inheritance tax as long as the deceased bought it directly from a real estate agency and was the first owner.
New dwellings get a capped VAT tax credit (65% for residential construction not exceeding 4 500 UF (USD 209 804) with a ceiling of 225 UF (USD 11 656).
Maintenance and repair taxed at 19%.
19% 2009, everyyears.
OECD ECONOMIC SURVEYS: CHILE © OECD 2012 119
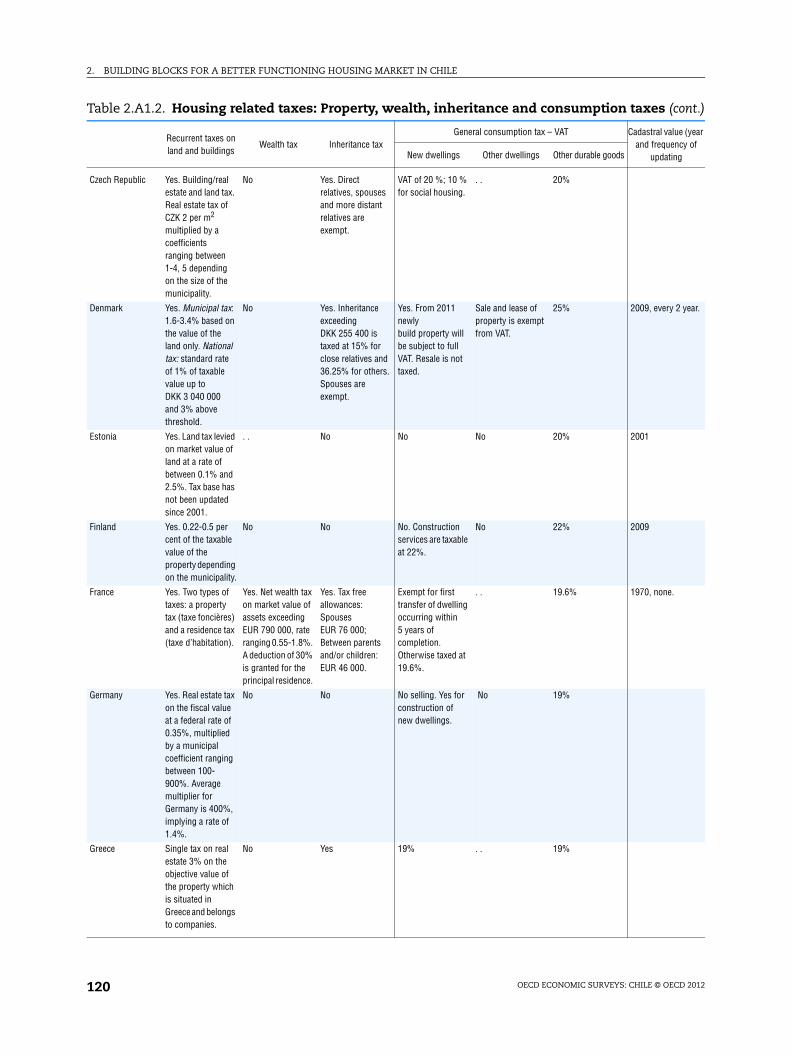
2. BUILDING BLOCKS FOR A BETTER FUNCTIONING HOUSING MARKET IN CHILE
2 year.
.
cont.)
lue (year ncy of ng
Czech Republic Yes. Building/real estate and land tax. Real estate tax of CZK 2 per m2 multiplied by a coefficients ranging between 1-4, 5 depending on the size of the municipality.
No Yes. Direct relatives, spouses and more distant relatives are exempt.
VAT of 20 %; 10 % for social housing.
. . 20%
Denmark Yes. Municipal tax: 1.6-3.4% based on the value of the land only. National tax: standard rate of 1% of taxable value up to DKK 3 040 000 and 3% above threshold.
No Yes. Inheritance exceeding DKK 255 400 is taxed at 15% for close relatives and 36.25% for others. Spouses are exempt.
Yes. From 2011 newly build property will be subject to full VAT. Resale is not taxed.
Sale and lease of property is exempt from VAT.
25% 2009, every
Estonia Yes. Land tax levied on market value of land at a rate of between 0.1% and 2.5%. Tax base has not been updated since 2001.
. . No No No 20% 2001
Finland Yes. 0.22-0.5 per cent of the taxable value of the property depending on the municipality.
No No No. Construction services are taxable at 22%.
No 22% 2009
France Yes. Two types of taxes: a property tax (taxe foncières) and a residence tax (taxe d’habitation).
Yes. Net wealth tax on market value of assets exceeding EUR 790 000, rate ranging 0.55-1.8%. A deduction of 30% is granted for the principal residence.
Yes. Tax free allowances: Spouses EUR 76 000; Between parents and/or children: EUR 46 000.
Exempt for first transfer of dwelling occurring within 5 years of completion. Otherwise taxed at 19.6%.
. . 19.6% 1970, none
Germany Yes. Real estate tax on the fiscal value at a federal rate of 0.35%, multiplied by a municipal coefficient ranging between 100-900%. Average multiplier for Germany is 400%, implying a rate of 1.4%.
No No No selling. Yes for construction of new dwellings.
No 19%
Greece Single tax on real estate 3% on the objective value of the property which is situated in Greece and belongs to companies.
No Yes 19% . . 19%
Table 2.A1.2. Housing related taxes: Property, wealth, inheritance and consumption taxes (
Recurrent taxes on land and buildings
Wealth tax Inheritance taxGeneral consumption tax – VAT Cadastral va
and frequeupdatiNew dwellings Other dwellings Other durable goods
OECD ECONOMIC SURVEYS: CHILE © OECD 2012120
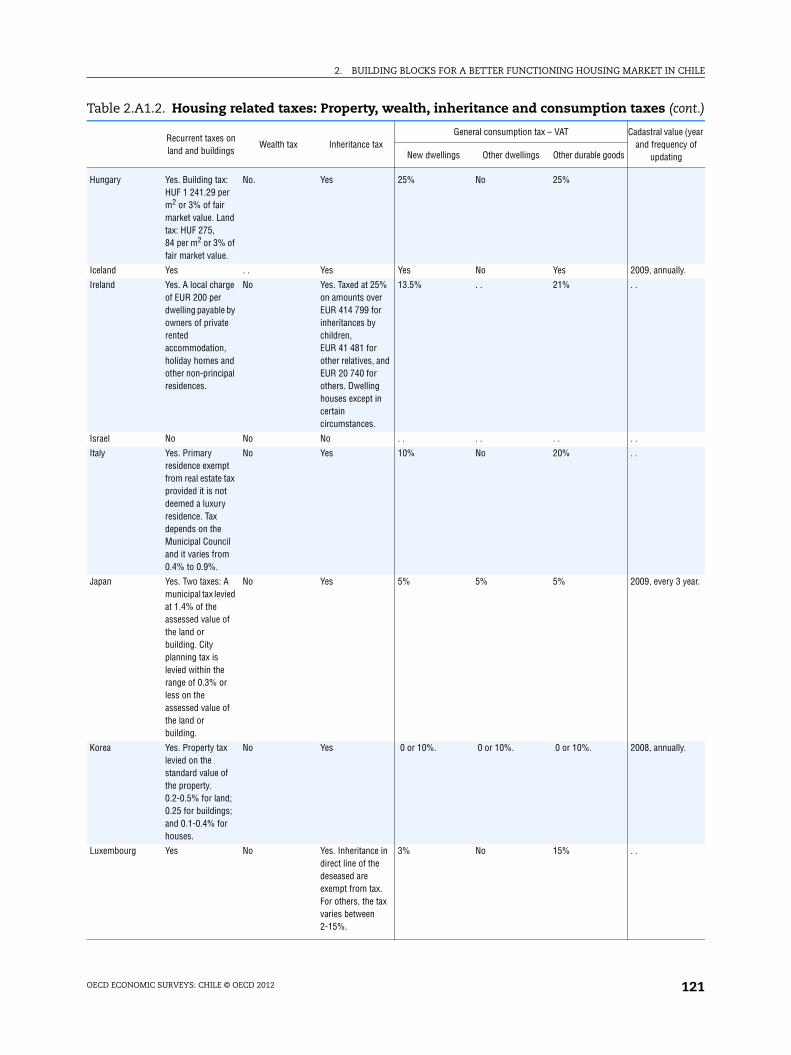
2. BUILDING BLOCKS FOR A BETTER FUNCTIONING HOUSING MARKET IN CHILE
ally.
3 year.
ally.
cont.)
lue (year ncy of ng
Hungary Yes. Building tax: HUF 1 241.29 per m2 or 3% of fair market value. Land tax: HUF 275, 84 per m2 or 3% of fair market value.
No. Yes 25% No 25%
Iceland Yes . . Yes Yes No Yes 2009, annu
Ireland Yes. A local charge of EUR 200 per dwelling payable by owners of private rented accommodation, holiday homes and other non-principal residences.
No Yes. Taxed at 25% on amounts over EUR 414 799 for inheritances by children, EUR 41 481 for other relatives, and EUR 20 740 for others. Dwelling houses except in certain circumstances.
13.5% . . 21% . .
Israel No No No . . . . . . . .
Italy Yes. Primary residence exempt from real estate tax provided it is not deemed a luxury residence. Tax depends on the Municipal Council and it varies from 0.4% to 0.9%.
No Yes 10% No 20% . .
Japan Yes. Two taxes: A municipal tax levied at 1.4% of the assessed value of the land or building. City planning tax is levied within the range of 0.3% or less on the assessed value of the land or building.
No Yes 5% 5% 5% 2009, every
Korea Yes. Property tax levied on the standard value of the property. 0.2-0.5% for land; 0.25 for buildings; and 0.1-0.4% for houses.
No Yes 0 or 10%. 0 or 10%. 0 or 10%. 2008, annu
Luxembourg Yes No Yes. Inheritance in direct line of the deseased are exempt from tax. For others, the tax varies between 2-15%.
3% No 15% . .
Table 2.A1.2. Housing related taxes: Property, wealth, inheritance and consumption taxes (
Recurrent taxes on land and buildings
Wealth tax Inheritance taxGeneral consumption tax – VAT Cadastral va
and frequeupdatiNew dwellings Other dwellings Other durable goods
OECD ECONOMIC SURVEYS: CHILE © OECD 2012 121

2. BUILDING BLOCKS FOR A BETTER FUNCTIONING HOUSING MARKET IN CHILE
ally.
ally/rs.
ally
cont.)
lue (year ncy of ng
Mexico Municipality tax ranging between 0.05-1.2% of the cadastral value.
No Yes No No 16% . .
Netherlands Yes Secondary homes are subject to tax.
Yes Taxed at 19%. Exempt if newly constructed dwelling sold at least 2 years after first actual use.
No 19% 2008, annu
New Zealand No No No. A gift duty is imposed on the donor at a rate between 5-25% of the gift value.
Taxed at 12.5%. Taxed if vendor GST registered.
12.5% varies, annuevery 3 yea
Norway Yes. Tax rate at 0.2-0.7% of value of the assessed value, which is usually 20-50% of fair market value.
Yes. Net wealth in excess of NOK 700 000, subject to national tax is levied of 0.4% and a municipal tax is levied at 0.7%.
Yes 25% No 25% 2010, annu
Poland Yes. Rates range in 2009: PLN 0.37-0.62.
No Yes. 3-20% according to degree of relationship and value.
New houses less than 300 m2 and apartments less than 150 m2 will be subject to 7% VAT. Additional surface will be subject to standard 22% VAT rate.
No 22% . .
Portugal2 Yes No No No No 20% . .
Slovak Republic Yes. Land tax levied at 0.25% of tax base, which is a fixed value per square meter, last adjusted in 2004. Tax on buildings and apartments is EUR 0.033 per m2.
No No 19% 19% 19% . .
Slovenia Yes. Land and building compensation duty is levied by municipalities on owners and users (renters, etc.) of land and buildings. For owner-occupiers, the first 160 m2 of a dwelling is exempt. Tax rates range from 0.1-1.5% of the value of the property.
No Yes Taxed at 8.5%. . . 20% . .
Table 2.A1.2. Housing related taxes: Property, wealth, inheritance and consumption taxes (
Recurrent taxes on land and buildings
Wealth tax Inheritance taxGeneral consumption tax – VAT Cadastral va
and frequeupdatiNew dwellings Other dwellings Other durable goods
OECD ECONOMIC SURVEYS: CHILE © OECD 2012122

2. BUILDING BLOCKS FOR A BETTER FUNCTIONING HOUSING MARKET IN CHILE
every
rs.
ans.
ty/
cont.)
lue (year ncy of ng
Spain No No Taxed at 7%. Social dwellings promoted by public developers taxed at 4%.
No 16% . .
Sweden Yes. Municipality fee based on the assessed value of the property, with a maximum of SEK 6 387 or 0.75% of assessed value for single family houses (SEK 1 277 or 0.4% of assessed value for apartments owned by residents associations). New buildings are exempt from the fee for the first 5 years.
No No Full VAT on production costs.
. . 25% 2007/2009,3 years.
Switzerland Yes Yes, at cantonal level.
Yes Every 5 yea
Turkey Yes No Yes. Progressive rates with tax free allowances for close/immediate family.
1% on properties < 150 m2 and 18% on properties over 150 m2.
. . 18% . .
United Kingdom Yes. Owners and renters must pay a Local Council tax based on assessed or imputed value of the property in April 1991.
No Yes. Levied at 40% on the value of estates above Pounds 255 000.
No VAT on construction of dwellings but materials/labour for any repairs/extensions attracts tax of 17.5%.
Reduced rate of 5%.
17.5% 1991, no pl
United States Yes. Local tax. No Yes. Will be re-imposed in 2011.
Very rare, 2-3 states.
Very rare, 2-3 states.
Yes. Sales tax, rate depend on state.
varies by cicounty.
1. Information for Canada is non-verified.2. Information for Portugal is non-verified.Source: OECD Housing Market questionnaire.
Table 2.A1.2. Housing related taxes: Property, wealth, inheritance and consumption taxes (
Recurrent taxes on land and buildings
Wealth tax Inheritance taxGeneral consumption tax – VAT Cadastral va
and frequeupdatiNew dwellings Other dwellings Other durable goods
OECD ECONOMIC SURVEYS: CHILE © OECD 2012 123
l and
and
, the
tting
good
ublic,
orea,
enia,
takes
and
and
ORGANISATION FOR ECONOMIC CO-OPERATION AND DEVELOPMENT
The OECD is a unique forum where governments work together to address the economic, socia
environmental challenges of globalisation. The OECD is also at the forefront of efforts to understand
to help governments respond to new developments and concerns, such as corporate governance
information economy and the challenges of an ageing population. The Organisation provides a se
where governments can compare policy experiences, seek answers to common problems, identify
practice and work to co-ordinate domestic and international policies.
The OECD member countries are: Australia, Austria, Belgium, Canada, Chile, the Czech Rep
Denmark, Estonia, Finland, France, Germany, Greece, Hungary, Iceland, Ireland, Israel, Italy, Japan, K
Luxembourg, Mexico, the Netherlands, New Zealand, Norway, Poland, Portugal, the Slovak Republic, Slov
Spain, Sweden, Switzerland, Turkey, the United Kingdom and the United States. The European Union
part in the work of the OECD.
OECD Publishing disseminates widely the results of the Organisation’s statistics gathering
research on economic, social and environmental issues, as well as the conventions, guidelines
standards agreed by its members.
OECD PUBLISHING, 2, rue André-Pascal, 75775 PARIS CEDEX 16
(10 2012 03 1 P) ISBN 978-92-64-12720-3 – No. 59747 2012

January 2012
OECD Economic Surveys
CHILESPECIAL FEATURES: REDUCING POVERTY: CASH TRANSFERS AND BETTER JOBS
Most recent editions
ISBN 978-92-64-12720-310 2012 03 1 P
ISSN 0376-64382012 SUBSCRIPTION (18 ISSUES)
ISSN 1995-378XSUBSCRIPTION BY COUNTRY
-:HSTCQE=VW\WUX:
Volu
me 2012/1
CH
ILEO
EC
D E
cono
mic S
urveys
Volume 2012/1January 2012
Please cite this publication as:
OECD (2012), OECD Economic Surveys: Chile 2012, OECD Publishing.http://dx.doi.org/10.1787/eco_surveys-chl-2012-en
This work is published on the OECD iLibrary, which gathers all OECD books, periodicals and statistical databases. Visit www.oecd-ilibrary.org, and do not hesitate to contact us for more information.
OECD Economic SurveysCHILE
JANUARY 2012
Australia, November 2010Austria, July 2011Belgium, July 2011Brazil, October 2011Canada, September 2010Chile, January 2012 China, February 2010Czech Republic, November 2011Denmark, January 2012Estonia, April 2011Euro area, December 2010European Union, September 2009Federal Republic of Yugoslavia, January 2003Finland, April 2010France, March 2011Germany, March 2010Greece, August 2011Hungary, February 2010Iceland, June 2011India, June 2011Indonesia, November 2010Ireland, October 2011Israel, December 2011
Italy, May 2011Japan, April 2011Korea, June 2010Luxembourg, May 2010Mexico, May 2011Netherlands, June 2010New Zealand, April 2011Norway, March 2010Poland, April 2010Portugal, September 2010Romania, October 2002Russian Federation, December 2011Slovak Republic, November 2010Slovenia, February 2011South Africa, July 2010Spain, December 2010Sweden, January 2011Switzerland, December 2011Turkey, September 2010Ukraine, September 2007United Kingdom, March 2011United States, September 2010
102012031cov.indd 1 11-Jan-2012 3:34:08 PM