OECD Economic Surveys Poland 2016
144
OECD Economic Surveys POLAND MARCH 2016
-
Upload
patrizio-sicari -
Category
Documents
-
view
164 -
download
3
Transcript of OECD Economic Surveys Poland 2016
March 2016
Volum
e 2016/8 P
OLA
ND
OE
CD
Eco
nom
ic Su
rveys
OECD Economic Surveys
POLANDSPECIAL FEATURES: SKILLS AND MIGRATION; TRANSPORT AND ENERGY INFRASTRUCTURE
Most recent editions
Consult this publication on line at http://dx.doi.org/10.1787/eco_surveys-pol-2016-en.
This work is published on the OECD iLibrary, which gathers all OECD books, periodicals and statistical databases.Visit www.oecd-ilibrary.org for more information.
Volume 2016/8March 2016
ISBN 978-92-64-25255-410 2016 08 1 P
ISSN 0376-64382016 SUBSCRIPTION
(18 ISSUES) 9HSTCQE*cfcffe+
Australia, December 2014Austria, July 2015Belgium, February 2015Brazil, November 2015Canada, June 2014Chile, November 2015China, March 2015Colombia, January 2015Costa Rica, February 2016Czech Republic, March 2014Denmark, January 2014Estonia, January 2015Euro area, April 2014European Union, April 2014Finland, January 2016France, March 2015Germany, May 2014Greece, March 2016Hungary, January 2014Iceland, September 2015India, November 2014Indonesia, March 2015Ireland, September 2015
Israel, January 2016Italy, February 2015Japan, April 2015Korea, June 2014Latvia, February 2015Lithuania, March 2016Luxembourg, March 2015Mexico, January 2015Netherlands, March 2016New Zealand, June 2015Norway, January 2016Poland, March 2016Portugal, October 2014Russian Federation, January 2014Slovak Republic, November 2014Slovenia, May 2015South Africa, July 2015Spain, September 2014Sweden, March 2015Switzerland, November 2015Turkey, July 2014United Kingdom, February 2015United States, June 2014
OECD Economic SurveysPOLAND
MARCH 2016


OECD Economic Surveys:Poland2016
This document and any map included herein are without prejudice to the status of or
sovereignty over any territory, to the delimitation of international frontiers and boundaries
and to the name of any territory, city or area.
ISBN 978-92-64-25255-4 (print)ISBN 978-92-64-25256-1 (PDF)ISBN 978-92-64-25257-8 (epub)
Series: OECD Economic SurveysISSN 0376-6438 (print)ISSN 1609-7513 (online)
OECD Economic Surveys: PolandISSN 1995-3542 (print)ISSN 1999-060X (online)
The statistical data for Israel are supplied by and under the responsibility of the relevant Israeli authorities. The useof such data by the OECD is without prejudice to the status of the Golan Heights, East Jerusalem and Israelisettlements in the West Bank under the terms of international law.
Photo credits: Cover © David Bank/Flickr/Getty Images.
Corrigenda to OECD publications may be found on line at: www.oecd.org/about/publishing/corrigenda.htm.
© OECD 2016
You can copy, download or print OECD content for your own use, and you can include excerpts from OECD publications, databases and
multimedia products in your own documents, presentations, blogs, websites and teaching materials, provided that suitable
acknowledgement of OECD as source and copyright owner is given. All requests for public or commercial use and translation rights should
be submitted to [email protected]. Requests for permission to photocopy portions of this material for public or commercial use shall be
addressed directly to the Copyright Clearance Center (CCC) at [email protected] or the Centre français d’exploitation du droit de copie (CFC)
Please cite this publication as:OECD (2016), OECD Economic Surveys: Poland 2016, OECD Publishing, Paris.http://dx.doi.org/10.1787/eco_surveys-pol-2016-en
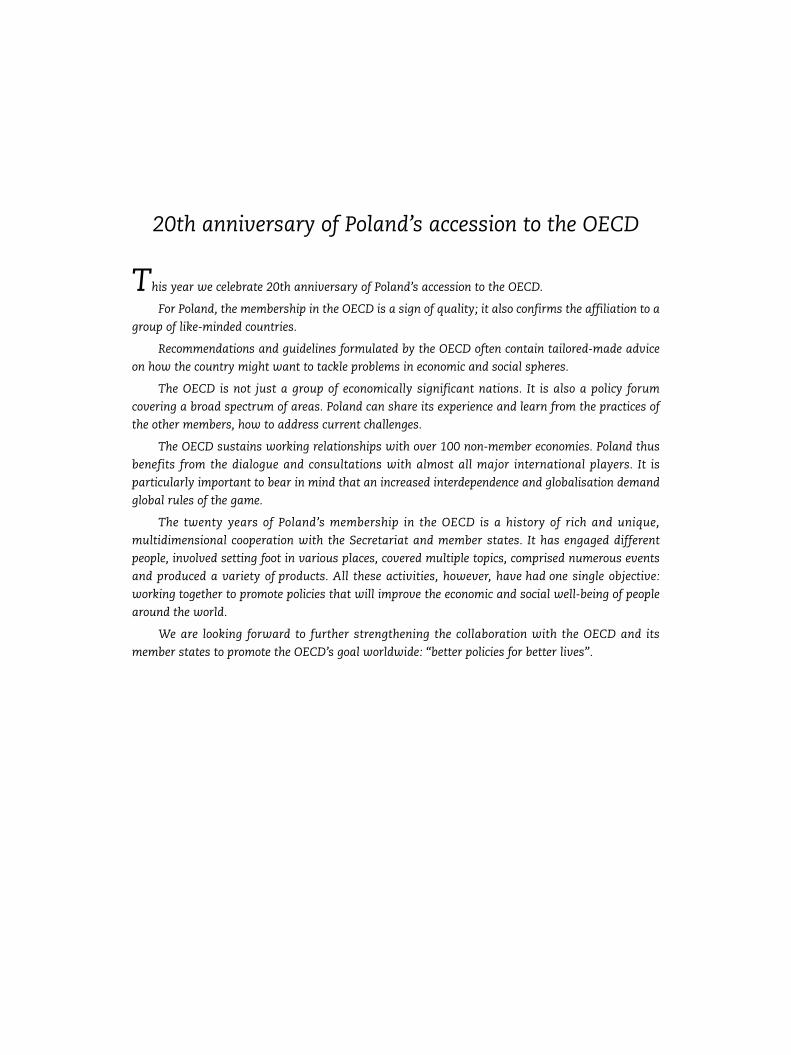
20th anniversary of Poland’s accession to the OECD
This year we celebrate 20th anniversary of Poland’s accession to the OECD.
For Poland, the membership in the OECD is a sign of quality; it also confirms the affiliation to a
group of like-minded countries.
Recommendations and guidelines formulated by the OECD often contain tailored-made advice
on how the country might want to tackle problems in economic and social spheres.
The OECD is not just a group of economically significant nations. It is also a policy forum
covering a broad spectrum of areas. Poland can share its experience and learn from the practices of
the other members, how to address current challenges.
The OECD sustains working relationships with over 100 non-member economies. Poland thus
benefits from the dialogue and consultations with almost all major international players. It is
particularly important to bear in mind that an increased interdependence and globalisation demand
global rules of the game.
The twenty years of Poland’s membership in the OECD is a history of rich and unique,
multidimensional cooperation with the Secretariat and member states. It has engaged different
people, involved setting foot in various places, covered multiple topics, comprised numerous events
and produced a variety of products. All these activities, however, have had one single objective:
working together to promote policies that will improve the economic and social well-being of people
around the world.
We are looking forward to further strengthening the collaboration with the OECD and its
member states to promote the OECD’s goal worldwide: “better policies for better lives”.

TABLE OF CONTENTS
OECD ECONOMIC SURVEYS: POLAND © OECD 2016 5
Table of contents
Basic Statistics of Poland, 2014 . . . . . . . . . . . . . . . . . . . . . . . . . . . . . . . . . . . . . . . . . . . . . . . 10
Executive summary . . . . . . . . . . . . . . . . . . . . . . . . . . . . . . . . . . . . . . . . . . . . . . . . . . . . . . . . . 11
Growth is robust, and unemployment has declined . . . . . . . . . . . . . . . . . . . . . . . . . . 12
Education reforms would strengthen skills . . . . . . . . . . . . . . . . . . . . . . . . . . . . . . . . . 12
Greening infrastructure would improve public health . . . . . . . . . . . . . . . . . . . . . . . . 12
Assessment and recommendations . . . . . . . . . . . . . . . . . . . . . . . . . . . . . . . . . . . . . . . . . . . 15
Moving towards higher-technology production would raise living standards. . . . . 16
Growth is solid, and the labour market situation has improved significantly . . . . 18
Macroeconomic policies . . . . . . . . . . . . . . . . . . . . . . . . . . . . . . . . . . . . . . . . . . . . . . . . . 21
Enhancing employment and access to high-quality jobs . . . . . . . . . . . . . . . . . . . . . . 27
Ensuring efficient public infrastructure and better conditions for private
investment. . . . . . . . . . . . . . . . . . . . . . . . . . . . . . . . . . . . . . . . . . . . . . . . . . . . . . . . . . . . . 32
Further improving education to boost productivity and the ability to adopt
innovations . . . . . . . . . . . . . . . . . . . . . . . . . . . . . . . . . . . . . . . . . . . . . . . . . . . . . . . . . . . . 42
Making better use of migrants’ skills. . . . . . . . . . . . . . . . . . . . . . . . . . . . . . . . . . . . . . . 48
Bibliography. . . . . . . . . . . . . . . . . . . . . . . . . . . . . . . . . . . . . . . . . . . . . . . . . . . . . . . . . . . . 51
Annex. Progress in structural reform. . . . . . . . . . . . . . . . . . . . . . . . . . . . . . . . . . . . . . . . . . . 55
Thematic chapters
Chapter 1. Making better use of skills and migration . . . . . . . . . . . . . . . . . . . . . . . . . . . . 61
Raising skill levels. . . . . . . . . . . . . . . . . . . . . . . . . . . . . . . . . . . . . . . . . . . . . . . . . . . . . . . 62
Improving skill matches . . . . . . . . . . . . . . . . . . . . . . . . . . . . . . . . . . . . . . . . . . . . . . . . . 74
Promoting a better use of skills through labour market policies. . . . . . . . . . . . . . . . 76
Migration and skills . . . . . . . . . . . . . . . . . . . . . . . . . . . . . . . . . . . . . . . . . . . . . . . . . . . . . 78
Recommendations to strengthen workers’ skills and profit more from mig . . . . . . . . . . . 88
Bibliography. . . . . . . . . . . . . . . . . . . . . . . . . . . . . . . . . . . . . . . . . . . . . . . . . . . . . . . . . . . . 89
Chapter 2. Improving transport and energy infrastructure investment . . . . . . . . . . . . . 93
Infrastructure is key for productivity and social welfare . . . . . . . . . . . . . . . . . . . . . . 94
An overarching strategy and a sound institutional framework are key to improving
infrastructure . . . . . . . . . . . . . . . . . . . . . . . . . . . . . . . . . . . . . . . . . . . . . . . . . . . . . . . . . . 97
Improving transport infrastructure would strengthen productivity and health
outcomes . . . . . . . . . . . . . . . . . . . . . . . . . . . . . . . . . . . . . . . . . . . . . . . . . . . . . . . . . . . . . . 113
Promoting appropriate energy infrastructure investment . . . . . . . . . . . . . . . . . . . . . 123
Recommendations for improving transport and energy infrastructure investment . . . . . 134
Bibliography. . . . . . . . . . . . . . . . . . . . . . . . . . . . . . . . . . . . . . . . . . . . . . . . . . . . . . . . . . . . 135
TABLE OF CONTENTS
OECD ECONOMIC SURVEYS: POLAND © OECD 20166
Boxes1. Possible shocks to the Polish economy . . . . . . . . . . . . . . . . . . . . . . . . . . . . . . . . . . 20
2. The new government’s tax and spending plans . . . . . . . . . . . . . . . . . . . . . . . . . . 21
1.1. Initial vocational education in Poland . . . . . . . . . . . . . . . . . . . . . . . . . . . . . . . . . . 64
1.2. Basic skills strategies in OECD countries . . . . . . . . . . . . . . . . . . . . . . . . . . . . . . . . 71
2.1. Government transport programmes . . . . . . . . . . . . . . . . . . . . . . . . . . . . . . . . . . . . 100
2.2. EU initiatives to attract private infrastructure investment and the EFSI. . . . . . 111
2.3. The state-owned development bank (BGK), the Polish Investments
for Development (PIR) and the Polish Development Fund (PFR) . . . . . . . . . . . . . 112
Tables1. Macroeconomic indicators and projections. . . . . . . . . . . . . . . . . . . . . . . . . . . . . . 19
2.1. Structure of responsibilities for the road network, 2005-13 . . . . . . . . . . . . . . . . 115
Figures1. GDP growth has been robust, but productivity and exports’ technological
content have stayed weak . . . . . . . . . . . . . . . . . . . . . . . . . . . . . . . . . . . . . . . . . . . . 17
2. The working-age population is set to decline sharply . . . . . . . . . . . . . . . . . . . . . 17
3. The OECD Better Life Index for Poland . . . . . . . . . . . . . . . . . . . . . . . . . . . . . . . . . . 18
4. Macroeconomic indicators . . . . . . . . . . . . . . . . . . . . . . . . . . . . . . . . . . . . . . . . . . . . 20
5. Debt is on a declining path. . . . . . . . . . . . . . . . . . . . . . . . . . . . . . . . . . . . . . . . . . . . 23
6. VAT revenue shortfall due to tax breaks . . . . . . . . . . . . . . . . . . . . . . . . . . . . . . . . . 23
7. VAT revenue shortfall due to evasion . . . . . . . . . . . . . . . . . . . . . . . . . . . . . . . . . . . 24
8. Inflation and monetary policy . . . . . . . . . . . . . . . . . . . . . . . . . . . . . . . . . . . . . . . . . 26
9. Financial sector developments . . . . . . . . . . . . . . . . . . . . . . . . . . . . . . . . . . . . . . . . 26
10. Foreign-currency-denominated and non-performing loans . . . . . . . . . . . . . . . . 27
11. Employment rates are low in the context of rapid ageing, and in-work poverty
is relatively high. . . . . . . . . . . . . . . . . . . . . . . . . . . . . . . . . . . . . . . . . . . . . . . . . . . . . 28
12. Enrolment rates in pre-primary and early childhood education have been weak
but increasing . . . . . . . . . . . . . . . . . . . . . . . . . . . . . . . . . . . . . . . . . . . . . . . . . . . . . . . 29
13. Reduction in gross average replacement rates of public pensions, 2013-60 . . . 29
14. Temporary employment . . . . . . . . . . . . . . . . . . . . . . . . . . . . . . . . . . . . . . . . . . . . . . 30
15. Average tax wedges on labour income . . . . . . . . . . . . . . . . . . . . . . . . . . . . . . . . . . 31
16. Public and private investment . . . . . . . . . . . . . . . . . . . . . . . . . . . . . . . . . . . . . . . . . 33
17. GHG emissions and deaths from ambient air pollution. . . . . . . . . . . . . . . . . . . . 34
18. The effective tax rate on CO2 emissions from energy use is low . . . . . . . . . . . . 34
19. Transport infrastructure . . . . . . . . . . . . . . . . . . . . . . . . . . . . . . . . . . . . . . . . . . . . . . 35
20. Electricity generation capacity. . . . . . . . . . . . . . . . . . . . . . . . . . . . . . . . . . . . . . . . . 37
21. Energy prices. . . . . . . . . . . . . . . . . . . . . . . . . . . . . . . . . . . . . . . . . . . . . . . . . . . . . . . . 38
22. International interconnection capacity in the electricity market . . . . . . . . . . . 39
23. Fixed broadband penetration and ICT use . . . . . . . . . . . . . . . . . . . . . . . . . . . . . . . 41
24. Procedures to start a business and resolve insolvency remain long and costly 42
25. Skill test scores of adults, including those with tertiary education, are below
the OECD average. . . . . . . . . . . . . . . . . . . . . . . . . . . . . . . . . . . . . . . . . . . . . . . . . . . . 43
26. The skills of students and graduates from basic vocational schools are weak. 44
27. Qualification mismatches have important consequences. . . . . . . . . . . . . . . . . . 45
28. Participation in continuing education is poor . . . . . . . . . . . . . . . . . . . . . . . . . . . . 46
29. Qualifications are valued more than skills. . . . . . . . . . . . . . . . . . . . . . . . . . . . . . . 47
TABLE OF CONTENTS
OECD ECONOMIC SURVEYS: POLAND © OECD 2016 7
30. Tertiary education boomed and students abandoned vocational education
until recently . . . . . . . . . . . . . . . . . . . . . . . . . . . . . . . . . . . . . . . . . . . . . . . . . . . . . . . 48
31. Emigration from Poland is significant. . . . . . . . . . . . . . . . . . . . . . . . . . . . . . . . . . . 49
32. Skills of Polish emigrants are low and they tend to perform simple jobs abroad 50
1.1. Skill test scores of adults, including those with tertiary education, are below
the OECD average. . . . . . . . . . . . . . . . . . . . . . . . . . . . . . . . . . . . . . . . . . . . . . . . . . . . 63
1.2. First-year students in upper secondary school by type of education. . . . . . . . . 65
1.3. Labour market outcomes of vocational school leavers are weaker than
in other OECD countries . . . . . . . . . . . . . . . . . . . . . . . . . . . . . . . . . . . . . . . . . . . . . . 66
1.4. The skills of students and graduates from basic vocational schools are weak. 66
1.5. Participation in continuing education . . . . . . . . . . . . . . . . . . . . . . . . . . . . . . . . . . 69
1.6. Many adults have weak computer skills. . . . . . . . . . . . . . . . . . . . . . . . . . . . . . . . . 70
1.7. Qualifications are valued more than skills. . . . . . . . . . . . . . . . . . . . . . . . . . . . . . . 71
1.8. Tertiary education attainment rates of individuals aged 25 to 34 . . . . . . . . . . . 72
1.9. Poland’s tertiary education institutions . . . . . . . . . . . . . . . . . . . . . . . . . . . . . . . . . 73
1.10. Evaluation results for higher education institutions in Poland, 2008-11 . . . . . . 73
1.11. Qualification mismatches have important consequences. . . . . . . . . . . . . . . . . . 75
1.12. Temporary employment . . . . . . . . . . . . . . . . . . . . . . . . . . . . . . . . . . . . . . . . . . . . . . 77
1.13. Emigration from Poland is significant. . . . . . . . . . . . . . . . . . . . . . . . . . . . . . . . . . . 79
1.14. Immigration has been rising rapidly, though from a low level . . . . . . . . . . . . . . 80
1.15. Unemployment in Poland . . . . . . . . . . . . . . . . . . . . . . . . . . . . . . . . . . . . . . . . . . . . . 81
1.16. Social protection of the unemployed is relatively limited . . . . . . . . . . . . . . . . . . 82
1.17. The working-age population is set to decline sharply . . . . . . . . . . . . . . . . . . . . . 83
1.18. Both emigrants and immigrants are relatively high-skilled, 2011 . . . . . . . . . . . 84
1.19. Skills of Polish emigrants are low, and they tend to perform simple jobs abroad . 85
2.1. Public investment has been significant but bottlenecks remain . . . . . . . . . . . . 95
2.2. Regional disparities and residential mobility . . . . . . . . . . . . . . . . . . . . . . . . . . . . 95
2.3. Land transport safety and urban air pollution . . . . . . . . . . . . . . . . . . . . . . . . . . . 96
2.4. Greenhouse gas (GHG) emissions in the energy sector . . . . . . . . . . . . . . . . . . . . 96
2.5. Indicators of the adequacy of infrastructure planning and financing . . . . . . . . 98
2.6. Land administration, urban sprawl and duration of urbanism procedures . . . 102
2.7. Fixed broadband penetration and ICT use . . . . . . . . . . . . . . . . . . . . . . . . . . . . . . . 103
2.8. Green taxes . . . . . . . . . . . . . . . . . . . . . . . . . . . . . . . . . . . . . . . . . . . . . . . . . . . . . . . . . 104
2.9. EU structural and cohesion funds, 2007-13 and 2014-20 . . . . . . . . . . . . . . . . . . . 105
2.10. Public procurement procedures in 2014 . . . . . . . . . . . . . . . . . . . . . . . . . . . . . . . . . 106
2.11. The perceived risks of corruption are high, 2013. . . . . . . . . . . . . . . . . . . . . . . . . . 108
2.12. Large public-private-partnership projects have been difficult to complete . . . 109
2.13. Assets of pension funds in selected OECD countries, 2013-14 . . . . . . . . . . . . . . 112
2.14. Regulation in network industries made significant progress, but bottlenecks
remain . . . . . . . . . . . . . . . . . . . . . . . . . . . . . . . . . . . . . . . . . . . . . . . . . . . . . . . . . . . . . 113
2.15. Public investment in transport has increased but remains unbalanced . . . . . . 114
2.16. The maintenance needs of the road network are set to increase rapidly . . . . . 116
2.17. The share of rail transport is declining. . . . . . . . . . . . . . . . . . . . . . . . . . . . . . . . . . 118
2.18. The quality of the rail infrastructure and services is perceived as low . . . . . . . 119
2.19. Density of the railway network . . . . . . . . . . . . . . . . . . . . . . . . . . . . . . . . . . . . . . . . 120
2.20. Rail access charges for freight are high by international standards. . . . . . . . . . 121
TABLE OF CONTENTS
OECD ECONOMIC SURVEYS: POLAND © OECD 20168
2.21. The perceived quality of seaport infrastructure remains low, but spending
is rising . . . . . . . . . . . . . . . . . . . . . . . . . . . . . . . . . . . . . . . . . . . . . . . . . . . . . . . . . . . . 122
2.22. Airport infrastructure spending and air traffic . . . . . . . . . . . . . . . . . . . . . . . . . . . 123
2.23. Electricity generation capacity. . . . . . . . . . . . . . . . . . . . . . . . . . . . . . . . . . . . . . . . . 124
2.24. Share of coal and emissions from the power sector. . . . . . . . . . . . . . . . . . . . . . . 124
2.25. The draft Energy Policy of Poland until 2050 . . . . . . . . . . . . . . . . . . . . . . . . . . . . . 125
2.26. The EU Emissions Trading System (EU-ETS). . . . . . . . . . . . . . . . . . . . . . . . . . . . . . 126
2.27. International interconnection capacity in the electricity market . . . . . . . . . . . 127
2.28. Retail and wholesale prices of electricity . . . . . . . . . . . . . . . . . . . . . . . . . . . . . . . . 128
2.29. Renewable energy sources . . . . . . . . . . . . . . . . . . . . . . . . . . . . . . . . . . . . . . . . . . . . 129
2.30. Household energy consumption . . . . . . . . . . . . . . . . . . . . . . . . . . . . . . . . . . . . . . . 131
2.31. The gas sector . . . . . . . . . . . . . . . . . . . . . . . . . . . . . . . . . . . . . . . . . . . . . . . . . . . . . . . 133
This Survey is published on the responsibility of the Economic andDevelopment Review Committee (EDRC) of the OECD, which is charged with theexamination of the economic situation of member countries.
The economic situation and policies of Poland were reviewed by the Committeeon 08 February 2016. The draft report was then revised in the light of thediscussions and given final approval as the agreed report of the whole Committee on4 March 2016.
The Secretariat’s draft report was prepared for the Committee by Nicola Brandtand Antoine Goujard under the supervision of Peter Jarrett. Statistical and researchassistance was provided by Patrizio Sicari and administrative assistance by DacilKurzweg.
The previous Survey of Poland was issued in March 2014.
Information about the latest as well as previous Surveys and more informationabout how Surveys are prepared is available at www.oecd.org/eco/surveys.
Look for the StatLinks2at the bottom of the tables or graphs in this book.
To download the matching Excel® spreadsheet, just type the link into your
Internet browser, starting with the http://dx.doi.org prefix, or click on the link from
the e-book edition.
Follow OECD Publications on:
This book has... StatLinks2A service that delivers Excel files from the printed page! ®
http://twitter.com/OECD_Pubs
http://www.facebook.com/OECDPublications
http://www.linkedin.com/groups/OECD-Publications-4645871
http://www.youtube.com/oecdilibrary
http://www.oecd.org/oecddirect/ OECD
Alerts
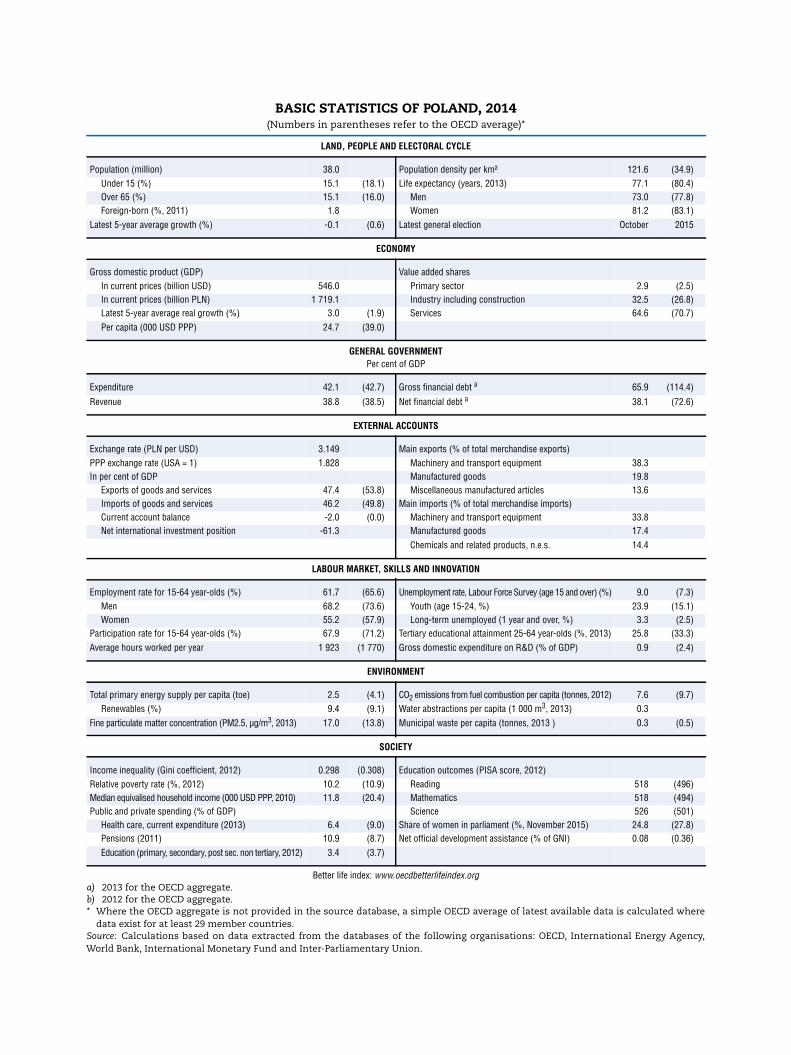
BASIC STATISTICS OF POLAND, 2014(Numbers in parentheses refer to the OECD average)*
LAND, PEOPLE AND ELECTORAL CYCLE
Population (million) 38.0 Population density per km² 121.6 (34.9)Under 15 (%) 15.1 (18.1) Life expectancy (years, 2013) 77.1 (80.4)Over 65 (%) 15.1 (16.0) Men 73.0 (77.8)Foreign-born (%, 2011) 1.8 Women 81.2 (83.1)
Latest 5-year average growth (%) -0.1 (0.6) Latest general election October 2015
ECONOMY
Gross domestic product (GDP) Value added sharesIn current prices (billion USD) 546.0 Primary sector 2.9 (2.5)In current prices (billion PLN) 1 719.1 Industry including construction 32.5 (26.8)Latest 5-year average real growth (%) 3.0 (1.9) Services 64.6 (70.7)Per capita (000 USD PPP) 24.7 (39.0)
GENERAL GOVERNMENTPer cent of GDP
Expenditure 42.1 (42.7) Gross financial debt a 65.9 (114.4)
Revenue 38.8 (38.5) Net financial debt a 38.1 (72.6)
EXTERNAL ACCOUNTS
Exchange rate (PLN per USD) 3.149 Main exports (% of total merchandise exports)PPP exchange rate (USA = 1) 1.828 Machinery and transport equipment 38.3In per cent of GDP Manufactured goods 19.8
Exports of goods and services 47.4 (53.8) Miscellaneous manufactured articles 13.6Imports of goods and services 46.2 (49.8) Main imports (% of total merchandise imports)Current account balance -2.0 (0.0) Machinery and transport equipment 33.8Net international investment position -61.3 Manufactured goods 17.4
Chemicals and related products, n.e.s. 14.4
LABOUR MARKET, SKILLS AND INNOVATION
Employment rate for 15-64 year-olds (%) 61.7 (65.6) Unemployment rate, Labour Force Survey (age 15 and over) (%) 9.0 (7.3)Men 68.2 (73.6) Youth (age 15-24, %) 23.9 (15.1)Women 55.2 (57.9) Long-term unemployed (1 year and over, %) 3.3 (2.5)
Participation rate for 15-64 year-olds (%) 67.9 (71.2) Tertiary educational attainment 25-64 year-olds (%, 2013) 25.8 (33.3)Average hours worked per year 1 923 (1 770) Gross domestic expenditure on R&D (% of GDP) 0.9 (2.4)
ENVIRONMENT
Total primary energy supply per capita (toe) 2.5 (4.1) CO2 emissions from fuel combustion per capita (tonnes, 2012) 7.6 (9.7)Renewables (%) 9.4 (9.1) Water abstractions per capita (1 000 m3, 2013) 0.3
Fine particulate matter concentration (PM2.5, µg/m3, 2013) 17.0 (13.8) Municipal waste per capita (tonnes, 2013 ) 0.3 (0.5)
SOCIETY
Income inequality (Gini coefficient, 2012) 0.298 (0.308) Education outcomes (PISA score, 2012)Relative poverty rate (%, 2012) 10.2 (10.9) Reading 518 (496)Median equivalised household income (000 USD PPP, 2010) 11.8 (20.4) Mathematics 518 (494)Public and private spending (% of GDP) Science 526 (501)
Health care, current expenditure (2013) 6.4 (9.0) Share of women in parliament (%, November 2015) 24.8 (27.8)Pensions (2011) 10.9 (8.7) Net official development assistance (% of GNI) 0.08 (0.36)Education (primary, secondary, post sec. non tertiary, 2012) 3.4 (3.7)
Better life index: www.oecdbetterlifeindex.orga) 2013 for the OECD aggregate.b) 2012 for the OECD aggregate.* Where the OECD aggregate is not provided in the source database, a simple OECD average of latest available data is calculated where
data exist for at least 29 member countries.Source: Calculations based on data extracted from the databases of the following organisations: OECD, International Energy Agency,World Bank, International Monetary Fund and Inter-Parliamentary Union.
OECD Economic Surveys: Poland
© OECD 2016
11
Executive summary
● Growth is robust, and unemployment has declined
● Education reforms would strengthen skills
● Greening infrastructure would improve public health
EXECUTIVE SUMMARY
OECD ECONOMIC SURVEYS: POLAND © OECD 201612
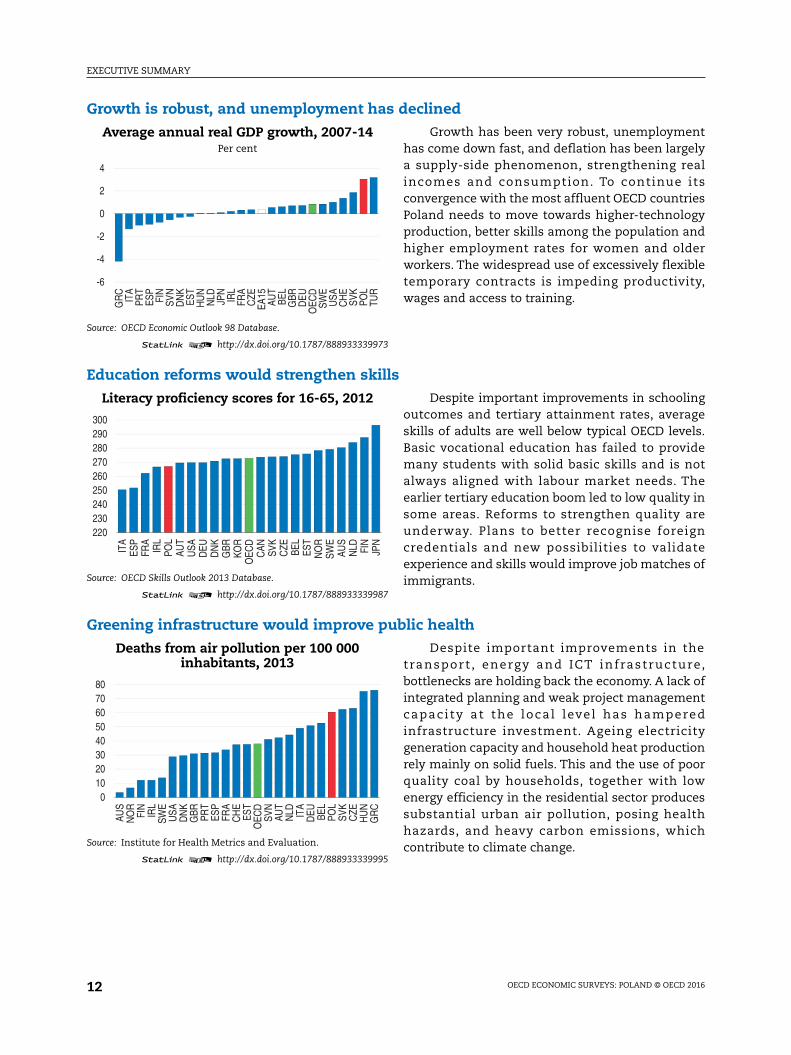
Growth is robust, and unemployment has declined
Average annual real GDP growth, 2007-14Per cent
Source: OECD Economic Outlook 98 Database.
1 2 http://dx.doi.org/10.1787/888933339973
Growth has been very robust, unemploymenthas come down fast, and deflation has been largelya supply-side phenomenon, strengthening realincomes and consumption. To continue itsconvergence with the most affluent OECD countriesPoland needs to move towards higher-technologyproduction, better skills among the population andhigher employment rates for women and olderworkers. The widespread use of excessively flexibletemporary contracts is impeding productivity,wages and access to training.
Education reforms would strengthen skills
Literacy proficiency scores for 16-65, 2012
Source: OECD Skills Outlook 2013 Database.
1 2 http://dx.doi.org/10.1787/888933339987
Despite important improvements in schoolingoutcomes and tertiary attainment rates, averageskills of adults are well below typical OECD levels.Basic vocational education has failed to providemany students with solid basic skills and is notalways aligned with labour market needs. Theearlier tertiary education boom led to low quality insome areas. Reforms to strengthen quality areunderway. Plans to better recognise foreigncredentials and new possibilities to validateexperience and skills would improve job matches ofimmigrants.
Greening infrastructure would improve public health
Deaths from air pollution per 100 000inhabitants, 2013
Source: Institute for Health Metrics and Evaluation.
1 2 http://dx.doi.org/10.1787/888933339995
Despite important improvements in thetransport , energy and ICT infrastructure,bottlenecks are holding back the economy. A lack ofintegrated planning and weak project managementcapaci ty at the local level has hamperedinfrastructure investment. Ageing electricitygeneration capacity and household heat productionrely mainly on solid fuels. This and the use of poorquality coal by households, together with lowenergy efficiency in the residential sector producessubstantial urban air pollution, posing healthhazards, and heavy carbon emissions, whichcontribute to climate change.
-6
-4
-2
0
2
4
GR
CIT
APR
TES
PFI
NSV
ND
NK
EST
HU
NN
LD JPN
IRL
FRA
CZE
EA15
AUT
BEL
GBR
DEU
OEC
DSW
EU
SAC
HE
SVK
POL
TUR
220230240250260270280290300
ITA
ESP
FRA
IRL
POL
AUT
USA
DEU
DN
KG
BRKO
RO
ECD
CAN SV
KC
ZE BEL
EST
NO
RSW
EAU
SN
LD FIN
JPN
01020304050607080
AUS
NO
RFI
NIR
LSW
EU
SAD
NK
GBR PR
TES
PFR
AC
HE
EST
OEC
DSV
NAU
TN
LD ITA
DEU BE
LPO
LSV
KC
ZEH
UN
GR
C
EXECUTIVE SUMMARY
OECD ECONOMIC SURVEYS: POLAND © OECD 2016 13
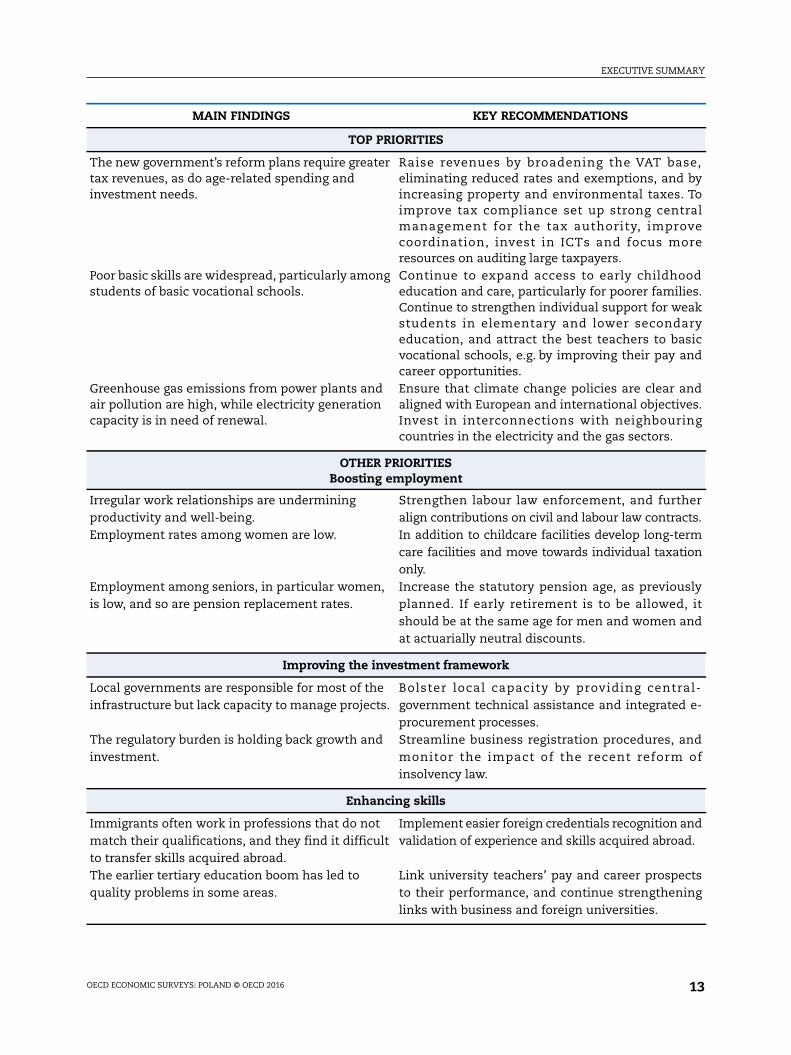
MAIN FINDINGS KEY RECOMMENDATIONS
TOP PRIORITIES
The new government’s reform plans require greatertax revenues, as do age-related spending andinvestment needs.
Raise revenues by broadening the VAT base,eliminating reduced rates and exemptions, and byincreasing property and environmental taxes. Toimprove tax compliance set up strong centralmanagement for the tax authority, improvecoordination, invest in ICTs and focus moreresources on auditing large taxpayers.
Poor basic skills are widespread, particularly amongstudents of basic vocational schools.
Continue to expand access to early childhoodeducation and care, particularly for poorer families.Continue to strengthen individual support for weakstudents in elementary and lower secondaryeducation, and attract the best teachers to basicvocational schools, e.g. by improving their pay andcareer opportunities.
Greenhouse gas emissions from power plants andair pollution are high, while electricity generationcapacity is in need of renewal.
Ensure that climate change policies are clear andaligned with European and international objectives.Invest in interconnections with neighbouringcountries in the electricity and the gas sectors.
OTHER PRIORITIESBoosting employment
Irregular work relationships are underminingproductivity and well-being.
Strengthen labour law enforcement, and furtheralign contributions on civil and labour law contracts.
Employment rates among women are low. In addition to childcare facilities develop long-termcare facilities and move towards individual taxationonly.
Employment among seniors, in particular women,is low, and so are pension replacement rates.
Increase the statutory pension age, as previouslyplanned. If early retirement is to be allowed, itshould be at the same age for men and women andat actuarially neutral discounts.
Improving the investment framework
Local governments are responsible for most of theinfrastructure but lack capacity to manage projects.
Bolster local capacity by providing central-government technical assistance and integrated e-procurement processes.
The regulatory burden is holding back growth andinvestment.
Streamline business registration procedures, andmonitor the impact of the recent reform ofinsolvency law.
Enhancing skills
Immigrants often work in professions that do notmatch their qualifications, and they find it difficultto transfer skills acquired abroad.
Implement easier foreign credentials recognition andvalidation of experience and skills acquired abroad.
The earlier tertiary education boom has led toquality problems in some areas.
Link university teachers’ pay and career prospectsto their performance, and continue strengtheninglinks with business and foreign universities.

OECD Economic Surveys: Poland
© OECD 2016
15
Assessment and recommendations
● Moving towards higher-technology production would raise living standards
● Growth is solid, and the labour market situation has improved significantly
● Macroeconomic policies
● Enhancing employment and access to high-quality jobs
● Ensuring efficient public infrastructure and better conditions for privateinvestment
● Further improving education to boost productivity and the ability to adoptinnovations
● Making better use of migrants’ skills
ASSESSMENT AND RECOMMENDATIONS
OECD ECONOMIC SURVEYS: POLAND © OECD 201616
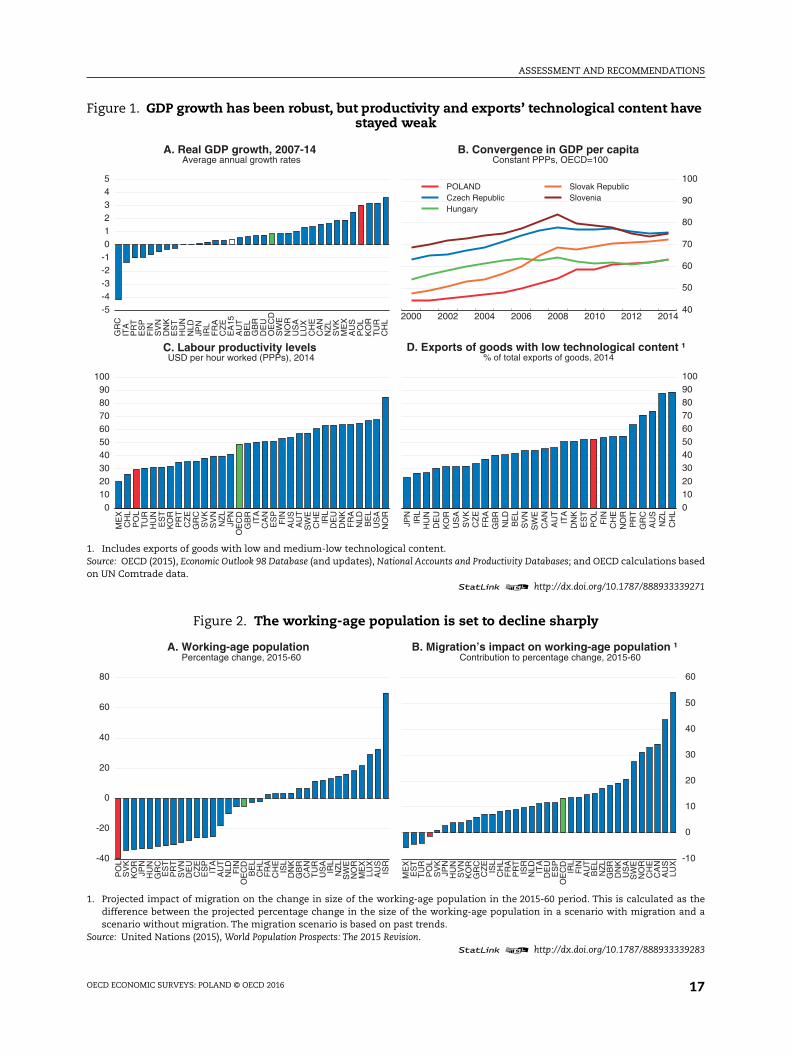
Moving towards higher-technology production would raise living standardsRemarkably resilient to the 2009 world economic and financial crisis, Poland has
continued to grow strongly (Figure 1 Panel A) and catch up with other OECD countries in
terms of GDP per capita (Panel B). Productivity has risen quickly, and this needs to continue
to sustain convergence with other OECD economies, as its level is still relatively low as is
the technology content of Poland’s exports (Panel C and D). Moreover, Poland faces severe
demographic pressures owing to low fertility and negative net migration, which will weigh
on GDP growth and on Poland’s ability to finance adequate pension and health-care
spending in the longer term. Based on past trends migration is not expected to mitigate the
sharp decline in the working-age population over the coming decades, unlike in many
other OECD countries (Figure 2), although recently immigration has been rising. The new
government has announced a welcome focus on strengthening skills and the economy’s
capacity to innovate, and its development plan foresees policies to strengthen investment
in productive capital and research and development. It wants to raise labour supply; the
envisaged increase in the coverage of preschools as well as the number of childcare places
for less than three year-olds will be helpful in this respect. It also aims to enhance
inclusiveness in a context of in-work poverty that is higher than the EU average. But plans
to lower the retirement age risk reversing progress in increasing seniors’ employment and
worsening old-age poverty.
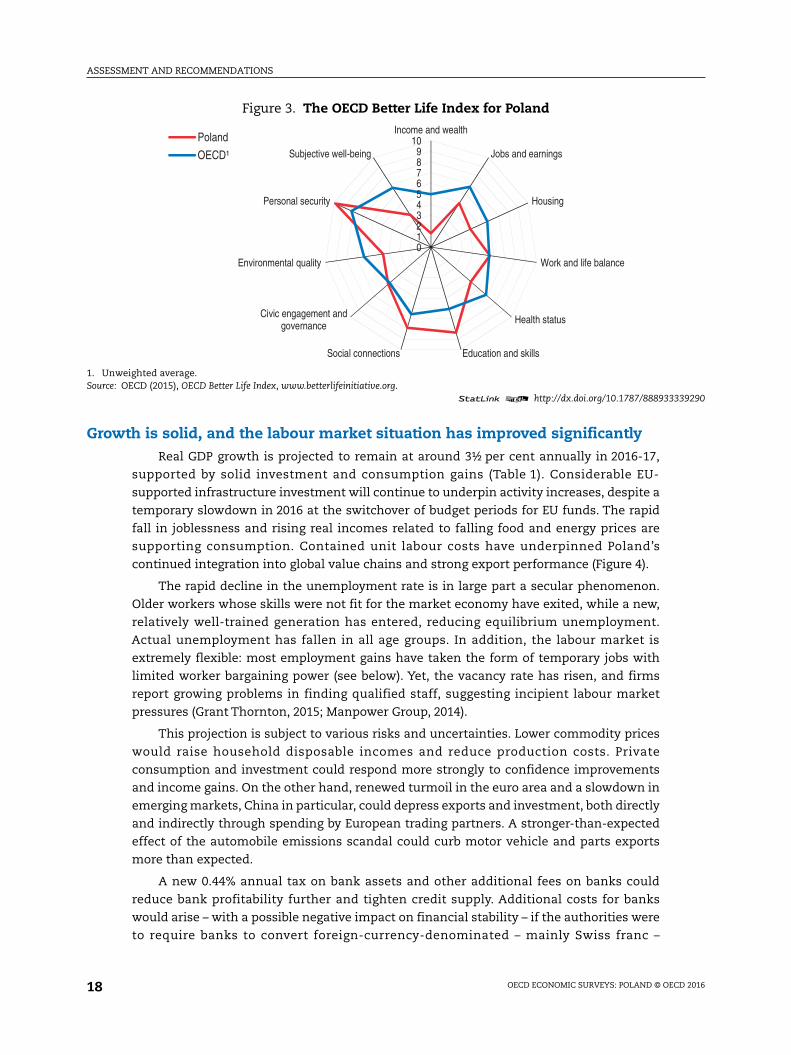
By 2016, the 20th anniversary of Poland’s OECD membership, it had achieved levels of
well-being and quality of life never before experienced. Poland scores higher than the
average OECD country on personal security, social connections and education owing to a
strong increase in tertiary attainment rates and high literacy and numeracy scores of
15 year-olds (Figure 3). Yet, jobs, housing and health outcomes are less favourable. The
main environmental problem in Poland is poor air quality reflected by high levels of urban
air pollution. It is related to the dependence on old and sometimes inefficient household
heating infrastructure based on low-quality coal and a heavy reliance on car transport.
Against this backdrop this Survey has three main messages:
● The economy has been resilient, with robust growth, falling unemployment and a stable
financial sector.
● Investment in low-emissions infrastructure and skills is essential to sustain a continued
improvement in living standards, environmental quality and well-being.
● Employment rates need to increase further to head off extreme demographic pressures,
and making Poland more attractive for workers would be beneficial.
ASSESSMENT AND RECOMMENDATIONS
OECD ECONOMIC SURVEYS: POLAND © OECD 2016 17
Figure 1. GDP growth has been robust, but productivity and exports’ technological content havestayed weak
1. Includes exports of goods with low and medium-low technological content.Source: OECD (2015), Economic Outlook 98 Database (and updates), National Accounts and Productivity Databases; and OECD calculations basedon UN Comtrade data.
1 2 http://dx.doi.org/10.1787/888933339271
Figure 2. The working-age population is set to decline sharply
1. Projected impact of migration on the change in size of the working-age population in the 2015-60 period. This is calculated as thedifference between the projected percentage change in the size of the working-age population in a scenario with migration and ascenario without migration. The migration scenario is based on past trends.
Source: United Nations (2015), World Population Prospects: The 2015 Revision.1 2 http://dx.doi.org/10.1787/888933339283
2000 2002 2004 2006 2008 2010 2012 2014
40
50
60
70
80
90
100 POLANDCzech RepublicHungary
Slovak RepublicSlovenia
B. Convergence in GDP per capitaConstant PPPs, OECD=100
-5-4-3-2-1012345
GR
CIT
AP
RT
ES
PF
INS
VN
DN
KE
ST
HU
NN
LDJP
NIR
LF
RA
CZ
EE
A15
AU
TB
EL
GB
RD
EU
OE
CD
SW
EN
OR
US
ALU
XC
HE
CA
NN
ZL
SV
KM
EX
AU
SP
OL
KO
RT
UR
CH
L
A. Real GDP growth, 2007-14Average annual growth rates
0102030405060708090
100
ME
XC
HL
PO
LT
UR
HU
NE
ST
KO
RP
RT
CZ
EG
RC
SV
KS
VN
NZ
LJP
NO
EC
DG
BR
ITA
CA
NE
SP
FIN
AU
SA
UT
SW
EC
HE
IRL
DE
UD
NK
FR
AN
LDB
EL
US
AN
OR
C. Labour productivity levelsUSD per hour worked (PPPs), 2014
01020
30405060708090100
JPN
IRL
HU
ND
EU
KO
RU
SA
SV
KC
ZE
FR
AG
BR
NLD
BE
LS
VN
SW
EC
AN
AU
TIT
AD
NK
ES
TP
OL
FIN
CH
EN
OR
PR
TG
RC
AU
SN
ZL
CH
L
D. Exports of goods with low technological content ¹% of total exports of goods, 2014
-40
-20
0
20
40
60
80
PO
LS
VK
KO
RJP
NH
UN
GR
CE
ST
PR
TS
VN
DE
UC
ZE
ES
PIT
AA
UT
NLD FIN
OE
CD
BE
LC
HL
FR
AC
HE
ISL
DN
KG
BR
CA
NT
UR
US
AIR
LN
ZL
SW
EN
OR
ME
XLU
XA
US
ISR
A. Working-age population Percentage change, 2015-60
-10
0
10
20
30
40
50
60
ME
XE
ST
TU
RP
OL
SV
KJP
NH
UN
SV
NK
OR
GR
CC
ZE
ISL
CH
LF
RA
PR
TIS
RN
LD ITA
DE
UE
SP
OE
CD
IRL
FIN
AU
TB
EL
NZ
LG
BR
DN
KU
SA
SW
EN
OR
CH
EC
AN
AU
SLU
X
B. Migration’s impact on working-age population ¹Contribution to percentage change, 2015-60
ASSESSMENT AND RECOMMENDATIONS
OECD ECONOMIC SURVEYS: POLAND © OECD 201618
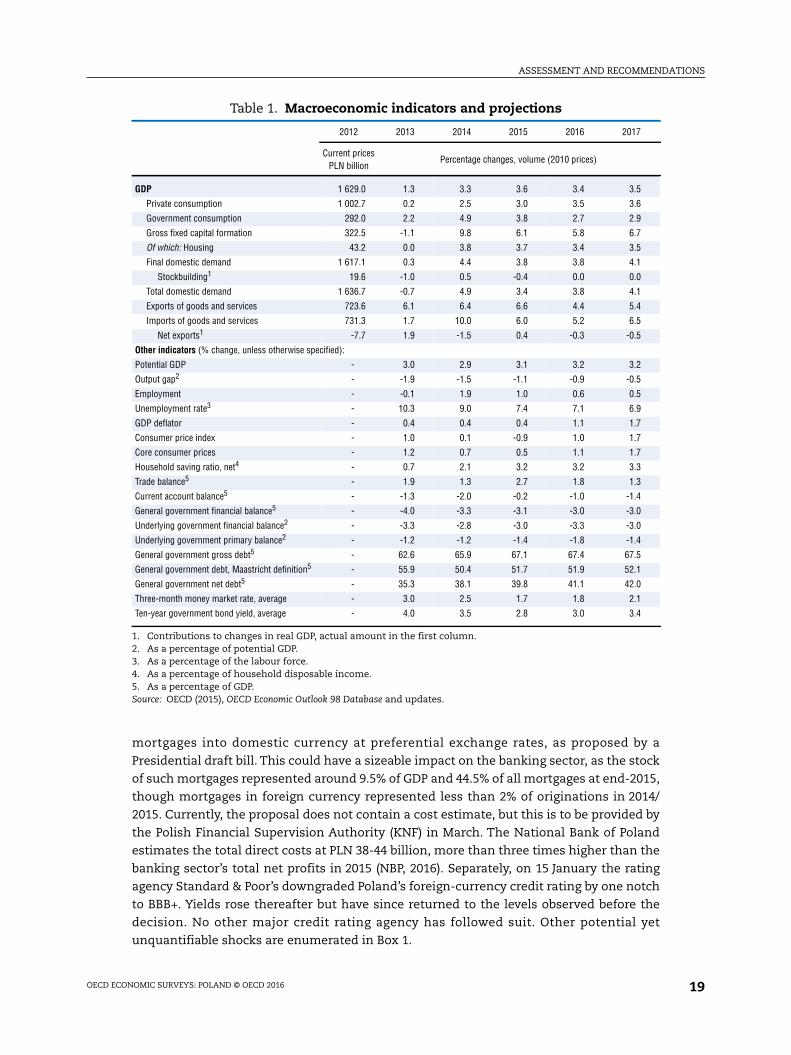
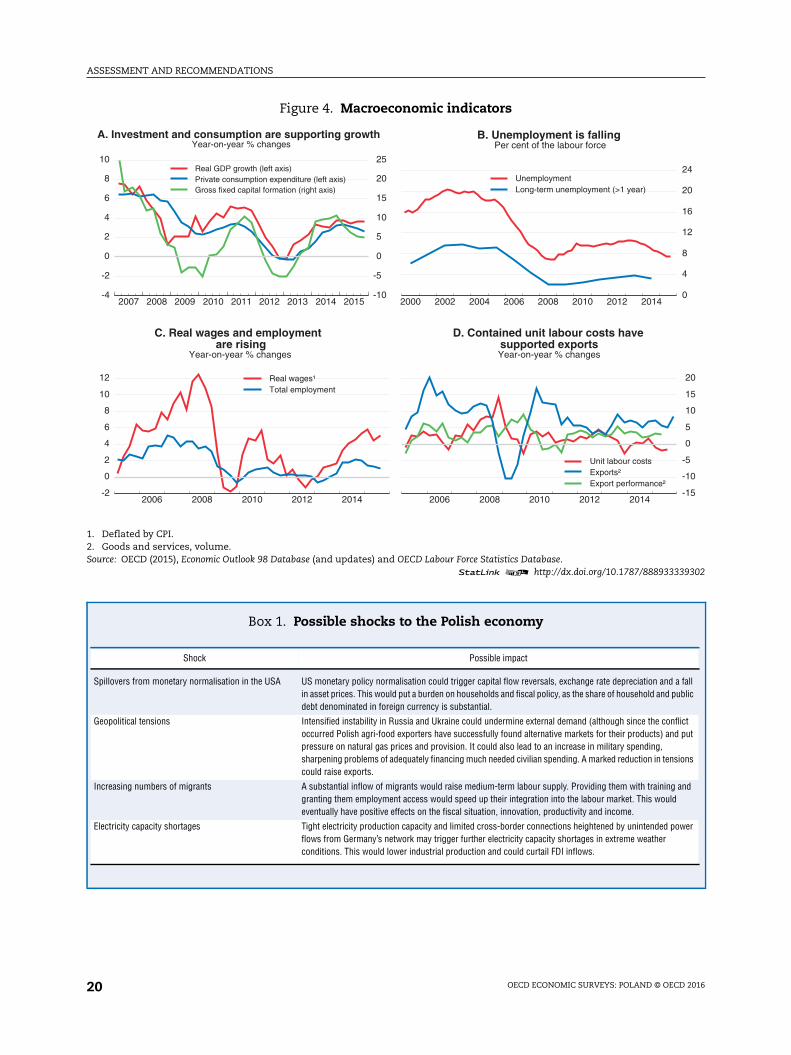
Growth is solid, and the labour market situation has improved significantlyReal GDP growth is projected to remain at around 3½ per cent annually in 2016-17,
supported by solid investment and consumption gains (Table 1). Considerable EU-
supported infrastructure investment will continue to underpin activity increases, despite a
temporary slowdown in 2016 at the switchover of budget periods for EU funds. The rapid
fall in joblessness and rising real incomes related to falling food and energy prices are
supporting consumption. Contained unit labour costs have underpinned Poland’s
continued integration into global value chains and strong export performance (Figure 4).
The rapid decline in the unemployment rate is in large part a secular phenomenon.
Older workers whose skills were not fit for the market economy have exited, while a new,
relatively well-trained generation has entered, reducing equilibrium unemployment.
Actual unemployment has fallen in all age groups. In addition, the labour market is
extremely flexible: most employment gains have taken the form of temporary jobs with
limited worker bargaining power (see below). Yet, the vacancy rate has risen, and firms
report growing problems in finding qualified staff, suggesting incipient labour market
pressures (Grant Thornton, 2015; Manpower Group, 2014).
This projection is subject to various risks and uncertainties. Lower commodity prices
would raise household disposable incomes and reduce production costs. Private
consumption and investment could respond more strongly to confidence improvements
and income gains. On the other hand, renewed turmoil in the euro area and a slowdown in
emerging markets, China in particular, could depress exports and investment, both directly
and indirectly through spending by European trading partners. A stronger-than-expected
effect of the automobile emissions scandal could curb motor vehicle and parts exports
more than expected.
A new 0.44% annual tax on bank assets and other additional fees on banks could
reduce bank profitability further and tighten credit supply. Additional costs for banks
would arise – with a possible negative impact on financial stability – if the authorities were
to require banks to convert foreign-currency-denominated – mainly Swiss franc –
Figure 3. The OECD Better Life Index for Poland
1. Unweighted average.Source: OECD (2015), OECD Better Life Index, www.betterlifeinitiative.org.
1 2 http://dx.doi.org/10.1787/888933339290
0 1 2 3 4 5 6 7 8 9
10Income and wealth
Jobs and earnings
Housing
Work and life balance
Health status
Education and skillsSocial connections
Civic engagement andgovernance
Environmental quality
Personal security
Subjective well-being
Poland
OECD¹
ASSESSMENT AND RECOMMENDATIONS
OECD ECONOMIC SURVEYS: POLAND © OECD 2016 19
mortgages into domestic currency at preferential exchange rates, as proposed by a
Presidential draft bill. This could have a sizeable impact on the banking sector, as the stock
of such mortgages represented around 9.5% of GDP and 44.5% of all mortgages at end-2015,
though mortgages in foreign currency represented less than 2% of originations in 2014/
2015. Currently, the proposal does not contain a cost estimate, but this is to be provided by
the Polish Financial Supervision Authority (KNF) in March. The National Bank of Poland
estimates the total direct costs at PLN 38-44 billion, more than three times higher than the
banking sector’s total net profits in 2015 (NBP, 2016). Separately, on 15 January the rating
agency Standard & Poor’s downgraded Poland’s foreign-currency credit rating by one notch
to BBB+. Yields rose thereafter but have since returned to the levels observed before the
decision. No other major credit rating agency has followed suit. Other potential yet
unquantifiable shocks are enumerated in Box 1.
Table 1. Macroeconomic indicators and projections
2012 2013 2014 2015 2016 2017
Current pricesPLN billion
Percentage changes, volume (2010 prices)
GDP 1 629.0 1.3 3.3 3.6 3.4 3.5
Private consumption 1 002.7 0.2 2.5 3.0 3.5 3.6
Government consumption 292.0 2.2 4.9 3.8 2.7 2.9
Gross fixed capital formation 322.5 -1.1 9.8 6.1 5.8 6.7
Of which: Housing 43.2 0.0 3.8 3.7 3.4 3.5
Final domestic demand 1 617.1 0.3 4.4 3.8 3.8 4.1
Stockbuilding1 19.6 -1.0 0.5 -0.4 0.0 0.0
Total domestic demand 1 636.7 -0.7 4.9 3.4 3.8 4.1
Exports of goods and services 723.6 6.1 6.4 6.6 4.4 5.4
Imports of goods and services 731.3 1.7 10.0 6.0 5.2 6.5
Net exports1 -7.7 1.9 -1.5 0.4 -0.3 -0.5
Other indicators (% change, unless otherwise specified):
Potential GDP - 3.0 2.9 3.1 3.2 3.2
Output gap2 - -1.9 -1.5 -1.1 -0.9 -0.5
Employment - -0.1 1.9 1.0 0.6 0.5
Unemployment rate3 - 10.3 9.0 7.4 7.1 6.9
GDP deflator - 0.4 0.4 0.4 1.1 1.7
Consumer price index - 1.0 0.1 -0.9 1.0 1.7
Core consumer prices - 1.2 0.7 0.5 1.1 1.7
Household saving ratio, net4 - 0.7 2.1 3.2 3.2 3.3
Trade balance5 - 1.9 1.3 2.7 1.8 1.3
Current account balance5 - -1.3 -2.0 -0.2 -1.0 -1.4
General government financial balance5 - -4.0 -3.3 -3.1 -3.0 -3.0
Underlying government financial balance2 - -3.3 -2.8 -3.0 -3.3 -3.0
Underlying government primary balance2 - -1.2 -1.2 -1.4 -1.8 -1.4
General government gross debt5 - 62.6 65.9 67.1 67.4 67.5
General government debt, Maastricht definition5 - 55.9 50.4 51.7 51.9 52.1
General government net debt5 - 35.3 38.1 39.8 41.1 42.0
Three-month money market rate, average - 3.0 2.5 1.7 1.8 2.1
Ten-year government bond yield, average - 4.0 3.5 2.8 3.0 3.4
1. Contributions to changes in real GDP, actual amount in the first column.2. As a percentage of potential GDP.3. As a percentage of the labour force.4. As a percentage of household disposable income.5. As a percentage of GDP.Source: OECD (2015), OECD Economic Outlook 98 Database and updates.
ASSESSMENT AND RECOMMENDATIONS
OECD ECONOMIC SURVEYS: POLAND © OECD 201620
Figure 4. Macroeconomic indicators
1. Deflated by CPI.2. Goods and services, volume.Source: OECD (2015), Economic Outlook 98 Database (and updates) and OECD Labour Force Statistics Database.
1 2 http://dx.doi.org/10.1787/888933339302
Box 1. Possible shocks to the Polish economy
2007 2008 2009 2010 2011 2012 2013 2014 2015-4
-2
0
2
4
6
8
10
-10
-5
0
5
10
15
20
25 Real GDP growth (left axis)Private consumption expenditure (left axis)Gross fixed capital formation (right axis)
A. Investment and consumption are supporting growthYear-on-year % changes
2000 2002 2004 2006 2008 2010 2012 2014
0
4
8
12
16
20
24 UnemploymentLong-term unemployment (>1 year)
B. Unemployment is fallingPer cent of the labour force
2006 2008 2010 2012 2014-2
0
2
4
6
8
10
12
Real wages¹Total employment
C. Real wages and employment are rising
Year-on-year % changes
2006 2008 2010 2012 2014
-15
-10
-5
0
5
10
15
20
Unit labour costsExports²Export performance²
D. Contained unit labour costs havesupported exportsYear-on-year % changes
Shock Possible impact
Spillovers from monetary normalisation in the USA US monetary policy normalisation could trigger capital flow reversals, exchange rate depreciation and a fallin asset prices. This would put a burden on households and fiscal policy, as the share of household and publicdebt denominated in foreign currency is substantial.
Geopolitical tensions Intensified instability in Russia and Ukraine could undermine external demand (although since the conflictoccurred Polish agri-food exporters have successfully found alternative markets for their products) and putpressure on natural gas prices and provision. It could also lead to an increase in military spending,sharpening problems of adequately financing much needed civilian spending. A marked reduction in tensionscould raise exports.
Increasing numbers of migrants A substantial inflow of migrants would raise medium-term labour supply. Providing them with training andgranting them employment access would speed up their integration into the labour market. This wouldeventually have positive effects on the fiscal situation, innovation, productivity and income.
Electricity capacity shortages Tight electricity production capacity and limited cross-border connections heightened by unintended powerflows from Germany’s network may trigger further electricity capacity shortages in extreme weatherconditions. This would lower industrial production and could curtail FDI inflows.
ASSESSMENT AND RECOMMENDATIONS
OECD ECONOMIC SURVEYS: POLAND © OECD 2016 21
Macroeconomic policies
The government needs higher revenues to finance its programmes
The new government has confirmed its determination to keep the deficit below 3% of
GDP. Yet, implementing a number of government priorities would imply higher spending or
lower revenues (Box 2), while new taxes already adopted or under discussion would yield
revenues of a much smaller order. Some modest further income could be forthcoming from
greater efforts to reduce tax evasion, especially in the VAT.
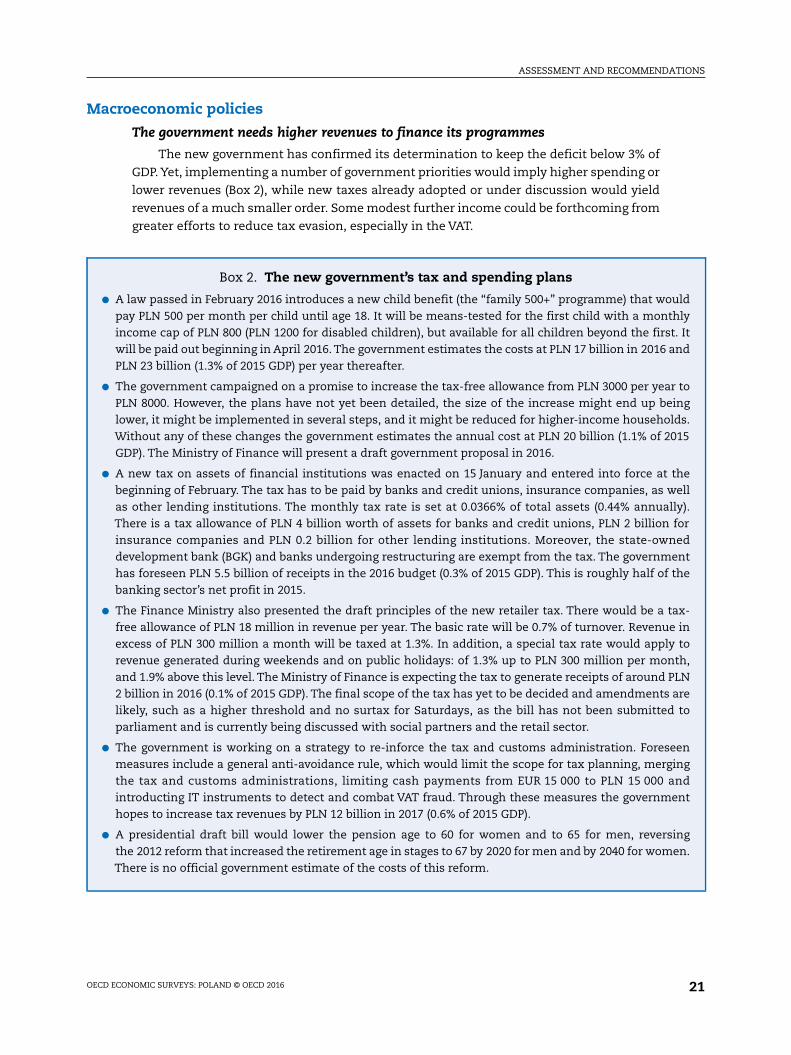
Box 2. The new government’s tax and spending plans
● A law passed in February 2016 introduces a new child benefit (the “family 500+” programme) that wouldpay PLN 500 per month per child until age 18. It will be means-tested for the first child with a monthlyincome cap of PLN 800 (PLN 1200 for disabled children), but available for all children beyond the first. Itwill be paid out beginning in April 2016. The government estimates the costs at PLN 17 billion in 2016 andPLN 23 billion (1.3% of 2015 GDP) per year thereafter.
● The government campaigned on a promise to increase the tax-free allowance from PLN 3000 per year toPLN 8000. However, the plans have not yet been detailed, the size of the increase might end up beinglower, it might be implemented in several steps, and it might be reduced for higher-income households.Without any of these changes the government estimates the annual cost at PLN 20 billion (1.1% of 2015GDP). The Ministry of Finance will present a draft government proposal in 2016.
● A new tax on assets of financial institutions was enacted on 15 January and entered into force at thebeginning of February. The tax has to be paid by banks and credit unions, insurance companies, as wellas other lending institutions. The monthly tax rate is set at 0.0366% of total assets (0.44% annually).There is a tax allowance of PLN 4 billion worth of assets for banks and credit unions, PLN 2 billion forinsurance companies and PLN 0.2 billion for other lending institutions. Moreover, the state-owneddevelopment bank (BGK) and banks undergoing restructuring are exempt from the tax. The governmenthas foreseen PLN 5.5 billion of receipts in the 2016 budget (0.3% of 2015 GDP). This is roughly half of thebanking sector’s net profit in 2015.
● The Finance Ministry also presented the draft principles of the new retailer tax. There would be a tax-free allowance of PLN 18 million in revenue per year. The basic rate will be 0.7% of turnover. Revenue inexcess of PLN 300 million a month will be taxed at 1.3%. In addition, a special tax rate would apply torevenue generated during weekends and on public holidays: of 1.3% up to PLN 300 million per month,and 1.9% above this level. The Ministry of Finance is expecting the tax to generate receipts of around PLN2 billion in 2016 (0.1% of 2015 GDP). The final scope of the tax has yet to be decided and amendments arelikely, such as a higher threshold and no surtax for Saturdays, as the bill has not been submitted toparliament and is currently being discussed with social partners and the retail sector.
● The government is working on a strategy to re-inforce the tax and customs administration. Foreseenmeasures include a general anti-avoidance rule, which would limit the scope for tax planning, mergingthe tax and customs administrations, limiting cash payments from EUR 15 000 to PLN 15 000 andintroducting IT instruments to detect and combat VAT fraud. Through these measures the governmenthopes to increase tax revenues by PLN 12 billion in 2017 (0.6% of 2015 GDP).
● A presidential draft bill would lower the pension age to 60 for women and to 65 for men, reversingthe 2012 reform that increased the retirement age in stages to 67 by 2020 for men and by 2040 for women.There is no official government estimate of the costs of this reform.
ASSESSMENT AND RECOMMENDATIONS
OECD ECONOMIC SURVEYS: POLAND © OECD 201622
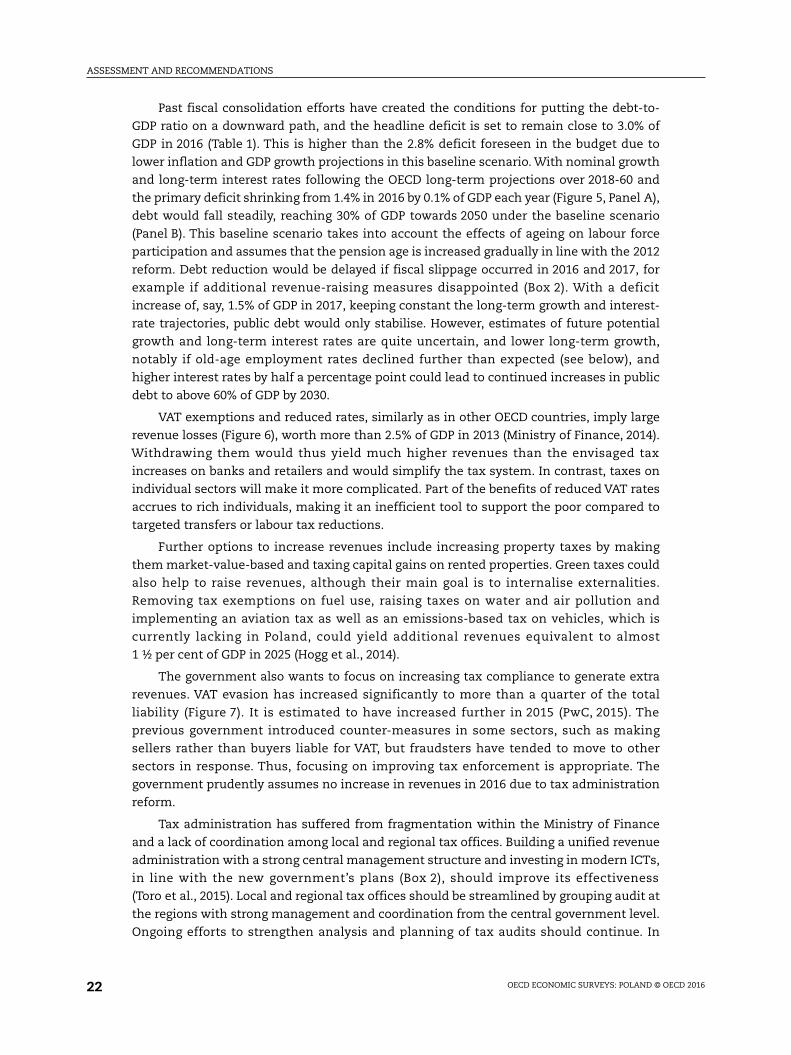
Past fiscal consolidation efforts have created the conditions for putting the debt-to-
GDP ratio on a downward path, and the headline deficit is set to remain close to 3.0% of
GDP in 2016 (Table 1). This is higher than the 2.8% deficit foreseen in the budget due to
lower inflation and GDP growth projections in this baseline scenario. With nominal growth
and long-term interest rates following the OECD long-term projections over 2018-60 and
the primary deficit shrinking from 1.4% in 2016 by 0.1% of GDP each year (Figure 5, Panel A),
debt would fall steadily, reaching 30% of GDP towards 2050 under the baseline scenario
(Panel B). This baseline scenario takes into account the effects of ageing on labour force
participation and assumes that the pension age is increased gradually in line with the 2012
reform. Debt reduction would be delayed if fiscal slippage occurred in 2016 and 2017, for
example if additional revenue-raising measures disappointed (Box 2). With a deficit
increase of, say, 1.5% of GDP in 2017, keeping constant the long-term growth and interest-
rate trajectories, public debt would only stabilise. However, estimates of future potential
growth and long-term interest rates are quite uncertain, and lower long-term growth,
notably if old-age employment rates declined further than expected (see below), and
higher interest rates by half a percentage point could lead to continued increases in public
debt to above 60% of GDP by 2030.
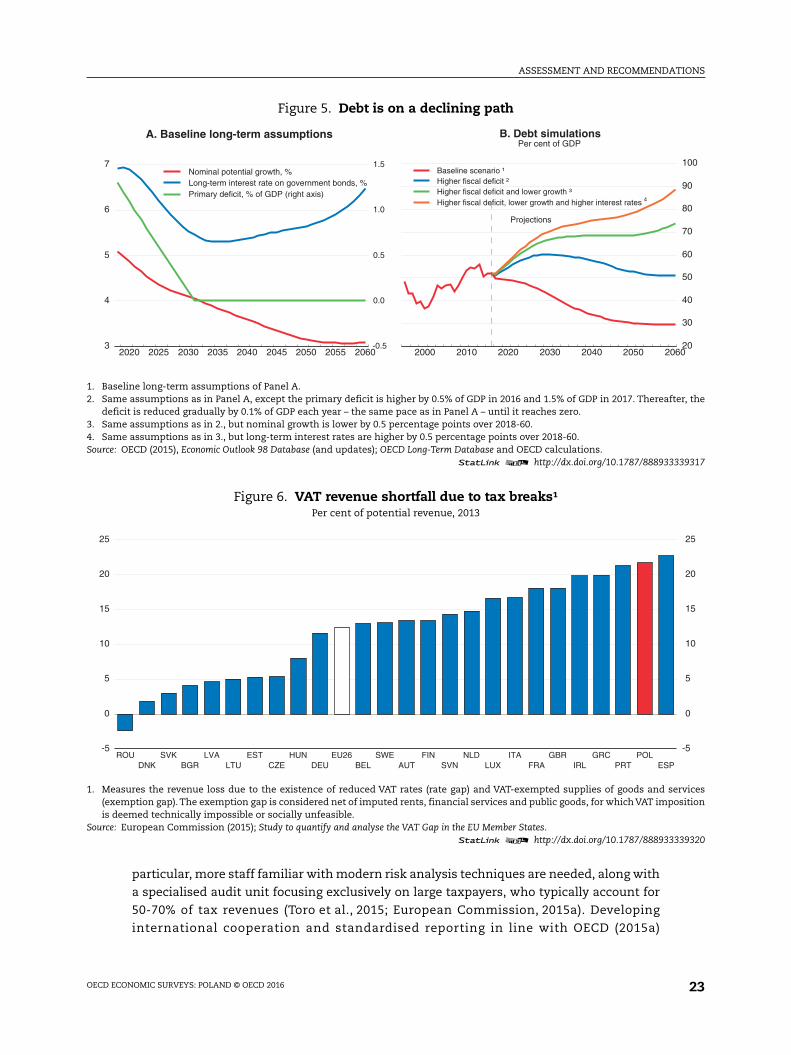
VAT exemptions and reduced rates, similarly as in other OECD countries, imply large
revenue losses (Figure 6), worth more than 2.5% of GDP in 2013 (Ministry of Finance, 2014).
Withdrawing them would thus yield much higher revenues than the envisaged tax
increases on banks and retailers and would simplify the tax system. In contrast, taxes on
individual sectors will make it more complicated. Part of the benefits of reduced VAT rates
accrues to rich individuals, making it an inefficient tool to support the poor compared to
targeted transfers or labour tax reductions.
Further options to increase revenues include increasing property taxes by making
them market-value-based and taxing capital gains on rented properties. Green taxes could
also help to raise revenues, although their main goal is to internalise externalities.
Removing tax exemptions on fuel use, raising taxes on water and air pollution and
implementing an aviation tax as well as an emissions-based tax on vehicles, which is
currently lacking in Poland, could yield additional revenues equivalent to almost
1 ½ per cent of GDP in 2025 (Hogg et al., 2014).
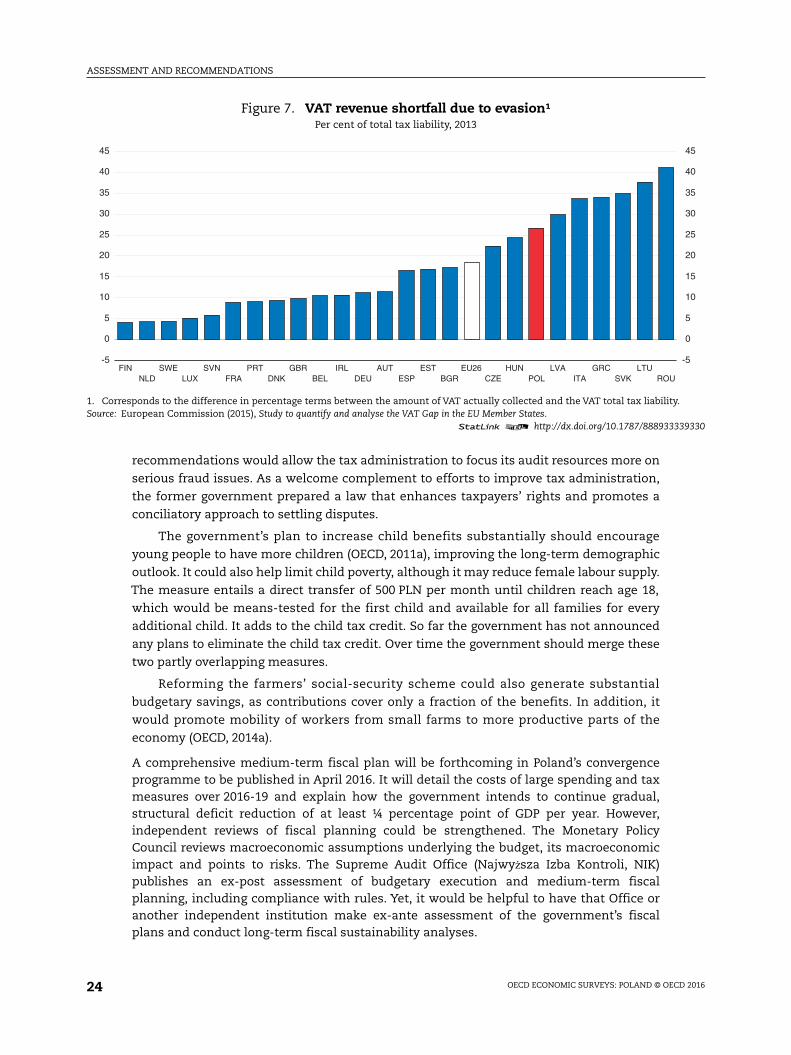
The government also wants to focus on increasing tax compliance to generate extra
revenues. VAT evasion has increased significantly to more than a quarter of the total
liability (Figure 7). It is estimated to have increased further in 2015 (PwC, 2015). The
previous government introduced counter-measures in some sectors, such as making
sellers rather than buyers liable for VAT, but fraudsters have tended to move to other
sectors in response. Thus, focusing on improving tax enforcement is appropriate. The
government prudently assumes no increase in revenues in 2016 due to tax administration
reform.
Tax administration has suffered from fragmentation within the Ministry of Finance
and a lack of coordination among local and regional tax offices. Building a unified revenue
administration with a strong central management structure and investing in modern ICTs,
in line with the new government’s plans (Box 2), should improve its effectiveness
(Toro et al., 2015). Local and regional tax offices should be streamlined by grouping audit at
the regions with strong management and coordination from the central government level.
Ongoing efforts to strengthen analysis and planning of tax audits should continue. In
ASSESSMENT AND RECOMMENDATIONS
OECD ECONOMIC SURVEYS: POLAND © OECD 2016 23
particular, more staff familiar with modern risk analysis techniques are needed, along with
a specialised audit unit focusing exclusively on large taxpayers, who typically account for
50-70% of tax revenues (Toro et al., 2015; European Commission, 2015a). Developing
international cooperation and standardised reporting in line with OECD (2015a)
Figure 5. Debt is on a declining path
1. Baseline long-term assumptions of Panel A.2. Same assumptions as in Panel A, except the primary deficit is higher by 0.5% of GDP in 2016 and 1.5% of GDP in 2017. Thereafter, the
deficit is reduced gradually by 0.1% of GDP each year – the same pace as in Panel A – until it reaches zero.3. Same assumptions as in 2., but nominal growth is lower by 0.5 percentage points over 2018-60.4. Same assumptions as in 3., but long-term interest rates are higher by 0.5 percentage points over 2018-60.Source: OECD (2015), Economic Outlook 98 Database (and updates); OECD Long-Term Database and OECD calculations.
1 2 http://dx.doi.org/10.1787/888933339317
Figure 6. VAT revenue shortfall due to tax breaks¹Per cent of potential revenue, 2013
1. Measures the revenue loss due to the existence of reduced VAT rates (rate gap) and VAT-exempted supplies of goods and services(exemption gap). The exemption gap is considered net of imputed rents, financial services and public goods, for which VAT impositionis deemed technically impossible or socially unfeasible.
Source: European Commission (2015); Study to quantify and analyse the VAT Gap in the EU Member States.1 2 http://dx.doi.org/10.1787/888933339320
2000 2010 2020 2030 2040 2050 2060
20
30
40
50
60
70
80
90
100
4
Projections
Baseline scenario ¹Higher fiscal deficit ²Higher fiscal deficit and lower growth ³Higher fiscal deficit, lower growth and higher interest rates
B. Debt simulationsPer cent of GDP
2020 2025 2030 2035 2040 2045 2050 2055 20603
4
5
6
7
-0.5
0.0
0.5
1.0
1.5 Nominal potential growth, %Long-term interest rate on government bonds, %Primary deficit, % of GDP (right axis)
A. Baseline long-term assumptions
-5
0
5
10
15
20
25
-5
0
5
10
15
20
25
ROUDNK
SVKBGR
LVALTU
ESTCZE
HUNDEU
EU26BEL
SWEAUT
FINSVN
NLDLUX
ITAFRA
GBRIRL
GRCPRT
POLESP
ASSESSMENT AND RECOMMENDATIONS
OECD ECONOMIC SURVEYS: POLAND © OECD 201624
recommendations would allow the tax administration to focus its audit resources more on
serious fraud issues. As a welcome complement to efforts to improve tax administration,
the former government prepared a law that enhances taxpayers’ rights and promotes a
conciliatory approach to settling disputes.
The government’s plan to increase child benefits substantially should encourage
young people to have more children (OECD, 2011a), improving the long-term demographic
outlook. It could also help limit child poverty, although it may reduce female labour supply.
The measure entails a direct transfer of 500 PLN per month until children reach age 18,
which would be means-tested for the first child and available for all families for every
additional child. It adds to the child tax credit. So far the government has not announced
any plans to eliminate the child tax credit. Over time the government should merge these
two partly overlapping measures.
Reforming the farmers’ social-security scheme could also generate substantial
budgetary savings, as contributions cover only a fraction of the benefits. In addition, it
would promote mobility of workers from small farms to more productive parts of the
economy (OECD, 2014a).
A comprehensive medium-term fiscal plan will be forthcoming in Poland’s convergenceprogramme to be published in April 2016. It will detail the costs of large spending and taxmeasures over 2016-19 and explain how the government intends to continue gradual,structural deficit reduction of at least ¼ percentage point of GDP per year. However,independent reviews of fiscal planning could be strengthened. The Monetary PolicyCouncil reviews macroeconomic assumptions underlying the budget, its macroeconomicimpact and points to risks. The Supreme Audit Office (Najwyższa Izba Kontroli, NIK)publishes an ex-post assessment of budgetary execution and medium-term fiscalplanning, including compliance with rules. Yet, it would be helpful to have that Office oranother independent institution make ex-ante assessment of the government’s fiscalplans and conduct long-term fiscal sustainability analyses.
Figure 7. VAT revenue shortfall due to evasion¹Per cent of total tax liability, 2013
1. Corresponds to the difference in percentage terms between the amount of VAT actually collected and the VAT total tax liability.Source: European Commission (2015), Study to quantify and analyse the VAT Gap in the EU Member States.
1 2 http://dx.doi.org/10.1787/888933339330
-5
0
5
10
15
20
25
30
35
40
45
-5
0
5
10
15
20
25
30
35
40
45
FINNLD
SWELUX
SVNFRA
PRTDNK
GBRBEL
IRLDEU
AUTESP
ESTBGR
EU26CZE
HUNPOL
LVAITA
GRCSVK
LTUROU
ASSESSMENT AND RECOMMENDATIONS
OECD ECONOMIC SURVEYS: POLAND © OECD 2016 25
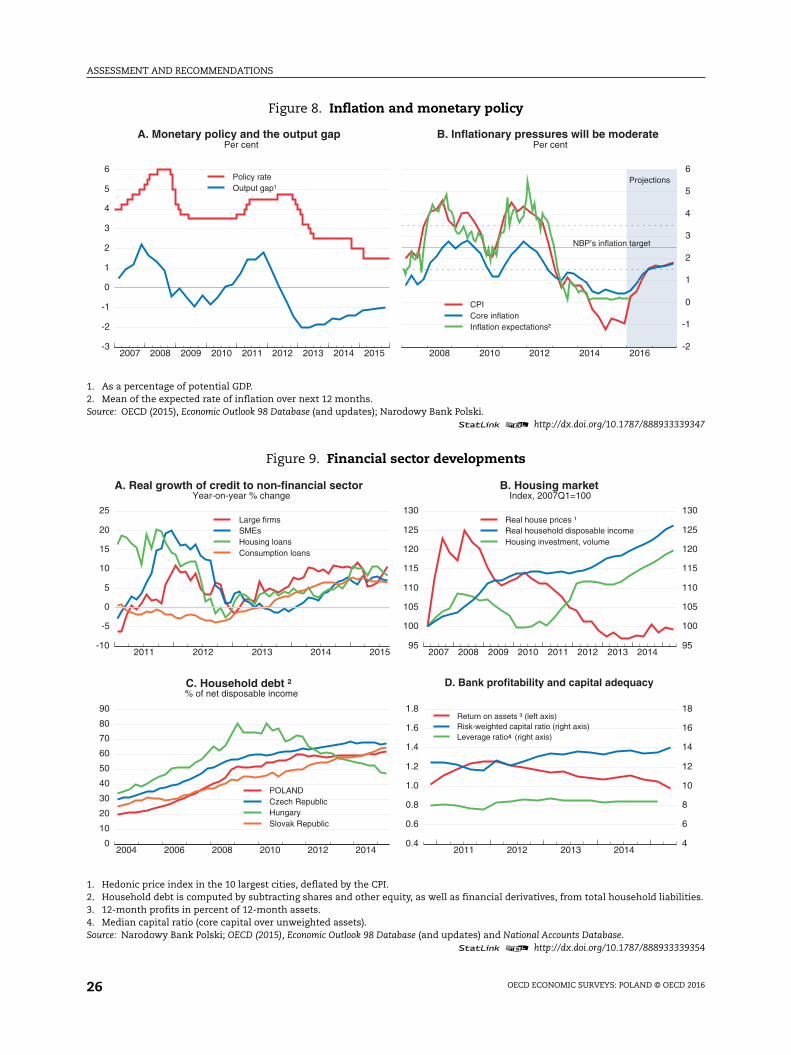
Monetary policy faces challenges
The central bank has kept the official interest rate at a record low of 1.5% since
March 2015 (Figure 8, Panel A). Inflation has been well below the medium-term inflation
target of 2.5% (with a tolerance band of ±1 percentage point) for three years and has been
negative since July 2014. Deflation reflects mainly global factors, such as low food prices
and recurring declines in energy prices. Yet, core inflation remains close to zero. Inflation
expectations have also fallen to record lows, although in Poland expectations tend to follow
the actual inflation rate, and the decline is therefore unlikely to become self-fulfilling
(Panel B). Unemployment is probably close to its equilibrium, and the output gap is mildly
negative, yet nominal wage growth has failed to pick up. The zloty has fallen fairly steadily
since May 2015, and there is much uncertainty surrounding fiscal policy, which may prove
to be expansionary. Should inflation pressures build gradually, in line with OECD
projections, there would be a case from a purely domestic perspective for the central bank
to start increasing rates fairly soon. However, the central bank should proceed with
caution, as there are ongoing headwinds to activity from slowing emerging markets and
risks of financial turbulence, for example from potential tensions from divergent moves
between US and euro-area monetary policies. These considerations justify keeping rates
low for the time being. Should inflation continue to be quiescent and remain below target,
interest rate reductions should be considered.
The financial system remains sound
Despite historically low interest rates, there are no signs of asset price bubbles nor
unwarranted debt accumulation. Real credit growth has picked up (Figure 9, Panel A), but
house prices have been broadly flat (Panel B), and household indebtedness has remained
fairly constant overall (Panel C). Non-financial corporate debt has been stable in recent
years at 46% of GDP (16% of GDP for bank credit; foreign debt stands at around 19% GDP).
Poland’s largely foreign-owned banking system remains well capitalised and liquid
(Panel D), and the core Tier 1 capital-adequacy ratio, at 14.3%, stood well above Basel III
requirements at end-September 2015. Leverage has been stable at a moderate level.
However, the profitability of the banking sector is declining, due to narrowing interest rate
margins (NBP, 2015). Moreover, bank costs are set to rise, as they are to contribute to a new
fund for distressed debtors, which adds to a new asset tax and higher contributions to the
bank-guarantee fund. These three measures would amount to around half of 2014 bank
profits. As mentioned above, the authorities are also considering requiring banks to
convert foreign-denominated mortgages into domestic currency at preferential exchange
rates. These additional burdens may have a negative effect on financial stability by
reducing the profitability of the banking sector and its capital position. This in turn would
limit credit to the real economy.
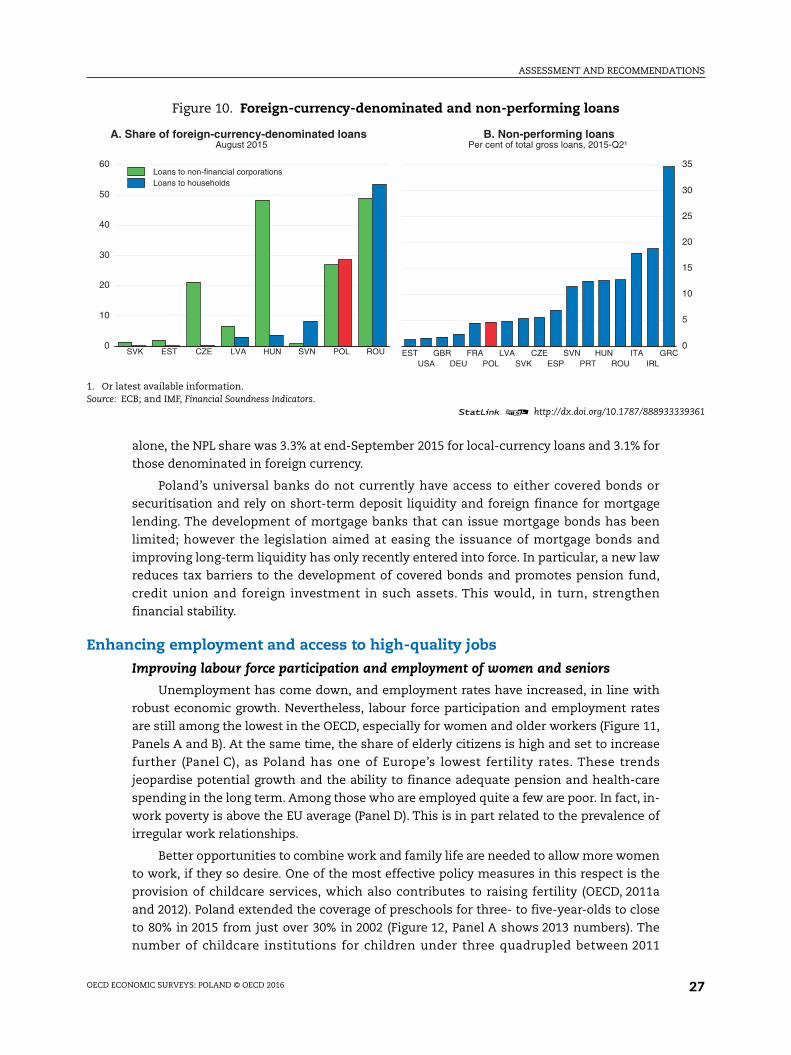
Credit risks remain limited. A significant share of loans to households and non-
financial corporations (Figure 10, Panel A) is in foreign currency. Yet, since 2014 banks have
been allowed to provide foreign currency (FX) mortgages only to households with a steady
income in the same currency. This has stopped new origination of such loans. FX
mortgages are concentrated among the wealthiest households (NBP, 2013), and
intercompany loans represent a majority of non-financial corporations’ FX loans,
mitigating apparent vulnerabilities (IMF, 2015). The financial sector was resilient to the
abrupt depreciation of the domestic currency against the Swiss franc in January 2015. The
share of non-performing loans (NPLs) remains relatively low (Panel B). For mortgages
ASSESSMENT AND RECOMMENDATIONS
OECD ECONOMIC SURVEYS: POLAND © OECD 201626
Figure 8. Inflation and monetary policy
1. As a percentage of potential GDP.2. Mean of the expected rate of inflation over next 12 months.Source: OECD (2015), Economic Outlook 98 Database (and updates); Narodowy Bank Polski.
1 2 http://dx.doi.org/10.1787/888933339347
Figure 9. Financial sector developments
1. Hedonic price index in the 10 largest cities, deflated by the CPI.2. Household debt is computed by subtracting shares and other equity, as well as financial derivatives, from total household liabilities.3. 12-month profits in percent of 12-month assets.4. Median capital ratio (core capital over unweighted assets).Source: Narodowy Bank Polski; OECD (2015), Economic Outlook 98 Database (and updates) and National Accounts Database.
1 2 http://dx.doi.org/10.1787/888933339354
2007 2008 2009 2010 2011 2012 2013 2014 2015-3
-2
-1
0
1
2
3
4
5
6 Policy rateOutput gap¹
A. Monetary policy and the output gapPer cent
2008 2010 2012 2014 2016
-2
-1
0
1
2
3
4
5
6
Projections
NBP’s inflation target
CPICore inflationInflation expectations²
B. Inflationary pressures will be moderatePer cent
2011 2012 2013 2014 2015-10
-5
0
5
10
15
20
25 Large firmsSMEsHousing loansConsumption loans
A. Real growth of credit to non-financial sectorYear-on-year % change
2007 2008 2009 2010 2011 2012 2013 201495
100
105
110
115
120
125
130
95
100
105
110
115
120
125
130 Real house prices ¹Real household disposable incomeHousing investment, volume
B. Housing marketIndex, 2007Q1=100
2004 2006 2008 2010 2012 20140
10
20
30
40
50
60
70
80
90
POLANDCzech RepublicHungarySlovak Republic
C. Household debt ²% of net disposable income
2011 2012 2013 20140.4
0.6
0.8
1.0
1.2
1.4
1.6
1.8
4
6
8
10
12
14
16
18
4
Return on assets ³ (left axis)Risk-weighted capital ratio (right axis)Leverage ratio (right axis)
D. Bank profitability and capital adequacy
ASSESSMENT AND RECOMMENDATIONS
OECD ECONOMIC SURVEYS: POLAND © OECD 2016 27
alone, the NPL share was 3.3% at end-September 2015 for local-currency loans and 3.1% for
those denominated in foreign currency.
Poland’s universal banks do not currently have access to either covered bonds or
securitisation and rely on short-term deposit liquidity and foreign finance for mortgage
lending. The development of mortgage banks that can issue mortgage bonds has been
limited; however the legislation aimed at easing the issuance of mortgage bonds and
improving long-term liquidity has only recently entered into force. In particular, a new law
reduces tax barriers to the development of covered bonds and promotes pension fund,
credit union and foreign investment in such assets. This would, in turn, strengthen
financial stability.
Enhancing employment and access to high-quality jobs
Improving labour force participation and employment of women and seniors
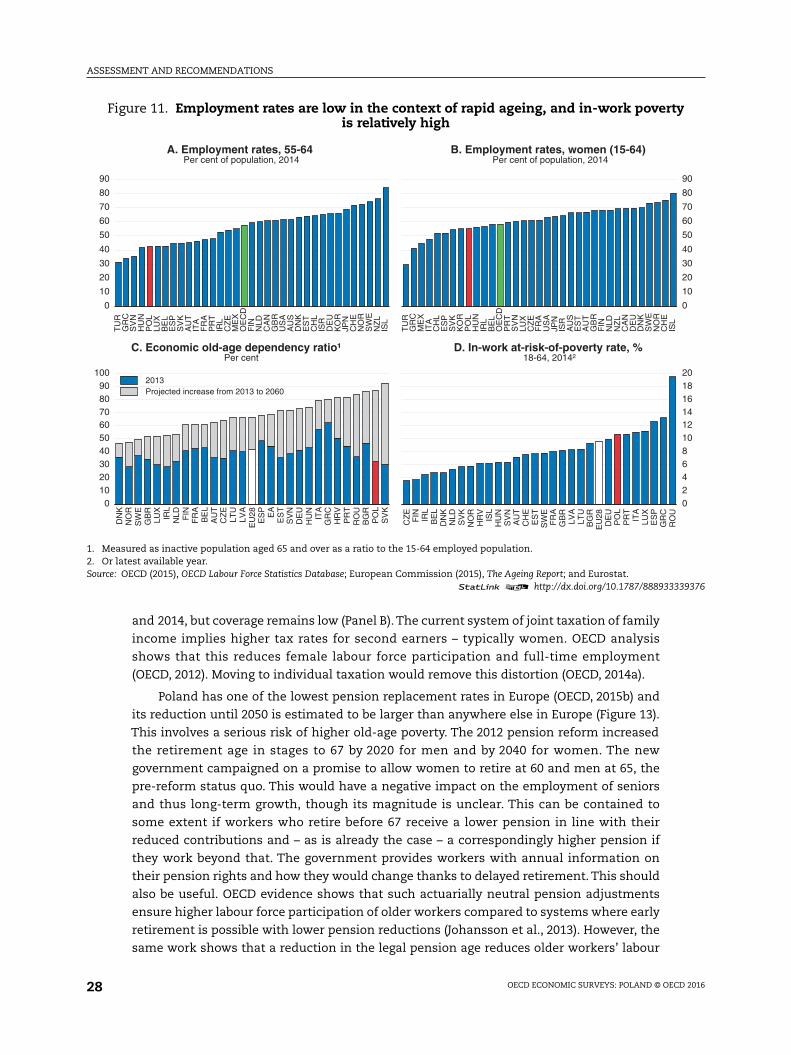
Unemployment has come down, and employment rates have increased, in line with
robust economic growth. Nevertheless, labour force participation and employment rates
are still among the lowest in the OECD, especially for women and older workers (Figure 11,
Panels A and B). At the same time, the share of elderly citizens is high and set to increase
further (Panel C), as Poland has one of Europe’s lowest fertility rates. These trends
jeopardise potential growth and the ability to finance adequate pension and health-care
spending in the long term. Among those who are employed quite a few are poor. In fact, in-
work poverty is above the EU average (Panel D). This is in part related to the prevalence of
irregular work relationships.
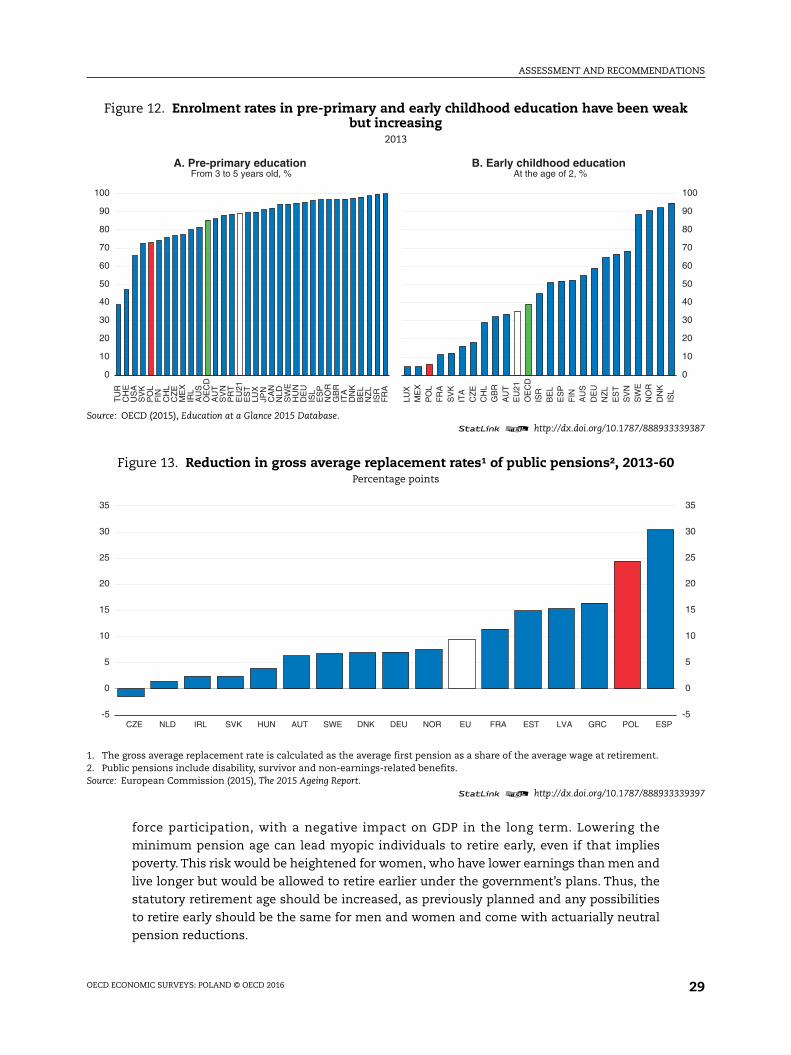
Better opportunities to combine work and family life are needed to allow more women
to work, if they so desire. One of the most effective policy measures in this respect is the
provision of childcare services, which also contributes to raising fertility (OECD, 2011a
and 2012). Poland extended the coverage of preschools for three- to five-year-olds to close
to 80% in 2015 from just over 30% in 2002 (Figure 12, Panel A shows 2013 numbers). The
number of childcare institutions for children under three quadrupled between 2011
Figure 10. Foreign-currency-denominated and non-performing loans
1. Or latest available information.Source: ECB; and IMF, Financial Soundness Indicators.
1 2 http://dx.doi.org/10.1787/888933339361
0
10
20
30
40
50
60
SVK EST CZE LVA HUN SVN POL ROU
Loans to non-financial corporationsLoans to households
A. Share of foreign-currency-denominated loansAugust 2015
0
5
10
15
20
25
30
35
ESTUSA
GBRDEU
FRAPOL
LVASVK
CZEESP
SVNPRT
HUNROU
ITAIRL
GRC
B. Non-performing loansPer cent of total gross loans, 2015-Q2¹
ASSESSMENT AND RECOMMENDATIONS
OECD ECONOMIC SURVEYS: POLAND © OECD 201628
and 2014, but coverage remains low (Panel B). The current system of joint taxation of family
income implies higher tax rates for second earners – typically women. OECD analysis
shows that this reduces female labour force participation and full-time employment
(OECD, 2012). Moving to individual taxation would remove this distortion (OECD, 2014a).
Poland has one of the lowest pension replacement rates in Europe (OECD, 2015b) and
its reduction until 2050 is estimated to be larger than anywhere else in Europe (Figure 13).
This involves a serious risk of higher old-age poverty. The 2012 pension reform increased
the retirement age in stages to 67 by 2020 for men and by 2040 for women. The new
government campaigned on a promise to allow women to retire at 60 and men at 65, the
pre-reform status quo. This would have a negative impact on the employment of seniors
and thus long-term growth, though its magnitude is unclear. This can be contained to
some extent if workers who retire before 67 receive a lower pension in line with their
reduced contributions and – as is already the case – a correspondingly higher pension if
they work beyond that. The government provides workers with annual information on
their pension rights and how they would change thanks to delayed retirement. This should
also be useful. OECD evidence shows that such actuarially neutral pension adjustments
ensure higher labour force participation of older workers compared to systems where early
retirement is possible with lower pension reductions (Johansson et al., 2013). However, the
same work shows that a reduction in the legal pension age reduces older workers’ labour
Figure 11. Employment rates are low in the context of rapid ageing, and in-work povertyis relatively high
1. Measured as inactive population aged 65 and over as a ratio to the 15-64 employed population.2. Or latest available year.Source: OECD (2015), OECD Labour Force Statistics Database; European Commission (2015), The Ageing Report; and Eurostat.
1 2 http://dx.doi.org/10.1787/888933339376
0102030405060708090
100
DN
KN
OR
SW
EG
BR
LUX
IRL
NLD FIN
FR
AB
EL
AU
TC
ZE
LTU
LVA
EU
28E
SP
EA
ES
TS
VN
DE
UH
UN
ITA
GR
CH
RV
PR
TR
OU
BG
RP
OL
SV
K2013Projected increase from 2013 to 2060
C. Economic old-age dependency ratio¹Per cent
02468101214161820
CZ
EF
IN IRL
BE
LD
NK
NLD
SV
KN
OR
HR
VIS
LH
UN
SV
NA
UT
CH
EE
ST
SW
EF
RA
GB
RLV
ALT
UB
GR
EU
28D
EU
PO
LP
RT
ITA
LUX
ES
PG
RC
RO
U
D. In-work at-risk-of-poverty rate, %18-64, 2014²
0
10
20
30
40
50
60
70
80
90
TU
RG
RC
SV
NH
UN
PO
LLU
XB
EL
ES
PS
VK
AU
TIT
AF
RA
PR
TIR
LC
ZE
ME
XO
EC
DF
INN
LDC
AN
GB
RU
SA
AU
SD
NK
ES
TC
HL
ISR
DE
UK
OR
JPN
CH
EN
OR
SW
EN
ZL
ISL
A. Employment rates, 55-64Per cent of population, 2014
0
10
20
30
40
50
60
70
80
90
TU
RG
RC
ME
XIT
AC
HL
ES
PS
VK
KO
RP
OL
HU
NIR
LB
EL
OE
CD
PR
TS
VN
LUX
CZ
EF
RA
US
AJP
NIS
RA
US
ES
TA
UT
GB
RF
INN
LDN
ZL
CA
ND
EU
DN
KS
WE
NO
RC
HE
ISL
B. Employment rates, women (15-64)Per cent of population, 2014
ASSESSMENT AND RECOMMENDATIONS
OECD ECONOMIC SURVEYS: POLAND © OECD 2016 29
force participation, with a negative impact on GDP in the long term. Lowering the
minimum pension age can lead myopic individuals to retire early, even if that implies
poverty. This risk would be heightened for women, who have lower earnings than men and
live longer but would be allowed to retire earlier under the government’s plans. Thus, the
statutory retirement age should be increased, as previously planned and any possibilities
to retire early should be the same for men and women and come with actuarially neutral
pension reductions.
Figure 12. Enrolment rates in pre-primary and early childhood education have been weakbut increasing
2013
Source: OECD (2015), Education at a Glance 2015 Database.1 2 http://dx.doi.org/10.1787/888933339387
Figure 13. Reduction in gross average replacement rates¹ of public pensions², 2013-60Percentage points
1. The gross average replacement rate is calculated as the average first pension as a share of the average wage at retirement.2. Public pensions include disability, survivor and non-earnings-related benefits.Source: European Commission (2015), The 2015 Ageing Report.
1 2 http://dx.doi.org/10.1787/888933339397
0
10
20
30
40
50
60
70
80
90
100
LUX
ME
XP
OL
FR
AS
VK
ITA
CZ
EC
HL
GB
RA
UT
EU
21O
EC
DIS
RB
EL
ES
PF
INA
US
DE
UN
ZL
ES
TS
VN
SW
EN
OR
DN
KIS
L
B. Early childhood educationAt the age of 2, %
0
10
20
30
40
50
60
70
80
90
100
TU
RC
HE
US
AS
VK
PO
LF
INC
HL
CZ
EM
EX
IRL
AU
SO
EC
DA
UT
SV
NP
RT
EU
21E
ST
LUX
JPN
CA
NN
LDS
WE
HU
ND
EU
ISL
ES
PN
OR
GB
RIT
AD
NK
BE
LN
ZL
ISR
FR
A
A. Pre-primary educationFrom 3 to 5 years old, %
-5
0
5
10
15
20
25
30
35
-5
0
5
10
15
20
25
30
35
CZE NLD IRL SVK HUN AUT SWE DNK DEU NOR EU FRA EST LVA GRC POL ESP
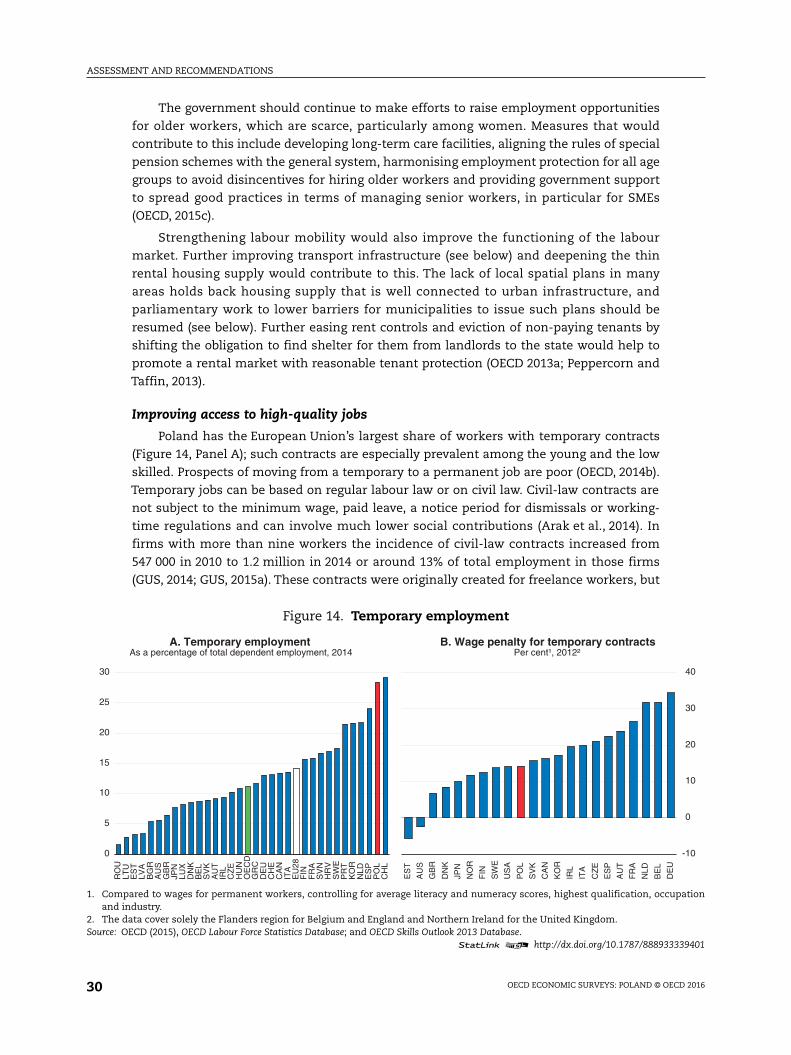
ASSESSMENT AND RECOMMENDATIONS
OECD ECONOMIC SURVEYS: POLAND © OECD 201630
The government should continue to make efforts to raise employment opportunities
for older workers, which are scarce, particularly among women. Measures that would
contribute to this include developing long-term care facilities, aligning the rules of special
pension schemes with the general system, harmonising employment protection for all age
groups to avoid disincentives for hiring older workers and providing government support
to spread good practices in terms of managing senior workers, in particular for SMEs
(OECD, 2015c).
Strengthening labour mobility would also improve the functioning of the labour
market. Further improving transport infrastructure (see below) and deepening the thin
rental housing supply would contribute to this. The lack of local spatial plans in many
areas holds back housing supply that is well connected to urban infrastructure, and
parliamentary work to lower barriers for municipalities to issue such plans should be
resumed (see below). Further easing rent controls and eviction of non-paying tenants by
shifting the obligation to find shelter for them from landlords to the state would help to
promote a rental market with reasonable tenant protection (OECD 2013a; Peppercorn and
Taffin, 2013).
Improving access to high-quality jobs
Poland has the European Union’s largest share of workers with temporary contracts
(Figure 14, Panel A); such contracts are especially prevalent among the young and the low
skilled. Prospects of moving from a temporary to a permanent job are poor (OECD, 2014b).
Temporary jobs can be based on regular labour law or on civil law. Civil-law contracts are
not subject to the minimum wage, paid leave, a notice period for dismissals or working-
time regulations and can involve much lower social contributions (Arak et al., 2014). In
firms with more than nine workers the incidence of civil-law contracts increased from
547 000 in 2010 to 1.2 million in 2014 or around 13% of total employment in those firms
(GUS, 2014; GUS, 2015a). These contracts were originally created for freelance workers, but
Figure 14. Temporary employment
1. Compared to wages for permanent workers, controlling for average literacy and numeracy scores, highest qualification, occupationand industry.
2. The data cover solely the Flanders region for Belgium and England and Northern Ireland for the United Kingdom.Source: OECD (2015), OECD Labour Force Statistics Database; and OECD Skills Outlook 2013 Database.
1 2 http://dx.doi.org/10.1787/888933339401
0
5
10
15
20
25
30
RO
ULT
UE
ST
LVA
BG
RA
US
GB
RJP
NLU
XD
NK
BE
LS
VK
AU
TIR
LC
ZE
HU
NO
EC
DG
RC
DE
UC
HE
CA
NIT
AE
U28
FIN
FR
AS
VN
HR
VS
WE
PR
TK
OR
NLD
ES
PP
OL
CH
L
A. Temporary employmentAs a percentage of total dependent employment, 2014
-10
0
10
20
30
40
ES
T
AU
S
GB
R
DN
K
JPN
NO
R
FIN
SW
E
US
A
PO
L
SV
K
CA
N
KO
R
IRL
ITA
CZ
E
ES
P
AU
T
FR
A
NLD
BE
L
DE
U
B. Wage penalty for temporary contractsPer cent¹, 2012²
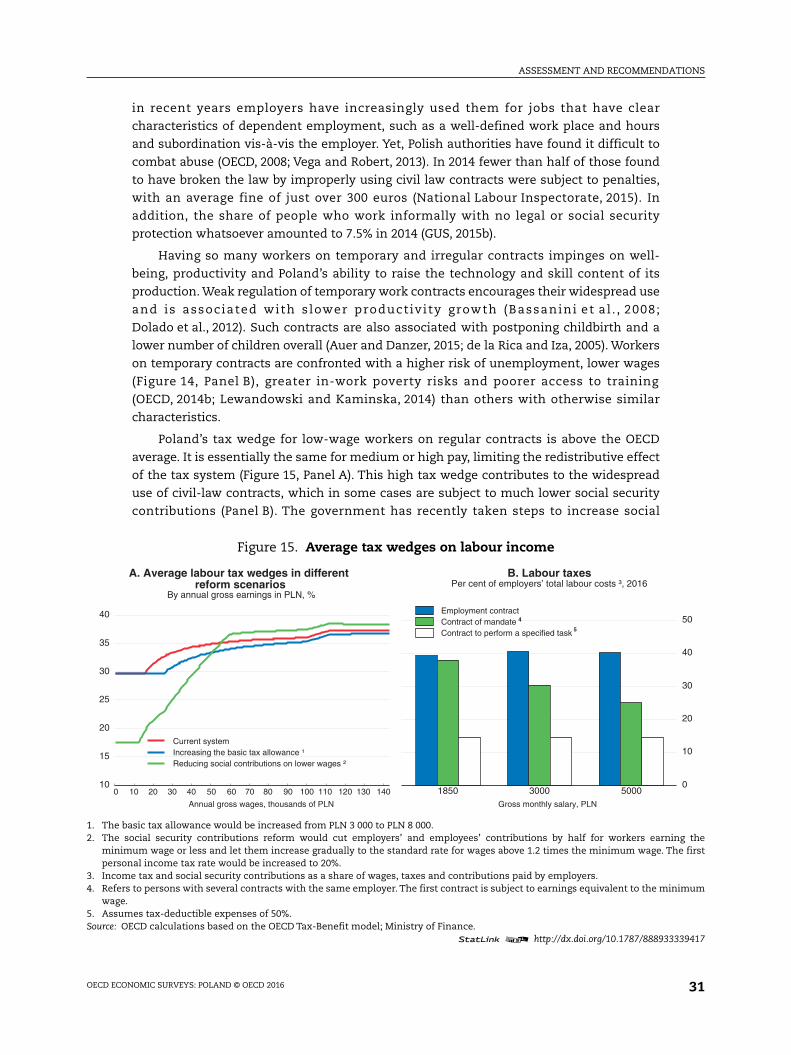
ASSESSMENT AND RECOMMENDATIONS
OECD ECONOMIC SURVEYS: POLAND © OECD 2016 31
in recent years employers have increasingly used them for jobs that have clear
characteristics of dependent employment, such as a well-defined work place and hours
and subordination vis-à-vis the employer. Yet, Polish authorities have found it difficult to
combat abuse (OECD, 2008; Vega and Robert, 2013). In 2014 fewer than half of those found
to have broken the law by improperly using civil law contracts were subject to penalties,
with an average fine of just over 300 euros (National Labour Inspectorate, 2015). In
addition, the share of people who work informally with no legal or social security
protection whatsoever amounted to 7.5% in 2014 (GUS, 2015b).
Having so many workers on temporary and irregular contracts impinges on well-
being, productivity and Poland’s ability to raise the technology and skill content of its
production. Weak regulation of temporary work contracts encourages their widespread use
and is associated with slower productivity growth (Bassanini et al . , 2008;
Dolado et al., 2012). Such contracts are also associated with postponing childbirth and a
lower number of children overall (Auer and Danzer, 2015; de la Rica and Iza, 2005). Workers
on temporary contracts are confronted with a higher risk of unemployment, lower wages
(Figure 14, Panel B), greater in-work poverty risks and poorer access to training
(OECD, 2014b; Lewandowski and Kaminska, 2014) than others with otherwise similar
characteristics.
Poland’s tax wedge for low-wage workers on regular contracts is above the OECD
average. It is essentially the same for medium or high pay, limiting the redistributive effect
of the tax system (Figure 15, Panel A). This high tax wedge contributes to the widespread
use of civil-law contracts, which in some cases are subject to much lower social security
contributions (Panel B). The government has recently taken steps to increase social
Figure 15. Average tax wedges on labour income
1. The basic tax allowance would be increased from PLN 3 000 to PLN 8 000.2. The social security contributions reform would cut employers’ and employees’ contributions by half for workers earning the
minimum wage or less and let them increase gradually to the standard rate for wages above 1.2 times the minimum wage. The firstpersonal income tax rate would be increased to 20%.
3. Income tax and social security contributions as a share of wages, taxes and contributions paid by employers.4. Refers to persons with several contracts with the same employer. The first contract is subject to earnings equivalent to the minimum
wage.5. Assumes tax-deductible expenses of 50%.Source: OECD calculations based on the OECD Tax-Benefit model; Ministry of Finance.
1 2 http://dx.doi.org/10.1787/888933339417
10
15
20
25
30
35
40
0 10 20 30 40 50 60 70 80 90 100 110 120 130 140
Annual gross wages, thousands of PLN
Current systemIncreasing the basic tax allowance ¹Reducing social contributions on lower wages ²
A. Average labour tax wedges in differentreform scenarios
By annual gross earnings in PLN, %
0
10
20
30
40
50
1850 3000 5000Gross monthly salary, PLN
4
5
Employment contractContract of mandateContract to perform a specified task
B. Labour taxesPer cent of employers’ total labour costs ³, 2016
ASSESSMENT AND RECOMMENDATIONS
OECD ECONOMIC SURVEYS: POLAND © OECD 201632
contributions on some civil-law contracts, although there are still ways for employers to
split contracts to minimise contributions, and this should be monitored. The government
also aims to introduce an hourly minimum wage of PLN 12 applying to civil law contracts.
For a standard working week of 40 hours it is higher than the monthly minimum wage for
labour law contracts by 3.7% in 2016.
Cutting labour taxes significantly on regular labour-law contracts with low wages
would further reduce incentives to use civil-law and other irregular contracts and would
make the tax system more progressive. This could potentially be done by reducing social
contributions on lower wages, but other financing would be needed to maintain benefits
for these groups. Another solution would be to further align contributions between civil
and labour law contracts. The government’s plan to increase the tax-free allowance from
3000 to up to 8000 PLN per year (see Figure 15, Panel A) would lower taxes for everyone and
would hence be very costly. To obtain a larger effect on the tax burden on lower wages one
possibility would be to increase the tax-free allowance but only for income from work
instead, such as proposed by Arak et al (2014). Introducing a targeted earned income tax
credit would even be more effective in reducing the tax burden on low-wage workers
(OECD, 2014a).
Ensuring efficient public infrastructure and better conditions for privateinvestment
Strengthening the quality of infrastructure investment
Poland’s investment has been relatively low compared to countries with similar per
capita income (Figure 16). Public investment has been heavily supported by EU funds, and
Poland has significantly upgraded its infrastructure networks over the past decade.
However, bottlenecks still restrain productivity, and much remains to be done to enhance
environmental outcomes. The EU 2014-20 programming period provides an opportunity to
strengthen the management of infrastructure investment. Further improving public
infrastructure, notably ICT technologies and networks, would facilitate new technology
adoption. Time-series evidence points to a positive historical relationship between public
and private investment and GDP growth in Poland (Rutkowski, 2009), as high-quality
infrastructure promotes productivity, thereby encouraging private investment
(OECD, 2015d).
Increasing administrative capacity in public procurement, public-private partnerships
and infrastructure management would improve spending efficiency. Local governments
lack skilled personnel, and sometimes incentives, to plan and manage infrastructure or
develop local zoning plans and energy efficiency strategies (NIK, 2014a; Ministry of
Economy, 2012). Providing central government technical assistance through expertise and
upfront resources for the preparation of large municipal projects would help local
governments deal better with such projects. There should also be a central platform for
integrated e-procurement procedures. Such a platform could reduce the fragmentation of
the public procurement market (Public Procurement Office, 2015). Defining metropolitan
governance structures according to functional urban areas, as planned for 2016, and giving
them infrastructure planning competencies could also improve cooperation among local
governments (Ahrend and Schumann, 2014).
Reinforcing the independence of sector regulators would reduce regulatory
uncertainties that inhibit investment. The rail network regulator, UTK, reports to the
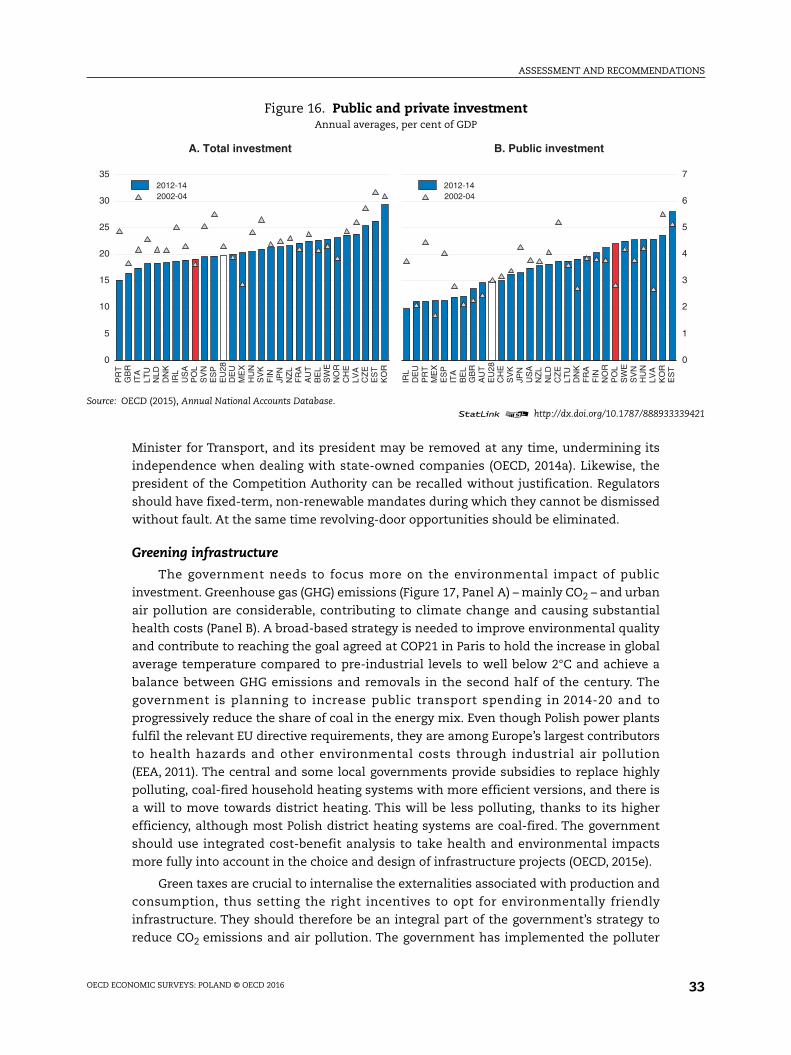
ASSESSMENT AND RECOMMENDATIONS
OECD ECONOMIC SURVEYS: POLAND © OECD 2016 33
Minister for Transport, and its president may be removed at any time, undermining its
independence when dealing with state-owned companies (OECD, 2014a). Likewise, the
president of the Competition Authority can be recalled without justification. Regulators
should have fixed-term, non-renewable mandates during which they cannot be dismissed
without fault. At the same time revolving-door opportunities should be eliminated.
Greening infrastructure
The government needs to focus more on the environmental impact of public
investment. Greenhouse gas (GHG) emissions (Figure 17, Panel A) – mainly CO2 – and urban
air pollution are considerable, contributing to climate change and causing substantial
health costs (Panel B). A broad-based strategy is needed to improve environmental quality
and contribute to reaching the goal agreed at COP21 in Paris to hold the increase in global
average temperature compared to pre-industrial levels to well below 2°C and achieve a
balance between GHG emissions and removals in the second half of the century. The
government is planning to increase public transport spending in 2014-20 and to
progressively reduce the share of coal in the energy mix. Even though Polish power plants
fulfil the relevant EU directive requirements, they are among Europe’s largest contributors
to health hazards and other environmental costs through industrial air pollution
(EEA, 2011). The central and some local governments provide subsidies to replace highly
polluting, coal-fired household heating systems with more efficient versions, and there is
a will to move towards district heating. This will be less polluting, thanks to its higher
efficiency, although most Polish district heating systems are coal-fired. The government
should use integrated cost-benefit analysis to take health and environmental impacts
more fully into account in the choice and design of infrastructure projects (OECD, 2015e).
Green taxes are crucial to internalise the externalities associated with production and
consumption, thus setting the right incentives to opt for environmentally friendly
infrastructure. They should therefore be an integral part of the government’s strategy to
reduce CO2 emissions and air pollution. The government has implemented the polluter
Figure 16. Public and private investmentAnnual averages, per cent of GDP
Source: OECD (2015), Annual National Accounts Database.1 2 http://dx.doi.org/10.1787/888933339421
0
5
10
15
20
25
30
35
PR
TG
BR
ITA
LTU
NLD
DN
KIR
LU
SA
PO
LS
VN
ES
PE
U28
DE
UM
EX
HU
NS
VK
FIN
JPN
NZ
LF
RA
AU
TB
EL
SW
EN
OR
CH
ELV
AC
ZE
ES
TK
OR
2002-042012-14
A. Total investment
0
1
2
3
4
5
6
7
IRL
DE
UP
RT
ME
XE
SP
ITA
BE
LG
BR
AU
TE
U28
CH
ES
VK
JPN
US
AN
ZL
NLD
CZ
ELT
UD
NK
FR
AF
INN
OR
PO
LS
WE
SV
NH
UN
LVA
KO
RE
ST
2002-042012-14
B. Public investment
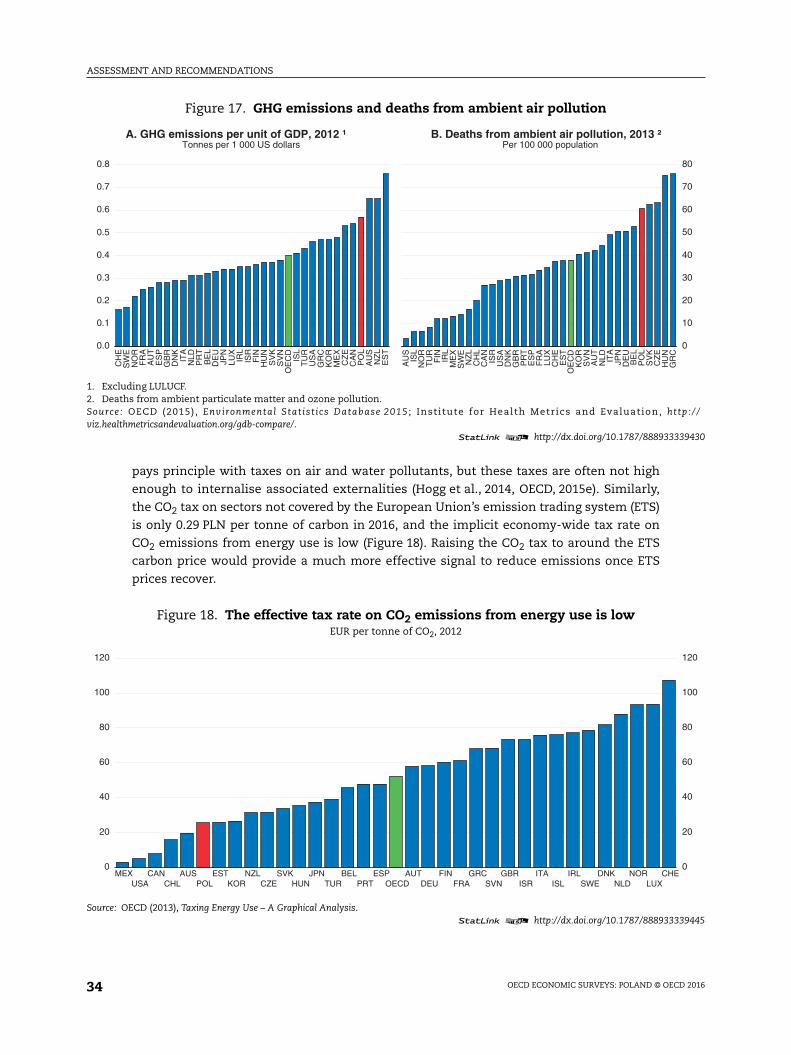
ASSESSMENT AND RECOMMENDATIONS
OECD ECONOMIC SURVEYS: POLAND © OECD 201634
pays principle with taxes on air and water pollutants, but these taxes are often not high
enough to internalise associated externalities (Hogg et al., 2014, OECD, 2015e). Similarly,
the CO2 tax on sectors not covered by the European Union’s emission trading system (ETS)
is only 0.29 PLN per tonne of carbon in 2016, and the implicit economy-wide tax rate on
CO2 emissions from energy use is low (Figure 18). Raising the CO2 tax to around the ETS
carbon price would provide a much more effective signal to reduce emissions once ETS
prices recover.
Figure 17. GHG emissions and deaths from ambient air pollution
1. Excluding LULUCF.2. Deaths from ambient particulate matter and ozone pollution.Source: OECD (2015) , Environmental Stat ist ics Database 2015 ; Institute for Health Metrics and Evaluation, http://viz.healthmetricsandevaluation.org/gdb-compare/.
1 2 http://dx.doi.org/10.1787/888933339430
0.0
0.1
0.2
0.3
0.4
0.5
0.6
0.7
0.8
CH
ES
WE
NO
RF
RA
AU
TE
SP
GB
RD
NK
ITA
NLD
PR
TB
EL
DE
UJP
NLU
XIR
LIS
RF
INH
UN
SV
KS
VN
OE
CD
ISL
TU
RU
SA
GR
CK
OR
ME
XC
ZE
CA
NP
OL
AU
SN
ZL
ES
T
A. GHG emissions per unit of GDP, 2012 ¹Tonnes per 1 000 US dollars
0
10
20
30
40
50
60
70
80
AU
SIS
LN
OR
TU
RF
IN IRL
ME
XS
WE
NZ
LC
HL
CA
NIS
RU
SA
DN
KG
BR
PR
TE
SP
FR
ALU
XC
HE
ES
TO
EC
DK
OR
SV
NA
UT
NLD IT
AJP
ND
EU
BE
LP
OL
SV
KC
ZE
HU
NG
RC
B. Deaths from ambient air pollution, 2013 ²Per 100 000 population
Figure 18. The effective tax rate on CO2 emissions from energy use is lowEUR per tonne of CO2, 2012
Source: OECD (2013), Taxing Energy Use – A Graphical Analysis.1 2 http://dx.doi.org/10.1787/888933339445
0
20
40
60
80
100
120
0
20
40
60
80
100
120
MEXUSA
CANCHL
AUSPOL
ESTKOR
NZLCZE
SVKHUN
JPNTUR
BELPRT
ESPOECD
AUTDEU
FINFRA
GRCSVN
GBRISR
ITAISL
IRLSWE
DNKNLD
NORLUX
CHE
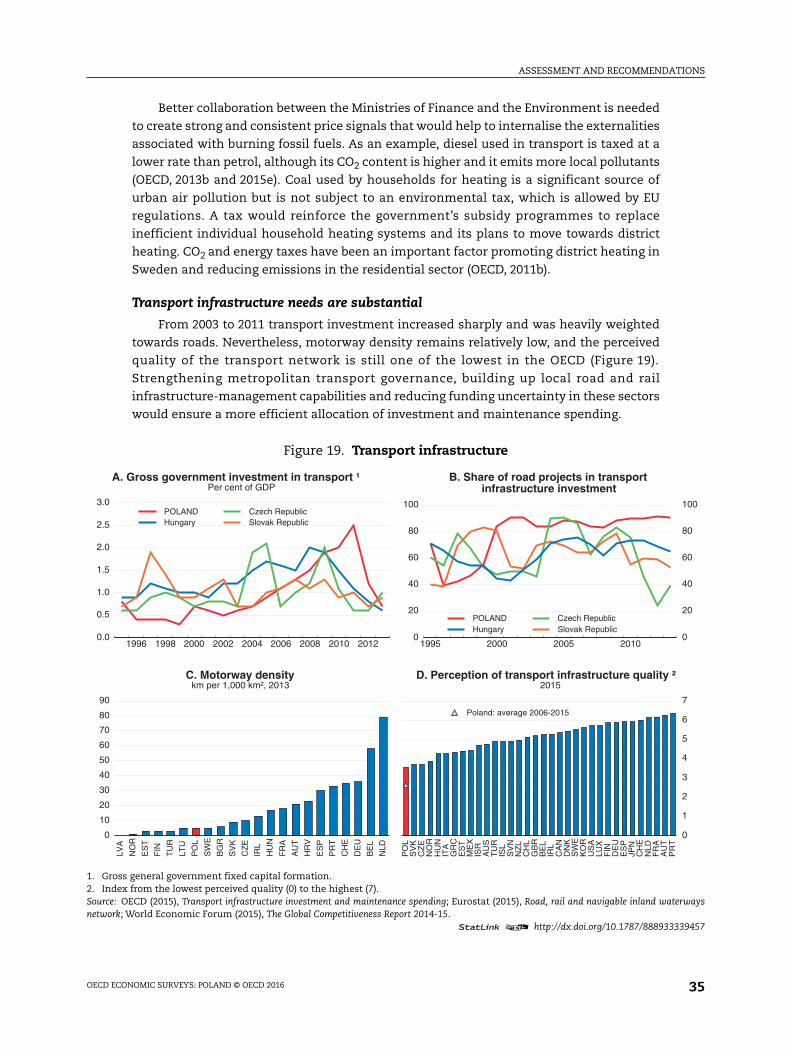
ASSESSMENT AND RECOMMENDATIONS
OECD ECONOMIC SURVEYS: POLAND © OECD 2016 35
Better collaboration between the Ministries of Finance and the Environment is needed
to create strong and consistent price signals that would help to internalise the externalities
associated with burning fossil fuels. As an example, diesel used in transport is taxed at a
lower rate than petrol, although its CO2 content is higher and it emits more local pollutants
(OECD, 2013b and 2015e). Coal used by households for heating is a significant source of
urban air pollution but is not subject to an environmental tax, which is allowed by EU
regulations. A tax would reinforce the government’s subsidy programmes to replace
inefficient individual household heating systems and its plans to move towards district
heating. CO2 and energy taxes have been an important factor promoting district heating in
Sweden and reducing emissions in the residential sector (OECD, 2011b).
Transport infrastructure needs are substantial
From 2003 to 2011 transport investment increased sharply and was heavily weighted
towards roads. Nevertheless, motorway density remains relatively low, and the perceived
quality of the transport network is still one of the lowest in the OECD (Figure 19).
Strengthening metropolitan transport governance, building up local road and rail
infrastructure-management capabilities and reducing funding uncertainty in these sectors
would ensure a more efficient allocation of investment and maintenance spending.
Figure 19. Transport infrastructure
1. Gross general government fixed capital formation.2. Index from the lowest perceived quality (0) to the highest (7).Source: OECD (2015), Transport infrastructure investment and maintenance spending; Eurostat (2015), Road, rail and navigable inland waterwaysnetwork; World Economic Forum (2015), The Global Competitiveness Report 2014-15.
1 2 http://dx.doi.org/10.1787/888933339457
1996 1998 2000 2002 2004 2006 2008 2010 20120.0
0.5
1.0
1.5
2.0
2.5
3.0 POLANDHungary
Czech RepublicSlovak Republic
A. Gross government investment in transport ¹Per cent of GDP
1995 2000 2005 20100
20
40
60
80
100
0
20
40
60
80
100
POLANDHungary
Czech RepublicSlovak Republic
B. Share of road projects in transportinfrastructure investment
0
10
20
30
40
50
60
70
80
90
LVA
NO
R
ES
T
FIN
TU
R
LTU
PO
L
SW
E
BG
R
SV
K
CZ
E
IRL
HU
N
FR
A
AU
T
HR
V
ES
P
PR
T
CH
E
DE
U
BE
L
NLD
C. Motorway densitykm per 1,000 km², 2013
0
1
2
3
4
5
6
7
PO
LS
VK
CZ
EN
OR
HU
NIT
AG
RC
ES
TM
EX
ISR
AU
ST
UR
ISL
SV
NN
ZL
CH
LG
BR
BE
LIR
LC
AN
DN
KS
WE
KO
RU
SA
LUX
FIN
DE
UE
SP
JPN
CH
EN
LDF
RA
AU
TP
RT
Poland: average 2006-2015
D. Perception of transport infrastructure quality ² 2015
ASSESSMENT AND RECOMMENDATIONS
OECD ECONOMIC SURVEYS: POLAND © OECD 201636
Integration of different types of transport is a priority, as connections between
national and local roads are often lacking (World Bank, 2011). The first top-down strategy
for the whole transport sector – Transport Development Strategy to 2020 (with perspectives
to 2030) – was adopted in 2013. A comprehensive plan of transport investments to be
implemented in the period 2014-20 is included in the Implementing Document to the
Strategy, but it will need regular updates. Inland waterways have received little funding,
limiting seaport catchment areas (NIK, 2014b). The 2014-20 operational programme for EU
funds includes planned new and modernised intermodal terminals for passenger and
freight transport, which is welcome. Intermodal projects linking railways, seaports and
airports will benefit from extra points when competing for EU funds.
Given the environmental effects of intensive car traffic, the envisaged increase in
spending on public transport infrastructure in the 2014-20 EU funds programming period is
crucial. However, railways may still suffer from unreliable financing, notwithstanding the
planned increase. The infrastructure manager, PKP PLK, signs three-year maintenance
contracts with the government, but the specific budget allocations are decided on an
annual basis, creating a lack of reliable financing for long-term maintenance work. In
addition, most local governments offer only one-year contracts for public passenger rail
service providers, effectively making investment in highly capital-intensive rolling stock
unprofitable and deterring new entry. Several tenders have not been able to attract even a
single bidder (European Commission, 2013). As a result, local governments usually
purchase their own rolling stock, lending it on to public passenger rail service providers.
However, a welcome draft programme aims to ensure more stable financing over 2016-23,
notably for maintenance.
A weak spatial planning system has contributed to substantial urban sprawl
(Veneri, 2015, Krajewska et al., 2014), intensifying road congestion and urban pollution.
Around 70% of municipal territory lacks local spatial plans, and building permits are
granted based on administrative decisions that do not ensure coherence with spatial
planning (Ministry of Regional Development, 2012). Many new developments lack access to
urban infrastructure, including public transport. Before the recent election there was a
draft law before the parliament reforming urban planning that would tighten restrictions
on granting building permits on land without local spatial plans. It would also reduce
barriers for municipalities to develop such plans. The scale and scope of compensation
municipalities have to pay to owners when they restrict the use of their land would be
limited. At the same time, to obtain building permits faster developers would be allowed to
build infrastructure themselves and provide it free of charge to municipalities. The
parliamentary approval process of this reform needs to be resumed swiftly to support the
development of efficient urban public transport infrastructure and reduce urban sprawl. If
it proves insufficient, the government should create an obligation for municipalities to
develop local spatial plans.
Road pricing could better internalise environmental externalities and take into
account maintenance costs, thereby helping to promote public transport. Heavy vehicles
have to pay fees on only a small part of the network, and these fees were less than half of
Czech or Slovenian levels in 2012 (ITF, 2013). Allowing local authorities to set urban
congestion charges could also help limit traffic congestion and local pollution, as in
London, Oslo and Stockholm.
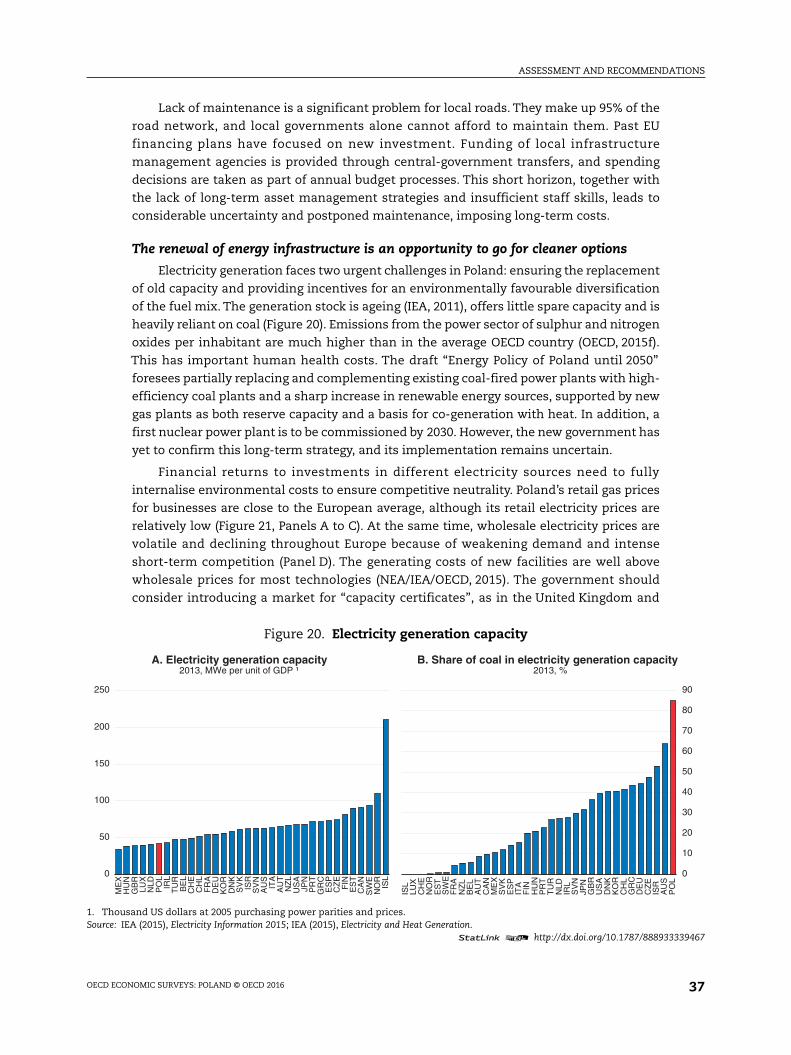
ASSESSMENT AND RECOMMENDATIONS
OECD ECONOMIC SURVEYS: POLAND © OECD 2016 37
Lack of maintenance is a significant problem for local roads. They make up 95% of the
road network, and local governments alone cannot afford to maintain them. Past EU
financing plans have focused on new investment. Funding of local infrastructure
management agencies is provided through central-government transfers, and spending
decisions are taken as part of annual budget processes. This short horizon, together with
the lack of long-term asset management strategies and insufficient staff skills, leads to
considerable uncertainty and postponed maintenance, imposing long-term costs.
The renewal of energy infrastructure is an opportunity to go for cleaner options
Electricity generation faces two urgent challenges in Poland: ensuring the replacement
of old capacity and providing incentives for an environmentally favourable diversification
of the fuel mix. The generation stock is ageing (IEA, 2011), offers little spare capacity and is
heavily reliant on coal (Figure 20). Emissions from the power sector of sulphur and nitrogen
oxides per inhabitant are much higher than in the average OECD country (OECD, 2015f).
This has important human health costs. The draft “Energy Policy of Poland until 2050”
foresees partially replacing and complementing existing coal-fired power plants with high-
efficiency coal plants and a sharp increase in renewable energy sources, supported by new
gas plants as both reserve capacity and a basis for co-generation with heat. In addition, a
first nuclear power plant is to be commissioned by 2030. However, the new government has
yet to confirm this long-term strategy, and its implementation remains uncertain.
Financial returns to investments in different electricity sources need to fully
internalise environmental costs to ensure competitive neutrality. Poland’s retail gas prices
for businesses are close to the European average, although its retail electricity prices are
relatively low (Figure 21, Panels A to C). At the same time, wholesale electricity prices are
volatile and declining throughout Europe because of weakening demand and intense
short-term competition (Panel D). The generating costs of new facilities are well above
wholesale prices for most technologies (NEA/IEA/OECD, 2015). The government should
consider introducing a market for “capacity certificates”, as in the United Kingdom and
Figure 20. Electricity generation capacity
1. Thousand US dollars at 2005 purchasing power parities and prices.Source: IEA (2015), Electricity Information 2015; IEA (2015), Electricity and Heat Generation.
1 2 http://dx.doi.org/10.1787/888933339467
0
50
100
150
200
250
ME
XH
UN
GB
RLU
XN
LDP
OL
IRL
TU
RB
EL
CH
EC
HL
FR
AD
EU
KO
RD
NK
SV
KIS
RS
VN
AU
SIT
AA
UT
NZ
LU
SA
JPN
PR
TG
RC
ES
PC
ZE
FIN
ES
TC
AN
SW
EN
OR
ISL
A. Electricity generation capacity2013, MWe per unit of GDP ¹
0
10
20
30
40
50
60
70
80
90
ISL
LUX
CH
EN
OR
ES
TS
WE
FR
AN
ZL
BE
LA
UT
CA
NM
EX
SV
KE
SP
ITA
FIN
HU
NP
RT
TU
RN
LDIR
LS
VN
JPN
GB
RU
SA
DN
KK
OR
CH
LG
RC
DE
UC
ZE
ISR
AU
SP
OL
B. Share of coal in electricity generation capacity2013, %
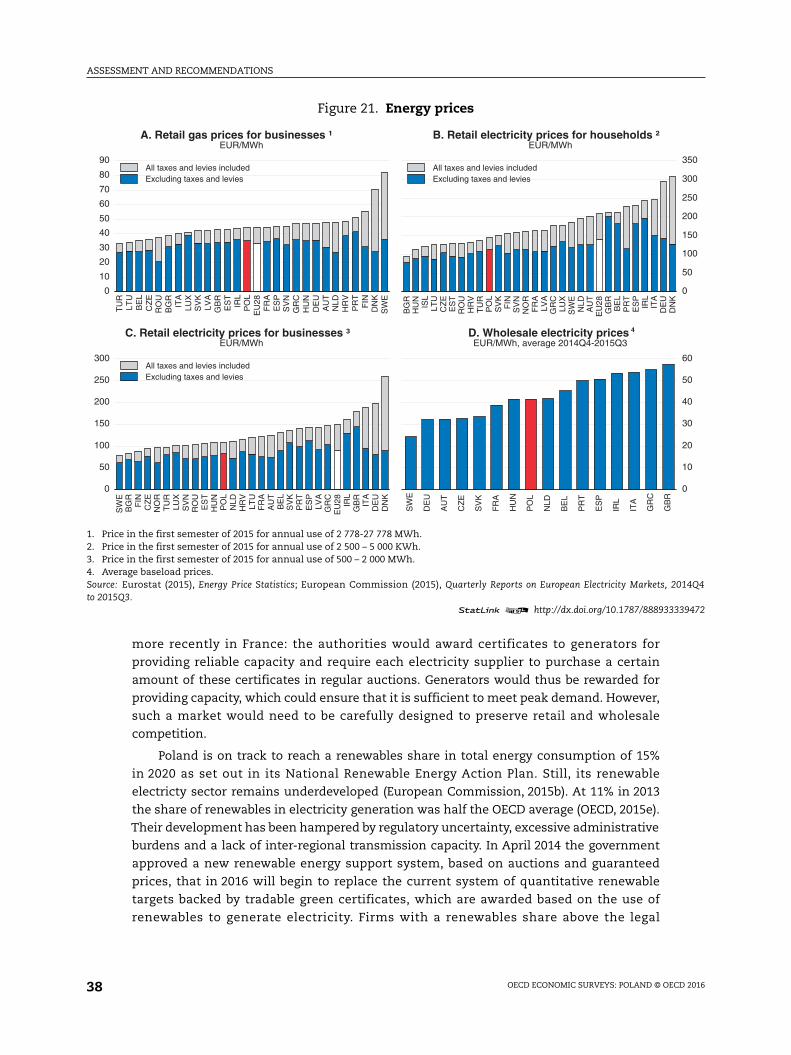
ASSESSMENT AND RECOMMENDATIONS
OECD ECONOMIC SURVEYS: POLAND © OECD 201638
more recently in France: the authorities would award certificates to generators for
providing reliable capacity and require each electricity supplier to purchase a certain
amount of these certificates in regular auctions. Generators would thus be rewarded for
providing capacity, which could ensure that it is sufficient to meet peak demand. However,
such a market would need to be carefully designed to preserve retail and wholesale
competition.
Poland is on track to reach a renewables share in total energy consumption of 15%
in 2020 as set out in its National Renewable Energy Action Plan. Still, its renewable
electricty sector remains underdeveloped (European Commission, 2015b). At 11% in 2013
the share of renewables in electricity generation was half the OECD average (OECD, 2015e).
Their development has been hampered by regulatory uncertainty, excessive administrative
burdens and a lack of inter-regional transmission capacity. In April 2014 the government
approved a new renewable energy support system, based on auctions and guaranteed
prices, that in 2016 will begin to replace the current system of quantitative renewable
targets backed by tradable green certificates, which are awarded based on the use of
renewables to generate electricity. Firms with a renewables share above the legal
Figure 21. Energy prices
1. Price in the first semester of 2015 for annual use of 2 778-27 778 MWh.2. Price in the first semester of 2015 for annual use of 2 500 – 5 000 KWh.3. Price in the first semester of 2015 for annual use of 500 – 2 000 MWh.4. Average baseload prices.Source: Eurostat (2015), Energy Price Statistics; European Commission (2015), Quarterly Reports on European Electricity Markets, 2014Q4to 2015Q3.
1 2 http://dx.doi.org/10.1787/888933339472
0
10
20
30
40
50
60
70
80
90
TU
RLT
UB
EL
CZ
ER
OU
BG
RIT
ALU
XS
VK
LVA
GB
RE
ST
IRL
PO
LE
U28
FR
AE
SP
SV
NG
RC
HU
ND
EU
AU
TN
LDH
RV
PR
TF
IND
NK
SW
E
Excluding taxes and leviesAll taxes and levies included
A. Retail gas prices for businesses ¹EUR/MWh
0
50
100
150
200
250
300
350
BG
RH
UN
ISL
LTU
CZ
EE
ST
RO
UH
RV
TU
RP
OL
SV
KF
INS
VN
NO
RF
RA
LVA
GR
CLU
XS
WE
NLD
AU
TE
U28
GB
RB
EL
PR
TE
SP
IRL
ITA
DE
UD
NK
Excluding taxes and leviesAll taxes and levies included
B. Retail electricity prices for households ²EUR/MWh
0
50
100
150
200
250
300
SW
EB
GR
FIN
CZ
EN
OR
TU
RLU
XS
VN
RO
UE
ST
HU
NP
OL
NLD
HR
VLT
UF
RA
AU
TB
EL
SV
KP
RT
ES
PLV
AG
RC
EU
28 IRL
GB
RIT
AD
EU
DN
KExcluding taxes and leviesAll taxes and levies included
C. Retail electricity prices for businesses ³EUR/MWh
0
10
20
30
40
50
60
SW
E
DE
U
AU
T
CZ
E
SV
K
FR
A
HU
N
PO
L
NLD
BE
L
PR
T
ES
P
IRL
ITA
GR
C
GB
R
4D. Wholesale electricity pricesEUR/MWh, average 2014Q4-2015Q3
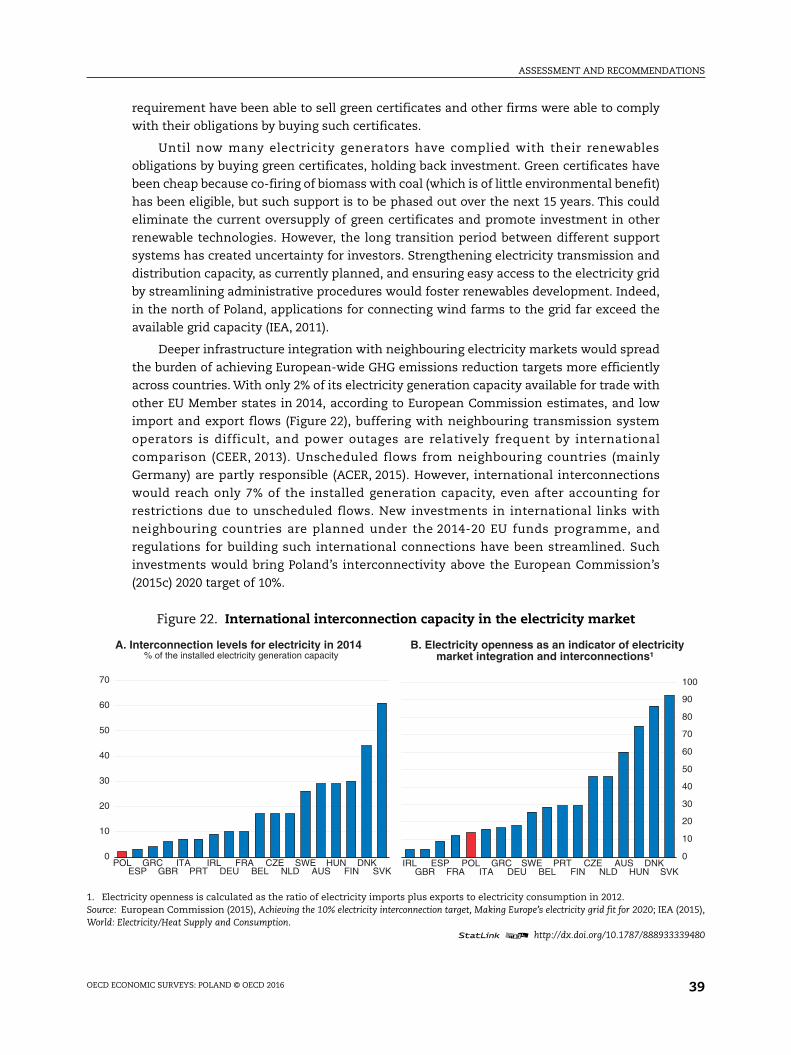
ASSESSMENT AND RECOMMENDATIONS
OECD ECONOMIC SURVEYS: POLAND © OECD 2016 39
requirement have been able to sell green certificates and other firms were able to comply
with their obligations by buying such certificates.
Until now many electricity generators have complied with their renewables
obligations by buying green certificates, holding back investment. Green certificates have
been cheap because co-firing of biomass with coal (which is of little environmental benefit)
has been eligible, but such support is to be phased out over the next 15 years. This could
eliminate the current oversupply of green certificates and promote investment in other
renewable technologies. However, the long transition period between different support
systems has created uncertainty for investors. Strengthening electricity transmission and
distribution capacity, as currently planned, and ensuring easy access to the electricity grid
by streamlining administrative procedures would foster renewables development. Indeed,
in the north of Poland, applications for connecting wind farms to the grid far exceed the
available grid capacity (IEA, 2011).
Deeper infrastructure integration with neighbouring electricity markets would spread
the burden of achieving European-wide GHG emissions reduction targets more efficiently
across countries. With only 2% of its electricity generation capacity available for trade with
other EU Member states in 2014, according to European Commission estimates, and low
import and export flows (Figure 22), buffering with neighbouring transmission system
operators is difficult, and power outages are relatively frequent by international
comparison (CEER, 2013). Unscheduled flows from neighbouring countries (mainly
Germany) are partly responsible (ACER, 2015). However, international interconnections
would reach only 7% of the installed generation capacity, even after accounting for
restrictions due to unscheduled flows. New investments in international links with
neighbouring countries are planned under the 2014-20 EU funds programme, and
regulations for building such international connections have been streamlined. Such
investments would bring Poland’s interconnectivity above the European Commission’s
(2015c) 2020 target of 10%.
Figure 22. International interconnection capacity in the electricity market
1. Electricity openness is calculated as the ratio of electricity imports plus exports to electricity consumption in 2012.Source: European Commission (2015), Achieving the 10% electricity interconnection target, Making Europe’s electricity grid fit for 2020; IEA (2015),World: Electricity/Heat Supply and Consumption.
1 2 http://dx.doi.org/10.1787/888933339480
0
10
20
30
40
50
60
70
POLESP
GRCGBR
ITAPRT
IRLDEU
FRABEL
CZENLD
SWEAUS
HUNFIN
DNKSVK
A. Interconnection levels for electricity in 2014% of the installed electricity generation capacity
0
10
20
30
40
50
60
70
80
90
100
IRLGBR
ESPFRA
POLITA
GRCDEU
SWEBEL
PRTFIN
CZENLD
AUSHUN
DNKSVK
B. Electricity openness as an indicator of electricitymarket integration and interconnections¹
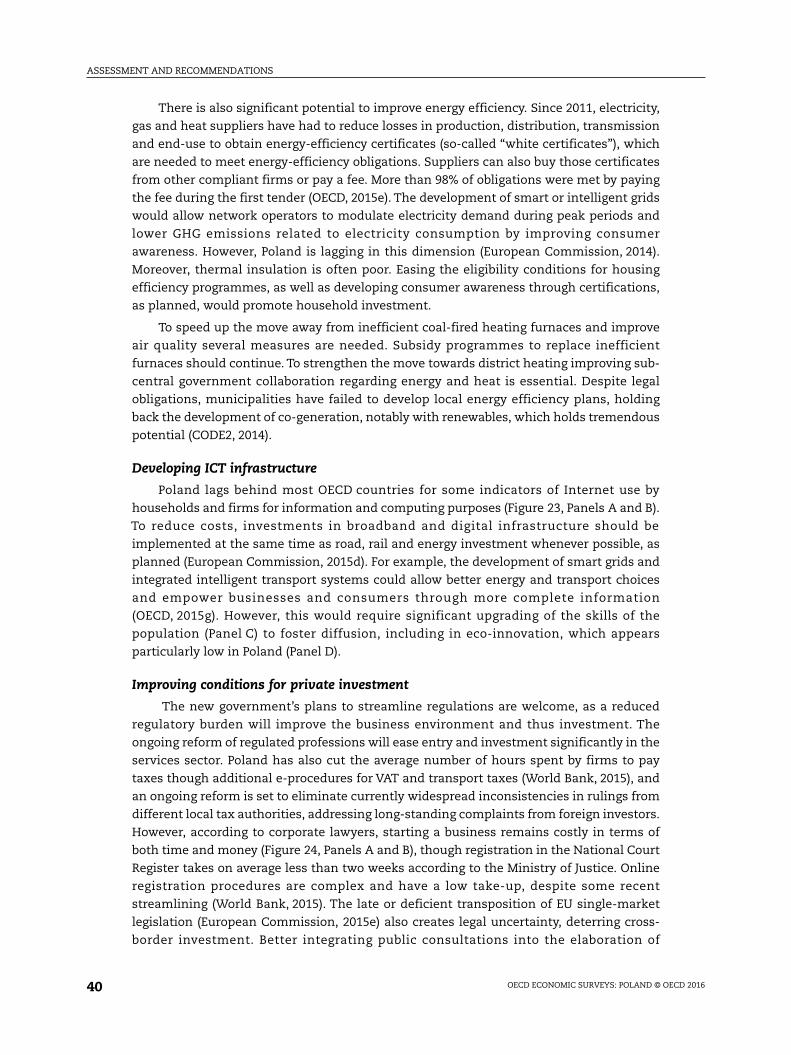
ASSESSMENT AND RECOMMENDATIONS
OECD ECONOMIC SURVEYS: POLAND © OECD 201640
There is also significant potential to improve energy efficiency. Since 2011, electricity,
gas and heat suppliers have had to reduce losses in production, distribution, transmission
and end-use to obtain energy-efficiency certificates (so-called “white certificates”), which
are needed to meet energy-efficiency obligations. Suppliers can also buy those certificates
from other compliant firms or pay a fee. More than 98% of obligations were met by paying
the fee during the first tender (OECD, 2015e). The development of smart or intelligent grids
would allow network operators to modulate electricity demand during peak periods and
lower GHG emissions related to electricity consumption by improving consumer
awareness. However, Poland is lagging in this dimension (European Commission, 2014).
Moreover, thermal insulation is often poor. Easing the eligibility conditions for housing
efficiency programmes, as well as developing consumer awareness through certifications,
as planned, would promote household investment.
To speed up the move away from inefficient coal-fired heating furnaces and improve
air quality several measures are needed. Subsidy programmes to replace inefficient
furnaces should continue. To strengthen the move towards district heating improving sub-
central government collaboration regarding energy and heat is essential. Despite legal
obligations, municipalities have failed to develop local energy efficiency plans, holding
back the development of co-generation, notably with renewables, which holds tremendous
potential (CODE2, 2014).
Developing ICT infrastructure
Poland lags behind most OECD countries for some indicators of Internet use by
households and firms for information and computing purposes (Figure 23, Panels A and B).
To reduce costs, investments in broadband and digital infrastructure should be
implemented at the same time as road, rail and energy investment whenever possible, as
planned (European Commission, 2015d). For example, the development of smart grids and
integrated intelligent transport systems could allow better energy and transport choices
and empower businesses and consumers through more complete information
(OECD, 2015g). However, this would require significant upgrading of the skills of the
population (Panel C) to foster diffusion, including in eco-innovation, which appears
particularly low in Poland (Panel D).
Improving conditions for private investment
The new government’s plans to streamline regulations are welcome, as a reduced
regulatory burden will improve the business environment and thus investment. The
ongoing reform of regulated professions will ease entry and investment significantly in the
services sector. Poland has also cut the average number of hours spent by firms to pay
taxes though additional e-procedures for VAT and transport taxes (World Bank, 2015), and
an ongoing reform is set to eliminate currently widespread inconsistencies in rulings from
different local tax authorities, addressing long-standing complaints from foreign investors.
However, according to corporate lawyers, starting a business remains costly in terms of
both time and money (Figure 24, Panels A and B), though registration in the National Court
Register takes on average less than two weeks according to the Ministry of Justice. Online
registration procedures are complex and have a low take-up, despite some recent
streamlining (World Bank, 2015). The late or deficient transposition of EU single-market
legislation (European Commission, 2015e) also creates legal uncertainty, deterring cross-
border investment. Better integrating public consultations into the elaboration of
ASSESSMENT AND RECOMMENDATIONS
OECD ECONOMIC SURVEYS: POLAND © OECD 2016 41
regulations and promoting in-depth evaluation of regulations in specific sectors would
strengthen the reform process and help improve the business environment (OECD, 2015h).
For Polish firms to move up the value chain they will need to undertake more research
and development (R&D) for faster technology adoption (OECD, 2015i), faster productivity
gains and improved competitiveness. Total R&D spending was just 0.9% of GDP in 2013, up
from 0.6% of GDP five years earlier but still one of the lowest shares in Europe. Take-up of
R&D tax incentives is low. Some R&D tax incentives are conditioned on investments in
Special Economic Zones, but these are located in poor regions, distant from public research
centres. Developing high-technology clusters around research centres would be more
efficient. From January 2016, a new R&D tax credit that also supports internal R&D
investments has replaced the tax relief for acquiring new technology. However, it is still
wasteable (non-refundable), penalising young and small firms.
The new government places a high priority on stimulating innovation and
entrepreneurship. It plans to do so by increasing tax breaks for those entrepreneurs who
re-invest their profits and by decreasing the corporate income tax rate on SMEs from 19 to
15%. There can be a rationale for special tax regimes for small and initially unprofitable
Figure 23. Fixed broadband penetration and ICT use
1. Cloud computing refers to ICT services used over the Internet as a set of computing resources to access software, computing power,storage capacity and so on.
2. Share of individuals aged 16 to 74 reporting to have carried out five or six specific tasks related to computer use.3. Index from 0 (lowest levels of inputs) to 300. The index is based on three indicators: government investments in environmental and
energy R&D, green early-stage investments and total R&D personnel.Source: OECD (2015), Digital Economic Outlook 2015 and OECD Science, Technology and Industry Scoreboard 2015; Eurostat (2015), Individuals’level of computer skills; European Commission (2015), Eco-Innovation Scoreboard.
1 2 http://dx.doi.org/10.1787/888933339498
0
10
20
30
40
50
TU
RM
EX
CH
LP
OL
SV
KC
ZE
ITA
HU
NP
RT
IRL
ISR
ES
TS
VN
AU
TA
US
ES
PG
RC
JPN
US
AN
ZL
FIN
SW
EC
AN
BE
LLU
XD
EU
ISL
GB
RN
OR
KO
RF
RA
DN
KN
LDC
HE
A. Fixed broadband connections for households, 2014Subscriptions per 100 inhabitants
0
10
20
30
40
50
60
PO
LG
RC
HU
NC
HE
DE
UA
UT
FR
AK
OR
LUX
PR
TE
SP
ES
TC
ZE
SV
NS
VK
BE
LG
BR
IRL
NLD
JPN
NO
RC
AN
DN
KS
WE
ITA
ISL
FIN
B. Enterprises using cloud computing services, 2014 ¹% of all enterprises
0
10
20
30
40
50
RO
UB
GR
TU
RP
OL
HR
VB
EL
HU
NS
VK
IRL
ITA
CZ
EN
LDD
EU
GR
CLV
AS
VN
ES
PF
RA
GB
RLT
UA
UT
PR
TE
ST
SW
EIS
LD
NK
LUX
NO
RF
IN
C. Computer skills, 2014 ² %
0
50
100
150
200
250
BG
RP
OL
HR
VR
OU
SV
KLV
AH
UN
LTU
GR
CC
ZE
PR
TE
SP
SV
NIT
AN
LDE
ST
AU
TB
EL
DE
UF
RA
IRL
LUX
DN
KG
BR
SW
EF
IN
D. Eco-innovation inputs, 2013Index ³
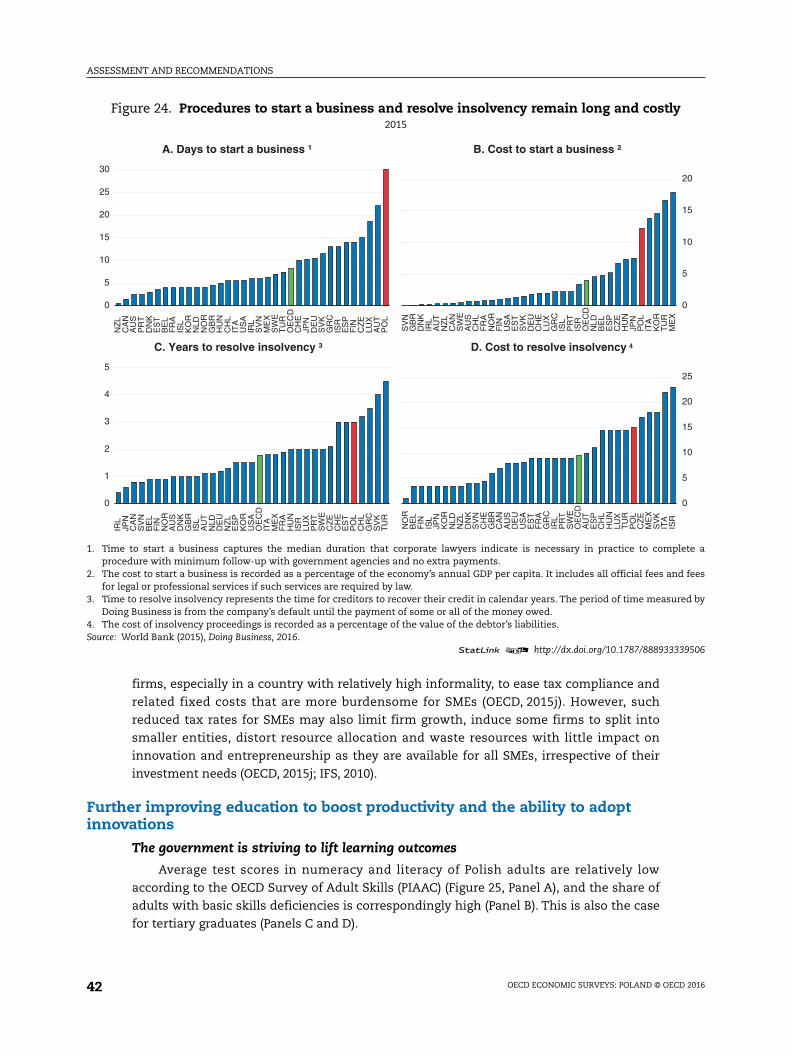
ASSESSMENT AND RECOMMENDATIONS
OECD ECONOMIC SURVEYS: POLAND © OECD 201642
firms, especially in a country with relatively high informality, to ease tax compliance and
related fixed costs that are more burdensome for SMEs (OECD, 2015j). However, such
reduced tax rates for SMEs may also limit firm growth, induce some firms to split into
smaller entities, distort resource allocation and waste resources with little impact on
innovation and entrepreneurship as they are available for all SMEs, irrespective of their
investment needs (OECD, 2015j; IFS, 2010).
Further improving education to boost productivity and the ability to adoptinnovations
The government is striving to lift learning outcomes
Average test scores in numeracy and literacy of Polish adults are relatively low
according to the OECD Survey of Adult Skills (PIAAC) (Figure 25, Panel A), and the share of
adults with basic skills deficiencies is correspondingly high (Panel B). This is also the case
for tertiary graduates (Panels C and D).
Figure 24. Procedures to start a business and resolve insolvency remain long and costly2015
1. Time to start a business captures the median duration that corporate lawyers indicate is necessary in practice to complete aprocedure with minimum follow-up with government agencies and no extra payments.
2. The cost to start a business is recorded as a percentage of the economy’s annual GDP per capita. It includes all official fees and feesfor legal or professional services if such services are required by law.
3. Time to resolve insolvency represents the time for creditors to recover their credit in calendar years. The period of time measured byDoing Business is from the company’s default until the payment of some or all of the money owed.
4. The cost of insolvency proceedings is recorded as a percentage of the value of the debtor’s liabilities.Source: World Bank (2015), Doing Business, 2016.
1 2 http://dx.doi.org/10.1787/888933339506
0
5
10
15
20
25
30
NZ
LC
AN
AU
SP
RT
DN
KE
ST
BE
LF
RA
ISL
KO
RN
LDN
OR
GB
RH
UN
CH
LIT
AU
SA
IRL
SV
NM
EX
SW
ET
UR
OE
CD
CH
EJP
ND
EU
SV
KG
RC
ISR
ES
PF
INC
ZE
LUX
AU
TP
OL
A. Days to start a business ¹
0
5
10
15
20
SV
NG
BR
DN
KIR
LA
UT
NZ
LC
AN
SW
EA
US
CH
LF
RA
NO
RF
INU
SA
ES
TS
VK
DE
UC
HE
LUX
GR
CIS
LP
RT
ISR
OE
CD
NLD
BE
LE
SP
CZ
EH
UN
JPN
PO
LIT
AK
OR
TU
RM
EX
B. Cost to start a business ²
0
1
2
3
4
5
IRL
JPN
CA
NS
VN
BE
LF
INN
OR
AU
SD
NK
GB
RIS
LA
UT
NLD
DE
UN
ZL
ES
PK
OR
US
AO
EC
DIT
AM
EX
FR
AH
UN
ISR
LUX
PR
TS
WE
CZ
EC
HE
ES
TP
OL
CH
LG
RC
SV
KT
UR
C. Years to resolve insolvency ³
0
5
10
15
20
25
NO
RB
EL
FIN
ISL
JPN
KO
RN
LDN
ZL
DN
KS
VN
CH
EG
BR
CA
NA
US
DE
UU
SA
ES
TF
RA
GR
CIR
LP
RT
SW
EO
EC
DA
UT
ES
PC
HL
HU
NLU
XT
UR
PO
LC
ZE
ME
XS
VK
ITA
ISR
4D. Cost to resolve insolvency
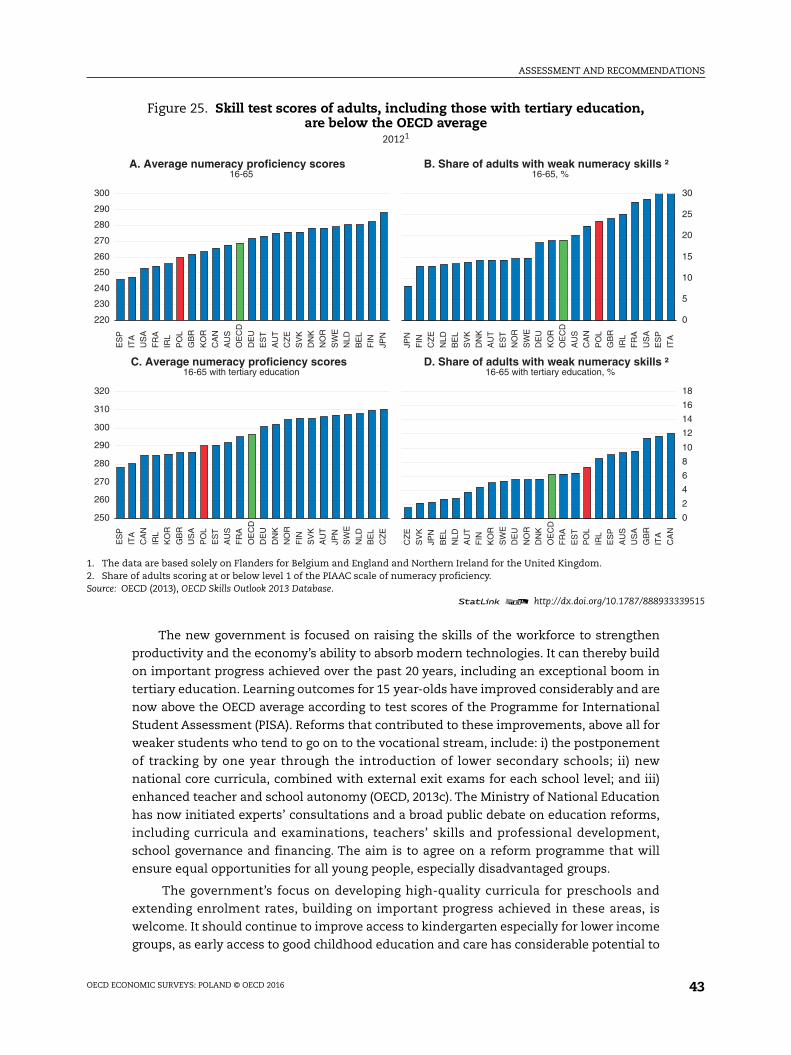
ASSESSMENT AND RECOMMENDATIONS
OECD ECONOMIC SURVEYS: POLAND © OECD 2016 43
The new government is focused on raising the skills of the workforce to strengthen
productivity and the economy’s ability to absorb modern technologies. It can thereby build
on important progress achieved over the past 20 years, including an exceptional boom in
tertiary education. Learning outcomes for 15 year-olds have improved considerably and are
now above the OECD average according to test scores of the Programme for International
Student Assessment (PISA). Reforms that contributed to these improvements, above all for
weaker students who tend to go on to the vocational stream, include: i) the postponement
of tracking by one year through the introduction of lower secondary schools; ii) new
national core curricula, combined with external exit exams for each school level; and iii)
enhanced teacher and school autonomy (OECD, 2013c). The Ministry of National Education
has now initiated experts’ consultations and a broad public debate on education reforms,
including curricula and examinations, teachers’ skills and professional development,
school governance and financing. The aim is to agree on a reform programme that will
ensure equal opportunities for all young people, especially disadvantaged groups.
The government’s focus on developing high-quality curricula for preschools and
extending enrolment rates, building on important progress achieved in these areas, is
welcome. It should continue to improve access to kindergarten especially for lower income
groups, as early access to good childhood education and care has considerable potential to
Figure 25. Skill test scores of adults, including those with tertiary education,are below the OECD average
20121
1. The data are based solely on Flanders for Belgium and England and Northern Ireland for the United Kingdom.2. Share of adults scoring at or below level 1 of the PIAAC scale of numeracy proficiency.Source: OECD (2013), OECD Skills Outlook 2013 Database.
1 2 http://dx.doi.org/10.1787/888933339515
220
230
240
250
260
270
280
290
300
ES
P
ITA
US
A
FR
AIR
L
PO
LG
BR
KO
RC
AN
AU
SO
EC
D
DE
UE
ST
AU
TC
ZE
SV
KD
NK
NO
R
SW
EN
LD
BE
LF
IN
JPN
A. Average numeracy proficiency scores 16-65
0
5
10
15
20
25
30
JPN
FIN
CZ
E
NLD
BE
L
SV
KD
NK
AU
T
ES
TN
OR
SW
ED
EU
KO
RO
EC
D
AU
SC
AN
PO
LG
BR
IRL
FR
A
US
AE
SP
ITA
B. Share of adults with weak numeracy skills ²16-65, %
250
260
270
280
290
300
310
320
ES
P
ITA
CA
N
IRL
KO
R
GB
RU
SA
PO
LE
ST
AU
SF
RA
OE
CD
DE
U
DN
KN
OR
FIN
SV
KA
UT
JPN
SW
E
NLD
BE
L
CZ
E
C. Average numeracy proficiency scores16-65 with tertiary education
0
2
4
6
8
10
12
14
16
18
CZ
E
SV
KJP
N
BE
LN
LD
AU
TF
INK
OR
SW
ED
EU
NO
RD
NK
OE
CD
FR
A
ES
TP
OL
IRL
ES
P
AU
SU
SA
GB
RIT
A
CA
N
D. Share of adults with weak numeracy skills ²16-65 with tertiary education, %
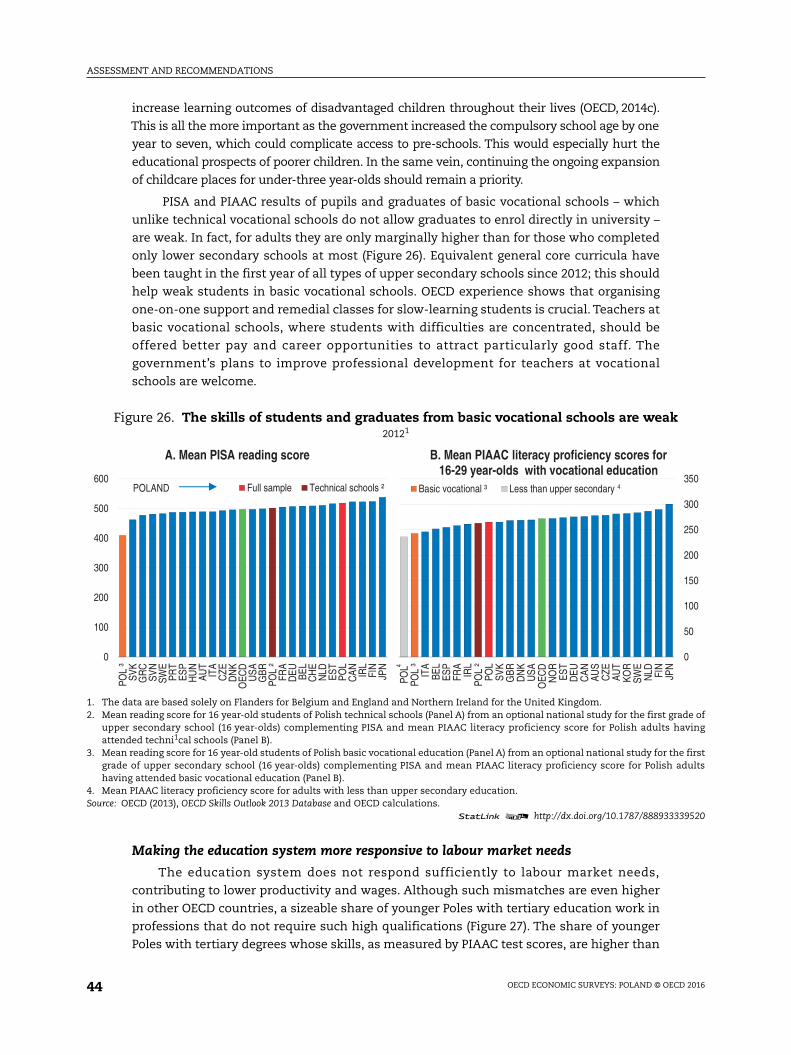
ASSESSMENT AND RECOMMENDATIONS
OECD ECONOMIC SURVEYS: POLAND © OECD 201644
increase learning outcomes of disadvantaged children throughout their lives (OECD, 2014c).
This is all the more important as the government increased the compulsory school age by one
year to seven, which could complicate access to pre-schools. This would especially hurt the
educational prospects of poorer children. In the same vein, continuing the ongoing expansion
of childcare places for under-three year-olds should remain a priority.
PISA and PIAAC results of pupils and graduates of basic vocational schools – which
unlike technical vocational schools do not allow graduates to enrol directly in university –
are weak. In fact, for adults they are only marginally higher than for those who completed
only lower secondary schools at most (Figure 26). Equivalent general core curricula have
been taught in the first year of all types of upper secondary schools since 2012; this should
help weak students in basic vocational schools. OECD experience shows that organising
one-on-one support and remedial classes for slow-learning students is crucial. Teachers at
basic vocational schools, where students with difficulties are concentrated, should be
offered better pay and career opportunities to attract particularly good staff. The
government’s plans to improve professional development for teachers at vocational
schools are welcome.
Making the education system more responsive to labour market needs
The education system does not respond sufficiently to labour market needs,
contributing to lower productivity and wages. Although such mismatches are even higher
in other OECD countries, a sizeable share of younger Poles with tertiary education work in
professions that do not require such high qualifications (Figure 27). The share of younger
Poles with tertiary degrees whose skills, as measured by PIAAC test scores, are higher than
Figure 26. The skills of students and graduates from basic vocational schools are weak20121
1. The data are based solely on Flanders for Belgium and England and Northern Ireland for the United Kingdom.2. Mean reading score for 16 year-old students of Polish technical schools (Panel A) from an optional national study for the first grade of
upper secondary school (16 year-olds) complementing PISA and mean PIAAC literacy proficiency score for Polish adults havingattended techni1cal schools (Panel B).
3. Mean reading score for 16 year-old students of Polish basic vocational education (Panel A) from an optional national study for the firstgrade of upper secondary school (16 year-olds) complementing PISA and mean PIAAC literacy proficiency score for Polish adultshaving attended basic vocational education (Panel B).
4. Mean PIAAC literacy proficiency score for adults with less than upper secondary education.Source: OECD (2013), OECD Skills Outlook 2013 Database and OECD calculations.
1 2 http://dx.doi.org/10.1787/888933339520
0
100
200
300
400
500
600
POL
³SV
KG
RC
SVN
SWE
PRT
ESP
HU
NAU
TIT
AC
ZED
NK
OEC
DU
SAG
BRPO
L ²
FRA
DEU BE
LC
HE
NLD ES
TPO
LC
AN IRL
FIN
JPN
Full sample Technical schools ²
A. Mean PISA reading score
POLAND
0
50
100
150
200
250
300
350
POL
POL
³IT
ABE
LES
PFR
AIR
LPO
L ²
POL
SVK
GBR
DN
KU
SAO
ECD
NO
RES
TD
EUC
AN AUS
CZE
AUT
KOR
SWE
NLD FI
NJP
N
Basic vocational ³ Less than upper secondary
B. Mean PIAAC literacy proficiency scores for 16-29 year-olds with vocational education
4
4
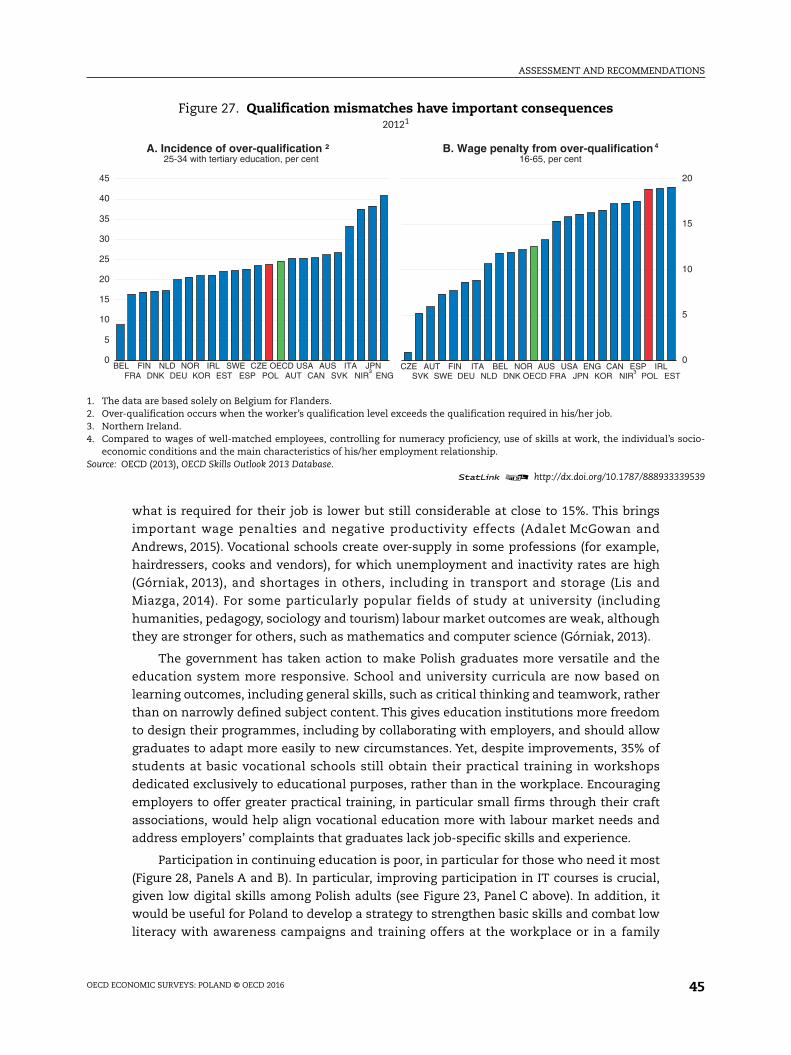
ASSESSMENT AND RECOMMENDATIONS
OECD ECONOMIC SURVEYS: POLAND © OECD 2016 45
what is required for their job is lower but still considerable at close to 15%. This brings
important wage penalties and negative productivity effects (Adalet McGowan and
Andrews, 2015). Vocational schools create over-supply in some professions (for example,
hairdressers, cooks and vendors), for which unemployment and inactivity rates are high
(Górniak, 2013), and shortages in others, including in transport and storage (Lis and
Miazga, 2014). For some particularly popular fields of study at university (including
humanities, pedagogy, sociology and tourism) labour market outcomes are weak, although
they are stronger for others, such as mathematics and computer science (Górniak, 2013).
The government has taken action to make Polish graduates more versatile and the
education system more responsive. School and university curricula are now based on
learning outcomes, including general skills, such as critical thinking and teamwork, rather
than on narrowly defined subject content. This gives education institutions more freedom
to design their programmes, including by collaborating with employers, and should allow
graduates to adapt more easily to new circumstances. Yet, despite improvements, 35% of
students at basic vocational schools still obtain their practical training in workshops
dedicated exclusively to educational purposes, rather than in the workplace. Encouraging
employers to offer greater practical training, in particular small firms through their craft
associations, would help align vocational education more with labour market needs and
address employers’ complaints that graduates lack job-specific skills and experience.
Participation in continuing education is poor, in particular for those who need it most
(Figure 28, Panels A and B). In particular, improving participation in IT courses is crucial,
given low digital skills among Polish adults (see Figure 23, Panel C above). In addition, it
would be useful for Poland to develop a strategy to strengthen basic skills and combat low
literacy with awareness campaigns and training offers at the workplace or in a family
Figure 27. Qualification mismatches have important consequences20121
1. The data are based solely on Belgium for Flanders.2. Over-qualification occurs when the worker’s qualification level exceeds the qualification required in his/her job.3. Northern Ireland.4. Compared to wages of well-matched employees, controlling for numeracy proficiency, use of skills at work, the individual’s socio-
economic conditions and the main characteristics of his/her employment relationship.Source: OECD (2013), OECD Skills Outlook 2013 Database.
1 2 http://dx.doi.org/10.1787/888933339539
0
5
10
15
20
25
30
35
40
45
BELFRA
FINDNK
NLDDEU
NORKOR
IRLEST
SWEESP
CZEPOL
OECDAUT
USACAN
AUSSVK
ITANIR
JPNENG³
A. Incidence of over-qualification ²25-34 with tertiary education, per cent
0
5
10
15
20
CZESVK
AUTSWE
FINDEU
ITANLD
BELDNK
NOROECD
AUSFRA
USAJPN
ENGKOR
CANNIR
ESPPOL
IRLEST
4
³
B. Wage penalty from over-qualification16-65, per cent
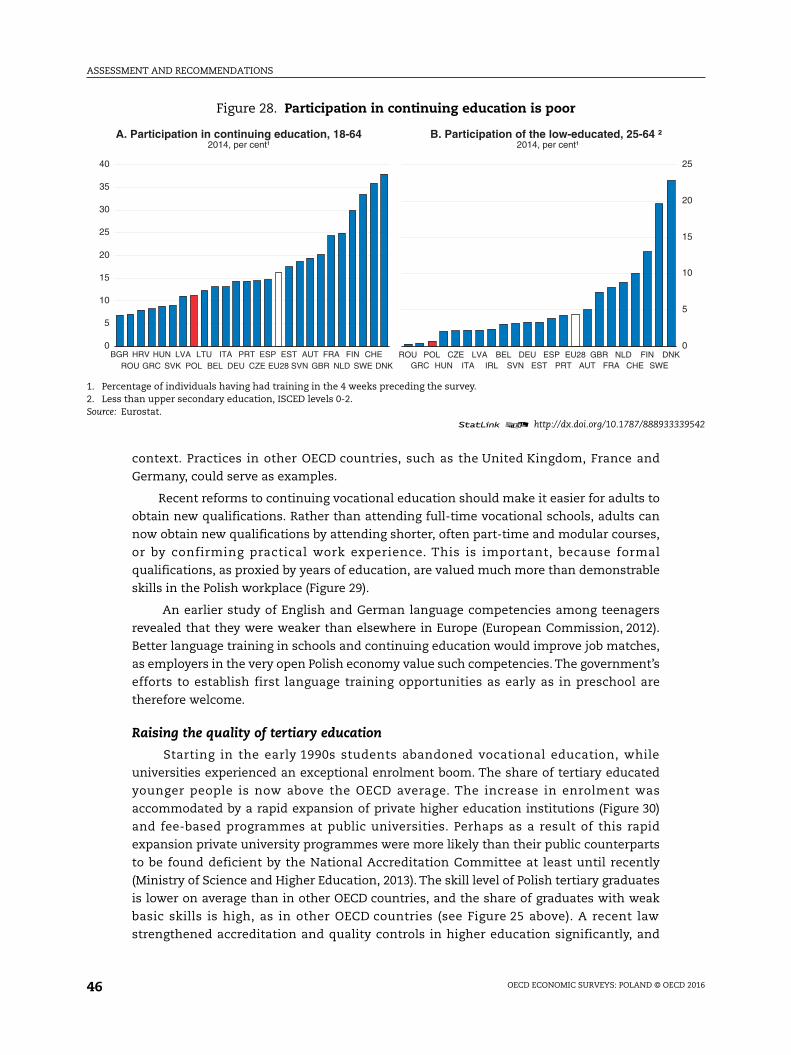
ASSESSMENT AND RECOMMENDATIONS
OECD ECONOMIC SURVEYS: POLAND © OECD 201646
context. Practices in other OECD countries, such as the United Kingdom, France and
Germany, could serve as examples.
Recent reforms to continuing vocational education should make it easier for adults to
obtain new qualifications. Rather than attending full-time vocational schools, adults can
now obtain new qualifications by attending shorter, often part-time and modular courses,
or by confirming practical work experience. This is important, because formal
qualifications, as proxied by years of education, are valued much more than demonstrable
skills in the Polish workplace (Figure 29).
An earlier study of English and German language competencies among teenagers
revealed that they were weaker than elsewhere in Europe (European Commission, 2012).
Better language training in schools and continuing education would improve job matches,
as employers in the very open Polish economy value such competencies. The government’s
efforts to establish first language training opportunities as early as in preschool are
therefore welcome.
Raising the quality of tertiary education
Starting in the early 1990s students abandoned vocational education, while
universities experienced an exceptional enrolment boom. The share of tertiary educated
younger people is now above the OECD average. The increase in enrolment was
accommodated by a rapid expansion of private higher education institutions (Figure 30)
and fee-based programmes at public universities. Perhaps as a result of this rapid
expansion private university programmes were more likely than their public counterparts
to be found deficient by the National Accreditation Committee at least until recently
(Ministry of Science and Higher Education, 2013). The skill level of Polish tertiary graduates
is lower on average than in other OECD countries, and the share of graduates with weak
basic skills is high, as in other OECD countries (see Figure 25 above). A recent law
strengthened accreditation and quality controls in higher education significantly, and
Figure 28. Participation in continuing education is poor
1. Percentage of individuals having had training in the 4 weeks preceding the survey.2. Less than upper secondary education, ISCED levels 0-2.Source: Eurostat.
1 2 http://dx.doi.org/10.1787/888933339542
0
5
10
15
20
25
30
35
40
BGRROU
HRVGRC
HUNSVK
LVAPOL
LTUBEL
ITADEU
PRTCZE
ESPEU28
ESTSVN
AUTGBR
FRANLD
FINSWE
CHEDNK
A. Participation in continuing education, 18-642014, per cent¹
0
5
10
15
20
25
ROUGRC
POLHUN
CZEITA
LVAIRL
BELSVN
DEUEST
ESPPRT
EU28AUT
GBRFRA
NLDCHE
FINSWE
DNK
B. Participation of the low-educated, 25-64 ²2014, per cent¹
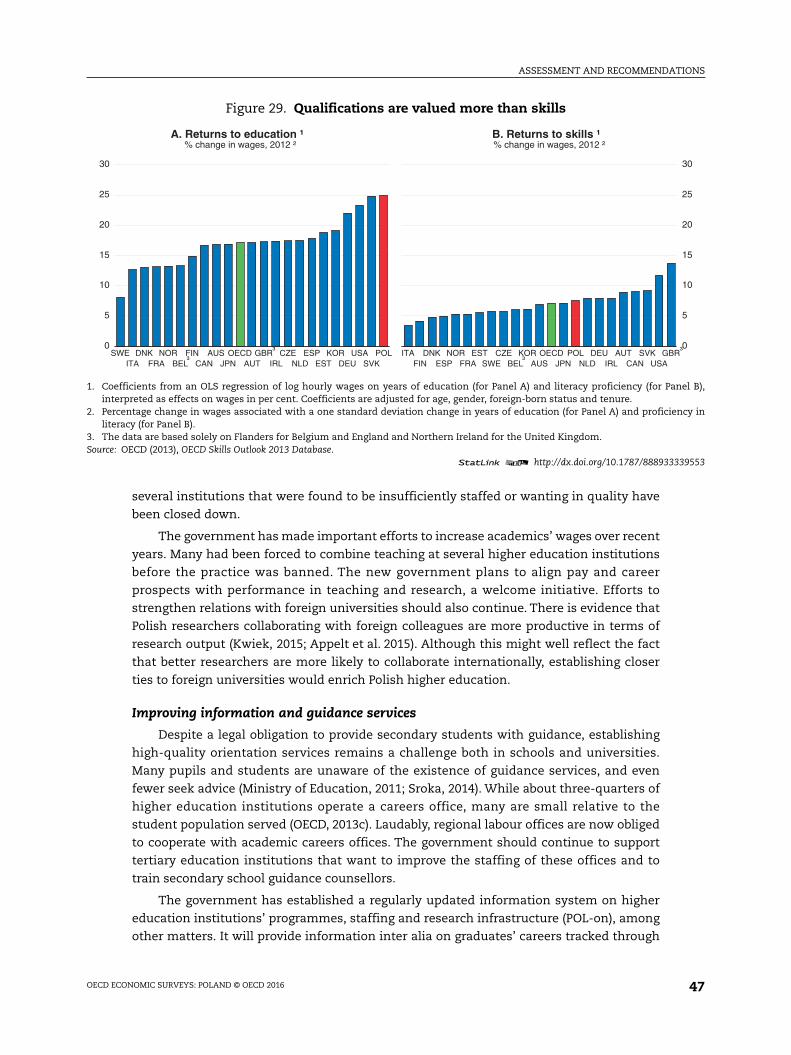
ASSESSMENT AND RECOMMENDATIONS
OECD ECONOMIC SURVEYS: POLAND © OECD 2016 47
several institutions that were found to be insufficiently staffed or wanting in quality have
been closed down.
The government has made important efforts to increase academics’ wages over recent
years. Many had been forced to combine teaching at several higher education institutions
before the practice was banned. The new government plans to align pay and career
prospects with performance in teaching and research, a welcome initiative. Efforts to
strengthen relations with foreign universities should also continue. There is evidence that
Polish researchers collaborating with foreign colleagues are more productive in terms of
research output (Kwiek, 2015; Appelt et al. 2015). Although this might well reflect the fact
that better researchers are more likely to collaborate internationally, establishing closer
ties to foreign universities would enrich Polish higher education.
Improving information and guidance services
Despite a legal obligation to provide secondary students with guidance, establishing
high-quality orientation services remains a challenge both in schools and universities.
Many pupils and students are unaware of the existence of guidance services, and even
fewer seek advice (Ministry of Education, 2011; Sroka, 2014). While about three-quarters of
higher education institutions operate a careers office, many are small relative to the
student population served (OECD, 2013c). Laudably, regional labour offices are now obliged
to cooperate with academic careers offices. The government should continue to support
tertiary education institutions that want to improve the staffing of these offices and to
train secondary school guidance counsellors.
The government has established a regularly updated information system on higher
education institutions’ programmes, staffing and research infrastructure (POL-on), among
other matters. It will provide information inter alia on graduates’ careers tracked through
Figure 29. Qualifications are valued more than skills
1. Coefficients from an OLS regression of log hourly wages on years of education (for Panel A) and literacy proficiency (for Panel B),interpreted as effects on wages in per cent. Coefficients are adjusted for age, gender, foreign-born status and tenure.
2. Percentage change in wages associated with a one standard deviation change in years of education (for Panel A) and proficiency inliteracy (for Panel B).
3. The data are based solely on Flanders for Belgium and England and Northern Ireland for the United Kingdom.Source: OECD (2013), OECD Skills Outlook 2013 Database.
1 2 http://dx.doi.org/10.1787/888933339553
0
5
10
15
20
25
30
SWEITA
DNKFRA
NORBEL
FINCAN
AUSJPN
OECDAUT
GBRIRL
CZENLD
ESPEST
KORDEU
USASVK
POL³
³
A. Returns to education ¹% change in wages, 2012 ²
0
5
10
15
20
25
30
ITAFIN
DNKESP
NORFRA
ESTSWE
CZEBEL
KORAUS
OECDJPN
POLNLD
DEUIRL
AUTCAN
SVKUSA
GBR³
³
B. Returns to skills ¹% change in wages, 2012 ²
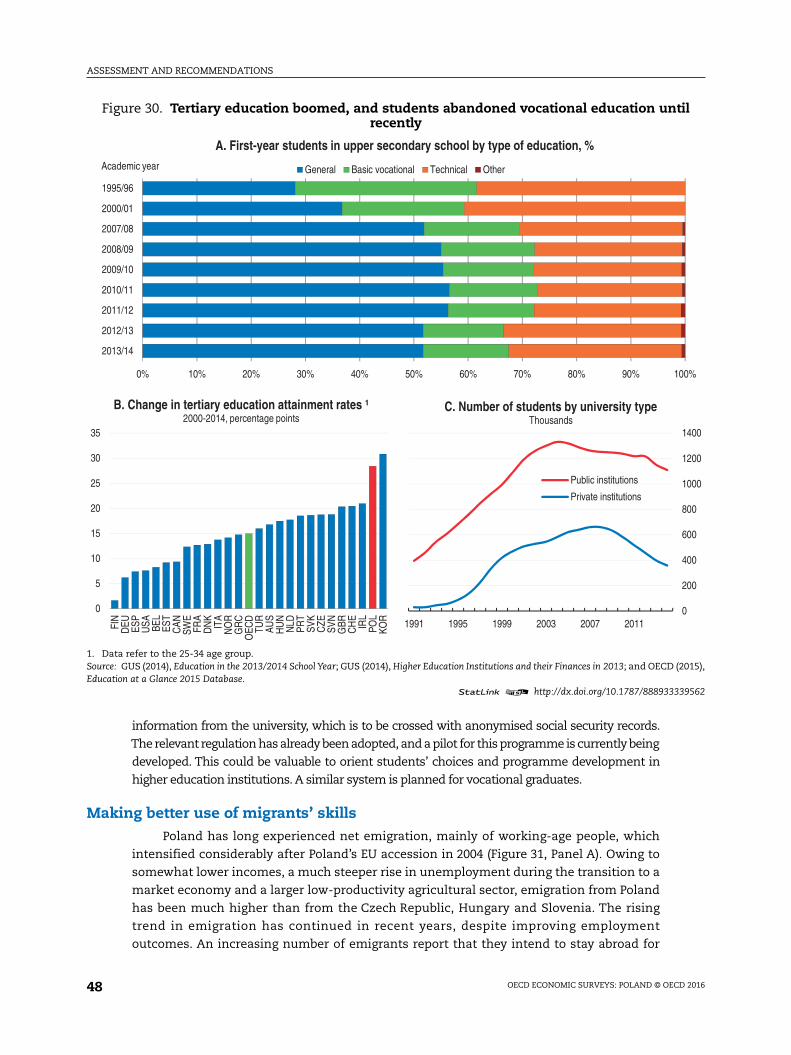
ASSESSMENT AND RECOMMENDATIONS
OECD ECONOMIC SURVEYS: POLAND © OECD 201648
information from the university, which is to be crossed with anonymised social security records.
The relevant regulation has already been adopted, and a pilot for this programme is currently being
developed. This could be valuable to orient students’ choices and programme development in
higher education institutions. A similar system is planned for vocational graduates.
Making better use of migrants’ skillsPoland has long experienced net emigration, mainly of working-age people, which
intensified considerably after Poland’s EU accession in 2004 (Figure 31, Panel A). Owing to
somewhat lower incomes, a much steeper rise in unemployment during the transition to a
market economy and a larger low-productivity agricultural sector, emigration from Poland
has been much higher than from the Czech Republic, Hungary and Slovenia. The rising
trend in emigration has continued in recent years, despite improving employment
outcomes. An increasing number of emigrants report that they intend to stay abroad for
Figure 30. Tertiary education boomed, and students abandoned vocational education untilrecently
1. Data refer to the 25-34 age group.Source: GUS (2014), Education in the 2013/2014 School Year; GUS (2014), Higher Education Institutions and their Finances in 2013; and OECD (2015),Education at a Glance 2015 Database.
1 2 http://dx.doi.org/10.1787/888933339562
0% 10% 20% 30% 40% 50% 60% 70% 80% 90% 100%
2013/14
2012/13
2011/12
2010/11
2009/10
2008/09
2007/08
2000/01
1995/96
General Basic vocational Technical OtherAcademic year
A. First-year students in upper secondary school by type of education, %
0
5
10
15
20
25
30
35
FIN
DEU ES
PU
SA BEL
EST
CAN
SWE
FRA
DN
KIT
AN
OR
GR
CO
ECD
TUR
AUS
HU
NN
LDPR
TSV
KC
ZESV
NG
BRC
HE
IRL
POL
KOR
B. Change in tertiary education attainment rates ¹2000-2014, percentage points
0
200
400
600
800
1000
1200
1400
1991 1995 1999 2003 2007 2011
Public institutions
Private institutions
C. Number of students by university typeThousands
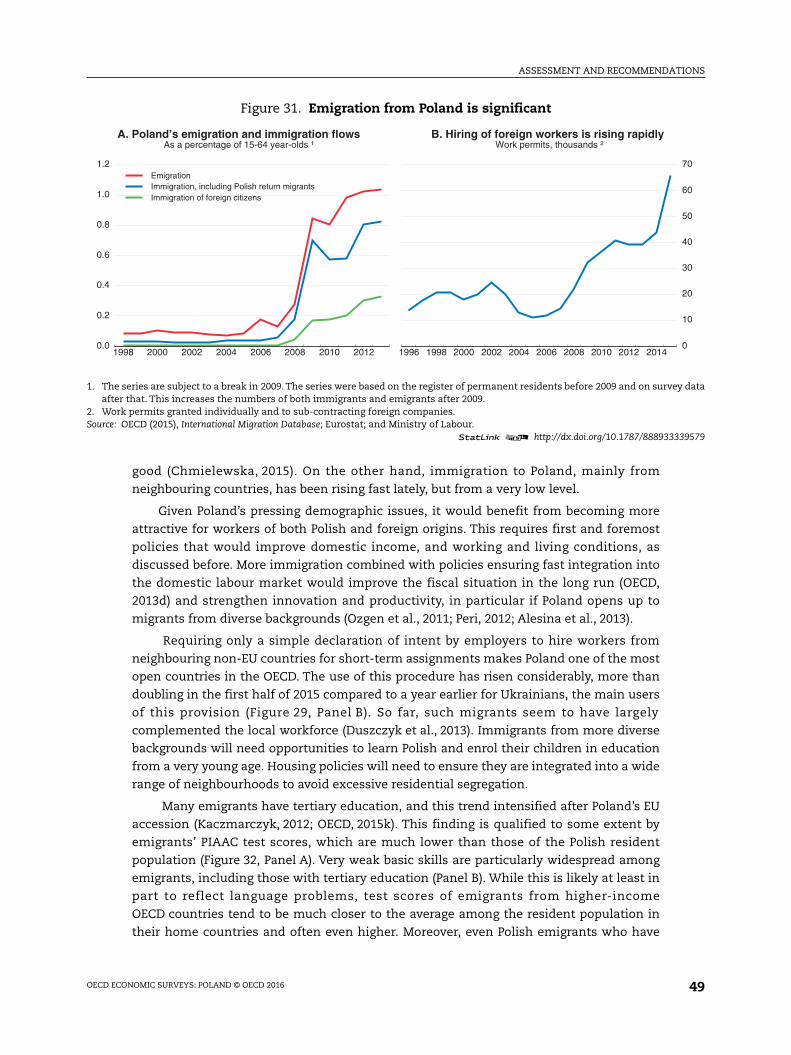
ASSESSMENT AND RECOMMENDATIONS
OECD ECONOMIC SURVEYS: POLAND © OECD 2016 49
good (Chmielewska, 2015). On the other hand, immigration to Poland, mainly from
neighbouring countries, has been rising fast lately, but from a very low level.
Given Poland’s pressing demographic issues, it would benefit from becoming more
attractive for workers of both Polish and foreign origins. This requires first and foremost
policies that would improve domestic income, and working and living conditions, as
discussed before. More immigration combined with policies ensuring fast integration into
the domestic labour market would improve the fiscal situation in the long run (OECD,
2013d) and strengthen innovation and productivity, in particular if Poland opens up to
migrants from diverse backgrounds (Ozgen et al., 2011; Peri, 2012; Alesina et al., 2013).
Requiring only a simple declaration of intent by employers to hire workers from
neighbouring non-EU countries for short-term assignments makes Poland one of the most
open countries in the OECD. The use of this procedure has risen considerably, more than
doubling in the first half of 2015 compared to a year earlier for Ukrainians, the main users
of this provision (Figure 29, Panel B). So far, such migrants seem to have largely
complemented the local workforce (Duszczyk et al., 2013). Immigrants from more diverse
backgrounds will need opportunities to learn Polish and enrol their children in education
from a very young age. Housing policies will need to ensure they are integrated into a wide
range of neighbourhoods to avoid excessive residential segregation.
Many emigrants have tertiary education, and this trend intensified after Poland’s EU
accession (Kaczmarczyk, 2012; OECD, 2015k). This finding is qualified to some extent by
emigrants’ PIAAC test scores, which are much lower than those of the Polish resident
population (Figure 32, Panel A). Very weak basic skills are particularly widespread among
emigrants, including those with tertiary education (Panel B). While this is likely at least in
part to reflect language problems, test scores of emigrants from higher-income
OECD countries tend to be much closer to the average among the resident population in
their home countries and often even higher. Moreover, even Polish emigrants who have
Figure 31. Emigration from Poland is significant
1. The series are subject to a break in 2009. The series were based on the register of permanent residents before 2009 and on survey dataafter that. This increases the numbers of both immigrants and emigrants after 2009.
2. Work permits granted individually and to sub-contracting foreign companies.Source: OECD (2015), International Migration Database; Eurostat; and Ministry of Labour.
1 2 http://dx.doi.org/10.1787/888933339579
1998 2000 2002 2004 2006 2008 2010 20120.0
0.2
0.4
0.6
0.8
1.0
1.2
EmigrationImmigration, including Polish return migrantsImmigration of foreign citizens
A. Poland’s emigration and immigration flowsAs a percentage of 15-64 year-olds ¹
1996 1998 2000 2002 2004 2006 2008 2010 2012 2014
0
10
20
30
40
50
60
70
B. Hiring of foreign workers is rising rapidlyWork permits, thousands ²

ASSESSMENT AND RECOMMENDATIONS
OECD ECONOMIC SURVEYS: POLAND © OECD 201650
stayed in the foreign country for over 10 years still have lower average test scores than the
Polish resident population, although the gap is narrower. Yet, there are limitations to
PIAAC data, namely the narrow representativeness for subgroups, such as emigrants from
a single country, and the difficulty to tell the difference between language problems and
fundamentally low skills. On balance, the observation that Poland has lost many workers
with high qualifications seems more important.
Polish emigrants work in low skilled occupations particularly often and rarely in
skilled occupations, even if they have tertiary education (Chmielewska, 2015; Kaczmarczyk
and Tyrowicz, 2015; Figure 32, Panels C and D). Similarly, immigrants to Poland often have
advanced qualifications but work in low-skill jobs, such as agriculture or domestic services.
These migrants suffer from a loss of hard and job-specific skills, probably associated with
their often poor ability in their destination country’s language. Polish return migrants often
do feel they have acquired new – in particular soft – skills, including in management and
languages, both on the job and through training, but also often complain that these are not
valued on the Polish labour market (Brzozowski, 2012; Szymanska et al., 2012).
Specialised job counsellors would help to better integrate migrants into the Polish
labour market as would better recognition of foreign credentials, of work experience and of
Figure 32. Skills of Polish emigrants are low, and they tend to perform simple jobs abroad2012
1. Percentage of adults scoring at or below level 1 of the PIAAC scale of numeracy proficiency.2. Skilled and elementary occupations are defined based on ISCO classification.3. The data are based solely on England and Northern Ireland for the United Kingdom.4. Simple average across countries with available observations.Source: OECD (2013), OECD Skills Outlook 2013 Database and OECD calculations.
1 2 http://dx.doi.org/10.1787/888933339588
230
240
250
260
270
280
290
300
POL OECD POL OECD POL
All residents All emigrants Poland,permanentemigrants(>10 years)
A. Average adult numeracy proficiency scores16-65
0
5
10
15
20
POL OECD POL OECD POL
All residents All emigrants Poland,permanentemigrants(>10 years)
B. Tertiary educated adults with weak numeracy skills ¹16-65, as a percentage of all adults with tertiary education
0102030405060708090
100
POLAUS
SVKGBR
DEUIRL
NLDOECD
USASWE
ESPITA
FRACZE
FINNOR³ 4
C. Share of tertiary educated emigrantsperforming skilled occupations abroad ²
Per cent
0
5
10
15
20
25
30
AUSCZE
IRLNOR
USANLD
FINDEU
GBRSWE
ITAFRA
OECDESP
POLSVK
³ 4
D. Share of tertiary educated emigrants performing low-skilled occupations abroad ²
Per cent

ASSESSMENT AND RECOMMENDATIONS
OECD ECONOMIC SURVEYS: POLAND © OECD 2016 51
skills acquired abroad. The new opportunities to validate practical experience and skills with
vocational qualifications might thus prove particularly useful for migrants.The recently adopted
integrated qualifications framework is another important project in this respect. With the same
methodology as the European qualifications framework it describes the knowledge, skills and
competences associated with qualifications, so that they can be more easily compared across
countries. Similar, perhaps bilateral, initiatives would be helpful for non-EU countries.
A more active outreach to the Polish diaspora would also be beneficial. The previous
government developed a programme to maintain ties with the Polish diaspora and
encourage them to transmit a positive image of Poland. This is welcome and should also be
used to advertise the country’s interesting business and job opportunities. Information on
practical details of coming to Poland is available on the website www.powroty.pl, which
targets return migrants. It would be useful to provide similar information in English for
foreigners interested in coming to Poland.
Bibliography
ACER (2015), Opinion of the Agency for the Cooperation of Energy Regulators No. 09/2015, Agency for theCooperation of Energy Regulators.
Adalet McGowan, M. and D. Andrews (2015), “Labour market mismatch and labour productivity:evidence from PIAAC data”, OECD Economics Department Working Papers, No. 1209, OECD Publishing.
Ahrend, R. and A. Schumann (2014), “Approaches to metropolitan area governance: a countryoverview”, OECD Regional Development Working Papers, No. 2014/03, OECD Publishing.
Alesina, A., J. Harnoss and H. Rapoport (2013), “Birthplace diversity and economic prosperity”, NBERWorking Paper, No. 18699.
Appelt, S., B. van Beuzekom, F. Galindo-Rueda and R. de Pinho (2015), “Which factors influence theinternational mobility of research scientists?”, OECD Science, Technology and Industry Working Papers,No. 2015/02, OECD Publishing.
Arak, P., P. Lewandowski and P. Żakowiecki (2014), “Dual labour market in Poland – proposals forovercoming the deadlock”, Instytut Badań Strukturalnych, Warsaw.
Auer, W. and N. Danzer (2015), “Fixed-Term Employment and Fertility: Evidence from German MicroData”, CESifo Economic Studies, pp. 1-29.
Bassanini, A., L. Nunziata and D. Venn (2008), “Job protection legislation and productivity growth inOECD countries”, IZA Discussion Paper, No. 3555, Bonn.
Brzozowski, J. (2012), “Analiza wpływu powrotów z emigracji na rozwój województwa śląskiego”, inJ. Szymańska, C. Ulasiński and D. Bieńkowska (eds.), Zaraz wracam… albo i nie. Skala powrotów,motywacje i strategie życiowe reemigrantów z województwa śląskiego, Centrum DoradztwaStrategicznego, Krakow.
CEER (2013), CEER Benchmarking Report 5.1 on the Continuity of Electricity Supply, Data update, Council ofEuropean Energy Regulators, Brussels.
Chmielewska, I. (2015), “Transfery z tytułu pracy Polaków za granicą w świetle badań NarodowegoBanku Polskiego”, Materiały i Studia, No. 314, Narodowy Bank Polski (NBP), Warsaw.
CODE2 (2014), Cogeneration Roadmap for Poland, Cogeneration Observatory and Dissemination Europe.
De la Rica, S. and A. Iza (2005), “Career planning in Spain: do fixed-term contracts delay marriage andparenthood?”, Review of Economics of the Household, Vol. 3, pp. 49-73.
Dolado, J., S. Ortigueira and R. Stucchi (2012), “Does dual employment protection affect TFP? Evidencefrom Spanish manufacturing firms”, CEPR Discussion Paper, No. 8763, London.
Duszczyk, M., M. Góra and P. Kaczmarczyk (2013), “Costs and benefits of labor mobility between the EUand the Eastern Partnership countries: The case of Poland”, IZA Discussion Paper, No. 7664, Bonn.
EEA (2011), “Revealing the costs of air pollution from industrial facilities in Europe”, European EnergyAgency Technical Report, No 15/2011.
ASSESSMENT AND RECOMMENDATIONS
OECD ECONOMIC SURVEYS: POLAND © OECD 201652
European Commission (2012), First European Survey on Language Competences, Brussels.
European Commission (2013), Impact assessment Accompanying the Documents Proposal for a Regulation ofthe European Parliament and of the Council Amending Regulation (EC) No 1370/2007 concerning theOpening of the Market for Domestic Passenger Transport Services by Rail, Brussels.
European Commission (2014), Smart Grid Projects Outlook 2014, Brussels.
European Commission (2015a), Country Report Poland – Commission Staff Working Document, Brussels.
European Commission (2015b), “Country Factsheet Poland – State of the Energy Union”, CommissionStaff Working Document, Brussels.
European Commission (2015c), “Achieving the 10% electricity interconnection target – Making Europe’selectricity grid fit for 2020”, Energy Union Package – Communication from the Commission to the EuropeanParliament and Council, COM(2015) 82 final.
European Commission (2015d), OP Digital Poland, Brussels.
European Commission (2015e), Single Market Scoreboard, Poland, Brussels.
Główny Urząd Stastyczny (GUS) (2014), Rocznik Statystyczny Pracy 2012, Warsaw.
Główny Urząd Stastyczny (GUS) (2015a), Employment in the National Economy, Warsaw.
Główny Urząd Stastyczny (GUS) (2015b), Concise Statistical Yearbook 2015, Warsaw.
Górniak, J. (2013), Youth or Experience? Human Capital in Poland – Report concluding the 3rd Round of the BKLstudy in 2012, Polska Agencja Rozwoju Przedsiębiorczości, Warsaw.
Grant Thornton (2015), International Business Report, London.
Hogg, D., M. Skou Andersen, T. Elliott, C. Sherrington, T. Vergunst, S. Ettlinger, L. Elliott and J. Hudson(2014), Study on Environmental Fiscal Reform Potential in 12 EU Member States, Final Report to DGEnvironment of the European Commission, No. 07.0307/ETU/2013/SI2.664058/ENV.D.2, AarhusUniversity, Aarhus and Eunomia Research and Consulting, Bristol, UK.
IEA (2011), Energy Policies of IEA Countries: Poland 2011 Review, IEA/OECD, OECD Publishing.
IFS (2010) (ed.), Dimensions of Tax Design: The Mirrlees Review, Oxford University Press.
IMF (2015), Republic of Poland: Staff Report for the 2015 Article IV Consultation, International MonetaryFund.
ITF (2013), Road Taxation Database, OECD Publishing.
Johansson, Å., D. Turner, Y. Guillemette, F. Murtin, C. de la Maisonneuve, P. Bagnoli, G. Bousquet and F.Spinelli (2013), “Long-term growth scenarios”, OECD Economics Department Working Papers, No. 1000,OECD Publishing.
Kaczmarczyk, P. (2012), “Labour market impacts of post-accession migration from Poland”, in OECD,Free Movement of Workers and Labour Market Adjustment: Recent Experiences from OECD Countries andthe European Union, OECD Publishing.
Kaczmarczyk, P. and J. Tyrowicz (2015), “Winners and losers among skilled migrants: the case of post-accession Polish migrants to the UK”, IZA Discussion Paper, No. 9057, Bonn.
Krajewska, M., S. Źróbek and M. Šubic-Kovač (2014), “The role of spatial planning in the investmentprocess in Poland and Slovenia”, Real Estate Management and Valuation, Vol. 22, No. 2, pp. 52-66.
Kwiek, M. (2015), “The internationalization of research in Europe: a quantitative study of 11 nationalsystems from a micro-level perspective”, Journal of Studies in International Education, pp. 1-9.
Lewandowski, P. and A. Kaminska (2014), “In-work poverty in Poland: Diagnosis and possibleremedies”, Instytut Badán Strukturalnych, Warsaw and World Bank Group, Washington, DC.
Lewandowski, P. and I. Magda (2014), “Employment in Poland – Labour in the Age of StructuralChange”, Warsaw.
Lis, M. and A. Miazga (2014), “Time for quality in vocational education”, IBS Policy Paper, No. 03/04,Instytut Badán Strukturalnych, Warsaw.
Manpower Group (2014), Niedobor Talentow, Warsaw.
Ministry of Economy (Ministerstwo Goposdarki) (2012), Report Evaluating Progress Towards Increasing theShare of High-efficiency Cogeneration in the Total Annual Production of Electricity in Poland, Warsaw.
ASSESSMENT AND RECOMMENDATIONS
OECD ECONOMIC SURVEYS: POLAND © OECD 2016 53
Ministry of Education (Ministerstwo Edukacji Narodowej- MEN) (2011), Badanie Funkcjonowania SystemuKształcenia Zawodowego w Polsce – Raport Końcowy, Warsaw.
Ministry of Finance (Ministerstwo Finansow) (2010), Tax Expenditures in Poland, Warsaw.
Ministry of Finance (Ministerstwo Finansow) (2014), Preferencje Podatkowe w Polsce, Warsaw.
Ministry of Regional Development (Ministerstwo Rozwoju Regionalnego) (2012), KoncepcjaPrzestrzennego Zagospodarowania Kraju 2030, Warsaw.
Ministry of Science and Higher Education (Ministerstwo Nauki i Szkolnistwa Wyższego – MniSW)(2013), Szkolnistwo Wyższe w Polsce, Warsaw.
National Labour Inspectorate (Państwowa Inspekcja Pracy – PIP) (2015), Sprawodzanie z DziałalnośćPaństwowej Inspekcij Pracy w 2014 Roku, Warsaw.
NBP (2013), Financial Stability Report July 2013, Narodowy Bank Polski, Warsaw.
NBP (2015), Financial Stability Report July 2015, Narodowy Bank Polski , Warsaw.
NBP (2016), Financial Stability Report February 2016, Narodowy Bank Polski, Warsaw.
NEA/IEA/OECD (2015), Projected Costs of Generating Electricity 2015, OECD Publishing.
NIK (2014a), NIK about Local Roads, Supreme Audit Office, Warsaw.
NIK (2014b), NIK on Inland Shipping, Supreme Audit Office, Warsaw.
OECD (2008), OECD Employment Outlook 2008, OECD Publishing.
OECD (2011a), Doing Better for Families, OECD Publishing.
OECD (2011b), Economic Survey of Sweden, OECD Publishing.
OECD (2011c), “The Impact of the 1999 Education Reform in Poland”, OECD Education Working Papers,No. 49, OECD Publishing.
OECD (2012), Closing the Gender Gap: Act Now, OECD Publishing.
OECD (2013a), Economic Policy Reforms 2013: Going for Growth, OECD Publishing.
OECD (2013b), Taxing Energy Use: A Graphical Analysis, OECD Publishing.
OECD (2013c), Higher Education in Regional and City Development: Wroclaw, Poland 2012, OECD Publishing.
OECD (2013d), International Migration Outlook 2013, OECD Publishing.
OECD (2014a), OECD Economic Surveys: Poland 2014, OECD Publishing.
OECD (2014b), OECD Employment Outlook 2014, OECD Publishing.
OECD (2014c), “Does primary education reach those who need it most?”, PISA in Focus 40, OECDPublishing.
OECD (2015a), OECD/G20 Base Erosion and Profit Shifting Project, Explanatory Statement, OECD Publishing.
OECD (2015b), Pensions at a Glance 2015, OECD Publishing.
OECD (2015c), Ageing and Employment Policies: Poland 2015, OECD Publishing.
OECD (2015d), OECD Economic Outlook 2015, Issue 1, OECD Publishing.
OECD (2015e), OECD Environmental Performance Reviews: Poland 2015, OECD Publishing.
OECD (2015f), Environment Database – Emissions of Air Pollutants, OECD publishing.
OECD (2015g), Measuring the Digital Economy, A New Perspective, OECD Publishing.
OECD (2015h), OECD Regulatory Policy Outlook 2015, OECD Publishing.
OECD (2015i), The Future of Productivity, OECD Publishing.
OECD (2015j), “Taxation of SMEs in OECD and G20 Countries”, OECD Tax Policy Studies, No. 23, OECDPublishing.
OECD (2015k), Connecting with Emigrants, OECD Publishing.
Ozgen, C., P. Nijkamp and J. Poot (2011), “Immigration and Innovation in European Regions”, IZADiscussion Paper, No. 5646, Bonn.
Peppercorn, I. G. and C. Taffin (2013), Rental Housing: Lessons from International Experience and Policies forEmerging Markets. Directions in Development, World Bank, Washington, DC.
ASSESSMENT AND RECOMMENDATIONS
OECD ECONOMIC SURVEYS: POLAND © OECD 201654
Peri, G. (2012), “The effect of immigration on productivity: evidence from US States.” Review ofEconomics and Statistics, Vol. 94, pp. 348-58.
Price Waterhouse Coopers (PwC) (2015), Wyłudzenia VAT – Luka Podatkowa w 2014 roku i Prognozana 2015, Warsaw.
Public Procurement Office (2015), Report on Functioning of Public Procurement System in 2014, Warsaw.
Rutkowski, A. (2009), “Public investment, transport infrastructure and growth in Poland”, EuropeanCommission Country Focus, No. 11.
Sroka, M. (2014), “Functioning of academic career centres in Polish schools of higher education”, PolishJournal of Management Studies, Vol. 10, pp.135-44.
Szymańska, J., C. Ulasiński and D. Bieńkowska (2012), Zaraz wracam… albo i nie. Skala powrotów,motywacje i strategie życiowe reemigrantów z województwa śląskiego, Centrum DoradztwaStrategicznego, Kraków.
Toro, J., A. Jensen, M. Thackray, M. Kidd and B. Russell (2015), “Tax administration, modernizationchallenges and strategic priorities”, Technical Assistance Report, Republic of Poland, IMF Country ReportNo. 15/112, Washington, DC.
Vega, M. L. and R. Robert (2013), “Labour inspection sanctions: Law and practice of national labourinspection systems”, Labour Administration and Inspection Programme LAB/ADMIN Working Document,No. 26, International Labour Organization, Geneva.
Veneri, P. (2015), “Urban spatial structure in OECD sities: Is urban population decentralising orclustering?”, OECD Regional Development Working Papers, No. 2015/01, OECD Publishing.
World Bank (2011), “Poland, transport policy note: Toward a sustainable land transport sector”, WorldBank Report, No. 59715-PL.
World Bank (2015), Doing Business 2016, Measuring Regulatory Quality and Efficiency, The World Bank,Washington, DC.
OECD Economic Surveys: Poland
© OECD 2016
55
ANNEX
Progress in structural reform
ANNEX. PROGRESS IN STRUCTURAL REFORM
OECD ECONOMIC SURVEYS: POLAND © OECD 201656
Recommendations Action taken since the beginning of 2014
Product and financial market competition
Give the Competition Authority more powers to split up firms to reduce dominantmarket positions and to impose vertical separation as a remedy for reduced third-party access in network industries. Create an independent regulator for water andsanitation services.
The Competition Authority can now impose structural remedies, when behaviouralmeasures prove insufficient or overly damaging to the undertaking. After a two-yearmonitoring period and consultations, the Competition Authority may be given newpowers.
Modify public procurement practices to select the contractors offering the bestvalue for money rather than the lowest price. Focus procurement decisions on a mixof prices and technical bid details, including environmental impact assessments.Enhance staff skills to deal with complex selection criteria.
The application of the price as sole award criterion has been restricted to contractsfor standard goods and services. Contracting authorities have been encouraged toconsider innovative, environmental and social characteristics. Specific guidelinesand training measures have been provided to contracting authorities. Governmentalinstitutions now have to respect some social clauses in procurement contracts.
Make the judicial environment friendlier to class actions in cases of competitionbreaches. Accelerate the functioning of the judicial system to shorten the timebetween the Competition Authority’s decisions and a final court decision in antitrustcases.
No action taken.
Pursue privatisation, and substantially reduce government ownership incompetitive segments of the economy while ensuring sound governance ofremaining state-owned enterprises. Remove regulations and implicit subsidiesdistorting competition between public and private firms.
The number of companies the Treasury supervises fell from 387 in January 2014 to281 in December 2015. The government envisages selling further minority shares.A new target for gender composition, additional financial planning and extra trainingof state-appointed directors have together strengthened SOE boards.
Fully implement the second and third stages of the liberalisation of professionalservices.
The second and third stages entered into force in August 2014 and December 2015.
Reduce anti-competitive pressures resulting from the participation of PolishAirports State Enterprise (PPL) in many airport entities, and consider long-termconcession agreements or privatisation for airport entities. Privatise the national aircarrier (LOT).
PPL is running its business on its own behalf and risk. It has shares in entitiesmanaging the most important Polish regional airports, running their business undercommercial law. The analyses for the privatisation of LOT are ongoing.
Deepen financial development through a consolidation of co-operative banks and animproved legal framework for collateral. Set a cap on interbank fees for credit cardtransactions to reduce the effects of market concentration in line with the 2013 EUproposal.
New regulations allow co-operative banks to set up institutional protectionschemes, which group institutions together. A cap on interbank fees was introducedand reduced to 0.3% and 0.2% for credit and debit card transactions, respectively.
Fiscal policy and the budgetary framework
Improve tax compliance and cut tax expenditures. Simplify tax regulations.Reinforce the monitoring and enforcement of the tax system. Eliminate thepreferential regimes for the self-employed and link their social securitycontributions to their actual earnings. Broaden tax bases by introducing cashregisters for all professional services to improve VAT collection and by significantlytightening eligibility for the lump-sum income tax. Extend the social insurancecontribution base to uncovered earnings.
A law passed in 2015 assigns more tax administration staff to inspection andenforcement. There is now pre-filling for tax declarations, and the number ofrequired documents was reduced. Companies will be assigned to a single tax office,and tax rulings will now clarify all cases of identical content.Mandatory cash registers were extended to several professional and personalservices.Supervisory board members now have to pay social contributions.
Redesign and increase the least distortive taxes, by establishing market-value-based property taxes and by taxing capital gains on rented properties.
No action taken.
Further tighten eligibility criteria in the generous disability pension system.Substantially reduce subsidies to the farmers’ social security scheme, eliminatepension privileges for certain occupations, and increase the female retirement ageat a faster pace, e.g. to reach 67 by 2030 instead of 2040 as currently scheduled.
Since January 2015 farmers undertaking additional work on a contract of mandatepay contributions to the universal ZUS insurance for that part of their revenues.Prevention and rehabilitation by KRUS will be financed almost fully by farmers’contributions. However, a presidential draft bill envisages lowering retirement ages.
Strengthen the fiscal framework by: introducing a deficit rule; creating anindependent fiscal council at least to monitor fiscal performance relative to targets;and harmonising the domestic and Maastricht definitions of government debt.
An expenditure rule was introduced into the budget process in 2014. It wasamended in late 2015: the scope of entities covered was increased, the inflationforecast used to determine the spending limit was replaced by the MPC target, anda possibility to increase expenditures in case of positive one-offs was introduced.The government considers that most elements of a fiscal council are in place, as thesupreme audit office assesses budget execution in terms of its compliance withfiscal rules.
Labour markets (see also Chapter 1 herein)
Allow the public employment services to hire more skilled staff, and ensure thatoverall resources are better allocated to front-line placement tasks. Promote theadoption of best practices through performance management and benchmarking ofemployment-service providers.
Managers of local labour offices and placement officers with good results can nowreceive performance-based rewards.As of 2017 external employment service providers will be benchmarked based onplacement and three-month retention rates.
Rationalise ALMPs by focusing more on job-search assistance, career guidance andwork schemes having a high training content. Improve job-seeker profiling. Reducepassive social assistance by making more transfers (such as childcare subsidies)conditional in part on being employed or seeking work. Expand the scope of privateemployment services.
Different tasks at local labour offices were combined to create client advisor postsin 2014.The number of such client advisors, including staff involved in job-searchassistance, grew in total to 7812. Needs-based intensity-of-service provision basedon profiling was introduced. The possibility to outsource job-placement services toprivate providers was introduced in 2015.
ANNEX. PROGRESS IN STRUCTURAL REFORM
OECD ECONOMIC SURVEYS: POLAND © OECD 2016 57
Consider merging local labour offices with unemployment benefits and socialassistance administration to create a one-stop shop and more fundamentally tointegrate the management of those activities. Enhance coordination and automaticexchange of information between local labour offices, firms, assistance centres andeducation institutions.
Since 2014 unemployed recipients of social assistance can be guided towardsactivation and social integration programmes under joint supervision by locallabour offices, the social welfare centre and NGOs under the Activation andIntegration Program (PAI).
Refrain from increasing the minimum-to-average wage ratio. Considerdifferentiating the minimum wage across regions depending on local labour-marketconditions. Reduce wage rigidities by bringing the effects of age and education onpublic-sector wages closer to private-sector standards.
In January 2016, the minimum wage was increased by 6% for full-time workerswith more than one year of tenure. This is above the increase in the average wageprojected by the OECD.
Consider introducing an earned-income tax credit to encourage labour marketparticipation by marginal groups.
No action taken.
Eliminate pre-retirement schemes, and prevent disability pensions from becomingattractive relative to old-age pensions. Remove the prohibition to lay off workersless than four years before retirement. Scale back survivors’ pensions to reduce thelabour tax wedge.
No action taken.
Promote the employment of people with disability by: reducing the employmentquota of 6% and raising the penalty for firms failing to reach the revised level; andbetter training and activating workers with disability.
In 2014 subsidies for employing disabled people in sectors not specialised inemploying disabled workers were increased, and a draft law foresees extending thescope of subsidies. There is new financial support for training disabled people.Public sector personnel and job coaches were trained to manage disabledemployees and assist them.
Health care
Broaden access to care and reduce inequality by: targeting extra resources toshortening waiting lists; extending dental services covered by public insurance;introducing co-payments on medical services while imposing a means-tested capon the level of out-of-pocket payments; and increasing transparency of dualphysician employment in the public and private sectors.
Fast-track waiting lists for cancer patients were introduced in 2015. They are nowguaranteed treatment within a specified period, and there are no financing limits fortreatment. Health-care providers who ensure timeliness and comprehensiveness ofhealth-care services face no financing ceilings. But waiting lists for several otherprocedures remain extremely long. Work is underway to extend the basichealth-benefit package in stomatology and dental care.
Improve the allocation and use of current resources by: shifting resources fromhospitals to primary and long-term care, potentially by integrated health-caredelivery models; strengthening the gate-keeping role of primary medicine; providingclearer incentives to hospitals to make them respect their financial commitmentsand rationalise the use of their resources; promoting the development of hospitalmanagement skills; and streamlining the responsibilities of the NFZ and central andlocal governments.
New schemes of integrated health-care will be tested in 2016-20. Since 2015referrals of primary doctors are obligatory for ophthalmologists anddermatologists. Primary health-care was strengthened in oncology.The Minister of Health in cooperation with the National Institute of Public Health willfinalise health needs maps in 2016 as a basis for the National Health Fund topurchase health-care services.
Develop a comprehensive strategy to address growing long-term care needs. Avoidlabour shortages in the health-care sector by: training more staff; improvingretention, particularly through better management policies and delaying retirement;enhancing re-integration in the health workforce of those who have left it; adoptinga more efficient skill mix by enhancing the role of advanced practice nurses andphysicians’ assistants; improving productivity, in particular by linking pay toperformance; and developing targeted immigration policies.
The National Health Program 2016-20, under discussion, includes a strategy toaddress senior citizens’ health needs through public information campaigns andimproved services, notably early diagnosis and training in geriatric health. Some200 medical care givers in geriatrics have been trained in 2012-15. Newspecialisations for medical professions and modular training reduced the time toobtain a specialisation in 2013-15. A September 2015 law eased foreigners’employment as nurses or midwives and facilitated returning to health professionsafter a long break and combining teaching and practice.
Recommendations Action taken since the beginning of 2014


OECD ECONOMIC SURVEYS: POLAND © OECD 2016
Thematic chapters


OECD Economic Surveys: Poland
© OECD 2016
61
Chapter 1
Making better use of skills and migration
To continue catching up with living standards in other OECD countries Poland needsto invest in higher skills. Crucial elements include: i) making sure that all childrenhave access to high-quality early childhood education; ii) strengthening the basicskills of vocational education students and the relevance of their studies throughstronger links with firms; and iii) improving the quality of universities by linkinguniversity teachers' pay and career progress with their teaching and researchperformance. The Polish government has taken action in many of these areas. Moreneeds to be done to put immigrants' skills to better use. Polish return migrantsfrequently complain about difficulties in using their skills acquired abroad, whilemany immigrants of foreign origin work in professions that do not match theirqualifications. Ongoing reforms to improve recognition of foreign credentials andnew possibilities to validate work experience through formal qualifications will behelpful.
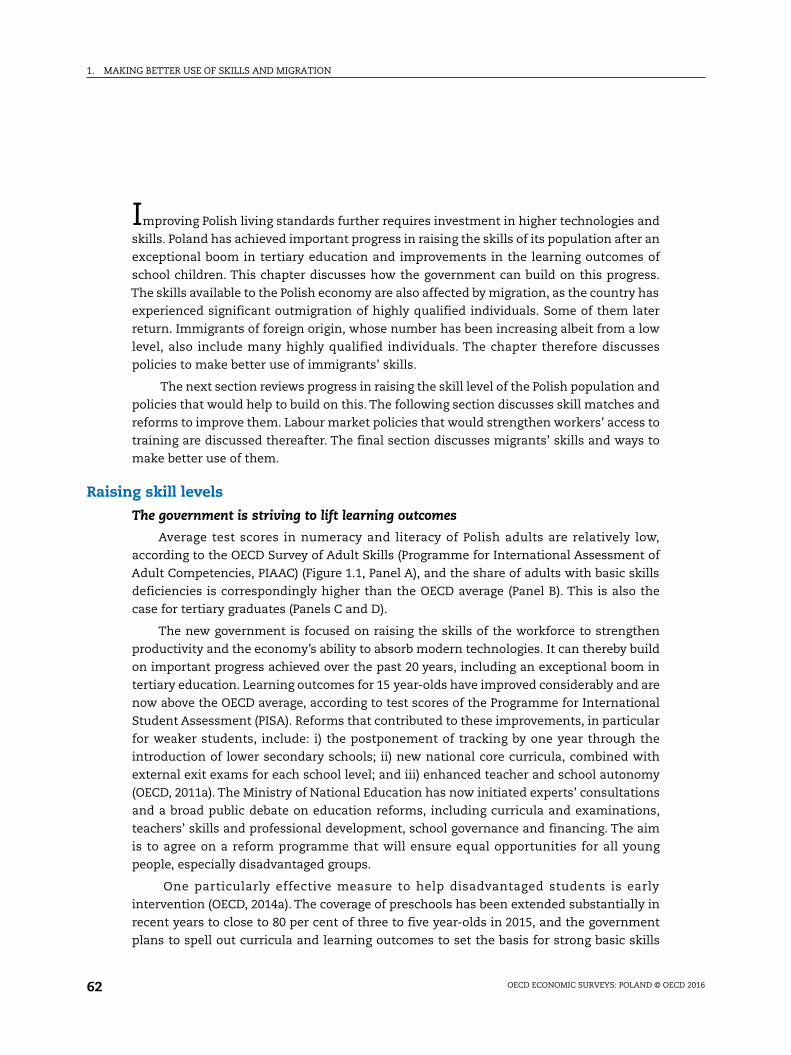
1. MAKING BETTER USE OF SKILLS AND MIGRATION
OECD ECONOMIC SURVEYS: POLAND © OECD 201662
Improving Polish living standards further requires investment in higher technologies and
skills. Poland has achieved important progress in raising the skills of its population after an
exceptional boom in tertiary education and improvements in the learning outcomes of
school children. This chapter discusses how the government can build on this progress.
The skills available to the Polish economy are also affected by migration, as the country has
experienced significant outmigration of highly qualified individuals. Some of them later
return. Immigrants of foreign origin, whose number has been increasing albeit from a low
level, also include many highly qualified individuals. The chapter therefore discusses
policies to make better use of immigrants’ skills.
The next section reviews progress in raising the skill level of the Polish population and
policies that would help to build on this. The following section discusses skill matches and
reforms to improve them. Labour market policies that would strengthen workers’ access to
training are discussed thereafter. The final section discusses migrants’ skills and ways to
make better use of them.
Raising skill levels
The government is striving to lift learning outcomes
Average test scores in numeracy and literacy of Polish adults are relatively low,
according to the OECD Survey of Adult Skills (Programme for International Assessment of
Adult Competencies, PIAAC) (Figure 1.1, Panel A), and the share of adults with basic skills
deficiencies is correspondingly higher than the OECD average (Panel B). This is also the
case for tertiary graduates (Panels C and D).
The new government is focused on raising the skills of the workforce to strengthen
productivity and the economy’s ability to absorb modern technologies. It can thereby build
on important progress achieved over the past 20 years, including an exceptional boom in
tertiary education. Learning outcomes for 15 year-olds have improved considerably and are
now above the OECD average, according to test scores of the Programme for International
Student Assessment (PISA). Reforms that contributed to these improvements, in particular
for weaker students, include: i) the postponement of tracking by one year through the
introduction of lower secondary schools; ii) new national core curricula, combined with
external exit exams for each school level; and iii) enhanced teacher and school autonomy
(OECD, 2011a). The Ministry of National Education has now initiated experts’ consultations
and a broad public debate on education reforms, including curricula and examinations,
teachers’ skills and professional development, school governance and financing. The aim
is to agree on a reform programme that will ensure equal opportunities for all young
people, especially disadvantaged groups.
One particularly effective measure to help disadvantaged students is early
intervention (OECD, 2014a). The coverage of preschools has been extended substantially in
recent years to close to 80 per cent of three to five year-olds in 2015, and the government
plans to spell out curricula and learning outcomes to set the basis for strong basic skills
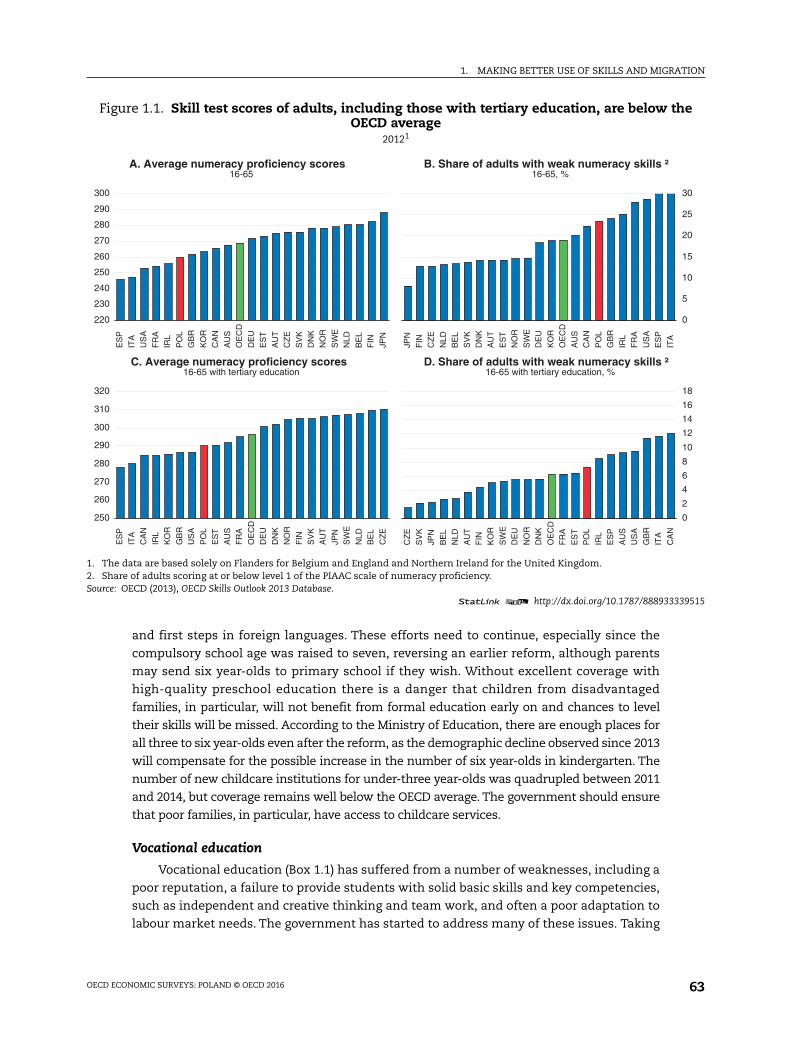
1. MAKING BETTER USE OF SKILLS AND MIGRATION
OECD ECONOMIC SURVEYS: POLAND © OECD 2016 63
and first steps in foreign languages. These efforts need to continue, especially since the
compulsory school age was raised to seven, reversing an earlier reform, although parents
may send six year-olds to primary school if they wish. Without excellent coverage with
high-quality preschool education there is a danger that children from disadvantaged
families, in particular, will not benefit from formal education early on and chances to level
their skills will be missed. According to the Ministry of Education, there are enough places for
all three to six year-olds even after the reform, as the demographic decline observed since 2013
will compensate for the possible increase in the number of six year-olds in kindergarten. The
number of new childcare institutions for under-three year-olds was quadrupled between 2011
and 2014, but coverage remains well below the OECD average. The government should ensure
that poor families, in particular, have access to childcare services.
Vocational education
Vocational education (Box 1.1) has suffered from a number of weaknesses, including a
poor reputation, a failure to provide students with solid basic skills and key competencies,
such as independent and creative thinking and team work, and often a poor adaptation to
labour market needs. The government has started to address many of these issues. Taking
Figure 1.1. Skill test scores of adults, including those with tertiary education, are below theOECD average
20121
1. The data are based solely on Flanders for Belgium and England and Northern Ireland for the United Kingdom.2. Share of adults scoring at or below level 1 of the PIAAC scale of numeracy proficiency.Source: OECD (2013), OECD Skills Outlook 2013 Database.
1 2 http://dx.doi.org/10.1787/888933339515
220
230
240
250
260
270
280
290
300
ES
P
ITA
US
A
FR
AIR
L
PO
LG
BR
KO
RC
AN
AU
SO
EC
D
DE
UE
ST
AU
TC
ZE
SV
KD
NK
NO
R
SW
EN
LD
BE
LF
IN
JPN
A. Average numeracy proficiency scores 16-65
0
5
10
15
20
25
30
JPN
FIN
CZ
E
NLD
BE
L
SV
KD
NK
AU
T
ES
TN
OR
SW
ED
EU
KO
RO
EC
D
AU
SC
AN
PO
LG
BR
IRL
FR
A
US
AE
SP
ITA
B. Share of adults with weak numeracy skills ²16-65, %
250
260
270
280
290
300
310
320
ES
P
ITA
CA
N
IRL
KO
R
GB
RU
SA
PO
LE
ST
AU
SF
RA
OE
CD
DE
U
DN
KN
OR
FIN
SV
KA
UT
JPN
SW
E
NLD
BE
L
CZ
E
C. Average numeracy proficiency scores16-65 with tertiary education
0
2
4
6
8
10
12
14
16
18
CZ
E
SV
KJP
N
BE
LN
LD
AU
TF
INK
OR
SW
ED
EU
NO
RD
NK
OE
CD
FR
A
ES
TP
OL
IRL
ES
P
AU
SU
SA
GB
RIT
A
CA
N
D. Share of adults with weak numeracy skills ²16-65 with tertiary education, %
1. MAKING BETTER USE OF SKILLS AND MIGRATION
OECD ECONOMIC SURVEYS: POLAND © OECD 201664
these reforms further would help vocational graduates to find better job matches on the
Polish labour market.
Adapting vocational education to the market economy has been a challenge. While
the education systems in former communist states were generally thought to be good, it
quickly turned out after the transition to a market economy that they lacked the flexibility
to adapt. Average educational attainment and literacy rates were relatively high, and there
was a strong base of vocational education in Poland, as in other Central and Eastern
European Countries (CEECs), when the economic transformation set in. However,
knowledge and competencies taught in vocational schools were often specific to
enterprises to which they were attached (Mertaugh and Hanushek, 2005). Many of these
enterprises disappeared, and thus firm-specific knowledge and skills became obsolete. As
demand for skilled manufacturing workers dwindled, many young people abandoned basic
vocational education (Figure 1.2). Only lately has the interest in vocational schools, above
all the technical branch, begun to increase again, as it has become apparent that there are
shortages of qualified workers with intermediate skills. Meanwhile, it took vocational
schools time to establish links to newly created firms, and the process of developing high-
quality training in management, IT and other advanced technologies is still ongoing. The
same holds for more generic skills, such as foreign languages, critical thinking, creativity
and leadership. This has been partly related to widespread rote learning, as opposed to
active learning, which involves a critical evaluation and understanding of concepts
(Nešporová, 2000).
Overall labour market outcomes of Polish vocational school leavers are weak,
especially so for graduates of basic vocational schools. Employment rates are low by
Box 1.1. Initial vocational education in Poland
Upper secondary (general and vocational) education starts at age 16. Most students goeither to a four-year upper secondary technical school (technikum, ISCED 3A) or to a three-year basic vocational school (zasadnicza szkoła zawodowa, ISCED 3B). Vocational educationis also provided in post-secondary non-tertiary schools (szkoła policealna).
General secondary school (licea ogólnoksztalcace, ISCED 3A) prepares students for passinga matura exam and for pursuing their education in a higher-education institution.Technical upper secondary school prepares students both for the matura and entering thelabour market. Basic vocational school and post-secondary non-tertiary school are focusedon providing vocational qualifications for occupations classified by the Ministry ofEducation.
Practical training makes up approximately 60% of total hours in basic vocational schoolsand 50% in technical schools and may take place in school workshops and laboratories,continuing education centres and practical training centres. Work-based training in alltypes of vocational schools lasts 4-12 weeks, depending on the occupation, and isorganised once or twice during the study period.
The scope of knowledge and skills acquired by pupils and the volume of practical andwork-based training are defined by curricula for each occupation. Since 2012, there hasbeen a single core curriculum for all occupations that defines interdisciplinary skills(e.g. social and interpersonal, entrepreneurship and management) and the level ofproficiency to be mastered in every occupation.
Based on: Cedefop (2013a and 2013b).
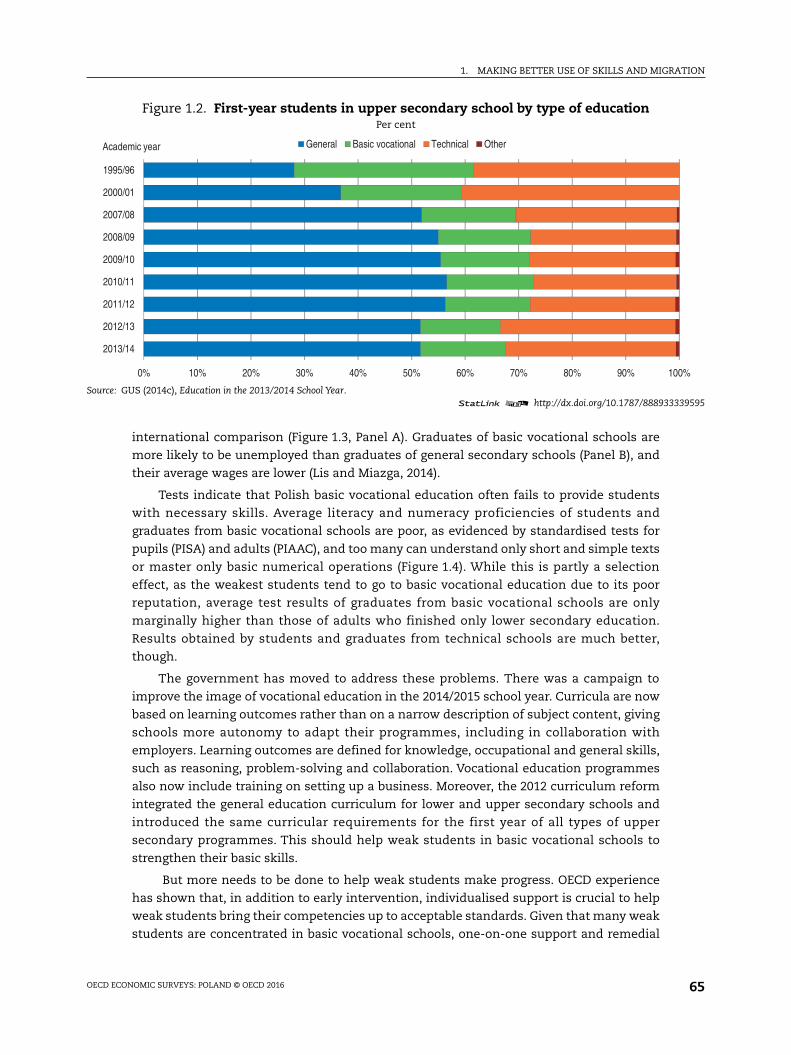
1. MAKING BETTER USE OF SKILLS AND MIGRATION
OECD ECONOMIC SURVEYS: POLAND © OECD 2016 65
international comparison (Figure 1.3, Panel A). Graduates of basic vocational schools are
more likely to be unemployed than graduates of general secondary schools (Panel B), and
their average wages are lower (Lis and Miazga, 2014).
Tests indicate that Polish basic vocational education often fails to provide students
with necessary skills. Average literacy and numeracy proficiencies of students and
graduates from basic vocational schools are poor, as evidenced by standardised tests for
pupils (PISA) and adults (PIAAC), and too many can understand only short and simple texts
or master only basic numerical operations (Figure 1.4). While this is partly a selection
effect, as the weakest students tend to go to basic vocational education due to its poor
reputation, average test results of graduates from basic vocational schools are only
marginally higher than those of adults who finished only lower secondary education.
Results obtained by students and graduates from technical schools are much better,
though.
The government has moved to address these problems. There was a campaign to
improve the image of vocational education in the 2014/2015 school year. Curricula are now
based on learning outcomes rather than on a narrow description of subject content, giving
schools more autonomy to adapt their programmes, including in collaboration with
employers. Learning outcomes are defined for knowledge, occupational and general skills,
such as reasoning, problem-solving and collaboration. Vocational education programmes
also now include training on setting up a business. Moreover, the 2012 curriculum reform
integrated the general education curriculum for lower and upper secondary schools and
introduced the same curricular requirements for the first year of all types of upper
secondary programmes. This should help weak students in basic vocational schools to
strengthen their basic skills.
But more needs to be done to help weak students make progress. OECD experience
has shown that, in addition to early intervention, individualised support is crucial to help
weak students bring their competencies up to acceptable standards. Given that many weak
students are concentrated in basic vocational schools, one-on-one support and remedial
Figure 1.2. First-year students in upper secondary school by type of educationPer cent
Source: GUS (2014c), Education in the 2013/2014 School Year.1 2 http://dx.doi.org/10.1787/888933339595
0% 10% 20% 30% 40% 50% 60% 70% 80% 90% 100%
2013/14
2012/13
2011/12
2010/11
2009/10
2008/09
2007/08
2000/01
1995/96
General Basic vocational Technical OtherAcademic year
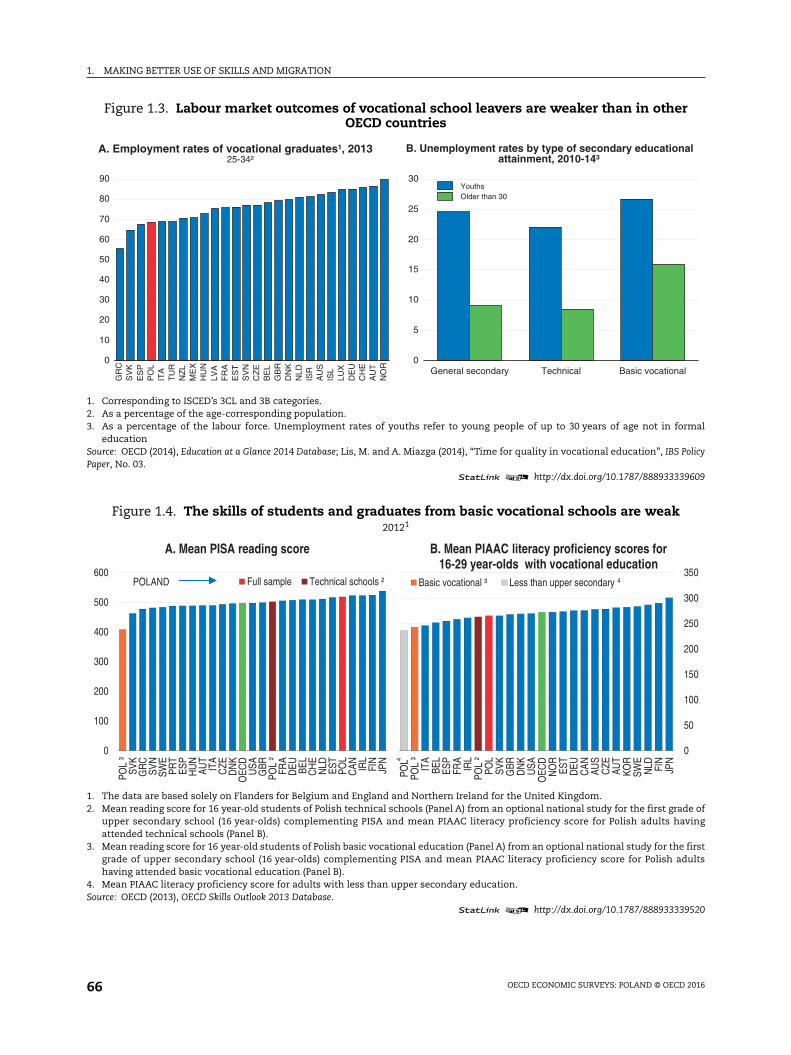
1. MAKING BETTER USE OF SKILLS AND MIGRATION
OECD ECONOMIC SURVEYS: POLAND © OECD 201666
Figure 1.3. Labour market outcomes of vocational school leavers are weaker than in otherOECD countries
1. Corresponding to ISCED’s 3CL and 3B categories.2. As a percentage of the age-corresponding population.3. As a percentage of the labour force. Unemployment rates of youths refer to young people of up to 30 years of age not in formal
educationSource: OECD (2014), Education at a Glance 2014 Database; Lis, M. and A. Miazga (2014), “Time for quality in vocational education”, IBS PolicyPaper, No. 03.
1 2 http://dx.doi.org/10.1787/888933339609
Figure 1.4. The skills of students and graduates from basic vocational schools are weak20121
1. The data are based solely on Flanders for Belgium and England and Northern Ireland for the United Kingdom.2. Mean reading score for 16 year-old students of Polish technical schools (Panel A) from an optional national study for the first grade of
upper secondary school (16 year-olds) complementing PISA and mean PIAAC literacy proficiency score for Polish adults havingattended technical schools (Panel B).
3. Mean reading score for 16 year-old students of Polish basic vocational education (Panel A) from an optional national study for the firstgrade of upper secondary school (16 year-olds) complementing PISA and mean PIAAC literacy proficiency score for Polish adultshaving attended basic vocational education (Panel B).
4. Mean PIAAC literacy proficiency score for adults with less than upper secondary education.Source: OECD (2013), OECD Skills Outlook 2013 Database.
1 2 http://dx.doi.org/10.1787/888933339520
0
10
20
30
40
50
60
70
80
90
GR
CS
VK
ES
PP
OL
ITA
TU
RN
ZL
ME
XH
UN
LVA
FR
AE
ST
SV
NC
ZE
BE
LG
BR
DN
KN
LDIS
RA
US
ISL
LUX
DE
UC
HE
AU
TN
OR
A. Employment rates of vocational graduates¹, 201325-34²
0
5
10
15
20
25
30
General secondary Technical Basic vocational
YouthsOlder than 30
B. Unemployment rates by type of secondary educationalattainment, 2010-14³
0
100
200
300
400
500
600
POL
³SV
KG
RC
SVN
SWE
PRT
ESP
HU
NAU
TIT
AC
ZED
NK
OEC
DU
SAG
BRPO
L ²
FRA
DEU BE
LC
HE
NLD ES
TPO
LC
AN IRL
FIN
JPN
Full sample Technical schools ²
A. Mean PISA reading score
POLAND
0
50
100
150
200
250
300
350
POL
POL
³IT
ABE
LES
PFR
AIR
LPO
L ²
POL
SVK
GBR
DN
KU
SAO
ECD
NO
RES
TD
EUC
AN AUS
CZE
AUT
KOR
SWE
NLD FI
NJP
N
Basic vocational ³ Less than upper secondary
B. Mean PIAAC literacy proficiency scores for 16-29 year-olds with vocational education
4
4
1. MAKING BETTER USE OF SKILLS AND MIGRATION
OECD ECONOMIC SURVEYS: POLAND © OECD 2016 67
classes are needed there for students who fall behind. Most vocational teachers have
advanced university degrees including pedagogical training. In addition, the government
intends to develop the skills of the existing teaching workforce through professional
development. This will include courses, practical work in firms, graduate studies to help
teachers acquire skills in vocational subjects they would like to teach and networks for
teachers to cooperate and share their teaching experiences. Such professional
development in groups has proven highly effective in other OECD countries, such as
Finland and Japan (OECD, 2005; Barber and Mourshed, 2007). To attract those with the best
pedagogical skills to basic vocational schools the authorities should offer them singularly
attractive pay and career opportunities. Cross-country research suggests that while
effective teaching is particularly helpful for low performers, they are often less likely to
receive it (OECD, 2005).
According to a survey conducted in 2010-11, headmasters often planned their courses
based on technical and organisational considerations, such as the availability of technical
facilities or qualified teachers (Goźlińska and Kruszewski, 2013). Only much less frequently
did they consider local labour market needs and other offerings in the region. This was in
part related to a lack of up-to-date information on labour market demand or reliable
forecasts thereof and a failure of local governments to develop strategies for vocational
education (MEN, 2011). As a result, there is often a mismatch between specialisations most
frequently offered by vocational schools and the needs of employers. In transport and
storage, for example, demand exceeds supply (MEN, 2011; Lis and Miazga, 2014). Among
graduates from a number of specialisations in service jobs, such as hairdressers, cooks and
vendors, which are frequently offered in vocational schools and are particularly popular
among women, unemployment was close to 20% in 2010-12 and inactivity around a further
30% (Górniak, 2013).
A large and growing number of Polish employers complain about difficulties in finding
qualified workers who meet their expectations: surveys show 80% of employers made that
claim in 2014, up from 75% in 2010 (Kocór et al., 2015). According to the same study
qualified manual workers were particularly scarce, and employers frequently bemoaned a
lack of professional competencies specific to the job that they were looking to fill. Apart
from more flexible courses in vocational schools with a greater focus on general skills,
allowing workers to adapt more easily to new jobs and circumstances, this would also
require more employer involvement in planning programmes and offering practical
training opportunities.
With the new core curriculum based on learning outcomes, the government has made
it easier for schools to contribute to programme design and is striving to engage employers
in such efforts. This is a welcome change. It has become easier for schools to offer new
vocational programmes after consultations with the district (powiat) and regional
(voivodship) governments to ensure alignment with local labour market needs. The
number of enterprises collaborating with schools to develop curricula and sending external
examiners to participate in vocational exams is growing, according to the Ministry of
Education. Yet, reaching small and medium-sized enterprises, which make up more than
90% of all firms in Poland, remains a challenge. Engaging craft associations will be crucial
to enhance collaboration with these firms.
Employers will need to become more engaged in offering practical training. Otherwise
they cannot expect to find workers with the specific job skills and experience they seek.
1. MAKING BETTER USE OF SKILLS AND MIGRATION
OECD ECONOMIC SURVEYS: POLAND © OECD 201668
Conducting practical training through firm-based work experience rather than in schools
makes it much easier to ensure that the qualifications of vocational students correspond
to labour market needs (OECD, 2014b), as firms will typically be interested in offering
training opportunities in areas where they lack workers. Although about 65 % of students
in basic vocational schools learn in a system including firm-based training, the rest
practice in different forms of workshops that are confined to training purposes.
Enterprises also need to contribute by providing more workplace-training
opportunities for vocational teachers and by allowing their own staff to combine teaching
in schools with work. This has proven crucial to ensuring that teachers have up-to-date
industry knowledge and experience. In Poland practitioners can now become teachers
based on the teacher charter after completing pedagogical training, or they can be
employed through contracts based on the labour code, if headmasters find them fit for
teaching. These measures are welcome, as long as pedagogical training for practitioners
interested in teaching is of high quality (OECD, 2014b; OECD, 2010).
Regardless of efforts to increase the number of workplace-training opportunities for
students, it will still be necessary to offer practical training in workshops for some time.
The effectiveness of training in schools has often been hindered by a lack of modern
equipment. Yet, qualifications offered at technical schools are evolving rapidly and in some
regions, where local authorities have taken the lead to adjust courses to labour market
needs, they have started to equip centres of practical training with modern technologies,
which can be shared by several schools. However, these successful practices would need to
be generalised, as schools tend to compete in other regions, where local authorities do not
coordinate sufficiently, often resulting in several under-equipped workshops, rather than
modern equipment that is shared (OECD, 2016). Enterprises can contribute to these efforts
by helping to equip joint laboratories. Providing vocational schools with state-of-art
technology and modern equipment is also one of the priorities for the European structural
funds intervention planned for 2014-20.
Continuing education
Participation in continuing education is low in Poland, notably for those who need it
most. Adult participation in lifelong learning is one of the lowest in the European Union,
especially among older and low-skilled workers (Figure 1.5). According to 2010 Eurostat
data, only 22 % of all companies provided continuing vocational education and training,
compared to 66 % in the EU-27 (European Commission, 2014). At the same time, low-skilled
workers account for the largest proportion of Poland’s unemployed. A lack of opportunities
for adults to adapt their skills and competencies to new circumstances is a serious issue in
an economy that has had to traverse a radical transition like Poland over the last 25 years.
Older adults are in urgent need to improve their numeracy and literacy competencies.
The share of adults with no computer experience and severe problems in solving digital
tasks is higher than anywhere else in the OECD (Figure 1.6), pointing to the need to
enhance access to digital skills training. At the same time, the government should move
forward with its plans to upgrade the communications infrastructure, as the share of the
population without fixed high-speed Internet access is comparatively high (Chapter 2).
A study of language competences of European teenagers suggests that relatively few
Polish pupils learn English well enough to be qualified as independent users: a bit more
than 25%, compared with more than 80% in Sweden and more than 50% in Estonia,
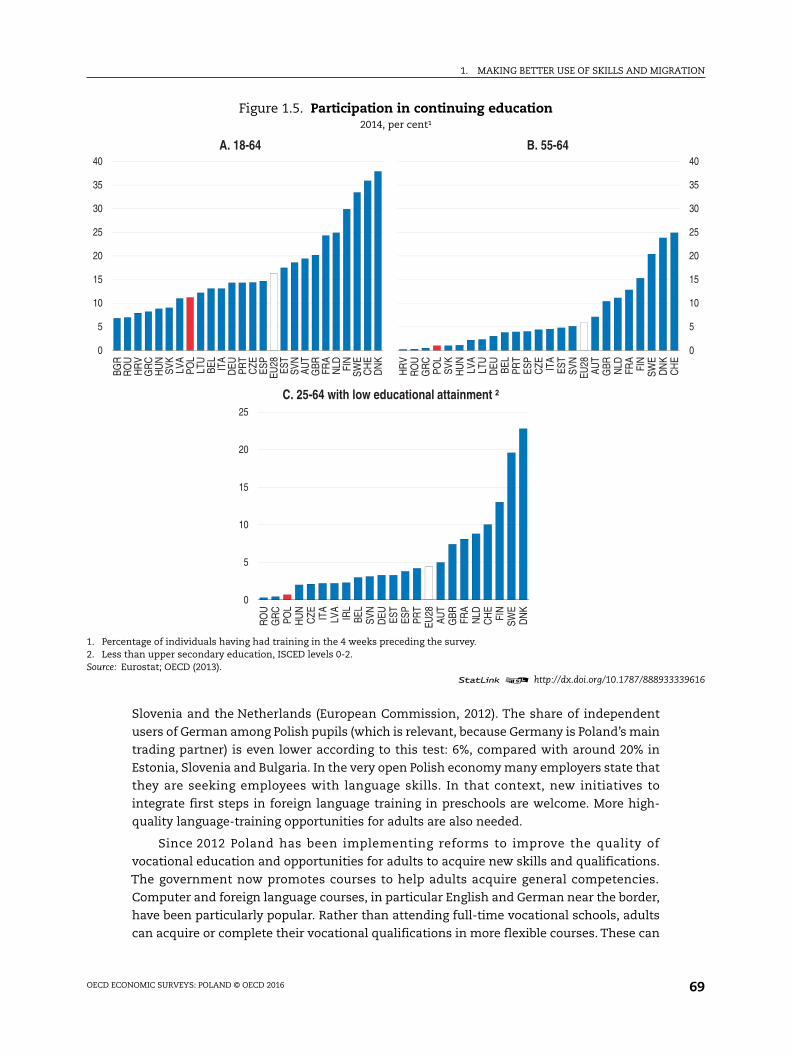
1. MAKING BETTER USE OF SKILLS AND MIGRATION
OECD ECONOMIC SURVEYS: POLAND © OECD 2016 69
Slovenia and the Netherlands (European Commission, 2012). The share of independent
users of German among Polish pupils (which is relevant, because Germany is Poland’s main
trading partner) is even lower according to this test: 6%, compared with around 20% in
Estonia, Slovenia and Bulgaria. In the very open Polish economy many employers state that
they are seeking employees with language skills. In that context, new initiatives to
integrate first steps in foreign language training in preschools are welcome. More high-
quality language-training opportunities for adults are also needed.
Since 2012 Poland has been implementing reforms to improve the quality of
vocational education and opportunities for adults to acquire new skills and qualifications.
The government now promotes courses to help adults acquire general competencies.
Computer and foreign language courses, in particular English and German near the border,
have been particularly popular. Rather than attending full-time vocational schools, adults
can acquire or complete their vocational qualifications in more flexible courses. These can
Figure 1.5. Participation in continuing education2014, per cent¹
1. Percentage of individuals having had training in the 4 weeks preceding the survey.2. Less than upper secondary education, ISCED levels 0-2.Source: Eurostat; OECD (2013).
1 2 http://dx.doi.org/10.1787/888933339616
0
5
10
15
20
25
30
35
40
BGR
RO
UH
RV
GR
CH
UN
SVK
LVA
POL
LTU
BEL
ITA
DEU PR
TC
ZEES
PEU
28ES
TSV
NAU
TG
BR FRA
NLD FI
NSW
EC
HE
DN
K
A. 18-64
0
5
10
15
20
25
30
35
40
HR
VR
OU
GR
CPO
LSV
KH
UN
LVA
LTU
DEU BE
LPR
TES
PC
ZE ITA
EST
SVN
EU28
AUT
GBR NLD
FRA
FIN
SWE
DN
KC
HE
B. 55-64
0
5
10
15
20
25
RO
UG
RC
POL
HU
NC
ZE ITA
LVA
IRL
BEL
SVN
DEU ES
TES
PPR
TEU
28AU
TG
BR FRA
NLD
CH
EFI
NSW
ED
NK
C. 25-64 with low educational attainment ²
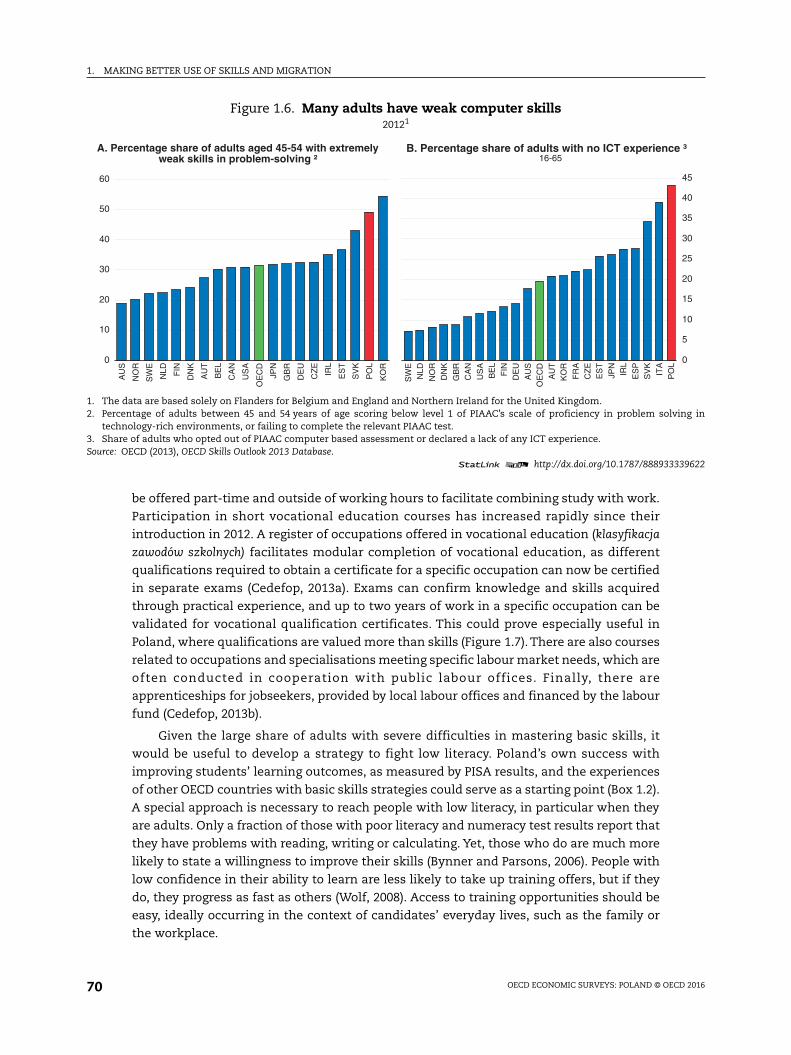
1. MAKING BETTER USE OF SKILLS AND MIGRATION
OECD ECONOMIC SURVEYS: POLAND © OECD 201670
be offered part-time and outside of working hours to facilitate combining study with work.
Participation in short vocational education courses has increased rapidly since their
introduction in 2012. A register of occupations offered in vocational education (klasyfikacja
zawodów szkolnych) facilitates modular completion of vocational education, as different
qualifications required to obtain a certificate for a specific occupation can now be certified
in separate exams (Cedefop, 2013a). Exams can confirm knowledge and skills acquired
through practical experience, and up to two years of work in a specific occupation can be
validated for vocational qualification certificates. This could prove especially useful in
Poland, where qualifications are valued more than skills (Figure 1.7). There are also courses
related to occupations and specialisations meeting specific labour market needs, which are
often conducted in cooperation with public labour offices. Finally, there are
apprenticeships for jobseekers, provided by local labour offices and financed by the labour
fund (Cedefop, 2013b).
Given the large share of adults with severe difficulties in mastering basic skills, it
would be useful to develop a strategy to fight low literacy. Poland’s own success with
improving students’ learning outcomes, as measured by PISA results, and the experiences
of other OECD countries with basic skills strategies could serve as a starting point (Box 1.2).
A special approach is necessary to reach people with low literacy, in particular when they
are adults. Only a fraction of those with poor literacy and numeracy test results report that
they have problems with reading, writing or calculating. Yet, those who do are much more
likely to state a willingness to improve their skills (Bynner and Parsons, 2006). People with
low confidence in their ability to learn are less likely to take up training offers, but if they
do, they progress as fast as others (Wolf, 2008). Access to training opportunities should be
easy, ideally occurring in the context of candidates’ everyday lives, such as the family or
the workplace.
Figure 1.6. Many adults have weak computer skills20121
1. The data are based solely on Flanders for Belgium and England and Northern Ireland for the United Kingdom.2. Percentage of adults between 45 and 54 years of age scoring below level 1 of PIAAC’s scale of proficiency in problem solving in
technology-rich environments, or failing to complete the relevant PIAAC test.3. Share of adults who opted out of PIAAC computer based assessment or declared a lack of any ICT experience.Source: OECD (2013), OECD Skills Outlook 2013 Database.
1 2 http://dx.doi.org/10.1787/888933339622
0
10
20
30
40
50
60
AU
S
NO
R
SW
E
NLD FIN
DN
K
AU
T
BE
L
CA
N
US
A
OE
CD
JPN
GB
R
DE
U
CZ
E
IRL
ES
T
SV
K
PO
L
KO
R
A. Percentage share of adults aged 45-54 with extremelyweak skills in problem-solving ²
0
5
10
15
20
25
30
35
40
45
SW
EN
LD
NO
RD
NK
GB
RC
AN
US
AB
EL
FIN
DE
U
AU
SO
EC
D
AU
TK
OR
FR
AC
ZE
ES
T
JPN
IRL
ES
PS
VK
ITA
PO
L
B. Percentage share of adults with no ICT experience ³16-65
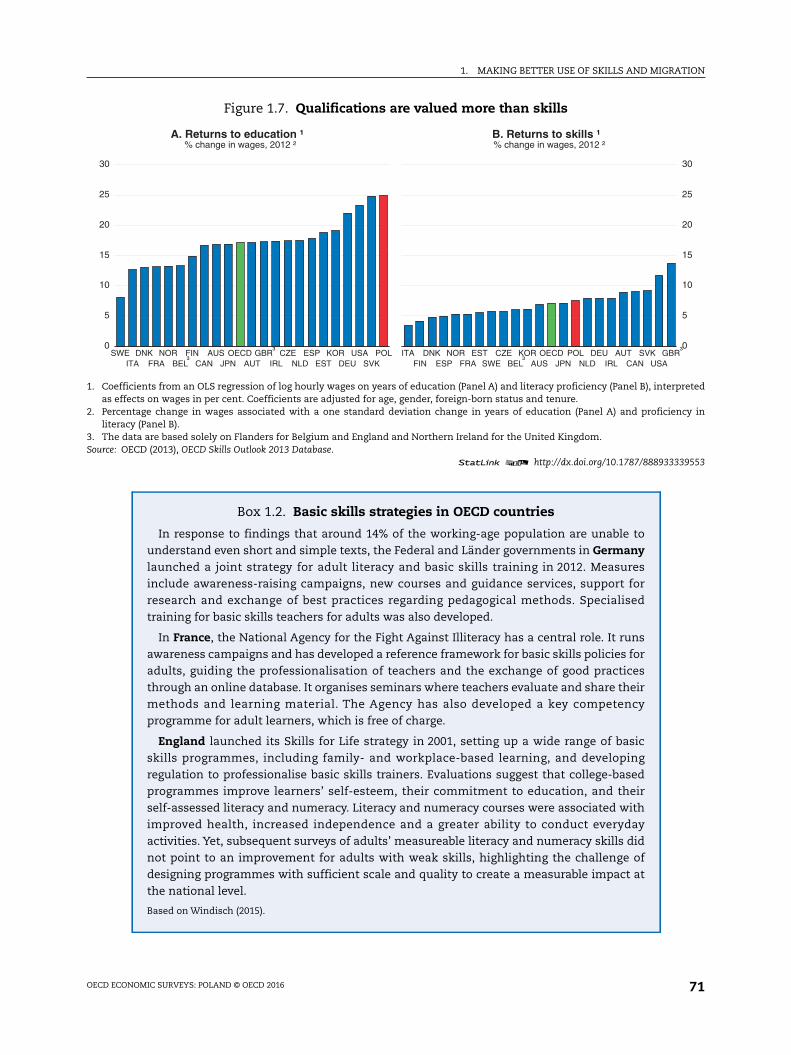
1. MAKING BETTER USE OF SKILLS AND MIGRATION
OECD ECONOMIC SURVEYS: POLAND © OECD 2016 71
Figure 1.7. Qualifications are valued more than skills
1. Coefficients from an OLS regression of log hourly wages on years of education (Panel A) and literacy proficiency (Panel B), interpretedas effects on wages in per cent. Coefficients are adjusted for age, gender, foreign-born status and tenure.
2. Percentage change in wages associated with a one standard deviation change in years of education (Panel A) and proficiency inliteracy (Panel B).
3. The data are based solely on Flanders for Belgium and England and Northern Ireland for the United Kingdom.Source: OECD (2013), OECD Skills Outlook 2013 Database.
1 2 http://dx.doi.org/10.1787/888933339553
0
5
10
15
20
25
30
SWEITA
DNKFRA
NORBEL
FINCAN
AUSJPN
OECDAUT
GBRIRL
CZENLD
ESPEST
KORDEU
USASVK
POL³
³
A. Returns to education ¹% change in wages, 2012 ²
0
5
10
15
20
25
30
ITAFIN
DNKESP
NORFRA
ESTSWE
CZEBEL
KORAUS
OECDJPN
POLNLD
DEUIRL
AUTCAN
SVKUSA
GBR³
³
B. Returns to skills ¹% change in wages, 2012 ²
Box 1.2. Basic skills strategies in OECD countries
In response to findings that around 14% of the working-age population are unable tounderstand even short and simple texts, the Federal and Länder governments in Germanylaunched a joint strategy for adult literacy and basic skills training in 2012. Measuresinclude awareness-raising campaigns, new courses and guidance services, support forresearch and exchange of best practices regarding pedagogical methods. Specialisedtraining for basic skills teachers for adults was also developed.
In France, the National Agency for the Fight Against Illiteracy has a central role. It runsawareness campaigns and has developed a reference framework for basic skills policies foradults, guiding the professionalisation of teachers and the exchange of good practicesthrough an online database. It organises seminars where teachers evaluate and share theirmethods and learning material. The Agency has also developed a key competencyprogramme for adult learners, which is free of charge.
England launched its Skills for Life strategy in 2001, setting up a wide range of basicskills programmes, including family- and workplace-based learning, and developingregulation to professionalise basic skills trainers. Evaluations suggest that college-basedprogrammes improve learners’ self-esteem, their commitment to education, and theirself-assessed literacy and numeracy. Literacy and numeracy courses were associated withimproved health, increased independence and a greater ability to conduct everydayactivities. Yet, subsequent surveys of adults’ measureable literacy and numeracy skills didnot point to an improvement for adults with weak skills, highlighting the challenge ofdesigning programmes with sufficient scale and quality to create a measurable impact atthe national level.
Based on Windisch (2015).
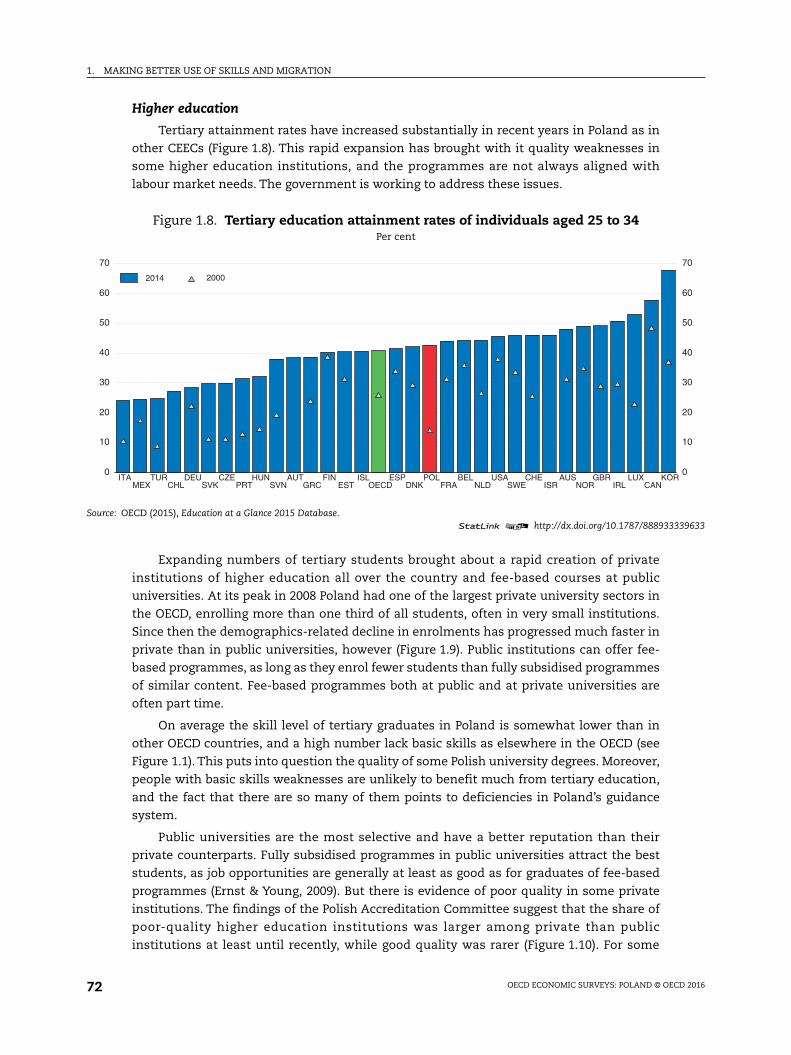
1. MAKING BETTER USE OF SKILLS AND MIGRATION
OECD ECONOMIC SURVEYS: POLAND © OECD 201672
Higher education
Tertiary attainment rates have increased substantially in recent years in Poland as in
other CEECs (Figure 1.8). This rapid expansion has brought with it quality weaknesses in
some higher education institutions, and the programmes are not always aligned with
labour market needs. The government is working to address these issues.
Expanding numbers of tertiary students brought about a rapid creation of private
institutions of higher education all over the country and fee-based courses at public
universities. At its peak in 2008 Poland had one of the largest private university sectors in
the OECD, enrolling more than one third of all students, often in very small institutions.
Since then the demographics-related decline in enrolments has progressed much faster in
private than in public universities, however (Figure 1.9). Public institutions can offer fee-
based programmes, as long as they enrol fewer students than fully subsidised programmes
of similar content. Fee-based programmes both at public and at private universities are
often part time.
On average the skill level of tertiary graduates in Poland is somewhat lower than in
other OECD countries, and a high number lack basic skills as elsewhere in the OECD (see
Figure 1.1). This puts into question the quality of some Polish university degrees. Moreover,
people with basic skills weaknesses are unlikely to benefit much from tertiary education,
and the fact that there are so many of them points to deficiencies in Poland’s guidance
system.
Public universities are the most selective and have a better reputation than their
private counterparts. Fully subsidised programmes in public universities attract the best
students, as job opportunities are generally at least as good as for graduates of fee-based
programmes (Ernst & Young, 2009). But there is evidence of poor quality in some private
institutions. The findings of the Polish Accreditation Committee suggest that the share of
poor-quality higher education institutions was larger among private than public
institutions at least until recently, while good quality was rarer (Figure 1.10). For some
Figure 1.8. Tertiary education attainment rates of individuals aged 25 to 34Per cent
Source: OECD (2015), Education at a Glance 2015 Database.1 2 http://dx.doi.org/10.1787/888933339633
0
10
20
30
40
50
60
70
0
10
20
30
40
50
60
70
ITAMEX
TURCHL
DEUSVK
CZEPRT
HUNSVN
AUTGRC
FINEST
ISLOECD
ESPDNK
POLFRA
BELNLD
USASWE
CHEISR
AUSNOR
GBRIRL
LUXCAN
KOR
20002014
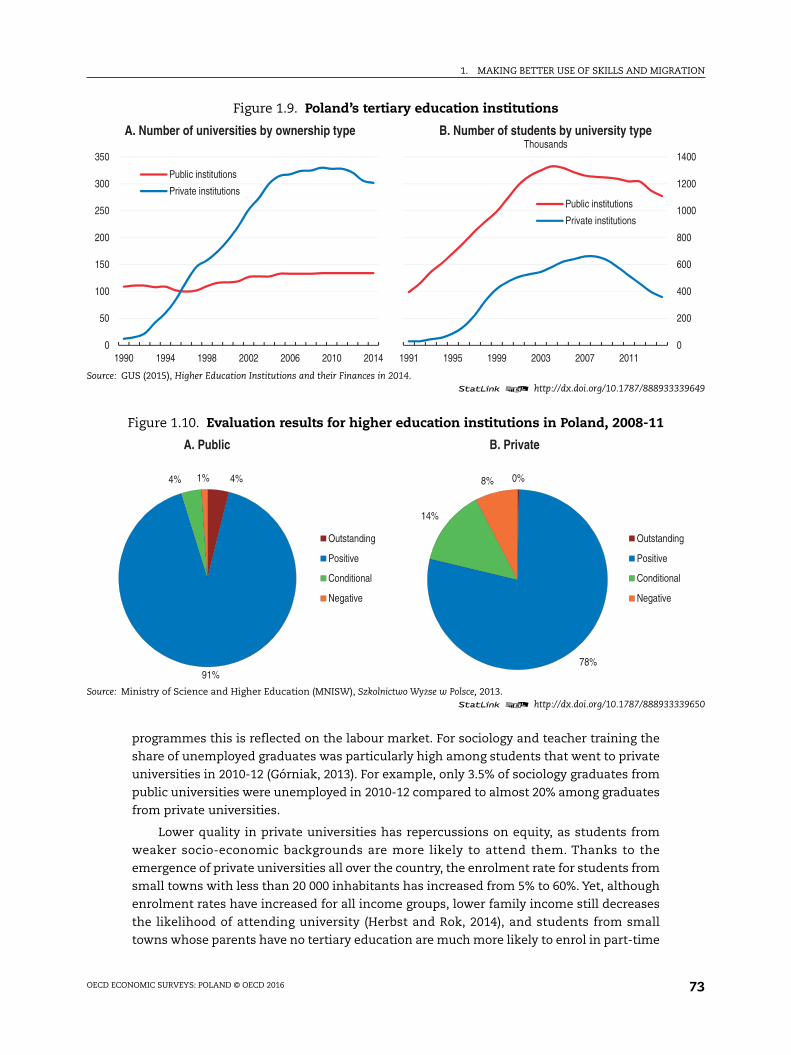
1. MAKING BETTER USE OF SKILLS AND MIGRATION
OECD ECONOMIC SURVEYS: POLAND © OECD 2016 73
programmes this is reflected on the labour market. For sociology and teacher training the
share of unemployed graduates was particularly high among students that went to private
universities in 2010-12 (Górniak, 2013). For example, only 3.5% of sociology graduates from
public universities were unemployed in 2010-12 compared to almost 20% among graduates
from private universities.
Lower quality in private universities has repercussions on equity, as students from
weaker socio-economic backgrounds are more likely to attend them. Thanks to the
emergence of private universities all over the country, the enrolment rate for students from
small towns with less than 20 000 inhabitants has increased from 5% to 60%. Yet, although
enrolment rates have increased for all income groups, lower family income still decreases
the likelihood of attending university (Herbst and Rok, 2014), and students from small
towns whose parents have no tertiary education are much more likely to enrol in part-time
Figure 1.9. Poland’s tertiary education institutions
Source: GUS (2015), Higher Education Institutions and their Finances in 2014.1 2 http://dx.doi.org/10.1787/888933339649
Figure 1.10. Evaluation results for higher education institutions in Poland, 2008-11
Source: Ministry of Science and Higher Education (MNISW), Szkolnictwo Wyżse w Polsce, 2013.1 2 http://dx.doi.org/10.1787/888933339650
0
50
100
150
200
250
300
350
1990 1994 1998 2002 2006 2010 2014
Public institutions
Private institutions
A. Number of universities by ownership type
0
200
400
600
800
1000
1200
1400
1991 1995 1999 2003 2007 2011
Public institutions
Private institutions
B. Number of students by university typeThousands
4%
91%
4% 1%
A. Public
Outstanding
Positive
Conditional
Negative
0%
78%
14%
8%
B. Private
Outstanding
Positive
Conditional
Negative

1. MAKING BETTER USE OF SKILLS AND MIGRATION
OECD ECONOMIC SURVEYS: POLAND © OECD 201674
fee-based programmes (Lewandowski and Magda, 2014). This means that students from
weaker socio-economic backgrounds are more likely to have to pay fees for tertiary
education that will often be of lower quality than at public universities. Owing to
demographic trends it has become easier to be admitted to public university programmes
that are not subject to fees, though. In any case, making sure that children from poor
families attend high-quality early childhood education as discussed above will improve
their chances to attend the best universities later on.
A recent law significantly strengthened higher education accreditation and quality
control procedures. All higher education institutions now have to be accredited based on
the adequacy of their staffing and the quality of their programmes. Several institutions
that were unable to meet standards within the time they were given to improve were
closed down. These important efforts should continue.
Another crucial factor to ensure high quality is attracting good teachers. The
government has made important efforts to increase academics’ wages in recent years.
Many had been forced to combine teaching at several higher education institutions before
the practice was banned. The new government now plans to align pay and career prospects
with performance in teaching and research, a welcome initiative.
Boosting Polish universities’ international co-operation would also help to improve the
relevance and quality of tertiary education and research. The number of English-language
university programmes has increased, and several institutions have used the opportunity
to develop more joint-degree programmes with foreign partners. This will also help to
strengthen graduates’ language skills. Exchanges of views and experiences with other
universities can also help make programmes more germane to modern labour markets.
Moreover, there is evidence that researchers who collaborate with foreign colleagues are
much more productive in terms of research output (Kwiek, 2015; Appelt et al., 2015).
Although this might well reflect the fact that better researchers are more likely to
collaborate internationally, establishing closer ties to foreign universities would enrich
university education in Poland.
A large share of employers looking for managers and specialists complain about a lack
of competences that are specific to the profession, a lack of experience and – to a lesser
extent – self-organisation (Kocór et al., 2015). The government has embarked on reforms to
address these complaints. Following a higher education reform in 2011, universities now
have more freedom to design their study programmes, including in co-operation with
business. As in secondary education, curricula are now based on learning outcomes
described in the National Qualifications Framework for higher education, rather than on
broad guidelines defined by the Ministry of Science and Higher Education. This gives
higher education institutions more autonomy. Departments that have the accreditation to
confer “habilitation” degrees, which allow holders to teach at university, can now create
programmes without ministerial agreement, as long as they lead to outcomes defined by
the Framework. Departments without an accreditation to confer doctoral degrees must
give their programmes a practical orientation, which includes mandatory traineeships in
firms or in public administration. Practitioners can be involved in programme design.
Improving skill matchesAlthough qualification mismatches are overall not very extensive in international
comparison according to OECD data, they still concern a substantial share of the
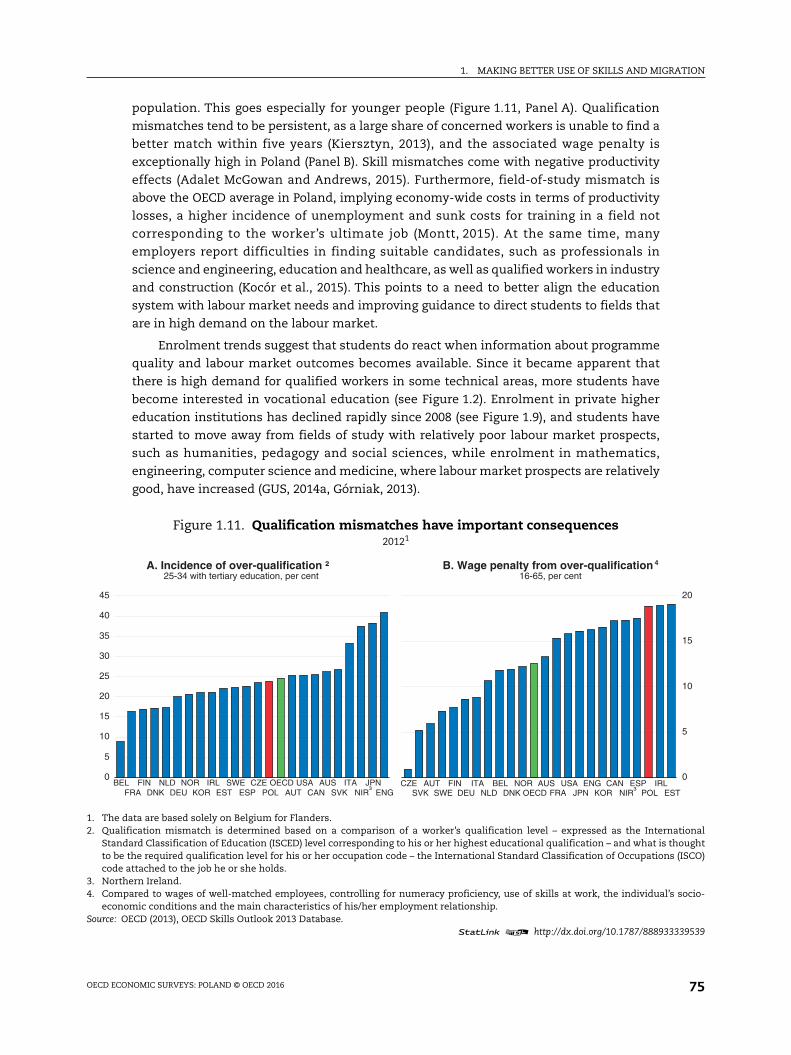
1. MAKING BETTER USE OF SKILLS AND MIGRATION
OECD ECONOMIC SURVEYS: POLAND © OECD 2016 75
population. This goes especially for younger people (Figure 1.11, Panel A). Qualification
mismatches tend to be persistent, as a large share of concerned workers is unable to find a
better match within five years (Kiersztyn, 2013), and the associated wage penalty is
exceptionally high in Poland (Panel B). Skill mismatches come with negative productivity
effects (Adalet McGowan and Andrews, 2015). Furthermore, field-of-study mismatch is
above the OECD average in Poland, implying economy-wide costs in terms of productivity
losses, a higher incidence of unemployment and sunk costs for training in a field not
corresponding to the worker’s ultimate job (Montt, 2015). At the same time, many
employers report difficulties in finding suitable candidates, such as professionals in
science and engineering, education and healthcare, as well as qualified workers in industry
and construction (Kocór et al., 2015). This points to a need to better align the education
system with labour market needs and improving guidance to direct students to fields that
are in high demand on the labour market.
Enrolment trends suggest that students do react when information about programme
quality and labour market outcomes becomes available. Since it became apparent that
there is high demand for qualified workers in some technical areas, more students have
become interested in vocational education (see Figure 1.2). Enrolment in private higher
education institutions has declined rapidly since 2008 (see Figure 1.9), and students have
started to move away from fields of study with relatively poor labour market prospects,
such as humanities, pedagogy and social sciences, while enrolment in mathematics,
engineering, computer science and medicine, where labour market prospects are relatively
good, have increased (GUS, 2014a, Górniak, 2013).
Figure 1.11. Qualification mismatches have important consequences20121
1. The data are based solely on Belgium for Flanders.2. Qualification mismatch is determined based on a comparison of a worker’s qualification level – expressed as the International
Standard Classification of Education (ISCED) level corresponding to his or her highest educational qualification – and what is thoughtto be the required qualification level for his or her occupation code – the International Standard Classification of Occupations (ISCO)code attached to the job he or she holds.
3. Northern Ireland.4. Compared to wages of well-matched employees, controlling for numeracy proficiency, use of skills at work, the individual’s socio-
economic conditions and the main characteristics of his/her employment relationship.Source: OECD (2013), OECD Skills Outlook 2013 Database.
1 2 http://dx.doi.org/10.1787/888933339539
0
5
10
15
20
25
30
35
40
45
BELFRA
FINDNK
NLDDEU
NORKOR
IRLEST
SWEESP
CZEPOL
OECDAUT
USACAN
AUSSVK
ITANIR
JPNENG³
A. Incidence of over-qualification ²25-34 with tertiary education, per cent
0
5
10
15
20
CZESVK
AUTSWE
FINDEU
ITANLD
BELDNK
NOROECD
AUSFRA
USAJPN
ENGKOR
CANNIR
ESPPOL
IRLEST
4
³
B. Wage penalty from over-qualification16-65, per cent

1. MAKING BETTER USE OF SKILLS AND MIGRATION
OECD ECONOMIC SURVEYS: POLAND © OECD 201676
There are a host of measures in place to monitor and project labour market needs; the
main challenge is to ensure that schools and students integrate the results in their
decision-making. Since 2009 there has been an ongoing national-level study on the supply
and demand for different skills and qualifications on the Polish labour market called the
Human Capital Report. This work is set to be linked to sectoral skills councils, composed of
officials from social partner organisations, professional associations and the government,
which would recommend areas of research and reforms to adjust education to labour
market opportunit ies . The government offers an onl ine forecast ing tool
(www.prognozowaniezatrudnienia.pl) that projects trends in employment and qualification
needs. Regional labour market observatories also conduct labour market research. This
information needs to be well presented and easily accessible, so that schools and
universities can use it to develop their programmes and counselling services to advise
students in their educational and career choices.
The government is currently setting up a monitoring system to track tertiary
graduates’ careers. Universities have been obliged to track students’ careers since 2011, but
this has suffered from a lack of a standardised methodology and thus comparability across
universities. A new system, Pol-on, will now link information from universities with social
security data to track graduates’ careers. This could help orient students’ choices and
programme development. A similar system is planned for vocational graduates.
Despite a legal obligation to provide secondary students with guidance, establishing
high-quality orientation services remains a challenge both in schools and universities.
Survey data suggest that many vocational students are unaware of career counselling
availability at their schools, and only every fifth student seeks career advice, most
frequently from parents and other family members (MEN, 2011). Similarly, a survey at
Częstochowa University of Technology revealed that three-quarters of students were
unaware of the existence of the careers office, and only a fraction of those who knew about
it sought its advice (Sroka, 2014). According to the Ministry of Science and Higher
Education, about three-quarters of higher education institutions operate a careers office.
However, it is up to the university to decide on their resourcing, and many are small
relative to the student population they are meant to serve (OECD, 2013b).
The government is taking action to improve guidance services in universities and
schools, and these efforts should continue. Centres of Information and Career Planning at
regional labour offices now have to cooperate with the academic careers offices at
universities, providing them for example with information on professions that are in high
demand in the region. To ensure their effectiveness academic careers centres will need to
be adequately staffed. The government envisages investing money from the European
Social Fund in strengthening careers offices. The National Centre for Supporting
Vocational and Continuing Education (KOWEZiU) has initiated training for 18 000
counsellors from lower secondary schools to provide orientation services. This will
continue in coming years, supported by EU financing. To inform students in their choice of
vocational schools the Ministry of Education has launched an interactive Internet tool
called “Map of vocational schools”, with information on education and training options.
Promoting a better use of skills through labour market policiesPoland has the European Union’s largest share of workers with temporary contracts
(Figure 1.12, Panel A); such contracts are especially prevalent among the young and the low
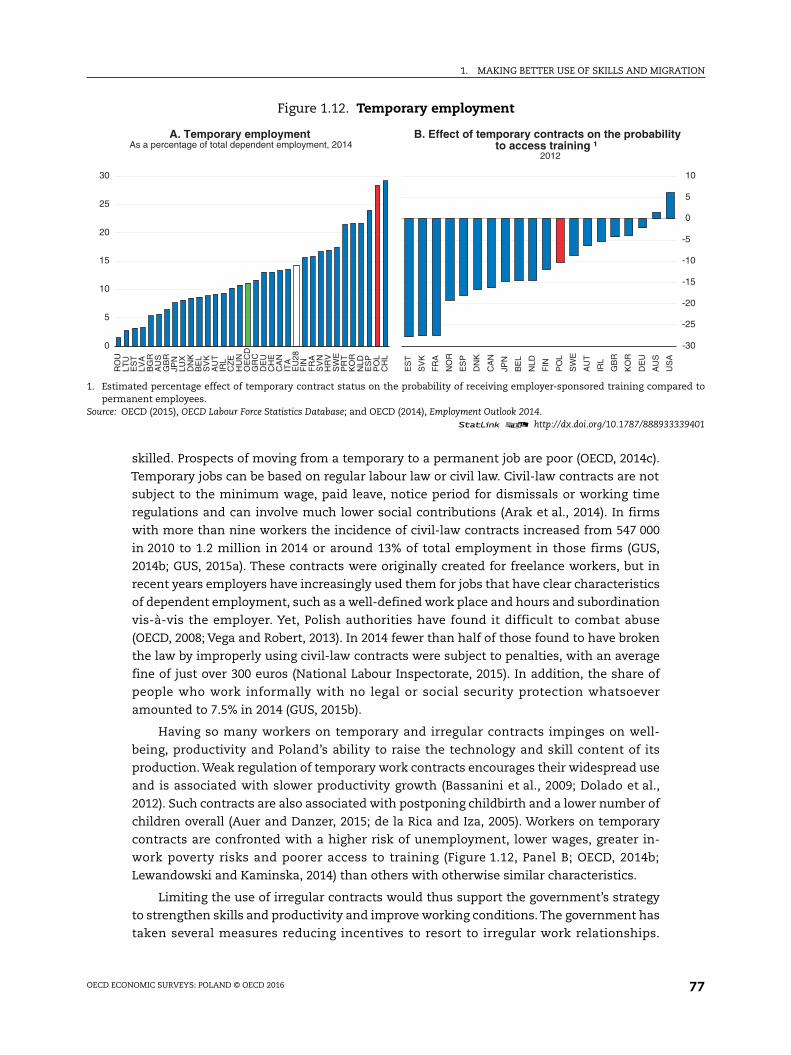
1. MAKING BETTER USE OF SKILLS AND MIGRATION
OECD ECONOMIC SURVEYS: POLAND © OECD 2016 77
skilled. Prospects of moving from a temporary to a permanent job are poor (OECD, 2014c).
Temporary jobs can be based on regular labour law or civil law. Civil-law contracts are not
subject to the minimum wage, paid leave, notice period for dismissals or working time
regulations and can involve much lower social contributions (Arak et al., 2014). In firms
with more than nine workers the incidence of civil-law contracts increased from 547 000
in 2010 to 1.2 million in 2014 or around 13% of total employment in those firms (GUS,
2014b; GUS, 2015a). These contracts were originally created for freelance workers, but in
recent years employers have increasingly used them for jobs that have clear characteristics
of dependent employment, such as a well-defined work place and hours and subordination
vis-à-vis the employer. Yet, Polish authorities have found it difficult to combat abuse
(OECD, 2008; Vega and Robert, 2013). In 2014 fewer than half of those found to have broken
the law by improperly using civil-law contracts were subject to penalties, with an average
fine of just over 300 euros (National Labour Inspectorate, 2015). In addition, the share of
people who work informally with no legal or social security protection whatsoever
amounted to 7.5% in 2014 (GUS, 2015b).
Having so many workers on temporary and irregular contracts impinges on well-
being, productivity and Poland’s ability to raise the technology and skill content of its
production. Weak regulation of temporary work contracts encourages their widespread use
and is associated with slower productivity growth (Bassanini et al., 2009; Dolado et al.,
2012). Such contracts are also associated with postponing childbirth and a lower number of
children overall (Auer and Danzer, 2015; de la Rica and Iza, 2005). Workers on temporary
contracts are confronted with a higher risk of unemployment, lower wages, greater in-
work poverty risks and poorer access to training (Figure 1.12, Panel B; OECD, 2014b;
Lewandowski and Kaminska, 2014) than others with otherwise similar characteristics.
Limiting the use of irregular contracts would thus support the government’s strategy
to strengthen skills and productivity and improve working conditions. The government has
taken several measures reducing incentives to resort to irregular work relationships.
Figure 1.12. Temporary employment
1. Estimated percentage effect of temporary contract status on the probability of receiving employer-sponsored training compared topermanent employees.
Source: OECD (2015), OECD Labour Force Statistics Database; and OECD (2014), Employment Outlook 2014.1 2 http://dx.doi.org/10.1787/888933339401
0
5
10
15
20
25
30
RO
ULT
UE
ST
LVA
BG
RA
US
GB
RJP
NLU
XD
NK
BE
LS
VK
AU
TIR
LC
ZE
HU
NO
EC
DG
RC
DE
UC
HE
CA
NIT
AE
U28
FIN
FR
AS
VN
HR
VS
WE
PR
TK
OR
NLD
ES
PP
OL
CH
L
A. Temporary employmentAs a percentage of total dependent employment, 2014
-30
-25
-20
-15
-10
-5
0
5
10
ES
T
SV
K
FR
A
NO
R
ES
P
DN
K
CA
N
JPN
BE
L
NLD
FIN
PO
L
SW
E
AU
T
IRL
GB
R
KO
R
DE
U
AU
S
US
A
B. Effect of temporary contracts on the probabilityto access training ¹
2012
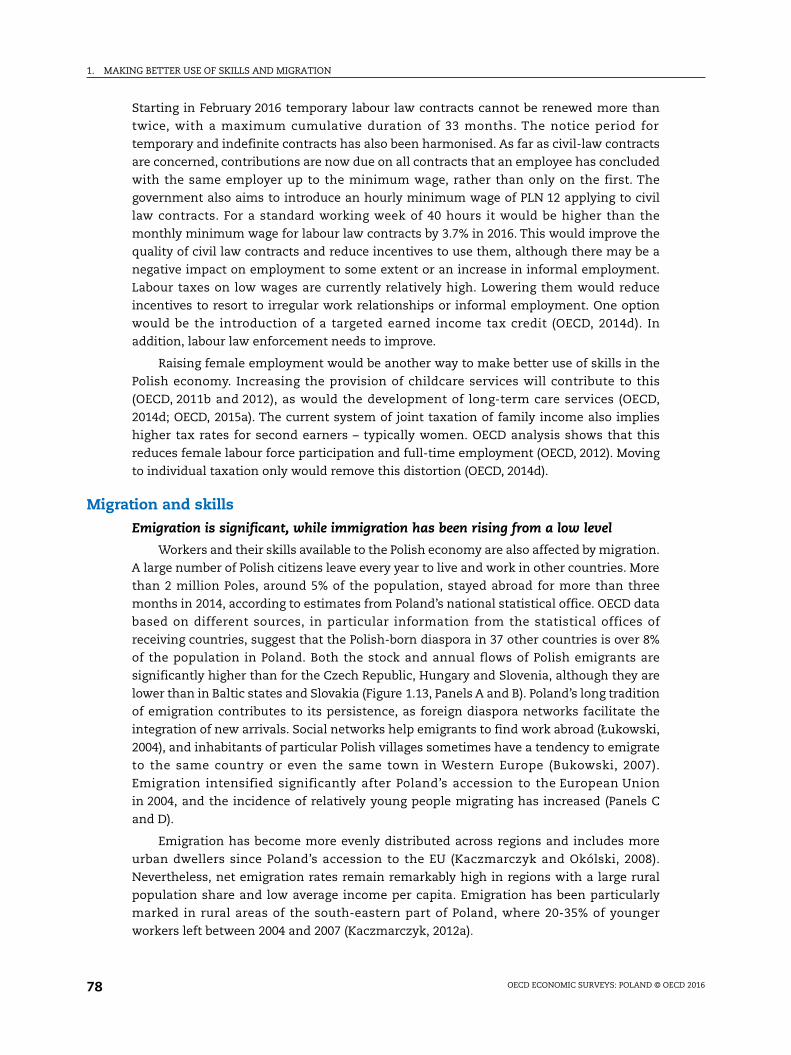
1. MAKING BETTER USE OF SKILLS AND MIGRATION
OECD ECONOMIC SURVEYS: POLAND © OECD 201678
Starting in February 2016 temporary labour law contracts cannot be renewed more than
twice, with a maximum cumulative duration of 33 months. The notice period for
temporary and indefinite contracts has also been harmonised. As far as civil-law contracts
are concerned, contributions are now due on all contracts that an employee has concluded
with the same employer up to the minimum wage, rather than only on the first. The
government also aims to introduce an hourly minimum wage of PLN 12 applying to civil
law contracts. For a standard working week of 40 hours it would be higher than the
monthly minimum wage for labour law contracts by 3.7% in 2016. This would improve the
quality of civil law contracts and reduce incentives to use them, although there may be a
negative impact on employment to some extent or an increase in informal employment.
Labour taxes on low wages are currently relatively high. Lowering them would reduce
incentives to resort to irregular work relationships or informal employment. One option
would be the introduction of a targeted earned income tax credit (OECD, 2014d). In
addition, labour law enforcement needs to improve.
Raising female employment would be another way to make better use of skills in the
Polish economy. Increasing the provision of childcare services will contribute to this
(OECD, 2011b and 2012), as would the development of long-term care services (OECD,
2014d; OECD, 2015a). The current system of joint taxation of family income also implies
higher tax rates for second earners – typically women. OECD analysis shows that this
reduces female labour force participation and full-time employment (OECD, 2012). Moving
to individual taxation only would remove this distortion (OECD, 2014d).
Migration and skills
Emigration is significant, while immigration has been rising from a low level
Workers and their skills available to the Polish economy are also affected by migration.
A large number of Polish citizens leave every year to live and work in other countries. More
than 2 million Poles, around 5% of the population, stayed abroad for more than three
months in 2014, according to estimates from Poland’s national statistical office. OECD data
based on different sources, in particular information from the statistical offices of
receiving countries, suggest that the Polish-born diaspora in 37 other countries is over 8%
of the population in Poland. Both the stock and annual flows of Polish emigrants are
significantly higher than for the Czech Republic, Hungary and Slovenia, although they are
lower than in Baltic states and Slovakia (Figure 1.13, Panels A and B). Poland’s long tradition
of emigration contributes to its persistence, as foreign diaspora networks facilitate the
integration of new arrivals. Social networks help emigrants to find work abroad (Łukowski,
2004), and inhabitants of particular Polish villages sometimes have a tendency to emigrate
to the same country or even the same town in Western Europe (Bukowski, 2007).
Emigration intensified significantly after Poland’s accession to the European Union
in 2004, and the incidence of relatively young people migrating has increased (Panels C
and D).
Emigration has become more evenly distributed across regions and includes more
urban dwellers since Poland’s accession to the EU (Kaczmarczyk and Okólski, 2008).
Nevertheless, net emigration rates remain remarkably high in regions with a large rural
population share and low average income per capita. Emigration has been particularly
marked in rural areas of the south-eastern part of Poland, where 20-35% of younger
workers left between 2004 and 2007 (Kaczmarczyk, 2012a).
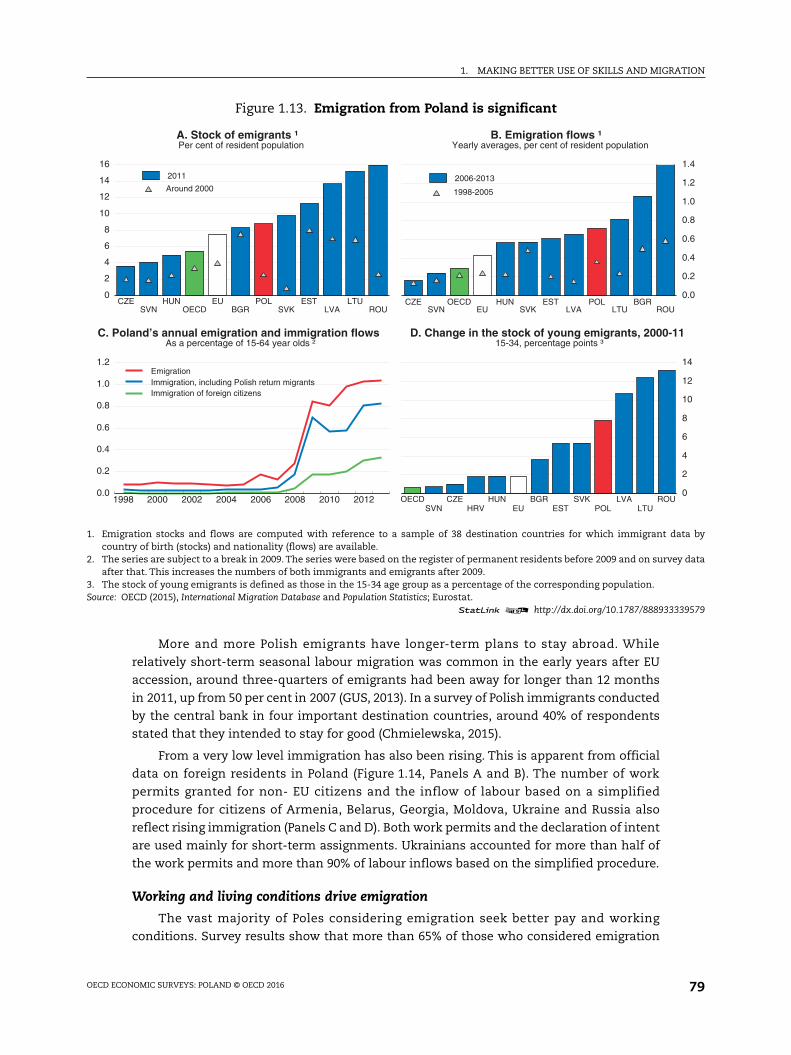
1. MAKING BETTER USE OF SKILLS AND MIGRATION
OECD ECONOMIC SURVEYS: POLAND © OECD 2016 79
More and more Polish emigrants have longer-term plans to stay abroad. While
relatively short-term seasonal labour migration was common in the early years after EU
accession, around three-quarters of emigrants had been away for longer than 12 months
in 2011, up from 50 per cent in 2007 (GUS, 2013). In a survey of Polish immigrants conducted
by the central bank in four important destination countries, around 40% of respondents
stated that they intended to stay for good (Chmielewska, 2015).
From a very low level immigration has also been rising. This is apparent from official
data on foreign residents in Poland (Figure 1.14, Panels A and B). The number of work
permits granted for non- EU citizens and the inflow of labour based on a simplified
procedure for citizens of Armenia, Belarus, Georgia, Moldova, Ukraine and Russia also
reflect rising immigration (Panels C and D). Both work permits and the declaration of intent
are used mainly for short-term assignments. Ukrainians accounted for more than half of
the work permits and more than 90% of labour inflows based on the simplified procedure.
Working and living conditions drive emigration
The vast majority of Poles considering emigration seek better pay and working
conditions. Survey results show that more than 65% of those who considered emigration
Figure 1.13. Emigration from Poland is significant
1. Emigration stocks and flows are computed with reference to a sample of 38 destination countries for which immigrant data bycountry of birth (stocks) and nationality (flows) are available.
2. The series are subject to a break in 2009. The series were based on the register of permanent residents before 2009 and on survey dataafter that. This increases the numbers of both immigrants and emigrants after 2009.
3. The stock of young emigrants is defined as those in the 15-34 age group as a percentage of the corresponding population.Source: OECD (2015), International Migration Database and Population Statistics; Eurostat.
1 2 http://dx.doi.org/10.1787/888933339579
0
2
4
6
8
10
12
14
16
CZESVN
HUNOECD
EUBGR
POLSVK
ESTLVA
LTUROU
Around 2000
2011
A. Stock of emigrants ¹Per cent of resident population
0.0
0.2
0.4
0.6
0.8
1.0
1.2
1.4
CZESVN
OECDEU
HUNSVK
ESTLVA
POLLTU
BGRROU
1998-2005
2006-2013
B. Emigration flows ¹Yearly averages, per cent of resident population
1998 2000 2002 2004 2006 2008 2010 20120.0
0.2
0.4
0.6
0.8
1.0
1.2 EmigrationImmigration, including Polish return migrantsImmigration of foreign citizens
C. Poland’s annual emigration and immigration flowsAs a percentage of 15-64 year olds ²
0
2
4
6
8
10
12
14
OECDSVN
CZEHRV
HUNEU
BGREST
SVKPOL
LVALTU
ROU
D. Change in the stock of young emigrants, 2000-1115-34, percentage points ³
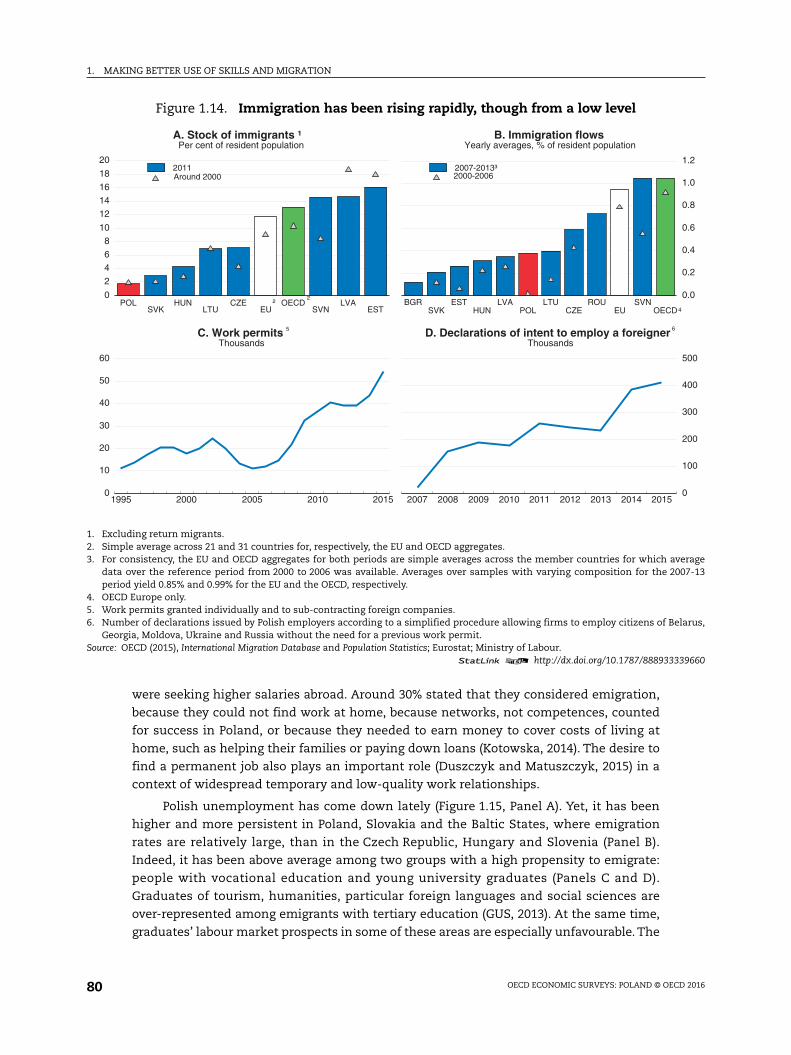
1. MAKING BETTER USE OF SKILLS AND MIGRATION
OECD ECONOMIC SURVEYS: POLAND © OECD 201680
were seeking higher salaries abroad. Around 30% stated that they considered emigration,
because they could not find work at home, because networks, not competences, counted
for success in Poland, or because they needed to earn money to cover costs of living at
home, such as helping their families or paying down loans (Kotowska, 2014). The desire to
find a permanent job also plays an important role (Duszczyk and Matuszczyk, 2015) in a
context of widespread temporary and low-quality work relationships.
Polish unemployment has come down lately (Figure 1.15, Panel A). Yet, it has been
higher and more persistent in Poland, Slovakia and the Baltic States, where emigration
rates are relatively large, than in the Czech Republic, Hungary and Slovenia (Panel B).
Indeed, it has been above average among two groups with a high propensity to emigrate:
people with vocational education and young university graduates (Panels C and D).
Graduates of tourism, humanities, particular foreign languages and social sciences are
over-represented among emigrants with tertiary education (GUS, 2013). At the same time,
graduates’ labour market prospects in some of these areas are especially unfavourable. The
Figure 1.14. Immigration has been rising rapidly, though from a low level
1. Excluding return migrants.2. Simple average across 21 and 31 countries for, respectively, the EU and OECD aggregates.3. For consistency, the EU and OECD aggregates for both periods are simple averages across the member countries for which average
data over the reference period from 2000 to 2006 was available. Averages over samples with varying composition for the 2007-13period yield 0.85% and 0.99% for the EU and the OECD, respectively.
4. OECD Europe only.5. Work permits granted individually and to sub-contracting foreign companies.6. Number of declarations issued by Polish employers according to a simplified procedure allowing firms to employ citizens of Belarus,
Georgia, Moldova, Ukraine and Russia without the need for a previous work permit.Source: OECD (2015), International Migration Database and Population Statistics; Eurostat; Ministry of Labour.
1 2 http://dx.doi.org/10.1787/888933339660
0
2
4
6
8
10
12
14
16
18
20
POLSVK
HUNLTU
CZEEU
OECDSVN
LVAEST
Around 2000
² ²
2011
A. Stock of immigrants ¹Per cent of resident population
0.0
0.2
0.4
0.6
0.8
1.0
1.2
BGRSVK
ESTHUN
LVAPOL
LTUCZE
ROUEU
SVNOECD
2000-2006
4
2007-2013³
B. Immigration flowsYearly averages, % of resident population
1995 2000 2005 2010 20150
10
20
30
40
50
60
5C. Work permitsThousands
2007 2008 2009 2010 2011 2012 2013 2014 2015
0
100
200
300
400
500
6D. Declarations of intent to employ a foreignerThousands
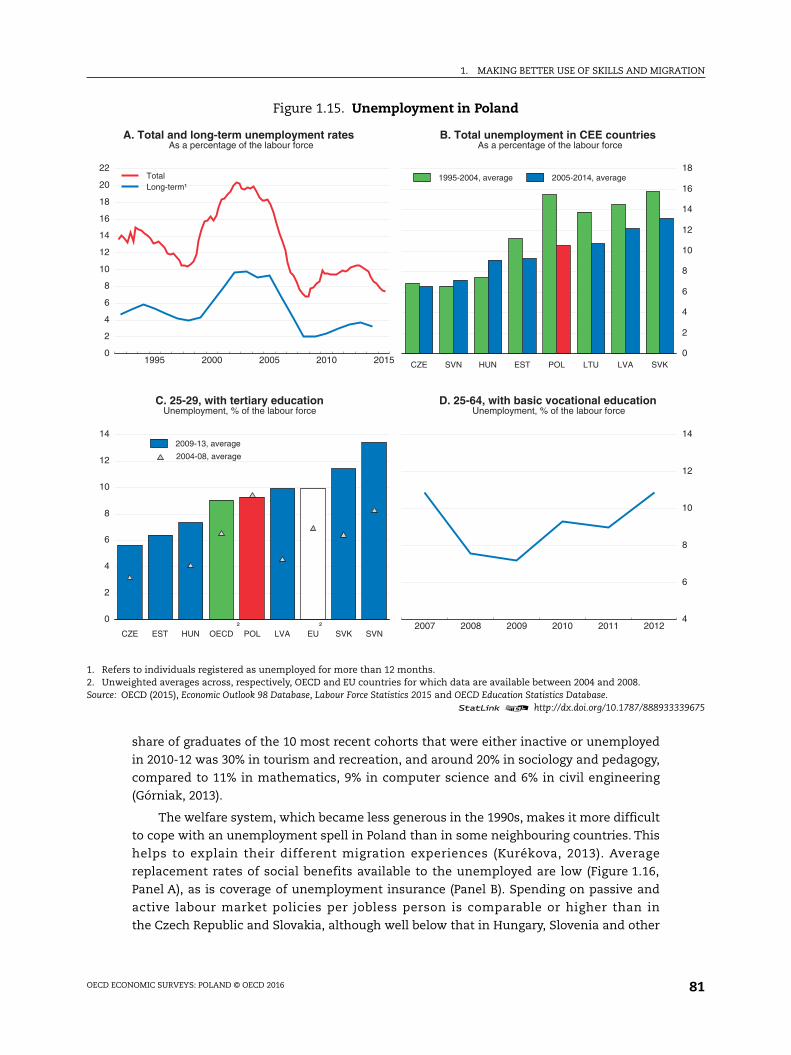
1. MAKING BETTER USE OF SKILLS AND MIGRATION
OECD ECONOMIC SURVEYS: POLAND © OECD 2016 81
share of graduates of the 10 most recent cohorts that were either inactive or unemployed
in 2010-12 was 30% in tourism and recreation, and around 20% in sociology and pedagogy,
compared to 11% in mathematics, 9% in computer science and 6% in civil engineering
(Górniak, 2013).
The welfare system, which became less generous in the 1990s, makes it more difficult
to cope with an unemployment spell in Poland than in some neighbouring countries. This
helps to explain their different migration experiences (Kurékova, 2013). Average
replacement rates of social benefits available to the unemployed are low (Figure 1.16,
Panel A), as is coverage of unemployment insurance (Panel B). Spending on passive and
active labour market policies per jobless person is comparable or higher than in
the Czech Republic and Slovakia, although well below that in Hungary, Slovenia and other
Figure 1.15. Unemployment in Poland
1. Refers to individuals registered as unemployed for more than 12 months.2. Unweighted averages across, respectively, OECD and EU countries for which data are available between 2004 and 2008.Source: OECD (2015), Economic Outlook 98 Database, Labour Force Statistics 2015 and OECD Education Statistics Database.
1 2 http://dx.doi.org/10.1787/888933339675
1995 2000 2005 2010 20150
2
4
6
8
10
12
14
16
18
20
22
TotalLong-term¹
A. Total and long-term unemployment ratesAs a percentage of the labour force
0
2
4
6
8
10
12
14
16
18
CZE SVN HUN EST POL LTU LVA SVK
1995-2004, average 2005-2014, average
B. Total unemployment in CEE countriesAs a percentage of the labour force
0
2
4
6
8
10
12
14
CZE EST HUN OECD POL LVA EU SVK SVN
2004-08, average
² ²
2009-13, average
C. 25-29, with tertiary educationUnemployment, % of the labour force
2007 2008 2009 2010 2011 2012
4
6
8
10
12
14
D. 25-64, with basic vocational educationUnemployment, % of the labour force
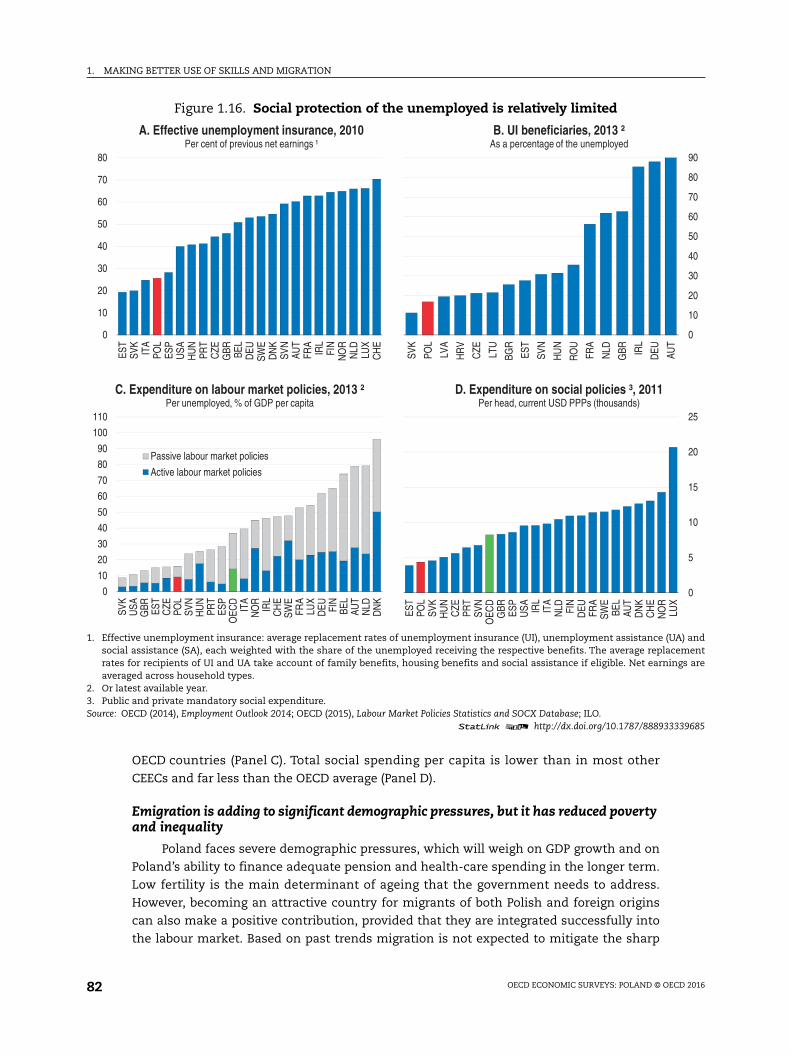
1. MAKING BETTER USE OF SKILLS AND MIGRATION
OECD ECONOMIC SURVEYS: POLAND © OECD 201682
OECD countries (Panel C). Total social spending per capita is lower than in most other
CEECs and far less than the OECD average (Panel D).
Emigration is adding to significant demographic pressures, but it has reduced povertyand inequality
Poland faces severe demographic pressures, which will weigh on GDP growth and on
Poland’s ability to finance adequate pension and health-care spending in the longer term.
Low fertility is the main determinant of ageing that the government needs to address.
However, becoming an attractive country for migrants of both Polish and foreign origins
can also make a positive contribution, provided that they are integrated successfully into
the labour market. Based on past trends migration is not expected to mitigate the sharp
Figure 1.16. Social protection of the unemployed is relatively limited
1. Effective unemployment insurance: average replacement rates of unemployment insurance (UI), unemployment assistance (UA) andsocial assistance (SA), each weighted with the share of the unemployed receiving the respective benefits. The average replacementrates for recipients of UI and UA take account of family benefits, housing benefits and social assistance if eligible. Net earnings areaveraged across household types.
2. Or latest available year.3. Public and private mandatory social expenditure.Source: OECD (2014), Employment Outlook 2014; OECD (2015), Labour Market Policies Statistics and SOCX Database; ILO.
1 2 http://dx.doi.org/10.1787/888933339685
0
10
20
30
40
50
60
70
80
EST
SVK
ITA
POL
ESP
USA
HU
NPR
TC
ZEG
BR BEL
DEU
SWE
DN
KSV
NAU
TFR
AIR
LFI
NN
OR
NLD LU
XC
HE
A. Effective unemployment insurance, 2010Per cent of previous net earnings ¹
0
10
20
30
40
50
60
70
80
90
SVK
POL
LVA
HR
V
CZE LT
U
BGR
EST
SVN
HU
N
RO
U
FRA
NLD
GBR IR
L
DEU AU
T
B. UI beneficiaries, 2013 ²As a percentage of the unemployed
0
10
20
30
40
50
60
70
80
90
100
110
SVK
USA
GBR ES
TC
ZEPO
LSV
NH
UN
PRT
ESP
OEC
DIT
AN
OR
IRL
CH
ESW
EFR
ALU
XD
EU FIN
BEL
AUT
NLD
DN
K
Passive labour market policies
Active labour market policies
C. Expenditure on labour market policies, 2013 ²Per unemployed, % of GDP per capita
0
5
10
15
20
25ES
TPO
LSV
KH
UN
CZE
PRT
SVN
OEC
DG
BR ESP
USA IR
LIT
AN
LD FIN
DEU FR
ASW
EBE
LAU
TD
NK
CH
EN
OR
LUX
D. Expenditure on social policies ³, 2011Per head, current USD PPPs (thousands)
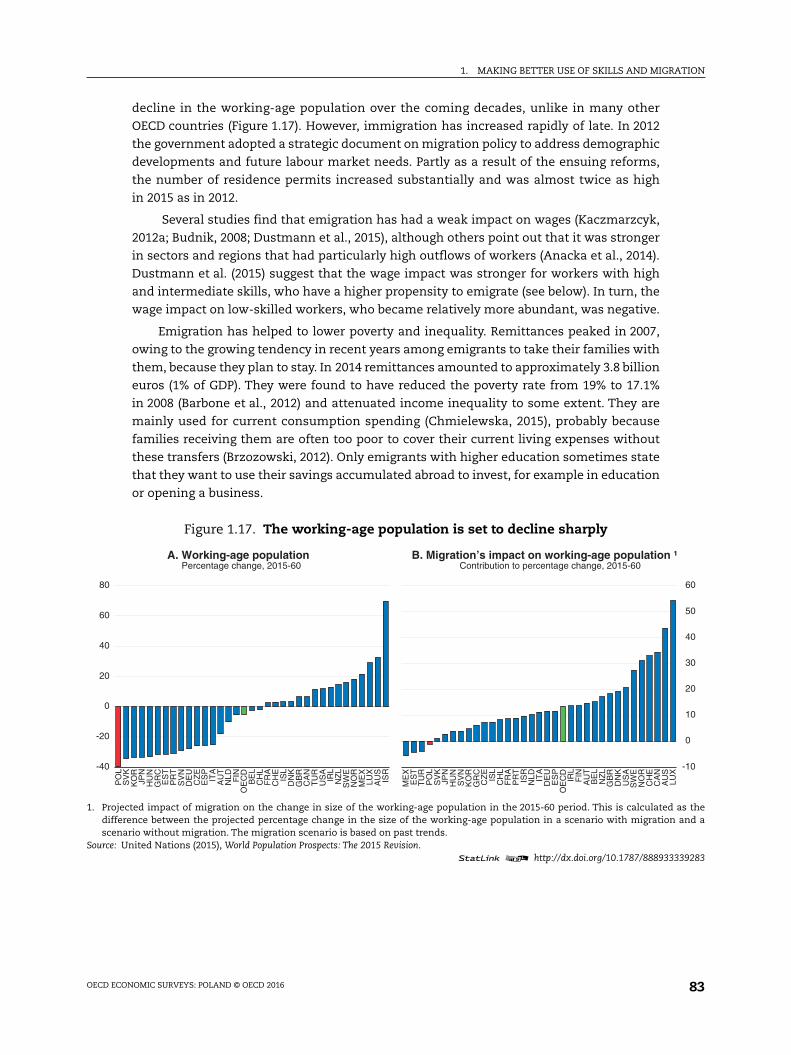
1. MAKING BETTER USE OF SKILLS AND MIGRATION
OECD ECONOMIC SURVEYS: POLAND © OECD 2016 83
decline in the working-age population over the coming decades, unlike in many other
OECD countries (Figure 1.17). However, immigration has increased rapidly of late. In 2012
the government adopted a strategic document on migration policy to address demographic
developments and future labour market needs. Partly as a result of the ensuing reforms,
the number of residence permits increased substantially and was almost twice as high
in 2015 as in 2012.
Several studies find that emigration has had a weak impact on wages (Kaczmarzcyk,
2012a; Budnik, 2008; Dustmann et al., 2015), although others point out that it was stronger
in sectors and regions that had particularly high outflows of workers (Anacka et al., 2014).
Dustmann et al. (2015) suggest that the wage impact was stronger for workers with high
and intermediate skills, who have a higher propensity to emigrate (see below). In turn, the
wage impact on low-skilled workers, who became relatively more abundant, was negative.
Emigration has helped to lower poverty and inequality. Remittances peaked in 2007,
owing to the growing tendency in recent years among emigrants to take their families with
them, because they plan to stay. In 2014 remittances amounted to approximately 3.8 billion
euros (1% of GDP). They were found to have reduced the poverty rate from 19% to 17.1%
in 2008 (Barbone et al., 2012) and attenuated income inequality to some extent. They are
mainly used for current consumption spending (Chmielewska, 2015), probably because
families receiving them are often too poor to cover their current living expenses without
these transfers (Brzozowski, 2012). Only emigrants with higher education sometimes state
that they want to use their savings accumulated abroad to invest, for example in education
or opening a business.
Figure 1.17. The working-age population is set to decline sharply
1. Projected impact of migration on the change in size of the working-age population in the 2015-60 period. This is calculated as thedifference between the projected percentage change in the size of the working-age population in a scenario with migration and ascenario without migration. The migration scenario is based on past trends.
Source: United Nations (2015), World Population Prospects: The 2015 Revision.1 2 http://dx.doi.org/10.1787/888933339283
-40
-20
0
20
40
60
80
PO
LS
VK
KO
RJP
NH
UN
GR
CE
ST
PR
TS
VN
DE
UC
ZE
ES
PIT
AA
UT
NLD FIN
OE
CD
BE
LC
HL
FR
AC
HE
ISL
DN
KG
BR
CA
NT
UR
US
AIR
LN
ZL
SW
EN
OR
ME
XLU
XA
US
ISR
A. Working-age population Percentage change, 2015-60
-10
0
10
20
30
40
50
60
ME
XE
ST
TU
RP
OL
SV
KJP
NH
UN
SV
NK
OR
GR
CC
ZE
ISL
CH
LF
RA
PR
TIS
RN
LD ITA
DE
UE
SP
OE
CD
IRL
FIN
AU
TB
EL
NZ
LG
BR
DN
KU
SA
SW
EN
OR
CH
EC
AN
AU
SLU
X
B. Migration’s impact on working-age population ¹Contribution to percentage change, 2015-60
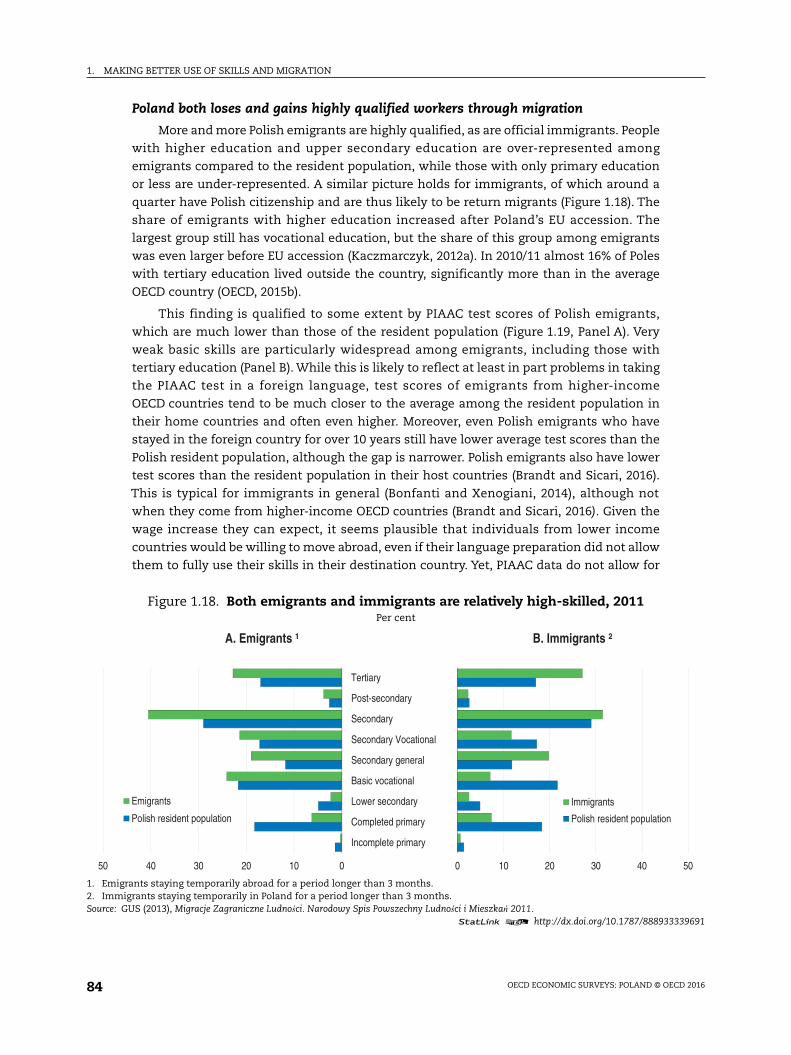
1. MAKING BETTER USE OF SKILLS AND MIGRATION
OECD ECONOMIC SURVEYS: POLAND © OECD 201684
Poland both loses and gains highly qualified workers through migration
More and more Polish emigrants are highly qualified, as are official immigrants. People
with higher education and upper secondary education are over-represented among
emigrants compared to the resident population, while those with only primary education
or less are under-represented. A similar picture holds for immigrants, of which around a
quarter have Polish citizenship and are thus likely to be return migrants (Figure 1.18). The
share of emigrants with higher education increased after Poland’s EU accession. The
largest group still has vocational education, but the share of this group among emigrants
was even larger before EU accession (Kaczmarczyk, 2012a). In 2010/11 almost 16% of Poles
with tertiary education lived outside the country, significantly more than in the average
OECD country (OECD, 2015b).
This finding is qualified to some extent by PIAAC test scores of Polish emigrants,
which are much lower than those of the resident population (Figure 1.19, Panel A). Very
weak basic skills are particularly widespread among emigrants, including those with
tertiary education (Panel B). While this is likely to reflect at least in part problems in taking
the PIAAC test in a foreign language, test scores of emigrants from higher-income
OECD countries tend to be much closer to the average among the resident population in
their home countries and often even higher. Moreover, even Polish emigrants who have
stayed in the foreign country for over 10 years still have lower average test scores than the
Polish resident population, although the gap is narrower. Polish emigrants also have lower
test scores than the resident population in their host countries (Brandt and Sicari, 2016).
This is typical for immigrants in general (Bonfanti and Xenogiani, 2014), although not
when they come from higher-income OECD countries (Brandt and Sicari, 2016). Given the
wage increase they can expect, it seems plausible that individuals from lower income
countries would be willing to move abroad, even if their language preparation did not allow
them to fully use their skills in their destination country. Yet, PIAAC data do not allow for
Figure 1.18. Both emigrants and immigrants are relatively high-skilled, 2011Per cent
1. Emigrants staying temporarily abroad for a period longer than 3 months.2. Immigrants staying temporarily in Poland for a period longer than 3 months.Source: GUS (2013), Migracje Zagraniczne Ludności. Narodowy Spis Powszechny Ludności i Mieszkań 2011.
1 2 http://dx.doi.org/10.1787/888933339691
01020304050
Incomplete primary
Completed primary
Lower secondary
Basic vocational
Secondary general
Secondary Vocational
Secondary
Post-secondary
Tertiary
Emigrants
Polish resident population
A. Emigrants ¹
0 10 20 30 40 50
Immigrants
Polish resident population
B. Immigrants ²
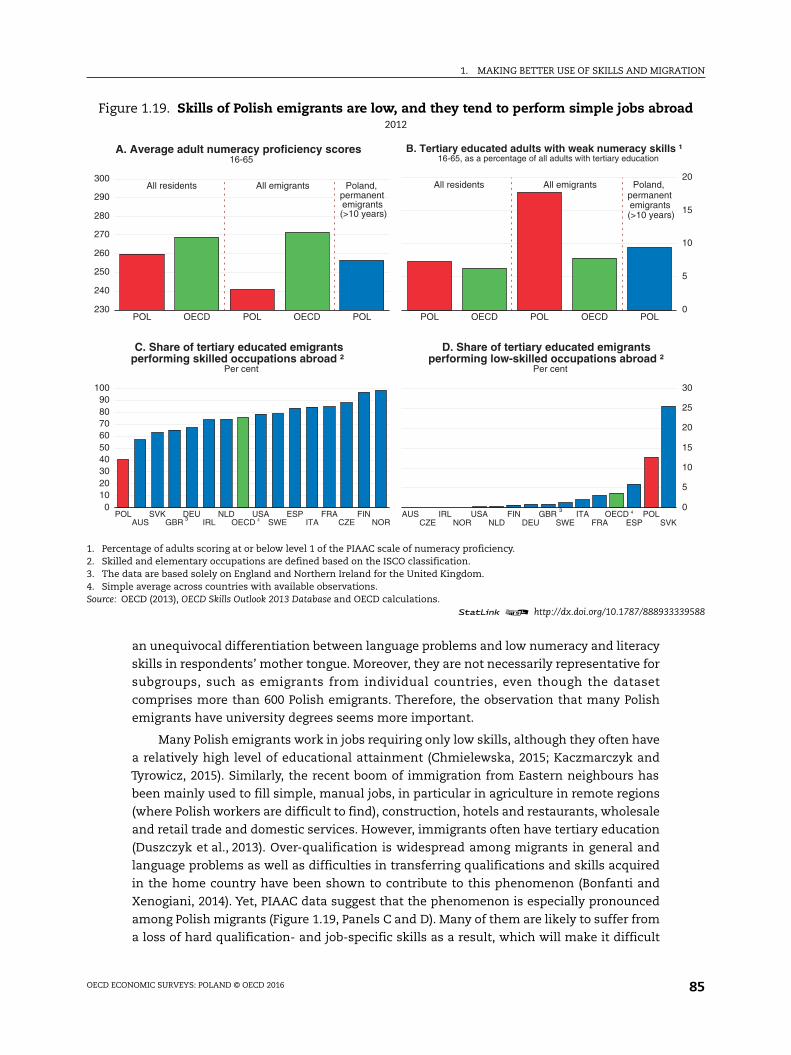
1. MAKING BETTER USE OF SKILLS AND MIGRATION
OECD ECONOMIC SURVEYS: POLAND © OECD 2016 85
an unequivocal differentiation between language problems and low numeracy and literacy
skills in respondents’ mother tongue. Moreover, they are not necessarily representative for
subgroups, such as emigrants from individual countries, even though the dataset
comprises more than 600 Polish emigrants. Therefore, the observation that many Polish
emigrants have university degrees seems more important.
Many Polish emigrants work in jobs requiring only low skills, although they often have
a relatively high level of educational attainment (Chmielewska, 2015; Kaczmarczyk and
Tyrowicz, 2015). Similarly, the recent boom of immigration from Eastern neighbours has
been mainly used to fill simple, manual jobs, in particular in agriculture in remote regions
(where Polish workers are difficult to find), construction, hotels and restaurants, wholesale
and retail trade and domestic services. However, immigrants often have tertiary education
(Duszczyk et al., 2013). Over-qualification is widespread among migrants in general and
language problems as well as difficulties in transferring qualifications and skills acquired
in the home country have been shown to contribute to this phenomenon (Bonfanti and
Xenogiani, 2014). Yet, PIAAC data suggest that the phenomenon is especially pronounced
among Polish migrants (Figure 1.19, Panels C and D). Many of them are likely to suffer from
a loss of hard qualification- and job-specific skills as a result, which will make it difficult
Figure 1.19. Skills of Polish emigrants are low, and they tend to perform simple jobs abroad2012
1. Percentage of adults scoring at or below level 1 of the PIAAC scale of numeracy proficiency.2. Skilled and elementary occupations are defined based on the ISCO classification.3. The data are based solely on England and Northern Ireland for the United Kingdom.4. Simple average across countries with available observations.Source: OECD (2013), OECD Skills Outlook 2013 Database and OECD calculations.
1 2 http://dx.doi.org/10.1787/888933339588
230
240
250
260
270
280
290
300
POL OECD POL OECD POL
All residents All emigrants Poland,permanentemigrants(>10 years)
A. Average adult numeracy proficiency scores16-65
0
5
10
15
20
POL OECD POL OECD POL
All residents All emigrants Poland,permanentemigrants(>10 years)
B. Tertiary educated adults with weak numeracy skills ¹16-65, as a percentage of all adults with tertiary education
0102030405060708090
100
POLAUS
SVKGBR
DEUIRL
NLDOECD
USASWE
ESPITA
FRACZE
FINNOR³ 4
C. Share of tertiary educated emigrantsperforming skilled occupations abroad ²
Per cent
0
5
10
15
20
25
30
AUSCZE
IRLNOR
USANLD
FINDEU
GBRSWE
ITAFRA
OECDESP
POLSVK
³ 4
D. Share of tertiary educated emigrants performing low-skilled occupations abroad ²
Per cent
1. MAKING BETTER USE OF SKILLS AND MIGRATION
OECD ECONOMIC SURVEYS: POLAND © OECD 201686
for them to work in professions corresponding to their qualifications when they return to
Poland.
Related to their concentration in low-skill jobs, average earnings of Polish workers are
significantly below the average in destination countries. This disadvantage is persistent,
even if it has shrunk somewhat over time. Average earnings of Polish immigrants in
Germany who had stayed longer than three years were more than a third lower than
average wages of Germans according to a central bank survey (Chmielewska, 2015).
Kaczmarczyk and Tyrowicz (2015) show that high-skilled Polish migrants in
the United Kingdom also suffer from a significant wage gap compared to their
British peers.
Nevertheless, many Polish emigrants report that they were able to acquire new, mainly
soft skills abroad through their work experience and training according to a survey among
return migrants conducted in Silesia (Brzozowski, 2012; Szymanska et al., 2012). This goes
in particular for languages (more than 80%), work experience, know-how and new
managerial and organisational techniques (more than 60%). Almost 40% of migrants with
higher education and slightly more than 20% of those with vocational education report
that they participated in training abroad.
Migrants find it difficult to use their skills and qualifications on the Polish labourmarket
Available data sources suggest that labour force participation among return migrants
is relatively high. While they are more likely to be employed than workers with no
migration experience, their unemployment rate is also much higher (Kotowska, 2014).
According to survey data from Silesia, around 40% of unemployed return migrants were
workers moving back and forth between Poland and other countries who registered as
unemployed when in Poland mainly for access to health-care benefits. Around 20% were
low skilled and had employment problems before moving abroad. Yet, roughly 40%
consisted of university graduates who previously worked below their qualifications in their
destination country (Brzozowski, 2012), suggesting that over-qualification abroad can
contribute to skills depreciation and labour market problems upon return. As in other
countries, return migrants are more likely to set up a business than others (Anacka et al.,
2014), yet when surveyed they cite various barriers. These include heavy bureaucratic
procedures, high labour costs and a lack of support from local labour offices.
Only 40% of return migrants felt that they were able to use their skills and experience
acquired abroad in their new jobs. Less than 30% consider that foreign experience has
helped them to obtain a better job or higher earnings (Brzozowski, 2012; Szymanska et al.,
2012). This may be linked to the finding that qualifications – as proxied by years of
education – are valued much more highly on the Polish labour market than skills
(Figure 1.7). Without a Polish qualification in their field of work, it is difficult for migrants
to signal their skills to Polish employers. The new possibilities to validate work experience
with formal qualifications should be particularly helpful for immigrants of both Polish and
foreign origins.
Research suggests that immigrants are mainly complementary to the domestic
workforce, in that their positions would have been difficult to fill by Poles (Duszczyk et al.,
2013). As labour shortages are starting to emerge, including for qualified manual labour
and some specialist professions, such as health-care workers, stronger immigration can
1. MAKING BETTER USE OF SKILLS AND MIGRATION
OECD ECONOMIC SURVEYS: POLAND © OECD 2016 87
help. Yet, more needs to be done to help immigrants fully use their qualifications and skills
on the Polish labour market.
Making qualifications more comparable nationally and internationally would improve
labour market opportunities for immigrants. A law adopted in December 2015 foresees an
integrated qualifications system (Zintegrowany System Kwalifikacji), aiming to make
diplomas and certificates comparable, both nationally and on the European level. With the
same methodology as the European qualifications framework it describes the knowledge,
skills and competences associated with Polish qualifications to map them to those from
other EU countries. This system should make it easier for Polish emigrants to use their
qualifications in other EU countries, promoting better skills matches and development.
Using qualifications acquired abroad when returning should also become easier. Similar,
perhaps bilateral, initiatives would be helpful for non-EU countries that are major
destinations or sources for Polish migration.
Public employment services need to improve further and be prepared to cater to
immigrants’ needs. The government is working to lower job counsellors’ caseloads by
increasing staff and to develop more individualised job-search assistance. Counsellors will
need to be trained, including how to advise return migrants, immigrants and jobseekers
who wish to set up their own business, and up-to-date information on labour market
trends needs to be better integrated into counselling. The government recently introduced
help for younger workers to set up a business, which can be particularly useful for return
migrants with their relatively high propensity to become entrepreneurs. Requests for
assistance can now be made online or by telephone, which might help return migrants
better prepare their re-integration into the Polish labour market before they come back.
Yet, services in English would be helpful to attract migrants who do not yet speak sufficient
Polish, and firms should be encouraged more vigorously to list their job offers with the
public employment services.
Active outreach to migrants is in Poland’s interest
Given the scale of Poland’s demographic problems, active outreach to potential
immigrants is in its interest. Attracting more workers to Poland requires first and foremost
good general economic, education and labour market policies that help the country
develop and make effective use of workers’ skills. Yet, actively reaching out to immigrants
to facilitate moving to Poland and integrating into the labour market would also be helpful.
The government has developed a programme to maintain ties with the Polish diaspora and
to engage them to transmit a positive image of Poland in their residence countries. It would
be important to actively advertise jobs and business and investment opportunities to
them.
Information helping workers to move to Poland and work should also be extended to
foreign migrants. There is a dedicated website www.powroty.gov.pl and a manual for
emigrants considering returning to Poland to help them with job search, administrative
procedures and access to education and health services. In the past, regional programmes
included help to set up a business and promotional activities abroad to encourage return,
but evaluations of their effectiveness are not available, and a number have been
abandoned (Kaczmarczyk, 2012b). Initiatives to facilitate moving to Poland to work should
be extended to foreign-born migrants from a wide set of countries. There is ample evidence
that immigration is beneficial for innovation and productivity, in particular if migrants
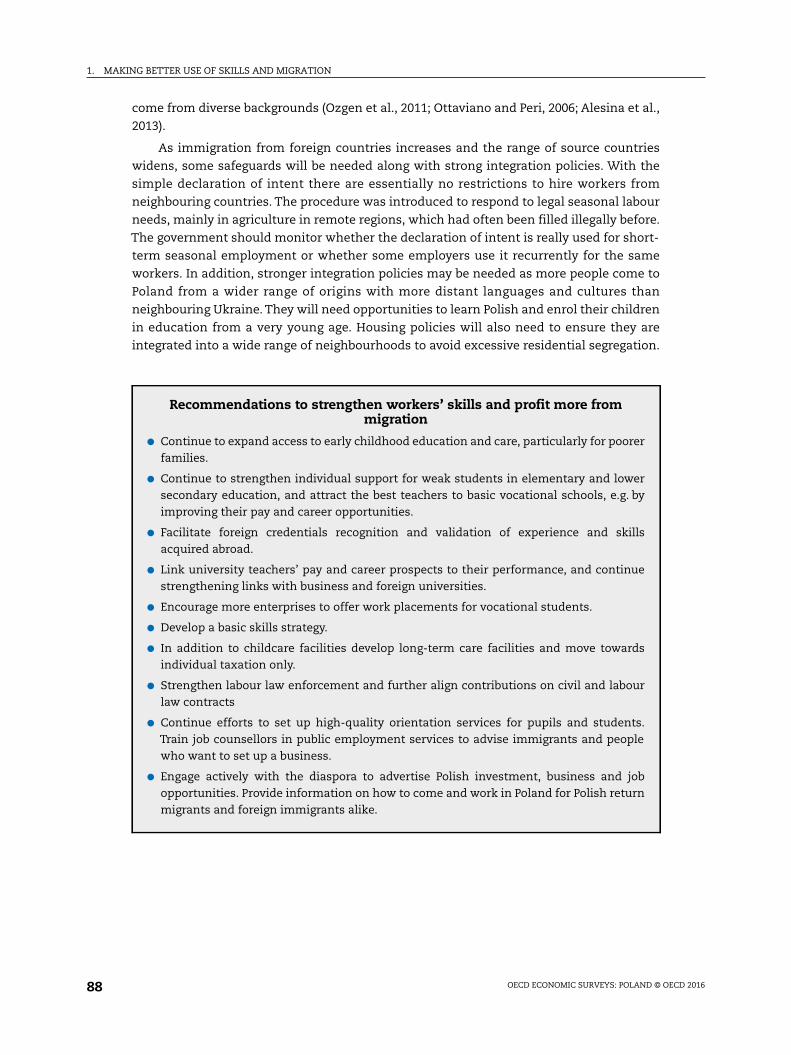
1. MAKING BETTER USE OF SKILLS AND MIGRATION
OECD ECONOMIC SURVEYS: POLAND © OECD 201688
come from diverse backgrounds (Ozgen et al., 2011; Ottaviano and Peri, 2006; Alesina et al.,
2013).
As immigration from foreign countries increases and the range of source countries
widens, some safeguards will be needed along with strong integration policies. With the
simple declaration of intent there are essentially no restrictions to hire workers from
neighbouring countries. The procedure was introduced to respond to legal seasonal labour
needs, mainly in agriculture in remote regions, which had often been filled illegally before.
The government should monitor whether the declaration of intent is really used for short-
term seasonal employment or whether some employers use it recurrently for the same
workers. In addition, stronger integration policies may be needed as more people come to
Poland from a wider range of origins with more distant languages and cultures than
neighbouring Ukraine. They will need opportunities to learn Polish and enrol their children
in education from a very young age. Housing policies will also need to ensure they are
integrated into a wide range of neighbourhoods to avoid excessive residential segregation.
Recommendations to strengthen workers’ skills and profit more frommigration
● Continue to expand access to early childhood education and care, particularly for poorerfamilies.
● Continue to strengthen individual support for weak students in elementary and lowersecondary education, and attract the best teachers to basic vocational schools, e.g. byimproving their pay and career opportunities.
● Facilitate foreign credentials recognition and validation of experience and skillsacquired abroad.
● Link university teachers’ pay and career prospects to their performance, and continuestrengthening links with business and foreign universities.
● Encourage more enterprises to offer work placements for vocational students.
● Develop a basic skills strategy.
● In addition to childcare facilities develop long-term care facilities and move towardsindividual taxation only.
● Strengthen labour law enforcement and further align contributions on civil and labourlaw contracts
● Continue efforts to set up high-quality orientation services for pupils and students.Train job counsellors in public employment services to advise immigrants and peoplewho want to set up a business.
● Engage actively with the diaspora to advertise Polish investment, business and jobopportunities. Provide information on how to come and work in Poland for Polish returnmigrants and foreign immigrants alike.
1. MAKING BETTER USE OF SKILLS AND MIGRATION
OECD ECONOMIC SURVEYS: POLAND © OECD 2016 89
Bibliography
Adalet McGowan, M. and D. Andrews (2015), “Labour market mismatch and labour productivity:evidence from PIAAC data”, OECD Economics Department Working Papers, No. 1209, OECD Publishing.
Alesina, A., J. Harnoss and H. Rapoport (2013), “Birthplace diversity and economic prosperity”, NBERWorking Papers, No. 18699.
Anacka, M., J. Brzozowski, I. Grabowska-Lusińska and S. Urbańska (2014), “Społeczne skutkipoakcesyjnych migracji ludności polski”, Raport Komitetu Badán nad Migracjami Polskiej AkademiiNauk, Warsaw.
Appelt, S. et al. (2015), “Which factors influence the international mobility of research scientists?”,OECD Science, Technology and Industry Working Papers, 2015/02, OECD Publishing, http://dx.doi.org/10.1787/5js1tmrr2233-en.
Arak, P., P. Lewandowski and P. Żakowiecki (2014), “Dual labour market in Poland – proposals forovercoming the deadlock”, Instytut Badań Strakturalnych, Warsaw.
Auer, W. and N. Danzer (2015), “Fixed-Term employment and fertility: evidence from German MicroData”, CESifo Economic Studies, pp. 1-29.
Barber, M. and M. Mourshed (2007), How the World’s Best-Performing School Systems Come Out on Top,McKinsey and Co., London.
Barbone, L., K. Piętka Kosińska and I. Topińska (2012), “Wpływ przepływów pieniężnych na polskągospodarkę w latach 1992-2012”, Raport Western Union, Centrum Analiz Społeczno-Ekonomicznych –CASE, Warsaw.
Bassanini, A., L. Nunziata and D. Venn (2009), “Job protection legislation and productivity growth inOECD Countries”, Economic Policy, Vol. 58, pp. 349-402.
Bonfanti, S. and T. Xenogiani (2014), “Migrants’ skills: use, mismatch and labour market outcomes. Afirst exploration of the Survey of Adult Skills (PIAAC)”, in Matching Economic Migration with LabourMarket Needs, OECD Publishing, http://dx.doi.org/10.1787/9789264216501-en.
Brandt, N. and P. Sicari (2016), “The Skills of Polish Emigrants – New Evidence from PIAAC”, TechnicalBackground Paper, forthcoming.
Brzozowski, J. (2012), “Analiza wpływu powrotów z emigracji na rozwój województwa śląskiego”, inJ. Szymańska, C. Ulasiński and D. Bieńkowska (eds.), Zaraz wracam… albo i nie. Skala powrotów,motywacje i strategie życiowe reemigrantów z województwa śląskiego, Centrum DoradztwaStrategicznego, Krakow.
Budnik, K.B. (2008), “Search equilibrium with migration: The case of Poland”, National Bank of PolandWorking Paper, No. 45, NBP, Warsaw.
Bukowski, M. (2007), Employment in Poland 2006 – Productivity for Jobs, Ministerstwo Pracy i PolitykiSpołecznej, Warsaw, http://ibs.org.pl/projekty/files/ZWP/Employment_in_Poland_2006_-_Productivity_for_jobs.pdf.
Bynner, J. and S. Parsons (2006), “New light on literacy and numeracy”, National Research andDevelopment Centre for Adult Literacy and Numeracy, London.
Cedefop (2013a), Poland. Vocational Education and Training in Europe – Country Report, Thessaloniki.
Cedefop (2013b), Spotlight on VET – Poland, Thessaloniki.
Chmielewska, I. (2015), “Transfery z tytułu pracy Polaków za granicą w świetle badań NarodowegoBanku Polskiego”, Materiały i Studia, No. 314, Narodowy Bank Polski (NBP), Warsaw.
Dolado, J., S. Ortigueira and R. Stucchi (2012), “Does dual employment protection affect TFP? Evidencefrom Spanish manufacturing firms”, CEPR Discussion Paper, No. 8763, London.
Dustmann, C., T. Frattini and A. Rosso (2015), “The effect of emigration from Poland on Polish wages”,The Scandinavian Journal of Economics, Vol. 117, No. 2, pp. 522-64.
Duszczyk, M. and K. Matuszczyk (2015), “A one-way ticket? Migration in Europe from the perspectiveof CEE countries”, Central and Eastern Europe Development Institute, Warsaw.
Duszczyk, M., M. Góra and P. Kaczmarczyk (2013), “Costs and benefits of labor mobility between the EUand the Eastern Partnership Countries: the case of Poland”, IZA Discussion Paper, No. 7664, Bonn.
1. MAKING BETTER USE OF SKILLS AND MIGRATION
OECD ECONOMIC SURVEYS: POLAND © OECD 201690
Ernst & Young and the Gdansk Institute for Market Economics (Instytut Badań nad GospodarkąRynkową) (2009), Diagnoza stanu szkolnictwa wyższego w Polsce (Diagnosis of Higher Education InPoland), Gdansk, http://ptbk.mol.uj.edu.pl/download/aktualnosci/akt.diagnoza.pdf.
European Commission (2012), First European Survey on Language Competences, Brussels.
European Commission (2014), Education and Training Monitor – Poland, Brussels.
Główny Urząd Stastyczny (GUS) (2013), Migracje Zagraniczne Ludności. Narodowy Spis Powszechny Ludnościi Mieszkań, Warsaw.
Główny Urząd Stastyczny (GUS) (2014a), Higher Education Institutions and their Finances in 2013, Warsaw.
Główny Urząd Stastyczny (GUS) (2014b), Rocznik Statystyczny Pracy, Warsaw
Główny Urząd Stastyczny (GUS) (2014c), Education in the 2013/2014 School Year, Warsaw.
Główny Urząd Stastyczny (GUS) (2015a), Wybrane Zagadnienia Rynku Pracy – Notatka, Warsaw.
Główny Urząd Stastyczny (GUS) (2015b), Concise Statistical Yearbook 2015, Warsaw.
Górniak, J. (2013), Youth or Experience? Human Capital in Poland – Report concluding the 3rd Round of the BKLstudy in 2012, Polska Agencja Rozwoju Przedsiębiorczości, Warsaw.
Goźlińska, E. and A. Kruszewski (2013), Stan szkolnictwa zawodowego w Polsce – Raport, Krajowy, OśrodekWspierania Edukacji Zawodowej i Ustawicznej, Warsaw.
Herbst, M. and J. Rok (2014), “Equity in an educational boom: lessons from the expansion andmarketization of tertiary schooling in Poland”, European Journal of Education, Vol. 49, No.3,pp. 435-50.
Kaczmarczyk, P. (2012a), “Labour market impacts of post accession migration from Poland”, in OECD,Free Movement of Workers and Labour Market Adjustment: Recent Experiences from OECD Countries andthe European Union, OECD Publishing, http://dx.doi.org/10.1787/9789264177185-10-en.
Kaczmarczyk (2012b), “Return migration and transfer of competencies – the case of Poland”,unpublished Manuscript.
Kaczmarczyk, P. and M. Okólski (2008), “Demographic and labour market impacts of migration onPoland”, Oxford Review of Economic Policy, Vol. 24, No. 3, pp. 600-25.
Kaczmarczyk, P. and J. Tyrowicz (2015), “Winners and losers among skilled migrants: The case of post-accession Polish migrants to the UK”, IZA Discussion Paper, No. 9057, Bonn.
Kiersztyn, A. (2013), “Stuck in a mismatch? The persistence of overeducation during twenty years ofthe post-communist transition in Poland”, Economics of Education Review, No. 32, pp. 78-91.
Kocór, M., A. Strzebońska and M. Dawid-Sawicka (2015), Rynek pracy widziany oczami pracodawców – Napodstawie badań pracodawców i ofert pracy zrealizowanych w 2014 roku w ramach V edycji projektu BilansKapitału Ludzkiego, Polska Agencja Rozwoju Przedsiębiorczości, Warsaw.
Kotowska, I. (2014), Rynek pracy y wykluczenie społeczne w kontekście percepcji Polaków – Diagnozaspołeczna 2013, Warsaw, http://analizy.mpips.gov.pl/images/stories/publ_i_raporty/DS2013/Raport_Rynek_pracy_i_wykluczenie_spoleczne.pdf.
Kureková, L. (2013), “Welfare systems as emigration factor: evidence from the new accession states”,Journal of Common Market Studies, Vol. 51, No. 4. pp. 721-39.
Kwiek, M. (2015), “The internationalization of research in Europe: A quantitative study of 11 nationalsystems from a micro-level perspective”, Journal of Studies in International Education, pp. 1-9.
Lewandowski, P. and I. Magda (2014), Employment in Poland – Labour in the Age of Structural Change,Warsaw.
Lewandowski, P. and A. Kaminska (2014), “In-work poverty in Poland: Diagnosis and possibleremedies”, Institute of Structural Research, Warsaw.
Lis, M. and A. Miazga (2014), “Time for quality in vocational education”, IBS Policy Paper, No. 03/04,Instytut Badán Strukturalnych.
Łukowski, W. (2004), “Polscy pracownicy na rynku pracy Unii Europejskiej na przełomie wiekow”,Institute for Social Studies, University of Warsaw.
Mertaugh, M. and E. Hanushek (2005), “Education and training”, in Nicholas Barr (ed.), Labor Marketsand Social Policy in Central and Eastern Europe: The Accession and Beyond, pp. 207-51, The World Bank,Washington, DC.
1. MAKING BETTER USE OF SKILLS AND MIGRATION
OECD ECONOMIC SURVEYS: POLAND © OECD 2016 91
Ministerstwo Edukacji Narodowej MEN (2011), Badanie funkcjonowania systemu kształcenia zawodowego wPolsce – Raport końcowy, Warsaw, www.efs.lubelskie.pl/widget/file/get/1328602926480914.pdf.
Montt, G. (2015), “The causes and consequences of field-of-study mismatch: An analysis using PIAAC”,OECD Social, Employment and Migration Working Papers, No. 167, OECD Publishing, http://dx.doi.org/10.1787/5jrxm4dhv9r2-en.
National Labour Inspectorate (Państwowa Inspekcja Pracy, PIP) (2015), Sprawozdanie z działalnościPaństwowej Inspekcji Pracy w 2014 roku, Warsaw.
Nešperová, A. (2000), “Employment and labour market policies in transition economies”, InternationalLabour Organization, Geneva.
OECD (2005), Teachers Matter: Attracting, Developing and Retaining Effective Teachers, OECD Publishing,http://dx.doi.org/10.1787/9789264018044-en.
OECD (2008), OECD Employment Outlook 2008, OECD Publishing, http://dx.doi.org/10.1787/empl_outlook-2008-en.
OECD (2010), Learning for Jobs, OECD Reviews of Vocational Education and Training, OECD Publishing,http://dx.doi.org/10.1787/9789264087460-en.
OECD (2011a), “The Impact of the 1999 Education Reform in Poland”, OECD Education Working Papers,No. 49, OECD Publishing.
OECD (2011b), Doing Better for Families, OECD Publishing, http://dx.doi.org/10.1787/empl_outlook-2008-en.
OECD (2012), Closing the Gender Gap: Act Now, OECD Publishing, http://dx.doi.org/10.1787/9789264179370-en.
OECD (2013a), Skills Outlook, OECD Publishing, http://dx.doi.org/ 10.1787/9789264204256-en.
OECD (2013b), Higher Education in Regional and City Development: Wroclaw, Poland 2012, OECD Publishing,http://dx.doi.org/10.1787/9789264188914-en.
OECD (2014a), “Does primary education reach those who need it most?” PISA in Focus 40, OECDPublishing, www.oecd.org/pisa/pisaproducts/pisainfocus/pisa-in-focus-n40-(eng)-final.pdf.
OECD (2014b), Skills Beyond School: Synthesis Report, OECD Reviews of Vocational Education and Training,OECD Publishing, http//dx.doi.org/10.1787/9789264214682-en.
OECD (2014c), OECD Employment Outlook 2014, OECD Publishing, http://dx.doi.org/10.1787/empl_outlook-2014-en.
OECD (2014d), OECD Economic Surveys: Poland 2014, OECD Publishing, http://dx.doi.org/ 10.1787/eco_surveys-pol-2014-en.
OECD (2015a), Ageing and Employment Policies: Poland 2015, OECD Publishing, http://dx.doi.org/ 10.1787/9789264227279-en.
OECD (2015b), Connecting with Emigrants, OECD Publishing, http://dx.doi.org/10.1787/9789264239845-1-en.
OECD (2016), Employment and Skills Strategies in Poland, OECD Reviews on Local Job Creation, OECDPublishing, forthcoming.
Ottaviano, G. and G. Peri (2006), “The economic value of cultural diversity: evidence from US Cities”Journal of Economic Geography, Vol. 6, pp. 9-44.
Ozgen, C., P. Nijkamp and J. Poot (2011), “Immigration and innovation in European regions”, IZADiscussion Paper, No. 5646, http://ftp.iza.org/dp5676.pdf.
Rica, S. de la and A. Iza (2005), “Career planning in Spain: do fixed-term contracts delay marriage andparenthood?”, Review of Economics of the Household, Vol. 3, pp. 49-73.
Sroka, M. (2014), “Functioning of academic career centres in Polish schools of higher education”, PolishJournal of Management Studies, Vol. 10, pp.135-44.
Szymańska, Justyna, C. Ulasiński and D. Bieńkowska (2012), Zaraz wracam… albo i nie. Skala powrotów,motywacje i strategie życiowe reemigrantów z województwa śląskiego, Centrum DoradztwaStrategicznego, Kraków.
Vega, M. L. and R. Robert (2013), “Labour inspection sanctions: law and practice of national labourinspection systems”, Labour Administration and Inspection Programme LAB/ADMIN, WorkingDocument, No. 26, International Labour Organization, Geneva.

1. MAKING BETTER USE OF SKILLS AND MIGRATION
OECD ECONOMIC SURVEYS: POLAND © OECD 201692
Windisch, H. C. (2015), “Adults with low literacy and numeracy skills: A literature review on policyintervention”, OECD Education Working Papers, No. 123, OECD Publishing, http://dx.doi.org/10.1787/5jrxnjdd3r5k-en.
Wolf, A. (2008), “Adult learning in the workplace: Creating formal provision with impact”, Teaching andLearning Research Briefing, No. 59, Teaching and Learning Research Programme, Economic and SocialResearch Council, London, www.tlrp.org/pub/documents/wolfRB59final.pdf.
OECD Economic Surveys: Poland
© OECD 2016
93
Chapter 2
Improving transport and energyinfrastructure investment
Poland has significantly upgraded its infrastructure network over the past decade.However, bottlenecks still weigh on productivity growth and environmental andhealth outcomes. The EU 2014-20 programming period is an opportunity to improvethe management of infrastructure investment. Regularly updating nationalinfrastructure strategies and promoting cost-benefit analyses and ex postevaluations would increase the coherence of sectoral development plans.Strengthening local governance and ensuring the independence of the networkindustry regulators and the Competition Authority would also be good moves. Atthe same time, rebuilding fiscal buffers and promoting long-term financinginstruments will be critical over the medium term, while increasing environmentaltaxation and road pricing would promote greener investment. As many localgovernments lack administrative capacity, relying more on central governmentassistance for project management and public procurement procedures wouldimprove infrastructure delivery. In the transport sector, the country allocated mostrecent funding to roads, but it plans significant investment in railway and urbanpublic transport in 2014-20. Strengthening metropolitan governance, building upmedium-term infrastructure management capabilities and reducing fundinguncertainty would ensure more efficient spending. In the energy sector, electricitygeneration capacity is tight, while regulatory uncertainty, administrative burdensand a lack of interregional and international trade capacity has hampered thedevelopment of renewables. The authorities are seeking to develop nuclear power,but they need to take fully into account tail risks involved and its long-term costs.More energy efficiency investment would also be valuable, as current supportsystems do not provide sufficient incentives.
2. IMPROVING TRANSPORT AND ENERGY INFRASTRUCTURE INVESTMENT
OECD ECONOMIC SURVEYS: POLAND © OECD 201694
Infrastructure is key for productivity and social welfareImproving infrastructure is a key requirement for keeping the economy on a steep
long-term growth path, enabling productive private investment and the creation of new
activities. Poland has made significant progress to upgrade its transport and energy
infrastructure over the last 20 years (Figure 2.1, Panels A and B). The increase in public
investment since 2003 has helped to significantly reduce infrastructure bottlenecks and
smoothed the economic downturn during the global financial crisis and the European
turmoil (OECD, 2014a). However, the perceived quality of overall transport infrastructure
and electricity supply remains lower than in most OECD countries (Panels C and D), and
infrastructure needs are still substantial. The current investment plans until 2030 and 2050
foresee sizeable investment in transport and energy infrastructure (Ministry of Economy,
2015a; Ministry of Infrastructure and Development, 2014). Until 2020, structural and
cohesion funds from the European Union that assist in the financing of numerous
infrastructure projects are set to reach nearly 3% of 2013 GDP per year (European
Commission, 2015a). Strengthening the planning and management of public and private
infrastructure investments, as well as improving the regulatory environment, would
enhance the short- and long-term impacts of new infrastructure on productivity, growth
and well-being (OECD, 2015a; IMF, 2015).
Improving transport infrastructure and developing public transport, as planned in the
EU 2014-20 programming period, is an important challenge. Investment imbalances
between road and rail infrastructure, consumer preference for car ownership, as well as
relatively low car use taxation have led to a steady decline of public transport modes
(OECD, 2014a and 2015b). At the same time, Poland’s economy has exhibited a growing
dispersion of GDP per capita across metropolitan areas, while residential mobility is low
(Figure 2.2). Furthermore, the safety of the rail and road networks is lagging in
international comparison (Figure 2.3, Panel A). Developing more efficient transport
infrastructure, notably urban rapid transit, is important to reduce the sector’s
environmental impacts and local labour market mismatches, and to sustain regional
development (OECD, 2014b and 2014c). At the macroeconomic level, lowering
transportation costs would improve access to markets and regional resource re-allocation
and boost agglomeration effects, productivity and economic growth. This could counteract
the slowdown in potential growth associated with the rapidly ageing population and low
fertility rates.
Emissions of greenhouse gases (GHGs) are another vital issue. Urban air pollution is
elevated, contributing to climate change and leading to substantial health costs (Figure 2.3,
Panel B; European Commission, 2015a). The government is planning to increase spending
on public transport in 2014-20 and to progressively reduce the share of coal in the energy
mix. However, coal’s share in primary energy supply remains the highest in the OECD,
despite its gradual reduction over the last decade, and the GHG emissions of the energy
sector are relatively high (Figure 2.4). Ageing electricity generation capacity and limited
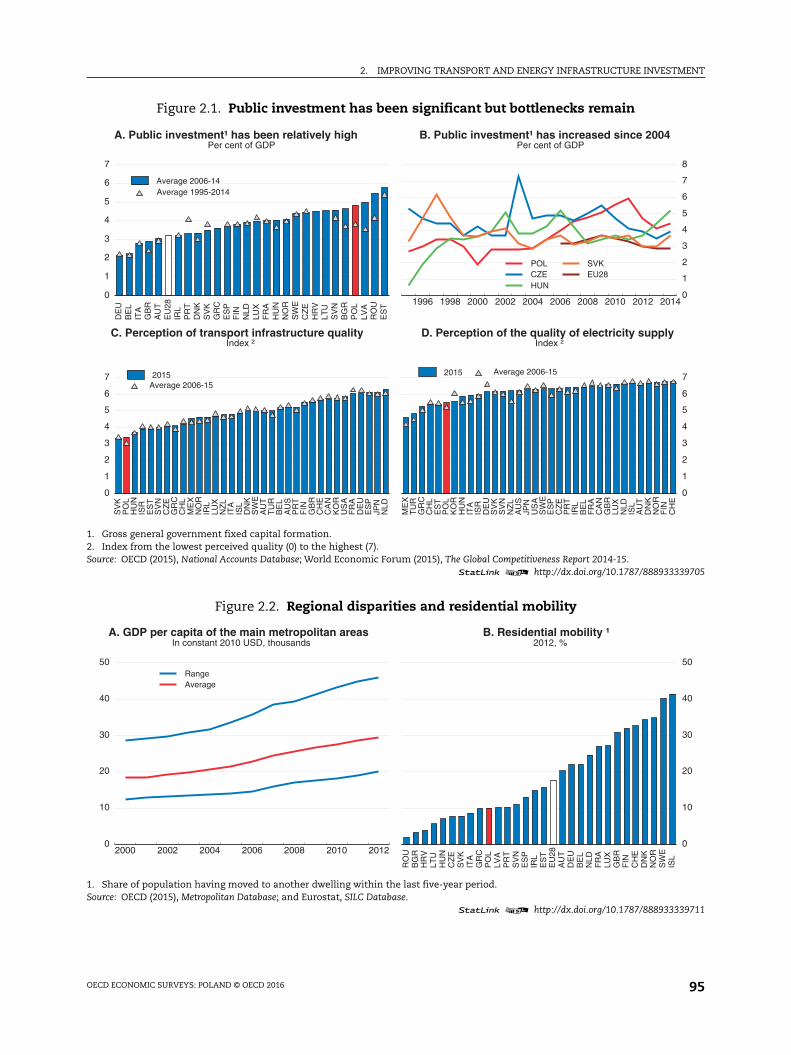
2. IMPROVING TRANSPORT AND ENERGY INFRASTRUCTURE INVESTMENT
OECD ECONOMIC SURVEYS: POLAND © OECD 2016 95
Figure 2.1. Public investment has been significant but bottlenecks remain
1. Gross general government fixed capital formation.2. Index from the lowest perceived quality (0) to the highest (7).Source: OECD (2015), National Accounts Database; World Economic Forum (2015), The Global Competitiveness Report 2014-15.
1 2 http://dx.doi.org/10.1787/888933339705
Figure 2.2. Regional disparities and residential mobility
1. Share of population having moved to another dwelling within the last five-year period.Source: OECD (2015), Metropolitan Database; and Eurostat, SILC Database.
1 2 http://dx.doi.org/10.1787/888933339711
0
1
2
3
4
5
6
7
DE
UB
EL
ITA
GB
RA
UT
EU
28IR
LP
RT
DN
KS
VK
GR
CE
SP
FIN
NLD
LUX
FR
AH
UN
NO
RS
WE
CZ
EH
RV
LTU
SV
NB
GR
PO
LLV
AR
OU
ES
T
Average 1995-2014Average 2006-14
A. Public investment¹ has been relatively highPer cent of GDP
1996 1998 2000 2002 2004 2006 2008 2010 2012 2014
0
1
2
3
4
5
6
7
8
POLCZEHUN
SVKEU28
B. Public investment¹ has increased since 2004Per cent of GDP
0
1
2
3
4
5
6
7
SV
KP
OL
HU
NIS
RE
ST
SV
NC
ZE
GR
CC
HL
ME
XN
OR
IRL
LUX
NZ
LIT
AIS
LD
NK
SW
EA
UT
TU
RB
EL
AU
SP
RT
FIN
GB
RC
HE
CA
NK
OR
US
AF
RA
DE
UE
SP
JPN
NLD
Average 2006-152015
C. Perception of transport infrastructure quality Index ²
0
1
2
3
4
5
6
7
ME
XT
UR
GR
CC
HL
ES
TP
OL
KO
RH
UN
ITA
ISR
DE
US
VK
SV
NN
ZL
AU
SJP
NU
SA
SW
EE
SP
CZ
EP
RT
IRL
BE
LF
RA
CA
NG
BR
LUX
NLD
ISL
AU
TD
NK
NO
RF
INC
HE
Average 2006-152015
D. Perception of the quality of electricity supplyIndex ²
2000 2002 2004 2006 2008 2010 20120
10
20
30
40
50
RangeAverage
A. GDP per capita of the main metropolitan areasIn constant 2010 USD, thousands
0
10
20
30
40
50
RO
UB
GR
HR
VLT
UH
UN
CZ
ES
VK
ITA
GR
CP
OL
LVA
PR
TS
VN
ES
PIR
LE
ST
EU
28A
UT
DE
UB
EL
NLD
FR
ALU
XG
BR
FIN
CH
ED
NK
NO
RS
WE
ISL
B. Residential mobility ¹2012, %
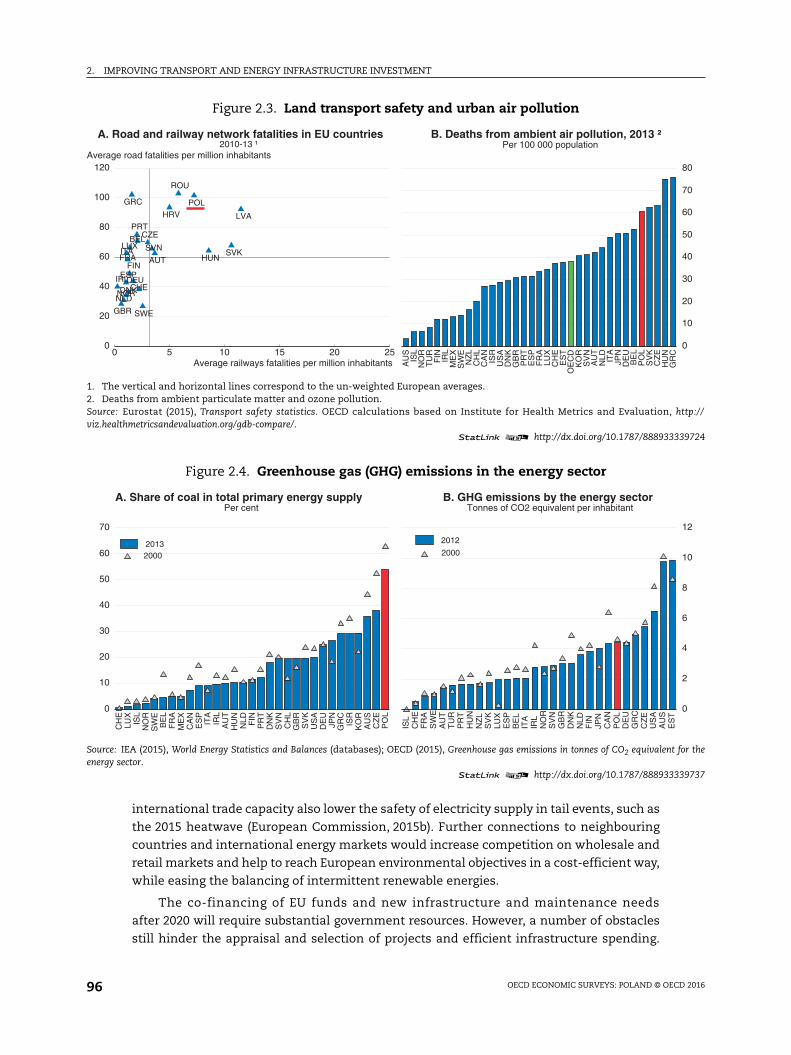
2. IMPROVING TRANSPORT AND ENERGY INFRASTRUCTURE INVESTMENT
OECD ECONOMIC SURVEYS: POLAND © OECD 201696
international trade capacity also lower the safety of electricity supply in tail events, such as
the 2015 heatwave (European Commission, 2015b). Further connections to neighbouring
countries and international energy markets would increase competition on wholesale and
retail markets and help to reach European environmental objectives in a cost-efficient way,
while easing the balancing of intermittent renewable energies.
The co-financing of EU funds and new infrastructure and maintenance needs
after 2020 will require substantial government resources. However, a number of obstacles
still hinder the appraisal and selection of projects and efficient infrastructure spending.
Figure 2.3. Land transport safety and urban air pollution
1. The vertical and horizontal lines correspond to the un-weighted European averages.2. Deaths from ambient particulate matter and ozone pollution.Source: Eurostat (2015), Transport safety statistics. OECD calculations based on Institute for Health Metrics and Evaluation, http://viz.healthmetricsandevaluation.org/gdb-compare/.
1 2 http://dx.doi.org/10.1787/888933339724
Figure 2.4. Greenhouse gas (GHG) emissions in the energy sector
Source: IEA (2015), World Energy Statistics and Balances (databases); OECD (2015), Greenhouse gas emissions in tonnes of CO2 equivalent for theenergy sector.
1 2 http://dx.doi.org/10.1787/888933339737
0
10
20
30
40
50
60
70
80
AU
SIS
LN
OR
TU
RF
IN IRL
ME
XS
WE
NZ
LC
HL
CA
NIS
RU
SA
DN
KG
BR
PR
TE
SP
FR
ALU
XC
HE
ES
TO
EC
DK
OR
SV
NA
UT
NLD IT
AJP
ND
EU
BE
LP
OL
SV
KC
ZE
HU
NG
RC
B. Deaths from ambient air pollution, 2013 ²Per 100 000 population
0 5 10 15 20 250
20
40
60
80
100
120Average road fatalities per million inhabitants
Average railways fatalities per million inhabitants
AUT
BEL
HRV
CZE
DNK
FINFRA
DEU
GRC
HUN
IRL
ITA
LVA
LUX
NLDNOR
POL
PRT
ROU
SVKSVN
ESP
SWE
CHE
GBR
A. Road and railway network fatalities in EU countries2010-13 ¹
0
10
20
30
40
50
60
70
CH
ELU
XIS
LN
OR
SW
EB
EL
FR
AM
EX
CA
NE
SP
ITA
IRL
AU
TH
UN
NLD FIN
PR
TD
NK
SV
NC
HL
GB
RS
VK
US
AD
EU
JPN
GR
CIS
RK
OR
AU
SC
ZE
PO
L
20002013
A. Share of coal in total primary energy supplyPer cent
0
2
4
6
8
10
12
ISL
CH
EF
RA
SW
EA
UT
TU
RP
RT
HU
NN
ZL
SV
KLU
XE
SP
BE
LIT
AIR
LN
OR
SV
NG
BR
DN
KN
LDF
INJP
NC
AN
PO
LD
EU
GR
CC
ZE
US
AA
US
ES
T
2000
2012
B. GHG emissions by the energy sectorTonnes of CO2 equivalent per inhabitant
2. IMPROVING TRANSPORT AND ENERGY INFRASTRUCTURE INVESTMENT
OECD ECONOMIC SURVEYS: POLAND © OECD 2016 97
Careful planning, effective spending controls, appropriate mobilisation of tax revenue and
well-functioning redistribution mechanisms across layers of governments would improve
infrastructure investment. Strengthening regulatory frameworks, improving public
procurement procedures and coordination among the different stakeholders would also
lead to more efficient infrastructure spending. At the same time, developing risk capital
from infrastructure funds that can be sold to long-term investors could support
infrastructure financing.
This chapter reviews the overall regulatory and financing frameworks surrounding
infrastructure investment and then focuses on the transport and energy sectors. The main
results are:
● Despite significant progress in redesigning the regulatory framework, regulations and
institutions could better ensure competitive neutrality. Infrastructure planning would be
strengthened by better integrating policy and investment priorities across ministries and
local governments, and by stepping up the professionalisation of public procurement
procedures.
● Significant headway has been made to extend the road network. However, the density of
high-speed roads remains lower than elsewhere, local road maintenance has been poor,
and rail investment is lagging. The new rail and road investments planned under
the 2014-20 EU perspective are welcome, but, over the medium term, developing road
pricing is needed to ensure sustained investment and maintenance of the existing
network and develop public services.
● Power generation capacity remains under-diversified, and the current regulatory
framework does not provide sufficient incentives for new investment. The functioning of
the new programme for energy efficiency and the development of nuclear projects need
to be monitored closely and international electricity trade capacity developed, as
planned.
An overarching strategy and a sound institutional framework are key toimproving infrastructure
Economic growth and better environmental and health outcomes call for higher
infrastructure investment. The ongoing implementation of the EU funds strategy 2014-20
provides further opportunities to strengthen infrastructure governance. At the same time,
policy developments should ensure that infrastructure investments are integrated into a
broader agenda of sustainable development and maintenance, since beyond 2020 EU
funding may be substantially reduced.
Better integrating strategic infrastructure plans across objectives and levels ofgovernment
Historically, public investment, private investment and GDP growth have moved
together in Poland (Rostowski, 2009), as better public capital and infrastructure allow
productivity gains and encourage private investment. Public investment may be necessary
to correct market failures and finance long-term projects in the transport and energy
sectors. The delivery of mostly irreversible capital investment involves a high level of risk-
taking and the need for long-term financing, whereas the development of infrastructure
networks is often associated with positive and negative externalities – such as lower
congestion costs or higher pollution – that can lead to socially non-optimal levels of capital
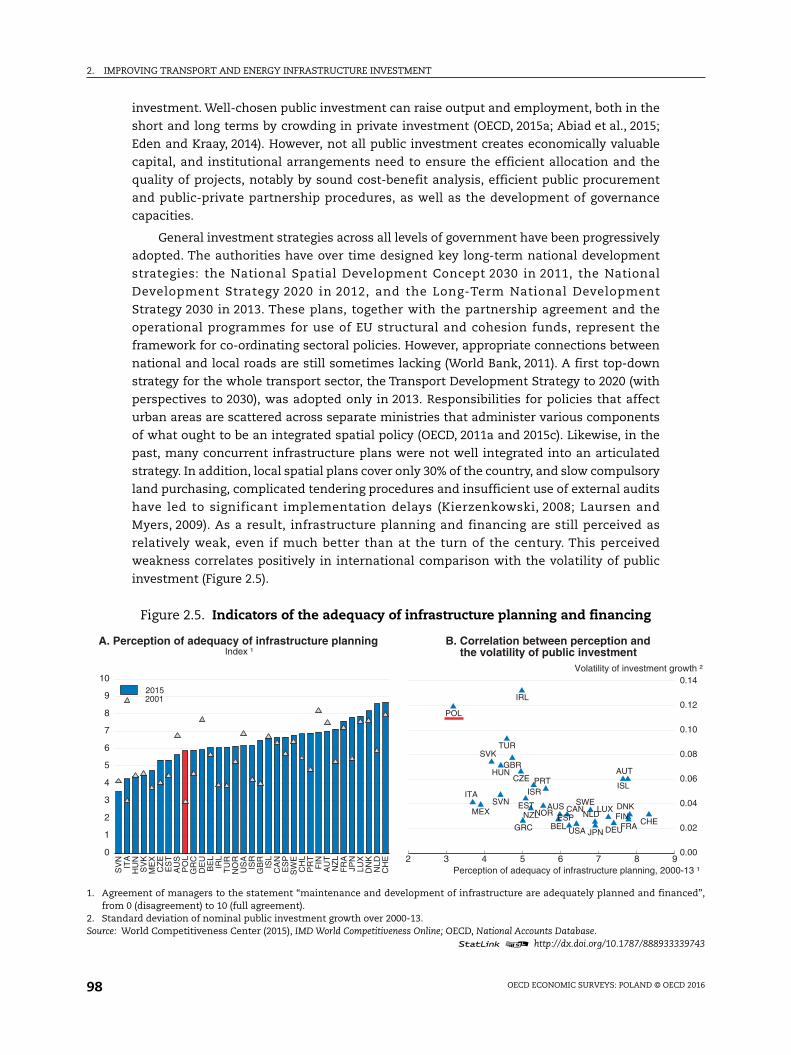
2. IMPROVING TRANSPORT AND ENERGY INFRASTRUCTURE INVESTMENT
OECD ECONOMIC SURVEYS: POLAND © OECD 201698
investment. Well-chosen public investment can raise output and employment, both in the
short and long terms by crowding in private investment (OECD, 2015a; Abiad et al., 2015;
Eden and Kraay, 2014). However, not all public investment creates economically valuable
capital, and institutional arrangements need to ensure the efficient allocation and the
quality of projects, notably by sound cost-benefit analysis, efficient public procurement
and public-private partnership procedures, as well as the development of governance
capacities.
General investment strategies across all levels of government have been progressively
adopted. The authorities have over time designed key long-term national development
strategies: the National Spatial Development Concept 2030 in 2011, the National
Development Strategy 2020 in 2012, and the Long-Term National Development
Strategy 2030 in 2013. These plans, together with the partnership agreement and the
operational programmes for use of EU structural and cohesion funds, represent the
framework for co-ordinating sectoral policies. However, appropriate connections between
national and local roads are still sometimes lacking (World Bank, 2011). A first top-down
strategy for the whole transport sector, the Transport Development Strategy to 2020 (with
perspectives to 2030), was adopted only in 2013. Responsibilities for policies that affect
urban areas are scattered across separate ministries that administer various components
of what ought to be an integrated spatial policy (OECD, 2011a and 2015c). Likewise, in the
past, many concurrent infrastructure plans were not well integrated into an articulated
strategy. In addition, local spatial plans cover only 30% of the country, and slow compulsory
land purchasing, complicated tendering procedures and insufficient use of external audits
have led to significant implementation delays (Kierzenkowski, 2008; Laursen and
Myers, 2009). As a result, infrastructure planning and financing are still perceived as
relatively weak, even if much better than at the turn of the century. This perceived
weakness correlates positively in international comparison with the volatility of public
investment (Figure 2.5).
Figure 2.5. Indicators of the adequacy of infrastructure planning and financing
1. Agreement of managers to the statement “maintenance and development of infrastructure are adequately planned and financed”,from 0 (disagreement) to 10 (full agreement).
2. Standard deviation of nominal public investment growth over 2000-13.Source: World Competitiveness Center (2015), IMD World Competitiveness Online; OECD, National Accounts Database.
1 2 http://dx.doi.org/10.1787/888933339743
0
1
2
3
4
5
6
7
8
9
10
SV
NIT
AH
UN
SV
KM
EX
CZ
EE
ST
AU
SP
OL
GR
CD
EU
BE
LIR
LT
UR
NO
RU
SA
ISR
GB
RIS
LC
AN
ES
PS
WE
CH
LP
RT
FIN
AU
TN
ZL
FR
AJP
NLU
XD
NK
NLD
CH
E
20012015
A. Perception of adequacy of infrastructure planningIndex ¹
2 3 4 5 6 7 8 90.00
0.02
0.04
0.06
0.08
0.10
0.12
0.14Volatility of investment growth ²
Perception of adequacy of infrastructure planning, 2000-13 ¹
AUS
AUT
BEL
CAN
CHE
CZE
DEU
DNKESP
ESTFIN
FRA
GBR
GRC
HUN
IRL
ISLISRITA
JPN
LUXMEX NLDNORNZL
POL
PRT
SVK
SVN SWE
TUR
USA
B. Correlation between perception andthe volatility of public investment

2. IMPROVING TRANSPORT AND ENERGY INFRASTRUCTURE INVESTMENT
OECD ECONOMIC SURVEYS: POLAND © OECD 2016 99
The government presented its medium-term plans for the road and rail sectors and a
draft energy strategy in 2013-15. The National Transport Strategy to 2020 (with
perspectives to 2030) presents the main goals of transport development. Its
implementation programme, adopted in 2014, presents the specific investments to be
carried over 2014-20, notably with the use of EU funds. While investments under the 2007-
13 EU financial perspective focused on roads, funding for the railway sector is set to
increase in 2014-20, notably urban transport projects to address congestion and
sustainability issues (Box 2.1). The current draft “Energy Policy of Poland until 2050” also
foresees partially replacing and complementing existing coal-fired power plants with high-
efficiency coal plants and a sharp increase in renewable energy sources supported by new
gas plants as both reserve capacity and a basis for co-generation with heat (Ministry of
Economy, 2015a). In addition, a first nuclear power plant is to be commissioned by 2030.
These represent steps in the right direction providing a comprehensive view of the
country’s infrastructure needs and how the government plans to satisfy them. However,
they would need regular updates, and improving coordination between ministries and
setting clear jurisdictions would also reduce policy uncertainty and could expedite
infrastructure investment, notably in the transport sector.
Ex ante and ex post cost-benefit analysis (CBA) should play a larger role in the
development of infrastructure strategies and the choice of specific projects. At the stage of
the feasibility studies, EU regulations require a CBA of all major investment projects
applying for assistance. However, several past strategies and policy documents in key areas
failed to include either a proper CBA or estimates of the cost of inaction. Only limited
studies of the impact of pollution on human health and on ecosystems have been carried
out and taken into account in prioritising policy responses (OECD, 2015b). Moreover, the
feasibility studies may have a limited impact on the choice of the final options to achieve
the project’s objectives. Therefore, beyond the feasibility studies, a more consistent use of
CBA could help identify projects with the largest social returns, facilitate prioritisation and
reduce fiscal risks. A central body could be in charge of securing uniform CBA, taking into
account environmental and health impacts and other policy objectives, by building up in-
house expertise, and mandatory independent counter-expertise could also be used for the
largest projects, as in France. In addition, standardised ex post evaluations for large
infrastructure projects should be required by national legislation so as to help identify best
practices and trade-offs between policy measures and improve cost efficiency
(Crozet, 2013; ITF, 2014).
The coordination of investment strategies across all levels of government is
improving. Sub-central governments were responsible for about half of total public
investment in 2014, above the OECD average and other Central and Eastern European
countries. For example, local governments owned more than 95 % of road infrastructure
in 2013 (Ministry of Infrastructure and Development, 2015a). The lack of co-ordination
between the various levels of government, and between jurisdictions at the same level, has
been a source of inefficiency. Polish legislation includes voluntary mechanisms for inter-
municipal collaboration; however, there are no specific financial incentives to encourage it.
Around 60% of municipalities are engaged in some kind of inter-municipal collaboration,
but integrated urban planning is underdeveloped (OECD, 2011a). The outcomes of some
environmental projects have been undermined by their geographic dispersion and the lack
of clear delimitation of functional areas served by the infrastructure (European
Commission, 2012). A welcome recent law foresees the creation of metropolitan
2. IMPROVING TRANSPORT AND ENERGY INFRASTRUCTURE INVESTMENT
OECD ECONOMIC SURVEYS: POLAND © OECD 2016100
governance associations in 2016, notably for transport and spatial planning, but these will
remain voluntary. In addition, under the 2014-20 EU perspective, new ex ante
conditionality mechanisms could ensure better coordination. Indeed, the new perspective
focuses on the integrated management of urban areas and their linkages with their rural
counterparts, irrespective of administrative boundaries, while urban and transport
developments used to be separate objectives.
The decentralisation of the allocation of EU funds over 2014-20 will give a more
prominent role to local governments in infrastructure investment, and there will be a need
to increase their accountability and resources, as local tax autonomy remains limited
(Blöchliger and Nettley, 2015). Decentralisation of competences in infrastructure
management has not been followed by comparable fiscal decentralisation to Poland’s 16
regions, 380 counties and 2 478 municipalities (OECD, 2013a). Specifically, regional and
local governments depend on central government transfers to implement infrastructure
and maintenance work not supported by EU funding, since they have a limited right to
impose taxes and levies. Moreover, the general grant system does not fully take into
account the high costs of public services for core cities compared to suburban areas, due to
high wages and land prices and the concentration of public services at the core of most
metropolitan areas (OECD, 2011a). In the 2014-20 EU funds allocation, transfers from the
central government to local municipalities will take into account alignment with the
national transport plan and the coordination of municipal policies within metropolitan
areas, but such mechanisms should be made permanent to match infrastructure finance
Box 2.1. Government transport programmes
The National Transport Strategy to 2020 (with perspectives to 2030) is the first global strategy for thetransport sector adopted in Poland. This document, published in 2013, aims to ensure coordinationbetween all transport modes and infrastructure projects. It sets the main goals and priorities for thetransport sector, including logistics and urban transport. It aims at improving transport accessibility, safetyand efficiency, and Poland’s international connections.
The implementation programme of this Strategy, adopted in 2014, specifies the priorities in the railway,road, maritime and inland waterways sectors to be reached in 2014-20 to ensure coordination betweentransport modes and infrastructure projects. It also sets criteria for project selection in the use of EU funds.
Besides the use of EU funds, the Strategy and its implementation programme also determine all thesectoral transport programmes, notably for roads and railways. The financing of these two programmesinvolves the state budget, the national road and railway funds (Box 2.2) and public-private partnerships.The authorities adopted two documents that set out investment priorities in September 2015:
● The 2014-23 National Road Construction Programme (with a view to 2025) foresees new infrastructureinvestment, notably the construction of 35 ring roads, for a total amount of PLN 107 billion (6.2% of 2014GDP), maintenance expenditures and land acquisitions worth PLN 46.8 billion (2.7% of 2014 GDP) androad safety measures (PLN 4.8 billion, 0.3% of 2014 GDP). This includes the carry-over of some expensesfrom the current 2011-15 National Roads Construction Programme for PLN 14.5 billion (0.8% of 2014 GDP).
● The 2014-23 National Railway Programme assumes that PLN 67.5 billion (3.9% of 2014 GDP) will be spenton railway infrastructure by 2023. It is expected that the projects to be carried out as part of theprogramme will reduce the time needed to travel between the main cities in Poland, establish rail as analternative to road and air transport, improve accessibility for some regions and strengthen the existingconnections between regions.
2. IMPROVING TRANSPORT AND ENERGY INFRASTRUCTURE INVESTMENT
OECD ECONOMIC SURVEYS: POLAND © OECD 2016 101
and future maintenance costs. The introduction of metropolitan fiscal equalisation
schemes could also help to better account for cost variation among municipalities.
Municipalities have far-reaching responsibilities for setting their own development
policies. They design areas for certain purposes through legally binding local land-use
plans. However, the quality of land administration appears relatively low
(Figure 2.6, Panel A). The digitalisation of plans, the availability of information and the ease
of land dispute resolution appear to lag behind most OECD countries (World Bank, 2015).
Moreover, around 70% of the municipal territory lacks local spatial plans (Ministry of
Regional Development, 2012). In the absence of local plans, municipalities may grant
building permits based on administrative decisions that do not ensure coherence with
spatial plans. Residential developments on greenfield sites have to fulfil certain minimal
conditions: a neighbouring plot has to be developed with housing, and there also has to be
access to a public road. This does not ensure coherence with spatial planning and tends to
favour housing developments along public roads (Halleux et al., 2012; Krajewska
et al., 2014). Indeed, urban sprawl has expanded rapidly (Panel B; Veneri 2015), and most
metropolitan areas in Poland have experienced decreasing population density in the urban
core along with increasing density in the suburbs (Panel C). An envisaged reform of spatial
planning would impose much stricter conditions regarding connection to infrastructure to
grant building permits on land without local spatial plans, while investors would be
allowed to develop infrastructure for the municipality to comply with conditions for
planning permission. It would also reduce the scale and scope of compensation
municipalities have to pay to owners when they restrict the use of their land to create or
update local spatial plans. This reform would support the development of local spatial
plans and should be implemented swiftly. If it proves insufficient, the release and
integration of municipal spatial plans with other local economic development plans and
metropolitan strategies should be made mandatory in order to improve coordination
among the different stakeholders.
Regulations for project approvals could be streamlined for specific infrastructure
projects. The application procedures for building permits and land ownership transfers are
slightly lengthier than in the average OECD country (Figure 2.6, Panel D). For a typical
warehouse, obtaining a permit requires 16 procedures, takes 156 days and costs 0.3% of the
construction value (World Bank, 2015). But procedures are much more cumbersome than in
other European countries for windfarms (EWEA, 2010). Before the recent election there was
a draft law before the parliament reforming spatial planning regulations. The
parliamentary approval process of this reform needs to be resumed swiftly. This, together
with foreseen amendments to the construction law, would improve the investment
process; however, progress remains limited so far (European Commission, 2015c). In
addition, large infrastructure projects need further authorisations. For example, various
levels of government have been in charge of environmental impact assessments (EIAs)
since the 1980s, depending on project size (OECD, 2015b). However, limited public
participation and lack of trust among stakeholders contribute to frustration with EIA
procedures by the administration, investors and the public. The national court of auditors
has stated that, in several cases, notably for road and renewable energy projects,
stakeholder views were ignored (NIK, 2014a). Better integrating public consultations into
the elaboration of regulations and promoting in-depth evaluation of regulations in specific
sectors would help improve the regulatory framework (OECD, 2015d). Improving the
national anticorruption framework (see below) would also be crucial in limiting conflicts of
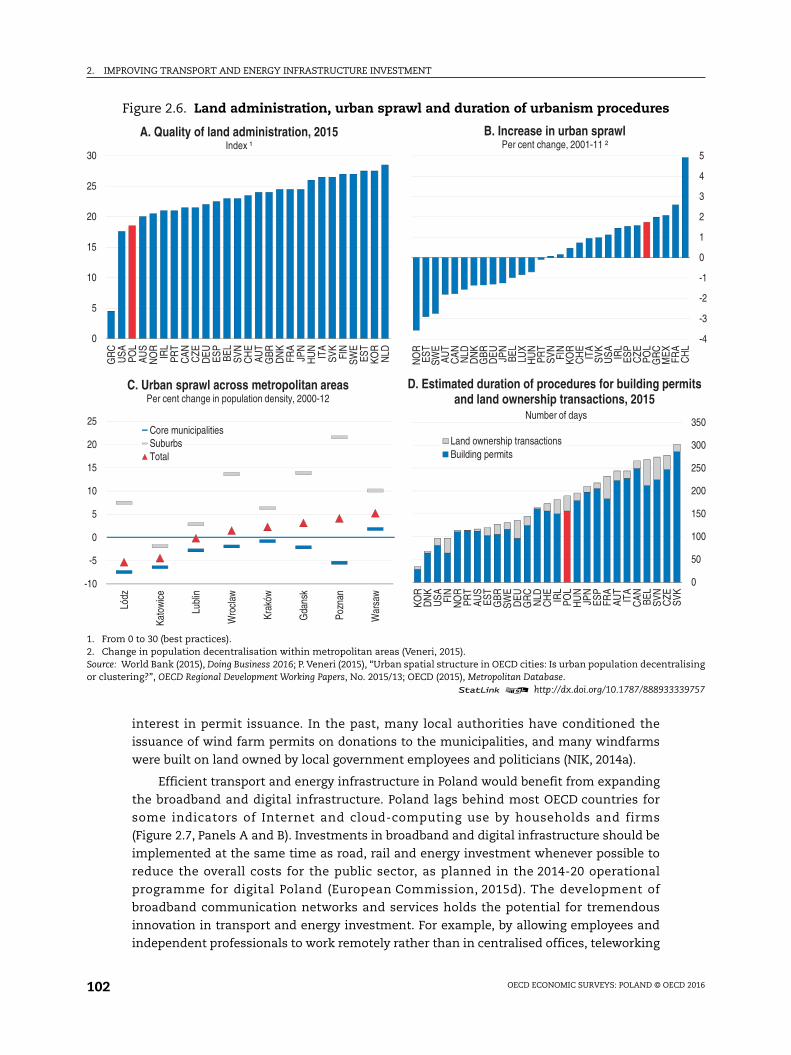
2. IMPROVING TRANSPORT AND ENERGY INFRASTRUCTURE INVESTMENT
OECD ECONOMIC SURVEYS: POLAND © OECD 2016102
interest in permit issuance. In the past, many local authorities have conditioned the
issuance of wind farm permits on donations to the municipalities, and many windfarms
were built on land owned by local government employees and politicians (NIK, 2014a).
Efficient transport and energy infrastructure in Poland would benefit from expanding
the broadband and digital infrastructure. Poland lags behind most OECD countries for
some indicators of Internet and cloud-computing use by households and firms
(Figure 2.7, Panels A and B). Investments in broadband and digital infrastructure should be
implemented at the same time as road, rail and energy investment whenever possible to
reduce the overall costs for the public sector, as planned in the 2014-20 operational
programme for digital Poland (European Commission, 2015d). The development of
broadband communication networks and services holds the potential for tremendous
innovation in transport and energy investment. For example, by allowing employees and
independent professionals to work remotely rather than in centralised offices, teleworking
Figure 2.6. Land administration, urban sprawl and duration of urbanism procedures
1. From 0 to 30 (best practices).2. Change in population decentralisation within metropolitan areas (Veneri, 2015).Source: World Bank (2015), Doing Business 2016; P. Veneri (2015), “Urban spatial structure in OECD cities: Is urban population decentralisingor clustering?”, OECD Regional Development Working Papers, No. 2015/13; OECD (2015), Metropolitan Database.
1 2 http://dx.doi.org/10.1787/888933339757
0
5
10
15
20
25
30
GR
CU
SA POL
AUS
NO
RIR
LPR
TC
AN CZE
DEU ES
PBE
LSV
NC
HE
AUT
GBR
DN
KFR
AJP
NH
UN
ITA
SVK
FIN
SWE
EST
KOR
NLD
A. Quality of land administration, 2015Index ¹
-4
-3
-2
-1
0
1
2
3
4
5
NO
RES
TSW
EAU
TC
AN NLD
DN
KG
BRD
EU JPN
BEL
LUX
HU
NPR
TSV
NFI
NKO
RC
HE
ITA
SVK
USA IR
LES
PC
ZEPO
LG
RC
MEX FR
AC
HL
B. Increase in urban sprawlPer cent change, 2001-11 ²
-10
-5
0
5
10
15
20
25
Lódz
Kato
wic
e
Lubl
in
Wro
claw
Krak
ów
Gda
nsk
Pozn
an
War
saw
Core municipalitiesSuburbsTotal
C. Urban sprawl across metropolitan areasPer cent change in population density, 2000-12
0
50
100
150
200
250
300
350KO
RD
NK
USA FI
NN
OR
PRT
AUS
EST
GBR
SWE
DEU
GR
CN
LDC
HE
IRL
POL
HU
NJP
NES
PFR
AAU
TIT
AC
AN BEL
SVN
CZE
SVK
Land ownership transactionsBuilding permits
D. Estimated duration of procedures for building permits and land ownership transactions, 2015
Number of days
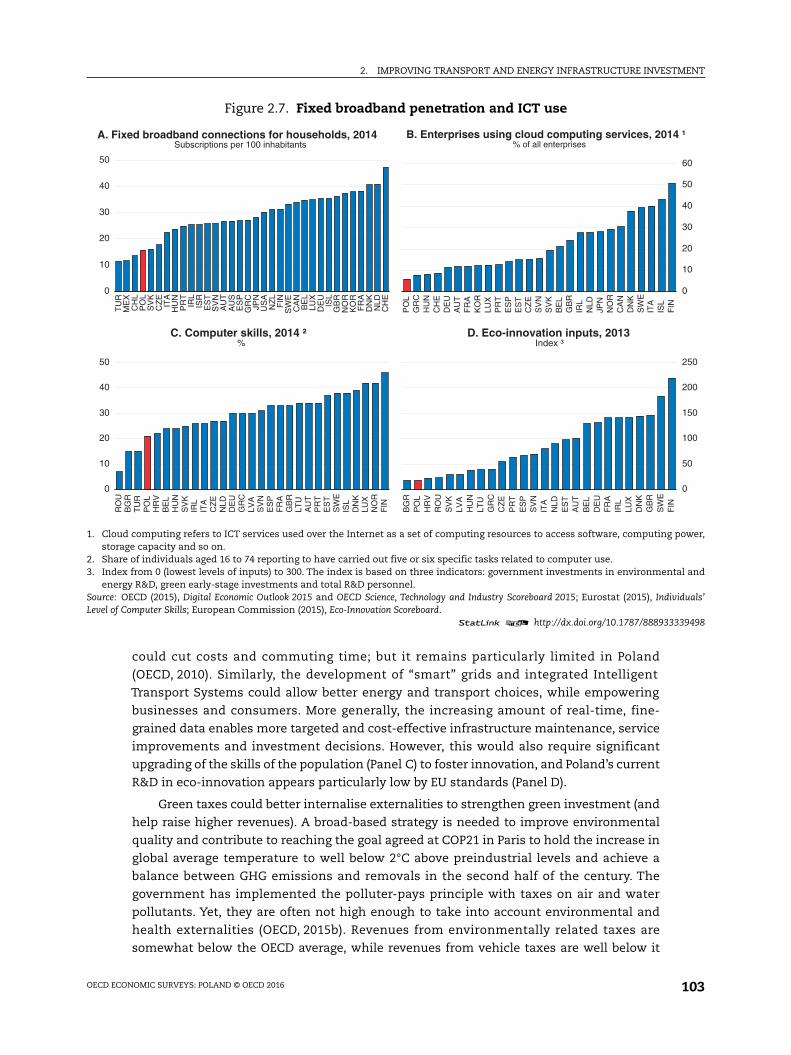
2. IMPROVING TRANSPORT AND ENERGY INFRASTRUCTURE INVESTMENT
OECD ECONOMIC SURVEYS: POLAND © OECD 2016 103
could cut costs and commuting time; but it remains particularly limited in Poland
(OECD, 2010). Similarly, the development of “smart” grids and integrated Intelligent
Transport Systems could allow better energy and transport choices, while empowering
businesses and consumers. More generally, the increasing amount of real-time, fine-
grained data enables more targeted and cost-effective infrastructure maintenance, service
improvements and investment decisions. However, this would also require significant
upgrading of the skills of the population (Panel C) to foster innovation, and Poland’s current
R&D in eco-innovation appears particularly low by EU standards (Panel D).
Green taxes could better internalise externalities to strengthen green investment (and
help raise higher revenues). A broad-based strategy is needed to improve environmental
quality and contribute to reaching the goal agreed at COP21 in Paris to hold the increase in
global average temperature to well below 2°C above preindustrial levels and achieve a
balance between GHG emissions and removals in the second half of the century. The
government has implemented the polluter-pays principle with taxes on air and water
pollutants. Yet, they are often not high enough to take into account environmental and
health externalities (OECD, 2015b). Revenues from environmentally related taxes are
somewhat below the OECD average, while revenues from vehicle taxes are well below it
Figure 2.7. Fixed broadband penetration and ICT use
1. Cloud computing refers to ICT services used over the Internet as a set of computing resources to access software, computing power,storage capacity and so on.
2. Share of individuals aged 16 to 74 reporting to have carried out five or six specific tasks related to computer use.3. Index from 0 (lowest levels of inputs) to 300. The index is based on three indicators: government investments in environmental and
energy R&D, green early-stage investments and total R&D personnel.Source: OECD (2015), Digital Economic Outlook 2015 and OECD Science, Technology and Industry Scoreboard 2015; Eurostat (2015), Individuals’Level of Computer Skills; European Commission (2015), Eco-Innovation Scoreboard.
1 2 http://dx.doi.org/10.1787/888933339498
0
10
20
30
40
50
TU
RM
EX
CH
LP
OL
SV
KC
ZE
ITA
HU
NP
RT
IRL
ISR
ES
TS
VN
AU
TA
US
ES
PG
RC
JPN
US
AN
ZL
FIN
SW
EC
AN
BE
LLU
XD
EU
ISL
GB
RN
OR
KO
RF
RA
DN
KN
LDC
HE
A. Fixed broadband connections for households, 2014Subscriptions per 100 inhabitants
0
10
20
30
40
50
60
PO
LG
RC
HU
NC
HE
DE
UA
UT
FR
AK
OR
LUX
PR
TE
SP
ES
TC
ZE
SV
NS
VK
BE
LG
BR
IRL
NLD
JPN
NO
RC
AN
DN
KS
WE
ITA
ISL
FIN
B. Enterprises using cloud computing services, 2014 ¹% of all enterprises
0
10
20
30
40
50
RO
UB
GR
TU
RP
OL
HR
VB
EL
HU
NS
VK
IRL
ITA
CZ
EN
LDD
EU
GR
CLV
AS
VN
ES
PF
RA
GB
RLT
UA
UT
PR
TE
ST
SW
EIS
LD
NK
LUX
NO
RF
IN
C. Computer skills, 2014 ² %
0
50
100
150
200
250
BG
RP
OL
HR
VR
OU
SV
KLV
AH
UN
LTU
GR
CC
ZE
PR
TE
SP
SV
NIT
AN
LDE
ST
AU
TB
EL
DE
UF
RA
IRL
LUX
DN
KG
BR
SW
EF
IN
D. Eco-innovation inputs, 2013Index ³
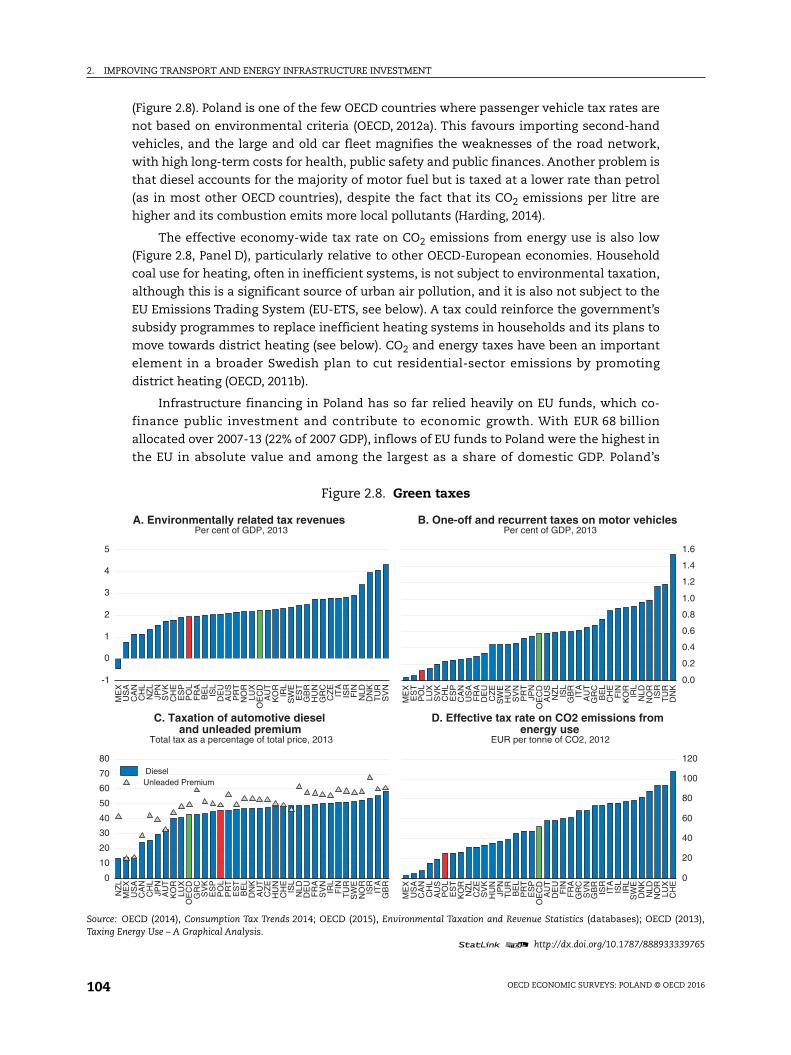
2. IMPROVING TRANSPORT AND ENERGY INFRASTRUCTURE INVESTMENT
OECD ECONOMIC SURVEYS: POLAND © OECD 2016104
(Figure 2.8). Poland is one of the few OECD countries where passenger vehicle tax rates are
not based on environmental criteria (OECD, 2012a). This favours importing second-hand
vehicles, and the large and old car fleet magnifies the weaknesses of the road network,
with high long-term costs for health, public safety and public finances. Another problem is
that diesel accounts for the majority of motor fuel but is taxed at a lower rate than petrol
(as in most other OECD countries), despite the fact that its CO2 emissions per litre are
higher and its combustion emits more local pollutants (Harding, 2014).
The effective economy-wide tax rate on CO2 emissions from energy use is also low
(Figure 2.8, Panel D), particularly relative to other OECD-European economies. Household
coal use for heating, often in inefficient systems, is not subject to environmental taxation,
although this is a significant source of urban air pollution, and it is also not subject to the
EU Emissions Trading System (EU-ETS, see below). A tax could reinforce the government’s
subsidy programmes to replace inefficient heating systems in households and its plans to
move towards district heating (see below). CO2 and energy taxes have been an important
element in a broader Swedish plan to cut residential-sector emissions by promoting
district heating (OECD, 2011b).
Infrastructure financing in Poland has so far relied heavily on EU funds, which co-
finance public investment and contribute to economic growth. With EUR 68 billion
allocated over 2007-13 (22% of 2007 GDP), inflows of EU funds to Poland were the highest in
the EU in absolute value and among the largest as a share of domestic GDP. Poland’s
Figure 2.8. Green taxes
Source: OECD (2014), Consumption Tax Trends 2014; OECD (2015), Environmental Taxation and Revenue Statistics (databases); OECD (2013),Taxing Energy Use – A Graphical Analysis.
1 2 http://dx.doi.org/10.1787/888933339765
-1
0
1
2
3
4
5
ME
XU
SA
CA
NC
HL
NZ
LJP
NS
VK
CH
EE
SP
PO
LF
RA
BE
LIS
LD
EU
AU
SP
RT
NO
RLU
XO
EC
DA
UT
KO
RIR
LS
WE
ES
TG
BR
HU
NG
RC
CZ
EIT
AIS
RF
INN
LDD
NK
TU
RS
VN
A. Environmentally related tax revenuesPer cent of GDP, 2013
0.0
0.2
0.4
0.6
0.8
1.0
1.2
1.4
1.6
ME
XE
ST
PO
LLU
XS
VK
CH
LE
SP
CA
NU
SA
FR
AD
EU
CZ
ES
WE
HU
NS
VN
PR
TJP
NO
EC
DA
US
NZ
LIS
LG
BR
ITA
AU
TG
RC
BE
LC
HE
FIN
KO
RIR
LN
LDN
OR
ISR
TU
RD
NK
B. One-off and recurrent taxes on motor vehiclesPer cent of GDP, 2013
0
10
20
30
40
50
60
70
80
NZ
LM
EX
US
AC
AN
CH
LJP
NA
UT
KO
RLU
XO
EC
DG
RC
SV
KE
SP
PO
LP
RT
ES
TB
EL
DN
KA
UT
CZ
EH
UN
CH
EIS
LN
LDD
EU
FR
AS
VN
IRL
FIN
TU
RS
WE
NO
RIS
RIT
AG
BR
Unleaded PremiumDiesel
C. Taxation of automotive dieseland unleaded premium
Total tax as a percentage of total price, 2013
0
20
40
60
80
100
120
ME
XU
SA
CA
NC
HL
AU
SP
OL
ES
TK
OR
NZ
LC
ZE
SV
KH
UN
JPN
TU
RB
EL
PR
TE
SP
OE
CD
AU
TD
EU
FIN
FR
AG
RC
SV
NG
BR
ISR
ITA
ISL
IRL
SW
ED
NK
NLD
NO
RLU
XC
HE
D. Effective tax rate on CO2 emissions fromenergy use
EUR per tonne of CO2, 2012
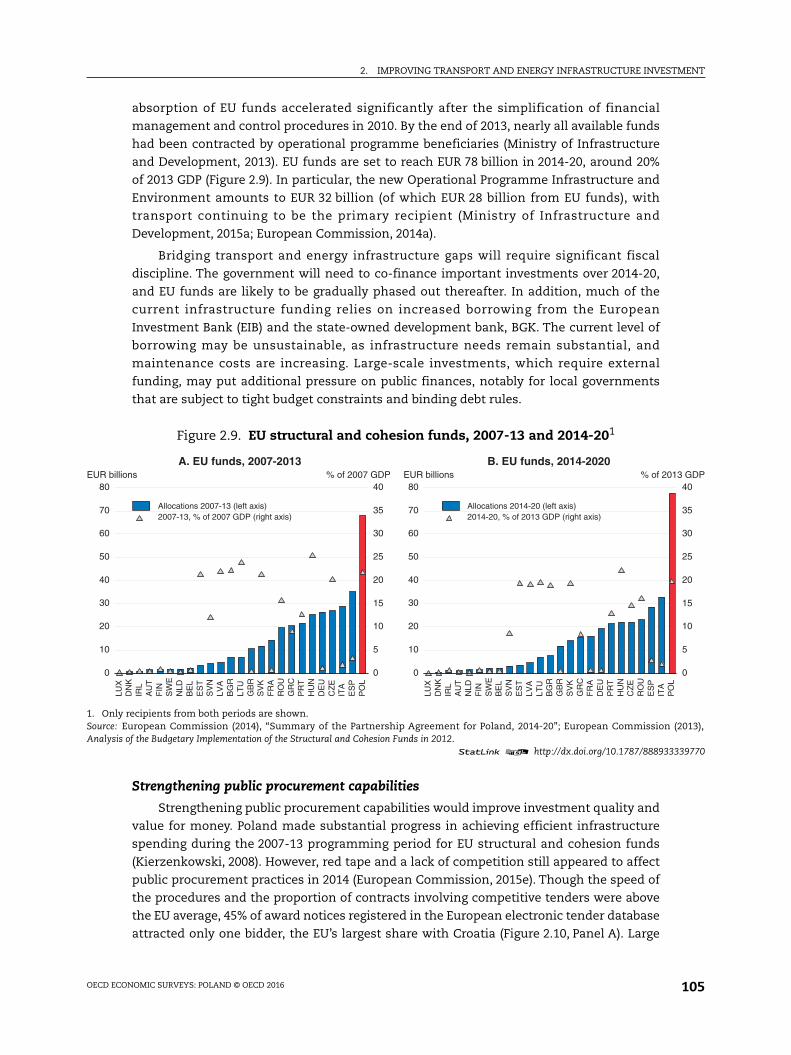
2. IMPROVING TRANSPORT AND ENERGY INFRASTRUCTURE INVESTMENT
OECD ECONOMIC SURVEYS: POLAND © OECD 2016 105
absorption of EU funds accelerated significantly after the simplification of financial
management and control procedures in 2010. By the end of 2013, nearly all available funds
had been contracted by operational programme beneficiaries (Ministry of Infrastructure
and Development, 2013). EU funds are set to reach EUR 78 billion in 2014-20, around 20%
of 2013 GDP (Figure 2.9). In particular, the new Operational Programme Infrastructure and
Environment amounts to EUR 32 billion (of which EUR 28 billion from EU funds), with
transport continuing to be the primary recipient (Ministry of Infrastructure and
Development, 2015a; European Commission, 2014a).
Bridging transport and energy infrastructure gaps will require significant fiscal
discipline. The government will need to co-finance important investments over 2014-20,
and EU funds are likely to be gradually phased out thereafter. In addition, much of the
current infrastructure funding relies on increased borrowing from the European
Investment Bank (EIB) and the state-owned development bank, BGK. The current level of
borrowing may be unsustainable, as infrastructure needs remain substantial, and
maintenance costs are increasing. Large-scale investments, which require external
funding, may put additional pressure on public finances, notably for local governments
that are subject to tight budget constraints and binding debt rules.
Strengthening public procurement capabilities
Strengthening public procurement capabilities would improve investment quality and
value for money. Poland made substantial progress in achieving efficient infrastructure
spending during the 2007-13 programming period for EU structural and cohesion funds
(Kierzenkowski, 2008). However, red tape and a lack of competition still appeared to affect
public procurement practices in 2014 (European Commission, 2015e). Though the speed of
the procedures and the proportion of contracts involving competitive tenders were above
the EU average, 45% of award notices registered in the European electronic tender database
attracted only one bidder, the EU’s largest share with Croatia (Figure 2.10, Panel A). Large
Figure 2.9. EU structural and cohesion funds, 2007-13 and 2014-201
1. Only recipients from both periods are shown.Source: European Commission (2014), “Summary of the Partnership Agreement for Poland, 2014-20”; European Commission (2013),Analysis of the Budgetary Implementation of the Structural and Cohesion Funds in 2012.
1 2 http://dx.doi.org/10.1787/888933339770
0
10
20
30
40
50
60
70
80EUR billions
0
5
10
15
20
25
30
35
40% of 2007 GDP
LUX
DN
KIR
LA
UT
FIN
SW
EN
LDB
EL
ES
TS
VN
LVA
BG
RLT
UG
BR
SV
KF
RA
RO
UG
RC
PR
TH
UN
DE
UC
ZE
ITA
ES
PP
OL
2007-13, % of 2007 GDP (right axis)Allocations 2007-13 (left axis)
A. EU funds, 2007-2013
0
10
20
30
40
50
60
70
80 EUR billions
0
5
10
15
20
25
30
35
40% of 2013 GDP
LUX
DN
KIR
LA
UT
NLD
FIN
SW
EB
EL
SV
NE
ST
LVA
LTU
BG
RG
BR
SV
KG
RC
FR
AD
EU
PR
TH
UN
CZ
ER
OU
ES
PIT
AP
OL
2014-20, % of 2013 GDP (right axis)Allocations 2014-20 (left axis)
B. EU funds, 2014-2020
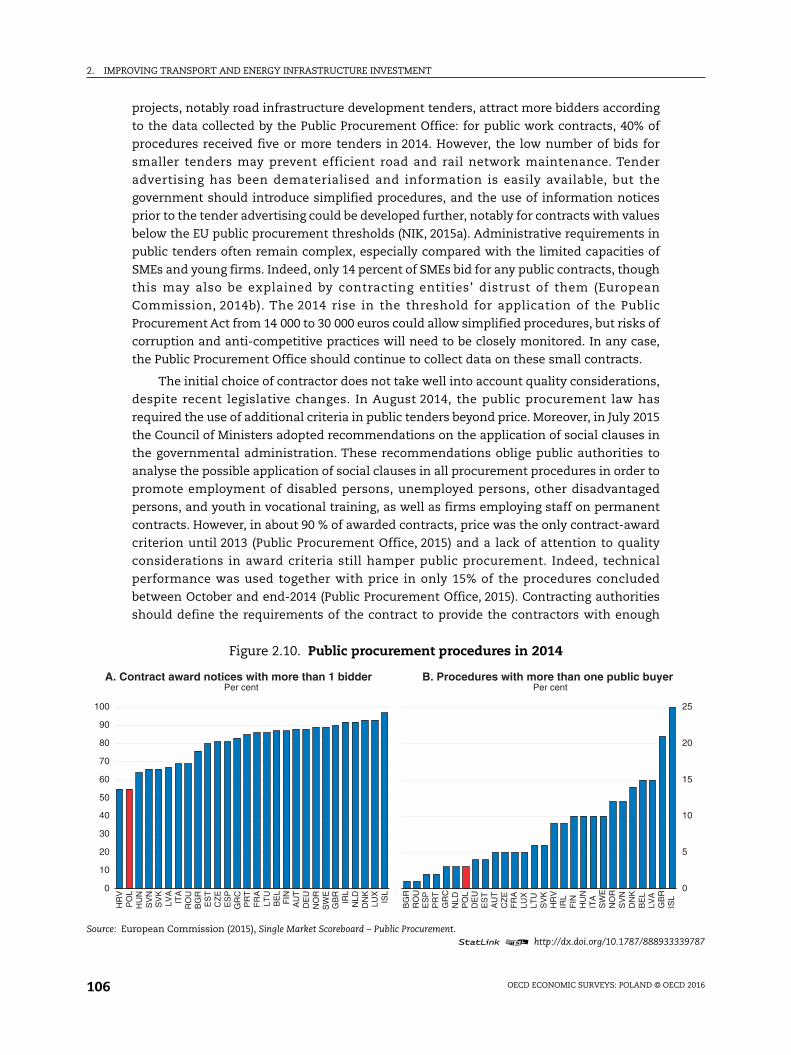
2. IMPROVING TRANSPORT AND ENERGY INFRASTRUCTURE INVESTMENT
OECD ECONOMIC SURVEYS: POLAND © OECD 2016106
projects, notably road infrastructure development tenders, attract more bidders according
to the data collected by the Public Procurement Office: for public work contracts, 40% of
procedures received five or more tenders in 2014. However, the low number of bids for
smaller tenders may prevent efficient road and rail network maintenance. Tender
advertising has been dematerialised and information is easily available, but the
government should introduce simplified procedures, and the use of information notices
prior to the tender advertising could be developed further, notably for contracts with values
below the EU public procurement thresholds (NIK, 2015a). Administrative requirements in
public tenders often remain complex, especially compared with the limited capacities of
SMEs and young firms. Indeed, only 14 percent of SMEs bid for any public contracts, though
this may also be explained by contracting entities’ distrust of them (European
Commission, 2014b). The 2014 rise in the threshold for application of the Public
Procurement Act from 14 000 to 30 000 euros could allow simplified procedures, but risks of
corruption and anti-competitive practices will need to be closely monitored. In any case,
the Public Procurement Office should continue to collect data on these small contracts.
The initial choice of contractor does not take well into account quality considerations,
despite recent legislative changes. In August 2014, the public procurement law has
required the use of additional criteria in public tenders beyond price. Moreover, in July 2015
the Council of Ministers adopted recommendations on the application of social clauses in
the governmental administration. These recommendations oblige public authorities to
analyse the possible application of social clauses in all procurement procedures in order to
promote employment of disabled persons, unemployed persons, other disadvantaged
persons, and youth in vocational training, as well as firms employing staff on permanent
contracts. However, in about 90 % of awarded contracts, price was the only contract-award
criterion until 2013 (Public Procurement Office, 2015) and a lack of attention to quality
considerations in award criteria still hamper public procurement. Indeed, technical
performance was used together with price in only 15% of the procedures concluded
between October and end-2014 (Public Procurement Office, 2015). Contracting authorities
should define the requirements of the contract to provide the contractors with enough
Figure 2.10. Public procurement procedures in 2014
Source: European Commission (2015), Single Market Scoreboard – Public Procurement.1 2 http://dx.doi.org/10.1787/888933339787
0
10
20
30
40
50
60
70
80
90
100
HR
VP
OL
HU
NS
VN
SV
KLV
AIT
AR
OU
BG
RE
ST
CZ
EE
SP
GR
CP
RT
FR
ALT
UB
EL
FIN
AU
TD
EU
NO
RS
WE
GB
RIR
LN
LDD
NK
LUX
ISL
A. Contract award notices with more than 1 bidderPer cent
0
5
10
15
20
25
BG
RR
OU
ES
PP
RT
GR
CN
LDP
OL
DE
UE
ST
AU
TC
ZE
FR
ALU
XLT
US
VK
HR
VIR
LF
INH
UN
ITA
SW
EN
OR
SV
ND
NK
BE
LLV
AG
BR
ISL
B. Procedures with more than one public buyerPer cent
2. IMPROVING TRANSPORT AND ENERGY INFRASTRUCTURE INVESTMENT
OECD ECONOMIC SURVEYS: POLAND © OECD 2016 107
freedom to propose different technical solutions and use quality criteria to assess the
different tenders. In particular, for complicated projects, such as new infrastructure,
technical details, methodologies, execution and organisation should be more
systematically taken into account both in contract specifications and bid assessment, in
addition to timing, guarantees and references that are frequently assessed by contracting
authorities. Environmental impact should also be explicitly considered (OECD, 2014a). The
insufficient use of technical performance criteria and excessive emphasis on the lowest
price could lower quality and increase the risks of leaving projects unfinished if contractors
go bankrupt. A well-known example is COVEC, a Chinese company, which was supposed to
build a stretch of the A2 highway but pulled out because the final costs would have been
twice the amount of its initial bid. In addition, international evidence found that favouring
low prices at the awarding stages may induce larger ex post renegotiation if the initial
commitments are not binding (Decarolis, 2014). Though not often used, competitive
dialogues should be developed, as they could help civil servants appreciate crucial
technical details for large infrastructure projects. In this context, the recent introduction by
the railway infrastructure manager (PKP PLK) of a two-stage system, in which contractors
will be vetted at the outset for production and financial potential, is welcome.
Ensuring an efficient application of public procurement procedures would require
additional central government assistance for local governments and developing joint
purchasing offices, as procedures combining several public buyers are relatively infrequent
(Figure 2.10, Panel B). Many local governments lack in-house capacity, and sometimes the
financial resources, to conduct procedures and hire external advisors. Indeed, numerous
irregularities have been found in local roadbuilding projects (NIK, 2014b), and, as in other
OECD countries, the market concentration of the construction sector makes it fertile
ground for bid-rigging, notably for large projects. A first step would be to introduce
additional central government technical assistance through expertise and upfront
resources for the preparation of large projects. For example, a dedicated central
preparation facility could reap economies of scale as local governments cannot all develop
skills to deal with infrastructure projects. It could also help local government in organising
financing (EIB, 2014) and would avoid potential conflicts of interest when hiring external
experts. More generally, 16 106 Polish institutions held public tenders in 2014 (Public
Procurement Office, 2015), and developing central purchasing offices, boosting cooperation
between municipalities through an integrated e-government system, and enhancing staff
skills to deal with complex selection criteria would help ensure more efficient practices. It
is encouraging that the establishment of a central purchasing group in the railway
company PKP at the end of 2012 led to significant savings. The announced introduction of
mandatory e-submissions for public tenders in 2016 is an opportunity to increase
cooperation across local governments, as current e-government procedures remain
fragmented and lack common standards (European Commission, 2015c). A comprehensive
e-procurement strategy, as recommended by OECD (2014d), to encourage the transition to
e-procurement and to co-ordinate its implementation would save money, improve
transparency, reduce delays and increase competition. The authorities acknowledge this
and plan to introduce better coordination through the 2014 National Integrated
Informatisation Programme (PZIP).
Improving the judicial review of public procurement disputes and appeals and
strengthening ex post monitoring capacities would increase the effectiveness of
procurement practices. In particular, equal treatment of different appeals by the national
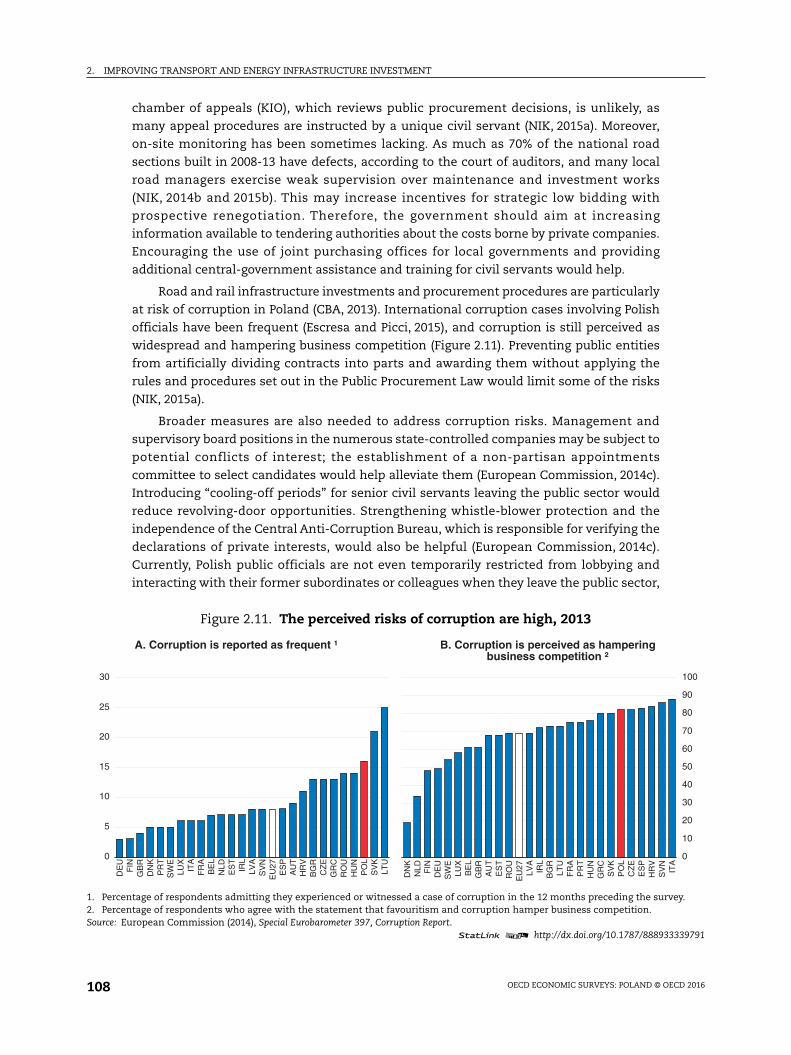
2. IMPROVING TRANSPORT AND ENERGY INFRASTRUCTURE INVESTMENT
OECD ECONOMIC SURVEYS: POLAND © OECD 2016108
chamber of appeals (KIO), which reviews public procurement decisions, is unlikely, as
many appeal procedures are instructed by a unique civil servant (NIK, 2015a). Moreover,
on-site monitoring has been sometimes lacking. As much as 70% of the national road
sections built in 2008-13 have defects, according to the court of auditors, and many local
road managers exercise weak supervision over maintenance and investment works
(NIK, 2014b and 2015b). This may increase incentives for strategic low bidding with
prospective renegotiation. Therefore, the government should aim at increasing
information available to tendering authorities about the costs borne by private companies.
Encouraging the use of joint purchasing offices for local governments and providing
additional central-government assistance and training for civil servants would help.
Road and rail infrastructure investments and procurement procedures are particularly
at risk of corruption in Poland (CBA, 2013). International corruption cases involving Polish
officials have been frequent (Escresa and Picci, 2015), and corruption is still perceived as
widespread and hampering business competition (Figure 2.11). Preventing public entities
from artificially dividing contracts into parts and awarding them without applying the
rules and procedures set out in the Public Procurement Law would limit some of the risks
(NIK, 2015a).
Broader measures are also needed to address corruption risks. Management and
supervisory board positions in the numerous state-controlled companies may be subject to
potential conflicts of interest; the establishment of a non-partisan appointments
committee to select candidates would help alleviate them (European Commission, 2014c).
Introducing “cooling-off periods” for senior civil servants leaving the public sector would
reduce revolving-door opportunities. Strengthening whistle-blower protection and the
independence of the Central Anti-Corruption Bureau, which is responsible for verifying the
declarations of private interests, would also be helpful (European Commission, 2014c).
Currently, Polish public officials are not even temporarily restricted from lobbying and
interacting with their former subordinates or colleagues when they leave the public sector,
Figure 2.11. The perceived risks of corruption are high, 2013
1. Percentage of respondents admitting they experienced or witnessed a case of corruption in the 12 months preceding the survey.2. Percentage of respondents who agree with the statement that favouritism and corruption hamper business competition.Source: European Commission (2014), Special Eurobarometer 397, Corruption Report.
1 2 http://dx.doi.org/10.1787/888933339791
0
5
10
15
20
25
30
DE
UF
ING
BR
DN
KP
RT
SW
ELU
XIT
AF
RA
BE
LN
LDE
ST
IRL
LVA
SV
NE
U27
ES
PA
UT
HR
VB
GR
CZ
EG
RC
RO
UH
UN
PO
LS
VK
LTU
A. Corruption is reported as frequent ¹
0
10
20
30
40
50
60
70
80
90
100
DN
KN
LD FIN
DE
US
WE
LUX
BE
LG
BR
AU
TE
ST
RO
UE
U27
LVA
IRL
BG
RLT
UF
RA
PR
TH
UN
GR
CS
VK
PO
LC
ZE
ES
PH
RV
SV
NIT
A
B. Corruption is perceived as hamperingbusiness competition ²
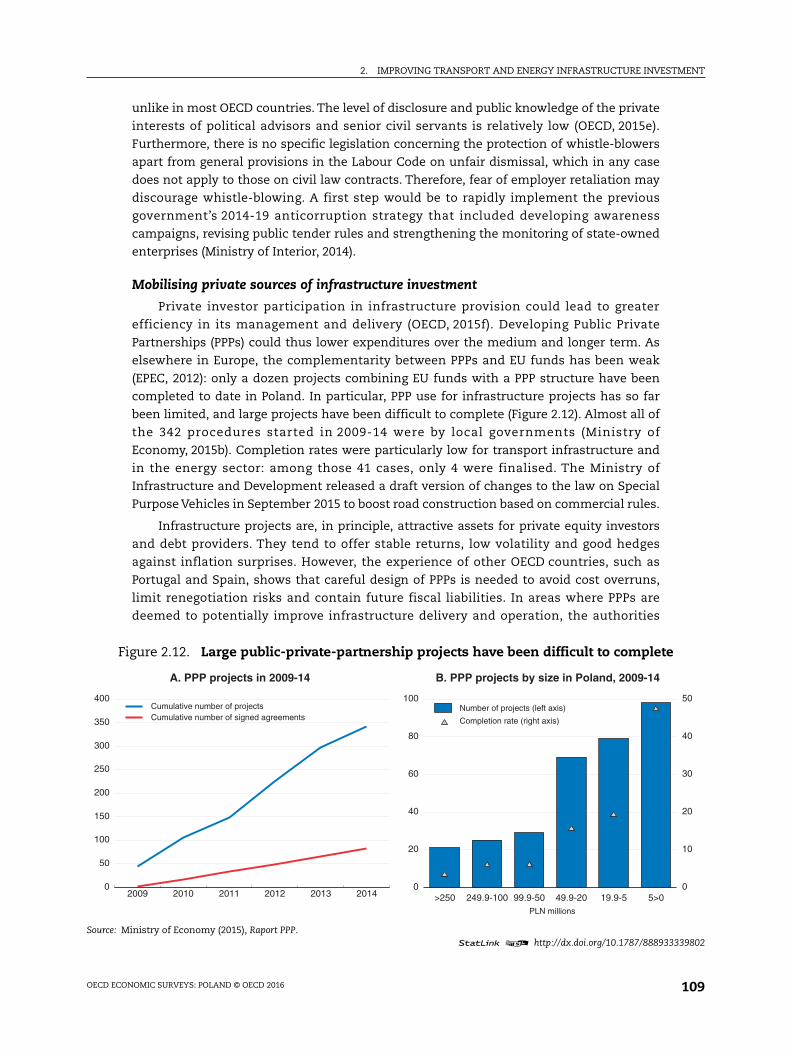
2. IMPROVING TRANSPORT AND ENERGY INFRASTRUCTURE INVESTMENT
OECD ECONOMIC SURVEYS: POLAND © OECD 2016 109
unlike in most OECD countries. The level of disclosure and public knowledge of the private
interests of political advisors and senior civil servants is relatively low (OECD, 2015e).
Furthermore, there is no specific legislation concerning the protection of whistle-blowers
apart from general provisions in the Labour Code on unfair dismissal, which in any case
does not apply to those on civil law contracts. Therefore, fear of employer retaliation may
discourage whistle-blowing. A first step would be to rapidly implement the previous
government’s 2014-19 anticorruption strategy that included developing awareness
campaigns, revising public tender rules and strengthening the monitoring of state-owned
enterprises (Ministry of Interior, 2014).
Mobilising private sources of infrastructure investment
Private investor participation in infrastructure provision could lead to greater
efficiency in its management and delivery (OECD, 2015f). Developing Public Private
Partnerships (PPPs) could thus lower expenditures over the medium and longer term. As
elsewhere in Europe, the complementarity between PPPs and EU funds has been weak
(EPEC, 2012): only a dozen projects combining EU funds with a PPP structure have been
completed to date in Poland. In particular, PPP use for infrastructure projects has so far
been limited, and large projects have been difficult to complete (Figure 2.12). Almost all of
the 342 procedures started in 2009-14 were by local governments (Ministry of
Economy, 2015b). Completion rates were particularly low for transport infrastructure and
in the energy sector: among those 41 cases, only 4 were finalised. The Ministry of
Infrastructure and Development released a draft version of changes to the law on Special
Purpose Vehicles in September 2015 to boost road construction based on commercial rules.
Infrastructure projects are, in principle, attractive assets for private equity investors
and debt providers. They tend to offer stable returns, low volatility and good hedges
against inflation surprises. However, the experience of other OECD countries, such as
Portugal and Spain, shows that careful design of PPPs is needed to avoid cost overruns,
limit renegotiation risks and contain future fiscal liabilities. In areas where PPPs are
deemed to potentially improve infrastructure delivery and operation, the authorities
Figure 2.12. Large public-private-partnership projects have been difficult to complete
Source: Ministry of Economy (2015), Raport PPP.1 2 http://dx.doi.org/10.1787/888933339802
2009 2010 2011 2012 2013 20140
50
100
150
200
250
300
350
400 Cumulative number of projectsCumulative number of signed agreements
A. PPP projects in 2009-14
0
20
40
60
80
100
0
10
20
30
40
50
>250 249.9-100 99.9-50 49.9-20 19.9-5 5>0
Completion rate (right axis)
PLN millions
Number of projects (left axis)
B. PPP projects by size in Poland, 2009-14
2. IMPROVING TRANSPORT AND ENERGY INFRASTRUCTURE INVESTMENT
OECD ECONOMIC SURVEYS: POLAND © OECD 2016110
should make their decisions based on feasibility analysis and collect relevant data to allow
ex post assessment at a predetermined date. This would help to develop procedures to
assess longer-term value-for-money differences between standard public procurement
and PPPs (Burger and Hawkesworth, 2011; OECD, 2012b). The current and estimated future
fiscal costs of each PPP needs to be transparently accounted for in public budgets. Only in
this way can these costs be adequately scrutinised through CBA.
Limited administrative capacity hinders PPP development in Poland. Despite the
new 2008 PPP law, the procedures may be too complex to be carried out by inexperienced
local governments that sometimes lack funding and capacity to hire external advisers. In
addition, central responsibilities are split between different ministries, though two
ministries in charge of PPPs were merged into the Ministry of Economic Development
in 2015, and there is no central PPP unit (EPEC, 2014). Existing structures allow information
sharing between different public PPP stakeholders, but the development of a central
structure advising local governments in designing and implementing PPP procedures could
be helpful, and the government is currently working on developing such a structure. It
could ensure further monitoring and appropriate renegotiation guidelines and skills and
avoid potential conflicts of interest when hiring external consultants. Encouraging co-
operation between local governments would also be positive. For example, the City of
Poznań and nine neighbouring municipalities have recently invested more than 200 million
euros (including 82 million euros from the Cohesion Fund) to reorganise waste
management (European Commission, 2015f), and other municipalities could build on this
experience. Further public-sector involvement in PPPs’ preparatory phase could also help
improve the completion rates. In a recent ITF study for a PPP port-rail link in Slovenia, a full
business case, CBA and risk analysis of the project, including land acquisition, had all been
completed before the authorities issued a call for interest (ITF, 2015). Only then the private
partners inspected the design and whether they could improve it. This would reduce the
current long time-frame of PPP projects for infrastructure (preparation, implementation
and operation) that poses significant political risks.
Strengthening long-term finance tools would support infrastructure financing. Poland
benefited from funding by the EIB and the European Bank for Reconstruction and
Development (EBRD) of around 0.1% of Polish GDP in 2014 (EUR 5.5 billion and
EUR 0.6 billion, respectively). Both institutions raise funds on capital markets and relend
them on favourable terms, notably for infrastructure projects. Recent initiatives, notably
the European Fund for Strategic Investments (EFSI) and Polish Investment Programme (PIR)
and the announced Polish Development Fund (PFR) (Boxes 2.2 and 2.3), aim to facilitate the
provision of long-term loans and to crowd in private finance, though they may also be used
for public investment. However, such measures may have large deadweight losses. Indeed,
lending by public entities may favour market-viable but politically favoured activities,
distorting competition in a context where public ownership remains widespread
(OECD, 2014a).
The national road fund and local governments have been able to issue substantial
amounts of debt since 2007. Nevertheless developing the long-term investor base would
increase the supply of finance for infrastructure investment. While pension funds were
among the main buyers of the bonds issued by the state-owned development bank (BGK),
their size has begun to decrease (Figure 2.13). The 2014 pension reforms shrank their role,
as most people switched to the public pension scheme for their mandatory contributions,
and voluntary contributions to private pension funds remain small. In addition, pension
2. IMPROVING TRANSPORT AND ENERGY INFRASTRUCTURE INVESTMENT
OECD ECONOMIC SURVEYS: POLAND © OECD 2016 111
funds had to hold a minimum of 75% of their assets in equities in 2014, and that floor will
only gradually decrease to 15% in 2017. Moreover, pension funds are now forbidden to
invest in Treasury securities and State Treasury guaranteed securities, including bonds
issued by BGK on behalf of the National Road Fund. In principle, foreign institutional
investors could supply long-term project finance, but European capital markets remain
fragmented. Moreover, bank funding for infrastructure may be constrained in maturities
and volume, while pressures on public finance may reduce state transfers to BGK over the
medium term. Therefore, strengthening the local long-term investor base would be
helpful, as only the largest investors have the capacity to directly fund infrastructure
projects because of their large size and long-term horizon (Della Croce and Yermo, 2013).
Some regulatory reforms would also foster private investment in infrastructure. OECD
evidence suggests that reducing barriers to entry in network industries can foster higher
rates of infrastructure investment (Sutherland et al., 2009). Formal entry barriers have
decreased substantially in Poland, according to the OECD indicators of the stringency of
regulations in network industries – ETCR – (Figure 2.14, Panel A), but widespread public
Box 2.2. EU initiatives to attract private infrastructure investment and the EFSI
Three main EU instruments aim to attract private infrastructure:
The Connecting Europe Facility (CEF) is intended to be a catalyst for further private and public funding bygiving infrastructure projects credibility and lowering their risk profiles, thereby attracting privateinvestors. One of the CEF’s key elements is more systematic use of innovative financial instruments, suchguaranteed loans, to provide a funding alternative to traditional grants and fill financing gaps for strategicinvestments.
The Loan Guarantee Instrument for Trans-European Transport (LGTT) has been introduced to partiallycover risks for network projects of common interest and to receive income from user charges. The LGTTnormally guarantees a maximum of 10% of senior debt (20% in exceptional instances) up to a maximum ofEUR 200 million per project. This support substantially enhances credit quality, thereby encouraging areduction of risk margins applied to senior project loans. It is available for as much as 5 to 7 years afterproject completion.
In addition, the Commission and the European Investment Bank (EIB) set up the European Fund forStrategic Investments (EFSI) in July 2015. Its capital consists of a EUR 5 billion contribution from the EIB anda EUR 16 billion guarantee from the EU budget, half of which is to be paid in, in a back-loaded manner, over2016-20 by reallocating existing budget funds. The EFSI capital of EUR 21 billion will be used to raise aroundthree times as much funding by issuing bonds, and the funds thus raised will be used as “first-lossprotection” to attract other private or public sources to finance projects of about four times the risk-bearingcapacity. Hence, every EUR 1 of EFSI capital is expected to result in about EUR 15 of real investment, withestimated total investment volume of EUR 315 billion (2.2% of 2014 EU GDP) (OECD, 2015a). Polandannounced that it will contribute EUR 8 billion (0.1% of 2014 Polish GDP) to EFSI projects through the state-owned development bank (BGK) and the Polish Investments for Development (PIR) (European Commission,2015g).
The EFSI focuses on financing infrastructure investment and innovation and SME financing. Suchfunding may help correct market failures and trigger further private-sector investment. Theimplementation of the EFSI started with the appointment of its steering board in July 2015. Projects seekingEFSI support will be submitted to the EIB (and the European Investment Fund for SME financing), which willcarry out project selection. In turn, the EIB will seek the approval of the EFSI Investment Committee tobenefit from the EFSI guarantee. This is expected to allow the EIB to finance riskier projects.
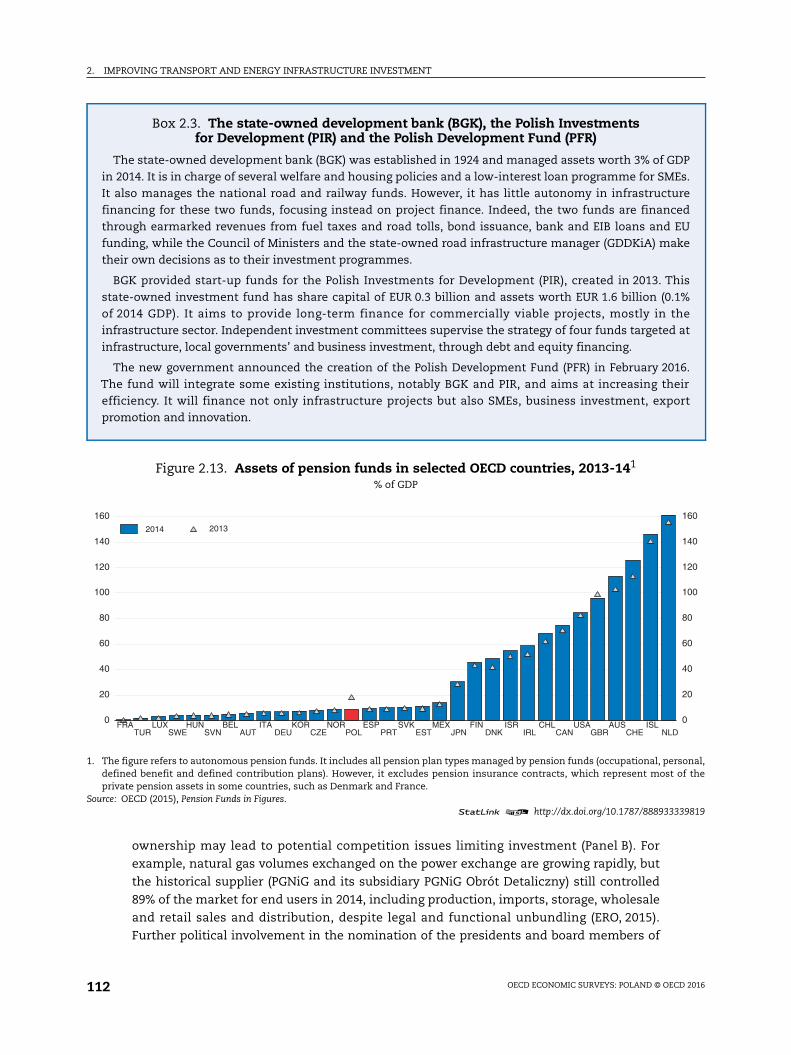
2. IMPROVING TRANSPORT AND ENERGY INFRASTRUCTURE INVESTMENT
OECD ECONOMIC SURVEYS: POLAND © OECD 2016112
ownership may lead to potential competition issues limiting investment (Panel B). For
example, natural gas volumes exchanged on the power exchange are growing rapidly, but
the historical supplier (PGNiG and its subsidiary PGNiG Obrót Detaliczny) still controlled
89% of the market for end users in 2014, including production, imports, storage, wholesale
and retail sales and distribution, despite legal and functional unbundling (ERO, 2015).
Further political involvement in the nomination of the presidents and board members of
Box 2.3. The state-owned development bank (BGK), the Polish Investmentsfor Development (PIR) and the Polish Development Fund (PFR)
The state-owned development bank (BGK) was established in 1924 and managed assets worth 3% of GDPin 2014. It is in charge of several welfare and housing policies and a low-interest loan programme for SMEs.It also manages the national road and railway funds. However, it has little autonomy in infrastructurefinancing for these two funds, focusing instead on project finance. Indeed, the two funds are financedthrough earmarked revenues from fuel taxes and road tolls, bond issuance, bank and EIB loans and EUfunding, while the Council of Ministers and the state-owned road infrastructure manager (GDDKiA) maketheir own decisions as to their investment programmes.
BGK provided start-up funds for the Polish Investments for Development (PIR), created in 2013. Thisstate-owned investment fund has share capital of EUR 0.3 billion and assets worth EUR 1.6 billion (0.1%of 2014 GDP). It aims to provide long-term finance for commercially viable projects, mostly in theinfrastructure sector. Independent investment committees supervise the strategy of four funds targeted atinfrastructure, local governments’ and business investment, through debt and equity financing.
The new government announced the creation of the Polish Development Fund (PFR) in February 2016.The fund will integrate some existing institutions, notably BGK and PIR, and aims at increasing theirefficiency. It will finance not only infrastructure projects but also SMEs, business investment, exportpromotion and innovation.
Figure 2.13. Assets of pension funds in selected OECD countries, 2013-141
% of GDP
1. The figure refers to autonomous pension funds. It includes all pension plan types managed by pension funds (occupational, personal,defined benefit and defined contribution plans). However, it excludes pension insurance contracts, which represent most of theprivate pension assets in some countries, such as Denmark and France.
Source: OECD (2015), Pension Funds in Figures.1 2 http://dx.doi.org/10.1787/888933339819
0
20
40
60
80
100
120
140
160
0
20
40
60
80
100
120
140
160
FRATUR
LUXSWE
HUNSVN
BELAUT
ITADEU
KORCZE
NORPOL
ESPPRT
SVKEST
MEXJPN
FINDNK
ISRIRL
CHLCAN
USAGBR
AUSCHE
ISLNLD
20132014
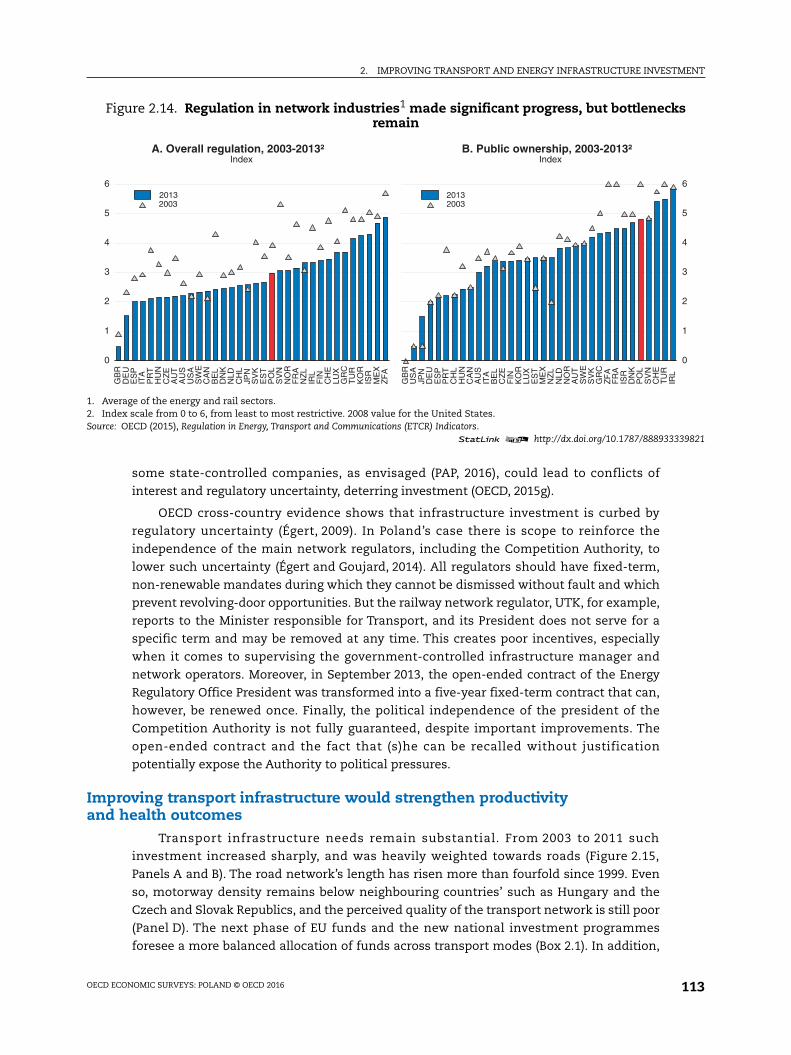
2. IMPROVING TRANSPORT AND ENERGY INFRASTRUCTURE INVESTMENT
OECD ECONOMIC SURVEYS: POLAND © OECD 2016 113
some state-controlled companies, as envisaged (PAP, 2016), could lead to conflicts of
interest and regulatory uncertainty, deterring investment (OECD, 2015g).
OECD cross-country evidence shows that infrastructure investment is curbed by
regulatory uncertainty (Égert, 2009). In Poland’s case there is scope to reinforce the
independence of the main network regulators, including the Competition Authority, to
lower such uncertainty (Égert and Goujard, 2014). All regulators should have fixed-term,
non-renewable mandates during which they cannot be dismissed without fault and which
prevent revolving-door opportunities. But the railway network regulator, UTK, for example,
reports to the Minister responsible for Transport, and its President does not serve for a
specific term and may be removed at any time. This creates poor incentives, especially
when it comes to supervising the government-controlled infrastructure manager and
network operators. Moreover, in September 2013, the open-ended contract of the Energy
Regulatory Office President was transformed into a five-year fixed-term contract that can,
however, be renewed once. Finally, the political independence of the president of the
Competition Authority is not fully guaranteed, despite important improvements. The
open-ended contract and the fact that (s)he can be recalled without justification
potentially expose the Authority to political pressures.
Improving transport infrastructure would strengthen productivityand health outcomes
Transport infrastructure needs remain substantial. From 2003 to 2011 such
investment increased sharply, and was heavily weighted towards roads (Figure 2.15,
Panels A and B). The road network’s length has risen more than fourfold since 1999. Even
so, motorway density remains below neighbouring countries’ such as Hungary and the
Czech and Slovak Republics, and the perceived quality of the transport network is still poor
(Panel D). The next phase of EU funds and the new national investment programmes
foresee a more balanced allocation of funds across transport modes (Box 2.1). In addition,
Figure 2.14. Regulation in network industries1 made significant progress, but bottlenecksremain
1. Average of the energy and rail sectors.2. Index scale from 0 to 6, from least to most restrictive. 2008 value for the United States.Source: OECD (2015), Regulation in Energy, Transport and Communications (ETCR) Indicators.
1 2 http://dx.doi.org/10.1787/888933339821
0
1
2
3
4
5
6
GB
RD
EU
ES
PIT
AP
RT
HU
NC
ZE
AU
TA
US
US
AS
WE
CA
NB
EL
DN
KN
LDC
HL
JPN
SV
KE
ST
PO
LS
VN
NO
RF
RA
NZ
LIR
LF
INC
HE
LUX
GR
CT
UR
KO
RIS
RM
EX
ZF
A
20032013
A. Overall regulation, 2003-2013²Index
0
1
2
3
4
5
6
GB
RU
SA
JPN
DE
UE
SP
PR
TC
HL
HU
NC
AN
AU
SIT
AB
EL
CZ
EF
INK
OR
LUX
ES
TM
EX
NZ
LN
LDN
OR
AU
TS
WE
SV
KG
RC
ZF
AF
RA
ISR
DN
KP
OL
SV
NC
HE
TU
RIR
L
20032013
B. Public ownership, 2003-2013²Index
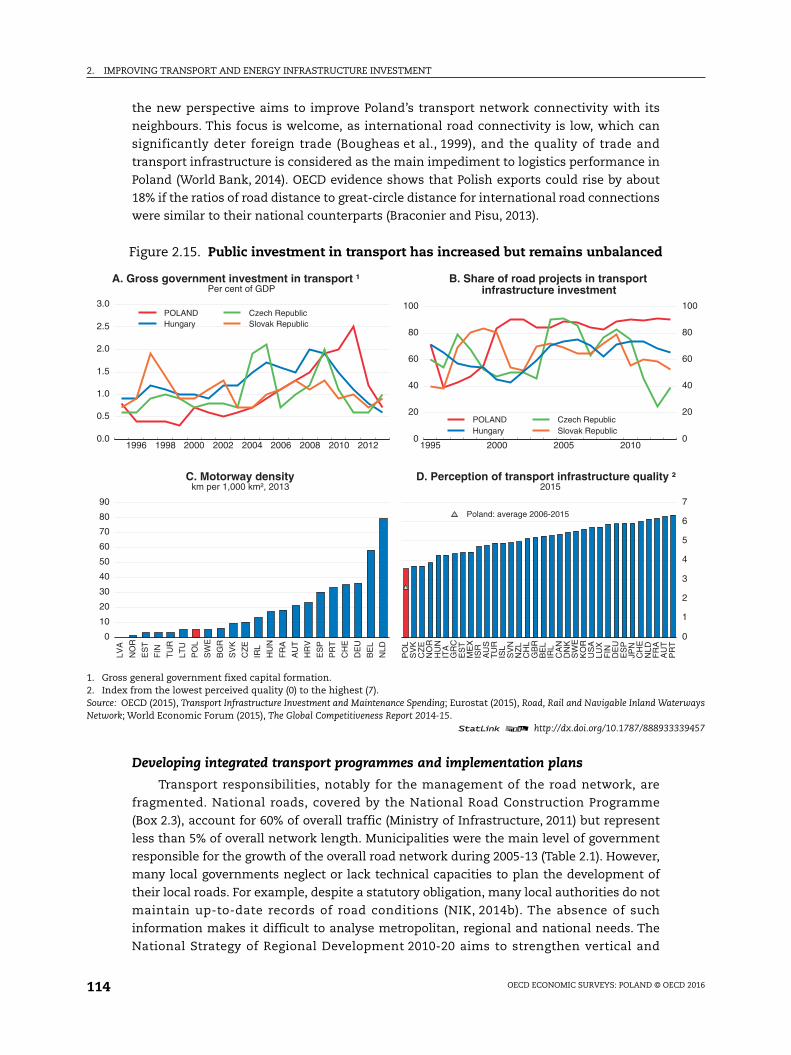
2. IMPROVING TRANSPORT AND ENERGY INFRASTRUCTURE INVESTMENT
OECD ECONOMIC SURVEYS: POLAND © OECD 2016114
the new perspective aims to improve Poland’s transport network connectivity with its
neighbours. This focus is welcome, as international road connectivity is low, which can
significantly deter foreign trade (Bougheas et al., 1999), and the quality of trade and
transport infrastructure is considered as the main impediment to logistics performance in
Poland (World Bank, 2014). OECD evidence shows that Polish exports could rise by about
18% if the ratios of road distance to great-circle distance for international road connections
were similar to their national counterparts (Braconier and Pisu, 2013).
Developing integrated transport programmes and implementation plans
Transport responsibilities, notably for the management of the road network, are
fragmented. National roads, covered by the National Road Construction Programme
(Box 2.3), account for 60% of overall traffic (Ministry of Infrastructure, 2011) but represent
less than 5% of overall network length. Municipalities were the main level of government
responsible for the growth of the overall road network during 2005-13 (Table 2.1). However,
many local governments neglect or lack technical capacities to plan the development of
their local roads. For example, despite a statutory obligation, many local authorities do not
maintain up-to-date records of road conditions (NIK, 2014b). The absence of such
information makes it difficult to analyse metropolitan, regional and national needs. The
National Strategy of Regional Development 2010-20 aims to strengthen vertical and
Figure 2.15. Public investment in transport has increased but remains unbalanced
1. Gross general government fixed capital formation.2. Index from the lowest perceived quality (0) to the highest (7).Source: OECD (2015), Transport Infrastructure Investment and Maintenance Spending; Eurostat (2015), Road, Rail and Navigable Inland WaterwaysNetwork; World Economic Forum (2015), The Global Competitiveness Report 2014-15.
1 2 http://dx.doi.org/10.1787/888933339457
1996 1998 2000 2002 2004 2006 2008 2010 20120.0
0.5
1.0
1.5
2.0
2.5
3.0 POLANDHungary
Czech RepublicSlovak Republic
A. Gross government investment in transport ¹Per cent of GDP
1995 2000 2005 20100
20
40
60
80
100
0
20
40
60
80
100
POLANDHungary
Czech RepublicSlovak Republic
B. Share of road projects in transportinfrastructure investment
0
10
20
30
40
50
60
70
80
90
LVA
NO
R
ES
T
FIN
TU
R
LTU
PO
L
SW
E
BG
R
SV
K
CZ
E
IRL
HU
N
FR
A
AU
T
HR
V
ES
P
PR
T
CH
E
DE
U
BE
L
NLD
C. Motorway densitykm per 1,000 km², 2013
0
1
2
3
4
5
6
7
PO
LS
VK
CZ
EN
OR
HU
NIT
AG
RC
ES
TM
EX
ISR
AU
ST
UR
ISL
SV
NN
ZL
CH
LG
BR
BE
LIR
LC
AN
DN
KS
WE
KO
RU
SA
LUX
FIN
DE
UE
SP
JPN
CH
EN
LDF
RA
AU
TP
RT
Poland: average 2006-2015
D. Perception of transport infrastructure quality ² 2015
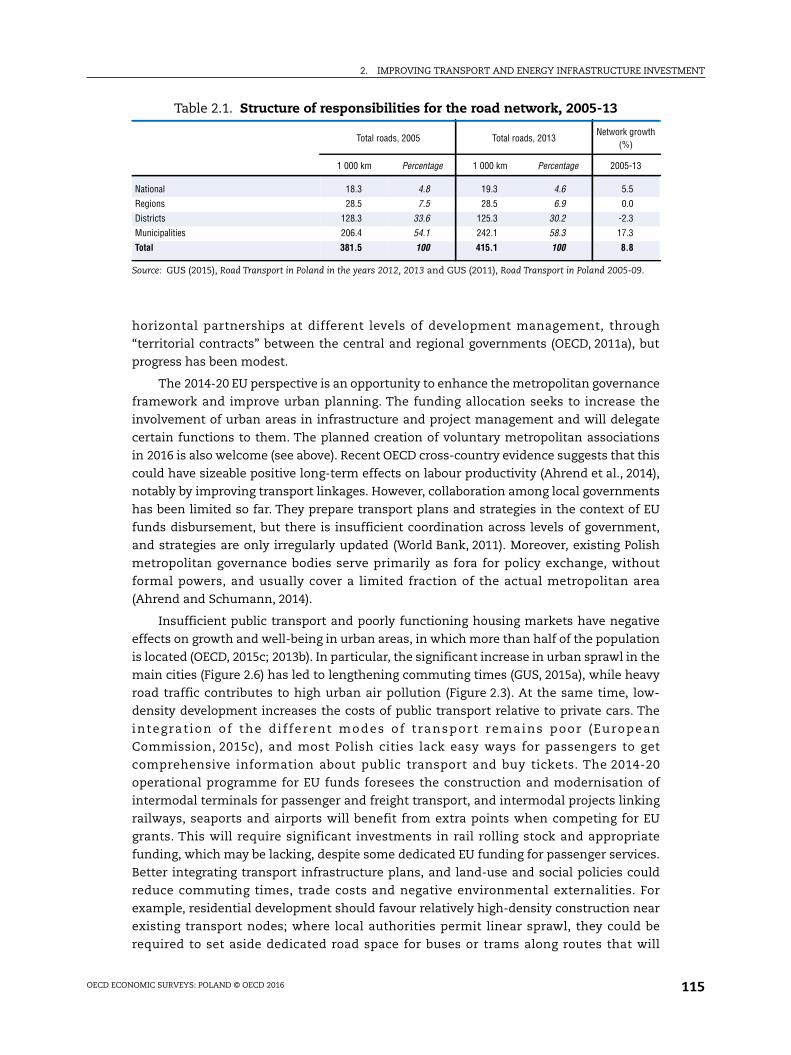
2. IMPROVING TRANSPORT AND ENERGY INFRASTRUCTURE INVESTMENT
OECD ECONOMIC SURVEYS: POLAND © OECD 2016 115
horizontal partnerships at different levels of development management, through
“territorial contracts” between the central and regional governments (OECD, 2011a), but
progress has been modest.
The 2014-20 EU perspective is an opportunity to enhance the metropolitan governance
framework and improve urban planning. The funding allocation seeks to increase the
involvement of urban areas in infrastructure and project management and will delegate
certain functions to them. The planned creation of voluntary metropolitan associations
in 2016 is also welcome (see above). Recent OECD cross-country evidence suggests that this
could have sizeable positive long-term effects on labour productivity (Ahrend et al., 2014),
notably by improving transport linkages. However, collaboration among local governments
has been limited so far. They prepare transport plans and strategies in the context of EU
funds disbursement, but there is insufficient coordination across levels of government,
and strategies are only irregularly updated (World Bank, 2011). Moreover, existing Polish
metropolitan governance bodies serve primarily as fora for policy exchange, without
formal powers, and usually cover a limited fraction of the actual metropolitan area
(Ahrend and Schumann, 2014).
Insufficient public transport and poorly functioning housing markets have negative
effects on growth and well-being in urban areas, in which more than half of the population
is located (OECD, 2015c; 2013b). In particular, the significant increase in urban sprawl in the
main cities (Figure 2.6) has led to lengthening commuting times (GUS, 2015a), while heavy
road traffic contributes to high urban air pollution (Figure 2.3). At the same time, low-
density development increases the costs of public transport relative to private cars. The
integrat ion of the dif ferent modes of transport remains poor (European
Commission, 2015c), and most Polish cities lack easy ways for passengers to get
comprehensive information about public transport and buy tickets. The 2014-20
operational programme for EU funds foresees the construction and modernisation of
intermodal terminals for passenger and freight transport, and intermodal projects linking
railways, seaports and airports will benefit from extra points when competing for EU
grants. This will require significant investments in rail rolling stock and appropriate
funding, which may be lacking, despite some dedicated EU funding for passenger services.
Better integrating transport infrastructure plans, and land-use and social policies could
reduce commuting times, trade costs and negative environmental externalities. For
example, residential development should favour relatively high-density construction near
existing transport nodes; where local authorities permit linear sprawl, they could be
required to set aside dedicated road space for buses or trams along routes that will
Table 2.1. Structure of responsibilities for the road network, 2005-13
Total roads, 2005 Total roads, 2013Network growth
(%)
1 000 km Percentage 1 000 km Percentage 2005-13
National 18.3 4.8 19.3 4.6 5.5
Regions 28.5 7.5 28.5 6.9 0.0
Districts 128.3 33.6 125.3 30.2 -2.3
Municipalities 206.4 54.1 242.1 58.3 17.3
Total 381.5 100 415.1 100 8.8
Source: GUS (2015), Road Transport in Poland in the years 2012, 2013 and GUS (2011), Road Transport in Poland 2005-09.
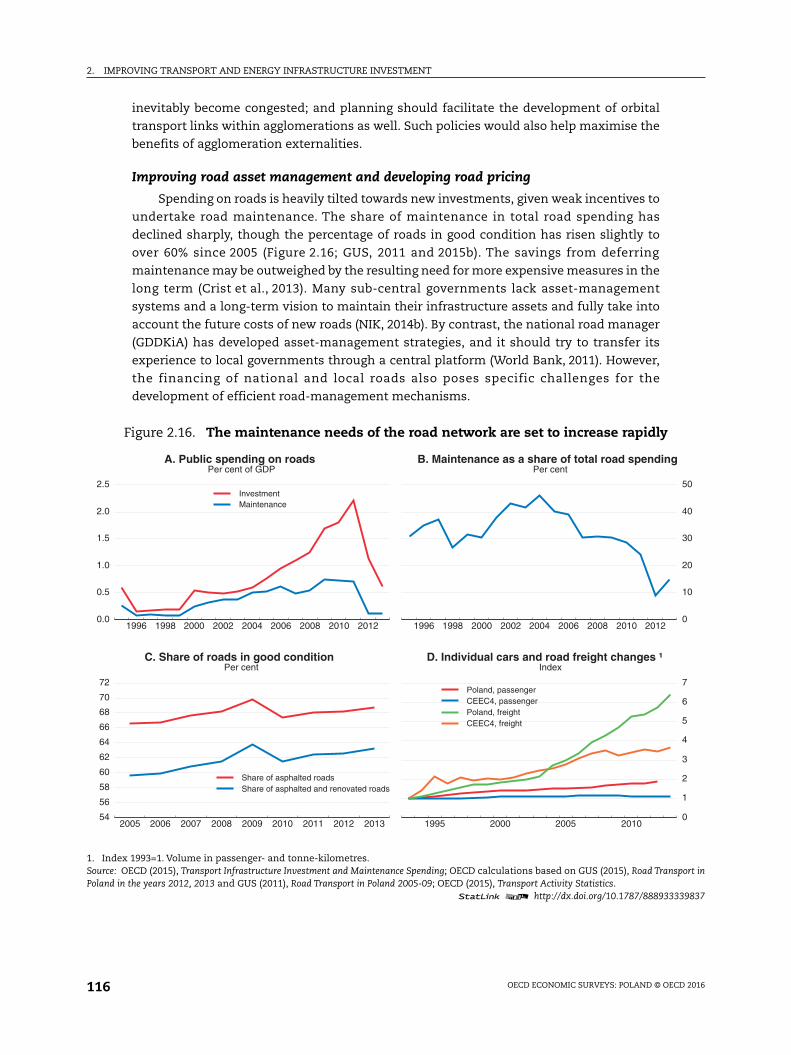
2. IMPROVING TRANSPORT AND ENERGY INFRASTRUCTURE INVESTMENT
OECD ECONOMIC SURVEYS: POLAND © OECD 2016116
inevitably become congested; and planning should facilitate the development of orbital
transport links within agglomerations as well. Such policies would also help maximise the
benefits of agglomeration externalities.
Improving road asset management and developing road pricing
Spending on roads is heavily tilted towards new investments, given weak incentives to
undertake road maintenance. The share of maintenance in total road spending has
declined sharply, though the percentage of roads in good condition has risen slightly to
over 60% since 2005 (Figure 2.16; GUS, 2011 and 2015b). The savings from deferring
maintenance may be outweighed by the resulting need for more expensive measures in the
long term (Crist et al., 2013). Many sub-central governments lack asset-management
systems and a long-term vision to maintain their infrastructure assets and fully take into
account the future costs of new roads (NIK, 2014b). By contrast, the national road manager
(GDDKiA) has developed asset-management strategies, and it should try to transfer its
experience to local governments through a central platform (World Bank, 2011). However,
the financing of national and local roads also poses specific challenges for the
development of efficient road-management mechanisms.
Figure 2.16. The maintenance needs of the road network are set to increase rapidly
1. Index 1993=1. Volume in passenger- and tonne-kilometres.Source: OECD (2015), Transport Infrastructure Investment and Maintenance Spending; OECD calculations based on GUS (2015), Road Transport inPoland in the years 2012, 2013 and GUS (2011), Road Transport in Poland 2005-09; OECD (2015), Transport Activity Statistics.
1 2 http://dx.doi.org/10.1787/888933339837
1996 1998 2000 2002 2004 2006 2008 2010 20120.0
0.5
1.0
1.5
2.0
2.5 InvestmentMaintenance
A. Public spending on roadsPer cent of GDP
1996 1998 2000 2002 2004 2006 2008 2010 2012
0
10
20
30
40
50
B. Maintenance as a share of total road spendingPer cent
2005 2006 2007 2008 2009 2010 2011 2012 201354
56
58
60
62
64
66
68
70
72
Share of asphalted roadsShare of asphalted and renovated roads
C. Share of roads in good conditionPer cent
1995 2000 2005 2010
0
1
2
3
4
5
6
7 Poland, passenger CEEC4, passengerPoland, freightCEEC4, freight
D. Individual cars and road freight changes ¹Index
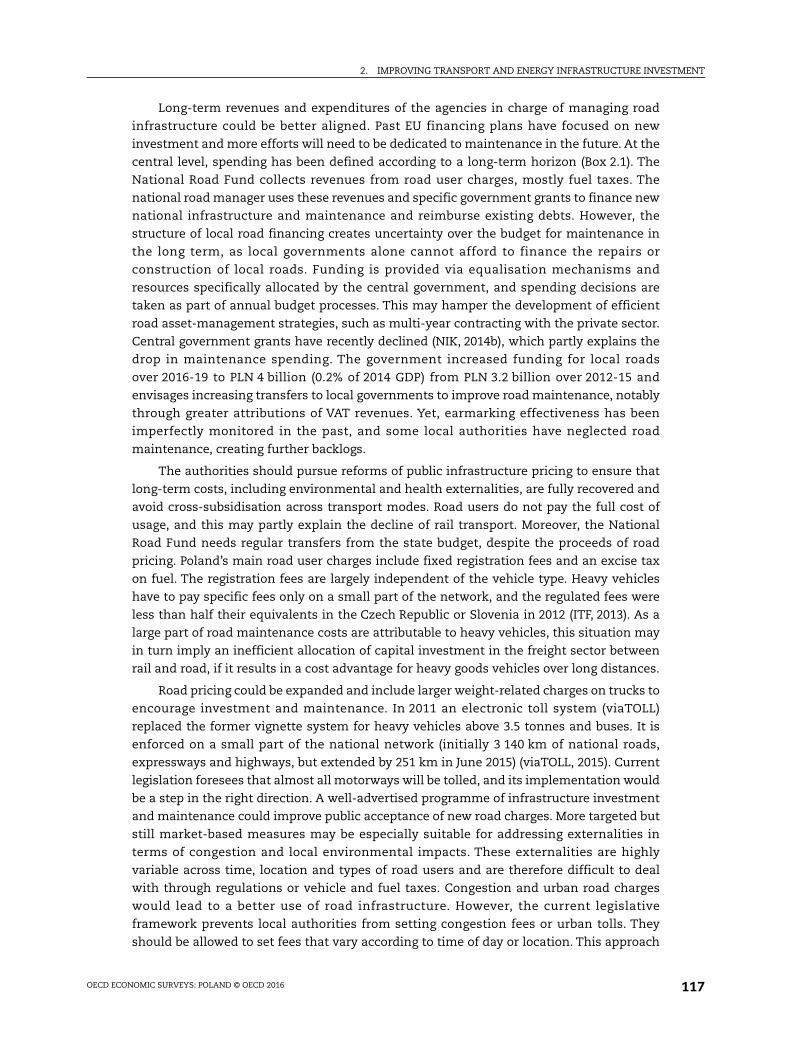
2. IMPROVING TRANSPORT AND ENERGY INFRASTRUCTURE INVESTMENT
OECD ECONOMIC SURVEYS: POLAND © OECD 2016 117
Long-term revenues and expenditures of the agencies in charge of managing road
infrastructure could be better aligned. Past EU financing plans have focused on new
investment and more efforts will need to be dedicated to maintenance in the future. At the
central level, spending has been defined according to a long-term horizon (Box 2.1). The
National Road Fund collects revenues from road user charges, mostly fuel taxes. The
national road manager uses these revenues and specific government grants to finance new
national infrastructure and maintenance and reimburse existing debts. However, the
structure of local road financing creates uncertainty over the budget for maintenance in
the long term, as local governments alone cannot afford to finance the repairs or
construction of local roads. Funding is provided via equalisation mechanisms and
resources specifically allocated by the central government, and spending decisions are
taken as part of annual budget processes. This may hamper the development of efficient
road asset-management strategies, such as multi-year contracting with the private sector.
Central government grants have recently declined (NIK, 2014b), which partly explains the
drop in maintenance spending. The government increased funding for local roads
over 2016-19 to PLN 4 billion (0.2% of 2014 GDP) from PLN 3.2 billion over 2012-15 and
envisages increasing transfers to local governments to improve road maintenance, notably
through greater attributions of VAT revenues. Yet, earmarking effectiveness has been
imperfectly monitored in the past, and some local authorities have neglected road
maintenance, creating further backlogs.
The authorities should pursue reforms of public infrastructure pricing to ensure that
long-term costs, including environmental and health externalities, are fully recovered and
avoid cross-subsidisation across transport modes. Road users do not pay the full cost of
usage, and this may partly explain the decline of rail transport. Moreover, the National
Road Fund needs regular transfers from the state budget, despite the proceeds of road
pricing. Poland’s main road user charges include fixed registration fees and an excise tax
on fuel. The registration fees are largely independent of the vehicle type. Heavy vehicles
have to pay specific fees only on a small part of the network, and the regulated fees were
less than half their equivalents in the Czech Republic or Slovenia in 2012 (ITF, 2013). As a
large part of road maintenance costs are attributable to heavy vehicles, this situation may
in turn imply an inefficient allocation of capital investment in the freight sector between
rail and road, if it results in a cost advantage for heavy goods vehicles over long distances.
Road pricing could be expanded and include larger weight-related charges on trucks to
encourage investment and maintenance. In 2011 an electronic toll system (viaTOLL)
replaced the former vignette system for heavy vehicles above 3.5 tonnes and buses. It is
enforced on a small part of the national network (initially 3 140 km of national roads,
expressways and highways, but extended by 251 km in June 2015) (viaTOLL, 2015). Current
legislation foresees that almost all motorways will be tolled, and its implementation would
be a step in the right direction. A well-advertised programme of infrastructure investment
and maintenance could improve public acceptance of new road charges. More targeted but
still market-based measures may be especially suitable for addressing externalities in
terms of congestion and local environmental impacts. These externalities are highly
variable across time, location and types of road users and are therefore difficult to deal
with through regulations or vehicle and fuel taxes. Congestion and urban road charges
would lead to a better use of road infrastructure. However, the current legislative
framework prevents local authorities from setting congestion fees or urban tolls. They
should be allowed to set fees that vary according to time of day or location. This approach
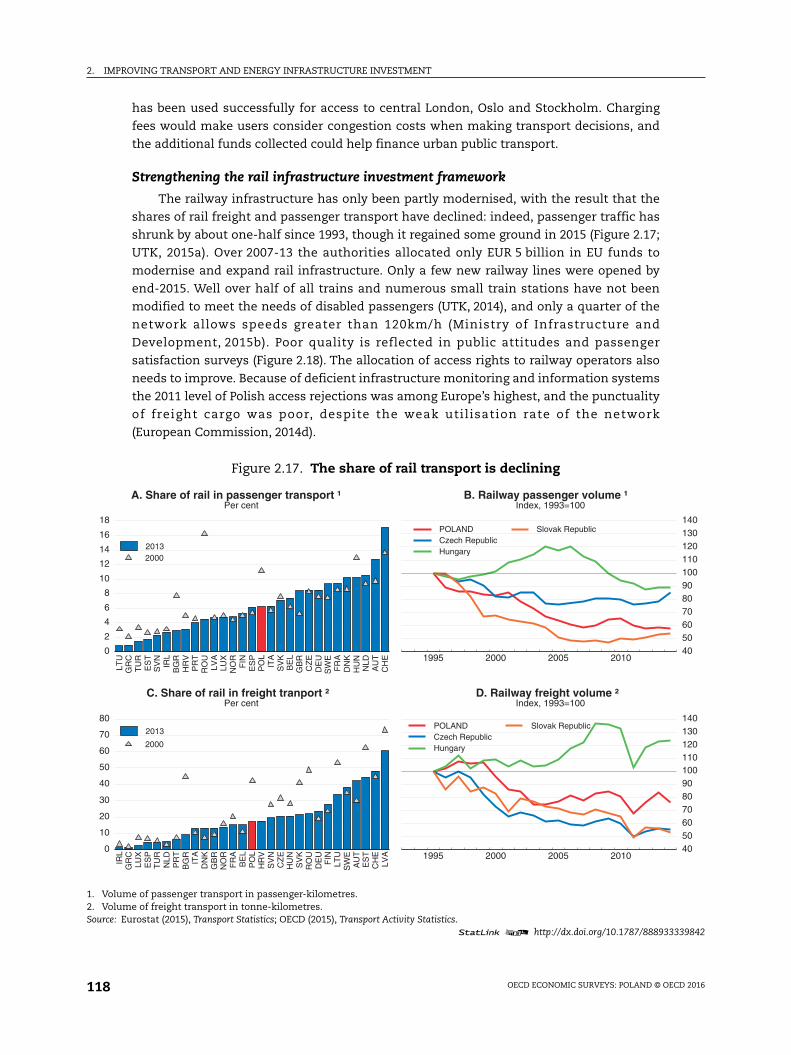
2. IMPROVING TRANSPORT AND ENERGY INFRASTRUCTURE INVESTMENT
OECD ECONOMIC SURVEYS: POLAND © OECD 2016118
has been used successfully for access to central London, Oslo and Stockholm. Charging
fees would make users consider congestion costs when making transport decisions, and
the additional funds collected could help finance urban public transport.
Strengthening the rail infrastructure investment framework
The railway infrastructure has only been partly modernised, with the result that the
shares of rail freight and passenger transport have declined: indeed, passenger traffic has
shrunk by about one-half since 1993, though it regained some ground in 2015 (Figure 2.17;
UTK, 2015a). Over 2007-13 the authorities allocated only EUR 5 billion in EU funds to
modernise and expand rail infrastructure. Only a few new railway lines were opened by
end-2015. Well over half of all trains and numerous small train stations have not been
modified to meet the needs of disabled passengers (UTK, 2014), and only a quarter of the
network allows speeds greater than 120km/h (Ministry of Infrastructure and
Development, 2015b). Poor quality is reflected in public attitudes and passenger
satisfaction surveys (Figure 2.18). The allocation of access rights to railway operators also
needs to improve. Because of deficient infrastructure monitoring and information systems
the 2011 level of Polish access rejections was among Europe’s highest, and the punctuality
of freight cargo was poor, despite the weak utilisation rate of the network
(European Commission, 2014d).
Figure 2.17. The share of rail transport is declining
1. Volume of passenger transport in passenger-kilometres.2. Volume of freight transport in tonne-kilometres.Source: Eurostat (2015), Transport Statistics; OECD (2015), Transport Activity Statistics.
1 2 http://dx.doi.org/10.1787/888933339842
0
2
4
6
8
10
12
14
16
18
LTU
GR
CT
UR
ES
TS
VN
IRL
BG
RH
RV
PR
TR
OU
LVA
LUX
NO
RF
INE
SP
PO
LIT
AS
VK
BE
LG
BR
CZ
ED
EU
SW
EF
RA
DN
KH
UN
NLD
AU
TC
HE
20002013
A. Share of rail in passenger transport ¹Per cent
0
10
20
30
40
50
60
70
80
IRL
GR
CLU
XE
SP
TU
RN
LDP
RT
BG
RIT
AD
NK
GB
RN
OR
FR
AB
EL
PO
LH
RV
SV
NC
ZE
HU
NS
VK
RO
UD
EU
FIN
LTU
SW
EA
UT
ES
TC
HE
LVA
2000
2013
C. Share of rail in freight tranport ²Per cent
1995 2000 2005 2010
405060708090100110120130140
POLANDCzech RepublicHungary
Slovak Republic
B. Railway passenger volume ¹Index, 1993=100
1995 2000 2005 2010
405060708090100110120130140
POLANDCzech RepublicHungary
Slovak Republic
D. Railway freight volume ²Index, 1993=100
2. IMPROVING TRANSPORT AND ENERGY INFRASTRUCTURE INVESTMENT
OECD ECONOMIC SURVEYS: POLAND © OECD 2016 119
The density of the railway system remains above the European average, but it has
fallen rapidly whereas it has been constant in other CEECs (Figure 2.19). Railways still
suffer from poorly structured financing, and long-term negligence of even the shrunken
network has exacerbated maintenance needs. The European Commission (2014e)
estimates that there was systematic underinvestment in maintenance from 1996 to 2010.
Over half the rail infrastructure requires significant repair work (UTK, 2014). The
infrastructure manager, PKP PLK, is aware of these deficiencies, and the Nationwide
Railway Programme adopted by the Council of Ministers in 2015 foresees rail infrastructure
investments totalling PLN 67.5 billion (3.9% of 2014 GDP) until 2023. The focus on
modernisation and maintenance of the most important lines is welcome, as it could lower
management fees and lead to closure of unprofitable parts of the network. However, this
could also have negative consequences, as freight companies may need to adopt longer
itineraries. Passenger stations also require specific attention, as despite the dense network,
the number of railway stations is particularly low, and citizens perceive them as remote
(European Commission, 2014e).
Despite the planned significant increase in funding, rigid and insecure national
financing hampers project preparation and implementation. The infrastructure manager,
PKP PLK, signs three-year maintenance contracts with the state, but the specific budget
allocations are decided yearly. As large maintenance projects are lengthy and uncertain,
this gives PKP PLK little leeway to schedule such work and develop a comprehensive asset-
management strategy. Indeed, in the past, funding at specific points in time has
sometimes been lacking to ensure the timely delivery of railway projects (NIK, 2013
and 2015c). This led to increased volatility in railway infrastructure access charges. In
addition, most local governments offer only one-year contracts to rail service providers for
passenger services. This creates high uncertainty and hampers investment in the rolling
stock and new entry. Indeed, there are several examples of tenders for public rail service
contracts that have not been able to attract a single bidder (European Commission, 2013a).
However, a 2014 law increased the predictability of track access charges, and a welcome
Figure 2.18. The quality of the rail infrastructure and services is perceived as low
1. Index from the lowest perceived quality (0) to the highest (7).Source: World Economic Forum (2015), The Global Competitiveness Report 2014-15; European Commission (2013), Europeans’ Satisfaction withRail Services.
1 2 http://dx.doi.org/10.1787/888933339852
0
1
2
3
4
5
6
7
PO
LS
VK
CZ
EN
OR
HU
NIT
AG
RC
ES
TM
EX
ISR
AU
ST
UR
ISL
SV
NN
ZL
CH
LG
BR
BE
LIR
LC
AN
DN
KS
WE
KO
RU
SA
LUX
FIN
DE
UE
SP
JPN
CH
EN
LDF
RA
AU
TP
RT
Average 2006-152015
A. Perceived quality of the railway networkIndex ¹
0
20
40
60
80
100
ES
TB
GR
ITA
PO
LR
OU
HR
VG
RC
LTU
SV
NH
UN
DE
US
VK
EU
SW
ED
NK
PR
TC
ZE
NLD
LVA
AU
TE
SP
FR
AB
EL
LUX
IRL
GB
RF
IN
HighGood
B. Passengers’ satisfaction with railway services, 2013Per cent
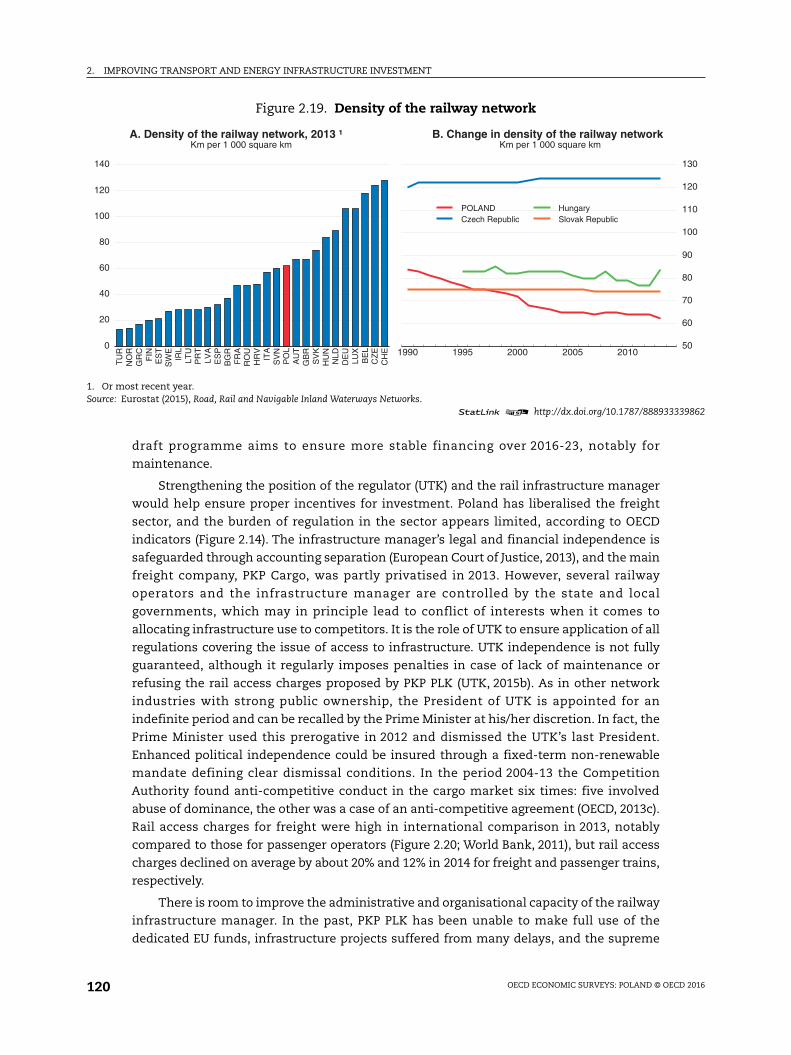
2. IMPROVING TRANSPORT AND ENERGY INFRASTRUCTURE INVESTMENT
OECD ECONOMIC SURVEYS: POLAND © OECD 2016120
draft programme aims to ensure more stable financing over 2016-23, notably for
maintenance.
Strengthening the position of the regulator (UTK) and the rail infrastructure manager
would help ensure proper incentives for investment. Poland has liberalised the freight
sector, and the burden of regulation in the sector appears limited, according to OECD
indicators (Figure 2.14). The infrastructure manager’s legal and financial independence is
safeguarded through accounting separation (European Court of Justice, 2013), and the main
freight company, PKP Cargo, was partly privatised in 2013. However, several railway
operators and the infrastructure manager are controlled by the state and local
governments, which may in principle lead to conflict of interests when it comes to
allocating infrastructure use to competitors. It is the role of UTK to ensure application of all
regulations covering the issue of access to infrastructure. UTK independence is not fully
guaranteed, although it regularly imposes penalties in case of lack of maintenance or
refusing the rail access charges proposed by PKP PLK (UTK, 2015b). As in other network
industries with strong public ownership, the President of UTK is appointed for an
indefinite period and can be recalled by the Prime Minister at his/her discretion. In fact, the
Prime Minister used this prerogative in 2012 and dismissed the UTK’s last President.
Enhanced political independence could be insured through a fixed-term non-renewable
mandate defining clear dismissal conditions. In the period 2004-13 the Competition
Authority found anti-competitive conduct in the cargo market six times: five involved
abuse of dominance, the other was a case of an anti-competitive agreement (OECD, 2013c).
Rail access charges for freight were high in international comparison in 2013, notably
compared to those for passenger operators (Figure 2.20; World Bank, 2011), but rail access
charges declined on average by about 20% and 12% in 2014 for freight and passenger trains,
respectively.
There is room to improve the administrative and organisational capacity of the railway
infrastructure manager. In the past, PKP PLK has been unable to make full use of the
dedicated EU funds, infrastructure projects suffered from many delays, and the supreme
Figure 2.19. Density of the railway network
1. Or most recent year.Source: Eurostat (2015), Road, Rail and Navigable Inland Waterways Networks.
1 2 http://dx.doi.org/10.1787/888933339862
0
20
40
60
80
100
120
140
TU
RN
OR
GR
CF
INE
ST
SW
EIR
LLT
UP
RT
LVA
ES
PB
GR
FR
AR
OU
HR
VIT
AS
VN
PO
LA
UT
GB
RS
VK
HU
NN
LDD
EU
LUX
BE
LC
ZE
CH
E
A. Density of the railway network, 2013 ¹Km per 1 000 square km
1990 1995 2000 2005 2010
50
60
70
80
90
100
110
120
130
POLANDCzech Republic
HungarySlovak Republic
B. Change in density of the railway networkKm per 1 000 square km
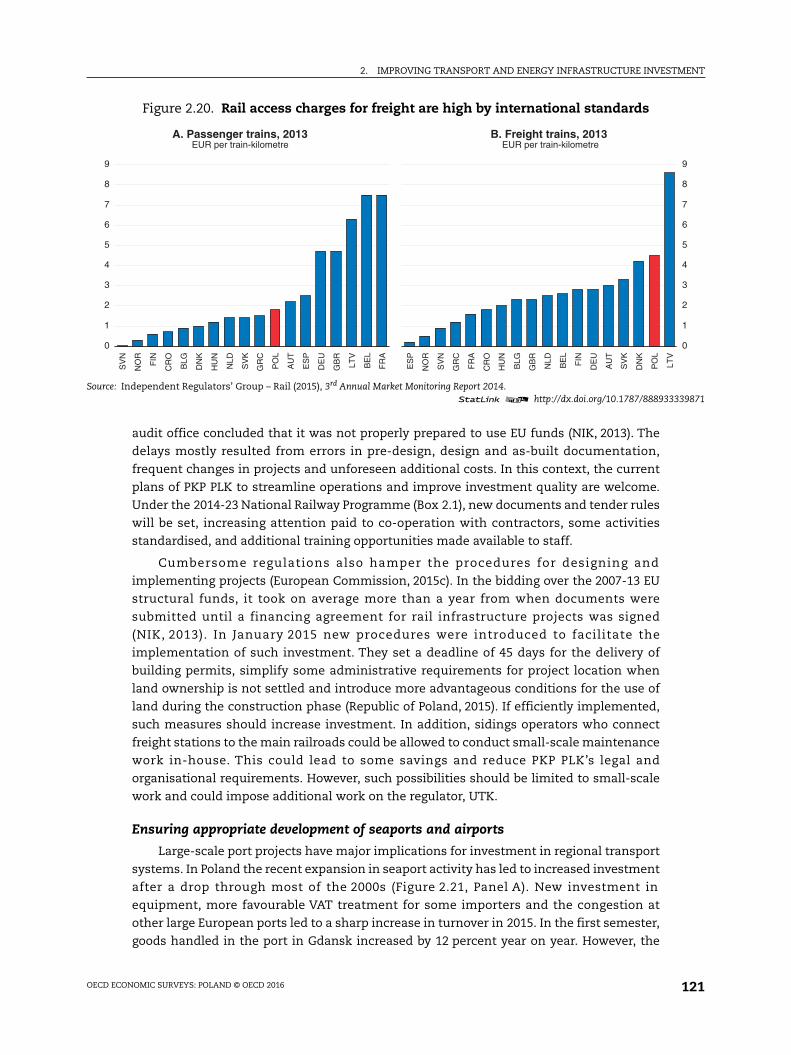
2. IMPROVING TRANSPORT AND ENERGY INFRASTRUCTURE INVESTMENT
OECD ECONOMIC SURVEYS: POLAND © OECD 2016 121
audit office concluded that it was not properly prepared to use EU funds (NIK, 2013). The
delays mostly resulted from errors in pre-design, design and as-built documentation,
frequent changes in projects and unforeseen additional costs. In this context, the current
plans of PKP PLK to streamline operations and improve investment quality are welcome.
Under the 2014-23 National Railway Programme (Box 2.1), new documents and tender rules
will be set, increasing attention paid to co-operation with contractors, some activities
standardised, and additional training opportunities made available to staff.
Cumbersome regulations also hamper the procedures for designing and
implementing projects (European Commission, 2015c). In the bidding over the 2007-13 EU
structural funds, it took on average more than a year from when documents were
submitted until a financing agreement for rail infrastructure projects was signed
(NIK, 2013). In January 2015 new procedures were introduced to facilitate the
implementation of such investment. They set a deadline of 45 days for the delivery of
building permits, simplify some administrative requirements for project location when
land ownership is not settled and introduce more advantageous conditions for the use of
land during the construction phase (Republic of Poland, 2015). If efficiently implemented,
such measures should increase investment. In addition, sidings operators who connect
freight stations to the main railroads could be allowed to conduct small-scale maintenance
work in-house. This could lead to some savings and reduce PKP PLK’s legal and
organisational requirements. However, such possibilities should be limited to small-scale
work and could impose additional work on the regulator, UTK.
Ensuring appropriate development of seaports and airports
Large-scale port projects have major implications for investment in regional transport
systems. In Poland the recent expansion in seaport activity has led to increased investment
after a drop through most of the 2000s (Figure 2.21, Panel A). New investment in
equipment, more favourable VAT treatment for some importers and the congestion at
other large European ports led to a sharp increase in turnover in 2015. In the first semester,
goods handled in the port in Gdansk increased by 12 percent year on year. However, the
Figure 2.20. Rail access charges for freight are high by international standards
Source: Independent Regulators’ Group – Rail (2015), 3rd Annual Market Monitoring Report 2014.1 2 http://dx.doi.org/10.1787/888933339871
0
1
2
3
4
5
6
7
8
9
SV
N
NO
R
FIN
CR
O
BLG
DN
K
HU
N
NLD
SV
K
GR
C
PO
L
AU
T
ES
P
DE
U
GB
R
LTV
BE
L
FR
A
A. Passenger trains, 2013EUR per train-kilometre
0
1
2
3
4
5
6
7
8
9
ES
P
NO
R
SV
N
GR
C
FR
A
CR
O
HU
N
BLG
GB
R
NLD
BE
L
FIN
DE
U
AU
T
SV
K
DN
K
PO
L
LTV
B. Freight trains, 2013EUR per train-kilometre
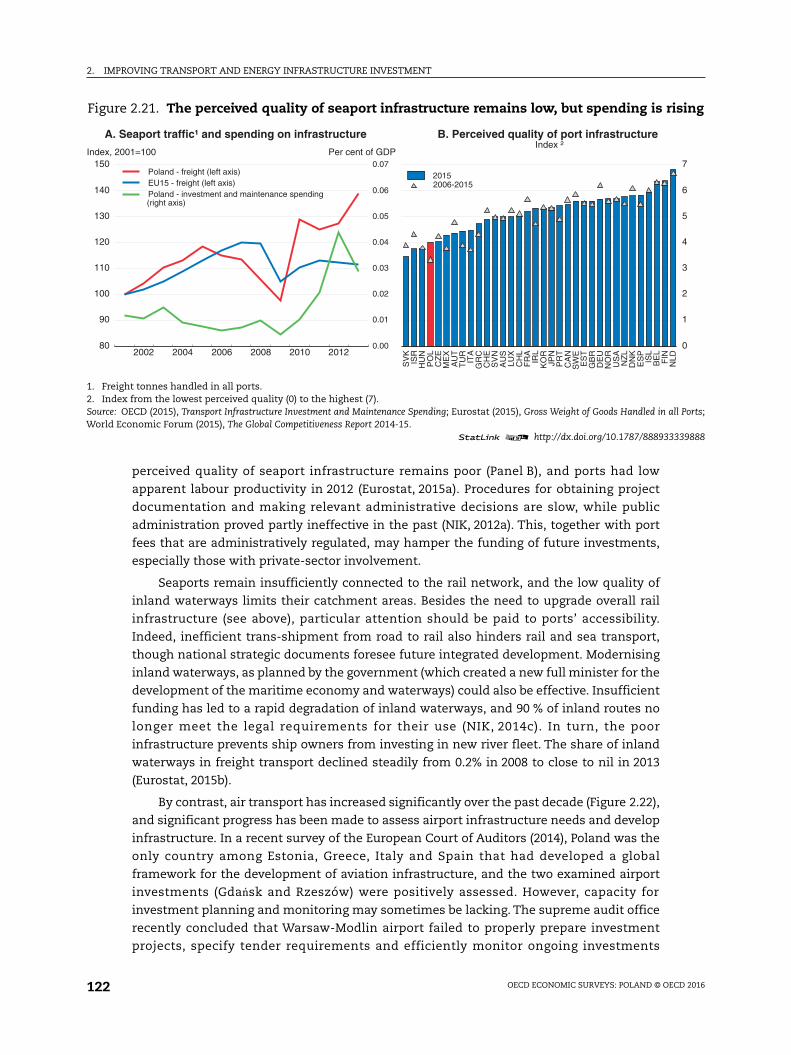
2. IMPROVING TRANSPORT AND ENERGY INFRASTRUCTURE INVESTMENT
OECD ECONOMIC SURVEYS: POLAND © OECD 2016122
perceived quality of seaport infrastructure remains poor (Panel B), and ports had low
apparent labour productivity in 2012 (Eurostat, 2015a). Procedures for obtaining project
documentation and making relevant administrative decisions are slow, while public
administration proved partly ineffective in the past (NIK, 2012a). This, together with port
fees that are administratively regulated, may hamper the funding of future investments,
especially those with private-sector involvement.
Seaports remain insufficiently connected to the rail network, and the low quality of
inland waterways limits their catchment areas. Besides the need to upgrade overall rail
infrastructure (see above), particular attention should be paid to ports’ accessibility.
Indeed, inefficient trans-shipment from road to rail also hinders rail and sea transport,
though national strategic documents foresee future integrated development. Modernising
inland waterways, as planned by the government (which created a new full minister for the
development of the maritime economy and waterways) could also be effective. Insufficient
funding has led to a rapid degradation of inland waterways, and 90 % of inland routes no
longer meet the legal requirements for their use (NIK, 2014c). In turn, the poor
infrastructure prevents ship owners from investing in new river fleet. The share of inland
waterways in freight transport declined steadily from 0.2% in 2008 to close to nil in 2013
(Eurostat, 2015b).
By contrast, air transport has increased significantly over the past decade (Figure 2.22),
and significant progress has been made to assess airport infrastructure needs and develop
infrastructure. In a recent survey of the European Court of Auditors (2014), Poland was the
only country among Estonia, Greece, Italy and Spain that had developed a global
framework for the development of aviation infrastructure, and the two examined airport
investments (Gdańsk and Rzeszów) were positively assessed. However, capacity for
investment planning and monitoring may sometimes be lacking. The supreme audit office
recently concluded that Warsaw-Modlin airport failed to properly prepare investment
projects, specify tender requirements and efficiently monitor ongoing investments
Figure 2.21. The perceived quality of seaport infrastructure remains low, but spending is rising
1. Freight tonnes handled in all ports.2. Index from the lowest perceived quality (0) to the highest (7).Source: OECD (2015), Transport Infrastructure Investment and Maintenance Spending; Eurostat (2015), Gross Weight of Goods Handled in all Ports;World Economic Forum (2015), The Global Competitiveness Report 2014-15.
1 2 http://dx.doi.org/10.1787/888933339888
0
1
2
3
4
5
6
7
SV
KIS
RH
UN
PO
LC
ZE
ME
XA
UT
TU
RIT
AG
RC
CH
ES
VN
AU
SLU
XC
HL
FR
AIR
LK
OR
JPN
PR
TC
AN
SW
EE
ST
GB
RD
EU
NO
RU
SA
NZ
LD
NK
ES
PIS
LB
EL
FIN
NLD
2006-20152015
B. Perceived quality of port infrastructureIndex ²
2002 2004 2006 2008 2010 201280
90
100
110
120
130
140
150Index, 2001=100
0.00
0.01
0.02
0.03
0.04
0.05
0.06
0.07Per cent of GDP
(right axis)
Poland - freight (left axis)EU15 - freight (left axis)Poland - investment and maintenance spending
A. Seaport traffic¹ and spending on infrastructure
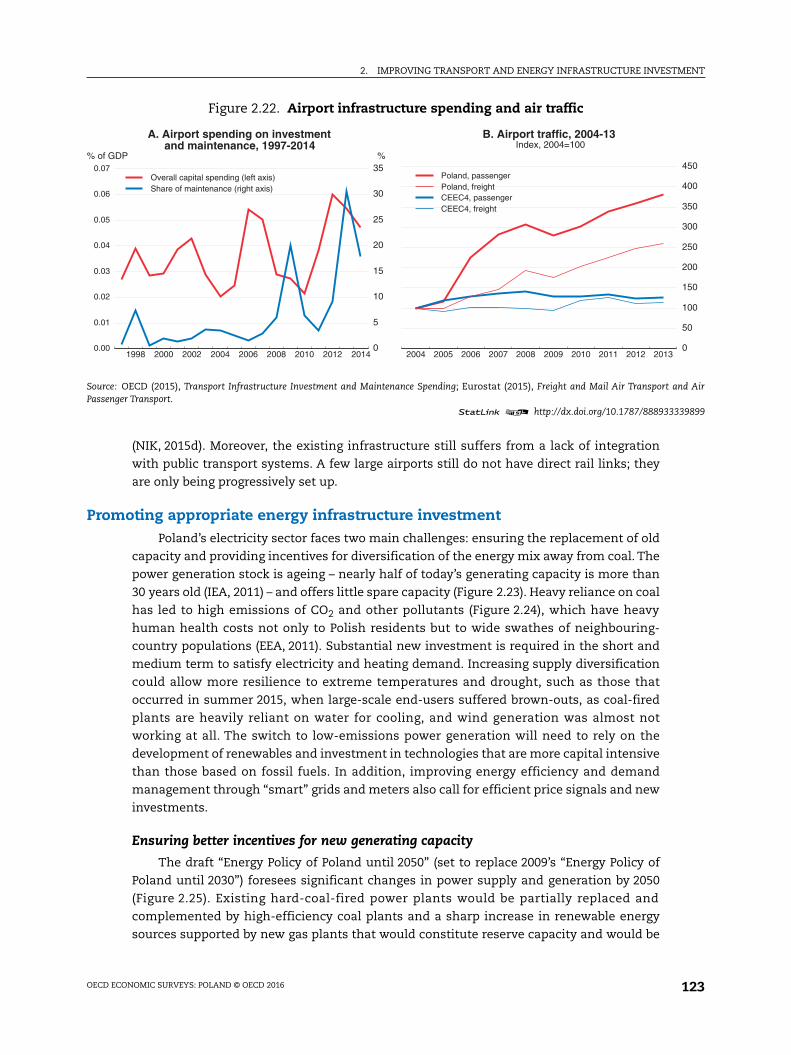
2. IMPROVING TRANSPORT AND ENERGY INFRASTRUCTURE INVESTMENT
OECD ECONOMIC SURVEYS: POLAND © OECD 2016 123
(NIK, 2015d). Moreover, the existing infrastructure still suffers from a lack of integration
with public transport systems. A few large airports still do not have direct rail links; they
are only being progressively set up.
Promoting appropriate energy infrastructure investmentPoland’s electricity sector faces two main challenges: ensuring the replacement of old
capacity and providing incentives for diversification of the energy mix away from coal. The
power generation stock is ageing – nearly half of today’s generating capacity is more than
30 years old (IEA, 2011) – and offers little spare capacity (Figure 2.23). Heavy reliance on coal
has led to high emissions of CO2 and other pollutants (Figure 2.24), which have heavy
human health costs not only to Polish residents but to wide swathes of neighbouring-
country populations (EEA, 2011). Substantial new investment is required in the short and
medium term to satisfy electricity and heating demand. Increasing supply diversification
could allow more resilience to extreme temperatures and drought, such as those that
occurred in summer 2015, when large-scale end-users suffered brown-outs, as coal-fired
plants are heavily reliant on water for cooling, and wind generation was almost not
working at all. The switch to low-emissions power generation will need to rely on the
development of renewables and investment in technologies that are more capital intensive
than those based on fossil fuels. In addition, improving energy efficiency and demand
management through “smart” grids and meters also call for efficient price signals and new
investments.
Ensuring better incentives for new generating capacity
The draft “Energy Policy of Poland until 2050” (set to replace 2009’s “Energy Policy of
Poland until 2030”) foresees significant changes in power supply and generation by 2050
(Figure 2.25). Existing hard-coal-fired power plants would be partially replaced and
complemented by high-efficiency coal plants and a sharp increase in renewable energy
sources supported by new gas plants that would constitute reserve capacity and would be
Figure 2.22. Airport infrastructure spending and air traffic
Source: OECD (2015), Transport Infrastructure Investment and Maintenance Spending; Eurostat (2015), Freight and Mail Air Transport and AirPassenger Transport.
1 2 http://dx.doi.org/10.1787/888933339899
1998 2000 2002 2004 2006 2008 2010 2012 20140.00
0.01
0.02
0.03
0.04
0.05
0.06
0.07
% of GDP
0
5
10
15
20
25
30
35%
Overall capital spending (left axis)Share of maintenance (right axis)
A. Airport spending on investmentand maintenance, 1997-2014
2004 2005 2006 2007 2008 2009 2010 2011 2012 2013
0
50
100
150
200
250
300
350
400
450 Poland, passengerPoland, freightCEEC4, passengerCEEC4, freight
B. Airport traffic, 2004-13Index, 2004=100
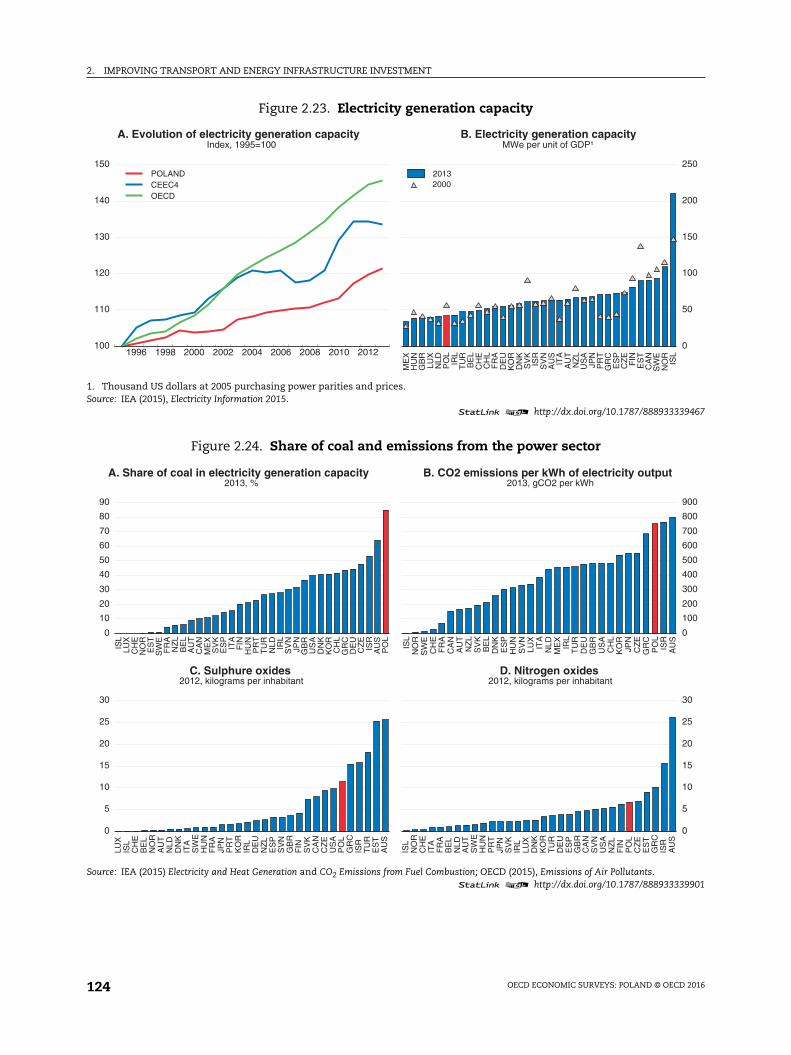
2. IMPROVING TRANSPORT AND ENERGY INFRASTRUCTURE INVESTMENT
OECD ECONOMIC SURVEYS: POLAND © OECD 2016124
Figure 2.23. Electricity generation capacity
1. Thousand US dollars at 2005 purchasing power parities and prices.Source: IEA (2015), Electricity Information 2015.
1 2 http://dx.doi.org/10.1787/888933339467
Figure 2.24. Share of coal and emissions from the power sector
Source: IEA (2015) Electricity and Heat Generation and CO2 Emissions from Fuel Combustion; OECD (2015), Emissions of Air Pollutants.1 2 http://dx.doi.org/10.1787/888933339901
0
50
100
150
200
250
ME
XH
UN
GB
RLU
XN
LDP
OL
IRL
TU
RB
EL
CH
EC
HL
FR
AD
EU
KO
RD
NK
SV
KIS
RS
VN
AU
SIT
AA
UT
NZ
LU
SA
JPN
PR
TG
RC
ES
PC
ZE
FIN
ES
TC
AN
SW
EN
OR
ISL
20002013
B. Electricity generation capacityMWe per unit of GDP¹
1996 1998 2000 2002 2004 2006 2008 2010 2012100
110
120
130
140
150 POLANDCEEC4OECD
A. Evolution of electricity generation capacityIndex, 1995=100
0
10
20
30
40
50
60
70
80
90
ISL
LUX
CH
EN
OR
ES
TS
WE
FR
AN
ZL
BE
LA
UT
CA
NM
EX
SV
KE
SP
ITA
FIN
HU
NP
RT
TU
RN
LD IRL
SV
NJP
NG
BR
US
AD
NK
KO
RC
HL
GR
CD
EU
CZ
EIS
RA
US
PO
L
A. Share of coal in electricity generation capacity2013, %
0
100
200
300
400
500
600
700
800
900
ISL
NO
RS
WE
CH
EF
RA
CA
NA
UT
NZ
LS
VK
BE
LD
NK
ES
PH
UN
SV
NLU
XIT
AN
LDM
EX
IRL
TU
RD
EU
GB
RU
SA
CH
LK
OR
JPN
CZ
EG
RC
PO
LIS
RA
US
B. CO2 emissions per kWh of electricity output2013, gCO2 per kWh
0
5
10
15
20
25
30
LUX
ISL
CH
EB
EL
NO
RA
UT
NLD
DN
KIT
AS
WE
HU
NF
RA
JPN
PR
TK
OR
IRL
DE
UN
ZL
ES
PS
VN
GB
RF
INS
VK
CA
NC
ZE
US
AP
OL
GR
CIS
RT
UR
ES
TA
US
C. Sulphure oxides2012, kilograms per inhabitant
0
5
10
15
20
25
30
ISL
NO
RC
HE
ITA
FR
AB
EL
NLD
AU
TS
WE
HU
NP
RT
JPN
SV
KIR
LLU
XD
NK
KO
RT
UR
DE
UE
SP
GB
RC
AN
SV
NU
SA
NZ
LF
INP
OL
CZ
EE
ST
GR
CIS
RA
US
D. Nitrogen oxides2012, kilograms per inhabitant
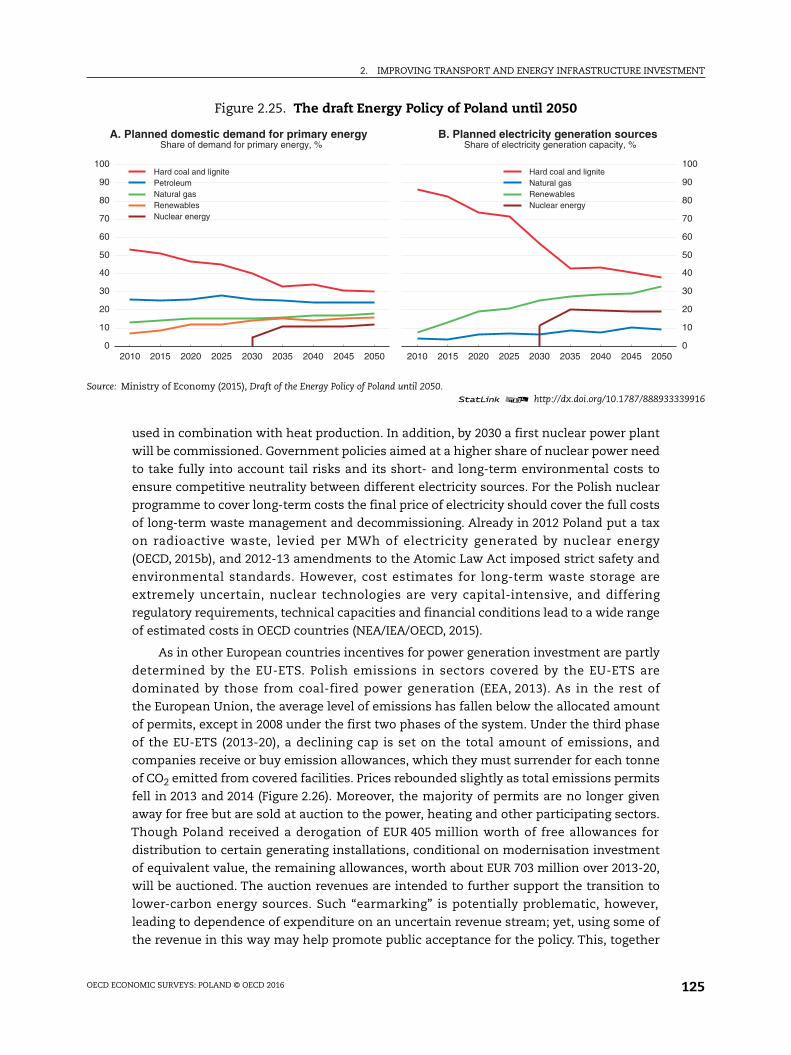
2. IMPROVING TRANSPORT AND ENERGY INFRASTRUCTURE INVESTMENT
OECD ECONOMIC SURVEYS: POLAND © OECD 2016 125
used in combination with heat production. In addition, by 2030 a first nuclear power plant
will be commissioned. Government policies aimed at a higher share of nuclear power need
to take fully into account tail risks and its short- and long-term environmental costs to
ensure competitive neutrality between different electricity sources. For the Polish nuclear
programme to cover long-term costs the final price of electricity should cover the full costs
of long-term waste management and decommissioning. Already in 2012 Poland put a tax
on radioactive waste, levied per MWh of electricity generated by nuclear energy
(OECD, 2015b), and 2012-13 amendments to the Atomic Law Act imposed strict safety and
environmental standards. However, cost estimates for long-term waste storage are
extremely uncertain, nuclear technologies are very capital-intensive, and differing
regulatory requirements, technical capacities and financial conditions lead to a wide range
of estimated costs in OECD countries (NEA/IEA/OECD, 2015).
As in other European countries incentives for power generation investment are partly
determined by the EU-ETS. Polish emissions in sectors covered by the EU-ETS are
dominated by those from coal-fired power generation (EEA, 2013). As in the rest of
the European Union, the average level of emissions has fallen below the allocated amount
of permits, except in 2008 under the first two phases of the system. Under the third phase
of the EU-ETS (2013-20), a declining cap is set on the total amount of emissions, and
companies receive or buy emission allowances, which they must surrender for each tonne
of CO2 emitted from covered facilities. Prices rebounded slightly as total emissions permits
fell in 2013 and 2014 (Figure 2.26). Moreover, the majority of permits are no longer given
away for free but are sold at auction to the power, heating and other participating sectors.
Though Poland received a derogation of EUR 405 million worth of free allowances for
distribution to certain generating installations, conditional on modernisation investment
of equivalent value, the remaining allowances, worth about EUR 703 million over 2013-20,
will be auctioned. The auction revenues are intended to further support the transition to
lower-carbon energy sources. Such “earmarking” is potentially problematic, however,
leading to dependence of expenditure on an uncertain revenue stream; yet, using some of
the revenue in this way may help promote public acceptance for the policy. This, together
Figure 2.25. The draft Energy Policy of Poland until 2050
Source: Ministry of Economy (2015), Draft of the Energy Policy of Poland until 2050.1 2 http://dx.doi.org/10.1787/888933339916
0
10
20
30
40
50
60
70
80
90
100
2010 2015 2020 2025 2030 2035 2040 2045 2050
Hard coal and lignitePetroleumNatural gasRenewablesNuclear energy
A. Planned domestic demand for primary energyShare of demand for primary energy, %
0
10
20
30
40
50
60
70
80
90
100
2010 2015 2020 2025 2030 2035 2040 2045 2050
Hard coal and ligniteNatural gasRenewablesNuclear energy
B. Planned electricity generation sourcesShare of electricity generation capacity, %
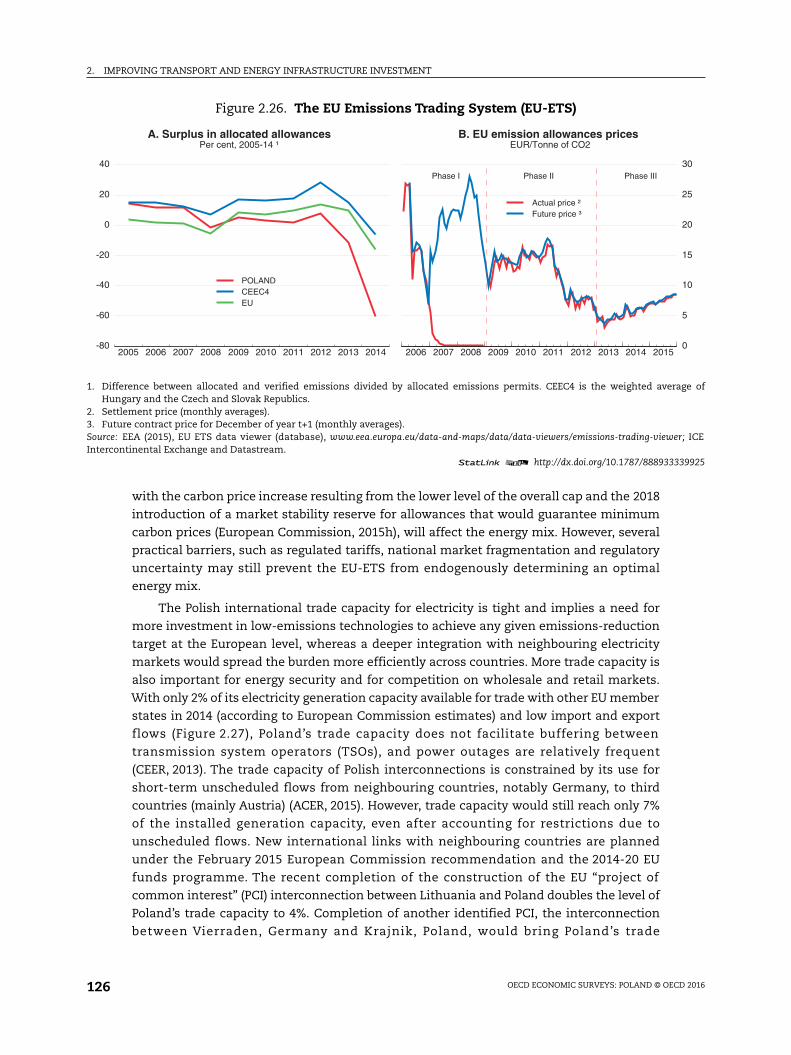
2. IMPROVING TRANSPORT AND ENERGY INFRASTRUCTURE INVESTMENT
OECD ECONOMIC SURVEYS: POLAND © OECD 2016126
with the carbon price increase resulting from the lower level of the overall cap and the 2018
introduction of a market stability reserve for allowances that would guarantee minimum
carbon prices (European Commission, 2015h), will affect the energy mix. However, several
practical barriers, such as regulated tariffs, national market fragmentation and regulatory
uncertainty may still prevent the EU-ETS from endogenously determining an optimal
energy mix.
The Polish international trade capacity for electricity is tight and implies a need for
more investment in low-emissions technologies to achieve any given emissions-reduction
target at the European level, whereas a deeper integration with neighbouring electricity
markets would spread the burden more efficiently across countries. More trade capacity is
also important for energy security and for competition on wholesale and retail markets.
With only 2% of its electricity generation capacity available for trade with other EU member
states in 2014 (according to European Commission estimates) and low import and export
flows (Figure 2.27), Poland’s trade capacity does not facilitate buffering between
transmission system operators (TSOs), and power outages are relatively frequent
(CEER, 2013). The trade capacity of Polish interconnections is constrained by its use for
short-term unscheduled flows from neighbouring countries, notably Germany, to third
countries (mainly Austria) (ACER, 2015). However, trade capacity would still reach only 7%
of the installed generation capacity, even after accounting for restrictions due to
unscheduled flows. New international links with neighbouring countries are planned
under the February 2015 European Commission recommendation and the 2014-20 EU
funds programme. The recent completion of the construction of the EU “project of
common interest” (PCI) interconnection between Lithuania and Poland doubles the level of
Poland’s trade capacity to 4%. Completion of another identified PCI, the interconnection
between Vierraden, Germany and Krajnik, Poland, would bring Poland’s trade
Figure 2.26. The EU Emissions Trading System (EU-ETS)
1. Difference between allocated and verified emissions divided by allocated emissions permits. CEEC4 is the weighted average ofHungary and the Czech and Slovak Republics.
2. Settlement price (monthly averages).3. Future contract price for December of year t+1 (monthly averages).Source: EEA (2015), EU ETS data viewer (database), www.eea.europa.eu/data-and-maps/data/data-viewers/emissions-trading-viewer; ICEIntercontinental Exchange and Datastream.
1 2 http://dx.doi.org/10.1787/888933339925
2005 2006 2007 2008 2009 2010 2011 2012 2013 2014-80
-60
-40
-20
0
20
40
POLANDCEEC4EU
A. Surplus in allocated allowancesPer cent, 2005-14 ¹
2006 2007 2008 2009 2010 2011 2012 2013 2014 2015
0
5
10
15
20
25
30
Phase I Phase II Phase III
Actual price ²Future price ³
B. EU emission allowances pricesEUR/Tonne of CO2
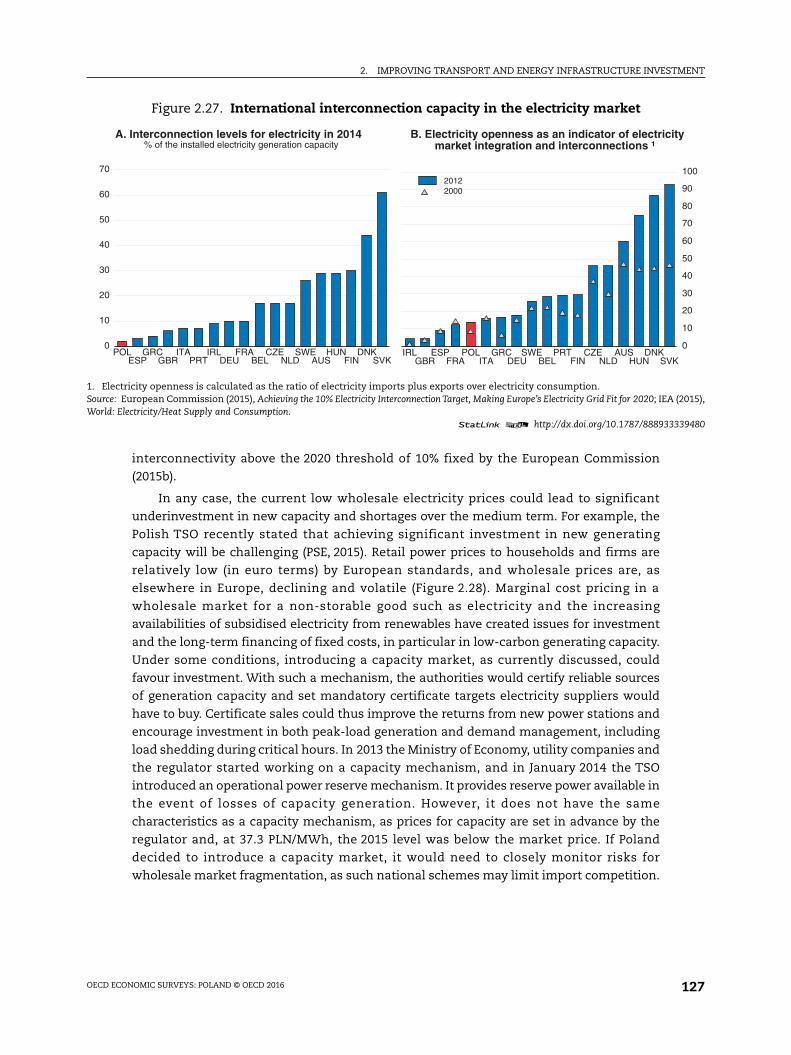
2. IMPROVING TRANSPORT AND ENERGY INFRASTRUCTURE INVESTMENT
OECD ECONOMIC SURVEYS: POLAND © OECD 2016 127
interconnectivity above the 2020 threshold of 10% fixed by the European Commission
(2015b).
In any case, the current low wholesale electricity prices could lead to significant
underinvestment in new capacity and shortages over the medium term. For example, the
Polish TSO recently stated that achieving significant investment in new generating
capacity will be challenging (PSE, 2015). Retail power prices to households and firms are
relatively low (in euro terms) by European standards, and wholesale prices are, as
elsewhere in Europe, declining and volatile (Figure 2.28). Marginal cost pricing in a
wholesale market for a non-storable good such as electricity and the increasing
availabilities of subsidised electricity from renewables have created issues for investment
and the long-term financing of fixed costs, in particular in low-carbon generating capacity.
Under some conditions, introducing a capacity market, as currently discussed, could
favour investment. With such a mechanism, the authorities would certify reliable sources
of generation capacity and set mandatory certificate targets electricity suppliers would
have to buy. Certificate sales could thus improve the returns from new power stations and
encourage investment in both peak-load generation and demand management, including
load shedding during critical hours. In 2013 the Ministry of Economy, utility companies and
the regulator started working on a capacity mechanism, and in January 2014 the TSO
introduced an operational power reserve mechanism. It provides reserve power available in
the event of losses of capacity generation. However, it does not have the same
characteristics as a capacity mechanism, as prices for capacity are set in advance by the
regulator and, at 37.3 PLN/MWh, the 2015 level was below the market price. If Poland
decided to introduce a capacity market, it would need to closely monitor risks for
wholesale market fragmentation, as such national schemes may limit import competition.
Figure 2.27. International interconnection capacity in the electricity market
1. Electricity openness is calculated as the ratio of electricity imports plus exports over electricity consumption.Source: European Commission (2015), Achieving the 10% Electricity Interconnection Target, Making Europe’s Electricity Grid Fit for 2020; IEA (2015),World: Electricity/Heat Supply and Consumption.
1 2 http://dx.doi.org/10.1787/888933339480
0
10
20
30
40
50
60
70
POLESP
GRCGBR
ITAPRT
IRLDEU
FRABEL
CZENLD
SWEAUS
HUNFIN
DNKSVK
A. Interconnection levels for electricity in 2014% of the installed electricity generation capacity
0
10
20
30
40
50
60
70
80
90
100
IRLGBR
ESPFRA
POLITA
GRCDEU
SWEBEL
PRTFIN
CZENLD
AUSHUN
DNKSVK
20002012
B. Electricity openness as an indicator of electricitymarket integration and interconnections ¹
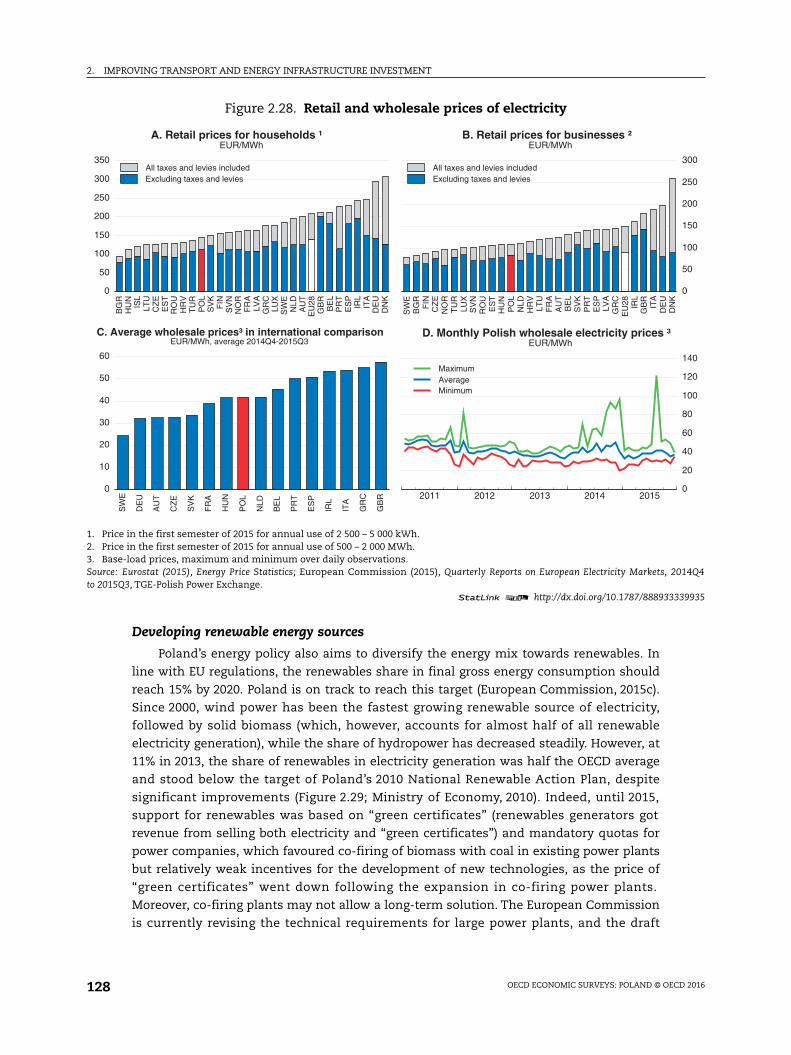
2. IMPROVING TRANSPORT AND ENERGY INFRASTRUCTURE INVESTMENT
OECD ECONOMIC SURVEYS: POLAND © OECD 2016128
Developing renewable energy sources
Poland’s energy policy also aims to diversify the energy mix towards renewables. In
line with EU regulations, the renewables share in final gross energy consumption should
reach 15% by 2020. Poland is on track to reach this target (European Commission, 2015c).
Since 2000, wind power has been the fastest growing renewable source of electricity,
followed by solid biomass (which, however, accounts for almost half of all renewable
electricity generation), while the share of hydropower has decreased steadily. However, at
11% in 2013, the share of renewables in electricity generation was half the OECD average
and stood below the target of Poland’s 2010 National Renewable Action Plan, despite
significant improvements (Figure 2.29; Ministry of Economy, 2010). Indeed, until 2015,
support for renewables was based on “green certificates” (renewables generators got
revenue from selling both electricity and “green certificates”) and mandatory quotas for
power companies, which favoured co-firing of biomass with coal in existing power plants
but relatively weak incentives for the development of new technologies, as the price of
“green certificates” went down following the expansion in co-firing power plants.
Moreover, co-firing plants may not allow a long-term solution. The European Commission
is currently revising the technical requirements for large power plants, and the draft
Figure 2.28. Retail and wholesale prices of electricity
1. Price in the first semester of 2015 for annual use of 2 500 – 5 000 kWh.2. Price in the first semester of 2015 for annual use of 500 – 2 000 MWh.3. Base-load prices, maximum and minimum over daily observations.Source: Eurostat (2015), Energy Price Statistics; European Commission (2015), Quarterly Reports on European Electricity Markets, 2014Q4to 2015Q3, TGE-Polish Power Exchange.
1 2 http://dx.doi.org/10.1787/888933339935
0
50
100
150
200
250
300
350
BG
RH
UN
ISL
LTU
CZ
EE
ST
RO
UH
RV
TU
RP
OL
SV
KF
INS
VN
NO
RF
RA
LVA
GR
CLU
XS
WE
NLD
AU
TE
U28
GB
RB
EL
PR
TE
SP
IRL
ITA
DE
UD
NK
Excluding taxes and leviesAll taxes and levies included
A. Retail prices for households ¹EUR/MWh
0
50
100
150
200
250
300
SW
EB
GR
FIN
CZ
EN
OR
TU
RLU
XS
VN
RO
UE
ST
HU
NP
OL
NLD
HR
VLT
UF
RA
AU
TB
EL
SV
KP
RT
ES
PLV
AG
RC
EU
28 IRL
GB
RIT
AD
EU
DN
K
Excluding taxes and leviesAll taxes and levies included
B. Retail prices for businesses ²EUR/MWh
0
10
20
30
40
50
60
SW
E
DE
U
AU
T
CZ
E
SV
K
FR
A
HU
N
PO
L
NLD
BE
L
PR
T
ES
P
IRL
ITA
GR
C
GB
R
C. Average wholesale prices³ in international comparisonEUR/MWh, average 2014Q4-2015Q3
2011 2012 2013 2014 2015
0
20
40
60
80
100
120
140
MinimumAverageMaximum
D. Monthly Polish wholesale electricity prices ³EUR/MWh
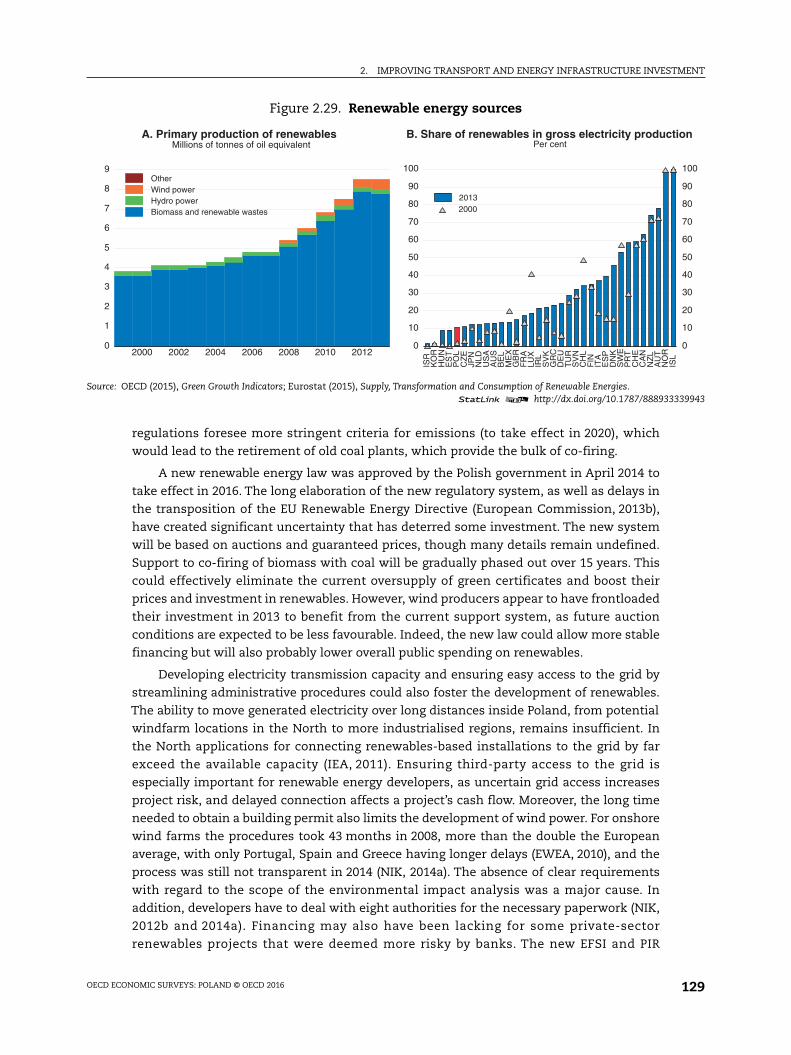
2. IMPROVING TRANSPORT AND ENERGY INFRASTRUCTURE INVESTMENT
OECD ECONOMIC SURVEYS: POLAND © OECD 2016 129
regulations foresee more stringent criteria for emissions (to take effect in 2020), which
would lead to the retirement of old coal plants, which provide the bulk of co-firing.
A new renewable energy law was approved by the Polish government in April 2014 to
take effect in 2016. The long elaboration of the new regulatory system, as well as delays in
the transposition of the EU Renewable Energy Directive (European Commission, 2013b),
have created significant uncertainty that has deterred some investment. The new system
will be based on auctions and guaranteed prices, though many details remain undefined.
Support to co-firing of biomass with coal will be gradually phased out over 15 years. This
could effectively eliminate the current oversupply of green certificates and boost their
prices and investment in renewables. However, wind producers appear to have frontloaded
their investment in 2013 to benefit from the current support system, as future auction
conditions are expected to be less favourable. Indeed, the new law could allow more stable
financing but will also probably lower overall public spending on renewables.
Developing electricity transmission capacity and ensuring easy access to the grid by
streamlining administrative procedures could also foster the development of renewables.
The ability to move generated electricity over long distances inside Poland, from potential
windfarm locations in the North to more industrialised regions, remains insufficient. In
the North applications for connecting renewables-based installations to the grid by far
exceed the available capacity (IEA, 2011). Ensuring third-party access to the grid is
especially important for renewable energy developers, as uncertain grid access increases
project risk, and delayed connection affects a project’s cash flow. Moreover, the long time
needed to obtain a building permit also limits the development of wind power. For onshore
wind farms the procedures took 43 months in 2008, more than the double the European
average, with only Portugal, Spain and Greece having longer delays (EWEA, 2010), and the
process was still not transparent in 2014 (NIK, 2014a). The absence of clear requirements
with regard to the scope of the environmental impact analysis was a major cause. In
addition, developers have to deal with eight authorities for the necessary paperwork (NIK,
2012b and 2014a). Financing may also have been lacking for some private-sector
renewables projects that were deemed more risky by banks. The new EFSI and PIR
Figure 2.29. Renewable energy sources
Source: OECD (2015), Green Growth Indicators; Eurostat (2015), Supply, Transformation and Consumption of Renewable Energies.1 2 http://dx.doi.org/10.1787/888933339943
2000 2002 2004 2006 2008 2010 20120
1
2
3
4
5
6
7
8
9
Biomass and renewable wastesHydro powerWind powerOther
A. Primary production of renewablesMillions of tonnes of oil equivalent
0
10
20
30
40
50
60
70
80
90
100
0
10
20
30
40
50
60
70
80
90
100
ISR
KO
RH
UN
ES
TP
OL
CZ
EJP
NN
LDU
SA
AU
SB
EL
ME
XG
BR
FR
ALU
XIR
LS
VK
GR
CD
EU
TU
RS
VN
CH
LF
INIT
AE
SP
DN
KS
WE
PR
TC
HE
CA
NN
ZL
AU
TN
OR
ISL
20002013
B. Share of renewables in gross electricity productionPer cent
2. IMPROVING TRANSPORT AND ENERGY INFRASTRUCTURE INVESTMENT
OECD ECONOMIC SURVEYS: POLAND © OECD 2016130
(Boxes 2.2 and 2.3) could finance new renewables capacity.
Developing high-efficiency combined heat and power (CHP)/cogeneration using
renewable energies and gas, as planned in the draft Energy Policy of Poland until 2050,
would also help increase energy efficiency and lower urban air pollution. District heating is
Poland’s most common form of heat supply and holds tremendous potential for
cogeneration and reducing GHG emissions (CODE2, 2014). Moreover, new buildings have to
be connected to existing heating networks, unless they can be connected to a higher-
energy-efficiency heating source. However, 88% of the existing CHP plants rely on coal
(Ministry of Economy, 2012), while low wholesale electricity and heat prices limit
investment opportunities. Since 2007, another tradable certificate system, comparable to
the “green certificates” for renewables, forces electricity distributors to buy some CHP-
produced electricity from high-efficiency plants and small producers. In addition, CHP
plants benefit from reduced connection fees to the electricity grid. However, regulatory
uncertainty has been high: the tradable certificate schemes stopped in 2013 but were
reintroduced in 2014 for four years. This led to low and volatile prices of CHP certificates
and limited new investments. Moreover, municipalities, responsible for defining local
energy and heat plans, have often failed to develop or implement such plans, in the
absence of skilled staff and legal sanctions (Ministry of Economy, 2012). Defining a stable
support scheme beyond 2018 and providing expert support would encourage investment in
new CHP plants.
Raising energy efficiency
There is significant potential to improve efficiency in the energy sector, notably by
strengthening yet another system of certificates, this one labelled “white”. According to the
Energy Efficiency Law, passed in April 2011, energy (electricity, gas and heat) suppliers have
to improve efficiency via reducing losses in production, distribution, transmission and the
end-use sector. The white certificate programme was eventually established in 2013 to
favour enhancement of energy efficiency undertakings (OECD, 2012a; Égert, 2012). The law
requires that claimed efficiency gains be subject to energy-savings audits, for which firms
will be rewarded with such certificates. If they miss their targets, they have to either
purchase white certificates or pay a substitution fee. Though the system is supposed to be
the main pillar of energy efficiency improvements, results of the first tender were
disappointing: only 1.4 % of the obligation was met using white certificates, the rest being
met by payment of the substitution fee (OECD, 2015b).
Poland has made some progress in boosting the energy efficiency of residential
buildings. However, energy consumption for space heating has been stable at a high level
and represents a larger share of household income than in most OECD countries, even
those with similar GDP per capita (Figure 2.30). Energy efficiency remains low due to the
continuing use of low-efficiency individual boilers for heating and hot water, coupled with
high heat losses because of poor thermal insulation in some buildings (IEA, 2011).
Moreover, the exposure of the urban population to air pollution by particulate matter
continues to be well above the EU average, and the number of deaths attributable to indoor
air pollution from solid fuels is high.
The Thermo-Modernisation Fund, overseen by the Ministry of Infrastructure and
Development and managed by BGK, has been the key instrument for thermal improvement
investment in existing buildings since 1998 (OECD, 2015b). It has provided subsidised loans
mainly to building owners and local governments to renovate apartment buildings and has
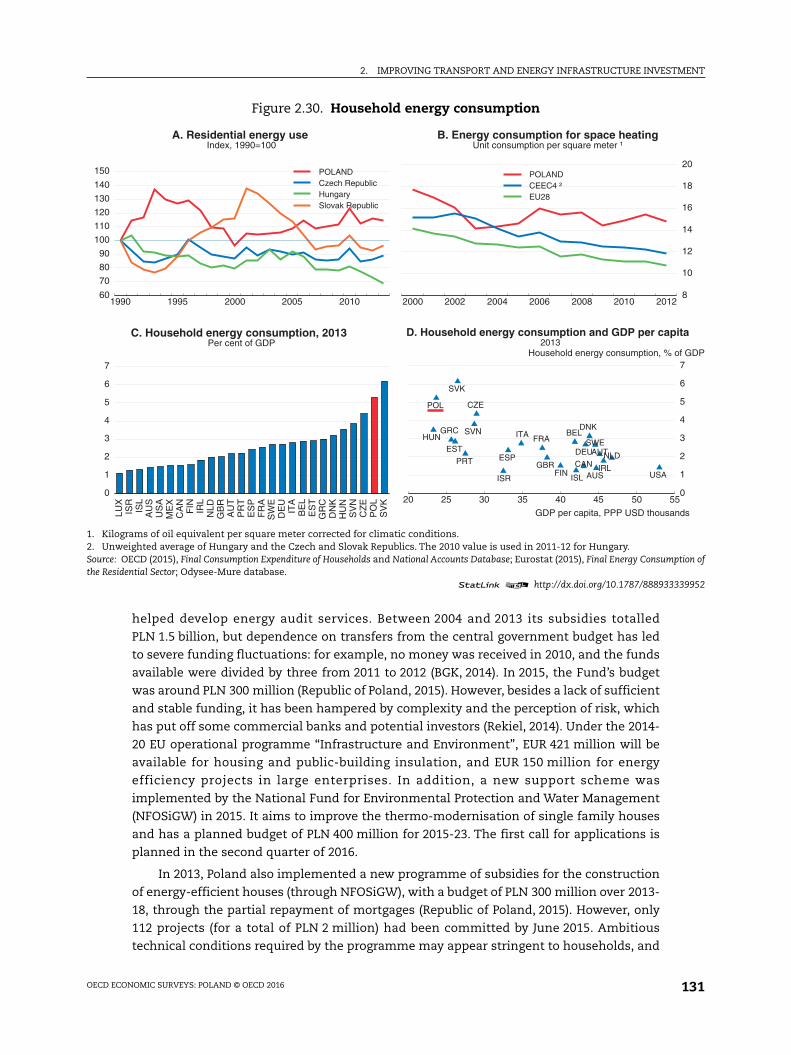
2. IMPROVING TRANSPORT AND ENERGY INFRASTRUCTURE INVESTMENT
OECD ECONOMIC SURVEYS: POLAND © OECD 2016 131
helped develop energy audit services. Between 2004 and 2013 its subsidies totalled
PLN 1.5 billion, but dependence on transfers from the central government budget has led
to severe funding fluctuations: for example, no money was received in 2010, and the funds
available were divided by three from 2011 to 2012 (BGK, 2014). In 2015, the Fund’s budget
was around PLN 300 million (Republic of Poland, 2015). However, besides a lack of sufficient
and stable funding, it has been hampered by complexity and the perception of risk, which
has put off some commercial banks and potential investors (Rekiel, 2014). Under the 2014-
20 EU operational programme “Infrastructure and Environment”, EUR 421 million will be
available for housing and public-building insulation, and EUR 150 million for energy
efficiency projects in large enterprises. In addition, a new support scheme was
implemented by the National Fund for Environmental Protection and Water Management
(NFOSiGW) in 2015. It aims to improve the thermo-modernisation of single family houses
and has a planned budget of PLN 400 million for 2015-23. The first call for applications is
planned in the second quarter of 2016.
In 2013, Poland also implemented a new programme of subsidies for the construction
of energy-efficient houses (through NFOSiGW), with a budget of PLN 300 million over 2013-
18, through the partial repayment of mortgages (Republic of Poland, 2015). However, only
112 projects (for a total of PLN 2 million) had been committed by June 2015. Ambitious
technical conditions required by the programme may appear stringent to households, and
Figure 2.30. Household energy consumption
1. Kilograms of oil equivalent per square meter corrected for climatic conditions.2. Unweighted average of Hungary and the Czech and Slovak Republics. The 2010 value is used in 2011-12 for Hungary.Source: OECD (2015), Final Consumption Expenditure of Households and National Accounts Database; Eurostat (2015), Final Energy Consumption ofthe Residential Sector; Odysee-Mure database.
1 2 http://dx.doi.org/10.1787/888933339952
1990 1995 2000 2005 201060
70
80
90
100
110
120
130
140
150
POLANDCzech RepublicHungarySlovak Republic
A. Residential energy useIndex, 1990=100
2000 2002 2004 2006 2008 2010 2012
8
10
12
14
16
18
20 POLANDCEEC4 ²EU28
B. Energy consumption for space heatingUnit consumption per square meter ¹
0
1
2
3
4
5
6
7
LUX
ISR
ISL
AU
SU
SA
ME
XC
AN
FIN IRL
NLD
GB
RA
UT
PR
TE
SP
FR
AS
WE
DE
UIT
AB
EL
ES
TG
RC
DN
KH
UN
SV
NC
ZE
PO
LS
VK
C. Household energy consumption, 2013Per cent of GDP
20 25 30 35 40 45 50 550
1
2
3
4
5
6
7Household energy consumption, % of GDP
GDP per capita, PPP USD thousands
AUS
AUT
BEL
CAN
CZE
DNK
EST
FIN
FRA
DEU
GRCHUN
ISLIRL
ISR
ITA
NLD
POL
PRT
SVK
SVN
ESP
SWE
GBRUSA
D. Household energy consumption and GDP per capita2013
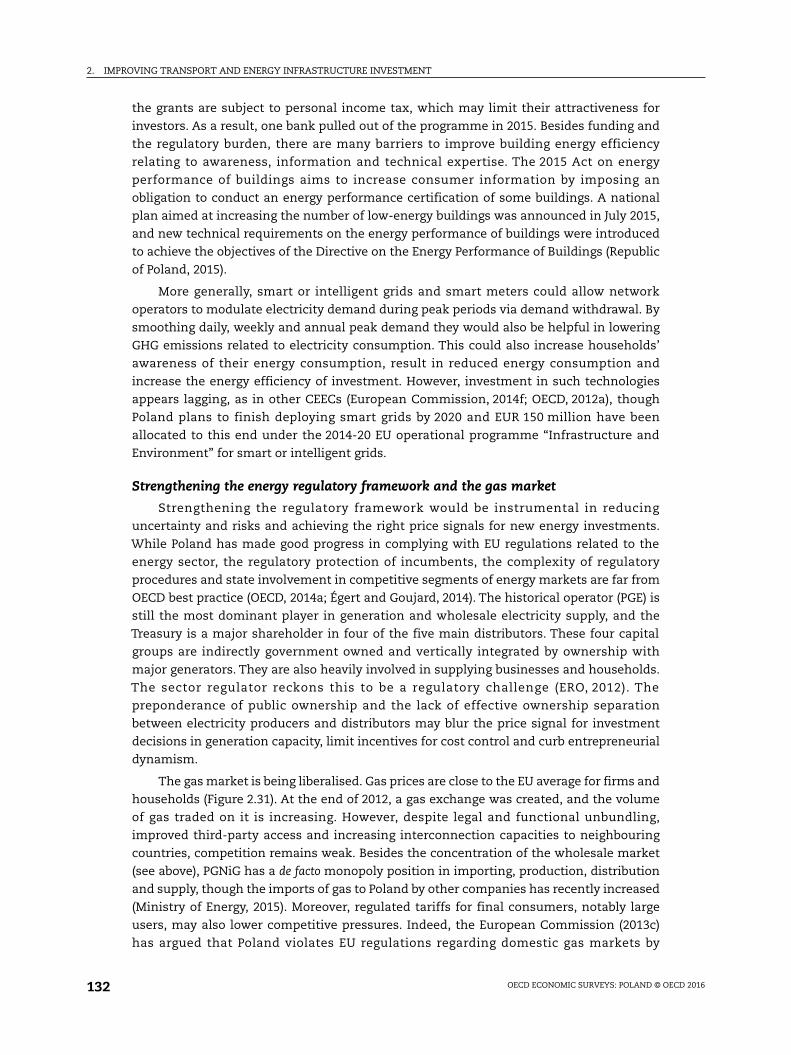
2. IMPROVING TRANSPORT AND ENERGY INFRASTRUCTURE INVESTMENT
OECD ECONOMIC SURVEYS: POLAND © OECD 2016132
the grants are subject to personal income tax, which may limit their attractiveness for
investors. As a result, one bank pulled out of the programme in 2015. Besides funding and
the regulatory burden, there are many barriers to improve building energy efficiency
relating to awareness, information and technical expertise. The 2015 Act on energy
performance of buildings aims to increase consumer information by imposing an
obligation to conduct an energy performance certification of some buildings. A national
plan aimed at increasing the number of low-energy buildings was announced in July 2015,
and new technical requirements on the energy performance of buildings were introduced
to achieve the objectives of the Directive on the Energy Performance of Buildings (Republic
of Poland, 2015).
More generally, smart or intelligent grids and smart meters could allow network
operators to modulate electricity demand during peak periods via demand withdrawal. By
smoothing daily, weekly and annual peak demand they would also be helpful in lowering
GHG emissions related to electricity consumption. This could also increase households’
awareness of their energy consumption, result in reduced energy consumption and
increase the energy efficiency of investment. However, investment in such technologies
appears lagging, as in other CEECs (European Commission, 2014f; OECD, 2012a), though
Poland plans to finish deploying smart grids by 2020 and EUR 150 million have been
allocated to this end under the 2014-20 EU operational programme “Infrastructure and
Environment” for smart or intelligent grids.
Strengthening the energy regulatory framework and the gas market
Strengthening the regulatory framework would be instrumental in reducing
uncertainty and risks and achieving the right price signals for new energy investments.
While Poland has made good progress in complying with EU regulations related to the
energy sector, the regulatory protection of incumbents, the complexity of regulatory
procedures and state involvement in competitive segments of energy markets are far from
OECD best practice (OECD, 2014a; Égert and Goujard, 2014). The historical operator (PGE) is
still the most dominant player in generation and wholesale electricity supply, and the
Treasury is a major shareholder in four of the five main distributors. These four capital
groups are indirectly government owned and vertically integrated by ownership with
major generators. They are also heavily involved in supplying businesses and households.
The sector regulator reckons this to be a regulatory challenge (ERO, 2012). The
preponderance of public ownership and the lack of effective ownership separation
between electricity producers and distributors may blur the price signal for investment
decisions in generation capacity, limit incentives for cost control and curb entrepreneurial
dynamism.
The gas market is being liberalised. Gas prices are close to the EU average for firms and
households (Figure 2.31). At the end of 2012, a gas exchange was created, and the volume
of gas traded on it is increasing. However, despite legal and functional unbundling,
improved third-party access and increasing interconnection capacities to neighbouring
countries, competition remains weak. Besides the concentration of the wholesale market
(see above), PGNiG has a de facto monopoly position in importing, production, distribution
and supply, though the imports of gas to Poland by other companies has recently increased
(Ministry of Energy, 2015). Moreover, regulated tariffs for final consumers, notably large
users, may also lower competitive pressures. Indeed, the European Commission (2013c)
has argued that Poland violates EU regulations regarding domestic gas markets by
2. IMPROVING TRANSPORT AND ENERGY INFRASTRUCTURE INVESTMENT
OECD ECONOMIC SURVEYS: POLAND © OECD 2016 133
regulating gas prices for users other than households, and the European Court of Justice
ruled that Poland was not compliant with the EU Gas Directive in September 2015. In 2013,
78 % of gas supplies were imported under the long-term Yamal contract from Russia
(ERO, 2014), and PGNiG was selling gas to consumers at regulated tariffs below the
wholesale price of its Russian imports.
Poland’s capacity to import gas from other EU countries has risen, but barriers to trade
(including import diversification requirements) should be revised. New gas
interconnections and expansion of the existing ones with neighbouring countries would
ensure a more diversified gas supply. In turn, this could foster the development of
renewables in electricity generation capacity by offering temporary peak-load capacity.
Poland has improved considerably its interconnections with Germany, and the investment
enabling physical reverse flows at the border with Germany was completed in 2014.
In 2016, the liquefied natural gas (LNG) terminal in Swinoujscie (owned by Polskie LNG S.A.,
a subsidiary of the gas transmission operator, OGP Gaz-System S.A.) will allow gas to be
imported from Qatar. The gas transmission operator plans further investment in
interconnections, notably with the Czech and Slovak Republics and Lithuania, and intends
to strengthen the domestic network, in particular by expanding distribution in the West
and South.
Figure 2.31. The gas sector
1. All taxies and levies included. Price for annual use of 2 778-27 778 MWh.2. All taxies and levies included. Price in the first semester of 2015 for annual use of 5.6-55.6 MWh.3. Unweighted average of Hungary and the Czech and Slovak Republics.Source: Eurostat (2015), Energy Price Statistics.
1 2 http://dx.doi.org/10.1787/888933339966
0
20
40
60
80
100
120
RO
UH
UN
TU
RLT
UE
ST
HR
VB
GR
LVA
LUX
SV
KP
OL
CZ
EB
EL
GB
RE
U28 IR
LD
EU
GR
CS
VN
FR
AA
UT
ES
PN
LD ITA
DN
KP
RT
SW
E
Excluding taxes and leviesAll taxes and levies included
B. Retail price for households ²EUR/MWh
2007 2008 2009 2010 2011 2012 2013 201430
35
40
45
50
55
60 PolandCEEC4 ³EU28
A. Retail price for firms ¹EUR/MWh

2. IMPROVING TRANSPORT AND ENERGY INFRASTRUCTURE INVESTMENT
OECD ECONOMIC SURVEYS: POLAND © OECD 2016134
Recommendations for improving transport and energy infrastructure investment
Strengthening infrastructure strategy and planning
● Improve the infrastructure selection process: systematically publish cost-benefit analyses (CBAs) withsufficient details; make mandatory independent evaluation for investment projects exceeding a certainamount; bolster the technical quality of CBAs with the creation of a reference centre able to helpagencies involved in the analyses.
● Integrate environmental and health criteria to the evaluation of infrastructure projects. Develop ex postevaluations to identify and promote best practices.
● Ensure funding for infrastructure investment includes long-term resources for maintenance. Increaseincentives for collaboration across levels of government. Develop and regularly update local spatialplans.
● Improve infrastructure management by reducing the fragmentation of responsibilities across ministriesand setting up permanent metropolitan governance institutions.
Enhancing incentives for capital investment
● Develop and implement clear climate change policies aligned with European and internationalobjectives.
● Introduce fixed-term, non-renewable mandates for the President of the Competition Authority and allsectoral regulators, during which they cannot be dismissed without fault, and prevent revolving-dooropportunities. Pursue privatisation in competitive segments of the economy.
● Rationalise and standardise purchasing procedures, centralise orders and promote e-procurement take-up, through an integrated national strategy. Bolster local-government capacity by providing central-government technical assistance for large infrastructure projects.
● Strengthen the anti-corruption framework, by better protecting whistle-blowers. Ensure the fullindependence of the Central Anticorruption Bureau.
Improving the efficiency of transport infrastructure investment
● Ensure total independence of the railway infrastructure manager from the operators. Allocate long-termcontracts for railway infrastructure management and services based on tenders.
● Reform arrangements for managing and funding national and local road infrastructure to enhanceconsistency of decision-making with regard to expenditure and revenue. Allow local governments todesign local electronic tolling systems to limit congestion and pollution.
● Review and revise transport taxes and charges, with a view to better internalising the environmental andhealth impacts of various transport modes. Set appropriate road prices to help finance new investments.
Getting the right incentives in the energy sector
● Invest in interconnections with neighbouring countries in the electricity and gas sectors. Install “smartmeters” for electricity more widely to improve demand management.
● Ensure that the new law on renewables, together with the EU-ETS, provides appropriate incentives forinvestment in new generation capacity. Streamline regulatory procedures for new energy investmentprojects. Evaluate the need for a capacity market to help finance baseload and peak-load capacity.
● Monitor the development of the market for “white certificates”. Modify its parameters if needed toensure it effectively supports energy efficiency investment. Reform the current programme for theconstruction of energy-efficient houses to ensure a higher take-up.
2. IMPROVING TRANSPORT AND ENERGY INFRASTRUCTURE INVESTMENT
OECD ECONOMIC SURVEYS: POLAND © OECD 2016 135
Bibliography
Abiad, A., D. Furceri and P. Topalova (2015), “The macroeconomic effects of public investment:Evidence from advanced economies”, IMF Working Paper, No. 15/95.
ACER (2015), Opinion of the Agency for the Cooperation of Energy Regulators No. 09/2015, Agency for theCooperation of Energy Regulators.
Ahrend, R., E. Farchy, I. Kaplanis and A. Lembcke (2014), “What makes cities more productive?Evidence on the role of urban governance from five OECD countries”, OECD Regional DevelopmentWorking Papers, No. 2014/05, OECD Publishing.
Ahrend, R. and A. Schumann (2014), “Approaches to metropolitan area governance: A countryoverview”, OECD Regional Development Working Papers, No. 2014/03, OECD Publishing.
BGK (2014), Dane liczbowe Funduszu Termomodernizacji i Remontów, State Development Bank.
Blöchliger, H. and M. Nettley (2015), “Sub-central tax autonomy: 2011 update”, OECD Working Papers onFiscal Federalism, No. 20, OECD Publishing.
Bougheas, S., P. O. Demetriades, and E. L. W. Morgenroth (1999), “Infrastructure, transport costs andtrade”, Journal of International Economics, Vol. 47, No. 1, pp. 169-89.
Braconier, H. and M. Pisu (2013), “Road connectivity and the border effect: Evidence from Europe”,OECD Economics Department Working Papers, No. 1073, OECD Publishing.
Burger, P. and I. Hawkesworth (2011), “How to attain value for money: Comparing PPP and traditionalinfrastructure public procurement”, OECD Journal on Budgeting, Vol. 2011/1, pp. 1-56, OECDPublishing.
CBA (2013), Anticipated Corruption Threats in Poland, Central Anti-Corruption Bureau.
CEER (2013), CEER Benchmarking Report 5.1 on the Continuity of Electricity Supply, Data update, Council ofEuropean Energy Regulators.
CODE2 (2014), Cogeneration Roadmap for Poland, Cogeneration Observatory and Dissemination Europe.
Crist, A, J. Kauppila, J. Vassallo and B. Wlaschin (2013), “Asset management for sustainable roadfunding”, ITF Discussion Paper, No. 2013-13, International Transport Forum.
Crozet, Y. (2013), “High speed rail performance in France: From appraisal methodologies to ex-postevaluation”, ITF Discussion Paper, No. 2013-26, International Transport Forum.
Decarolis, F. (2014), “Awarding price, contract performance, and bids screening: evidence fromprocurement auctions”, American Economic Journal: Applied Economics, Vol. 6, No. 1, pp. 108-32.
Della Croce, R. and J. Yermo (2013), “Institutional investors and infrastructure financing”, OECDWorking Papers on Finance, Insurance and Private Pensions, No. 36, OECD Publishing.
Eden, M. and A. Kraay (2014), “Crowding in and the returns to government investment in low-incomecountries”, World Bank Policy Research Working Paper, No. 6781.
EEA (2011), “Revealing the costs of air pollution from industrial facilities in Europe”, European EnergyAgency Technical report, No 15/2011, European Environment Agency.
EEA (2013), Trends and Projections in Europe 2013: Tracking Progress towards Europe’s Climate and EnergyTargets until 2020, European Environment Agency.
Égert, B. (2009), “Infrastructure investment in network industries: The role of incentive regulation andregulatory independence”, OECD Economics Department Working Papers, No. 688, OECD Publishing.
Égert, B. (2012), “Climate change policies in Poland: Minimising abatement costs”, OECD EconomicsDepartment Working Papers, No. 953, OECD Publishing.
Égert, B. and A. Goujard (2014), “Strengthening competition in Poland”, OECD Economics DepartmentWorking Papers, No. 1125, OECD Publishing.
EIB (2014), 2014-2020 JESSICA Evaluation Study for Nine Polish Regions: Kujawsko-Pomorskie, Łódzkie,Lubelskie, Małopolskie, Mazowieckie, Śląskie, Świętokrzyskie, Wielkopolskie, Zachodniopomorskie,European Investment Bank.
Escresa, L. and L. Picci (2015), “A new cross-national measure of corruption”, World Bank EconomicReview, 24 July.
EPEC (2012), Poznan Waste-to-Energy Project, Poland, Using EU Funds in PPPs Case Study, European PPPExpertise Centre.
2. IMPROVING TRANSPORT AND ENERGY INFRASTRUCTURE INVESTMENT
OECD ECONOMIC SURVEYS: POLAND © OECD 2016136
EPEC (2014), Establishing and Reforming PPP Units Analysis of EPEC Member PPP Units and Lessons Learnt,European PPP Expertise Centre.
ERO (2012), National Report 2012, The President of the Energy Regulatory Office in Poland.
ERO (2014), National Report 2014, The President of the Energy Regulatory Office in Poland.
ERO (2015), National Report 2015, The President of the Energy Regulatory Office in Poland.
European Commission (2012), Expert Evaluation Network Delivering Policy Analysis on the Performance ofCohesion policy 2007-13, Year 2 – 2012, Task 2: Country Report on Achievements of Cohesion policy Poland,Brussels.
European Commission (2013a), Impact Assessment Accompanying the documents Proposal for a Regulation ofthe European Parliament and of the Council Amending Regulation (EC) No 1370/2007 Concerning theOpening of the Market for Domestic Passenger Transport Services by Rail, Brussels.
European Commission (2013b), “Renewable Energy: Commission refers Poland and Cyprus to Court forfailing to transpose EU rules”, European Commission Press Release, No. 13-259.
European Commission (2013c), Internal Gas Market: the Commission takes Poland to Court over RegulatedGas Prices for Business Consumers, Brussels.
European Commission (2014a), Summary of the Partnership Agreement for Poland, 2014-2020, Brussels.
European Commission (2014b), 2014 SBA Factsheet Poland, Brussels.
European Commission (2014c), Poland, Annex to the EU Anti-Corruption Report, Brussels.
European Commission (2014d), Fourth Report on Monitoring Development of the Rail Market, Brussels.
European Commission (2014e), “Infrastructure in the EU: developments and impact on growth”,European Economy Occasional Paper, No. 203.
European Commission (2014f), Smart Grid Projects Outlook 2014, Brussels.
European Commission (2015a), “Commission refers Poland to the Court of Justice of the EU over poorair quality”, European Commission – Press release, No. 15-6265.
European Commission (2015b), “Achieving the 10% electricity interconnection target – MakingEurope’s electricity grid fit for 2020”, Energy Union Package – Communication from the Commission to theEuropean Parliament and Council, COM(2015) 82 final.
European Commission (2015c), “Country report Poland 2015”, Commission Staff Working Document,COM(2015) 85 final.
European Commission (2015d), OP Digital Poland, Brussels.
European Commission (2015e), Single Market Scoreboard – Public Procurement, Brussels.
European Commission (2015f), More than €82 million from the EU Cohesion Fund to Improve WasteManagement in the City of Poznań, Brussels.
European Commission (2015g), “Investment plan for Europe: Poland will contribute €8 billion”,European Commission – Press release, No. 15-4818.
European Commission (2015h), “Greenhouse gas emissions: Creation of a market stability reserveapproved”, European Commission Press Release, No. 666/15.656/15.
European Court of Auditors (2014), “EU-funded airport infrastructures: Poor value for money”, SpecialReport of the European Court of Auditors, No. 21.
European Court of Justice (2013), Judgment of the Court (First Chamber) of 30 May 2013 – EuropeanCommission v Republic of Poland (Case C-512/10), ECLI:EU:C:2013:338.
Eurostat (2015a), National Accounts Aggregates by Industry, Kirchberg, Luxembourg.
Eurostat (2015b), Modal Split of Inland Freight Transport, Kirchberg, Luxembourg.
EWEA (2010), Wind Barriers: Administrative and Grid Access Barriers To Wind Power, European Wind EnergyAssociation.
GUS (2011), Road Transport in Poland 2005-2009, Central Statistical Office of Poland.
GUS (2015a), Time Use Survey 2013, Central Statistical Office of Poland.
GUS (2015b), Road Transport in Poland in the years 2012, 2013, Central Statistical Office of Poland.
2. IMPROVING TRANSPORT AND ENERGY INFRASTRUCTURE INVESTMENT
OECD ECONOMIC SURVEYS: POLAND © OECD 2016 137
Halleux, J-M., S. Marcinczak and E. van der Krabben (2012), “The adaptive efficiency of land useplanning measured by the control of urban sprawl. The cases of the Netherlands, Belgium andPoland”, Land Use Policy, No.29, pp. 887-898.
Harding, M. (2014), “The diesel differential: Differences in the tax treatment of gasoline and diesel forroad use”, OECD Taxation Working Paper, No. 21, OECD Publishing.
IEA (2011), Energy Policies of IEA Countries: Poland 2011 Review, IEA/OECD, OECD Publishing.
IMF (2015), Making Public Investment More Efficient, International Monetary Fund.
ITF (2013), Road Taxation Database, OECD Publishing.
ITF (2014), Major Transport Infrastructure Projects and Economic Development, OECD Publishing.
ITF (2015), “Port investment and container shipping markets”, ITF Round Tables, No. 157, OECDPublishing.
Kierzenkowski, R. (2008), “Bridging the housing gap in Poland”, OECD Economics Department WorkingPapers, No. 639, OECD Publishing.
Krajewska M., S. Źróbek and M. Šubic-Kovač (2014), “The role of spatial planning in the investmentprocess in Poland and Slovenia”, Real Estate Management and Valuation, Vol. 22, No. 2, pp. 52-66.
Laursen, T. and B. Myers (2009), “Public investment management in the new EU member states”, WorldBank Working Paper, No. 161.
Ministry of Economy (2010), National Renewable Action Plan, Warsaw.
Ministry of Economy (2012), Report Evaluating Progress Towards Increasing the Share of High-EfficiencyCogeneration in the Total Annual Production of Electricity in Poland, Warsaw.
Ministry of Economy (2015a), Polityki energetycznej Polski do 2050 roku, Warsaw.
Ministry of Economy (2015b), Raport PPP, Warsaw.
Ministry of Energy (2015), Sprawozdania z wyników monitorowania bezpieczeństwa dostaw paliw gazowychza okres od dnia 1 stycznia 2014 r. do dnia 31 grudnia 2014 r., Ministertwo Energii.
Ministry of Infrastructure (2011), Programu Budowy Dróg Krajowych na lata 2011-2015, Warsaw.
Ministry of Infrastructure and Development (2013), Post py w realizacji Narodowej Strategii Spójnoci 2007-13 – stan na 29 grudnia 2013 r, Warsaw.
Ministry of Infrastructure and Development (2014), Budownictwa i Gospodarki Morskiej, Strategia rozwojutransportu do 2020 roku (z perspektywą do 2030 roku), Warsaw.
Ministry of Infrastructure and Development (2015a), Project National Roads Construction Programme for theyears 2014-23 (with a view to 2025), Warsaw.
Ministry of Infrastructure and Development (2015b), National Railway Programme for 2023, Warsaw.
Ministry of Interior (2014), Rządowy Program Przeciwdziałania Korupcji na lata 2014-2019, Warsaw.
Ministry of Regional Development (2012), Koncepcja Przestrzennego Zagospodarowania Kraju 2030,Warsaw.
NEA/IEA/OECD (2015), Projected Costs of Generating Electricity 2015, OECD Publishing.
NIK (2012a), NIK on the Conditions of Seaports’ Development, Supreme Audit Office, Warsaw.
NIK (2012b), NIK on Renewable Energy Sources, Supreme Audit Office, Warsaw.
NIK (2013), NIK on Infrastructure Investments of PKP PLK SA, Supreme Audit Office, Warsaw.
NIK (2014a), NIK about Wind Farms, Supreme Audit Office, Warsaw.
NIK (2014b), NIK about Local Roads, Supreme Audit Office, Warsaw.
NIK (2014c), NIK on Inland Shipping, Supreme Audit Office, Warsaw.
NIK (2015a), NIK on Public Procurements, Supreme Audit Office, Warsaw.
NIK (2015b), NIK on Road Maintenance and Repairs, Supreme Audit Office, Warsaw.
NIK (2015c), NIK o funkcjonowaniu grupy kapitałowej PKP, Supreme Audit Office, Warsaw.
NIK (2015d), NIK o budowie lotniska w Modlinie, Supreme Audit Office, Warsaw.
2. IMPROVING TRANSPORT AND ENERGY INFRASTRUCTURE INVESTMENT
OECD ECONOMIC SURVEYS: POLAND © OECD 2016138
OECD (2010), OECD Information Technology Outlook, OECD Publishing, http://dx.doi.org/ 10.1787/it_outlook-2010-en.
OECD (2011a), OECD Urban Policy Reviews Poland, OECD Publishing, http://dx.doi.org/ 10.1787/9789264097834-en.
OECD (2011b), Economic Survey of Sweden, OECD Publishing, http://dx.doi.org/10.1787/eco_surveys-swe-2011-en.
OECD (2012a), OECD Economic Surveys: Poland 2010, OECD Publishing, http://dx.doi.org /10.1787/eco_outlook-v2010-2-30-en.
OECD (2012b), Recommendation of the Council on Principles for Public Governance of Public-PrivatePartnerships, OECD Publishing.
OECD (2013a), Poland: Implementing Strategic-State Capability, OECD Public Governance Reviews, OECDPublishing, http://dx.doi.org /10.1787/9789264201811-en.
OECD (2013b), OECD Regions at a Glance 2013, OECD Publishing, http://dx.doi.org /10.1787/reg_glance-2013-en.
OECD (2013c), “Recent developments in rail transportation services”, OECD Policy Roundtables, DAF/COMP(2013)24, OECD Publishing.
OECD (2014a), OECD Economic Surveys: Poland 2014, OECD Publishing, http://dx.doi.org/ 10.1787/eco_surveys-pol-2014-en.
OECD (2014b), How Was Life?: Global Well-Being Since 1820, OECD Publishing, http://dx.doi.org/ 10.1787/9789264214262-en.
OECD (2014c), How’s Life in Your Region? Measuring Regional and Local Well-being for Policy Making, OECDPublishing, http://dx.doi.org/10.1787/9789264217416-en.
OECD (2014d), OECD Recommendation of the Council on Public Procurement, OECD Publishing.
OECD (2015a), “Lifting investment for higher sustainable growth”, in OECD Economic Outlook, Vol. 2015/1,OECD Publishing, http://dx.doi.org/10.1787/eco_outlook-v2015-1-en.
OECD (2015b), OECD Environmental Performance Reviews, Poland 2015, OECD Publishing.
OECD, (2015c), Strategic Expenditure Reviews, Overview of Housing Policy Interventions in Poland, GOV/RDPC/URB/RD(2015)2, OECD Publishing.
OECD (2015d), OECD Regulatory Policy Outlook 2015, OECD publishing, http://dx.doi.org/10.1787/9789264238770-en.
OECD (2015e), Government at a Glance 2015, OECD Publishing, http://dx.doi.org/10.1787/gov_glance-2015-en.
OECD (2015f), Fostering Infrastructure Investment: Lessons Learned from OECD Investment Policy Reviews,OECD Publishing.
OECD (2015g), OECD Guidelines on Corporate Governance of State-Owned Enterprises, OECD Publishing,http://dx.doi.org/10.1787/9789264009431-10-en.
PAP (2016), “W niektórych państwowych firmach prezesa wskazywać będzie szef MSP”, 7 January 2016,Polish Press Agency.
PSE (2015), Konsultacje projektu Planu rozwoju w zakresie zaspokojenia obecnego i przyszłego zapotrzebowaniana energię elektryczną na lata 2016-2025, Polskie Sieci Elektroenergetyczne.
Public Procurement Office (2015), Report on Functioning of Public Procurement System in 2014, UrządZamówień Publicznych.
Rekiel, M. (2014), “Thermo-modernization program in Poland”, Presentation made at the 2nd Workshop onEnergy Efficiency in Buildings, 15-16 May, Energy Community Secretariat, Vienna.
Republic of Poland (2015), National Reform Programme 2020, Update 2015/2016, Council of Ministers.
Rostowski, A. (2009), “Public investment, transport infrastructure and growth in Poland”, EuropeanCommission Country Focus, No. 11.
Sutherland, D., S. Araujo, B. Égert and T. Koźluk (2009), “Infrastructure investment: Links to growth andthe role of public policies,” OECD Economics Department Working Papers, No. 686, OECD Publishing,http://dx.doi.org/ 10.1787/225678178357-en.
UTK (2014), An Assessment of Rail Market Operations and Rail Traffic Safety in 2013, Urzad TranportuKolejowego.

2. IMPROVING TRANSPORT AND ENERGY INFRASTRUCTURE INVESTMENT
OECD ECONOMIC SURVEYS: POLAND © OECD 2016 139
UTK (2015a), Kolejowe przewozy pasażerskie w Polsce – dane kwartalne, Urzad Tranportu Kolejowego.
UTK (2015b), Liczne nieprawidłowości w procesie utrzymania sieci trakcyjnej – Prezes UTK stwierdziłnaruszenie przepisów przez PKP PLK na linii nr 151 Kędzierzyn-Koźle – Chałupki, Urzad TranportuKolejowego.
Veneri, P. (2015), “Urban spatial structure in OECD cities: Is urban population decentralising orclustering?”, OECD Regional Development Working Papers, No. 2015/13, OECD Publishing, http://dx.doi.org/10.1787/5js3d834r3q7-en.
ViaToll, (2015), New Roads in the viaTOLL System, 24-06-2015.
World Bank (2011), “Poland, Transport Policy Note: Toward a sustainable land transport sector”, WorldBank Report, No. 59715-PL.
World Bank (2014), Connecting to Compete 2014: Trade Logistics in the Global Economy, The World Bank.
World Bank (2015), Doing Business 2016: Measuring Regulatory Quality and Efficiency, The World Bank.

ORGANISATION FOR ECONOMIC CO-OPERATIONAND DEVELOPMENT
The OECD is a unique forum where governments work together to address the economic, social and
environmental challenges of globalisation. The OECD is also at the forefront of efforts to understand and
to help governments respond to new developments and concerns, such as corporate governance, the
information economy and the challenges of an ageing population. The Organisation provides a setting
where governments can compare policy experiences, seek answers to common problems, identify good
practice and work to co-ordinate domestic and international policies.
The OECD member countries are: Australia, Austria, Belgium, Canada, Chile, the Czech Republic,
Denmark, Estonia, Finland, France, Germany, Greece, Hungary, Iceland, Ireland, Israel, Italy, Japan, Korea,
Luxembourg, Mexico, the Netherlands, New Zealand, Norway, Poland, Portugal, the Slovak Republic,
Slovenia, Spain, Sweden, Switzerland, Turkey, the United Kingdom and the United States. The European
Union takes part in the work of the OECD.
OECD Publishing disseminates widely the results of the Organisation’s statistics gathering and
research on economic, social and environmental issues, as well as the conventions, guidelines and
standards agreed by its members.
OECD PUBLISHING, 2, rue André-Pascal, 75775 PARIS CEDEX 16
(10 2016 08 1 P) ISBN 978-92-64-25255-4 – 2016
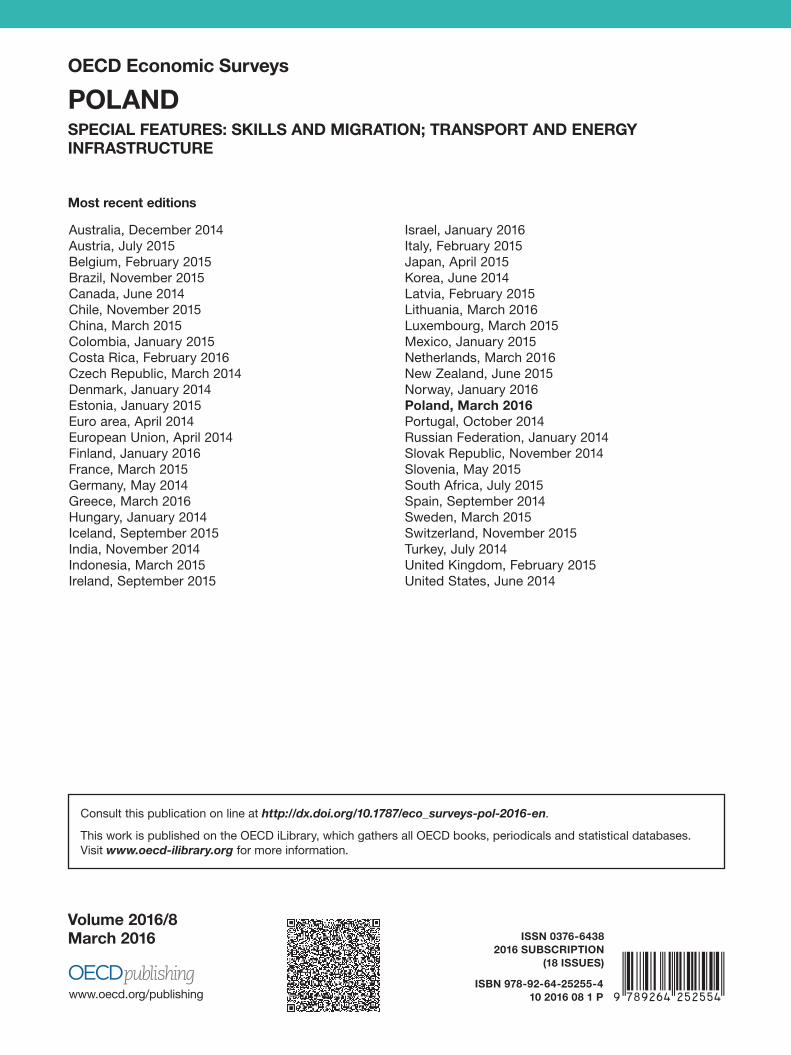
March 2016
Volum
e 2016/8 P
OLA
ND
OE
CD
Eco
nom
ic Su
rveys
OECD Economic Surveys
POLANDSPECIAL FEATURES: SKILLS AND MIGRATION; TRANSPORT AND ENERGY INFRASTRUCTURE
Most recent editions
Consult this publication on line at http://dx.doi.org/10.1787/eco_surveys-pol-2016-en.
This work is published on the OECD iLibrary, which gathers all OECD books, periodicals and statistical databases.Visit www.oecd-ilibrary.org for more information.
Volume 2016/8March 2016
ISBN 978-92-64-25255-410 2016 08 1 P
ISSN 0376-64382016 SUBSCRIPTION
(18 ISSUES) 9HSTCQE*cfcffe+
Australia, December 2014Austria, July 2015Belgium, February 2015Brazil, November 2015Canada, June 2014Chile, November 2015China, March 2015Colombia, January 2015Costa Rica, February 2016Czech Republic, March 2014Denmark, January 2014Estonia, January 2015Euro area, April 2014European Union, April 2014Finland, January 2016France, March 2015Germany, May 2014Greece, March 2016Hungary, January 2014Iceland, September 2015India, November 2014Indonesia, March 2015Ireland, September 2015
Israel, January 2016Italy, February 2015Japan, April 2015Korea, June 2014Latvia, February 2015Lithuania, March 2016Luxembourg, March 2015Mexico, January 2015Netherlands, March 2016New Zealand, June 2015Norway, January 2016Poland, March 2016Portugal, October 2014Russian Federation, January 2014Slovak Republic, November 2014Slovenia, May 2015South Africa, July 2015Spain, September 2014Sweden, March 2015Switzerland, November 2015Turkey, July 2014United Kingdom, February 2015United States, June 2014
OECD Economic SurveysPOLAND
MARCH 2016