OECD Economic Surveys: Australia 2021
67
OECD Economic Surveys Australia September 2021 OVERVIEW http://www.oecd.org/economy/australia-economic-snapshot/
Transcript of OECD Economic Surveys: Australia 2021

OECD Economic Surveys
Australia September 2021 OVERVIEW
http://www.oecd.org/economy/australia-economic-snapshot/
This Overview is extracted from the 2021 Economic Survey of Australia. The Survey is published on the responsibility of the Economic and Development Review Committee of the OECD, which is charged with the examination of the economic situation of member countries.
This document, as well as any data and any map included herein, are without prejudice to the status of or sovereignty over any territory, to the delimitation of international frontiers and boundaries and to the name of any territory, city or area.
The statistical data for Israel are supplied by and under the responsibility of the relevant Israeli authorities. The use of such data by the OECD is without prejudice to the status of the Golan Heights, East Jerusalem and Israeli settlements in the West Bank under the terms of international law.
OECD Economic Surveys: Australia© OECD 2021
You can copy, download or print OECD content for your own use, and you can include excerpts from OECD publications, databases and multimedia products in your own documents, presentations, blogs, websites and teaching materials, provided that suitable acknowledgement of OECD as source and copyright owner is given. All requests for public or commercial use and translation rights should be submitted to [email protected]. Requests for permission to photocopy portions of this material for public or commercial use shall be addressed directly to the Copyright Clearance Center (CCC) at [email protected] or the Centre français d’exploitation du droit de copie (CFC) at [email protected] of or sovereignty over any territory, to the delimitation of international frontiers and boundaries and to the name of any territory, city or area.

| 1
OECD ECONOMIC SURVEYS: AUSTRALIA 2021 © OECD 2021
Executive Summary

2 |
OECD ECONOMIC SURVEYS: AUSTRALIA 2021 © OECD 2021
Australia’s zero-tolerance approach is shifting to virus containment. At the onset of the pandemic, well-coordinated policies across different levels of government sought to suppress COVID-19 transmission. As a result, the rise in deaths from the virus was temporarily halted (Figure 1). Control of the public health situation facilitated the reopening of the economy. However, recent COVID-19 outbreaks have meant much of the country has returned to a strict lockdown. The vaccine rollout started slowly but has picked up pace in recent months as the country begins transitioning from zero-tolerance to a containment approach to the virus.
Figure 1. The virus was suppressed for a period but cases have risen in recent months COVID-19 cases and cumulative deaths, 7-day average
Source: Refinitiv.
StatLink 2 https://stat.link/9wbjdn
The downturn in 2020 was less significant than in the majority of other OECD countries (Figure 2). Real GDP bounced back over the year to June 2021, to be above pre-pandemic levels. The unemployment rate fell to 4.6% in July 2021, after peaking at 7.4% in 2020. Nonetheless, high frequency indicators suggest that the current containment measures are having a significant negative impact on economic activity.
OECD projections envisage annual output growth of 4% in 2021 and 3.3% in 2022 (Table 1). The economy is expected to contract in the third quarter of 2021, before state-based restrictions can begin to be eased as higher vaccination rates are achieved. The ensuing recovery may be more gradual than in previous episodes, given it will occur in an environment of higher community transmission of COVID-19.
Figure 2. The initial downturn was relatively mild Real GDP, index Q4 2019 = 100
Source: OECD Economic Outlook database
StatLink 2 https://stat.link/u1msrb
Risks and uncertainties remain large. On the upside, a substantial quickening in the pace of vaccine rollout could enable an early relaxation of containment measures. Once the economy reopens, household consumption could also pick up surprisingly rapidly given a high stock of excess savings. In contrast, significant new COVID-19 outbreaks in other states may deepen the economic shock. Furthermore, problems with the vaccine rollout or vaccine hesitancy could delay reopening. A ratcheting up of diplomatic tensions with China could also further weaken trade activity.
Table 1. Macroeconomic projections Annual growth, unless specified 2019 2020 2021 2022 Gross domestic product (GDP) 1.9 -2.5 4.0 3.3 Unemployment rate (% labour force)
5.2 6.5 5.4 4.9
Core inflation index 1.6 1.3 2.2 1.7 General government gross debt (% of GDP)
45.9 65.4 68.5 72.6
Source: OECD Economic Outlook 109 Database, projections revised as of 8 September 2021.
Macroeconomic policies must remain responsive to changing conditions Macroeconomic policy support was delivered swiftly and with appropriate force at the onset of the pandemic. The immediate fiscal expansion was one of the largest in the OECD (Figure 3) and the Reserve Bank of Australia cut official rates and embraced an array of new policy tools, including purchases of government bonds. Legacies of the pandemic in the form of higher public debt and limited monetary policy space will present challenges for macroeconomic management going forward. While the institutional framework has
0
250
500
750
1 000
1 250
1 500
Mar-20 Jul-20 Nov-20 Mar-21 Jul-21
New cases Deaths
85
90
95
100
105
2019Q4 2020Q2 2020Q4 2021Q2
Australia OECD

| 3
OECD ECONOMIC SURVEYS: AUSTRALIA 2021 © OECD 2021
supported the strong economic response to the pandemic, there are some areas that could be improved. A review into the monetary policy framework should be undertaken and the fiscal framework buttressed. At the same time, tax reform can help make public finances more growth-friendly and sustainable.
Figure 3. Fiscal policy has been supportive General government financial balance
Source: OECD Economic Outlook 109 Database, projections revised as of 8 September 2021.
StatLink 2 https://stat.link/5knq64
In the short-term, fiscal policy should continue to be highly responsive to developments in economic conditions, such as the impact of further COVID-19 containment measures. At the same time, there is scope for the RBA to further expand the asset purchasing programme and consider other less conventional monetary policy tools as needed. As the recovery becomes entrenched, the RBA should also remain cognisant of potential upside risks to inflation stemming from factors such as labour shortages.
Over the longer-term, fiscal spending pressures will grow. Under current policy settings, ageing related costs will cause public debt to rise to 2060. In addition, further investment in the social safety net is needed, not least to complement reforms that promote business and labour market dynamism. For example, the unemployment benefit rate should be raised further.
Tax reform is needed. Australia’s heavy reliance on taxation of personal incomes adds to the vulnerability of public finances to an ageing population. Fortunately, there is a clear path for tax reforms that will provide a more sustainable tax base, enhance economic growth and promote other government priorities like improving housing
affordability and reversing the trend toward rising income and intergenerational inequality common to many countries. The authorities should increase the Goods and Services Tax rate or broaden the base, offsetting any regressive effects through additional personal income tax cuts (especially for low and middle-income workers), reducing private pension tax breaks and reducing the capital gains tax discount. In addition, more state governments should replace stamp duty with a well-designed recurrent land tax.
The government entered the pandemic from a strong fiscal position. Its newly revised fiscal strategy is to support the economy until the recovery is well entrenched and the unemployment rate is back to pre-pandemic levels (5%) or lower and then to switch focus to stabilising and then reducing public debt in the medium-term. As this transition draws nearer, the government should provide a medium-term fiscal strategy with targets that are associated with specific timeframes or conditional on measurable economic outcomes.
Looking forward, the government’s fiscal strategy should be regularly evaluated and monitored by an independent fiscal institution. The Parliamentary Budget Office (PBO) is a credible and independent institution that could fulfil this task within its current mandate. Through explicitly assigning such responsibilities to an independent fiscal institution, the authorities will be enhancing the transparency and accountability of fiscal policy.
Stronger productivity growth is needed for a sustainable recovery The economy was exhibiting signs of structural headwinds when the pandemic hit. As in many OECD countries, productivity and wages growth had slowed notably. This partly reflected weaker business dynamism and labour market mobility. Small young firms were then hit particularly hard by the pandemic. Looking forward, prospects for this cohort of firms are particularly important given they have typically accounted disproportionately for job creation and investment in Australia.
Regulatory procedures are relatively complex and the licensing and permit system is cumbersome compared with other OECD countries. This can slow necessary resource
-12.5
-10.0
-7.5
-5.0
-2.5
0.0
2019 2020 2021 2022
Australia OECD% of GDP

4 |
OECD ECONOMIC SURVEYS: AUSTRALIA 2021 © OECD 2021
reallocation. The ongoing reforms to the occupational licensing system are welcome, a first step being the broadest possible adoption by the states of automatic mutual recognition of licenses across jurisdictions. Furthermore, broadly based reform to land use regulations are well overdue. As well as harmonising and simplifying the land zoning system at the state level, giving local authorities more fiscal autonomy can encourage them to allow the entry of new businesses or households.
The financial sector will continue to be of central importance to the recovery Financial institutions provided an important buffer against the economic shock. To promote a sustained recovery, reforms that improve access of small young firms to credit and protect the financially vulnerable will be key.
The digital revolution in financial services can improve lenders’ ability to assess credit risk in the absence of collateral or business history. This can facilitate new sources of finance for young businesses. Extending open banking to facilitate switching of providers could inject much-needed competition to the lending market and improve access to finance.
The Personal Property Securities Register provides a good foundation for supporting the use of intangible assets as collateral. This is especially important for young innovative enterprises. However, the register is considered difficult to use and lacks visibility. Streamlining the system, reducing compliance costs and making better use of available technology (including regtech) would help realise its potential.
The financial sector also has a role to play in ensuring an inclusive recovery. The Royal Commission into misconduct in financial services highlighted a range of practices that led to mistreatment of vulnerable customers due to poorly designed incentives. The government should complete the implementation of the reforms arising from the Royal Commission.
Climate change policy needs to be strengthened The Federal government is now aiming to achieve net zero carbon emissions as soon as possible and preferably by 2050. All states and
territories have now committed to achieving net zero carbon emissions by 2050. However, emissions will need to decline at a significantly faster pace if this goal is to be met (Figure 4). The government’s forthcoming Long-term Emissions Reduction Strategy is an opportunity to articulate a more co-ordinated, ambitious and stable climate-change policy that defines clear goals and corresponding policy actions to achieve their goal.
Figure 4. Faster progress in reducing carbon emissions is needed Greenhouse gas emission projections
Source: DISER; OECD calculations.
StatLink 2 https://stat.link/fvrdpc
The authorities are focused on the development of clean energy technologies as the path to lower emissions. Australia has world class public institutions for supporting renewable energy research and the commercialisation of low emissions projects. Yet, there has been a trend decline in environmental innovation over the past decade and stronger incentives for innovation and adoption of new low emission technologies are needed. While a national carbon price would be the most efficient means of achieving this, political considerations may instead require the scaling up of existing market-based instruments, such as the Safeguard Mechanism (a baseline-and-offset system for large emitters). This should be accompanied by policies that support the transition of workers out of fossil fuel generating industries.
The financial sector can also play a key role in the transition to a low carbon economy. Creating a roadmap for improving the consistency, comparability and quality of reporting of climate-related risks by listed companies and financial institutions would improve capital allocation and support investment in emission abatement projects.
0100200300400500600700
1990 2000 2010 2020 2030 2040 2050
Mt CO2-e
HistoricalGovernment baseline projectionsRequired trajectory to reach net zero

| 5
OECD ECONOMIC SURVEYS: AUSTRALIA 2021 © OECD 2021
MAIN FINDINGS KEY RECOMMENDATIONS Ensuring a sustained recovery in output and jobs
International borders remain closed, negatively impacting education exports and bilateral tourism. Labour shortages are arising in some sectors traditionally reliant on foreign workers and there are many Australian citizens stuck abroad because of hotel quarantine caps.
Ensure all eligible adults are able to receive COVID-19 vaccination and open international borders at the earliest possible date.
The substantial fiscal response at the onset of the pandemic was enabled by the country’s strong starting fiscal position. The stimulus measures were front loaded and temporary. Additional targeted measures were announced with the reimposition of containment measures in some states.
Restore fiscal sustainability in a gradual manner and adopt a more expansionary stance of fiscal policy if further containment measures have a significant negative impact on economic growth.
Fiscal policy is now being conducted in an environment of higher public debt, with fiscal costs from ageing in prospect. The independent fiscal authority (the Parliamentary Budget Office) fulfils a narrower role than counterparts in many other OECD countries.
Task an independent fiscal institution, such as the Parliamentary Budget Office, with both formal evaluation and monitoring of the government’s fiscal strategy. Implement a medium-term fiscal strategy with targets that are associated with specific timeframes or conditional on measurable economic outcomes.
Young and low-wage workers experienced the greatest job losses through the pandemic. The unemployment benefit replacement rate remains close to the lowest in the OECD and below estimates of the relative poverty line. This partly reflects prior indexation to consumer price inflation.
Further increase the unemployment benefit rate and consider indexing the rate to wage inflation.
Australia's tax mix remains tilted towards income taxes. With an ageing population over the next 40 years, revenue streams will come under significant pressure under current policy settings. In addition, some inefficiencies and distortions in the tax system remain.
Further shift the tax mix away from income taxes (especially personal income tax) and inefficient taxes (including real-estate stamp duty) and towards the Goods and Services Tax and recurrent land taxes.
The Reserve Bank of Australia has added new instruments to its toolkit. In particular, a government bond purchasing programme, which could be expanded if needed. The central bank’s preferred measures of underlying inflation have undershot the target since 2015.
As in other OECD countries, undertake a review into the monetary policy framework that is broad in scope, transparent and involves consultation with a wide variety of relevant stakeholders. Keep monetary policy expansionary, but stand ready to tighten policy if underlying inflation risks sustainably rising above the target or inflation expectations risk becoming de-anchored.
Raising productivity growth to boost future living standards About one fifth of Australian workers require a license to perform their work. Most need distinct licenses in each Australian state and territory. This unnecessarily raises economic costs, including by slowing resource reallocation.
Legislate automatic mutual recognition of occupational licenses.
Land needs to be repurposed to take into account structural changes, not least those induced by the pandemic. However, there is limited incentive for local authorities in desirable locations to attract new businesses or expand dwelling supply.
Allow local authorities to raise more of their own-source revenue, at the same time as reallocating the minimum Financial Assistance Grant from wealthier local authorities to those in more disadvantaged areas.
Ensuring the financial sector supports a sustainable and inclusive economic recovery The register of security interests over personal property (Personal Property Securities Register) is considered difficult to use and lacks visibility.
Overhaul the Personal Property Securities Register then increase awareness among small businesses and lenders.
Comprehensive credit reporting and the new consumer data right in banking can help improve competition in lending for start-ups and smaller businesses by allowing borrowers to share information with other service providers.
Extend open banking to facilitate switching of providers and other actions (“write access”) with appropriate protections.
Disclosure of climate-related risks by listed companies and financial institutions has increased but progress is uneven and there are still large data gaps.
Create a roadmap for improving the consistency, comparability and quality of reporting of climate-related risks by listed companies and financial institutions.
A Royal Commission found serious misconduct in the financial sector. The Government has implemented a significant number of the Commission’s recommendations, but some reforms remain outstanding.
Complete the implementation of the reforms arising from the Royal Commission into the financial sector.
Reducing greenhouse gas emissions in a cost efficient way All states and territories have now committed to achieving net zero carbon emissions by 2050. National carbon emissions need to decline on a significantly steeper trajectory if this goal is to be met.
Develop a national, integrated Long-term Emissions Reduction Strategy that defines clear goals and corresponding policy settings for the path to achieving net zero emissions as soon as possible and preferably by 2050. Scale up the Safeguard Mechanism that exists as part of the government’s Emissions Reduction Fund to appropriately price carbon emissions across sectors.

6 |
OECD ECONOMIC SURVEYS: AUSTRALIA 2021 © OECD 2021
The pandemic recession in 2020 was milder than in most other OECD countries, but recent outbreaks of the Delta variant of COVID-19 have put much of the country in a strict lockdown. As a result, economic activity will contract, with a gradual reopening of the economy only occurring once vaccination rates have risen significantly. As the economy recovers, public policy must focus on setting the conditions for another prolonged period of strong and well-distributed growth in living standards. Recent efforts to reduce regulatory, administrative and financial barriers for young high potential firms should continue. At the same time, the resilience of the economy to future economic shocks can be supported by rethinking institutional frameworks related to fiscal and monetary policy and ensuring the social safety net is adequate. Australia is uniquely vulnerable to climate change, but it is also uniquely placed to benefit economically from global decarbonisation. Domestic greenhouse gas emissions will need to decline on a significantly faster pace if the country is to achieve net zero emissions by 2050.
1 Key policy insights

| 7
OECD ECONOMIC SURVEYS: AUSTRALIA 2021 © OECD 2021
While the pandemic broke Australia’s enviable run of 28 years of uninterrupted economic growth, the recession in 2020 was milder than in most other OECD countries. In addition to the public health measures, this owed to the swift and appropriate economic policy response. Fiscal policy played a particularly important role in stabilising the economy and the living standards of the population. Yet, the current outbreak, and associated containment measures in some states, pose additional challenges for the national economy.
The pandemic also arrived at a time when the economy had been experiencing structural headwinds. After outperforming OECD countries through the financial crisis and in the immediate aftermath, GDP per capita growth had been slowing in the years before the pandemic (Figure 1.1). This partly reflected weakening productivity growth that had translated into disappointing wage outcomes for workers. At the same time, the stress of climate change on the physical environment had become more visible. Australia is the driest inhabited continent on the planet and catastrophic bushfires had been raging for months before the onset of the pandemic, with more than three billion of Australia’s native animals – mammals, birds, reptiles and frogs – killed, injured or impacted (van Eeden et. al., 2020).
Figure 1.1. GDP per capita had slowed pre-pandemic GDP per capita, average annual growth (%)
Source: OECD Productivity Statistics.
StatLink 2 https://stat.link/ha2czg
The key messages of this Economic Survey are:
• Once the economy reopens, the focus must turn to reforms that will lay the foundations for another prolonged period of strong and well-distributed growth in living standards. Recent efforts to reduce regulatory, administrative and financial barriers for young high potential firms should continue.
• Legacies of the pandemic will remain, in the form of higher public debt, less monetary policy space and labour market scarring in particular cohorts. Rethinking institutional frameworks related to fiscal and monetary policy, ensuring the social safety net is adequate and that the financial sector supports household financial resilience will better prepare the economy for future shocks.
• Australia is uniquely vulnerable to climate change, but it is also uniquely placed to benefit economically from global decarbonisation due to a large (and windy) land mass, high solar radiation, plentiful ocean access and strong human capital to form the basis of innovation in carbon abatement technologies. A coherent and coordinated national strategy that defines clear goals and corresponding policy settings for the path to achieving net zero emissions as soon as possible and preferably by 2050 is needed. The financial sector can play a key role in achieving these aims.
0.0
0.2
0.4
0.6
0.8
1.0
1.2
1.4
1.6
1.8
0.0
0.2
0.4
0.6
0.8
1.0
1.2
1.4
1.6
1.8
2005-2009 2010-2014 2015-2019
Australia OECD

8 |
OECD ECONOMIC SURVEYS: AUSTRALIA 2021 © OECD 2021
The initial pandemic response was well coordinated
Australia’s first cases of COVID-19 appeared in late-January 2020, with an acceleration in cases from early March (Figure 1.2, Panel A). Although strict confinement measures were not introduced until late-March 2020, they had a significant impact once in place: the number of daily new cases had peaked within two weeks and fell sharply thereafter.
The eventual reopening of economic activity in May 2020 was successful in most states and territories. Nevertheless, a significant rise in cases in Victoria (which accounts for almost one quarter of the national economy) in July 2020 led to a strict lockdown in the state that included school closures and lasted for over three months. The number of COVID-19 related deaths subsequently rose, but remained limited by international standards. Once that outbreak was brought under control, Australians in all states experienced around six months of very few COVID-19 cases, with localised outbreaks effectively curtailed. However, in June 2021, an outbreak of the more-transmissable Delta variant of COVID-19 in New South Wales soon spread to other parts of the country. Strict lockdowns were subsequently implemented in several states, including the largest ones - New South Wales and Victoria. In the past few weeks, the number of COVID-19 patients in hospital intensive care units in New South Wales has begun to rise rapidly.
Figure 1.2. A resurgence of the virus has been accompanied by a faster pace of vaccinations
Source: Refinitiv; and CEIC.
StatLink 2 https://stat.link/jisdat
The early stages of the pandemic were characterised by coherent decision making and communication across levels of government. This was facilitated by the introduction of a primary decision-making body, the “National Cabinet” that comprised the Prime Minister and the Premiers and Chief Ministers of each state and territory (Box 1.1). The government also moved early to restrict access to remote communities. This was important given the heightened mortality risk for Indigenous Australians due to existing health and socioeconomic inequities (Yashadhana et. al., 2020). An advisory group was established for developing the health response for Indigenous Australians and funding was dedicated to improve health service delivery, testing, quarantine and communication for those in remote communities.
0
250
500
750
1 000
1 250
1 500
Mar-20 Jul-20 Nov-20 Mar-21 Jul-21
A. COVID-19 new daily cases and deaths
New cases Deaths
0
2,000
4,000
6,000
8,000
10,000
12,000
Jan-21 Mar-21 May-21 Jul-21 Sep-21
B. Daily vaccinations per million inhabitants
OECD United StatesAustralia

| 9
OECD ECONOMIC SURVEYS: AUSTRALIA 2021 © OECD 2021
Box 1.1. Australia’s National Cabinet
On 13 March, it was announced that the National Cabinet would be formed in response to the onset of the COVID-19 pandemic. It comprised the Prime Minister and the leaders of each state and territory and was characterised by direct and frequent interactions between leaders, resulting in strong policy coordination. Decisions through the pandemic were guided by expert advice and evidence, with the Chief Medical Officer and top scientists regularly included in meetings. Decisions also benefited from the “Rapid Research Information Forum” that was established by the government to provide evidence-based advice on topics such as the seasonality of COVID-19, the transmission of the disease from surfaces and the most promising vaccines.
The National Cabinet enjoyed strong public support, with 89% of polled Australians in favour of retaining the institution after the pandemic (Guinness et. al., 2020). In late May 2020, it was decided that the National Cabinet would replace the previous Council of Australian Governments which had long been criticised as overly bureaucratic with an agenda that was too tightly controlled by the federal government. On 29 May 2020, the National Cabinet agreed to the formation of the National Federation Reform Council, comprised of the leaders and treasurers across the Commonwealth and states and territories and the President of the Australian Local Government Association to focus on priority national federation issues.
Through 2020, the stated priority of the National Cabinet was job creation and the economic recovery. In 2021, the focus turned to coordinating vaccinations and the transition to virus containment.
Another notable feature of Australia’s initial response was the speed with which regulations were temporarily changed to ensure the smooth functioning of the health system and the economy. Professional requirements were adjusted to allow nurses to re-enter the workforce, telehealth services were facilitated by permitting paperless transfer of prescriptions and international standards for hand sanitiser were quickly adopted. Several states allowed shops to extend trading hours to reduce the concentration of customers and delivery trucks were permitted to travel outside normal hours to re-stock shops amid panic-buying. Businesses were also provided protection through temporary adjustments to insolvency regulations and the use of electronic signatures and online shareholder meetings was allowed (McDonald, 2020). Labour market regulations were temporarily relaxed to allow greater flexibility in terms of working hours, tasks and leave entitlements.
Australia’s island borders also helped contain the virus. As cases began to rise in March 2020, the government closed international borders to non-citizens. By end-March, all returning travellers were required to quarantine at government-mandated hotel facilities for two weeks. This may have helped reduce COVID-19 transmission from abroad, but has not been without problems. International quarantine is typically a federal government responsibility, but the COVID-19 hotel quarantine system is managed by the states. While overall the system has worked as intended, there have been a few instance of unsuitable hotels and poor training of staff leading to facilities becoming seeding grounds, where staff contracted the disease before spreading it into the local community. This was the source of the second outbreak of infection in Victoria. Limited capacity in hotel quarantine facilities also meant strict caps on international arrivals. In response to the emergence of the Delta variant of COVID-19 and pressure on quarantine facilities, the National Cabinet halved the cap on international air passenger arrivals in mid-July. By later in the month, there was around 40,000 Australians abroad who were registered as wanting to return home but unable to do so. In late August, the cap for international arrivals into New South Wales was halved again.

10 |
OECD ECONOMIC SURVEYS: AUSTRALIA 2021 © OECD 2021
In July 2021, the National Cabinet agreed a National Plan to transition Australia's National COVID Response from pre-vaccination settings, focusing on continued suppression of community transmission, to post-vaccination settings focused on prevention of serious illness, hospitalisation and fatality, and the public health management of other infectious diseases. Each phase of the plan will be triggered by the achievement of vaccination rate thresholds, meaning that the speed with which the plan is implemented will largely depend on widespread availability and community take-up of vaccines. Once 70-80% of the adult population are fully vaccinated, the plan envisages a relaxation of the stringency of containment measures and a staged reopening of international borders. These targets have taken on added importance since the current strict lockdowns were implemented in several states. With an acceptance by leaders in these jurisdictions that the increased transmissibility of the Delta variant means near-zero case numbers is no longer feasible, reduced stringency of lockdowns has been conditioned on these vaccination thresholds being met.
The vaccine campaign started slowly (Figure 1.2, Panel B). This reflected slow community take-up due to low case numbers, but also challenges with vaccine availability (including through accessing supply from other countries) and coordinating the administration of vaccines through general practitioners. As in many other OECD countries, there have been changes to health advice related to using certain vaccines. Pfizer is now the recommended vaccine for those under the age of 60, but the vaccine only began to be available in large volumes in Australia in recent months. Vaccination rates have recently ramped up in response to increased vaccine supply and the recent COVID-19 outbreaks. Nevertheless, the proportion of the adult population who are fully vaccinated is still well below the 70-80% threshold in all states and territories.
Looking forward, the authorities should target all eligible adults being able to receive COVID-19 vaccination by end-2021. Ensuring Indigenous Australians who live in remote communities have easy access to vaccines and accurate medical advice should be a focus. Once the defined vaccination thresholds are achieved and international agreement is reached related to a vaccine passport, the reopening of international borders will support the economic recovery through enabling foreign student arrivals, bilateral tourism and population growth stemming from net immigration. As border and other restrictions are eased, testing, tracing and isolation systems of state governments will need to be reviewed to ensure that they are adequately prepared for the new arrangements. The capacity of state health systems to cope once restrictions are eased will also need to be a focus, ensuring that they can provide high quality and timely care to individuals who contract COVID-19 as well as those requiring hospital care for other conditions.
The macroeconomy rebounded strongly, but has weakened amid new restrictions
The economy bounced back rapidly through the second half of 2020, with the easing of restrictions and strong income growth. The robust recovery continued through the first half of 2021, as rising commodity and asset prices, low COVID-19 case numbers and limited negative economic impacts from the withdrawal of fiscal stimulus pushed consumer and business confidence higher (Figure 1.3, Panel A). Even so, there remained significant divergence between sectors (Figure 1.3, Panel B). This partly reflected changing consumption patterns through the pandemic: by June 2021, household expenditure on goods had rebounded 6.3% above pre-pandemic levels while spending on services remained around 4% below. In response to the recent COVID-19 outbreaks and stricter restrictions, measures of confidence have fallen sharply. Once again, the economic impacts are likely to disproportionately fall on some face-to-face services sectors such as hospitality.

| 11
OECD ECONOMIC SURVEYS: AUSTRALIA 2021 © OECD 2021
Figure 1.3. Confidence has recovered, but there are divergent trends across sectors
Note: In Panel A, the measures are normalised over the period since 1997. Source: Refinitiv.
StatLink 2 https://stat.link/h8wyu4
Private investment activity also bounced back sharply through the year to June 2021. The recovery in confidence through 2020 and early 2021, along with government tax incentives, translated into particularly strong business machinery and equipment spending. Since then, available indicators suggest a moderation in firm’s capital expenditure. Investment in detached housing also bounced back strongly once the initial restrictions were eased, supported by both federal and state government policy measures, low interest rates and pent-up demand. In contrast, approvals for high-density housing construction remained weak, partly reflecting low population growth, including through a reduction in international students. House prices rose strongly through the first half of 2021, contributing to concerns around housing affordability that have added to a structural trend of growing wealth inequality between older and young Australians (Wood et al., 2019). While indicators of rents on houses have risen over the past year, apartment rents have declined.
Export volumes have remained somewhat subdued since the onset of the pandemic. In particular, international border closures have depressed education exports. The decline in these exports subtracted roughly ½ per cent from GDP over the first half of 2020 (RBA, 2021). The economic effects of fewer foreign tourists has been somewhat offset by Australian residents spending more domestically (ibid), as Australia has been a net importer of tourism in recent years. In the first half of 2021, resource exports were constrained by supply disruptions. Nevertheless, there was a discernable recovery in nominal export values, with rising iron ore prices pushing the terms of trade to its highest level in history in June 2021 (Figure 1.4, Panels A and B). This reflected strong Chinese steel production combined with supply constraints in Brazilian mines.
The Asia-Pacific region is critical for Australian trade, accounting for over 80% of exports (Figure 1.4, Panels D and E). Over the past two decades, the share of Australia’s merchandise exports destined for China has increased from 10% to around 40% and now surpasses Australia’s total merchandise exports to all OECD countries combined (Figure 1.4, Panel C). In recent years, escalating trade tensions have resulted in China placing import restrictions on certain Australian commodities, including coal, barley, wine, beef and cotton. For some of these products, exporters have been successful at pivoting to other markets. For instance, coal exports to India, Brazil and Indonesia have picked up.
-0.8 -0.4 0 0.4 0.8
Professional servicesRetail Trade
Public administrationHealth care and social assistance
Other servicesMining
Financial servicesElectricity, gas, water and waste
EducationArts and recreation
Transport and warehousingRental and real estate services
ManufacturingAdministrative and support services
Wholesale TradeAgriculture
ConstructionInformation, media, telecomm.
Accommodation and Food
% pts
B. Contribution to aggregate employment growth, Feb-2020 to May-2021
-8
-7
-6
-5
-4
-3
-2
-1
0
1
2
Jan-19 Jul-19 Jan-20 Jul-20 Jan-21 Jul-21
Std dev.
A. Measures of consumer and business confidence
Consumer confidence
Business confidence

12 |
OECD ECONOMIC SURVEYS: AUSTRALIA 2021 © OECD 2021
Australia’s strengthened trade relationship with a rapidly-industrialising China has brought benefits for business, household and government incomes over recent decades. Nonetheless, the increased concentration of export flows makes Australia more vulnerable to a future shock in the Chinese economy or import restrictions being imposed on additional commodities, such as iron ore.
Figure 1.4. The Asia-Pacific is the core bilateral trading region
Note: In Panel B and Panel C, export shares are in nominal terms. In Panel B, “Metal ores” includes metalliferous ores and scrap and “Coal” includes coal, coke and briquettes. Source: ABS; and OECD International Trade by Commodity Statistics database.
StatLink 2 https://stat.link/wu97ai
1%4%5%
8%
82%
D. Exports by destination
1% 4%
15%
20%60%
E. Imports by originAfrica Oceania AmericasEurope Asia
0
10
20
30
40
50
60
2003 2005 2007 2009 2011 2013 2015 2017 2019 2021
%
C. Merchandise export share by destination
OECD China
0
10
20
30
40
50
2003 2005 2007 2009 2011 2013 2015 2017 2019 2021
%B. Total export share by selected items
Metal ores Coal
60
80
100
120
140
160
180
60
80
100
120
140
160
180
1960 1965 1970 1975 1980 1985 1990 1995 2000 2005 2010 2015 2020
Index 1960Q1 = 100Index 1960Q1 = 100
A. Terms of trade

| 13
OECD ECONOMIC SURVEYS: AUSTRALIA 2021 © OECD 2021
The immediate labour market impacts of the initial downturn were more abrupt than in earlier recessions, but the subsequent recovery was also more rapid (Figure 1.5). Total hours worked had fully recovered by early 2021. The unemployment rate fell from its peak of 7.4% in mid-2020 to 4.6% in July 2021. As the labour market recovered, the composition of employment growth gradually shifted from part-time to full-time work and pockets of labour shortages began to emerge. This was especially the case in sectors that have traditionally relied on foreign or interstate labour such as agriculture and mining. Even so, the long-term unemployment rate remained elevated (Figure 1.6, Panel A), with particular cohorts of displaced workers still struggling to reintegrate into the labour market. Higher frequency data suggest that the current strict lockdowns are having notable effects on the labour market: payroll jobs fell 3.7% between the first and last week of July and wages fell 5.7%.
Figure 1.5. The labour market shock was abrupt but employment rebounded after the initial lockdown
Employment, percentage change from pre-downturn employment peak
Source: Australian Bureau of Statistics
StatLink 2 https://stat.link/vtapm2
As in many other OECD countries, job losses in the early stages of the pandemic were particularly severe in labour intensive, face-to-face services which tend to employ a large share of young and lower-wage workers (Figure 1.6, Panel B). In contrast to older cohorts, employment of the 15-24 and 25-34 age groups remained below pre-pandemic levels in July 2021. The larger labour market impact on young and lower-wage workers risks amplifying existing divides. In addition to rising intergenerational inequality, aggregate measures of income and wealth inequality have edged up over recent decades (Productivity Commission, 2018).
The employment shock at the onset of the pandemic was slightly larger for women than for men, though the subsequent labour market recovery was observed across both genders (Figure 1.6, Panels C and D). There remains an eight percentage point gap in the employment to population ratios between the genders, which is around the gap in the average OECD country. Australia’s gender participation gap is also around the average across the OECD, having narrowed in recent years partly due to rising participation of older women. However, Australian women are more likely to work part-time than in other countries. This is especially the case for women with children (OECD, 2018b; Wood et al. 2020).
-7
-6
-5
-4
-3
-2
-1
0
1
2
-7
-6
-5
-4
-3
-2
-1
0
1
2
1 3 5 7 9 11 13 15 17 19 21 23 25 27 29 31 33 35 37 39 41 43 45 47 49 51 53 55
%%
Months since peak in employment
1980s recession 1990s recession
GFC COVID-19 pandemic

14 |
OECD ECONOMIC SURVEYS: AUSTRALIA 2021 © OECD 2021
As discussed in the 2018 OECD Australia Economic Survey, an ongoing challenge for promoting female labour participation is ensuring that the tax and benefit system does not disincentivise those women wanting to increase work hours. Australia's system of means-tested benefits ensures that payments are well targeted and fiscal costs are contained, but high effective marginal tax rates generated by steep benefit tapering may dissuade some women from working more. Higher incomes upon entering employment would also encourage greater female participation: the gap in earnings per hour worked between men and women was around 10% in 2020. A significant portion of this gap cannot be explained by gender differences in factors such as job category and industry, career interruptions, age and tenure (KPMG, 2019).
An additional barrier to greater female workforce participation has been relatively high net childcare costs. While limited childcare availability constrains access for some parents (Australian Institute of Family Studies, 2021), surveys suggest that childcare cost is the more significant factor holding back parents from undertaking more paid work (Wood et al., 2020). In July 2018, the government replaced two childcare support measures with a means-tested Child Care Subsidy. Subsequently, out-of-pocket child care expenses for families declined by 18% (Commonweatlh Government, 2021a). As part of the 2021-22 Federal Budget, the subsidy was increased for families with two or more children aged five and under. The annual cap on the subsidy, applying to families with incomes over AUD189,390, will also be removed (see Table 1.4). Ongoing income tax cuts under the government’s Personal Income Tax Plan should also generally reduce marginal effective tax rates.
Figure 1.6. Lower wage workers experienced more adverse employment outcomes
Note: In Panel B, measures are calculated at the industry-level, with industries placed in the wage distribution depending on average weekly earnings. Source: ABS; OECD calculations.
StatLink 2 https://stat.link/5x9ngz
-2.0
-1.0
0.0
1.0
2.0
3.0
4.0
5.0
6.0
Bottom third Middle third Top third
%
B. Employment growth by wage group Feb 2020 to May 2021
5052545658606264666870
Dec-19 Mar-20 Jun-20 Sep-20 Dec-20 Mar-21 Jun-21
RatioC. Employment to population
Males Females
-1.0-0.8-0.6-0.4-0.20.00.20.40.60.8
Employment topopulation ratio
Participation rate Unemployment rate
D. Labour market indicators, by genderFeb 2020 to July 2021
Males Females
% pts. changes
0
5
10
15
20
25
30
35
40
1991 1995 1999 2003 2007 2011 2015 2019
Ratio
A. Long-term unemployment to total employment
| 15
OECD ECONOMIC SURVEYS: AUSTRALIA 2021 © OECD 2021
Underlying inflationary pressures remain subdued. Policy measures and, to a lesser extent, the impacts of the pandemic, caused substantial volatility in prices through 2020. While much of this impact has now passed, it is possible that the reintroduction of domestic containment measures may result in additional government policies or behavioural changes that have strong temporary influences on consumer prices. Consistent with spare capacity in most sectors, wage growth remains modest, despite the reversal of some temporary wage cuts in the second half of 2020.
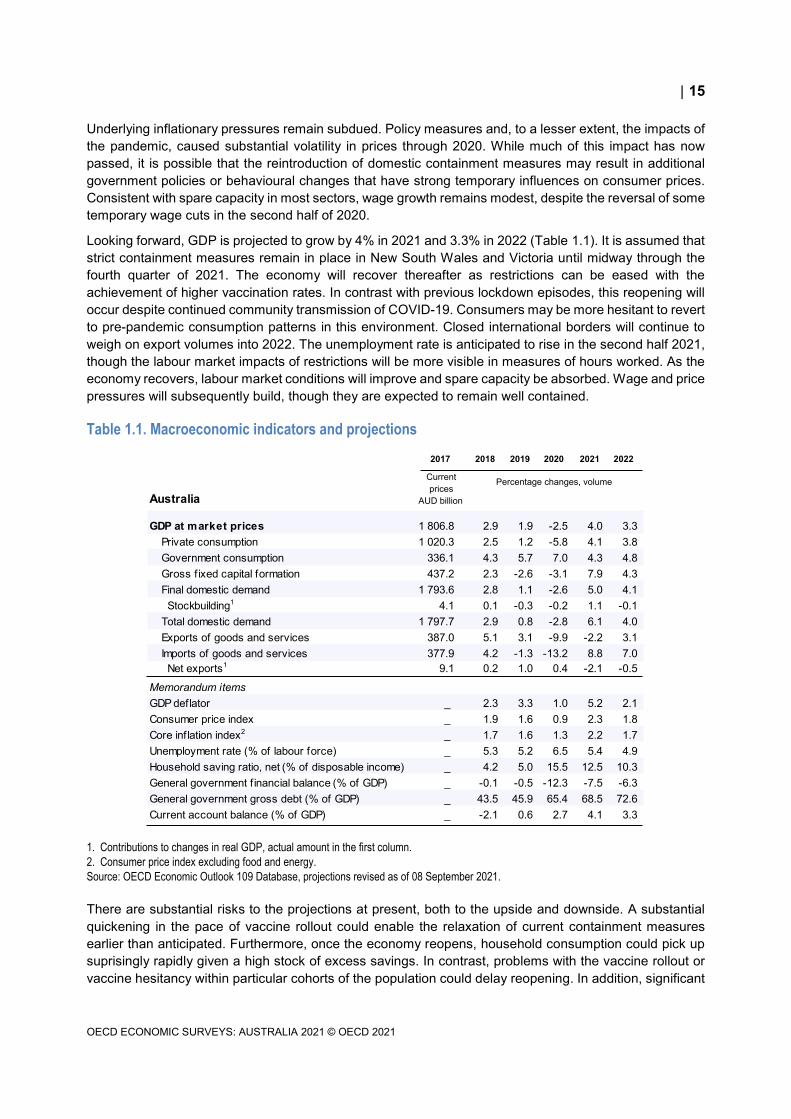
Looking forward, GDP is projected to grow by 4% in 2021 and 3.3% in 2022 (Table 1.1). It is assumed that strict containment measures remain in place in New South Wales and Victoria until midway through the fourth quarter of 2021. The economy will recover thereafter as restrictions can be eased with the achievement of higher vaccination rates. In contrast with previous lockdown episodes, this reopening will occur despite continued community transmission of COVID-19. Consumers may be more hesitant to revert to pre-pandemic consumption patterns in this environment. Closed international borders will continue to weigh on export volumes into 2022. The unemployment rate is anticipated to rise in the second half 2021, though the labour market impacts of restrictions will be more visible in measures of hours worked. As the economy recovers, labour market conditions will improve and spare capacity be absorbed. Wage and price pressures will subsequently build, though they are expected to remain well contained.
Table 1.1. Macroeconomic indicators and projections
1. Contributions to changes in real GDP, actual amount in the first column. 2. Consumer price index excluding food and energy. Source: OECD Economic Outlook 109 Database, projections revised as of 08 September 2021.
There are substantial risks to the projections at present, both to the upside and downside. A substantial quickening in the pace of vaccine rollout could enable the relaxation of current containment measures earlier than anticipated. Furthermore, once the economy reopens, household consumption could pick up suprisingly rapidly given a high stock of excess savings. In contrast, problems with the vaccine rollout or vaccine hesitancy within particular cohorts of the population could delay reopening. In addition, significant
2017 2018 2019 2020 2021 2022
Australia
Current prices
AUD billion
GDP at market prices 1 806.8 2.9 1.9 -2.5 4.0 3.3 Private consumption 1 020.3 2.5 1.2 -5.8 4.1 3.8 Government consumption 336.1 4.3 5.7 7.0 4.3 4.8 Gross f ixed capital formation 437.2 2.3 -2.6 -3.1 7.9 4.3 Final domestic demand 1 793.6 2.8 1.1 -2.6 5.0 4.1 Stockbuilding1 4.1 0.1 -0.3 -0.2 1.1 -0.1 Total domestic demand 1 797.7 2.9 0.8 -2.8 6.1 4.0 Exports of goods and services 387.0 5.1 3.1 -9.9 -2.2 3.1 Imports of goods and services 377.9 4.2 -1.3 -13.2 8.8 7.0 Net exports1 9.1 0.2 1.0 0.4 -2.1 -0.5
Memorandum itemsGDP deflator _ 2.3 3.3 1.0 5.2 2.1 Consumer price index _ 1.9 1.6 0.9 2.3 1.8 Core inflation index2 _ 1.7 1.6 1.3 2.2 1.7 Unemployment rate (% of labour force) _ 5.3 5.2 6.5 5.4 4.9 Household saving ratio, net (% of disposable income) _ 4.2 5.0 15.5 12.5 10.3 General government f inancial balance (% of GDP) _ -0.1 -0.5 -12.3 -7.5 -6.3 General government gross debt (% of GDP) _ 43.5 45.9 65.4 68.5 72.6 Current account balance (% of GDP) _ -2.1 0.6 2.7 4.1 3.3
Percentage changes, volume
16 |
OECD ECONOMIC SURVEYS: AUSTRALIA 2021 © OECD 2021
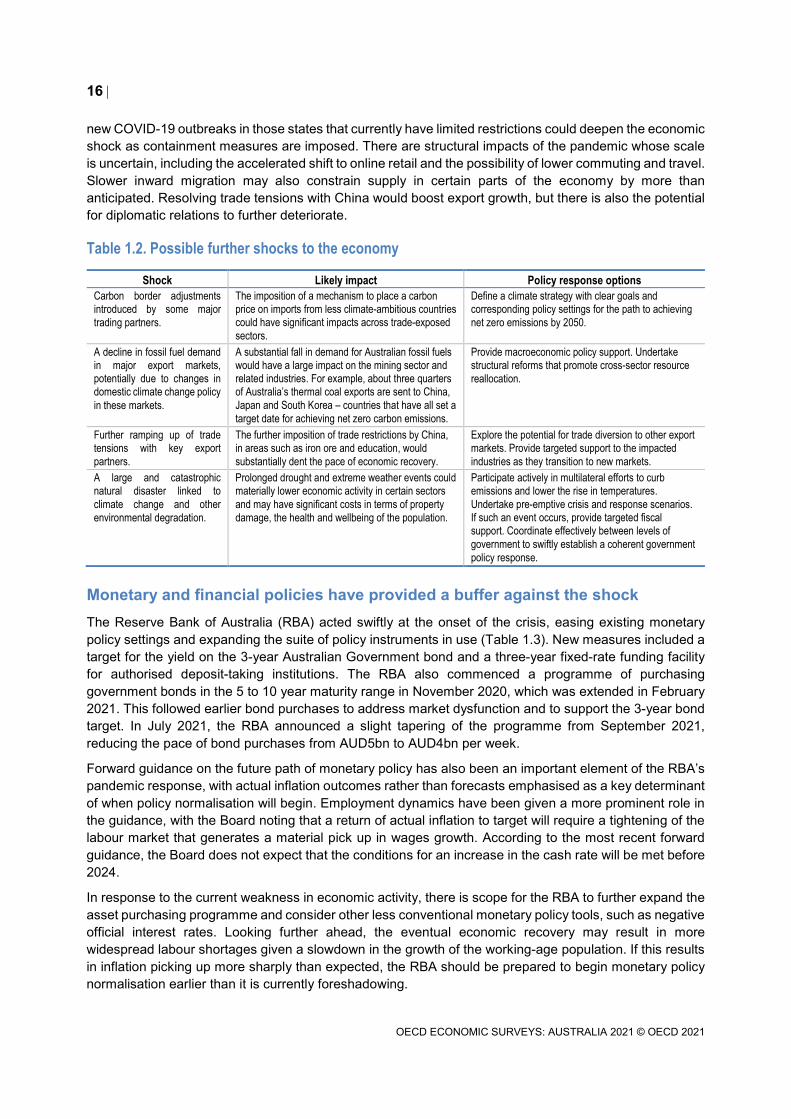
new COVID-19 outbreaks in those states that currently have limited restrictions could deepen the economic shock as containment measures are imposed. There are structural impacts of the pandemic whose scale is uncertain, including the accelerated shift to online retail and the possibility of lower commuting and travel. Slower inward migration may also constrain supply in certain parts of the economy by more than anticipated. Resolving trade tensions with China would boost export growth, but there is also the potential for diplomatic relations to further deteriorate.
Table 1.2. Possible further shocks to the economy
Shock Likely impact Policy response options Carbon border adjustments introduced by some major trading partners.
The imposition of a mechanism to place a carbon price on imports from less climate-ambitious countries could have significant impacts across trade-exposed sectors.
Define a climate strategy with clear goals and corresponding policy settings for the path to achieving net zero emissions by 2050.
A decline in fossil fuel demand in major export markets, potentially due to changes in domestic climate change policy in these markets.
A substantial fall in demand for Australian fossil fuels would have a large impact on the mining sector and related industries. For example, about three quarters of Australia’s thermal coal exports are sent to China, Japan and South Korea – countries that have all set a target date for achieving net zero carbon emissions.
Provide macroeconomic policy support. Undertake structural reforms that promote cross-sector resource reallocation.
Further ramping up of trade tensions with key export partners.
The further imposition of trade restrictions by China, in areas such as iron ore and education, would substantially dent the pace of economic recovery.
Explore the potential for trade diversion to other export markets. Provide targeted support to the impacted industries as they transition to new markets.
A large and catastrophic natural disaster linked to climate change and other environmental degradation.
Prolonged drought and extreme weather events could materially lower economic activity in certain sectors and may have significant costs in terms of property damage, the health and wellbeing of the population.
Participate actively in multilateral efforts to curb emissions and lower the rise in temperatures. Undertake pre-emptive crisis and response scenarios. If such an event occurs, provide targeted fiscal support. Coordinate effectively between levels of government to swiftly establish a coherent government policy response.
Monetary and financial policies have provided a buffer against the shock The Reserve Bank of Australia (RBA) acted swiftly at the onset of the crisis, easing existing monetary policy settings and expanding the suite of policy instruments in use (Table 1.3). New measures included a target for the yield on the 3-year Australian Government bond and a three-year fixed-rate funding facility for authorised deposit-taking institutions. The RBA also commenced a programme of purchasing government bonds in the 5 to 10 year maturity range in November 2020, which was extended in February 2021. This followed earlier bond purchases to address market dysfunction and to support the 3-year bond target. In July 2021, the RBA announced a slight tapering of the programme from September 2021, reducing the pace of bond purchases from AUD5bn to AUD4bn per week.
Forward guidance on the future path of monetary policy has also been an important element of the RBA’s pandemic response, with actual inflation outcomes rather than forecasts emphasised as a key determinant of when policy normalisation will begin. Employment dynamics have been given a more prominent role in the guidance, with the Board noting that a return of actual inflation to target will require a tightening of the labour market that generates a material pick up in wages growth. According to the most recent forward guidance, the Board does not expect that the conditions for an increase in the cash rate will be met before 2024.
In response to the current weakness in economic activity, there is scope for the RBA to further expand the asset purchasing programme and consider other less conventional monetary policy tools, such as negative official interest rates. Looking further ahead, the eventual economic recovery may result in more widespread labour shortages given a slowdown in the growth of the working-age population. If this results in inflation picking up more sharply than expected, the RBA should be prepared to begin monetary policy normalisation earlier than it is currently foreshadowing.

| 17
OECD ECONOMIC SURVEYS: AUSTRALIA 2021 © OECD 2021
Table 1.3. Monetary policy support since the onset of the pandemic
Date of announcement Measure 3 March 2020 Official cash rate target lowered by 25 basis points to 0.50 per cent 19 March 2020 At an emergency meeting, a package of new measures were introduced, comprising:
• Reduction in the official cash rate target to 0.25 per cent. • Introduced a target for the yield on 3-year Australian Government bonds of around 0.25 per cent, to
be achieved through bond purchases in the secondary market. • Introduced a three-year funding facility of at least AUD90 billion to authorised deposit-taking
institutions (ADIs) at a fixed rate of 0.25 per cent. ADIs were able to obtain initial funding of up to 3 per cent of their existing outstanding credit and have access to additional funding if they increased lending to business, especially to small and medium-sized businesses.
• Exchange settlement balances at the Reserve Bank remunerated at 10 basis points, rather than zero. This was aimed at mitigating the cost to the banking system associated with a large foreshadowed increase in banks' settlement balances.
1 September 2020 Term Funding Facility increased and extended. ADIs were able to access additional funding, equivalent to 2 per cent of their outstanding credit, at a fixed rate of 25 basis points for three years. ADIs were able to draw on this extra funding up until the end of June 2021, an extension from the prior expiry date of March 2021.
3 November 2020 A package of additional measures were introduced, comprising: • Reduction in official cash rate target to 0.1 per cent. • Reduction in the target for the yield on the 3-year Australian Government bond to around 0.1 per
cent. • Reduction in the interest rate on new drawings under the Term Funding Facility to 0.1 per cent. • Reduction in the interest rate on Exchange Settlement balances to zero. • Purchase of AUD100 billion of government bonds of maturities of around 5 to 10 years over the next
six months. Under the programme, the RBA purchased bonds in the secondary market through regular auctions. The programme aimed to purchase 80% Australian Government bonds and 20% States and Territory government bonds.
2 February 2021 Announced that an additional AUD100 billion of bonds issued by the Australian Government and states and territories would be purchased when the current bond purchase programme finished in mid-April. Additional purchases were to be made at the rate of AUD5 billion per week.
Other financial sector policies have also shifted to support the economy since the onset of the pandemic. The banking sector offered loan repayment deferrals to households and SMEs and the bank regulator allowed such deferrals to not be treated as in arrears. Insolvency thresholds were temporarily raised and a raft of additional government policies, including a loan guarantee for SMEs and investment in structured finance markets, eased the flow of credit. These policies interacted with a healthy financial sector to provide an important buffer against the economic shock. Nevertheless, as temporary support measures are further unwound, insolvencies will likely rise from the currently exceptionally low levels. The financial sector response to the pandemic and the ongoing policy challenges are discussed in the thematic chapter of this Economic Survey.
In response to the monetary and financial policy response, interest rates have fallen across the board (Figure 1.7, Panels A and B). Since mid-2019, housing, personal and business interest rates have declined by 1% on average. This has begun to translate into a pickup in credit growth, especially for housing. This reflects a broadly based increase in housing prices in recent months (Figure 1.7, Panel C).
Past OECD Australia Economic Surveys have highlighted the potential risks stemming from Australia’s high household debt and strong trend increases in house prices. This remains a medium-term vulnerability for the Australian economy. In the near-term, systemic risks are moderated by the likelihood of prolonged low interest rates and the increased attention being given to lending standards in the wake of the Royal Commission into Misconduct in the Banking, Superannuation and Financial Services Industry (see Chapter 2). Looking forward, macroprudential tools should be the primary lever to curb emerging risks in the housing market. Such tools were judiciously employed in the period of strong house price growth from late 2014.

18 |
OECD ECONOMIC SURVEYS: AUSTRALIA 2021 © OECD 2021
As discussed in Chapter 2, the Australian Prudential Regulation Authority (APRA) should continue to develop its toolkit of macroprudential interventions. Unlike in most OECD countries, Australia does not have a regulatory maximum loan-to-value ratio. Other effective macroprudential options to consider include higher capital requirements, through sectoral counter-cyclical capital buffers or higher risk weights on highly leveraged loans. APRA plans to release a new prudential standard for recovery and resolution planning by early 2022, completing the implementation of reforms started with the crisis-resolution legislation passed in 2018. The 2018 OECD Economic Survey highlighted that a severe crisis could test the 2018 legislation as there are no explicit bail-in provisions on senior debt or deposits owned by financial institutions. Such provisions exist in the United States and European Union and may be useful in allowing more flexible resolutions when faced with a crisis.
Figure 1.7. Market interest rates have declined
Note: Panel A and B show average interest rates on credit outstanding. Panel C is the five capital city aggregate that includes Sydney, Melbourne, Brisbane, Adelaide and Perth. Source: Reserve Bank of Australia; CoreLogic.
StatLink 2 https://stat.link/vgnc8q
0
1
2
3
4
5
6
Jul-19 Nov-19 Mar-20 Jul-20 Nov-20 Mar-21
%A. Housing interest rates
Investors Owner-occupiers
0
1
2
3
4
5
6
Jul-19 Nov-19 Mar-20 Jul-20 Nov-20 Mar-21
%B. Business interest rates
Small businessesMedium sized businessesLarge businesses
-4
-2
0
2
4
6
8
2012 2013 2014 2015 2016 2017 2018 2019 2020 2021
C. House pricesRolling three month % change

| 19
OECD ECONOMIC SURVEYS: AUSTRALIA 2021 © OECD 2021
Achieving monetary policy objectives
As in many other OECD countries, inflation had fallen below the central bank’s target prior to the pandemic. It has now been over five years since underlying inflation was within the RBA’s 2-3% symmetric medium-term target band (Figure 1.8). A variety of idiosyncratic factors have been identified as contributing to undershooting, including the impacts of globalisation and digitalisation (Debelle, 2018; Cassidy, 2019) and underestimates of the extent of spare capacity (Bishop and Cassidy, 2017) that lead to overly tight monetary policy settings. While inflation expectations have gently declined since 2015, they are not yet de-anchored, suggesting the inflation target remains credible. However, there has been an active public debate around the RBA’s policy stance and practices over the past few years (e.g. Preston, 2020; Tulip, 2021; Standing Committee on Economics, 2021).
Figure 1.8. Underlying inflation has undershot the target band for a prolonged period
Note: The measure of underlying inflation is the arithmetic average of the Trimmed Mean and Weighted Median. Source: RBA.
StatLink 2 https://stat.link/zdpuvy
Now would seem like an appropriate time for a review of Australia’s monetary policy framework, given the institutional and structural changes that have occurred in the economy as a result of the pandemic and the unconventional policy instruments the RBA has begun to employ. The experience of the many central banks in other OECD countries that have recently been through such a process could also inform the terms of reference (OECD, 2020a). Such a review should be broad in scope, potentially including a review of the central bank mandate, policy tools, methods of public communication, hiring processes and internal structures. It could also consider the alternative paths for rebuilding monetary policy space from the current position of policy rates at the zero lower bound. As was the case with recent reviews in the United States and Canada, the process should be transparent and involve consultation with a wide variety of relevant stakeholders. This can enhance public engagement and credibility in the policy framework. Looking forward, strong consideration should be given to enshrining such a review on a recurring basis.
-1
0
1
2
3
4
5
6
-1
0
1
2
3
4
5
6
2003 2005 2007 2009 2011 2013 2015 2017 2019 2021
Y-o-y % changes, s.a.Y-o-y % changes, s.a.
Consumer Price Inflation - all groups Underlying inflation
RBA target band

20 |
OECD ECONOMIC SURVEYS: AUSTRALIA 2021 © OECD 2021
Fiscal policy has responded with unprecedented force Fiscal policy responded with appropriate force within the opening months of the pandemic. Direct economic and health support was initially announced in mid-March 2020 and then progressively scaled up as the severity of the pandemic became apparent. Additional fiscal support from the Commonwealth government amounted to around 15.7% of GDP, with the spending mostly concentrated in 2020. In addition, state and territory governments announced further initiatives worth around 2½% of national GDP. The immediate fiscal response was one of the largest in the OECD (Figure 1.9). It also dwarfed the 7¼% of GDP stimulus injected during the global financial crisis, which at the time was itself large compared with other countries.
Figure 1.9. Additional fiscal support was significant and front loaded Change in projected general government budget balance, per cent of GDP
Source: OECD Economic Outlook database.
StatLink 2 https://stat.link/3k97w6
The core component of the Commonwealth government fiscal response was a large-scale temporary wage subsidy scheme called JobKeeper (Table 1.4). One estimate suggests that this programme saved at least 700,000 jobs over April to July 2020 (Bishop and Day, 2020). This was coupled with many other support measures; Australia employed a broader range of policies than most other OECD countries (Figure 1.10).
-12 -9 -6 -3 0 3 6AUSCANGRCGBRNORAUTUSASVNISR
ESPITA
LTUBELJPNCZELUXPOLFRANLDHUNPRTDEUBGR
IRLKORESTNZLDNKSVKFIN
CHELVA
SWE
% pts
A. 2019-20
-12 -9 -6 -3 0 3 6AUSCANGRCGBRNORAUTUSASVNISR
ESPITA
LTUBELJPNCZELUXPOLFRANLDHUNPRTDEUBGR
IRLKORESTNZLDNKSVKFIN
CHELVA
SWE
% pts
B. 2020-21
-12 -9 -6 -3 0 3 6AUSCANGRCGBRNORAUTUSASVNISR
ESPITA
LTUBELJPNCZELUXPOLFRANLDHUNPRTDEUBGR
IRLKORESTNZLDNKSVKFIN
CHELVA
SWE
% pts
C. 2021-22

| 21
OECD ECONOMIC SURVEYS: AUSTRALIA 2021 © OECD 2021
Figure 1.10. A multitude of policy measures were employed to fight the pandemic
Number of policy instruments used during the pandemic, out of 79 covered policy instruments
Note: Entries in the OECD COVID-19 Policy Response Tracker are coded into 79 policy items; loan guarantees or tax relief for firms are two examples of policy instruments. The figure shows the total number of policy items announced by a country between January and November 2020. Source: OECD COVID-19 Policy Response Tracker.
StatLink 2 https://stat.link/81ismq
Table 1.4. Fiscal policy support since the onset of the pandemic
Date of announcement Measure 12 March 2020 AUD17.6 billion plan. Measures included:
• One-off AUD750 direct payment to recipients of selected government income support payments and eligible concession card holders.
• Increased social security payments through a cut to the deeming rate for some income support recipients.
• Accelerated depreciation deductions for businesses. • Direct cash payments to small and medium-sized businesses (“Cash Flow Assistance for
Businesses”). • Increased instant-asset write-off for businesses.
22 March 2020 AUD66.1 billion package. Measures included: • Income support payments – expanded eligibility and supplementary benefits (“Temporary
Coronavirus Supplement”). • Additional one-off AUD750 direct payment to recipients of selected government income support
payments and eligible concession card holders. • Early release of up to AUD10,000 of superannuation for individuals in financial stress on two
separate occasions. • Payments to small and medium sized businesses linked to staff wage tax withholdings (“Boosting
Cash Flow for Employers”). • Coronavirus SME Guarantee Scheme to support SME access to credit.
30 March 2020 AUD89 billion JobKeeper temporary wage subsidy scheme. The subsidy was paid to firms impacted by COVID-19 restrictions and was required to be passed on to employees in full. In the first phase of JobKeeper (March to September 2020) eligible businesses and not-for-profits (NFPs) were able to receive AUD1,500 (before tax) per fortnight per employee to cover the cost of wages, a rate which was equivalent to the median wage in heavily hit sectors such as retail, hospitality and tourism. In the extension phase of JobKeeper (October 2020 to March 2021), business eligibility was retested and the payment was tapered and targeted to those businesses that continued to be significantly affected by the economic downturn.
2 April 2020 Early Childhood Education and Care Relief Package. New funding arrangements that temporarily made childcare services fee free for families.
0
5
10
15
20
25
30
35
40
45
0
5
10
15
20
25
30
35
40
45
ISL
JPN
CHE
MEX
CAN
EST
SVK
LVA
NZL
COL
DNK
FIN
ISR
USA
BEL
GRC IRL
SVN
AUT
FRA
GBR
OECD SW
ECZ
ENL
DNO
RTU
RHU
NKO
RCH
LIT
APR
TDE
UPO
LLU
XAU
SLT
UES
P
NumberNumber

22 |
OECD ECONOMIC SURVEYS: AUSTRALIA 2021 © OECD 2021
4 June 2020 HomeBuilder programme with an initial cost of AUD680 million (total cost after the scheme was extended in April 2021 was AUD2.5 billion). Under the scheme, eligible owner-occupiers were provided a grant of AUD25,000 to build a new home or substantially renovate an existing home.
6 October 2020 2020-21 Federal Budget. Measures included: • Business tax relief (full expensing of eligible assets and losses incurred to June 2022 able to be
offset against prior profits). • Personal income tax cuts, through bringing forward the already-legislated Stage 2 tax cuts of the
government’s Personal Income Tax Plan, as well as an extension to the Low- and Middle-income Tax Offset.
• Infrastructure investment focused on roads and spending on the National Water Grid. • Temporary wage subsidy for newly hired young workers (16-35) previously receiving selected
government payments. • Spending on COVID-19 vaccines. • Further support for apprenticeships, through the Boosting Apprenticeship Commencements Wage
Subsidy. • Two additional Economic Support Payments of AUD250 to pensioners and other eligible recipients. • Pandemic Leave Disaster Payment for eligible workers unable to work and earn income while under
a direction to self-isolate or quarantine. 17 December 2020 2021 Mid-year Economic and Fiscal Outlook. Measures included:
• Extension of various support measures including the temporary Coronavirus Supplement and the HomeBuilder programme.
• New support for travel agents and the aviation sector. • New spending on health, including COVID-19 Vaccination Programme and aged care. • Transport infrastructure spending, particularly focused on rail.
11 May 2021 2021-22 Federal Budget. Measures included: • Extension of temporary tax relief, including full expensing, temporary loss carry-back and the low and
middle income tax offset. • Aged care spending, including improvements to residential care and home care packages. • Increase of the Child Care Subsidy for families with two or more children aged five and under. The
annual cap on the subsidy, applying to families with incomes over AUD189,390, will also be removed.
• Spending for women’s safety and economic security, including support for victims of family violence and women’s health programs.
• Infrastructure projects focused on road, rail and community infrastructure. • Additional support for National Disability Insurance Scheme. • COVID-19 spending on vaccination rollout and health care services. • Spending on mental health services. • Expanded wage subsidies through existing schemes, that will include subsidies for young people,
parents and the long-term unemployed. July-August 2021 Various additional fiscal supports, some under joint financing agreements between federal and state
governments, were introduced for entities impacted by the reintroduction of COVID-19 containment measures in certain regions. Measures included:
• The COVID-19 Disaster Payment for individuals who lost work as a result of a state public health order that imposes restrictions on movement (AUD750 per week for individuals who lost 20 hours or more of work, and AUD450 per week for those who lose between 8-20 hours). Those receiving an income support payment can also claim an extra payment of AUD200 if they have lost eight hours or more of work and meet the other eligibility requirements for the COVID-19 Disaster Payment.
• Increases in business grants and broader eligibility in several states. These included expansions of the Smass Business COVID Hardship Fund in Victoria, COVID-19 Business Grants in New South Wales and a Business Support Grant in South Australia.
• Additional sector-specific supports, such as grants for tourism businesses in Western Australia and a new round of payments for hospitality businesses in metropolitan Melbourne.
• Expansion of the SME Recovery Loan Scheme to remove requirements that an SME had received JobKeeper or have been impacted by March 2021 floods.
Note: This is a non-exhaustive list, but serves to cover the main fiscal policy announcements through the pandemic.

| 23
OECD ECONOMIC SURVEYS: AUSTRALIA 2021 © OECD 2021
Supporting the recovery while ensuring fiscal sustainability
At the time of the last Federal Budget, the government expected the Commonwealth fiscal deficit to decline from 7.8% of GDP in fiscal year 2020-21 to 2.4% in 2024-25. Commonwealth gross government debt was projected to rise from around 28% of GDP prior to the pandemic to 50% of GDP at 30 June 2025. At that time, the authorities articulated a two-stage fiscal strategy. First, the aim is to create a strong and sustainable private sector led recovery and drive down the unemployment rate. Then, once the economic recovery is well entrenched and the unemployment rate is back to pre-pandemic levels (5%) or lower, the policy focus will turn to stabilising and then reducing debt as a share of GDP.
The current strict containment measures in certain states have been accompanied by further fiscal support from both the federal and state governments (Table 1.4). The current stance of fiscal policy is appropriate and governments should stand ready to provide further fiscal support if restrictions end up being more prolonged than currently anticipated or if there are virus outbreaks in other jurisdictions that result in new containment measures being introduced. For the time being, the low interest rate environment means that the government could run primary fiscal deficits in the coming years and still put the government gross debt ratio on a downward path (Box 1.3).
The government’s substantial fiscal stimulus during the pandemic was enabled by the country’s strong starting fiscal position. After an extended period of “budget repair”, the federal Budget had returned to balance in Financial Year 2018/19. Since its inception, Australia’s Charter of Budget Honesty has entrenched fiscal discipline into the system, with a range of regular publications that provide insights to the government’s budgetary position (Box 1.2).
Box 1.2. Australia’s Charter of Budget Honesty Legislated in 1998, the Charter of Budget Honesty occupies a central role in Australia’s Commonwealth budget process, creating a system of processes that involve Parliament, the Treasury, the Department of Finance, and the Parliamentary Budget Office. The purpose of the Charter is to improve fiscal policy outcomes by requiring fiscal strategy to be based on principles of sound fiscal management, and by facilitating public scrutiny of fiscal policy and performance. There are a range of documents published each year that aim to support these objectives, including:
• The Fiscal Strategy Statement is tabled by the Federal Treasurer with the release of each annual budget, which also includes an Economic and Fiscal Outlook report.
• The Mid-Year Economic and Fiscal Outlook Report acts as an update and a progress report to the annual budget half-way through the fiscal year. It serves to highlight any changes that may affect the budget’s trajectory.
• The Budget Outcome Report is published within three months of the end of the financial year and summarises the post-budget financial statements.
• The Intergenerational Report is published at least once every five years and highlights the impact of changing demographics on the economy and public finances over the following 40 years.
• A Pre-Election Fiscal Outlook is released within 10 days of the issue of the writ for a Federal election and updates budget estimates to present the country’s fiscal position before the election.
The institutional fiscal framework should continue to evolve, reflecting the new environment in which fiscal policy is being conducted. Prior to the pandemic, there was a view that discretionary policy support for non-crisis cyclical fluctuations should be provided through monetary policy (Commonwealth Government, 2019). However, fiscal policy may play a more active role in managing such fluctuations in the coming
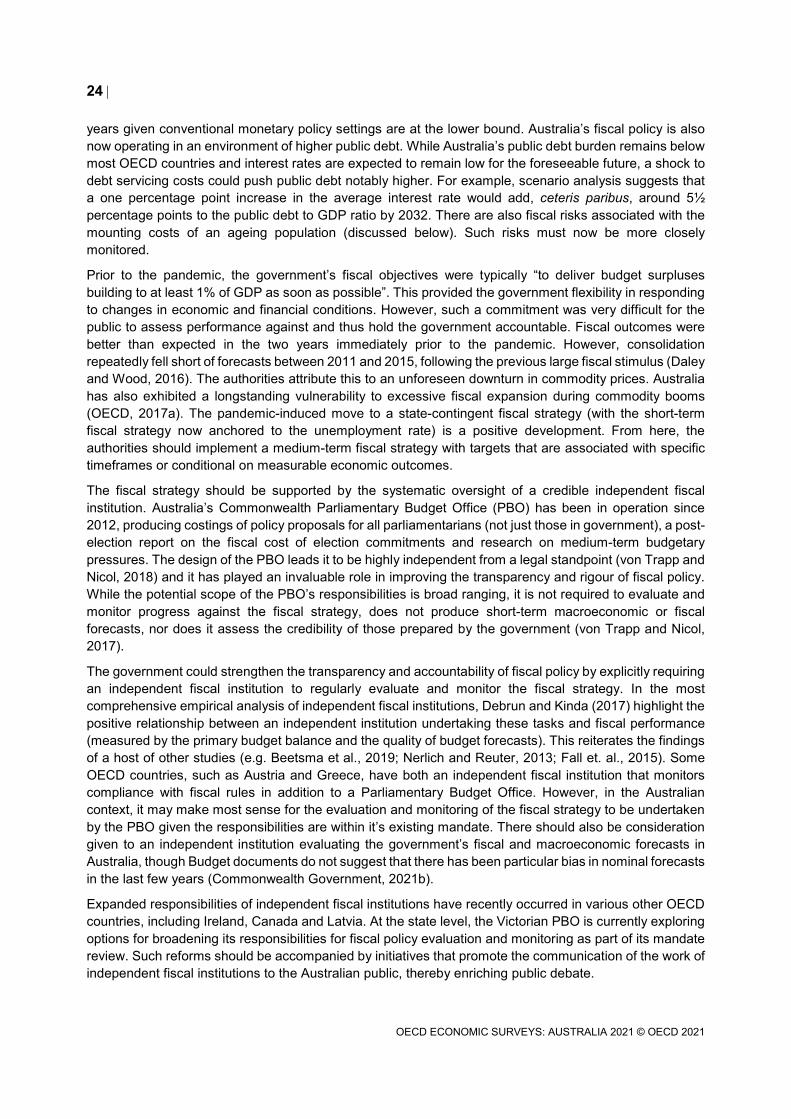
24 |
OECD ECONOMIC SURVEYS: AUSTRALIA 2021 © OECD 2021
years given conventional monetary policy settings are at the lower bound. Australia’s fiscal policy is also now operating in an environment of higher public debt. While Australia’s public debt burden remains below most OECD countries and interest rates are expected to remain low for the foreseeable future, a shock to debt servicing costs could push public debt notably higher. For example, scenario analysis suggests that a one percentage point increase in the average interest rate would add, ceteris paribus, around 5½ percentage points to the public debt to GDP ratio by 2032. There are also fiscal risks associated with the mounting costs of an ageing population (discussed below). Such risks must now be more closely monitored.
Prior to the pandemic, the government’s fiscal objectives were typically “to deliver budget surpluses building to at least 1% of GDP as soon as possible”. This provided the government flexibility in responding to changes in economic and financial conditions. However, such a commitment was very difficult for the public to assess performance against and thus hold the government accountable. Fiscal outcomes were better than expected in the two years immediately prior to the pandemic. However, consolidation repeatedly fell short of forecasts between 2011 and 2015, following the previous large fiscal stimulus (Daley and Wood, 2016). The authorities attribute this to an unforeseen downturn in commodity prices. Australia has also exhibited a longstanding vulnerability to excessive fiscal expansion during commodity booms (OECD, 2017a). The pandemic-induced move to a state-contingent fiscal strategy (with the short-term fiscal strategy now anchored to the unemployment rate) is a positive development. From here, the authorities should implement a medium-term fiscal strategy with targets that are associated with specific timeframes or conditional on measurable economic outcomes.
The fiscal strategy should be supported by the systematic oversight of a credible independent fiscal institution. Australia’s Commonwealth Parliamentary Budget Office (PBO) has been in operation since 2012, producing costings of policy proposals for all parliamentarians (not just those in government), a post-election report on the fiscal cost of election commitments and research on medium-term budgetary pressures. The design of the PBO leads it to be highly independent from a legal standpoint (von Trapp and Nicol, 2018) and it has played an invaluable role in improving the transparency and rigour of fiscal policy. While the potential scope of the PBO’s responsibilities is broad ranging, it is not required to evaluate and monitor progress against the fiscal strategy, does not produce short-term macroeconomic or fiscal forecasts, nor does it assess the credibility of those prepared by the government (von Trapp and Nicol, 2017).
The government could strengthen the transparency and accountability of fiscal policy by explicitly requiring an independent fiscal institution to regularly evaluate and monitor the fiscal strategy. In the most comprehensive empirical analysis of independent fiscal institutions, Debrun and Kinda (2017) highlight the positive relationship between an independent institution undertaking these tasks and fiscal performance (measured by the primary budget balance and the quality of budget forecasts). This reiterates the findings of a host of other studies (e.g. Beetsma et al., 2019; Nerlich and Reuter, 2013; Fall et. al., 2015). Some OECD countries, such as Austria and Greece, have both an independent fiscal institution that monitors compliance with fiscal rules in addition to a Parliamentary Budget Office. However, in the Australian context, it may make most sense for the evaluation and monitoring of the fiscal strategy to be undertaken by the PBO given the responsibilities are within it’s existing mandate. There should also be consideration given to an independent institution evaluating the government’s fiscal and macroeconomic forecasts in Australia, though Budget documents do not suggest that there has been particular bias in nominal forecasts in the last few years (Commonwealth Government, 2021b).
Expanded responsibilities of independent fiscal institutions have recently occurred in various other OECD countries, including Ireland, Canada and Latvia. At the state level, the Victorian PBO is currently exploring options for broadening its responsibilities for fiscal policy evaluation and monitoring as part of its mandate review. Such reforms should be accompanied by initiatives that promote the communication of the work of independent fiscal institutions to the Australian public, thereby enriching public debate.

| 25
OECD ECONOMIC SURVEYS: AUSTRALIA 2021 © OECD 2021
Box 1.3. The short-term path of fiscal policy In the coming years, fiscal policy will need to tread the path between gradually restoring the fiscal balance while not choking off the recovery. Illustrative paths for the fiscal balance highlight that, under certain assumptions, running fiscal deficits of 2% of GDP in the short-term could be consistent with a debt stabilising path (Figure 1.11). If the economic recovery is stronger than expected, a reduction in the fiscal balance to around 1% of GDP could put the ratio of gross government debt to GDP on a steadily declining path (“Upside risk eventuates”). Alternatively, a weaker than expected recovery could be cushioned by more expansionary fiscal policy, though this would result in a steady further increase in the public debt burden (“Downside risk eventuates”). These scenarios rely on the assumption of relatively low interest rates being sustained and no major downside shock to economic growth (see figure note).
Figure 1.11. Fiscal stability can be restored in the short-term
Note: The interest rate on government debt and real GDP growth forecasts in the 2023-27 period are taken from the baseline scenario of the OECD Long-term Model. The upside risk scenario assumes that real GDP recovers more quickly to be 2½% above the baseline level in 2027 and fiscal policy responds through a decline in the primary fiscal deficit (relative to baseline). The downside risk scenario assumes that real GDP recovers more slowly to be 2½% below the baseline level in 2027 and fiscal policy responds through an increase in the primary fiscal deficit. Source: Calculations based on OECD Long-term Model.
StatLink 2 https://stat.link/mdja6k
Future public spending pressures
Once the economy reopens and a well-entrenched recovery moves the economy back to full employment, the fiscal strategy will need to be framed in the context of future budgetary pressures, partly from an ageing population. Although the fiscal impacts of ageing are less pronounced in Australia than in most other OECD countries, public costs are expected to rise notably. This is consistent with the findings of the government’s recent Intergenerational Report (Box 1.4). The OECD Long-term Model estimates that ageing-related fiscal costs will increase by 5% of GDP between 2021 and 2060 (Figure 1.12). This means that a similar reduction of spending or increase in revenue (or combination thereof) will be needed just to stabilise the gross debt-to-GDP ratio.
-14
-12
-10
-8
-6
-4
-2
0
2020 2022 2024 2026
A. Illustrative primary fiscal balance scenarios
Percentage of GDP
Upside risk eventuatesDownside risk eventuatesDebt stabilising path
40
50
60
70
80
2020 2022 2024 2026
B. Illustrative gross government debt scenarios
Percentage of GDP
Upside risk eventuatesDownside risk eventuatesDebt stabilising path

26 |
OECD ECONOMIC SURVEYS: AUSTRALIA 2021 © OECD 2021
Figure 1.12. There are long-term fiscal pressures from ageing
Note: In Panel A, “Other primary expenditure” is projected based on the assumption that governments will seek to provide a constant level of public spending per capita in real terms. Under some reasonable assumptions, the evolution of this expenditure category relative to GDP becomes an inverse function of the projected evolution of the population-to-employment ratio, as expenditure (numerator) follows population whereas GDP (denominator) follows employment. The “other factors” component captures anything that affects debt dynamics other than the explicit expenditure components (it mostly reflects the correction of any disequilibrium between the initial structural primary balance and the one that would stabilise the debt ratio). In Panel B, underlying projected growth rates, interest rates, etc., are from the baseline long-term scenario (for further details, see Guillemette and Turner, 2021). The debt path in the “With measures to offset ageing-related costs” scenario assumes the primary budget converges to balance in 2030 and then stays at that level. Interest receipts are assumed to remain at 1% of GDP after 2030. Source: OECD Long-term model.
StatLink 2 https://stat.link/gzdskc
0
10
20
30
40
50
60
70
80
0
10
20
30
40
50
60
70
80
2000 2005 2010 2015 2020 2025 2030 2035 2040 2045 2050 2055 2060
% of GDP% of GDP
B. Gross government debt as a share of GDP
With measures to offset ageing-related costs
Without measures to offset ageing-related costs
-4
-2
0
2
4
6
8
10
12
-4
-2
0
2
4
6
8
10
12
SVK
ESP
NOR
CZE
FRA
JPN
BEL
KOR IRL
ISL
USA
POL
SVN
AUT
DNK
NZL
AUS
HUN
ISR
FIN
SWE
CAN ITA
CHE
DEU
LUX
LVA
GBR
PRT
NLD
EST
GRC
LTU
Health expenditure Other primary expenditure Other factors Total% pts. of potential GDP % pts. of potential GDP
A. Change in general government expenditure from 2019 to 2060

| 27
OECD ECONOMIC SURVEYS: AUSTRALIA 2021 © OECD 2021
Box 1.4. The Australian Intergenerational Report 2021 On 28 June 2021, the Commonwealth government released the Intergenerational Report 2021 (Commonwealth Government, 2021c). The report projects an outlook for the economy and the federal budget over the next 40 years.
Key findings from the report include:
• The Australian economy is projected to grow at a slower pace over the next 40 years than it has over the past 40 years, largely owing to slower population growth.
• The population will continue to age, mostly because of improved life expectancy and low fertility. The ratio of working-age people to those over 65 is projected to fall from 4.0 to 2.7 over the next 40 years.
• Real per person health spending is projected to more than double over the projection period, largely due to rising incomes, changes in preferences and the costs of using new health technology.
• Aged care spending is projected to nearly double as a share of the economy by 2060-61. • In the future, more Australians will retire having made superannuation contributions while
working. This will reduce the call for government support through the Age Pension. However, superannuation attracts favourable tax treatment which reduces government revenues.
There are some key differences in coverage and methodology between the government projections in the Intergenerational Report and those presented in Figure 1.13 which mean that the two are not directly comparable. The estimates in Figure 1.13 are taken from the OECD Long-Term Model (for details, see Guillemette and Turner, 2021) with some additional assumptions. Notable difference include:
• Coverage of the public sector – the OECD estimates are for general government debt (including the States and Territories) as opposed to Commonwealth government debt in the Intergenerational Report.
• Coverage of ageing costs – the OECD estimates do not incorporate projections of pension expenses for Australia. This is because the model does not properly capture the specificities of Australia’s Superannuation system.
• Nominal GDP and interest rate projections – the OECD projections for nominal GDP and interest rates are taken from the OECD Long-term Model, which follows a harmonised methodology across countries.
• Estimates of ageing costs and other primary expenditure - the OECD projections of ageing and other primary expenditure are based on a stylised approach common to all countries. Country specificities in health, long-term care and other programme designs are generally not taken into account other than in initial expenditure levels. The stylised approach also implies a “business-as-usual” future in which no major policy changes are undertaken. One exception is already-legislated future changes in legal retirement ages, which are incorporated in employment projections. See Guillemette and Turner (2021) for additional details and references.
There is also a need for further spending to ensure the adequacy of the social safety net. Unlike most OECD countries, Australia does not have an unemployment insurance scheme that provides benefits linked to previous earnings, but has a tax-funded unemployment assistance programme that is not time-limited. Individuals may also receive other assistance for additional costs such as Rent Assistance for rental costs, and a Family Tax Benefit to help with the cost of raising children.

28 |
OECD ECONOMIC SURVEYS: AUSTRALIA 2021 © OECD 2021
Recently, the working-age unemployment benefit was raised by AUD50 per fortnight. However, the benefit for a single person in the first month of unemployment in Australia, at just 29% of the average wage, is still very low by OECD standards (Figure 1.13). When comparing Australia’s total minimum income benefits to the safety net in other countries after an individual has exhausted all unemployment benefit entitlements, Australia’s total minimum income supports are around OECD average (OECD, 2019a). However, the income shock from falling into unemployment in Australia is much larger than in other countries and minimum income supports remain well below the relative poverty line. Indeed, one estimate suggests that 85% of recipients of unemployment benefits will be in poverty (Phillips 2021).
The low level of unemployment benefits partly reflects indexation of the benefit rate to consumer price inflation, rather than faster-growing average wages. The latter has been the basis for increases in other government payments, such as the Age Pension and disability support. Consequently, while unemployment benefits were above 90% of the Age Pension in 2000, the ratio had declined to 65% by 2020. The divergence in generosity across benefits can incentivise job seekers to try and move to disability support or another type of payment (Coates and Cowgill, 2021) and thus weaken activation targeting. More generally, an adequate safety net for the unemployed is an important prerequisite for the successful implementation of new reforms that promote business dynamism (discussed further down). The government should further increase the generosity of unemployment benefits and consider indexing further increases to average wage growth. When considering such a reform, the fiscal impact as well as the potential effect on work incentives of particular cohorts should be taken into account.
Figure 1.13. Unemployment benefits remain very low by international standards
Unemployment benefit net replacement rate, 2020 or latest available year
Note: Calculation includes social assistance and housing benefits. Source: OECD Tax-Benefit Models, www.oecd.org/els/social/workincentives.
StatLink 2 https://stat.link/53f12w
Well-functioning activation policies are also key to avoid scarring effects on the long-term unemployed and to support within- and between-sector reallocation as a result of the pandemic. Such measures can also boost labour supply in the context of a smaller than expected working-age population, due partly to the extended closure of international borders. The 2018 OECD Jobs Strategy highlighted that effective activation strategies can help overcome adverse effects of benefit receipt on work incentives. Moreover, adequate unemployment benefits are needed to ensure activation policies, based on the threat of benefit sanctions, are credible and effective (OECD, 2018a).
0102030405060708090100
0102030405060708090
100
LUX
LVA
LTU
NLD
PRT
CHE
BEL
CZE
FRA
ITA
SVK
ISR
NOR
CAN
SVN ISL
DNK
DEU
KOR
OECD ES
TJP
NES
PAU
TFI
NTU
RSW
EIR
LHU
NPO
LGB
RUS
ANZ
LGR
CAU
S
%%
Including 2021 benefit
increase
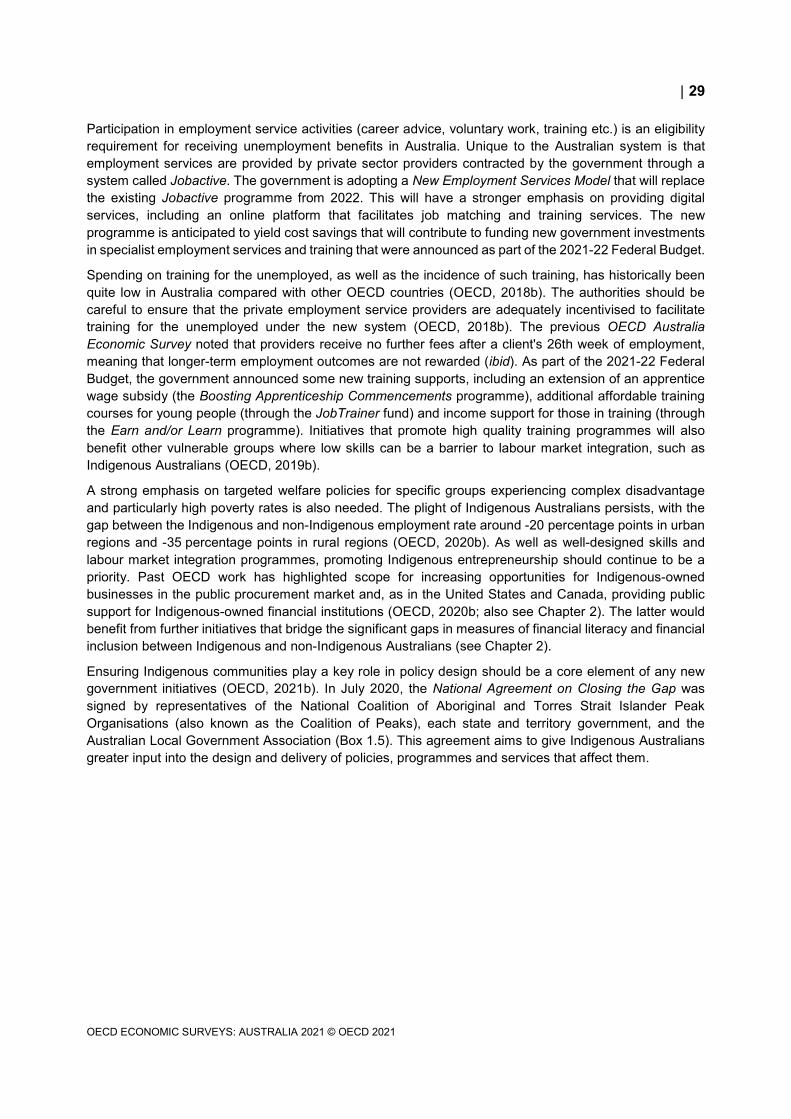
| 29
OECD ECONOMIC SURVEYS: AUSTRALIA 2021 © OECD 2021
Participation in employment service activities (career advice, voluntary work, training etc.) is an eligibility requirement for receiving unemployment benefits in Australia. Unique to the Australian system is that employment services are provided by private sector providers contracted by the government through a system called Jobactive. The government is adopting a New Employment Services Model that will replace the existing Jobactive programme from 2022. This will have a stronger emphasis on providing digital services, including an online platform that facilitates job matching and training services. The new programme is anticipated to yield cost savings that will contribute to funding new government investments in specialist employment services and training that were announced as part of the 2021-22 Federal Budget.
Spending on training for the unemployed, as well as the incidence of such training, has historically been quite low in Australia compared with other OECD countries (OECD, 2018b). The authorities should be careful to ensure that the private employment service providers are adequately incentivised to facilitate training for the unemployed under the new system (OECD, 2018b). The previous OECD Australia Economic Survey noted that providers receive no further fees after a client's 26th week of employment, meaning that longer-term employment outcomes are not rewarded (ibid). As part of the 2021-22 Federal Budget, the government announced some new training supports, including an extension of an apprentice wage subsidy (the Boosting Apprenticeship Commencements programme), additional affordable training courses for young people (through the JobTrainer fund) and income support for those in training (through the Earn and/or Learn programme). Initiatives that promote high quality training programmes will also benefit other vulnerable groups where low skills can be a barrier to labour market integration, such as Indigenous Australians (OECD, 2019b).
A strong emphasis on targeted welfare policies for specific groups experiencing complex disadvantage and particularly high poverty rates is also needed. The plight of Indigenous Australians persists, with the gap between the Indigenous and non-Indigenous employment rate around -20 percentage points in urban regions and -35 percentage points in rural regions (OECD, 2020b). As well as well-designed skills and labour market integration programmes, promoting Indigenous entrepreneurship should continue to be a priority. Past OECD work has highlighted scope for increasing opportunities for Indigenous-owned businesses in the public procurement market and, as in the United States and Canada, providing public support for Indigenous-owned financial institutions (OECD, 2020b; also see Chapter 2). The latter would benefit from further initiatives that bridge the significant gaps in measures of financial literacy and financial inclusion between Indigenous and non-Indigenous Australians (see Chapter 2).
Ensuring Indigenous communities play a key role in policy design should be a core element of any new government initiatives (OECD, 2021b). In July 2020, the National Agreement on Closing the Gap was signed by representatives of the National Coalition of Aboriginal and Torres Strait Islander Peak Organisations (also known as the Coalition of Peaks), each state and territory government, and the Australian Local Government Association (Box 1.5). This agreement aims to give Indigenous Australians greater input into the design and delivery of policies, programmes and services that affect them.

30 |
OECD ECONOMIC SURVEYS: AUSTRALIA 2021 © OECD 2021
Box 1.5. The National Agreement on Closing the Gap The objective of the National Agreement on Closing the Gap (the National Agreement) is to enable Aboriginal and Torres Strait Islander people and governments to work together to overcome the inequality experienced by Aboriginal and Torres Strait Islander people and achieve life outcomes equal to all Australians.
The agreement lists four reform priorities, including:
(i) Shared decision-making: Meaning Aboriginal and Torres Strait Islander people are empowered to share decision-making authority with governments to accelerate policy and place-based progress on Closing the Gap through formal partnership arrangements.
(ii) Building the community-controlled sector: Meaning there is a strong and sustainable Aboriginal and Torres Strait Islander community-controlled sector delivering high quality services to meet the needs of Aboriginal and Torres Strait Islander people across the country.
(iii) Improving mainstream institutions: Meaning governments and their institutions are accountable for Closing the Gap and are culturally safe and responsive to the needs of Aboriginal and Torres Strait Islander people, including through the services they fund.
(iv) Aboriginal and Torres Strait Islander-led data: Meaning Aboriginal and Torres Strait Islander people have access to, and the capability to use, locally-relevant data and information to set and monitor the implementation of efforts to close the gap, their priorities and drive their own development.
Source: Joint Council on Closing the Gap (2020)
Better evaluation of policies and programmes related to Indigenous people is also needed. Despite decades of new policies and changes to existing ones in an attempt to improve the lives of Aboriginal and Torres Strait Islander people, little is known about what works and why, and there is no coordinated approach to policy evaluation across governments. The Productivity Commission aimed to address this by developing an Indigenous Evaluation Strategy (Productivity Commission, 2020a).
The Indigenous Evaluation Strategy has principles-based guidance for agencies to use when selecting, planning, conducting and reporting on evaluations of initiatives affecting Aboriginal and Torres Strait Islander people and aims to lift the quality of evaluations and improve their usefulness. Past OECD work has identified a need for better data collection on Indigenous outcomes (OECD, 2021b), which would enhance this process. The Strategy puts Aboriginal and Torres Strait Islander people at its centre, and emphasises the importance of drawing on their perspectives, priorities and knowledge when deciding what to evaluate and how to conduct an evaluation. The Commission engaged widely, and worked with Aboriginal and Torres Strait Islander people and organisations, government agencies, and people administering, delivering and evaluating policies and programmes. Looking forward, the Strategy should be embedded in the policy design and evaluation process of all Australian Government agencies for both Indigenous-specific and mainstream policies that affect the Indigenous population.
Improving public spending efficiency
Since 2018, the government has had the goal of maintaining the tax-to-GDP ratio at or below 23.9% of GDP. Given the fiscal costs on the horizon, consideration may eventually need to be given to relaxing this cap. However, along with reforms that boost nominal GDP growth, improvements in public spending efficiency can reduce the need for increases in the tax burden. The health system and social welfare for the aged should be particular focuses, given that the population is ageing and these areas already account for around one quarter of all government spending.

| 31
OECD ECONOMIC SURVEYS: AUSTRALIA 2021 © OECD 2021
Australia’s health system is well regarded (OECD, 2019c), but in its current form will face fiscal pressures over the longer term. In addition to ageing, rising incidence of chronic disease, advances in some medical technologies and increased consumer expectations will add to future costs. While relatively stable over the past two decades, private health insurance coverage has fallen slightly in recent years, amid rising premiums, causing more people to rely on the public system.
An overreliance on hospitals can increase health costs. Australia has the third highest hospital admission rates for asthma and chronic obstructive pulmonary disease in the OECD, with the hospitalisation rate for such diseases almost twice the OECD average (OECD, 2019c). In 2018-19, almost half of all emergency department presentations were classified as semi or non-urgent, with age-standardised emergency department presentations rising over the preceding years (PwC Australia, 2020a). Shifting care to primary care settings, where appropriate, should be an ongoing focus of policy. This can also reduce the chance of hospital systems becoming overwhelmed by any rise in COVID-19 cases that follow the eventual easing of the current strict lockdown in certain states. As part of the Long-Term National Health Plan, the government has pledged to make primary health care more patient-focused, more accessible and better able to provide preventive health and management of chronic conditions (Department of Health, 2019). Harnessing technology in the health sector should be a key element in achieving this.
Telehealth is a recent example of the primary care system adjusting to deliver care in a way that provides a better patient experience at the same time as reducing costs to the public purse. During the pandemic, take-up of Telehealth consultations was impressive after the government announced a range of subsidies; the Australian Bureau of Statistics reported that one in six people used Telehealth in the month of November 2020 alone.
Home telemonitoring of patients with chronic conditions can take pressure off the health system (Oliveira Hashiguchi, 2020). For instance, “telehomecare” in Canada was shown to reduce hospital admissions by 60% to 80% (OTN, 2018). Such practices allow carers to better anticipate deterioration in a patient by interacting with them earlier and through the course of treatment (OECD, 2020c). Other OECD countries are at various points in deploying telemonitoring projects in areas such as mental health (Denmark, Ireland), chemotherapy (Denmark, Norway), palliative care (Lithuania) and cancer screening (Poland; OECD, 2020c).
Digital technologies can also improve health services in a range of areas, including remote imaging services and online secondary consultations. Electronic health records that can be shared across the health system can provide better coordination of care. Past work highlighted that less than 20 per cent of Australian general practitioners were informed when one of their patients was seen in a hospital emergency department, notably lower than in other comparable countries (Productivity Commission, 2017). However, such practices require an investment in data infrastructure. Australia has been well below the top performing countries in terms of the availability, quality and linkages of such data sources (OECD, 2021c).
Reforms to the Age Pension can also better enable future public spending obligations to be met. While the Age Pension system as it stands appears fiscally sustainable (Box 1.6), income support for seniors currently accounts for about one quarter of government spending on social welfare. As such, reforms to the system can bring material fiscal benefits.
The Age Pension is a means-tested payment to older individuals as part of the social safety net, but can supplement superannuation (Chapter 2) or other savings. As already mentioned, Age Pension payments have risen more markedly than other social benefits, such as those for the unemployed. In addition, the prolonged boom in house prices have inflated the wealth of many pensioners without impacting their pension eligibility given that the value of the family home above a modest threshold (AUD210,500) remains outside the means test. Half of the government’s spending on the Age Pension currently goes to people with more than AUD500,000 in assets (Daley et al., 2018). Indeed, the government’s recent Retirement Income Review highlighted that the distribution of Age Pension expenditure is much less skewed to lower wealth quintiles than other payments such as Commonwealth Rent Assistance expenditure (Commonwealth of Australia, 2020; Box 1.6).

32 |
OECD ECONOMIC SURVEYS: AUSTRALIA 2021 © OECD 2021
Box 1.6. Australian Government Retirement Income Review
In July 2020, the Australian Government published a review of the retirement income system following a recommendation by the Productivity Commission. The terms of reference asked the review to focus on establishing a fact base of the current retirement income system to improve understanding of its operation and the outcomes it delivers Australians. It was not asked to make recommendations or propose changes to policy settings.
According to the terms of reference, Australia has a three pillar retirement income system consisting of; 1) A means-tested Age Pension, 2) Compulsory superannuation (see Box 2.1 for a discussion of Australia’s Superannuation Industry) and 3) Voluntary savings, including home ownership.
Main observations from the review included that:
• The Australian retirement income system is effective, sound and its costs are broadly sustainable.
• There is a need to improve understanding of the system. Complexity, misconceptions and low financial literacy have resulted in people not adequately planning for their retirement or making the most of their assets when in retirement.
• The Age Pension, combined with other support provided to retirees, is effective in ensuring most Australians achieve a minimum standard of living in retirement. This is especially the case for retirees who own a home.
• Renters and involuntary retirees experience higher levels of financial stress and poverty than the working age population. For many who retire involuntarily due to job related reasons, the adequacy of their living standards before Age Pension eligibility age depends on the level of the unemployment benefit payment.
• Superannuation savings are supported by tax concessions for the purpose of retirement income and not purely for wealth accumulation. Yet most retirees leave the bulk of the wealth they had at retirement as a bequest.
• Using superannuation assets more efficiently and accessing equity in the home can significantly boost retirement incomes without the need for additional contributions.
• The Pension Loans Scheme is an effective option for accessing equity in the home for both age pensioners and self funded retirees. The current exemption of the principal residence from the Age Pension assets test is a disincentive to using the equity in the home to support retirement incomes.
• While the Age Pension helps offset inequities in retirement outcomes, the design of superannuation tax concessions increases inequality in the system. Tax concessions provide greater benefit to people on higher incomes.
• Tax concessions encourage saving in tax-preferred forms, but they may displace other forms of saving and have a limited impact on overall saving. People with very large superannuation balances receive very large tax concessions on their earnings.
• Government expenditure on the Age Pension as a proportion of GDP is projected to fall slightly over the next 40 years, as higher superannuation balances reduce Age Pension costs. The cost of superannuation tax concessions is projected to grow as a proportion of GDP and exceed that of Age Pension expenditure by around 2050. This is due to earnings tax concessions.
Source: Commonwealth Government (2020a)

| 33
OECD ECONOMIC SURVEYS: AUSTRALIA 2021 © OECD 2021
In 2017, the government announced an increase in the Age Pension qualifying age to 67 by 2023-24. A further increase in the qualifying age to 70 was proposed, but subsequently abandoned. This should be reconsidered over the coming years and future increases in the pension age linked to changes in life expectancy. The entire value of the family home – or that portion above a certain threshold – should also be included in the means test for pension eligibility. As suggested by the government’s Retirement Income Review (Box 1.6), the Pension Loan Scheme could be better used to access equity in the home for those pensioners who have little income but live in a high-value property (see also Coates and Nolan, 2020). Taken together, this reform would not reduce the income available to pensioners in retirement. The cost would be shifted off the government balance sheet and onto inheritances. In addition to improving fiscal sustainability, this would disincentivise older people from staying in large family homes that are no longer fit for their purposes. In a context of declining housing affordability, along with rising intergenerational and intragenerational inequality, such a reform has multiple benefits.
Box 1.7. Budgetary impact of the main fiscal recommendations
The following estimates are taken from a variety of sources and quantify the fiscal impact of selected medium-term reforms.
Table 1.5. Illustrative fiscal impact of selected reforms
Policy Scenario Additional annual fiscal cost (-) or revenue (+), percentage points of
GDP Spending measures Further raising unemployment benefits Unemployment benefits are increased to the point where the
minimum amount a JobSeeker Payment recipient receives through private income and government payments equals the OECD relative measure of poverty.1
-0.5%
Improving health spending efficiency Reduce the number of avoidable hospital admissions, partly through expanding and better integrating primary healthcare.2
+0.3%
Include the family home in Age Pension means test
Include the entire value of the family home in the means test for pension eligibility.3
+0.2%
Revenue measures Cutting personal income taxes Australia moves into the lowest decile of OECD countries in a
measure of (personal income tax + social security contributions) as a percentage of GDP.4
-0.9%
Increasing the GST rate Increase the GST rate to 12.5% on the current base.5 +1.0%
Note: Behavioural changes in response to a tax or spending change are not taking into account. In formulating this table, it is assumed that switch from a stamp duty to land value tax is designed to be fiscally neutral in the medium-term. Source: 1 Partially based on calculations from Parliamentary Budget Office (2020). 2 Estimate taken from Australian Healthcare Reform Alliance (2018). 3 Partially based on earlier estimate from Daley et. al. (2018). 4 Underlying data taken from OECD Global Revenue Statistics Database. 5 Estimate taken from PwC Australia (2020b).
Growth-enhancing tax reforms
Population ageing will also result in lower future tax revenue. Australia’s tax base has become increasingly reliant on personal income taxation (Table 1.6) meaning the declining share of people active in the labour market, as the population ages, will have significant implications for tax receipts. This is especially the case given the relatively light taxation of pension income. Furthermore, an overreliance on income taxation could

34 |
OECD ECONOMIC SURVEYS: AUSTRALIA 2021 © OECD 2021
diminish potential output growth (Akgun et al., 2017), further threatening fiscal sustainability as well as gains in living standards. To address these factors, the tax base should be further reoriented towards indirect taxation and some inefficiencies and distortions removed from the system. Doing so can also help address other government priorities such as improving housing affordability, reducing income inequality and negative environmental externalities.
Figure 1.14. The tax base is skewed towards income taxation Revenue as a share of GDP, 2018
Source: OECD Global Revenue Statistics Database.
StatLink 2 https://stat.link/6jsqeu
Table 1.6. The tax burden is increasingly falling on personal incomes Share of total taxation
2003/04 2009/10 2020/21 2024/25 Personal income tax 44.5 42.0 45.8 46.4 Corporate income tax 16.4 18.2 18.7 17.7 Goods and services tax 15.4 15.9 14.1 14.7 Excise taxes 12.0 10.4 8.5 8.1 Superannuation tax 2.6 2.1 2.3 2.8 Other 9.2 11.5 10.7 2.8
Note: Calculations are based on Australian Financial Year. Numbers for 2024/25 are based on projections from the 2021/22 Federal Budget. Source: Parliamentary Budget Office; OECD calculations.
Particular areas that should be a focus of future reforms are:
• Increasing the contribution of the goods and services tax to the overall tax mix. Australia raises a relatively small share of its revenues from the Goods and Services Tax (GST), a revenue base that will be largely unaffected by population ageing (Parliamentary Budget Office, 2020). Over the last decade, revenues from the GST have been falling as a share of total taxes (Table 1.6) and will continue to do so if recent changes to the pattern of household consumption persist (Parliamentary Budgetary Office, 2020). Compared with other OECD countries, the consumption tax rate is relatively low (Figure 1.15, Panel A) and a much larger share of consumption goods are GST-free or GST-exempt in Australia (Figure 1.15, Panel B). The authorities should aim to increase the overall contribution of GST revenues to its tax mix once the economic recovery is firmly
0
5
10
15
20
25
30
35
0
5
10
15
20
25
30
35
Australia OECD
%% Personal income tax Goods and services taxes Corporate income tax Property taxes
Payroll taxes Social security contributions Other

| 35
OECD ECONOMIC SURVEYS: AUSTRALIA 2021 © OECD 2021
entrenched. However, careful consideration should be given to the distributional effects. One potential policy package that could support the tax system’s overall progressivity would involve a broadening of the base or an increase in the rate of the GST in combination with cuts to personal income taxes for low and middle income earners (see below) and the increase in the unemployment benefit rate also recommended in this Survey. As revenues from the GST are distributed to the states, such a reform may be best pursued through the National Federation Reform Council (see Box 1.1 further above).
• Further reducing personal income taxes. The government has already made progress in reducing the personal income tax burden, with a series of significant tax cuts under the Personal Income Tax Plan having recently been introduced or scheduled to take effect (Table 1.7). However, even with the legislated tax cuts, bracket creep is likely to result in the average personal tax rate of many workers rising over the period to 2030, especially those in the low-middle part of the income distribution (Parliamentary Budget Office, 2020a). As noted above, an increase in revenues from the goods and services tax could be accompanied by further lightening the taxation of personal incomes for such workers.
• Aligning the taxation of different forms of savings. There is little consistency in the way that different forms of savings are taxed. While Australia has close to the highest marginal effective tax rate on bank deposits in the OECD, the rates on private pension savings are well below average (OECD, 2018c). These differences, combined with a high level of complexity in the various tax provisions, can encourage costly tax planning schemes and distort the flow of savings (see Box 1.4; Varela et al., 2020). The fact that older and higher income households have a relatively high share of assets in those savings vehicles more lightly taxed can exacerbate both intra- and intergenerational inequalities. In addition, Australia does not have an inheritance tax, after such levies were removed at both the state and federal level four decades ago. To both improve the efficiency and equity of the system, greater neutrality in the taxation of savings is needed. A first step could be to reduce some of the concessions for the taxation of private pensions, particularly those that favour high income earners. For example, the annual concessional contributions cap could be lowered and private pension earnings in retirement (currently untaxed for balances below AUD1.6 million) taxed at the same rate as private pension earnings before retirement.
• Reducing the capital gains tax discount. Taxing capital gains at the full income tax rate would mean taxing the component of returns simply due to inflation. As a result, there is a case for providing a capital gains tax discount, but the current discounts are very generous and well in excess of inflation. The size of the current discount risks distorting household investment decisions, particularly skewing household balance sheets towards residential property investment (see Chapter 2).
• Replacing stamp duty with a recurrent land tax. State and territory governments are heavily reliant on real-estate transaction taxes (“stamp duty”) that inhibit residential mobility and may contribute to the pro-cyclicality of state budgets. A host of modelling exercises have suggested substantial economic benefits of replacing stamp duty with recurrent land taxes. The challenge is devising the transition path (Helm, 2019). Two jurisdictions have made progress in making such a tax switch, with different approaches. The Australian Capital Territory has coupled the introduction of a broad based land tax with a partial credit for stamp duty recently paid, while New South Wales is proposing to allow purchasers to voluntarily opt-in to the tax. The New South Wales approach may be more politically palatable, but involves a very long transition period given that only around 5% of properties are transacted each year. Indeed, the New South Wales Review of Federal Financial Relations explicitly cautioned against such an approach (New South Wales Review of Federal Financial Relations, 2020).
• Better pricing road use and environmental externalities. Opportunities to better address environmental issues include road transport taxation and charging where there is scope to shift the

36 |
OECD ECONOMIC SURVEYS: AUSTRALIA 2021 © OECD 2021
mix partly away from systems based on car ownership towards those based on car use, notably distance-based road user charging and congestion charging. Congestion in capital cities has been growing with rising populations. Related costs, which represented 1% of GDP in 2011, are expected to reach 2% by 2031 (Infrastructure Australia, 2016). As discussed further below, the effective pricing of energy-related carbon emissions is low compared with other high income OECD countries, although emissions are priced to some extent through mechanisms other than explicit carbon and fuel taxes (e.g. through the Emission Reduction Fund and Renewable Energy Target). Adequate pricing of carbon emissions could promote the development and diffusion of low-carbon technologies and steer households and businesses towards lower carbon emissions, contributing to a cost-effective approach towards reaching international commitments. The revenue from carbon pricing can facilitate a just transition and support a more efficient tax system overall.
• Review the taxation of corporate income. Small and medium sized enterprises (SME) are taxed at a preferential rate of 25%, compared with 30% for larger firms. A two-rate system risks distorting how firms are structured and how they behave, especially around the threshold between the two rates. It can also raise the cost of tax compliance as firms move between the two rates. To the extent that SME support is required, it may be better channelled to particular SME segments where market failures are rife, such as young businesses in innovative sectors. The distortionary impact of the current two-tier corporate tax system should be investigated.
• Continue to evaluate the approach to natural resource taxation. As discussed in previous OECD Economic Surveys, a shift towards taxing resource rents, rather than royalties could improve the climate for resource-sector investment and exploration (OECD, 2018b; OECD, 2014). In Australia, natural-resource taxation is primarily a state-level responsibility, the federal government only has exclusive power for taxing offshore natural resources.

| 37
OECD ECONOMIC SURVEYS: AUSTRALIA 2021 © OECD 2021
Figure 1.15. The GST rate is low and there are significant exemptions
Note: Panel B is the “VAT Revenue Ratio”. Source: OECD Consumption Tax Trends database.
StatLink 2 https://stat.link/n8b0w5
Table 1.7. Past OECD recommendations on fiscal policy
Recommendations in past Surveys Actions taken since the previous Survey (December 2018) Further shift the tax mix from direct taxes (corporate and personal) and inefficient taxes (including real-estate stamp duty) and towards the Goods and Services Tax and land taxes.
The Government has taken steps to flatten the personal income tax schedule. In 2018-19 the top threshold of the 32.5 per cent bracket increased from AUD87,000 to AUD90,000. In 2020-21 the top threshold of the 19 per cent tax bracket increased from AUD37,000 to AUD45,000 and the top threshold of the 32.5 per cent bracket increased from AUD90,000 to AUD120,000. In 2024-25, the top threshold of the 32.5 per cent tax bracket will increase from AUD120,000 to AUD200,000, removing the 37 per cent tax bracket completely. In addition, the 32.5 per cent rate will be reduced to 30 per cent so that taxpayers with incomes from AUD45,001 to AUD200,000 will face the same marginal rate. New South Wales Treasury has also begun consulting on a proposal to transition away from stamp duties on conveyances towards a broad based land tax. The Government has been successful in implementing the OECD recommendations to apply GST to low value goods, digital products and services purchased by Australian consumers from offshore online
0
5
10
15
20
25
30
0
5
10
15
20
25
30
CAN
CHE
AUS
JPN
KOR
NZL
MEX
ISR
LUX
TUR
CHL
COL
DEU
OECD AU
TES
TFR
ASV
KGB
RBE
LCZ
ELV
ALT
UNL
DES
PIT
ASV
N IRL
POL
PRT
FIN
GRC ICL
DNK
NOR
SWE
HUN
%% A. Consumption tax standard rate
0.00.10.20.30.40.50.60.70.80.91.0
0.00.10.20.30.40.50.60.70.80.91.0
MEX
COL
ITA
TUR
GRC
GBR
ESP
BEL
AUS
CAN IRL
FRA
POL
PRT
SVK
NLD
LTU ISL
OECD FI
NDE
ULV
ANO
RSW
EHU
NAU
TSV
NCZ
EDN
KIS
RCH
LKO
RCH
EJP
NES
TLU
XNZ
L
RatioRatioB. Ratio of GST collected to revenue if GST
was applied to all consumption at standard rate

38 |
OECD ECONOMIC SURVEYS: AUSTRALIA 2021 © OECD 2021
vendors and digital platforms. By broadening its GST base to include these online sales, which were previously largely GST free, the Government has already collected considerable additional GST revenues and minimised competitive distortions between domestic businesses and offshore online vendors.
Follow up on the recommendations for improving public services made by the Productivity Commission's “human services” inquiry, notably those in health care and long-term care.
No action taken.
Consider a spending ceiling to contain expenditure growth in booms and targeting debt in the long term.
No action taken.
Create stabilisation funds using resource revenues, or make greater use of existing funds, to insulate the budget from commodity price changes.
No action taken.
Make the R&D Tax Incentive more effective, for instance by combining an eligibility threshold with an increase in the expenditure cap.
In the 2020-21 Budget the Government announced that, as of 1 July 2021, the R&D expenditure threshold will increase from AUD100 million to AUD150 million, offset rates will be determined by reference to claimants’ company tax rates and the offset rate for larger businesses will be calculated with reference to the claimant’s R&D intensity: - companies with an aggregated annual turnover of less than AUD20 million will be entitled to a refundable tax offset of their company tax rate plus 18.5 per cent for their first AUD150 million of eligible R&D expenditure; and - companies with an aggregated annual turnover of AUD20 million or more will be entitled to a non-refundable tax offset on the first AUD150 million of eligible R&D expenditure. The rate of the offset will be calculated with reference to the claimant’s R&D intensity (R&D expenditure as a proportion of total expenses). In the 2021-22 Budget the Government announced a patent box to encourage companies to develop and apply their medical and biotechnology innovations in Australia. This incentive will tax corporate profits from Australian developed and patented medical and biotechnology innovations at a concessional 17 per cent effective corporate tax rate.
Encourage more innovation in public services by opening up procurement to more bidders and further development of digital government services.
In September 2020, the Government announced the AUD800m Digital Business Plan. Key initiatives include:
● AUD256.6 million to develop an expanded Digital Identity system to enable more secure and convenient engagement with government services.
● A further AUD419.9 million to enable the full implementation of the Modernising Business Registers (MBR) program, a one-stop shop for business registry data.
● AUD3.6 million towards mandating the adoption of electronic invoicing by 1 July 2022 for all Commonwealth government agencies. In the 2021-22 Budget the Government announced AUD2.6 million over four years from 2021-22 to support and strengthen small and medium enterprise participation in Commonwealth procurement.
Reduce the number of support schemes for innovative SMEs No action taken.
Regulatory and institutional reforms are needed for a sustained recovery When the pandemic hit, the Australian economy was exhibiting signs of structural headwinds. Business formation and job switching rates had declined (Quinn, 2019), accompanied by a slowing in the pace of productivity-enhancing labour reallocation (Andrews and Hansell, 2019) and trend business investment had been weak for some time (International Monetary Fund, 2020). Consequently, as in many other OECD countries, productivity growth had fallen (Figure 1.16, Panel A), contributing to real wage stagnation through much of the past decade (Productivity Commission, 2020b; Figure 1.16, Panel B).
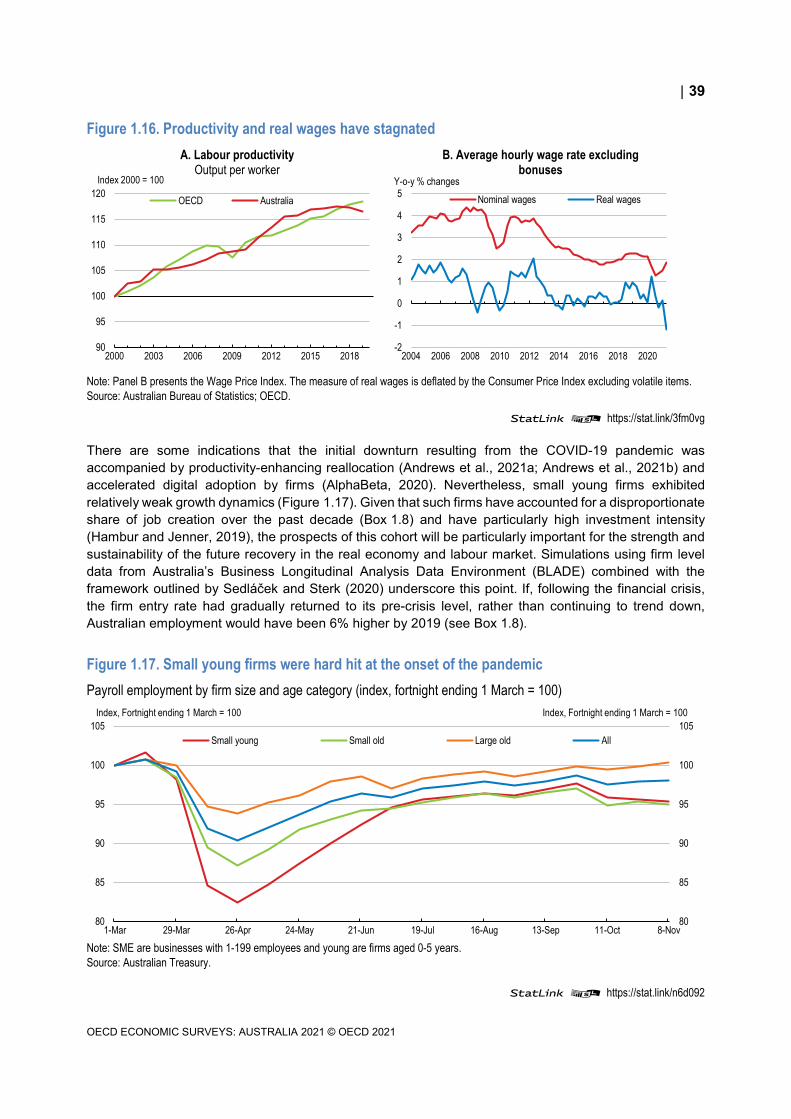
| 39
OECD ECONOMIC SURVEYS: AUSTRALIA 2021 © OECD 2021
Figure 1.16. Productivity and real wages have stagnated
Note: Panel B presents the Wage Price Index. The measure of real wages is deflated by the Consumer Price Index excluding volatile items. Source: Australian Bureau of Statistics; OECD.
StatLink 2 https://stat.link/3fm0vg
There are some indications that the initial downturn resulting from the COVID-19 pandemic was accompanied by productivity-enhancing reallocation (Andrews et al., 2021a; Andrews et al., 2021b) and accelerated digital adoption by firms (AlphaBeta, 2020). Nevertheless, small young firms exhibited relatively weak growth dynamics (Figure 1.17). Given that such firms have accounted for a disproportionate share of job creation over the past decade (Box 1.8) and have particularly high investment intensity (Hambur and Jenner, 2019), the prospects of this cohort will be particularly important for the strength and sustainability of the future recovery in the real economy and labour market. Simulations using firm level data from Australia’s Business Longitudinal Analysis Data Environment (BLADE) combined with the framework outlined by Sedláček and Sterk (2020) underscore this point. If, following the financial crisis, the firm entry rate had gradually returned to its pre-crisis level, rather than continuing to trend down, Australian employment would have been 6% higher by 2019 (see Box 1.8).
Figure 1.17. Small young firms were hard hit at the onset of the pandemic Payroll employment by firm size and age category (index, fortnight ending 1 March = 100)
Note: SME are businesses with 1-199 employees and young are firms aged 0-5 years. Source: Australian Treasury.
StatLink 2 https://stat.link/n6d092
-2
-1
0
1
2
3
4
5
2004 2006 2008 2010 2012 2014 2016 2018 2020
B. Average hourly wage rate excluding bonuses
Nominal wages Real wagesY-o-y % changes
90
95
100
105
110
115
120
2000 2003 2006 2009 2012 2015 2018
A. Labour productivityOutput per worker
OECD Australia
Index 2000 = 100
80
85
90
95
100
105
80
85
90
95
100
105
1-Mar 29-Mar 26-Apr 24-May 21-Jun 19-Jul 16-Aug 13-Sep 11-Oct 8-Nov
Small young Small old Large old All
Index, Fortnight ending 1 March = 100 Index, Fortnight ending 1 March = 100

40 |
OECD ECONOMIC SURVEYS: AUSTRALIA 2021 © OECD 2021
Policy reforms that lower barriers to entrepreneurship and the expansion of young firms are thus a priority. Adequate access to finance for start-ups and young firms is critical, which is discussed extensively in Chapter 2 of this Economic Survey. However, regulatory and administrative procedures, competition policies and the integrity of the business sector are also of primary importance.
Box 1.8. The impact of business dynamics on employment growth As in many OECD countries, young firms have been core drivers of economic activity and job creation in Australia. In collaboration with the Australian Treasury, this has been examined for this Economic Survey by using firm-level data from the Business Longitudinal Analysis Data Environment (BLADE), compiled by the Australian Bureau of Statistics.
Over the period 2007-19, young firms accounted for the majority of net employment growth in Australia, in particular small startups (Figure 1.18). However, the employment share of such firms (i.e. young SMEs) declined over the period from 22% in 2007 to 18% in 2019.
Figure 1.18. Young firms have been the drivers of employment growth Average net employment growth as a share of total employment, 2007-19
Note: Agriculture, Mining, Utilities and non-market industries are excluded. The results presented in this figure and the other figures in this box are based, in part, on Australian Business Register (ABR) data supplied by the Registrar to the Australian Bureau of Statistics (ABS) under A New Tax System (Australian Business Number) Act 1999 and tax data supplied by the Australian Taxation Office (ATO) to the ABS under the Taxation Administration Act 1953. These require that such data are only used for the purpose of carrying out functions of the ABS. No individual information collected under the Census and Statistics Act 1905 is provided back to the Registrar or ATO for administrative or regulatory purposes. Any discussion of data limitations or weaknesses is in the context of using the data for statistical purposes, and is not related to the ability of the data to support the ABR or ATO's core operational requirements. Legislative requirements to ensure privacy and secrecy of this data have been followed. Only people authorised under the Australian Bureau of Statistics Act 1975 have been allowed to view data about any particular firm in conducting these analyses. In accordance with the Census and Statistics Act 1905, results have been confidentialised to ensure that they are not likely to enable identification of a particular person or organisation. Source: Australian Treasury calculations based on BLADE dataset.
StatLink 2 https://stat.link/aj5wh4
-3
-2
-1
0
1
2
3
4
-3
-2
-1
0
1
2
3
4
Old Young
%%
SME Large firms

| 41
OECD ECONOMIC SURVEYS: AUSTRALIA 2021 © OECD 2021
Figure 1.19. Firm entry rates have slumped and those that do enter are larger
Note: In Panel B, Agriculture, Mining, Utilities and non-market industries are excluded. Source: Australian Bureau of Statistics; Australian Treasury calculations based on BLADE dataset.
StatLink 2 https://stat.link/xzhrwf
To illustrate the direct employment effects of the decline in the firm entry rate, a counterfactual exercise is undertaken using the framework of Sedláček and Sterk (2020). Specifically, the BLADE data is used to estimate employment outcomes under a counterfactual scenario whereby the firm entry rate (both in terms of number of firms and employment share) had rebounded to its pre-crisis levels (specifically, the 2003-2007 average) after declining through the financial crisis (Figure 1.20, Panel A). The results suggest that employment would have been around 6 per cent higher at the end of the period than actually observed (Figure 1.20, Panel B).
Figure 1.20. A higher share of young firms would considerably boost employment
Note: Agriculture, Mining, Utilities and non-market industries are excluded. Counterfactual assumes entry rate remains at pre-GFC average of around 12 per cent, and firm initial size and growth rate return for 2005/06 to 2006/07 average. Source: Australian Treasury calculations based on BLADE dataset.
StatLink 2 https://stat.link/uehgiy
0
2
4
6
8
10
12
14
16
2003 2005 2007 2009 2011 2013 2015 2017 2019
%A. Firm entry rate for employing firms
0102030405060708090
100
Probability of surviving 3years
Average growth ofsurvivors
Average size at entry
%B. Survival growth and size of entrants
2006-07 2012-18
30
35
40
45
50
55
2007 2010 2013 2016 2019
%
A. Young firm share of businesses
Observed Counterfactual scenario
0
1
2
3
4
5
6
7
2007 2010 2013 2016 2019
%
B. Employment counterfactual Divergence from observed

42 |
OECD ECONOMIC SURVEYS: AUSTRALIA 2021 © OECD 2021
Reforming regulatory and administrative procedures
The design and implementation of regulations and administrative procedures are a key determinant of the capacity for bright ideas to be converted into businesses that can expand and thrive (OECD, 2015). Product market regulation settings in Australia are generally favourable, indicating a well-functioning and competitive market environment. The OECD Product Market Regulation (PMR) Indicator highlights that Australia is in the lowest quartile of member countries for the overall restrictiveness of such regulations. Even so, the licensing and permit system and the complexity of regulatory procedures have been identified as relatively cumbersome (Figure 1.21). Digging deeper, shortcomings in coordinating the permits and licenses across the states and territories and in transparency regarding regulatory changes are particular reasons for elevated scores on these dimensions. Such weaknesses impact upon the efficacy of policies in a range of areas. However, the occupational licensing regime and land use regulations are two areas that have gained added importance following the pandemic and will be influential in determining the shape of the economic recovery.
Figure 1.21. The licensing system and regulatory complexity are ripe for reform
Product Market Regulation Indicators, subcategories 2018
Source: OECD 2018 PMR database.
StatLink 2 https://stat.link/plxmoi
Occupational licensing
Occupational licensing can be important where the competence of a provider can impact the health and safety of customers or where large information asymmetries exist regarding service quality. However, such regulations can stifle business dynamism by protecting incumbents (Bambalaite et al., 2020) and the reallocation of workers from low to high productivity firms (von Reuden et al., 2019). The reduction in job mobility tends to be particularly damaging for groups with low labour market experience, such as young and low-skilled workers (Haltiwanger et al., 2018). Recent work has linked weak wages growth in Australia to a slowdown in job-to-job transitions (Andrews et al., 2019).
Facilitating job mobility is particularly important at present given the structural trends highlighted above and the more pronounced need for within- and between-sector reallocation in the wake of the pandemic. The growing importance of Australia’s services sector also means unnecessary occupational restrictions
0.0
0.5
1.0
1.5
2.0
2.5
3.0
0.0
0.5
1.0
1.5
2.0
2.5
3.0
Assessment of Impact onCompetition
Interaction with InterestGroups
Complexity of RegulatoryProcedures
Admin. Requirements forLimited Liability Companies
and Personally-OwnedEnterprises
Licenses and permits
Australia OECD OECD - Top 5
Simplification and evaluation of regulations Administrative burden on startups

| 43
OECD ECONOMIC SURVEYS: AUSTRALIA 2021 © OECD 2021
will be an increasing drag on aggregate productivity. At the onset of the pandemic, new digital tools were already narrowing many of the information asymmetries that occupational licenses were established to address. This will have been compounded through the accelerated diffusion of such tools during the pandemic, potentially making parts of the regime obsolete.
About one fifth of Australian workers currently require a registration or license to perform their work (Commonwealth Government, 2021d), a proportion that is comparable with other OECD countries (Bambalaite et al., 2020). However, most of these professionals, such as builders, plumbers and real estate agents require distinct licenses in each Australian state and territory. There is limited economic rationale for separate licenses in different jurisdictions and such a practice can raise substantial economic costs. Recent OECD empirical work related to the United States highlights that differences in occupational licensing regimes across states can have significant impacts on reallocation mechanisms (Hermansen, 2019).
While there has been a policy of mutual recognition of licenses across Australian jurisdictions since 1992, the Commonwealth, State and Territory governments have now reached an intergovernmental agreement on automatic mutual recognition and begun to implement the scheme (Table 1.9). The federal government has passed enabling legislation. Once legislation is passed by the states, licenses subject to the Mutual Recognition Act will be automatically recognised across jurisdictions without needing to reapply for a license and pay associated fees (except where jurisdictions exempt specific occupational licences temporarily or to protect against significant risks for up to five years, subject to review). Following this reform, it is anticipated that 124,000 licensees will benefit from reduced administrative costs from no longer needing to hold multiple licences and an additional 44,000 workers will benefit from being able to take up new jobs across borders (PwC Australia, 2020c). However, to deliver the full benefits of the reform, it is critical that the states only exempt occupations where a significant risk exists to consumer protection, the environment, animal welfare or the health or safety of workers or the public. Under the agreement, governments also pledged to support ongoing improvements to the regulatory environment for occupational registration and to reduce impediments to labour mobility. Implementation of the reforms will be regularly monitored and independently reviewed.
Automatic mutual recognition is a good initial step in occupational licensing reform that should be fully actioned. Attempts in recent decades at national licensing reform have failed (McDonald, 2020), but this should not deter policymakers from continuing to find ways of simplifying the regime, improving flexibility and ensuring it is fit for purpose as the economy evolves. This will require further cooperation between governments to investigate the scale of occupational licensing, the welfare benefits of particular licenses, the avenues for further harmonisation across jurisdictions and the extent to which new technologies are making existing licenses obsolete. There are various instances where licenses exist only in some states and territories, such as for beauticians in New South Wales and for professional matchmakers in Victoria and Queensland (Wild, 2018). At a minimum, some agreement between jurisdictions about those occupations where there is a strong public safety or health justification for licensing is needed. Regulators should play a key role in streamlining regulatory arrangements and adopting best practice, including through the use of new technologies for cooperation between jurisdictions.
Recent lessons from the European Union may be relevant, with member states undertaking a transparency and mutual evaluation exercise in 2014 and subsequently introducing a proportionality directive that established clear criteria for Member States when introducing new or altered professional requirements (von Rueden and Bambalaite, 2020). Data collection will be an important element of such an exercise in Australia, as information on the licensing system is highly fragmented, currently spanning multiple regulatory agencies in each jurisdiction with little national coordination. The Australian Bureau of Statistics could be tasked with including questions about occupational licensing in the Labour Force Survey. This would mimic the approach taken by the Bureau of Labor Statistics in the United States since 2015, where data on certification and licensing of workers is published on an annual basis for different industries and worker characteristics.

44 |
OECD ECONOMIC SURVEYS: AUSTRALIA 2021 © OECD 2021
More broadly, better coordination between the states on the regulatory landscape should be a priority. The upcoming work of the Deregulation Taskforce on unnecessarily overlapping or duplicative cross-jurisdictional burdens can be a critical input to better coordination in the future. The newly established National Federation Reform Council also provides an opportunity for states and territories to fully commit to a shared regulatory reform agenda that they can work through in a concerted manner.
Box 1.9. Estimated GDP impact of selected structural reforms The following estimates roughly quantify the cumulative GDP impact of reform scenarios after 10 years and are illustrative.
Table 1.8. Illustrative GDP impact of selected recommendations Policy Scenario GDP Impact
Reduce product market regulations Reduce the stringency of Product Market Regulation Index to put Australia in the top 10% of best performing OECD countries. The reform is assumed to be phased in immediately.
+1.5%
Domestic stock of R&D capital Domestic stock of R&D capital is assumed to increase the average of the top quartile of OECD countries, phased in over 10 years.
+0.2%
Cut in personal income tax Australia moves into the lowest decile of OECD countries for the personal income tax wedge for both singles earning 100% of the average wage without children and for couples with one earner earning 100% of the average wage and two children. The reform is assumed to be phased in immediately.
+1.5%
Note: In the OECD Long-term model, reductions in the personal income tax wedge are fiscally neutral meaning that such a scenario should be understood as a shift toward less-distorting forms of taxation (such as the Goods and Services Tax). Source: OECD Long-term model.
Land use regulations
Structural change requires adapting metropolitan land-use to new circumstances. For instance, any lasting shifts in the nature of office work following the pandemic, like greater working from home, will be accompanied by changes in the optimal way for land to be used. Reforms that make land supply more flexible can also remove obstacles to labour reallocation (OECD, 2021a), while streamlining of the permit and development system can lower business costs and facilitate investment.
Land use policies suffer from considerable variation across Australia. Each State government controls their zoning legislation, leading to the number of zones and the allowable activities within each varying considerably between jurisdictions. Then, in each state, local governments decide how to allocate land under the zoning system and may add further development criteria (e.g. building-height restrictions). In some states, local governments even have discretion to vary or tailor zone types (Productivity Commission, 2021). When these diverge from state level planning policies, there is often little consequence (Productivity Commission, 2021). As a result, the zoning system has been criticised as inconsistent, containing too many categories and excessively prescriptive about the allowable activities within each zone (OECD, 2018b).
State governments should move to fewer zone types, which are harmonised where possible, and less prescriptive about the types of activities that can be undertaken. This can make it easier for new business to enter and expand and for land use to adapt to the changing nature of the economy and local demography. Such a direction has been long-championed by the Productivity Commission (Productivity

| 45
OECD ECONOMIC SURVEYS: AUSTRALIA 2021 © OECD 2021
Commission, 2012; Productivity Commission, 2017a; Productivity Commission, 2021), leading to some states making noteworthy reforms. For example, Queensland now has minimal prohibited uses enshrined in zone definitions, while Victoria has moved to fewer commercial and industrial zone types. Nevertheless, there remains considerable scope to further improve the zoning system and the adherence of local governments to state-level planning policies.
It may be that the incentive structures of local governments translate into overly restrictive planning practices. This is often the case in countries where local authorities have limited fiscal autonomy (OECD, 2017b), such as Australia. The main source of revenue for Australia’s local governments are property rates which are capped in the largest states by state governments. Local governments also receive a minimum Financial Assistance Grant from the federal government irrespective of their capacity to raise revenue. At the same time, development control is discretionary, as in most other Commonwealth countries. Contrasting with the rules-based systems more common in Europe, this means that every single planning application is subject to review and political opposition by local residents (OECD, 2017b). Providing fiscal incentives for local authorities to rapidly approve applications that will have a net benefit for the community may encourage authorities to resist a few loud voices opposed to such projects.
Other OECD countries use the fiscal framework to support well-functioning land use policies in different ways. In Switzerland, local government finances are heavily reliant on property taxation and there is significant flexibility afforded to authorities for setting the applicable tax rates. This incentivises actions by authorities that raise property values, including allowing the conversion of low value land to higher value uses. It also creates an incentive to attract new residents and businesses. An alternative approach was proposed in the United States American Jobs Plan, with a competitive grant programme awarding flexible funding to jurisdictions deemed to be taking concrete steps to streamline zoning systems.
There may be a risk of greater urban sprawl when increasing fiscal incentives for local authorities to attract and approve land use proposals. As urban sprawl tends to be associated with higher car dependency and longer commuting distances, this could imply more traffic jams, higher greenhouse gas emissions and air pollution (OECD, 2018d). Such urban growth patterns can also substantially increase the per-user costs of providing public services such as water, energy, sanitation and public transport (ibid). However, the risk of greater urban sprawl can be mitigated by well-enforced top-down spatial planning frameworks (OECD, 2017b). As an example, Ireland established a dedicated institution in 2018, the Office of the Planning Regulator, that is responsible for ensuring local development plans and spatial strategies align with the National Planning Framework.
Looking forward, Australia should end the minimum Financial Assistance Grant for wealthier local authorities, allocating the savings to local governments in more disadvantaged areas. This should be combined with reforms that allow local authorities to raise more of their own-source revenue. This system will provide an incentive for local authorities in those areas where land is in highest demand to reduce barriers to businesses or households entering and promote more flexible land use. As well as promoting business investment and productivity, such reforms can also improve housing affordability through boosting supply of housing in desirable locations.
Competition policy
Competition policy also influences the dynamics of firm creation and expansion. The decline in business dynamism in Australia has coincided with indicators of reduced competitive intensity in product markets. Hambur (2021) highlights that the average firm mark-up (the ratio of price to marginal cost of production) increased by around 5% from the early 2000s to the mid-2010s. This was accompanied by a rise in the average share of sales accruing to the largest four firms in an industry and a decline in the probability of such firms being displaced. Furthermore, the more significant economic hit to small young firms with the pandemic may be increasing the market share of larger incumbent firms (Hambur, 2021). While market

46 |
OECD ECONOMIC SURVEYS: AUSTRALIA 2021 © OECD 2021
power is not automatically a cause for concern, it may require a competition policy response if it is durable, difficult to contest, or defended through anticompetitive conduct.
One of the contemporary challenges for competition authorities across OECD countries is reckoning with the impact of digitalisation on both labour market and product market competition. This was already the case before the onset of the pandemic. Then, once the pandemic hit, the requirement for physical distancing contributed to an acceleration in the pace of digitalisation. The proliferation of digital technologies can be competition-enhancing. Nonetheless, substantial network effects, high fixed costs and low variable costs are unique features of digital markets that may lead to the entrenchment of market power that adversely impacts social welfare. These features can translate into heightened merger and acquisition activity in digitally intensive sectors, sometimes due to smaller innovative firms being acquired by large incumbents to prevent them from growing into potential competitors (i.e. “killer acquisitions”; OECD, 2020d).
Recent evidence highlights cause for concern about the impact of digitalisation on competitive dynamics in Australia. The recent slowdown in the firm entry rate highlighted in Figure 1.19, that has coincided with weaker productivity growth (Figure 1.16, Panel A), appears to have been driven by weaker start-up activity in digitally intensive sectors (Figure 1.22). Indeed, the work by Hambur (2021) shows that the rise in firm mark-ups over this period was significantly larger in digitally intensive sectors. Additionally, the number of mergers and acquisitions in Australia’s technology sector have picked up notably over the past few years (BDO, 2020).
Figure 1.22. The pace of entrepreneurialism has been weakest in digitally intensive sectors
Firm entry rates by digital intensity of industry, 2019/20 (100=2015/16)
Note: Firm entry rates are defined as number of business entries as a share of total businesses at the beginning of the operating year. “Digital intensive” sectors are defined using the taxonomy outlined in Calvino and Criscuolo (2019). The finding of lower firm entry rates in high digital intensity sectors is also apparent when using earlier time periods, such as 2010/11-2013/14 (covered by the prior ABS release). Source: ABS; OECD calculations.
StatLink 2 https://stat.link/urjp7t
Australia has a comprehensive competition law, most recently reviewed in 2015. The law is enforced by a strong regulator in the Australian Competition and Consumer Commission (ACCC). To ensure it remains fit-for-purpose, the government has directed the ACCC to undertake long-term monitoring of, and public reporting on, potential areas of concern. In 2017, the government passed major reforms to competition laws, including strengthening its misuse of market power provision. At the same time, it directed the ACCC
90
92
94
96
98
100
102
104
106
90
92
94
96
98
100
102
104
106
Low digital intensity Medium digital intensity High digital intensity
Index 2015/16 = 100Index 2015/16 = 100

| 47
OECD ECONOMIC SURVEYS: AUSTRALIA 2021 © OECD 2021
to conduct an inquiry into the impact of digital platforms on competition in media and advertising services markets. The final report was published in 2019 and a key finding was that an imbalance of bargaining power existed between digital platforms and Australian news businesses. In response, the government implemented a mandatory bargaining code. Since coming into effect in March 2021, several agreements have been reached between digital platforms and news businesses.
The ACCC considers the effective pursuit of anti-competitive merger and acquisition activity an ongoing challenge. In particular, it notes limited success in stopping anti-competitive mergers once they proceed to litigation. The Authority has proposed changes to the merger regime to further public debate on the issue (Sims, 2021a). These include a new formal merger review process, changes to the merger test and reforms to deal with acquisitions by large digital platforms. Reforms to increase effectiveness of the merger control framework should continue to be explored and discussed. In doing so, the benefits for competition of tightening merger protocols should be carefully weighed against the potential increase in regulatory costs and deterrent effects of such protocols on productivity- and competition-enhancing mergers.
Digitalisation may also lead to new concerns about the abuse of market power not covered under existing legislation. Practices such as larger businesses threatening smaller ones with commercial consequences unless they agree to change contract terms are not illegal under the current interpretation of unconscionability by Australia’s courts (Sims, 2021b). The ACCC is proposing the introduction of an unfair practices prohibition to eliminate such conduct. In November 2020, Australian consumer affairs ministers agreed to undertake further work to establish if government intervention is warranted in this area.
Promoting investment through vigilance in fighting economic crimes
An effective anti-corruption framework is also an important element for reversing Australia’s structural slowdown. Corruption – the abuse of public office for private gain – discourages business dynamism, reducing investment and innovation, and weighs on growth prospects (Jin, 2020). It also undermines equality of opportunity and erodes trust in government. In doing so, it makes the structural reforms that are necessary to drive the economic recovery more difficult to implement. Australia scores relatively well in international indicators of domestic corruption, ranking among peer countries on the public perception of corruption and control of corruption (Figure 1.23). Nevertheless, two thirds of Australians now think that corruption is a quite big or very big problem (Transparency International and Griffith University, 2020).

48 |
OECD ECONOMIC SURVEYS: AUSTRALIA 2021 © OECD 2021
Figure 1.23. Australia ranks among peer countries in indicators of corruption
Note: Panel B shows the point estimate and the margin of error. Panel D shows sector-based subcomponents of the “Control of Corruption” indicator by the Varieties of Democracy Project. Source: Panel A: Transparency International; Panels B & C: World Bank, Worldwide Governance Indicators; Panel D: Varieties of Democracy Project, V-Dem Dataset v11.
StatLink 2 https://stat.link/ordh5q
Each state now has a unique institutional framework for combatting corruption. However, there are significant differences in their institutional approach (Transparency International, 2016). At the federal level, important anti-corruption institutions have been established to oversee corruption in law enforcement bodies (i.e. the Australian Commission for Law Enforcement Integrity and the Australian Federal Police Fraud and Corruption Centre). Yet, there is currently no agency responsible for public sector integrity, more broadly.
Encouragingly, the federal government has committed to establishing a Commonwealth Integrity Commission and is in the process of finalising its design. The process is a timely opportunity to create an institution that buttresses trust in the public sector and acts as an illustration of best practice to analogous institutions in the states and territories. To achieve this standard, adjustments to the proposed model should be considered.
Under the current proposal, the institution would be characterised by two distinct divisions with different structures. A “law enforcement division” would have jurisdiction over law enforcement agencies (replacing
0102030405060708090
100
USA JPN GBR CAN AUS DEU NZL DNK
A. Corruption Perceptions IndexScale: 0 (worst) to 100 (best), 2020
0.0
0.5
1.0
1.5
2.0
2.5
USA JPN CAN GBR AUS DEU DNK NZL
B. Control of corruptionScale: -2.5 (worst) to 2.5 (best), 2019
0.00
0.25
0.50
0.75
1.00Executive bribery
Executiveembezzlement
Public sectorbribery
Public sectorembezzlement
Legislaturecorruption
Judicial corruption
D. Corruption by sector, "Control of Corruption"
Scale: 0 (worst) to 1 (best), 2020
0.0
0.5
1.0
1.5
2.0
2.5
1996 1999 2002 2005 2008 2011 2014 2017
C. Evolution of "Control of Corruption"Scale: -2.5 (higher) to 2.5 (lower corruption)
OECD PEERS AUS

| 49
OECD ECONOMIC SURVEYS: AUSTRALIA 2021 © OECD 2021
the current Australian Commission for Law Enforcement Integrity). This division would be able to investigate both criminal and non-criminal forms of corruption from referrals made by a broad range of individuals, including staff members, whistle-blowers or members of the public and could hold public hearings. The “public sector division” would be responsible for investigating corruption in the rest of the public sector (accounting for about 80% of federal government employees and 90% of expenditures), including public servants and parliamentarians. However, this division would not be able to investigate non-criminal forms of corruption, nor would it be able to directly accept referrals from staff, whistle-blowers or members of the public and could not hold public hearings. While this division would not be able to make public findings that a person engaged in corrupt conduct, it is intended that any evidence or allegations of corruption would be referred to a relevant authority for prosecution or civil proceedings.
The government has indicated that the rationale for the two-division structure is to reflect the different nature of the corruption risk that exists in law enforcement agencies as opposed to the broader public sector. However, none of the states or territories have such a demarcation within their respective anti-corruption institutions. In other OECD countries, such a structure is also uncommon. As the government seeks to improve the design of the institution ahead of its establishment, the powers and processes of the public sector division should be brought more closely into line with those of the law enforcement division. If making this change will require dedicating further financial resources to the agency, then such funding should be made available.
Prevention-focused activities should also be strongly emphasised in the mandate of the new institution. As provided in the OECD Recommendation on Public Integrity, an effective complement to investigative powers is a framework that fully addresses systemic and situational corruption risks that may lead to future wrongdoing (OECD, 2020e). For example, the New South Wales anti-corruption institution undertakes data analysis to help identify patterns that may indicate fraudulent activity (Wood and Griffiths, 2021). Transparency International suggests that prevention activities in anti-corruption institutions in Australia are mostly ad hoc, patchy and inconsistent, with the importance of prevention not reflected in formal structures or resourcing (Transparency International Australia and Griffith University, 2020).
In terms of tax transparency, which reduces the scope for tax evasion, Australia is largely compliant and similar to other comparable countries (Figure 1.24). On anti-money laundering measures, Australia performs better or at least equivalent to its peers. However, the country remains technically non-compliant in five areas of the International Standards on Combating Money Laundering and the Financing of Terrorism and Proliferation: reporting of suspicious transactions, internal controls and foreign branches and subsidiaries, regulation and supervision of financial institutions, guidance and feedback and powers of law enforcement and investigative authorities. In addition, there are several areas of the OECD Anti-Bribery Convention where Australia remains non-compliant (OECD, 2019d). The OECD Working Group on Bribery is also concerned about the continued low level of foreign bribery enforcement. Since the Australian foreign bribery legislation was enacted 20 years ago, just two corporate entities and six individuals have been sanctioned in two cases (OECD, 2019d).

50 |
OECD ECONOMIC SURVEYS: AUSTRALIA 2021 © OECD 2021
Figure 1.24. Australia is in line with other comparable countries on tax transparency
Note: Panel A summarises the overall assessment on the exchange of information in practice from peer reviews by the Global Forum on Transparency and Exchange of Information for Tax Purposes. Peer reviews assess member jurisdictions' ability to ensure the transparency of their legal entities and arrangements and to co-operate with other tax administrations in accordance with the internationally agreed standard. The figure shows first round results; a second round is ongoing. Panel B shows ratings from the FATF peer reviews of each member to assess levels of implementation of the FATF Recommendations. The ratings reflect the extent to which a country's measures are effective against 11 immediate outcomes. "Investigation and prosecution¹" refers to money laundering. "Investigation and prosecution²" refers to terrorist financing. Source: OECD Secretariat’s own calculation based on the materials from the Global Forum on Transparency and Exchange of Information for Tax Purposes; and OECD, Financial Action Task Force (FATF).
StatLink 2 https://stat.link/21qkrd
Table 1.9. Past OECD recommendations on ensuring a competitive and innovative business environment
Recommendations in past Surveys Actions taken since the previous Survey (December 2018) Reforms should include adopting lighter product standards, paring back professional and occupational licensing, and reducing operating restrictions in shipping.
On 11 December 2020, the National Cabinet agreed to establish a widespread uniform scheme for occupational licences to be automatically recognised across jurisdictions. The scheme took effect in some states on 1 July, but there is a transitional period before it becomes fully functional. At present, a limited number of occupational registrations are currently within the scheme in New South Wales, Victoria, the Australian Capital Territory and the Northern Territory. Other states are expected to implement automatic mutual recognition over the coming year. Safeguards are embedded in the Bill to maintain high standards of consumer and environmental protection, animal welfare, and the health and safety of workers and the public as licensed workers move between jurisdictions. Following consultation in 2019 and 2020, the Department of Infrastructure, Transport, Regional Development and Communications is proposing reforms to cargo vessel regulations under the Coastal Trading Act. These reforms are intended to ensure the coastal trading regime remains fit-for-purpose.
Widen the scope of subsidies for innovation-related subjects beyond STEM (e.g. innovation-related arts disciplines)
No action taken.
Increase labour mobility, for instance by lower interstate differences in education and training programmes.
From 1 December 2020, all job seekers participating in employment service programs are immediately eligible for the Relocation Assistance to Take Up a Job program, which provides between AUD3,000 and AUD9,000 in relocation assistance for job seekers relocating to take up work, with a particular focus on job seekers who take up work in regional areas. The establishment of a widespread uniform scheme for automatic mutual recognition of occupational licenses (discussed above) will also promote labour mobility.
Non-Compliant
Partially
LargelyCompliant
Compliant
AUS CAN DEU DNK GBR JPN USA NZL
A. Tax transparency: Exchange of Information on Request
0
1
2
3
4
Risk, policy &coordination
International co-operation
Supervision
Preventive measu
Legal persons andarrangements
Authorities' financialintelligence
Investigation andprosecution¹
Confiscation
Investigation andprosecution²
Deprivation ofterrorist financing
Financial sanctionsagainst proliferation
B. Anti-money laundering measuresScale: 1 (low) to 4 (high effectiveness)
OECD AUS

| 51
OECD ECONOMIC SURVEYS: AUSTRALIA 2021 © OECD 2021
Improve competition law, notably by strengthening the definition of abuse of dominant position.
The July 2019 Digital Platforms Inquiry Report by the Australian Competition and Consumer Commission (ACCC), found an imbalance in bargaining power between digital platforms and local news businesses. Consequently, the News Media and Digital Platforms Mandatory Bargaining Code came into force on 2 March 2021. The Code will ensure that news media businesses are fairly remunerated for the content they generate, thereby helping to sustain public interest journalism in Australia.
Adjust insolvency legislation Reforms to the insolvency framework took effect on 1 January 2021. These were designed to make the framework more fit for small business, reducing complexity, time and costs. These will enable more Australian small businesses to quickly restructure. The reforms feature three key elements:
• A new debt restructuring process for small businesses, to enable distressed but viable firms to restructure their debts in a streamlined and cost-effective way.
• A new, simplified liquidation process for small businesses to allow faster and lower-cost liquidation.
• Complementary measures to build the capacity of the insolvency sector, so that it can respond to developments in the insolvency market and the needs of small businesses.
In May 2021, the government announced it would explore further insolvency reforms. As part of this process, stakeholder views will be sort on:
● improving the schemes of arrangement process to better support company turnaround.
● clarifying the application of trusts under insolvency law to reduce complexity and cost.
The Government also announced that it would: ● commence an independent review of the insolvent trading safe harbour
to ensure it remains fit for purpose. ● increase the threshold at which creditors can issue a statutory demand
on a company, from AUD2,000 to AUD4,000. This increase came into effect on 1 July 2021.
On 5 February 2020, Australia passed legislation amending corporations and tax laws to include new offences and penalties to deter and sanction those who engage in and facilitate illegal phoenix activity (i.e. where a new company is created to continue the business of an existing company that has been deliberately liquidated to avoid paying outstanding debts).
Faster decarbonisation can bring significant economic benefits
As the driest inhabited continent on the planet, with settlement primarily on the coasts, Australia is highly vulnerable to long‑term climate change and associated extreme events—such as extreme heat, heavy rainfall and coastal inundation, fire weather and drought. The country is also uniquely placed to benefit economically from the decarbonisation of the global economy, with a large (and windy) land mass, ocean access, solar radiation and strong human capital to form the basis of innovation and new trade opportunities. As a consequence of its endowments, Australia currently boasts some of the best wind and solar resources in the world (Wood and Dundas, 2020). It also has good foundations for further developing other renewable energy sources such as tidal and geothermal. At the same time, Australia faces a more challenging decarbonisation task than many other countries due to a historical reliance on coal generation and the presence of significant mining and agriculture sectors.
Further reducing greenhouse gas emissions from high levels
Australia has made progress in decoupling environmental pressures from economic activity: total greenhouse gas emissions (including land use, land use change and forestry) per unit of real GDP fell from 0.47 in 2005 to 0.26 in 2020 (Department of Industry, Science and Energy Resources, 2021a). In per capita terms, greenhouse gas emissions (including land use, land use change and forestry) declined by around 30% between 2005 and 2017, compared with a fall of 15.9% across OECD countries. Nevertheless,

52 |
OECD ECONOMIC SURVEYS: AUSTRALIA 2021 © OECD 2021
Australia’s greenhouse gas emissions per unit of GDP and per capita remain among the highest in the OECD (OECD, 2021d).
The federal government is now aiming to achieve net zero carbon emissions as soon as possible and preferably by 2050. At the same time, all states and territories have committed to achieving net zero carbon emissions by 2050. The government’s objective under the Paris Agreement of reducing net emissions (including land use, land use change and forestry) by 26-28% between 2005 and 2030 is within reach. However, emissions will need to decline on a significantly steeper trajectory for Australia to reach net zero by 2050 (Figure 1.25, Panel B).
Figure 1.25. Emissions will need to decline faster to achieve net zero emissions by 2050 Greenhouse gas emission projections and required trajectory to achieve net zero emissions at 2050
Note: The data for 2021-2030 correspond to government projections under the department’s baseline scenario as at December 2020. The measure includes land use, land use change and forestry. Source: Department of Industry, Science and Energy Resources; OECD calculations.
StatLink 2 https://stat.link/ykpsaj
The vast majority of Australia’s decline in greenhouse gas emissions since 2005 has been due to emission reductions in the land use sector (Figure 1.26). Between 2005 and 2019, annual emissions from land use, land use change and forestry declined by 114.1 million tonnes of CO2 equivalent. This reflected reductions in native forest harvesting and primary forest clearing, improved soil carbon management, the fostering of native vegetation growth and retention and improved fire management in Australia's Top End savannas. Government data show that there has also been a reduction in emissions from the electricity sector, especially over the past decade: after peaking in the year to June 2009, emissions from the electricity sector had fallen by 20.9% by the year to December 2020 (44.2 million tonnes of CO2 equivalent). Declines in emissions from other sectors have been more limited. There have been increases in emissions from the transport sector and from fugitive emissions from fuels (largely deriving from the production of liquefied natural gas and coal for export) over the period.
0
100
200
300
400
500
600
700
0
100
200
300
400
500
600
700
1990 1995 2000 2005 2010 2015 2020 2025 2030 2035 2040 2045 2050
Mt CO2-eMt CO2-e
Required trajectory to net zero emissions by 2050
Baseline
2021-2030 2031-2050

| 53
OECD ECONOMIC SURVEYS: AUSTRALIA 2021 © OECD 2021
Figure 1.26. Progress in reducing net emissions has varied across sectors Historical greenhouse gas emissions
Note: “Energy industries“ includes activities such as energy extraction, energy production and transformation, electricity generation and petroleum refining. Source: OECD Greenhouse Gas Emissions dataset.
StatLink 2 https://stat.link/dgeqhk
State and territory governments have become increasingly active in introducing distinct climate change policies as they seek to achieve net zero emission targets on an individual basis. The different costs of emissions abatement across states means that such an approach will come at a higher cost than a nationally coordinated strategy. The government’s forthcoming Long-term Emissions Reduction Strategy is an opportunity to articulate a more co-ordinated and ambitious climate-change policy that puts the national economy on the path to reaching net zero emissions as soon as possible and preferably by 2050. Doing so could propel innovation in low carbon technologies and catalyse their diffusion throughout the economy. At the same time, it can allow Australia to meet its international climate change commitments without unnecessarily raising the short-term economic costs of doing so. The new International Programme for Action on Climate (IPAC) could assist Australia in tracking progress in achieving its emission reduction goals.
Significant economic benefits can come from a quicker pace of emission reductions. Following such a path could reduce the chance of locking-in emissions-intensive infrastructure that becomes stranded in the future. It also has the potential to support more affordable access to investment capital (from reduced climate-related exposures), enhanced agricultural productivity, reduced energy use and costs for households and businesses and lower health risks (Kompas et al., 2019). In addition, there can be substantial commercial benefits from developing and selling emissions reduction technology for a country like Australia with rich access to human capital, developed financial markets and world class research institutions.
The federal government has recently stressed the development of clean energy technologies as the path to lower emissions. Strong institutions are already in place to support these aims. The Australian Renewable Energy Agency provides grants for research, development, demonstration, deployment and early-stage commercialisation of renewables technology. In addition, Australia is one of the few OECD countries to have established a green bank at the national level (OECD, 2019e). The Clean Energy Finance Corporation facilitates the financing of clean energy projects through a variety of instruments including co-financing, project finance, corporate loans, climate bonds and equities. Since 2013, the CEFC has made investment commitments of more than AUD9.1 billion in projects worth over AUD31 billion. Despite these institutions being considered best practice within the OECD and having been in existence for many years,
-100
0
100
200
300
400
500
600
700
-100
0
100
200
300
400
500
600
700
2005 2007 2009 2011 2013 2015 2017 2019
Mt CO2-eMt CO2-e Energy industries Transport AgricultureIndustrial processes and product use Manufacturing industries and construction Residential and other sectorsEnergy - other Waste Fugitive emissions from fuelsLand use, land-use change and forestry

54 |
OECD ECONOMIC SURVEYS: AUSTRALIA 2021 © OECD 2021
innovations are less likely to be environment-related in Australia than in other OECD countries (Figure 1.28, Panel A). Furthermore, there has been a trend decline in environmental R&D over the past decade (OECD, 2019e).
In 2020, the government released the Technology Investment Roadmap that identified five key areas where technological developments could reduce emissions in Australia’s most carbon-intensive sectors. The focus will specifically be on clean hydrogen, energy storage, low carbon materials (e.g. low emission steel production), carbon capture and storage and soil carbon. The Roadmap will guide AUD20 billion of government investment over the next decade and will help leverage AUD80 billion in total investment. Overall, climate-related spending by the federal government will account for around 0.2-0.3% of total government expenditure in the coming years (Commonwealth Government, 2021e).
The efficacy of the public investment and technology policies would be enhanced by ensuring that market prices adequately reflect carbon content. Doing so would provide the essential price signal for further mobilising private investment in clean technologies (IMF/OECD, 2021). As with any emission reduction policy, the potential impact on cost of living and competitiveness needs to be taken into account, especially in areas where there are currently fewer low emissions alternatives. At present, Australia’s carbon emissions are priced lower than in most other high income OECD countries, but similar to some other commodity exporters such as Chile (Figure 1.27). Carbon prices in Canada, another major commodity exporter, are higher and the Canadian government has proposed that they rise significantly over the years ahead (OECD, 2021e). Around 20% of Australia’s carbon emissions are priced above EUR 30 per tonne of CO2 (a conservative estimate of the climate damage from one tonne of CO2 emissions), with the majority of unpriced emissions deriving from the electricity and industry sectors (OECD, 2021f).
Figure 1.27. Carbon emissions are priced lower than in most other countries
EUR per tCO2, 2018
Note: The figure only includes explicit carbon pricing from carbon taxes, ETSs and fuel taxes, not other market and regulatory measures. Source: OECD Effective Carbon Pricing Dataset.
StatLink 2 https://stat.link/ql9bc0
More generally, widespread diffusion of new clean energy technologies will require a Long-term Emissions Reduction Strategy that defines clear goals and corresponding policy measures for the path to achieving net zero emissions by 2050. The least cost approach to meeting these emission targets would involve an economy-wide carbon price. However, if the political environment precludes such an approach, other existing instruments will need to be scaled up and new sector-based solutions considered. More ambitious emission reduction policies will be especially needed in those sectors that are the biggest emitters – energy, transport and agriculture.
0
10
20
30
40
50
60
70
0
10
20
30
40
50
60
70
CHE
LUX
NOR
FRA
SVN
GBR
AUT
ISL
ITA
LTU
DNK
IRL
NLD
ESP
PRT
KOR
ISR
GRC
MEX
FIN
SVK
USA
CAN
NZL
HUN
SWE
BEL
LVA
TUR
POL
DEU
AUS
CHL
JPN
COL
CZE
EST
Priced above EUR30 Priced above EUR60
% of total CO2 emissions from energy use % of total CO2 emissions from energy use

| 55
OECD ECONOMIC SURVEYS: AUSTRALIA 2021 © OECD 2021
Energy sector
Energy intensity has fallen, with the decline in the ratio of total energy supply to GDP over the past decade similar to that in other OECD countries (Figure 1.28, Panel B). This partly reflects the progress in the electricity sector already discussed. Even so, CO2 intensity of electricity generation remains around double the OECD average (OECD, 2019e).
High emissions intensity reflects the very high share of fossil fuels still in the energy mix (OECD, 2019e). Oil, coal and natural gas account for about 93% of primary energy supply compared with 80% on average across the OECD. The share of renewables in energy supply and electricity generation have increased rapidly over recent years, partly due to the success of the government’s Renewable Energy Target. Australia now boasts the highest installed photovoltaic capacity per inhabitant in the world (International Energy Agency, 2020a). Such technology was initially in rooftop applications, especially in the residential sector, before shifting to utility scale applications (ibid.). While Australia has more solar and wind capacity installed than any country outside of Europe, there is significant scope for further increases in renewable energy, given that the share remains low compared with other OECD countries (Figure 1.28, Panel C).
The relative costs of renewable energy sources are anticipated to fall further in the years ahead (International Energy Agency, 2020b). The Australian Energy Market Operator has highlighted that economic forces will cause renewables to continue displacing coal in the electricity market (Australian Energy Market Operator, 2020). However, greater renewable generation needs to be accompanied by further investment in the transmission network with projects supported by careful cost-benefit analysis (Wood, 2020).
There is also a critical role for the federal government to play in managing the transition to renewables at least cost. This will provide greater certainty for investors, ensure proper planning can be undertaken to maintain network reliability and allow flanking policies to be devised that support displaced workers. The Long-term Emissions Reduction Strategy should outline specific emission reduction targets for electricity over regular intervals that are consistent with net zero emissions by 2050. These targets could then be enforced through a scaled-up version of the Safeguard Mechanism that already exists as part of the government’s Emissions Reduction Fund.
The Safeguard Mechanism currently requires the largest emitters in mining, manufacturing, transport, electricity and other industrial sectors to purchase an Australian Carbon Credit Unit (ACCU) if their emissions exceed a defined baseline. ACCU’s are created through eligible domestic abatement projects being undertaken that are funded through the government’s Emission Reduction Fund. It is conceivable that the Safeguard Mechanism could be used as a way to ensure emission reduction goals are met in a range of sectors outside of electricity. A well-communicated schedule for future declines in the baseline that accord with the government’s emission abatement goals would provide clarity to businesses. Past proposals that detail the design and sequencing for an emission reduction framework that utilises the Safeguard Mechanism (e.g. Wood and Blowers, 2016) should now be reconsidered by the authorities.
In scaling up the Safeguard Mechanism, the government should consider providing carbon credits for entities that undershoot baseline emissions. Under its current form, there is little incentive for emitters to reduce emissions below the baseline level. The authorities have already committed to trial a similar approach in response to a proposal of the final report of the expert panel examining additional sources of low-cost abatement (i.e. ‘the King Review’; Commonwealth Government, 2020c). This will credit reductions in emissions intensity (rather than absolute emissions) to avoid crediting reduced production or facility closures (ibid.).
The further transition away from fossil fuel energy generation must be accompanied by policies that support the transition of workers. Coal mining in Australia employs about 40,000 people and many of the intensive coal-dependent regions will not be able to seamlessly switch to producing large-scale renewable energy, given that the best solar and wind resources are located elsewhere (Briggs et. al., 2020). As such,

56 |
OECD ECONOMIC SURVEYS: AUSTRALIA 2021 © OECD 2021
programmes that diversify and develop economic activities in the most affected regions will be key. Many OECD countries have now established “just transition” authorities to plan for this process. In Germany, the government tasked a “coal commission” with developing a path for such a transition by 2038, through broad stakeholder consultation. This was accompanied with additional funding to implement the transition projects.
Figure 1.28. Green growth indicators
Source: OECD Green Growth Indicators database.
StatLink 2 https://stat.link/0tfzuj
Transport
CO2 emissions from the transport sector grew by 22% between 2005 and 2019, accounting for around 18% of total emissions by that time. The majority derive from cars and light commercial vehicles. Specifically, fossil fuel combustion in internal combustion engines (Climate Change Authority, 2020a). The private and public transport sectors offer considerable opportunities for abatement given the rapid development of the global electric vehicle market. However, this will only be true if significant emission reductions in electricity generation are achieved.
So far, uptake of electric vehicles has been modest compared with other OECD countries. Electric vehicles accounted for less than 1% of new car sales in Australia in 2020, compared with 2-4% in markets such as the United States and Canada, around 10% in the UK and EU and as high as 75% in Norway (International
0.00
0.02
0.04
0.06
0.08
0.10
0.12
0.14
0.16
2000 2003 2006 2009 2012 2015 2018
B. Energy intensityEnergy supply per GDP
Australia OECD
ktoe/USD (2015 PPP)
0
5
10
15
20
25
30
1990 1994 1998 2002 2006 2010 2014 2018
C. Renewable electricity share
Australia OECD
% of total electricity generation
0
2
4
6
8
10
12
Australia OECD
A. Environment-related inventions
Average 2016-2018 Average 2000-2002% of all technologies

| 57
OECD ECONOMIC SURVEYS: AUSTRALIA 2021 © OECD 2021
Energy Agency, 2020c). Some countries such as the UK and France have set a target of 100 per cent of new car purchases being electric by 2040, whilst others like the Netherlands and Norway aim to achieve the same target by 2025 (Commonwealth of Australia, 2019). A dramatic fall in the cost of lithium-ion batteries has allowed for the introduction of longer range electric vehicles at more affordable prices. Australia is well positioned to benefit economically from growth in the electric vehicle market given a rich endowment of lithium, nickel, cobalt and rare earth materials that are used in battery manufacture (Climate Change Authority, 2020a).
The barriers to a greater proportion of electric vehicles on Australian roads can be reduced by adjusting public policy. While public charging infrastructure is currently insufficient, the federal government recently announced co-investment with the private sector from the AUD71.9 million Future Fuels Fund to address “charging blackspots” and to demonstrate hydrogen refuelling infrastructure (Department of Industry, Science and Energy Resources, 2021b). Federal government leadership on developing this infrastructure is important to avoid interoperability issues between states and territories.
Cost can also be a barrier to greater electric vehicle uptake. This is because electric vehicles typically involve greater upfront costs, even though costs can be comparable with internal combustion engine vehicles over the entire useful life. Continued efforts should be made to inform consumers that operational costs of electric vehicles are comparatively low. The federal government provides preferential tax treatment of electric vehicles through a higher luxury car tax threshold (worth around AUD3,500 per vehicle) and some state governments offer additional financial support for electric vehicle purchases. The Victorian government has introduced a new distance-based road user charge that applies only to electric vehicles. A move to road user charging across all vehicle types should be a priority of Australian governments (OECD, 2019e). While internal combustion engine vehicles would continue paying fuel excise, road user charges that are levied only on electrical vehicles risk disincentivising the transition to cleaner forms of transport. At a minimum, the new tax should be coupled with incentives that fully offset any potential negative impact on their adoption. The New South Wales government has announced that it will delay a road user charge for zero- and low-emissions cars until mid-2027 or once electric vehicles account for 30% of new car sales (whichever comes first). In addition, the government is waiving stamp duty on electric vehicle purchases and providing rebates for cars priced under AUD68,750 (EUR43,376).
Corporate and government fleet cars make up approximately half of new car sales in Australia, meaning that they are an important source of used cars. Furthermore, the total cost of electric vehicle ownership for local government fleets is already cost-competitive with internal combustion vehicles (ClimateWorks 2019). Targets for electric vehicle procurement in government fleets could thus be a worthwhile initiative to support the broader proliferation of electric vehicles.
Stricter fuel efficiency standards are also necessary for reducing emissions and air pollution as the transition to increased electrification of the vehicle fleet occurs. Vehicle efficiency clearly lags behind international peers such as the United States, China, Europe, Canada and Japan (Climate Change Authority, 2020a). Australia is one of the few G20 countries without mandatory emissions or fuel efficiency standards for cars. It also does not have any policy to reduce emissions from freight trucks. In keeping with the recommendations of the most recent OECD Environmental Policy Review, Australia should introduce fuel quality and vehicle emission standards, including CO2 and other pollutant emissions that are on par with global best practices.
Agriculture
There has been progress in reducing aggregate emissions from agriculture over the past decade. Agricultural emissions (excluding land use, land use change and forestry) fell by 12.5% between 2005 and 2019, compared with an increase of 4.2% in the OECD. By 2019, the sector accounted for around 13% of Australia’s greenhouse gas emissions, largely deriving from livestock production. There have been significant advances in technologies designed to reduce emissions from agriculture. For instance, methane

58 |
OECD ECONOMIC SURVEYS: AUSTRALIA 2021 © OECD 2021
emissions can be reduced by employing new types of feed or breeding practices and more efficient nitrogen fertilisers are available. There is also more interest in farms using renewable energy solutions given the significant falls in prices (Eckard, 2020).
The main government policy designed to reduce Australia’s agricultural emissions is the Emissions Reduction Fund (Table 1.10). Many of the abatement projects under the scheme that result in Australian Carbon Credit Units are related to agriculture. Since 2012-13, 53 million tonnes of abatement have been achieved related to the land sector under the scheme (including agricultural, vegetation and savanna burning methods). The Climate Change Authority has noted that the Emissions Reduction Fund has robust mechanisms for ensuring the environmental integrity of the contracted abatement projects (Climate Change Authority, 2020b).
Looking forward, the government should ensure that reductions in agricultural emissions are a core element of the nationally integrated strategy to reach net zero carbon emissions by 2050. If the government were to use a recalibrated Safeguard Mechanism to achieve net zero emissions by 2050, there would be a significant increase in demand for Australian Carbon Credit Units. In turn, this could mean increased funding of abatement projects in the agricultural sector. The authorities should continue to ensure that a broad range of agricultural producers and projects can be eligible for funding under the Emissions Reduction Fund, that the lowest abatement cost projects are prioritised and that the scheme is not funding abatement initiatives that would have been undertaken in the absence of the programme (Climate Change Authority, 2020b).
Table 1.10. Past OECD recommendations on promoting environmental sustainability
Recommendations in past Surveys Actions taken since the previous Survey (December 2018) Stabilise and strengthen climate-change policy. Develop and implement a national, integrated energy and climate policy framework for 2030 based on a low-emission development strategy for 2050, in line with the Paris Agreement objective. Guide the energy transition through an emissions reduction goal for the power sector supported by a market-based mechanism.
In 2019 the Government announced the AUD3.5 billion Climate Solutions Package. The package included AUD2 billion to build on the Emissions Reduction Fund, including through auctions to purchase low-cost abatement The package also included funding for energy efficiency and for pumped hydro projects. In September 2020 the Government released the first Low Emissions Technology Statement. The Statement set stretch goals for five priority technologies. The 2020-21 Budget included AUD1.9 billion to invest in technologies identified in the roadmap. This included funding for carbon capture and storage, hydrogen, electric vehicle infrastructure and to support industry to adopt low emission technologies. In November 2020, the Government announced that it will establish a new, National Resilience, Relief and Recovery Agency to drive the reduction of natural disaster risk, enhance natural disaster resilience and ensure effective relief and recovery to all hazards. On 25 January 2021, the Government announced that Australia will develop a new National Climate Resilience and Adaptation Strategy. This would replace the existing Strategy, released in 2015. As part of the 2021-22 Budget, the Government announced further investment of AUD539.2 million in new clean hydrogen, carbon capture, use and storage (CCS/CCUS) projects. In addition, a further AUD565.8 million was committed to funding low emissions international technology partnerships and initiatives by co-funding research and demonstration projects.
Give greater priority to biodiversity in project approval and land use.
The ten yearly independent review of Australia’s national environment law was completed in October 2020. The review found that significant reform is required. The Australian Government has committed to a staged program of reform, which is now underway.

| 59
OECD ECONOMIC SURVEYS: AUSTRALIA 2021 © OECD 2021
Table 1.11. Key Policy Insights recommendations
MAIN FINDINGS RECOMMENDATIONS (Key recommendations in bold)
Ensuring a sustained recovery in output and jobs International borders remain closed, negatively impacting education exports and bilateral tourism. Labour shortages are arising in some sectors traditionally reliant on foreign workers and there are many Australian citizens stuck abroad because of hotel quarantine caps.
Ensure all eligible adults are able to receive COVID-19 vaccination and open international borders at the earliest possible date.
A substantial fiscal response at the onset of the pandemic was enabled by the country’s strong starting fiscal position. The stimulus measures were front loaded and temporary.
Restore fiscal sustainability in a gradual manner and adopt a more expansionary stance of fiscal policy if further containment measures have a significant negative impact on economic growth.
Fiscal policy is now being conducted in an environment of higher public debt, with fiscal costs from ageing in prospect. The independent fiscal authority fulfils a narrower role than counterparts in many other OECD countries.
Task an independent fiscal institution, such as the Parliamentary Budget Office, with both formal evaluation and monitoring of the government’s fiscal strategy.
Young and low-wage workers experienced the greatest job losses through the pandemic. The unemployment benefit replacement rate remains close to the lowest in the OECD and below estimates of the relative poverty line. This partly reflects prior indexation to consumer price inflation.
Further increase the unemployment benefit rate and consider indexing the rate to wage inflation.
Australia's tax mix remains tilted towards income taxes and has increasingly relied on personal income taxation. With an ageing population, revenue streams will come under significant pressure under current policy settings. In addition, some prominent inefficiencies and distortions in the tax system remain.
Further shift the tax mix away from income taxes (especially personal income tax) and inefficient taxes (including real-estate stamp duty) and towards the Goods and Services Tax and recurrent land taxes. Reduce some of the concessions for the taxation of private pensions, particularly those that favour high income earners. Reduce the capital gains tax discount. Assess the distortionary impact of the current two-tier corporate tax system.
Health and social welfare for the aged already account for one quarter of all government spending and costs will grow with the ageing population. An overreliance on hospitals inflates health spending pressures. Half of the government’s spending on the Age Pension currently goes to people that are asset rich.
Boost primary care capacity through further promoting new methods of care that harness digital technologies. Include the entire value of the family home, or that portion above a certain threshold, in the means test for Age Pension eligibility. Consider increasing the qualifying age for the Age Pension to 70.
Gaps in economic and wellbeing between Indigenous and non-Indigenous Australian remain large. There are a raft of policy measures aimed at improving outcomes for Indigenous Australians. However, little is known about what policies work and why, and there is no coordinated approach to policy evaluation across government.
Embed the Productivity Commission Indigenous Evaluation Strategy in the policy design and evaluation process of all Australian Government agencies for both Indigenous-specific and mainstream policies that affect the Indigenous population.
The Reserve Bank of Australia has added new instruments to its toolkit. In particular, a government bond purchasing programme, though it remains comparatively small in scale. The central bank’s preferred measures of underlying inflation have undershot the target since 2015.
As in other OECD countries, undertake a review into the monetary policy framework that is broad in scope, transparent and involves consultation with a wide variety of relevant stakeholders. Keep monetary policy expansionary, but stand ready to tighten policy if underlying inflation risks sustainably rising above the target or inflation expectations risk becoming de-anchored.
Households are amongst the most indebted in the OECD and banks are highly exposed to housing assets. Risks are moderated by high household asset holdings, well-capitalised banks and close supervision.
If credit growth picks up and there are other signs of building risks, implement macroprudential tools. Complete implementation of a loss-absorbing regime, including bail-in provisions, in case of financial institution insolvency.
Raising productivity growth to boost future living standards About one fifth of Australian workers require a license to perform their work. Most need distinct licenses in each Australian state and territory. This unnecessarily raises economic costs, including by slowing resource reallocation.
Legislate automatic mutual recognition of occupational licenses. Further investigate occupational licensing requirements from systemic and sectoral perspectives, considering the avenues for further harmonisation across jurisdictions and the extent to which new technologies are making existing licenses obsolete. Improve data collection about occupational licensing regimes across the country and information exchange systems between jurisdictions.
Land needs to be repurposed to take into account structural changes, not least those induced by the pandemic. However, there is limited
Allow local authorities to raise more of their own-source revenue, at the same time as reallocating the minimum Financial Assistance Grant from wealthier local authorities to those in more

60 |
OECD ECONOMIC SURVEYS: AUSTRALIA 2021 © OECD 2021
incentive for local authorities in desirable locations to attract new businesses or expand dwelling supply.
disadvantaged areas. Move towards fewer land zone types, which are harmonised where possible, and less prescriptive about the types of activities that can be undertaken.
Australia scores relatively well in indicators of domestic corruption, butthe institutional arrangement for fighting corruption could be strengthened. The authorities plan to establish a Commonwealth Integrity Commission, but the proposed institution would have stronger powers for the Law Enforcement Division than for the Public Sector Division.
Establish a Commonwealth Integrity Commission and more closely align the mandate of the Public Sector Division with that currently proposed for the Law Enforcement Division.
There are signs of reduced competitive intensity in product markets. In particular, firm entry rates have declined in digitally intensive sectors. There has been a pick-up in merger and acquisition activity in the technology sector over the recent period.
Consider the introduction of an unfair practices provision to eliminate various practices that are a clear abuse of market power but are currently not illegal. Consider changes to merger review legislation that better take into account the competitive dynamics in digital markets.
Reducing greenhouse gas emissions in a cost efficient way All states and territories have now committed to achieving net zero carbon emissions by 2050. National carbon emissions need to decline on a much steeper trajectory if this goal is to be met.
Develop a national, integrated Long-term Emissions Reduction Strategy that defines clear goals and corresponding policy settings for the path to achieving net zero emissions as soon as possible and preferably by 2050. Scale up the Safeguard Mechanism that exists as part of the government’s Emissions Reduction Fund to appropriately price carbon emissions across sectors. Ensure that reductions in agricultural emissions are a core element of the nationally integrated strategy to reach net zero carbon emissions by 2050.
Australia is one of the few G20 countries without mandatory emissions or fuel efficiency standards for cars.
Introduce fuel quality and vehicle emission standards, including CO2 and other pollutant emissions that are on a par with global best practices.

| 61
OECD ECONOMIC SURVEYS: AUSTRALIA 2021 © OECD 2021
References Akgun, O., B. Cournede, J.M. Fournier, (2017), "The effects of tax mix on inequality and growth", OECD
Economics Department Working Paper, No. 1447, OECD Publishing, Paris. AlphaBeta (2020), “Australia’s digital resilience: how technology strengthened Australian business during
COVID and beyond”, September 2020. Andrews, D. et. al. (2021a), “COVID-19 and Productivity-Enhancing Reallocation in Australia: Real-time
evidence from Single Touch Payroll”, OECD Economics Department Working Paper, forthcoming. Andrews, D. et. al. (2021b), “COVID-19 and Productivity-Enhancing Reallocation in Australia: Timely
evidence from three OECD countries”, OECD Economics Department Working Paper, forthcoming. Andrews, D. et. al. (2019), “Wage growth in Australia: lessons from longitudinal microdata”, RBA Annual
Conference Papers, Reserve Bank of Australia. Australian Competition and Consumer Commission (2019), Digital Platforms Inquiry, Final Report, June
2019. Australian Energy Market Operator (2020), 2020 Integrated System Plan for the National Electricity
Market, July 2020. Australian Institute of Family Studies (2021), Child care in 2020, Towards COVID normal, Report no. 3,
June 2021. Bambalaite, I. et. al. (2020), “Occupational entry regulations and their effects on productivity in services:
Firm-level evidence”, OECD Economics Department Working Papers, No. 1605, OECD Publishing, Paris.
Beetsma, R. et. al. (2019), “Independent fiscal councils: Recent trends and performance”, European Journal of Political Economy, Vol. 57.
BDO (2020), Technology M&A Highlights, Q3 2020. Bishop, J. and I. Day (2020), “How many jobs did JobKeeper keep?”, RBA Research Discussion Paper,
No. 2020-07, Reserve Bank of Australia. Briggs, C. et al. (2020), Renewable energy jobs in Australia: Stage One, prepared for Clean Energy
Council by UTS Institute for Sustainable Futures, University of Technology Sydney. Calvino, F. and C. Criscuolo (2019), “Business dynamics and digitalisation”, OECD Science, Technology
and Industry Policy Papers, No. 62, OECD Publishing, Paris. Cassidy, N. (2019), Low Wages Growth in Australia – An Overview, Reserve Bank of Australia. Climate Change Authority (2020a), Prospering in a low emissions world: an updated climate policy toolkit
or Australia¸ Australian Government, March 2020. Climate Change Authority (2020b), Review of the Emissions Reduction Fund, Australian Government,
October 2020. ClimateWorks (2019), Electrical Vehicle Ready Local Government Fleets: Increasing Uptake and
Ambition, March 2019. Coates, B. and M. Cowgill (2021), “Now is an especially bad time to cut unemployment benefits”, Pearls
and Irritations, 25 February. Coates, B. and J. Nolan (2020), “Balancing act: managing the trade-offs in retirement incomes policy”,
Submission to the Retirement Income Review, Grattan Institute. Commonwealth Government (2021a), Women’s Budget Statement, Federal Government Budget 2021-
22. Commonwealth Government (2021b), Statement 8: Forecasting Performance and Sensitivity Analysis,
Federal Government Budget 2021-22, Budget Paper No. 1. Commonwealth Government (2021c), Intergenerational Report: Australia over the next 40 years, June
2021. Commonwealth Government (2021d), Mutual Recognition Amendment Bill, Second Reading, House of
Representatives Hansard, 18 March 2021.

62 |
OECD ECONOMIC SURVEYS: AUSTRALIA 2021 © OECD 2021
Commonwealth Government (2021e), Statement 7: Debt Statement, Federal Government Budget 2021-22, Budget Paper No. 1.
Commonwealth Government (2020a), Retirement Income Review, Final Report, July 2020. Commonwealth Government (2020b), Australian Government response to the Final Report of the Expert
Panel examining additional sources of low-cost abatement, Department of Industry, Science and Energy Resources.
Commonwealth Government (2019), Senate Estimates – Opening Statement, Secretary to the Treasury, October 2019.
Climate Change Authority (2015), Final Report on Australia’s Future Emission’s Reduction Targets, 2 July 2015.
Daley, J. et. al. (2018), Housing affordability: re-imagining the Australian dream, Report No. 2018-04, Grattan Institute.
Daley, J. and D. Wood (2016), “Fiscal challenges for Australia: the next decade and beyond”, Asia & the Pacific Policy Studies, Vol. 3, No. 3,
Debelle, G. (2018), “Low Inflation”, Address at The Economic Society of Australia (QLD) Business Lunch, Brisbane, 22 August.
Debrun, X. and T. Kinda (2017), “Strengthening post-crisis fiscal credibility: Fiscal councils on the rise—A new dataset.”, Fiscal Studies, Vol. 38.
Department of Health (2019), Australia’s Long-term National Health Plan: to build the world’s best health system, August, 2019.
Department of Industry, Science, Energy and Resource (2021a), Quarterly Update of Australia’s National Greenhouse Gas Inventory, December 2020.
Department of Industry, Science, Energy and Resource (2021b), Future Fuels Strategy: Discussion Paper, February 2021.
Eckard, R. (2020), “Australia’s farmers want more climate action – and they’re starting in their own (huge) backyards”, The Conversation, 20 August.
Fall, F. et al. (2015), Prudent debt targets and fiscal frameworks, OECD Economic Policy Paper, July 2015, No. 15, OECD Publishing, Paris.
Guillemette, Y. and D. Turner (2021), “The Long Game: Fiscal Outlooks to 2060 Underline Need for Structural Reform”, OECD Economics Department Policy Papers, No. 29, OECD Publishing.
Guinness, H. et. al. (2020), A Blueprint for the National Cabinet, Blueprint Institute. Grattan Institute (2020), The Recovery Book: what Australian governments should do now, Grattan
Institute Report No. 2020-10, June 2020. Haltiwanger, J., H. Hyatt and E. McEntarfer (2018), “Who Moves Up the Job Ladder?”, Journal of Labor
Economics, Vol. 36/S1. Hambur, J. (2021), “Product market power and its implications for the Australian economy”, Treasury
Working Paper, forthcoming. Hambur, J. and K. Jenner (2019), “Can structural change account for the low level of non-mining
investment?”, RBA Bulletin – June 2019, Reserve Bank of Australia. Hermansen, M. (2019), "Occupational licensing and job mobility in the United States", OECD Economics
Department Working Papers, No. 1585, OECD Publishing, Paris. IMF/OECD (2021), Tax Policy and Climate Change, IMF/OECD Report for the G20 Finance Ministers
and Central Bank Governors, April 2021. International Energy Agency (2020a), Trends in Photovoltaic Applications 2020, OECD Publishing, Paris. International Energy Agency (2020b), World Energy Outlook 2020, OECD Publishing, Paris. International Energy Agency (2020c), Global EV Outlook, OECD Publishing, Paris. International Monetary Fund (2020), “Australia: Selected Issues”, IMF Country Report, No. 20/69. Jin, Y. (2021), “Framework to discuss corruption in OECD Economic Surveys”, OECD Economics

| 63
OECD ECONOMIC SURVEYS: AUSTRALIA 2021 © OECD 2021
Department Working Paper, forthcoming. Johansson, Å. et al. (2008), “Taxation and economic growth”, OECD Economics Department Working
Papers, No. 620, OECD Publishing, Paris. Joint Council on Closing the Gap (2020), National Agreement on Closing the Gap, July 2020. Kompas, T., et al. (2019), “Australia’s Clean Energy Future: Costs and Benefits”, MSSI Issues Paper,
No. 12, Melbourne Sustainable Society Institute, The University of Melbourne. KPMG (2019), She’s Price(d)less: the economics of the gender pay gap, prepared with Diversity Council
of Australia and the Workplace Gender Equality Agency, August 2019. McDonald, J. (2020), “Why deregulate?”, Speech transcript, Productivity reform in Australia and New
Zealand – Barriers and opportunities, 24 November 2020. Nerlich, C. and W. Reuter (2013), The design of national fiscal frameworks and their budgetary impact.,
Working Paper Series, No. 1588, European Central Bank, Frankfurt. NSW Review of Federal Financial Relations (2020), “Supporting the road to recovery”, Final Report,
August 2020. OECD (2021a), Brick by Brick: Building Better Housing Policies, OECD Publishing, Paris OECD (2021b), Economic Policy Reforms 2021: Going for Growth: Shaping a Vibrant Recovery, OECD
Publishing, Paris OECD (2021c), Empowering the health workforce: Strategies to make the most of the digital revolution,
OECD Publishing, Paris. OECD (2021d), "Climate change", in Environment at a Glance Indicators, OECD Publishing, Paris. OECD (2021e), Effective Carbon Rates 2021: Pricing Carbon Emissions through Taxes and Emissions
Trading, OECD Publishing, Paris. OECD (2021f), OECD Economic Surveys: Canada 2021, OECD Publishing, Paris. OECD (2020a), “Issue Note 3. Post-financial- crisis changes to monetary policy frameworks: Driving
factors and remaining challenges”, in Chapter 2 of OECD Economic Outlook, Volume 2020, Issue 2, OECD Publishing, Paris.
OECD (2020b), Linking Indigenous Communities with Regional Development in Australia, OECD Rural Studies, OECD Publishing, Paris.
OECD (2020c), “Empowering the health workforce: strategies to make the most of the digital revolution”, OECD Directorate of Employment, Labour and Social Affairs, Health Division, OECD Publishing, Paris.
OECD (2020d), “Start ups, killer acquisitions and merger control”, Directorate for Financial and Enterprise Affairs Competition Committee, Background Note.
OECD (2020e), OECD Public Integrity Handbook, OECD Publishing, Paris. OECD (2019a), Society at a Glance 2019: OECD Social Indicators, OECD Publishing, Paris. OECD (2019b), Linking Indigenous Communities with Regional Development, OECD Rural Policy
Reviews, OECD Publishing, Paris. OECD (2019c), Health at a Glance 2019: Australia, OECD Publishing, Paris. OECD (2019d), Phase 4 Two-Year Follow-up Report: Australia, Implementing the OECD Anti-Bribery
Convention, OECD Working Group on Bribery. OECD (2019e), OECD Environmental Performance Reviews: Australia 2019, OECD Environmental
Performance Reviews, OECD Publishing, Paris. OECD (2018a), Good Jobs for All in a Changing World of Work: The OECD Jobs Strategy, OECD
Publishing, Paris. OECD (2018b), OECD Economic Surveys: Australia 2018, OECD Publishing, Paris. OECD (2018c), Taxation of Household Savings, OECD Tax Policy Studies, No. 25, OECD Publishing,
Paris. OECD (2018d), Rethinking Urban Sprawl: Moving Towards Sustainable Cities, OECD Publishing, Paris.

64 |
OECD ECONOMIC SURVEYS: AUSTRALIA 2021 © OECD 2021
OECD (2017a), OECD Economic Surveys: Australia 2017, OECD Publishing, Paris. OECD (2017b), The Governance of Land Use in OECD Countries: Policy Analysis and
Recommendations, OECD Publishing, Paris. OECD (2015), The Future of Productivity, OECD Publishing, Paris. OECD (2014), OECD Economic Surveys: Australia 2014, OECD Publishing, Paris. Oliveira Hashiguchi, T. (2020), "Bringing health care to the patient: An overview of the use of
telemedicine in OECD countries", OECD Health Working Papers, No. 116, OECD Publishing, Paris, OTN (2018), OTN Annual Report 2017/18, Ontario Telemedicine Network. Parliamentary Budget Office (2020a), 2020-21 Medium-term fiscal projections, Report No. 04/2020. Parliamentary Budget Office (2020b), Structural Trends in GST, Report No. 2/2020. Parliamentary Budget Office (2020c), Increase JobSeeker Payment, Policy Costing, 17 March. Parliamentary Budget Office (2019), Australia’s Ageing Population: understanding the fiscal impacts over
the next decade, Report No. 02/2019. Phillips, B. (2021), “There are lots of poverty lines and JobSeeker doesn’t keep people above any of
them”, The Conversation, 30 March 2021. Preston, B. (2020), “The case for reform of the RBA’s policy and communications strategy”, Centre for
Applied Macroeconomic Analysis, Australian National University. Productivity Commission (2021), Plan to identify planning and zoning reforms, Information Paper, March
2021, Commonwealth of Australia. Productivity Commission (2020a), Indigenous Evaluation Strategy, October 2020, Commonwealth of
Australia. Productivity Commission (2020b), Recent productivity trends, PC Productivity Insights, February 2020,
Commonwealth of Australia. Productivity Commission (2018), “Rising inequality? A stocktake of the evidence”, Productivity
Commission Research Paper, August 2018. Productivity Commission (2017a), Integrated care, Shifting the Dial - Supporting Paper No. 5, August
2017. Productivity Commission (2017b), Local government, Shifting the Dial - Supporting Paper No. 16, August
2017. Productivity Commission (2012), Performance Benchmarking of Australian Business Regulation: The
Role of Local Government as Regulator, Research Report, Volume 1, July 2012. PwC Australia (2020a), Economic benefits of the RACGP’s Vision for general practice and a sustainable
healthcare system, Commissioned and supported by The Royal Australian College of General Practitioners, July 2020.
PwC Australia (2020b), “How GST reform can help reboot prosperity for Australia”, Where next for Australia’s tax system?, July 2020.
PwC Australia (2020c), Economic Impact Assessment of automatic mutual recognition of occupational licensing - Final report, prepared for Department of the Prime Minister and Cabinet, December 2020.
Quinn, M. (2019), Keeping pace with technological change: the role of capabilities and dynamism, OECD Global Forum on Productivity, Speech.
RBA (2021), Statement on Monetary Policy, May 2021. Sedláček, P. and V. Sterk (2020), “Startups and employment following the COVID-19 pandemic: a
calculator”, VOXeu, Centre for Economic Policy Research. Sims, R. (2021a), “Protecting and promoting competition in Australia”, Competition and Consumer
Workshop 2021, Law Council of Australia, Speech, 27 August, 2021. Sims, R. (2021b), “Tackling market power in the COVID-19 era”, National Press Club, Speech, 21
October, 2021. Standing Committee on Economics (2021), Reserve Bank of Australia - Annual Report 2019, 5 February,

| 65
OECD ECONOMIC SURVEYS: AUSTRALIA 2021 © OECD 2021
Hansard. Transparency International Australia (2021), Submission To The Attorney-General’s Department
Consultation process to establish a Commonwealth Integrity Commission, 12 February 2021. Transparency International Australia and Griffith University (2020), Australia’s National Integrity System:
The Blueprint for Action, National Integrity Assessment, November 2020. Transparency International (2016), “Anti-corruption agencies in Australia”, Position Paper, No. 3, January
2016. Tulip, P. (2021), “The Reserve Bank needs accountability that only external scrutiny can provide”, Pearls
and Irritations, 11 February. Varela, P. et. al. (2020), “The taxation of savings in Australia: Theory, current practice and future policy
directions”, Policy Report, No. 01-2020, Tax and Transfer Policy Institute. van Eeden, L.M. et. al. (2020), “Impacts of the unprecedented 2019-20 bushfires on Australian animals”,
Report prepared for WWF-Australia, Ultimo NSW. von Rueden, C. and I. Bambalaite (2020), “Measuring occupational entry regulations: a new OECD
approach”, OECD Economics Department Working Paper, No. 1606. von Trapp, L. and Nicol, S. (2018) “Measuring IFI independence: A first pass using the OECD IFI
database”, In R. Beetsma, and X. Debrun (eds.), Independent fiscal councils: Watchdogs or lapdogs? VoxEU and CEPR.
von Trapp, L. and Nicol, S. (2017) Designing effective independent fiscal institutions. OECD Publishing, Paris.
Wild, D. (2018), “The case for abolishing occupational licensing”, Institute of Public Affairs, May 2018. Wood, D. and K. Griffiths (2021), Submission on the Commonwealth Integrity Commission draft
legislation, Grattan Institute, February 2021. Wood, D. et. al. (2020), Cheaper childcare: a practical plan to boost female workforce participation,
Grattan Institute, August 2020. Wood, D. et. al. (2019), Generation gap: ensuring a fair go for younger Australians, Grattan Institute. Wood, T. and G. Dundas (2020), Start with steel: a practical plan to support carbon workers and cut
emissions, Grattan Insitute, May 2020. Wood, T. (2020), What is the electricity transmission system, and why does it need fixing?, The
Conversation, 16 October 2020. Wood, T. and D. Blowers (2016), Climate Phoenix: a sustainable Australian climate policy, Grattan
Institute, April 2016. Yashadhana, A. et. al. (2020), “Indigenous Australians at increased risk of COVID-19 due to existing
health and socioeconomic inequities”, The Lancet Regional Health – Western Pacific, No. 1/202