OECD DEVELOPMENT CENTREOECD DEVELOPMENT CENTRE Working Paper No. 247 MEASURING GENDER (IN)EQUALITY:...
51
OECD DEVELOPMENT CENTRE Working Paper No. 247 MEASURING GENDER (IN)EQUALITY: Introducing the Gender, Institutions and Development Data Base (GID) by Johannes P. Jütting, Christian Morrisson, Jeff Dayton-Johnson and Denis Drechsler Research programme on: Social Institutions and Dialogue March 2006 DEV/DOC(2006)01
Transcript of OECD DEVELOPMENT CENTREOECD DEVELOPMENT CENTRE Working Paper No. 247 MEASURING GENDER (IN)EQUALITY:...
OECD DEVELOPMENT CENTRE
Working Paper No. 247
MEASURING GENDER (IN)EQUALITY:
Introducing the Gender, Institutions andDevelopment Data Base (GID)
by
Johannes P. Jütting, Christian Morrisson, Jeff Dayton-Johnsonand Denis Drechsler
Research programme on:Social Institutions and Dialogue
March 2006DEV/DOC(2006)01
Measuring Gender (In)Equality: Introducing the Gender, Institutions and Development Data Base (GID)
DEV/DOC(2006)01
© OECD 2006 2
DEVELOPMENT CENTRE WORKING PAPERS
This series of working papers is intended to disseminate the Development Centre’s research findings rapidly among specialists in the field concerned. These papers are generally available in the original English or French, with a summary in the other language.
Comments on this paper would be welcome and should be sent to the OECD Development Centre, 2, rue André Pascal, 75775 PARIS CEDEX 16, France; or to [email protected]. Documents may be downloaded from: http://www.oecd.org/dev/wp or obtained via e-mail ([email protected]).
THE OPINIONS EXPRESSED AND ARGUMENTS EMPLOYED IN THIS DOCUMENT ARE THE SOLE RESPONSIBILITY OF THE AUTHOR
AND DO NOT NECESSARILY REFLECT THOSE OF THE OECD OR OF THE GOVERNMENTS OF ITS MEMBER COUNTRIES
CENTRE DE DÉVELOPPEMENT DOCUMENTS DE TRAVAIL
Cette série de documents de travail a pour but de diffuser rapidement auprès des spécialistes dans les domaines concernés les résultats des travaux de recherche du Centre de développement. Ces documents ne sont disponibles que dans leur langue originale, anglais ou français ; un résumé du document est rédigé dans l’autre langue.
Tout commentaire relatif à ce document peut être adressé au Centre de développement de l’OCDE, 2, rue André Pascal, 75775 PARIS CEDEX 16, France; ou à [email protected]. Les documents peuvent être téléchargés à partir de: http://www.oecd.org/dev/wp ou obtenus via le mél ([email protected]).
LES IDÉES EXPRIMÉES ET LES ARGUMENTS AVANCÉS DANS CE DOCUMENT SONT CEUX DE L’AUTEUR ET NE REFLÈTENT PAS NÉCESSAIREMENT CEUX DE L’OCDE OU DES GOUVERNEMENTS DE SES PAYS MEMBRES
Applications for permission to reproduce or translate all or part of this material should be made to: Head of Publications Service, OECD
2, rue André-Pascal, 75775 PARIS CEDEX 16, France © OECD 2006

OECD Development Centre Working Paper No. 247
DEV/DOC(2006)01
© OECD 2006
3
TABLE OF CONTENTS
ACKNOWLEDGEMENTS.......................................................................................................................... 4
PREFACE ...................................................................................................................................................... 5
RÉSUMÉ........................................................................................................................................................ 6
ABSTRACT ................................................................................................................................................... 6
I. INTRODUCTION................................................................................................................................. 7
II. CONSTRUCTION OF THE NEW DATA BASE........................................................................... 9
III. THE GID DATA BASE – SOME DESCRIPTIVE EVIDENCE................................................... 17
IV. RELEVANCE OF SOCIAL INSTITUTIONS TO EXPLAIN THE ECONOMIC ROLE OF WOMEN..................................................................................................................................... 22
V. CONCLUSIONS.............................................................................................................................. 32
BIBLIOGRAPHY........................................................................................................................................ 33
STATISTICAL SOURCES ......................................................................................................................... 34
ANNEX ....................................................................................................................................................... 36
OTHER TITLES IN THE SERIES/ AUTRES TITRES DANS LA SÉRIE.............................................. 44

Measuring Gender (In)Equality: Introducing the Gender, Institutions and Development Data Base (GID)
DEV/DOC(2006)01
© OECD 2006 4
ACKNOWLEDGEMENTS
The Development Centre would like to thank the Swiss and the United Kingdom Authorities for the financial support given to the project which gave rise to this study.
OECD Development Centre Working Paper No. 247
DEV/DOC(2006)01
© OECD 2006
5
PREFACE
“Tradition is a guide and not a jailer”, wrote W. Somerset Maugham. Could it be that some traditions, however rooted in great histories and cultures, are now trapping countries in poverty? This certainly appears to be the case when it comes to the influence of social and cultural norms on the status of women. For many, equality between sexes is primarily a moral issue, something that must be pursued as a matter of principle. What is often neglected, however, is the economic impact of barring women from economic activities. The success with which a developing country integrates female workers into its labour force partially determines its level of competitiveness in the global economy. To shed light on factors constraining the economic role of women is therefore of paramount importance.
With the innovative Gender, Institutions, and Development Data Base (GID), the OECD Development Centre provides a useful new tool to determine and analyse obstacles to women’s economic development. The data base has been compiled from various sources and combines in a systematic and coherent fashion the current empirical evidence that exists on the socio-economic status of women. Its true value-added, however, is the innovative inclusion of institutional variables that range from intra-household behaviour to social norms. Information on cultural and traditional practices that impact women’s economic development is coded so as to measure the level of discrimination. Such comprehensive overview of gender-related variables and the data base’s specific focus on social institutions is the first of its kind, providing a tool-box for a wide range of analytical queries and allowing case-by-case adaptation to specific research or policy questions.
Analysis in this paper using the GID data base generates important policy lessons that are relevant for donor and partner countries alike. Contrary to conventional thinking the status of women does not automatically improve with rising incomes, gender specific policies (providing micro-credit, setting up schools) or legal reforms. These policies will only be successful if simultaneously long-standing discriminatory traditions and privileges that benefit men are simultaneously challenged. To do so requires an approach that uses incentives and sanctions for behavioural change that vary according to different socio-economic environments.
Louka T. Katseli
Director OECD Development Centre
March 2006
Measuring Gender (In)Equality: Introducing the Gender, Institutions and Development Data Base (GID)
DEV/DOC(2006)01
© OECD 2006 6
RÉSUMÉ
Les efforts pour établir, tester, et analyser les hypothèses relatives aux différences de statut économique des femmes entre les pays sont entravés par le manque d'informations disponibles sur-le-champ et faciles à utiliser sur les divers aspects de l'inégalité entre les sexes. Afin de combler cette lacune, ce document présente la base de données sur l’Égalité homme-femme, les Institutions et le Développement (EID) www.oecd.org/dev/institutions/basededonnéesEID du Centre de développement de l'OCDE. La base EID représente une amélioration importante par rapport aux sources qui existent, en particulier parce qu'elle comprend des variables institutionnelles relatives aux normes, aux lois , aux codes de conduite, aux coutumes et aux traditions familiales qui avaient été négligées dans les études comparatives quantitatives. Pour illustrer l'utilité de cette base, ce document introduit dans un modèle les facteurs de la participation des femmes au marché du travail - celle-ci constitue un indicateur de l'égalité entre les sexes aussi bien qu'un élément important pour la croissance économique à long terme – et démontre que le rôle économique des femmes dépend d'une manière critique des différences entre les institutions sociales en matière de discrimination selon le sexe.
ABSTRACT
Efforts to establish, test and analyse hypotheses regarding cross-country variations in women’s economic status are hampered by the lack of a readily accessible and easily used information resource on the various dimensions of gender inequality. Addressing this gap, this paper introduces the Gender, Institutions and Development data base (GID) www.oecd.org/dev/institutions/GIDdatabase of the OECD Development Centre. The GID constitutes an important improvement upon existing sources, notably because it incorporates institutional variables related to norms, laws, codes of conduct, customs, and family traditions that heretofore have been neglected in quantitative comparative studies. To illustrate the utility of the GID, the paper models the determinants of women’s participation in the labour force – an indicator of gender equality as well as an important ingredient for long-run economic growth – and demonstrates that the economic role of women hinges critically on variations in discriminatory social institutions.
OECD Development Centre Working Paper No. 247
DEV/DOC(2006)01
© OECD 2006
7
I. INTRODUCTION
The promotion of gender equality and empowerment of women is among the eight Millennium Development Goals to which the international community has committed itself. While significant improvements towards reaching this goal have already been achieved – e.g. an impressive increase in girl’s school enrolment world-wide over the last five to ten years – the situation of women remains largely unsatisfactory. Generally speaking, in the developing world, women are still largely denied access to the formal labour market, do not have equal opportunities to qualify for higher employment and are consequently less likely to occupy administrative or managerial positions, and lag significantly behind in terms of career development and earnings increases (consult, for example, Tables 25 to 30 in UNDP, 2005).
Gender equality is a development goal in its own right and – as research has shown – has instrumental value for the long-term growth prospects of countries (see, for example, Klasen, 2002; World Bank, 2001). The success with which developing countries integrate more skilled female workers into the labour force determines in part their level of competitiveness in the global economy. To better understand the main obstacles constraining the economic role of women is important for the design of gender policies that promote gender equality for its intrinsic and instrumental values.
There are two conflicting views linking women’s status and the level of development. The first argues that rising incomes (or economic development more generally) will close the gender differential; Forsythe et al. (2000) call this the modernisation-neoclassical approach. On this view, increasing competition will drive out discriminatory practices, at least in the medium to long run (Becker, 1985; O’Neill and Polachek, 1993). Opposed to this is the view that enduring patriarchal institutions will prevent gender equality even in the face of economic advancement (Marchand and Parpart, 1995, Parpart, 1993). By constraining women’s participation in the labour force and/or access to resources, gender inequality is cemented and will not easily be changed in the course of development (Morrisson and Jütting, 2005). The example of Saudi Arabia – a country with quite high average income but very poor gender equality – supports this interpretation.
Whether discrimination will be eroded or endure as the economy grows is of critical importance to policy makers, aid agencies and social movements as they choose strategies to address gender inequality: should they promote growth or attack the proximate causes of inequality? For analysts, a necessary first step is to identify and analyse empirical regularities linking levels of development, the degree of discrimination and other factors explaining the economic well-being of women across societies. As a contribution to this effort, this paper

Measuring Gender (In)Equality: Introducing the Gender, Institutions and Development Data Base (GID)
DEV/DOC(2006)01
© OECD 2006 8
introduces the Gender, Institutions and Development (GID) data base, a new analytical tool that systematically documents the “endless variety and monotonous similarity” (as feminist theorist Gayle Rubin famously wrote in 1975) of gender discrimination in 162 countries. The GID has been compiled from a variety of sources (not all of them well-known to economists) and is an important extension to existing compilations. Commonly-used data sets produced by the World Bank (e.g. GenderStats) or various UN agencies (e.g. UNIFEM, UNDP) miss an important dimension of determinants of gender inequality by neglecting the institutional setting that constrains the economic role of women in many countries. This paper demonstrates that this broader framework, including social institutions, adds critically to our understanding of the role of women in developing countries and that conversely, ignoring traditions, customs and explicit or implicit laws limits the usefulness of policy actions aimed at improving the situation of women.
The structure of the paper is as follows: the following section discusses in detail the construction of the new data base and provides a conceptual framework, while section III presents some highlights of the GID data, including an overview of variations in gender inequality across regions and income levels. Section IV uses bivariate and multivariate statistical analysis to analyse the GID data on social institutions and women’s participation in the labour force. Section V concludes.
OECD Development Centre Working Paper No. 247
DEV/DOC(2006)01
© OECD 2006
9
II. CONSTRUCTION OF THE NEW DATA BASE
II.1 Motivation and Aim of the GID Data Base
The Gender, Institutions and Development (GID) data base adds to and improves on existing compilations (e.g. World Bank GenderStats, UNDP GDI and GEM gender statistics). Construction of the GID data base follows a clear conceptual framework that differentiates between outcome and input variables: the former measure the extent to which women suffer discrimination (e.g. women’s participation in the labour force) and the latter encompass underlying reasons for this discrimination. Moreover, the GID, unlike previous data bases, includes information on social institutions that help determine the status of women. Finally, the process of compilation and the potential uses of the GID data base are open and transparent, unlike other data bases that cover sensitive social institutions (e.g. CPIA Indicators of the World Bank1), to which access is more restricted. Researchers can use the variables in the GID data base to analyse various dimensions of gender inequality or create indices based on a selection of the variables (as Jütting and Morrisson, 2005, did with a preliminary version of the data base).
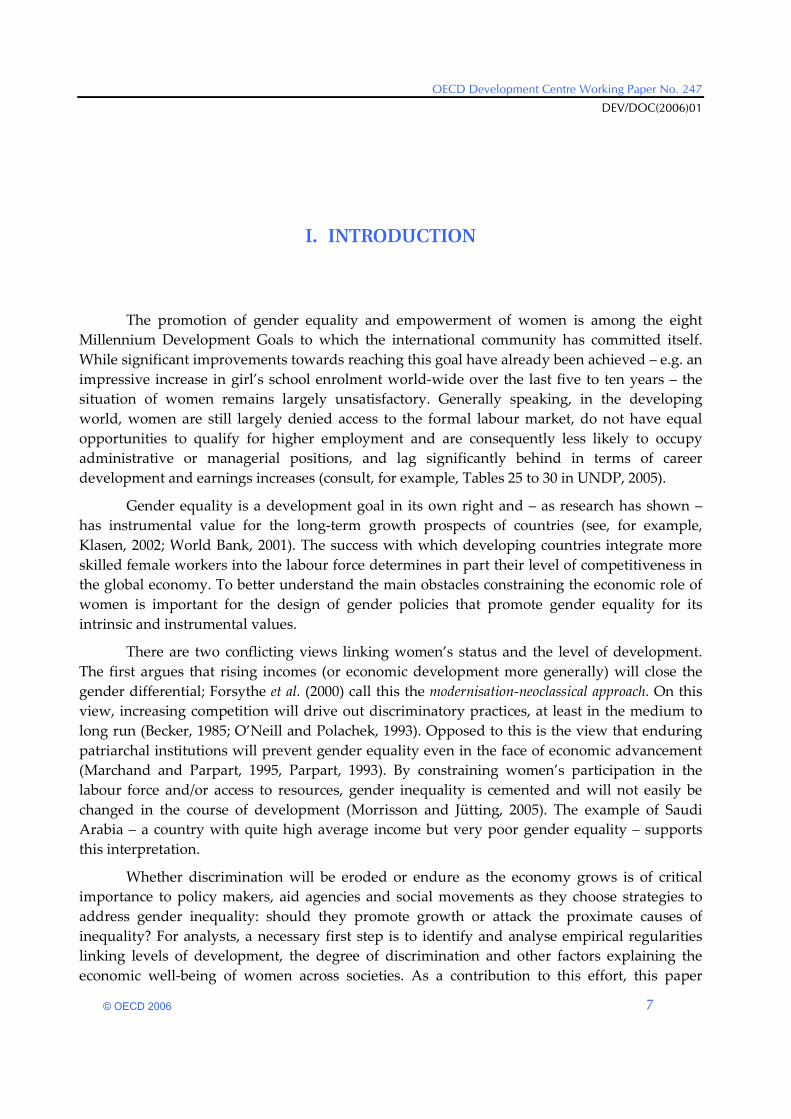
Consider a simple framework of gender discrimination, illustrated in Figure 1. We hypothesise that the economic role of women (Block D) depends on various social institutions (Block A), women’s access to resources (Block B) and the overall income level of a country (Block C). Interactions among these four blocks are illustrated by the dotted and solid arrows, which signify the direction and in some sense the temporal relationship among variables; e.g. family traditions related to marriage instantaneously influence the economic role of women while an increased presence of women in paid professions will only gradually have an impact on social institutions (this is indicated by a dotted, rather than a solid line).
Our main focus is on the solid circuit, which describes four channels through which social institutions influence the economic role of women. i) Social institutions directly affect women’s economic roles (this is the link from A to D in Figure 1): a higher degree of civil liberties, for example, allows women to participate in the labour market. Social institutions also have indirect effects on how fully a woman can participate in the economic life of a country; we distinguish two such indirect channels. ii) Thus, social institutions can have an effect by influencing women’s access to resources, as greater physical integrity, for example, improves
1. The “Country Policy and Institutional Investment” (CPIA) mechanisms is used by the World Bank to
annually rate government policy and institutional performance of borrowing countries. Although the World Bank has started to disclose countries’ relative ratings (i.e. their score relative to others), nominal ratings are still kept secret.
Measuring Gender (In)Equality: Introducing the Gender, Institutions and Development Data Base (GID)
DEV/DOC(2006)01
© OECD 2006 10
women’s health and consequently their chances in the labour market. This is the link from A to B to D. iii) Social institutions can also directly affect a country’s economic development (A to C), with positive repercussions on women’s labour force participation (C to D): e.g. ownership rights of women can foster entrepreneurial behaviour that promotes growth. iv) Finally, social institutions can also affect women’s economic role more indirectly via economic development (and thus the economic role of women) by improving access to resources such as health and education (A to B to C to D, or A to C to B to D): education, for example, fosters a country’s human-capital accumulation, which in turn increases economic development (B to C), but girls’ access to education is conditioned in the first instance by social institutions.
Figure 1. Indicators Affecting the Economic Role of Women
Economic Development (C)GDP per capita
Social Institutions (A)Family CodePhysical IntegrityCivil LibertiesOwnership Rights
Economic Role of Women (D)Women among paid workersWomen among technical workersWomen among administrators and managers
Access to Resources (B)HealthEducation
Input Variables Output Variables
Source: Own illustration.
II.2 Data Sources and Selection
For variables measuring access to resources, economic development and the economic role of women, we rely on well-known data bases provided by the World Bank, the International Labour Organisation and the World Health Organisation. For aggregate indices, we report two well-known UNDP indicators, the Gender Empowerment Measure (GEM) and the Gender Development Index (GDI). Measurement of the social institutions, however, poses
OECD Development Centre Working Paper No. 247
DEV/DOC(2006)01
© OECD 2006
11
the biggest challenge as they are not well documented or systematically reported by international organisations. Nevertheless, in order to construct a sensible and comprehensive data base on social institutions, we collected data and information from a variety of sources, including Amnesty International, BRIDGE (a research and information service of the Institute for Development Studies specialised in gender and development), WIDNET (the Women in Development Network), AFROL (a news agency that concentrates on Africa) and a study commissioned by the French Parliament (Lang, 1998). Whenever possible, we compare and contrast observations from one source with other sources to cross-check the validity and reliability of information. The information from AFROL proved to be especially valuable as it concerns sensitive issues such as genital mutilation, questions of parental authority as well as women’s access to property, inheritance, and freedom of movement and dress. Gender profiles of various donor organisations (e.g. the Canadian International Development Agency) were also drawn upon to complete the data base.
All world regions and levels of average income are well-represented among the economies in the final database. There are 162 economies in the data base, though the number for which measures of social institutions are available is always lower. Thus information on female genital mutilation is available for 123 economies; information on the male right of repudiation is available for 117. (More details about what these measures mean is provided below). With a few exceptions, economies with fewer than 1 million inhabitants are not included.
Given the GID’s focus on gender-related differences rather than the absolute values of a particular indicator, many variables are measured in terms of ratios. Thus the GID includes the female/male ratio of school enrolment rather than the percentage of female students enrolled. Measures of qualitative variables, including most of the social-institutions variables, vary as a rule between 0 (better) to 1 (worse).
II.2.1 Women’s Economic Participation
Our conceptual framework requires some kind of outcome variable that measures women’s participation in the economy. While there are potentially many candidates, we have opted to focus on the degree to which women in a given country participate in paid labour outside of the home. The selection of this variable embodies an implicit normative assumption: that women in a country are “better off” the higher the rate of female participation in paid work. This normative interpretation is consistent with what we have referred to as the “modernisation” theory of gender discrimination, the most eloquent expression of which was enunciated by Nobel laureate Sir W. Arthur Lewis in 1955:
In the process [of economic growth] woman gains freedom from drudgery, is emancipated from the seclusion of the household, and gains at least the chance to be a full human being, exercising her mind and her talents in the same way as men. It is open to men to debate whether economic progress is good for men or not, but for women to debate the desirability of economic growth is to debate whether women should have the chance to cease to be beasts of burden and to join the human race.
Measuring Gender (In)Equality: Introducing the Gender, Institutions and Development Data Base (GID)
DEV/DOC(2006)01
© OECD 2006 12
Furthermore, women’s labour force participation was the cornerstone of the pioneering study of women and development, Esther Boserup’s Woman’s Role in Economic Development (1970). Naturally, this measure elides consideration of discrimination against women within labour markets, sexual harassment in the workplace, or other related issues: we do not imply that just because women enter the labour market, they have achieved economic equality with men.
What is the right way to measure women’s participation in the labour market? A commonly-used measure of the degree of women’s participation in the economy is the “percentage of women among the active population”; this can nevertheless be misleading as it aggregates employment situations that might differ considerably across economies, regions or ethnic groups. In most of Africa and South Asia, for example, economically active women are predominantly family workers. Although many women consequently do not work outside of the household or only work part-time, the proxy considers them as belonging to an economy’s economically active population. This proxy similarly fails to account for still larger differences in women’s decision-making autonomy. Clearly, there is a big difference between a woman who owns the crop that she sells on the market and one who works instead under the authority of her husband. The former will generate an individual income that is at her disposal, while in the latter case the income earner is her husband. The importance of an individual income to the economic role of women is illustrated in a recent study by Kabeer and Mahmud (2004). The authors report findings of interviews with female workers in the garment manufacturing in Bangladesh who stress that having an independent income increased their self reliance, reduced their dependence on household income and helped them develop greater decision-making autonomy. The “percentage of women among the active population” does not draw this distinction.
Conscious of these problems, we propose a general measure of the degree of economic activity of women, supplemented by three more specific indicators. We use the variable recorded by the International Labour Organisation and the United Nations Statistical Division, namely, “the female share of the paid non-agricultural labour force.” This variable captures the prevalence of salaried women with personal incomes that may enhance their financial independence. The supplemental specific indicators cover “the percentage of women in professional and technical positions” and “the percentage of women among administrative workers and managers”. Finally, we also include an indicator measuring the difference between female and male wages. For conciseness, we will sometimes refer to “women’s participation” or “women’s economic participation” to refer to the percentage of women in the non-agricultural paid labour force.
II.2.2 Institutional Variables
Institutional variables are at the core of the GID data base’s value-added. According to our conceptual framework, institutional variables have direct and indirect impacts on the economic role of women. In order to give a broad overview of important traditions, laws, cultural norms, and religious practices affecting the economic status of women, we distinguish
OECD Development Centre Working Paper No. 247
DEV/DOC(2006)01
© OECD 2006
13
among the following social institutions: i) the prevailing family code; ii) women’s physical integrity; iii) women’s civil liberties; and iv) women’s ownership rights.
Family Code
The family code is the complex of formal and informal laws, customs, and traditions that constrain women’s economic participation. A social institution of special relevance is that of early marriage: where very young women are married, parents (fathers) and not young women themselves have the power to make important decisions about marriage and household formation; moreover, within households, the substantially older husbands have disproportionate authority and decision-making power. The percentage of women married before the age of 20 and the mean age of marriage are given by the United Nations (2004). Related variables include whether a marriage can be unilaterally terminated by a husband’s repudiation of his wife (who has little or no recourse), and whether parental authority is granted equally to men and women. Information on repudiation and authority is documented by Lang (1998).
The value of the repudiation variable for a society ranges between 0 and 1, depending on whether repudiation is a legally binding practice and the proportional of the population that is affected (i.e. the proportion of a population subject to Islamic law or sharia). Recent modifications in the legal code of some societies have not been taken into consideration for reasons of data comparability: first, because other variables date from years before the family-code reforms, and second, as we are interested in the long-term effects of discriminatory social institutions, the status quo ante is of special importance. Most notably, we still rate Algeria and Morocco with a value of 1 (i.e. Islamic law is legally binding for the entire population) although these countries have abandoned the application of the sharia in 2005.
Parental authority is coded 1 for a society where fathers, as a rule, have complete control over their offspring and 0 where they evenly share authority with their children’s mothers. Full authority of the father means that only he can seek passports for his children or take educational decisions on their behalf, and that following a divorce he will always be given custody (except in some cases for infants and very young children). This variable can take on values between 0 and 1 depending on the extent of pro-patriarchal discrimination.
The family code also embraces inheritance practices, coded between 0 and 1 depending on the degree to which regulation is in favour of male heirs: a value of 0 indicates that bequests are equally shared between male and female offspring. Finally, we consider the prevalence of polygamy, to which values were assigned on a case-by-case basis in the absence of any comprehensive overviews. Special attention was paid to the extent of legal or customary acceptance of polygamy and to the proportion of populations subject to such law or custom. Our polygamy variable is therefore not an estimate of the percentage of polygamous households, but rather an indicator of the acceptance of polygamy within a society.

Measuring Gender (In)Equality: Introducing the Gender, Institutions and Development Data Base (GID)
DEV/DOC(2006)01
© OECD 2006 14
Physical Integrity
Physical integrity is captured by two variables: the extent of female genital mutilation and the existence of legislation punishing acts of violence against women. Although our principal sources for female genital mutilation (e.g. Amnesty International, WHO, UNDP) are prone to estimation errors, they are generally not biased by differences in definitions across national authorities. In the case of large variations between the data, we tried to consider the most reliable source (e.g. according to date of publication, number of references, and potential bias of institution2).
Despite much interest in the prevalence of violence against women by multilateral institutions (e.g. WHO, UNIFEM) and NGOs alike, there is unfortunately no comprehensive and reliable source for this indicator. We consequently focused our attention on how three distinct areas of violence against women are penalised through national legislation and calculated the average value of our coded indices. In the case of violence against women, we quantify information provided by UNIFEM (2003) on the existence of laws against: i) domestic violence; ii) sexual assault or rape; and iii) sexual harassment as follows: 0 if specific legislation is in place, 0.25 if legislation is in place but of general nature, 0.5 if specific legislation is being planned, drafted or reviewed, and 0.75 if this planned legislation is of general nature; 1 captures the absence of any legislation concerning violence against women. Thus Ecuador’s value of 0.17 for legislation governing violence against women, for example, is calculated as follows: the country has specific legislation in place against domestic violence (1/3*0) as well as general legislation against sexual assault or rape (1/3*0.25) and sexual harassment (1/3*0.25); the average of these three sub-indices is (1/3)*0 + (1/3)*0.25 + (1/3)*0.25 = 0.17.
Civil Liberties
We group four variables under civil liberties: the percentage of members of parliament who are female; the percentage of government ministers who are female; women’s freedom to leave the house; the requirement that women wear a veil in public. Information on the female proportion of parliaments and cabinets is taken from the World Bank’s Gender Statistics and the UNDP’s (2005) Human Development Report. Whether women are free to leave the house or are required to wear a veil in public are mostly coded based on Lang (1998). For freedom of movement, our indicators capture various degrees of oppression ranging from 0 = no restriction to 1 = total dependence on male authority. In the case of Saudi Arabia, for example, a value of 0.7 for freedom of movement signifies that women are allowed to leave the house without a male member of the household, but nevertheless suffer other restrictions on personal freedom (e.g. women cannot obtain a driver’s license). Regarding the veil, either women have an obligation to wear it or they do not and thus this variable is coded as 0 or 1. Some of these restrictions may only apply to certain minority groups in the population, in which case the
2. Non-governmental organisations that specifically fight for the abolishment of female genital mutilation
may sometimes over-report its prevalence as an advocacy strategy.
OECD Development Centre Working Paper No. 247
DEV/DOC(2006)01
© OECD 2006
15
value of the indicator is adjusted depending on the relative size of the group subject to these social institutions.
Ownership Rights
Three variables are used to indicate the quality of women’s ownership rights: women’s access to bank loans, their right to acquire and own land, and their right to own property other than land. Variations between 0 and 1 indicate the extent of restrictions or the size of the female population for which the restrictions are relevant; as before, 1 signifies complete discrimination against women. Some restrictions may only be relevant for a woman in a specific stage of her life. In Chinese Taipei, for example, women generally have free access to bank loans and property. However, certain restrictions apply after a woman gets married as it is usually the husband who takes decisions related to property and asset ownership. Sources for our indicators include Lang (1998), BRIDGE, the Asian Development Bank, the Canadian International Development Agency, and AFROL.
II.2.3 Variables Measuring Command Over and Access to Resources
In economies where women have better access to education, health care, or birth control, women will presumably find more and better jobs; their participation in the economy is greater. We consider the following measures of access to resources in the data set:
Education
The GID includes four indicators of female access to education: the female-to-male enrolment ratio in primary, secondary and tertiary education as well as the female-to-male literacy ratio. (The literacy ratio can be considered as an outcome variable of differences in access to education.) For each of these four variables, a value of 1 indicates female-male parity.
Health
Various indicators are included to present disparities in the access to health care. The life expectancy ratio primarily measures differences in the access to health services over the entire lifetime of an individual. In the 15 most developed countries, women typically outlive their male counterparts: in the presence of reasonably equal access to health care, women enjoy longevity advantages that are biological in nature. A life-expectancy ratio of 1.08 (women live on average 8 per cent longer than men), the average of all OECD countries, is consequently taken as a benchmark figure (UNDP, 2002). Discrimination in access to health care can also be illustrated by cross-country differences in sex ratios (the number of women per men) as well as by comparing, within a country, the sex ratio at birth to the sex ratio at the age of 15.
The sex ratio indicators are particularly relevant to the issue of “missing women” (Sen, 1992): where girls are less valued than boys, fewer girls survive to adulthood (because of sex-selective abortions, female infanticide, or discrimination against girls in intra-household

Measuring Gender (In)Equality: Introducing the Gender, Institutions and Development Data Base (GID)
DEV/DOC(2006)01
© OECD 2006 16
allocation of food and medicines) and the sex ratios are correspondingly lower. Maternal mortality, meanwhile, is a more basic measure of access to health care per se.
Access to Birth Control
Contraceptive prevalence (i.e. the percentage of married women currently using contraception) and the total fertility rate (i.e. average number of births per woman) are included in the GID, in part because they proxy for important obstacles for women to enter the labour market. Empirical evidence suggests that it is more complicated for mothers to become a wage earner if they are also expected to be the primary care-giver for their children. Where contraceptives are less widely available, and conversely where women on average bear more children, these obstacles to women’s economic participation are correspondingly more salient. Of course there are exceptions to this general rule. Although not beneficial for a professional career, children are not necessarily impediments either. In many African countries, women with several children still manage to run their own little retail business in the streets; a practice which is socially accepted by both the community and the family. As a general rule, however, the use of family planning (as measured by access to birth control and total fertility rate) can be expected to have a positive impact on the economic participation of women.
II.2.4 Economic Development
One theory of gender discrimination maintains that the economic circumstances of women will improve with higher levels of economic development. In terms of the framework sketched out in Figure 1, this could occur because women gain access to greater resources as per capita income climbs (block C to block B), and improved access to resources opens more possibilities for women to participate in the paid labour force (block B to block D). Alternatively, with the creation of a more formalised, rules-based system of governance, traditional social institutions might lose importance (block C to block A), which might ease institutional constraints upon women’s decision-making (block A to block D). As shorthand indicators of the level of economic development (and its rate of change), the GID includes GDP per capita and GDP per capita growth for the years for which values of other variables are available (from the World Bank’s World Development Indicators 2005).
II.2.5 Aggregate Indices
Aggregate indices of gender discrimination such as the UNDP’s (2005) Gender-related Development Index (GDI) and the Gender Empowerment Measure (GEM) have already received considerable attention, and are included in the GID data base. The GDI is an unweighted average of three types of gender differences: life expectancy at birth, gross school enrolment and literacy rates, and earned income. The GEM is an unweighted average of variables reflecting women’s position in society: the percentage of women in parliament, the male/female ratio among administrators, managers and professional and technical workers, and the female/male per capita income ratio, which is calculated from female and male shares of earned income.
OECD Development Centre Working Paper No. 247
DEV/DOC(2006)01
© OECD 2006
17
III. THE GID DATA BASE – SOME DESCRIPTIVE EVIDENCE
III.1 Regional Variation of Social Institutions
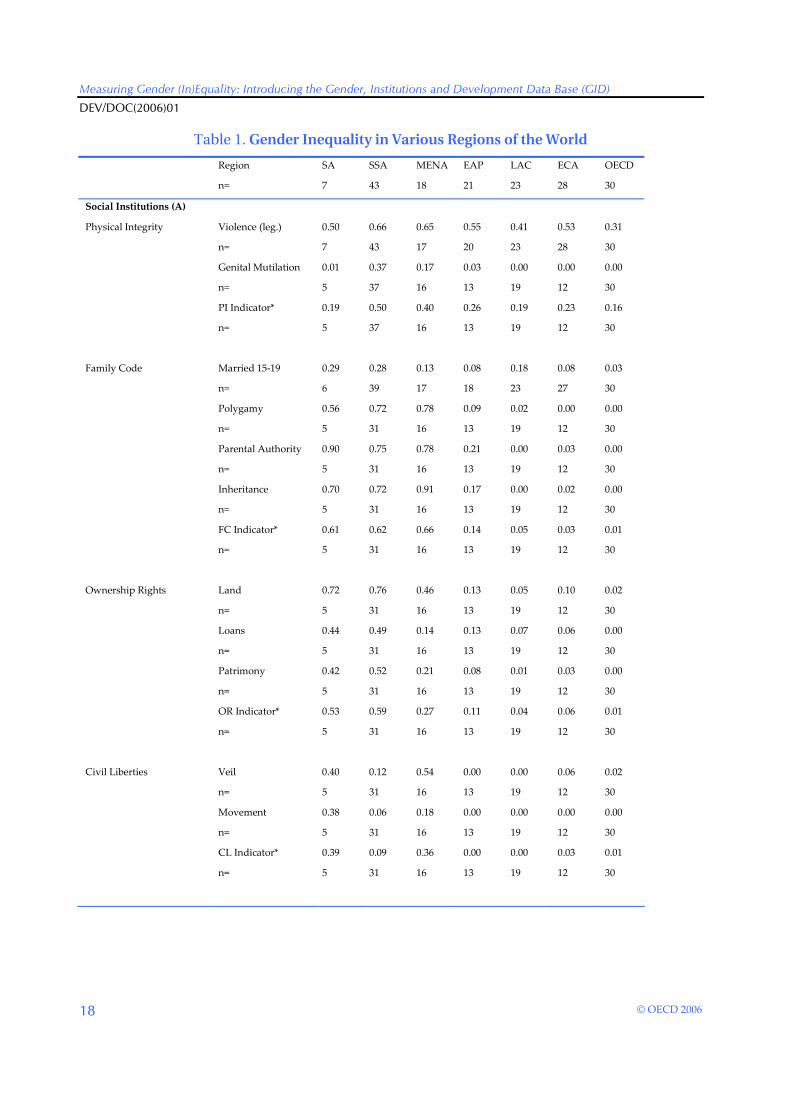
Table 1 provides a regional overview of gender inequality based on items in the GID data base. Table 1 illustrates that, compared to other regions of the world, women in sub-Saharan Africa (SSA), South Asia (SA), and Middle East/North Africa (MENA) marry at an earlier age, often younger than twenty. They generally enjoy fewer rights than their husbands and suffer from unfavourable regulations and traditions regarding inheritance and parental authority. Furthermore, they sometimes find themselves as only one female partner among several wives in countries where polygamy is practiced and accepted by society. Women often have no or only restricted access to credit, land and property and their civil liberties are abridged.
At the same time, women in these three regions have less access to human-capital-producing resources such as health care and education, indicated by the comparatively lower female/male ratios of school enrolment, literacy rates, and life expectancy. The female-to-male life expectancy ratio in these three regions falls below the 1.08 OECD benchmark. As indicated by the comparatively low contraceptive prevalence and high fertility rates, women finally have less access to birth control in these regions; accordingly, women’s participation in the labour market is lower. The values for women among paid workers and the ratios of females in professional and administrative positions are significantly lower than in East Asia and the Pacific (EAP), Latin America and the Caribbean (LAC), Europe and Central Asia (ECA) and the OECD countries.
Measuring Gender (In)Equality: Introducing the Gender, Institutions and Development Data Base (GID)
DEV/DOC(2006)01
© OECD 2006 18
Table 1. Gender Inequality in Various Regions of the World
Region SA SSA MENA EAP LAC ECA OECD
n= 7 43 18 21 23 28 30
Social Institutions (A)
Physical Integrity Violence (leg.) 0.50 0.66 0.65 0.55 0.41 0.53 0.31
n= 7 43 17 20 23 28 30
Genital Mutilation 0.01 0.37 0.17 0.03 0.00 0.00 0.00
n= 5 37 16 13 19 12 30
PI Indicator* 0.19 0.50 0.40 0.26 0.19 0.23 0.16
n= 5 37 16 13 19 12 30
Family Code Married 15-19 0.29 0.28 0.13 0.08 0.18 0.08 0.03
n= 6 39 17 18 23 27 30
Polygamy 0.56 0.72 0.78 0.09 0.02 0.00 0.00
n= 5 31 16 13 19 12 30
Parental Authority 0.90 0.75 0.78 0.21 0.00 0.03 0.00
n= 5 31 16 13 19 12 30
Inheritance 0.70 0.72 0.91 0.17 0.00 0.02 0.00
n= 5 31 16 13 19 12 30
FC Indicator* 0.61 0.62 0.66 0.14 0.05 0.03 0.01
n= 5 31 16 13 19 12 30
Ownership Rights Land 0.72 0.76 0.46 0.13 0.05 0.10 0.02
n= 5 31 16 13 19 12 30
Loans 0.44 0.49 0.14 0.13 0.07 0.06 0.00
n= 5 31 16 13 19 12 30
Patrimony 0.42 0.52 0.21 0.08 0.01 0.03 0.00
n= 5 31 16 13 19 12 30
OR Indicator* 0.53 0.59 0.27 0.11 0.04 0.06 0.01
n= 5 31 16 13 19 12 30
Civil Liberties Veil 0.40 0.12 0.54 0.00 0.00 0.06 0.02
n= 5 31 16 13 19 12 30
Movement 0.38 0.06 0.18 0.00 0.00 0.00 0.00
n= 5 31 16 13 19 12 30
CL Indicator* 0.39 0.09 0.36 0.00 0.00 0.03 0.01
n= 5 31 16 13 19 12 30

OECD Development Centre Working Paper No. 247
DEV/DOC(2006)01
© OECD 2006
19
Table 1 (contd.)
Access to Resources (B)
Education Literacy 0.58 0.71 0.78 0.91 0.98 0.97 0.98
n= 7 43 17 17 23 26 14
Enrolment (prim) 0.86 0.89 0.95 0.98 1.00 0.99 1.00
n= 7 43 18 20 23 28 30
Enrolment (sec) 0.79 0.80 0.94 0.99 1.08 0.99 1.01
n= 7 43 18 20 23 28 30
Enrolment (ter) 0.52 0.52 1.12 1.02 1.31 1.19 1.19
n= 7 43 18 20 23 28 30
Health Care Life Expectancy 1.03 1.04 1.05 1.06 1.08 1.12 1.08
n= 7 43 18 20 23 28 30
Birth Control Contraceptive Pr. 36.94 21.31 46.67 58.59 59.86 58.77 72.35
n= 7 40 17 19 20 25 26
Fertility Rate 3.62 5.18 3.33 2.68 2.77 1.61 1.62
n= 7 43 18 20 23 28 30
Level of Development (C)
Income Level GDP pc 2,572 2,883 9,554 12,367 7,474 8665 27934
n= 5 40 14 17 22 26 30
Women’s Economic Role
(D)
Labour Force Participation
Women among
paid workers 19.32 27.60 20.31 41.83 41.27 46.82 45.43
n= 7 43 18 20 23 27 30
Administrative
Workers 6.60 13.74 10.83 21.77 32.22 31.33 26.46
n= 5 27 12 13 18 15 28
Technical and
Profess. Workers 30.25 29.88 31.25 45.00 47.33 59.13 48.82
n= 4 17 12 13 18 15 28
Note: * Indicators are a calculated for each sub-group (i.e. physical integrity=PI, family code=CI, ownership rights=OR, civil liberties=CL) taking the average of the single components where available.
Source: Own compilation. Data: World Bank, ILO, WHO, UNDP.
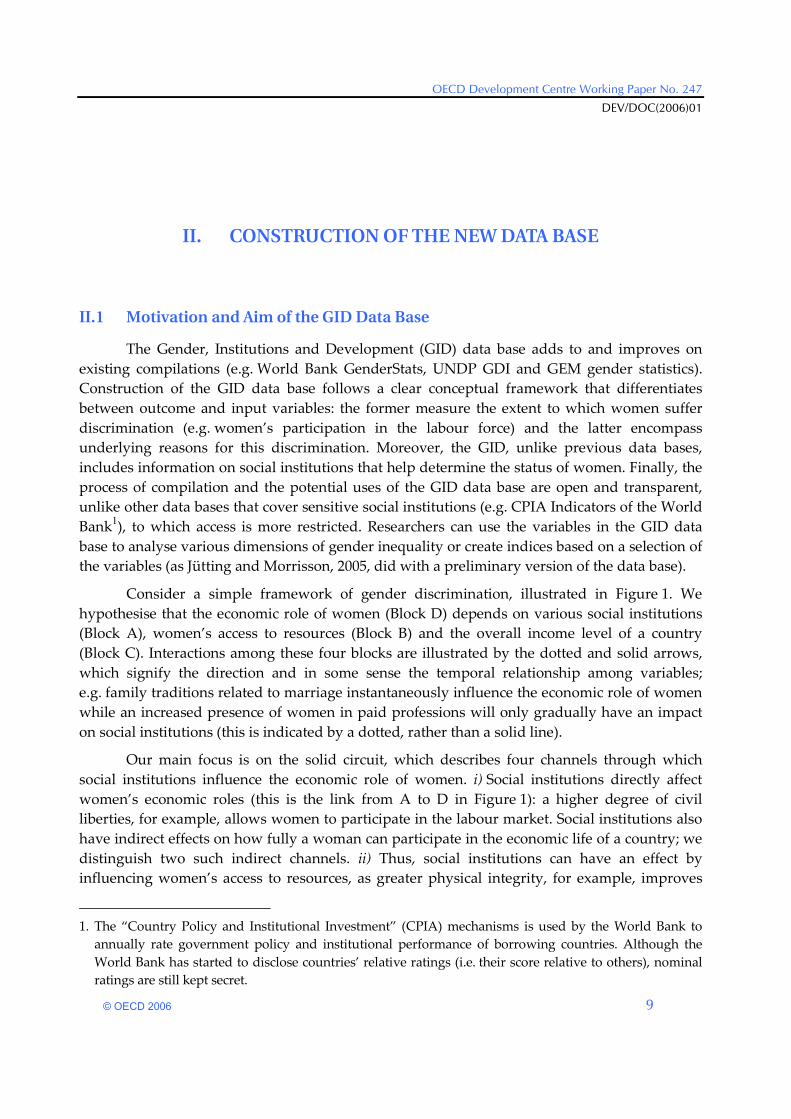
Figure 2 illustrates the striking difference between South Asia, sub-Saharan Africa, and Middle East/North Africa on the one hand and East Asia and the Pacific, Latin America and the Caribbean, Europe and Central Asia, and OECD countries on the other using the average values

Measuring Gender (In)Equality: Introducing the Gender, Institutions and Development Data Base (GID)
DEV/DOC(2006)01
© OECD 2006 20
for each of the four sub-indices of the social institutions indicators3. Recall that our indices range from zero (no discrimination) to one (high discrimination), so higher bars in Figure 2 indicate more discrimination. Although the values for EAP, LAC, ECA and OECD countries are generally low, this is not to say that women in these regions do not face discrimination. In some Latin American countries, for example, women can find access to land and capital difficult; however, they are not systematically excluded as is the case in countries with high discrimination values. Except for rare exceptions (e.g. among immigrant populations) women in LAC also do not suffer from genital mutilation, but violence against them is reported frequently. At the same time, not all countries in SSA, SA, or the MENA regions are marked by the presence of discriminatory social institutions: Mauritius, Israel, and Sri Lanka can be cited as notable exceptions.
Figure 2. Regional Indices of Discrimination against Women
0.00
0.05
0.10
0.15
0.20
0.25
0.30
0.35
0.40
0.45
0.50
SA SSA MENA EAP LAC ECA OECD
Physical Integrity Family Code Ownership Rigths Civil Liberties
Source: Own illustration. Scale: 0=no discrimination; 1=maximum level of discrimination.
III.2 Variation of Social Institutions According to Income
Following the logic of the “modernisation theory” of gender discrimination (in which gender discrimination will gradually vanish as countries develop economically), perhaps the regional differences in gender discrimination noted above are explained by the level of
3. The diagram compares the average values of physical integrity, family code, ownership rights, and
civil liberties. We will refer to the sum of the four sub-indices as the “social institutions indicator”.
OECD Development Centre Working Paper No. 247
DEV/DOC(2006)01
© OECD 2006
21
economic development in each region rather than institutional differences per se. That is, the presence of discriminatory social institutions in SSA, SA, and MENA could be explained by the over-representation of very poor countries in these regions.
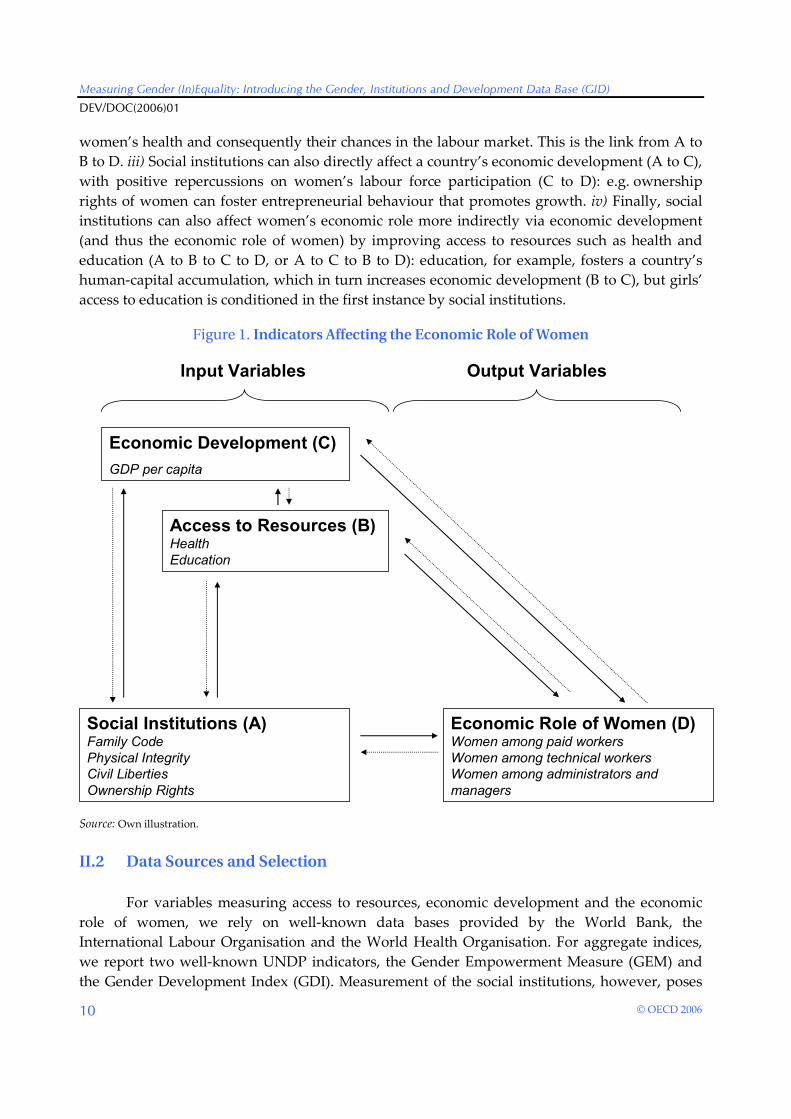
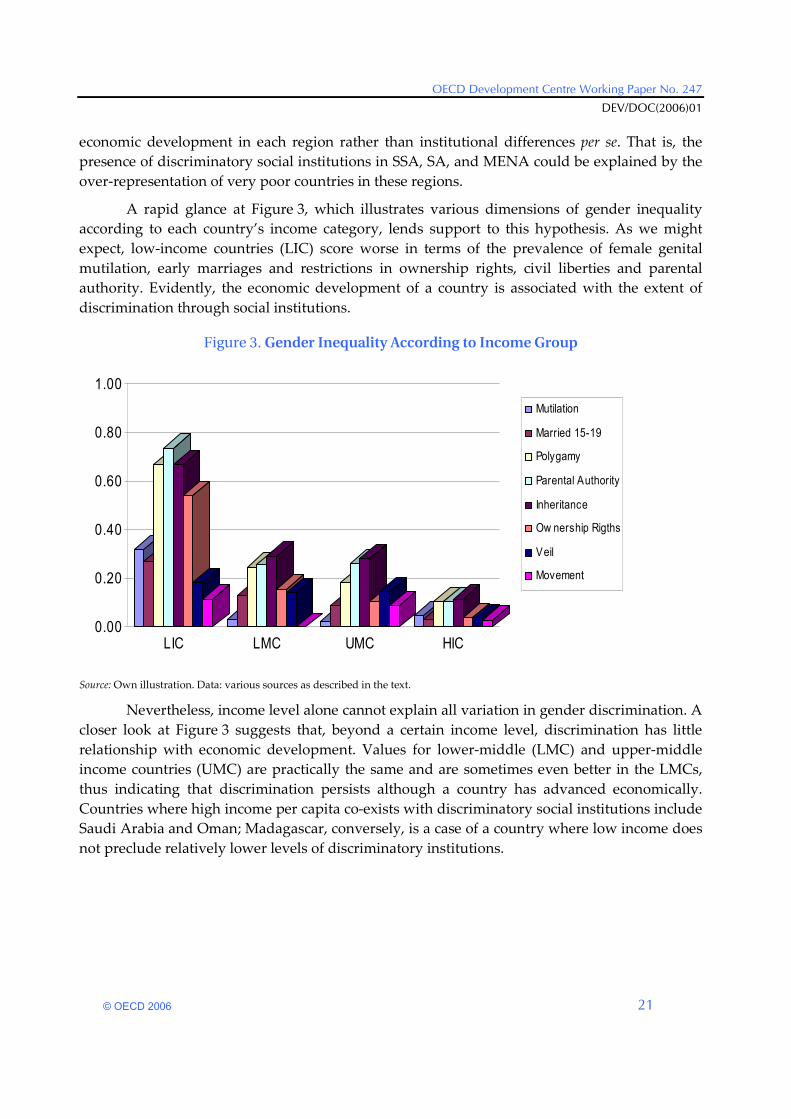
A rapid glance at Figure 3, which illustrates various dimensions of gender inequality according to each country’s income category, lends support to this hypothesis. As we might expect, low-income countries (LIC) score worse in terms of the prevalence of female genital mutilation, early marriages and restrictions in ownership rights, civil liberties and parental authority. Evidently, the economic development of a country is associated with the extent of discrimination through social institutions.
Figure 3. Gender Inequality According to Income Group
0.00
0.20
0.40
0.60
0.80
1.00
LIC LMC UMC HIC
Mutilation
Married 15-19
Polygamy
Parental Authority
Inheritance
Ow nership Rigths
Veil
Movement
Source: Own illustration. Data: various sources as described in the text.
Nevertheless, income level alone cannot explain all variation in gender discrimination. A closer look at Figure 3 suggests that, beyond a certain income level, discrimination has little relationship with economic development. Values for lower-middle (LMC) and upper-middle income countries (UMC) are practically the same and are sometimes even better in the LMCs, thus indicating that discrimination persists although a country has advanced economically. Countries where high income per capita co-exists with discriminatory social institutions include Saudi Arabia and Oman; Madagascar, conversely, is a case of a country where low income does not preclude relatively lower levels of discriminatory institutions.

Measuring Gender (In)Equality: Introducing the Gender, Institutions and Development Data Base (GID)
DEV/DOC(2006)01
© OECD 2006 22
IV. RELEVANCE OF SOCIAL INSTITUTIONS TO EXPLAIN THE ECONOMIC ROLE OF WOMEN
The regional and income-based summary statistics presented in Section III suggest that social institutions are substantially more discriminatory against women in some parts of the world (and that those discriminatory institutions are accompanied by unequal access to resources and economic participation); the summary statistics also showed a strong association between discriminatory institutions and low incomes (though there is no clear evidence of a monotonic inverse relationship between income and discriminatory institutions across the whole sample). The question posed in this section is whether discriminatory social institutions can indeed explain cross-country variations in the economic participation of women.
IV.1 Direct and Indirect Channels of Social Institutions
As outlined in our theoretical framework (Figure 1), we distinguish two main channels in which discriminating social institutions can have a detrimental effect on the economic role of women: by directly preventing women from participating in the paid labour market (A to D), and by restricting women’s access to resources and thereby indirectly lowering their labour force participation (A to B to D). The following section presents some initial evidence regarding these two channels.
IV.1.1 Direct Impact Channels of Social Institutions
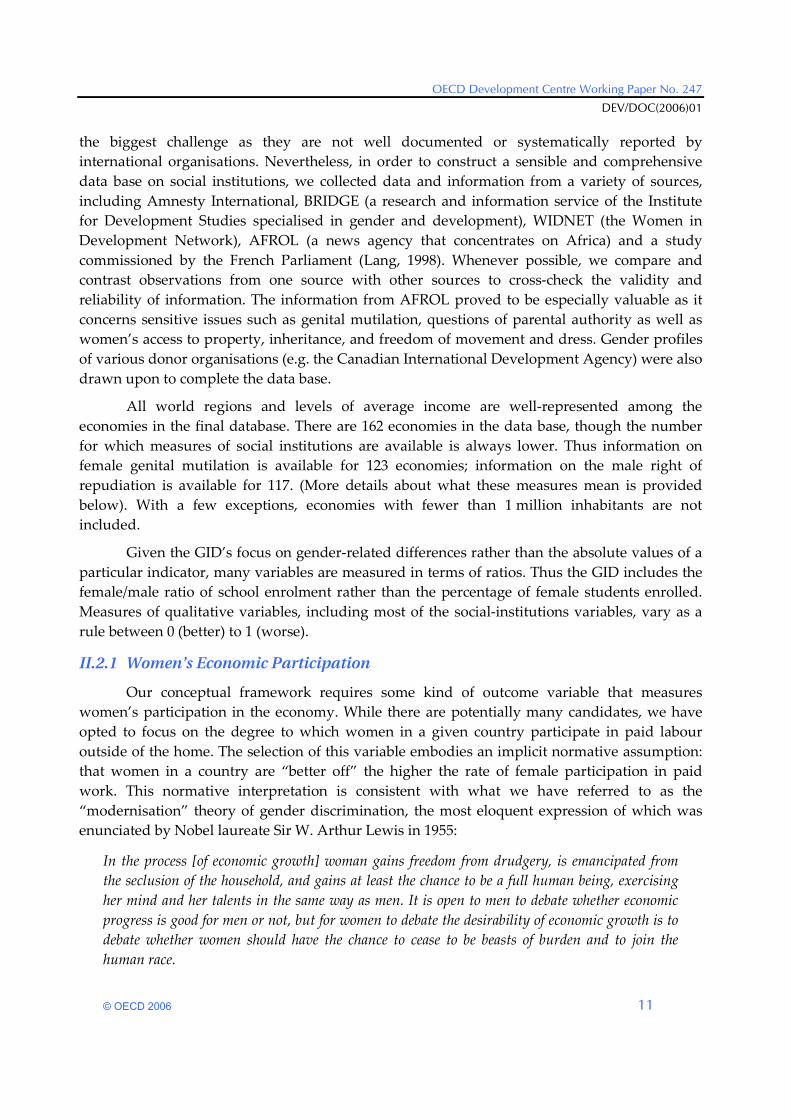
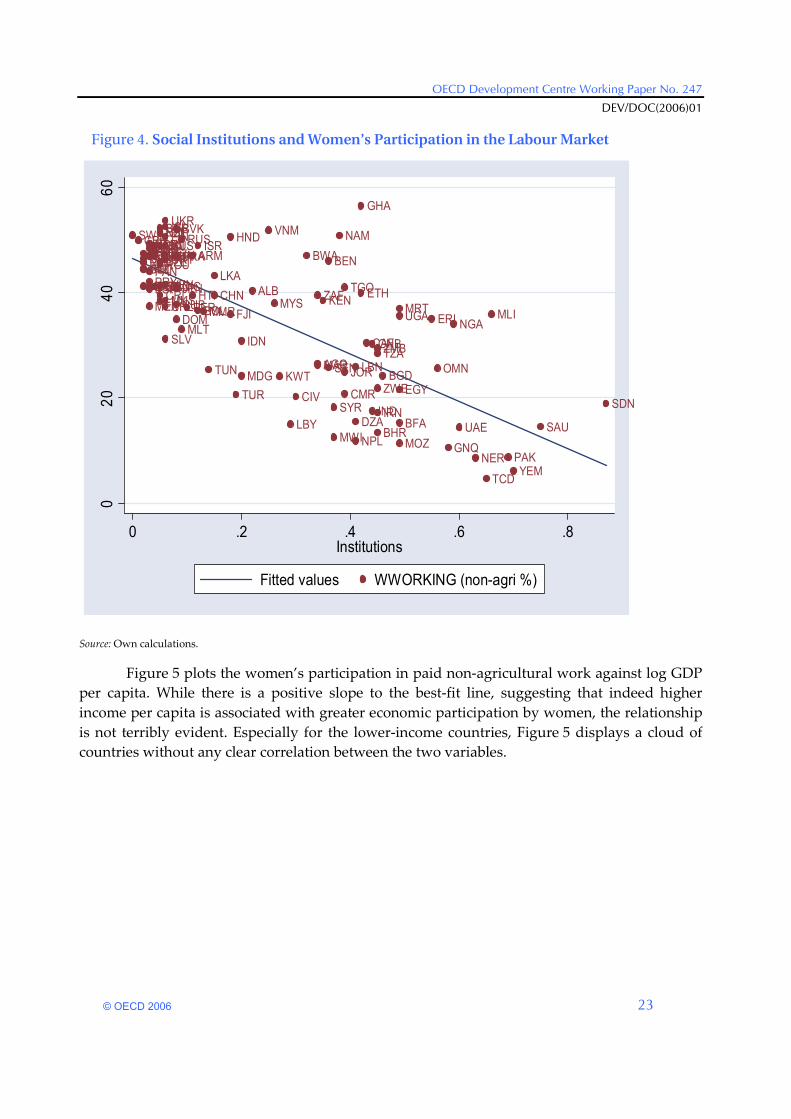
The relevance of social institutions for women’s economic participation is clearly emphasised in Figure 4, which plots a society’s “social institutions indicator” (the average of four indicators introduced in Figure 2: physical integrity, family code, ownership rights and civil liberties) against women as a share of paid workers in the non-agricultural labour-force. The negative relationship between the two variables suggests that the presence of more discriminatory institutions is associated with lower rates of economic participation.
OECD Development Centre Working Paper No. 247
DEV/DOC(2006)01
© OECD 2006
23
Figure 4. Social Institutions and Women’s Participation in the Labour Market
ZWE
ZMB
YEM
VNM
VEN
URYUSAGBR
UAE
UKR
UGA
TUR
TUN
TGO
THA
TZA
SYR
CHE
SWE
SDN
LKAESP ZAF
SVK
SEN
SAU
RUS
ROUPRTPOL
PHL
PER
PRYPAN
PAK
OMN
NOR
NGA
NER
NIC
NZL
NLD
NPL
NAM
MMR
MOZ
MAR
MEXMUS MRT
MLTMLI
MYS
MWI
MDG
LUX
LBY
LBNKWT
KORKEN
JOR
JPNITA
ISRIRL
IRN
IDN
IND
ISL
HUNHND
HTI
GNB
GRC
GHA
DEUFRAFIN
FJI
ETH
EST
ERI
GNQ
SLV
EGY
ECU
DOM
DNKCZE
CUB
CIV
CRI
COL
CHNCHL
TCD
CAF
CAN
CMR
BFA
BGR
BRA BWA
BOL
BENBEL
BGD
BHR
AUT
AUSARMARG
AGO
DZA
ALB
020
4060
0 .2 .4 .6 .8Institutions
Fitted values WWORKING (non-agri %)
Source: Own calculations.
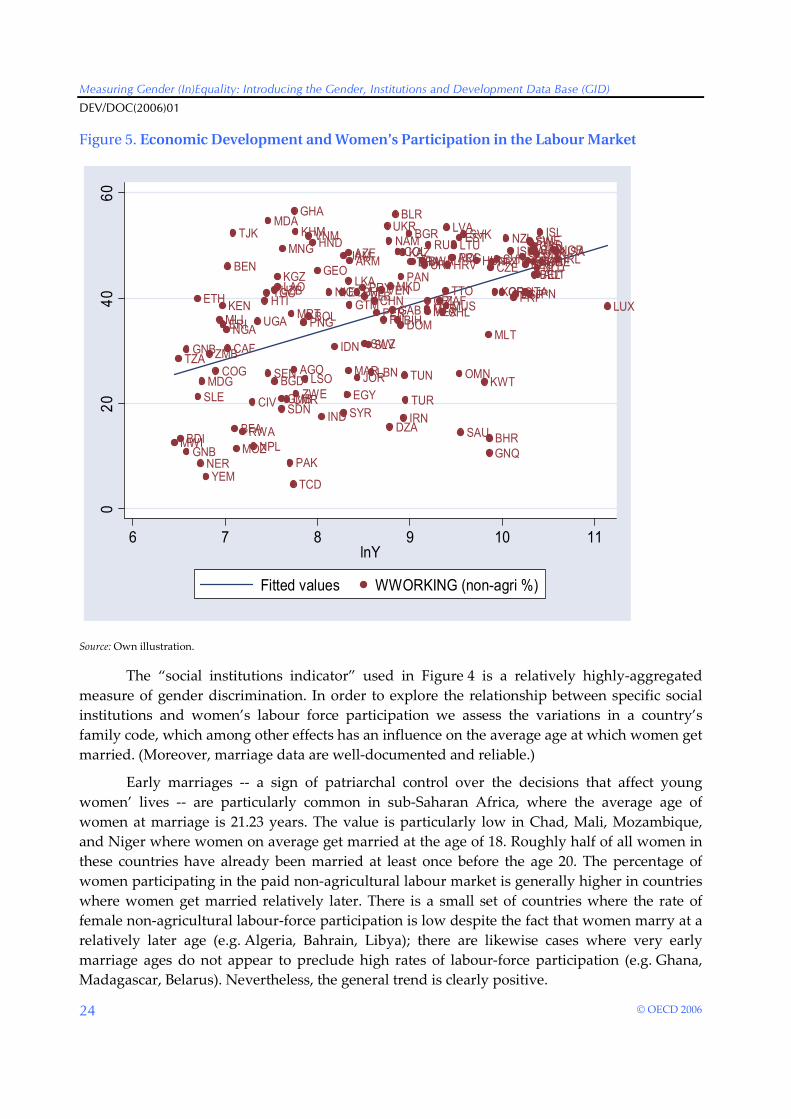
Figure 5 plots the women’s participation in paid non-agricultural work against log GDP per capita. While there is a positive slope to the best-fit line, suggesting that indeed higher income per capita is associated with greater economic participation by women, the relationship is not terribly evident. Especially for the lower-income countries, Figure 5 displays a cloud of countries without any clear correlation between the two variables.
Measuring Gender (In)Equality: Introducing the Gender, Institutions and Development Data Base (GID)
DEV/DOC(2006)01
© OECD 2006 24
Figure 5. Economic Development and Women’s Participation in the Labour Market
ZWE
ZMB
YEM
VNM
VEN
URYUSAGBR
UKR
UGA
TUR
TUN
TGO
THA
TZA
SYR
CHE
SWE
SDN
LKAESPZAF
SVK
SEN
SAU
RUSPRTPOL
PHL
PER
PRYPAN
PAK
OMN
NOR
NGA
NER
NIC
NZL
NLD
NPL
NAM
MOZ
MAR
MEXMUSMRT
MLTMLI
MYS
MWI
MDG
LUX
LBNKWT
KORKEN
JOR
JPNITA
ISR IRL
IRN
IDN
IND
ISL
HUNHND
HTI
GNB
GRC
GHA
DEUFRAFIN
FJI
ETH
EST
ERI
GNQ
SLV
EGY
ECU
DOM
DNKCZE
CIV
CRI
COL
CHNCHL
TCD
CAF
CAN
CMR
BFA
BGR
BRABWA
BOL
BEN BEL
BGD
BHR
AUT
AUSARM ARG
AGO
DZA
ALBUZB TTO
TJK
SWZ
SVN SGP
SLE
RWA
PRI
PNG
MNG
MDA
MKD
LTU
LSO
LVA
LAOKGZ
KAZJAM HKG
GNB
GTM
GEO
GMB
GAB
HRV
COG
KHM
BDI
BIH
BLR
AZE
020
4060
6 7 8 9 10 11lnY
Fitted values WWORKING (non-agri %)
Source: Own illustration.
The “social institutions indicator” used in Figure 4 is a relatively highly-aggregated measure of gender discrimination. In order to explore the relationship between specific social institutions and women’s labour force participation we assess the variations in a country’s family code, which among other effects has an influence on the average age at which women get married. (Moreover, marriage data are well-documented and reliable.)
Early marriages -- a sign of patriarchal control over the decisions that affect young women’ lives -- are particularly common in sub-Saharan Africa, where the average age of women at marriage is 21.23 years. The value is particularly low in Chad, Mali, Mozambique, and Niger where women on average get married at the age of 18. Roughly half of all women in these countries have already been married at least once before the age 20. The percentage of women participating in the paid non-agricultural labour market is generally higher in countries where women get married relatively later. There is a small set of countries where the rate of female non-agricultural labour-force participation is low despite the fact that women marry at a relatively later age (e.g. Algeria, Bahrain, Libya); there are likewise cases where very early marriage ages do not appear to preclude high rates of labour-force participation (e.g. Ghana, Madagascar, Belarus). Nevertheless, the general trend is clearly positive.
OECD Development Centre Working Paper No. 247
DEV/DOC(2006)01
© OECD 2006
25
IV.1.2 Indirect Impact Channels of Social Institutions
We also find empirical support for our hypothesis that social institutions have an influence on the economic role of women through indirect impact channels, i.e. by affecting women’s access to resources (health, education, and birth control). This mechanism has already been widely discussed in the literature (e.g. World Bank, 2001; Klasen, 2002).
Consider access to adequate education. Several indicators included in the GID data base measure the quality of such access, including female enrolment rates in primary, secondary, and tertiary education. In fact, the UN’s current initiative to significantly improve women’s empowerment in the framework of the Millennium Development Goals specifically focuses on enrolment rates.
While being an indisputable prerequisite for educational attainment, we nevertheless believe that enrolment rates per se do not necessarily capture whether women can benefit from adequate educational resources as their success may be undermined by institutional constraints. A focus on a very basic outcome variable of educational attainment, namely literacy rates, demonstrates that discriminatory social institutions can mitigate the impact of reasonably high enrolment rates on the educational attainment of women: thus Figure 6 plots the social-institutions indicator against the female-to-male literacy ratio, illustrating a clear negative relationship between discrimination and parity in literacy (albeit one marked by substantial heteroscedasticity).

Measuring Gender (In)Equality: Introducing the Gender, Institutions and Development Data Base (GID)
DEV/DOC(2006)01
© OECD 2006 26
Figure 6. Social Institutions and Educational Attainment
ZWE
ZMB
YEM
VNMVENURYUSA
UAE
UKR
UGA
TUR
TUN
TGO
THA
TZA
SYRSDN
LKAESP ZAFSVK
SEN
SAU
RUSROUPRTPOLPHL
PER
PRYPAN
PAK
OMNNGA
NER
NIC
NPL
NAM
MMR
MOZ
MAR
MEXMUS
MRT
MLT
MLI
MYS
MWI
MDG
LUX
LBY
LBN
KWTKOR
KENJOR
ITAISR
IRN
IDN
IND
HUN HND
HTI
GNB
GRC
GHA
FRAFJI
ETH
EST
ERI
GNQ
SLV
EGY
ECUDOMCUB
CIV
CRICOL
CHN
CHL
TCD
CAF
CMR
BFA
BGRBRA
BWA
BOL
BEN
BGD
BHR
AUS ARMARG
AGO
DZA
ALB
.4.6
.81
1.2
0 .2 .4 .6 .8Institutions
Fitted values RatioLIT
Source: Own illustration.
IV.2 Econometric Analysis of the Impact of Social Institutions
To summarise, there is a clear relationship between discriminatory social institutions and women’s economic participation, one that appears even more robust than that between women’s participation and a country’s level of economic development. We furthermore provided initial indication of the various channels through which social institutions affect women’s labour force participation and distinguished a direct channel from one which primarily operates via women’s access to resources such as education or health care. In this section, we complement these bivariate results with multivariate regression analysis to further isolate the effect of social institutions and illustrate the utility of the GID data base.
IV.2.1 Regression Analysis Using Single Variables
In order to analyse the significance of social institutions for the economic role of women, we first consider each variable’s separate impact on women’s participation in the paid non-agricultural labour force. As indicated in the results summarised in Table 2, all of the social institutions from the GID data base, taken singly, have a statistically significant effect on

OECD Development Centre Working Paper No. 247
DEV/DOC(2006)01
© OECD 2006
27
women’s labour force participation while the sign of each coefficient corresponds to our underlying theoretical hypothesis: discriminatory social institutions are associated with lower rates of labour-force participation. (The estimated coefficient on the average marriage age has a positive sign because this is the sole variable in which higher values signify lower discrimination). Explanatory variables in bold-face indicate simple arithmetic averages of the disaggregated variables in that category: thus “Physical Integrity” is the average value of the genital-mutilation and violence-against-women indicators.
Comparing the dimensions of discriminatory institutions, the family code has significant explanatory power with an R-squared of 0.55. This may arise because the family code combines a comparatively larger number of socio-institutional variables than other aggregate indices do. Within the family code category, those institutions that illustrate male domination are of particular importance (i.e. inheritance rights, acceptance of polygamy, and regulations of parental authority). Institutions related to physical integrity, ownership rights, and civil liberties also explain a satisfactory portion of the variation between countries in terms of female labour-force participation (i.e. R-squared values of around 0.30).

Measuring Gender (In)Equality: Introducing the Gender, Institutions and Development Data Base (GID)
DEV/DOC(2006)01
© OECD 2006 28
Table 2. Single Variable Regression
Women among paid workers in non-agricultural professions (in % of total)
Estimated Coefficient Estimated Constant No. of observations R-squared
Family Code -29.67 45.03 116 0.55 (11.82)** (39.95)** Age Marriage (Avg.) 1.83 -6.42 149 0.20 (6.02)** -0.89 Ever married (15-19) -55.24 45.00 150 0.31 (8.18)** (32.77)** Repudiation -23.21 39.80 116 0.37 (8.14)** (36.73)** Inheritance -20.52 43.30 116 0.48 (10.21)** (37.86)** Parental Authority -19.98 43.29 116 0.46 (9.76)** (36.70)** Polygamy -20.94 42.91 116 0.46 (9.90)** (37.52)** Physical Integrity -33.61 45.75 122 0.30 (7.17)** (25.53)** Female Genital Mutilation -19.17 37.72 122 0.16 (4.72)** (30.59)** Violence against women (leg.) -24.24 48.69 157 0.21 (6.37)** (21.95)** Ownership Rights -23.17 41.47 116 0.29 (6.79)** (31.39)** Land -18.61 41.92 116 0.31 (7.18)** (31.79)** Loans -19.20 39.66 116 0.17 (4.90)** (29.29)** Patrimony -22.44 40.23 116 0.25 (6.20)** (31.70)** Civil Liberties -34.92 39.12 116 0.34 (7.66)** (36.29)** Veil -26.44 39.30 116 0.35 (7.81)** (36.44)** Freedom to move -34.23 37.78 116 0.22 (5.59)** (33.34)**
Note: Absolute value of t statistics in parentheses; * significant at 5%; ** significant at 1% Source: Own Calculation.

OECD Development Centre Working Paper No. 247
DEV/DOC(2006)01
© OECD 2006
29
IV.2.2 Multi-Variable Regression and Regressions Using Composite Indicators
Table 4 presents results of regression analysis of the female share of non-agricultural paid labour. Column 1 shows a significant positive effect of the (log of) income per capita on women’s labour-force participation, but the significance of per capita income can disappears when additional regressors are added. In the next three models, therefore, we regress women’s labour-force participation on log income and an indicator of gender discrimination: the UNDP’s GDI index (column 2); the UNDP’s GEM index (column 3); and our social institutions indicator. Both of the UNDP indicators have positive and statistically significant estimated coefficients, meaning that improvements in women’s status are associated with higher rates of female labour-force participation. However, in the models of columns 2 and 3, the estimated coefficient on log income per capita becomes negative, and insignificant in the GEM model. In the model in column 4, our social institutions indicator has a statistically significant and negative estimated coefficient (recall that higher values of the index mean more discrimination), and per capita income is not significant. The models in columns 2 to 4 illustrate that the effect of higher income per capita on women’s economic participation is not statistically robust (clearly calling into question the modernisation theory of gender discrimination); they also illustrate that the social institutions indicator has the best-measured (in terms of t-statistics) effect on women’s labour-force participation, and explains a larger share of the variation (in terms of R-squared statistics) in the dependent variable than do the UNDP indicators. When all four sub-indices of social institutions are included in a regression (column 5), only family code and civil liberties are statistically significant. The absence of significance for some of these variables might arise because of correlation among the institutional variables (Table 3).
Table 3. Correlation Table of Institutional Variables
Family Code Physical Integrity Ownership Right Civil Liberties
Family Code 1.000 - - -
Physical Integrity 0.6437 1.000 - -
Ownership Rights 0.5473 0.3196 1.000 -
Civil Liberties 0.7562 0.5122 0.3942 1.000
Note: All coefficients significant at 1% level.
In columns 6 to 8, we include indicators of both social institutions and access to resources. Column 6 includes log income, the social-institutions indicator, and the ratio of female to male literacy rates: log income is significant (and negative, again), but both the literacy ratio and institutions are significant and have the expected signs. In part to explore the robustness of the effect of access to resources, column 7 replaces the literacy ratio from model 6 with the UNDP’s GDI index: here, the estimated coefficient on the institutions index is significant and negative, but the coefficient on the GDI index is not. In model 8, we include one resource-access variable (the literacy ratio) and one institutional variable (the family code sub-index),

Measuring Gender (In)Equality: Introducing the Gender, Institutions and Development Data Base (GID)
DEV/DOC(2006)01
© OECD 2006 30
together with log income. The estimated coefficients on both the literacy ratio and the family code are significant and with the expected signs for women’s labour-force participation. In column 9, we add the remaining institutional sub-indices to the model of column 8 and another resource-access variable, the life expectancy ratio; the effect of the literacy ratio remains significant, while, as in the model of column 5, both family code and civil liberties sub-indices of social institutions have significant depressive effects upon women’s labour force participation.
Most of the models in Table 4 were re-estimated with a series of regional dummy variables; these results are not qualitatively different from those in Table 3 and are not reported here. The principal finding is that once social institutions are controlled for, regional dummies do not have significant estimated coefficients. Thus, while we have observed in Section III that some regions have significantly higher prevalence of discriminatory institutions (e.g. Middle East and North Africa, South Asia, and Sub-Saharan Africa), these multivariate results suggest that it is indeed these institutions and not some un-measured regional effect that accounts for the differences in women’s labour-force participation.
Taken as a whole, the exploratory regression analysis reported in this section suggests that variables measuring social institutions are associated with women’s labour force participation in a statistically-significant way. These associations are at least as robust, if not more so, than the relationships between women’s economic participation and more conventionally-used measures of women’s access to resources (such as those used in the Human Development Indices); the social institutions variables also account for similar or larger shares of cross-country variation (as measured by R-squared values) than do human-development measures. More generally, these results illustrate the efficacy of the new GID data base introduced in this paper.

OECD Development Centre Working Paper No. 247
DEV/DOC(2006)01
© OECD 2006
31
Table 4. Multi-Variable Regression and Regressions using Composite Indicators
(1) (2) (3) (4) (5) (6) (7) (8) (9) Women as a share of paid workers in the non-agricultural sector (%) Log Income 5.207 -7.08 1.368 0.274 1.121 -2.48 -1.14 -2.204 -1.652
(6.52)**
(3.61)** -0.73 -0.3 -1.17 (2.11)* -0.5 -1.87 -1.32
Family Code -21.784 -19.263 -12.11 (4.63)** (4.57)** (2.20)* Physical Integrity -2.078 -1.117 -0.38 -0.2 Civil Liberties -16.414 -14.006 (3.61)** (2.98)** Ownership Rights 2.3 2.686 -0.53 -0.59 Social Institutions -43.678 -30.073 -40.796 (8.35)** (4.73)** (6.13)** Literacy Ratio 31.657 30.754 27.086 (3.69)** (3.48)** (3.11)** Life-expectancy Ratio 56.973 -1.74
GDI 83.79
9 11.652
(6.82)** -0.7
GEM 26.64
6
(2.46)*
Constant -8.067 40.33
9 15.78
3 43.961 34.569 36.679 47.53 33.987 -29.701
-1.16 (4.17)** -1.2 (4.88)** (3.67)** (3.64)** (4.45)** (3.44)** -0.83
Obser-vations 144 134 64 111 111 95 109 95 95 R-squared 0.23 0.43 0.32 0.54 0.6 0.55 0.55 0.55 0.6
Note: Absolute value of t statistics in parentheses: * significant at 5%; ** significant at 1% Source: Own Calculation.

Measuring Gender (In)Equality: Introducing the Gender, Institutions and Development Data Base (GID)
DEV/DOC(2006)01
© OECD 2006
32
V. CONCLUSIONS
This paper presents the Gender, Institutions and Development (GID) data base, a new analytical tool to measure gender (in)equality, compiled to shed light on the increasingly important area of the impact of institutions on development outcomes. To that end, the GID data base includes frequently-consulted variables such as female access to education, health, and birth control; but it also compiles, for the first time in an easily usable fashion, measures of discriminatory social institutions, including the degree of women’s freedom related to physical integrity, civil liberties, ownership rights and the family code. The GID data base is organised following a conceptual framework linking “outcome” variables like women’s rate of participation in the labour force to input variables such as the institutional framework, women’s access to resources, and the level of economic development. The paper demonstrates the usefulness of the GID data base by means of an analysis of the determinants of cross-country variations in women’s labour-force participation. The results of the econometric analysis suggest that the quantitative significance of institutional factors overrides more commonly used variables such as income per capita. This finding supports the interpretation that one cannot necessarily expect an improvement of the economic role women as incomes rise and that policy measures – like the recent reforms to the family code in Morocco – have to be implemented that address institutional bottlenecks.4
4 The interaction of state policy, women’s well-being and pre-existing social institutions is
analysed with reference to China, India and Korea in Das Gupta et al. (2004).
OECD Development Centre Working Paper No. 247
DEV/DOC(2006)01
© OECD 2006
33
BIBLIOGRAPHY
BECKER, G. (1985), “Human Capital, Effort and the Sexual Division of Labour”, Journal of Labour Economics, Vol. 3(1), pp. 33-58.
BOSERUP, E. (1970), Woman’s Role in Economic Development, St Martin’s Press, New York, NY.
DAS GUPTA, M., S. LEE, P. UBEROI, D. WANG, L. WANG and X. ZHANG (2004), “State Policies and Women’s Agency in China, the Republic of Korea, and India, 1950-2000: Lessons from Contrasting Experiences”, in RAO, V. and WALTON, M. (eds.), Culture and Public Action, Stanford University Press, Stanford, CA.
FORSYTHE, N., R.P. KORZENIEWICZ. and V. DURRANT (2000), “Gender Inequalities and Economic Growth: A Longitudinal Evaluation”, Economic Development and Cultural Change, Vol. 48(3), pp. 573-617.
KABEER, N. and S. MAHMUD (2004), “Globalization, Gender and Poverty: Bangladesh Women Workers in Export and Local Market”, Journal of International Development, Vol. 16(1), pp. 93-109.
KLASEN, S. (2002), “Low Schooling for Girls, Slower Growth for All? Cross-Country Evidence on the Effect of Gender Inequality in Education on Economic Development”, The World Bank Economic Review, Vol. 16(3), pp. 315-373.
LEWIS, W.A. (1955), The Theory of Economic Growth, Richard T. Irwin, Homewood, Ill.
MARCHAND, M.H. and J.L. PARPART (eds.), (1995). Feminism, Postmodernism Development, Routledge, London.
MORRISSON, C. and J. JÜTTING (2005), “Women’s Discrimination in Developing Countries: A New Data Set for Better Policies”, World Development, Vol. 33(7), pp. 1065-1081.
O’NEILL, J. and S. POLACHEK (1993), “Why the Gender Gap in Wages Narrowed in the 1980’s”, Journal of Labour Economics, Vol. 11(1), pp. 205-228.
PARPART, J.L. (1993), “Who is the Other? A Postmodern Feminist Critique of Women and Development Theory and Practice”, Development and Change, Vol. 24(3), pp. 439-464.
RUBIN, G. (1975), “The Traffic in Women: Notes on the ‘Political Economy’ of Sex”, in Toward an Anthropology of Women, edited by Rayna R. Reiter, Monthly Review Press, New York, NY, pp. 197-210.
SEN, A. (1992), “Missing Women” British Medical Journal, Vol. 304, pp. 586-7.
UNDP (2005), Human Development Report: International cooperation at a crossroads: Aid, Trade and Security in an Unequal World, Oxford University Press, New York, NY.
UNDP (2002), Human Development Report: Deepening Democracy in a Fragmented World, Oxford University Press, New York, NY.
WORLD BANK (2001), Engendering Development through Gender Equality in Rights, Resources and Voice, World Bank, Washington, D.C.
Measuring Gender (In)Equality: Introducing the Gender, Institutions and Development Data Base (GID)
DEV/DOC(2006)01
© OECD 2006
34
STATISTICAL SOURCES
AFROL NEWS/ http://www.afrol.com/index.php
AMNESTY INTERNATIONAL (1997), Female Genital Mutilation in Africa: A Human Rights Information Pack. Amnesty International Report ACT 77/07/97, Amnesty International, London.
ASIAN DEVELOPMENT BANK, Gender and Development, http://www.adb.org/Gender/default.asp
BRIDGE, Development and Gender, http://www.bridge.ids.ac.uk/
CANADIAN INTERNATIONAL DEVELOPMENT AGENCY, http://www.acdi-cida.gc.ca/index-e.htm
CLÉVENOT, M. (1987), L’État des Religions dans le Monde, La Découverte, Paris.
INTERNATIONAL LABOUR ORGANIZATION (2002), Key Indicators of the Labour Market 2001-2002, ILO, Geneva.
LANG, J. (1998), Enquête sur la Situation des Femmes dans le Monde, Assemblée Nationale, Paris.
MADDISON, A. (2001), The World Economy: A Millennial Perspective, OECD Development Centre Studies, Paris.
UNITED NATIONS (2006), The World’s Women 2000: Trends and Statistics, United Nations, New York, NY.
UNITED NATIONS (2005), Millennium Development Indicator Database, Statistics Division, United Nations, New York, NY.
UNITED NATIONS (2004), Human Development Report, United Nations, New York, NY.
UNDP (2005), Human Development Report: International cooperation at a crossroads: Aid, Trade and Security in an Unequal World, Gender-related Development Index (GDI) and Gender Empowerment Measure (GEM), Oxford University Press, New York, NY.
UNDP (2002), Human Development Report: Deepening Democracy in a Fragmented World, UNDP, New York, NY.
UNDP (2000), Gender in Development. Statistics and Indicators, UNDP, New York, NY.
UNIFEM (2006), United Nations Development Fund for Women, http://www.unifem.org/
UNIFEM (2003), Not a Minute More: Ending Violence Against Women, United Nations Development Fund for Women, New York, NY.
U.S. STATE DEPARTMENT, Country Reports on Human Rights Practices, Bureau of Democracy, Human Rights and Labour, http://www.state.gov/g/drl/rls/hrrpt/2001/
WHO, Female Genital Mutilation. http://www.who.int/topics/female_genital_mutilation/en/
WOMEN IN DEVELOPMENT NETWORK (WIDNET), http://www.focusintl.com/widnet.htm
OECD Development Centre Working Paper No. 247
DEV/DOC(2006)01
© OECD 2006
35
WOMEN’S LEARNING PARTNERSHIP FOR RIGHTS, DEVELOPMENT AND PEACE (WLP), Facts and Figures http://www.learningpartnership.org/about/
WORLD BANK (2005): World Development Indicators 2005, Washington: World Bank.
WORLD BANK, GenderStats, electronic database of gender statistics and indicators. http://devdata.worldbank.org/genderstats/

Measuring Gender (In)Equality: Introducing the Gender, Institutions and Development Data Base (GID)
DEV/DOC(2006)01
© OECD 2006
36
ANNEX
Table A.1. GID Data Base (selection: Social Institutions)
Physical Integrity Family Code Ownership Rights Civil Liberties
Country Type VIOL MUTI
PI* Indic.
AGEM
MARR POLY AUTH INHR REPU
FC* Indic. LAND LOAN PATR
OR* Indic. VEIL
MOVE
CL* Indic.
1 Afghanistan LIC 1.00 - - - - - - - - - - - - - - - -
2 Albania LMC 0.75 0.0 2.95 23 0.08 0.0 0.2 0.2 0.0 0.12 0.5 0.5 0.2 0.4 0.0 0.0 0.0
3 Algeria LMC 0.75 0.0 3.85 26 0.04 1.0 1.0 1.0 1.0 0.76 0.2 0.2 0.2 0.2 0.6 0.0 0.0
4 Angola LIC 0.50 0.2 2.77 19 0.36 0.8 0.7 0.5 0.0 0.59 0.8 0.2 0.2 0.4 0.0 0.0 0.0
5 Argentina UMC 0.25 0.0 2.89 23 0.12 0.0 0.0 0.0 0.0 0.03 0.0 0.0 0.0 0.0 0.0 0.0 0.0
6 Armenia LMC 0.75 0.0 2.92 23 0.09 0.0 0.2 0.0 0.0 0.07 0.0 0.0 0.0 0.0 0.0 0.0 0.0
7 Australia HIC 0.50 0.0 3.63 29 0.01 0.0 0.0 0.0 0.0 0.00 0.0 0.0 0.0 0.0 0.0 0.0 0.0
8 Austria HIC 0.17 0.0 3.25 26 0.03 0.0 0.0 0.0 0.0 0.01 0.0 0.0 0.0 0.0 0.0 0.0 0.0
9 Azerbaijan LIC 0.75 - - 24 0.13 - - - - - - - - - - - -
10 Bahrain HIC 0.75 1.0 3.98 26 0.07 1.0 1.0 1.0 1.0 0.77 0.5 0.0 0.0 0.2 0.0 0.0 0.0
11 Bangladesh LIC 0.08 0.0 3.02 19 0.48 1.0 1.0 1.0 0.8 0.87 0.8 0.3 0.5 0.5 0.5 0.3 0.3
12 Belarus LMC 0.50 - - 23 0.06 - - - - - - - - - - - -
13 Belgium HIC 0.17 0.0 3.50 28 0.01 0.0 0.0 0.0 0.0 0.00 0.0 0.0 0.0 0.0 0.0 0.0 0.0
14 Benin LIC 0.75 0.2 2.93 20 0.29 0.8 1.0 0.5 0.0 0.65 1.0 0.0 0.0 0.3 0.0 0.0 0.0
15 Bhutan LIC 0.67 - - 21 0.27 - - - - - - - - - - - -
16 Bolivia LMC 0.42 0.0 2.89 23 0.12 0.0 0.0 0.0 0.0 0.03 0.2 0.5 0.0 0.2 0.0 0.0 0.0
17 Bosnia & Herzegovina LMC 0.50 - - - - - - - - - - - - - - - -
18 Botswana UMC 0.33 0.0 3.73 27 0.05 0.2 1.0 1.0 0.0 0.56 0.7 0.5 0.5 0.6 0.0 0.0 0.0

OECD Development Centre Working Paper No. 247
DEV/DOC(2006)01
© OECD 2006
37
19 Brazil LMC 0.58 0.0 2.90 23 0.17 0.0 0.0 0.0 0.0 0.04 0.0 0.0 0.0 0.0 0.0 0.0 0.0
20 Bulgaria LMC 0.33 0.0 2.65 21 0.16 0.0 0.0 0.0 0.0 0.04 0.0 0.0 0.0 0.0 0.0 0.0 0.0
21 Burkina Faso LIC 0.50 0.7 2.93 19 0.35 0.9 0.8 0.6 0.4 0.66 0.8 0.5 0.5 0.6 0.0 0.2 0.2
22 Burundi LIC 0.75 - - 22 0.07 - - - - - - - - - - - -
23 Cambodia LIC 0.58 - - 22 0.12 - - - - - - - - - - - -
24 Cameroon LIC 0.75 0.2 2.78 20 0.36 0.6 0.2 0.3 0.2 0.37 1.0 0.5 0.6 0.7 0.0 0.0 0.0
25 Canada HIC 0.25 0.0 3.38 27 0.03 0.0 0.0 0.0 0.0 0.01 0.0 0.0 0.0 0.0 0.0 0.0 0.0
26 Central African
Republic LIC 0.75 0.4 2.96 20 0.42 0.7 0.5 1.0 0.0 0.66 1.0 0.0 0.4 0.5 0.0 0.0 0.0
27 Chad LIC 0.50 0.5 2.91 18 0.49 1.0 1.0 1.0 0.5 0.87 1.0 0.5 0.8 0.8 0.5 0.5 0.5
28 Chile UMC 0.42 0.0 2.89 23 0.12 0.0 0.0 0.0 0.0 0.03 0.0 0.0 0.0 0.0 0.0 0.0 0.0
29 China LMC 0.58 0.0 2.94 23 0.01 0.0 0.2 0.2 0.0 0.10 0.2 0.2 0.2 0.2 0.0 0.0 0.0
30 Colombia LMC 0.33 0.0 2.90 23 0.18 0.0 0.0 0.0 0.0 0.05 0.0 0.0 0.0 0.0 0.0 0.0 0.0
31 Congo, Dem. Rep. LIC 0.75 0.1 0.05 - - - - - - - - - - - - - -
32 Congo, Rep. LIC 0.75 - - - - - - - - - - - - - - - -
33 Costa Rica UMC 0.33 0.0 2.63 21 0.06 0.0 0.0 0.0 0.0 0.02 0.0 0.0 0.0 0.0 0.0 0.0 0.0
34 Cote d'Ivoire LIC 0.42 0.4 3.23 22 0.25 0.8 1.0 0.2 0.6 0.56 0.6 0.0 0.0 0.2 0.0 0.0 0.0
35 Croatia UMC 0.25 - - 26 0.02 - - - - - - - - - - - -
36 Cuba LMC 0.50 0.0 2.55 20 0.29 0.0 0.0 0.0 0.0 0.07 0.0 0.0 0.0 0.0 0.0 0.0 0.0
37 Czech Republic UMC 0.42 0.0 3.13 25 0.01 0.0 0.0 0.0 0.0 0.00 0.0 0.0 0.0 0.0 0.0 0.0 0.0
38 Denmark HIC 0.25 0.0 3.88 31 0.01 0.0 0.0 0.0 0.0 0.00 0.0 0.0 0.0 0.0 0.0 0.0 0.0
39 Dominican Rep. LMC 0.50 0.0 2.67 21 0.29 0.0 0.0 0.0 0.0 0.07 0.0 0.0 0.0 0.0 0.0 0.0 0.0
40 Ecuador LMC 0.17 0.0 2.78 22 0.22 0.0 0.0 0.0 0.0 0.06 0.0 0.0 0.0 0.0 0.0 0.0 0.0
41 Egypt LMC 0.75 1.0 3.44 22 0.15 1.0 0.9 0.9 0.9 0.74 0.0 0.0 0.0 0.0 0.7 0.0 0.0
42 El Salvador LMC 0.17 0.0 2.78 22 0.16 0.0 0.0 0.0 0.0 0.04 0.1 0.1 0.1 0.1 0.0 0.0 0.0
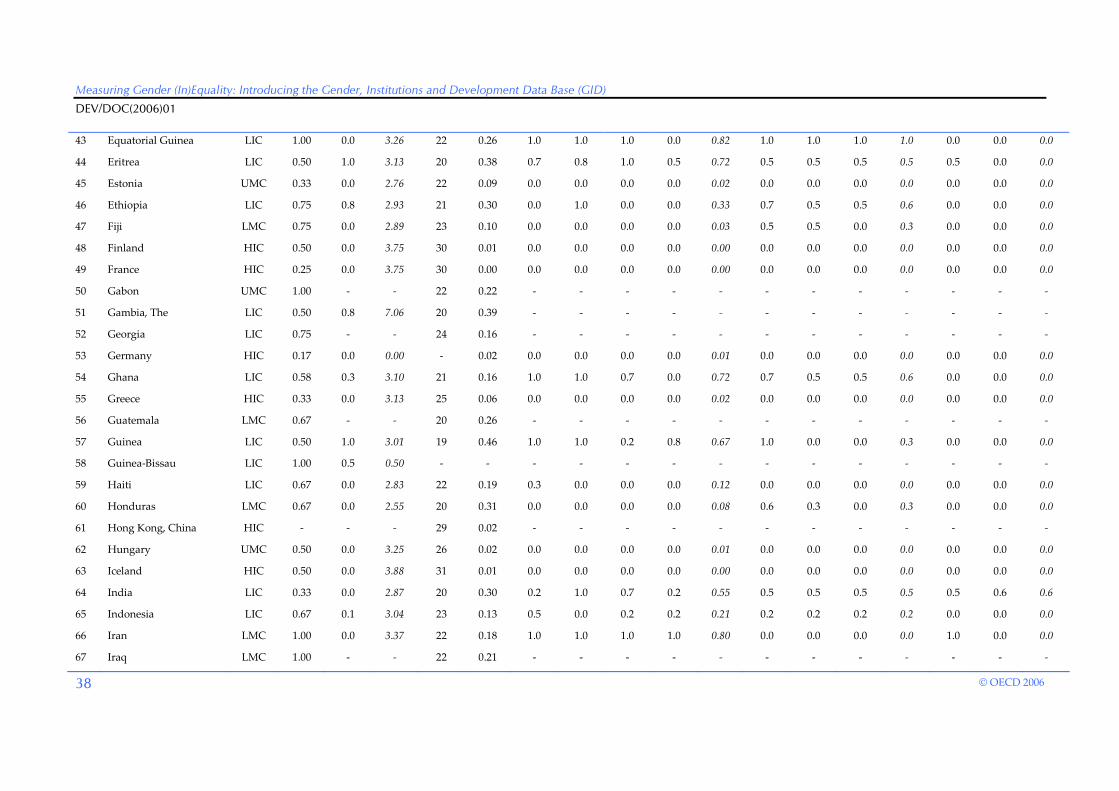
Measuring Gender (In)Equality: Introducing the Gender, Institutions and Development Data Base (GID)
DEV/DOC(2006)01
© OECD 2006
38
43 Equatorial Guinea LIC 1.00 0.0 3.26 22 0.26 1.0 1.0 1.0 0.0 0.82 1.0 1.0 1.0 1.0 0.0 0.0 0.0
44 Eritrea LIC 0.50 1.0 3.13 20 0.38 0.7 0.8 1.0 0.5 0.72 0.5 0.5 0.5 0.5 0.5 0.0 0.0
45 Estonia UMC 0.33 0.0 2.76 22 0.09 0.0 0.0 0.0 0.0 0.02 0.0 0.0 0.0 0.0 0.0 0.0 0.0
46 Ethiopia LIC 0.75 0.8 2.93 21 0.30 0.0 1.0 0.0 0.0 0.33 0.7 0.5 0.5 0.6 0.0 0.0 0.0
47 Fiji LMC 0.75 0.0 2.89 23 0.10 0.0 0.0 0.0 0.0 0.03 0.5 0.5 0.0 0.3 0.0 0.0 0.0
48 Finland HIC 0.50 0.0 3.75 30 0.01 0.0 0.0 0.0 0.0 0.00 0.0 0.0 0.0 0.0 0.0 0.0 0.0
49 France HIC 0.25 0.0 3.75 30 0.00 0.0 0.0 0.0 0.0 0.00 0.0 0.0 0.0 0.0 0.0 0.0 0.0
50 Gabon UMC 1.00 - - 22 0.22 - - - - - - - - - - - -
51 Gambia, The LIC 0.50 0.8 7.06 20 0.39 - - - - - - - - - - - -
52 Georgia LIC 0.75 - - 24 0.16 - - - - - - - - - - - -
53 Germany HIC 0.17 0.0 0.00 - 0.02 0.0 0.0 0.0 0.0 0.01 0.0 0.0 0.0 0.0 0.0 0.0 0.0
54 Ghana LIC 0.58 0.3 3.10 21 0.16 1.0 1.0 0.7 0.0 0.72 0.7 0.5 0.5 0.6 0.0 0.0 0.0
55 Greece HIC 0.33 0.0 3.13 25 0.06 0.0 0.0 0.0 0.0 0.02 0.0 0.0 0.0 0.0 0.0 0.0 0.0
56 Guatemala LMC 0.67 - - 20 0.26 - - - - - - - - - - - -
57 Guinea LIC 0.50 1.0 3.01 19 0.46 1.0 1.0 0.2 0.8 0.67 1.0 0.0 0.0 0.3 0.0 0.0 0.0
58 Guinea-Bissau LIC 1.00 0.5 0.50 - - - - - - - - - - - - - -
59 Haiti LIC 0.67 0.0 2.83 22 0.19 0.3 0.0 0.0 0.0 0.12 0.0 0.0 0.0 0.0 0.0 0.0 0.0
60 Honduras LMC 0.67 0.0 2.55 20 0.31 0.0 0.0 0.0 0.0 0.08 0.6 0.3 0.0 0.3 0.0 0.0 0.0
61 Hong Kong, China HIC - - - 29 0.02 - - - - - - - - - - - -
62 Hungary UMC 0.50 0.0 3.25 26 0.02 0.0 0.0 0.0 0.0 0.01 0.0 0.0 0.0 0.0 0.0 0.0 0.0
63 Iceland HIC 0.50 0.0 3.88 31 0.01 0.0 0.0 0.0 0.0 0.00 0.0 0.0 0.0 0.0 0.0 0.0 0.0
64 India LIC 0.33 0.0 2.87 20 0.30 0.2 1.0 0.7 0.2 0.55 0.5 0.5 0.5 0.5 0.5 0.6 0.6
65 Indonesia LIC 0.67 0.1 3.04 23 0.13 0.5 0.0 0.2 0.2 0.21 0.2 0.2 0.2 0.2 0.0 0.0 0.0
66 Iran LMC 1.00 0.0 3.37 22 0.18 1.0 1.0 1.0 1.0 0.80 0.0 0.0 0.0 0.0 1.0 0.0 0.0
67 Iraq LMC 1.00 - - 22 0.21 - - - - - - - - - - - -
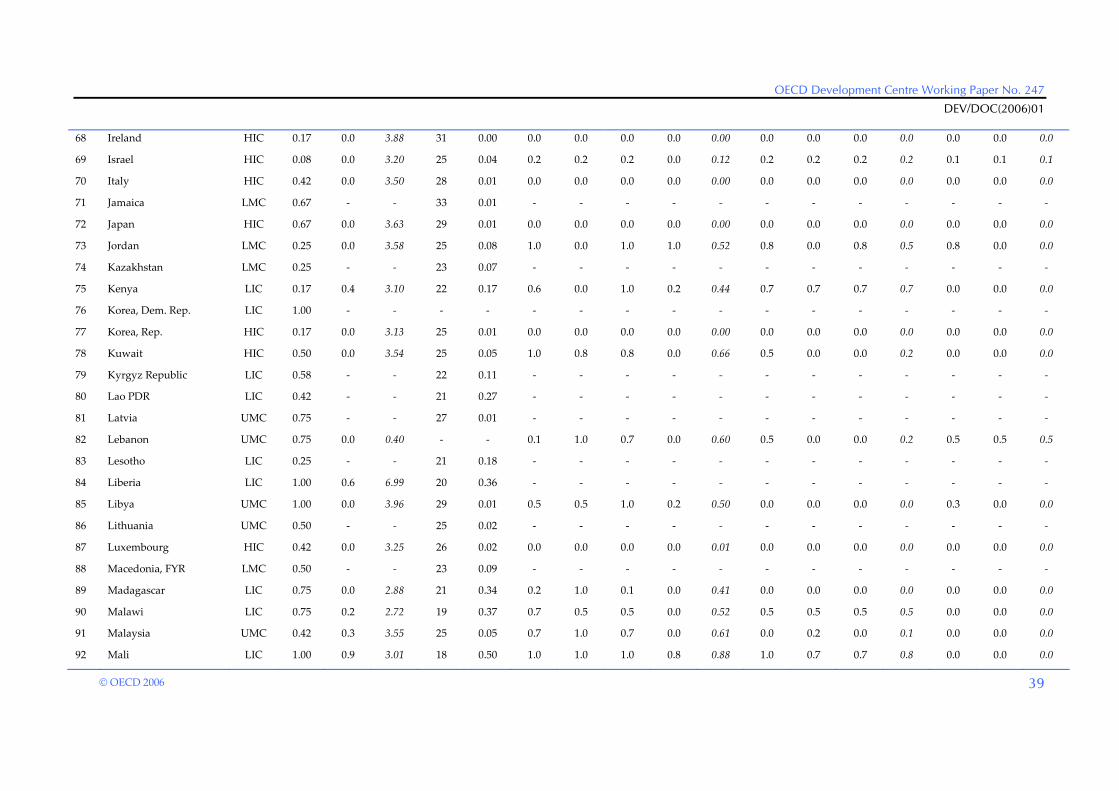
OECD Development Centre Working Paper No. 247
DEV/DOC(2006)01
© OECD 2006
39
68 Ireland HIC 0.17 0.0 3.88 31 0.00 0.0 0.0 0.0 0.0 0.00 0.0 0.0 0.0 0.0 0.0 0.0 0.0
69 Israel HIC 0.08 0.0 3.20 25 0.04 0.2 0.2 0.2 0.0 0.12 0.2 0.2 0.2 0.2 0.1 0.1 0.1
70 Italy HIC 0.42 0.0 3.50 28 0.01 0.0 0.0 0.0 0.0 0.00 0.0 0.0 0.0 0.0 0.0 0.0 0.0
71 Jamaica LMC 0.67 - - 33 0.01 - - - - - - - - - - - -
72 Japan HIC 0.67 0.0 3.63 29 0.01 0.0 0.0 0.0 0.0 0.00 0.0 0.0 0.0 0.0 0.0 0.0 0.0
73 Jordan LMC 0.25 0.0 3.58 25 0.08 1.0 0.0 1.0 1.0 0.52 0.8 0.0 0.8 0.5 0.8 0.0 0.0
74 Kazakhstan LMC 0.25 - - 23 0.07 - - - - - - - - - - - -
75 Kenya LIC 0.17 0.4 3.10 22 0.17 0.6 0.0 1.0 0.2 0.44 0.7 0.7 0.7 0.7 0.0 0.0 0.0
76 Korea, Dem. Rep. LIC 1.00 - - - - - - - - - - - - - - - -
77 Korea, Rep. HIC 0.17 0.0 3.13 25 0.01 0.0 0.0 0.0 0.0 0.00 0.0 0.0 0.0 0.0 0.0 0.0 0.0
78 Kuwait HIC 0.50 0.0 3.54 25 0.05 1.0 0.8 0.8 0.0 0.66 0.5 0.0 0.0 0.2 0.0 0.0 0.0
79 Kyrgyz Republic LIC 0.58 - - 22 0.11 - - - - - - - - - - - -
80 Lao PDR LIC 0.42 - - 21 0.27 - - - - - - - - - - - -
81 Latvia UMC 0.75 - - 27 0.01 - - - - - - - - - - - -
82 Lebanon UMC 0.75 0.0 0.40 - - 0.1 1.0 0.7 0.0 0.60 0.5 0.0 0.0 0.2 0.5 0.5 0.5
83 Lesotho LIC 0.25 - - 21 0.18 - - - - - - - - - - - -
84 Liberia LIC 1.00 0.6 6.99 20 0.36 - - - - - - - - - - - -
85 Libya UMC 1.00 0.0 3.96 29 0.01 0.5 0.5 1.0 0.2 0.50 0.0 0.0 0.0 0.0 0.3 0.0 0.0
86 Lithuania UMC 0.50 - - 25 0.02 - - - - - - - - - - - -
87 Luxembourg HIC 0.42 0.0 3.25 26 0.02 0.0 0.0 0.0 0.0 0.01 0.0 0.0 0.0 0.0 0.0 0.0 0.0
88 Macedonia, FYR LMC 0.50 - - 23 0.09 - - - - - - - - - - - -
89 Madagascar LIC 0.75 0.0 2.88 21 0.34 0.2 1.0 0.1 0.0 0.41 0.0 0.0 0.0 0.0 0.0 0.0 0.0
90 Malawi LIC 0.75 0.2 2.72 19 0.37 0.7 0.5 0.5 0.0 0.52 0.5 0.5 0.5 0.5 0.0 0.0 0.0
91 Malaysia UMC 0.42 0.3 3.55 25 0.05 0.7 1.0 0.7 0.0 0.61 0.0 0.2 0.0 0.1 0.0 0.0 0.0
92 Mali LIC 1.00 0.9 3.01 18 0.50 1.0 1.0 1.0 0.8 0.88 1.0 0.7 0.7 0.8 0.0 0.0 0.0

Measuring Gender (In)Equality: Introducing the Gender, Institutions and Development Data Base (GID)
DEV/DOC(2006)01
© OECD 2006
40
93 Malta HIC 0.67 0.0 2.75 22 0.03 0.0 0.0 0.0 0.0 0.01 0.0 0.0 0.0 0.0 0.0 0.0 0.0
94 Mauritania LIC 0.50 0.3 3.42 22 0.28 1.0 1.0 1.0 1.0 0.82 0.5 0.5 0.5 0.5 0.5 0.0 0.0
95 Mauritius UMC 0.42 0.0 3.02 24 0.11 0.0 0.0 0.0 0.0 0.03 0.0 0.0 0.0 0.0 0.0 0.0 0.0
96 Mexico UMC 0.17 0.0 2.90 23 0.17 0.0 0.0 0.0 0.0 0.04 0.0 0.0 0.0 0.0 0.0 0.0 0.0
97 Moldova LIC 0.42 - - 21 0.12 - - - - - - - - - - - -
98 Mongolia LIC 0.58 - - 24 0.06 - - - - - - - - - - - -
99 Morocco LMC 0.25 0.0 3.74 25 0.13 1.0 1.0 1.0 1.0 0.78 0.2 0.2 0.2 0.2 0.5 0.0 0.0
100 Mozambique LIC 0.75 0.4 2.84 18 0.47 1.0 1.0 1.0 0.0 0.87 0.5 0.5 0.5 0.5 0.0 0.0 0.0
101 Myanmar LIC 0.75 0.0 3.22 25 0.11 0.0 0.5 0.0 0.0 0.15 0.0 0.0 0.0 0.0 0.0 0.0 0.0
102 Namibia LMC 0.50 0.0 3.64 26 0.08 1.0 0.7 0.7 0.0 0.62 0.8 0.6 0.6 0.7 0.0 0.0 0.0
103 Nepal LIC 0.58 0.0 2.73 19 0.40 0.1 1.0 0.8 0.0 0.58 1.0 0.7 0.6 0.8 0.0 0.0 0.0
104 Netherlands HIC 0.17 0.0 3.75 30 0.01 0.0 0.0 0.0 0.0 0.00 0.0 0.0 0.0 0.0 0.0 0.0 0.0
105 New Zealand HIC 0.33 0.0 3.14 25 0.07 0.0 0.0 0.0 0.0 0.02 0.0 0.0 0.0 0.0 0.0 0.0 0.0
106 Nicaragua LIC 0.50 0.0 2.68 21 0.32 0.0 0.0 0.0 0.0 0.08 0.0 0.0 0.0 0.0 0.0 0.0 0.0
107 Niger LIC 1.00 0.1 2.95 18 0.62 1.0 1.0 1.0 1.0 0.91 1.0 0.3 0.8 0.7 0.8 0.0 0.0
108 Nigeria LIC 0.75 0.3 3.06 21 0.28 0.9 0.6 0.8 0.0 0.65 0.8 0.8 0.5 0.7 0.5 0.5 0.5
109 Norway HIC 0.25 0.0 3.88 31 0.00 0.0 0.0 0.0 0.0 0.00 0.0 0.0 0.0 0.0 0.0 0.0 0.0
110 Oman UMC 0.75 0.2 3.32 22 0.16 1.0 0.5 1.0 1.0 0.67 1.0 0.0 0.0 0.3 1.0 0.5 0.5
111 Pakistan LIC 0.50 0.1 3.26 21 0.21 1.0 1.0 1.0 1.0 0.80 0.8 0.7 0.5 0.7 1.0 1.0 1.0
112 Panama UMC 0.17 0.0 2.78 22 0.22 0.0 0.0 0.0 0.0 0.06 0.0 0.0 0.0 0.0 0.0 0.0 0.0
113 Papua New Guinea LIC 0.75 - - 21 0.21 - - - - - - - - - - - -
114 Paraguay LMC 0.17 0.0 2.78 22 0.17 0.0 0.0 0.0 0.0 0.04 0.0 0.0 0.0 0.0 0.0 0.0 0.0
115 Peru LMC 0.42 0.0 2.90 23 0.13 0.0 0.0 0.0 0.0 0.03 0.0 0.5 0.0 0.2 0.0 0.0 0.0
116 Philippines LMC 0.17 0.0 3.04 24 0.10 0.0 0.1 0.1 0.0 0.06 0.0 0.0 0.0 0.0 0.0 0.0 0.0
117 Poland UMC 0.33 0.0 3.13 25 0.02 0.0 0.0 0.0 0.0 0.01 0.0 0.0 0.0 0.0 0.0 0.0 0.0

OECD Development Centre Working Paper No. 247
DEV/DOC(2006)01
© OECD 2006
41
118 Portugal HIC 0.25 0.0 3.01 24 0.06 0.0 0.0 0.0 0.0 0.02 0.0 0.0 0.0 0.0 0.0 0.0 0.0
119 Puerto Rico HIC 0.42 - - 23 0.19 - - - - - - - - - - - -
120 Romania LMC 0.33 0.0 3.01 24 0.06 0.0 0.0 0.0 0.0 0.02 0.0 0.0 0.0 0.0 0.0 0.0 0.0
121 Russian Federation LMC 0.25 0.0 2.77 22 0.11 0.0 0.0 0.0 0.0 0.03 0.2 0.2 0.2 0.2 0.0 0.0 0.0
122 Rwanda LIC 1.00 - - 23 0.07 - - - - - - - - - - - -
123 Saudi Arabia UMC 1.00 0.0 3.37 22 0.16 1.0 1.0 1.0 1.0 0.79 1.0 0.8 0.8 0.9 1.0 0.7 0.7
124 Senegal LIC 0.25 0.2 3.24 22 0.29 0.9 0.9 0.7 0.2 0.70 0.5 0.5 0.5 0.5 0.0 0.0 0.0
125 Serbia and Montenegro LMC 0.75 - - 23 0.11 - - - - - - - - - - - -
126 Sierra Leone LIC 0.75 0.9 7.12 20 0.47 - - - - - - - - - - - -
127 Singapore HIC 0.50 - - 27 0.01 - - - - - - - - - - - -
128 Slovak Republic UMC 0.67 0.0 3.13 25 0.02 0.0 0.0 0.0 0.0 0.01 0.0 0.0 0.0 0.0 0.0 0.0 0.0
129 Slovenia HIC 0.75 - - 30 0.00 - - - - - - - - - - - -
130 Somalia LIC 0.75 1.0 0.98 - - - - - - - - - - - - - -
131 South Africa LMC 0.42 0.1 3.80 28 0.03 0.5 0.3 1.0 0.0 0.46 0.9 0.5 0.5 0.6 0.0 0.0 0.0
132 Spain HIC 0.25 0.0 3.25 26 0.02 0.0 0.0 0.0 0.0 0.01 0.0 0.0 0.0 0.0 0.0 0.0 0.0
133 Sri Lanka LMC 0.33 0.0 3.29 25 0.07 0.5 0.5 0.0 0.0 0.27 0.5 0.0 0.0 0.2 0.0 0.0 0.0
134 Sudan LIC 0.75 0.9 3.59 23 0.21 1.0 1.0 1.0 0.8 0.80 1.0 1.0 1.0 1.0 1.0 0.7 0.7
135 Swaziland LMC 0.75 - - 26 0.09 - - - - - - - - - - - -
136 Sweden HIC 0.00 0.0 4.00 32 0.00 0.0 0.0 0.0 0.0 0.00 0.0 0.0 0.0 0.0 0.0 0.0 0.0
137 Switzerland HIC 0.25 0.0 3.63 29 0.01 0.0 0.0 0.0 0.0 0.00 0.0 0.0 0.0 0.0 0.0 0.0 0.0
138 Syria LMC 0.50 0.0 3.24 22 0.25 0.7 1.0 1.0 0.2 0.74 0.4 0.4 0.4 0.4 0.2 0.0 0.0
139 Taiwan HIC 0.17 0.0 0.18 - - 0.0 0.3 0.5 0.0 0.27 0.3 0.3 0.3 0.3 0.0 0.0 0.0
140 Tajikistan LIC 0.50 - - 21 0.12 - - - - - - - - - - - -
141 Tanzania LIC 0.25 0.2 3.14 21 0.25 0.7 1.0 1.0 0.3 0.73 1.0 0.8 0.8 0.9 0.0 0.0 0.0
142 Thailand LMC 0.33 0.0 3.04 24 0.15 0.0 0.1 0.0 0.0 0.06 0.0 0.0 0.0 0.0 0.0 0.0 0.0

Measuring Gender (In)Equality: Introducing the Gender, Institutions and Development Data Base (GID)
DEV/DOC(2006)01
© OECD 2006
42
143 Timor-Leste LIC 0.83 - - - - - - - - - - - - - - - -
144 Togo LIC 0.75 0.1 2.84 21 0.20 0.6 0.0 0.5 0.0 0.33 1.0 0.7 0.7 0.8 0.0 0.0 0.0
145 Trinidad and Tobago UMC 0.33 - - 27 0.09 - - - - - - - - - - - -
146 Tunisia LMC 0.25 0.0 3.65 27 0.03 0.0 0.7 1.0 0.0 0.43 0.0 0.0 0.0 0.0 0.0 0.0 0.0
147 Turkey LMC 0.42 0.0 2.78 22 0.16 0.0 0.0 0.0 0.0 0.04 0.5 0.0 0.0 0.2 0.7 0.0 0.0
148 Turkmenistan LMC 0.75 - - 23 0.06 - - - - - - - - - - - -
149 Uganda LIC 0.75 0.1 2.92 20 0.32 0.3 1.0 1.0 0.0 0.66 0.9 0.9 0.9 0.9 0.0 0.0 0.0
150 Ukraine LMC 0.42 0.0 2.77 22 0.10 0.0 0.0 0.0 0.0 0.03 0.0 0.0 0.0 0.0 0.0 0.0 0.0
151 United Arab Emirates HIC 0.75 0.3 3.54 23 0.19 1.0 1.0 1.0 1.0 0.80 1.0 0.0 0.0 0.3 1.0 0.5 0.5
152 United Kingdom HIC 0.08 0.0 3.25 26 0.02 0.0 0.0 0.0 0.0 0.01 0.0 0.0 0.0 0.0 0.0 0.0 0.0
153 United States HIC 0.33 0.0 3.26 26 0.04 0.0 0.0 0.0 0.0 0.01 0.0 0.0 0.0 0.0 0.0 0.0 0.0
154 Uruguay UMC 0.42 0.0 2.90 23 0.13 0.0 0.0 0.0 0.0 0.03 0.0 0.0 0.0 0.0 0.0 0.0 0.0
155 Uzbekistan LIC 0.75 - - 21 0.13 - - - - - - - - - - - -
156 Venezuela UMC 0.42 0.0 2.78 22 0.18 0.0 0.0 0.0 0.0 0.05 0.0 0.0 0.0 0.0 0.0 0.0 0.0
157 Vietnam LIC 0.75 0.0 2.92 22 0.08 0.0 0.5 0.5 0.0 0.27 0.5 0.3 0.3 0.4 0.0 0.0 0.0
158 West Bank and Gaza LMC - - - 22 0.24 - - - - - - - - - - - -
159 World - - - - - - - - - - - - - - - - -
160 Yemen LIC 0.75 0.2 3.29 21 0.27 1.0 1.0 1.0 1.0 0.82 1.0 0.5 0.7 0.7 1.0 0.5 0.5
161 Zambia LIC 0.75 0.0 3.08 21 0.24 0.8 0.9 1.0 0.0 0.74 0.7 0.7 0.7 0.7 0.0 0.0 0.0
162 Zimbabwe LIC 0.67 0.1 3.03 21 0.23 0.8 0.5 1.0 0.0 0.63 0.9 0.7 0.7 0.8 0.0 0.0 0.0
Note: * Indicators calculated as arithmetic average of single sub-group components. Source: As mentioned in the text

OECD Development Centre Working Paper No. 247
DEV/DOC(2006)01
© OECD 2006
43
Table A.2. Definition of Acronyms
Acronym Definition
VIOL existence of legislation punishing acts of violence against women (3 components)
MUTI estimated prevalence of female genital mutilation (in %)
AGEM mean age of marriage of women (in years)
MARR percentage of women ever married between 15-19 years
POLY acceptance of polygamy within a society (1=completely accepted)
AUTH parental authority over children given equally to men and women (0=yes)
INHR inheritance rights given equally to men and women (0=yes)
REPU men have the right of repudiation (1=yes)
LAND women's right to acquire and own land (0=no discrimination)
LOAN women's access to bank loans (0=no discrimination)
PATR women's right to own property other than land (0=no discrimination)
VEIL requirement that women wear a veil in public (1=yes)
MOVE women's freedom of movement in public (1=discrimination)
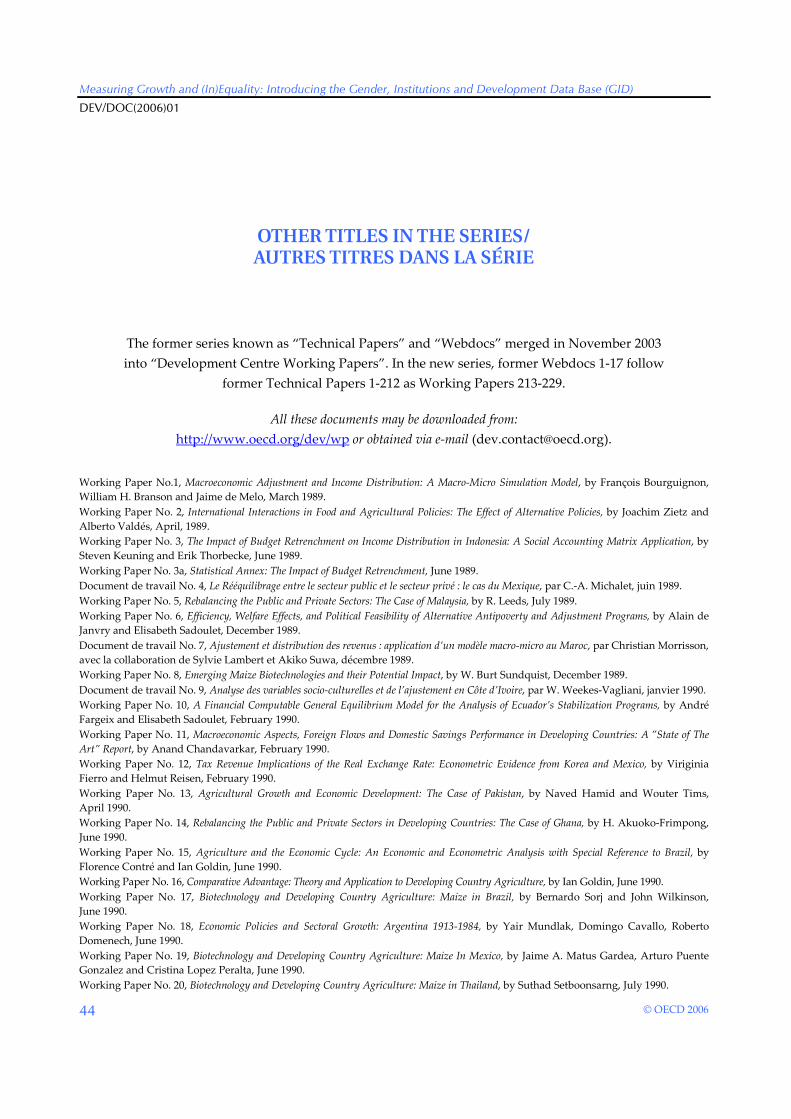
Measuring Growth and (In)Equality: Introducing the Gender, Institutions and Development Data Base (GID)
DEV/DOC(2006)01
© OECD 2006
44
OTHER TITLES IN THE SERIES/ AUTRES TITRES DANS LA SÉRIE
The former series known as “Technical Papers” and “Webdocs” merged in November 2003 into “Development Centre Working Papers”. In the new series, former Webdocs 1-17 follow
former Technical Papers 1-212 as Working Papers 213-229.
All these documents may be downloaded from: http://www.oecd.org/dev/wp or obtained via e-mail ([email protected]).
Working Paper No.1, Macroeconomic Adjustment and Income Distribution: A Macro-Micro Simulation Model, by François Bourguignon, William H. Branson and Jaime de Melo, March 1989. Working Paper No. 2, International Interactions in Food and Agricultural Policies: The Effect of Alternative Policies, by Joachim Zietz and Alberto Valdés, April, 1989. Working Paper No. 3, The Impact of Budget Retrenchment on Income Distribution in Indonesia: A Social Accounting Matrix Application, by Steven Keuning and Erik Thorbecke, June 1989. Working Paper No. 3a, Statistical Annex: The Impact of Budget Retrenchment, June 1989. Document de travail No. 4, Le Rééquilibrage entre le secteur public et le secteur privé : le cas du Mexique, par C.-A. Michalet, juin 1989. Working Paper No. 5, Rebalancing the Public and Private Sectors: The Case of Malaysia, by R. Leeds, July 1989. Working Paper No. 6, Efficiency, Welfare Effects, and Political Feasibility of Alternative Antipoverty and Adjustment Programs, by Alain de Janvry and Elisabeth Sadoulet, December 1989. Document de travail No. 7, Ajustement et distribution des revenus : application d’un modèle macro-micro au Maroc, par Christian Morrisson, avec la collaboration de Sylvie Lambert et Akiko Suwa, décembre 1989. Working Paper No. 8, Emerging Maize Biotechnologies and their Potential Impact, by W. Burt Sundquist, December 1989. Document de travail No. 9, Analyse des variables socio-culturelles et de l’ajustement en Côte d’Ivoire, par W. Weekes-Vagliani, janvier 1990. Working Paper No. 10, A Financial Computable General Equilibrium Model for the Analysis of Ecuador’s Stabilization Programs, by André Fargeix and Elisabeth Sadoulet, February 1990. Working Paper No. 11, Macroeconomic Aspects, Foreign Flows and Domestic Savings Performance in Developing Countries: A ”State of The Art” Report, by Anand Chandavarkar, February 1990. Working Paper No. 12, Tax Revenue Implications of the Real Exchange Rate: Econometric Evidence from Korea and Mexico, by Viriginia Fierro and Helmut Reisen, February 1990. Working Paper No. 13, Agricultural Growth and Economic Development: The Case of Pakistan, by Naved Hamid and Wouter Tims, April 1990. Working Paper No. 14, Rebalancing the Public and Private Sectors in Developing Countries: The Case of Ghana, by H. Akuoko-Frimpong, June 1990. Working Paper No. 15, Agriculture and the Economic Cycle: An Economic and Econometric Analysis with Special Reference to Brazil, by Florence Contré and Ian Goldin, June 1990. Working Paper No. 16, Comparative Advantage: Theory and Application to Developing Country Agriculture, by Ian Goldin, June 1990. Working Paper No. 17, Biotechnology and Developing Country Agriculture: Maize in Brazil, by Bernardo Sorj and John Wilkinson, June 1990. Working Paper No. 18, Economic Policies and Sectoral Growth: Argentina 1913-1984, by Yair Mundlak, Domingo Cavallo, Roberto Domenech, June 1990. Working Paper No. 19, Biotechnology and Developing Country Agriculture: Maize In Mexico, by Jaime A. Matus Gardea, Arturo Puente Gonzalez and Cristina Lopez Peralta, June 1990. Working Paper No. 20, Biotechnology and Developing Country Agriculture: Maize in Thailand, by Suthad Setboonsarng, July 1990.
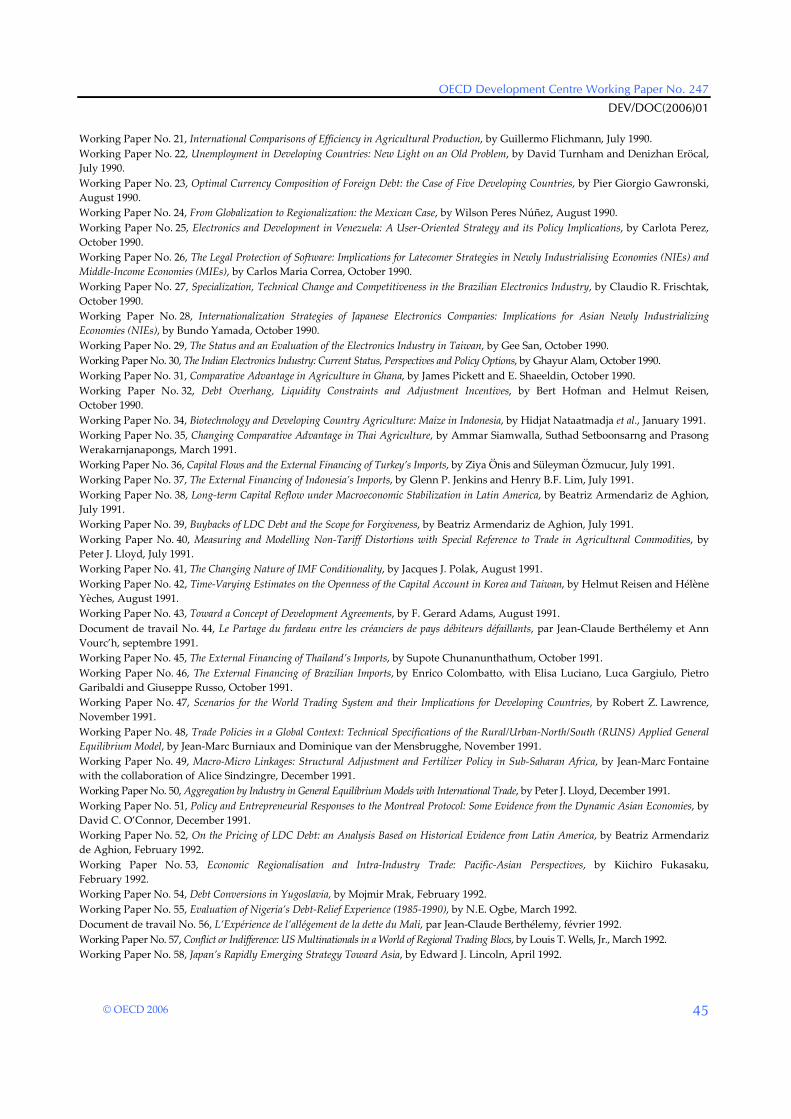
OECD Development Centre Working Paper No. 247
DEV/DOC(2006)01
© OECD 2006
45
Working Paper No. 21, International Comparisons of Efficiency in Agricultural Production, by Guillermo Flichmann, July 1990. Working Paper No. 22, Unemployment in Developing Countries: New Light on an Old Problem, by David Turnham and Denizhan Eröcal, July 1990. Working Paper No. 23, Optimal Currency Composition of Foreign Debt: the Case of Five Developing Countries, by Pier Giorgio Gawronski, August 1990. Working Paper No. 24, From Globalization to Regionalization: the Mexican Case, by Wilson Peres Núñez, August 1990. Working Paper No. 25, Electronics and Development in Venezuela: A User-Oriented Strategy and its Policy Implications, by Carlota Perez, October 1990. Working Paper No. 26, The Legal Protection of Software: Implications for Latecomer Strategies in Newly Industrialising Economies (NIEs) and Middle-Income Economies (MIEs), by Carlos Maria Correa, October 1990. Working Paper No. 27, Specialization, Technical Change and Competitiveness in the Brazilian Electronics Industry, by Claudio R. Frischtak, October 1990. Working Paper No. 28, Internationalization Strategies of Japanese Electronics Companies: Implications for Asian Newly Industrializing Economies (NIEs), by Bundo Yamada, October 1990. Working Paper No. 29, The Status and an Evaluation of the Electronics Industry in Taiwan, by Gee San, October 1990. Working Paper No. 30, The Indian Electronics Industry: Current Status, Perspectives and Policy Options, by Ghayur Alam, October 1990. Working Paper No. 31, Comparative Advantage in Agriculture in Ghana, by James Pickett and E. Shaeeldin, October 1990. Working Paper No. 32, Debt Overhang, Liquidity Constraints and Adjustment Incentives, by Bert Hofman and Helmut Reisen, October 1990. Working Paper No. 34, Biotechnology and Developing Country Agriculture: Maize in Indonesia, by Hidjat Nataatmadja et al., January 1991. Working Paper No. 35, Changing Comparative Advantage in Thai Agriculture, by Ammar Siamwalla, Suthad Setboonsarng and Prasong Werakarnjanapongs, March 1991. Working Paper No. 36, Capital Flows and the External Financing of Turkey’s Imports, by Ziya Önis and Süleyman Özmucur, July 1991. Working Paper No. 37, The External Financing of Indonesia’s Imports, by Glenn P. Jenkins and Henry B.F. Lim, July 1991. Working Paper No. 38, Long-term Capital Reflow under Macroeconomic Stabilization in Latin America, by Beatriz Armendariz de Aghion, July 1991. Working Paper No. 39, Buybacks of LDC Debt and the Scope for Forgiveness, by Beatriz Armendariz de Aghion, July 1991. Working Paper No. 40, Measuring and Modelling Non-Tariff Distortions with Special Reference to Trade in Agricultural Commodities, by Peter J. Lloyd, July 1991. Working Paper No. 41, The Changing Nature of IMF Conditionality, by Jacques J. Polak, August 1991. Working Paper No. 42, Time-Varying Estimates on the Openness of the Capital Account in Korea and Taiwan, by Helmut Reisen and Hélène Yèches, August 1991. Working Paper No. 43, Toward a Concept of Development Agreements, by F. Gerard Adams, August 1991. Document de travail No. 44, Le Partage du fardeau entre les créanciers de pays débiteurs défaillants, par Jean-Claude Berthélemy et Ann Vourc’h, septembre 1991. Working Paper No. 45, The External Financing of Thailand’s Imports, by Supote Chunanunthathum, October 1991. Working Paper No. 46, The External Financing of Brazilian Imports, by Enrico Colombatto, with Elisa Luciano, Luca Gargiulo, Pietro Garibaldi and Giuseppe Russo, October 1991. Working Paper No. 47, Scenarios for the World Trading System and their Implications for Developing Countries, by Robert Z. Lawrence, November 1991. Working Paper No. 48, Trade Policies in a Global Context: Technical Specifications of the Rural/Urban-North/South (RUNS) Applied General Equilibrium Model, by Jean-Marc Burniaux and Dominique van der Mensbrugghe, November 1991. Working Paper No. 49, Macro-Micro Linkages: Structural Adjustment and Fertilizer Policy in Sub-Saharan Africa, by Jean-Marc Fontaine with the collaboration of Alice Sindzingre, December 1991. Working Paper No. 50, Aggregation by Industry in General Equilibrium Models with International Trade, by Peter J. Lloyd, December 1991. Working Paper No. 51, Policy and Entrepreneurial Responses to the Montreal Protocol: Some Evidence from the Dynamic Asian Economies, by David C. O’Connor, December 1991. Working Paper No. 52, On the Pricing of LDC Debt: an Analysis Based on Historical Evidence from Latin America, by Beatriz Armendariz de Aghion, February 1992. Working Paper No. 53, Economic Regionalisation and Intra-Industry Trade: Pacific-Asian Perspectives, by Kiichiro Fukasaku, February 1992. Working Paper No. 54, Debt Conversions in Yugoslavia, by Mojmir Mrak, February 1992. Working Paper No. 55, Evaluation of Nigeria’s Debt-Relief Experience (1985-1990), by N.E. Ogbe, March 1992. Document de travail No. 56, L’Expérience de l’allégement de la dette du Mali, par Jean-Claude Berthélemy, février 1992. Working Paper No. 57, Conflict or Indifference: US Multinationals in a World of Regional Trading Blocs, by Louis T. Wells, Jr., March 1992. Working Paper No. 58, Japan’s Rapidly Emerging Strategy Toward Asia, by Edward J. Lincoln, April 1992.
Measuring Growth and (In)Equality: Introducing the Gender, Institutions and Development Data Base (GID)
DEV/DOC(2006)01
© OECD 2006
46
Working Paper No. 59, The Political Economy of Stabilization Programmes in Developing Countries, by Bruno S. Frey and Reiner Eichenberger, April 1992. Working Paper No. 60, Some Implications of Europe 1992 for Developing Countries, by Sheila Page, April 1992. Working Paper No. 61, Taiwanese Corporations in Globalisation and Regionalisation, by Gee San, April 1992. Working Paper No. 62, Lessons from the Family Planning Experience for Community-Based Environmental Education, by Winifred Weekes-Vagliani, April 1992. Working Paper No. 63, Mexican Agriculture in the Free Trade Agreement: Transition Problems in Economic Reform, by Santiago Levy and Sweder van Wijnbergen, May 1992. Working Paper No. 64, Offensive and Defensive Responses by European Multinationals to a World of Trade Blocs, by John M. Stopford, May 1992. Working Paper No. 65, Economic Integration in the Pacific Region, by Richard Drobnick, May 1992. Working Paper No. 66, Latin America in a Changing Global Environment, by Winston Fritsch, May 1992. Working Paper No. 67, An Assessment of the Brady Plan Agreements, by Jean-Claude Berthélemy and Robert Lensink, May 1992. Working Paper No. 68, The Impact of Economic Reform on the Performance of the Seed Sector in Eastern and Southern Africa, by Elizabeth Cromwell, June 1992. Working Paper No. 69, Impact of Structural Adjustment and Adoption of Technology on Competitiveness of Major Cocoa Producing Countries, by Emily M. Bloomfield and R. Antony Lass, June 1992. Working Paper No. 70, Structural Adjustment and Moroccan Agriculture: an Assessment of the Reforms in the Sugar and Cereal Sectors, by Jonathan Kydd and Sophie Thoyer, June 1992. Document de travail No. 71, L’Allégement de la dette au Club de Paris : les évolutions récentes en perspective, par Ann Vourc’h, juin 1992. Working Paper No. 72, Biotechnology and the Changing Public/Private Sector Balance: Developments in Rice and Cocoa, by Carliene Brenner, July 1992. Working Paper No. 73, Namibian Agriculture: Policies and Prospects, by Walter Elkan, Peter Amutenya, Jochbeth Andima, Robin Sherbourne and Eline van der Linden, July 1992. Working Paper No. 74, Agriculture and the Policy Environment: Zambia and Zimbabwe, by Doris J. Jansen and Andrew Rukovo, July 1992. Working Paper No. 75, Agricultural Productivity and Economic Policies: Concepts and Measurements, by Yair Mundlak, August 1992. Working Paper No. 76, Structural Adjustment and the Institutional Dimensions of Agricultural Research and Development in Brazil: Soybeans, Wheat and Sugar Cane, by John Wilkinson and Bernardo Sorj, August 1992. Working Paper No. 77, The Impact of Laws and Regulations on Micro and Small Enterprises in Niger and Swaziland, by Isabelle Joumard, Carl Liedholm and Donald Mead, September 1992. Working Paper No. 78, Co-Financing Transactions between Multilateral Institutions and International Banks, by Michel Bouchet and Amit Ghose, October 1992. Document de travail No. 79, Allégement de la dette et croissance : le cas mexicain, par Jean-Claude Berthélemy et Ann Vourc’h, octobre 1992. Document de travail No. 80, Le Secteur informel en Tunisie : cadre réglementaire et pratique courante, par Abderrahman Ben Zakour et Farouk Kria, novembre 1992. Working Paper No. 81, Small-Scale Industries and Institutional Framework in Thailand, by Naruemol Bunjongjit and Xavier Oudin, November 1992. Working Paper No. 81a, Statistical Annex: Small-Scale Industries and Institutional Framework in Thailand, by Naruemol Bunjongjit and Xavier Oudin, November 1992. Document de travail No. 82, L’Expérience de l’allégement de la dette du Niger, par Ann Vourc’h et Maina Boukar Moussa, novembre 1992. Working Paper No. 83, Stabilization and Structural Adjustment in Indonesia: an Intertemporal General Equilibrium Analysis, by David Roland-Holst, November 1992. Working Paper No. 84, Striving for International Competitiveness: Lessons from Electronics for Developing Countries, by Jan Maarten de Vet, March 1993. Document de travail No. 85, Micro-entreprises et cadre institutionnel en Algérie, par Hocine Benissad, mars 1993. Working Paper No. 86, Informal Sector and Regulations in Ecuador and Jamaica, by Emilio Klein and Victor E. Tokman, August 1993. Working Paper No. 87, Alternative Explanations of the Trade-Output Correlation in the East Asian Economies, by Colin I. Bradford Jr. and Naomi Chakwin, August 1993. Document de travail No. 88, La Faisabilité politique de l’ajustement dans les pays africains, par Christian Morrisson, Jean-Dominique Lafay et Sébastien Dessus, novembre 1993. Working Paper No. 89, China as a Leading Pacific Economy, by Kiichiro Fukasaku and Mingyuan Wu, November 1993. Working Paper No. 90, A Detailed Input-Output Table for Morocco, 1990, by Maurizio Bussolo and David Roland-Holst November 1993. Working Paper No. 91, International Trade and the Transfer of Environmental Costs and Benefits, by Hiro Lee and David Roland-Holst, December 1993. Working Paper No. 92, Economic Instruments in Environmental Policy: Lessons from the OECD Experience and their Relevance to Developing Economies, by Jean-Philippe Barde, January 1994.
OECD Development Centre Working Paper No. 247
DEV/DOC(2006)01
© OECD 2006
47
Working Paper No. 93, What Can Developing Countries Learn from OECD Labour Market Programmes and Policies?, by Åsa Sohlman with David Turnham, January 1994. Working Paper No. 94, Trade Liberalization and Employment Linkages in the Pacific Basin, by Hiro Lee and David Roland-Holst, February 1994. Working Paper No. 95, Participatory Development and Gender: Articulating Concepts and Cases, by Winifred Weekes-Vagliani, February 1994. Document de travail No. 96, Promouvoir la maîtrise locale et régionale du développement : une démarche participative à Madagascar, par Philippe de Rham et Bernard Lecomte, juin 1994. Working Paper No. 97, The OECD Green Model: an Updated Overview, by Hiro Lee, Joaquim Oliveira-Martins and Dominique van der Mensbrugghe, August 1994. Working Paper No. 98, Pension Funds, Capital Controls and Macroeconomic Stability, by Helmut Reisen and John Williamson, August 1994. Working Paper No. 99, Trade and Pollution Linkages: Piecemeal Reform and Optimal Intervention, by John Beghin, David Roland-Holst and Dominique van der Mensbrugghe, October 1994. Working Paper No. 100, International Initiatives in Biotechnology for Developing Country Agriculture: Promises and Problems, by Carliene Brenner and John Komen, October 1994. Working Paper No. 101, Input-based Pollution Estimates for Environmental Assessment in Developing Countries, by Sébastien Dessus, David Roland-Holst and Dominique van der Mensbrugghe, October 1994. Working Paper No. 102, Transitional Problems from Reform to Growth: Safety Nets and Financial Efficiency in the Adjusting Egyptian Economy, by Mahmoud Abdel-Fadil, December 1994. Working Paper No. 103, Biotechnology and Sustainable Agriculture: Lessons from India, by Ghayur Alam, December 1994. Working Paper No. 104, Crop Biotechnology and Sustainability: a Case Study of Colombia, by Luis R. Sanint, January 1995. Working Paper No. 105, Biotechnology and Sustainable Agriculture: the Case of Mexico, by José Luis Solleiro Rebolledo, January 1995. Working Paper No. 106, Empirical Specifications for a General Equilibrium Analysis of Labor Market Policies and Adjustments, by Andréa Maechler and David Roland-Holst, May 1995. Document de travail No. 107, Les Migrants, partenaires de la coopération internationale : le cas des Maliens de France, par Christophe Daum, juillet 1995. Document de travail No. 108, Ouverture et croissance industrielle en Chine : étude empirique sur un échantillon de villes, par Sylvie Démurger, septembre 1995. Working Paper No. 109, Biotechnology and Sustainable Crop Production in Zimbabwe, by John J. Woodend, December 1995. Document de travail No. 110, Politiques de l’environnement et libéralisation des échanges au Costa Rica : une vue d’ensemble, par Sébastien Dessus et Maurizio Bussolo, février 1996. Working Paper No. 111, Grow Now/Clean Later, or the Pursuit of Sustainable Development?, by David O’Connor, March 1996. Working Paper No. 112, Economic Transition and Trade-Policy Reform: Lessons from China, by Kiichiro Fukasaku and Henri-Bernard Solignac Lecomte, July 1996. Working Paper No. 113, Chinese Outward Investment in Hong Kong: Trends, Prospects and Policy Implications, by Yun-Wing Sung, July 1996. Working Paper No. 114, Vertical Intra-industry Trade between China and OECD Countries, by Lisbeth Hellvin, July 1996. Document de travail No. 115, Le Rôle du capital public dans la croissance des pays en développement au cours des années 80, par Sébastien Dessus et Rémy Herrera, juillet 1996. Working Paper No. 116, General Equilibrium Modelling of Trade and the Environment, by John Beghin, Sébastien Dessus, David Roland-Holst and Dominique van der Mensbrugghe, September 1996. Working Paper No. 117, Labour Market Aspects of State Enterprise Reform in Viet Nam, by David O’Connor, September 1996. Document de travail No. 118, Croissance et compétitivité de l’industrie manufacturière au Sénégal, par Thierry Latreille et Aristomène Varoudakis, octobre 1996. Working Paper No. 119, Evidence on Trade and Wages in the Developing World, by Donald J. Robbins, December 1996. Working Paper No. 120, Liberalising Foreign Investments by Pension Funds: Positive and Normative Aspects, by Helmut Reisen, January 1997. Document de travail No. 121, Capital Humain, ouverture extérieure et croissance : estimation sur données de panel d’un modèle à coefficients variables, par Jean-Claude Berthélemy, Sébastien Dessus et Aristomène Varoudakis, janvier 1997. Working Paper No. 122, Corruption: The Issues, by Andrew W. Goudie and David Stasavage, January 1997. Working Paper No. 123, Outflows of Capital from China, by David Wall, March 1997. Working Paper No. 124, Emerging Market Risk and Sovereign Credit Ratings, by Guillermo Larraín, Helmut Reisen and Julia von Maltzan, April 1997. Working Paper No. 125, Urban Credit Co-operatives in China, by Eric Girardin and Xie Ping, August 1997. Working Paper No. 126, Fiscal Alternatives of Moving from Unfunded to Funded Pensions, by Robert Holzmann, August 1997. Working Paper No. 127, Trade Strategies for the Southern Mediterranean, by Peter A. Petri, December 1997. Working Paper No. 128, The Case of Missing Foreign Investment in the Southern Mediterranean, by Peter A. Petri, December 1997.
Measuring Growth and (In)Equality: Introducing the Gender, Institutions and Development Data Base (GID)
DEV/DOC(2006)01
© OECD 2006
48
Working Paper No. 129, Economic Reform in Egypt in a Changing Global Economy, by Joseph Licari, December 1997. Working Paper No. 130, Do Funded Pensions Contribute to Higher Aggregate Savings? A Cross-Country Analysis, by Jeanine Bailliu and Helmut Reisen, December 1997. Working Paper No. 131, Long-run Growth Trends and Convergence Across Indian States, by Rayaprolu Nagaraj, Aristomène Varoudakis and Marie-Ange Véganzonès, January 1998. Working Paper No. 132, Sustainable and Excessive Current Account Deficits, by Helmut Reisen, February 1998. Working Paper No. 133, Intellectual Property Rights and Technology Transfer in Developing Country Agriculture: Rhetoric and Reality, by Carliene Brenner, March 1998. Working Paper No. 134, Exchange-rate Management and Manufactured Exports in Sub-Saharan Africa, by Khalid Sekkat and Aristomène Varoudakis, March 1998. Working Paper No. 135, Trade Integration with Europe, Export Diversification and Economic Growth in Egypt, by Sébastien Dessus and Akiko Suwa-Eisenmann, June 1998. Working Paper No. 136, Domestic Causes of Currency Crises: Policy Lessons for Crisis Avoidance, by Helmut Reisen, June 1998. Working Paper No. 137, A Simulation Model of Global Pension Investment, by Landis MacKellar and Helmut Reisen, August 1998. Working Paper No. 138, Determinants of Customs Fraud and Corruption: Evidence from Two African Countries, by David Stasavage and Cécile Daubrée, August 1998. Working Paper No. 139, State Infrastructure and Productive Performance in Indian Manufacturing, by Arup Mitra, Aristomène Varoudakis and Marie-Ange Véganzonès, August 1998. Working Paper No. 140, Rural Industrial Development in Viet Nam and China: A Study in Contrasts, by David O’Connor, September 1998. Working Paper No. 141,Labour Market Aspects of State Enterprise Reform in China, by Fan Gang,Maria Rosa Lunati and David O’Connor, October 1998. Working Paper No. 142, Fighting Extreme Poverty in Brazil: The Influence of Citizens’ Action on Government Policies, by Fernanda Lopes de Carvalho, November 1998. Working Paper No. 143, How Bad Governance Impedes Poverty Alleviation in Bangladesh, by Rehman Sobhan, November 1998. Document de travail No. 144, La libéralisation de l’agriculture tunisienne et l’Union européenne: une vue prospective, par Mohamed Abdelbasset Chemingui et Sébastien Dessus, février 1999. Working Paper No. 145, Economic Policy Reform and Growth Prospects in Emerging African Economies, by Patrick Guillaumont, Sylviane Guillaumont Jeanneney and Aristomène Varoudakis, March 1999. Working Paper No. 146, Structural Policies for International Competitiveness in Manufacturing: The Case of Cameroon, by Ludvig Söderling, March 1999. Working Paper No. 147, China’s Unfinished Open-Economy Reforms: Liberalisation of Services, by Kiichiro Fukasaku, Yu Ma and Qiumei Yang, April 1999. Working Paper No. 148, Boom and Bust and Sovereign Ratings, by Helmut Reisen and Julia von Maltzan, June 1999. Working Paper No. 149, Economic Opening and the Demand for Skills in Developing Countries: A Review of Theory and Evidence, by David O’Connor and Maria Rosa Lunati, June 1999. Working Paper No. 150, The Role of Capital Accumulation, Adjustment and Structural Change for Economic Take-off: Empirical Evidence from African Growth Episodes, by Jean-Claude Berthélemy and Ludvig Söderling, July 1999. Working Paper No. 151, Gender, Human Capital and Growth: Evidence from Six Latin American Countries, by Donald J. Robbins, September 1999. Working Paper No. 152, The Politics and Economics of Transition to an Open Market Economy in Viet Nam, by James Riedel and William S. Turley, September 1999. Working Paper No. 153, The Economics and Politics of Transition to an Open Market Economy: China, by Wing Thye Woo, October 1999. Working Paper No. 154, Infrastructure Development and Regulatory Reform in Sub-Saharan Africa: The Case of Air Transport, by Andrea E. Goldstein, October 1999. Working Paper No. 155, The Economics and Politics of Transition to an Open Market Economy: India, by Ashok V. Desai, October 1999. Working Paper No. 156, Climate Policy Without Tears: CGE-Based Ancillary Benefits Estimates for Chile, by Sébastien Dessus and David O’Connor, November 1999. Document de travail No. 157, Dépenses d’éducation, qualité de l’éducation et pauvreté : l’exemple de cinq pays d’Afrique francophone, par Katharina Michaelowa, avril 2000. Document de travail No. 158, Une estimation de la pauvreté en Afrique subsaharienne d’après les données anthropométriques, par Christian Morrisson, Hélène Guilmeau et Charles Linskens, mai 2000. Working Paper No. 159, Converging European Transitions, by Jorge Braga de Macedo, July 2000. Working Paper No. 160, Capital Flows and Growth in Developing Countries: Recent Empirical Evidence, by Marcelo Soto, July 2000. Working Paper No. 161, Global Capital Flows and the Environment in the 21st Century, by David O’Connor, July 2000. Working Paper No. 162, Financial Crises and International Architecture: A “Eurocentric” Perspective, by Jorge Braga de Macedo, August 2000. Document de travail No. 163, Résoudre le problème de la dette : de l’initiative PPTE à Cologne, par Anne Joseph, août 2000.
OECD Development Centre Working Paper No. 247
DEV/DOC(2006)01
© OECD 2006
49
Working Paper No. 164, E-Commerce for Development: Prospects and Policy Issues, by Andrea Goldstein and David O’Connor, September 2000. Working Paper No. 165, Negative Alchemy? Corruption and Composition of Capital Flows, by Shang-Jin Wei, October 2000. Working Paper No. 166, The HIPC Initiative: True and False Promises, by Daniel Cohen, October 2000. Document de travail No. 167, Les facteurs explicatifs de la malnutrition en Afrique subsaharienne, par Christian Morrisson et Charles Linskens, octobre 2000. Working Paper No. 168, Human Capital and Growth: A Synthesis Report, by Christopher A. Pissarides, November 2000. Working Paper No. 169, Obstacles to Expanding Intra-African Trade, by Roberto Longo and Khalid Sekkat, March 2001. Working Paper No. 170, Regional Integration In West Africa, by Ernest Aryeetey, March 2001. Working Paper No. 171, Regional Integration Experience in the Eastern African Region, by Andrea Goldstein and Njuguna S. Ndung’u, March 2001. Working Paper No. 172, Integration and Co-operation in Southern Africa, by Carolyn Jenkins, March 2001. Working Paper No. 173, FDI in Sub-Saharan Africa, by Ludger Odenthal, March 2001 Document de travail No. 174, La réforme des télécommunications en Afrique subsaharienne, par Patrick Plane, mars 2001. Working Paper No. 175, Fighting Corruption in Customs Administration: What Can We Learn from Recent Experiences?, by Irène Hors; April 2001. Working Paper No. 176, Globalisation and Transformation: Illusions and Reality, by Grzegorz W. Kolodko, May 2001. Working Paper No. 177, External Solvency, Dollarisation and Investment Grade: Towards a Virtuous Circle?, by Martin Grandes, June 2001. Document de travail No. 178, Congo 1965-1999: Les espoirs déçus du « Brésil africain », par Joseph Maton avec Henri-Bernard Solignac Lecomte, septembre 2001. Working Paper No. 179, Growth and Human Capital: Good Data, Good Results, by Daniel Cohen and Marcelo Soto, September 2001. Working Paper No. 180, Corporate Governance and National Development, by Charles P. Oman, October 2001. Working Paper No. 181, How Globalisation Improves Governance, by Federico Bonaglia, Jorge Braga de Macedo and Maurizio Bussolo, November 2001. Working Paper No. 182, Clearing the Air in India: The Economics of Climate Policy with Ancillary Benefits, by Maurizio Bussolo and David O’Connor, November 2001. Working Paper No. 183, Globalisation, Poverty and Inequality in sub-Saharan Africa: A Political Economy Appraisal, by Yvonne M. Tsikata, December 2001. Working Paper No. 184, Distribution and Growth in Latin America in an Era of Structural Reform: The Impact of Globalisation, by Samuel A. Morley, December 2001. Working Paper No. 185, Globalisation, Liberalisation, Poverty and Income Inequality in Southeast Asia, by K.S. Jomo, December 2001. Working Paper No. 186, Globalisation, Growth and Income Inequality: The African Experience, by Steve Kayizzi-Mugerwa, December 2001. Working Paper No. 187, The Social Impact of Globalisation in Southeast Asia, by Mari Pangestu, December 2001. Working Paper No. 188, Where Does Inequality Come From? Ideas and Implications for Latin America, by James A. Robinson, December 2001. Working Paper No. 189, Policies and Institutions for E-Commerce Readiness: What Can Developing Countries Learn from OECD Experience?, by Paulo Bastos Tigre and David O’Connor, April 2002. Document de travail No. 190, La réforme du secteur financier en Afrique, par Anne Joseph, juillet 2002. Working Paper No. 191, Virtuous Circles? Human Capital Formation, Economic Development and the Multinational Enterprise, by Ethan B. Kapstein, August 2002. Working Paper No. 192, Skill Upgrading in Developing Countries: Has Inward Foreign Direct Investment Played a Role?, by Matthew J. Slaughter, August 2002. Working Paper No. 193, Government Policies for Inward Foreign Direct Investment in Developing Countries: Implications for Human Capital Formation and Income Inequality, by Dirk Willem te Velde, August 2002. Working Paper No. 194, Foreign Direct Investment and Intellectual Capital Formation in Southeast Asia, by Bryan K. Ritchie, August 2002. Working Paper No. 195, FDI and Human Capital: A Research Agenda, by Magnus Blomström and Ari Kokko, August 2002. Working Paper No. 196, Knowledge Diffusion from Multinational Enterprises: The Role of Domestic and Foreign Knowledge-Enhancing Activities, by Yasuyuki Todo and Koji Miyamoto, August 2002. Working Paper No. 197, Why Are Some Countries So Poor? Another Look at the Evidence and a Message of Hope, by Daniel Cohen and Marcelo Soto, October 2002. Working Paper No. 198, Choice of an Exchange-Rate Arrangement, Institutional Setting and Inflation: Empirical Evidence from Latin America, by Andreas Freytag, October 2002. Working Paper No. 199, Will Basel II Affect International Capital Flows to Emerging Markets?, by Beatrice Weder and Michael Wedow, October 2002. Working Paper No. 200, Convergence and Divergence of Sovereign Bond Spreads: Lessons from Latin America, by Martin Grandes, October 2002. Working Paper No. 201, Prospects for Emerging-Market Flows amid Investor Concerns about Corporate Governance, by Helmut Reisen, November 2002.

Measuring Growth and (In)Equality: Introducing the Gender, Institutions and Development Data Base (GID)
DEV/DOC(2006)01
© OECD 2006
50
Working Paper No. 202, Rediscovering Education in Growth Regressions, by Marcelo Soto, November 2002. Working Paper No. 203, Incentive Bidding for Mobile Investment: Economic Consequences and Potential Responses, by Andrew Charlton, January 2003. Working Paper No. 204, Health Insurance for the Poor? Determinants of participation Community-Based Health Insurance Schemes in Rural Senegal, by Johannes Jütting, January 2003. Working Paper No. 205, China’s Software Industry and its Implications for India, by Ted Tschang, February 2003. Working Paper No. 206, Agricultural and Human Health Impacts of Climate Policy in China: A General Equilibrium Analysis with Special Reference to Guangdong, by David O’Connor, Fan Zhai, Kristin Aunan, Terje Berntsen and Haakon Vennemo, March 2003. Working Paper No. 207, India’s Information Technology Sector: What Contribution to Broader Economic Development?, by Nirvikar Singh, March 2003. Working Paper No. 208, Public Procurement: Lessons from Kenya, Tanzania and Uganda, by Walter Odhiambo and Paul Kamau, March 2003. Working Paper No. 209, Export Diversification in Low-Income Countries: An International Challenge after Doha, by Federico Bonaglia and Kiichiro Fukasaku, June 2003. Working Paper No. 210, Institutions and Development: A Critical Review, by Johannes Jütting, July 2003. Working Paper No. 211, Human Capital Formation and Foreign Direct Investment in Developing Countries, by Koji Miyamoto, July 2003. Working Paper No. 212, Central Asia since 1991: The Experience of the New Independent States, by Richard Pomfret, July 2003. Working Paper No. 213, A Multi-Region Social Accounting Matrix (1995) and Regional Environmental General Equilibrium Model for India (REGEMI), by Maurizio Bussolo, Mohamed Chemingui and David O’Connor, November 2003. Working Paper No. 214, Ratings Since the Asian Crisis, by Helmut Reisen, November 2003. Working Paper No. 215, Development Redux: Reflections for a New Paradigm, by Jorge Braga de Macedo, November 2003. Working Paper No. 216, The Political Economy of Regulatory Reform: Telecoms in the Southern Mediterranean, by Andrea Goldstein, November 2003. Working Paper No. 217, The Impact of Education on Fertility and Child Mortality: Do Fathers Really Matter Less than Mothers?, by Lucia Breierova and Esther Duflo, November 2003. Working Paper No. 218, Float in Order to Fix? Lessons from Emerging Markets for EU Accession Countries, by Jorge Braga de Macedo and Helmut Reisen, November 2003. Working Paper No. 219, Globalisation in Developing Countries: The Role of Transaction Costs in Explaining Economic Performance in India, by Maurizio Bussolo and John Whalley, November 2003. Working Paper No. 220, Poverty Reduction Strategies in a Budget-Constrained Economy: The Case of Ghana, by Maurizio Bussolo and Jeffery I. Round, November 2003. Working Paper No. 221, Public-Private Partnerships in Development: Three Applications in Timor Leste, by José Braz, November 2003. Working Paper No. 222, Public Opinion Research, Global Education and Development Co-operation Reform: In Search of a Virtuous Circle, by Ida Mc Donnell, Henri-Bernard Solignac Lecomte and Liam Wegimont, November 2003. Working Paper No. 223, Building Capacity to Trade: What Are the Priorities?, by Henry-Bernard Solignac Lecomte, November 2003. Working Paper No. 224, Of Flying Geeks and O-Rings: Locating Software and IT Services in India’s Economic Development, by David O’Connor, November 2003. Document de travail No. 225, Cap Vert: Gouvernance et Développement, par Jaime Lourenço and Colm Foy, novembre 2003. Working Paper No. 226, Globalisation and Poverty Changes in Colombia, by Maurizio Bussolo and Jann Lay, November 2003. Working Paper No. 227, The Composite Indicator of Economic Activity in Mozambique (ICAE): Filling in the Knowledge Gaps to Enhance Public-Private Partnership (PPP), by Roberto J. Tibana, November 2003. Working Paper No. 228, Economic-Reconstruction in Post-Conflict Transitions: Lessons for the Democratic Republic of Congo (DRC), by Graciana del Castillo, November 2003. Working Paper No. 229, Providing Low-Cost Information Technology Access to Rural Communities In Developing Countries: What Works? What Pays? by Georg Caspary and David O’Connor, November 2003. Working Paper No. 230, The Currency Premium and Local-Currency Denominated Debt Costs in South Africa, by Martin Grandes, Marcel Peter and Nicolas Pinaud, December 2003. Working Paper No. 231, Macroeconomic Convergence in Southern Africa: The Rand Zone Experience, by Martin Grandes, December 2003. Working Paper No. 232, Financing Global and Regional Public Goods through ODA: Analysis and Evidence from the OECD Creditor Reporting System, by Helmut Reisen, Marcelo Soto and Thomas Weithöner, January 2004. Working Paper No. 233, Land, Violent Conflict and Development, by Nicolas Pons-Vignon and Henri-Bernard Solignac Lecomte, February 2004. Working Paper No. 234, The Impact of Social Institutions on the Economic Role of Women in Developing Countries, by Christian Morrisson and Johannes Jütting, May 2004. Document de travail No. 235, La condition desfemmes en Inde, Kenya, Soudan et Tunisie, par Christian Morrisson, août 2004. Working Paper No. 236, Decentralisation and Poverty in Developing Countries: Exploring the Impact, by Johannes Jütting, Céline Kauffmann, Ida Mc Donnell, Holger Osterrieder, Nicolas Pinaud and Lucia Wegner, August 2004. Working Paper No. 237, Natural Disasters and Adaptive Capacity, by Jeff Dayton-Johnson, August 2004.
OECD Development Centre Working Paper No. 247
DEV/DOC(2006)01
© OECD 2006
51
Working Paper No. 238, Public Opinion Polling and the Millennium Development Goals, by Jude Fransman, Alphonse L. MacDonnald, Ida Mc Donnell and Nicolas Pons-Vignon, October 2004. Working Paper No. 239, Overcoming Barriers to Competitiveness, by Orsetta Causa and Daniel Cohen, December 2004. Working Paper No. 240, Extending Insurance? Funeral Associations in Ethiopia and Tanzania, by Stefan Dercon, Tessa Bold, Joachim De Weerdt and Alula Pankhurst, December 2004. Working Paper No. 241, Macroeconomic Policies: New Issues of Interdependence, by Helmut Reisen, Martin Grandes and Nicolas Pinaud, January 2005. Working Paper No. 242, Institutional Change and its Impact on the Poor and Excluded: The Indian Decentralisation Experience, by D. Narayana, January 2005. Working Paper No. 243, Impact of Changes in Social Institutions on Income Inequality in China, by Hiroko Uchimura, May 2005. Working Paper No. 244, Priorities in Global Assistance for Health, AIDS and Population (HAP), by Landis MacKellar, June 2005. Working Paper No. 245, Trade and Structural Adjustment Policies in Selected Developing Countries, by Jens Andersson, Federico Bonaglia, Kiichiro Fukasaku and Caroline Lesser, July 2005. Working Paper No. 246, Economic Growth and Poverty Reduction: Measurement and Policy Issues, by Stephan Klasen.


![Economic Brief - Climate Change, Gender and Development in ... · Climate Change, Gender and Development in Africa ... AfDB Climate Change, Gender and Development in Africa. [ ] 2](https://static.fdocuments.in/doc/165x107/5c813f5a09d3f28e2f8c1f41/economic-brief-climate-change-gender-and-development-in-climate-change.jpg)