Objectives of quality measurement Classification of software quality metrics Process metrics
36
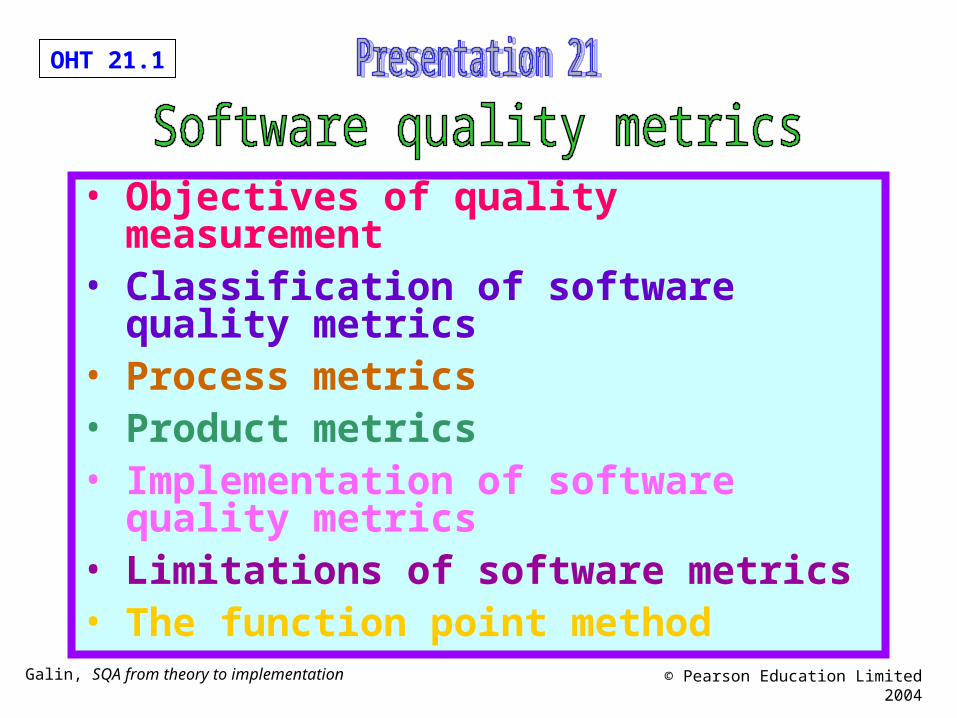
OHT 21.1 Galin, SQA from theory to implementation © Pearson Education Limited 2004 • Objectives of quality measurement • Classification of software quality metrics • Process metrics • Product metrics • Implementation of software quality metrics • Limitations of software metrics • The function point method
-
Upload
maile-greene -
Category
Documents
-
view
42 -
download
2
description
Presentation 21. Software quality metrics. Objectives of quality measurement Classification of software quality metrics Process metrics Product metrics Implementation of software quality metrics Limitations of software metrics The function point method. IEEE definitions of - PowerPoint PPT Presentation
Transcript of Objectives of quality measurement Classification of software quality metrics Process metrics
OHT 21.1
Galin, SQA from theory to implementation © Pearson Education Limited 2004
• Objectives of quality measurement • Classification of software quality metrics • Process metrics • Product metrics • Implementation of software quality
metrics • Limitations of software metrics • The function point method
OHT 21.2
Galin, SQA from theory to implementation © Pearson Education Limited 2004
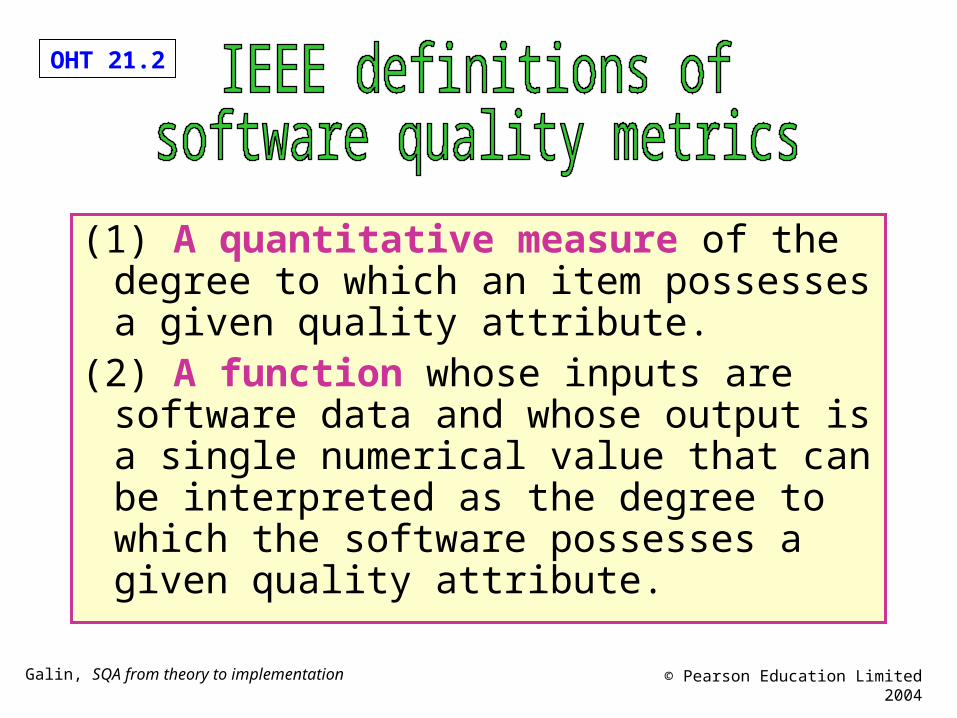
(1) A quantitative measure of the degree to which an item possesses a given quality attribute.
(2) A function whose inputs are software data and whose output is a single numerical value that can be interpreted as the degree to which the software possesses a given quality attribute.
OHT 21.3
Galin, SQA from theory to implementation © Pearson Education Limited 2004
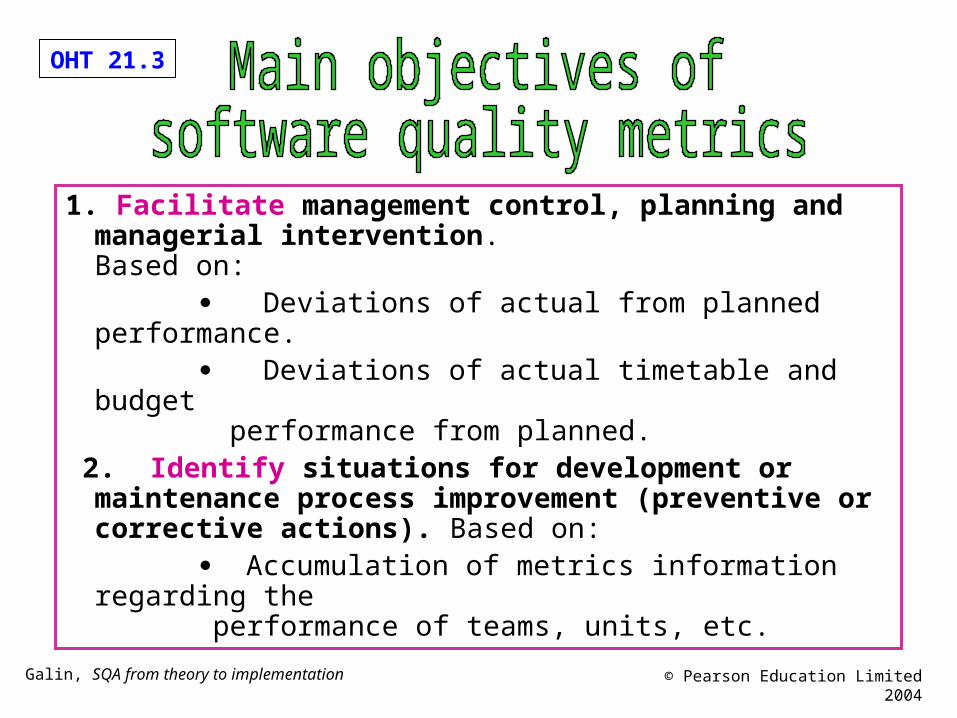
1. Facilitate management control, planning and managerial intervention.Based on:
Deviations of actual from planned performance. Deviations of actual timetable and budget
performance from planned. 2. Identify situations for development or maintenance
process improvement (preventive or corrective actions). Based on:
Accumulation of metrics information regarding the performance of teams, units, etc.
OHT 21.4
Galin, SQA from theory to implementation © Pearson Education Limited 2004
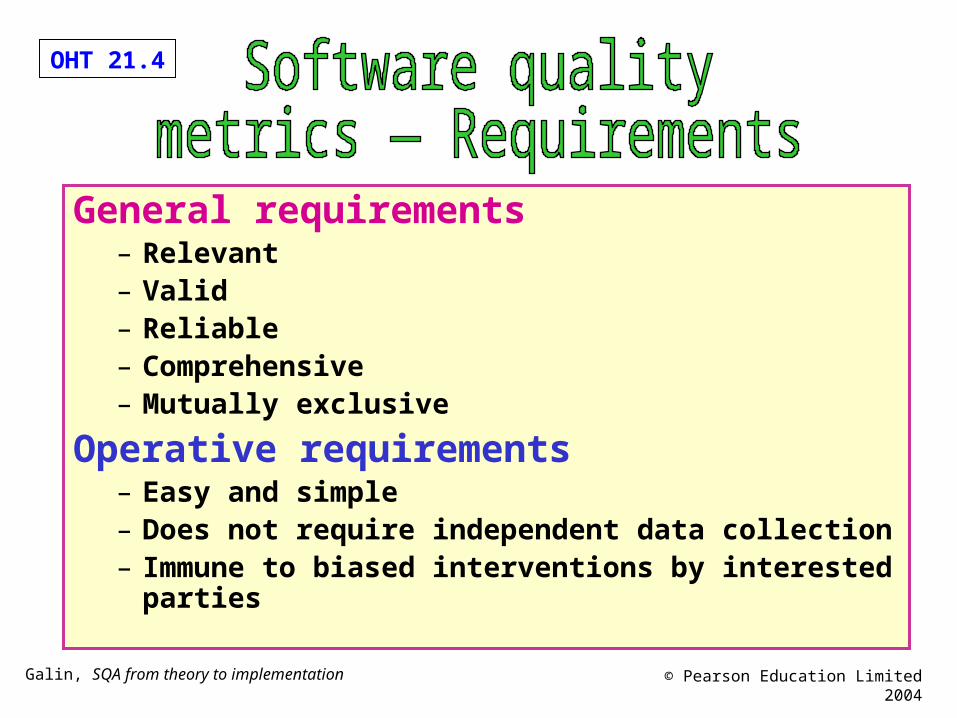
General requirements– Relevant– Valid– Reliable– Comprehensive– Mutually exclusive
Operative requirements– Easy and simple– Does not require independent data collection– Immune to biased interventions by interested parties
OHT 21.5
Galin, SQA from theory to implementation © Pearson Education Limited 2004
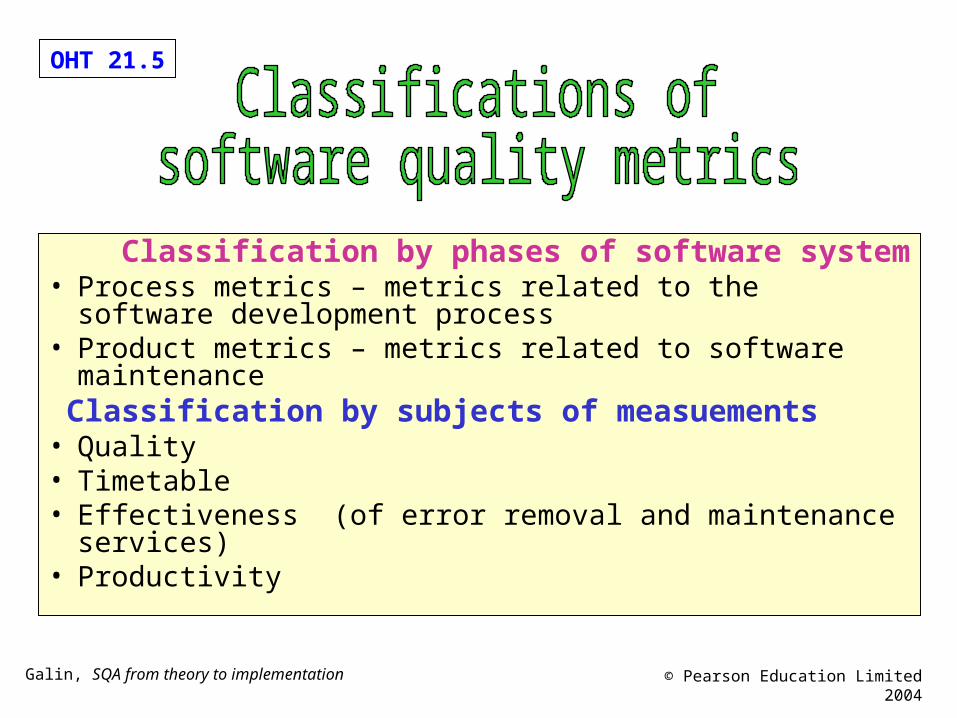
Classification by phases of software system • Process metrics – metrics related to the software
development process• Product metrics – metrics related to software maintenance Classification by subjects of measuements• Quality• Timetable• Effectiveness (of error removal and maintenance services)• Productivity
OHT 21.6
Galin, SQA from theory to implementation © Pearson Education Limited 2004
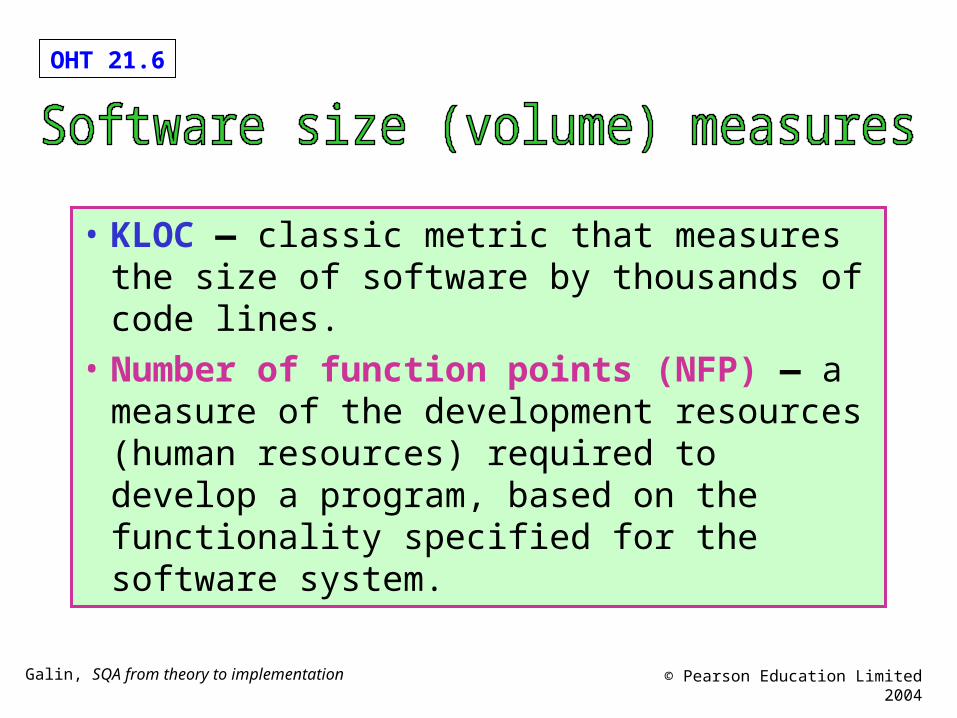
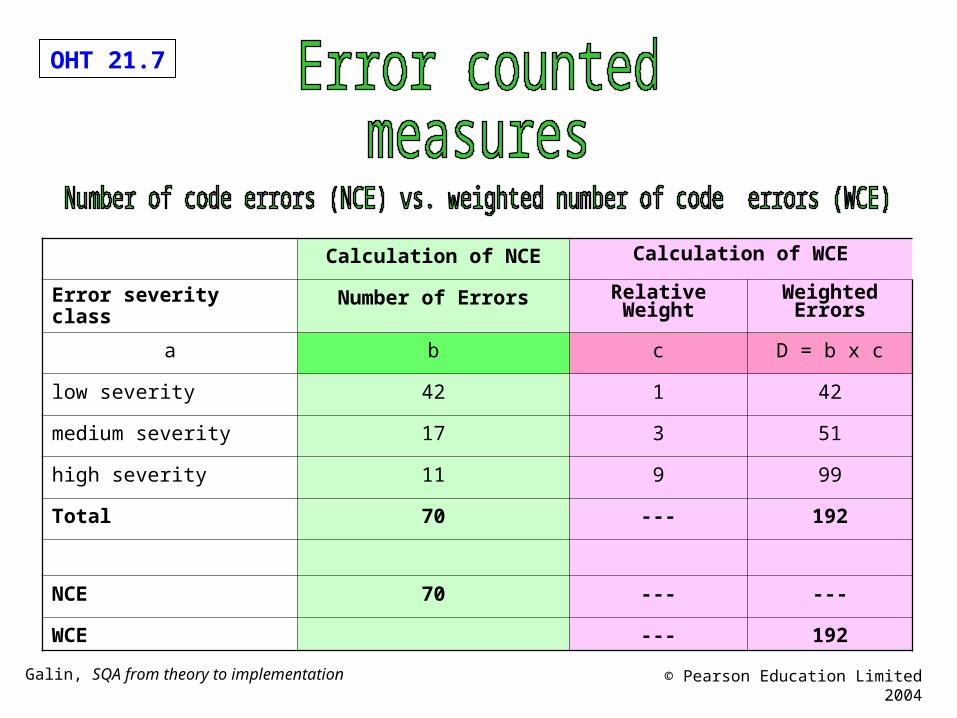
• KLOC — classic metric that measures the size of software by thousands of code lines.
• Number of function points (NFP) — a measure of the development resources (human resources) required to develop a program, based on the functionality specified for the software system.
OHT 21.7
Galin, SQA from theory to implementation © Pearson Education Limited 2004
Calculation of NCE Calculation of WCE
Error severity class Number of Errors Relative Weight Weighted Errors
a b c D = b x c
low severity 42 1 42
medium severity 17 3 51
high severity 11 9 99
Total 70 --- 192
NCE 70 --- ---
WCE --- 192
OHT 21.8
Galin, SQA from theory to implementation © Pearson Education Limited 2004
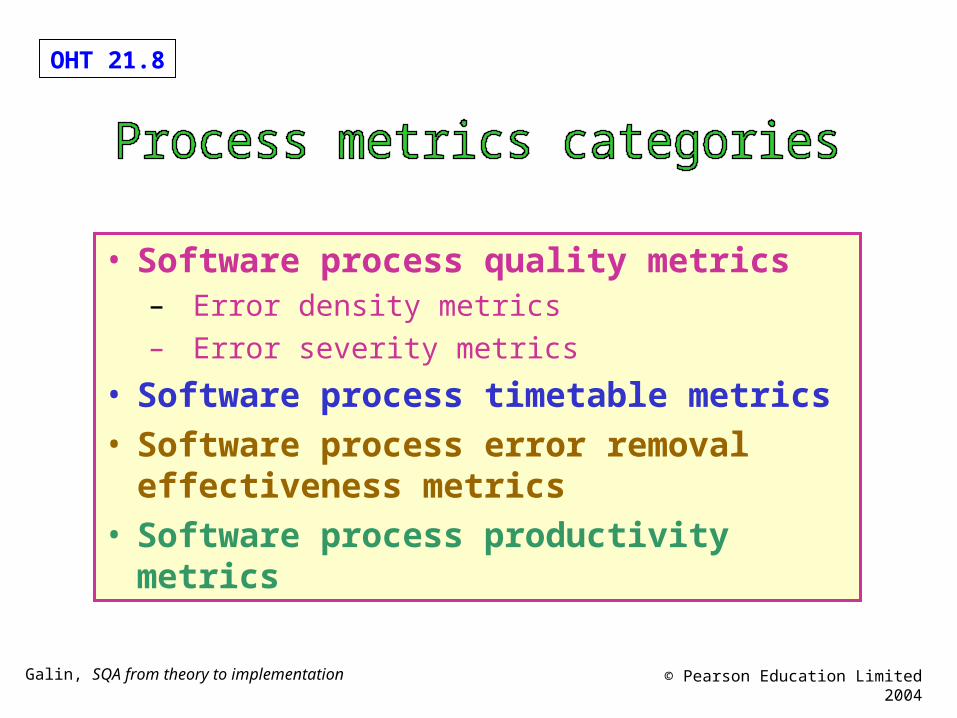
Process metrics categories
• Software process quality metrics– Error density metrics
– Error severity metrics
• Software process timetable metrics• Software process error removal effectiveness
metrics • Software process productivity metrics
OHT 21.9
Galin, SQA from theory to implementation © Pearson Education Limited 2004
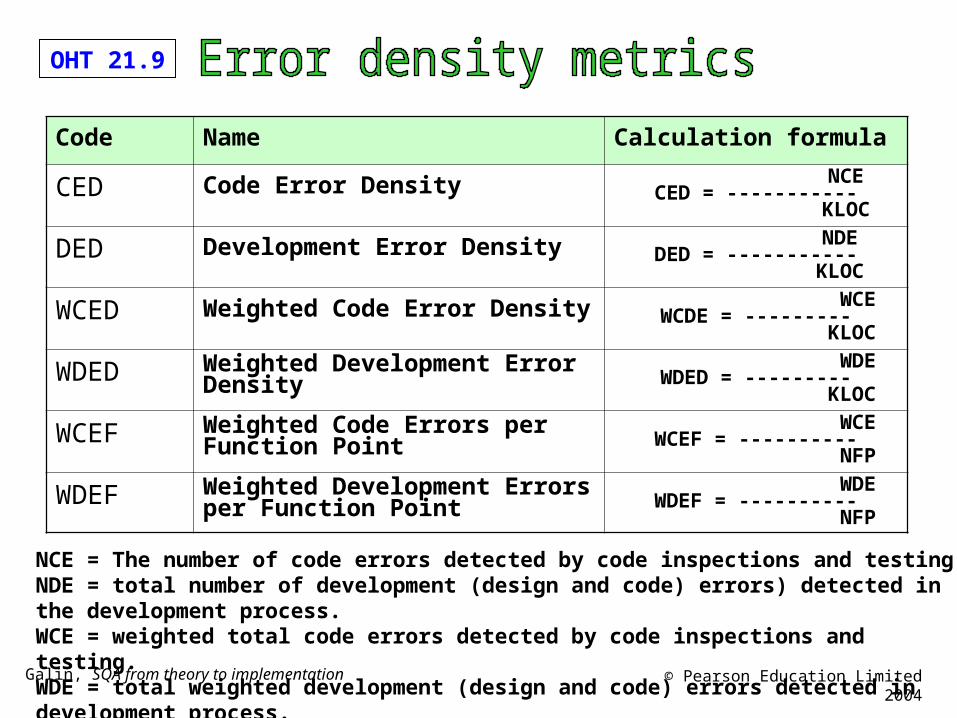
Code Name Calculation formula
CED Code Error Density NCECED = ----------- KLOC
DED Development Error Density NDEDED = ----------- KLOC
WCED Weighted Code Error Density WCEWCDE = --------- KLOC
WDED Weighted Development Error Density WDEWDED = --------- KLOC
WCEF Weighted Code Errors per Function Point
WCEWCEF = ----------
NFP
WDEF Weighted Development Errors per Function Point
WDEWDEF = ----------
NFP
NCE = The number of code errors detected by code inspections and testing.NDE = total number of development (design and code) errors) detected in the development process.WCE = weighted total code errors detected by code inspections and testing.WDE = total weighted development (design and code) errors detected in development process.
OHT 21.10
Galin, SQA from theory to implementation © Pearson Education Limited 2004
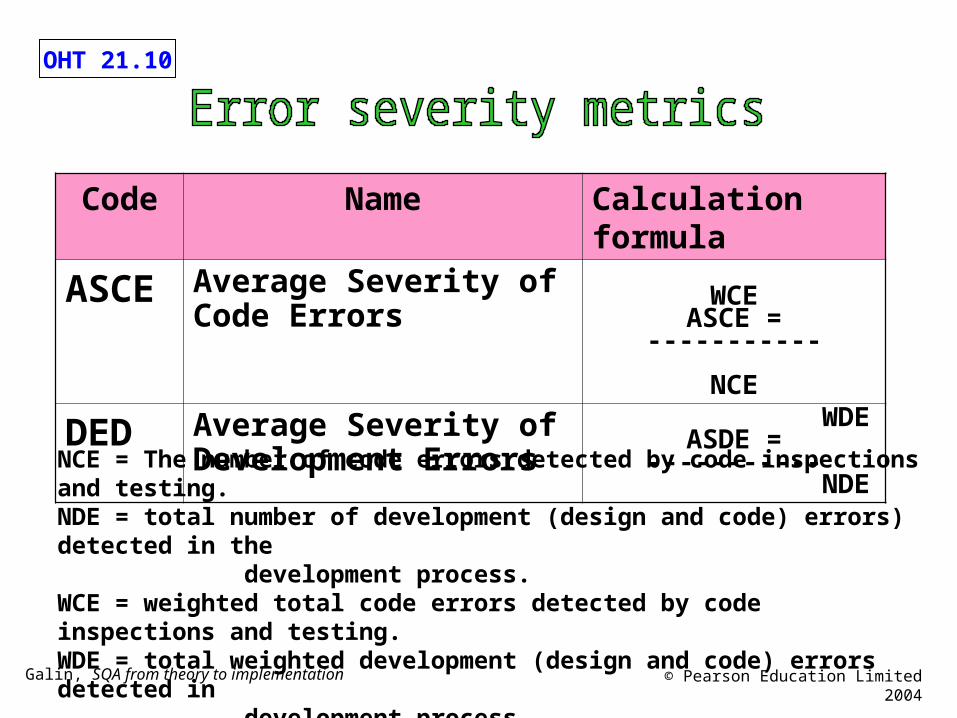
Code Name Calculation formula
ASCE Average Severity of Code Errors
WCEASCE = -----------
NCE
DED Average Severity of Development Errors
WDEASDE = -----------
NDE
NCE = The number of code errors detected by code inspections and testing.NDE = total number of development (design and code) errors) detected in the development process.WCE = weighted total code errors detected by code inspections and testing.WDE = total weighted development (design and code) errors detected in development process.
OHT 21.11
Galin, SQA from theory to implementation © Pearson Education Limited 2004
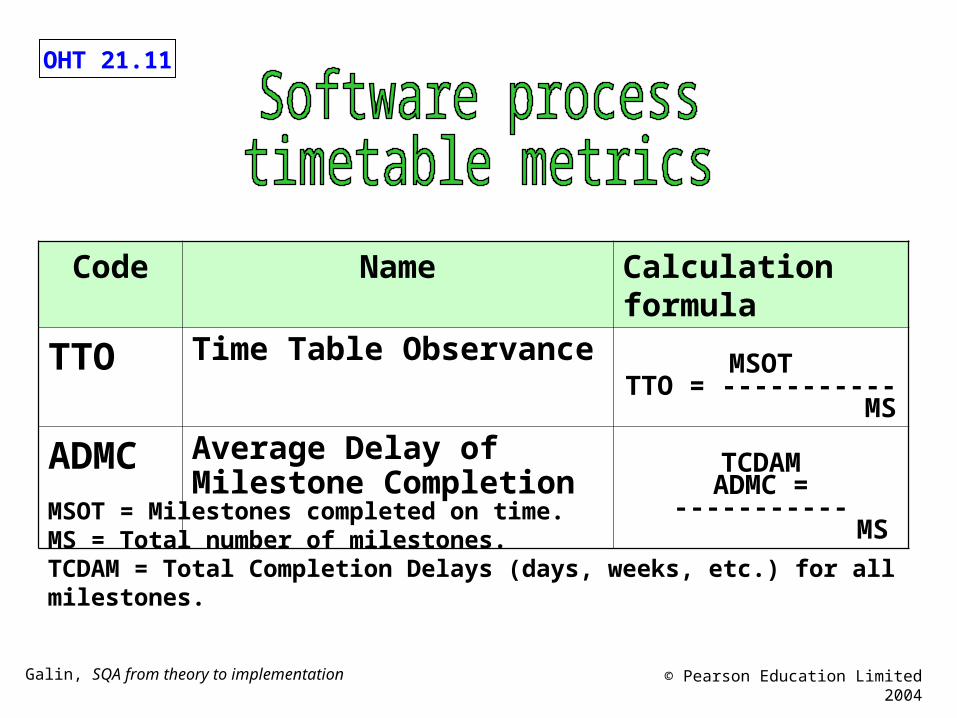
Code Name Calculation formula
TTO Time Table Observance MSOTTTO = -----------
MS
ADMC Average Delay of Milestone Completion
TCDAMADMC = -----------
MS
MSOT = Milestones completed on time.MS = Total number of milestones.TCDAM = Total Completion Delays (days, weeks, etc.) for all milestones.
OHT 21.12
Galin, SQA from theory to implementation © Pearson Education Limited 2004
Code Name Calculation formula
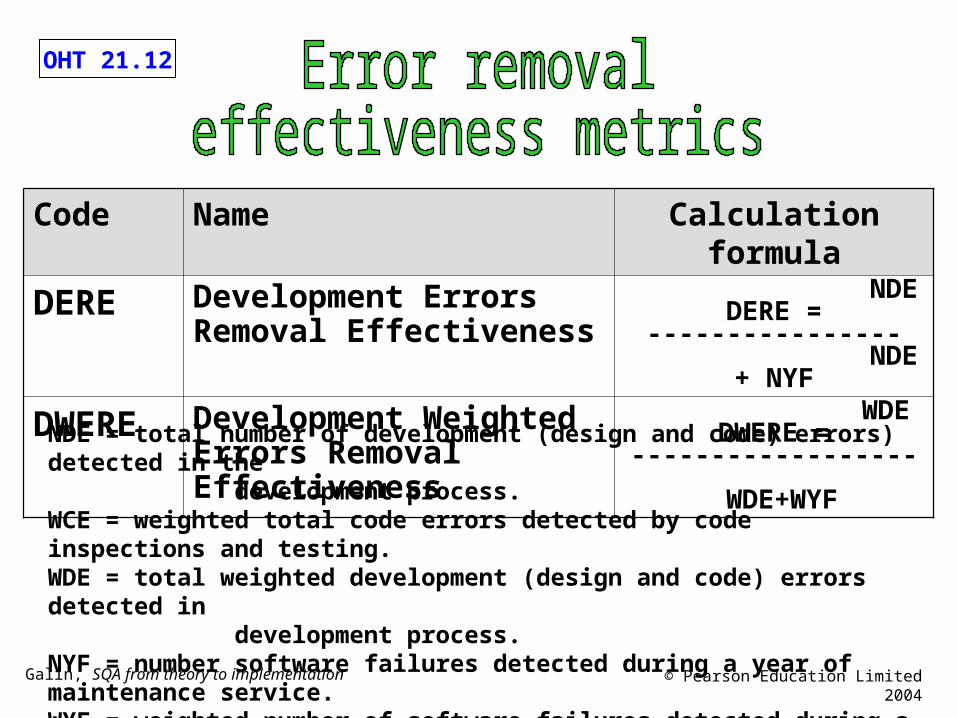
DERE Development Errors Removal Effectiveness
NDEDERE = ---------------- NDE + NYF
DWERE Development Weighted Errors Removal Effectiveness
WDEDWERE = ------------------ WDE+WYF
NDE = total number of development (design and code) errors) detected in the development process.WCE = weighted total code errors detected by code inspections and testing.WDE = total weighted development (design and code) errors detected in development process. NYF = number software failures detected during a year of maintenance service. WYF = weighted number of software failures detected during a year of maintenance
service.
OHT 21.13
Galin, SQA from theory to implementation © Pearson Education Limited 2004
Code Name Calculation formula
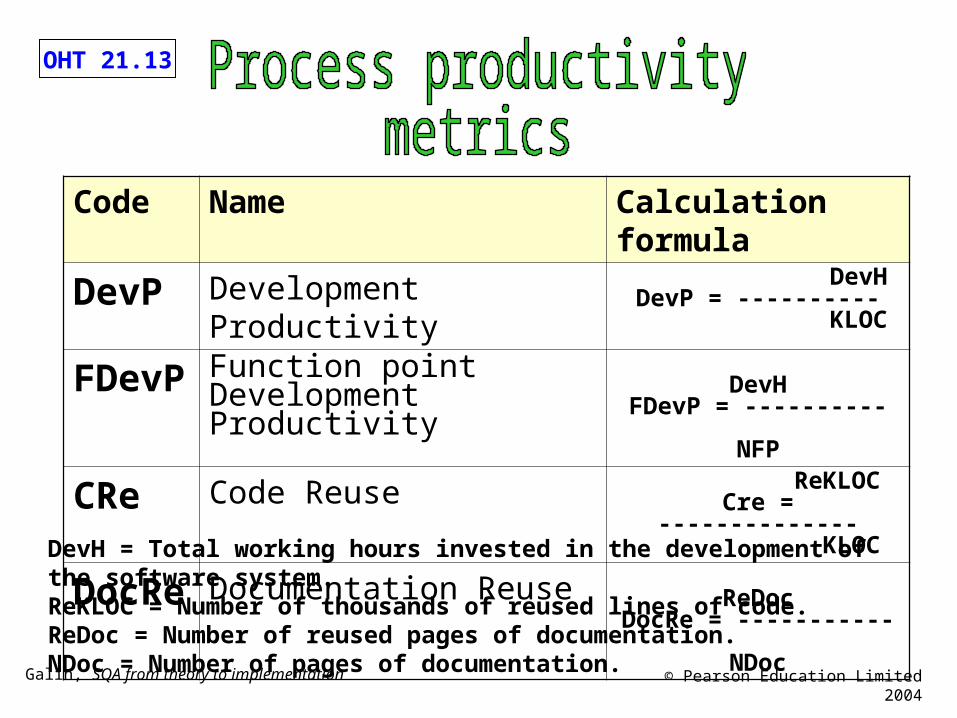
DevP Development Productivity DevHDevP = ---------- KLOC
FDevP Function point Development Productivity
DevHFDevP = ----------
NFP
CRe Code Reuse ReKLOCCre = --------------
KLOC
DocRe Documentation Reuse ReDocDocRe = ----------- NDoc
DevH = Total working hours invested in the development of the software system.ReKLOC = Number of thousands of reused lines of code.ReDoc = Number of reused pages of documentation.NDoc = Number of pages of documentation.
OHT 21.14
Galin, SQA from theory to implementation © Pearson Education Limited 2004
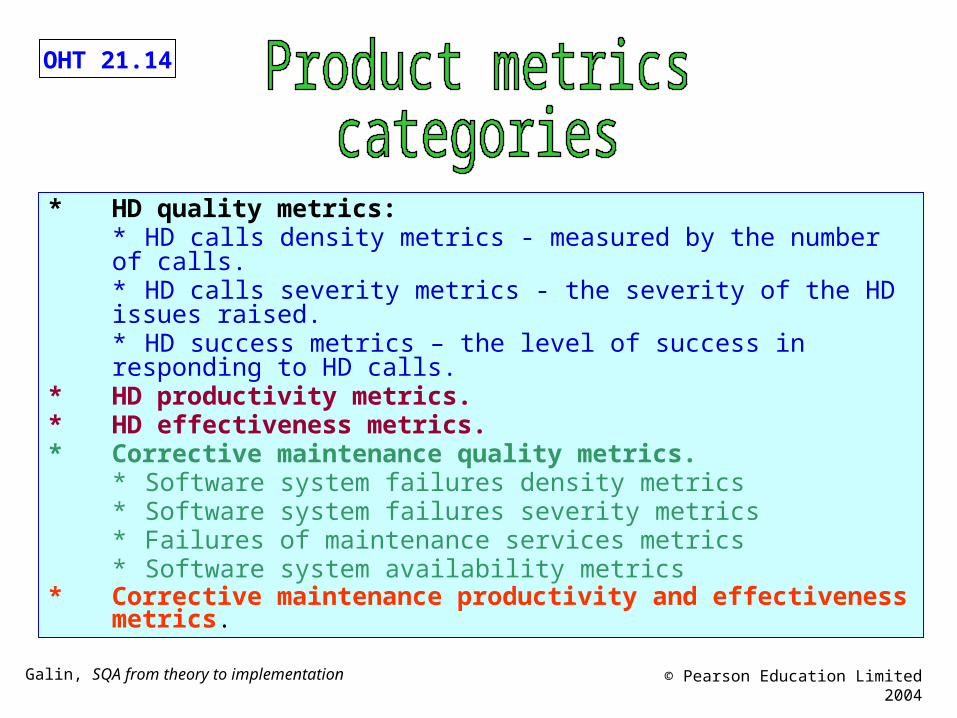
* HD quality metrics:* HD calls density metrics - measured by the number of calls. * HD calls severity metrics - the severity of the HD issues raised. * HD success metrics – the level of success in responding to HD calls.
* HD productivity metrics.* HD effectiveness metrics.* Corrective maintenance quality metrics.
* Software system failures density metrics * Software system failures severity metrics * Failures of maintenance services metrics * Software system availability metrics
* Corrective maintenance productivity and effectiveness metrics.
OHT 21.15
Galin, SQA from theory to implementation © Pearson Education Limited 2004
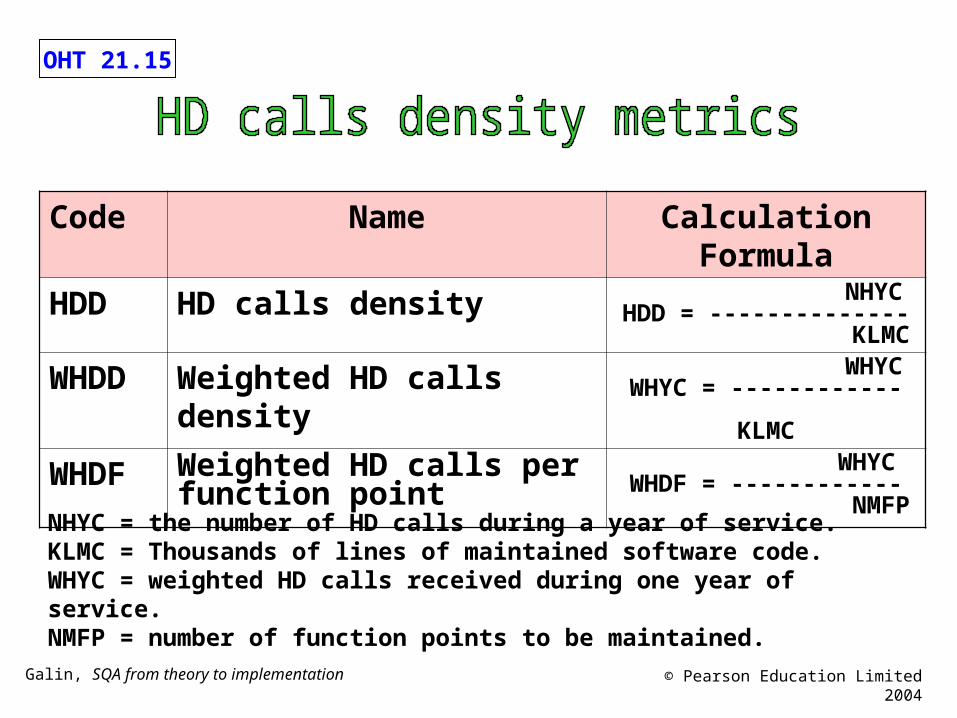
Code Name Calculation Formula
HDD HD calls density NHYCHDD = -------------- KLMC
WHDD Weighted HD calls density WHYCWHYC = ------------ KLMC
WHDF Weighted HD calls per function point
WHYCWHDF = ------------ NMFP
NHYC = the number of HD calls during a year of service.KLMC = Thousands of lines of maintained software code.WHYC = weighted HD calls received during one year of service.NMFP = number of function points to be maintained.
OHT 21.16
Galin, SQA from theory to implementation © Pearson Education Limited 2004
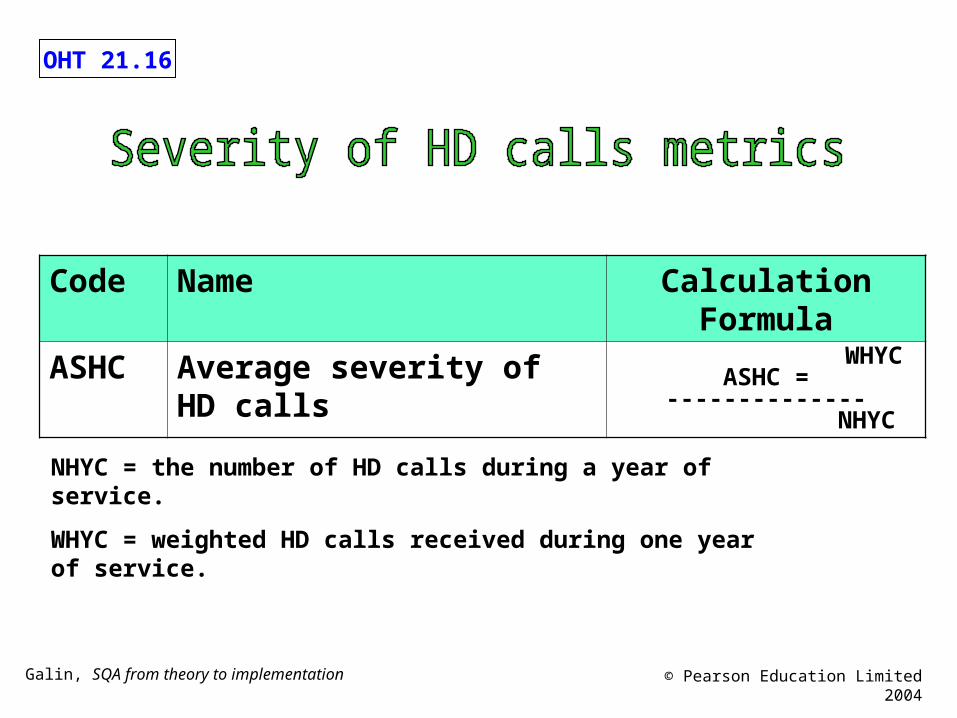
Code Name Calculation Formula
ASHC Average severity of HD calls WHYCASHC = --------------
NHYC
NHYC = the number of HD calls during a year of service.
WHYC = weighted HD calls received during one year of service.
OHT 21.17
Galin, SQA from theory to implementation © Pearson Education Limited 2004
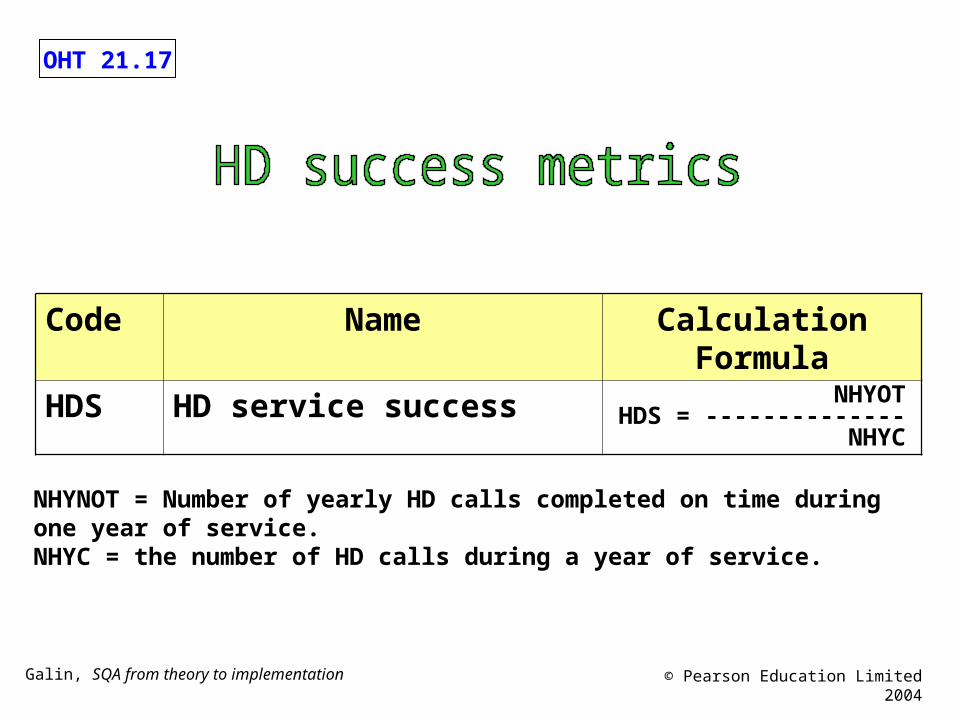
Code Name Calculation Formula
HDS HD service success NHYOTHDS = -------------- NHYC
NHYNOT = Number of yearly HD calls completed on time during one year of service. NHYC = the number of HD calls during a year of service.
OHT 21.18
Galin, SQA from theory to implementation © Pearson Education Limited 2004
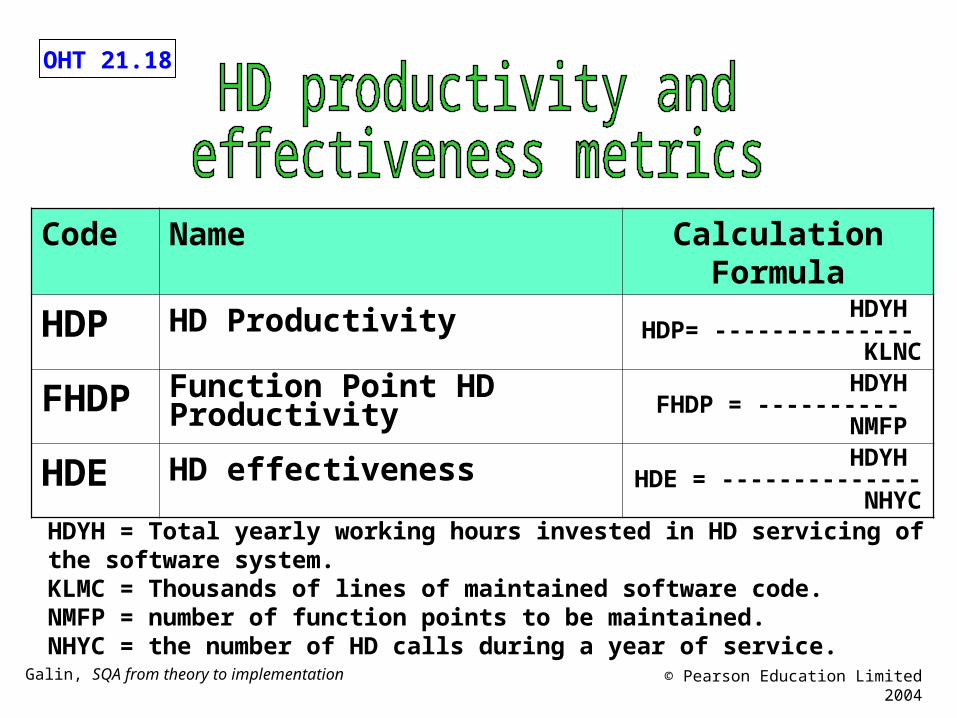
Code Name Calculation Formula
HDP HD Productivity HDYHHDP= -------------- KLNC
FHDP Function Point HD Productivity HDYHFHDP = ---------- NMFP
HDE HD effectiveness HDYHHDE = -------------- NHYC
HDYH = Total yearly working hours invested in HD servicing of the software system.KLMC = Thousands of lines of maintained software code.NMFP = number of function points to be maintained.NHYC = the number of HD calls during a year of service.
OHT 21.19
Galin, SQA from theory to implementation © Pearson Education Limited 2004
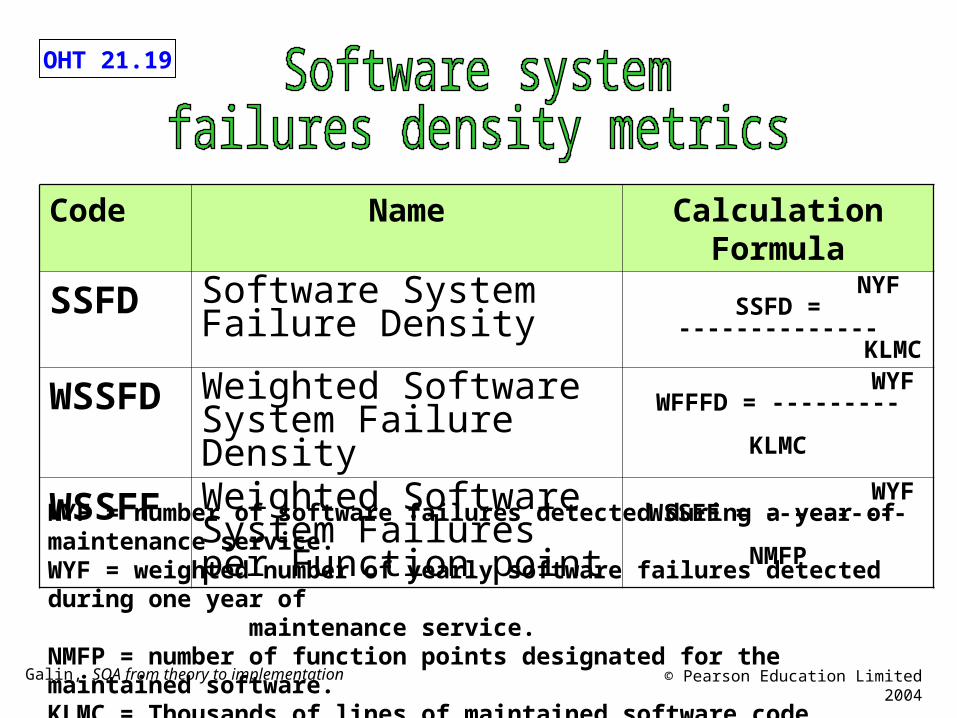
Code Name Calculation Formula
SSFD Software System Failure Density
NYF SSFD = --------------
KLMC
WSSFD Weighted Software System Failure Density
WYFWFFFD = ---------
KLMC
WSSFF Weighted Software System Failures per Function point
WYFWSSFF = ---------- NMFP
NYF = number of software failures detected during a year of maintenance service.WYF = weighted number of yearly software failures detected during one year of maintenance service.NMFP = number of function points designated for the maintained software.KLMC = Thousands of lines of maintained software code.
OHT 21.20
Galin, SQA from theory to implementation © Pearson Education Limited 2004
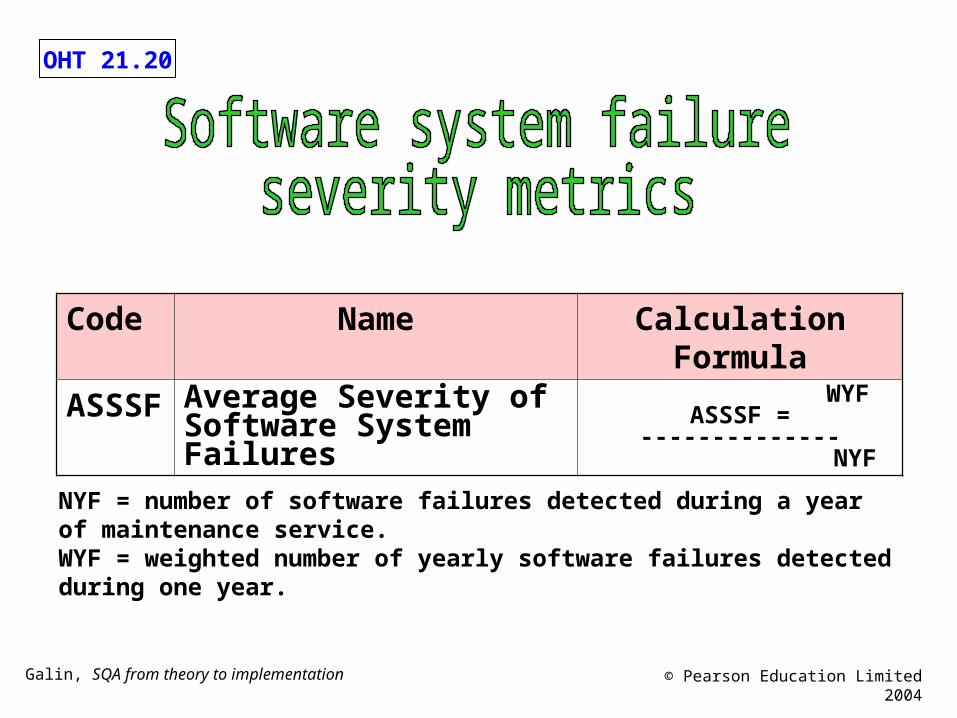
Code Name Calculation Formula
ASSSF Average Severity of Software System Failures
WYFASSSF = --------------
NYF
NYF = number of software failures detected during a year of maintenance service.WYF = weighted number of yearly software failures detected during one year.
OHT 21.21
Galin, SQA from theory to implementation © Pearson Education Limited 2004
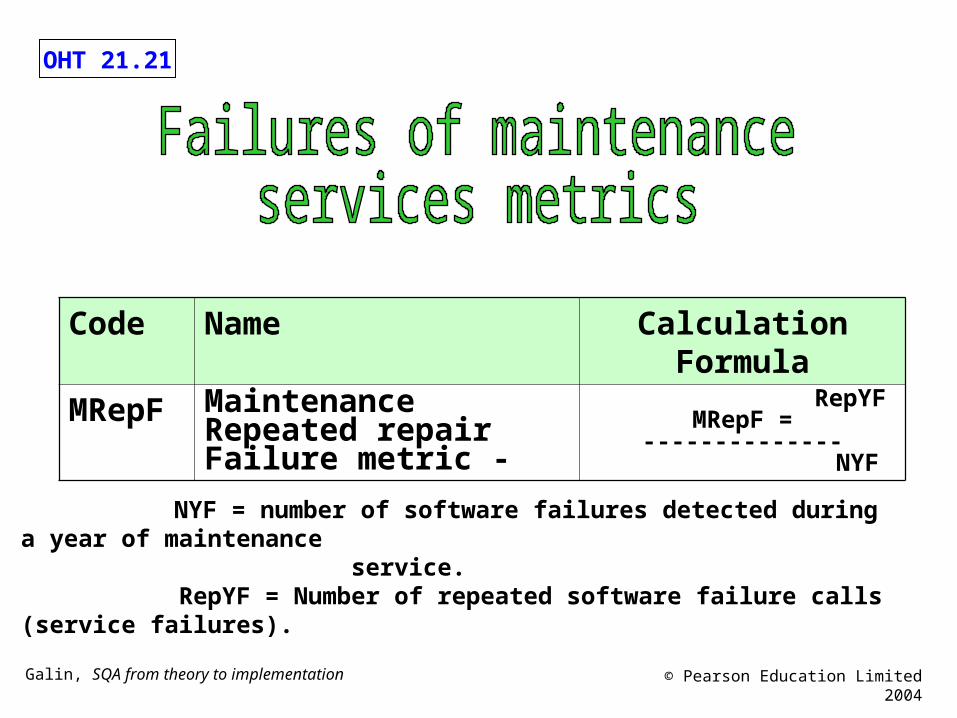
Code Name Calculation Formula
MRepF Maintenance Repeated repair Failure metric -
RepYFMRepF = --------------
NYF
NYF = number of software failures detected during a year of maintenance service. RepYF = Number of repeated software failure calls (service failures).
OHT 21.22
Galin, SQA from theory to implementation © Pearson Education Limited 2004
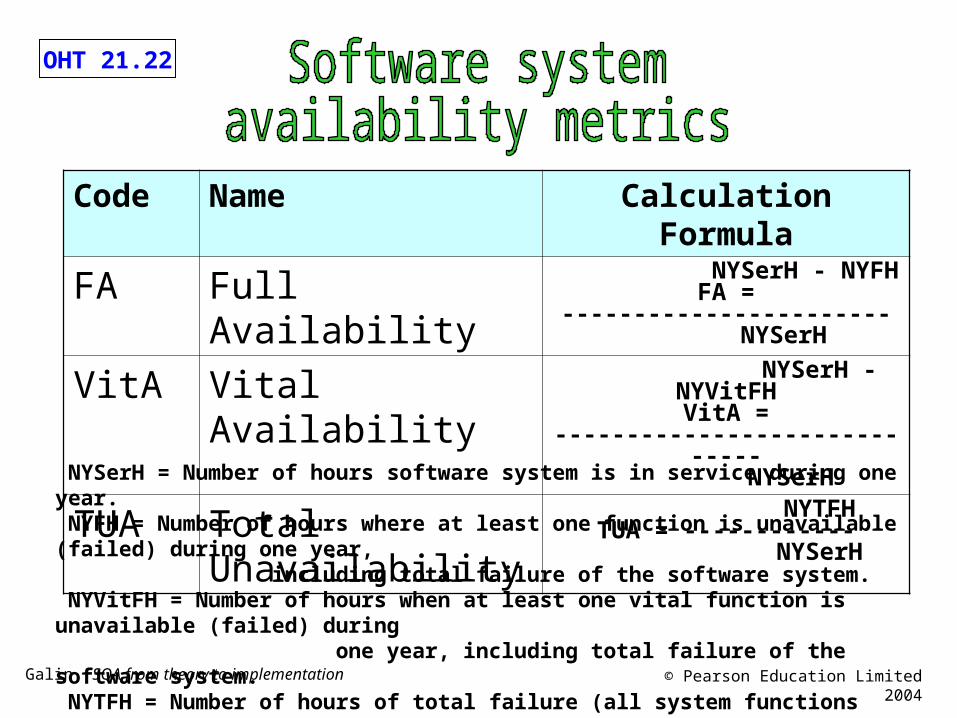
Code Name Calculation Formula
FA Full Availability NYSerH - NYFHFA = -----------------------
NYSerH
VitA Vital Availability NYSerH - NYVitFHVitA = -----------------------------
NYSerH
TUA Total Unavailability NYTFHTUA = ------------ NYSerH
NYSerH = Number of hours software system is in service during one year. NYFH = Number of hours where at least one function is unavailable (failed) during one year, including total failure of the software system. NYVitFH = Number of hours when at least one vital function is unavailable (failed) during one year, including total failure of the software system. NYTFH = Number of hours of total failure (all system functions failed) during one year.NYFH ≥ NYVitFH ≥ NYTFH.1 – TUA ≥ VitA ≥FA
OHT 21.23
Galin, SQA from theory to implementation © Pearson Education Limited 2004
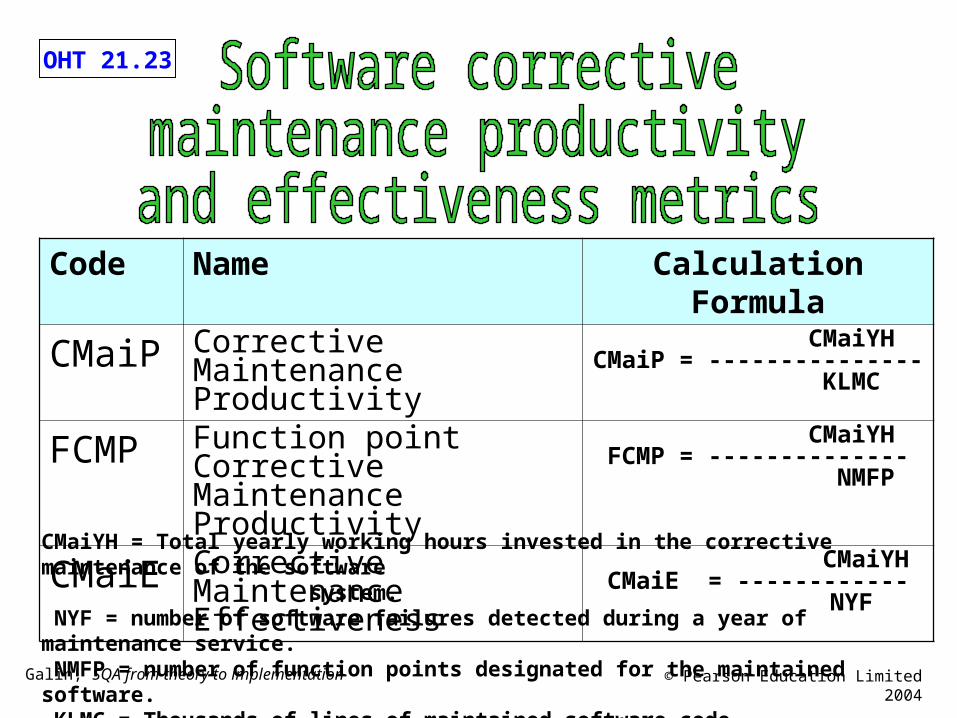
Code Name Calculation Formula
CMaiP Corrective Maintenance Productivity
CMaiYHCMaiP = ---------------
KLMC
FCMP Function point Corrective Maintenance Productivity
CMaiYHFCMP = --------------
NMFP
CMaiE Corrective Maintenance Effectiveness
CMaiYHCMaiE = ------------
NYF
CMaiYH = Total yearly working hours invested in the corrective maintenance of the software system. NYF = number of software failures detected during a year of maintenance service. NMFP = number of function points designated for the maintained software. KLMC = Thousands of lines of maintained software code.
OHT 21.24
Galin, SQA from theory to implementation © Pearson Education Limited 2004
OHT 21.25
Galin, SQA from theory to implementation © Pearson Education Limited 2004
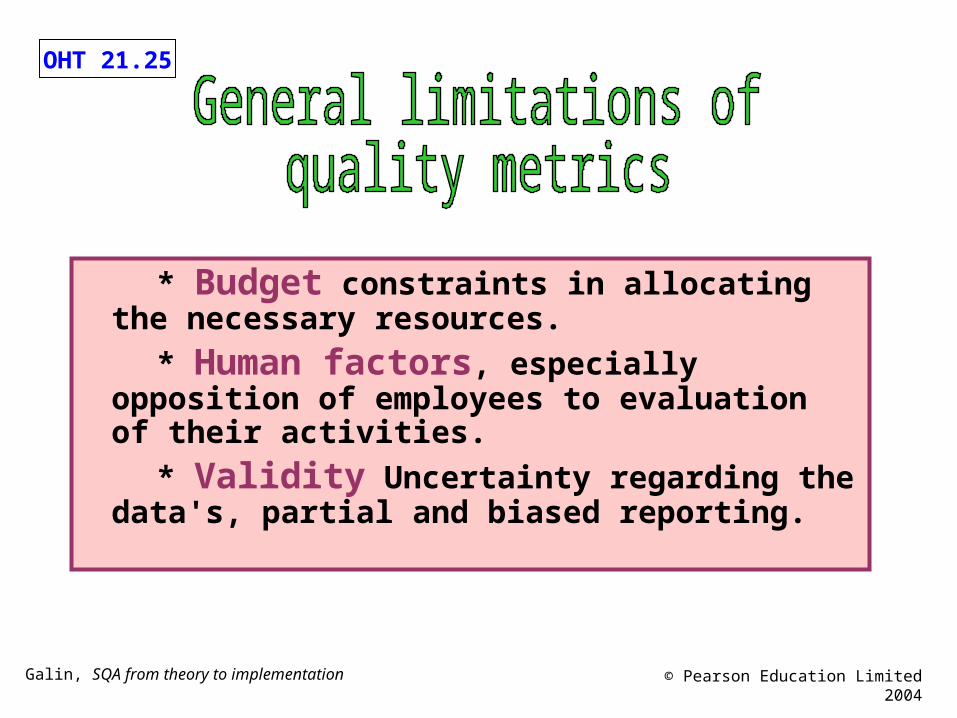
* Budget constraints in allocating the necessary resources.
* Human factors, especially opposition of employees to evaluation of their activities.
* Validity Uncertainty regarding the data's, partial and biased reporting.
OHT 21.26
Galin, SQA from theory to implementation © Pearson Education Limited 2004
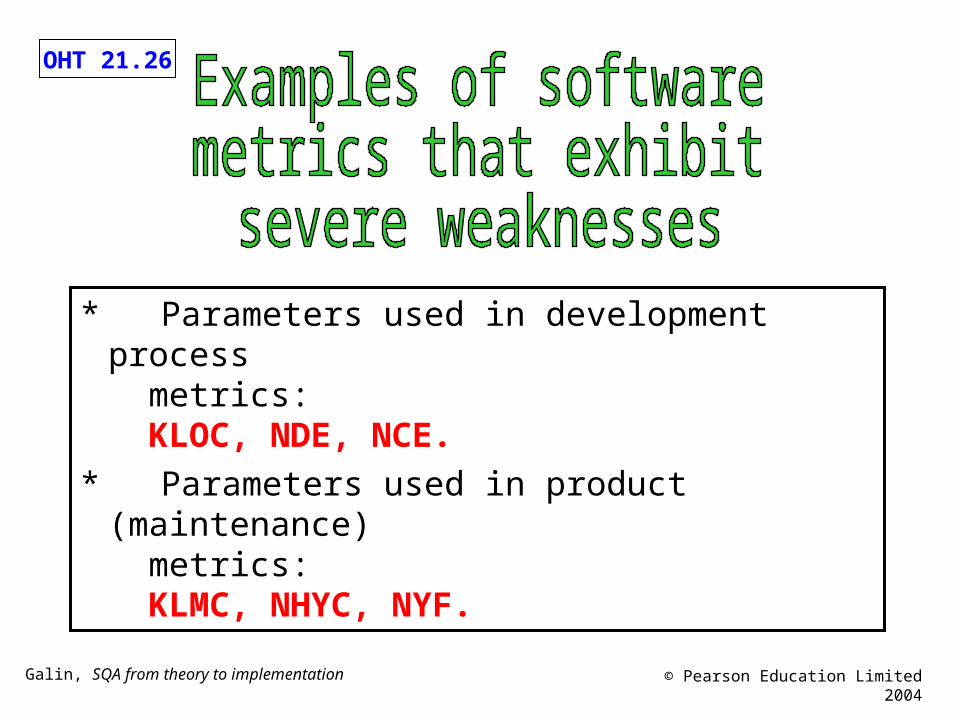
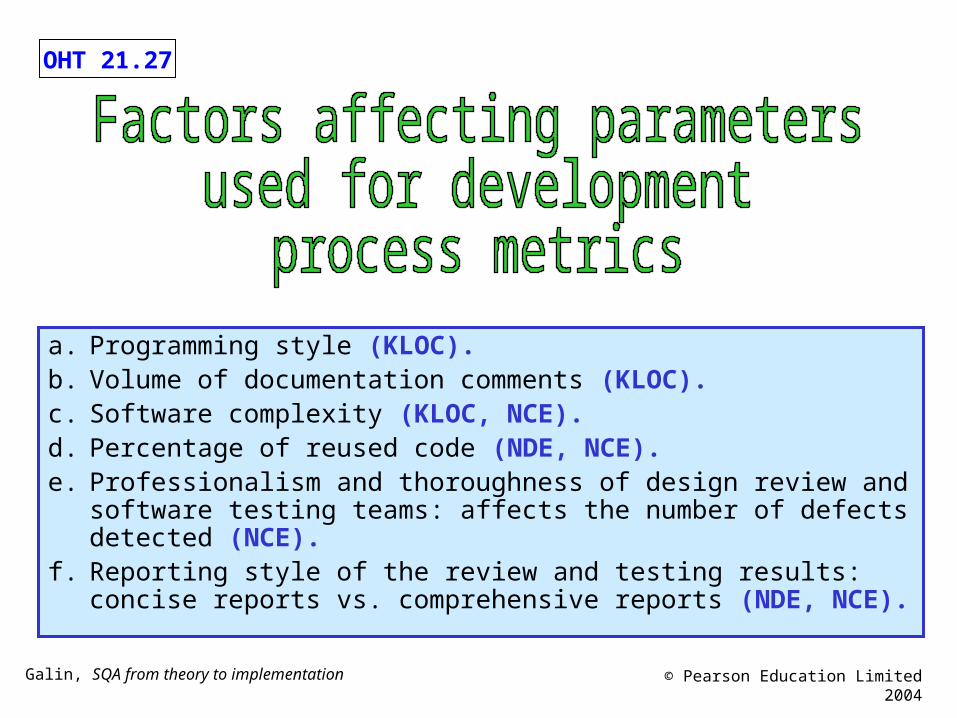
* Parameters used in development process metrics: KLOC, NDE, NCE.
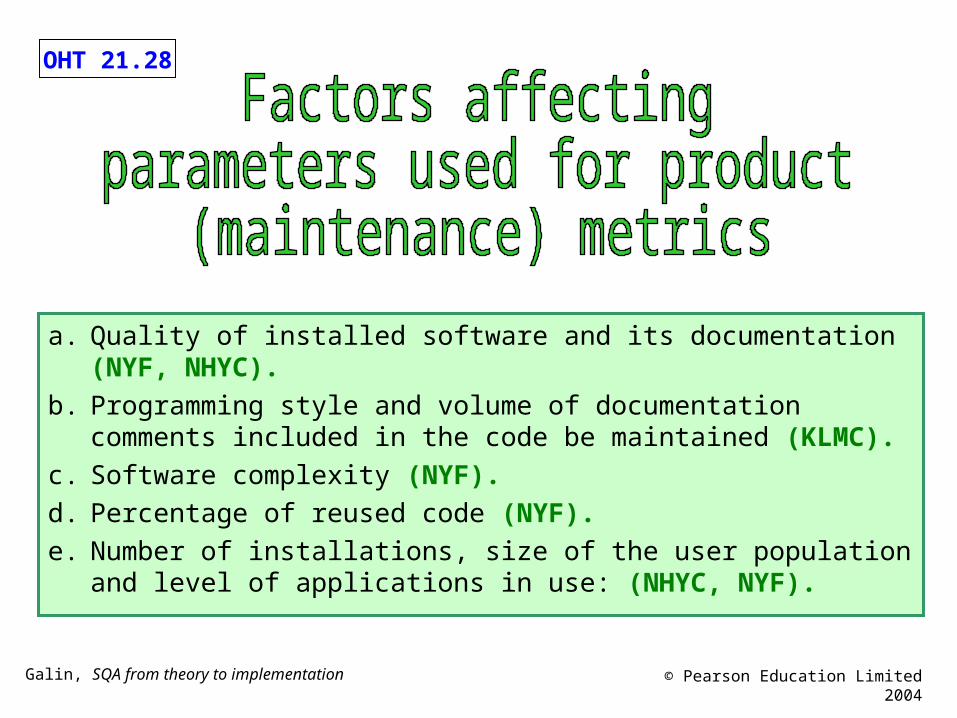
* Parameters used in product (maintenance) metrics: KLMC, NHYC, NYF.
OHT 21.27
Galin, SQA from theory to implementation © Pearson Education Limited 2004
a. Programming style (KLOC).b. Volume of documentation comments (KLOC).c. Software complexity (KLOC, NCE).d. Percentage of reused code (NDE, NCE).e. Professionalism and thoroughness of design review and software
testing teams: affects the number of defects detected (NCE).f. Reporting style of the review and testing results: concise reports vs.
comprehensive reports (NDE, NCE).
OHT 21.28
Galin, SQA from theory to implementation © Pearson Education Limited 2004
a. Quality of installed software and its documentation (NYF, NHYC).
b. Programming style and volume of documentation comments included in the code be maintained (KLMC).
c. Software complexity (NYF).
d. Percentage of reused code (NYF).
e. Number of installations, size of the user population and level of applications in use: (NHYC, NYF).
OHT 21.29
Galin, SQA from theory to implementation © Pearson Education Limited 2004
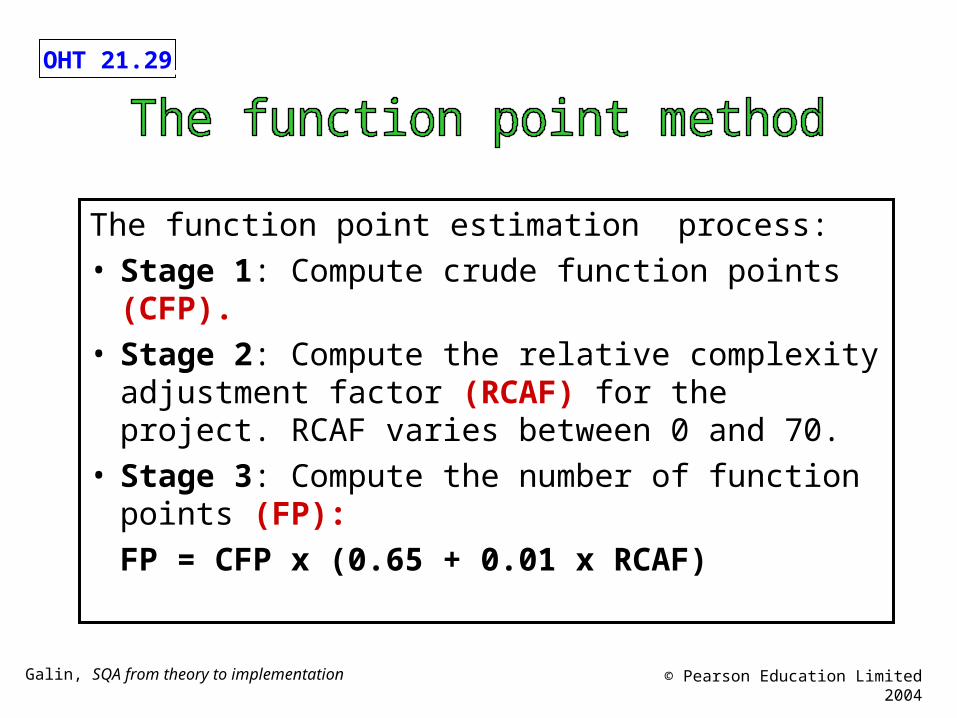
The function point method
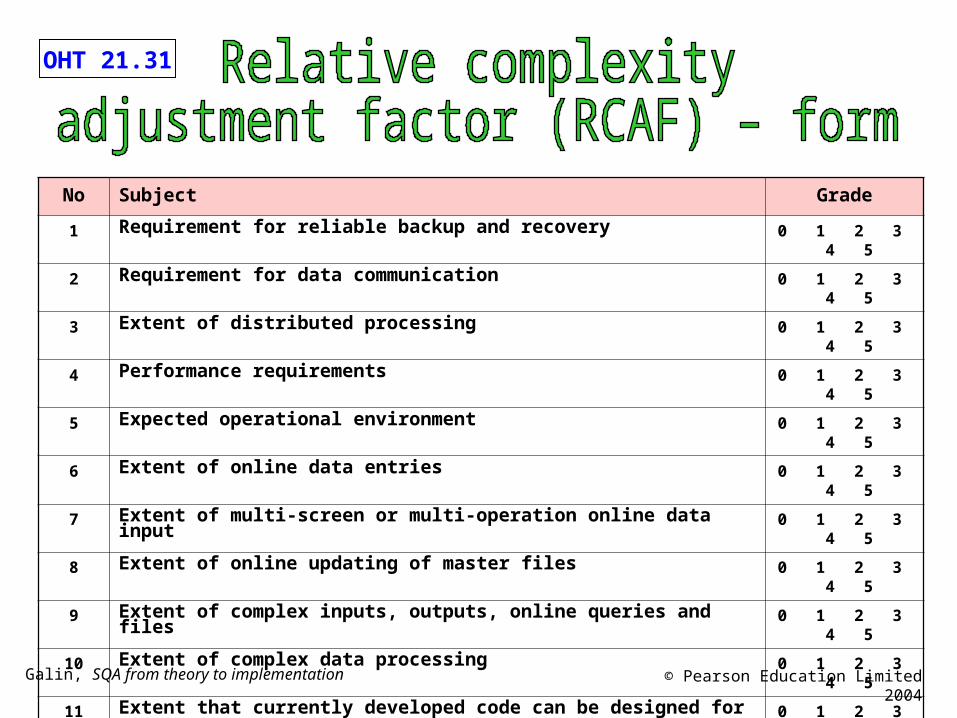
The function point estimation process: • Stage 1: Compute crude function points (CFP). • Stage 2: Compute the relative complexity
adjustment factor (RCAF) for the project. RCAF varies between 0 and 70.
• Stage 3: Compute the number of function points (FP):
FP = CFP x (0.65 + 0.01 x RCAF)
OHT 21.30
Galin, SQA from theory to implementation © Pearson Education Limited 2004
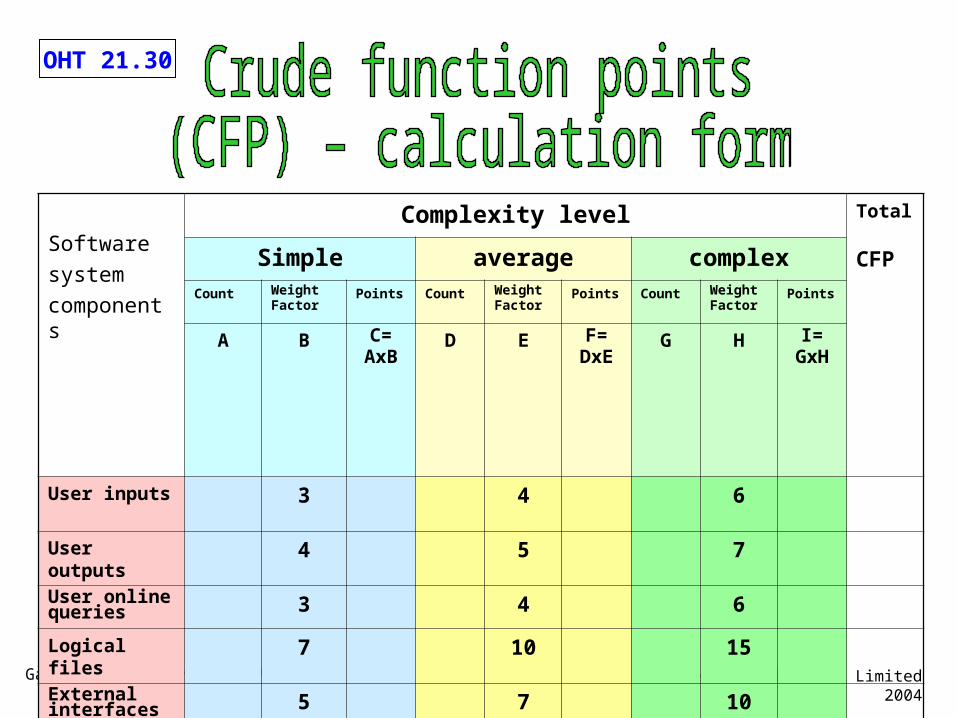
Software
system
components
Complexity level Total
CFP
Simple average complexCount Weight
FactorPoints Count Weight
FactorPoints Count Weight
FactorPoints
A B C=AxB
D E F=DxE
G H I=GxH
User inputs 3 4 6
User outputs 4 5 7
User online queries
3 4 6
Logical files 7 10 15
External interfaces
5 7 10
Total CFP
OHT 21.31
Galin, SQA from theory to implementation © Pearson Education Limited 2004
No Subject Grade
1 Requirement for reliable backup and recovery 0 1 2 3 4 5
2 Requirement for data communication 0 1 2 3 4 5
3 Extent of distributed processing 0 1 2 3 4 5
4 Performance requirements 0 1 2 3 4 5
5 Expected operational environment 0 1 2 3 4 5
6 Extent of online data entries 0 1 2 3 4 5
7 Extent of multi-screen or multi-operation online data input 0 1 2 3 4 5
8 Extent of online updating of master files 0 1 2 3 4 5
9 Extent of complex inputs, outputs, online queries and files 0 1 2 3 4 5
10 Extent of complex data processing 0 1 2 3 4 5
11 Extent that currently developed code can be designed for reuse 0 1 2 3 4 5
12 Extent of conversion and installation included in the design 0 1 2 3 4 5
13 Extent of multiple installations in an organization and variety of customer organizations
0 1 2 3 4 5
14 Extent of change and focus on ease of use 0 1 2 3 4 5
Total = RCAF
OHT 21.32
Galin, SQA from theory to implementation © Pearson Education Limited 2004
OHT 21.33
Galin, SQA from theory to implementation © Pearson Education Limited 2004
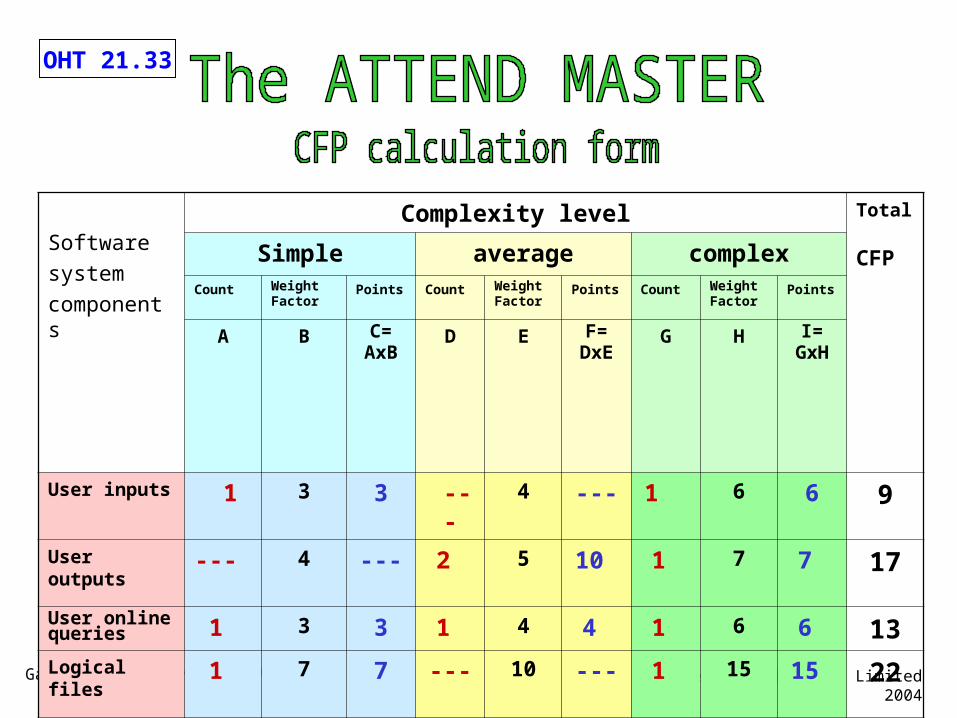
Software
system
components
Complexity level Total
CFP
Simple average complexCount Weight
FactorPoints Count Weight
FactorPoints Count Weight
FactorPoints
A B C=AxB
D E F=DxE
G H I=GxH
User inputs 1 3 3 --- 4 --- 1 6 6 9User outputs --- 4 --- 2 5 10 1 7 7 17User online queries 1 3 3 1 4 4 1 6 6 13Logical files 1 7 7 --- 10 --- 1 15 15 22External interfaces --- 5 --- --- 7 --- 2 10 20 20Total CFP 81
OHT 21.34
Galin, SQA from theory to implementation © Pearson Education Limited 2004
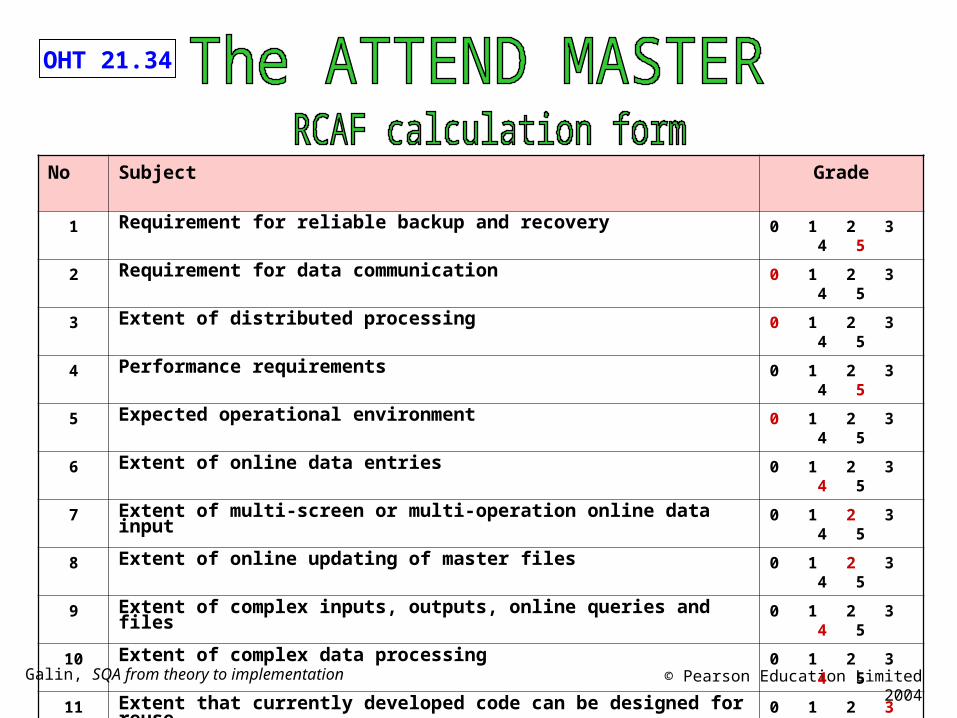
No Subject Grade
1 Requirement for reliable backup and recovery 0 1 2 3 4 5
2 Requirement for data communication 0 1 2 3 4 5
3 Extent of distributed processing 0 1 2 3 4 5
4 Performance requirements 0 1 2 3 4 5
5 Expected operational environment 0 1 2 3 4 5
6 Extent of online data entries 0 1 2 3 4 5
7 Extent of multi-screen or multi-operation online data input 0 1 2 3 4 5
8 Extent of online updating of master files 0 1 2 3 4 5
9 Extent of complex inputs, outputs, online queries and files 0 1 2 3 4 5
10 Extent of complex data processing 0 1 2 3 4 5
11 Extent that currently developed code can be designed for reuse 0 1 2 3 4 5
12 Extent of conversion and installation included in the design 0 1 2 3 4 5
13 Extent of multiple installations in an organization and variety of customer organizations
0 1 2 3 4 5
14 Extent of change and focus on ease of use 0 1 2 3 4 5
Total = RCAF 41
OHT 21.35
Galin, SQA from theory to implementation © Pearson Education Limited 2004
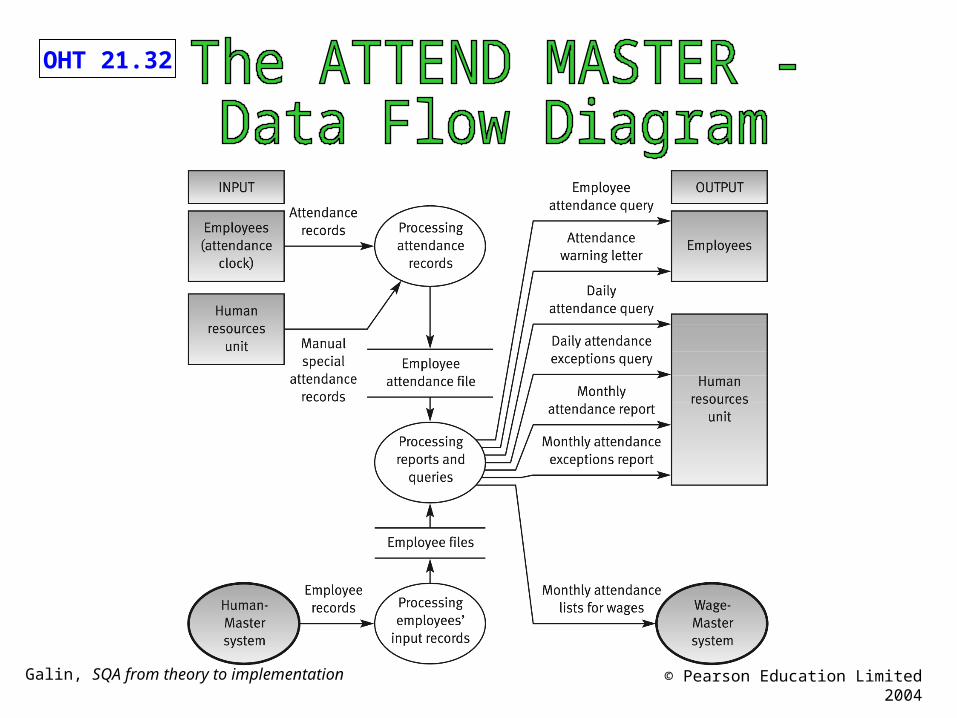
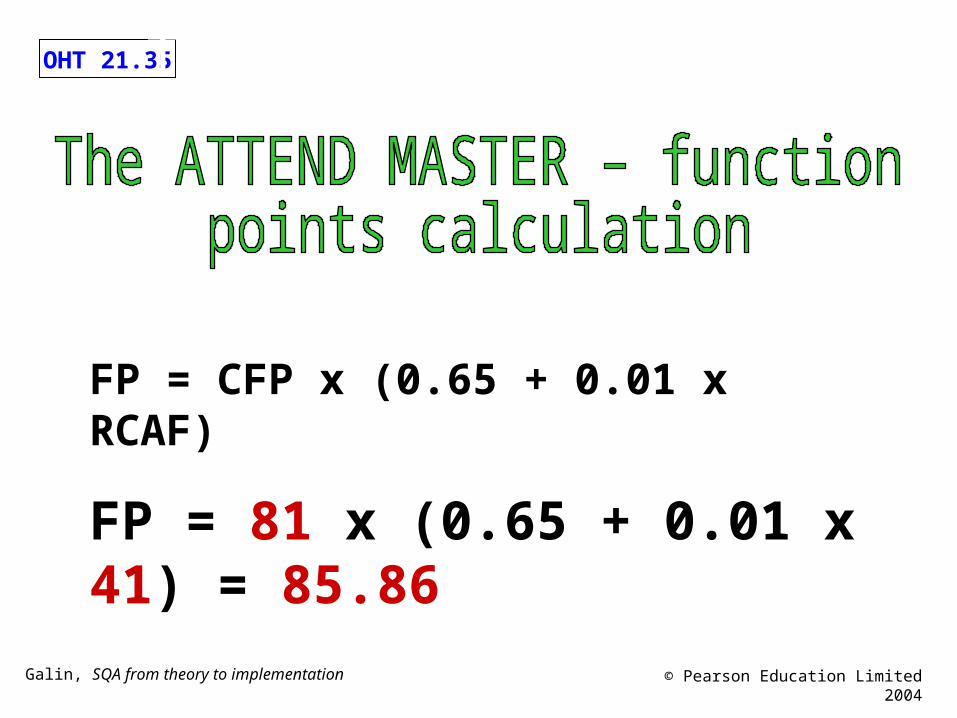
The ATTEND MASTER – function points calculation
FP = CFP x (0.65 + 0.01 x RCAF)
FP = 81 x (0.65 + 0.01 x 41) = 85.86
OHT 21.36
Galin, SQA from theory to implementation © Pearson Education Limited 2004
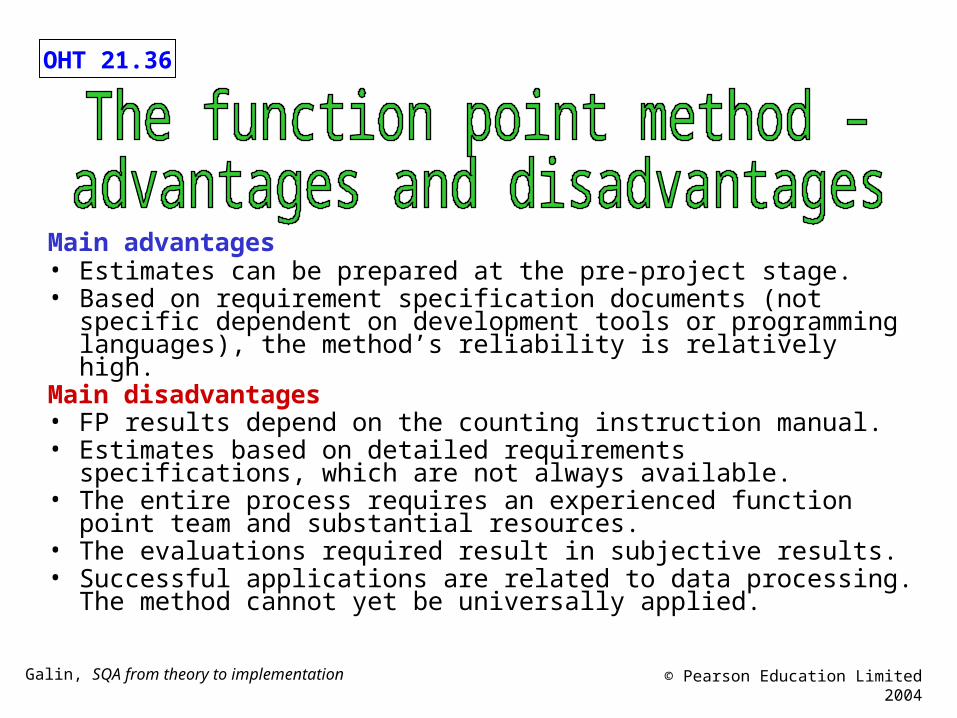
Main advantages• Estimates can be prepared at the pre-project stage.• Based on requirement specification documents (not specific dependent
on development tools or programming languages), the method’s reliability is relatively high.
Main disadvantages• FP results depend on the counting instruction manual.• Estimates based on detailed requirements specifications, which are not
always available.• The entire process requires an experienced function point team and
substantial resources. • The evaluations required result in subjective results.• Successful applications are related to data processing. The method
cannot yet be universally applied.