CODE QUALITY METRICS
63
Transcript of CODE QUALITY METRICS

ABOUT ME
Name: Nicoleta Suciu
Job: Software Developer
Experience: 3 years
Zodiacal Sign: Aries
Height: …no idea

❑ Why the code quality metrics are needed
❑ Which are the metrics
❑ How we can use them❑
❑ Tools


Work That
Frustrates Per
Minute
Quality
metrics
Coverage
metrics
Complexity
metrics
Object-
oriented
metrics
Code quality
metrics

Complexity Metrics
Cyclomatic complexity
Essential complexity

Cyclomatic
complexityMeasures the number of linearly independent paths
within the source code.
Measures complexity at class or method level.
Based on graph theory.

Code Flow Chart Flow Graph

How to compute the cyclomatic complexity
V(G) = E – N + 2Where: E – is the total number of edges
N – is the total number of nodes
Example:V(G) = 13 – 10 + 2 = 5
V(G) = 13 – 10 + 2 = 5

Benefits of
cyclomatic complexity
Reduces the coupling of code
Increases the code readability
Ease of testing

Essential complexity
Cyclomatic complexity of the reduced control flow graph.
How to reduce the complexity:
• Validate and remove unwanted if statements
• Refactoring
• Remove unnecessary/redundant else conditions
V(G) = 13 – 10 + 2 = 5


Example

Work That
Frustrates
Per Minute
Coverage
metrics
Complexity
metrics
Object-
oriented
metrics
Code quality
metrics
Quality metrics

Quality Metrics
Average Percentage of Faults Detected
Fault Severity and Priority
Production Incidents

Average Percentage of Faults Detected (APFD)
Measures the rate of faults relative to the percentage of the test suite that is executed
Needs prior knowledge of faults -> used only for evaluation
Can be used with prioritized and non-prioritized test case

How to calculate itV(G) = 13 – 10 + 2 = 5
𝐴𝑃𝐹𝐷 = 1 −𝑇𝐹1 + 𝑇𝐹2 +⋯+ 𝑇𝐹𝑚
𝑛 ∗ 𝑚+
1
2 ∗ 𝑛
Where: • T is the test suit under evaluation• m is the number of faults contained in the
program• n is the total number of test cases• TFi is the position of the first test in T that
exposes fault i

Example
T1 T2 T3 T4 T5
F1 *
F2 *
F3 * *
F4 * *
F5 *
No. of
faults
1 2 1 2 1
Time 5 7 11 4 10
APFD for non-prioritized test case:
𝐴𝑃𝐹𝐷 = 1 −2+3+1+4+2
5∗5+
1
2∗5
= 0.62
APFD for prioritized test case:V = fault/time
𝐴𝑃𝐹𝐷 = 1 −1+3+4+1+1
5∗5+
1
2∗5
= 0.7

Fault Severity
and Priority
Different types of failures, divided in two categories:
• Failure Severity
• Failure Priority

I look only at the Priority field and
so QA shouldn’t waste time writing
down the Severity.
Developers
Yaa... 90% of the time
Priority and Severity have
the same value...
I think... QA just wants to
exaggerate the severity of
some Bugs
Severity vs Priority of a bug

What is fault severity and fault priority?
• Severity is defined as the degree of impact a defect has on the system.
• Priority of a defect would indicate the urgency with which it would need to be fixed.

Categorization of fault severity and priority
Category Class Description Category Class
Severity
Critical Complete shut-down of the
system
Priority
High Must be solved asap.,
the system cannot be
used
Major Severe defect that collapse
the system, certain parts
are still functional
Medium Must be solved, but
can wait until next
release
Medium Causes undesirable
behaviour, but still
functional
Low Defect does not have
any major impact
Low It won’t cause any major
break-down of the system

Different levels
of faults
Company logo is spelled wrong
Key featuredoes not work
Features that israrely used does not
workCosmetic errors
HIGH LOW
HIG
HLO
W
SEVERITY
PR
IOR
ITY
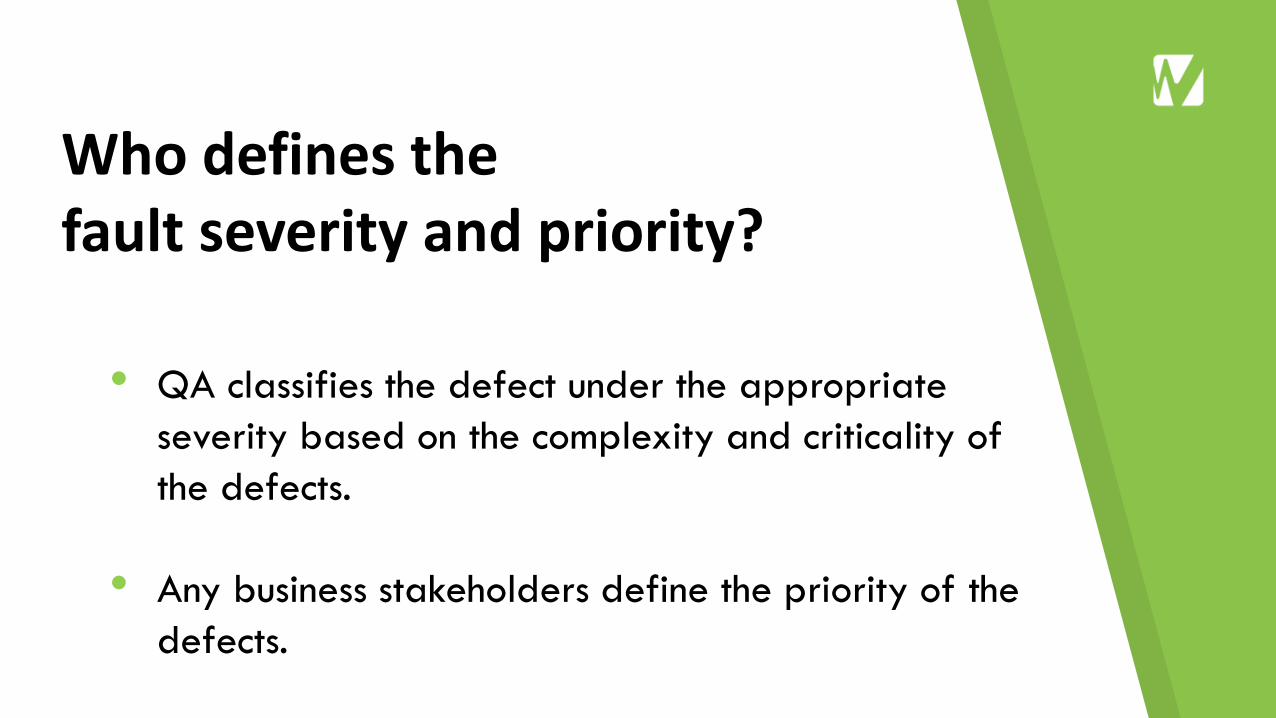
Who defines the fault severity and priority?
• QA classifies the defect under the appropriate
severity based on the complexity and criticality of
the defects.
• Any business stakeholders define the priority of the
defects.

Production Incidents
Another performance improvement metric is the number of
production incidents or software crash rate.
Is imperative to record the initial cause of the defect along
with what corrective measures were taken to solve it.
It traces the root problem that caused an incident.

Work That
Frustrates
Per Minute
Quality
metrics
Coverage
metrics
Complexity
metrics
Code quality
metrics
Object-oriented metrics

Object-Oriented Metrics
Coupling Between Objects (CBO)
Responses For a Class (RFC)
Weighted Methods Per Class
(WMC)
Depth of Inheritance Tree (DIT)
Number Of Children (NOC)

Coupling between objects (CBO)
An object is coupled to another object if one of them acts on
the other.
Excessive coupling is detrimental to modular design and
prevents reuse
Measures testability, maintenance and reusability of a class

Coupling between objects (CBO)
• CBO can be obtained through method calls, field accesses, inheritance, arguments, return types, and exceptions.
• CBO doesn’t care about the direction of dependency.

Coupling between objects (CBO)
▪ High CBO =>• Low modularity and reusability• Low maintainability• High complexity
▪ Used to track =>• Integrity of classes• Unnecessary interconnections in inappropriate
places

Response for a class (RFC)
RFC measures the number of different methods that can be
executed when an object of that class receives a message.
High RFC
• Testing and debugging of a class becomes
complicated
• Higher the RFC, higher the complexity

Weighted Methods
Per Class (WMC)
WMC is defined to be the summation of all method’s
complexity defined in a given class.
Method complexities can be considered to be unity,
therefore WMC will be equal with the number of methods
in a class

Weighted Methods Per Class (WMC)
Indicator of class quality in an object-oriented environment
Predictor of how much time and effort is required to develop and maintain a class
High WMC value:• Higher impact on the children• More application specific, low reusability &
maintainability

Example
We will use 2 different complexity
measurements
1. Thomas McCabe’s Cyclomatic Complexity:
CC = E – N + 2P
2. Alternative:
- total number of decision points + 1
Values:
Method foo: Method bar:
1. CC = 7 1. CC = 5
2 CC = 2 2. CC = 2
WMC for class:
1. WMC = 12
2. WMC = 4

Depth of Inheritance Tree (DIT)
DIT provides for each class a measure of the inheritance
levels from the class node to the root of the tree.
Measure of how many ancestor classes can potentially affect
this class

Depth of Inheritance Tree (DIT)
Higher DIT => higher complexity, but greater potential for reuse
DIT value 2 => indicate improper use of object-oriented techniques
DIT can indicate if a design is ‘top heavy’ or ‘bottom heavy’
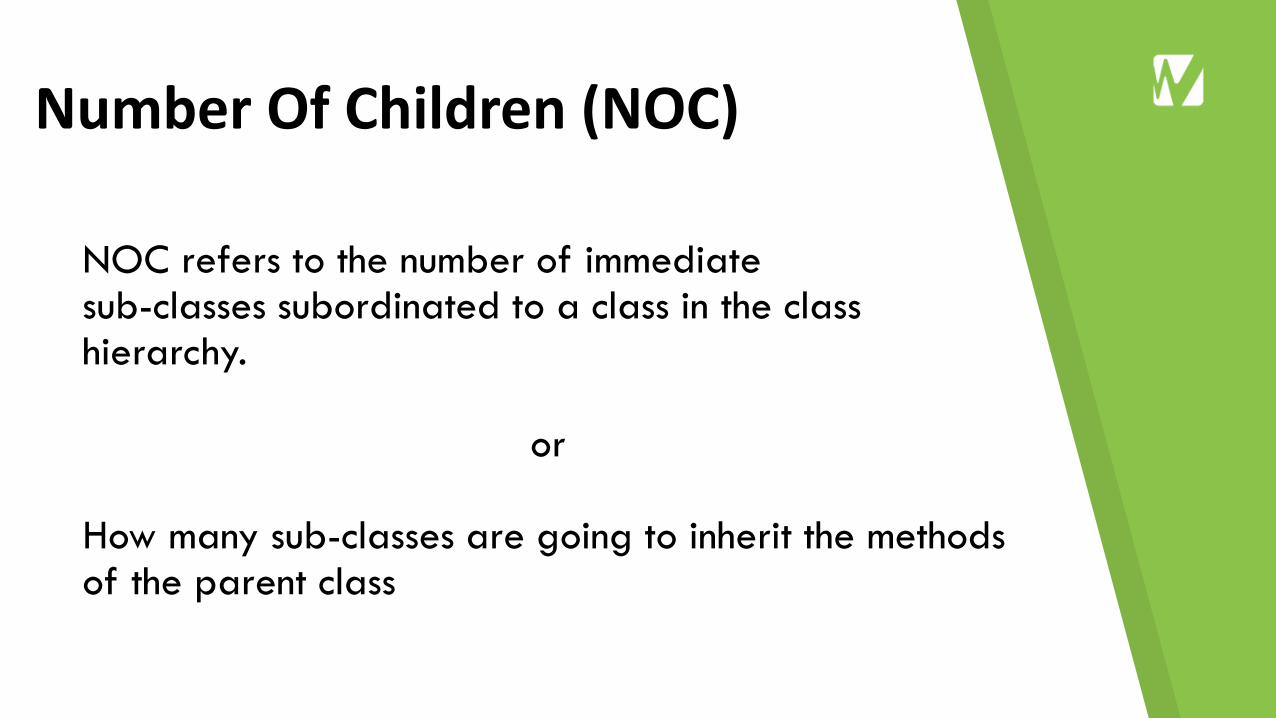
Number Of Children (NOC)
NOC refers to the number of immediate sub-classes subordinated to a class in the class hierarchy.
or
How many sub-classes are going to inherit the methods of the parent class

Number Of Children (NOC)
High NOC:
Improper abstraction of parent class
Misuse of sub-classing
More testing for the base class
High reuse for the parent class

Work That
Frustrates
Per Minute
Quality
metrics
Complexity
metrics
Object-
oriented
metrics
Code quality
metrics
Coverage metrics

Coverage MetricsFunction Coverage
Statement Coverage
Branch Coverage

Function CoverageHas each function in the program been called?
Aims to measure the quantity of functions, methods,
classes that are covered by the test suite.
Suited for testing the actual business requirements


Statement Coverage
Has each statement in the program been executed?
Covers only the true conditions in a method
Makes sure that all code blocks are executed

How to measure it
Statement coverage = 𝑁𝑢𝑚𝑏𝑒𝑟 𝑜𝑓 𝑠𝑡𝑎𝑡𝑒𝑚𝑒𝑛𝑡𝑠 𝑒𝑥𝑒𝑟𝑐𝑖𝑠𝑒𝑑
𝑇𝑜𝑡𝑎𝑙 𝑛𝑢𝑚𝑏𝑒𝑟 𝑜𝑓 𝑠𝑡𝑎𝑡𝑒𝑚𝑒𝑛𝑡𝑠× 100 %
Higher this number => better exercised code
100 % statement coverage => not imply fully functional test

Example
1. READ X
2. READ Y
3. Z = X + 2*Y
4. IF Z > 50 THEN
5. PRINT “Z VALUE”
6. ENDIF
Test No. Tests Lines Covered Statement
Coverage
Value
Test1 X = 2, Y = 3 1 TO 4, 6 83 %
Test2 X = 0, Y = 25 1 TO 4, 6 83 %
Test3 X = 47, Y = 1 1 TO 4 ,6 83 %
Test4 X = 20, Y = 25 1 TO 6 100 %

Statement Coverage != Function
Coverage

Statement Coverage != Function Coverage
Full Code Coverage Test

Statement Coverage != Function Coverage
Correct Tests

Branch Coverage
Has each branch of each control structure been
executed?
Aims to measure how many branches in the code base
have been executed during testing.
Covers both the TRUE and the FALSE conditions

How to measure it
Branch coverage = 𝑁𝑢𝑚𝑏𝑒𝑟 𝑜𝑓 𝑑𝑒𝑐𝑖𝑠𝑖𝑜𝑛 𝑜𝑢𝑡𝑐𝑜𝑚𝑒𝑠 𝑒𝑥𝑒𝑟𝑐𝑖𝑠𝑒𝑑
𝑇𝑜𝑡𝑎𝑙 𝑛𝑢𝑚𝑏𝑒𝑟 𝑜𝑓 𝑑𝑒𝑐𝑖𝑠𝑖𝑜𝑛 𝑜𝑢𝑡𝑐𝑜𝑚𝑒𝑠× 100
%
100 % branch coverage => imply full statement coverage
100 % statement coverage => does NOT imply full branch
coverage

Example
1. READ X
2. READ Y
3. Z = X - 2*Y
4. IF Z < 0 THEN
5. PRINT “Z negative”
6. ENDIF
Test No. Tests Decision
outcome
exercised
Branch
Coverage
Value
Test1-1 X = 20, Y =
15
‘Z < 0’ -> TRUE 50 %
Test1-2 X = 10, Y = 2 ‘Z < 0’ ->
FALSE
50 %
Test1-1 gives 100 % statement coverage
For 100% branch coverage ->
both tests need to be run

Quality
metrics
Coverage
metrics
Complexity
metrics
Object-
oriented
metrics
Code quality
metrics
Work That Frustrates
Per Minute

Work that Frustrate per Minute (CODE REVIEW)
Major impact on the quality of the code => one of the most powerful tools available
One of the biggest defect detection rate
0
10
20
30
40
50
60
Function Testing Integration Testing Unit Testing Code Review


How can you control WTFPM?
Regular code reviews
Ongoing education
Learning from mistakes

Tools…

SonarQube
Open source platform developed by SonarSource
OpenEdge pug-in developed by RiverSide Software
Supports 20+ programming languages
50+ official plugins

SonarQube
Includes quality gates status:• Reliability• Security• Maintainability
Code quality metrics:• Duplicated Code• Lines of code• Technical debt• Code coverage• Comments density

Glimpse of overall health:Shows where you stand in terms of quality

Conclusions…


THANK YOU


![Exploranative Code Quality Documents · metrics. For instance, SonarQube [5] controls and manages the code quality in several ways, such as continuous inspection and issue de-tection.](https://static.fdocuments.in/doc/165x107/5f08d62b7e708231d423f577/exploranative-code-quality-documents-metrics-for-instance-sonarqube-5-controls.jpg)