NYC Green Infrastructure · as more fully detailed in the landmark NYC Green Infrastructure Plan,...
38
NYC Green Infrastructure 2012 Annual Report Michael R. Bloomberg Mayor Carter H. Strickland, Jr. Commissioner
Transcript of NYC Green Infrastructure · as more fully detailed in the landmark NYC Green Infrastructure Plan,...

2012 Green Infrastructure Annual Report 1
NYC Green Infrastructure2012 Annual Report
Michael R. Bloomberg MayorCarter H. Strickland, Jr.Commissioner

i 2012 Green Infrastructure Annual Report
2012 Green Infrastructure Annual Report ii
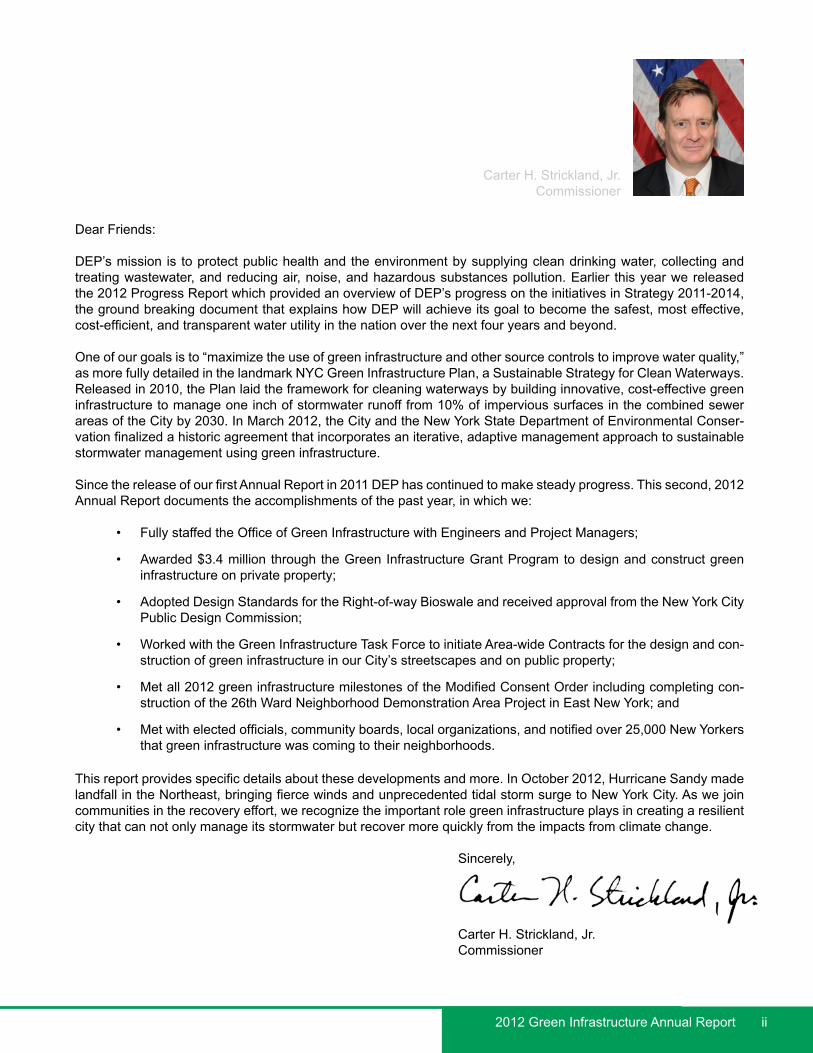
Carter H. Strickland, Jr. Commissioner
Dear Friends:
DEP’s mission is to protect public health and the environment by supplying clean drinking water, collecting and treating wastewater, and reducing air, noise, and hazardous substances pollution. Earlier this year we released the 2012 Progress Report which provided an overview of DEP’s progress on the initiatives in Strategy 2011-2014, the ground breaking document that explains how DEP will achieve its goal to become the safest, most effective, cost-efficient, and transparent water utility in the nation over the next four years and beyond.
One of our goals is to “maximize the use of green infrastructure and other source controls to improve water quality,” as more fully detailed in the landmark NYC Green Infrastructure Plan, a Sustainable Strategy for Clean Waterways. Released in 2010, the Plan laid the framework for cleaning waterways by building innovative, cost-effective green infrastructure to manage one inch of stormwater runoff from 10% of impervious surfaces in the combined sewer areas of the City by 2030. In March 2012, the City and the New York State Department of Environmental Conser-vation finalized a historic agreement that incorporates an iterative, adaptive management approach to sustainable stormwater management using green infrastructure.
Since the release of our first Annual Report in 2011 DEP has continued to make steady progress. This second, 2012 Annual Report documents the accomplishments of the past year, in which we:
• Fully staffed the Office of Green Infrastructure with Engineers and Project Managers;
• Awarded $3.4 million through the Green Infrastructure Grant Program to design and construct green infrastructure on private property;
• Adopted Design Standards for the Right-of-way Bioswale and received approval from the New York City Public Design Commission;
• Worked with the Green Infrastructure Task Force to initiate Area-wide Contracts for the design and con-struction of green infrastructure in our City’s streetscapes and on public property;
• Met all 2012 green infrastructure milestones of the Modified Consent Order including completing con-struction of the 26th Ward Neighborhood Demonstration Area Project in East New York; and
• Met with elected officials, community boards, local organizations, and notified over 25,000 New Yorkers that green infrastructure was coming to their neighborhoods.
This report provides specific details about these developments and more. In October 2012, Hurricane Sandy made landfall in the Northeast, bringing fierce winds and unprecedented tidal storm surge to New York City. As we join communities in the recovery effort, we recognize the important role green infrastructure plays in creating a resilient city that can not only manage its stormwater but recover more quickly from the impacts from climate change.
Sincerely,
Carter H. Strickland, Jr. Commissioner

iii 2012 Green Infrastructure Annual Report

2012 Green Infrastructure Annual Report iv
Introduction....................................................................................................................................................
2012 Major Accomplishments........................................................................................................................
Institutionalizing Green Infrastructure..........................................................................................................
Multi-agency Green Infrastructure Task Force..................................................................................
DEP’s Office of Green Infrastructure.................................................................................................
Outreach and Engagement...............................................................................................................
Regulations, Rulemaking, and Other Developments........................................................................
Environmental Review......................................................................................................................
Green Infrastructure Design Standards........................................................................................................
Demonstration and Pilots Projects...............................................................................................................
Neighborhood Demonstration Area Projects.....................................................................................
Pilot Monitoring Program...................................................................................................................
Green Infrastructure Planning.......................................................................................................................
Waterbody Prioritization Approach....................................................................................................
Priority Area Approach......................................................................................................................
Modeling............................................................................................................................................
Citywide Implementation...............................................................................................................................
Area-wide Contracts..........................................................................................................................
Public Onsite Retrofit Projects.........................................................................................................
Green Infrastructure Maintenance.....................................................................................................
Green Infrastructure Grant Program.................................................................................................
Office of Green Infrastructure Program Costs...................................................................................
Built and Designed Green Infrastructure...........................................................................................
Adaptive Management and Lessons Learned..............................................................................................
Green Infrastructure Tracking...........................................................................................................
Case Studies...................................................................................................................................................
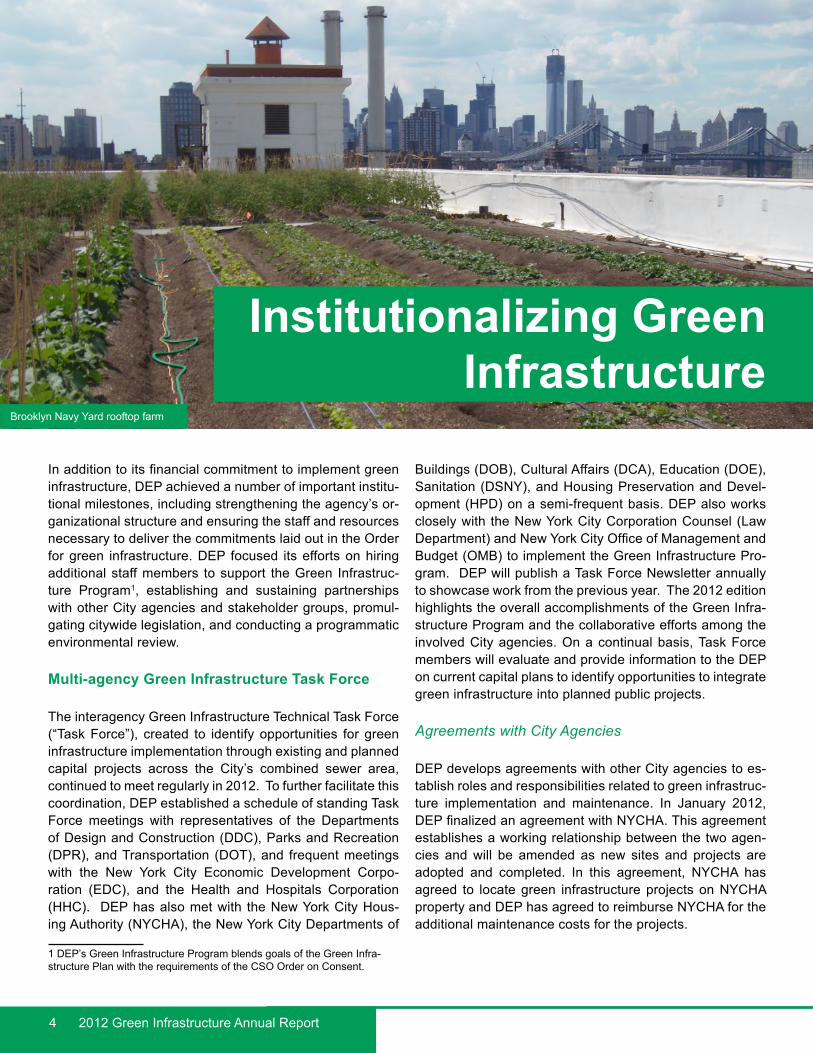
Brooklyn Navy Yard..........................................................................................................................
Queens College................................................................................................................................
26th Ward.........................................................................................................................................
2013 Action Plan.............................................................................................................................................
List of Acronyms............................................................................................................................................
Table of Contents1
2
4
4
5
6
7
7
8
10
10
11
12
12
14
15
17
17
18
18
19
20
22
23
23
24
25
26
27
28
31

v 2012 Green Infrastructure Annual Report

2012 Green Infrastructure Annual Report 1
In 2012, the New York City Department of Environmental Protection (DEP) signed a groundbreaking agreement with the New York State Department of Environmental Conser-vation (DEC) to reduce combined sewer overflows (CSO) using a hybrid green and grey infrastructure approach. By the time of the signing, DEP had already established the Office of Green Infrastructure, worked with the interagen-cy Green Infrastructure Task Force to develop standard designs, specifications, and siting procedures for Right-of-way Bioswales (“bioswales”), launched the Green Infra-structure Grant Program (“Grant Program”), adopted a new rule for stormwater management in new construction, and built first generation green roofs, blue roofs, bioswales, rain gardens, and other types of green infrastructure across the City’s combined sewer areas.
Despite all that has already been accomplished, the City is still in the early stages of achieving the goal set forth in the NYC Green Infrastructure Plan, A Sustainable Strategy for Clean Waterways (2010) (“Green Infrastructure Plan”): which is to manage one inch of runoff from 10% of impervi-ous surfaces within combined sewer areas by 2030. Each year, DEP will report to DEC and the public on its progress toward this goal as well as interim milestones included in the CSO Order on Consent1 (“Order”) between DEP and DEC and effective March 12, 2012. This annual report de-scribes the institutional and organizational steps taken, cre-ation of design standards, pilot and demonstration projects implemented for ongoing data collection, and approaches for citywide implementation developed over the past year.
1 Order on Consent (CSO Order Modification to CO2-20000107-8) (DEC Case No. CO2-20110512-25)
Green infrastructure is included in the Order as baseline credit towards achieving waterbody-specific water quali-ty standards consistent with the Federal CSO Policy and the water quality goals of the Clean Water Act (CWA). The Order requires a specific green infrastructure application rate—manage one inch of runoff from 10% of impervious surfaces in combined sewer areas citywide by 2030—but allows the City to develop waterbody-specific application rates as part of the development of Long Term Control Plans (LTCP) for New York City. Waterbody-specific application rates include varied percentages or targets for managing impervious areas in different combined sewer tributary ar-eas. DEP will adjust these rates based on lessons learned during implementation, monitoring data collected from pilot projects and Neighborhood Demonstration Areas, and the development of green infrastructure performance metrics.
Over the next 20 years, DEP is planning for $2.4 billion in public and private funding for targeted green infrastructure installations, as well as $2.9 billion in cost-effective grey infrastructure upgrades to reduce CSOs. DEP expects to fulfill the interim milestones of the Order and manage one inch of runoff from 1.5% of impervious surfaces or commit more than $192 million by 2015 largely by working with oth-er City agencies to build green infrastructure in the right-of-way. The City’s comprehensive strategy for CSO control combines green infrastructure with cost-effective grey infra-structure and system optimization, and is a critical element of Mayor Bloomberg’s far-reaching environmental initiative, PlaNYC 2030, to ensure a cleaner and more accessible harbor that continues to benefit residents and visitors.
IntroductionBlue Roof, 1201 Metropolitan Ave, a DEP storehouse
2 2012 Green Infrastructure Annual Report
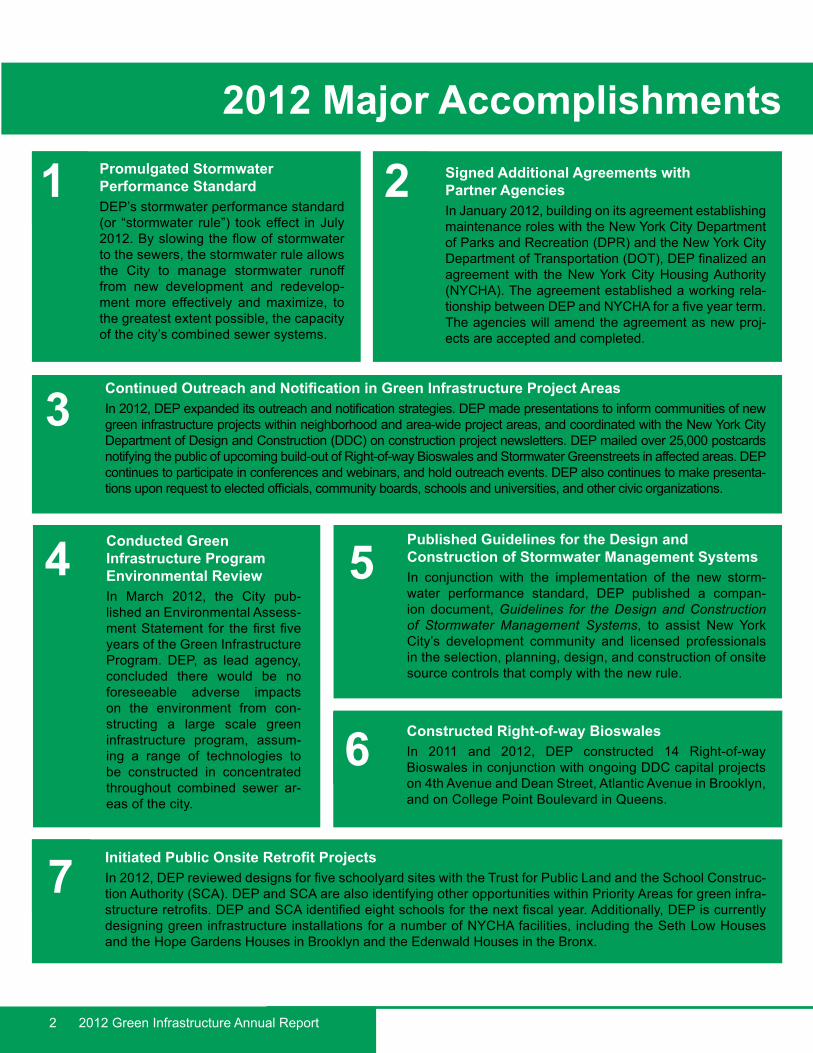
2012 Major AccomplishmentsSigned Additional Agreements with Partner AgenciesIn January 2012, building on its agreement establishing maintenance roles with the New York City Department of Parks and Recreation (DPR) and the New York City Department of Transportation (DOT), DEP finalized an agreement with the New York City Housing Authority (NYCHA). The agreement established a working rela-tionship between DEP and NYCHA for a five year term. The agencies will amend the agreement as new proj-ects are accepted and completed.
Promulgated Stormwater Performance StandardDEP’s stormwater performance standard (or “stormwater rule”) took effect in July 2012. By slowing the flow of stormwater to the sewers, the stormwater rule allows the City to manage stormwater runoff from new development and redevelop-ment more effectively and maximize, to the greatest extent possible, the capacity of the city’s combined sewer systems.
Continued Outreach and Notification in Green Infrastructure Project AreasIn 2012, DEP expanded its outreach and notification strategies. DEP made presentations to inform communities of new green infrastructure projects within neighborhood and area-wide project areas, and coordinated with the New York City Department of Design and Construction (DDC) on construction project newsletters. DEP mailed over 25,000 postcards notifying the public of upcoming build-out of Right-of-way Bioswales and Stormwater Greenstreets in affected areas. DEP continues to participate in conferences and webinars, and hold outreach events. DEP also continues to make presenta-tions upon request to elected officials, community boards, schools and universities, and other civic organizations.
Conducted Green Infrastructure Program Environmental ReviewIn March 2012, the City pub-lished an Environmental Assess-ment Statement for the first five years of the Green Infrastructure Program. DEP, as lead agency, concluded there would be no foreseeable adverse impacts on the environment from con-structing a large scale green infrastructure program, assum-ing a range of technologies to be constructed in concentrated throughout combined sewer ar-eas of the city.
Published Guidelines for the Design and Construction of Stormwater Management SystemsIn conjunction with the implementation of the new storm-water performance standard, DEP published a compan-ion document, Guidelines for the Design and Construction of Stormwater Management Systems, to assist New York City’s development community and licensed professionals in the selection, planning, design, and construction of onsite source controls that comply with the new rule.
Constructed Right-of-way Bioswales In 2011 and 2012, DEP constructed 14 Right-of-way Bioswales in conjunction with ongoing DDC capital projects on 4th Avenue and Dean Street, Atlantic Avenue in Brooklyn, and on College Point Boulevard in Queens.
2
3
4
1
5
6
Initiated Public Onsite Retrofit ProjectsIn 2012, DEP reviewed designs for five schoolyard sites with the Trust for Public Land and the School Construc-tion Authority (SCA). DEP and SCA are also identifying other opportunities within Priority Areas for green infra-structure retrofits. DEP and SCA identified eight schools for the next fiscal year. Additionally, DEP is currently designing green infrastructure installations for a number of NYCHA facilities, including the Seth Low Houses and the Hope Gardens Houses in Brooklyn and the Edenwald Houses in the Bronx.
7

2012 Green Infrastructure Annual Report 3
Completed Green Infrastructure Standard Designs for Right-of-way BioswalesIn coordination with Green Infrastructure Task Force partners, DEP’s Office of Green Infrastructure developed design standards for various types of Right-of-way Bioswales to be used by engineers, architects, landscape architects and other city agencies while preparing contract plans. These standards, finalized in August 2012, will facilitate the design of green infrastructure practices in the right-of-way and specifically streamline the development of contract plans and drawings, and reduce the timeline and costs associated with design and approval processes. DOT, DPR, and DEP also developed a siting and review procedure for Right-of-way Bioswale and Greenstreet locations. This includes a desktop hydrologic analysis, followed by a site visit by all agencies to determine the feasibility of the Right-of-way Bioswale or Greenstreet in a specific location based on existing conditions such as spatial and pedestrian conflicts.
10
Completed Construction of 26th Ward Neighborhood Demonstration ProjectDEP completed the 26th Ward Green In-frastructure Demonstration Area Project (“Demonstration Area”) in December 2012, which included 29 Right-of-way Bioswales and two Greenstreets within a 23 acre tributary area. Additionally, DEP constructed Right-of-way Bioswales as part of the Hutchinson Riv-er Demonstration Area, which started in Sep-tember 2012 and includes 22 Right-of-way Bioswales in a 24-acre tributary area. DEP is currently in the process of building 19 Right-of-way Bioswales in the 16-acre Newtown Creek Demonstration Project Area. Monitoring will be ongoing at all Demonstration Projects in order to study the benefits of green infra-structure application on a neighborhood scale.
8 Initiated Area-wide ContractsIn 2012, DEP selected three consultants to design green infrastructure in Priority Com-bined Sewer Tributary Areas (“Priority Areas”) of the Gowanus Canal, Newtown Creek, and Flushing Bay waterbodies. These area-wide contracts have commenced, with construction expected to begin in the fall of 2013. DEP has also transferred funding for both design and construction to the New York City Economic Development Corporation (EDC), DDC, and DPR for area-wide contracts covering other Priority Areas in the Newtown Creek tributary areas, as well as Priority Areas within the Ja-maica Bay, Bronx River, and Hutchinson River CSO tributary areas. In 2012, DPR began con-struction in Flushing Bay and Bronx River, and will complete those projects in 2013. DDC and EDC will begin design this year.
9
Completed Second Cycle of Green Infrastructure Grant ProgramIn 2012, DEP awarded through the Green In-frastructure Grant Program $3.4 million to eight proposals. Projects are spread across four bor-oughs, and included green roofs, rain gardens, porous pavement, and bioinfiltration. Since its introduction in 2011, approximately $6.4 million has been awarded to 19 private property own-ers to build green infrastructure projects in the combined sewer areas of the city. DEP has ex-panded the Grant Program by announcing $6 million for the 2013 cycle.
11 Released NYC Green Infrastructure Plan: 2011 Preliminary Pilot Monitoring ResultsSince 2009, DEP has been selecting appro-priate sites, and designing and constructing green infrastructure pilots in various locations throughout the Bronx, Brooklyn, and Queens. These pilots informed the analysis in the NYC’s Green Infrastructure Plan and continue to shape future planning and design efforts. This inaugu-ral report, published in 2012, summarizes initial monitoring results and preliminary observations made in 2011 for a number of individual source controls.
12
2012 Major Accomplishments
4 2012 Green Infrastructure Annual Report
Institutionalizing Green Infrastructure
In addition to its financial commitment to implement green infrastructure, DEP achieved a number of important institu-tional milestones, including strengthening the agency’s or-ganizational structure and ensuring the staff and resources necessary to deliver the commitments laid out in the Order for green infrastructure. DEP focused its efforts on hiring additional staff members to support the Green Infrastruc-ture Program1, establishing and sustaining partnerships with other City agencies and stakeholder groups, promul-gating citywide legislation, and conducting a programmatic environmental review.
Multi-agency Green Infrastructure Task Force
The interagency Green Infrastructure Technical Task Force (“Task Force”), created to identify opportunities for green infrastructure implementation through existing and planned capital projects across the City’s combined sewer area, continued to meet regularly in 2012. To further facilitate this coordination, DEP established a schedule of standing Task Force meetings with representatives of the Departments of Design and Construction (DDC), Parks and Recreation (DPR), and Transportation (DOT), and frequent meetings with the New York City Economic Development Corpo-ration (EDC), and the Health and Hospitals Corporation (HHC). DEP has also met with the New York City Hous-ing Authority (NYCHA), the New York City Departments of
1 DEP’s Green Infrastructure Program blends goals of the Green Infra-structure Plan with the requirements of the CSO Order on Consent.
Buildings (DOB), Cultural Affairs (DCA), Education (DOE), Sanitation (DSNY), and Housing Preservation and Devel-opment (HPD) on a semi-frequent basis. DEP also works closely with the New York City Corporation Counsel (Law Department) and New York City Office of Management and Budget (OMB) to implement the Green Infrastructure Pro-gram. DEP will publish a Task Force Newsletter annually to showcase work from the previous year. The 2012 edition highlights the overall accomplishments of the Green Infra-structure Program and the collaborative efforts among the involved City agencies. On a continual basis, Task Force members will evaluate and provide information to the DEP on current capital plans to identify opportunities to integrate green infrastructure into planned public projects.
Agreements with City Agencies
DEP develops agreements with other City agencies to es-tablish roles and responsibilities related to green infrastruc-ture implementation and maintenance. In January 2012, DEP finalized an agreement with NYCHA. This agreement establishes a working relationship between the two agen-cies and will be amended as new sites and projects are adopted and completed. In this agreement, NYCHA has agreed to locate green infrastructure projects on NYCHA property and DEP has agreed to reimburse NYCHA for the additional maintenance costs for the projects.
Brooklyn Navy Yard rooftop farm

2012 Green Infrastructure Annual Report 5
Capital Planning Coordination
In 2012, DEP continued to focus its efforts on institutional-izing the planning, design, construction and maintenance of green infrastructure in different bureaus throughout the agency as well as with other City agencies. In order to meet the Order milestone dates DEP developed an area-wide approach to green infrastructure implementation focused on Priority CSO Tributary Areas (“Priority Areas”). Priority Areas were chosen based on water quality of the receiving waterbody and the frequency and volume of overflow. DEP is now partnering with DDC, DPR, and EDC to implement green infrastructure Area-wide Contracts for the design of bioswales, Stormwater Greenstreets2 (“Greenstreets”), and green infrastructure retrofits on public property. DEP initi-ated three Area-wide Contracts and is currently collecting field data to determine feasibility and design.
Throughout 2012, DEP assigned Priority Areas to partner agencies, who then solicited contracts for the design and construction of green infrastructure in those areas. DEP will continue to work closely with its partner agencies through-out design and construction under these contracts to meet the near-term Order milestones for green infrastructure and 2015 targets. DEP will also review and refine Priority Areas as it ensures green infrastructure implementation to achieve long-term Order milestones and 2030 targets. 2 In 2010, the Greenstreets program became DPR’s Green Infrastructure Unit, realigning its focus in coordination with DEP to build bioswales and Greenstreets that can actively manage stormwater. Greenstreets, like bioswales, feature inlets, broken stone, engineered soil, and hardy plants to collect and absorb stormwater from the street and sidewalk. They are slightly larger than bioswales and are built in underutilized roadbed areas along the curb.
DEP’s Office of Green Infrastructure
DEP leads green infrastructure implementation and coor-dination with other bureaus and City agencies and over-sees area-wide green infrastructure design and construc-tion. The Office of Green Infrastructure (OGI) began with six full time staff in January 2011 to implement the Green Infrastructure Program on behalf of DEP. In 2012, OGI in-creased to ten staff dedicated to the programmatic areas necessary for ongoing green infrastructure implementation and is currently in the process of hiring three additional en-gineers. Generally these programmatic areas include engi-neering design review, field investigations, hydraulic analy-sis, design and construction contract oversight, consultant/contractor contract management, Grant Program adminis-tration, interagency coordination, capital planning, mainte-nance program management, internal project tracking and data management, intra-agency and LTCP coordination, outreach and engagement, public meetings and presenta-tions, and other related administrative tasks.
In addition, OGI collaborates with other DEP bureaus in-cluding the Bureau of Water and Sewer Operations and the Bureau of Environmental Planning and Analysis, which provide direct support to OGI primarily on design review, waterbody planning, and coordinating the monitoring of green infrastructure benefits. Figure 1 illustrates the variety of roles and responsibilities of DEP bureaus and collabo-rating agencies.
DEPOffice of Green Infrastructure
DEP Bureau of Engineering Design and Construction
• Area-wide Contracts Design & Construction
DEP Bureau of Water and Sewer Operations
• Assists with Grant Project Design Review• Site Connection and Stormwater Rule Review
DEP Bureau of Environmental Planning and Analysis
• Grant Application Review Committee• Green Infrastructure reporting for CSO Consent Order• LTCP Green Infrastructure Modeling• Waterbody Prioritization Planning
Department of Design and Construction• Area-wide Contracts Design & Construction• Development of Right-of-way Bioswale Standard Designs• Grant Application Review Committee
Economic Development Corporation• Area-wide Contracts Design & Construction
Department of Transportation• Review of All Area-wide Design• Walk-Through for Site Selection• Development of Right-of-way Bioswale Standard Designs• Grant Application Review Committee
Department of Parks and Recreation• Area-wide Contracts Design & Construction• Walk-Through for Site Selection• Development of Right-of-way Bioswale Standard Designs• Grant Application Review Committee• Maintenance of Green Infrastructure
Leads Green Infrastructure Implementation and
Coordination with other Bureaus and Agencies
Public Outreach• Green Infrastructure Steering Committee• Citizens Group• Elected Officials• Community Boards Other Agencies
• NYC Housing Authroity• NYC School Construction Authority/Department of Education• NYC Department of Cultural Affairs• NYC Health and Hospitals Corporation
Figure 1: Office of Green Infrastructure organizational chart
6 2012 Green Infrastructure Annual Report
Outreach and Engagement
DEP continued to convene the Green Infrastructure Steer-ing Committee in 2012 and engage the public in the on-going implementation of the Green Infrastructure Program. The committee is comprised of a cross-section of stake-holders ranging from environmental justice and economic development organizations, to architecture, design, green jobs training organizations, and other experts in stormwa-ter management. The Steering Committee meets quarterly and serves as a liaison between the Green Infrastructure Citizens Group and DEP in order to represent different stakeholder groups and interests. In 2012, the Steering Committee met quarterly and organized itself into three separate working groups: Green Jobs, Education and Engagement, and Technical Advice and Research. DEP works with each group to help foster greater stakeholder participation in the ongoing development of DEP’s Green Infrastructure Program, raise awareness among the gener-al public, and assist DEP in promoting green infrastructure practices across the construction industry.
In 2012, DEP expanded its outreach and notification strate-gies. DEP developed presentations to inform communities of new green infrastructure projects within neighborhood
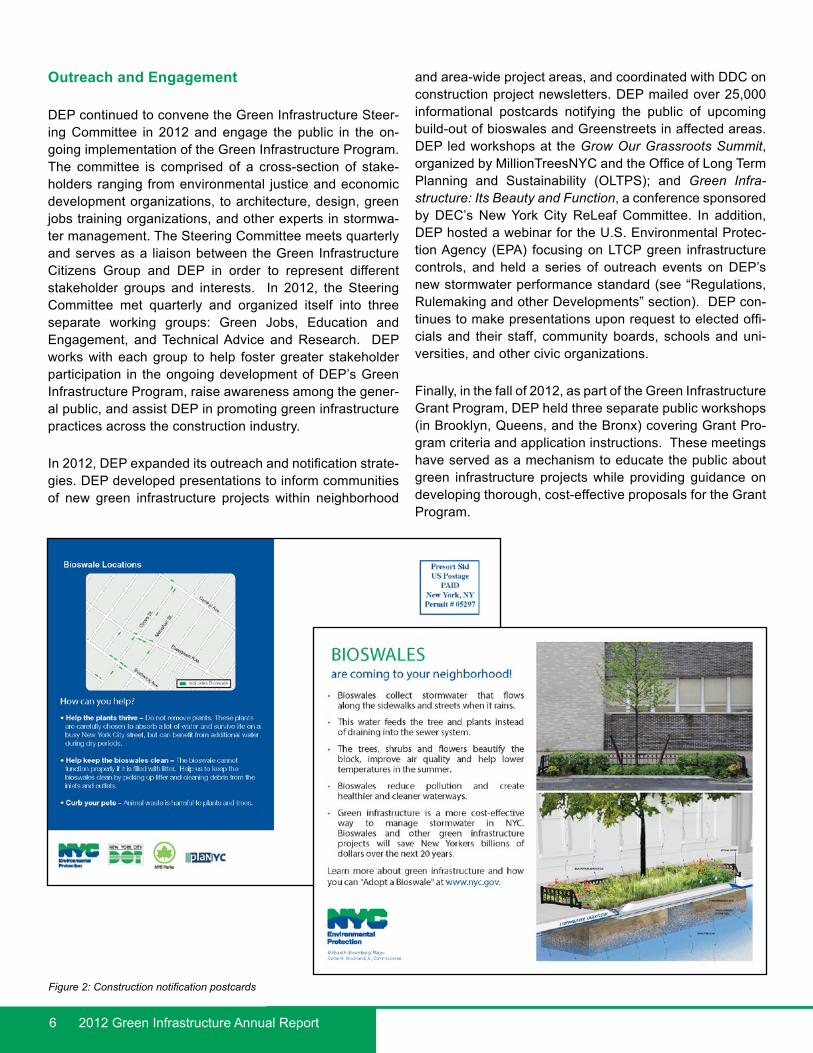
and area-wide project areas, and coordinated with DDC on construction project newsletters. DEP mailed over 25,000 informational postcards notifying the public of upcoming build-out of bioswales and Greenstreets in affected areas. DEP led workshops at the Grow Our Grassroots Summit, organized by MillionTreesNYC and the Office of Long Term Planning and Sustainability (OLTPS); and Green Infra-structure: Its Beauty and Function, a conference sponsored by DEC’s New York City ReLeaf Committee. In addition, DEP hosted a webinar for the U.S. Environmental Protec-tion Agency (EPA) focusing on LTCP green infrastructure controls, and held a series of outreach events on DEP’s new stormwater performance standard (see “Regulations, Rulemaking and other Developments” section). DEP con-tinues to make presentations upon request to elected offi-cials and their staff, community boards, schools and uni-versities, and other civic organizations.
Finally, in the fall of 2012, as part of the Green Infrastructure Grant Program, DEP held three separate public workshops (in Brooklyn, Queens, and the Bronx) covering Grant Pro-gram criteria and application instructions. These meetings have served as a mechanism to educate the public about green infrastructure projects while providing guidance on developing thorough, cost-effective proposals for the Grant Program.
Figure 2: Construction notification postcards

2012 Green Infrastructure Annual Report 7
Regulations, Rulemaking, and other Developments
DEP promulgated the new stormwater performance stan-dard (“stormwater rule”) in July 2012, as an amendment to the Rules of the City of New York after several years of development and analysis.3 By slowing the flow of storm-water to the sewers, the stormwater rule allows the City to manage stormwater runoff from new development and re-development more effectively and to maximize the capacity of the City’s combined sewer systems to the extent possi-ble. Any new house or site connections to the City’s com-bined sewer system must comply with a stricter stormwater release rate, effectively requiring greater onsite detention. The stormwater rule was a key component of PlaNYC 2030 and the Green Infrastructure Plan, and is a green in-frastructure strategy that DEP will continue to evaluate as part of its comprehensive approach to reduce CSOs using a combination of green and grey infrastructure.
The stormwater rule applies to new development or the alteration of an existing development in combined sewer areas of the City. For a new development, the stormwa-ter release rate4 will be the greater of 0.25 cubic feet per second (cfs) or 10% of the drainage plan allowable flow5. If the allowable flow is less than 0.25 cfs, then the storm-water release rate shall be equal to the allowable flow. For alterations, the stormwater release rate for the altered area will be directly proportional to the ratio of the altered area to the total site area, and no new points of discharge are permitted.6
DEP’s stormwater rule effectively implemented several proposals of the New York City Green Codes Task Force, a citywide effort led by the U.S. Green Buildings Council to “green” the City’s rules and regulations. Specifically these proposals include; reduce stormwater runoff from new de-velopments, send rainwater to waterways, encourage in-novative stormwater practices, and maintain site-based stormwater detention systems.
In conjunction with the implementation of the new stormwa-ter rule, DEP published a companion document, Guidelines for the Design and Construction of Stormwater Manage-ment Systems, to assist New York City’s development com-munity and licensed professionals in the selection, plan-ning, design, and construction of onsite source controls that comply with the stormwater rule. The guidelines were
3 See Chapter 31 of Title 15 of the Rules of the City of New York Govern-ing House/Site Connections to the Sewer System. (New York City, N.Y., Rules, Tit. 15, § 31)4 New York City, N.Y., Rules, Tit. 15, § 31-01(b)5 Allowable flow is defined as the storm flow from developments based on existing sewer design criteria that can be released into an existing storm or combined sewer.6 New York City, N.Y., Rules, Tit. 15, § 31-03(a)(2)
developed in consultation with DOB, and feature guid-ance on siting, design, and construction considerations for various stormwater control systems, as well as operation and maintenance recommendations. Likewise, DEP went through an extensive peer review process that incorporat-ed input from representatives of multiple City agencies, members of design, engineering, real estate communities, and leaders in sustainability.
DEP continued implementation of the Parking Lot Storm-water Pilot Program first initiated in 2011, and billed 364 parking lot accounts for a total of $188,000 during 2012. DEP instituted a stormwater charge of $0.05 per square foot for stand-alone parking lots which applies to existing and new parking lots that do not receive or pay for wa-ter service but discharge stormwater to City sewers. The charge generates revenue for important stormwater-relat-ed expenditures. In 2012, DEP used updated data to iden-tify additional stand-alone parking lots not charged in 2011, and will begin billing these additional accounts in 2013. The charge is anticipated to increase each year as DEP’s stormwater related expenditures increase.
Throughout 2012, DEP worked with OLTPS, DOB, OMB and the Department of Finance (DOF), as well as envi-ronmental advocates and green roof designers to modify and extend the New York City Green Roof Tax Abatement past the March 2013 expiration date. Since the tax abate-ment became effective in 2008, approximately two acres of green roof have been installed. Five individual proper-ty owners have received the abatement, totaling approxi-mately $260,000. DEP met with stakeholders and agency partners to identify ways to improve response to the pro-gram, increase the number of green roofs in the City, and support the transformation of the local market for green roof materials and labor.
Environmental Review
On March 8, 2012, DEP published an Environmental As-sessment Statement for the first five years of the Green Infrastructure Program. Although individual projects are unlikely to trigger an environmental review, each project site is intended to function together as part of a larger stormwater management program. DEP, as lead agency, concluded there would be no foreseeable adverse impacts on the environment from constructing a large scale Green Infrastructure Program, assuming a range of technologies to be constructed in concentrated areas throughout com-bined sewer areas of the City. DEP published the Nega-tive Declaration May 23 and finalized it on June 22, 2012. Documents pertaining to the environmental review are on DEP’s website: nyc.gov/dep.

8 2012 Green Infrastructure Annual Report
Green Infrastructure Design Standards
In coordination with Task Force partners, DEP has devel-oped design standards for various types of bioswales to be used by engineers, architects, landscape architects, and other city agencies while preparing contract plans. These standards will facilitate the design of green infrastructure practices in the right-of-way and specifically streamline the development of contract plans and drawings, and reduce the timeline and costs associated with design and approval processes. Finalized on August 16, 2012, the standards are posted on DEP’s website. Currently, there are three stan-dard designs including a 10’x5’, 15’x5’ and 20’x5’ bioswale, each with unique plant specifications and variations to in-clude stormwater inlets and/or stone columns. DEP is de-veloping additional green infrastructure standards in order to address a range of site conditions common throughout the Area-wide Contract locations.
In February 2012, DEP joined DDC, DOT, and DPR in pre-senting the bioswale designs to the NYC Public Design Commission. With support from professional design part-ners the designs received the commission’s final approval on March 12, 2012.
In 2011 and 2012, DEP constructed 14 bioswales in con-junction with ongoing DDC capital projects on 4th Avenue
and Dean Street and Atlantic Avenue in Brooklyn, and on College Point Boulevard in Queens. DEP also completed the 26th Ward/Jamaica Bay Demonstration Area in De-cember 2012, which included 29 bioswales and two Green-streets.
Beyond the design standards, DOT, DPR, and DEP also developed a siting and review procedure for bioswale and Greenstreets locations. This includes a desktop hydro-logic analysis, followed by a site visit by all agencies to determine the feasibility of the bioswale or Greenstreet in that specific location based on existing conditions such as spatial and pedestrian conflicts. The right-of-way green in-frastructure projects respect the established street zones and will be placed in the “Furnishing Zone” of the sidewalk, similar to street trees.
DEP has standardized survey and geotechnical proce-dures specifically required for bioswale and Greenstreets sites to ensure that each site does not conflict with utilities and will infiltrate as designed. Due to the various complica-tions that can arise during construction as well as unknown subsurface conditions, these procedures are necessary in order to avoid utility conflicts, and areas with adverse soil conditions and high groundwater tables.
Right-of-way Bioswale, Dean St. & 4th Ave., Brooklyn

2012 Green Infrastructure Annual Report 9
EXISTING CATCH BASIN
INLET
COMBINED SEWER
SEWER MANHOLE
OUTLET
A
A
B
B
C
C
OPEN-GRADED STONE BASE
ENGINEERED SOIL
GEOTEXTILE FABRIC
UNDISTURBED SOIL
3” LAYER OF MULCH
3 SIDED STEELTREE PIT GUARD
3 SIDED STEELTREE PIT GUARD
RUNOFF FROM SIDEWALK
PITCH
DROP CURB INLET DROP CURB OUTLET
SECTION A-A SECTION B-B SECTION C-C
TREE ROOTS
CONCRETE CURB
GABION
GREEN INFRASTRUCTURE RIGHT OF WAY BIOSWALE
Michael R. Bloomberg, MayorCarter H. Strickland, Jr. Comissioner
RUNOFF FROM ROADWAY
CONCRETE CURB
CONCRETE APRONASPHALT ROADWAY
STONE STRIPLANDSCAPE EDGING
HDPE BARRIER
Figure 3: Illustrations showing Right-of-way Bioswale design and functions
10 2012 Green Infrastructure Annual Report
Demonstration &Pilot Projects
The Green Infrastructure Program applies an adaptive management approach based on pilot monitoring results and information collected and assessed for demonstration projects. In particular, this information will be used to de-velop a green infrastructure performance metrics report re-quired by the Order to relate the benefits of combined sew-er overflow reduction to the amount of constructed green infrastructure.
Neighborhood Demonstration Area Projects
The Order contains design, construction, and monitoring milestones for three Neighborhood Demonstration Area Projects (“Demonstration Projects”). DEP is currently in the process of building and monitoring green infrastructure within a total of 63 acres of tributary area in the Newtown Creek, Hutchinson River1 and Jamaica Bay CSO tributary areas to study the benefits of green infrastructure applica-tion on a neighborhood scale. The development of these Demonstration Projects will culminate in the submission of a post-construction monitoring report in August 2014, and
1 The original location of this Neighborhood Demonstration Area project was in the Bronx River CSO tributary area. However, in the course of con-ducting soil borings in the area as part of the green infrastructure design process, DEP found that the Demonstration Area is predominantly under-lain with shallow bedrock that is unfavorable for the design and construc-tion of bioswales. Per a modification request submitted by DEP to DEC on March 30, 2012, the location was moved to the Hutchinson River CSO tributary area, where more favorable soil conditions were identified for a neighborhood area connected to a common combined sewer.
will be incorporated into the 2016 performance metrics re-port. Monitoring for all three Demonstration Projects start-ed in the fall of 2011 and continued throughout 2012.
Construction of bioswales as part of the Hutchinson River Green Infrastructure Demonstration Area Project (Demon-stration Area 1) started in September 2012. Demonstra-tion Area 1 includes 22 bioswales that will be installed within a 24-acre tributary area and will cost approximately $371,000 to construct. DPR’s Green Infrastructure Unit completed the design for Demonstration Area 1. In Decem-ber 2012, DEP completed the Jamaica Bay Green Infra-structure Demonstration Project in the 26th Ward Tribu-tary Area (Demonstration Area 2). The project includes 29 bioswales and two Greenstreets within a 23-acre tributary area. Demonstration Area 2 cost approximately $887,000 to design and construct. Finally, the Newtown Creek Green Infrastructure Demonstration Project (Demonstration Area 3) includes 19 bioswales within a 16-acre tributary area. Demonstration Area 3 will cost approximately $690,000 to design and construct.
While DEP’s Pilot Monitoring Program provides perfor-mance data for individual green infrastructure installations, the Demonstration Projects will allow DEP to establish standardized methods for calculating and reporting derived CSO volume reductions and other benefits associated with multiple green infrastructure installations in a concentrated
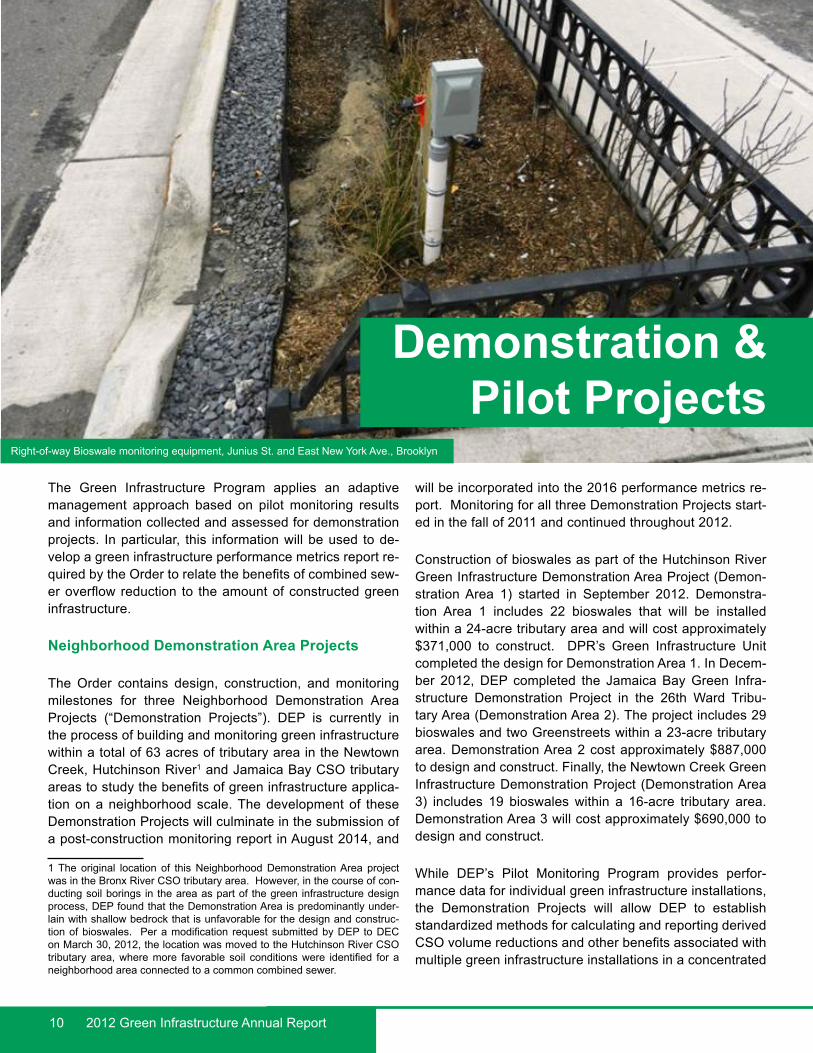
Right-of-way Bioswale monitoring equipment, Junius St. and East New York Ave., Brooklyn

2012 Green Infrastructure Annual Report 11
area. DEP will assess CSO reductions achieved through multiple installations with common connections to the sew-er system by collecting high-quality flow monitoring data at a point at which the combined sewers exit each of the Demonstration Areas. Monitoring activities consist of re-cording flow and depth using meters placed within the main outlet sewer as well as at several individual bioswale instal-lations. Data acquisition will be continuous with measure-ments recorded at 15-minute intervals, and will be collect-ed for a period of several months for pre-construction and a year for post-construction. In August 2014, DEP will report on the monitoring data in a Post Construction Monitoring Report. This information will enhance DEP’s understanding of the benefits of green infrastructure relative to runoff con-trol and CSO reduction. Additionally, DEP will extrapolate the results when calculating and modeling water quality and cost-benefit information on a waterbody basis.
Pilot Monitoring Program
The Pilot Monitoring Program provides DEP opportunities to test different designs and monitoring techniques in or-der to determine the most cost-effective, adaptable, and efficient green infrastructure strategies for implementation citywide. Specifically, the program assesses the effective-ness of different source controls in various locations at re-ducing the volume and rate of stormwater runoff from the tributary area through measuring quantitative aspects like inflow and outflow rates. Monitoring efforts also include qualitative assessments of maintenance requirements, aesthetics, and community perception. DEP initiated site selection and design of 25 different pilot sites in 2009, and completed construction of each pilot site in less than one year. Water quality and quantity data collection began in 2010 and 2011. Monitoring results are currently used to estimate bioswale performance, and to validate modeling methods and parameters. DEP will publish the results of the 2012 Pilot Monitoring Report in 2013, and is expected to verify results published in the 2011 Pilot Monitoring Re-port, which DEP published in 2012.
The 2011 Pilot Monitoring Report is posted on DEP’s web-site. Given the consistency in monitoring results reported for the first two years, DEP will scale back water quality and quantity monitoring for several pilots in 2013. DEP antici-pates resuming in three to five years to determine if pilots are performing as originally designed. Besides measuring the direct stormwater capture and water quality benefits of the green infrastructure projects, DEP has also begun to develop protocols for monitoring the co-benefits of green infrastructure, such as carbon sequestration and urban heat island mitigation, and plans to begin its monitoring in 2013.
!(
!(
!(
!(
!(
!(!(
!(
!(
!(!(
!(
!(
!(!(
!(
!(
!(
!(
!(!(!(
!(!(
!(!(
!(!(!(
!
!
JUN
IUS
PITKIN
POW
ELL
LIBERTY
GLENMORE
VAN SIN
DER
EN
HR
ISTOPH
ER
BELMONT
SACKM
AN
PACIFIC
NEW YORK
LOW
HO
USES
SACKM
AN
LOW
HO
USES
! Greenstreets
Right-of-way Bioswales!
¯ 0 200100
Figure 4: 26th Ward Demonstration Area, East New York, Brooklyn

12 2012 Green Infrastructure Annual Report
Green Infrastructure Planning
As previously mentioned, the Order allows for the develop-ment of waterbody-specific green infrastructure applica-tion rates for 2030 as part of the development of LTCPs for 10 different waterbodies between 2012 and 2017. Baseline implementation rates with respect to green infrastructure must be included in each LTCP. Further, to begin area-wide implementation toward achieving the goals of the Order, DEP first had to identify combined sewer areas of the City to concentrate funding for de-sign and construction contracts and in-house ef-forts. DEP employed a two-step planning process to identify target combined sewer areas for green infrastructure implementation: 1) waterbody priori-tization and 2) tributary CSO drainage area priori-tization. In addition, as LTCPs are developed and monitoring data continues to be collected, model-ing will be used to confirm and identify additional Priority Areas in the future. Each of these process-es is described in greater detail below.
Waterbody Prioritization Approach
Waterbody-specific green infrastructure application rates were developed based on a review of current and expected water quality conditions and an over-all prioritization of waterbodies. The results of this exercise were shared with and reviewed by DEC in 2012 as DEP initiated the development of the first LTCP for Alley Creek and Little Neck Bay in northeast Queens. DEP’s waterbody prioritization process relied on existing information to provide
the best estimate for waterbody-specific application rates. DEP then used this approach to identify specific waterbod-ies for public and private green infrastructure investment, provide targeted areas for ongoing green infrastructure im-plementation, and optimize LTCP alternatives evaluations involving both grey and green infrastructure.
Figure 5: DEC water classifications used to prioritize waterbodies for green infra-structure implementation in corresponding CSO tributary areas
Green roof at Paerdegat Basin CSO Facility

2012 Green Infrastructure Annual Report 13
The following criteria were applied to compare and priori-tize waterbodies in order to determine waterbody-specific green infrastructure application rates:
• Water quality standards » Fecal coliform » Total Coliform » Dissolved Oxygen
• Baseline cost effective grey investments » Planned/constructed grey investments » Projected CSO volume reductions » Remaining CSO volumes » Total capital costs
• The ratio of separate stormwater discharges to CSO discharges;
• Additional planned CSO controls not captured in Wa-tershed/Waterbody Facility Plans or Order (e.g., high level storm sewers);
• Preliminary waterbody sensitivity to green infrastruc-ture in terms of cost per gallon of CSO reduced; and
• Additional considerations: » Background water quality conditions » Public concerns and demand for higher uses » Eliminated or deferred CSO storage facilities
Managed Acres Percent of CSIA
Alley Creek 1,490 45 3%%41223133,2*reviR xnorB
Coney Island Creek %17496Flushing Bay* 4,049 522 13%Flushing %8974329,5*keerC Gowanus Canal* 1,387 162 12%
%41851821,1*reviR nosnihctuHJamaica Bay %9576198,7*seiratubirT OSC & Newtown Creek* 4,524 593 13%
%41784084,3keerC retsehctseWTotal Waterbodies 32,897 3,450 10%
CITYWIDE (Total Waterbodies + East River & Open Waters + Paerdegat Basin) 78,749 7,875 10%
Initial Phases
Future Phases
Order Requirements by 2030
WaterbodyCombined Sewer
Impervious Area (CSIA) Acreage
Application Rate Targets
Table 1: Waterbody specific application rates and opportunities for green infrastructure implementation* Priority Area
Table 1 provides a summary of 2030 green infrastructure implementation targets per the Order and for each water body based on the previously described Priority Areas. The combined sewer impervious area (CSIA) acreage for each waterbody illustrates portions of the citywide total. As LTCPs are developed, green infrastructure targets or application rates for specific waterbodies may be adjust-ed based on lessons learned during implementation and modeling of CSO and water quality conditions. Currently, DEP has identified greater application rates for waterbod-ies such as Bronx River, Flushing Bay, Gowanus Canal, Hutchinson River, Newtown Creek, and Westchester Creek based on the above DEP prioritization criteria.
DEP is targeting the right-of-way to achieve waterbody-spe-cific application rates by aggressively designing and con-structing bioswales and Greenstreets.
Application rates on public property is based DEP’s ongoing coordination with other agencies including DPR, NYCHA, Metropolitan Transit Authority, DOT, DSNY, DOE, and the New York City Fire and Police Departments to identify on-site opportunities that will supplement green infrastructure implementation in the right-of-way.
Implementation of green infrastructure as part of new de-velopment or redevelopment in all waterbodies is based on compliance with DEP’s stormwater performance standard made effective in July 2012. Grant program projects and other incentive programs will also be tracked and credited toward these private onsite application rates as well.

14 2012 Green Infrastructure Annual Report
Priority Area Approach
In order to meet the 1.5%, 4%, 7% and 10% citywide com-bined sewer tributary areas managed by green infrastruc-ture application rates by 2015, 2020, 2025 and 2030 respec-tively, Priority Areas were identified based on discharges in receiving waterbodies from specific CSO outfalls. DEP looked closely at the annual CSO volume and frequency of CSO events at each outfall to target large volume and high frequency outfalls. In addition, DEP considered outfalls that may be affected by WWFPs or other system improve-ments in the future, outfalls in close proximity to existing
0%
1%
2%
3%
4%
5%
6%
7%
8%
9%
10%
03025202020251020102
Initial 1.5%Additional 2.5%Additional 3.0%Final 3%10% Target
Figure 6: Green infrastructure application rates and milestone schedule
Flow monitoring device in CSO pipe, 26th Ward Demonstration Project
with design. Due to standardized designs and efficien-cies of scale, bioswales are the primary technologies for achieving overall targets and will manage runoff from 30% of right-of-way impervious surfaces within combined sewer tributary areas. To achieve overall targets, DEP identifies opportunities for collaboration with other agencies and de-velops onsite contracts to implement green infrastructure on other publicly owned properties. Additional information about Area-wide Contracts and Public Onsite Retrofit Proj-ects is below under Citywide Implementation.
Right-of-way Bioswale, Dean St. & 4th Ave., Brooklyn
and future public access locations, and tributary CSO drainage areas with po-tential site-specific limitations such as groundwater, bedrock, and soil types. This approach has provided DEP a platform for ongoing green infrastruc-ture implementation and will provide DEP an opportunity to measure and evaluate the CSO benefits of area-wide green infrastructure implementation at the outfall level.
Once the Priority Areas are identified, DEP then initiates Area-wide Contracts and undertakes a series of additional steps to select potential, preliminary and final sites for bioswales, and proceed
2012 Green Infrastructure Annual Report 15
The total impervious area within a CSO tributary area is di-vided into a portion being controlled by retention, another portion by detention, and a third uncontrolled portion. These three portions contribute differing degrees of outflow to the sewer system during rainfall events based on the type of control, which is then routed through combined and inter-ceptor sewers and regulators within the model as it would within the City’s actual wastewater collections and treatment system. Combined sewer overflows that occur in individual regulators during certain rainfall events are thereby influ-enced by the application of retention and detention practic-es at the neighborhood and CSO tributary area scale. By comparing the CSO discharges and related pollutant loads for the scenarios with and without green infrastructure, the anticipated CSO benefits of green infrastructure implemen-tation can be assessed on a waterbody basis.
Modeling
Green infrastructure implementation is incorporated into landside models using InfoWorks1 modeling software and based on the extent of retention and detention practices in CSO tributary areas. Infoworks has been customized for well over a decade to account for the unique flow charac-teristics of New York City’s sewer system. It uses informa-tion for 25,000 catchments, 7,500 pipes, 6,000 manholes, regulators, and other features, and predicts overland runoff routing in New York City’s topography. InfoWorks expresses the extent of retention and detention in terms of a percent of impervious cover where one inch of stormwater is managed through different types of source controls such as bioswales, cisterns, and detention tanks on a CSO tributary area basis.
Individual source controls are aggregated in the model to col-lectively represent distributed green infrastructure through-out a neighborhood and also at the tributary area scale. The fundamental processes in these controls such as infiltration, storage, and orifice control for detention are still preserved, and DEP has developed scale-up methodologies to account for multiple retention and detention practices planned as part of the baseline credit for each CSO tributary area.
For example, the model replicates infiltration and storage in the bioswales based on the corresponding percent of reten-tion and the number of bioswales needed to manage one inch of rainfall within this subcatchment.
Similarly, a detention system that constricts the outflow to 0.25 cubic feet per second per impervious acre or 10% of allowable flow is reflected in the models as a collective of decentralized systems at the neighborhood scale. Based on the number of new and redevelopment projects that will guide the percent of impervious area being managed by de-tention, DEP’s drainage planning methodology is used to es-timate the detention storage needed for each project. These neighborhood scale retention and detention systems are then aggregated within each CSO tributary area as “storage nodes” managing one inch of stormwater from impervious surfaces within specific CSO tributary areas in the model.
1 The InfoWorks model is a commercially available product from Innovyze (http://www.innovyze.com). The model is used to analyze urban hydrolo-gy and hydraulics. The InfoWorks model is capable of using Geographic Information Systems (GIS) data, modeling continuous and event simula-tions, incorporating real time controls, modeling green and grey infrastruc-ture, and performing water quality tracking within sewer systems.
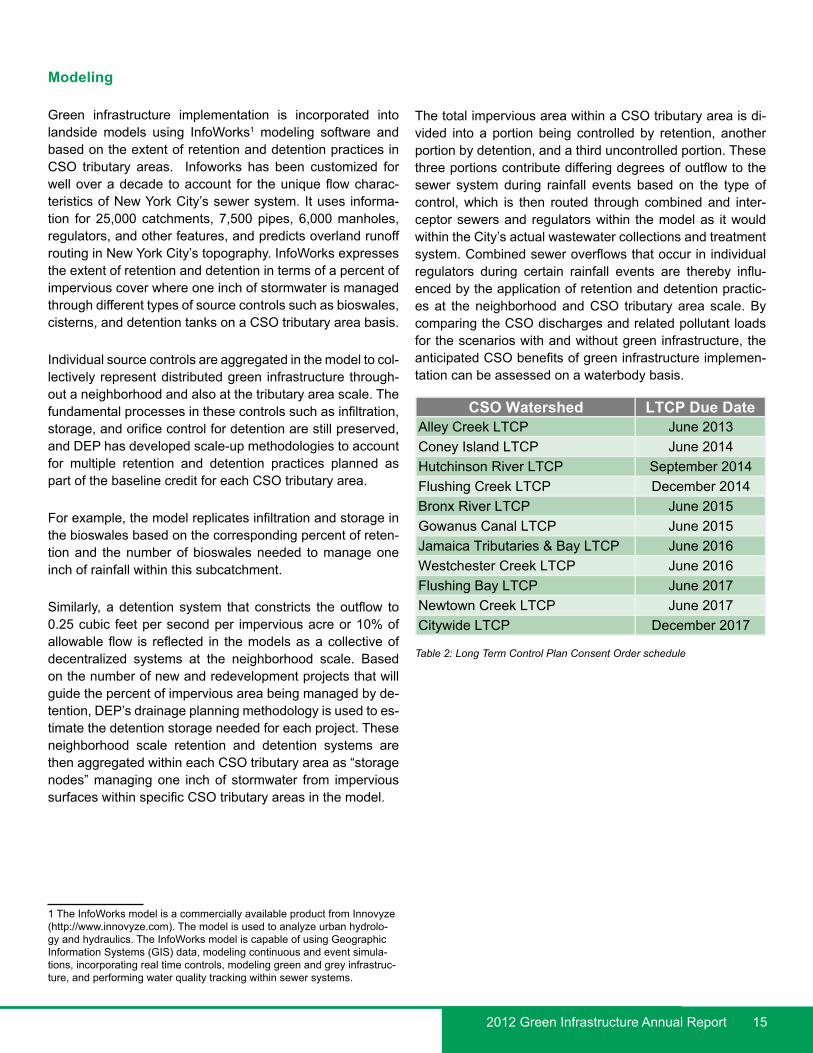
CSO Watershed LTCP Due Date3102 enuJPCTL keerC yellA
Coney Island LTCP June 2014Hutchinson River LTCP September 2014Flushing Creek LTCP December 2014Bronx River LTCP June 2015Gowanus Canal LTCP June 2015Jamaica Tributaries & Bay LTCP June 2016Westchester Creek LTCP June 2016Flushing Bay LTCP June 2017Newtown Creek LTCP June 2017
7102 rebmeceDPCTL ediwytiC
Table 2: Long Term Control Plan Consent Order schedule

16 2012 Green Infrastructure Annual Report
Prioritized Waterbodies and CSO Tributary Areas
Jamaica Bay andCSO Tributaries
Bronx RiverHutchinson
River
GowanusCanal
FlushingCreek
FlushingBay
NewtownCreek
0 1 2 30.5 Miles
Priority CSO Tributary Areas
Current Phase to Meet 2015 Milestone
°Figure 7: Greater green infrastructure application rates were identified for the above CSO tributary areas based on specific water quality criteria, ratios of separate stormwater and CSO discharges, and comparisons of existing and planned grey infrastructure investments
TargetAcres to be Managed by
2015
75330504055
2254101185
Gowanus Canal
Waterbody
Initial PhasesBronx RiverFlushing BayFlushing Creek
Hutchinson RiverJamaica Bay & CSO TribsNewtown CreekTotal Waterbodies
2012 Green Infrastructure Annual Report 17
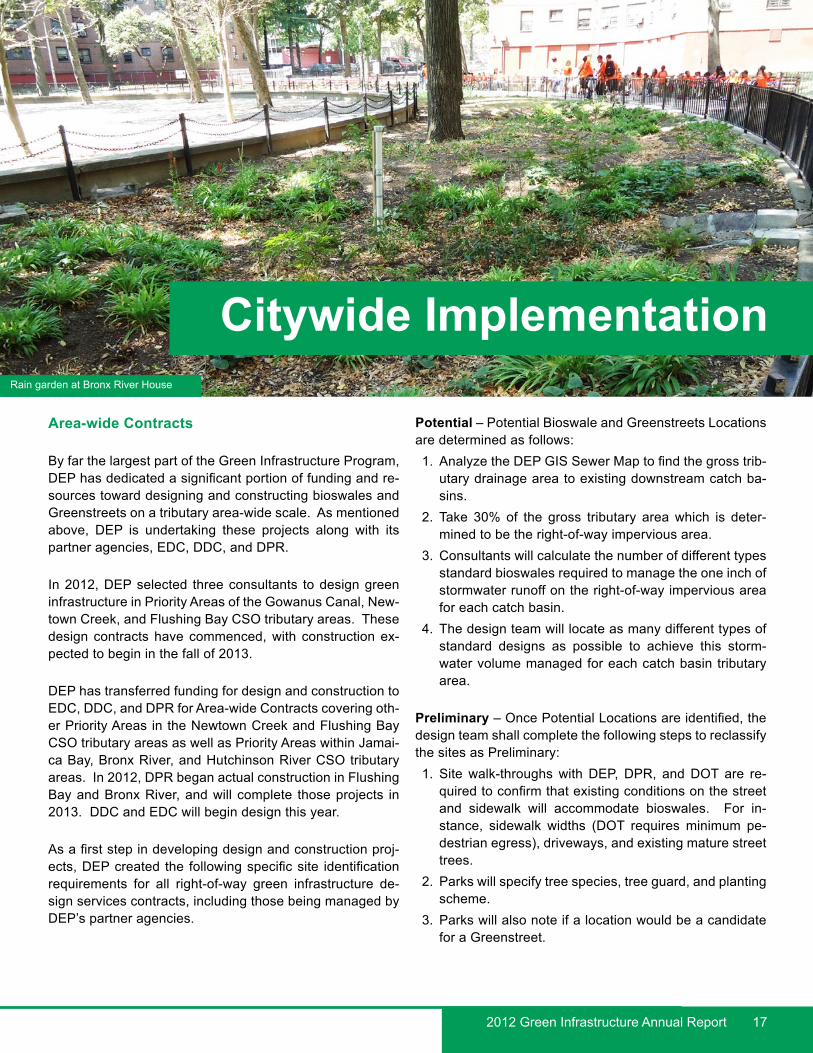
Area-wide Contracts
By far the largest part of the Green Infrastructure Program, DEP has dedicated a significant portion of funding and re-sources toward designing and constructing bioswales and Greenstreets on a tributary area-wide scale. As mentioned above, DEP is undertaking these projects along with its partner agencies, EDC, DDC, and DPR.
In 2012, DEP selected three consultants to design green infrastructure in Priority Areas of the Gowanus Canal, New-town Creek, and Flushing Bay CSO tributary areas. These design contracts have commenced, with construction ex-pected to begin in the fall of 2013.
DEP has transferred funding for design and construction to EDC, DDC, and DPR for Area-wide Contracts covering oth-er Priority Areas in the Newtown Creek and Flushing Bay CSO tributary areas as well as Priority Areas within Jamai-ca Bay, Bronx River, and Hutchinson River CSO tributary areas. In 2012, DPR began actual construction in Flushing Bay and Bronx River, and will complete those projects in 2013. DDC and EDC will begin design this year.
As a first step in developing design and construction proj-ects, DEP created the following specific site identification requirements for all right-of-way green infrastructure de-sign services contracts, including those being managed by DEP’s partner agencies.
Potential – Potential Bioswale and Greenstreets Locations are determined as follows: 1. Analyze the DEP GIS Sewer Map to find the gross trib-
utary drainage area to existing downstream catch ba-sins.
2. Take 30% of the gross tributary area which is deter-mined to be the right-of-way impervious area.
3. Consultants will calculate the number of different types standard bioswales required to manage the one inch of stormwater runoff on the right-of-way impervious area for each catch basin.
4. The design team will locate as many different types of standard designs as possible to achieve this storm-water volume managed for each catch basin tributary area.
Preliminary – Once Potential Locations are identified, the design team shall complete the following steps to reclassify the sites as Preliminary: 1. Site walk-throughs with DEP, DPR, and DOT are re-
quired to confirm that existing conditions on the street and sidewalk will accommodate bioswales. For in-stance, sidewalk widths (DOT requires minimum pe-destrian egress), driveways, and existing mature street trees.
2. Parks will specify tree species, tree guard, and planting scheme.
3. Parks will also note if a location would be a candidate for a Greenstreet.
Citywide ImplementationRain garden at Bronx River House

18 2012 Green Infrastructure Annual Report
ROWB Types Calculated CF Capacity
Calculated SF Managed
Type I 300 3,600Type II 225 2,700Type III 150 1,800Type I - Enhanced 400 4,800Type II - Enhanced 300 3,600
Table 3: Calculated Right-of-way Bioswale Capacity (cubic feet) and Square Feet Managed
Final – Once Preliminary Locations are identified, the Con-sultant shall complete the following steps to reclassify the sites as Final:1. Conduct Soil boring and permeability test per DEP’s
Procedures Governing Limited Geotechnical Investiga-tions to determine if the subsoil would be favorable for bioswales or Greenstreets to function.
2. Those sites remaining after the walk-through and geo-technical explorations will require a topographical sur-vey per DEP’s Procedure Governing Limited Survey.
After review and approval of final locations by DEP, the design team shall develop 60% plans, 90% plans and fi-nal contract plans and prepare complete construction bid packages and submit to DEP for final review and approval, and then proceed with bidding.
Public Onsite Retrofit Projects
Each green infrastructure retrofit project must manage the one-inch rainfall volume from the impervious area tributary to the installation(s). This design criterion is based on the 90th percentile storm for the New York City area, which is approximately 1.2 inches. Therefore, projects designed us-ing this criterion will perform at capacity for 90% of storms that fall in New York City. This cost-effective approach al-lows DEP to fund retrofits while also achieving both water quality and other sustainability goals such as reducing the urban heat island effect, providing greening and shade, and community improvements.
In 2012, DEP reviewed designs for five sites with the Trust for Public Land and the New York City School Construction Authority (SCA). DEP and SCA are also identifying other opportunities within Priority Areas for green infrastructure retrofits. Eight schools have been identified for the next fiscal year.
DEP and NYCHA signed an agreement in 2012 to build green infrastructure on NYCHA properties in DEP’s Prior-ity Areas. DEP is currently designing green infrastructure installations for the Seth Low Houses and the Hope Gar-dens Houses in Brooklyn, and the Edenwald Houses in the Bronx. DEP and NYCHA may also identify other opportu-nities within the Gowanus and Flushing Bay Priority Areas.
In 2012, DEP worked with the DCA and DDC on a parking lot project for the Flushing Town Hall, a non-profit cultur-al institution in Queens. The project consisted of install-ing additional bioinfiltration to the parking lot design and bioswales adjacent to the parking lot.
Also in 2012, DEP worked with the HHC and the Kings County Hospital Center to design a green roof for its East New York Diagnostic and Treatment Center building. DEP and HHC are working to identify additional opportunities for green roof projects at other City-owned hospital facilities.
Green Infrastructure Maintenance
Throughout 2012, DPR and DEP proceeded on develop-ment of the Green Infrastructure Maintenance Program per the maintenance agreement signed in 2011 establish-ing the maintenance roles and responsibilities concerning green infrastructure installation in the right-of-way. In the agreement, DEP agreed to fund dedicated maintenance crews to maintain Greenstreets and bioswales through January 2016. The agreement established that the DPR crews would provide maintenance for the vegetated areas including the plants, trees, and landscaped areas; DOT will maintain to the extent practicable the existing grades during milling and resurfacing operations when working around green infrastructure sites; and DEP will continue to maintain catch basins and other existing roadway drainage elements.
Over the next several years, DEP will continue to hire staff for dedicated green infrastructure maintenance crews who will be working under DPR to maintain the bioswales and Greenstreets. DEP hired the first crew of five in Brooklyn, an additional crew in Queens to begin later this year and the Bronx crew in 2014. As the agencies approve final sites through the Area-wide Contracts, DEP will continuously evaluate the maintenance capacity of the existing crews and will add crews in each borough as needed. DPR also added three positions to support their in-house design ca-pacity for green infrastructure projects in 2012.
2012 Green Infrastructure Annual Report 19
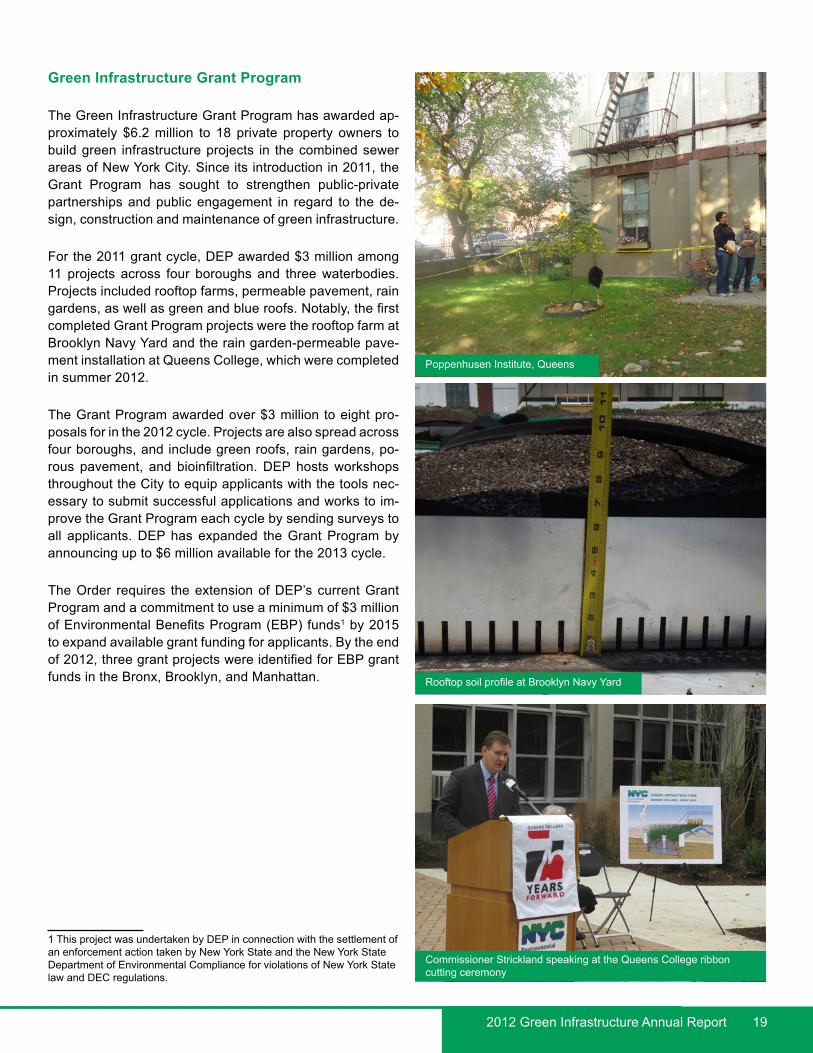
Green Infrastructure Grant Program
The Green Infrastructure Grant Program has awarded ap-proximately $6.2 million to 18 private property owners to build green infrastructure projects in the combined sewer areas of New York City. Since its introduction in 2011, the Grant Program has sought to strengthen public-private partnerships and public engagement in regard to the de-sign, construction and maintenance of green infrastructure.
For the 2011 grant cycle, DEP awarded $3 million among 11 projects across four boroughs and three waterbodies. Projects included rooftop farms, permeable pavement, rain gardens, as well as green and blue roofs. Notably, the first completed Grant Program projects were the rooftop farm at Brooklyn Navy Yard and the rain garden-permeable pave-ment installation at Queens College, which were completed in summer 2012.
The Grant Program awarded over $3 million to eight pro-posals for in the 2012 cycle. Projects are also spread across four boroughs, and include green roofs, rain gardens, po-rous pavement, and bioinfiltration. DEP hosts workshops throughout the City to equip applicants with the tools nec-essary to submit successful applications and works to im-prove the Grant Program each cycle by sending surveys to all applicants. DEP has expanded the Grant Program by announcing up to $6 million available for the 2013 cycle.
The Order requires the extension of DEP’s current Grant Program and a commitment to use a minimum of $3 million of Environmental Benefits Program (EBP) funds1 by 2015 to expand available grant funding for applicants. By the end of 2012, three grant projects were identified for EBP grant funds in the Bronx, Brooklyn, and Manhattan.
1 This project was undertaken by DEP in connection with the settlement of an enforcement action taken by New York State and the New York State Department of Environmental Compliance for violations of New York State law and DEC regulations.
Poppenhusen Institute, Queens
Rooftop soil profile at Brooklyn Navy Yard
Commissioner Strickland speaking at the Queens College ribbon cutting ceremony

20 2012 Green Infrastructure Annual Report
Office of Green Infrastructure Program Costs
The Green Infrastructure Program has committed approxi-mately $23 million in capital funds to date and has budget-ed over $730 million to the Green Infrastructure Program over the next 10 years.
In the Order, DEP agreed to spend $187 million on green infrastructure to show the agency’s commitment toward mitigating CSOs using green practices. In addition, DEP set aside $5 million as EBP funding, which equals the $192 million commitment for green infrastructure by 2015. The Green Infrastructure Program will ramp up spending in the coming years to meet the commitments under the Order and will ultimately commit $192 million by the end of 2015 (FY16).
Table 4 shows the FY12 and FY13 spending for the Green Infrastructure Program. The capital funding shown below are costs of design, construction management, and con-struction of green infrastructure program-wide for the last two fiscal years. This funding will support design, construc-tion management, and construction for green infrastructure projects undertaken by DEP as well as agency partners, including the Area-wide Contracts with EDC, DDC, DPR and smaller projects with other agencies. Expense funding covers DEP’s operational costs, such as maintenance of green infrastructure, as well as DEP’s Rain Barrel Program.
While the program is still in its early stages, DEP is work-ing to ensure that costs stay competitive and that econo-mies of scale are realized for all contracts. Table 5 shows DEP’s current estimated costs per bioswale. It should be noted that during the initial stages of Area-wide Contracts, DEP is conservatively requiring survey work and geotech-nical investigations at most proposed green infrastructure locations. If needed, DEP will update these requirements
latoT 31YF & 21YF31YF21YFyrammuS margorP 000,201,401$ 000,300,49$ 000,990,01$ latipaC
588,595$ 588,595$ 0$esnepxE 588,796,401$ 588,895,49$ 000,990,01$LATOT
latoT 31YF & 21YF31YF21YFyrammuS latipaC 000,619,15$ 000,962,94$ 000,746,2$ngiseD 000,681,25$ 000,437,44$ 000,254,7$MC/noitcurtsnoC 000,201,401$ 000,300,49$ 000,990,01$latoT
latoT 31YF & 21YF31YF21YFyrammuS esnepxEDPR Green Infrastructure Maintenance Program $0 $462,385 $462,385
005,331$ 005,331$ 0$margorP yawaeviG lerraB niaR 588,595$ 588,595$ 0$latoT
Table 4: Budgeted spending for FY12 and FY13.
000,4$ngiseDSurveys and Geotechnical $5,000
000,52$noitcurtsnoCConstruction Management (10% of Construction Costs) $2,500
005,63$latoT
Average Costs for a Typical Right-of-way Bioswale
Table 5: Average costs for a typical Right-of-way Bioswale.
as well as design and construction practices to keep costs reasonable and to ensure that all green infrastructure proj-ects will be functional over the long-term.
As previously described, the maintenance of right-of-way green infrastructure systems is currently governed by an interagency agreement between the DOT, DEP, and DPR, which established that green infrastructure will be main-tained by dedicated DPR Green Infrastructure Mainte-nance Crews.
As final sites are approved through the Area-wide Con-tracts, DEP will continuously evaluate the maintenance capacity of the existing crews and will add crews per bor-ough as needed. In order to estimate long term operations and maintenance costs, DEP and DPR are developing reasonable parameters as a basis including neighborhood context, vegetation establishment over time, streamlining tasks and frequencies, and accounting for site densities and clusters. These parameters will be analyzed regularly and revised as field experience increases.
DEP is also developing a state-of-the-art tracking and as-set management system that will ensure all sites are main-tained and functioning, and assist in the ongoing opera-tions and maintenance (O&M) analyses. DPR and DEP are committed to on-going O&M evaluation to more accurately predict the costs and expenses of green infrastructure in the right-of-way going forward.

2012 Green Infrastructure Annual Report 21
°0 2 4 6 81Miles
Green RoofSubsurface DetentionBioinfiltrationBlue RoofPorous Paving
Figure 8: 2011 and 2012 built green infrastructure

22 2012 Green Infrastructure Annual Report
Built and Designed Green Infrastructure
Throughout 2011 and 2012, DEP has built and funded nu-merous green infrastructure projects throughout the City’s combined sewer area, both onsite and in the right-of-way. In order to reach the citywide 10% goal, the agency has targeted projects in the Priority CSO Tributary Areas, or waterbodies, as defined under LTCP. Table 6 indicates the acreage necessary to meet this goal per waterbody, as well as the amount of impervious surface managed by green infrastructure to date and those planned for 2013.
0
1,000
2,000
3,000
4,000
5,000
6,000
7,000
8,000
2012 2013 2014 2015 2016 2017
Num
ber o
f Bio
swal
es
Calendar Year
Built/Designed SitesIdentified AreasFuture Projection
The built columns for 2011 and 2012 show the area managed by completed green infrastructure projects in the right-of-way, includ-ing change order projects, Neigh-borhood Demonstration Areas, and public retrofits and Grant Program projects. The above table also in-cludes the area managed by DEP’s green infrastructure pilots as well as green roofs incentivized through the Green Roof Tax Abatement program and others built on private property. The designed 2013 proj-ects have final design completed for construction to start in 2013. Those projects that are in various design stages at the date of this
report, including substantially completed designs, are not included in Table 6 but will be included in the next annual report. Additionally, the managed area included in the de-signed column for 2013 includes private properties affected by DEP’s stormwater rule, which are tracked via permitted site connections through DEP’s Bureau of Water and Sew-er Operations.
2013 GI Designed2
2.2 1.2 2.7 6.10.02 0.3 15.3 15.6
3.03.00.6 0.5 0.7 1.8
1.8 14.8 16.63.8 5.1 1.9 10.8
8.53.55.00.06 0.1 0.6 0.87.2 9.3 41.3 57.7
8.7 13.1 56.3 78.1
Flushing BayFlushing CreekGowanus Canal
2011 GI Built1 2012 GI Built1
Bronx River
Acres ManagedGreen Infrastructure Built and Designed as of April 30, 2013
CITYWIDE (Total Waterbodies + East River & Open Waters + Paerdegat Basin)
Hutchinson RiverJamaica Bay & CSO TributariesNewtown CreekWestchester CreekTotal Waterbodies
Total Built and Designed Acres2
Initial Phases
Future Phases
Waterbody
Table 6: Built and Designed Green Infrastructure Implementation 1 Includes: change order projects, area-wide projects, pilots, demonstration projects, grants, onsite retrofits, green roof tax abatement, etc.2 Based on completed designs (including grant projects) and public investments
Figure 9: Right-of-way Bioswale construction targets. In partnership with EDC, DDC, DPR, other agency partners, and on its own, DEP has initiated many area-wide green infrastructure projects in Priority CSO Tributary Areas. The final number of Right-of-way Bioswales to be constructed under these contracts is contingent upon meeting of OGI standards, specifications, and siting criteria

2012 Green Infrastructure Annual Report 23
Since its inception in January 2011, DEP has progressed along the cost and learning curves associated with its Green Infrastructure Program. Reengineering stormwater manage-ment in New York City has posed serious challenges but has also led to significant opportunities and increasing gains. The decentralized and diverse nature of green infrastructure demands non-standard approaches to capital planning and streamlined processes to meet aggressive targets. As a re-sult, DEP’s program emphasizes the following strategies in the near term: Priority CSO Drainage Areas, area-wide de-sign and construction, and pilot and demonstration project monitoring. As the implementation of Green Infrastructure Program progresses, DEP expects to take stock of lessons learned and modify the program accordingly to achieve cost-effective designs and installations, optimal performance over time, and overall water quality goals.
Green Infrastructure Tracking
DEC has agreed to an adaptive management approach that allows DEP to propose alternative ways to meet its green infrastructure performance targets, and to account for any missed targets by changing its investment and design strat-egy to reflect current conditions. To establish the feedback loop necessary to adopt this approach, DEP has institution-alized tracking systems such as the Green Infrastructure Webmap, which has a public interface allowing people to search and enter green infrastructure projects online. DEP uses the Webmap to track a variety of onsite installations and encourages individual property owners installing green infrastructure on private property to add their information to the Webmap. DEP also updates the Webmap internally to
track other private projects as information is available, such as green roofs constructed by New York City Green Roof Tax Abatement recipients. DEP also tracks private proper-ties affected by the stormwater performance standard at the time of site connection proposal certifications and issuance of a certificate of inspections once built. These private prop-erty owners must furnish proof of maintenance in the form of a certification by a licensed professional submitted to DEP every three years to comply with the performance standard. DEP will also track this information to ensure the perfor-mance of the retention and detention systems constructed in compliance with the performance standard over time.
DEP has developed an interim asset management system to track and monitor green infrastructure built in the right-of-way and as public retrofit and Grant Program projects throughout the City. DEP tracks all projects funded by the agency, including grant projects, bioswales, Greenstreets, and public retrofits through its asset management system and ultimately by the GIS-based Green Infrastructure As-set Management System currently under development. The asset management system will allow DEP to enter design, construction and maintenance information about each green infrastructure installation via Global Positioning System de-vices and map these projects via the Webmap application. DEP will review all tracking data annually to compare to es-timated waterbody application rates presented in this annual report, and Pilot and Demonstration Project Monitoring data as collected. DEP will also compare tracked data to perfor-mance metrics to be developed based on future modeling in order to adjust the citywide implementation program as needed, and achieve the requirements of the Order.
Adaptive Management and Lessons Learned
Tree guard and native plants in a Right-of-way Bioswale

24 2012 Green Infrastructure Annual Report
°0 2 4 6 81Miles
26th Ward Demonstration Area
Brooklyn Navy Yard Rooftop Farm Queens College Campus
Case Studies

2012 Green Infrastructure Annual Report 25
°0 2 4 6 81Miles
The rooftop farm installation at the Brooklyn Navy Yard was the Grant Program’s first and largest grant project complet-ed to date. In June 2011, DEP awarded a $592,730 grant to the Brooklyn Navy Yard to build a 43,000 square foot roof-top farm atop Building 3 in the Brooklyn Navy Yard. Con-struction began in May 2012 and was complete by August. The rooftop farm will prevent more than one million gallons of stormwater from entering the New York City sewer sys-tem each year and will help reduce CSOs to the East River.
The Brooklyn Navy Yard, formerly the largest shipbuilding facility in the U.S., is now home to a diverse array of busi-nesses including movie studios, furniture manufacturers, ship repairers, architectural designers, electronics distrib-utors and jewelers. Brooklyn Grange, who will manage the rooftop farm, is a commercial, urban farming business founded in 2010, and now has over two acres of rooftop under cultivation on two separate rooftops. The Navy Yard farm includes two flocks of egg-laying hens and a commer-cial apiary consisting of more than 30 bee hives.
The farm’s 12-inch deep growing beds are comprised of a soil medium blended specifically for rooftop farming use. Brooklyn Grange expects an annual yield of 20,000 pounds of fresh produce. Crops include leafy greens, aromatic herbs, heirloom tomatoes and carrots. The farm is produc-tive between April and November, and cover crops such as clover and vetch are planted in the winter to prevent soil erosion and replenish vital nutrients.
The farm will also provide several co-benefits to the Navy Yard itself, including increased ecological activity, local food production and job creation. Brooklyn Grange will also use the rooftop farm for community engagement by provid-ing school groups, families and volunteers with opportuni-ties to learn about the local food supply and participate in urban farming activities
Case Study: Brooklyn Navy Yard
Rooftop before farm installation
Rooftop farm after installation
Rooftop farm in production

26 2012 Green Infrastructure Annual Report
In October 2012, Queens College, a Green Infrastruc-ture Grant Program grantee located in the Flushing Creek watershed, completed construction of three rain gardens and permeable paver projects on its campus. Construc-tion lasted approximately 12 weeks and transformed three different plaza and public spaces into green infrastructure projects. In addition to DEP’s $386,000 award for the project, Queens College provided more than $150,000 in matching funds. The newly installed permeable pavers, bioswales and rain gardens at Kiely Hall, Remsen Hall and the Rosenthal Library will manage stormwater runoff and keep an estimated 900,000 gallons of stormwater out of New York City’s combined sewer system each year. The plazas also provide beautification and an educational op-portunity for the campus community.
The project’s designers, RDA Landscape Architects, worked to transform the three highly-trafficked pedestri-an areas on campus with sustainable green infrastruc-ture technologies. The permeable pavers and bioretention system have a storage capacity of nearly 48,000 gallons of stormwater and are managing runoff from over 33,000 square feet of impervious area. The system has already im-proved site drainage on campus while providing additional green space.
The Rosenthal Library promenade is a primary campus entrance, linking a parking area with the campus quad. The project replaced 9,645 square feet of impervious area with permeable pavers, new concrete pavement, trees, bioswales, and rain gardens. In addition to adding green infrastructure, the landscape design intent was to enhance the experience of arriving at the campus.
Kiely Hall is the College’s administration building. The 11,400 square foot impervious courtyard space is located just off the main campus quad. The College’s aim was to transform the space from a pass-through corridor to a gath-ering place, using permeable pavers, new trees, and rain gardens.
Finally, Remsen Hall Forecourt was an existing 4,700 square foot impervious parking lot and loading area sep-arating the Remsen Hall entrance from the main quad. To create this pedestrian-oriented space, existing asphalt and concrete were replaced with permeable pavers and along with rain gardens and bioswales.
Case Study: Queens College
Kiely Hall Plaza before construction
Kiely Hall Plaza during construction
Kiely Hall Plaza after construction

2012 Green Infrastructure Annual Report 27
In December 2012, DEP completed construction on the first of three Neighborhood Demonstration Projects in East New York, Brooklyn (“Demonstration Area 2”). Demonstration Area 2 is comprised of a 23-acre area of a mixed use neigh-borhood with approximately 2,300 residents, and is charac-terized by residential buildings, industrial, manufacturing, transportation, and utility facilities. DEP constructed twen-ty-nine bioswales and two Greenstreets over a six-month period beginning in August 2012.
The project is designed to manage one inch of rain on 2.63 acres of the right-of-way within the Demonstration Area, which equates to approximately 7,563 cubic feet of storm-water. DEP estimates that the project will prevent nearly four million gallons of stormwater on average from reaching the combined sewer system each year. Since October 2011, DEP has collected continuous data of normal and peak flow levels in the combined sewer pipe before it exits Demonstra-tion Area 2. Post-construction monitoring of the green infra-structure installations at Demonstration Area 2 began in Jan-uary 2013. In addition to the flow meters in the sewers, five of the bioswales have piezometers and moisture sensors installed in order to measure performance on the site level. These two monitoring approaches will help DEP determine the amount of stormwater being managed by each bioswale as well as their cumulative benefits that will be measured by the flow meters in the sewer pipe.
DEP worked closely with the contractor on the Demonstra-tion Area projects to communicate the key functions of the bioswale and Greenstreet, which differ significantly from traditional planting practices in the landscape industry. For example, the soil level in a traditional street tree pit is even with the surrounding sidewalk; in contrast, the planting bed of a bioswale is several inches below the sidewalk to allow the collection of stormwater. During construction of the first Demonstration Area projects, DEP and the contractor togeth-er discovered bioswale construction methods that will serve to increase productivity in the upcoming larger bioswale con-struction contracts. In order to install the distributed right-of-way green infrastructure practices in an efficient manner, the 31 installations in Demonstration Area 2 were constructed in clusters. These clusters were identified by the proximity of each bioswale on a block, overall distribution in the area, and street parking regulations. In each cluster, the contrac-tor started with pavement and sidewalk removal, followed by concrete work for the curbs and sidewalk. Excavation and backfill were then followed by tree planting, placement of the tree guard, and finishing with perennials and mulch.
In addition to providing performance monitoring data, Demonstration Area 2 will also allow DEP to demonstrate and study the operation and maintenance of right-of-way green infrastructure. DPR’s Greenstreets maintenance crews visit
each installation weekly, and perform routine and seasonal tasks year round to keep the bioswales and Greenstreets functioning as designed. Typical tasks include litter and leaf removal, weeding, and plant care.
In 2012, DEP completed designs for an onsite green infra-structure project at the New York City Housing Authority’s Seth Low Houses, which is also within Demonstration Area 2. The planned permeable pavement and subsurface deten-tion system in the Seth Low development will also manage stormwater and supplement the overall volume managed by the right-of-way green infrastructure.
DEP will continue to conduct community outreach in the 26th Ward Demonstration Area. Office of Green Infrastruc-ture staff has given multiple presentations to the Communi-ty Board, the City Council Member, and the East Brooklyn Business Improvement District. Over 1,500 postcards were sent to mailing addresses within the area to notify the com-munity about the construction. DEP will host a stewardship workshop with MillionTreesNYC and NYCHA this spring to educate and train the community in environmental steward-ship.
Case Study: 26th Ward
Right-of-way Bioswale construction, Junius St. and Liberty Ave., Brooklyn
Right-of-way Bioswale tree planting, Junius St and Glenmore Ave., Brooklyn

28 2012 Green Infrastructure Annual Report
2013 Action Plan
DEP will reinstate the Rain Barrel Giveaway Program and will make educational and informational materials available on the DEP website.
DEP will develop a Tracking and Asset Management System to track, manage, and maintain all of the Green Infrastructure Program’s decentralized system of green infrastructure assets.
DEP will continue a Research and Development Program to monitor the performance of built green in-frastructure projects, and employ the data to adapt existing green infrastructure designs and modeling for CSO tributary areas.
BioswaleCare, a stewardship program in partnership with MillionTreesNYC, will kick-off in March 2013 with workshops beginning shortly thereafter.
DEP continues to explore opportunities to partner with other City agencies related to Hurricane Sandy recovery initiatives. Currently, DEP and DOT are jointly assessing locations to build out green infrastructure in City streets affected by the storm.
1
3
4
5
6DEP will to work with DOB, DOF and Law to modify the Rules of the City of New York to extend and en-hance the Green Roof Tax Abatement. 7DEP will hire a Green Roof Technical Advisor to assist in the Green Roof Tax Abatement application process and educate prospective applicants.8DEP will hire additional staff in 2013 to support broader implementation of the Green Infrastructure Program.9DEP will continue to design and implement green infrastructure projects towards waterbody-specific application rates.10
DEP will create standard informational placards for the green infrastructure projects built in the right-of-way to educate and engage the public as well as to provide unique identification system for each site. This will provide multiple benefits as DEP builds its O&M Program.2
Building on the progress made in 2012, DEP will implement the following programs and activities in 2013, in addition to ongoing out-reach and program management for Area-wide Contracts, public retrofits, the Grant Program, and the designed projects in table 6.

2012 Green Infrastructure Annual Report 29
Area-wide Contracts for Priority CSO Tributary Areas
Construction
Design
Planned
OGIJan 2013
OGIFall 2013
OGIJan 2013
OGIJan 2013
EDCMay 2013
EDCApr 2013
DDCMay 2013
DDCMay 2013
DDCMay 2013
OGIJan 2013
BEDC/OGIJan 2013
DPRDec 2012
DPR
DPRApr 2013
DPRApr 2013
DPRApr 2013DPR
Apr 2013
OGI
OGI
RH-034
OH-007
NCB-015
26W-003
NCB-083
NCQ-077
JAM-003
BB-006
BB-006
BB-008BB-026
BB-009
TI-011
HP-008HP-009
HP-004HP-007
HP-024
HP-023
Jamaica Bay andCSO Tributaries
Bronx RiverHutchinson
River
GowanusCanal
FlushingCreek
FlushingBay
NewtownCreek
0 1 2 30.5 Miles °
Area-wide Contracts for Priority CSO Tributary Areas
Figure 11: 2013 Area-wide Contracts, implementing agencies, and start dates.

30 2012 Green Infrastructure Annual Report

2012 Green Infrastructure Annual Report 31
List of AcronymsBioswale Right-of-way BioswaleCFS Cubic Feet per SecondCSIA Combined Sewer Impervious AreaCSO Combined Sewer OverflowCWA Clean Water ActDCA New York City Department of Cultural AffairsDDC New York City Department of Design and ConstructionDEC New York State Department of Environmental ConservationDEP Department of Environmental ProtectionDOB New York City Department of BuildingsDOE New York City Department of EducationDOF New York City Department of FinanceDOT New York City Department of TransitDPR New York City Department of Parks and RecreationDSNY New York City Department of SanitationEAS Environmental Assessment StatementEBP Environmental Benefit ProjectEDC New York City Economic Development CorporationEPA U.S. Environmental Protection AgencyGIS Geographical Information SystemGreenstreets Stormwater GreenstreetsHHC New York City Health and Hospitals CorporationHLSS High Level Storm SewersHPD New York City Department of Housing Preservation and DevelopmentLTCP Long Term Control PlanNYCHA New York City Housing Authority O&M Operations and MaintenanceOGI Office of Green InfrastructureOLTPS Office of Long Term Planning and SustainabilityOMB Office of Management and BudgetOrder CSO Modified Consent OrderPriority Area Priority CSO Tributary AreaROW Right-of-WaySCA New York City School Construction AuthorityTask Force Green Infrastructure Task Force