NYC Green Infrastructure Plan - Welcome to NYC.gov | … New York City’s valuable water bodies....
49
NYC Green Infrastructure Plan: 2012 Green Infrastructure Pilot Monitoring Report Michael R. Bloomberg, Mayor Carter H. Strickland, Jr., Commissioner
Transcript of NYC Green Infrastructure Plan - Welcome to NYC.gov | … New York City’s valuable water bodies....
NYC Green Infrastructure Plan: 2012 Green Infrastructure Pilot Monitoring Report
Michael R. Bloomberg,
Mayor
Carter H. Strickland, Jr.,
Commissioner
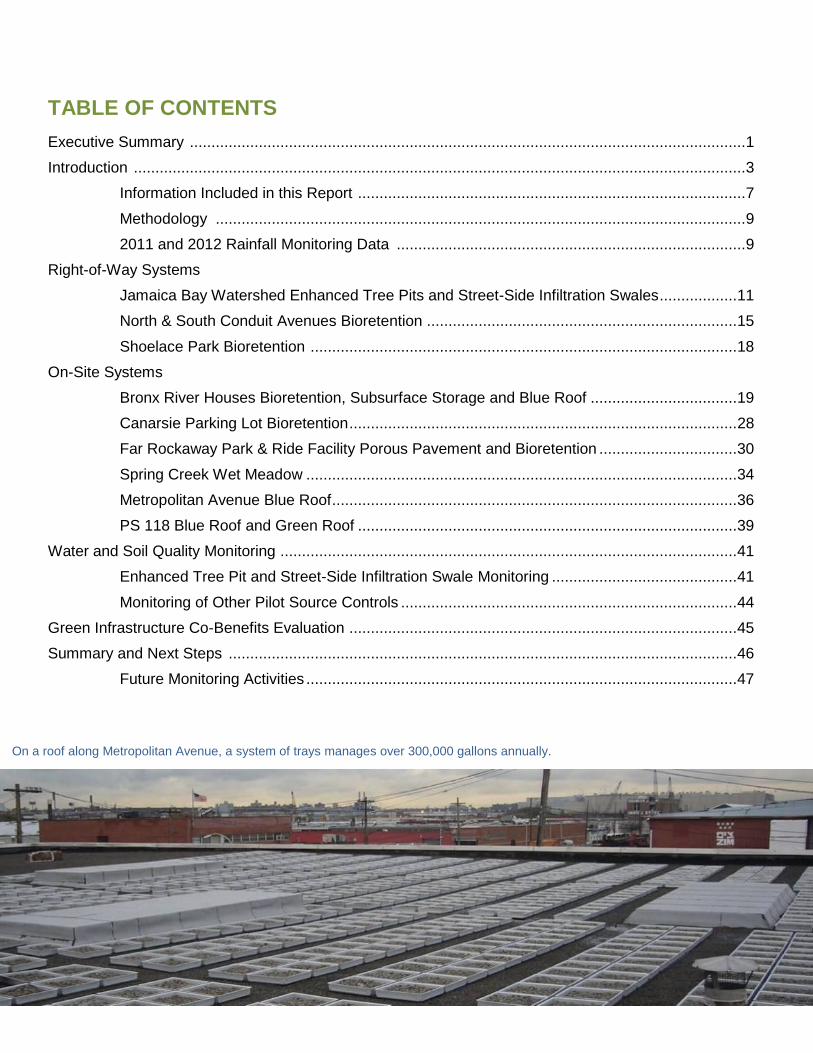
TABLE OF CONTENTS
Executive Summary ................................................................................................................................. 1
Introduction .............................................................................................................................................. 3
Information Included in this Report .......................................................................................... 7
Methodology ........................................................................................................................... 9
2011 and 2012 Rainfall Monitoring Data ................................................................................. 9
Right-of-Way Systems
Jamaica Bay Watershed Enhanced Tree Pits and Street-Side Infiltration Swales .................. 11
North & South Conduit Avenues Bioretention ........................................................................ 15
Shoelace Park Bioretention ................................................................................................... 18
On-Site Systems
Bronx River Houses Bioretention, Subsurface Storage and Blue Roof .................................. 19
Canarsie Parking Lot Bioretention .......................................................................................... 28
Far Rockaway Park & Ride Facility Porous Pavement and Bioretention ................................ 30
Spring Creek Wet Meadow .................................................................................................... 34
Metropolitan Avenue Blue Roof .............................................................................................. 36
PS 118 Blue Roof and Green Roof ........................................................................................ 39
Water and Soil Quality Monitoring .......................................................................................................... 41
Enhanced Tree Pit and Street-Side Infiltration Swale Monitoring ........................................... 41
Monitoring of Other Pilot Source Controls .............................................................................. 44
Green Infrastructure Co-Benefits Evaluation .......................................................................................... 45
Summary and Next Steps ...................................................................................................................... 46
Future Monitoring Activities .................................................................................................... 47
On a roof along Metropolitan Avenue, a system of trays manages over 300,000 gallons annually.
1
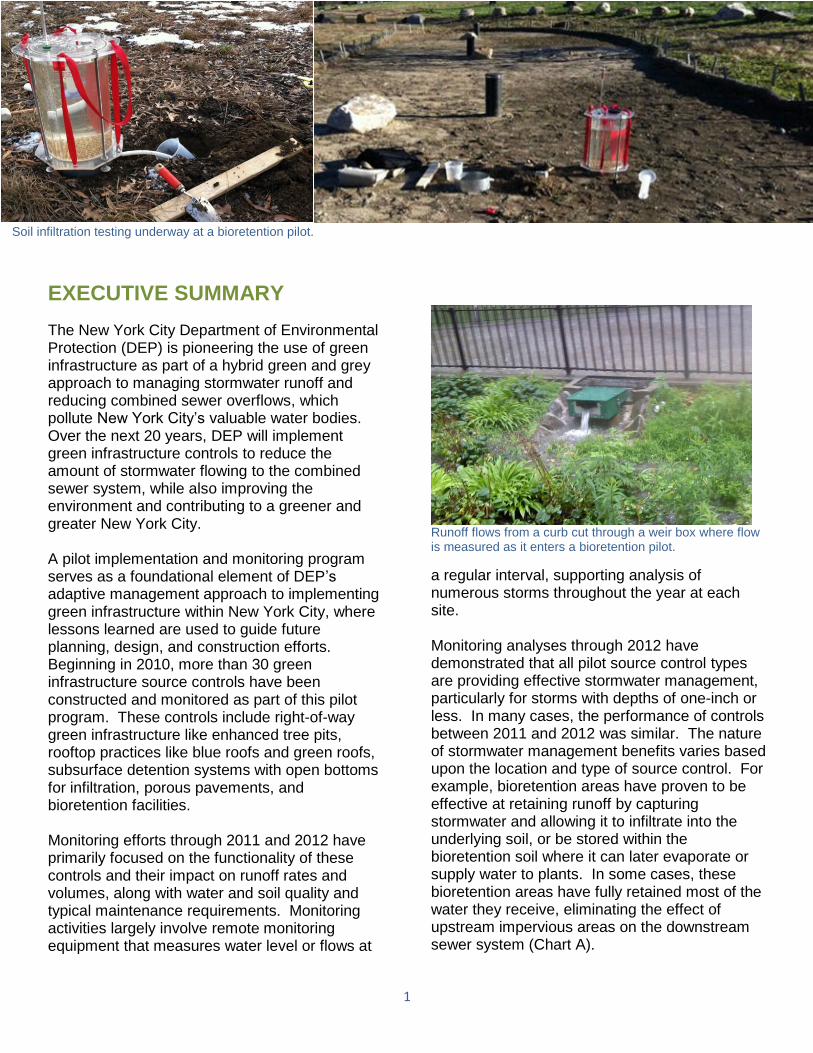
Soil infiltration testing underway at a bioretention pilot.
EXECUTIVE SUMMARY
The New York City Department of Environmental Protection (DEP) is pioneering the use of green infrastructure as part of a hybrid green and grey approach to managing stormwater runoff and reducing combined sewer overflows, which pollute New York City’s valuable water bodies. Over the next 20 years, DEP will implement green infrastructure controls to reduce the amount of stormwater flowing to the combined sewer system, while also improving the environment and contributing to a greener and greater New York City. A pilot implementation and monitoring program serves as a foundational element of DEP’s adaptive management approach to implementing green infrastructure within New York City, where lessons learned are used to guide future planning, design, and construction efforts. Beginning in 2010, more than 30 green infrastructure source controls have been constructed and monitored as part of this pilot program. These controls include right-of-way green infrastructure like enhanced tree pits, rooftop practices like blue roofs and green roofs, subsurface detention systems with open bottoms for infiltration, porous pavements, and bioretention facilities. Monitoring efforts through 2011 and 2012 have primarily focused on the functionality of these controls and their impact on runoff rates and volumes, along with water and soil quality and typical maintenance requirements. Monitoring activities largely involve remote monitoring equipment that measures water level or flows at
Runoff flows from a curb cut through a weir box where flow is measured as it enters a bioretention pilot.
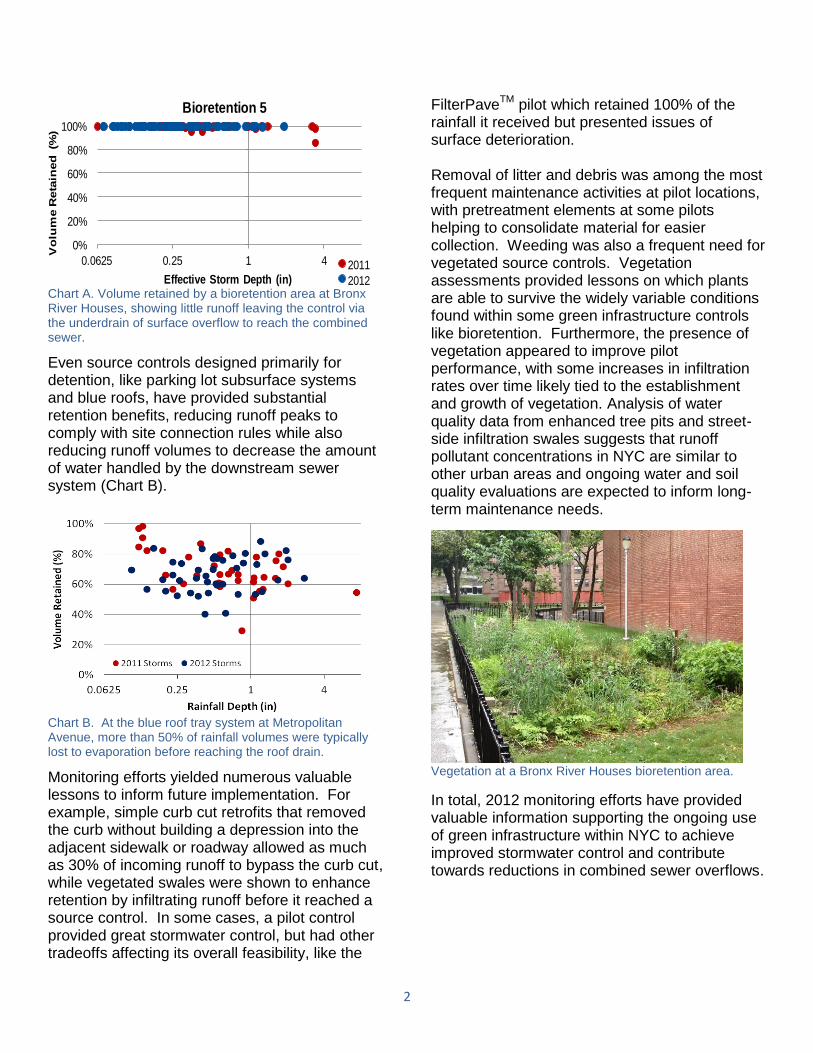
a regular interval, supporting analysis of numerous storms throughout the year at each site. Monitoring analyses through 2012 have demonstrated that all pilot source control types are providing effective stormwater management, particularly for storms with depths of one-inch or less. In many cases, the performance of controls between 2011 and 2012 was similar. The nature of stormwater management benefits varies based upon the location and type of source control. For example, bioretention areas have proven to be effective at retaining runoff by capturing stormwater and allowing it to infiltrate into the underlying soil, or be stored within the bioretention soil where it can later evaporate or supply water to plants. In some cases, these bioretention areas have fully retained most of the water they receive, eliminating the effect of upstream impervious areas on the downstream sewer system (Chart A).
2
Chart A. Volume retained by a bioretention area at Bronx River Houses, showing little runoff leaving the control via the underdrain of surface overflow to reach the combined sewer.
Even source controls designed primarily for detention, like parking lot subsurface systems and blue roofs, have provided substantial retention benefits, reducing runoff peaks to comply with site connection rules while also reducing runoff volumes to decrease the amount of water handled by the downstream sewer system (Chart B).
Chart B. At the blue roof tray system at Metropolitan Avenue, more than 50% of rainfall volumes were typically lost to evaporation before reaching the roof drain.
Monitoring efforts yielded numerous valuable lessons to inform future implementation. For example, simple curb cut retrofits that removed the curb without building a depression into the adjacent sidewalk or roadway allowed as much as 30% of incoming runoff to bypass the curb cut, while vegetated swales were shown to enhance retention by infiltrating runoff before it reached a source control. In some cases, a pilot control provided great stormwater control, but had other tradeoffs affecting its overall feasibility, like the
FilterPaveTM
pilot which retained 100% of the rainfall it received but presented issues of surface deterioration. Removal of litter and debris was among the most frequent maintenance activities at pilot locations, with pretreatment elements at some pilots helping to consolidate material for easier collection. Weeding was also a frequent need for vegetated source controls. Vegetation assessments provided lessons on which plants are able to survive the widely variable conditions found within some green infrastructure controls like bioretention. Furthermore, the presence of vegetation appeared to improve pilot performance, with some increases in infiltration rates over time likely tied to the establishment and growth of vegetation. Analysis of water quality data from enhanced tree pits and street-side infiltration swales suggests that runoff pollutant concentrations in NYC are similar to other urban areas and ongoing water and soil quality evaluations are expected to inform long-term maintenance needs.
Vegetation at a Bronx River Houses bioretention area.
In total, 2012 monitoring efforts have provided valuable information supporting the ongoing use of green infrastructure within NYC to achieve improved stormwater control and contribute towards reductions in combined sewer overflows.
0%
20%
40%
60%
80%
100%
0.0625 0.25 1 4
Vo
lum
e R
eta
ined
(%
)
Effective Storm Depth (in)
Bioretention 5
2011
2012

3
Vegetation growth at a bioretention facility at the Bronx River Houses Planted in late 2010.
INTRODUCTION
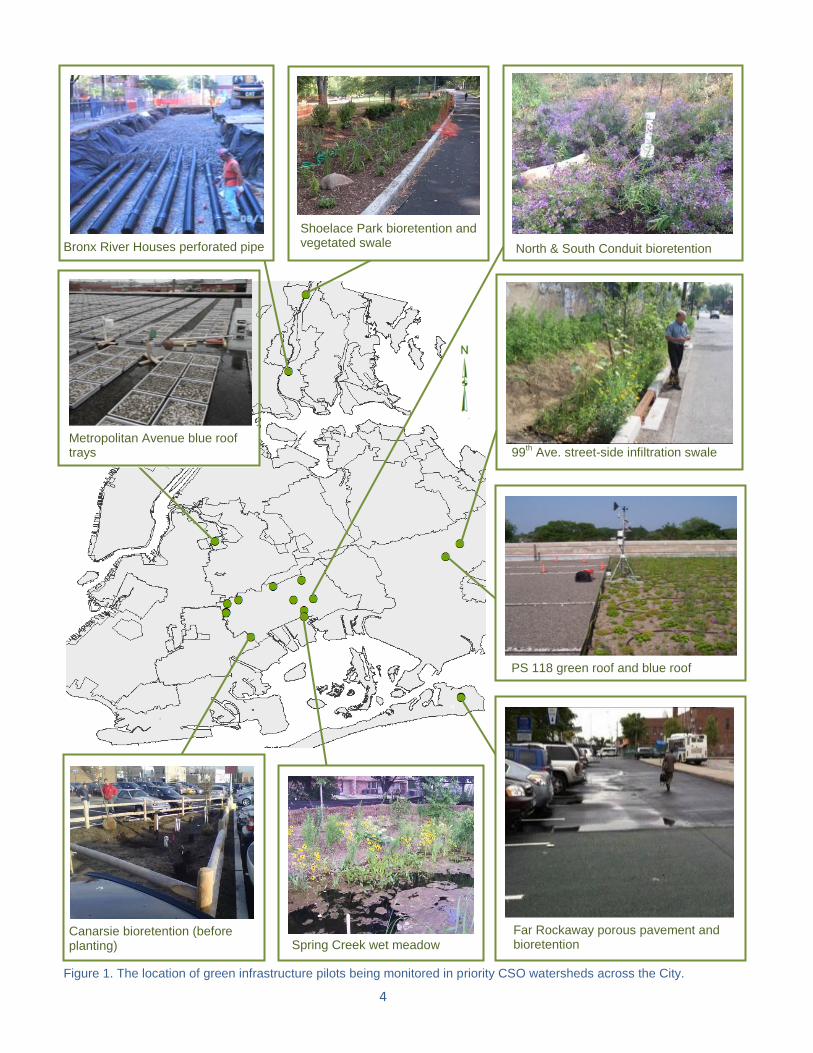
In 2012, the New York City Department of Environmental Protection (DEP) signed a groundbreaking agreement with the New York State Department of Environmental Conservation (DEC) to reduce combined sewer overflows (CSOs) using a hybrid green and grey infrastructure approach. Over the next 20 years, DEP is planning for $2.4 billion in public and private funding for targeted green infrastructure installations, as well as $2.9 billion in cost-effective grey infrastructure upgrades. More immediately, DEP expects to fulfill the interim milestones of the Consent Order and manage one-inch of runoff from 1.5% of impervious surfaces or commit more than $192 million by 2015, largely by working with other City agencies to build green infrastructure in the right-of-way. The agreement follows efforts that DEP began in 2010 with the Green Infrastructure Task Force to identify and install green infrastructure opportunities within priority tributary areas as part of the initiatives in the NYC Green Infrastructure Plan, A Sustainable Strategy for Clean Waterways (2010). Pilot source controls include blue roofs, bioswales, bioretention, porous pavement and subsurface detention infrastructure, among other types of structural facilities designed to manage stormwater runoff. DEP initiated construction of more than 30 pilots in November 2010 at 15 publicly-owned sites, including public housing, rights-of-way, parks and parking lots (Figure 1). Monitoring began at the majority of source control pilots in 2011, with some additional sites added in 2012.
The primary purpose of monitoring is to better understand the function and effectiveness of green infrastructure stormwater controls within NYC and guide future planning and implementation efforts. Specifically, stormwater pilot monitoring evaluates the effectiveness of each of the source controls (Table 1) at reducing the volume and/or rate of stormwater runoff (Table 2), as well as qualitative issues like maintenance requirements, appearance, and community perception. In addition to ongoing performance monitoring, DEP conducted soil infiltration tests, water quality, and soil quality sampling at some pilot source controls in 2012. DEP also conducted vegetation surveys to evaluate plant survival and health in some pilot bioretention facilities. Results from pilot monitoring efforts were first presented in the NYC Green Infrastructure Plan: 2011 Preliminary Pilot Monitoring Results (“2011 Monitoring Report”). Background information on the specific design and monitoring plans for these pilot source controls can also be found in the NYC Green Infrastructure Plan 2011 Update. The 2012 report builds upon the 2011 Monitoring Report, providing additional observations, analyses of pilot performance, and comparisons between 2011 and 2012 data for more than 30 source control pilots.
4
Figure 1. The location of green infrastructure pilots being monitored in priority CSO watersheds across the City.
Spring Creek wet meadow
Bronx River Houses perforated pipe North & South Conduit bioretention
99th Ave. street-side infiltration swale
PS 118 green roof and blue roof
Shoelace Park bioretention and vegetated swale
Metropolitan Avenue blue roof trays
Far Rockaway porous pavement and bioretention
Canarsie bioretention (before planting)
5
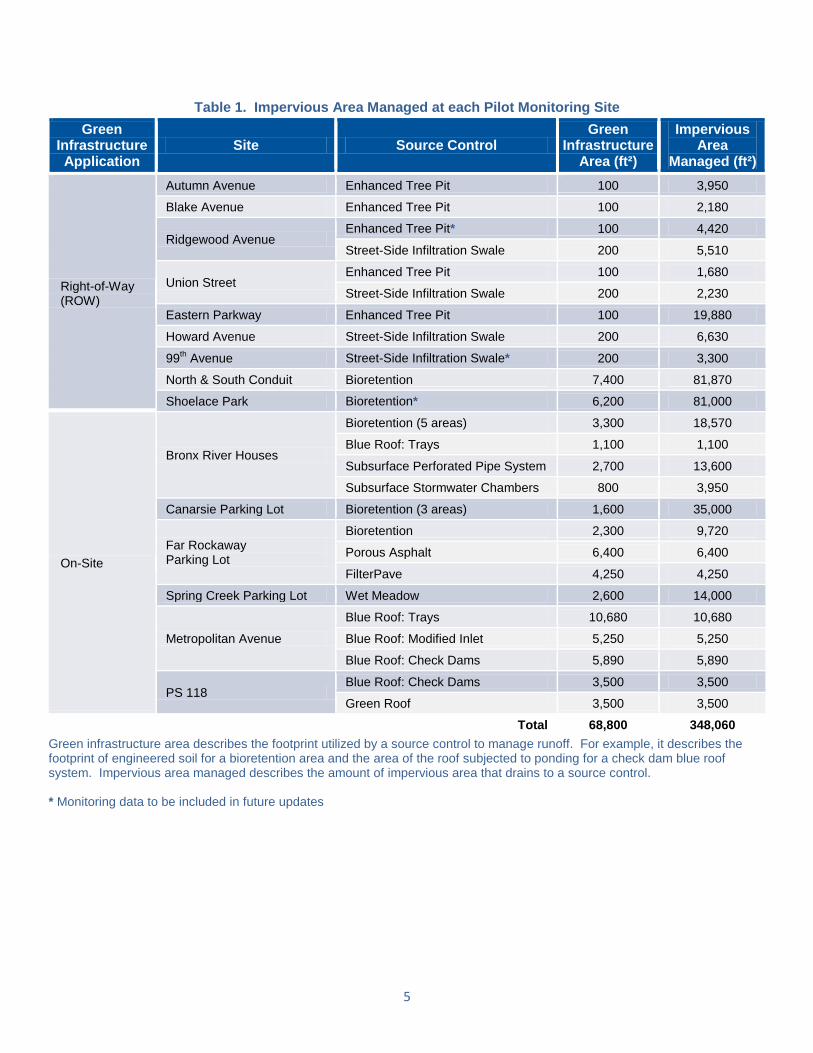
Table 1. Impervious Area Managed at each Pilot Monitoring Site
Green Infrastructure Application
Site Source Control Green
Infrastructure Area (ft²)
Impervious Area
Managed (ft²)
Right-of-Way (ROW)
Autumn Avenue Enhanced Tree Pit 100 3,950
Blake Avenue Enhanced Tree Pit 100 2,180
Ridgewood Avenue Enhanced Tree Pit* 100 4,420
Street-Side Infiltration Swale 200 5,510
Union Street Enhanced Tree Pit 100 1,680
Street-Side Infiltration Swale 200 2,230
Eastern Parkway Enhanced Tree Pit 100 19,880
Howard Avenue Street-Side Infiltration Swale 200 6,630
99th Avenue Street-Side Infiltration Swale* 200 3,300
North & South Conduit Bioretention 7,400 81,870
Shoelace Park Bioretention* 6,200 81,000
On-Site
Bronx River Houses
Bioretention (5 areas) 3,300 18,570
Blue Roof: Trays 1,100 1,100
Subsurface Perforated Pipe System 2,700 13,600
Subsurface Stormwater Chambers 800 3,950
Canarsie Parking Lot Bioretention (3 areas) 1,600 35,000
Far Rockaway Parking Lot
Bioretention 2,300 9,720
Porous Asphalt 6,400 6,400
FilterPave 4,250 4,250
Spring Creek Parking Lot Wet Meadow 2,600 14,000
Metropolitan Avenue
Blue Roof: Trays 10,680 10,680
Blue Roof: Modified Inlet 5,250 5,250
Blue Roof: Check Dams 5,890 5,890
PS 118 Blue Roof: Check Dams 3,500 3,500
Green Roof 3,500 3,500
Total 68,800 348,060
Green infrastructure area describes the footprint utilized by a source control to manage runoff. For example, it describes the footprint of engineered soil for a bioretention area and the area of the roof subjected to ponding for a check dam blue roof system. Impervious area managed describes the amount of impervious area that drains to a source control. * Monitoring data to be included in future updates
6
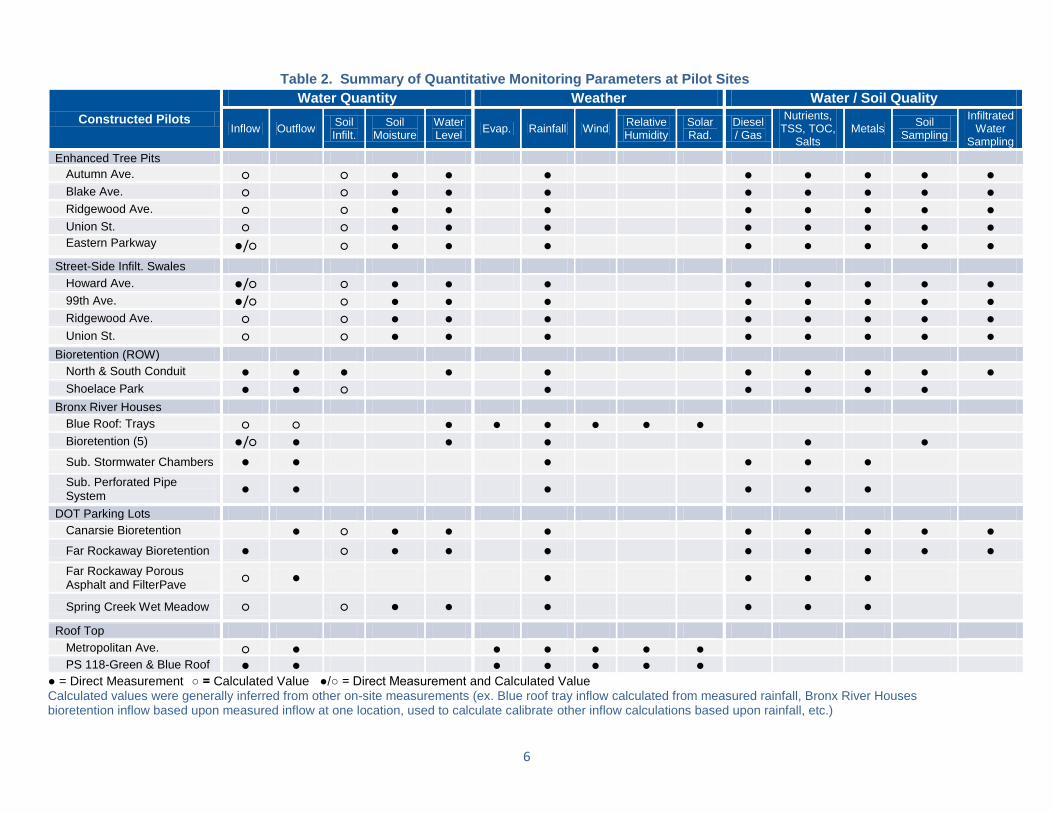
Table 2. Summary of Quantitative Monitoring Parameters at Pilot Sites
Constructed Pilots
Water Quantity Weather
Water / Soil Quality
Inflow Outflow Soil Infilt.
Soil Moisture
Water Level
Evap. Rainfall Wind Relative Humidity
Solar Rad.
Diesel/ Gas
Nutrients, TSS, TOC,
Salts Metals
Soil Sampling
Infiltrated Water
Sampling
Enhanced Tree Pits Autumn Ave. ○ ○ ● ● ● ● ● ● ● ● Blake Ave. ○
○ ● ● ● ● ● ● ● ●
Ridgewood Ave. ○
○ ● ● ● ● ● ● ● ● Union St. ○
○ ● ● ●
● ● ● ● ●
Eastern Parkway ●/○
○ ● ● ● ● ● ● ● ●
Street-Side Infilt. Swales Howard Ave. ●/○
○ ● ● ● ● ● ● ● ●
99th Ave. ●/○ ○ ● ● ● ● ● ● ● ● Ridgewood Ave. ○
○ ● ● ● ● ● ● ● ●
Union St. ○
○ ● ● ● ● ● ● ● ● Bioretention (ROW)
North & South Conduit ● ● ● ●
●
● ● ● ● ● Shoelace Park ● ● ○
●
● ● ● ●
Bronx River Houses Blue Roof: Trays ○ ○ ● ● ● ● ● ● Bioretention (5) ●/○ ● ● ● ● ●
Sub. Stormwater Chambers ● ● ● ● ● ●
Sub. Perforated Pipe System
● ● ● ● ● ●
DOT Parking Lots Canarsie Bioretention
● ○ ● ●
●
● ● ● ● ●
Far Rockaway Bioretention ●
○ ● ●
●
● ● ● ● ●
Far Rockaway Porous Asphalt and FilterPave
○ ● ● ● ● ●
Spring Creek Wet Meadow ○
○ ● ● ● ● ● ●
Roof Top
Metropolitan Ave. ○ ● ● ● ● ● ● PS 118-Green & Blue Roof ● ● ● ● ● ● ●
● = Direct Measurement ○ = Calculated Value ●/○ = Direct Measurement and Calculated Value Calculated values were generally inferred from other on-site measurements (ex. Blue roof tray inflow calculated from measured rainfall, Bronx River Houses bioretention inflow based upon measured inflow at one location, used to calculate calibrate other inflow calculations based upon rainfall, etc.)

7
Information Included in this Report
This report builds upon prior 2011 analyses to present a summary of stormwater monitoring results from 2011 and 2012 for more than 30 individual source control pilots distributed across 15 sites. The information is organized by source control type in the following order:
Jamaica Bay Watershed Enhanced Tree Pits and Street-Side Infiltration Swales
North & South Conduit Avenues Bioretention
Shoelace Park Bioretention
Bronx River Houses Bioretention, Subsurface Storage and Blue Roof
Canarsie Parking Lot Bioretention
Far Rockaway Park & Ride Facility Porous Pavement and Bioretention
Spring Creek Wet Meadow
Metropolitan Avenue Blue Roof
PS 118 Blue Roof and Green Roof Each of these summaries is divided into three sections: Pilot Overview, Monitoring Results, and Summary. Pilot Overview The Overview describes the pilot site and basic monitoring design and equipment. A figure illustrating site layout is generaly included for reference. A table of site metrics and storm characteristics from 2011 and 2012 is also provided, including: Impervious Area Managed—the square footage of roads, rooftop, and other impervious surfaces draining to each source control. Drainage Area: Green Infrastructure Area—the ratio between the impervious area managed and the source control’s surface area. # of Storms—the number of individual storm events, separated by 12 hours with no rainfall, with a depth greater than 0.1-inches included in the analysis for this report.
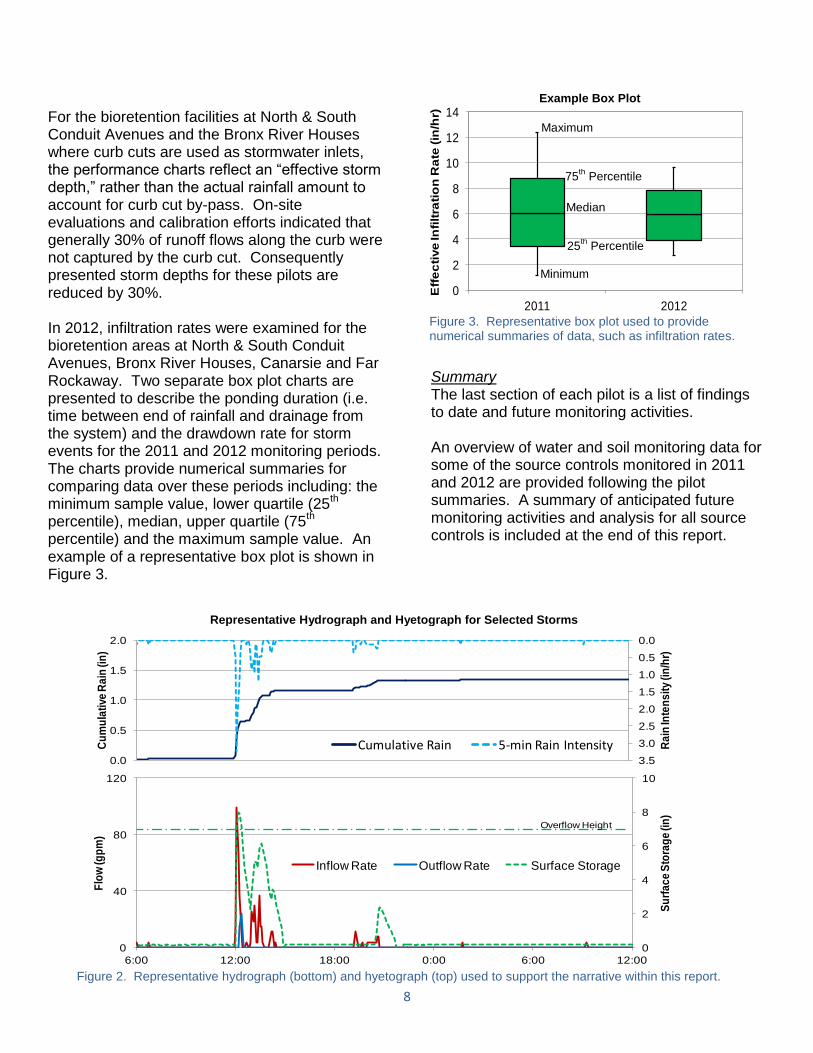
Storm Depth—the total amount of rain during an event measured in inches; presented here as a range. Peak Intensity—the highest rate of rainfall as measured over a five minute interval (in/hr) during an event; presented here as a range. Storm Duration—total time from the beginning to the end of a rain event; presented here as a range. Monitoring Results The Monitoring Results section presents the performance observations for each pilot analyzed during 2011 and 2012 for comparative purposes. A brief narrative is supported by a representative hydrograph and one or more performance charts. An example of a representative hydrograph with a corresponding hyetograph is shown in Figure 2. The bottom graph generally shows source control inflow and outflow (gallons per minute) for a single storm event. Outflow is a direct measure of flow in the outlet pipe, which excludes losses via other mechanisms (e.g., infiltration, evapotranspiration). Water level is shown, in some cases, as an indication of runoff storage within the source control and of overall system performance. The corresponding cumulative rainfall depth and intensity of that event is shown in the top graph (cumulative rainfall along the bottom and intensity along the top).
The performance charts show the percent volume retained and, in some cases, peak flow reduction by each source control for all storm events, including those greater than one-inch. Each dot represents a single storm event. Volume retention is defined as the portion of inflow into the source control practice that is not discharged to the sewer system, which may be lost through infiltration into underlying soils or storage and evapotranspiration between storms. These graphics are shown on a log scale. Peak flow reduction is the difference between the highest measured inflow and outflow rates, expressed as a percentage.
8
0.0
0.5
1.0
1.5
2.0
2.5
3.0
3.50.0
0.5
1.0
1.5
2.0
Ra
in In
ten
sit
y (i
n/h
r)
Cu
mu
lati
ve R
ain
(in
)
0
2
4
6
8
10
0
40
80
120
6:00 12:00 18:00 0:00 6:00 12:00
Su
rfa
ce
Sto
rag
e (i
n)
Flo
w (g
pm
)
Inflow Rate Outflow Rate Surface Storage
Overflow Height
Figure 2. Representative hydrograph (bottom) and hyetograph (top) used to support the narrative within this report.
Figure 3. Representative box plot used to provide numerical summaries of data, such as infiltration rates.
0
2
4
6
8
10
12
14
2011 2012
Eff
ec
tive
In
filt
rati
on
Ra
te (in
/hr)
Bioretention 3
For the bioretention facilities at North & South Conduit Avenues and the Bronx River Houses where curb cuts are used as stormwater inlets, the performance charts reflect an “effective storm depth,” rather than the actual rainfall amount to account for curb cut by-pass. On-site evaluations and calibration efforts indicated that generally 30% of runoff flows along the curb were not captured by the curb cut. Consequently presented storm depths for these pilots are reduced by 30%. In 2012, infiltration rates were examined for the bioretention areas at North & South Conduit Avenues, Bronx River Houses, Canarsie and Far Rockaway. Two separate box plot charts are presented to describe the ponding duration (i.e. time between end of rainfall and drainage from the system) and the drawdown rate for storm events for the 2011 and 2012 monitoring periods. The charts provide numerical summaries for comparing data over these periods including: the minimum sample value, lower quartile (25
th
percentile), median, upper quartile (75th
percentile) and the maximum sample value. An example of a representative box plot is shown in Figure 3.
Summary The last section of each pilot is a list of findings to date and future monitoring activities. An overview of water and soil monitoring data for some of the source controls monitored in 2011 and 2012 are provided following the pilot summaries. A summary of anticipated future monitoring activities and analysis for all source controls is included at the end of this report.
Example Box Plot
Representative Hydrograph and Hyetograph for Selected Storms
Maximum
75th
Percentile
Median
25th
Percentile
Minimum
0.0
0.5
1.0
1.5
2.00.0
0.5
1.0
1.5
2.0
1:00 PM 3:00 PM 5:00 PM 7:00 PM
Rai
n In
ten
sity
(in
/hr)
Cu
mu
lati
ve R
ain
(in
)
Cumulative Rain 5-min Rain Intensity
0
2
4
6
8
10
0
40
80
120
6:00 AM 12:00 PM 6:00 PM 12:00 AM 6:00 AM 12:00 PM
Su
rfa
ce
Sto
rag
e (i
n)
Flo
w (g
pm
)
Inflow Rate Outflow Rate Surface Storage
9
Methodology
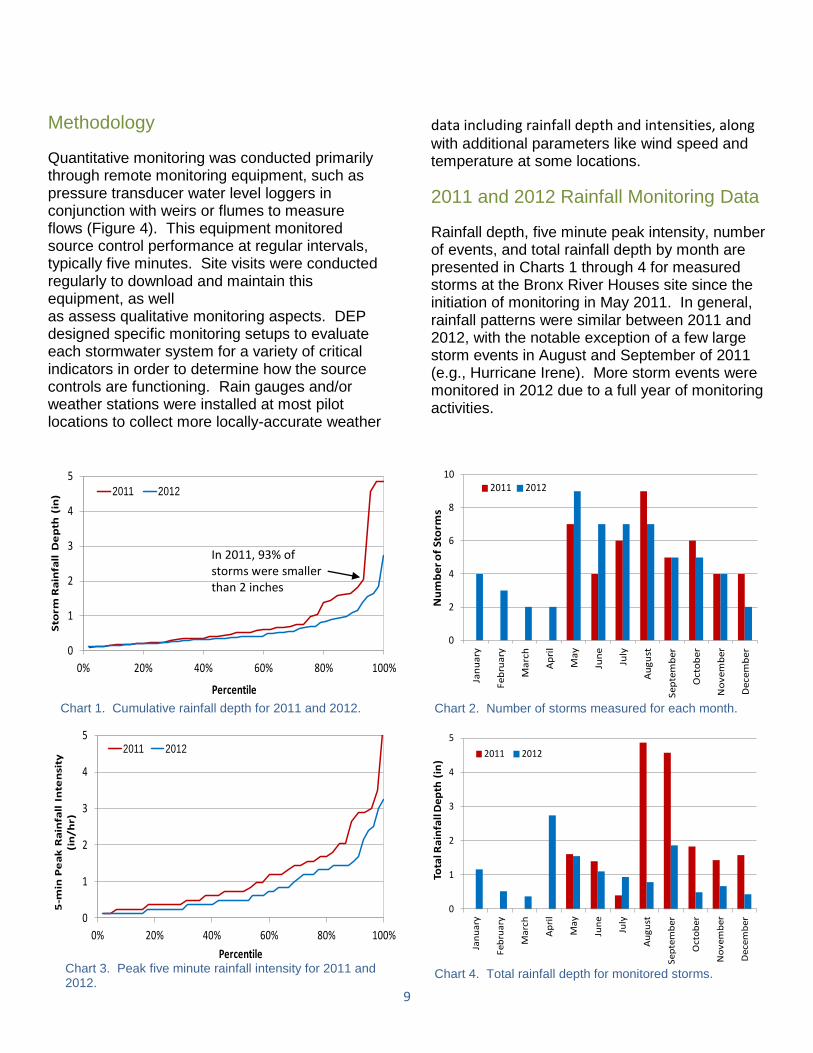
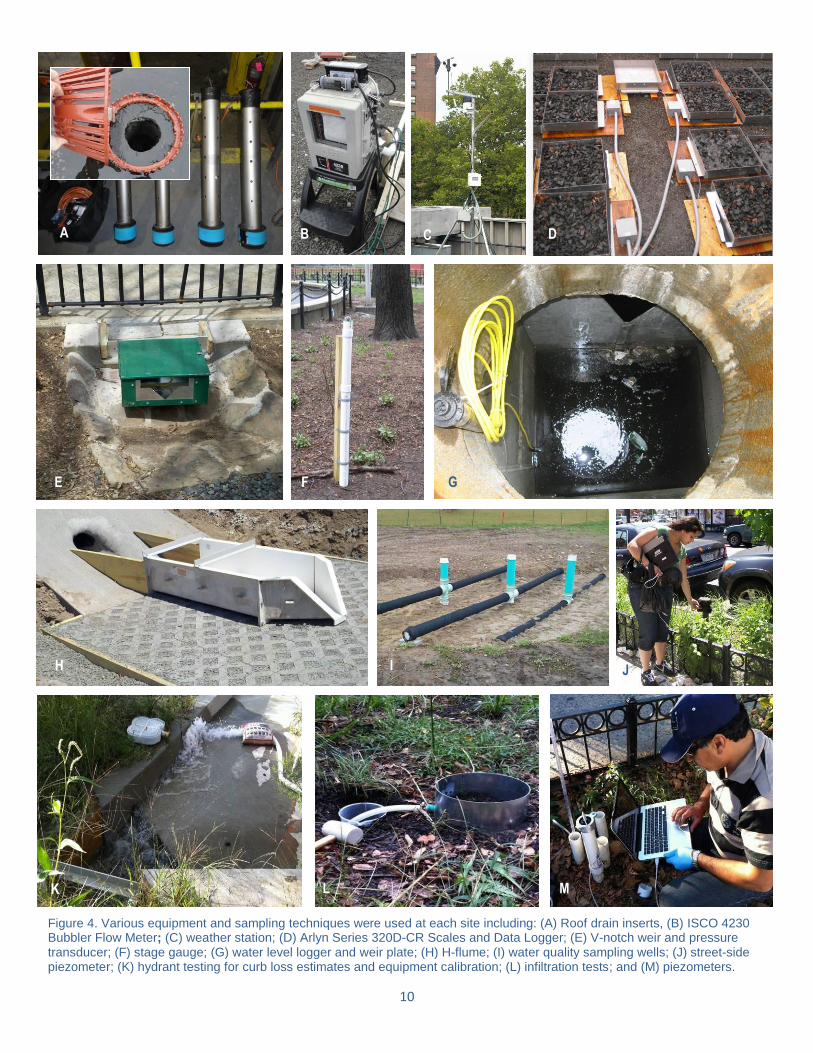
Quantitative monitoring was conducted primarily through remote monitoring equipment, such as pressure transducer water level loggers in conjunction with weirs or flumes to measure flows (Figure 4). This equipment monitored source control performance at regular intervals, typically five minutes. Site visits were conducted regularly to download and maintain this equipment, as well as assess qualitative monitoring aspects. DEP designed specific monitoring setups to evaluate each stormwater system for a variety of critical indicators in order to determine how the source controls are functioning. Rain gauges and/or weather stations were installed at most pilot locations to collect more locally-accurate weather
data including rainfall depth and intensities, along with additional parameters like wind speed and temperature at some locations.
2011 and 2012 Rainfall Monitoring Data
Rainfall depth, five minute peak intensity, number of events, and total rainfall depth by month are presented in Charts 1 through 4 for measured storms at the Bronx River Houses site since the initiation of monitoring in May 2011. In general, rainfall patterns were similar between 2011 and 2012, with the notable exception of a few large storm events in August and September of 2011 (e.g., Hurricane Irene). More storm events were monitored in 2012 due to a full year of monitoring activities.
0
1
2
3
4
5
0% 20% 40% 60% 80% 100%
Sto
rm R
ain
fall
De
pth
(in
)
Percentile
2011 2012
Chart 1. Cumulative rainfall depth for 2011 and 2012.
0
2
4
6
8
10Ja
nu
ary
Fe
bru
ary
Ma
rch
Ap
ril
Ma
y
Jun
e
July
Au
gu
st
Se
pte
mb
er
Oct
ob
er
No
ve
mb
er
De
cem
be
r
Nu
mb
er
of
Sto
rms
2011 2012
Chart 2. Number of storms measured for each month.
0
1
2
3
4
5
0% 20% 40% 60% 80% 100%
5-m
in P
ea
k R
ain
fall
In
ten
sity
(i
n/h
r)
Percentile
2011 2012
Chart 3. Peak five minute rainfall intensity for 2011 and 2012.
0
1
2
3
4
5
Jan
ua
ry
Fe
bru
ary
Ma
rch
Ap
ril
Ma
y
Jun
e
July
Au
gu
st
Se
pte
mb
er
Oct
ob
er
No
ve
mb
er
De
cem
be
r
Tota
l Ra
infa
ll D
ep
th (
in)
2011 2012
Chart 4. Total rainfall depth for monitored storms.
In 2011, 93% of storms were smaller than 2 inches
10
Figure 4. Various equipment and sampling techniques were used at each site including: (A) Roof drain inserts, (B) ISCO 4230 Bubbler Flow Meter; (C) weather station; (D) Arlyn Series 320D-CR Scales and Data Logger; (E) V-notch weir and pressure transducer; (F) stage gauge; (G) water level logger and weir plate; (H) H-flume; (I) water quality sampling wells; (J) street-side piezometer; (K) hydrant testing for curb loss estimates and equipment calibration; (L) infiltration tests; and (M) piezometers.
H I J
K L
G F E
A B C D
M
11
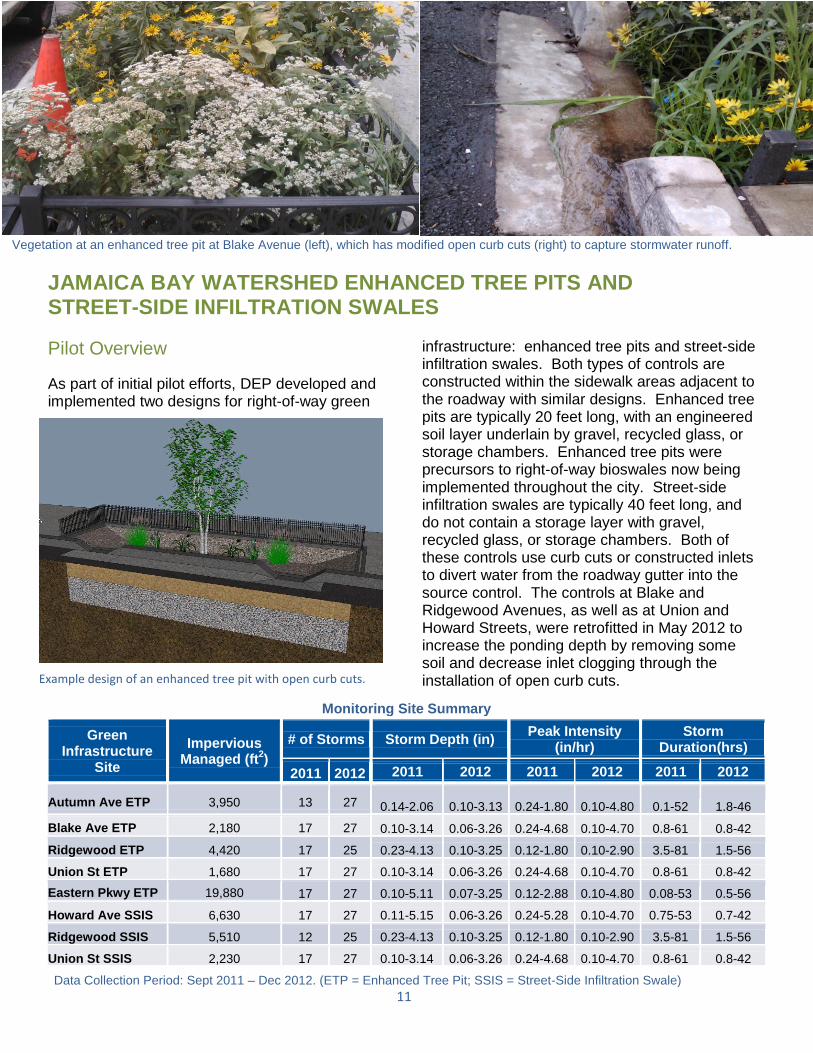
Vegetation at an enhanced tree pit at Blake Avenue (left), which has modified open curb cuts (right) to capture stormwater runoff.
JAMAICA BAY WATERSHED ENHANCED TREE PITS AND STREET-SIDE INFILTRATION SWALES
Pilot Overview
As part of initial pilot efforts, DEP developed and implemented two designs for right-of-way green
infrastructure: enhanced tree pits and street-side infiltration swales. Both types of controls are constructed within the sidewalk areas adjacent to the roadway with similar designs. Enhanced tree pits are typically 20 feet long, with an engineered soil layer underlain by gravel, recycled glass, or storage chambers. Enhanced tree pits were precursors to right-of-way bioswales now being implemented throughout the city. Street-side infiltration swales are typically 40 feet long, and do not contain a storage layer with gravel, recycled glass, or storage chambers. Both of these controls use curb cuts or constructed inlets to divert water from the roadway gutter into the source control. The controls at Blake and Ridgewood Avenues, as well as at Union and Howard Streets, were retrofitted in May 2012 to increase the ponding depth by removing some soil and decrease inlet clogging through the installation of open curb cuts.
Monitoring Site Summary
Green Infrastructure
Site
Impervious Managed (ft
2)
# of Storms Storm Depth (in) Peak Intensity
(in/hr) Storm
Duration(hrs)
2011 2012 2011 2012 2011 2012 2011 2012
Autumn Ave ETP 3,950 13 27 0.14-2.06 0.10-3.13 0.24-1.80 0.10-4.80 0.1-52 1.8-46
Blake Ave ETP 2,180 17 27 0.10-3.14 0.06-3.26 0.24-4.68 0.10-4.70 0.8-61 0.8-42
Ridgewood ETP 4,420 17 25 0.23-4.13 0.10-3.25 0.12-1.80 0.10-2.90 3.5-81 1.5-56
Union St ETP 1,680 17 27 0.10-3.14 0.06-3.26 0.24-4.68 0.10-4.70 0.8-61 0.8-42
Eastern Pkwy ETP 19,880 17 27 0.10-5.11 0.07-3.25 0.12-2.88 0.10-4.80 0.08-53 0.5-56
Howard Ave SSIS 6,630 17 27 0.11-5.15 0.06-3.26 0.24-5.28 0.10-4.70 0.75-53 0.7-42
Ridgewood SSIS 5,510 12 25 0.23-4.13 0.10-3.25 0.12-1.80 0.10-2.90 3.5-81 1.5-56
Union St SSIS 2,230 17 27 0.10-3.14 0.06-3.26 0.24-4.68 0.10-4.70 0.8-61 0.8-42
Data Collection Period: Sept 2011 – Dec 2012. (ETP = Enhanced Tree Pit; SSIS = Street-Side Infiltration Swale)
Example design of an enhanced tree pit with open curb cuts.
12
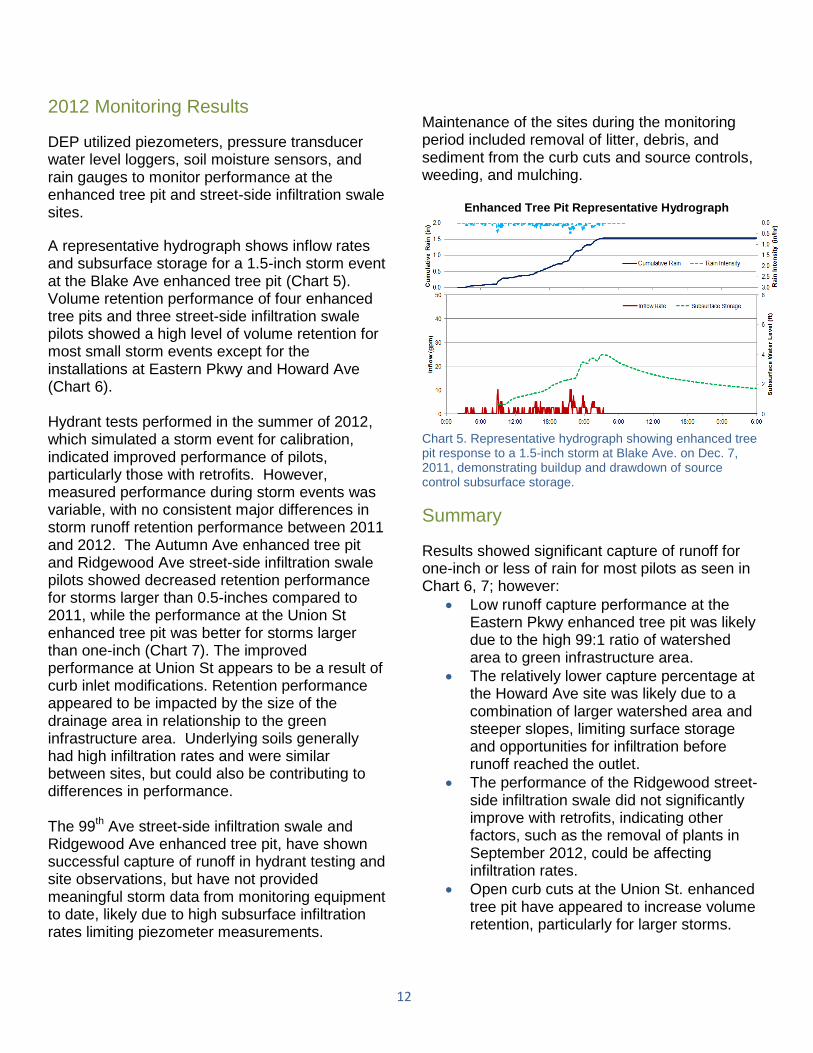
2012 Monitoring Results
DEP utilized piezometers, pressure transducer water level loggers, soil moisture sensors, and rain gauges to monitor performance at the enhanced tree pit and street-side infiltration swale sites.
A representative hydrograph shows inflow rates and subsurface storage for a 1.5-inch storm event at the Blake Ave enhanced tree pit (Chart 5). Volume retention performance of four enhanced tree pits and three street-side infiltration swale pilots showed a high level of volume retention for most small storm events except for the installations at Eastern Pkwy and Howard Ave (Chart 6). Hydrant tests performed in the summer of 2012, which simulated a storm event for calibration, indicated improved performance of pilots, particularly those with retrofits. However, measured performance during storm events was variable, with no consistent major differences in storm runoff retention performance between 2011 and 2012. The Autumn Ave enhanced tree pit and Ridgewood Ave street-side infiltration swale pilots showed decreased retention performance for storms larger than 0.5-inches compared to 2011, while the performance at the Union St enhanced tree pit was better for storms larger than one-inch (Chart 7). The improved performance at Union St appears to be a result of curb inlet modifications. Retention performance appeared to be impacted by the size of the drainage area in relationship to the green infrastructure area. Underlying soils generally had high infiltration rates and were similar between sites, but could also be contributing to differences in performance. The 99
th Ave street-side infiltration swale and
Ridgewood Ave enhanced tree pit, have shown successful capture of runoff in hydrant testing and site observations, but have not provided meaningful storm data from monitoring equipment to date, likely due to high subsurface infiltration rates limiting piezometer measurements.
Maintenance of the sites during the monitoring period included removal of litter, debris, and sediment from the curb cuts and source controls, weeding, and mulching.
Chart 5. Representative hydrograph showing enhanced tree pit response to a 1.5-inch storm at Blake Ave. on Dec. 7, 2011, demonstrating buildup and drawdown of source control subsurface storage.
Summary
Results showed significant capture of runoff for one-inch or less of rain for most pilots as seen in Chart 6, 7; however:
Low runoff capture performance at the Eastern Pkwy enhanced tree pit was likely due to the high 99:1 ratio of watershed area to green infrastructure area.
The relatively lower capture percentage at the Howard Ave site was likely due to a combination of larger watershed area and steeper slopes, limiting surface storage and opportunities for infiltration before runoff reached the outlet.
The performance of the Ridgewood street-side infiltration swale did not significantly improve with retrofits, indicating other factors, such as the removal of plants in September 2012, could be affecting infiltration rates.
Open curb cuts at the Union St. enhanced tree pit have appeared to increase volume retention, particularly for larger storms.
Enhanced Tree Pit Representative Hydrograph
13
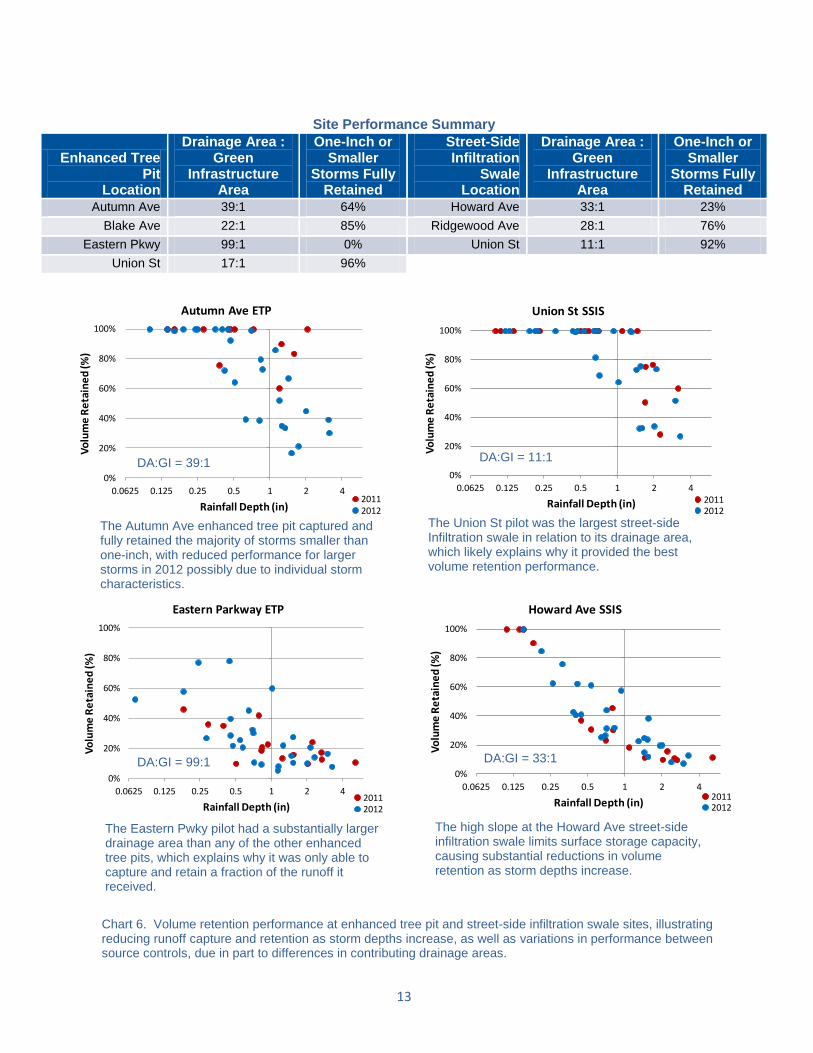
Site Performance Summary
Enhanced Tree Pit
Location
Drainage Area : Green
Infrastructure Area
One-Inch or Smaller
Storms Fully Retained
Street-Side Infiltration
Swale Location
Drainage Area : Green
Infrastructure Area
One-Inch or Smaller
Storms Fully Retained
Autumn Ave 39:1 64% Howard Ave 33:1 23%
Blake Ave 22:1 85% Ridgewood Ave 28:1 76%
Eastern Pkwy 99:1 0% Union St 11:1 92%
Union St 17:1 96%
0%
20%
40%
60%
80%
100%
0.0625 0.125 0.25 0.5 1 2 4
Vo
lum
e R
eta
ine
d (%
)
Rainfall Depth (in)
Autumn Ave ETP
20112012
0%
20%
40%
60%
80%
100%
0.0625 0.125 0.25 0.5 1 2 4
Vo
lum
e R
eta
ine
d (%
)
Rainfall Depth (in)
Eastern Parkway ETP
20112012
Chart 6. Volume retention performance at enhanced tree pit and street-side infiltration swale sites, illustrating reducing runoff capture and retention as storm depths increase, as well as variations in performance between source controls, due in part to differences in contributing drainage areas.
0%
20%
40%
60%
80%
100%
0.0625 0.125 0.25 0.5 1 2 4
Vo
lum
e R
eta
ine
d (%
)
Rainfall Depth (in)
Union St SSIS
20112012
0%
20%
40%
60%
80%
100%
0.0625 0.125 0.25 0.5 1 2 4
Vo
lum
e R
eta
ine
d (%
)
Rainfall Depth (in)
Howard Ave SSIS
20112012
The Autumn Ave enhanced tree pit captured and fully retained the majority of storms smaller than one-inch, with reduced performance for larger storms in 2012 possibly due to individual storm characteristics.
DA:GI = 39:1
The Union St pilot was the largest street-side Infiltration swale in relation to its drainage area, which likely explains why it provided the best volume retention performance.
DA:GI = 11:1
The Eastern Pwky pilot had a substantially larger drainage area than any of the other enhanced tree pits, which explains why it was only able to capture and retain a fraction of the runoff it received.
The high slope at the Howard Ave street-side infiltration swale limits surface storage capacity, causing substantial reductions in volume retention as storm depths increase.
DA:GI = 99:1 DA:GI = 33:1
14
0%
20%
40%
60%
80%
100%
0.0625 0.125 0.25 0.5 1 2 4
Vo
lum
e R
eta
ine
d (%
)
Rainfall Depth (in)
Union St ETP
20112012
0%
20%
40%
60%
80%
100%
0.0625 0.125 0.25 0.5 1 2 4
Vo
lum
e R
eta
ine
d (%
)
Rainfall Depth (in)
42 Ridgewood SSIS
2011
2012
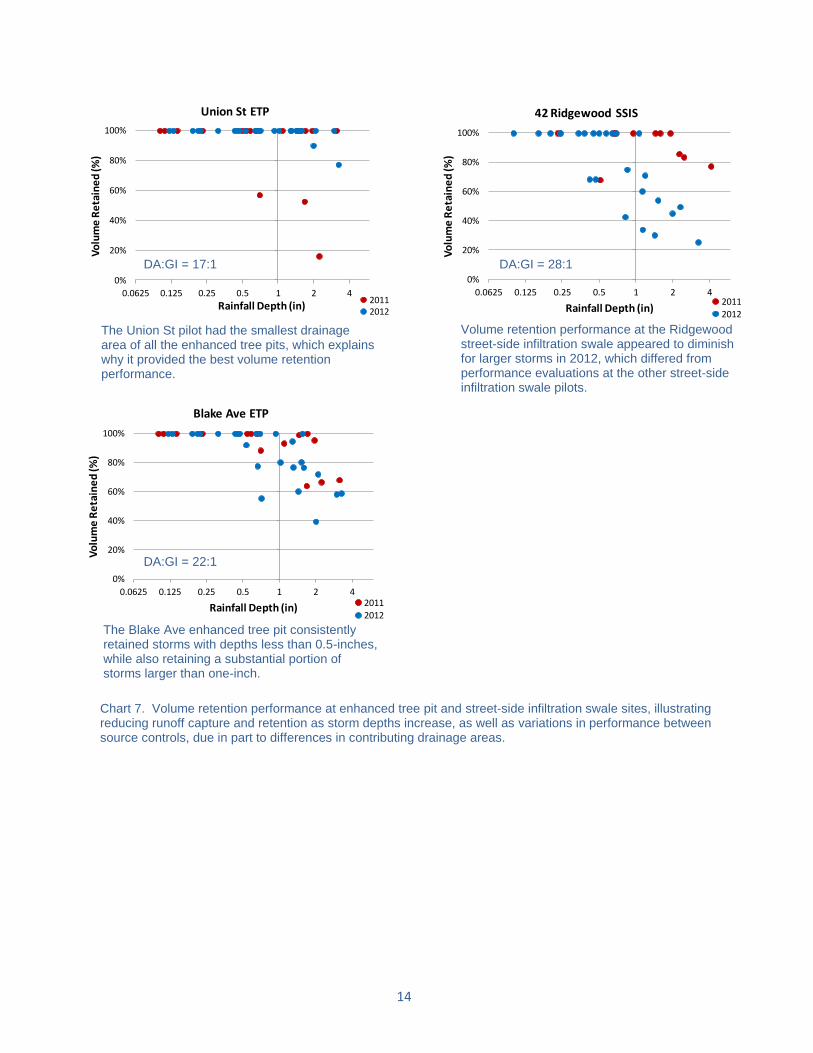
Chart 7. Volume retention performance at enhanced tree pit and street-side infiltration swale sites, illustrating reducing runoff capture and retention as storm depths increase, as well as variations in performance between source controls, due in part to differences in contributing drainage areas.
0%
20%
40%
60%
80%
100%
0.0625 0.125 0.25 0.5 1 2 4
Vo
lum
e R
eta
ine
d (%
)
Rainfall Depth (in)
Blake Ave ETP
2011
2012
The Union St pilot had the smallest drainage area of all the enhanced tree pits, which explains why it provided the best volume retention performance.
DA:GI = 17:1 DA:GI = 28:1
DA:GI = 22:1
Volume retention performance at the Ridgewood street-side infiltration swale appeared to diminish for larger storms in 2012, which differed from performance evaluations at the other street-side infiltration swale pilots.
The Blake Ave enhanced tree pit consistently retained storms with depths less than 0.5-inches, while also retaining a substantial portion of storms larger than one-inch.
15
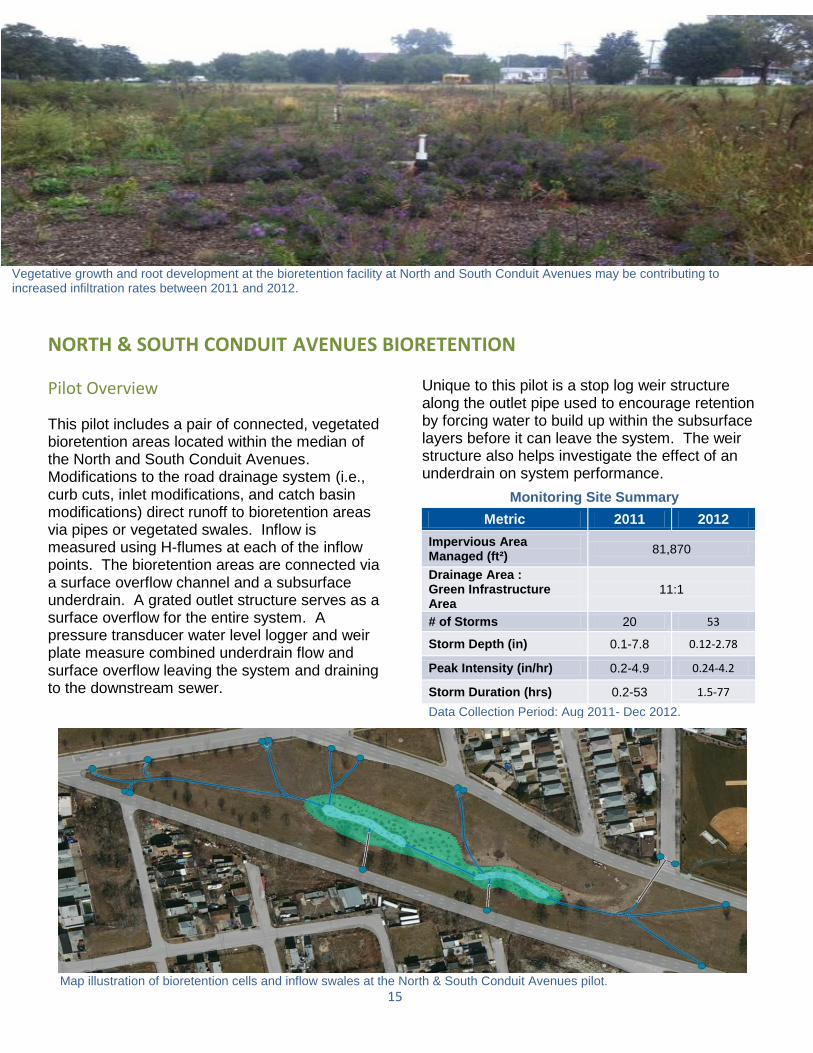
Vegetative growth and root development at the bioretention facility at North and South Conduit Avenues may be contributing to increased infiltration rates between 2011 and 2012.
NORTH & SOUTH CONDUIT AVENUES BIORETENTION
Pilot Overview
This pilot includes a pair of connected, vegetated bioretention areas located within the median of the North and South Conduit Avenues. Modifications to the road drainage system (i.e., curb cuts, inlet modifications, and catch basin modifications) direct runoff to bioretention areas via pipes or vegetated swales. Inflow is measured using H-flumes at each of the inflow points. The bioretention areas are connected via a surface overflow channel and a subsurface underdrain. A grated outlet structure serves as a surface overflow for the entire system. A pressure transducer water level logger and weir plate measure combined underdrain flow and surface overflow leaving the system and draining to the downstream sewer.
Unique to this pilot is a stop log weir structure along the outlet pipe used to encourage retention by forcing water to build up within the subsurface layers before it can leave the system. The weir structure also helps investigate the effect of an underdrain on system performance.
Monitoring Site Summary
Metric 2011 2012
Impervious Area Managed (ft²)
81,870
Drainage Area : Green Infrastructure Area
11:1
# of Storms 20 53
Storm Depth (in) 0.1-7.8 0.12-2.78
Peak Intensity (in/hr) 0.2-4.9 0.24-4.2
Storm Duration (hrs) 0.2-53 1.5-77
Data Collection Period: Aug 2011- Dec 2012.
Map illustration of bioretention cells and inflow swales at the North & South Conduit Avenues pilot.
16
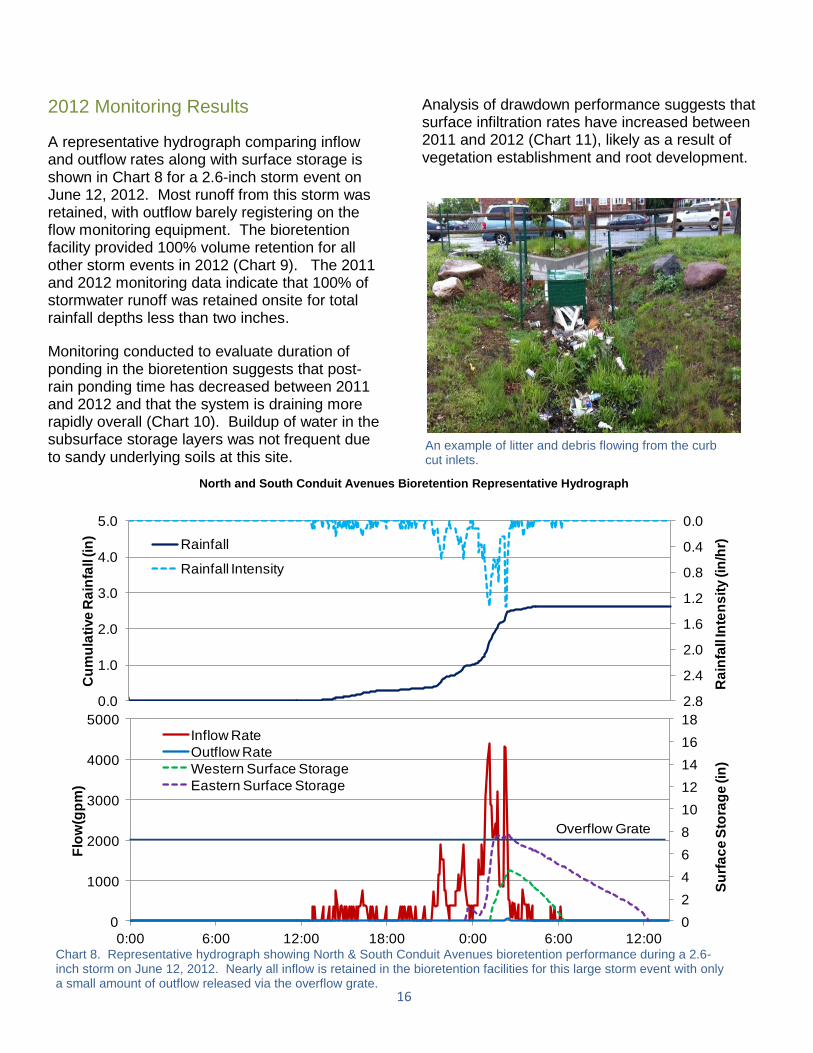
Chart 8. Representative hydrograph showing North & South Conduit Avenues bioretention performance during a 2.6-inch storm on June 12, 2012. Nearly all inflow is retained in the bioretention facilities for this large storm event with only a small amount of outflow released via the overflow grate.
0
2
4
6
8
10
12
14
16
18
0
1000
2000
3000
4000
5000
0:00 6:00 12:00 18:00 0:00 6:00 12:00
Su
rfa
ce
Sto
rag
e (i
n)
Flo
w(g
pm
)
Inflow Rate
Outflow Rate
Western Surface Storage
Eastern Surface Storage
0.0
0.4
0.8
1.2
1.6
2.0
2.4
2.80.0
1.0
2.0
3.0
4.0
5.0
Ra
infa
ll In
ten
sit
y (in
/hr)
Cu
mu
lati
ve
Ra
infa
ll (i
n)
Rainfall
Rainfall Intensity
Overflow Grate
2012 Monitoring Results
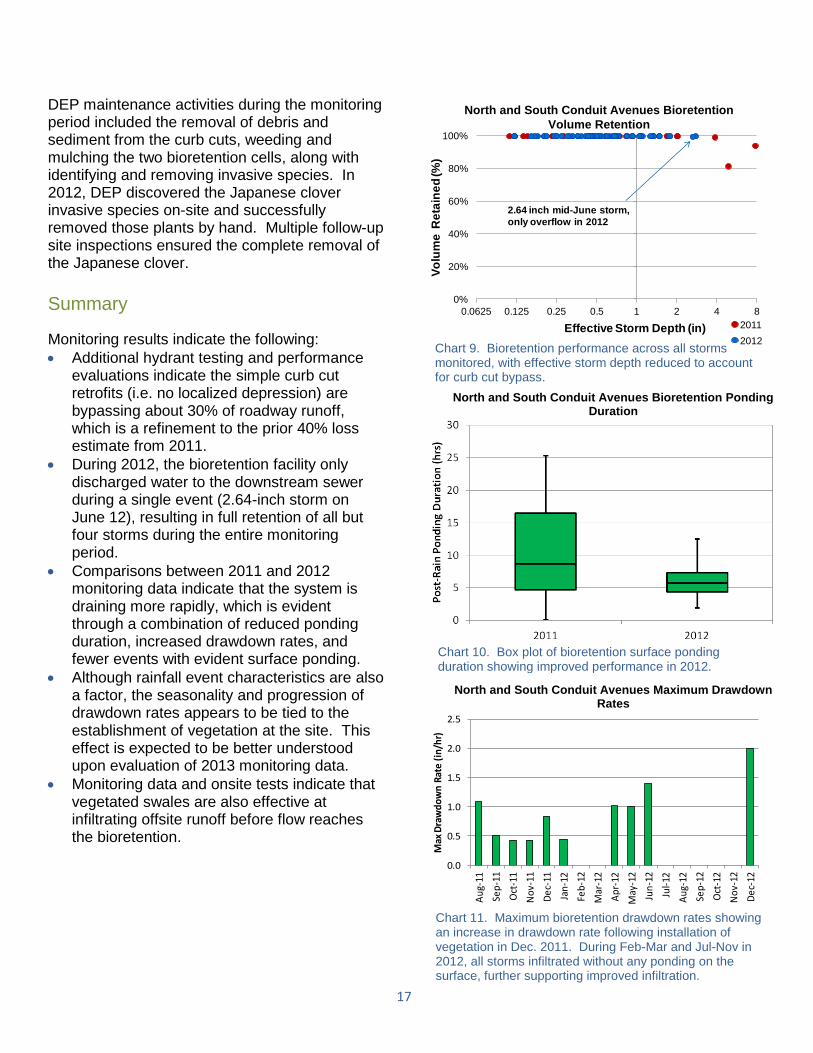
A representative hydrograph comparing inflow and outflow rates along with surface storage is shown in Chart 8 for a 2.6-inch storm event on June 12, 2012. Most runoff from this storm was retained, with outflow barely registering on the flow monitoring equipment. The bioretention facility provided 100% volume retention for all other storm events in 2012 (Chart 9). The 2011 and 2012 monitoring data indicate that 100% of stormwater runoff was retained onsite for total rainfall depths less than two inches.
Monitoring conducted to evaluate duration of ponding in the bioretention suggests that post-rain ponding time has decreased between 2011 and 2012 and that the system is draining more rapidly overall (Chart 10). Buildup of water in the subsurface storage layers was not frequent due to sandy underlying soils at this site.
Analysis of drawdown performance suggests that surface infiltration rates have increased between 2011 and 2012 (Chart 11), likely as a result of vegetation establishment and root development.
An example of litter and debris flowing from the curb cut inlets.
North and South Conduit Avenues Bioretention Representative Hydrograph
17
DEP maintenance activities during the monitoring period included the removal of debris and sediment from the curb cuts, weeding and mulching the two bioretention cells, along with identifying and removing invasive species. In 2012, DEP discovered the Japanese clover invasive species on-site and successfully removed those plants by hand. Multiple follow-up site inspections ensured the complete removal of the Japanese clover.
Summary
Monitoring results indicate the following:
Additional hydrant testing and performance evaluations indicate the simple curb cut retrofits (i.e. no localized depression) are bypassing about 30% of roadway runoff, which is a refinement to the prior 40% loss estimate from 2011.
During 2012, the bioretention facility only discharged water to the downstream sewer during a single event (2.64-inch storm on June 12), resulting in full retention of all but four storms during the entire monitoring period.
Comparisons between 2011 and 2012 monitoring data indicate that the system is draining more rapidly, which is evident through a combination of reduced ponding duration, increased drawdown rates, and fewer events with evident surface ponding.
Although rainfall event characteristics are also a factor, the seasonality and progression of drawdown rates appears to be tied to the establishment of vegetation at the site. This effect is expected to be better understood upon evaluation of 2013 monitoring data.
Monitoring data and onsite tests indicate that vegetated swales are also effective at infiltrating offsite runoff before flow reaches the bioretention.
North and South Conduit Avenues Bioretention Ponding Duration
Chart 9. Bioretention performance across all storms monitored, with effective storm depth reduced to account for curb cut bypass.
Chart 11. Maximum bioretention drawdown rates showing an increase in drawdown rate following installation of vegetation in Dec. 2011. During Feb-Mar and Jul-Nov in 2012, all storms infiltrated without any ponding on the surface, further supporting improved infiltration.
North and South Conduit Avenues Bioretention
Volume Retention
0%
20%
40%
60%
80%
100%
0.0625 0.125 0.25 0.5 1 2 4 8
Vo
lum
e R
eta
ine
d (%
)
Effective Storm Depth (in) 2011
2012
2.64 inch mid-June storm,
only overflow in 2012
Chart 10. Box plot of bioretention surface ponding duration showing improved performance in 2012.
North and South Conduit Avenues Maximum Drawdown Rates
0.0
0.5
1.0
1.5
2.0
2.5
Au
g-11
Sep
-11
Oct
-11
No
v-11
De
c-11
Jan
-12
Feb
-12
Mar
-12
Ap
r-12
May
-12
Jun
-12
Jul-
12
Au
g-12
Sep
-12
Oct
-12
No
v-12
De
c-12
Max
Dra
wd
ow
n R
ate
(in
/hr)

18
Construction of the tiered bioretention facility at Shoelace Park, completed in 2012. Monitoring activities during 2013 will evaluate pilot performance.
SHOELACE PARK BIORETENTION
Pilot Overview
DEP installed a linear and a terraced bioretention facility at Shoelace Park in 2012. New catch basins on 224
th St. and Bronx Blvd. redirect
runoff into an underground pretreatment device and diversion structure. That diversion structure sends flow to the tiered bioretention cells for treatment, while diverting excess flows back to the sewer system. The linear bioretention area borders the paved path through park, managing that runoff and sending any excess flow to the downstream bioretention facility.
Monitoring activities include evaluating inflow and outflow from the system, along with surface ponding in each of the tiered bioretention areas, using pressure transducer water level loggers and v-notch weirs.
2012 Monitoring Results
Monitoring activities at Shoelace Park will take place during 2013. Initial qualitative monitoring evaluations during 2012 indicated that overall plant survival was high (over 99%), but there were issues with the health of ferns along some of the repaired slopes.
Monitoring Site Summary
Metric 2012
Impervious Area Managed (ft²)
81,000
Drainage Area: Green Infrastructure Area
13:1
# of Storms -
Storm Depth (in) -
Peak Intensity (in/hr) -
Storm Duration (hrs) -
Schematic illustrating the bioretention cells and vegetated swale installed at Shoelace Park.
Bioretention
Linear Bioretention
Pretreatment Unit
BBrroonnxx BBllvvdd
19
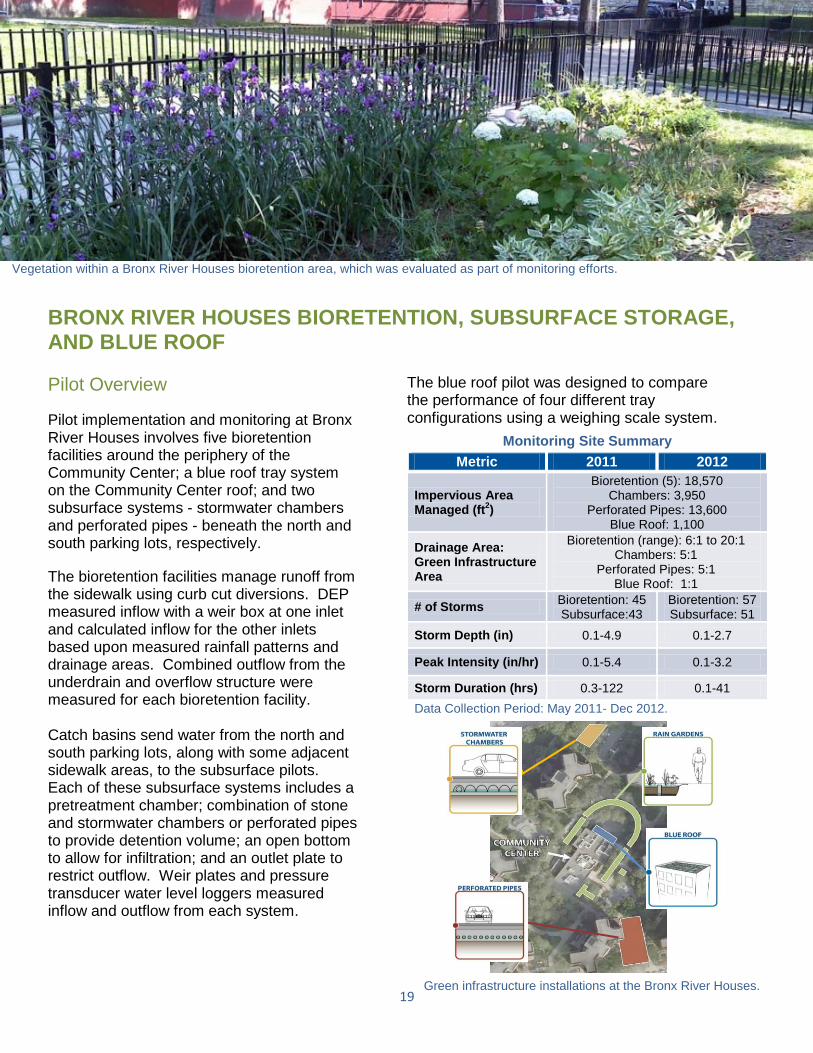
Vegetation within a Bronx River Houses bioretention area, which was evaluated as part of monitoring efforts.
BRONX RIVER HOUSES BIORETENTION, SUBSURFACE STORAGE, AND BLUE ROOF
Pilot Overview
Pilot implementation and monitoring at Bronx River Houses involves five bioretention facilities around the periphery of the Community Center; a blue roof tray system on the Community Center roof; and two subsurface systems - stormwater chambers and perforated pipes - beneath the north and south parking lots, respectively.
The bioretention facilities manage runoff from the sidewalk using curb cut diversions. DEP measured inflow with a weir box at one inlet and calculated inflow for the other inlets based upon measured rainfall patterns and drainage areas. Combined outflow from the underdrain and overflow structure were measured for each bioretention facility. Catch basins send water from the north and south parking lots, along with some adjacent sidewalk areas, to the subsurface pilots. Each of these subsurface systems includes a pretreatment chamber; combination of stone and stormwater chambers or perforated pipes to provide detention volume; an open bottom to allow for infiltration; and an outlet plate to restrict outflow. Weir plates and pressure transducer water level loggers measured inflow and outflow from each system.
The blue roof pilot was designed to compare the performance of four different tray configurations using a weighing scale system.
Monitoring Site Summary
Metric 2011 2012
Impervious Area Managed (ft
2)
Bioretention (5): 18,570
Chambers: 3,950 Perforated Pipes: 13,600
Blue Roof: 1,100
Drainage Area: Green Infrastructure Area
Bioretention (range): 6:1 to 20:1 Chambers: 5:1
Perforated Pipes: 5:1 Blue Roof: 1:1
# of Storms Bioretention: 45 Subsurface:43
Bioretention: 57 Subsurface: 51
Storm Depth (in) 0.1-4.9 0.1-2.7
Peak Intensity (in/hr) 0.1-5.4 0.1-3.2
Storm Duration (hrs) 0.3-122 0.1-41
Data Collection Period: May 2011- Dec 2012.
Green infrastructure installations at the Bronx River Houses.
20
2012 Monitoring Results
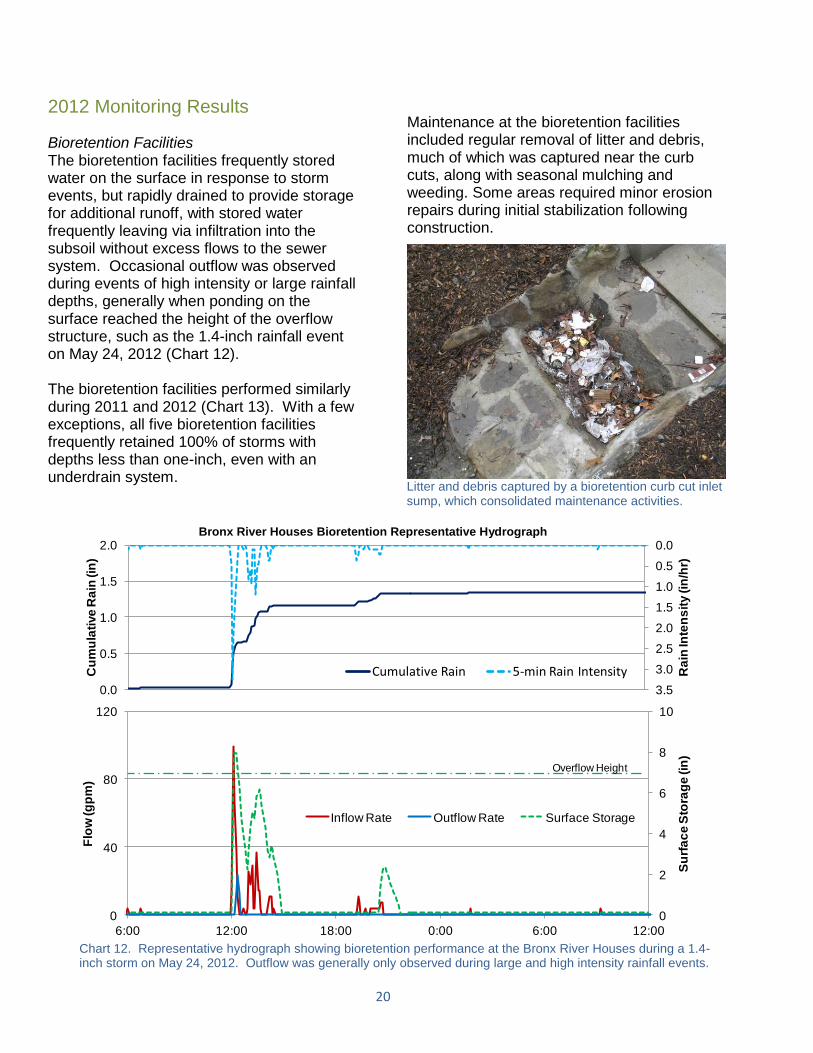
Bioretention Facilities The bioretention facilities frequently stored water on the surface in response to storm events, but rapidly drained to provide storage for additional runoff, with stored water frequently leaving via infiltration into the subsoil without excess flows to the sewer system. Occasional outflow was observed during events of high intensity or large rainfall depths, generally when ponding on the surface reached the height of the overflow structure, such as the 1.4-inch rainfall event on May 24, 2012 (Chart 12). The bioretention facilities performed similarly during 2011 and 2012 (Chart 13). With a few exceptions, all five bioretention facilities frequently retained 100% of storms with depths less than one-inch, even with an underdrain system.
Maintenance at the bioretention facilities included regular removal of litter and debris, much of which was captured near the curb cuts, along with seasonal mulching and weeding. Some areas required minor erosion repairs during initial stabilization following construction.
0.0
0.5
1.0
1.5
2.0
2.5
3.0
3.50.0
0.5
1.0
1.5
2.0
Ra
in In
ten
sit
y (in
/hr)
Cu
mu
lati
ve
Ra
in (in
)
0
2
4
6
8
10
0
40
80
120
6:00 12:00 18:00 0:00 6:00 12:00
Su
rfa
ce
Sto
rag
e (in
)
Flo
w (g
pm
)
Inflow Rate Outflow Rate Surface Storage
Overflow Height
Chart 12. Representative hydrograph showing bioretention performance at the Bronx River Houses during a 1.4-inch storm on May 24, 2012. Outflow was generally only observed during large and high intensity rainfall events.
Litter and debris captured by a bioretention curb cut inlet sump, which consolidated maintenance activities.
Bronx River Houses Bioretention Representative Hydrograph
0.0
0.5
1.0
1.5
2.00.0
0.5
1.0
1.5
2.0
1:00 PM 3:00 PM 5:00 PM 7:00 PM
Rai
n In
ten
sity
(in
/hr)
Cu
mu
lati
ve R
ain
(in
)
Cumulative Rain 5-min Rain Intensity
0
2
4
6
8
10
0
40
80
120
6:00 AM 12:00 PM 6:00 PM 12:00 AM 6:00 AM 12:00 PM
Su
rfa
ce
Sto
rag
e (i
n)
Flo
w (g
pm
)
Inflow Rate Outflow Rate Surface Storage
21
0%
20%
40%
60%
80%
100%
0.0625 0.25 1 4Vo
lum
e R
eta
ined
(%
)
Effective Storm Depth (in)
Bioretention 1
2011
2012
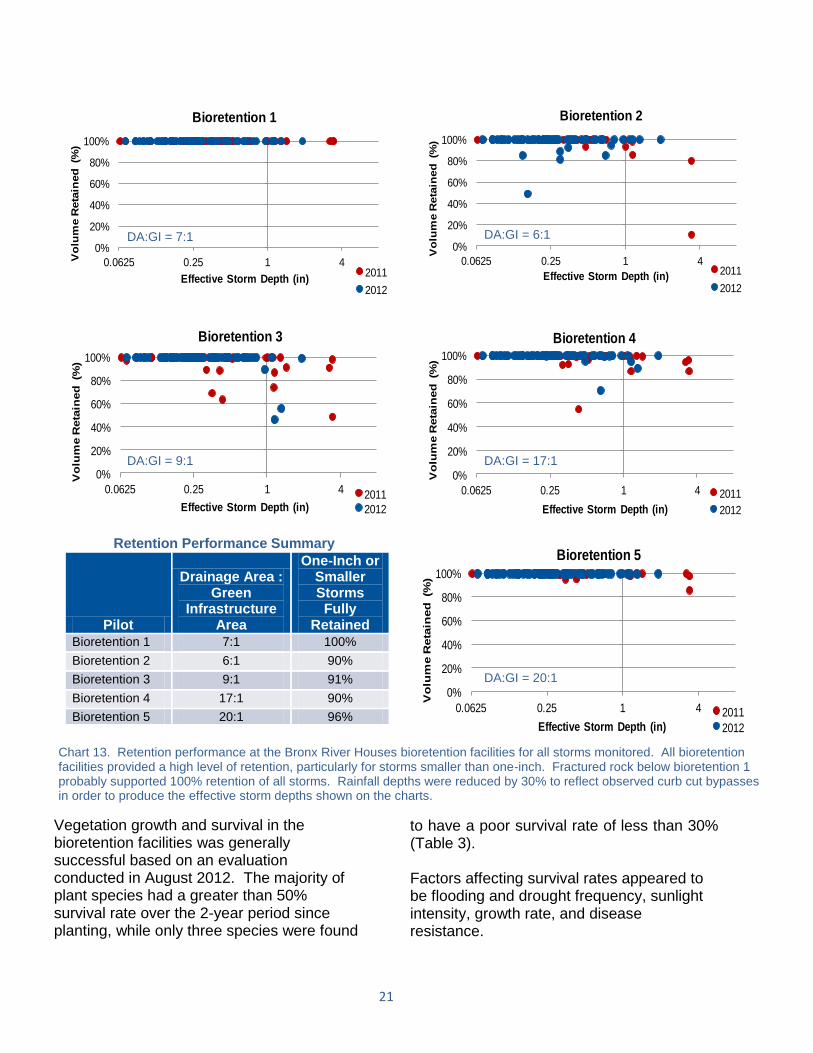
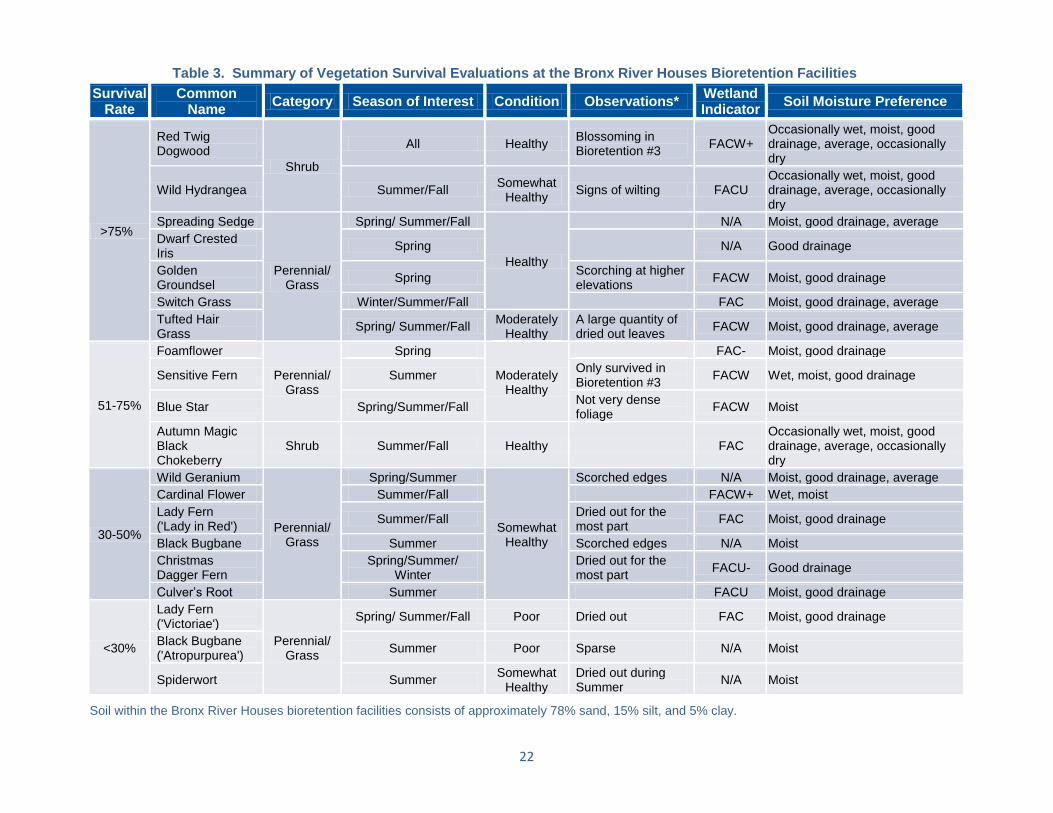
Vegetation growth and survival in the bioretention facilities was generally successful based on an evaluation conducted in August 2012. The majority of plant species had a greater than 50% survival rate over the 2-year period since planting, while only three species were found
to have a poor survival rate of less than 30% (Table 3). Factors affecting survival rates appeared to be flooding and drought frequency, sunlight intensity, growth rate, and disease resistance.
Retention Performance Summary
Pilot
Drainage Area : Green
Infrastructure Area
One-Inch or Smaller Storms
Fully Retained
Bioretention 1 7:1 100%
Bioretention 2 6:1 90%
Bioretention 3 9:1 91%
Bioretention 4 17:1 90%
Bioretention 5 20:1 96%
Chart 13. Retention performance at the Bronx River Houses bioretention facilities for all storms monitored. All bioretention facilities provided a high level of retention, particularly for storms smaller than one-inch. Fractured rock below bioretention 1 probably supported 100% retention of all storms. Rainfall depths were reduced by 30% to reflect observed curb cut bypasses in order to produce the effective storm depths shown on the charts.
0%
20%
40%
60%
80%
100%
0.0625 0.25 1 4
Vo
lum
e R
eta
ined
(%
)
Effective Storm Depth (in)
Bioretention 3
2011
2012
0%
20%
40%
60%
80%
100%
0.0625 0.25 1 4
Vo
lum
e R
eta
ined
(%
)
Effective Storm Depth (in)
Bioretention 5
2011
2012
0%
20%
40%
60%
80%
100%
0.0625 0.25 1 4
Vo
lum
e R
eta
ined
(%
)
Effective Storm Depth (in)
Bioretention 2
2011
2012
0%
20%
40%
60%
80%
100%
0.0625 0.25 1 4
Vo
lum
e R
eta
ined
(%
)
Effective Storm Depth (in)
Bioretention 4
2011
2012
DA:GI = 7:1 DA:GI = 6:1
DA:GI = 9:1 DA:GI = 17:1
DA:GI = 20:1
22
Table 3. Summary of Vegetation Survival Evaluations at the Bronx River Houses Bioretention Facilities
Survival Rate
Common Name
Category Season of Interest Condition Observations* Wetland Indicator
Soil Moisture Preference
>75%
Red Twig Dogwood
Shrub
All Healthy Blossoming in Bioretention #3
FACW+ Occasionally wet, moist, good drainage, average, occasionally dry
Wild Hydrangea Summer/Fall Somewhat
Healthy Signs of wilting FACU
Occasionally wet, moist, good drainage, average, occasionally dry
Spreading Sedge
Perennial/Grass
Spring/ Summer/Fall
Healthy
N/A Moist, good drainage, average
Dwarf Crested Iris
Spring
N/A Good drainage
Golden Groundsel
Spring Scorching at higher elevations
FACW Moist, good drainage
Switch Grass Winter/Summer/Fall
FAC Moist, good drainage, average
Tufted Hair Grass
Spring/ Summer/Fall Moderately
Healthy A large quantity of dried out leaves
FACW Moist, good drainage, average
51-75%
Foamflower
Perennial/Grass
Spring
Moderately Healthy
FAC- Moist, good drainage
Sensitive Fern Summer Only survived in Bioretention #3
FACW Wet, moist, good drainage
Blue Star Spring/Summer/Fall Not very dense foliage
FACW Moist
Autumn Magic Black Chokeberry
Shrub Summer/Fall Healthy FAC Occasionally wet, moist, good drainage, average, occasionally dry
30-50%
Wild Geranium
Perennial/Grass
Spring/Summer
Somewhat Healthy
Scorched edges N/A Moist, good drainage, average
Cardinal Flower Summer/Fall FACW+ Wet, moist
Lady Fern ('Lady in Red')
Summer/Fall Dried out for the most part
FAC Moist, good drainage
Black Bugbane Summer Scorched edges N/A Moist
Christmas Dagger Fern
Spring/Summer/ Winter
Dried out for the most part
FACU- Good drainage
Culver’s Root Summer FACU Moist, good drainage
<30%
Lady Fern ('Victoriae')
Perennial/Grass
Spring/ Summer/Fall Poor Dried out FAC Moist, good drainage
Black Bugbane ('Atropurpurea')
Summer Poor Sparse N/A Moist
Spiderwort Summer Somewhat
Healthy Dried out during Summer
N/A Moist
Soil within the Bronx River Houses bioretention facilities consists of approximately 78% sand, 15% silt, and 5% clay.
23
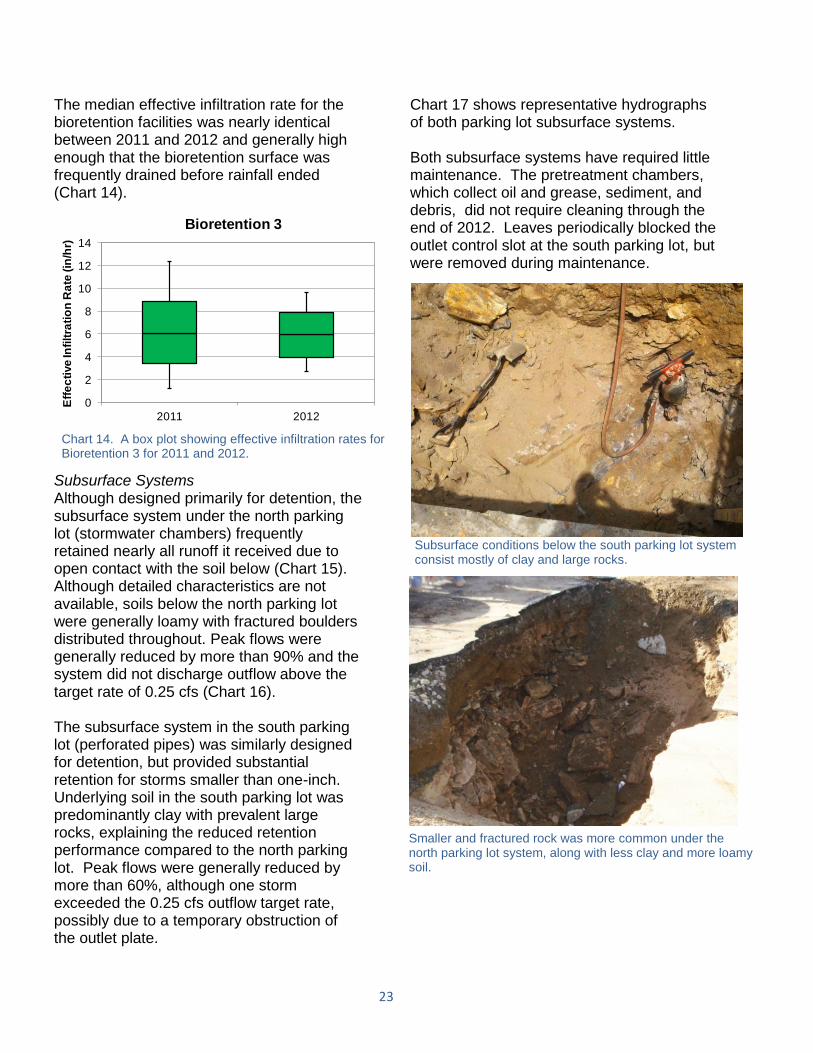
The median effective infiltration rate for the bioretention facilities was nearly identical between 2011 and 2012 and generally high enough that the bioretention surface was frequently drained before rainfall ended (Chart 14).
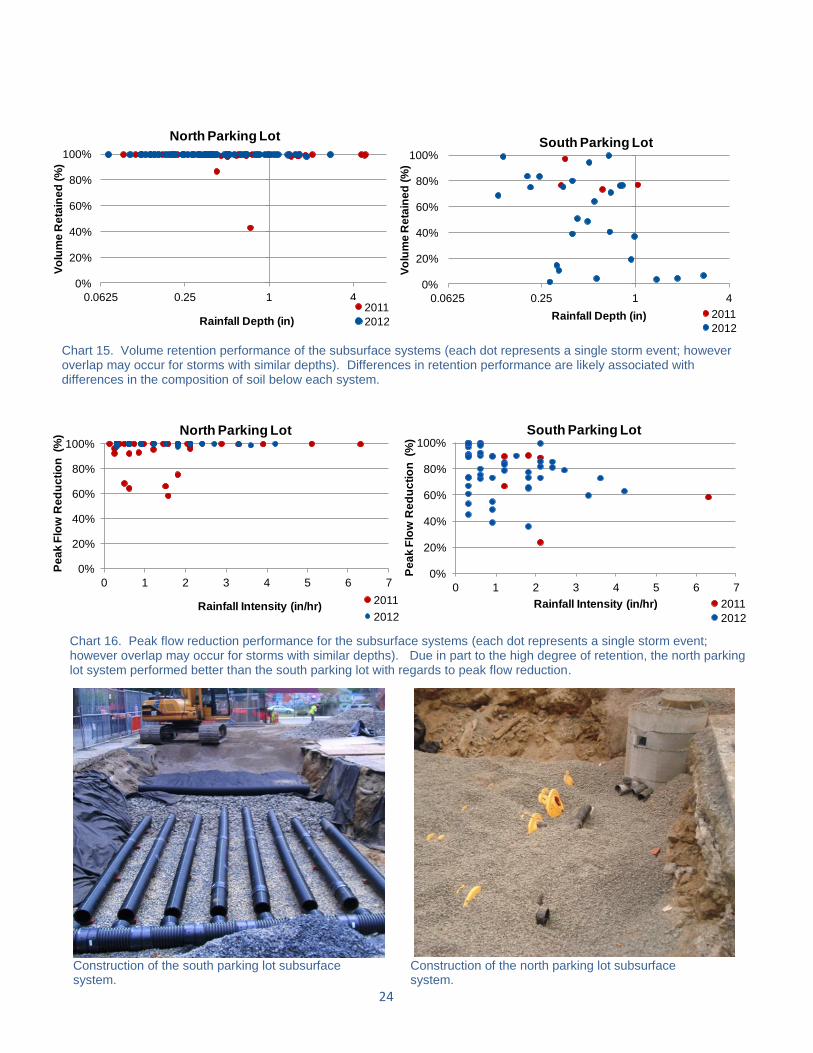
Subsurface Systems Although designed primarily for detention, the subsurface system under the north parking lot (stormwater chambers) frequently retained nearly all runoff it received due to open contact with the soil below (Chart 15). Although detailed characteristics are not available, soils below the north parking lot were generally loamy with fractured boulders distributed throughout. Peak flows were generally reduced by more than 90% and the system did not discharge outflow above the target rate of 0.25 cfs (Chart 16). The subsurface system in the south parking lot (perforated pipes) was similarly designed for detention, but provided substantial retention for storms smaller than one-inch. Underlying soil in the south parking lot was predominantly clay with prevalent large rocks, explaining the reduced retention performance compared to the north parking lot. Peak flows were generally reduced by more than 60%, although one storm exceeded the 0.25 cfs outflow target rate, possibly due to a temporary obstruction of the outlet plate.
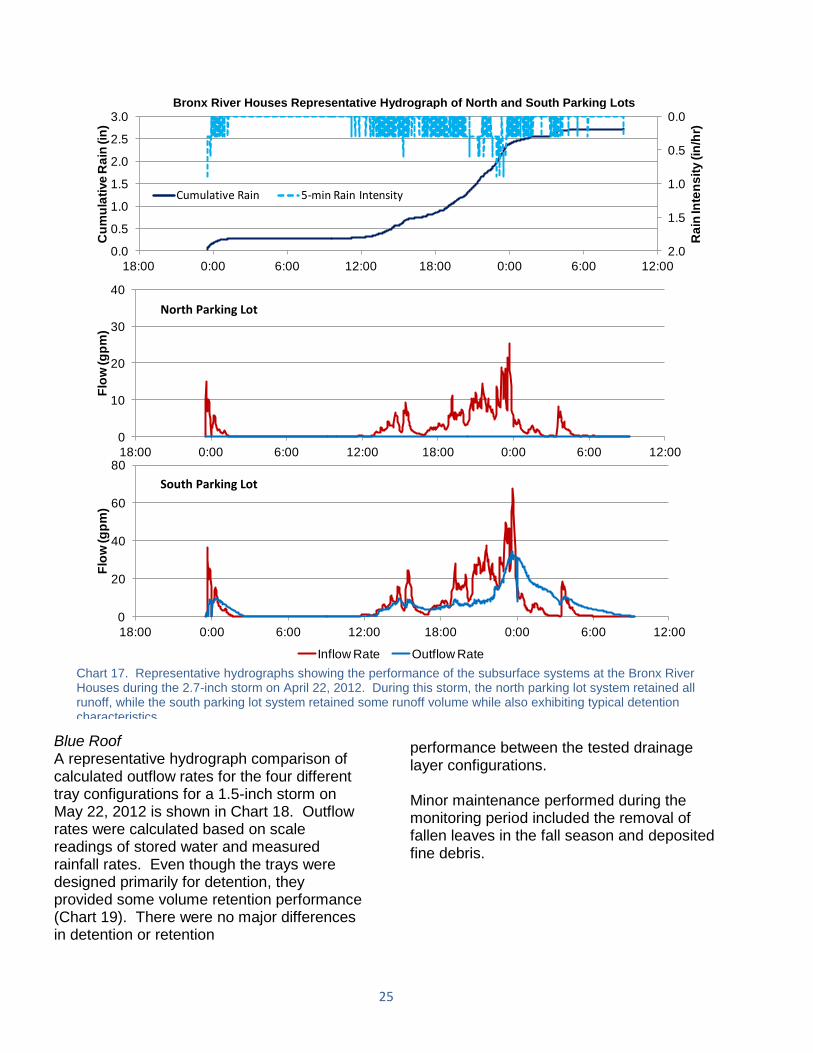
Chart 17 shows representative hydrographs of both parking lot subsurface systems. Both subsurface systems have required little maintenance. The pretreatment chambers, which collect oil and grease, sediment, and debris, did not require cleaning through the end of 2012. Leaves periodically blocked the outlet control slot at the south parking lot, but were removed during maintenance.
Chart 14. A box plot showing effective infiltration rates for Bioretention 3 for 2011 and 2012.
0
2
4
6
8
10
12
14
2011 2012
Eff
ec
tive
Infi
ltra
tio
n R
ate
(in
/hr)
Bioretention 3
Subsurface conditions below the south parking lot system consist mostly of clay and large rocks.
Smaller and fractured rock was more common under the north parking lot system, along with less clay and more loamy soil.
24
Chart 15. Volume retention performance of the subsurface systems (each dot represents a single storm event; however overlap may occur for storms with similar depths). Differences in retention performance are likely associated with differences in the composition of soil below each system.
0%
20%
40%
60%
80%
100%
0.0625 0.25 1 4
Vo
lum
e R
eta
ine
d (
%)
Rainfall Depth (in)
North Parking Lot
2011
2012
0%
20%
40%
60%
80%
100%
0.0625 0.25 1 4
Vo
lum
e R
eta
ine
d (
%)
Rainfall Depth (in)
South Parking Lot
2011
2012
Chart 16. Peak flow reduction performance for the subsurface systems (each dot represents a single storm event; however overlap may occur for storms with similar depths). Due in part to the high degree of retention, the north parking lot system performed better than the south parking lot with regards to peak flow reduction.
0%
20%
40%
60%
80%
100%
0 1 2 3 4 5 6 7
Pe
ak
Flo
w R
ed
uc
tio
n (%
)
Rainfall Intensity (in/hr)
North Parking Lot
2011
2012
0%
20%
40%
60%
80%
100%
0 1 2 3 4 5 6 7
Pe
ak
Flo
w R
ed
uc
tio
n (%
)
Rainfall Intensity (in/hr)
South Parking Lot
2011
2012
Construction of the south parking lot subsurface system.
Construction of the north parking lot subsurface system.
25
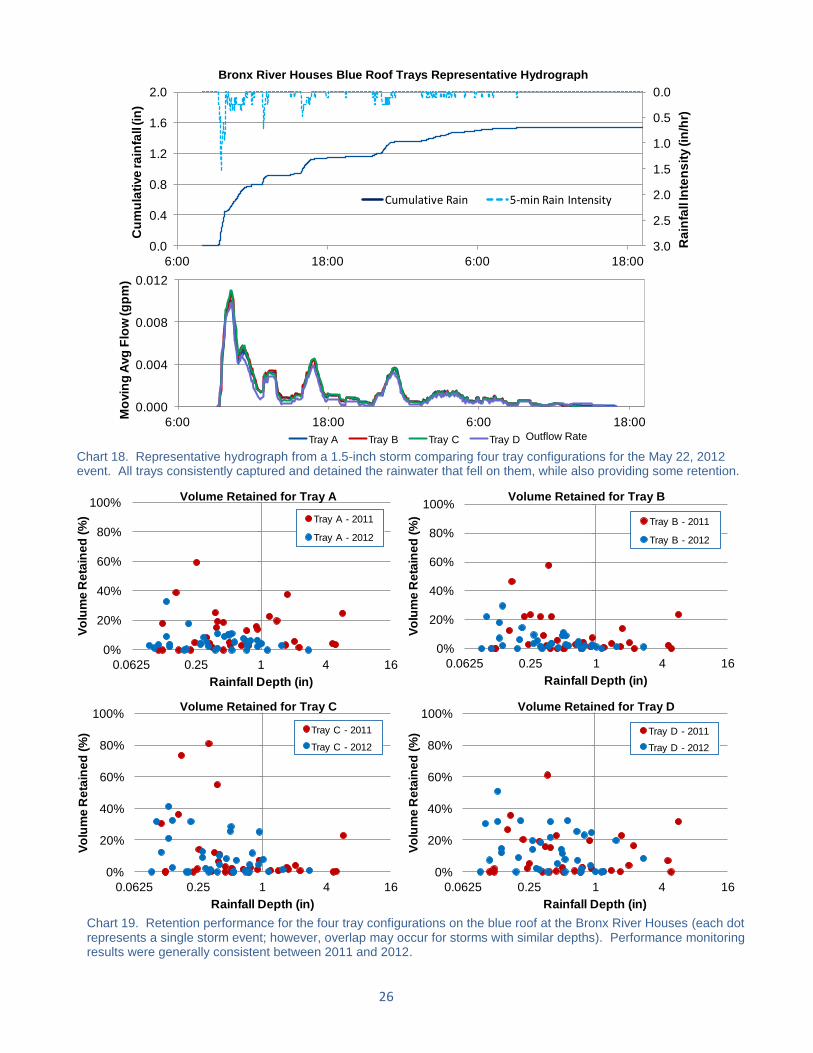
Blue Roof A representative hydrograph comparison of calculated outflow rates for the four different tray configurations for a 1.5-inch storm on May 22, 2012 is shown in Chart 18. Outflow rates were calculated based on scale readings of stored water and measured rainfall rates. Even though the trays were designed primarily for detention, they provided some volume retention performance (Chart 19). There were no major differences in detention or retention
performance between the tested drainage layer configurations. Minor maintenance performed during the monitoring period included the removal of fallen leaves in the fall season and deposited fine debris.
Chart 17. Representative hydrographs showing the performance of the subsurface systems at the Bronx River Houses during the 2.7-inch storm on April 22, 2012. During this storm, the north parking lot system retained all runoff, while the south parking lot system retained some runoff volume while also exhibiting typical detention characteristics.
0
10
20
30
40
18:00 0:00 6:00 12:00 18:00 0:00 6:00 12:00
Flo
w (g
pm
)
Inflow Rate Outflow Rate Surface Storage
0.0
0.5
1.0
1.5
2.00.0
0.5
1.0
1.5
2.0
2.5
3.0
18:00 0:00 6:00 12:00 18:00 0:00 6:00 12:00
Ra
in In
ten
sit
y (in
/hr)
Cu
mu
lati
ve
Ra
in (in
)
0
20
40
60
80
18:00 0:00 6:00 12:00 18:00 0:00 6:00 12:00
Flo
w (g
pm
)
Inflow Rate Outflow Rate
North Parking Lot
South Parking Lot
Bronx River Houses Representative Hydrograph of North and South Parking Lots
0.0
0.5
1.0
1.5
2.00.0
0.5
1.0
1.5
2.0
1:00 PM 3:00 PM 5:00 PM 7:00 PM
Rai
n In
ten
sity
(in
/hr)
Cu
mu
lati
ve R
ain
(in
)
Cumulative Rain 5-min Rain Intensity
26
Chart 19. Retention performance for the four tray configurations on the blue roof at the Bronx River Houses (each dot represents a single storm event; however, overlap may occur for storms with similar depths). Performance monitoring results were generally consistent between 2011 and 2012.
Chart 18. Representative hydrograph from a 1.5-inch storm comparing four tray configurations for the May 22, 2012 event. All trays consistently captured and detained the rainwater that fell on them, while also providing some retention.
0.0
0.5
1.0
1.5
2.0
2.5
3.00.0
0.4
0.8
1.2
1.6
2.0
6:00 18:00 6:00 18:00
Ra
infa
ll In
ten
sit
y (in
/hr)
Cu
mu
lati
ve
ra
infa
ll (i
n)
0.000
0.004
0.008
0.012
6:00 18:00 6:00 18:00
Mo
vin
g A
vg
Flo
w (g
pm
)
Tray A Tray B Tray C Tray D
Bronx River Houses Blue Roof Trays Representative Hydrograph
0%
20%
40%
60%
80%
100%
0.0625 0.25 1 4 16
Vo
lum
e R
eta
ine
d (
%)
Rainfall Depth (in)
Tray A - 2011
Tray A - 2012
0%
20%
40%
60%
80%
100%
0.0625 0.25 1 4 16
Vo
lum
e R
eta
ine
d (
%)
Rainfall Depth (in)
Tray B - 2011
Tray B - 2012
0%
20%
40%
60%
80%
100%
0.0625 0.25 1 4 16
Vo
lum
e R
eta
ine
d (
%)
Rainfall Depth (in)
Tray C - 2011
Tray C - 2012
0%
20%
40%
60%
80%
100%
0.0625 0.25 1 4 16
Vo
lum
e R
eta
ine
d (
%)
Rainfall Depth (in)
Tray D - 2011
Tray D - 2012
Volume Retained for Tray C
Volume Retained for Tray B
Volume Retained for Tray D
Volume Retained for Tray A
0.0
0.5
1.0
1.5
2.00.0
0.5
1.0
1.5
2.0
1:00 PM 3:00 PM 5:00 PM 7:00 PM
Rai
n In
ten
sity
(in
/hr)
Cu
mu
lati
ve R
ain
(in
)
Cumulative Rain 5-min Rain Intensity
Outflow Rate
27
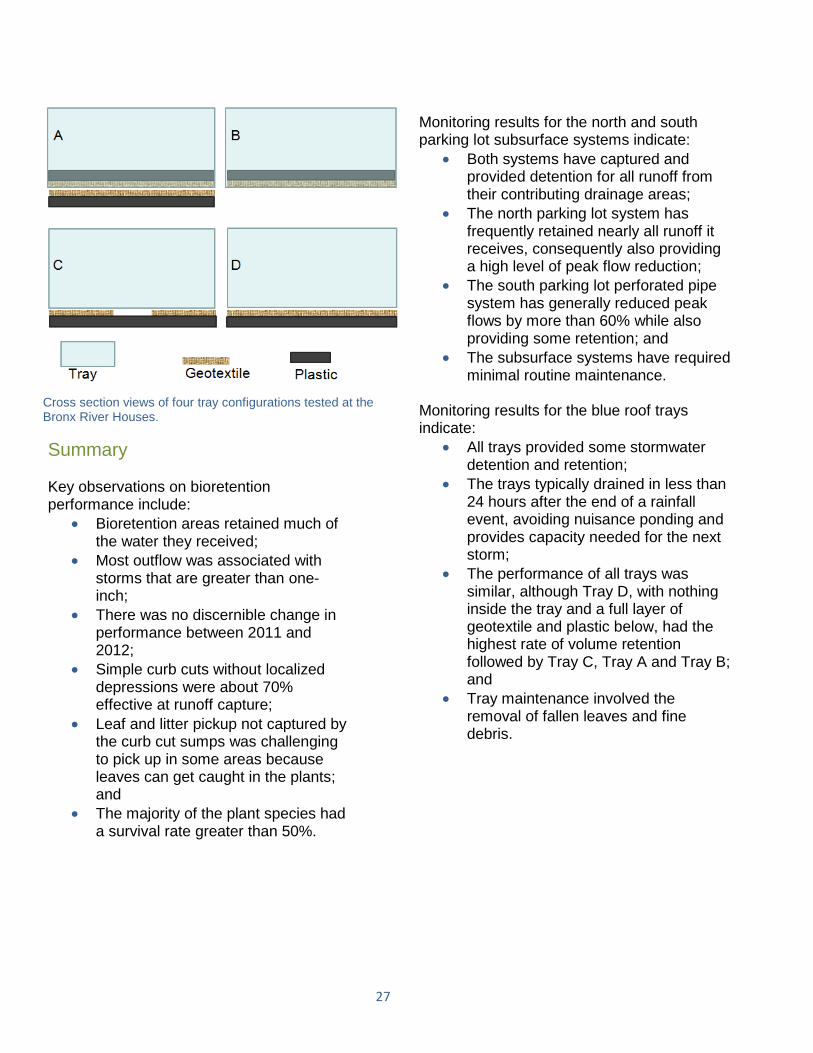
Summary Key observations on bioretention performance include:
Bioretention areas retained much of the water they received;
Most outflow was associated with storms that are greater than one-inch;
There was no discernible change in performance between 2011 and 2012;
Simple curb cuts without localized depressions were about 70% effective at runoff capture;
Leaf and litter pickup not captured by the curb cut sumps was challenging to pick up in some areas because leaves can get caught in the plants; and
The majority of the plant species had a survival rate greater than 50%.
Monitoring results for the north and south parking lot subsurface systems indicate:
Both systems have captured and provided detention for all runoff from their contributing drainage areas;
The north parking lot system has frequently retained nearly all runoff it receives, consequently also providing a high level of peak flow reduction;
The south parking lot perforated pipe system has generally reduced peak flows by more than 60% while also providing some retention; and
The subsurface systems have required minimal routine maintenance.
Monitoring results for the blue roof trays indicate:
All trays provided some stormwater detention and retention;
The trays typically drained in less than 24 hours after the end of a rainfall event, avoiding nuisance ponding and provides capacity needed for the next storm;
The performance of all trays was similar, although Tray D, with nothing inside the tray and a full layer of geotextile and plastic below, had the highest rate of volume retention followed by Tray C, Tray A and Tray B; and
Tray maintenance involved the removal of fallen leaves and fine debris.
Cross section views of four tray configurations tested at the Bronx River Houses.
28
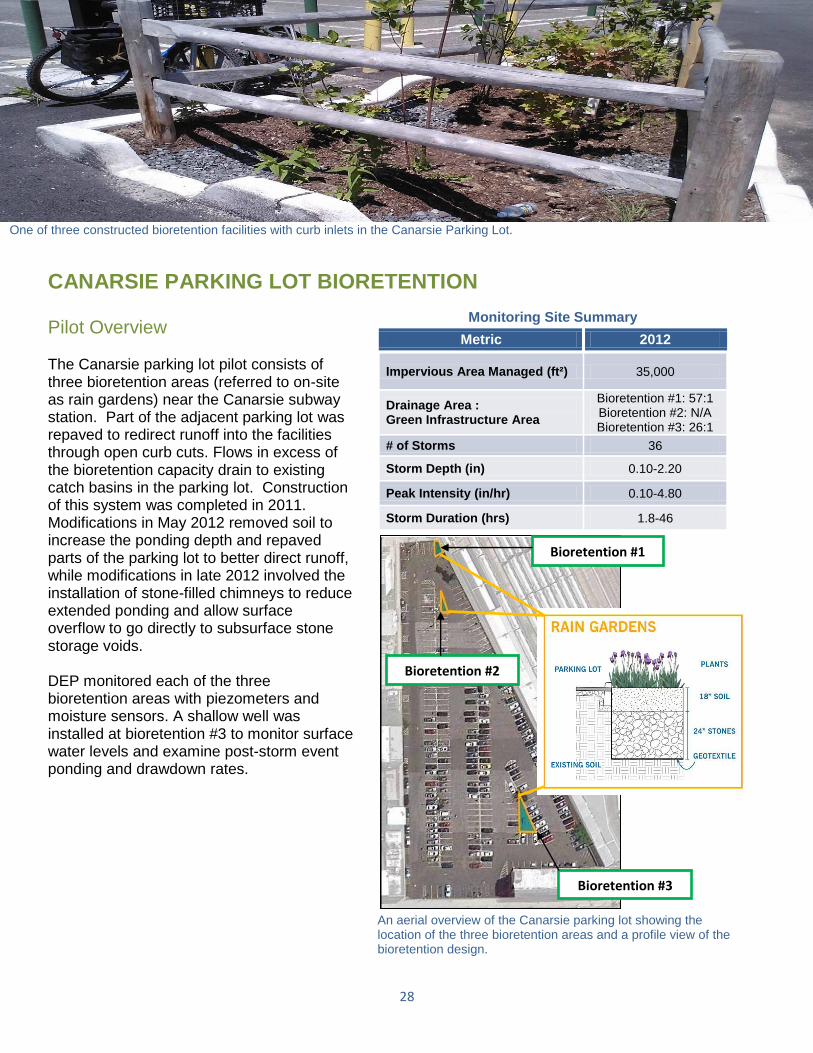
One of three constructed bioretention facilities with curb inlets in the Canarsie Parking Lot.
CANARSIE PARKING LOT BIORETENTION
Pilot Overview The Canarsie parking lot pilot consists of three bioretention areas (referred to on-site as rain gardens) near the Canarsie subway station. Part of the adjacent parking lot was repaved to redirect runoff into the facilities through open curb cuts. Flows in excess of the bioretention capacity drain to existing catch basins in the parking lot. Construction of this system was completed in 2011. Modifications in May 2012 removed soil to increase the ponding depth and repaved parts of the parking lot to better direct runoff, while modifications in late 2012 involved the installation of stone-filled chimneys to reduce extended ponding and allow surface overflow to go directly to subsurface stone storage voids. DEP monitored each of the three bioretention areas with piezometers and moisture sensors. A shallow well was installed at bioretention #3 to monitor surface water levels and examine post-storm event ponding and drawdown rates.
Monitoring Site Summary
Metric 2012
Impervious Area Managed (ft²) 35,000
Drainage Area : Green Infrastructure Area
Bioretention #1: 57:1 Bioretention #2: N/A Bioretention #3: 26:1
# of Storms 36
Storm Depth (in) 0.10-2.20
Peak Intensity (in/hr) 0.10-4.80
Storm Duration (hrs) 1.8-46
An aerial overview of the Canarsie parking lot showing the location of the three bioretention areas and a profile view of the bioretention design.
Bioretention #2
Bioretention #1
Bioretention #3
29
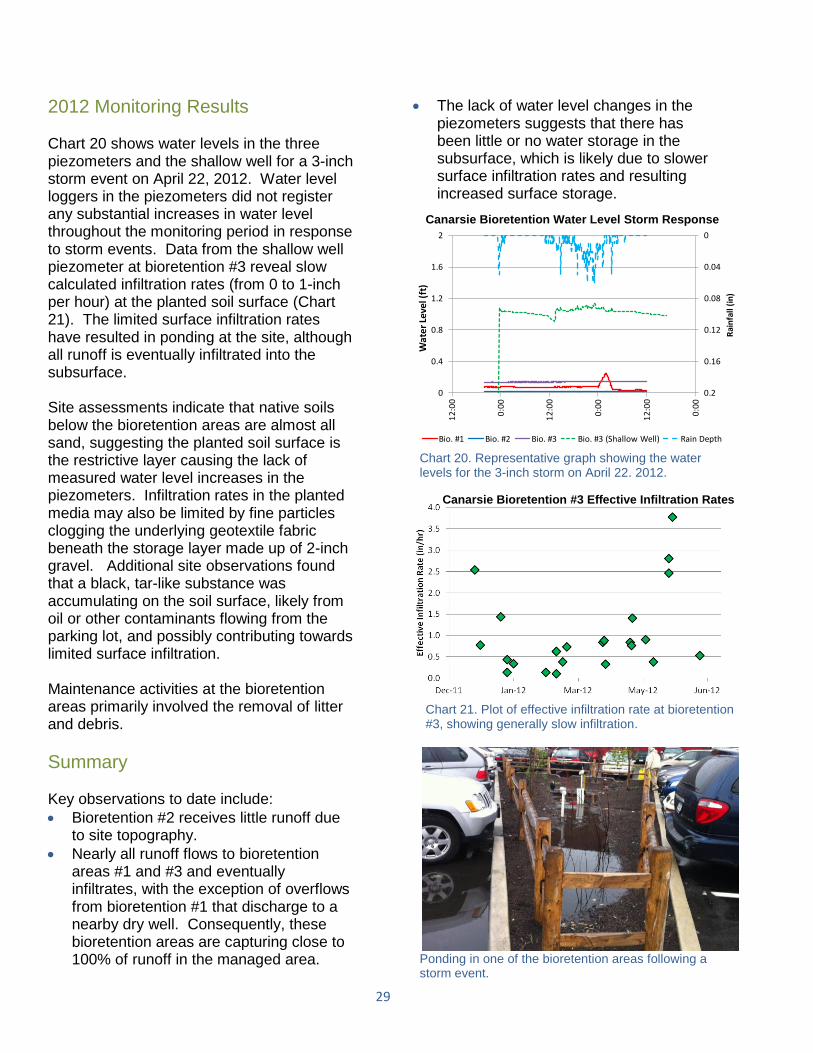
2012 Monitoring Results Chart 20 shows water levels in the three piezometers and the shallow well for a 3-inch storm event on April 22, 2012. Water level loggers in the piezometers did not register any substantial increases in water level throughout the monitoring period in response to storm events. Data from the shallow well piezometer at bioretention #3 reveal slow calculated infiltration rates (from 0 to 1-inch per hour) at the planted soil surface (Chart 21). The limited surface infiltration rates have resulted in ponding at the site, although all runoff is eventually infiltrated into the subsurface. Site assessments indicate that native soils below the bioretention areas are almost all sand, suggesting the planted soil surface is the restrictive layer causing the lack of measured water level increases in the piezometers. Infiltration rates in the planted media may also be limited by fine particles clogging the underlying geotextile fabric beneath the storage layer made up of 2-inch gravel. Additional site observations found that a black, tar-like substance was accumulating on the soil surface, likely from oil or other contaminants flowing from the parking lot, and possibly contributing towards limited surface infiltration. Maintenance activities at the bioretention areas primarily involved the removal of litter and debris.
Summary Key observations to date include:
Bioretention #2 receives little runoff due to site topography.
Nearly all runoff flows to bioretention areas #1 and #3 and eventually infiltrates, with the exception of overflows from bioretention #1 that discharge to a nearby dry well. Consequently, these bioretention areas are capturing close to 100% of runoff in the managed area.
The lack of water level changes in the piezometers suggests that there has been little or no water storage in the subsurface, which is likely due to slower surface infiltration rates and resulting increased surface storage.
Chart 21. Plot of effective infiltration rate at bioretention #3, showing generally slow infiltration.
Chart 20. Representative graph showing the water levels for the 3-inch storm on April 22, 2012.
Ponding in one of the bioretention areas following a storm event.
0
0.04
0.08
0.12
0.16
0.20
0.4
0.8
1.2
1.6
2
12
:00
0:0
0
12
:00
0:0
0
12
:00
0:0
0
Rai
nfa
ll (i
n)
Wat
er L
evel
(ft
)
Bio. #1 Bio. #2 Bio. #3 Bio. #3 (Shallow Well) Rain Depth
Canarsie Bioretention Water Level Storm Response
Canarsie Bioretention #3 Effective Infiltration Rates
30
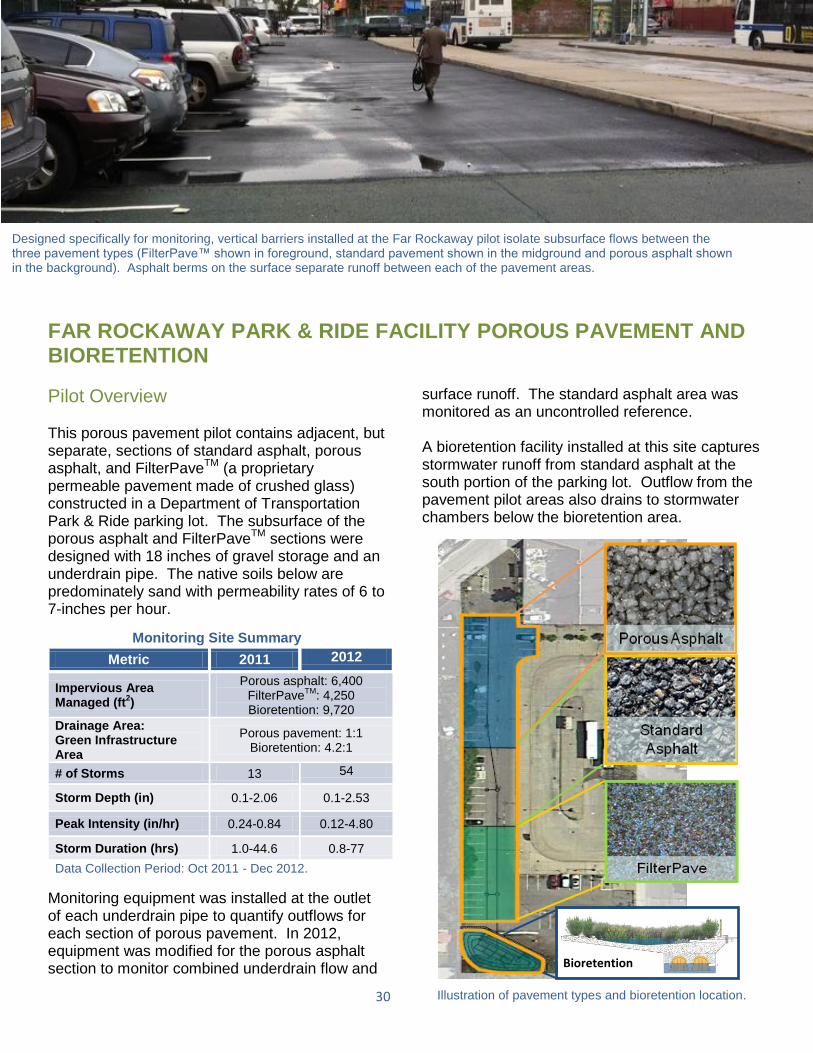
Designed specifically for monitoring, vertical barriers installed at the Far Rockaway pilot isolate subsurface flows between the three pavement types (FilterPave™ shown in foreground, standard pavement shown in the midground and porous asphalt shown in the background). Asphalt berms on the surface separate runoff between each of the pavement areas.
FAR ROCKAWAY PARK & RIDE FACILITY POROUS PAVEMENT AND BIORETENTION
Pilot Overview This porous pavement pilot contains adjacent, but separate, sections of standard asphalt, porous asphalt, and FilterPave
TM (a proprietary
permeable pavement made of crushed glass) constructed in a Department of Transportation Park & Ride parking lot. The subsurface of the porous asphalt and FilterPave
TM sections were
designed with 18 inches of gravel storage and an underdrain pipe. The native soils below are predominately sand with permeability rates of 6 to 7-inches per hour.
Monitoring Site Summary
Metric 2011 2012
Impervious Area Managed (ft
2)
Porous asphalt: 6,400 FilterPave
TM: 4,250
Bioretention: 9,720
Drainage Area: Green Infrastructure Area
Porous pavement: 1:1 Bioretention: 4.2:1
# of Storms 13 54
Storm Depth (in) 0.1-2.06 0.1-2.53
Peak Intensity (in/hr) 0.24-0.84 0.12-4.80
Storm Duration (hrs) 1.0-44.6 0.8-77
Data Collection Period: Oct 2011 - Dec 2012.
Monitoring equipment was installed at the outlet of each underdrain pipe to quantify outflows for each section of porous pavement. In 2012, equipment was modified for the porous asphalt section to monitor combined underdrain flow and
surface runoff. The standard asphalt area was monitored as an uncontrolled reference. A bioretention facility installed at this site captures stormwater runoff from standard asphalt at the south portion of the parking lot. Outflow from the pavement pilot areas also drains to stormwater chambers below the bioretention area.
Illustration of pavement types and bioretention location.
Bioretention
31
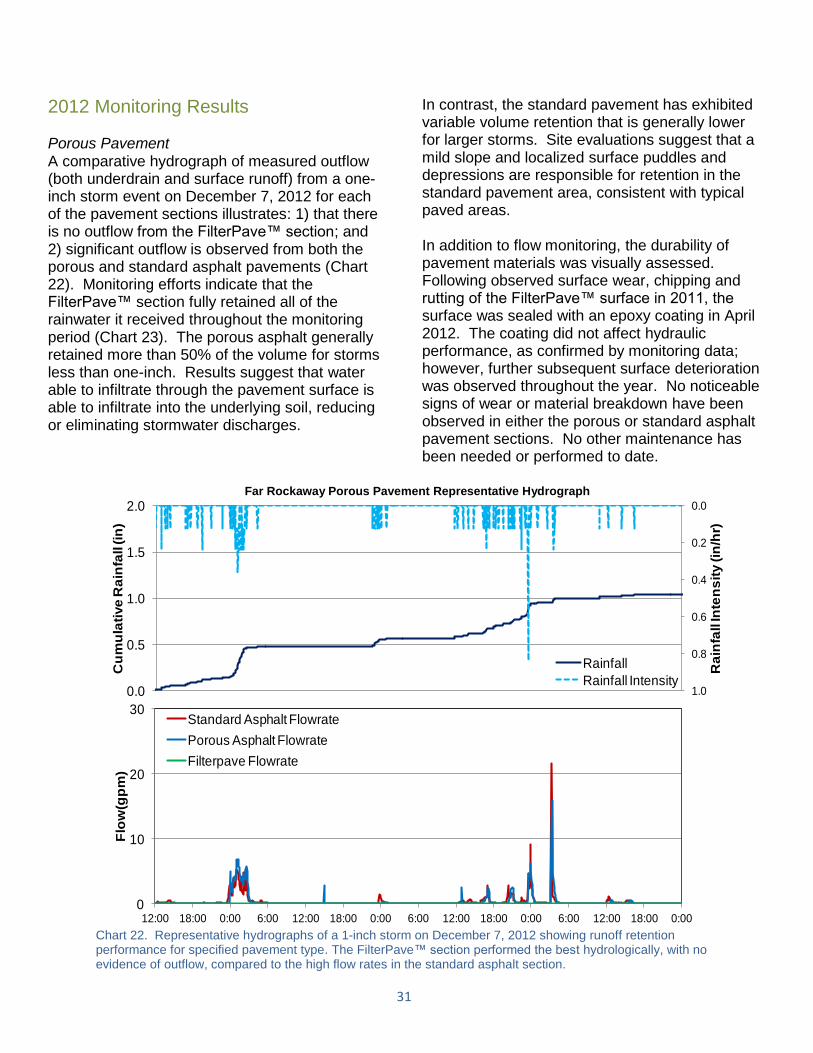
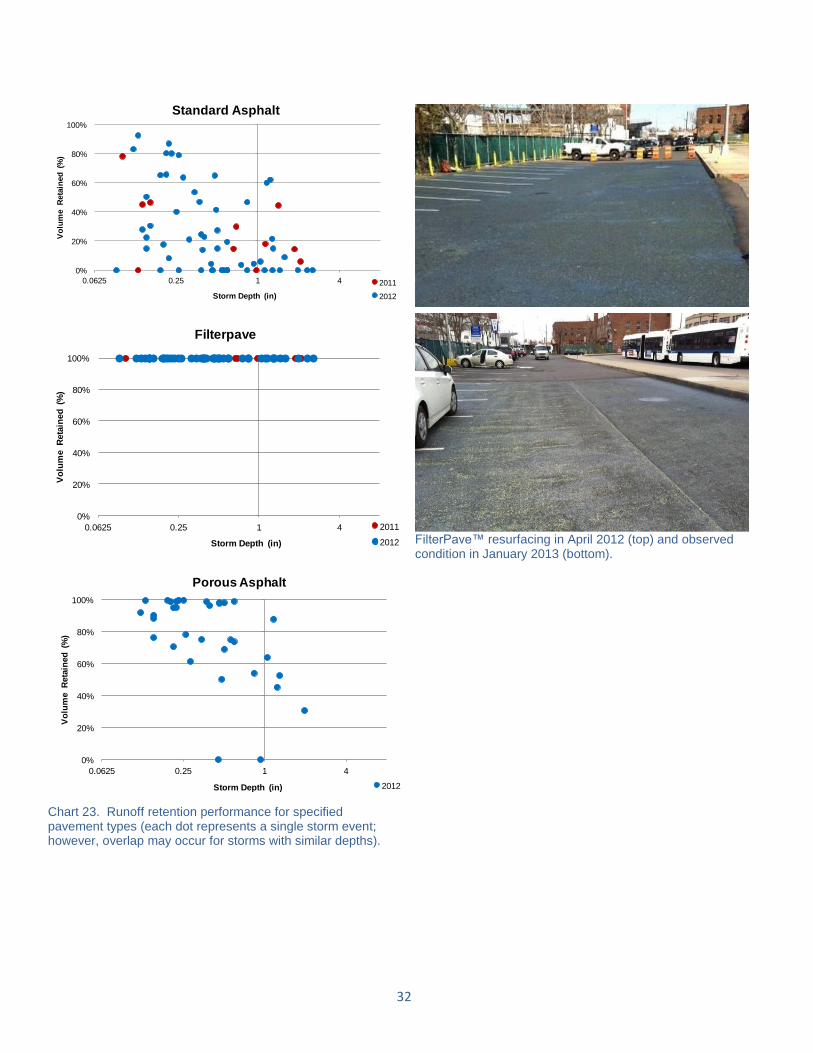
2012 Monitoring Results
Porous Pavement A comparative hydrograph of measured outflow (both underdrain and surface runoff) from a one-inch storm event on December 7, 2012 for each of the pavement sections illustrates: 1) that there is no outflow from the FilterPave™ section; and 2) significant outflow is observed from both the porous and standard asphalt pavements (Chart 22). Monitoring efforts indicate that the FilterPave™ section fully retained all of the rainwater it received throughout the monitoring period (Chart 23). The porous asphalt generally retained more than 50% of the volume for storms less than one-inch. Results suggest that water able to infiltrate through the pavement surface is able to infiltrate into the underlying soil, reducing or eliminating stormwater discharges.
In contrast, the standard pavement has exhibited variable volume retention that is generally lower for larger storms. Site evaluations suggest that a mild slope and localized surface puddles and depressions are responsible for retention in the standard pavement area, consistent with typical paved areas. In addition to flow monitoring, the durability of pavement materials was visually assessed. Following observed surface wear, chipping and rutting of the FilterPave™ surface in 2011, the surface was sealed with an epoxy coating in April 2012. The coating did not affect hydraulic performance, as confirmed by monitoring data; however, further subsequent surface deterioration was observed throughout the year. No noticeable signs of wear or material breakdown have been observed in either the porous or standard asphalt pavement sections. No other maintenance has been needed or performed to date.
Chart 22. Representative hydrographs of a 1-inch storm on December 7, 2012 showing runoff retention performance for specified pavement type. The FilterPave™ section performed the best hydrologically, with no evidence of outflow, compared to the high flow rates in the standard asphalt section.
Far Rockaway Porous Pavement Representative Hydrograph
0
10
20
30
12:00 18:00 0:00 6:00 12:00 18:00 0:00 6:00 12:00 18:00 0:00 6:00 12:00 18:00 0:00
Flo
w(g
pm
)
Standard Asphalt Flowrate
Porous Asphalt Flowrate
Filterpave Flowrate
0.0
0.2
0.4
0.6
0.8
1.00.0
0.5
1.0
1.5
2.0
Ra
infa
ll In
ten
sit
y (in
/hr)
Cu
mu
lati
ve
Ra
infa
ll (in
)
Rainfall
Rainfall Intensity
32
FilterPave™ resurfacing in April 2012 (top) and observed condition in January 2013 (bottom).
Chart 23. Runoff retention performance for specified pavement types (each dot represents a single storm event; however, overlap may occur for storms with similar depths).
0%
20%
40%
60%
80%
100%
0.0625 0.25 1 4
Vo
lum
e R
eta
ined
(%
)
Storm Depth (in)
Standard Asphalt
2011
2012
0%
20%
40%
60%
80%
100%
0.0625 0.25 1 4
Vo
lum
e R
eta
ined
(%
)
Storm Depth (in)
Filterpave
2011
2012
0%
20%
40%
60%
80%
100%
0.0625 0.25 1 4
Vo
lum
e R
eta
ined
(%
)
Storm Depth (in)
Porous Asphalt
2012
33
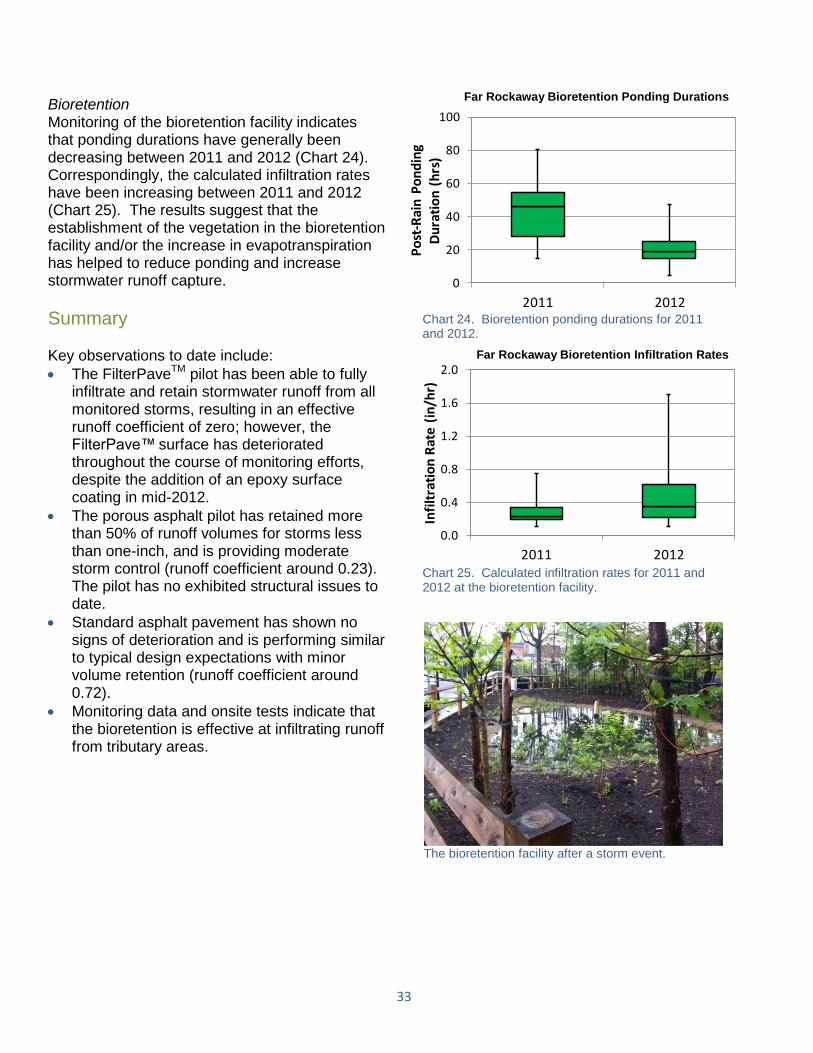
Bioretention Monitoring of the bioretention facility indicates that ponding durations have generally been decreasing between 2011 and 2012 (Chart 24). Correspondingly, the calculated infiltration rates have been increasing between 2011 and 2012 (Chart 25). The results suggest that the establishment of the vegetation in the bioretention facility and/or the increase in evapotranspiration has helped to reduce ponding and increase stormwater runoff capture.
Summary Key observations to date include:
The FilterPaveTM
pilot has been able to fully infiltrate and retain stormwater runoff from all monitored storms, resulting in an effective runoff coefficient of zero; however, the FilterPave™
surface has deteriorated
throughout the course of monitoring efforts, despite the addition of an epoxy surface coating in mid-2012.
The porous asphalt pilot has retained more than 50% of runoff volumes for storms less than one-inch, and is providing moderate storm control (runoff coefficient around 0.23). The pilot has no exhibited structural issues to date.
Standard asphalt pavement has shown no signs of deterioration and is performing similar to typical design expectations with minor volume retention (runoff coefficient around 0.72).
Monitoring data and onsite tests indicate that the bioretention is effective at infiltrating runoff from tributary areas.
The bioretention facility after a storm event.
Chart 24. Bioretention ponding durations for 2011 and 2012.
Chart 25. Calculated infiltration rates for 2011 and 2012 at the bioretention facility.
0
20
40
60
80
100
2011 2012
Po
st-R
ain
Po
nd
ing
Du
rati
on
(h
rs)
Far Rockaway Bioretention Ponding Durations
Far Rockaway Bioretention Infiltration Rates
0.0
0.4
0.8
1.2
1.6
2.0
2011 2012
Infi
ltra
tio
n R
ate
(in
/hr)
34
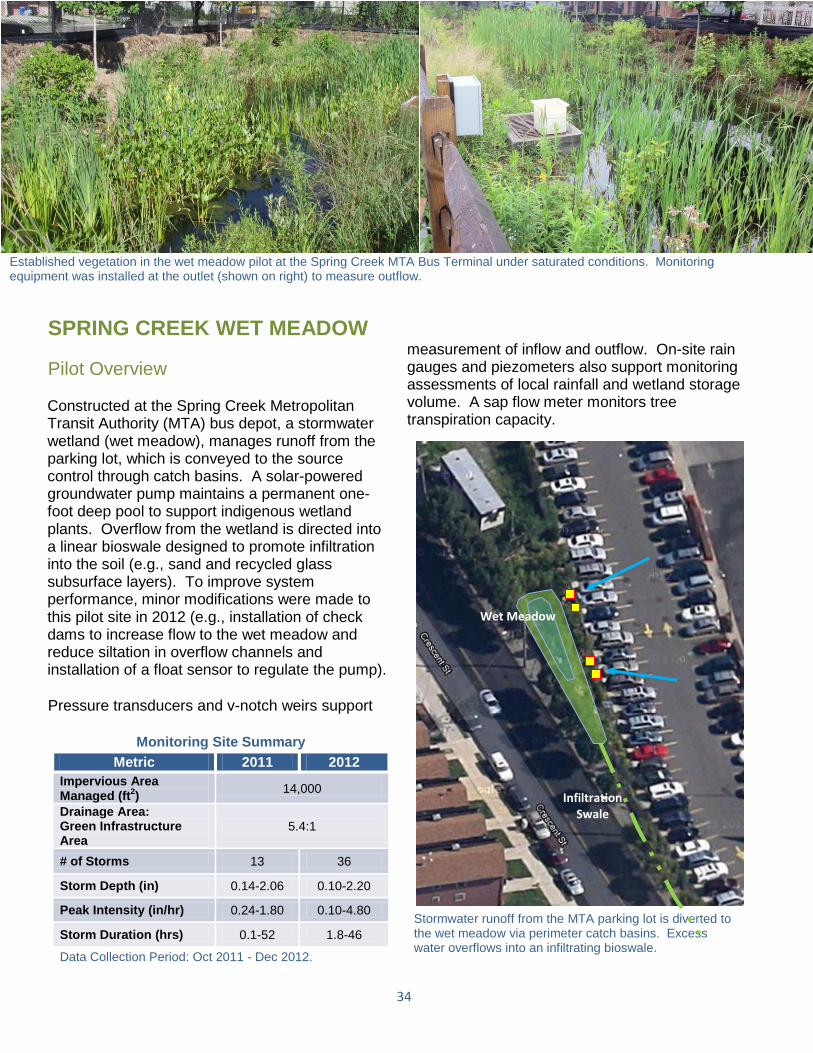
Established vegetation in the wet meadow pilot at the Spring Creek MTA Bus Terminal under saturated conditions. Monitoring equipment was installed at the outlet (shown on right) to measure outflow.
SPRING CREEK WET MEADOW
Pilot Overview Constructed at the Spring Creek Metropolitan Transit Authority (MTA) bus depot, a stormwater wetland (wet meadow), manages runoff from the parking lot, which is conveyed to the source control through catch basins. A solar-powered groundwater pump maintains a permanent one-foot deep pool to support indigenous wetland plants. Overflow from the wetland is directed into a linear bioswale designed to promote infiltration into the soil (e.g., sand and recycled glass subsurface layers). To improve system performance, minor modifications were made to this pilot site in 2012 (e.g., installation of check dams to increase flow to the wet meadow and reduce siltation in overflow channels and installation of a float sensor to regulate the pump).
Pressure transducers and v-notch weirs support
measurement of inflow and outflow. On-site rain gauges and piezometers also support monitoring assessments of local rainfall and wetland storage volume. A sap flow meter monitors tree transpiration capacity.
Monitoring Site Summary
Metric 2011 2012
Impervious Area Managed (ft
2)
14,000
Drainage Area: Green Infrastructure Area
5.4:1
# of Storms 13 36
Storm Depth (in) 0.14-2.06 0.10-2.20
Peak Intensity (in/hr) 0.24-1.80 0.10-4.80
Storm Duration (hrs) 0.1-52 1.8-46
Data Collection Period: Oct 2011 - Dec 2012.
Stormwater runoff from the MTA parking lot is diverted to the wet meadow via perimeter catch basins. Excess water overflows into an infiltrating bioswale.
Wet Meadow
Infiltration Swale
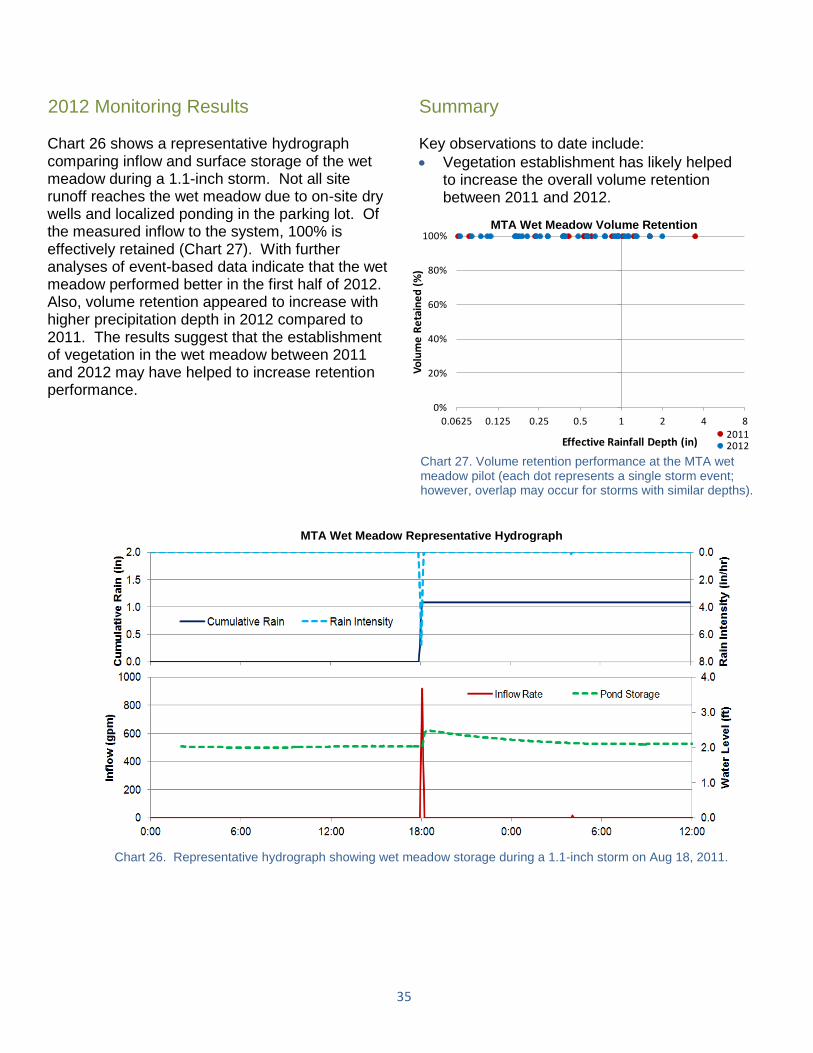
35
Chart 27. Volume retention performance at the MTA wet meadow pilot (each dot represents a single storm event; however, overlap may occur for storms with similar depths).
2012 Monitoring Results Chart 26 shows a representative hydrograph comparing inflow and surface storage of the wet meadow during a 1.1-inch storm. Not all site runoff reaches the wet meadow due to on-site dry wells and localized ponding in the parking lot. Of the measured inflow to the system, 100% is effectively retained (Chart 27). With further analyses of event-based data indicate that the wet meadow performed better in the first half of 2012. Also, volume retention appeared to increase with higher precipitation depth in 2012 compared to 2011. The results suggest that the establishment of vegetation in the wet meadow between 2011 and 2012 may have helped to increase retention performance.
Summary Key observations to date include:
Vegetation establishment has likely helped to increase the overall volume retention between 2011 and 2012.
Chart 26. Representative hydrograph showing wet meadow storage during a 1.1-inch storm on Aug 18, 2011.
MTA Wet Meadow Volume Retention
0%
20%
40%
60%
80%
100%
0.0625 0.125 0.25 0.5 1 2 4 8V
olu
me
Re
tain
ed
(%
)
Effective Rainfall Depth (in)20112012
MTA Wet Meadow Representative Hydrograph
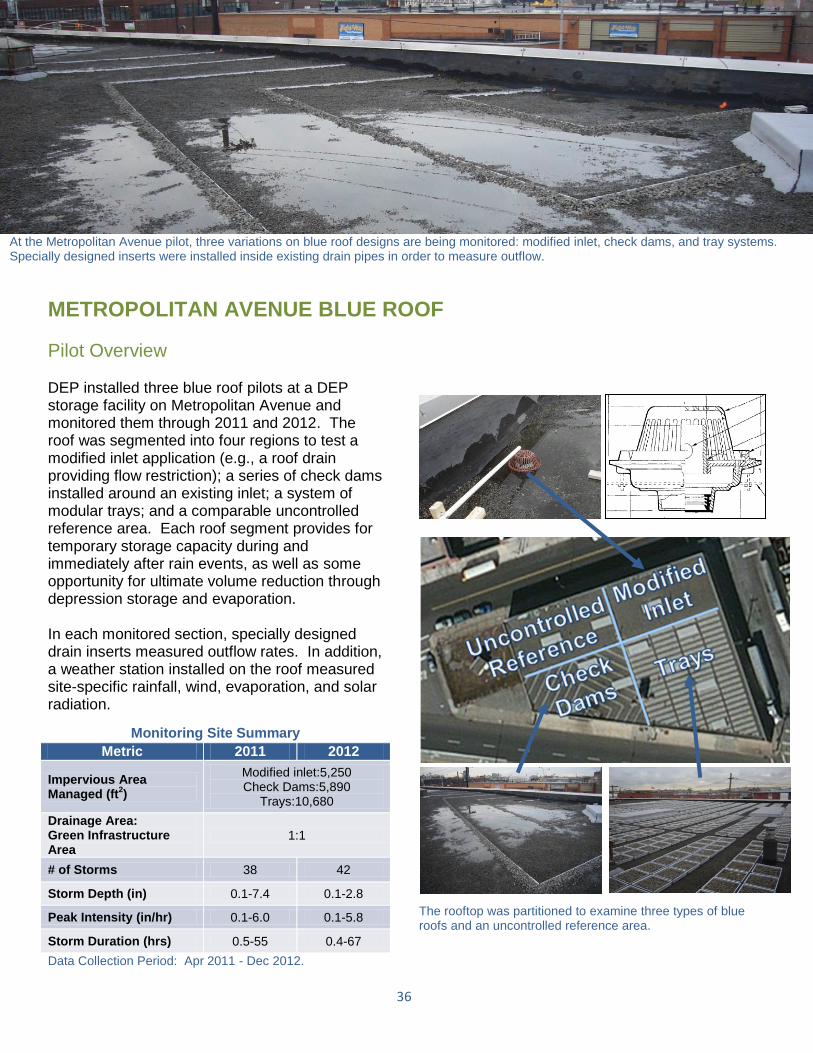
36
At the Metropolitan Avenue pilot, three variations on blue roof designs are being monitored: modified inlet, check dams, and tray systems. Specially designed inserts were installed inside existing drain pipes in order to measure outflow.
METROPOLITAN AVENUE BLUE ROOF
Pilot Overview DEP installed three blue roof pilots at a DEP storage facility on Metropolitan Avenue and monitored them through 2011 and 2012. The roof was segmented into four regions to test a modified inlet application (e.g., a roof drain providing flow restriction); a series of check dams installed around an existing inlet; a system of modular trays; and a comparable uncontrolled reference area. Each roof segment provides for temporary storage capacity during and immediately after rain events, as well as some opportunity for ultimate volume reduction through depression storage and evaporation. In each monitored section, specially designed drain inserts measured outflow rates. In addition, a weather station installed on the roof measured site-specific rainfall, wind, evaporation, and solar radiation.
The rooftop was partitioned to examine three types of blue roofs and an uncontrolled reference area.
Monitoring Site Summary
Metric 2011 2012
Impervious Area Managed (ft
2)
Modified inlet:5,250 Check Dams:5,890
Trays:10,680
Drainage Area: Green Infrastructure Area
1:1
# of Storms 38 42
Storm Depth (in) 0.1-7.4 0.1-2.8
Peak Intensity (in/hr) 0.1-6.0 0.1-5.8
Storm Duration (hrs) 0.5-55 0.4-67
Data Collection Period: Apr 2011 - Dec 2012.
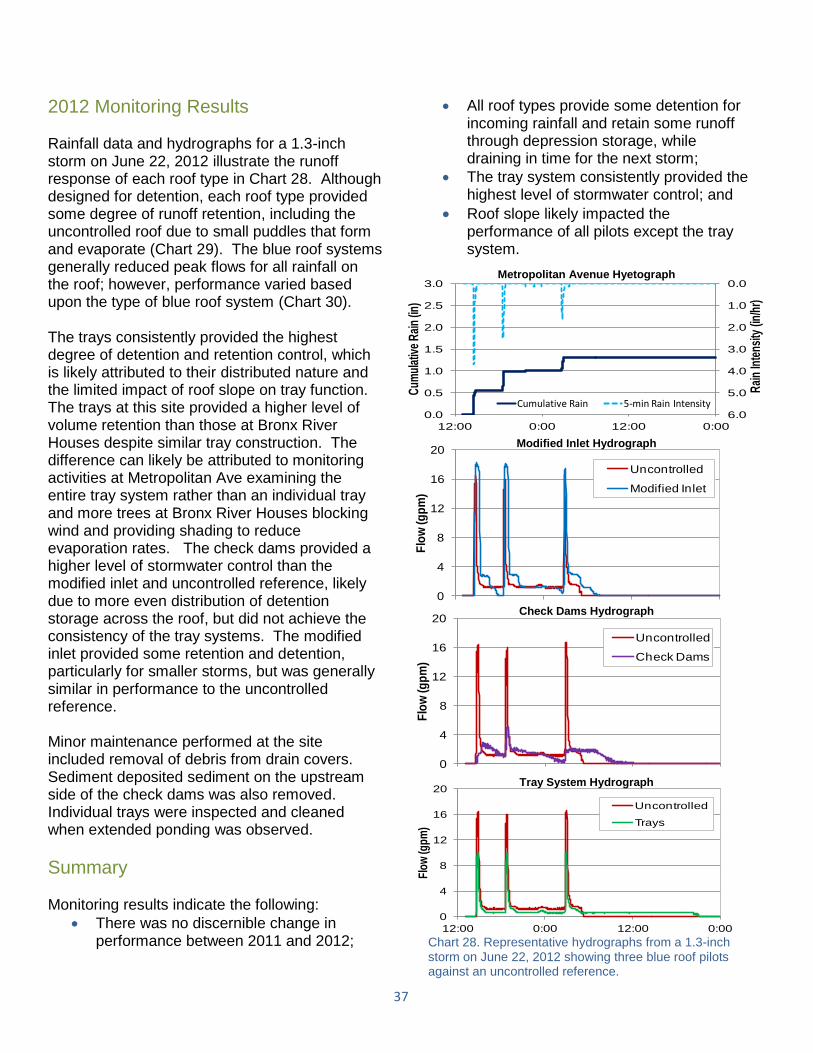
37
Chart 28. Representative hydrographs from a 1.3-inch storm on June 22, 2012 showing three blue roof pilots against an uncontrolled reference.
0.0
1.0
2.0
3.0
4.0
5.0
6.00.0
0.5
1.0
1.5
2.0
2.5
3.0
12:00 0:00 12:00 0:00
Rai
n In
tens
ity (i
n/hr
)
Cum
ulat
ive
Rai
n (in
)
0
4
8
12
16
20
12:00 0:00 12:00 0:00
Flo
w (g
pm
)
Uncontrolled
Modified Inlet
0
4
8
12
16
20
12:00 0:00 12:00 0:00
Flo
w (g
pm
)
Uncontrolled
Check Dams
0
4
8
12
16
20
12:00 0:00 12:00 0:00
Flo
w (g
pm
)
Uncontrolled
Trays
Metropolitan Avenue Hyetograph
Modified Inlet Hydrograph
Tray System Hydrograph
Check Dams Hydrograph
2012 Monitoring Results Rainfall data and hydrographs for a 1.3-inch storm on June 22, 2012 illustrate the runoff response of each roof type in Chart 28. Although designed for detention, each roof type provided some degree of runoff retention, including the uncontrolled roof due to small puddles that form and evaporate (Chart 29). The blue roof systems generally reduced peak flows for all rainfall on the roof; however, performance varied based upon the type of blue roof system (Chart 30). The trays consistently provided the highest degree of detention and retention control, which is likely attributed to their distributed nature and the limited impact of roof slope on tray function. The trays at this site provided a higher level of volume retention than those at Bronx River Houses despite similar tray construction. The difference can likely be attributed to monitoring activities at Metropolitan Ave examining the entire tray system rather than an individual tray and more trees at Bronx River Houses blocking wind and providing shading to reduce evaporation rates. The check dams provided a higher level of stormwater control than the modified inlet and uncontrolled reference, likely due to more even distribution of detention storage across the roof, but did not achieve the consistency of the tray systems. The modified inlet provided some retention and detention, particularly for smaller storms, but was generally similar in performance to the uncontrolled reference. Minor maintenance performed at the site included removal of debris from drain covers. Sediment deposited sediment on the upstream side of the check dams was also removed. Individual trays were inspected and cleaned when extended ponding was observed.
Summary Monitoring results indicate the following:
There was no discernible change in performance between 2011 and 2012;
All roof types provide some detention for incoming rainfall and retain some runoff through depression storage, while draining in time for the next storm;
The tray system consistently provided the highest level of stormwater control; and
Roof slope likely impacted the performance of all pilots except the tray system.
0.0
0.5
1.0
1.5
2.00.0
0.5
1.0
1.5
2.0
1:00 PM 3:00 PM 5:00 PM 7:00 PM
Rai
n In
ten
sity
(in
/hr)
Cu
mu
lati
ve R
ain
(in
)
Cumulative Rain 5-min Rain Intensity
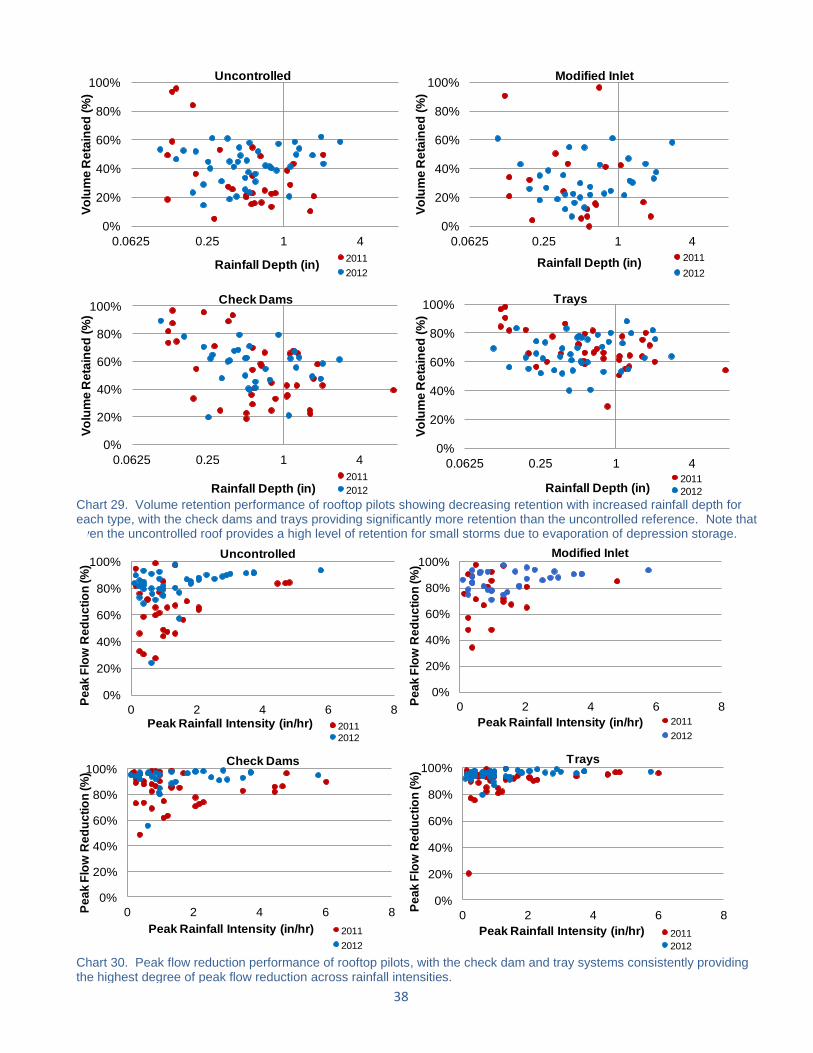
38
0%
20%
40%
60%
80%
100%
0.0625 0.25 1 4
Vo
lum
e R
eta
ine
d (
%)
Rainfall Depth (in)2011 Storms
2012 Storms
Uncontrolled
0%
20%
40%
60%
80%
100%
0.0625 0.25 1 4
Vo
lum
e R
eta
ine
d (
%)
Rainfall Depth (in)2011 Storms
2012 Storms
Modified Inlet
0%
20%
40%
60%
80%
100%
0.0625 0.25 1 4
Vo
lum
e R
eta
ine
d (
%)
Rainfall Depth (in)2011 Storms
2012 Storms
Check Dams
0%
20%
40%
60%
80%
100%
0.0625 0.25 1 4
Vo
lum
e R
eta
ine
d (
%)
Rainfall Depth (in)2011 Storms
2012 Storms
Trays
Chart 29. Volume retention performance of rooftop pilots showing decreasing retention with increased rainfall depth for each type, with the check dams and trays providing significantly more retention than the uncontrolled reference. Note that even the uncontrolled roof provides a high level of retention for small storms due to evaporation of depression storage.
Chart 30. Peak flow reduction performance of rooftop pilots, with the check dam and tray systems consistently providing the highest degree of peak flow reduction across rainfall intensities.
0%
20%
40%
60%
80%
100%
0 2 4 6 8
Pe
ak
Flo
w R
ed
uc
tio
n (%
)
Peak Rainfall Intensity (in/hr) 2011 Storms
2012 Storms
Trays
0%
20%
40%
60%
80%
100%
0 2 4 6 8Pe
ak
Flo
w R
ed
uc
tio
n (%
)
Peak Rainfall Intensity (in/hr) 2011 Storms
2012 Storms
Check Dams
0%
20%
40%
60%
80%
100%
0 2 4 6 8Pe
ak
Flo
w R
ed
uc
tio
n (%
)
Peak Rainfall Intensity (in/hr) 2011 Storms
2012 Storms
Modified Inlet
0%
20%
40%
60%
80%
100%
0 2 4 6 8
Pe
ak
Flo
w R
ed
uc
tio
n (%
)
Peak Rainfall Intensity (in/hr) 2011 Storms
2012 Storms
Uncontrolled

39
Monitoring of the blue roof (left), green roof (right) and an uncontrolled section (not shown) at PS 118.
PS 118 BLUE ROOF AND GREEN ROOF
Pilot Overview DEP monitored three roof sections at PS 118—a blue roof, a green roof, and an uncontrolled reference section—each approximately 3,500 square feet in size. The green roof was designed to detain precipitation in the 4-inch thick soil layer and to promote evapotranspiration through plant uptake and sun exposure. The blue roof consists of check dams made from perforated aluminum T-sections that are designed to slow the flow of runoff to existing drains. The uncontrolled reference area was simply monitored for comparison, with no modifications made. A full weather station, water level loggers, and drain inserts supported monitoring evaluations for both the green and blue roof pilots at PS 118, with a v-notch weir and water level logger used to quantify flow from the uncontrolled section.
Monitoring Site Summary
Metric 2011 2012
Impervious Area Managed (ft
2)
Green roof:3,500 Blue roof (check dams):3,500
Drainage Area: Green Infrastructure Area
1:1
# of Storms 22 33
Storm Depth (in) 0.19-6.63 0.09-2.82
Peak Intensity (in/hr) 0.24-3.60 0.12-2.92
Storm Duration (hrs) 0.5-60 0.5-54
Data Collection Period: July 2011 - Dec 2012.
Arrangement of the blue roof, green roof, and uncontrolled areas at the PS 118 pilot site.
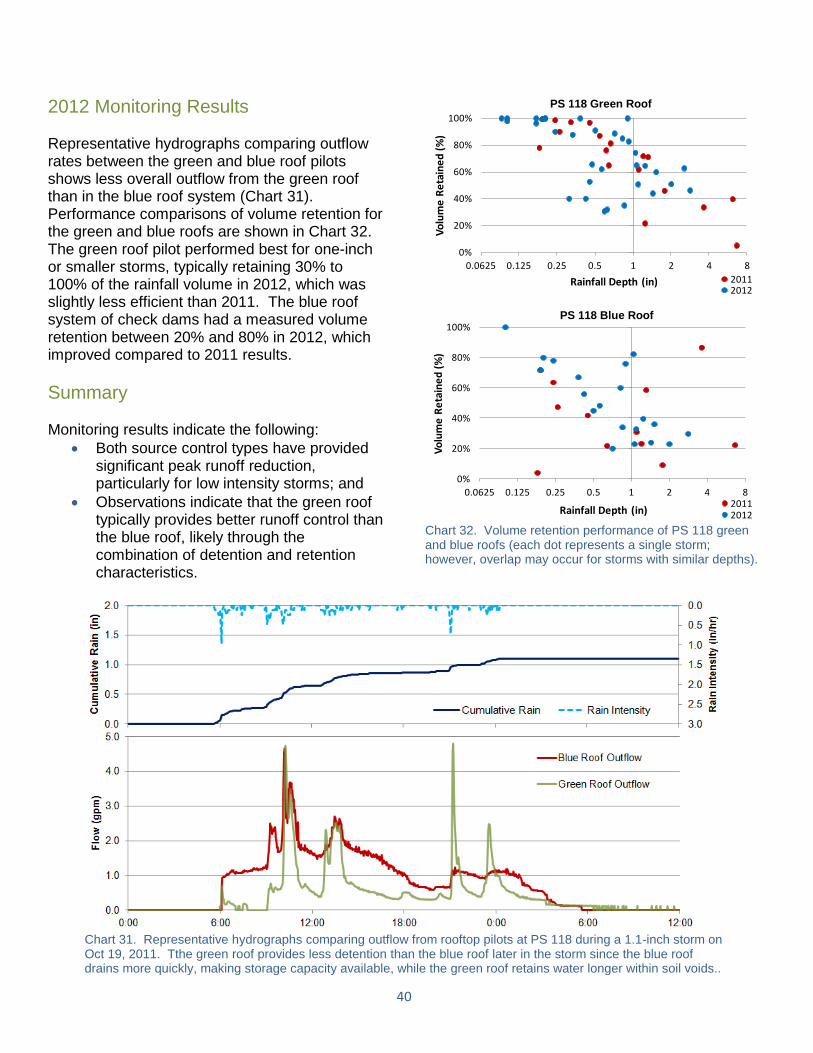
40
Chart 32. Volume retention performance of PS 118 green and blue roofs (each dot represents a single storm; however, overlap may occur for storms with similar depths).
2012 Monitoring Results Representative hydrographs comparing outflow rates between the green and blue roof pilots shows less overall outflow from the green roof than in the blue roof system (Chart 31). Performance comparisons of volume retention for the green and blue roofs are shown in Chart 32. The green roof pilot performed best for one-inch or smaller storms, typically retaining 30% to 100% of the rainfall volume in 2012, which was slightly less efficient than 2011. The blue roof system of check dams had a measured volume retention between 20% and 80% in 2012, which improved compared to 2011 results.
Summary Monitoring results indicate the following:
Both source control types have provided significant peak runoff reduction, particularly for low intensity storms; and
Observations indicate that the green roof typically provides better runoff control than the blue roof, likely through the combination of detention and retention characteristics.
Chart 31. Representative hydrographs comparing outflow from rooftop pilots at PS 118 during a 1.1-inch storm on Oct 19, 2011. Tthe green roof provides less detention than the blue roof later in the storm since the blue roof drains more quickly, making storage capacity available, while the green roof retains water longer within soil voids..
0%
20%
40%
60%
80%
100%
0.0625 0.125 0.25 0.5 1 2 4 8
Vo
lum
e R
eta
ine
d (
%)
Rainfall Depth (in)
Blue Roof
20112012
0%
20%
40%
60%
80%
100%
0.0625 0.125 0.25 0.5 1 2 4 8
Vo
lum
e R
eta
ine
d (
%)
Rainfall Depth (in)
Green Roof
20112012
PS 118 Green Roof
PS 118 Blue Roof

41
Water quality sampling equipment at a bioretention facility, drawing water from wells that capture runoff after it has infiltrated through the soil.
WATER AND SOIL QUALITY MONITORING Water and soil quality monitoring at select green infrastructure pilot locations supports a better understanding of the function of these source controls and their potential maintenance needs. Sampling began in 2011 and will continue through 2013. The primary objective of these monitoring efforts is to characterize water and soil quality at NYC Green Infrastructure pilots and compare results to those from studies elsewhere. Water quality monitoring efforts typically collect and analyze water from runoff entering a source control and in some cases water that has infiltrated through the soil or is leaving via an outlet structure (See page 44 for photos of sampling setups). Water quality samples are collected and composited at a regular interval to examine characteristics throughout a storm. Soil samples were collected during dry weather from the surface and/or one to two feet below surface to examine changes in composition and look for the potential buildup of pollutants.
Enhanced Tree Pit and Street-Side Infiltration Swale Monitoring During 2011 and 2012, water quality monitoring efforts at 11 enhanced tree pits and street-side infiltration swales examined 115 samples of runoff, along with 96 samples of water that had infiltrated below the soil surface. During this period, a total of 94 soil samples were collected from those sites.
Sampling Parameters
Water and soil quality parameters studied include:
Water quality analysis: o TDS – Total Dissolved Solids (mg/L) o TSS – Total Suspended Solids (mg/L) o TOC – Total Organic Carbon (mg/L) o TKN – Total Kjeldahl Nitrogen (mg/L) o TN – Total Nitrogen (mg/L) o TP - Total Phosphorus (mg/L) o Total Dissolved Metals (µg/L) o Total Metals (µg/L) o Total Petroleum Hydrocarbons (TPH) –
Gasoline (µg/L) o TPH – Diesel (µg/L)
Soil quality analysis: o TP – Total Phosphorous (mg/kg) o Total Metals (mg/kg) o TPH - Gasoline (mg/kg) o TPH - Diesel (mg/kg) o Salt Content
Not all parameters were evaluated for each collected sample due to factors such as limited sample volumes, sample holding times, or invalid laboratory analyses. The majority of water quality samples were analyzed for total dissolved solids, total suspended solids, total organic carbon, total kjeldahl nitrogen, total phosphorus, and total metals, with a limited fraction were analyzed for total nitrogen, total dissolved metals, and total petroleum hydrocarbons. The majority of soil samples were analyzed for total metals and salt content, with a limited fraction analyzed
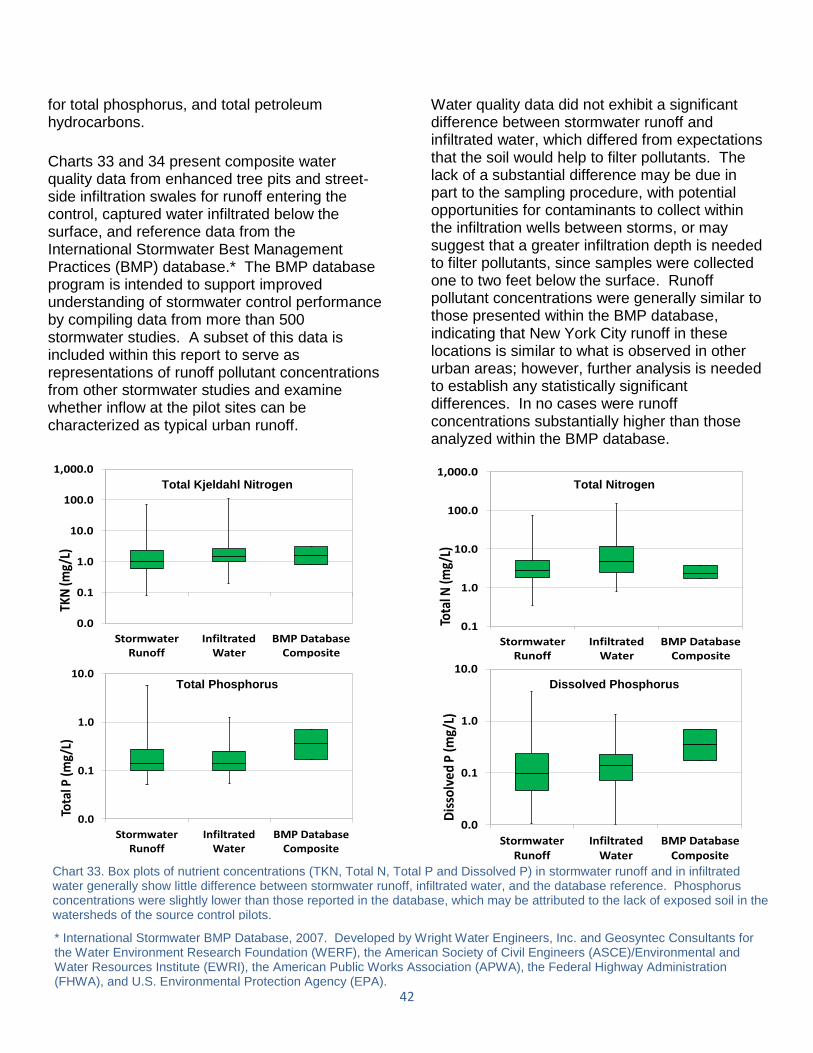
42
for total phosphorus, and total petroleum hydrocarbons.
Charts 33 and 34 present composite water quality data from enhanced tree pits and street-side infiltration swales for runoff entering the control, captured water infiltrated below the surface, and reference data from the International Stormwater Best Management Practices (BMP) database.* The BMP database program is intended to support improved understanding of stormwater control performance by compiling data from more than 500 stormwater studies. A subset of this data is included within this report to serve as representations of runoff pollutant concentrations from other stormwater studies and examine whether inflow at the pilot sites can be characterized as typical urban runoff.
Water quality data did not exhibit a significant difference between stormwater runoff and infiltrated water, which differed from expectations that the soil would help to filter pollutants. The lack of a substantial difference may be due in part to the sampling procedure, with potential opportunities for contaminants to collect within the infiltration wells between storms, or may suggest that a greater infiltration depth is needed to filter pollutants, since samples were collected one to two feet below the surface. Runoff pollutant concentrations were generally similar to those presented within the BMP database, indicating that New York City runoff in these locations is similar to what is observed in other urban areas; however, further analysis is needed to establish any statistically significant differences. In no cases were runoff concentrations substantially higher than those analyzed within the BMP database.
* International Stormwater BMP Database, 2007. Developed by Wright Water Engineers, Inc. and Geosyntec Consultants for the Water Environment Research Foundation (WERF), the American Society of Civil Engineers (ASCE)/Environmental and Water Resources Institute (EWRI), the American Public Works Association (APWA), the Federal Highway Administration (FHWA), and U.S. Environmental Protection Agency (EPA).
Chart 33. Box plots of nutrient concentrations (TKN, Total N, Total P and Dissolved P) in stormwater runoff and in infiltrated water generally show little difference between stormwater runoff, infiltrated water, and the database reference. Phosphorus concentrations were slightly lower than those reported in the database, which may be attributed to the lack of exposed soil in the watersheds of the source control pilots.
0.0
0.1
1.0
10.0
Stormwater Runoff
Infiltrated Water
BMP Database Composite
Tota
l P (m
g/L)
0.0
0.1
1.0
10.0
100.0
1,000.0
Stormwater Runoff
Infiltrated Water
BMP Database Composite
TKN
(mg/
L)
0.1
1.0
10.0
100.0
1,000.0
Stormwater Runoff
Infiltrated Water
BMP Database Composite
Tota
l N (m
g/L)
0.0
0.1
1.0
10.0
Stormwater Runoff
Infiltrated Water
BMP Database Composite
Dis
solv
ed P
(mg/
L)
Total Kjeldahl Nitrogen Total Nitrogen
Total Phosphorus Dissolved Phosphorus
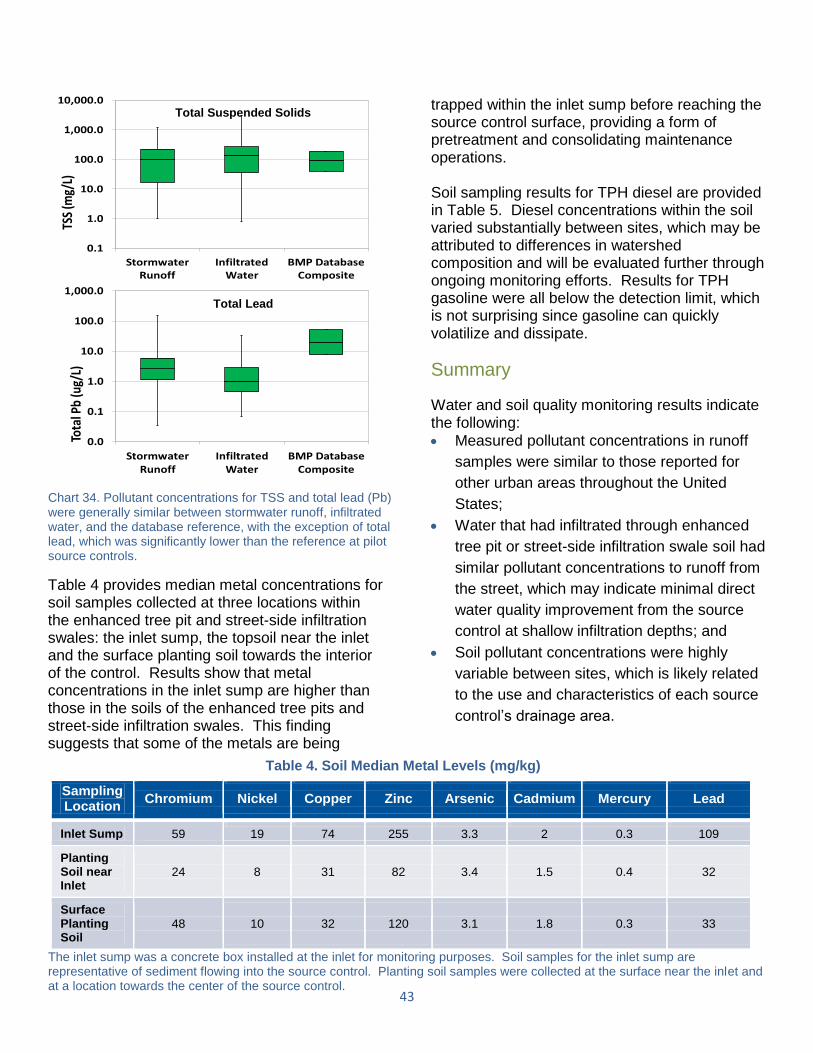
43
Table 6. Soil Median Metal Concentrations (mg/kg)
Sampling Location
Chromium Nickel Copper Zinc Arsenic Cadmium Mercury Lead
Inlet Sump 59 19 74 255 3.3 2 0.3 109
Planting Soil near Inlet
24 8 31 82 3.4 1.5 0.4 32
Surface Planting Soil
48 10 32 120 3.1 1.8 0.3 33
Table 4 provides median metal concentrations for soil samples collected at three locations within the enhanced tree pit and street-side infiltration swales: the inlet sump, the topsoil near the inlet and the surface planting soil towards the interior of the control. Results show that metal concentrations in the inlet sump are higher than those in the soils of the enhanced tree pits and street-side infiltration swales. This finding suggests that some of the metals are being
trapped within the inlet sump before reaching the source control surface, providing a form of pretreatment and consolidating maintenance operations. Soil sampling results for TPH diesel are provided in Table 5. Diesel concentrations within the soil varied substantially between sites, which may be attributed to differences in watershed composition and will be evaluated further through ongoing monitoring efforts. Results for TPH gasoline were all below the detection limit, which is not surprising since gasoline can quickly volatilize and dissipate.
Summary
Water and soil quality monitoring results indicate the following: Measured pollutant concentrations in runoff
samples were similar to those reported for
other urban areas throughout the United
States;
Water that had infiltrated through enhanced
tree pit or street-side infiltration swale soil had
similar pollutant concentrations to runoff from
the street, which may indicate minimal direct
water quality improvement from the source
control at shallow infiltration depths; and
Soil pollutant concentrations were highly
variable between sites, which is likely related
to the use and characteristics of each source
control’s drainage area.
Chart 34. Pollutant concentrations for TSS and total lead (Pb) were generally similar between stormwater runoff, infiltrated water, and the database reference, with the exception of total lead, which was significantly lower than the reference at pilot source controls.
0.1
1.0
10.0
100.0
1,000.0
10,000.0
Stormwater Runoff
Infiltrated Water
BMP Database Composite
TSS
(mg/
L)
0.0
0.1
1.0
10.0
100.0
1,000.0
Stormwater Runoff
Infiltrated Water
BMP Database Composite
Tota
l Pb
(ug/
L)
Total Suspended Solids
Total Lead
The inlet sump was a concrete box installed at the inlet for monitoring purposes. Soil samples for the inlet sump are representative of sediment flowing into the source control. Planting soil samples were collected at the surface near the inlet and at a location towards the center of the source control.
Table 4. Soil Median Metal Levels (mg/kg)
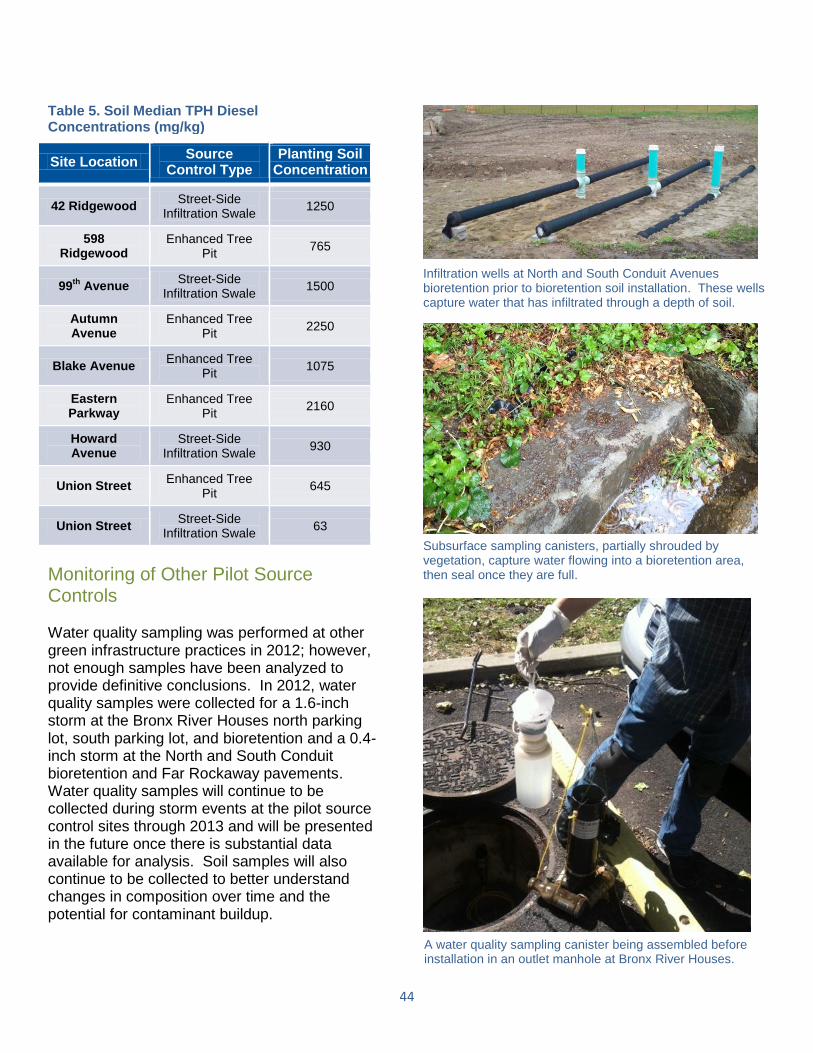
44
Monitoring of Other Pilot Source Controls Water quality sampling was performed at other green infrastructure practices in 2012; however, not enough samples have been analyzed to provide definitive conclusions. In 2012, water quality samples were collected for a 1.6-inch storm at the Bronx River Houses north parking lot, south parking lot, and bioretention and a 0.4-inch storm at the North and South Conduit bioretention and Far Rockaway pavements. Water quality samples will continue to be collected during storm events at the pilot source control sites through 2013 and will be presented in the future once there is substantial data available for analysis. Soil samples will also continue to be collected to better understand changes in composition over time and the potential for contaminant buildup.
Table 5. Soil Median TPH Diesel Concentrations (mg/kg)
Site Location Source
Control Type Planting Soil
Concentration
42 Ridgewood Street-Side
Infiltration Swale 1250
598 Ridgewood
Enhanced Tree Pit
765
99th
Avenue Street-Side
Infiltration Swale 1500
Autumn Avenue
Enhanced Tree Pit
2250
Blake Avenue Enhanced Tree
Pit 1075
Eastern Parkway
Enhanced Tree Pit
2160
Howard Avenue
Street-Side Infiltration Swale
930
Union Street Enhanced Tree
Pit 645
Union Street Street-Side
Infiltration Swale 63
Infiltration wells at North and South Conduit Avenues bioretention prior to bioretention soil installation. These wells capture water that has infiltrated through a depth of soil.
Subsurface sampling canisters, partially shrouded by vegetation, capture water flowing into a bioretention area, then seal once they are full.
A water quality sampling canister being assembled before installation in an outlet manhole at Bronx River Houses.
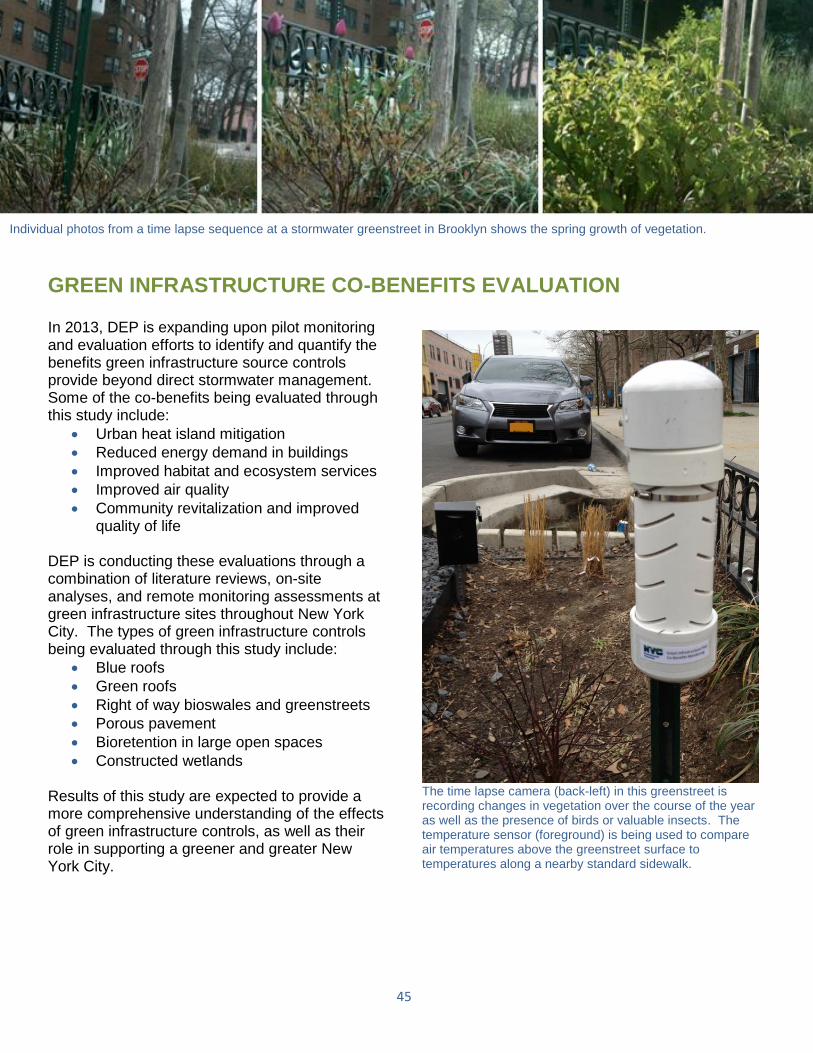
45
Individual photos from a time lapse sequence at a stormwater greenstreet in Brooklyn shows the spring growth of vegetation.
GREEN INFRASTRUCTURE CO-BENEFITS EVALUATION
In 2013, DEP is expanding upon pilot monitoring and evaluation efforts to identify and quantify the benefits green infrastructure source controls provide beyond direct stormwater management. Some of the co-benefits being evaluated through this study include:
Urban heat island mitigation
Reduced energy demand in buildings
Improved habitat and ecosystem services
Improved air quality
Community revitalization and improved quality of life
DEP is conducting these evaluations through a combination of literature reviews, on-site analyses, and remote monitoring assessments at green infrastructure sites throughout New York City. The types of green infrastructure controls being evaluated through this study include:
Blue roofs
Green roofs
Right of way bioswales and greenstreets
Porous pavement
Bioretention in large open spaces
Constructed wetlands Results of this study are expected to provide a more comprehensive understanding of the effects of green infrastructure controls, as well as their role in supporting a greener and greater New York City.
The time lapse camera (back-left) in this greenstreet is recording changes in vegetation over the course of the year as well as the presence of birds or valuable insects. The temperature sensor (foreground) is being used to compare air temperatures above the greenstreet surface to temperatures along a nearby standard sidewalk.

46
Researcher lowering a water quality sampler into a subsurface system at the Bronx River Houses.
SUMMARY AND NEXT STEPS
The 2012 Green Infrastructure Pilot Monitoring Report summarizes the performance of more than 30 pilot stormwater source controls, examining quantitative monitoring results such as volume retention, peak flow reduction and effective infiltration rates, and qualitative results, such as maintenance requirements and vegetation growth. Water and soil quality analyses for enhanced tree pits and street-side infiltration swales were also reviewed. In general:
Observations indicate that green infrastructure source controls are providing effective stormwater management, particularly for the one-inch storm;
All source controls have provided benefits for storms greater than one-inch, with specific impacts varying based upon location and the type of source control;
In many cases, bioretention source controls have fully retained the volume of one-inch storms they receive;
Porous pavement performance varied for different types. Flexipave
TM, although
providing 100% retention, has shown degradation in vehicle turning areas, while porous asphalt is structurally sound, but provides less runoff retention;
Although detailed characteristics of underlying soils are not available for all sites, observations suggest that the condition of these soils have an impact on
retention performance and overall source control functionality;
Source controls designed primarily for detention, such as the subsurface systems and blue roofs, can also retain substantial runoff volumes, supporting more effective stormwater control;
Performance generally improved in vegetated systems (e.g, bioretention facilities and Spring Creek Wet Meadow) between 2011 and 2012, likely due to the growth and establishment of plants which improve infiltration and evapotranspiration of stormwater runoff;
Performance monitoring and hydrant testing at inflow points has shown that simple curb cuts without localized depressions can bypass as much as 30% of incoming runoff;
Analysis of water quality data from enhanced tree pits and street-side infiltration swales suggests that pollutant concentrations from roadway runoff in NYC are similar to other urban areas; and
Further data analysis and development of performance metrics is expected to inform green infrastructure planning and future implementation efforts, as well as providing greater insight into potential CSO reductions from implementing these controls at a larger scale.

47
Future Monitoring Activities The following monitoring and analysis activities are anticipated in 2013:
Removing monitoring equipment at the Metropolitan Avenue blue roof and from the roof, north parking lot, and bioretention facilities at the Bronx River Houses;
Bringing Shoelace Park monitoring on-line for one year of performance monitoring;
Continued monitoring of the bioretention at North & South Conduit Avenues; porous asphalt at Far Rockaway, and the south parking lot at the Bronx River Houses through the Fall;
Continued monitoring of the Canarsie parking lot, Spring Creek wet meadow, and PS 118 blue and green roofs through 2014;
Additional water and soil quality sampling and analysis at enhanced tree pits and street-side infiltration swales, along with other pilot locations;
Monitoring right of way bioswales within the neighborhood demonstration projects; and
Collection and review of co-benefits monitoring data (i.e., urban heat island and energy impacts).


![Vegetating Green Infrastructure - michigan.gov€¦Vegetating Green Infrastructure. Outline [ green infrastructure vegetation needs to ... [ bioswales ] the myth of sheet flow protecting](https://static.fdocuments.in/doc/165x107/5af1d6177f8b9a572b9143f3/vegetating-green-infrastructure-vegetating-green-infrastructure-outline-green.jpg)