NUMERICAL AND EXPERIMENTAL … AND EXPERIMENTAL INVESTIGATION OF A ... work has been assessed on a...
12
NUMERICAL AND EXPERIMENTAL INVESTIGATION OF A NEW FILM COOLING GEOMETRY WITH HIGH P/D RATIO F. Montomoli, A. D’Ammaro S. Uchida Whittle Laboratory University of Cambridge, UK now at University of Surrey, Guildford, UK Whittle Laboratory University of Cambridge, UK Mitsubishi Heavy Industry Takasago, Japan ABSTRACT In order to improve the coolant surface coverage, in the past years new geometries have been proposed with higher lateral fan-shaped angle and/or greater inter-hole pitch distance (P/D). Unfortunately it is not possible to increase the fan angle or the pitch distance even further without inducing a coolant separation and a drop in the overall effectiveness. This study proposes an innovative design which improves the lateral coverage and reduces the jet lift off. The results have been validated by a combination of numerical and experimental analyses: the experimental work has been assessed on a flat plate using thermo chromic liquid crystals and the results have been confirmed numerically by the CFD with the same conditions. The CFD simulations have been carried out considering a stochastic distribution for the free stream Mach number and the coolant blowing ratio. The experimental and computational results show an increase in lateral averaged adiabatic effectiveness of +30% than the baseline until a distance downstream of 20 times the coolant diameter. 1. INTRODUCTION In order to improve the efficiency of gas turbines, the Turbine Entry Temperature has been increased to a level that exceeds the melting point of alloys used in HP nozzles, demanding advanced cooling techniques. The most effective of these techniques is the film cooling that generates a layer of coolant between metal surface and hot gases. To improve the performance of film cooling even further, several geometries have been proposed in the past. There are two major goals to be achieved: increase the coolant effectiveness and the lateral coverage. The influence of hole geometry on film cooling effectiveness has been studied the first time by Goldstein et al. [1]. They found that a better lateral coverage can be achieved using fan shaped holes. The authors hypothesized that the reduced momentum of the jet was due to the fact that the hole expansion reduces the coolant momentum and as consequence the jet lift -off. Detailed flow field measurements of Andreopulos and Rodi [2] first identified that the mechanism of lateral spreading is dominated by the so called "kidney vortices" or counter rotating vortex pair, CVP. This pair of counter rotating vortices moves the coolant away from the blade surface with a detrimental effect on the adiabatic effectiveness. If the coolant lift off is dominated by the kidney vortex, it is possible to improve the effectiveness in three ways: modifying the coolant shape to reduce the vorticity content in the CVP, dispose jets with opposite vorticity to minimize the CVP or uses trench cavities to suppress completely these vertical structures. Shaped holes design characterized the majority of early works on film cooling. Considering that kidney vortices are responsible of coolant lift off, Papell [3] proposed and tested a new shape with a cusp in the upstream edge. The author found that the cusp induces vortical structures within the film hole counter rotating to the kidney vortices, potentially increasing the lateral coverage and the adiabatic effectiveness. Makki and Jakubowski [4] found a similar improvement using laid back shaped hole instead of the classical round hole. Schmidt et al. [5] and Sen et al. [6] showed that with a 15° forward diffusing exit it is possible to improve the adiabatic effectiveness. The authors attributed to the exit geometry a crucial role in determining the adiabatic effectiveness and heat transfer coefficient. Bell et al. [7] performed an exhaustive study on the effect of hole shape on adiabatic effectiveness. They compared cylindrical simple angle (CYSA), laterally diffused simple angle (LDSA), laterally diffused compound angle (LDCA), forward diffused simple angle (FDSA) and forward diffused compound angle (FDCA). The best overall performances with large operating blowing ratios were offered by the laterally diffused holes with compound angle. In the second group there are all coolant concepts that use jets with opposite vorticity to reduce the strength of kidney vortices. In this family there are the anti-vortex coolant idea of Heidmann and Ekkad [8] or the opposite jets in tandem developed by [9]. In the third group there are all the studies [10] that uses trench cavities to eliminate the CVP and to obtain a more uniform lateral distribution effectiveness. Ideally the slot cooling configuration may be obtained.
Transcript of NUMERICAL AND EXPERIMENTAL … AND EXPERIMENTAL INVESTIGATION OF A ... work has been assessed on a...

NUMERICAL AND EXPERIMENTAL INVESTIGATION OF A NEW FILM COOLING GEOMETRY WITH HIGH P/D RATIO
F. Montomoli, A. D’Ammaro S. Uchida Whittle Laboratory
University of Cambridge, UK now at University of Surrey,
Guildford, UK
Whittle Laboratory University of Cambridge, UK
Mitsubishi Heavy Industry Takasago, Japan
ABSTRACT
In order to improve the coolant surface coverage, in the past years new geometries have been proposed with
higher lateral fan-shaped angle and/or greater inter-hole pitch distance (P/D). Unfortunately it is not possible to
increase the fan angle or the pitch distance even further without inducing a coolant separation and a drop in the
overall effectiveness.
This study proposes an innovative design which improves the lateral coverage and reduces the jet lift off.
The results have been validated by a combination of numerical and experimental analyses: the experimental
work has been assessed on a flat plate using thermo chromic liquid crystals and the results have been confirmed
numerically by the CFD with the same conditions. The CFD simulations have been carried out considering a
stochastic distribution for the free stream Mach number and the coolant blowing ratio.
The experimental and computational results show an increase in lateral averaged adiabatic effectiveness of
+30% than the baseline until a distance downstream of 20 times the coolant diameter.
1. INTRODUCTION
In order to improve the efficiency of gas turbines, the Turbine Entry Temperature has been increased to a
level that exceeds the melting point of alloys used in HP nozzles, demanding advanced cooling techniques. The
most effective of these techniques is the film cooling that generates a layer of coolant between metal surface and
hot gases. To improve the performance of film cooling even further, several geometries have been proposed in
the past. There are two major goals to be achieved: increase the coolant effectiveness and the lateral coverage.
The influence of hole geometry on film cooling effectiveness has been studied the first time by Goldstein et
al. [1]. They found that a better lateral coverage can be achieved using fan shaped holes. The authors
hypothesized that the reduced momentum of the jet was due to the fact that the hole expansion reduces the
coolant momentum and as consequence the jet lift-off. Detailed flow field measurements of Andreopulos and
Rodi [2] first identified that the mechanism of lateral spreading is dominated by the so called "kidney vortices"
or counter rotating vortex pair, CVP. This pair of counter rotating vortices moves the coolant away from the
blade surface with a detrimental effect on the adiabatic effectiveness. If the coolant lift off is dominated by the
kidney vortex, it is possible to improve the effectiveness in three ways: modifying the coolant shape to reduce
the vorticity content in the CVP, dispose jets with opposite vorticity to minimize the CVP or uses trench cavities
to suppress completely these vertical structures.
Shaped holes design characterized the majority of early works on film cooling. Considering that kidney
vortices are responsible of coolant lift off, Papell [3] proposed and tested a new shape with a cusp in the
upstream edge. The author found that the cusp induces vortical structures within the film hole counter rotating to
the kidney vortices, potentially increasing the lateral coverage and the adiabatic effectiveness. Makki and
Jakubowski [4] found a similar improvement using laid back shaped hole instead of the classical round hole.
Schmidt et al. [5] and Sen et al. [6] showed that with a 15° forward diffusing exit it is possible to improve the
adiabatic effectiveness. The authors attributed to the exit geometry a crucial role in determining the adiabatic
effectiveness and heat transfer coefficient. Bell et al. [7] performed an exhaustive study on the effect of hole
shape on adiabatic effectiveness. They compared cylindrical simple angle (CYSA), laterally diffused simple
angle (LDSA), laterally diffused compound angle (LDCA), forward diffused simple angle (FDSA) and forward
diffused compound angle (FDCA). The best overall performances with large operating blowing ratios were
offered by the laterally diffused holes with compound angle.
In the second group there are all coolant concepts that use jets with opposite vorticity to reduce the strength
of kidney vortices. In this family there are the anti-vortex coolant idea of Heidmann and Ekkad [8] or the
opposite jets in tandem developed by [9].
In the third group there are all the studies [10] that uses trench cavities to eliminate the CVP and to obtain a
more uniform lateral distribution effectiveness. Ideally the slot cooling configuration may be obtained.
Despite the majority of works presented aim to fight against the vorticity content in film cooling, the film
cooling/main stream interaction is heavily dominated by the local pressure gradients at the jet exit. As observed
by Pietrzyk et al [11] and Walters and Leylek [12], the coolant blockage on the main stream generates an
overpressure on the upstream edge and a non uniform lateral distribution of static pressure. The beneficial
impact of the pressure gradients near the coolant exit has been observed also by Na and Shih [30]. The authors
proposed to use a ramp to modify the incoming boundary layer and to improve the coolant effectiveness. This
alters the lateral spreading of the jet, as shown by CFD and experiments. In this work it has been decided to use
this idea to improve the lateral effectiveness of the baseline configuration and to develop a new geometry named
DBFS (Double Back Facing Step). The geometry presented in this work does not aim to increase the surface
coverage controlling the kidney vortices but modifying the static pressure gradients at the jet exit. The baseline
film cooling geometry is a classical layback fan-shaped hole [1] [2], as shown in the next paragraph. The major
difference is the aggressive P/D ratio, P/D=8, twice what used up to now. The new geometry DBFS, presented in
this paper, has been patented by Mitsubishi Heavy Industries.
One of the limitations of the “advanced” coolant geometries proposed in literature is that they work on well
calibrated laboratory experiments but not in a real gas turbine environment where their reliability maybe
questioned. For this reason an uncertainty quantification study has been carried out on this new geometry to
prove that the new geometry has a better performance than the baseline even considering the stochastic variation
of free stream Mach number and blowing ratio, M.
NOMENCLATURE
M Blowing Ratio= (𝜌𝑣)c/(𝜌𝑣)g
DR Density Ratio= 𝜌c/𝜌g
IR Momentum Flux Ratio= (𝜌𝑣2)c/(𝜌𝑣2)g
D diameter
L Hole length
P Hole Pitch
Inclination angle
T Temperature
P Pressure
𝜌 Density
�̇� Mass flow
𝑣 Velocity
𝜂 effectiveness
TLC Thermocromic Liquid Crystal
𝜀 Error in the measurement
PDF Probability Density Function
UQ Uncertainty Quantification
PCM Probabilistic Collocation Method
MCM Monte Carlo Method
Mean value
Standard deviation
Stochastic Mean of
σ Standard deviation from the statistics
y(x,ξ) Stochastic output response
ξ Vector defining random inputs
aj(x) Deterministic coefficients PCM
Ψj(ξ) Multi-dimensional orthogonal polynomials
wj(ξ) Quadrature weights
Lj(ξ) Lagrange polynomials
nv Number of variables
d Degree of the polynomial
Nav Available points
Np Minimum number of points
Subscripts
c Coolant
g Mainstream conditions
w Wall

0 Stagnation (total) conditions
2. EXPERIMENTAL SETUP The experimental rig is shown in Figure 1 and it has been designed to perform film cooling effectiveness
measurements at the Whittle Laboratory, University of Cambridge. The rig is a suck down wind tunnel, with a
rectangular cross section for the of internal coolant channel of 205x40 mm, whereas the main cross section is
250x245 mm and both are about 1000 mm long. Both channels are made with Perspex which has a very low
thermal conductivity, in order to model the adiabatic case, and it is transparent, allowing optical access. In order
to improve the quality of optical data, a glass window has been mounted over the experimental section.
Figure 1 Experimental rig layout
The rig was designed in order to consider the following effects:
Independent control in terms of velocity and orientation, for the mainstream and the coolant channel
Model the coolant channel as channel and not as a plenum, Bunker [13]
Model the real layout of gas turbines where the main flow is in cross flow with the coolant flow
Possibility to easily interchange geometries
The film cooling test rig consists of two channels: the main and the coolant, the layout is shown in Figure 1The
main flow has an extractor fan which extracts air at ambient condition and a valve is used to adjust the main
stream Mach number. The layout of the main stream is similar to the configuration shown by Chia Hui et al [29]
with the same contraction rate, bell-mouth shape and honeycomb size. Experimental traverse at x/D=-4.375
carried out by Chia Hui obtained the following properties for the boundary layer: thickness, /D = 3.41;
displacement thickness, ∗/D = 0.57; momentum thickness, BL/D = 0.40, shape factor, H = 1.44 with a free
stream turbulence intensity of Tu = 0.5 %. The coolant channel is a closed loop circuit where the recirculation
velocity is controlled by 4 blowers of 6 kW and the coolant mass flow that is discharged in the main stream is
supplied by two blowers of 3kW. However in the present study the recirculation of the coolant flow is not used
and the coolant channel behaves like a plenum.
a) Baseline b) Upstream back facing step c) DBFS Figure 2 Film cooling geometry, not in scale

The amount of coolant flow is controlled using a valve and it is subsequently measured by an orifice plate
designed according to the International Standard ISO 5167 , which has an uncertainty of 𝜀�̇�=±1.5% as
calculated according to the International Standard. To guarantee the uniformity of the inlet velocity profile, for
both channels the air travels through a contraction area and consequently it is straightened using a honeycomb.
The inlet stagnation pressures were measured with Pitot tubes while the corresponding static pressures were
measured with static pressure tappings. The pressure measurements have an uncertainty of 𝜀𝑃=±0.4% of 12⁄ 𝜌gvg
2. The stagnation temperatures were measured with T-type thermocouples which have an uncertainty of
𝜀𝑇=±0.3 °C.
Both channels can independently rotate, however the experiments have been ran with the main flow
perpendicular to the coolant. In order to measure the coolant effectiveness a temperature gradient is required
between the coolant and the main stream. As common practice in the open literature (Coat and Lock [14], Teng
et al. [15]), an inverse coolant design is used where the coolant flow is heated up. During the tests the “coolant”
is warmed up before entering in the recirculation channel in order to match the temperature operating conditions
for the Thermocromic Liquid Crystal (TLC). The acquisition camera is a Basler Scout GigE.
The uncertainty of the overall coolant effectiveness can be evaluated with the methodology proposed by
Moffat [16]. By applying the chain rule the maximum error is between 7% (for 𝜂 = 1) and 5% (for 𝜂 = 0). This
is obtained by:
𝜀𝜂𝑀𝐴𝑋 =
𝜀𝑇
𝑇0 𝑐 − 𝑇0 𝑔√𝑛2 + 1
Eq. 1
Where 𝜀𝜂
𝑀𝐴𝑋 is the maximum error of the overall coolant effectiveness, 𝜀𝑇 is the uncertainty in the mainstream
temperature and 𝜀𝑇 = 𝑛 ∙ 𝜀𝑇 .
The main parameter used for the experimental analysis is the coolant adiabatic effectiveness defined as:
𝜂 =𝑇0 𝑔 − 𝑇𝑤𝑎𝑙𝑙
𝑇0 𝑔 − 𝑇0 𝑐
Eq. 2
A value of 𝜂 = 1 represents a perfect film cooling performance, when the surface temperature is equal to the
coolant temperature; a value of 𝜂 = 1 means that the film cooling has no effect in reducing the wall temperature,
which is heated to the same temperature as the mainstream gas. The computational results are compared using
the mean value of the stochastic distribution of the adiabatic effectiveness, This parameter accounts the
stochastic variations of Mach number and blowing ratio, M.
3. COOLANT GEOMETRY The coolant baseline geometry 2a and the modified configurations b and c are sketched in figure 2 and the
geometrical characteristics are summarized in Table 1. The film cooling hole is a standard laidback fan-shaped
geometry. The main difference with the data presented in literature is the P/D ratio which is twice the normal
value of a standard configuration, P/D=8.
In order to improve the coolant effectiveness, two configurations have been studied and the details are
shown in figure 2b and c. Figure 2 b is the original geometry with a back facing step on the upstream edge, with
an height of D/2. The second geometry is named DBFS and has the back facing step in the middle of two
adjacent coolant holes. The starting point of the ramp is the same in both configurations.
Diameter, D [mm] 4
Lateral angle [deg] 18
Laidback angle [deg] 15
Duct inclination, [deg] 30
Length/D, L/D [-] 6
Pitch/D, P/D [-] 8
Table 1 Geometrical parameters

4. COMPUTATIONAL DETAILS The computational domain is shown in Figure for the baseline case. The baseline case has been studied
with an Uncertainty Quantification study by D’Ammaro and Montomoli [17].
The analysis of film cooling has been carried out using the commercial code ANSYS CFX. The software
solves the Reynolds-averaged Navier Stokes equations and uses the k-ω SST turbulence model to compute the
averaged turbulent stresses, more details can be found in Wilcox [18]. The Langtry-Menter transition model is
used [19] to model the impact of transition inside the coolant duct exit.
The computational mesh is generated by using a commercial semiautomatic mesh generator: CentaurTM
.
The zone in the core of the flow is tessellated using tetrahedrons, while regular prismatic layers cover solid
walls for accurate discretisation of the viscous boundary layer. A grid sensitivity study has been carried out by
using four meshes with 0.3, 0.6, 1 and 2.6 million of elements with 15 prismatic layers. The Richardson’s
extrapolation criterion explained by Roache [20] applied to this configuration gives a grid independency at
about 600,000 elements.
Figure 3 Computational domain and boundary
conditions
The denser mesh with 2.6 million of elements has been used in this work and it is represented along with its
boundary details in Figure , and in Figure there are some details of the mesh. The top of the main stream is
considered inviscid and all the viscous surfaces are adiabatic with no slip condition. A periodic boundary is
applied to lateral surfaces to model the row of coolant holes. The boundary conditions applied are the stagnation
temperature and pressure at inlet surfaces and the outlet static pressure. The inlet coolant, considering the low
internal velocity has been modeled as a plenum. Figure 4 shows a cut view of the coolant channel for the
configuration shown in figure 2b.As shown the mesh presents prismatic layers near the wall. A detailed view of
the coolant hole at the exit is also presented. A check on the y+ has been performed and its value was always
below one, which assures an accurate solution of the boundary layer [21].
Based on previous studies by Montomoli et al [22][23][24], the convergence of this particular configuration
was determined based on three criteria:
value of normalized residuals ( 10 E-6)
mass balance error ( 10 E-6)
relative variation of local adiabatic effectiveness ( 10 E-2)
Cut view of the computational grid with back facing

step
Figure 4 Detail of the mesh at the film cooling hole duct
5. UNCERTAINTY QUANTIFICATION In order to evaluate the reliability of the new geometry a stochastic study has been applied for the baseline
configuration and the DBFS. The details of the methodology have been already presented and are briefly
repeated here for clarity reasons. Several stochastic methods have been compared by D’Ammaro and
Montomoli [17] on the baseline geometry, such as Monte Carlo Lattice Sampling and Probability Collocation
Methods with different orders. A PCM technique with a second order accuracy and oversampling has been
chosen for the current study. study because in good agreement with a 4th
order solution and with the Monte
Carlo Lattice Based. Two stochastic inputs, free stream Mach number and blowing ratio,
M, have been used imposing a Gaussian distribution for both of them with a sigma of 20%, figure 3. In total 9
CFD simulations have been carried out for each case baseline and DBFS and Figure shows the computational
input matrix for each case.
The basic idea of collocation methods is to use a finite number of simulations to represent the stochastic
output (𝑦(𝒙 𝝃), where x is the input random variable). In order to use a finite number of data, some assumptions
must be taken on the shape of the probability output. In this way with ad hoc input values, it is possible to use a
finite number of simulations to evaluate the output statistics. It is the same problem of fitting a polynomial with
a specified number of points. The only difference is that the input points follow a probability distribution.
The number of these points is connected to the polynomial order and the number of variables used.
Moreover is possible to define different distributions of the collocation points and different approaches to obtain
the stochastic output.
The PCM uses the polynomial chaos expansion introduced by Wiener [25] to model a stochastic output
𝑦(𝒙 𝝃)y(x ξ):
𝑦(𝒙 𝝃) ≅ ∑ 𝑎𝑗(𝒙) ∙ 𝛹𝑗(𝝃)
𝑁 −1
𝑗=0
Eq. 3
In the Eq. 3, the stochastic output 𝑦(𝒙 𝝃)y(x ξ), is a combination of the coefficients 𝑎(𝒙) and the multi-
dimensional polynomials 𝛹𝑗(𝝃), which are function of the input random variable 𝝃. In this specific case the
output 𝑦(𝒙 𝝃) is the stochastic distribution of adiabatic effectiveness and the x are the input random variables
(free stream Mach number and blowing ratio, M). The choice of the polynomials is a consequence of the
probability distribution of the inputs variables. Xiu [26] showed that with a Gaussian distribution for

Figure 5 Stochastic space changing the number of input variables, nv
the input variables, as in this case, the Hermite polynomials must be used. These polynomials are used to define
𝛹𝑗(𝝃). The coefficients 𝑎(𝒙) are deterministic equations that must be evaluated. In order to find these
coefficients a linear system of Np equations has to be solved where Np is obtained using:
𝑁𝑝 =(𝑛𝑣 + 𝑑)!
𝑛𝑣! 𝑑!
Eq. 4
In Eq. 4, nv is the number of the input random variables (in this case 2) and d is the degree of the
polynomial (in this case 2). The input variables must be chosen to generate a set of Np independent equation.
The choice of these values is done using the zeros of the orthogonal polynomial of order (d+1)th
, these points
are called collocation points.
However, the total number of points that can be chosen to cover completely the space is 9, Nav=(d+1)nv (for each variable we can chose three points as shown in fig. 5). The minimum number of data to solve the
system is Np=6 (Eq. 4). Figure 5 shows how the choice of the collocation points change with the number of
input variables (with a second order polynomial, d=2). With one only input variable, nv=1, the available points
are equal to the minimum number of points required (Nav=Np), and those are the zeros of a 3rd
order Hermite
polynomial (𝜇 𝜇 − 𝜎√3 𝜇 + 𝜎√3). In the case of 2 variables, nv=2, all the available points are 9 (3x3) but,
from equation 2, only 6 are needed and 3 maybe discarded. The points that are kept are usually the data with
higher probability, maintaining the symmetry of the input matrix, Isukapalli et al. [27]. The result is shown in
fig. 5, where the Np collocation points are the black circles and the white circles are the available points not
needed.
6. NEW GEOMETRY DEFINITION: DBFS The new geometry proposed is called DBFS that stands for double backwards facing step and is shown in
figure 2c. As stated in the introduction the baseline geometry has an aggressive P/D ratio. Figure shows the
comparison between two coolant holes with the same P/D=8, but a different lateral expansion 12 and 18. In the
coolant nomenclature used in this work, the first number is the area ratio between inlet and outlet (4.3 and 5.6
respectively), the second number is the lateral expansion of the fan angle (12 and 18) and the third number is the
laid-back angle (15 in both cases). It is evident that the overall effectiveness drops increasing the lateral
expansion, figure 6. The same trend has been observed experimentally. The reason can be understood observing
the streamlines of Figure .
For high expansion angles and high P/D, the coolant separates and it is not able to stay attached to the side-
walls of the fan. As shown by the streamlines trajectory, the geometry with a smaller fan shaped angle (=12)
has a better efficiency than the one with greater lateral expansion (=18) because the coolant is able to stay
attached, covering a wider region. With high P/D the coolant effectiveness is mainly driven by the ability of the
coolant to cope with the diffusion angle of the duct and to stay attached to the side-walls of the duct fan.
As stated in the introduction, the pressure gradients at the hole exit have a strong influence on the coolant
distribution, as shown by Walters and Leylek [12]. In this work it has been decided to use these gradients to
control the coolant distribution and to improve the overall effectiveness. The main goal is to have a better lateral
coverage and this requires a low pressure zone between two adjacent coolant holes. In order to achieve this, a
small backward facing step is placed just over the upstream edge. The size of the step is half of the coolant
diameter, D/2. This geometry is very simple and can be realized using different distribution of the thickness of
the thermal barrier coating. Experimental tests, not shown in this work, proved that small variations of the step
high do not affect the overall results.

Figure 7 shows the CFD results with a backward facing step added in front of the coolant exit with
streamlines and coolant iso-surface. The isosurface correspond to the coolant temperature that gives 0.12 as
value of adiabatic effectiveness. As shown by the arrows, the coolant moves laterally, as expected. The pink
isosurface in Figure 7 confirms that the lateral coverage is improved even several diameters downstream the
exit. The pressure gradient introduced by the step has a very strong effect on the coolant distribution.
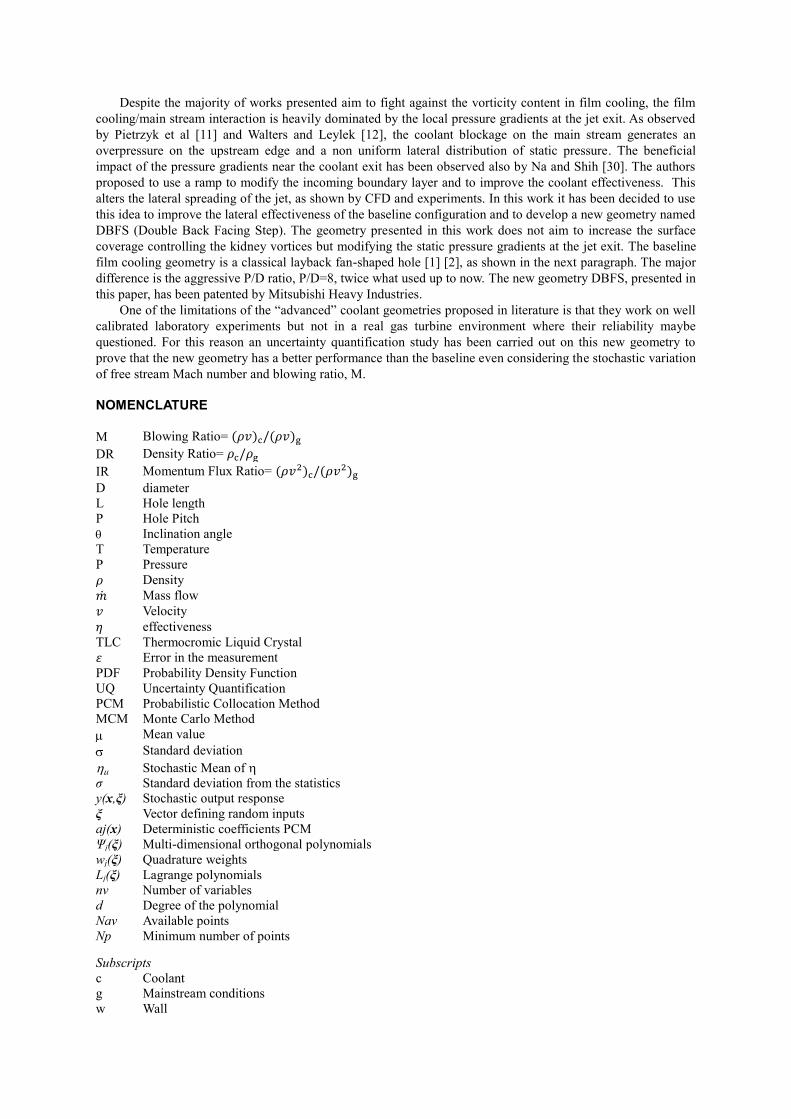
Figure 8 shows the comparison of non dimensional static pressure on a plane between two adjacent coolant
holes. The static pressure is non dimensional and the main stream stagnation pressure and the inlet kinetic
energy are used as reference. In the baseline case there is a region of high pressure just over the coolant exit and
this is generated by the interaction between the coolant and the main stream. Near the exit, due to the aggressive
P/D, the coolant in the baseline presents a lateral separation from the duct. The coolant jet is wide near the
downstream edge and becomes narrow before reaching the downstream edge. The blockage introduced by the
coolant on the main stream (isosurface in figure 7) generates a divergent section over rear part of the coolant
exit and this produces the increment in pressure. As shown in the figure 8 the back facing step introduces a
region of low static pressure near the exit and this allow the coolant to stay attached to the step. Laterally the
coolant is not only able to stay attached to the side-walls but it moves over the lateral edges.
Figure 6 M=1.12, Comparison of two laidback fan shaped holes with different fan angles, =12
and =18
Figure 7 Comparison between the baseline (left, top) and the baseline with a backwards facing step at the upstream edge (right, bottom). Bottom picture shows the temperature isosurface
corresponding to =0.12
baseline back facing step Figure 8 Comparison of pressure distribution on the periodic plane, baseline vs back
facing step
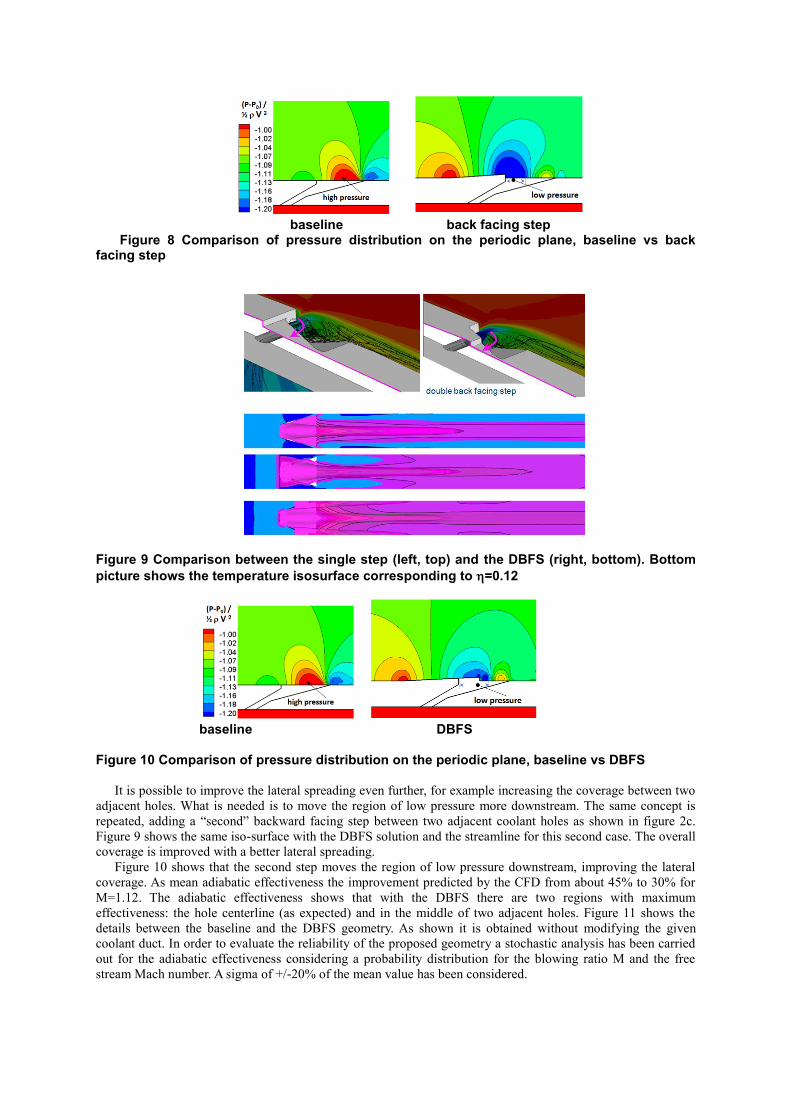
Figure 9 Comparison between the single step (left, top) and the DBFS (right, bottom). Bottom
picture shows the temperature isosurface corresponding to =0.12
baseline DBFS
Figure 10 Comparison of pressure distribution on the periodic plane, baseline vs DBFS
It is possible to improve the lateral spreading even further, for example increasing the coverage between two
adjacent holes. What is needed is to move the region of low pressure more downstream. The same concept is
repeated, adding a “second” backward facing step between two adjacent coolant holes as shown in figure 2c.
Figure 9 shows the same iso-surface with the DBFS solution and the streamline for this second case. The overall
coverage is improved with a better lateral spreading.
Figure 10 shows that the second step moves the region of low pressure downstream, improving the lateral
coverage. As mean adiabatic effectiveness the improvement predicted by the CFD from about 45% to 30% for
M=1.12. The adiabatic effectiveness shows that with the DBFS there are two regions with maximum
effectiveness: the hole centerline (as expected) and in the middle of two adjacent holes. Figure 11 shows the
details between the baseline and the DBFS geometry. As shown it is obtained without modifying the given
coolant duct. In order to evaluate the reliability of the proposed geometry a stochastic analysis has been carried
out for the adiabatic effectiveness considering a probability distribution for the blowing ratio M and the free
stream Mach number. A sigma of +/-20% of the mean value has been considered.

.
Figure 11 Comparison of , stochastic mean of adiabatic effectiveness
Figure shows the mean value of the stochastic output of the adiabatic effectiveness, for the two
configurations. The comparison using this new variable takes into account the stochastic variation of blowing
ratio, M and free stream Mach number. A gain of +30% is obtained until 20 diameters downstream the coolant
injection. All the solutions used for the PCM show the same gain relatively to the baseline case.
7. EXPERIMENTAL RESULTS The measurements presented were conducted at engine representative Reynolds number based on inlet
condition of the main flow and the diameter of the cooling hole, 𝑅𝑒𝑑 ≅ 4.5 ∙ 103, density ratio of DR=𝜌c/𝜌g ≅
0.88 and at blowing ratio M=(𝜌𝑣)c/(𝜌𝑣)g ≅ 1.12.
The Thermocromic Liquid Crystal technique (TLC) is based on crystals which selectively reflect incident
light and change color with the temperature. The crystals which have a temperature band higher than 1 °C are
called wide band liquid crystals, and in this work the band is equal to 20°C. The color of the surface are
collected using a high resolution camera as Red Green Blue (RGB) information. This information is
consequently converted into the Hue Saturation Intensity (HSI) space using the equations by Gonzalez and
Woods [28]. This conversion is needed since the hue is monotonic crescent as the temperature increases. Once
the temperature of the wall is known, it is possible to evaluate the adiabatic effectiveness of the film cooling
hole. Hence, the results of the baseline geometry have been validated against the results provided by MHI, at
similar conditions. Once the validation has been terminated, the DBFS geometry has been tested.
Figure 12 Comparison between baseline and DBFS
Figure shows the experimental comparison between the baseline case and the DBFS. As before the red line
represents the result for the baseline case, the blue line the DBFS solution. Numerical and experimental tests on
the proposed geometry show that the new configuration is reliable with an improvement of lateral coverage and
on the local adiabatic effectiveness.

The proposed configuration does not use the vorticity reduction in the CVP to improve the effectiveness but
the pressure gradients at the coolant exit. This approach seems much more powerful to obtain a more uniform
lateral coverage.
8. CONCLUSIONS In this work new coolant geometry has been proposed. The new geometry is able to give an improvement in
the coolant effectiveness of 30% in all the analyzed conditions, both experimentally and numerically. This
improvement is observed until 20 coolant diameters downstream. For the numerical assessment of the proposed
geometry, a Probability Collocation Method has been used. The PCM is used to test the reliability of the
configuration assuming a variation of +/-20% of the free stream Mach number and the coolant blowing ratio, M.
The experimental results confirm the numerical tests showing a gain of +30% minimum, until 20 diameters
downstream the hole exit. By using local pressure gradients is possible to have a better control of the coolant
spreading than acting on the counter rotating vortex pair.
REFERENCES [1] Goldstein R, Eckert E, Burggraf F.: Effects of hole geometry and density on three-dimensional film
cooling. International Journal of Heat and Mass Transfer. 1974;17(5):595--607.
[2] Andreopoulos J, Rodi W.: Experimental investigation of jets in a crossflow. J. Fluid Mech.
1984;138(1):93-127.
[3] Papell S. Vortex generating flow passage design for increased film-cooling effectiveness and surface
coverage. NASA STI/Recon Technical Report; 1984.
[4] Makki Y, Jakubowski G. An experimental study of film cooling from diffused trapezoidal shaped holes.;
1986.
[5] Schmidt DL, Sen B, Bogard DG. Film cooling with compound angle holes: adiabatic effectiveness.
Journal of turbomachinery. 1996;118(4):807-813.
[6] Sen B, Schmidt DL, Bogard DG. Film cooling with compound angle holes: heat transfer. Journal of
turbomachinery. 1996;118:800.
[7] Bell C, Hamakawa H, Ligrani P. Film cooling from shaped holes. Journal of heat transfer.
2000;122(2):224-232.
[8] Heidmann JD, Ekkad S. A novel anti-vortex turbine film cooling hole concept. Journal of
Turbomachinery. 2007 487-496.
[9] Ahn J, Jung I.S. and Lee J.S. Film Cooling from Two Rows of Holes with Opposite Orientation Angles:
Injectant Behavior and Adiabatic Film Cooling Effectiveness. Int. J. Heat Fluid Flow. 2003;24:91-99.
[10] Lu Y. , Dhungel A., Ekkad S. V. and Bunker R. S. Effect of Trench Width and Depth on Film Cooling
From Cylindrical Holes Embedded in Trenches. Journal of turbomachinery. 2009;131.
[11] Pietrzyk J. R., Bogard D. G., and Crawford M. E. Hydrodynamic Measurements of Jets in Crossflow for
Gas Turbine Film Cooling Applications. J. Turbomach 1989;111:139-145.
[12] Walters D. K. and Leylek J. H., A Detailed Analysis of Film-Cooling Physics: Part I - Streamwise
Injection With Cylindrical Holes. Journal of turbomachinery. 2000;122:102-112.
[13] Bunker RS. A Review of Shaped Hole Turbine Film-Cooling Technology. Journal of Heat Transfer.
2005;127(4):441-453.
[14] Coat C, Lock G. Flow visualisation experiments for turbine film cooling. Aeronautical Journal.
2004;108(1086):403-409.
[15] Teng S, Sohn DK, Han JC. Unsteady wake effect on film temperature and effectiveness distributions for
a gas turbine blade. Journal of turbomachinery. 2000;122(2):340-347.
[16] Moffat RJ. Describing the uncertainties in experimental results. Experimental thermal and fluid science.
1988;1(1):3-17.
[17] D'Ammaro A, Montomoli F. Uncertainty Quantification and film cooling. Computer and Fluids. 2012
[18] Wilcox DC. Turbulence modeling for CFD. DCW Industries; 2006.
[19] Langtry RB, Menter FR. Transition modeling for general CFD applications in aeronautics. AIAA paper.
2005;522:2005.
[20] Roache PJ. Quantification of uncertainty in computational fluid dynamics. Annual Review of Fluid
Mechanics. 1997;29(1):123-160.
[21] Van der Weide E, Kalitzin G, Schluter J, Medic G, Alonso J. On large scale turbomachinery
computations. CTR Annual Research Briefs 2005. 2005 139-150.
[22] Montomoli F, Massini M, Salvadori S. Geometrical Uncertainty in Turbomachinery: tip gap and fillet
radius. Journal of Computers and Fluids. 2010;46:362-368.
[23] Montomoli F., Massini M., Salvadori S., and Martelli F.
Geometrical Uncertainty and Film Cooling: Fillet Radii, J. Turbomach. 134, 011019 (2012)

[24] Adami P, Martelli F, Montomoli F. Numerical investigation of internal crossflow film cooling. In: GT-
2002-30171; 2002; Amsterdam.
[25] Wiener N. The homogeneous chaos. American Journal of Mathematics. 1938;60(4):897-936.
[26] Xiu D, Karniadakis GE. The Wiener--Askey Polynomial Chaos for Stochastic Differential Equations.
SIAM J. Sci. Comput. 2002;24:619-644.
[27] Isukapalli SS, Roy A, Georgopoulos PG. Stochastic Response Surface Methods (SRSMs) for
uncertainty propagation: application to environmental and biological systems. Risk Analysis. 1998;18(3):351-
363.
[28] Gonzalez RC, Woods RE. Digital image processing. 1992. Reading, Mass.: Addison-Wesley.
1996;16(716):8.
[29] Chia Hui L., Pullan G., Ireland P., Influence of film cooling hole angles and geometries on aerodynamic
loss and net heat flux reduction, ASME GT2011-45721
[30] Na S., Shih T. I-P, Increasing Adiabatic Film-Cooling Effectiveness by Using an Upstream Ramp, J
Heat Transfer, V 129, 464 (8 pages)