ntrs.nasa.gov · Ames Research Center ... development of a final conf1guration. ... This...
34
NASA Technical Memorandum 86782 NASA- TM-86782 19860000548 Evaluation of an Aerodynamic- Load Prediction Method on a STOL Fighter Configuration Joseph Katz August 1985 NI\S/\ National Aeronautics and Space Administration 3 0 1985 111111111111111111111111111111111111111111111 NF00045 https://ntrs.nasa.gov/search.jsp?R=19860000548 2018-08-08T00:24:54+00:00Z
Transcript of ntrs.nasa.gov · Ames Research Center ... development of a final conf1guration. ... This...

NASA Technical Memorandum 86782
NASA-TM-86782 19860000548
Evaluation of an AerodynamicLoad Prediction Method on a STOL Fighter Configuration
Joseph Katz
August 1985
NI\S/\ National Aeronautics and Space Administration
~ff' 3 0 1985
111111111111111111111111111111111111111111111 NF00045 --~
https://ntrs.nasa.gov/search.jsp?R=19860000548 2018-08-08T00:24:54+00:00Z

NASA Technical Memorandum 86782
Evaluation of an AerodynamicLoad Prediction Method on a STOL Fighter Configuration Joseph Katz, Ames Research Center, Moffett Field, California
August 1985
NI\S/\ National Aeronautics and Space Administration
Ames Research Center Moffett Field California 94035

EVALUATION OF AN AERODYNAMIC-LOAD PREDICTION METHOD
ON A STOL FIGHTER CONFIGURATION*
Joseph Katz Ames Research Center
Moffett Field, CA 94035
*To be published concurrently as NASA TM-86732.

A
bref
CD
CL
C2,
Cm
Cp
CT
cref
c(y)
d
h
m
p
a
surface area
wwg span
drag coefficient
lift coeffic1ent
local-11ft coeff1cient
p1tch1ng moment coeff1c1ent
pressure coefficient
thrust coeff1c1ent
w1ng-reference chord
local chord
NOMENCLATURE
distance between thrust vector and pitch1ng-moment aX1S
ground clearance
mass-flow rate
pressure
w1ng-reference area
thrust
a1rspeed
veloc1ty at the exhaust-jet outer boundar1es
chordW1se coordinate
long1tudinal locat1on of reference point for moment calculat10ns
center of pressure
spanwise coord1nate
angle of attack
111

p a1r dens1ty
Subscripts
( )c canard
( )ex eXit
)f fuel
)In 1nlet
)T thrust
( )w wing
)0 at geometr1c angle of attack = 0
)00 free-stream condition
1V

EVALUATION OF AN AERODYNAMIC-LOAD PREDICTION METHOD
ON A STOL FIGHTER CONFIGURATION
Joseph Katz
Ames Research Center
SUMMARY
A three-dimensional panel method was used to compute the aerodynam1c loads on a large-scale, powered w1nd tunnel model. The size of the computation grid was selected such that turnaround t1mes, on present computers, rema1ned satisfactory. Hith this constraint, the STOL aircraft configuration was modeled and the capab1lities and limitations of the pred1ction method were 1nvestigated. After th1S study, a simllar numerical model was established for a forward-swept-wing a1rcraft conf1gurat10n which is planned for large-scale, low-speed testing. The resulting aerodynamic-load predictions are discussed and will be utilized, together w1th the future experimental results, to obtain a broader val1dation of th1S method as well as to reduce the necessary Slze of the matrix of the test parameters.
INTRODUCTION
Accurate predict10n of the performance and stabil1ty of aircraft and high-speed veh1cles by the use of exper1mental and analyt1cal methods 1S essential for rel1able development of a final conf1guration. As the 1n1t1al geometry of the vehicle 1S establ1shed, 1tS aerodynam1c character1st1cs have to be continually evaluated. Wind tunnels take an act1ve role 1n the development of complex aircraft shapes such as a V/STOL (vertical short takeoff and land1ng) conf1gurat1on, so that suff1c1ent fullscale deta1ls are extracted for an accurate assessment of the veh1cle's aerodynam1c characteristics. Such a level of deta1l1ng 1S needed to invest1gate low-speed and h1gh-angle-of-attack condit1ons, to account for Reynolds number effects, and to evaluate the influence of the smaller geometr1c details. The procedure 1S long and costly, and at several stages of development these large or full-scale tests are needed to invest1gate fl1ght cond1tions such as land1ng, takeoff, and translt1on. Therefore, inclusion of advanced pred1ction methods lnto the varlOUS phases of a development program has the potential to shorten both model-design and w1nd tunnel test t1me. This integration can be accomplished by computing data for the prelim1-nary performance estimation, for the structural design of the model, and for plann1ng the matrix of the test parameters. Part of the results of these computations are in the form of numerical flow visual1zation. Streamllne plots, for example, may provlde an explanation for flow features (as 1n the case of vortex flows) and can pOint toward poss1ble 1mprovements in a redes1gn exercise of the model geometry (e.g., in the case of undeS1rable vortex interactions with lifting surfaces).

For the low-speed flow reg1me, aerodynamic load pred1ct10n methods already have been developed to the point where turnaround times on today's computers allow an almost-real-time computation. In this report, a val1dation of one of these methods 1S presented. In the first part of this investigation, computed data were compared w1th full-scale wind tunnel results for a V/STOL aircraft configuration. Then, aerodynamic-load pred1ct1ons were computed for a future V/STOL model, Wh1Ch lS now under construction and w111 be tested 1n the full-scale w1nd tunnel. This val1dation procedure ensures that predicted results are computed w1thout pr10r knowledge of the measured quant1ties.
DESCRIPTION OF THE PREDICTION METHOD
The flu1d-dynam1cs equations involved in solving the pressure field of a complex V/STOL aircraft are basically nonlinear. This nonl1near1ty 1S a result of the viscous terms associated with flow separation, vortex flows, propuls10n jets, boundary layers, and rec1rculating flows caused by the interact10n of Jets and ground. A complete solutIon of these equations for a real aircraft shape w1l1 requ1re an elaborate and time-consuming (ref. 1) computer code (compared w1th 11near1zed methods). On the other hand, during the past 20 years exper1ence has been ga1ned 1n solving the linear port1ons of these fluid dynamic equations (refs. 2-12). These solutions pred1ct the flu1d dynamics of 1nV1scid reg10ns Wh1Ch 1nclude the Ilft1ng properties of nonseparated wings in subson1c or supersonic flows (refs. 4,7,8). An addit10nal advantage of the potential problem emerges from the use of Green's theorem (ref. 9): an 1ntegral equation 1S obtained, Wh1Ch 1S solved on the body's boundaries only, rather than a solution spann1ng the whole flu1d reg1on. A comprehens1ve descr1ption of the mathematical principles and of the requ1red numer1cal schemes of these methods are prov1ded 1n references 7-12. These methods were extended to 1nclude more complex s1ngular1ty elements (refs. 4,12), 1nteract1on w1th viscous boundary-layer solutions, wake rollup relaxations, and Jet models (ref. 13). The code VSAERO (refs. 5,13), used 1n the current invest1gat10n, included most of the aforementioned features and was found to be among the most effic1ent (ref. 6), 1n terms of computat10n t1me.
PANELED WIND TUNNEL MODEL
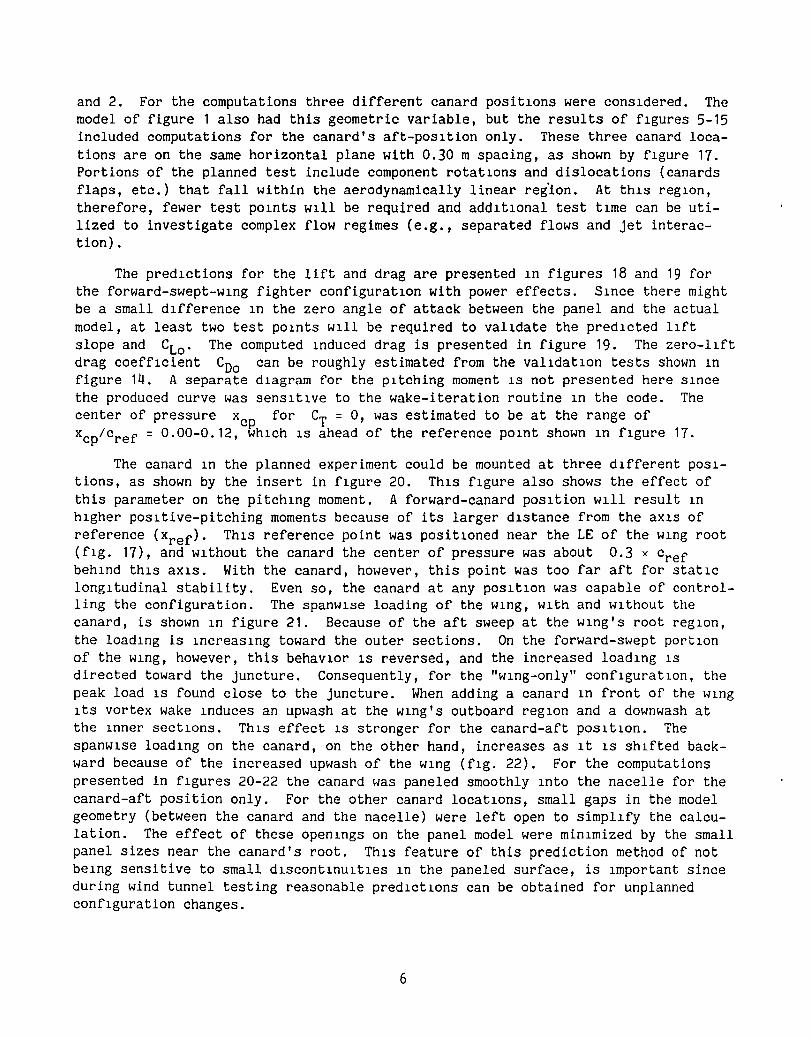
Once the computation method was selected, 1ts capab111ty and Ilm1tations were investigated via a compar1son w1th exper1mental results. The full-scale w1nd tunnel model that was used for this validation is shown in figure 1. Additional geometr1c details on the model are presented in figure 2 and 1n references 14-17. The panel model, for this configuration, cons1sted of 767 panels and computation t1mes were about 60 sec on a CRAY XMP computer, for one run through the program. The flow 1n the 1nlet was modeled by spec1fY1ng an inward, normal veloc1ty of about 1.2 t1mes the free-stream velocity. More complex inlet flows already have been modeled uS1ng this method (ref. 13). Because of the large increase in the required number of
2

panels and because of the longer computational time, thiS fine detailing was not used here. The exhausting jets were modeled by encloslng the high-energy jet region with a linearily vary1ng doublet sheet, equivalent to a constant-strength vortex sheet, as shown 1n f1gure 3. The strength of this doublet sheet was obtained by prescribing the correspond1ng 1nner and outer jet veloc1ties. In the actual tests (refs. 14-16) the jet eng1ne was operat1ng at a constant setting and the thrust coefficient was varied by chang1ng the wind tunnel airspeed. The eng1ne-exhaust total temperature was about 890 K with an average (inner) veloc1ty of about 457 m/sec. For a thrust coeff1c1ent of unity thiS w1ll Y1eld to a velocity rat10 (Vex/Vm ) of almost 11. To account for the correct amount of vort1city generated at the shear layer, a density correction of 2.9 was applied because of th1S temperature difference (refs. 14-16) (based on test conditions). Therefore, the velocity ratios used 1n th1S report were 3.42, 3.70, 4.53, 5.31, and 5.90 for the corresponding thrust coeff1clents of 0.9, 1.0, 1.4, 1.8, and 2.0, accordingly. The outer veloc1ty (Vout ) 1n f1gure 3 was matched w1th the computed external velocity and was close to (Vout/Voo = 1.2). Th1S model was investigated and used for var10US applications (refs. 13,18); however, it lacks a detailed simulat10n of the jet/free-stream entrainment.
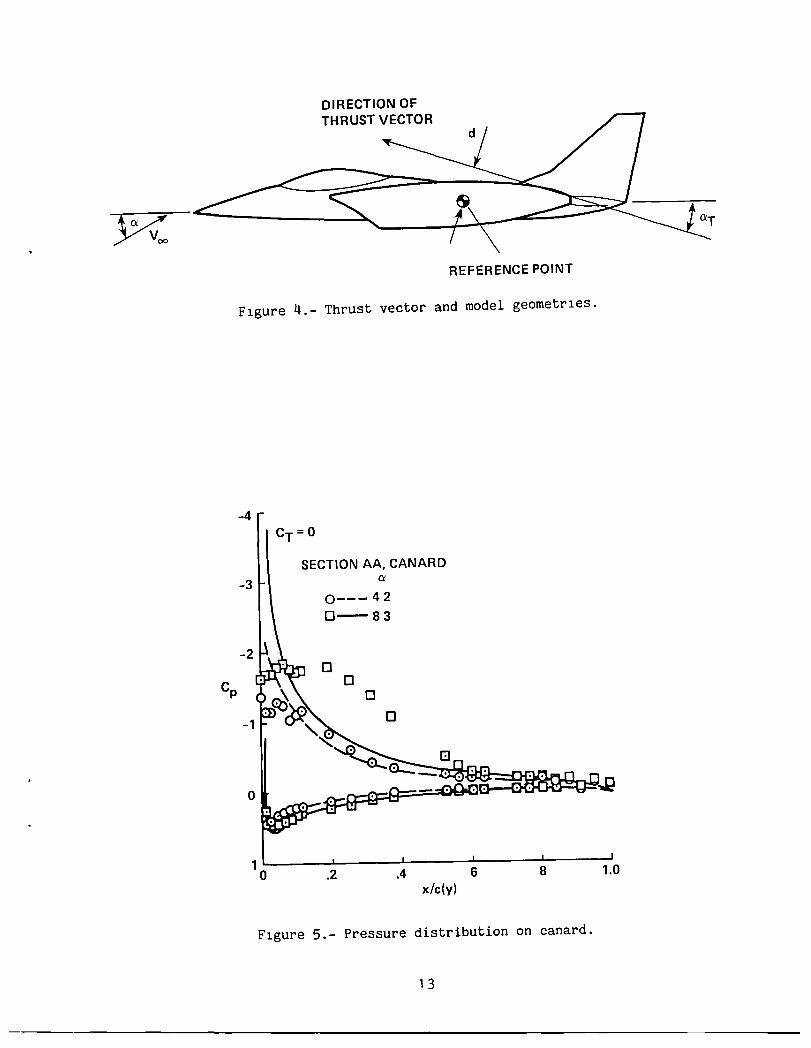
To account for the contribution of the jet engines to the aerodynamic forces and moments, the formulat1on presented 1n equation (1) is used. Here aT 1S the angle between the jet vector and the a1rcraft geometr1cal aX1S and d 1S the diStance between th1S vector and the reference point (center of mass) as shown in f1gure 4.
~CLT = CT sln(a + aT)
6CDT = -CT COs(a + aT)
6CmT = -CT d/cref
(1)
AddltlOnally, a distwct10n has to be made between the "Jet" and "pressure" components of the thrust force. From slmpl1fied one-d1mensional momentum cons1derat1ons the thrust of an lsolated jet englne includes the followlng terms:
T = 1 V(pV·dA) + nacelle
f P·dA nacelle
= -(m1'n + mf)Vex - m1'nVi'n + (P - P)A - (P - P )A (2) ex m ex ln m ln
The last two terms, WhiCh are a result of the pressure 1ntegral, are actually included 1n the numerical computation. When accounting for the thrust of the jet (e.g., CT = 1), however, all the terms of equation (2) are lncluded. To avoid the lncluslon of these terms twice, the results of the pressure lntegral over the jeteng1ne nacelle, [ ]nacelle' has to be subtracted from the overall pressure integration results, [ ]VSAERO:
3

CL CL ~CL ~CLT
CD = CD ~CD + ~CDT (3)
C C ~C 6CmT m model m VSAERO m nacelle
COMPARISONS WITH EXPERIMENTS
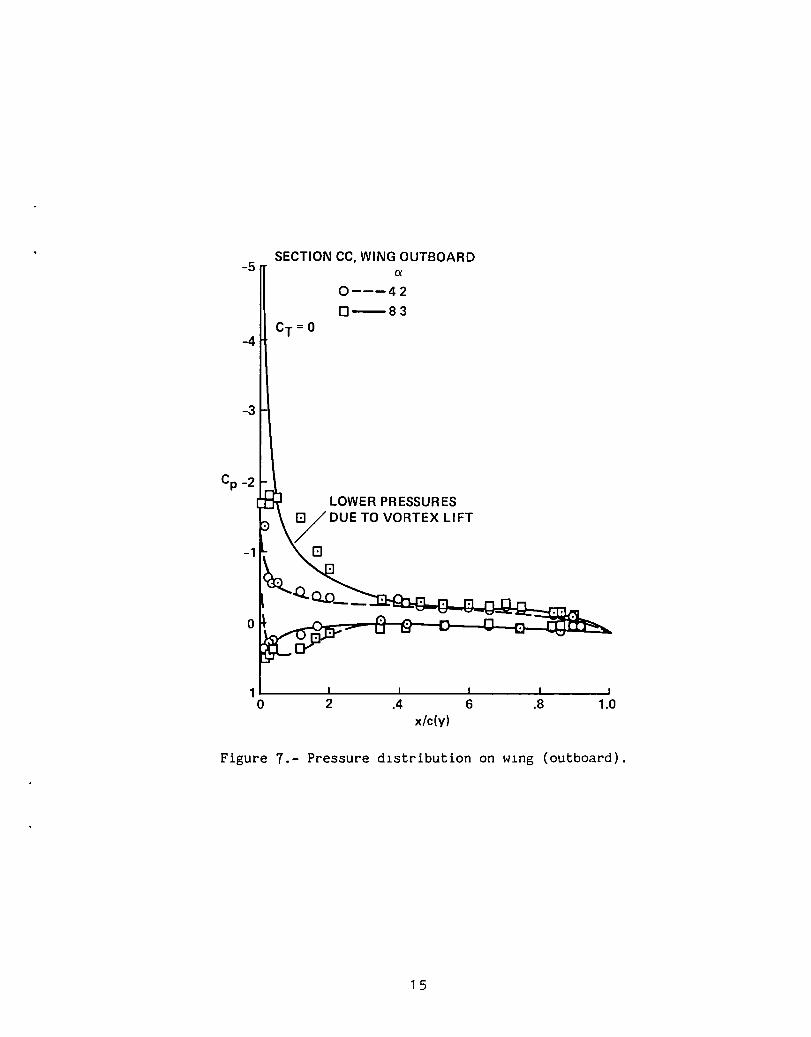
Evaluation and validation of the prediction method was obta1ned by compar1ng the computed results with the experimental measurements of references 15 and 16. In these wind tunnel tests, apart from the integral forces, pressure data were also recorded along the cross sections (A-A, B-B, C-C, and D-D) shown 1n f1gure 2. These data, together with the computed pressure values, are presented 1n f1gures 5-8 without power effect and in figures 9-12 with the effect of the propuls1on Jets. The pressures on both upper and lower surfaces of the canard are presented in f1gure 5. At the smaller angle of attack there is a good agreement between the measured and computed data, excludIng a limited area at the upper surface of the lead1ng edge (LE). In this reg10n the potent1al pred1ct1ons overest1mate the suction peaks, which are limited by the viscous effects. At the h1gher angles of attack, a LE vortex 1S developed at the canard's upper surface and a larger deviation 1n the pressure d1stribut1on is observed. Since the canard sweep-back angle is only 45°, the resulting vortex effect is small (ref. 19), and 1n spite of this d1screpancy the overall 11ft is approximated quite well. Th1S behavior is less pronounced in the case of the wing that has an aft-sweep of 40°. Therefore, for the 1nboard section (B-B in f1g. 2), the measured results 1n figure 6 fall closer to each other than for the w1ng's outboard sect10n C-C (fIg. 7), where the influence of LE separation (refs. 14-16) caused a small offset between the experiment and the pred1ctlon. The compar1son of the pressure data, in the case of the strake (fig. 8) exhib1ts similar behav1or. At the larger angles of attack, traces of LE separat10n are agaIn evident and 1nclusion of LE vortex models (e.g., refs. 20,21) m1ght 1mprove the pred1cted pressure distrIbutIons.
The effect of power (CT = 1.4) on the canard's pressure d1str1but1on is small, w1th a lImited increase of the vortex 11ft at the front section of the a1rfoll (f1g. 9). At the wing's 1nboard (fIg. 10) and outboard sect10ns (f1g. 11), the pred1ction is satisfactory and aga1n a Ilm1ted 1ncrease in the 11ft of the sect10n caused by power 1S detected. Also, 1n the case of the strake (f1g. 12), the changes in both measured and calculated pressures are smaller; therefore, a good pred1ct1on of the 11ft-curve slope 1n the nonseparated reg10n 1S obta1ned (f1g. 13). When computing the "power-on" effects, a Jet angle (aT in eq. (1) and 1n f1g. 4) of 8.5° was assumed. Th1S 1nclination was a result of the exhaust nozzle inner geometry as shown in references 14 and 16. The exper1mental data on f1gure 13 ind1cate that WIng stall is delayed to h1gher angles of attack for the power-on condItions. Such a nonlinear feature cannot be predIcted wIth this type of computation.
4

The V/STOL configurat1on of figures 1 and 2 has already been analyzed w1th the current prediction code (VSAERO in ref. 13) and w1th other panel methods (refs. 22,23). The present panel model, however, has a modified geometry Wh1Ch was a result of a comparison w1th the actual wind tunnel model, and thereby 1ncluded a vert1cal fin as well. Also, the jet-wake and jet-flap modeling (fig. 3) were changed relative to the model used 1n reference 13. The results of the pressure d1str1but1on of f1gures 5-12 are close to the computed pressures of reference 13, but the1r lift curve had slightly lower results than those shown 1n f1gure 13. For compar1son, computat1ons for this configurat1on by other panel methods are also presented in figure 13. The lift values of references 22 and 23 have SlIghtly lower values and smaller slopes. The computations of reference 23, uS1ng the model of reference 12, 1ncluded some surface pressure computat1ons and had no power effects.
Drag polars and p1tch1ng moments for th1S model are shown 1n figure 14 and in figure 15. The predicted drag coeff1cIent consists of the 11ft-induced terms only, and therefore had smaller values. The skin fr1ct1on on the model was separately computed w1th the current predIct10n method and was found to be about COo = 0.01. However, th1S value IS small compared wIth the d1fference (of about 0.05) ImplIed by fIgure 14, and IS a result of numerous local flow separatIons around the nacelle and near the w1ng and canard fuselage junctures. The pltch1ng-moment predIctions were sensItive to wake IteratIons; therefore, instead of a SOlld line, a pred1cted range IS presented. However, predIcted center of pressure was reasonable from the eng1-neer1ng point of view (xcp/cref = -0.10 to 0.22) compared wIth the measured value 0.20-0.23 (unstable), reported In reference 14.
AERODYNAMIC LOAD PREDICTIONS FOR A FORWARD-SWEPT-WING AIRCRAFT MODEL
Inclusion of advanced aerodynamic predIction technIques Into generIc test programs can result In Improvements in model shape and structural des1gn, 1mprovements 1n model mounting In the w1nd tunnel, and In establIshing the test program. In th1S latter case the Ident1flcation of more domInant test parameters (e.g., canard locations, flap settIng, etc.) can contribute to the preparatIon of a more effIc1ent test matrIX. An example of a set of predictions has been chosen for a STOL-fighter configuratIon scheduled for future large-scale testIng. The results of these predictIons, apart from the 1mmed1ate benef1ts, when combIned w1th future wInd tunnel results w1ll prov1de additIonal evaluat10n of th1S predIction method.
The model, whose geometry IS presented In fIgures 16 and 11, 1S planned to evaluate the low-speed aerodynamICS of forward-swept WIngs utIlIZIng vectored jets and the control of high-angle-of-attack flow separatIon by varIOUS blOWIng technIques. The nacelle, tall, canard, and upper portions of the fuselage of thIS deSIgn are similar to those of the model presented in fIgures 1 and 2. The strake, however, was removed and the fuselage SIdes, tall, and WIng were redeSIgned. The reference chord was based on the chord of the WIng, WIthout the aft-swept faIrIng, at the nacelle root sectIon. The reference point (xref) for the moments calculatIons was left at the same pOInt where It was for the model shown In fIgures 1
5
and 2. For the computations three different canard positIons were conSIdered. The model of figure 1 also had this geometric variable, but the results of fIgures 5-15 included computations for the canard's aft-pOSItion only. These three canard locations are on the same horizontal plane with 0.30 m spacing, as shown by fIgure 17. Portions of the planned test include component rotatIons and dislocations (canards flaps, etc.) that fall within the aerodynamically linear reglon. At thIS regIon, therefore, fewer test pOInts WIll be required and addItIonal test tIme can be utilized to investigate complex flow regimes (e.g., separated flows and jet interaction).
The predIctions for the lift and drag are presented In figures 18 and 19 for the forward-swept-wing fighter configuratlon with power effects. SInce there might be a small dIfference In the zero angle of attack between the panel and the actual model, at least two test pOInts WIll be required to valIdate the predIcted 11ft slope and CLo ' The computed lnduced drag is presented in figure 19. The zero-11ft drag coeffIcient CDo can be roughly estimated from the valIdatIon tests shown In figure 14. A separate dIagram for the pItching moment IS not presented here SInce the produced curve was senSItIve to the wake-iteration routine In the code. The center of pressure xcp for CT = 0, was estimated to be at the range of xcp/cref = 0.00-0.12, WhICh IS ahead of the reference pOInt shown In flgure 17.
The canard In the planned experiment could be mounted at three dIfferent POSItions, as shown by the insert in fIgure 20. ThIS flgure also shows the effect of this parameter on the pitchIng moment. A forward-canard pOSItion WIll result In hIgher pOSItive-pitching moments because of its larger dIstance from the aXIS of reference (xref)' ThIS reference point was positIoned near the LE of the WIng root (fIg. 17), and WIthout the canard the center of pressure was about 0.3 x cref behInd thIS aXIS. With the canard, however, this point was too far aft for statIC longItudinal stability. Even so, the canard at any POSItIon was capable of controlling the configuration. The spanwlse loading of the WIng, WIth and WIthout the canard, is shown In figure 21. Because of the aft sweep at the WIng's root regIon, the loadIng is IncreaSIng toward the outer sections. On the forward-swept portIon of the WIng, however, this behaVIor IS reversed, and the increased loadIng IS directed toward the juncture. Consequently, for the "wIng-only" confIguratIon, the peak load IS found close to the juncture. When adding a canard In front of the WIng Its vortex wake Induces an upwash at the wlng's outboard regIon and a down wash at the Inner sectIons. ThIS effect IS stronger for the canard-aft POSItIon. The spanwlse loadIng on the canard, on the other hand, increases as It IS shIfted backward because of the increased upwash of the WIng (fIg. 22). For the computations presented in fIgures 20-22 the canard was paneled smoothly lnto the nacelle for the canard-aft position only. For the other canard locatIons, small gaps in the model geometry (between the canard and the nacelle) were left open to simplIfy the calculation. The effect of these openIngs on the panel model were minlmized by the small panel sizes near the canard's root. ThIS feature of this prediction method of not beIng sensitive to small dlscontlnultles In the paneled surface, is lmportant since during wind tunnel testing reasonable predlctlons can be obtained for unplanned confIguration changes.
6

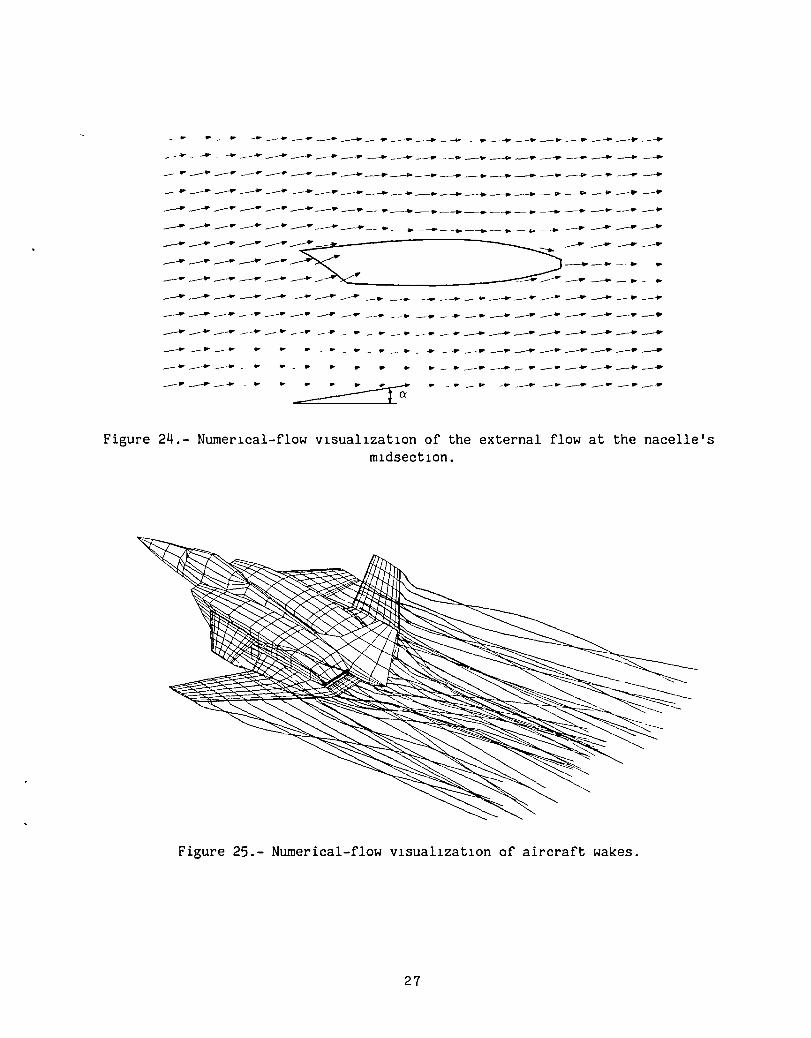
The computation of aircraft 11ft with ground proximity, without propulsion effects for a landing configuration is presented in figure 23. Because of the angle of IncIdence of the configuratIon and because of the forward sweep of the w1ng, 1n thIS case, the lIftIng surfaces lIe hIgh above the ground. This effect 1S more not1ceable for the canard and for the forward-swept portIon of the w1ng; therefore, ground proxImIty has only a small effect on the 11ft. However, for a landIng V/STOL aircraft conflgurat1on, the flow fIeld caused by propulsIon jets and resulting recirculations IS more complex and the sImplifIed model used here IS not adequate. Flow v1suallzations and velocIty surveys are also easily computed wIth thIS predIctIon method. These vIsualizatIons are usually important durIng w1nd tunnel testing, so that a correct physical InterpretatIon of the measured results can be obta1ned. Such numer1cal flow vlsualizat10ns were prepared before the wind tunnel test and are presented 1n f1gures 24 and 25. Here a vector representatIon of sImulated aIr velocIty and dIrectIons, for the CT = 0 condit1on, are descr1bed at the nacelle m1dsection (fig. 24). The wake of the aircraft 1S shown In fIgure 25. The prox1m-1ty between the canard's wake and the wIng explains the strong 1nteract1on presented 1n f1gure 21. The short turnaround t1mes requ1red by the panel method to generate such numer1cal flow v1sual1zat1ons allow real-tIme d1splay of such results that can be exam1ned wh1le the w1nd tunnel IS running.
CONCLUDING REMARKS
The panel method that was used here IS based on potent1al flow wIth model1ng of some of the V1SCOUS effects. Thereby, when strong VISCOUS reg1mes eX1st 1n the phys1cal case, the1r results are not accurate everywhere, especially the results taken close to sharp edges of nacelles and w1ngs' leading edges, near jets and nozzles, and when sh1ft1ng the canard back and forth. However, 1ntegral results for 11ft and drag, and even pressures, away from these troubled areas and junctures were found to be valid. ThUS, dur1ng wInd tunnel test1ng, rap1d and reasonable pred1ctions can be provided for the effects of unplanned component sh1fting and rotat1on, even when some slots 1n the panel model are left open. Furthermore, since such slmpl1f1ed methods (compared to Nav1er-Stokes SolutIons) have the potent1al for be1ng faster and more economIcal, the1r performance upgrad1ng has to be cons1dered. Future ref1nement of thIS method should concentrate on includ1ng 1nteract1ve graph1c routInes so that changes In model geometry and InvestigatIon of the computed output w1ll be accelerated. InclusIon of a more deta1led slmulat10n of wake motIon, perhaps by develop1ng a t1me-stepp1ng verS10n of th1S code, would allow the model1ng of LE separat10n and thereby extend the predictIon range up to h1gher angles of attack. Also, a more detailed model1ng of inlet flows and exhaust jets, w1th and w1thout ground effect, IS needed.
7

REFERENCES
1. Chapman, D. R.: Computatlonal Aerodynamics Development and Outlook. AIAA J., vol. 17, no. 12, 1979, pp. 1293-1313.
2. Kraus, W.: Panel Methods in Aerodynamics. Numerical Methods in Fluid Dynamics. H. J. Wirz and J. J. Smolderen, eds., McGraw-Hill, 1978, pp. 237-297.
3. Rubbert, P. E.; and Saaris, G. R.: A General Three-Dimensional Potential-Flow Method Applled to V/STOL Aerodynamics. SAE Paper no. 68-0304, 1968.
4. Carmichael, R. L.; and Erlcson, L. L.: PAN AIR--A Hlgher Order Panel Method for PredIctlng Subsonic or Supersonic Linear Potentlal Flows About Arbltrary Conflguratlons. AIAA Paper 81-1255, June 1981.
5. Maskew, B.: Program VSAERO, A Computer Program for Calculating the Nonllnear Aerodynamic Characteristics of Arbitrary ConfiguratIons. NASA CR-166476, 1982.
6. Margason, R. J.; Kjelgaard, S. 0.; Sellers, W. L. III; MorrIs, C. E. K. Jr.; Walkey, K. B.; and Shields, E. W.: Subsonic Panel Methods--A Comparison of Several Production Codes. AIAA Paper 85-0280, Jan. 1985.
7. Woodward, F. A.: Analysis and Design of Wing-Body Combinations at Subsonlc and Supersonic Speeds. J. of Aircraft, vol. 5, no. 6, 1968, pp. 528-534.
8. Hess, J. L.: Calculation of Potential Flow About Arbitrary Three-Dimenslonal Lifting Bodies. Final Technical Report MDe J5679-01, McDonnell Douglas, Long Beach, Callfornla, Oct. 1972.
9. Hess, J. L.j and SmIth, A. M. 0.: CalculatIon of Potential Flow About ArbItrary Bodies. Progress in Aeronautical SClences, vol. 8, Pergamon Press, 1967, pp. 1-138.
10. Woodward, F. A.: An Improved Method for the Aerodynamlc Analysls of Wing-BodyTall Conflgurations In Subsonlc and Supersonlc Flow. NASA CR-2228, May 1973.
11. Morlno, L.: A General Theory of Unsteady CompressIble Potentlal Aerodynamics. NASA CR-2464, 1974.
12. Johnson, F. T.: A General Panel Method for the Analysls and Design of Arbltrary Configurations in Incompressible Flows. NASA CR-3079, May 1980.
13. Maskew, B.; Strash, D.; Nathman, J.; and Dvorak, F. A.: Investlgatlon to Advance Prediction Techniques of the Low-Speed Aerodynamics of V/STOL Aircraft. NASA CR-166479, 1983.
8

14. Falarskl, M. D.; Whitten, P. D.; and Harris, M. J.: Aerodynamic CharacterlstlCS of a Large-Scale Model of a Highly Maneuverable Supersonic V/STOL Fighter: STOL Conflguration. AIAA Paper 80-0234, Jan. 1980.
15. Howell, G. A.; Crosthwait, E. L.; and Witte, M. C.: EvaluatIon of Pressure and Thermal Data From a Wind Tunnel Test of a Large-Scale, Powered, STOL Flghter Model. NASA CR-166110, June 1981.
16. Falarski, M. D.; and Dudley, M. R.: Analysis of Data From a Wlnd Tunnel Investigatlon of a Large-Scale Model of a Highly Maneuverable SupersonIC V/STOL Flghter: STOL Conflguration. AIAA Paper 81-2620, Dec. 1981.
11. Howell, G. A.: Test Results of Chordwlse and Spanwise Blowlng for Low-Speed Llft Augmentatlon. Proc. of 13th lCAS Conf., vol. 2, Aug. 1982, pp. 1222-1234.
18. Shollenberger, C. A.: Three-DImensIonal Wing/Jet Interactlon Analysls Including Jet Distortlon Influences. J. of Alrcraft, vol. 12, no. 9, 1915, pp. 106-113.
19. Polhamus, E. C.: Predlctions for Vortex LIft CharacterIstIcs by Leading Edge SuctIon Analogy. J. of AIrcraft, vol. 8, 1911, pp. 193-199.
20. Katz, J.: Lateral Aerodynamics of Delta Wlngs With Leadlng Edge SeparatIon. AIAA J., vol. 22, no. 3, 1984, pp. 323-328.
21. LevIn, D.; and Katz, J.: Vortex-LattIce Method for the Calculation of the Nonsteady Separated Flow Over Delta Wlngs. J. of AIrcraft, vol. 18, no. 12, 1981, pp. 1031-1031.
22. Beatty, T. D.; and Worthey, M. K.: Advanced PredictIon TechnIque for the Low Speed AerodynamICS of V/STOL AIrcraft, Vol. I. NASA CR-166442, Mar. 1983.
23. Bhateley, I. C.; Howell, G. A.; and Mann, H. W.: Development of V/STOL Methodology Based on a HIgher Order Panel Method. NASA CR-166491, Feb. 1983.
9
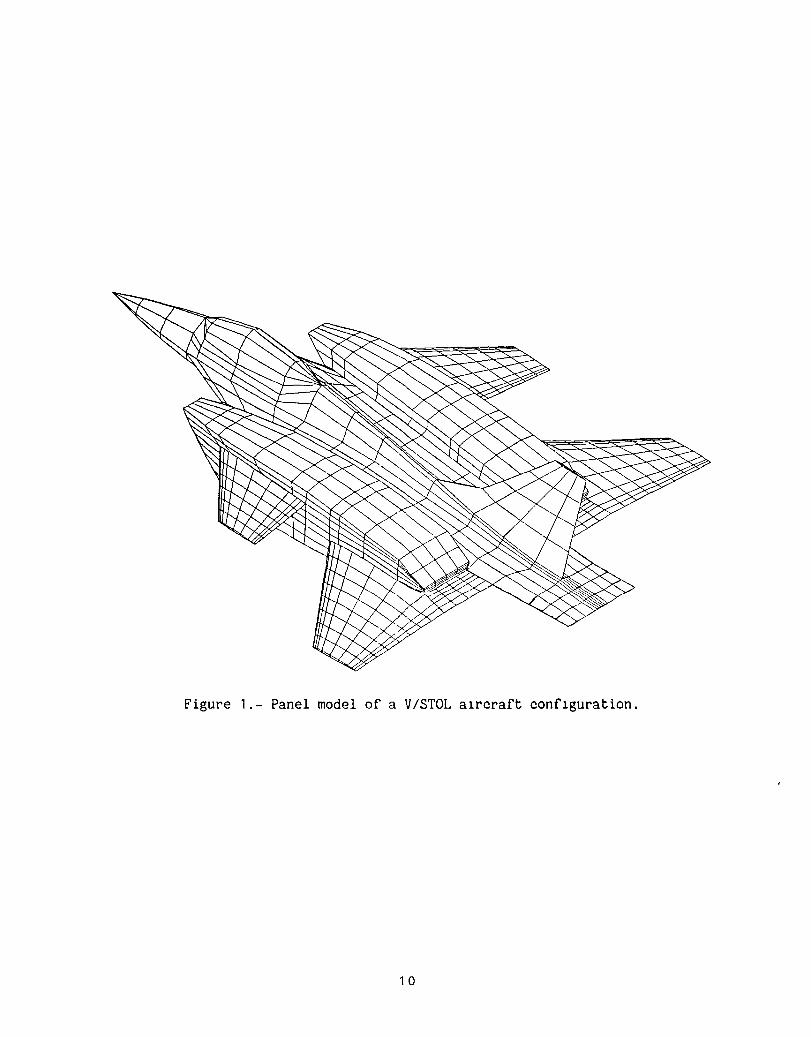
Figure 1.- Panel model of a V/STOL alrcraft conflguration.
1 0

, 60---,.jl- /f/I I I I J~V" .. fflill ~
.----------------;t7} / I CL.lf/ / -; -, C g/ / I A B #/,1 / ; I 1(2y/bref = 0.84)
(2y/bref = 0.63) AL//// /r~ .PI;I / / ! I ~B $£ / I I /11 / I I I (2 /b 0 4)
$7 / I 7 PI I / Y ref = 6
~ t:..cr:J:: oL~~
6.04 ~ ~- l I -.to .-.r-
7 I"""' ~ ~ -= ~ -=" ~ ........ ~,
r--r-d:l
~ ~'(\ \ \' \;\\\ \ ~ '\ \ \ \ ~I~~~~\-.l,\r--\--\-+--I-+l ~'\ \ \ \ ~\ _\ \ \
1-4~\ \ \ \ ~'\ \ \ \ -I-_____________ ~--.::~\ ,\1 'tJu ~\ \ \ \
~ 0 77 -1.- ~ \ \ \ \ -I I~ ~, \ \ \
~0.\\\
Sref = 17 00 0.65~ ~ cref= 2.61 r Ib.r~e~f=~~3~6~4~~~~~~§I~;;~~~~~~~~Ii~~~~~~~16;I5 1~~r---------------601--------------~·~1 t+------------------10.24--------------~
Figure 2.- Geometrical detalls of the V/STOL alrcraft conflguratlon.
11

JET BOUNDARIES
DIRECTION OF VORTICITY IN THE SHEAR LAYER
Figure 3.- Models for the inlet and Jet flows.
12
Cp
DIRECTION OF THRUST VECTOR
REFERENCE POINT
Flgure 4.- Thrust vector and model geometrles.
-4 CT = 0
SECTION AA, CANARD
-3 a
0--- 42 0-83
-2 0
0 0
-1 0
.4 1~------~---------~---------~---------~------~
6 8 1.0 o .2 x/ely)
Flgure 5.- Pressure distribution on canard.
13

SECTION BB, WING INBOARD a
0---42 0--83
-3 . CT = 0
-2
1 ~----~------~------~------~----~ o 2 4 .6 8 1.0 x/ely)
FIgure 6.- Pressure dIstribution on wIng (Inboard).
1 4
-5
-4
-3
SECTION CC, WING OUTBOARD ex
0---42
0-83
LOWER PRESSURES ~ DUE TO VORTEX LIFT
-1 G
~~~-o
1~----~~----~------~------~------~ o 2 .4 6 .8 1.0 x/ely)
Figure 1.- Pressure distribution on wing (outboard).
15

SECTION DO, STRAKE
-3 0 a 0---42
0-8.3
-2
lL-----~-------L----__ ~ ______ ~ ____ ~ o .2 4 6 8
x/ely)
Flgure 8.- Pressure distrlbutlon on strake.
SECTION AA, CANARD
CT -3 0--0
1 0
1~----~-------L------~------~----~ o .2 4 .6 8 1 0
x/ely)
Figure 9.- Effect of power on canard-pressure dlstribution.
1 6

-3 SECTION BB, WING INBOARD
CT 0--0 0---14
-2 ~=43
1~----~------~------L-----~----~ o 2 4 6 .8 10 x/c{y)
Figure 10.- Effect of power on wing-inboard pressures.
-3 SECTION CC, WING OUTBOARD CT
0--0
0---1.4 -2
~=43
1~----~------~------J-------~----~ o .2 .4 6 8 1.0
x/c{y)
Figure 11.- Effect of power on wing-outboard pressures.
17

SECTION DO, STRAKE
-3 CT 0-0 0--- 1.4
-2 0'=43
o
1~----~----~------L-----~----~ o .2 4 6 .8 1.0 x/ely)
Figure 12.- Effect of power on strake-pressure distributlon.
1 8

3
2
1
o
EXPERIMENT COMPUTATION CT ~ 1.8
o o
09 o o (REF 23)
o (REF. 22)
A / /
,/
A / // 0
/ 0 /' / ,,/
6 // ./. / G /
/ / / ./
6 / 0 ./ / ./ 0
o
/ / / /'
/ 0/' 0 ./ (REF. 22)
6/ /' // /. /'
/0 /0 / / / :/ / /' ..... '\
./ .~/ (REF. 23)
10 20 0', deg
Figure 13.- Lift coeffIcIents for the V/STOL fIghter model.
19

EXPERIMENT COMPUTATION CT ~ 1.8
[J 0.9 () 0.0
4
3 aT = 8 5° // ~
/, /A /./'" G
CL 2 //A . ,,/" []
/A / G 0 / /
1 /A • G /
/ A . G I I . G
0 A 0
-2 -1 0 1 Co
Figure 14.- Lift/drag polars for the V/STOL fighter model.
20

EXPERIMENT COMPUTED CT l::.. K\\'\) 1.8
0 0.9 0 rzzzl 0
3
2 o
o
o
o 1
o
o
O~--~~~~-L-L------~------~----~ -.4 -.2 .4 .6
FIgure 15.- PItchIng moment dIagram for the V/STOL flghter model.
21

Flgure 16.- Panel model of the forward-swept-wing V/STOL flghter.
22

7.85
4.91
CANARD AFT·POSITION ~\\.\.\.~ ~\\.\.\.~
CANARD MID·POSITION ~ ,\\\ \ \. \.\.~
CANARD FORWARD·POSITION / -/ /' \\ \ \ \. \. ~~ ~ L / 'Y' P/// /III \\\ \ \. \.~~
...-"!""'"": P
------.~
/ R/ /11111 \\\\ \ \ ""~ / £//// /;~ II / \ \ \ "\\. // $/ / / I II / I \ \ ~ \~
~ J;::
r-
~
-~ ~~ -
~'" \ \ --"1 ~ \ I II / tf ~, '\ \ \ ~\ \ I / / hi ~~~'\\ \~~\ '// / / / / ///
~'\\ \\\\ 1// / / / ///;;;-30° ///////// hJ..///////// //////$
//////$ -
099 I I
Sref = 13.66 cref = 2.03
bref = 392
1 ...... :-------6.01 ... xref I
i 2.45
1 ... 0('------------9.87 ...
Flgure 11.- Geometrical detalls of the forward-swept-wlng model.
23

o ...J
(,J
I ...J
(,J
3
2
1
o
CT --- 2.0 -'-10
-0
/ /
/ / /
/ /' / '
/ /./
// ,/ / /
/ ' / ./
/ ./ / ,/
/ / / '
/ ,/ / ,/
/ / / ' ,/ /
15 20 25 Ci,deg
Flgure 18.- Prediction of lift coefficients for the forward-swept-wlng model.
4 CT -- 20 _.- 1.0 ,..,...."" -0.0
,....... 3 /""
,..,.....,... CiT = 8 5°
",.,/ /'
0 . /' ...J /' . (,J ,/ ",., I 2 / /"
. ...J
(,J / /' / /
. / .
1 / / . / / .
o~------------~--------------~----------------2 -1 o 1
Figure 19.- Lift/drag polars for the forward-swept-wlng model.
24

.3
2
MID·POSITION
o ~~, ~~
AFT·POSITION
-5 5 10
FIgure 20.- Effect of canard position on pitchIng moment.
1 0
8
~' ~~ "\
~=:=~+r-h '~ ,,:;;J \~ \" / NO CANARD _~~ii .! .JL
,----_ /CANARD // --__ FORWARD·POSITION
/ --/ ._0-. -_ / .,.,.,. -- ~
// /./. ~ • /' ~ '-.
/. ~.l .". CANARD IN -~
AFT·POSITION
a = 10
. 6
4
.2 .--NACELLE BOUNDARY
o~------~---------~---------~------~~------~---------~------~ 3 .4 5 6 7 .8 9 1.0
2y/b
Figure 21.- Effect of canard posItIon on wing's spanwise loadIng.
25

1.0
.8
.6
CQ
.4
2
0
I--~ I CANARD, ~
AFT-POSITION
a = 10 I ----ac = 0 --- .....-----.-. -- .-' CT = 0 /~.--~-----:./. ~~ r·--·--· --=E~
A I CANARD,
-,~:'" " MID-POSITION
I CANARD IN
' _____ NACELLE BOUNDARY FORWARD POSITION
I I
3 4 5 2y/b
6
, I I
Figure 22.- Effect of canard posItIon on canard's spanwise loadIng.
2
o
................. ""---
......... --
a, deg
15
10
5
v~~ ----. T
h + 7 7 7 ) 7 7 ) ) ) ) ) )
---------------
........ ----.--. ---.--- -
5
h/cref
--------
1 0
FIgure 23.- Effect of ground proxImity on lift.
26
-- .. -- .. _._----------------.. ----po _ ..
~ --... ----.. --.. ~- ...... - _ .. .--P --~ -p ~ -- .. -- ... -- ...
Figure 24.- Numerical-flow visualization of the external flow at the nacelle's midsection.
Figure 25.- Numerical-flow visualization of aircraft wakes.
27

1 Report No I 2 Government Accession No 3 Recipient's Catalog No
NASA TM-86782 4 Title and Subtitle 5 Report Date
EVALUATION OF AN AERODYNAMIC-LOAD PREDICTION METHOD August 1985
ON A STOL FIGHTER CONFIGURATION 6 Performing Organization Code
7 Author(s) 8 Performing Organization Report No
Joseph Katz 85358 10 Work Unit No
9 Performing Organization Name and Address
Ames Research Center 11 Contract or Grant No
Moffett Field, CA 94035
13 Type of Report and Period Covered
12 Sponsoring Agency Name and Address Technical Memorandum Nat10nal Aeronautics and Space Administration 14 Sponsoring Agency Code Washington, DC 20546 505-43-01
15 Supplementary Notes
Point of Contact: Joseph Katz, MS 247-1, Ames Research Center, Moffett Field, CA 94035, (415)694-5046 or FTS 464-5046
16 Abstract
A three-dimensional panel method was used to compute the aerodynamic loads on a large-scale, powered wind tunnel model. The size of the com-putat10n grid was selected such that turnaround times, on present computers, remained satisfactory. With this constraint, the STOL aircraft conf1gura-tion was modeled and the capabilities and limitations of the prediction method were investigated. After this study, a sim1lar numerical model was established for a forward-swept-wing aircraft configurat10n which is planned for large-scale, low-speed testing. The resulting aerodynamic-load predict10ns are discussed and will be utilized, together w1th the future experimental results, to obtain a broader validation of this method as well as to reduce the necessary size of the matrix of the test parameters.
17 Key Words (Suggested by Author(5)) 1S Distribution Statement
Aircraft aerodynam1cs Unlimited V/STOL Prediction method
Subject Category - 02
19 Security Oasslf (of thiS report) \20 Security Classlf (of thiS page) J 21 rIo of Pages
\ 22 Price·
Unclassified Unclassified 30 A03
·For sale by the National Technical Information Service, Springfield, Virginia 22161

End of Document