II - ntrs.nasa.gov
240
II (NASA-C_-I9644b) SPACCC_AFT MAXIMUM ALLOWABLE C3NC_NTRATIONS FnR SELECTED AIRBORNE CONTAMINANTS, VOLUME 1 (NAS-NRC) 226 p g _J95-12PT) Unclas G3/lo 0027221 Spacecraft Maximum Allowable Concentrations for Selected Airborne Contaminants Volume 1 COMMI1WEE ON TOXICOI.OGY NATIONAL RESEARCH cour'-,,I(FIL
Transcript of II - ntrs.nasa.gov
II(NASA-C_-I9644b) SPACCC_AFT
MAXIMUM ALLOWABLE C3NC_NTRATIONS
FnR SELECTED AIRBORNE CONTAMINANTS,VOLUME 1 (NAS-NRC) 226 p
g_J95-12PT)
Unclas
G3/lo 0027221
Spacecraft MaximumAllowable Concentrations
for Selected AirborneContaminants
Volume 1
COMMI1WEE ON TOXICOI.OGY
NATIONAL RESEARCH cour'-,,I(FIL

Spacecraft Maximum Allowable
Concentrations for SelectedAirborne Contaminants
Volume 1
Subcommittee on Spacecraft Maximum
Allowable Concentrations
Committee on Toxicology
Board on Environmental Studies
and Toxicology
Commission on Life Sciences
National Research Council
NATIONAL ACADEMY PRESS
Washington, D.C., 1994
NATIONAL ACADEMY PRESS 2101 Constitution Ave., N.W., Washington, D.C. 20418
NOTICE: The project that is the subject of this report was approved by the Govermng Board of
the National Research Council, whose members are drawn from the councils of the National
Academy of Sciences, the National Academy of Engineering, and the Institute of Medicine. The
members of the committee responsible for the report were chosen for their special competencies
and with regard for appropriate balance.
This report has been reviewed by a group other than the authors according to procedures
approved by a Report Review Committee consisting of members of the National Academy of
Sciences, the National Academy of Engineering, and the Institute of Medicine.
The National Academy of Sciences is a private, non-profit, self-perpetuating society of
distinguished scholars engaged in scientific and engineering research, dedicated to the furtherance
of science and technology and to their use for the general welfare. Upon the authority of the
charter granted to it by the Congress in 1863, the Academy has a mandate that requires it to advise
the federal government on scientific and technical matters. Dr. Bruce Alberts is president of the
National Academy of Sciences.
The National Academy of Engineering was established in 1964, under the charter of the
National Academy of Sciences, as a parallel organization of outstanding engineers. It is autono-
mous in its administration and in the selection of its members, sharing with the National Academy
of Sciences the responsibility for advising the federal government. The National Academy of
Engineering also sponsors engineering programs aimed at meeting national needs, encourages
education and research, and recognizes the superior achievements of engineers. Dr. Robert M.
White is president of the National Academy of Engineering.
The Institute of Medicine was established in 1970 by the National Academy of Sciences to
secure the services of eminent members of appropriate professions in the examination of policy
matters pertaining to the health of the public. The Institute acts under the responsibility given to
the National Academy of Sciences by its congressional charter to be an adviser to the federal
government and, upon its own initiative, to identify issues of medical care, research, and education.
Dr. Kenneth I. Shine is president of the Institute of Medicine.The National Research Council was organized by the National Academy of Sciences in 1916
to associate the broad community of science and technology with the Academy's purposes of
furthering knowledge and advising the federal government. Functioning in accordance with general
policies determined by the Academy, the Council has become the principal operating agency of
both the National Academy of Sciences and the National Academy of Engineering in providing
services to the government, the public, and the scientific and engineering communities. The
Council is administered jointly by both Academies and the Institute of Medicine. Dr. Bruce Albertsand Dr. Robert M. White are chairman and vice chairman, respectively, of the National Research
Council.
The project was supported by the National Aeronautics and Space Adminislration Grant No.
NAGW-2239.
Copyright 1994 by the National Academy of Sciences. All rights reserved.
Printed in the United States of America
Subcommittee on SpacecraftMaximum Allowable Concentrations
DONALD E. GARDNER (Chair), ManTech Environmental Technology,
Inc., Research Triangle Park, N.C.
JOSEPH BRADY, Johns Hopkins School of Medicine, Baltimore, Md.
RICHARD BULL, Washington State University, Pullman, Wash.
GARY P. CARLSON, Purdue University, West Lafayette, Ind.
CHARLES E. FEIGLEY, University of South Carolina, Columbia, S.C.
MARY E. GAULDEN, University of Texas, Southwestern Medical
School, Dallas, Tex.
WILLIAM E. HALPER_, National Institute for Occupational Safety
and Health, Cincinnati, Ohio
ROGENE F. HENDERSON, Lovelace Biomedical and Environmental
Research Institute, Albuquerque, N.Mex.
MARSHALL JOHNSON, Thomas Jefferson Medical College,
Philadelphia, Pa.RALPH L. KODELL, National Center for Toxicological Research,
Jefferson, Ark.
ROBERT SNYDER, Environmental and Occupational Health Sciences
Institute, Piscataway, N.J.
BERNARD M. WAGNER, Wagner Associates, Millburn, N.J.
G. DONALD WHEDON, Consultant, Clearwater Beach, Fla.
GAROLD S. YOST, University of Utah, Salt Lake City, Utah
Staff
KULBm S. BAKSnI, Project Director and Program Director
RICHARD D. THOMAS, Program Director (until May 1994)
RUTH E. CROSSGROVE, Editor
CATHERINE M. KtraIK, Senior Program Assistant
NIANI StrrmtoJO, Project Assistant
Sponsor." National Aeronautics and Space Administration
°°,
111

Committee on Toxicology
ROGENE F. HENDERSON (Chair), Lovelace Biomedical and
Environmental Research Institute, Albuquerque, N.Mex.
R. HAYS BELL, Eastman Kodak Company, Rochester, N.Y.
DEAN E. CARTER, University of Arizona, Tucson, Ariz.
DEBORAH A. CORY-SLECHTA, University of Rochester School ofMedicine, Rochester, N.Y.
CHARLES Eo FEIGLEY, University of South Carolina, Columbia, S.C.
DONALD E. GARDNER, ManTech Environmental Technology, Inc.,
Research Triangle Park, N.C.
DAVID W. GAYLOR, U.S. Food and Drug Administration, Jefferson,Ark.
WALDERICO M. GENEROSO, Oak Ridge National Laboratory, OakRidge, Tenn.
IAN A. GREAVES, University of Minnesota, Minneapolis, Minn.
SIDNEY GREEN, U.S. Food and Drug Administration, Laurel, Md.
CAROLE Ao KIMMEL, U.S. Environmental Protection Agency,
Washington, D.C.
LOREN D. KOLLER, Oregon State University, Corvallis, Oreg.
ERNEST EUGENE MCCONNELL, Raleigh, N.C.
MICHELE A. MEDINSKY, Chemical Industry Institute of Toxicology,Research Triangle Park, N.C.
ROBERT SNYDER, Rutgers University, Piscataway, N.J.
BAILUS WALKER, JR., University of Oklahoma, Oklahoma City,Okla.
HANSPETER R. Wrrscm, University of California, Davis, Calif.
GERALD N. WOGAN, Massachusetts Institute of Technology,
Cambridge, Mass.
GAROLD S. YOST, University of Utah, Salt Lake City, Utah
¥
Pi_a_K)(f_ PAGEJI__Ar_ I_T FN.MED

Staff of Committee on Toxicology
KULBIR S. BAKSltI, Program Director
RICHARD D. THOMAS, Program Director (until May 1994)MARVIN A. SCI-INEmERMAN, Senior Staff Scientist
Rtrru E. CROSSGROVE, Editor
CATHERINE M. KUBIK, Senior Program Assistant
Rtrrrl P. DArqOF/r, Project Assistant (until November 1993)
NIANI SUTARDJO, Project Assistant
vi
Board on Environmental
Studies and Toxicology
PAUL G. RISSER (Chair), Miami University, Oxford, Ohio
FREDERICK R. ANDERSON, Cadwalader, Wickersham & Taft,
Washington, D.C.
MICHAEL J. BEAN, Environmental Defense Fund, Washington, D.C.
EULA BINGHAM, University of Cincinnati, Cincinnati, Ohio
EDWIN H. CLARK, Clean Sites, Inc., Alexandria, Va.
ALLAN H. CONNEY, Rutgers University, Piscataway, N.J.
JOHN L. EMMERSON, Eli Lilly & Company, Greenfield, Ind.ROBERT C. FORNEY, Unionville, Pa.
ROBERT A. FROSCH, Harvard University, Cambridge, Mass.KAI LEE, Williams College, Williamstown, Mass.
JANE LUBCHENCO, Oregon State University, Corvallis, Ore.
GORDON ORIANS, University of Washington, Seattle, Wash.
FRANK L. PARKER, Vanderbilt University, Nashville, Tenn., and
Clemson University, Anderson, S.Car.
GEOFFREY PLACE, Hilton Head, S.Car.
DAVID P. RALL, Washington, D.C.
LESLIE A. REAL, Indiana University, Bloomington, Ind.
KRISTIN SHRADER-FRECI-IETTE, University of South Florida, Tampa,Fla.
GERALD VAN BELLE, University of Washington, Seattle, Wash.BAILUS WALKER, JR., Washington, D.C.
vii
Staff of Board on Environmental Studies and Toxicology
JAMES J. REISA_ Director
DAVID J. POLICANSKY, Associate Director and Program Director for
Natural Resources and Applied Ecology
GAIn CHARNLEY, Acting Program Director for Human Toxicology
and Risk Assessment (since May 1994)
RICHARD D. THOMAS, Associate Director and Program Director for
Human Toxicology and Risk Assessment (until May 1994)
LEE R. PA_N, Program Director for Information Systems andStatistics
RAYMOND A. WASSEL, Program Director for Environmental
Sciences and Engineering
oo*
Commission on Life Sciences
THOMAS D. POLLARD (Chair), Johns Hopkins Medical School,Baltimore, Md.
BRUCE N. AMES, University of California, Berkeley, Calif.
JOHN C. BA1LAR, III, McGill University, Montreal, Quebec
MICHAEL BISHOP, Hooper Research Foundation, University ofCalifornia Medical Center, San Francisco, Calif.
JoHN E. BURRIS, Marine Biological Laboratory, Woods Hole, Mass.
MICHAEL T. CLEGG, University of California, Riverside, Calif.
GLENN A. CROSBY, Washington State University, Pullman, Wash.
LEROY E. HOOD, University of Washington, Seattle, Wash.
MARIAN E. KOSI-ILAND, University of California, Berkeley, Calif.
RICHARD E. LENSKI, Michigan State University, East Lansing,Mich.
EMIL A. PFITZER, Hoffmann-La Roche Inc., Nutley, N.J.MALCOLM C. PIKE, University of Southern California School of
Medicine, Los Angeles, Calif.
HENRY C. PITOT, III, University of Wisconsin, Madison, Wisc.
PAUL G. RISSER, Miami University, Oxford, Ohio
JOHNATHAN M. SAMET, University of New Mexico School of
Medicine, Albuquerque, N.Mex.
HAROLD M. SCHMECK, JR., Armonk, N.Y.
CARLA J. SHATZ, University of California, Berkeley, Calif.
SUSAN S. TAYLOR, University of California at San Diego, La Jolla,Calif.
P. ROY VAGELOS, Merck & Company, Whitehouse Station, N. J.JOHN L. VANDEBERG, Southwestern Foundation for Biomedical
Research, San Antonio, Tex.
TORSTEN N. WmSEL, Rockefeller University, New York, N.Y.
PAUL GILMAN, Executive Director
ix

Other Recent Reports of theBoard on Environmental Studies
and Toxicology
Science and Judgment in Risk Assessment (1994)Environmental Information for Outer Continental Shelf Oil and Gas
Decisions (1994)
Measuring Lead Exposure in Infants, Children, and Other Sensitive
Populations (1993)Health Effects of Ingested Fluoride (1993)
Pesticides in the Diets of Infants and Children (1993)
Issues in Risk Assessment (1993)
Setting Priorities for Land Conservation (1993)
Protecting Visibility in National Parks and Wilderness Areas (1993)
Biologic Markers in Immunotoxicology (1992)
Dolphins and the Tuna Industry (1992)
Environmental Neurotoxicology (1992)
Hazardous Materials on the Public Lands (1992)
Science and the National Parks (1992)Animals as Sentinels of Environmental Health Hazards (1991)
Assessment of the U.S. Outer Continental Shelf Environmental Stud-
ies Program, Volumes I-IV (1991-1993)
Human Exposure Assessment for Airborne Pollutants (1991)
Monitoring Human Tissues for Toxic Substances (1991)
Rethinking the Ozone Problem in Urban and Regional Air Pollution
(1991)
Decline of the Sea Turtles (1990)
Tracking Toxic Substances at Industrial Facilities (1990)
Biologic Markers in Pulmonary Toxicology (1989)
Biologic Markers in Reproductive Toxicology (1989)
These reports may be ordered from the National Academy Press
(800) 624-6242 or (202) 334-3313
PAG_ _LAr_ hK)T FK.MEO


Preface
The National Aeronautics and Space Administration (NASA) is aware
of the potential toxicological hazards to humans that might be associated
with prolonged spacecraft missions. Despite major engineering advances
in controlling the atmosphere within spacecraft, some contamination of
the air appears inevitable. NASA has measured numerous airborne con-
taminants during space missions. As the missions increase in duration
and complexity, ensuring the health and well-being of astronauts travel-
ing and working in this unique environment becomes increasingly diffi-cult.
As part of its efforts to promote safe conditions aboard spacecraft,
NASA requested the National Research Council (NRC) to develop
guidelines for establishing spacecraft maximum allowable concentrations
(SMACs) for contaminants, and to review SMACs for various spacecraft
contaminants to determine whether NASA's recommended exposure lim-
its are consistent with the guidelines recommended by the subcommittee.
In response to NASA's request, the NRC organized the Subcommittee
on Guidelines for Developing Spacecraft Maximum Allowable Concen-
trations for Space Station Contaminants within the Committee on Toxi-
cology (COT). In the first phase of its work, the subcommittee devel-
oped the criteria and methods for preparing SMACs for spacecraft con-
taminants. The subcommittee's report, entitled Guidelines for Develop-
ing Spacecraft Maximum Allowable Concentrations for Space Station
Contaminants, was published in 1992. The executive summary of that
report is reprinted as Appendix A of this volume.In the second phase of the study, the Subcommittee on Spacecraft
Maximum Allowable Concentrations reviewed reports prepared by
°°°
Xlll
_,_ Ot_l_ _3X. ,t'll._
_,-_. .... '_ _ , _ : _i_ . ,_
xiv PREFACE
NASA scientists and contractors recommending SMACs for 35 space-
craft contaminants. The subcommittee sought to determine whether the
SMAC reports were consistent with the 1992 guidelines. Appendix B ofthis volume contains the first 11 SMAC reports that have been reviewed
for their application of the guidelines developed in the first phase of this
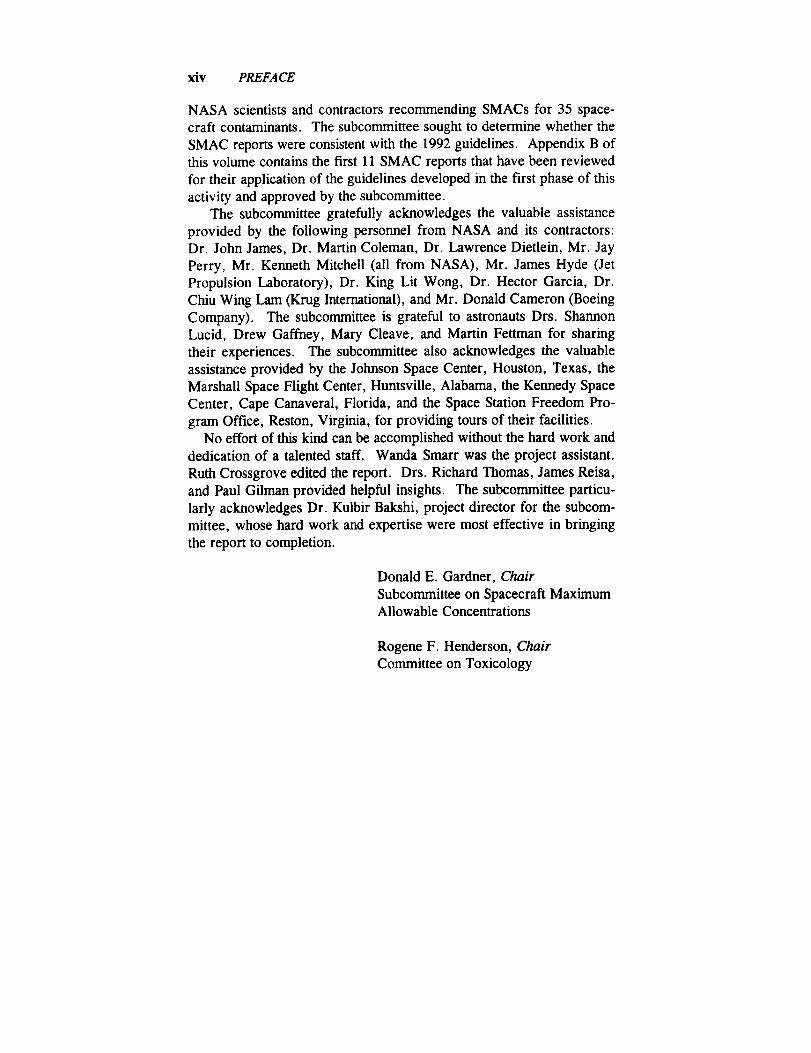
activity and approved by the subcommittee.The subcommittee gratefully acknowledges the valuable assistance
provided by the following personnel from NASA and its contractors:Dr. John James, Dr. Martin Coleman, Dr. Lawrence Dietlein, Mr. Jay
Perry, Mr. Kenneth Mitchell (all from NASA), Mr. James Hyde (Jet
Propulsion Laboratory), Dr. King Lit Wong, Dr. Hector Garcia, Dr.Chiu Wing Lam (Krug International), and Mr. Donald Cameron (Boeing
Company). The subcommittee is grateful to astronauts Drs. ShannonLucid, Drew Gaffney, Mary Cleave, and Martin Fettman for sharing
their experiences. The subcommittee also acknowledges the valuable
assistance provided by the Johnson Space Center, Houston, Texas, the
Marshall Space Flight Center, Huntsville, Alabama, the Kennedy SpaceCenter, Cape Canaveral, Florida, and the Space Station Freedom Pro-
gram Office, Reston, Virginia, for providing tours of their facilities.No effort of this kind can be accomplished without the hard work and
dedication of a talented staff. Wanda Smarr was the project assistant.
Ruth Crossgrove edited the report. Drs. Richard Thomas, James Reisa,
and Paul Gilman provided helpful insights. The subcommittee particu-
larly acknowledges Dr. Kulbir Bakshi, project director for the subcom-
mittee, whose hard work and expertise were most effective in bringing
the report to completion.
Donald E. Gardner, Chair
Subcommittee on Spacecraft MaximumAllowable Concentrations
Rogene F. Henderson, Chair
Committee on Toxicology
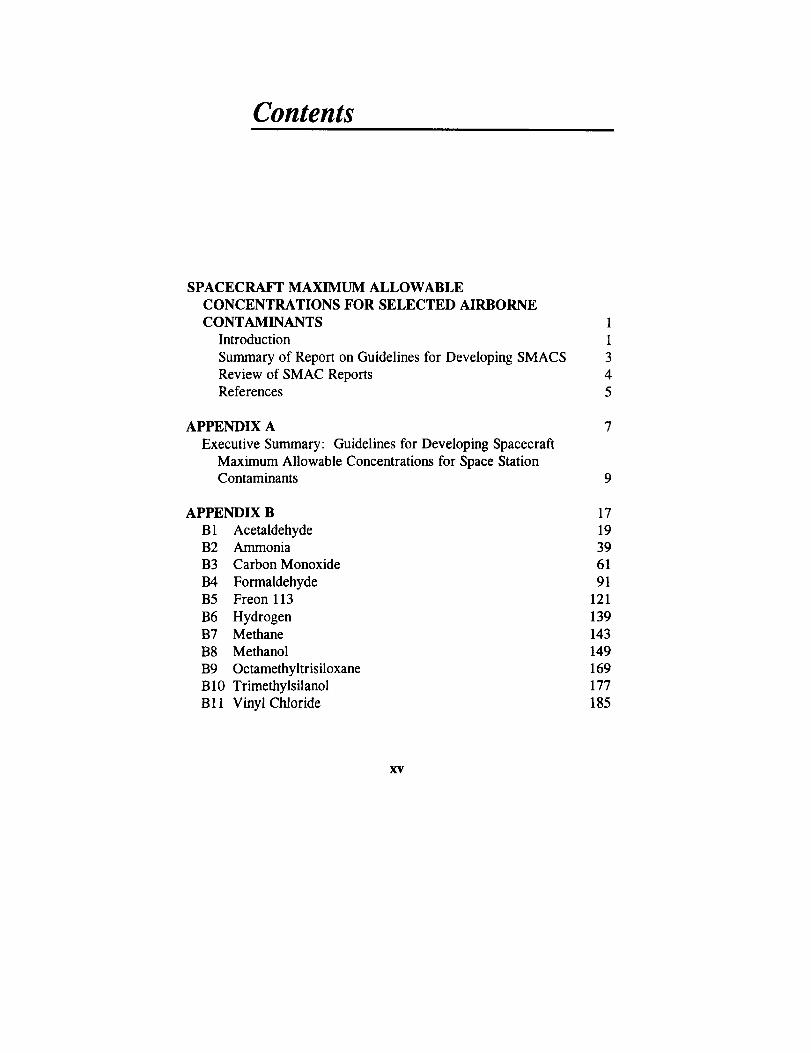
Contents
SPACECRAFT MAXIMUM ALLOWABLE
CONCENTRATIONS FOR SELECTED AIRBORNE
CONTAMINANTS
Introduction
Summary of Report on Guidelines for Developing SMACS
Review of SMAC ReportsReferences
APPENDIX A
Executive Summary: Guidelines for Developing Spacecraft
Maximum Allowable Concentrations for Space StationContaminants
APPENDIX B
B1 AcetaldehydeB2 Ammonia
B3 Carbon Monoxide
B4 FormaldehydeB5 Freon 113
B6 HydrogenB7 Methane
B8 Methanol
B9 Octamethyltrisiloxane
B10 Trimethylsilanol
Bll Vinyl Chloride
17
19
39
61
91
121
139
143
149
169
177
185

Spacecraft Maximum Allowable
Concentrations for SelectedAirborne Contaminants
INTRODUCTION
The space station--a multinational effort--is expected to be launched
in 1997 and, in its presently planned configuration, is expected to carry
a crew of four to eight astronauts for up to 180 days. Because the space
station will be a closed and complex environment, some contamination
of its internal atmosphere is unavoidable. Several hundred chemical
contaminants are likely to be found in the closed-loop atmosphere of the
space station, most at very low concentrations. Important sources of
atmospheric contaminants include off-gassing of cabin materials, opera-
tion of equipment, and metabolic waste products of crew members.
Other potential sources of contamination are releases of toxic chemicals
from experiments and manufacturing activities performed on board the
space station and accidental spills and fires. The water recycling systemhas also been shown to produce chemical contaminants that can enter the
cabin air. Therefore, the astronauts potentially can be chronically ex-
posed to low levels of airborne contaminants and occasionally to highlevels of contaminants in the event of a leak, spill, or fire.
The National Aeronautics and Space Administration (NASA) is seek-
ing to ensure the health, safety, and functional abilities of astronauts and
seeks to prevent the exposure of astronauts to toxic levels of spacecraftcontaminants. Consequently, exposure limits need to be established for
continuous exposure of astronauts to spacecraft contaminants for up to
180 days (for normal space-station operations) and for short-term (1-24
hr) emergency exposures of astronauts to high levels of chemical con-taminants.
1
P__ PAGE _LA_ NOT _[M_D

2 SMACS FOR SELECTED AIRBORNE CONTAMINANTS
Federal regulatory agencies such as the U.S. Occupational Safety andHealth Administration (OSHA) and the U.S. Environmental Protection
Agency (EPA) have not promulgated exposure limits for the unique envi-
ronment of spacecraft, nor are their existing standards appropriate forthis environment. In 1972, the National Research Council's Committee
on Toxicology (COT) first recommended maximum levels for continuous
and emergency exposures to spacecraft contaminants (NRC, 1972).
However, that early report did not provide documentation of toxicity
data or the rationale for the recommended exposure levels. Toxicity
data for most of the compounds were not well developed at that time,and the risk-assessment methods were rudimentary. Over the past sev-
eral years, COT has recommended emergency exposure guidance levels
(EEGLs) and continuous exposure guidance levels (CEGLs) for several
hundred chemical substances for the U.S. Department of Defense (NRC,1984a,b,c,d; 1985a,b; 1986; 1987; 1988). However, EEGLs and
CEGLs are not available for most spacecraft contaminants. Because of
the experience of COT in recommending EEGLs and CEGLs, NASA
requested that COT establish guidelines for developing spacecraft maxi-
mum allowable concentrations (SMACs) that could be used uniformly by
scientists involved in preparing SMACs for airborne contaminants and
review the SMACs for individual contaminants to ascertain whether they
are consistent with the guidelines.
SMACs are intended to provide guidance on chemical exposures dur-
ing normal operations of spacecraft as well as emergency situations.
Short-term SMACs refer to concentrations of airborne substances (such
as a gas, vapor, or aerosol) that will not compromise the performance of
specific tasks by astronauts during emergency conditions or cause serious
or permanent toxic effects. Such exposures might cause reversible ef-
fects, such as mild skin or eye irritation, but they are not expected to
impair judgment or interfere with proper responses to emergencies.
Long-term SMACs are intended to avoid adverse health effects (either
immediate or delayed) and to prevent decremental change in crew per-
formance under continuous exposure to chemicals in the closed environ-
ment of the space station for as long as 180 days.
In response to NASA's request to establish guidelines for developing
SMACs and to review SMAC documents for selected spacecraft contam-
inants, COT organized the Subcommittee on Guidelines for Developing
Spacecraft Maximum Allowable Concentrations for Space Station Con-

SMACS FOR SELECTED AIRBORNE CONTAMINANTS 3
taminants. The subcommittee comprised experts in toxicology, epidemi-
ology, medicine, physiology, biochemistry, pathology, pharmacology,neurotoxicology, industrial hygiene, statistics, and risk assessment. In
the first phase of the study, the subcommittee prepared Guidelines for
Developing Spacecraft Maximum Allowable Concentrations for SpaceStation Contaminants (NRC, 1992). That report provided guidance for
deriving SMACs from available toxicological and epidemiological data.It also provided guidance on what data to use, how to evaluate the data
for appropriateness, how to perform risk assessment for carcinogenicand noncarcinogenic effects, and how to consider the effects of physio-
logical changes induced by microgravity that might enhance the suscepti-bility of astronauts to certain spacecraft contaminants. The executive
summary of that report is contained in Appendix A of this volume.
SUMMARY OF REPORT ON
GUIDELINES FOR DEVELOPING SMACS
As described in Appendix A, the first step in establishing SMACs fora chemical is to collect and review all relevant information available on
a compound. Various types of evidence are assessed in establishingSMAC values for a chemical contaminant. These include information
from (1) chemical-physical characterizations, (2) structure-activity rela-
tionships, (3) in vitro toxicity studies, (4) animal toxicity studies, (5) hu-
man clinical studies, and (6) epidemiological studies. For chemical con-
taminants, dose-response data from human exposure are most applicableand are used when available in preference to data from animal studies
and in vitro studies. Toxicity data from inhalation exposures are most
useful because inhalation is the most likely route of exposure.
For most chemicals, actual human toxicity data are not available.
Therefore, toxicity data from studies conducted in animals are extrapo-
lated to estimate the potential toxicity in humans. This requires experi-
enced scientific judgment. The toxicity data from animal species mostrepresentative of humans in terms of pharmacodynamic and pharmaco-
kinetic properties are used for determining SMACs. If data are not
available on which species best represents humans, the data from the
most sensitive animal species are used to set SMACs. Safety or uncer-
tainty factors are commonly used when animal data are extrapolated to a
4 SMACS FOR SELECTED AIRBORNE CONTAMINANTS
safe level for humans. The magnitude of uncertainty factors depends on
the quality of the animal data used to determine the no-observed-adverse-effect level (NOAEL). Conversion from animals to humans is done on a
body-weight or surface-area basis. When available, pharmacokinetic
data on tissue doses are considered for use in species interconversion.
Based on the review of the toxicity data and the use of appropriate
safety factors, SMACs for different periods are developed, and a ration-
ale is provided for each recommendation. One- or 24-hr emergency
SMACs are usually derived from acute exposure toxicity studies. Devel-
opment of 1- or 24-hr SMACs usually begins with providing a SMAC
for the shortest exposure of 1 hr. Values for 24-hr SMACs might neces-
sitate using Haber's law (C × T = k) when applicable. Detoxification
or recovery and data available on 24-hr exposures are taken into account
in modifying Haber's law.
When data from chronic exposure studies are available, they are usedto derive 7-, 30-, or 180-day SMACs, and safety factors are applied as
needed. For substances that affect several organ systems or have multi-
ple effects, all end points--including reproductive (in both sexes), devel-
opmental, carcinogenic, neurotoxic, respiratory, and other organ-relatedeffects--are evaluated, the most important or most sensitive effects re-
ceiving the major attention. With carcinogenic chemicals, quantitative
carcinogenic assessment is done, and the SMAC is set so that the esti-mated lifetime risk of a neoplasm is no more than 1 in 10,000 exposed
persons. When a substance is known to cause an effect that will be ag-
gravated by microgravity, additional safety factors are used.
REVIEW OF SMAC REPORTS
In the second phase of the study, the Subcommittee on Spacecraft
Maximum Allowable Concentrations reviewed reports for 35 spacecraft
contaminants to determine whether the recommended exposure limits
were consistent with the 1992 guidelines (see Appendix A). One of the
SMAC reports was prepared with the collaboration of members of this
subcommittee to serve as an example for NASA scientists in preparing
their reports on other substances. The remaining SMAC reports were
prepared solely by NASA scientists or contractors.These SMAC reports are intended for use by engineers in develop-
SMACS FOR SELECTED AIRBORNE CONTAMINANTS 5
ing design criteria for the space station. The SMAC reports will also be
applicable to the space shuttle, because the recommended SMACs will
cover the exposure times that are of interest to the space-shuttle
program--1-hr and 24-hr SMACs for emergencies and 7-day and 30-day
SMACs for continuous exposures.
The subcommittee's review of the SMAC reports prepared by NASA,NASA's contractors, and members of the subcommittee involved both
oral and written presentations to the subcommittee by the authors of the
reports. The subcommittee provided advice and recommendations for
revisions. The authors of the SMAC reports presented their revised re-
ports at subsequent meetings until approved by the subcommittee, which
depended upon the appropriate application of the guidelines developed in
the first phase of the study (NRC, 1992).
The subcommittee recognizes that many factors, such as the altera-
tions in normal human physiological and biochemical processes associ-
ated with spaceflight, are not fully understood and could warrant revi-
sions of proposed SMAC values as additional scientific data become
available. Because of the enormity of the data presented in the SMAC
reports, the subcommittee could not verify all the data. The subcommit-
tee relied on NASA scientists for the accuracy and completeness of the
toxicity data cited in the SMAC reports. Although individual data points
were not verfied by the subcommittee, it agrees with the proposedSMAC values.
This report is the first volume in the series Spacecraft Maximum Al-
lowable Concentrations for Selected Contaminants. It contains SMAC
reports on 11 spacecraft contaminants; these reports, presented in Ap-
pendix B, are approved by the subcommittee as consistent with the 1992
NRC guidelines. SMAC reports for additional spacecraft contaminants
will be presented in subsequent volumes.
REFERENCES
NRC (National Research Council). 1968. Atmospheric Contaminants in
Spacecraft. Washington, D.C.: National Academy of Sciences.
NRC (National Research Council). 1972. Atmospheric Contaminants in
Manned Spacecraft. Washington, D.C.: National Academy of Sci-ences.
6 SMACS FOR SELECTED AIRBORNE CONTAMINANTS
NRC (National Research Council). 1984a. Emergency and Continuous
Exposure Limits for Selected Airborne Contaminants, Vol. 1. Wash-ington, D.C.: National Academy Press.
NRC (National Research Council). 1984b. Emergency and Continuous
Exposure Limits for Selected Airborne Contaminants, Vol. 2. Wash-
ington, D.C.: National Academy Press.
NRC (National Research Council). 1984c. Emergency and Continuous
Exposure Limits for Selected Airborne Contaminants, Vol. 3. Wash-
ington, D.C.: National Academy Press.
NRC (National Research Council). 1984d. Toxicity Testing: Strategies
to Determine Needs and Priorities. Washington, D.C.: National
Academy Press.
NRC (National Research Council). 1985a. Emergency and Continuous
Exposure Guidance Levels for Selected Airborne Contaminants, Vol.
4. Washington, D.C.: National Academy Press.
NRC (National Research Council). 1985b. Emergency and Continuous
Exposure Guidance Levels for Selected Airborne Contaminants, Vol.
5. Washington, D.C.: National Academy Press.
NRC (National Research Council). 1986. Emergency and Continuous
Exposure Guidance Levels for Selected Airborne Contaminants, Vol.
6. Washington, D.C.: National Academy Press.
NRC (National Research Council). 1987. Emergency and Continuous
Exposure Guidance Levels for Selected Airborne Contaminants, Vol.
7. Washington, D.C.: National Academy Press.
NRC (National Research Council). 1988. Emergency and Continuous
Exposure Guidance Levels for Selected Airborne Contaminants, Vol.
8. Washington, D.C.: National Academy Press.
NRC (National Research Council). 1992. Guidelines for Developing
Spacecraft Maximum Allowable Concentrations for Space Station
Contaminants, Washington, D.C.: National Academy Press.
App endix A
Executive Summary of Guidelines for
Developing Spacecraft Maximum
Allowable Concentrations for SpaceStation Contaminants

Executive Summary:Spacecraft Maximum Allowable
Concentrations for Space StationContaminants
The National Aeronautics and Space Administration (NASA) is pre-
paring to launch a manned space station--Space Station Freedom--by the
mid-1990's. Because Space Station Freedom will be a closed complex
environment, some contamination of its atmosphere is inevitable. Sev-
eral hundred chemicals are likely to be found in the closed atmosphere of
the space station, most in very low concentrations. Important sources of
atmospheric contaminants include metabolic waste products of crew
members and off-gassing of cabin materials and equipment. Release of
chemicals from experiments performed on board the space station is also
a possible source of contamination, and the water reclamation system has
the potential to introduce novel compounds into the air. NASA is con-cerned about the health, safety, and functional abilities of crews exposedto these contaminants.
This report, prepared by the Committee on Toxicology of the National
Research Council's Board on Environmental Studies and Toxicology, is
in response to a request from NASA for guidelines to develop spacecraft
maximum allowable concentrations (SMACs) for space-station contami-
nants. SMACs are used to provide guidance on allowable chemical ex-
posures during normal operations and emergency situations. Short-termSMACs refer to concentrations of airborne substances (such as gas, va-
por, or aerosol) that will not compromise the performance of specific
tasks during emergency conditions lasting up to 24 hr. Exposure to 1- or
24-hr SMACs will not cause serious or permanent effects but may cause
9
10 SMACS FOR SELECTED AIRBORNE CONTAMINANTS
reversible effects that do not impair judgment or interfere with proper
responses to emergencies such as fires or accidental releases.
Long-term SMACs are intended to avoid adverse health effects (either
immediate or delayed) and to avoid degradation in crew performance
with continuous exposure in a closed space-station environment for as
long as 180 days. Chemical accumulation, detoxification, excretion, and
repair of toxic insults are thus important in determining 180-daySMACs.
ENVIRONMENTAL CONTROL AND
LIFE-SUPPORT SYSTEM
The environmental control and life-support system (ECLSS) of the
space station is designed to control temperature, humidity, and composi-
tion of space-station air, including CO 2 removal; recover water; dispose
of waste; and detect and suppress fires. Fires are a great potential haz-ard and much attention has been given to suppressing them. A fire sup-
pression system is available, but if all else fails, an escape vehicle can be
used. A subsystem of the ECLSS, the atmosphere revitalization system,
which includes a mass spectrometer called the major constituent ana-
lyzer, will analyze cabin air for 02, N2, H2, CO, H20, and CH 4 in all
areas of the habitation and laboratory modules. A design criterion for the
atmosphere revitalization subsystem is the maintenance of space-station
exposure levels below the 180-day SMACs under normal conditions.
MODIFICATION OF CONTAMINANT
TOXICITY BY ENVIRONMENTAL FACTORS
The special conditions of the space environment must be taken intoaccount in def'ming spacecraft contaminant exposure limits. Deposition
of particles is clearly different and lung function and the toxic potentialof inhaled particles may be different under microgravity conditions than
under full gravity conditions, as on earth.Astronauts will be physically, physiologically, and psychologically
compromised for the following reasons: loss of muscle and bone mass,altered immune system, cardiovascular changes, decreased red-blood-
EXECUTIVE SUMMARY 11
cell mass, altered nutritional requirements, behavioral changes from
stress, fluid shift in the body, altered hormonal status, and altered drug
metabolism. These changes could be important factors in disease sus-
ceptibility.
The physiological changes noted in spaceflight to date demonstratethat the astronaut is in an altered homeostatic state and thus may be more
susceptible to toxic chemicals. How this altered state modifies reactions
to chemicals in the space-station environment is not fully known. The
physiological changes induced in the space crew are important and their
impact must be taken into account in developing SMAC values for vari-ous contaminants.
SOURCES AND TYPES OF DATA FOR
ESTABLISHMENT OF SMACS
The subcommittee recommends the use of data derived from a number
of sources in establishing SMAC values. These sources provide infor-
mation on a variety of health effects including mortality, morbidity, clin-
ical signs and symptoms, pulmonary effects, neurobehavioral effects,
immunotoxicity, reproductive and developmental toxicity, pathology,mutagenicity, carcinogenicity, and biochemical and enzyme changes.
Chemical-Physical Characteristics of Toxicants
The chemical and physical characteristics of a substance provide valu-
able information on potential tissue dosimetry of the compound within
the body and on its likely toxic effects. Preliminary estimates of the toxic
potential of new chemicals also may be derived from known toxicities ofstructurally similar, well-investigated compounds. However, additional
uncertainty (safety) factors must be applied to arrive at safe levels for
those congeners that have no dose-response data from intact animals.
In Vitro Toxicity Studies
Useful information can be obtained from studies conducted to investi-

12 SMACS FOR SELECTED AIRBORNE CONTAMINANTS
gate adverse effects of chemicals on cellular or subcellular systems invitro. Systems in which toxicity data have been collected include isolated
organ systems, single-cell systems, and tissue cultures from multicellular
organisms maintained under defined conditions or from functional unitsderived from whole cells. In vitro studies can be used to elucidate the
toxic effects of chemicals and to study their mechanism of action.
Animal Toxicity Studies
The data necessary to evaluate the relationship between exposure to a
toxic chemical and its effects on people are frequently not available from
human experience; therefore, animal toxicity studies must be relied on to
provide information on responses likely to occur in humans.
The usefulness of animal data depends in part on the route of exposure
and species used. Although inhalation studies are most relevant in assess-
ing the toxicity of atmospheric contaminants, data from skin absorption,
ingestion, and parenteral studies are also useful. The relevance of animaldata to humans may be limited by the absence of information on affected
target organs and knowledge of metabolic pathways and pharmacokinet-ics in animals and humans.
Clinical and Epidemiological Observations
In establishing SMACs for chemicals, dose-response data from humanexposure should be used whenever possible. Data from clinical inhala-
tion exposures are most useful because inhalation is the most likely route
of exposure. Human toxicity data also are available from epidemiologi-
cal studies of long-term industrial exposures, from short-term high-level
exposures following accidents, or from therapeutic uses of some pharma-
ceutical agents. Some of these data provide a basis for estimating a
dose-response relationship.
Epidemiological studies have contributed to our knowledge of the
health effects of many airborne chemical hazards. The limitations of epi-
demiology stem from its use of available data. The accuracy of data onhealth outcomes varies with the source of the information, and records
documenting historical exposure levels are often sparse. For example,
EXECUTIVE SUMMARY 13
mortality information derived from death certificates is sometimes inac-
curate, and exposure information collected from administrative purposesis limited. Despite these limitations, if the populations studied are large
enough and have been exposed to high enough doses over a sufficient
period to allow for the expression of disease, epidemiological studies
usually provide valuable information on the effects of exposure in hu-
mans without resorting to cross-species extrapolation or to exposing hu-
mans in an experimental situation to possible injuries from chemical haz-ards.
Pharmacokinetics and Metabolism
Evaluation of the health effects of any chemical in a given environ-
ment is greatly facilitated by an understanding of its physiological dispo-sition in the body. Many chemicals require some form of metabolic acti-vation to exert their toxic effects. The formation of reactive metabolites
may depend on the level of exposure and the pharmacokinetics of the
chemical. Modern pharmacokinetic studies can provide physiologically
based models describing disposition of chemicals within organs and tis-
sues in the body. The space station is a closed system with limited capac-
ity to clear the air of chemical vapors; the crew contributes to the remov-
al of the chemicals from the air through sequestration and metabolism.
Toxic metabolites may be highly reactive chemically. These metabo-
lites are biologically reactive intermediates that may covalently bind to
nucleic acids or proteins that in turn, may alter DNA replication or tran-
scription. In addition to formation of reactive metabolites, metabolic
activity also may lead to formation of species of active oxygen that may
damage nucleic acids or proteins or cause lipid peroxidation. The result-
ing health effects may range from direct, short-term target-organ toxicity
to carcinogenesis.
Biological Markers
Biological markers are indicators of change within an organism that
link exposure to a chemical to subsequent development of adverse health
effects. Biological markers within an exposed individual can indicate the
14 SMACS FOR SELECTED AIRBORNE CONTAMINANTS
degree of exposure to a pollutant and may provide evidence of the initialstructural, functional, or biochemical changes induced by the exposure
and, ultimately, the biochemical or physiological changes associated withadverse health effects.
Biological markers can be divided into three classes:
1. Biological markers of exposure to pollutants may be thought of as
"footprints" that the chemical leaves behind upon interaction with the
body. Such markers contain the chemical itself or a metabolic fragment
of the chemical and thus are usually chemical-specific.
2. Biological markers of the effects of exposure include the totality of
subclinical and clinical signs of chemically induced disease states. The
markers of greatest interest are those that are early predictors of serious
effects or late-occurring effects. Such markers would be useful in deter-
mining what levels of pollutants in the space station can be tolerated
without causing irreversible deleterious health effects.
3. Biological markers of increased susceptibility to the effects of ex-
posure to pollutants could be used to predict which persons are most
likely to be at excess risk as space-station crew members.
RISK ASSESSMENT
(DEVELOPMENT OF EXPOSURE CRITERIA)
The assessment of toxicants that do not induce carcinogenic or muta-
genic effects traditionally has been based on the concept that an adversehealth effect will not occur below a certain level of exposure, even if
exposure continues over a lifetime. Given this assumption, a referencedose intended to avoid toxic effects may be established by dividing the
no-observed-adverse-effect level by an appropriate uncertainty factor orset of factors.
For carcinogenic effects, especially those known to be due to direct
mutagenic events, no threshold dose may exist. However, when carcino-
genesis is due to epigenetic or nongenotoxic mechanisms, a threshold
dose may be considered. Attempts to estimate carcinogenic risks associ-ated with levels of exposure have involved fitting mathematical models
to experimental data and extrapolating from these models to predict risksat doses that are usually well below the experimental range. The multi-

EXECUTIVE SUMMARY 15
stage model of Armitage and Doll is used most frequently for low-dose
extrapolation. According to multistage theory, a malignant cancer cell
develops from a single stem cell as a result of a number of biological
events (e.g., mutations) that must occur in a specific order. Recently, a
two-stage model that explicitly provides for tissue growth and cell kinet-ics also has been used in carcinogenic risk assessment.
The multistage model, characterized by low-dose linearity, forms the
basis for setting SMACs for carcinogens. Low-dose linearity is generallyassumed for chemical carcinogens that act through direct interaction with
genetic material.
ISSUES IN MAKING RECOMMENDATIONS
FOR THE ESTABLISHMENT OF SMACS
A number of issues need to be considered in developing recommenda-
tions for establishing SMACs. These issues include (1) translating animal
toxicity data to predict toxicities in humans; (2) determining 30- or 180-
day SMACs for carcinogens based on toxicological or epidemiologicalstudies that often involve long-term or lifetime exposure; (3) considering
limits set by the Occupational Safety and Health Administration, theAmerican Conference of Governmental Industrial Hygienists, and the
National Research Council in developing SMACs; (4) evaluating the tox-icities of mixtures; and (5) modifying risk assessments based on the al-
tered environment in the microgravity of space.

App en dix B
Reports on Spacecraft Maximum
Allowable Concentrations (SMACs) forSelected Airborne Contaminants


B1 Acetaldehyde
King Lit Wong, Ph.D.
Johnson Space Center Toxicology Group
Biomedical Operations and Research BranchHouston, Texas
PHYSICAL AND CHEMICAL PROPERTIES
Acetaldehyde is a colorless liquid with a fruity, pungent odor (Sax,1984).
Synonyms:
Formula:
CAS number:
Molecular weight:
Boiling point:
Melting point:
Vapor pressure:Conversion lactors at 25°C, 1 atm:
Ethanol, ethyl aldehyde, acetic
aldehyde
CH3CHO75-07-044
20.8°C
-123.5°C
740 mm Hg at 20°C
1 ppm = 1.80 mg/m 3
1 mg/m 3 = 0.56 ppm
OCCURRENCE AND USE
Acetaldehyde is used as a solvent in the rubber, paper, and tanning in-
dustries. We are not aware of any use of acetaldehyde in the spacecraft,
but acetaldehyde has been found in the cabin atmosphere during several
space-shuttle missions (NASA, 1988-90). The concentration detected
usually ranged from 2 to 7 ppb. However, a sample in one space-shuttle
mission was found to contain 140 ppb of acetaldehyde.
19
20 SMACS FOR SELECTED AIRBORNE CONTAMINANTS
The human is a potential source of acetaldehyde in space shuttles. It hasbeen estimated that acetaldehyde is produced at a rate of about 83 #g/d per
human (Olcott, 1972). One production mechanism is the cleavage of
L-threonine into glycine and acetaldehyde by threonine aldolase or serine
hydroxy-methyltransferase (White et al., 1978; Diamondstone, 1982). It isalso possible that acetaldehyde is absorbed during anaerobic metabolism of
glucose by microorganisms in human intestines via decarboxylation of
pyruvate by pyruvate decarboxylase (White et al., 1978; Harris, 1982). Inhuman subjects fasted for 9 h previously, acetaldehyde was found in the
expired air at an average rate of 17/zg/h (standard deviation = 25 #g/h),
with the data corrected for compounds present in the bottled, zero-grade air
they breathed (Conkle et al., 1975).
PHARMACOKINETICS
AND METABOLISM
When human volunteers inhaled acetaldehyde at 84-168 ppm for about 1
min, the respiratory tract retained 66-68 % of acetaldehyde at a respiratory
rate of 10 bpm (Egle, 1970). The respiratory retention of acetaldehydewas somewhat concentration dependent because the retention dropped to
55% when the acetaldehyde concentration was raised to 336 ppm (Egle,
1970). The respiratory rate also inversely affected acetaldehyde's respira-
tory retention. At an exposure concentration ranging from 84 to 336 ppm,
the percent retention of acetaldehyde linearly decreased by 25 as the
respiratory rate was increased from 5 to 40 bpm (Egle, 1970). Unlike the
respiratory rate, the tidal volume does not affect acetaldehyde's respiratory
retention. Varying the tidal volume between 500 and 2000 mL did not
change acetaldehyde's respiratory retention (Egle, 1970). Similar respira-
tory retention results were obtained in dogs (Egie, 1972).
Acetaldehyde is oxidized mainly in the liver to acetic acid by aldehyde
dehydrogenase, aldehyde oxidase, and xanthine oxidase (White et al.,1978). In the liver, aldehyde dehydrogenase is found in the cytosol,
mitochondria, and microsomes, but most of the hepatic aldehyde dehy-
drogenase activity exists in the mitochondria (Sipes and Gandolfi, 1986).
Aldehyde dehydrogenase is present in many mammalian tissues (Sipes and
Gandolfi, 1986), which probably include nasal mucosa because nasal
ACETALDEHYDE 21
mucosai homogenates of rats could oxidize acetaldehyde (Casanova-
Schmitz et al., 1984).
After a 1-h inhalation exposure of rats to acetaldehyde at 24,500 to
491,000 ppm, acetaldehyde disappeared from blood monoexponenfiallywith a half-life of 3.1 min (Hobara et al., 1985). During a 90-min, in vitro
incubation of acetaldehyde with human blood, the acetaldehydeconcentration showed an exponential biphasic decrease (Freundt, 1975).
The half-lives of the first and second phases were 57 and 110 min, re-
spectively (Freundt, 1975).
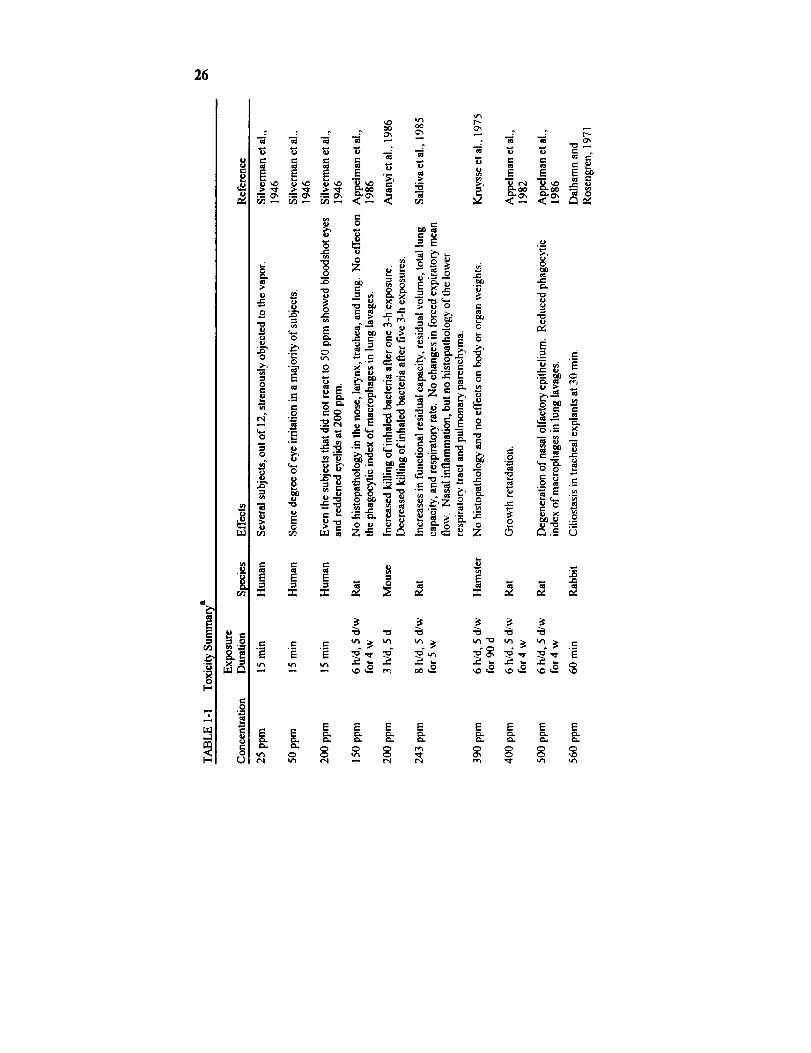
TOXICITY SUMMARY
Acute Toxicity
Mucosal Irritation
The eye is the most sensitive organ to acetaldehyde's acute toxicity. In
a study, 12 human subjects were exposed to acetaldehyde vapor for 15 min
while being shown a movie "to divert their attention," most of the subjects
developed eye irritation at 50 ppm, but it took more than 200 ppm to causenose or throat irritation in the majority of the subjects (Silverman et al.,
1946).
Other than comparing the sensitivities of several organs to acetalde-
hyde's irritancy, the investigators in that study also obtained concentra-
tion-response data on acetaldehyde's irritancy on the eyes: 50 ppm ir-ritated the eyes of most of the subjects, and several subjects strenuously
objected to the vapor at as low as 25 ppm (Silverman et al., 1946). Even
those who reported no eye irritation at 50 ppm showed erythematous
eyelids and bloodshot eyes when exposed to 200 ppm of acetaldehyde
(Silverman et al., 1946).
Based on a mouse model, acetaldehyde vapor is not as strong a sensory
irritant as acrolein or formaldehyde (Steinhagen and Barrow, 1984). Inthis mouse model, a chemical's sensory irritancy slows down the breathing
via a trigeminal nerve reflex (Alarie, 1973). Acetaldehyde at 2845 ppm
reduced the mouse's respiratory rate by 50% in 10 min, but it took only
22 SMACS FOR SELECTED AIRBORNE CONTAMINANTS
1.4 ppm of acrolein or 5 ppm of formaldehyde to slow the mouse breathing
by 50% (Steinhagen and Barrow, 1984).
Miscellaneous Mucosal Effects
In addition to causing mucosal irritation, acetaldehyde vapor can pro-
duce ciliostasis at 560 ppm within 30 min in rabbit tracheal explants
(Dalhamn and Rosengren, 1971). Acetaldehyde apparently also caused
DNA-protein crosslinks in rats' nasal mucosa (Lain et al., 1986). There
was evidence that DNA-protein crosslinks could be formed in the nasal
respiratory mucosa after a 6-h exposure and olfactory mucosa after fivedaily 6-h exposures of rats to acetaldehyde at 1000 ppm (Lain et al., 1986).
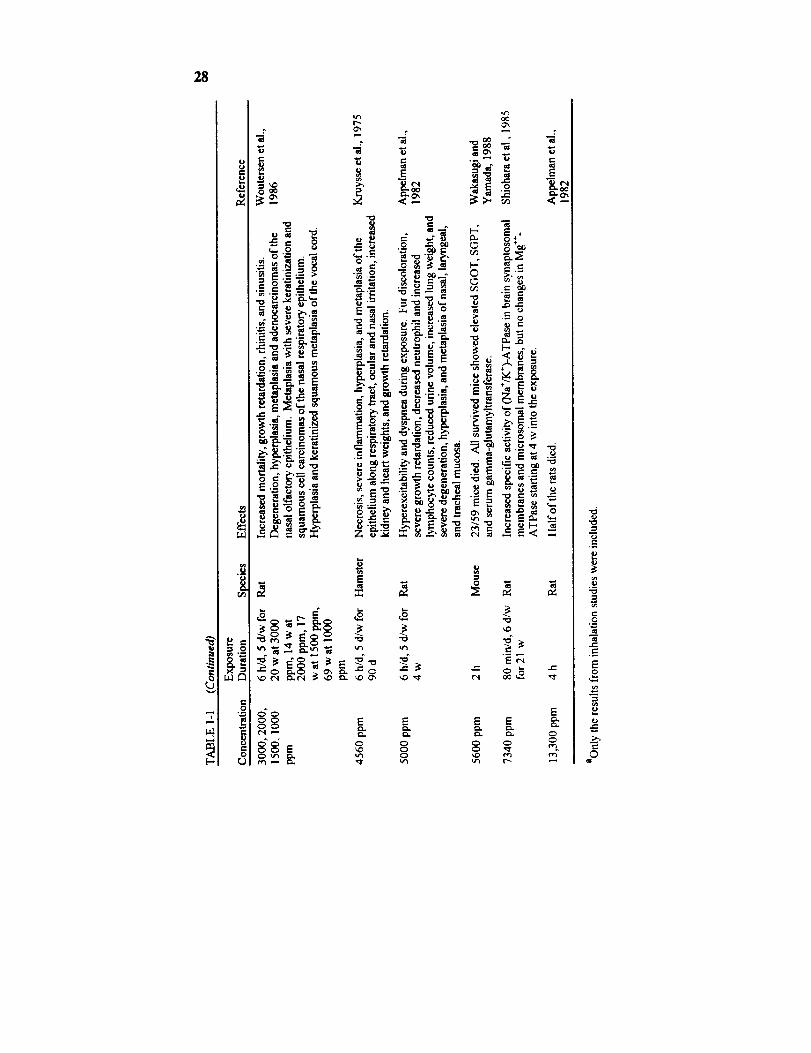
Lethality
Acetaldehyde is lethal at sufficiently high exposure levels. Its 4-h LC5oin rats is 13,300 ppm (Appelman et al., 1982). Exposure of mice to 5600
ppm for 2 h led to 40% mortality and elevated SGOT, SGPT, and serum
g-glutamyltransferase activities in the survivors (Wakasugi and Yamada,
1988). There was, however, no evidence of acetaldehyde causing liver
injury in other studies.
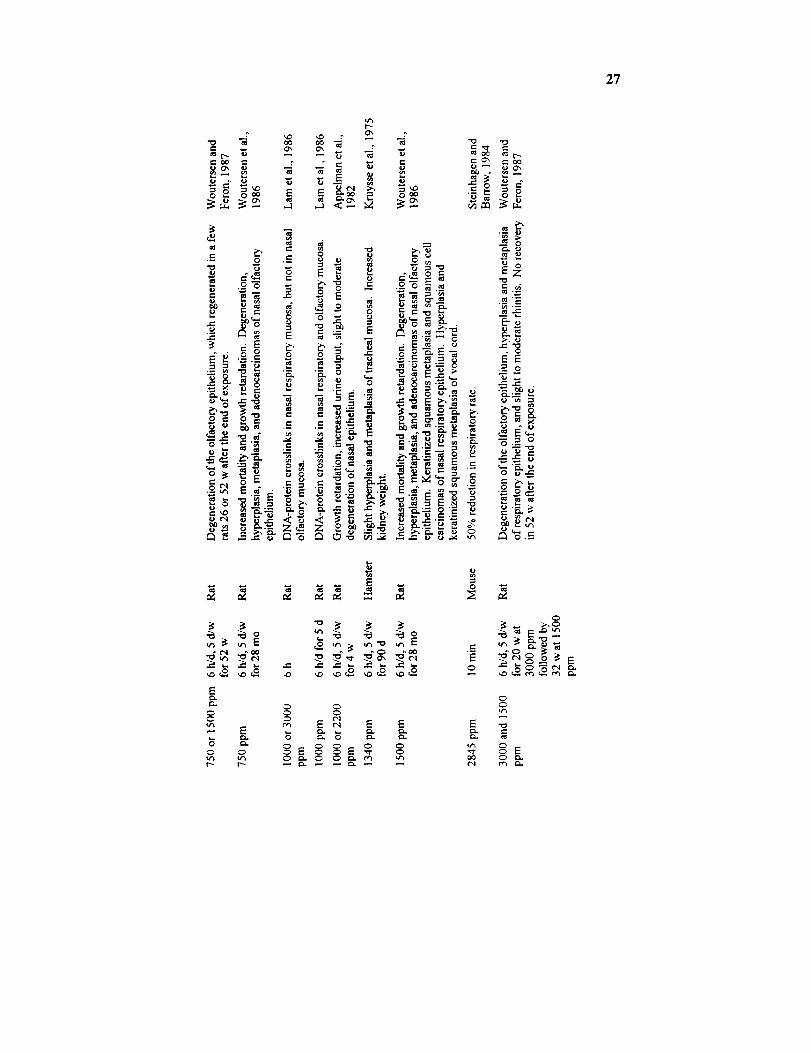
Subchronic and Chronic Toxicity
Nasal Toxicity
Consistent with acetaldehyde's acute toxicity, acetaldehyde causes
primarily nasal injuries in subchronic and chronic exposures. In rats,
exposures to acetaldehyde at 500 ppm, 6 h/d, 5 d/w for 4 w resulted in
growth retardation, the degeneration of nasal olfactory epithelium and
reduced phagocytic ability of pulmonary macrophages (Appelman et al.,1986). The no-daserved-adverse-effect level (NOAEL) in that study in rats
was 150 ppm. It is of interest that the NOAEL was 390 ppm in hamsters
in a 90-d study performed in the same laboratory with similar end points
(Kruysse et al., 1975). It thus appears that the rat is more sensitive than
ACETALDEHYDE 23
the hamster to acetaldehyde's subchronic toxicity. As the duration of
acetaldehyde's repetitive exposure was lengthened to 52 w, nasal injuries
similar to that seen in the 4-w study were also observed (Woutersen andFeron, 1987). However, some of the rats that developed degeneration of
the olfactory epithelium, after a 52-w, 6-h/d, 5-d/w exposure to
acetaldehyde at 750 ppm, recovered from the nasal injury in 26 or 52 w
after the end of the exposure (Woutersen and Feron, 1987). This indicates
that the nasal mucosa may regenerate after acetaldehyde exposure in rats.
Pulmonary and Renal Toxicity
In addition to injuring the nose, subchronic acetaldehyde exposures have
been shown to affect the lung and kidney. A 5-w exposure of rats to
acetaldehyde at 243 ppm, 8 h/d, 5 d/w produced increases in functional
residual capacity, residual volume, total lung capacity, and respiratoryrate, but no change in forced expiratory mean flows (Saldiva et al., 1985).
No changes in lung morphology, however, were detected in these rats
(Saldiva et al., 1985) or in rats repetitively exposed to acetaldehyde atconcentrations as high as 2200 ppm for 4 to 52 w (Appelman et al., 1982;
Appelman et al., 1986; Woutersen and Feron, 1987). A 90-d exposure ofhamsters to acetaldehyde at 1340 ppm, 6 h/d, 5 d/w increased the kidney
weight (Kruysse et al., 1975). A 4-w exposure of rats to acetaldehyde at
1000 ppm has been shown to increase the urine output (Appelman et al.,
1982). It was not known whether the increase in urine output was due to
acetaldehyde's effect on the kidney.
Cardnogenicity
There was only one epidemiology study with acetaldehyde. It showedthat the incidence of total cancer in acetaldehyde production workers was
higher than that in the general population (Bittersohl, 1974). Out of 220workers studied, nine cases of cancers were found: five cases of squamouscell carcinomas in the bronchial tress, two cases of squamous cell carcin-
omas in the mouth, one case of adenocarcinoma in the stomach, and onecase of adenocarcinoma in the cecum. The rates of bronchial cancers and
oral cancers were both higher than that in the whole German population.
24 SMACS FOR SELECTED AIRBORNE CONTAMINANTS
All nine men with cancers were smokers. Unfortunately, the study had
several deficiencies, including a small number of subjects and the fact that
the workers were exposed to a mixture of butyraldehyde, acetaldehyde,
crotonaldehyde, n-butanol, and ethylhexanoi, with butyraldehyde as thecompound with the highest concentration. The measured concentration of
acetaldehyde (l to 7 mg/m 3) was much lower than that of butyraldehyde (5to 70 mg/m3). As a result, acetaldehyde's carcinogenicity could not be
evaluated in this study.
A carcinogenicity bioassay was performed in rats by Woutersen et al.
(1986). They exposed rats to acetaldehyde at 0, 750, 1500, or 3000-1000
ppm, 6 h/d, 5 d/w for up to 28 mo. The 3000-1000-ppm group was
actually exposed at 3000 ppm for 20 w, 2000 ppm for 14 w, 1500 ppm for17 w, and 1000 ppm for 69 w. Other than degeneration, hyperplasia, and
metaplasia of the nasal mucosa, they found adenocarcinomas of the nasal
olfactory epithelium and squamous cell carcinomas of the nasal respiratory
epithelium in both the male and female rats. The combined incidences ofnasal adenocarcinomas and squamous cell carcinoma in the male rats were
1 of 49, 17 of 52, 41 of 53, and 36 of 49 in the 0-, 750-, 1500-, and 3000-
1000-ppm groups, respectively (Woutersen et al., 1986).The International Agency for Research on Cancer (IARC) concluded
that there is insufficient evidence of acetaldehyde's carcinogenicity in hu-
mans, but there is sufficient evidence that acetaldehyde is a carcinogen inanimals (IARC, 1987). Based on the carcinogenic findings in the rat, the
U.S. Environmental Protection Agency (EPA) classified acetaldehyde as a
probable human carcinogen (EPA, 1990).
Genotoxicity
There are some indications that acetaldehyde might be genotoxic. As
mentioned earlier, acetaldehyde exposure at 1000 ppm, 6 h/d for 5 d could
produce DNA-protein crosslinks in the nasal mucosa in rats (Lam et ai.,
1986). The data on the reaction with DNA in nasal mucosa of rats
supports the carcinogenicity findings in rats. Incubation of human
leukocytes with 10-20 mM acetaldehyde for 4 h in vitro has been shown by
Lambert et al. to produce DNA crosslinks, but not DNA strand breaks
(Lambert et al., 1985).
Although acetaldehyde was negative in the Ames test (Mortelmans et al.,

ACETALDEHYDE 25
1986), it was found to induce sex-linked recessive lethal mutations in
Drosophila melanogaster (Woodruff et al., 1985) and sister chromatid
exchange in human lymphocytes in vitro (Obe et al., 1979). Acetaldehydewas found to induce sister chromatid exchange in vitro without the addition
of S-9 fraction, suggesting that metabolic activation was not required.
Acetaldehyde also is known to produce chromosomal aberrations inmammalian cell culture (Bird et al., 1981). However, acetaldehyde failed
to produce chromosomal aberrations in Drosophila (Woodruff et al.,
1985).
Reproductive and Developmental Toxicity
No data were found on acetaldehyde's reproductive toxicity. However,
acetaldehyde might affect the fetus. Acetaldehyde administered in-
traperitoneally at 50, 75, or 100 mg/kg to pregnant rats on days 10, 11,and 12 of gestation led to fetal resorptions and decreased ossification ofsternebrae and vertebrae in all three dose groups on day 21 (Sreenathan
and Padmanabhan, 1982). Fetal growth was also severely impaired
because there were reductions in crown-rump length, tail length, body
weight, and transumbilical distance at all doses. The investigators ob-served malformations, such as reduction in the number of sternebrae, but
they did not report results of statistical analyses of those malformation data,
making interpretation difficult. They also did not mention if any maternal
toxicity was detected. No conclusive assessment of acetaldehyde's
teratogenicity can be made.
Synergistic Effects
There is no evidence that inhaled acetaldehyde acts synergistically withother chemicals. Pretreatrnent of rats with inhaled formaldehyde is known
to decrease the rat's sensitivity toward acetaldehyde's sensory irritation
(Babiuk et al., 1985). Inhalation exposures of mice to acetaldehyde havebeen shown to cause a metabolic tolerance to ethanol (Latge et al., 1987).
These findings should be considered in assessing the health risk of
exposures to a mixture of these compounds.
:Z6
E
l-,
=,
r_
i!0
...=,
8,=,0
r,.)
_, o ,-u
o ;._ = ='- = >= .=:,,_ =- _
=_ o_ "_
.- :._ = _ _ "_
._ _. ,_ _'_ _
= C• .=. ._
E "_r_
E E E EE E = = = =
E E E E
0", 0 0 ",.0
2"7
"0 m
i- OO _-
._o-6
,%
-_L_ _
o u
u cN
_, '_._
E
00
- E
0 0
,--1
t_
e-, 0",
0
o o
.o ...
._ ,m e-
_ 0
,- ._oo _ ,__
_'_o
"_._ _' _ 0 .--._ ,,-'_- _ _ _
_,. e.-,_" _,, ,_._ 0
__ _.o_,_=
--- "_ _ _,._
E
xO
E _ E E
0 0 0 u'_
"o
"o
E_
_E-2_._.'_--_I_ _
_,-_ _
r_ o,_=
0
00 0 _.
28
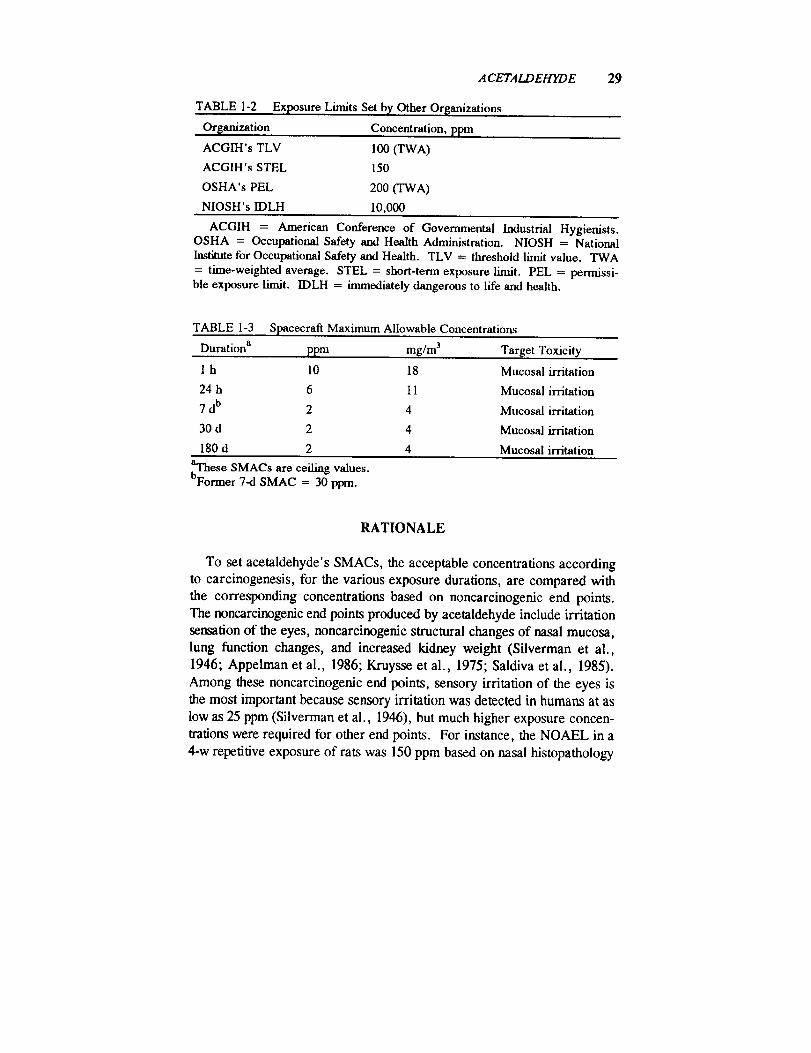
TABLE 1-2
Orlganization
ACGIH's TLV
ACGIH's STEL
OSHA's PEL
NIOSH's IDLH
A CETALDEHYDE
Exposure Limits Set b), Other Orsanizations
Concentration, ppm
100 (TWA)
150
200 (TWA)
10,000
29
ACGIH = American Conference of Governmental Industrial Hygienists.OSHA = Occupational Safety and Health Administration. NIOSH = NationalInstitute for Occupational Safety and Health. TLV = threshold limit value. TWA
= time-weighted average. STEL = short-term exposure limit. PEL = permissi-ble exposure limit. IDLH = immediately dangerous to life and health.
TABLE 1-3 Spacecraft Maximum Allowable Concentrations
Duration a ppm mg/m 3 Target Toxicity
1 h 10 18 Mucosal irritation
24 h 6 I 1 Mucosal irritation
7 db 2 4 Mucosal irritation
30 d 2 4 Mucosal irritation
180 d 2 4 Mucosal irritation
baThese SMACs are eeiling values.Former 7-d SMAC = 30 ppm.
RATIONALE
To set acetaldehyde's SMACs, the acceptable concentrations according
to carcinogenesis, for the various exposure durations, are compared with
the corresponding concentrations based on noncarcinogenic end points.
The noncarcinogenic end points produced by acetaldehyde include irritation
sensation of the eyes, noncarcinogenic structural changes of nasal mucosa,
lung function changes, and increased kidney weight (Silverman et al.,
1946; Appelman et al., 1986; Kruysse et al., 1975; Saldiva et al., 1985).
Among these noncarcinogenic end points, sensory irritation of the eyes is
the most important because sensory irritation was detected in humans at as
low as 25 ppm (Silverman et al., 1946), but much higher exposure concen-
nations were required for other end points. For instance, the NOAEL in a
4-w repetitive exposure of rats was 150 ppm based on nasal histopathology
30 SMACS FOR SELECTED AIRBORNE CONTAMINANTS
(Appelman et al., 1986). The lowest-observed-effect level (LOEL) based
on kidney weight changes was 1340 ppm in a 4-w repetitive exposure of
hamsters (Kruysse et al., 1975). Therefore, an exposure level low enough
to prevent eye irritation will also prevent nasal histopathology and kidney
weight changes.
It took 243 ppm of acetaldehyde to cause lung function changes in a 5-w
repetitive exposure of rats (Saldiva et al., 1985). In that study, the
investigators used only one acetaldehyde exposure concentration. Withoutany concentration response data on the lung function, it is difficult to
predict whether acetaldehyde, at a practically nonirritating level of 25 ppm,
would affect the lung function of humans in a repetitive exposure. The
lung function data of these investigators (Saldiva et al., 1985) were not
relied on in estimating the acceptable level based on noncarcinogenic end
points. The reason is that a 5-w repetitive exposure of rats to acetaldehyde
at 243 ppm increased the functional residual capacity, residual volume, and
total lung capacity (Saldiva et al., 1985). This pattern of lung functionchanges is typical for pulmonary emphysema (McCarthy, 1981), but no
emphysematous changes were detected in that study or in other subchronic
studies of acetaldehyde (Appelman et al., 1982, 1986; Kruysse et al.,
1975). Until these lung function effects of acetaldehyde are reproduced
and more data on acetaldehyde's lung function effects are available, lung
function changes will not be considered in estimating the acceptable acetal-
dehyde's exposure level for noncarcinogenic end points.The process used to set SMACs involves individual consideration of
significant toxic end points. For each toxic end point, an acceptable con-centration (AC) for the appropriate length of exposure is estimated. After
ACs are estimated for all the toxic end points under consideration, the
lowest AC for a given duration of exposure is then selected as the SMAC.
Carcinogenicity
According to EPA's estimates based on the linearized multistage model
(EPA, 1990), a life-time, continuous exposure to acetaldehyde at 0.046mg/m 3 or 0.025 ppm would lead to an excess tumor risk of 1 × 10⁴ in
humans. Using the approach of the NRC's Committee on Toxicology
(NRC, 1990) and setting k = 3, t = 25,550 d or 70 y, and s t = 10,950 dor 30 y, an adjustment factor of 26,082 is obtained to calculate a
ACETALDEHYDE 31
near-instantaneous exposure level that would yield the same excess tumor
risk as a continuous life-time exposure.
24-h exposure level that would yield an excess tumor risk of 10.4
= 0.025 ppm × 26,082
= 660 ppm.
For the 7-d, 30-d, and 180-d acceptable exposure levels based on car-
cinogenesis, adjustment factors are calculated with the approach of the
NRC's Committee on Toxicology (NRC, 1990), setting k = 3, t = 25,550
d, and s I = 10,950 d. The adjustment factors are 3728, 871, and 146.7 fora continuous 7-d, 30-d, and 180-d exposure, respectively, that would yield
the same excess tumor risk as a continuous life-time exposure.
7-d exposure level that would yield an excess tumor risk of 10-4
= 0.025 ppm × 3728
= 94 ppm.
30-d exposure level that would yield an excess tumor risk of 10-4
= 0.025ppm x 871
= 22 ppm.
180-d exposure level that would yield an excess tumor risk of 10-4
= 0.025 ppm x 146.7
= 4 ppm.
Mucosal Irritation
Silverman et al. (1946) conducted a study in which 12 human volunteers
were exposed to various organic compounds, one at a time, including
acetaldehyde, while the volunteers were shown motion pictures during the
exposure to "divert their thoughts from the atmospheric contamination." A
15-min exposure to acetaldehyde at 50 ppm resulted in some degree of eye
irritation in a majority of the volunteers. Even though most of the subjects
said that they were willing to work an 8-h day at 200 ppm (Silverman et
al., 1946), it does not mean that 200 ppm is an acceptable concentration
because the study of Silverman et al. was done in the mid-1940's, when
workers were probably more willing to endure undesirable work conditions
32 SMACS FOR SELECTED AIRBORNE CONTAMINANTS
due to the economic hard times. The finding that a 15-min exposure at 200
ppm produced bloodshot eyes and reddened eyelids in those subjects who
did not respond to 50 ppm (Silverman et ai., 1946) also tends to support the
conclusion that 200 ppm could be quite irritating. Several of the 12 volun-
leers strenuously objected to even 25 ppm of acetaldehyde, a concentration
not irritating to the majority of the test subjects (Silverman et al., 1946).
These data were prudently interpreted to mean that a 15-min acetaldehydeexposure at 200 and 50 ppm would probably result in moderate and mild
eye irritation, respectively; and some individuals, however, are more sensi-
tive to acetaldehyde's sensory irritation than others, so that 25 ppm is
nonirritating except to supersusceptible individuals.
Since the 1-h SMAC is designed for contingencies, slight eye irritation is
acceptable. Although a 15-rain acetaldehyde exposure at 25 ppm is not
irritating except to a minority of the individuals (Silverman et al., 1946),25 ppm is not acceptable as the 1-h SMAC because the irritation response
to 25 ppm could increase if the acetaldehyde exposure is extended to 1 h.
There is no time-response data on acetaldehyde's irritancy, but in humans
the eye irritancy of acrolein, another irritating aldehyde, at 0.3 ppm in-
creased when the exposure was extended from 15 to 40 min and it stayedconstant from 40 to 60 min (Webber-Tschopp et al., 1977). Therefore, the
15-rain acetaldehyde exposure level of 25 ppm should be lowered in
estimating a 60-min exposure level that would not be irritating except to a
minority of individuals.
How much it should be lowered is determined from the acetaldehyde
and acrolein data. The degree of eye irritation during an acrolein exposure
increased by one grade, from slight to moderate, when the exposure was
extended from 15 to 60 rain (Weber-Tschopp et al., 1977). So to estimate
a 60-rain exposure concentration of acetaldehyde that is as irritating as a
15-rain exposure concentration of acetaldehyde, the 15-rain exposure
concentration should be decreased by an amount that would drop the
irritancy by one grade and this lower concentration is made the 60-rain
exposure concentration. When the acetaldehyde concentration was reduced
two-fold from 50 ppm to 25 ppm in a 15-min acetaldehyde exposure, the
degree of eye irritation was found to decrease by one grade, from mildly
irritating in most of the 12 subjects to nonirritating in the majority of the
subjects (Silverman et al., 1946). Therefore, a 60-rain exposure concen-
tration of acetaldehyde that is one half the 15-rain exposure concentration
would probably be as irritating as the 15-min exposure concentration.
ACETALDEHYDE 33
1-h acceptable exposure level that would be nonirritating to most people= 15-min nonirritating exposure level x 1/time factor (TF)
= 25ppm × 1/2
= 12.5 ppm.
It should be noted that, even though the l-h AC based on irritation is
derived from data generated from only 12 human subjects by Silverman et
al. (1946), no correction is made for the small number of subjects. This is
because some degree of mucosal irritation is acceptable for a l-h contin-
gency, so the 1-h AC for irritation need not be too conservative. By the
same token, no correction is made for the small number of subjects in
deriving the 24-h AC based on Silverman's data.
In setting the 24-h AC, a 24-h exposure concentration of acetaldehydethat is one half the 15-min exposure concentration is assumed to be as
irritating as the 15-min concentration. Although there is no direct evidence
that the irritancy of acetaldehyde's vapor at 24 h would be the same as that
at 1 h, data on the irritancy of acrolein and ammonia indicate that the
irritancy of most sensory irritants reaches a plateau near 1 h. The irritancy
of 0.3-ppm acrolein in humans stayed constant from 40 to 60 min into anexposure (Weber-Tschopp et al., 1977). There were no significant dif-
ferences in ammonia's irritancy at 50 ppm in volunteers exposed for 0.5,1, or 2 h (Verberk, 1977). As a result, it is safe to assume that the irri-
tancy of acetaldehyde would not increase from 1 h to 24 h. This assump-
tion is consistent with the general belief that mucosal irritation is a surface
phenomenon, affected mainly by the exposure concentration, not the
exposure duration. So by applying the time adjustment factor of 2 on the15-min exposure concentration of 25 ppm, which was nonirritating to most
of the subjects in 15 min (Silverman et al., 1946), the resulting concentra-
tion of 12.5 ppm should also be nonirritating to most of the people in a
24-h exposure. But because a few of the 12 exposed subjects "strenuously
objected" to a 15-min acetaldehyde exposure at 25 ppm (Silverman et al.,
1946), a number of sensitive individuals might also strenuously object to a
60-min exposure at 12.5 ppm. For this reason, the acceptable 24-h expo-
sure concentration based on eye irritation should be lower than 12.5 ppm.
There is another reason why it should be lower. Even though some
probability of eye irritation is acceptable during a 24-h exposure to an
irritant at its 24-h SMAC because 24-h SMACs are designed for con-
tingency scenarios, the 24-h AC of an irritant is usually set slightly lower
34 SMACS FOR SELEC-TED AIRBORNE CONTAMINANTS
than its l-h AC to reduce the degree of irritation that the astronauts have toendure in 24-h contingencies. So in setting the 24-h AC, an additional
uncertainty factor (UF) is needed compared with the derivation of the 1-hAC. Because it is known that a reduction of the 15-rain exposure level of
acetaldehyde by 2, from 50 ppm to 25 ppm, reduced acetaldehyde's irri-
tancy from being slightly irritating to nonirritating in most of the subjects
(Silverman et al., 1946), 2 is selected to be that UF.
24-h acceptable exposure level based on eye irritation
= 15-min nonirritating level x I/TF x I/UF
= 25ppm x 1/2 x 1/2
= 6 ppm.
As discussed above, it is safe to assume that acetaldehyde's irritancy
would not increase from 1 h to 24 h. Similarly, the irritancy would not beexpected to increase as the acetaldehyde exposure is further lengthened to
7, 30, or 180 d. Consequently, the same acceptable exposure level based
on eye irritation may be used for 7, 30, or 180 d. To prevent eye irritationin practically all astronauts in a 7-d, 30-d, or 180-d exposure, a correction
factor of 10/(square root of n) is applied because there were only 12 human
subjects in Silverman's data (Silverman et al., 1946). This correction
factor for "small n" would provide an added margin of safety.
7-, 30-, or 180-d acceptable exposure level that would prevent eye irritation
= 15-min nonirritating level x I/TF x 1/UF x 1/small n factor
= 25ppm × 1/2 x 1/2 x (square root of n)/10
= 25ppm x 1/2 x 1/2 × (square rootofl2)/10
= 2 ppm.
The Establishment of SMACs
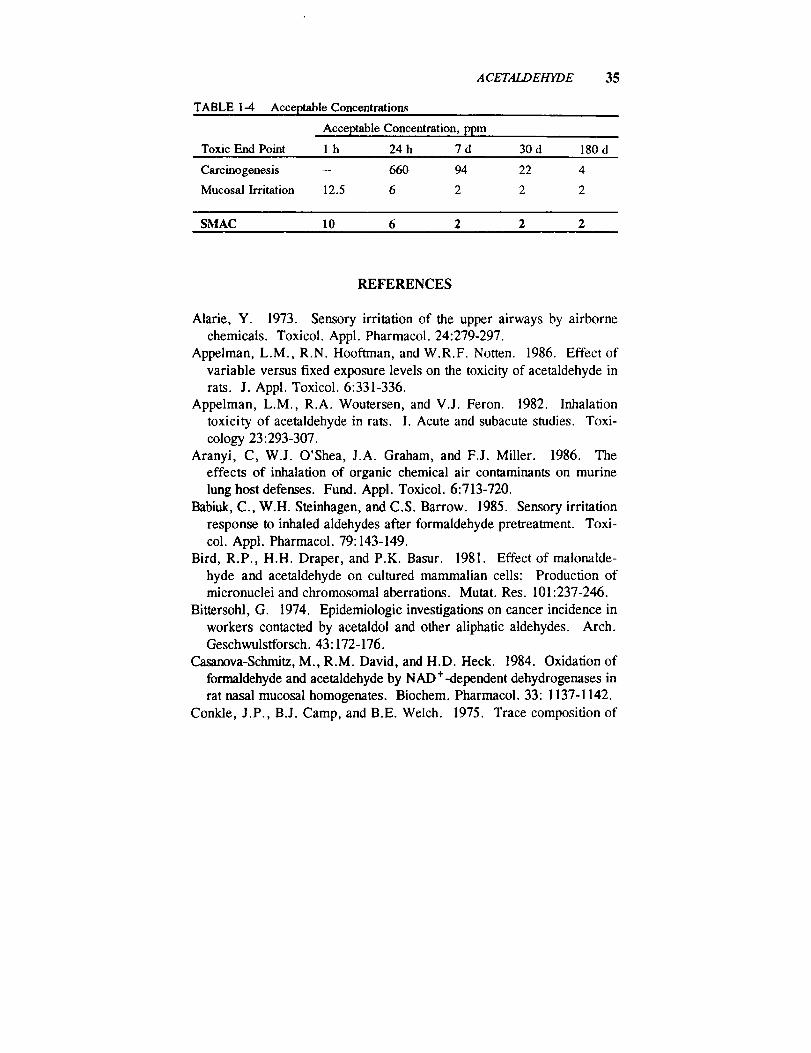
All the ACs derived for carcinogenesis are tabulated below. The ACs
based on eye irritation are lower than that based on carcinogenesis, so the
ACs of 10, 6, 2, 2, and 2 ppm for mucosal irritation are chosen to be the
l-h, 24-h, 7-d, 30-d, and 180-d SMACs, respectively.
35ACETALDEHYDE
TABLE 1-4 Acceptable Concentrations
Acceptable Concentration, ppm
Toxic End Point 1 h 24 h 7 d 30 d 180 d
Carcinogenesis -- 660 94 22 4
Mucosal Irritation 12.5 6 2 2 2
SMAC 10 6 2 2 2
REFERENCES
Marie, Y. 1973. Sensory irritation of the upper airways by airborne
chemicals. Toxicol. Appl. Pharmacol. 24:279-297.
Appelman, L.M., R.N. Hooftman, and W.R.F. Notten. 1986. Effect of
variable versus fixed exposure levels on the toxicity of acetaldehyde inrats. J. Appl. Toxicol. 6:331-336.
Appelman, L.M., R.A. Woutersen, and V.J. Feron. 1982. Inhalation
toxicity of acetaldehyde in rats. I. Acute and subacute studies. Toxi-
cology 23:293-307.
Aranyi, C, W.J. O'Shea, J.A. Graham, and F.J. Miller. 1986. Theeffects of inhalation of organic chemical air contaminants on murine
lung host defenses. Fund. Appl. Toxicol. 6:713-720.
Babiuk, C., W.H. Steinhagen, and C.S. Barrow. 1985. Sensory irritation
response to inhaled aldehydes after formaldehyde pretreatment. Toxi-
col. Appl. Pharmacol. 79:143-149.
Bird, R.P., H.H. Draper, and P.K. Basur. 1981. Effect of malonalde-
hyde and acetaldehyde on cultured mammalian cells: Production ofmicronuclei and chromosomal aberrations. Mutat. Res. 101:237-246.
Bittersohl, G. 1974. Epidemiologic investigations on cancer incidence in
workers contacted by acetaldol and other aliphatic aldehydes. Arch.Geschwulstforsch. 43:172-176.
Casanova-Schmitz, M., R.M. David, and H.D. Heck. 1984. Oxidation of
formaldehyde and acetaldehyde by NAD+-dependent dehydrogenases in
rat nasal mucosal homogenates. Biochem. Pharmacol. 33:1137-1142.
Conkle, J.P., B.J. Camp, and B.E. Welch. 1975. Trace composition of
36 SMACS FOR SELECTED AIRBORNE CONTAMINANTS
human respiratory gas. Arch. Environ. Health 30:290-295.
Dalhamn, T. and A. Rosengren. 1971. Effect of different aldehydes on
tracheal mucosa. Arch. Otolaryng. 93:496-500.Diamondstone, T.I. 1982. Amino acid metabolism II. P. 588 in Text-
book of Biochemistry with Clinical Correlations. T.M. Devlin, ed.
John Wiley & Sons, New York, N.Y.Egle, J.L., Jr. 1970. Retention of inhaled acetaldehyde in man. J.
Pharmacol. Exp. Ther. 174:14-19.
Egle, J.L. 1972. Retention of inhaled acetaldehyde in the dog. Arch.Environ. Health 24:354-357.
EPA. 1990. Acetaldehyde. In Integrated Risk Information System.Office of Health and Environmental Assessment. U.S. Environmental
Protection Agency, Washington, D.C.
Freundt, K.J. 1975. Behavior of the alcohol metabolite acetaldehyde inblood. Blutalkohol 12:389-392.
Harris, R.A. 1982. Carbohydrate metabolism I. P. 329 in Textbook of
Biochemistry with Clinical Correlations. T.M. Devlin, ed. John Wiley& Sons, New York, N.Y.
I-Iobara, N., A. Watanabe, M. Kobayashi, I-I. Nakatsukasa, H. Nagashi-ma, T. Fukuda, and Y. Araki. 1985. Tissue distribution of acetalde-
hyde in rats following acetaldehyde inhalation and intragastric ethanoladministration. Bull. Environ. Contam. Toxicol. 35:393-396.
IARC. 1987. Acetaldehyde. Pp. 77-78 in IARC Monographs on the
Evaluation of Carcinogenic Risks to Humans. IARC Monogr. Suppl. 7.
Kruysse, A., V.J. Feron, and H.P. Til. 1975. Repeated exposure to
acetaldehyde vapor. Studies in Syrian golden hamsters. Arch. Environ.Health 30:449-452.
Lam, C.W., M. Casanova, and H.D'A. I-leek. 1986. Decreased ex-
Iractability of DNA from proteins in the rat nasal mucosa after acetalde-
hyde exposure. Fund. Appl. Toxicol. 6:541-550.Lambert, B., Y. Chen, S.M. He, and M. Sten. 1985. DNA cross-links in
human leucocyte treated with vinyl acetate and acetaldehyde in vitro.Mutat. Res. 146:301-303.
Latge, C., Y. Lamboeuf, C. Roumec, and G. deSaint Blanquat. 1987.
Effect of chronic acetaldehyde intoxication on ethanol tolerance andmembrane fatty acid. Drug Alcohol Depend. 20:47-55.
McCarthy, D.S. 1981. Airflow obstruction. Pp. 19-33 in Pathophysi-
ACETALDEHYDE 37
ology of Respiration. M.H. Kryger, ed. John Wiley & Sons, NewYork, N.Y.
Mortelmans, K., S. Haworth, T. Lawlor, W. Speck, B. Tainer, and E.
Zeiger. 1986. Salmonella mutagenicity tests. II. Results from testingof 270 chemicals. Environ. Mutagen. 8:1-119.
NASA. 1988-90. Postflight reports for atmospheric analysis for STS-26,
STS-27, STS-28, and STS-32. JSC Toxicology Group, NASA, Johnson
Space Center, Houston, Tex.NRC. 1990. Guidelines for Developing Spacecraft Maximum Allowable
Concentration for Space Station Contaminants. National Academy
Press, Washington, D.C.Obe, G., A.T. Natarajan, M. Meyers, and A.D. Hertog. 1979. Induction
of chromosomal aberrations in peripheral lymphocytes of human bloodin vitro and of SCEs in bone-marrow cells of mice in vivo by ethanol
and its metabolite acetaldehyde. Mutat. Res. 68:291-294.Olcott, T.M. 1972. Development of a Sorbent Trace Contaminant Con-
trol System, Including Pre- and Postsorbers for a Catalytic Oxidizer.NASA CR-2027. Johnson Space Center, Houston, Tex.
Saldiva, P.H.N., M.P. do Rio Caldeira, E. Massad, D.F. Calheiros,
L.M.N. Cardosa, G.M. Bohm, and C.D. Saldiva. 1985. Effects of
formaldehyde and acetaldehyde inhalation on rat pulmonary mechanics.
J. Appl. Toxicol. 5:288-292.Sax, I. 1984. P. 74 in Dangerous Properties of Industrial Materials. Van
Nostrand Reinhold, New York, N.Y.
Shiohara, E., M. Tsukada, S. Chiba, H. Yamazaki, K. Nishiguchi, R.
Miyamoto, and S. Nakanishi. 1985. Effect of chronic administration of
acetaldehyde by inhalation on (Na ÷ + K+)-activated adenosine triphopha-
tase activity of rat brain membranes. Toxicology 34:277- 284.
Silverman, L., H.F. Schulte, and M.W. First. 1946. Further studies of
sensory response to certain industrial solvent vapors. J. Ind. Hyg.Toxicol. 28:262-266.
Sipes, I.G. and A.J. Gandolfi. 1986. Biotransformation of toxicants. P.73 in Casarett and Doull's Toxicology. The Basic Science of Poisons.
C.D. Klaassen, M.O. Amdur, and J. Doull, eds. Macmillan, New
York, N.Y.
Sreenathan, R.N. and R. Padmanabhan. 1982. Teratogenic effects of
acetaldehyde in the rat. Drug Alcohol Depend. 9:339-50.
38 $MAC$ FOR SELECTED AIRBORNE CONTAMINANTS
Steinhagen, W.H. and C.S. Barrow. 1984. Sensory irritation struc-
ture-activity study of inhaled aldehydes in B6C3F1 and Swiss-Webstermice. Toxicol. Appl. Pharmacol. 72:495-503.
Stowell, A.R., R. Greenway, and R.D. Batt. 1977. Acetaldehyde forma-
tion during deproteinizafon of human blood samples containing ethanol.Biochem. Med. 18:392-401.
Verberk, M.M. 1977. Effects of ammonia in volunteers. Int. Arch.
Occup. Environ. Health 39:73-81.
Wakasugi, C. and M. Yamada. 1988. Inhalation toxicity of acetaldehyde.Kogai to Taisaku 24:57-60.
Weber-Tschopp, A., T. Fischer, R. Gierer, and E. Grandjean. 1977.[Experimentally induced irritating effects of acrolein on men.] Int.
Arch. Occup. Environ. Health 40:117-130.
White, A., P. Handler, E.L. Smith, R.L. Hill, and I.R. Lehman. 1978.
Principles of Biochemistry. Pp. 449, 476, and 737. McGraw-Hill,New York, N.Y.
Woodruff, R.C., J.M. Mason, R. Valencia, and S. Zimmering. 1985.
Chemical mutagenesis testing in Drosophila. V. Results of 53 coded
compounds tested for the National Toxicology Program. Environ.Mutagen. 7:677-702.
Woutersen, R.A., L.M. Appelman, A. Van Garderen-Hoemaer, and V.J.
Feron. 1986. Inhalation toxicity of acetaldehyde in rats. III. Car-
cinogenicity study. Toxicology 41:213-231.
Woutersen, R.A. and V.J. Feron. 1987. Inhalation toxicity of acetalde-
hyde in rats. IV. Progression and regression of nasal lesions after
discontinuation of exposure. Toxicology 47:295-305.

B2 Ammonia
King L# Wong, Ph.D.
Johnson Space Center Toxicology GroupBiomedical Operations and Research BranchHouston, Texas
PHYSICAL AND CHEMICAL PROPERTIES
Ammonia is a colorless gas with a sharp, burning odor (ACGIH, 1986).
Formula:
CAS number:
Molecular weight:Boiling point:
Melting point:Vapor pressure:
Conversion factors at 25°C, 1 arm:
NH 37664-41-7
17.0
-33.5°C
-77,7°C
8.5 atm at 20°C for liquid NH 31 ppm = 0.69 mg/m 3
1 mg/m 3 = 1.44 ppm
OCCURRENCE AND USE
Ammonia can be used in coolant loops as a refrigerant. There is an
internal biological source of ammonia from amino acid metabolism (White
et al., 1978). It is difficult to predict the exposure levels in the spacecraft.
On the shuttle, a large amount of ammonia is used in the coolant loop and
it is triply contained.
39
40 SMACS FOR SELECTED AIRBORNE CONTAMINANTS
PHARMACOKINETICS AND METABOLISM
The principal internal source of ammonia is the oxidation of glutamate
by glutamate dehydrogenase in tissues, in particular the liver (White et al.,1978). Minor internal sources include oxidative and nonoxidative deamina-
tions of amino acids in the liver and kidney. Another source of ammonia isthe bacterial degradation of urea in the large intestine (Diamondstone,
1982). Ammoma averages about 100/zg/100 mL in blood (Diamondstone,
1982). Once formed inside the body, ammonia is used in the syntheses of
glutamine, asparagine, and carbamoyl phosphate, which is utilized inarginine synthesis (White et al., 1978).
The body eliminates ammonia in two major ways, both of which pro-
teed indirectly via amino acid metabolism. One way is the hepatic metabo-
lism of arginine into urea, which is excreted in the urine (White et al.,
1978). The second major way is the renal metabolism of glutamine into
free ammonia, which is excreted in the urine for maintaining the body'sacid-base balance (Diamondstone, 1982). Ammonia could be excreted in
the urine at 680 mg or 40 mEq per day in humans (Eastman, 1963). A
minor elimination pathway is via exhalation. Ammonia vapor has been
measured in the expired air from the mouth of rabbits ranging from 0.014
to 1.09 ppm (Vollmuth and Schlesinger, 1984).
When exposed to ammonia gas, the human nose retains 83% of am-
monia inhaled at a ventilation rate corresponding to light activity (Landahland Herrmann, 1950). Being extremely water soluble, ammonia gas
readily dissolves in the moisture present on the mucosa that comes in
contact with it (Helmers et al., 1971; O'Kane, 1983).
TOXICITY SUMMARY
Mechanisms of Tissue Injuries
Ammonia's principal toxic effect is to irritate mucous membranes, caus-
ing burning sensation in the eyes, nose, and throat with little systemic
toxicity, but sensory fatigue develops toward the irritation with continuousor repetitive exposure (Hatton et al., 1979). In accidental massive expo-
sures, ammonia harms the tissue it comes in contact in two ways (Arwood
et al., 1985). One is via the ammonium hydroxide formed when ammonia
AMMONIA 41
dissolves in the liquid lining the mucous membrane, causing liquefaction oftissues in a manner similar to that seen in alkali burns. The second mecha-
nism of tissue injury is the release of heat in the solvation of ammonia inthe liquid on the mucous membrane.
Mucosal Irritation in Naive Subjects
Ammonia's irritation response depends on whether the subject has adapt-
ed to it. Based on their experiences in manufacturing facilities for am-
monia, nitrate, and urea in Italy, Vigliani and Zurlo (1956) reported thatunadapted workers found 20-ppm ammonia irritating to the mucous mem-
branes, but adapted workers did not complain of any irritating sensation
upon long-term exposures to 20 ppm. However, there was a slight rednesson the conjunctiva of the adapted workers after the 20-ppm exposures.
The irritation data on unadapted workers reported by other investigatorsare summarized here. MacEwen et al. (1970) studied the subjective
irritation of a 10-min exposure of five or six unadapted human volunteers
to 30 or 50 ppm ammonia (MacEwen et al., 1970). Two of five subjects
found 30 ppm to be faintly irritating (the irritation was just perceptible, butnot painful). In contrast, four of six subjects found 50 ppm to be moder-
ately irritating. Only one of six subjects felt that 50 ppm was faintly
irritating and this subject did not find 30 ppm irritating (MacEwen et al.,
1970). Irritation data of ammonia exposures at concentrations higher than
50 ppm, lasting longer than 10 rain, have been reported by Verberk(1977), who compared the irritation responses of eight students who did not
know ammonia's toxicity with those of eight "experts" who were familiar
with ammonia's toxicity. Since neither the students nor the "experts" were
accustomed to ammonia's effects by personal contact before the study, the
data of the two groups are combined and summarized in Table 2-1.
It can be concluded from the data of Vigliani and Zurlo (1956),
MacEwen et al. (1970), and Verberk (1977) that ammonia vapor couldproduce irritation sensation on mucous membranes in unadapted human
subjects at as low as 20 ppm.
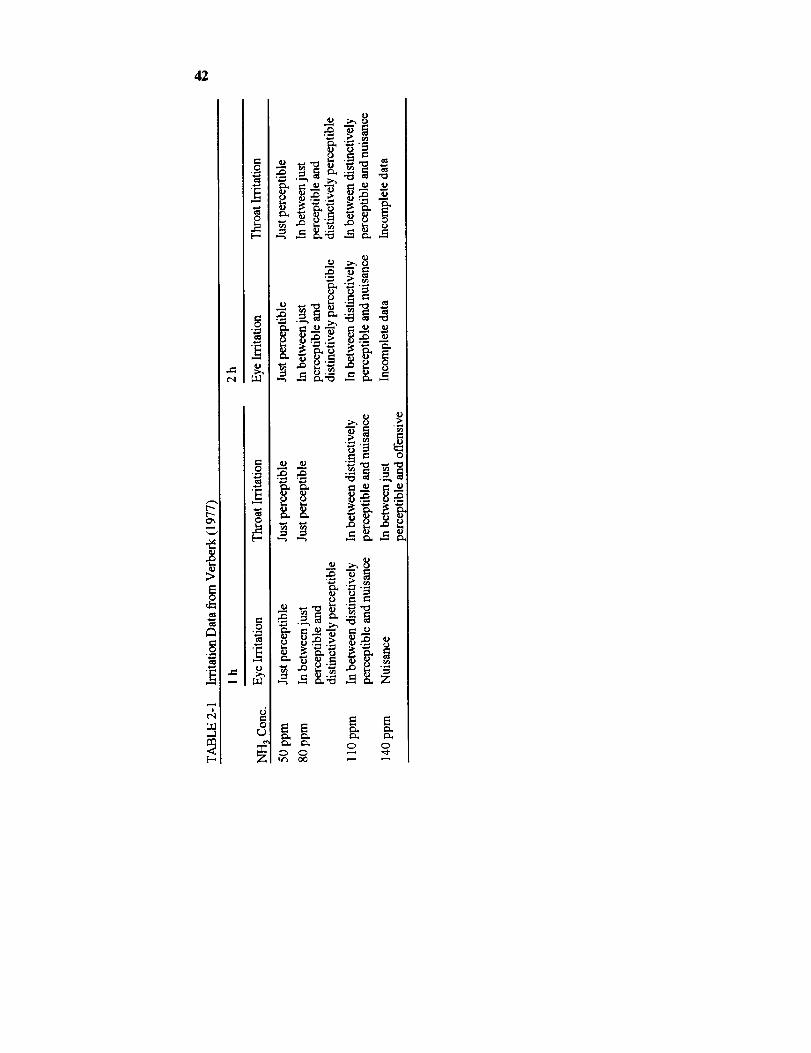
42
E
.o_ _
°_ _
0 0
AMMONIA 43
Mucosal Irritation in Adapted Subjects
Holness et al. (1989) reported that, in 58 soda ash workers, who have
been continually exposed to ammonia on the job, an exposure to 9.2-ppm
ammonia on the first and last workdays of their workweek did not produceany symptoms, effects on the sense of smell, or effects on lung functions,
such as forced expiratory volume in 1 s and forced vital capacity (Douglas
and Coe, 1987). Ferguson et al. (1977) showed that, in several subjects
exposed to 25-100-ppm ammonia daily for 2-6 h for 5 d in the previous
week, only one of four subjects developed mild mucosal irritation (pinkishred mucosa upon examination by a physician) when exposed to 25-ppm
ammonia, 2 h a day for 5 d. However, at a more severe exposure of 50-
pm ammonia, 4 or 6 h/d for 5 d, all six subjects developed mild mucosal
irritation. Based on their experiences in manufacturing plants for ammo-
nia, nitrate, and urea, Vigliani and Zurlo (1956) reported that workers,
presumably adapted, could not breathe 100-ppm ammonia for too longwithout developing irritation of the upper respiratory tract and the conjunc-
tiva. In conclusion, in adapted human subjects, ammonia at 9 ppm is not
irritating, but whether 25 ppm or 50 ppm produces irritation symptoms is
unknown. Nevertheless, based on an objective sign of irritation (mucosal
erythema), 25 ppm is barely irritating, and 50 ppm is definitely irritating,albeit only mildly, in adapted subjects.
Mucosal Irritation in SubjectsOf Unknown Adaptation Status
This section summarizes the irritation data on individuals with unknown
adaptation status. Weatherby (1952) reported that five or six members of
his laboratory staff, upon inhaling the exhaust from a chamber in which
guinea pigs were exposed to 140-200-ppm ammonia, gave their opinion
that no person would voluntarily remain in such an atmosphere for any
length of time because of the respiratory distress and disagreeable odor.Henderson and Haggard (1943) reported that it took at least 408-ppm
ammonia to cause immediate throat irritation. Other reports indicate that
ammonia could produce immediate eye injury at 700 ppm and laryngo-
spasm at 1700 ppm (Helmers et al., 1971; Grant, 1974). Death is possible
at 2500 ppm (Helmers et al., 1971).

44 SMACS FOR SELECTED AIRBORNE CONTAMINANTS
Toxic Effects of Massive Exposures
As the exposure concentration increases, ammonia affects not only the
upper airways, it can also cause pulmonary or alveolar injuries (Hatton etal., 1979). All our knowledge of the toxic effects of ammonia at high
concentrations in humans is generated from our experiences with accidental
ammonia releases, in which there are no data on the exposure concentra-
tions. However, via qualitative characterization of the exposure and
response, the toxic effects of massive ammonia exposures can be separated
into six groups.Most accidental ammonia releases involved a rupture of refrigerant
storage tanks, tank trucks, or railroad tank cars containing many gallons of
anhydrous liquid ammonia (Price et al., 1983; Close et al., 1980;
Montague and Macneil, 1980; Kass et al., 1972; Flury et ai., 1983). In the
first group of cases, the victims were situated close enough to the ruptured
tank that they came in direct contact with anhydrous ammonia and alsoinhaled the ammonia vapor at presumably very high concentrations (Close
et al., 1980). According to Close et al., victims in this group died shortly
afterward with severe chemical burns over most of the body, full-thicknesschemical burns of the entire tracheobronchiai tree, and extensive pulmo-
nary edema.In the second group, the fatal course was more prolonged than in the
first group (Arwood et al., 1985; Price et ai., 1983). Immediately after the
accident, the victims developed chemical burns over the face, eyes, oro-
pharynx, back, and legs. Arwood et al. reported that some of them rapidly
developed corneal opacities. Within a day, according to Price et al., some
of them were coughing up large quantities of greenish mucus. Both studies
reported severe respiratory distress, tachypnea, dyspnea, pulmonary
edema, crackles or wheezing over the lung fields, and bilateral pulmonary
infiltrates in chest x-ray. Hypoxemia began in the first or second day and
remained until death. The hypoxemia showed a variable course of steadydeterioration, oscillating between deterioration and improvement, or
remaining constant with time. The victims died in 10 d to 12 w. The two
victims who died in 10-16 d were oliguric a few days before death, and
their autopsies showed lung congestion with purulent exudates in smaller
bronchi, necrotizing bronchitis with ulceration and membrane formation,
and severe intraalveolar fibroblastic proliferation (Arwood et al., 1985).
For the victim who died 12 w after the exposure, an autopsy revealed
AMMONIA 45
patchy ulceration and squamous metaplasia of bronchi, whose mucosa were
partially replaced by granulation tissue, bronchiectasis, peribronchiolar
fibrosis, patchy congestion and edema of the alveolar region (Price et al.,
1983). Similarly, Kass et al. (1972) reported radiological studies showing
bronchiectatic changes in two victums 2 y after a massive exposure to
ammonia. Unlike the victims who died in 10-16 d in the study of Arwood
et al. (985), Price et al. (1983) reported that the victim who died in 12 w
did not have fibrosis of the alveolar region. This victim also developed
severe airflow obstruction, which got worse with time, in the last 8 w.
Airflow obstruction was also detected by Kass et al. (1972) and Flury et al.
(1983) in three victims 1-2 y after a massive exposure to ammonia.
The victims of the remaining three groups did not die from the ammonia
exposure. The third group of victims were also exposed to anhydrous
ammonia cutaneously and to ammonia vapor via inhalation, but they
survived. They sustained chemical burns of the face and the mucous
membranes of the upper airway (Close et al., 1980). There was also acute
upper airway obstruction. Close et al. postulated that the upper airway
obstruction might have protected the remainder of the tracheobronchial tree
from the harmful effects of ammonia vapor. Although the acute airway
obstruction was life-threatening, the victims probably did not die from that
because they were rescued and hospitalized after less than 30 min of
exposure, when emergency airways were created for them (Close et al.,
1980). These victims developed inspiratory wheezing, rhonchi, and rales.
They recovered in 1-2 mo and did not develop any pulmonary sequelaeafterward.
The fourth group of victims were in the vicinity of the ruptured tank
without coming in direct contact with the liquid ammonia, but they did
inhale the gaseous ammonia for longer than 30 min (Close et al., 1980).
Close et al. reported that they all had first-degree chemical burns of the
eyes, face, and exposed skin, but they had no acute upper airway ob-
struction. Initially the victims appeared to have sustained very little inter-
nal injuries because, upon hospital admission, both the chest examination
and x-ray were normal and only one of nine of the victims developed
hypoxemia. Because the victims did not develop upper airway obstruction
acutely, their lungs were not protected against ammonia at concentrations
too low to cause acute lung damage but sufficient to lead to insidious lung
damage. During the next 2 to 6 mo, obstructive pulmonary function
gradually developed, followed by a slight improvement and then stabiliza-

46 SMACS FOR SELECTED AIRBORNE CONTAMINANTS
tion. The moderate obstructive pulmonary function with considerable
bronchoalveolar perfusion deficits remained constant for the next 2 y
(Close et al., 1980).
Both the fifth and sixth groups of victims were exposed to high con-centrations of gaseous ammonia for several seconds to several minutes
(Montague and Macneil, 1980). Montague and Macneil reported that in
day 1 both groups had inflammation of conjunctiva and pharynx, pain in
the pharynx and chest, cough, and dyspnea, but there were no chest x-rayabnormalities. The major difference between the fifth and sixth groups
was their results in chest examinations. Based on this study, Montague and
Macneil concluded that, in terms of predicting the clinical course of ammo-
nia inhalation, chest x-ray is of little value, and chest examinations aremuch more important (Montague and Macneil, 1980). In chest examina-
tions, the fifth group exhibited abnormalities, such as rales, rhonchi, or
wheezing, while the sixth group had no abnormalities. The fifth group
developed moderate hypoxemia, but the sixth group had only mild hypox-emia. In addition, the fifth group had tachypnea and tachycardia. The
sixth group recovered on the second day after the exposure. In contrast,
the fifth group developed airway obstruction and productive cough in thenext several days. The fifth group finally recovered about 1 w after the
exposure (Montague and Macneil, 1980).In summary, massive ammonia exposures usually cause chemical burns
of the face, eyes, pharynx, or even the torso; some degree of mucosal
injury of the tracheobronchial tree; productive cough; and hypoxemia.
Airway obstruction is produced either acutely or as a sequelae. If the
e_e is severe, there can be deep lung injuries, resulting in acute rales,
rhonchi, or wheezing and bronchiectasis later.
Animal Models of Ammonia's
Respiratory Damage
Niden (1968) demonstrated ultrastructural damage to the respiratory
system of mice exposed to an extremely high concentration of ammonia, an
exposure probably similar to that of the first group of human victims. He
exposed mice to 28% ammonia, which killed the mice in 3 to 60 min. He
found an increase in the number of secretory granules in Clara cells and
the ballooning of Clara cells. Mitochondrial and endoplasmic swelling in
AMMONIA 47
type II pneumocytes, extensive swelling of the alveolar epithelium with
edema fluid, and intracapillary platelet thrombosis in the lung also oc-curred.
The biphasic nature of ammonia's damage to the respiratory system seen
in the fourth group of human victims has been reproduced somewhat by
Dodd and Gross (1980) in cats exposed to 1000 ppm ammonia for 10 min.
In the first day after exposure, the cats exhibited necrotizing bronchitis
primarily in the large bronchi, but the bronchioles were hardly damagedand the centriacinus was normal, indicating that the bronchoconstriction
reflexes protected deep parts of the lung. Pulmonary function reflected the
pathology in these cats. Increases in the work of breathing, airway resis-
tance, and pulmonary tissue resistance agreed with pathological changes in
the air conducting pathways, and a lack of change in the functional residual
capacity agreed with the lack of central lung damage. On the seventh dayafter exposure, the mucosal lesions were healed, but pulmonary conges-
tion, edema, and interstitial emphysema still existed. The increases in the
work of breathing and airway resistance disappeared on the seventh day.
However, both pulmonary resistance and pulmonary tissue resistance were
increased. On the 21st day after exposure, bronchitis, bronchiolitis, early
bronchopneumonia, and scattered bulbous emphysema had developed,which the investigators felt represented sequelae of the initial chemical
insult (Dodd and Gross, 1980). Even though there were no differences,
compared with the values before exposure, in airway resistance, increaseswere seen in the functional residual capacity, work of breathing, pul-
monary resistance, and pulmonary tissue resistance on the 21st day (Dodd
and Gross, 1980).
Metabolic Acidosis
Although mucosal irritation is its major toxicity, ammonia could cause a
systemic effect. Manninen et al. (1988) exposed rats to ammonia at 25 or300 ppm, 6 h/d for 5, 10, or 15 d. They found metabolic acidosis after 5 d
of exposure at both concentrations. However, the metabolic disturbance is
not long lasting because it disappeared in later time points. After a 15-d
exposure to 25 or 300 ppm, Manninen et al. failed to find any treatment-
related histopathology in the lung, liver, and kidney.

48
EE
r_
[..
.u
0
c-O
_J
o_ 5
_ _ ._-_.__ _
.N _ "e_
_ _i _
0
_' 0
_ _-_ ._-• _
oO
_._, [.-o, : o
=° '_ i !___ _ _
o_ e_ .
__ ._._
_ _. _
E E E E
E E E E E E_o = ° ° =°
°_r_ ..= .E E
E E E
_ Cxl e_ c'l en
.E
E E E E E

49
m r'
_o=
_.',6
8t-,
0
0
.c ._
•- _ £o '_ _ _" _ --E
> = o
_= _ _= __ °° °._,_= E - "_
_ _ °'_° i'- ""--"_ " "" " 0 "*
__-i_ _ _ _° _"_ __,_ ...... Z,'_
E E E _ E _E E E E EE
Z _|
s & &('4 0
-_ = _ Z - Z _ Z Z _° Z Z'
EEE _ Z ZEEE E E&
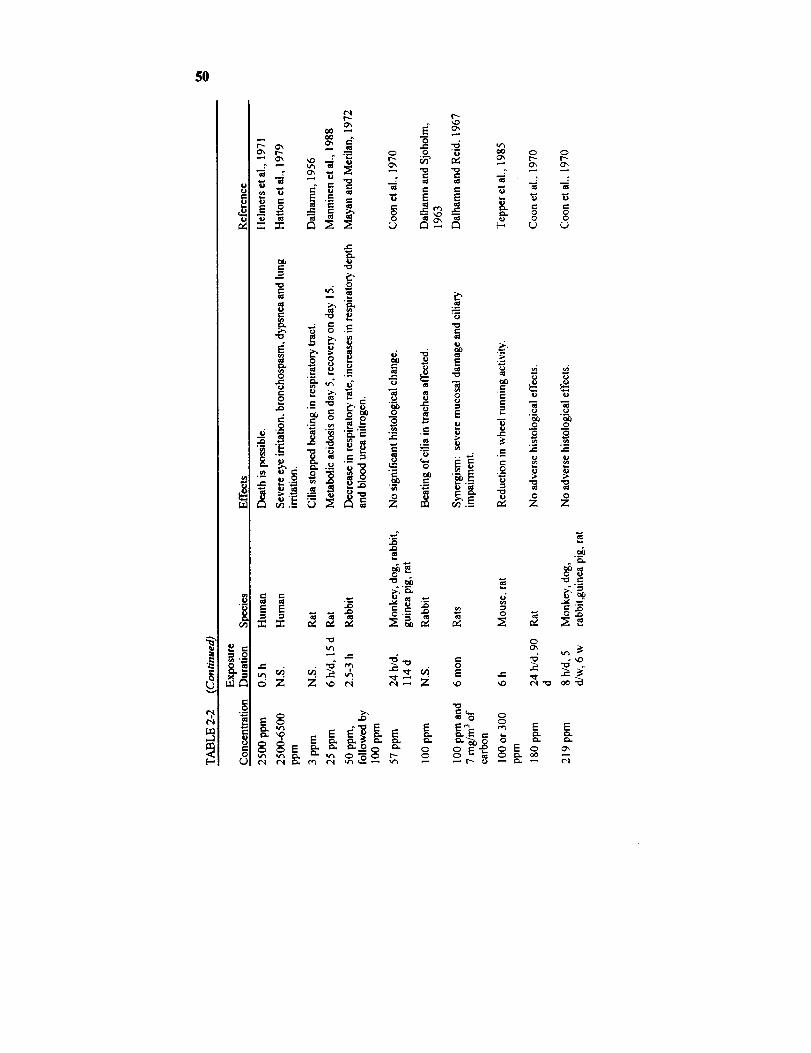
5O
u.l
0
rj
t_
;:i2 ::I:: _ _.
0
0 --_ Ox 0 0
e-
ab
"_ 0
°--
.- _• _._
E E ___
III
._ g E _ ._ .__ _ 0 O
"- N N
"_ _ • o o_. _ _.__ _ z z
E E _ _ E
.0
._-- ,_ .__ _ _ _ _

S!
oCr, _ 0
O0 00 O0 _0
i__ "=
E E
r_
,J_ .o
O 0
EEEEE
E E E E EEE__
._=
0
m
,_=
__.
e- ,

52 SMACS FOR SELECT_ AIRBORNE CONTAMINANTS
TABLE 2-3 Exposure Limits Set by Other Organizations
Organization Concentration, ppm
ACGIH's TLV 25 (TWA)
OSHA's PEL 50 (TWA)
NIOSH's REL 50 (5-rain ceiling)
NIOSH's IDLH 50
NRC's 1-h EEGL 100
NRC's 24-h EEGL 100
NRC's CEGL 50
TLV = threshold limit value. TWA = time-weighted average. PEL =permissible exposure limit. REL = recommended exposure limit. IDLH =immediately dangerous to life and health. EEGL = emergency exposure guid-ance level. CEGL = continuous exposure guidance level.
TABLE 2-4 Spacecraft Maximum Allowable Concentrations
Duration a ppm mg/m 3 Target Toxicity
1 h 30 20 Irritation
24 h 20 14 Irritation
7 db 10 7 Irritation
30 d 10 7 Irritation
180 d 10 7 Irritation
aThese SMACs are ceiling values.bThe current 7-d SMAC = 25 ppm.
RATIONALE
The SMACs for ammonia should be set based on mucosal irritation,
which is the major toxic end point of ammonia inhalation at low-to-mod-
erate concentrations. Vigliani and Zurlo (1956) noted that the adaptation
status of workers played an important role in ammonia's irritation re-
sponse. Based on their industrial experiences (they studied the healtheffects in workers and measured the ammonia concentrations in various
industrial plants), Vigliani and Zurlo reported that 20-ppm ammonia could
produce eye and nose discomfort in unadapted workers, but no complaints
in adapted workers. Although 20 ppm elicited no complaints from the
AMMONIA 53
adapted workers, there was conjunctival erythema (Vigliani and Zurlo,
1956). That means ammonia can cause mild inflammation in a person who
has adapted to ammonia's irritation sensation. Therefore, the irritation
sensation of adapted workers should not be used to set SMACs for ammo-
nia because unadapted astronauts could be sensitive to levels tolerated by
adapted workers. Consequently, in setting the SMACs, an emphasis isplaced on irritation data on unadapted subjects.
1-h SMAC and 24-h SMAC
The l-h and 24-h SMACs are intended for emergencies, so a potential
of some discomfort is acceptable. However, the l-h and 24-h SMACs
should not be set at levels that produce more than slight mucosal irritation.
In eight uninured human volunteers studied by Verberk, 50-ppm am-monia was found to cause irritation that was, on the average, "just per-
ceptible" in 2 h (Verberk, 1977). When the individual eye-irritationresponses of the eight uninured volunteers exposed to 50-ppm ammonia for
2 h in Verberk's study were examined, it was discovered that the individual
responses ranged from "no sensation," "just perceptible," "distinctively
perceptible," to "nuisance." Although none of the eight uninured volun-teers experienced "offensive" eye irritation in the 2-h exposure at 50 ppm,
it is obvious that 50 ppm could be irritating in some people.
Without citing any data, Ellenhorn and Barceloux (1988) stated that,
upon an ammonia exposure, "eye and nasal irritation begins near 50 ppm."According to Ellenhorn and Barceloux, ammonia concentrations below 50
ppm should be nonirritating. However, the lack of data support casts doubt
on the accuracy of the statement of Ellenhorn and Barceloux. Indeed,
there were investigators who contradicted their statement by reporting
irritation at ammonia concentrations below 50 ppm. For instance, Mac-
Ewen et al. (1970) reported that 30-ppm ammonia caused just perceptiblemucosal irritation in two of five uninured human subjects in 10 min.
Ferguson et al. (1977) cited an industrial hygiene report made by Mangoldat the Puget Sound Naval Shipyard that workers engaged in diazo copying
complained of discomfort and annoyance with 20 ppm of ammonia.
Vigliani and Zurlo (1956) also reported that 20-ppm ammonia could cause
eye and respiratory discomfort in unadapted workers. These human dataon ammonia's mucosal irritation are tabulated in Table 2-5.

54 SMACS FOR SELECTED AIRBORNE CONTAMINANTS
TABLE 2-5 Ammonia's Mucosal Irritation in Humans
Concert- Exposed
tration, ppm Time Subjects
20 Occupational Unadapted Eye and Vigliani andworkers in manu- respiratory Zurlo, 1956facturing plants discomfortfor NH 3, nitrate,and area
20 Occupational Workers in a Disconffort Ferguson etnaval shipyard and al., 1977
annoyance
30 l0 min 2 of 5 unadapted Irritation just MacEwen et
subjects perceptible al., 1970
Effect Reference
Because 30-ppm ammonia caused only just perceptible irritation in 10
min, it is not expected to produce more than mild irritation in l h. The 1-h
SMAC is, therefore, set at 30 ppm. Although some irritation is acceptable
for the 24-h SMAC, it should be set lower than the l-h SMAC to reduce
the degree of slight irritation astronauts have to endure in a 24-h contin-
gency. Since 20-ppm ammonia has been shown to produce only eye and
nose discomfort in workers (Vigliani and Zurlo, 1956; Ferguson et al.,
1977), the 24-h SMAC is set at 20 ppm.
It should be noted that, even though the 1-h SMAC was based on the
response in only five subjects, no adjustment for a "small n" is needed
owing to the fact that a certain degree of mucosal irritation is acceptable in
a 1-h or 24-h contingencies, so a smaller margin of safety is acceptable in
the derivation of the 1-h and 24-h SMACs based on irritation.
7-d SMAC
There are no data on the effect of ammonia on humans after long-term
continuous exposures. A continuous exposure to ammonia at 57 ppm for
114 d or 180 ppm for 90 d produced no adverse histological effects on
monkeys, dogs, rats, and rabbits (Coon et al., 1970). However, the 7-d,
30-d, and 180-d SMACs are not set relying on these animal data because
the data provide no information on irritation sensation of ammonia.
AMMONIA 55
The 7-d SMAC should be set at the maximum nonirritating level.
Unfortunately, there are no data on that level. We know that 20 ppm
caused some discomfort in workers in Italy (Vigliani and Zurlo, 1956), so
the 7-d SMAC should be lower than 20 ppm. Although 20 ppm is the
lowest-observed-adverse-effect level (LOAEL), the traditional factor of 10
to derive a no-observed-adverse-effect level (NOAEL) from a LOAEL will
not be used because there are concentration-response data. In the study of
Verberk, when the 1-h ammonia concentration was reduced 43% from 140
ppm to 80 ppm, the eye irritation went from "nuisance" to between "just
perceptible" and "distinctly perceptible" (Verberk, 1977). In the same
study, a 37% decrease in ammonia concentration from 80 ppm to 50 ppm
caused the irritation sensation to drop from being between "just percepti-
ble" and "distinctively noticeable" to "just noticeable." In another report,
as the 10-min inhalation concentration is reduced by 40% from 50 ppm to
30 ppm, the irritation decreases from "moderate" to "just perceptible"
(MacEwen et al., 1970). Although the irritation effects were characterized
subjectively and qualitatively in these studies, as long as we compare the
effects within the same study group, the qualitative differences should give
us an idea of the concentration response of ammonia. From these com-
parisons, it can be concluded that a 50% reduction of the 20-ppm dis-
comfort level (Vigliani and Zurlo, 1956) should yield a level that does not
produce irritation or discomfort. Ten parts per million is selected as the7-d NOAEL.
Because the 7-d NOAEL was derived from the experience of Vigliani
and Zurlo with workers in various manufacturing plants with ammonia
exposures in Italy (Vigliani and Zurlo, 1956), the NOAEL is based on a
sufficiently large human population, requiring no "small n" adjustment.
Accordingly, the 7-d SMAC is set at the 7-d NOAEL of 10 ppm.
30-d SMAC and 180-d SMAC
Because of adaptation, a level that is nonirritating in 7 d should remain
nonirritating up to 180 d. Consequently, the 30-d and 180-d SMACs are
also set at 10 ppm. Ten parts per million appears to be appropriate be-
cause workers exposed to ammonia at 9.2 ppm for up to 12 y did not
complain of irritation any more than nonexposed workers did (Holness et
56 SMACS FOR SELECTED AIRBORNE CONTAMINANTS
al., 1989). Finally, because mucosal irritation is a surface response, the
SMACs need not be adjusted for any microgravity-induced physiological
changes.
REFERENCES
ACGIH. 1986. Threshold Limit Values and Biological Exposure Indices
for 1986-87. American Conference of Governmental Industrial Hygien-ists, Cincinnati, Ohio.
Appelman, L.J., W.F. ten Berge, and P.G.J. Reuzel. 1982. Acute
inhalation toxicity study of ammonia in rats with variable exposureperiods. Am. Ind. Hyg. Assoc. J. 43:662-665.
Arwood, R., J. Hammond, and G. Gillon. 1985. Ammonia inhalation.Trauma 25:444-447.
Buckley, L.A., X.Z. Jiang, R.A. James, K.T. Morgan, and C.S. Barrow.1984. Respiratory tract lesions induced by sensory irritants at the RD_o
concentration. Toxicoi. Appl. Pharmacol. 74:417- 429.
Close, L.G., F.I. Catlin, and A.M. Cohn. 1980. Acute and chronic
effects of ammonia burns of the respiratory tract. Arch. Otolaryngol.106:151-158.
Cole, T.J., J.E. Cotes, G.R. Johnson, H.D. Martin, J.W. Reed, and J.E.
Saunders. 1977. Ventilation, cardiac frequency and pattern of breath-
ing during exercise in men exposed to 0-chlorobenzylidene melononitrile
(CS) and ammonia gas in low concentrations. Q.J. Exp. Physiol. Cogn.Med. Sci. 62:341-51.
Coon, R.A., R.A. Jones, L.J. Jenkins, Jr., and J. Siegel. 1970. Animal
inhalation studies on ammonia, ethylene glycol, formaldehyde, dimethyl-
amine, and ethanol. Toxicol. Appl. Pharmacol. 16:646-655.
Dalhamn, T. 1956. Mucous flow and ciliary activity in the trachea of
healthy rats and rats exposed to respiratory irritant (SO2, NH3, HCHO).
VIII. The reaction of the tracheal ciliary activity to single exposure to
respiratory irritant gases and studies of the pI-I. Acta Physiol. Scand.Suppl. 123:93-97.
Dalhamn, T. and L. Reid. 1967. P. 299 in Inhaled Particles and Vapours
II. C.N. Davies, ed. Pergamon, New York, N.Y.
Dalhamn, T. and J. Sjoholm. 1963. Studies on SO 2 and NH3--Effect on
ciliary activity in the rabbit trachea of single in vitro exposure and
AMMONIA 57
resorption in rabbit nasal cavity. Acta Physiol. Scand. 58:287-91.
Diamondstone, T.I. 1982. Amino acid metabolism. I. P. 544 in Text-
book of Biochemistry with Clinical Correlations. T.M. Devlin, ed.
John Wiley & Sons. New York, N.Y.Dodd, K.T. and D.R. Gross. 1980. Ammonia inhalaton toxicity in cats:
A study of acute and chronic respiratory dysfunction. Arch. Environ.Health 35:6-14.
Douglas, R.B. and J.E. Coe. 1987. The relative sensitivity of the human
eye and lung to irritant gases. Ann. Occup. Hyg. 31:265-267.Eastman, R.D. 1963. P. 13 in Biochemical Values in Clinical Medicine.
Wright, Bristol, U.K.Ellenhorn, M.J. and D.G. Barceloux. 1988. Airborne toxins. P. 871 in
Medical Toxicology. Diagnosis and Treatment of Human Poisoning.Elsevier, New York, N.Y.
Ferguson, W.S., W.C. Koch, L.B. Webster, and J.B. Gould. 1977.
Human physiological response and adaptation to ammonia. J. Occup.Med. 19:319- 326.
Flury, K.E., D.E. Dines, J.R. Rodarte, and R. Rodgers. 1983. Airwayobstruction due to inhalation of ammonia. Mayo Clin. Proc. 58:389-393.
Grant, W.M. 1974. Pp. 121-128 in Toxicology of the Eye. Charles
Thomas, Springfield, I11.Hatton, D.V., C.S. Leach, A.L. Beaudet, R.O. Dillman, and N. Di
Ferrante. 1979. Collagen breakdown and ammonia inhalation. Arch.Environ. Health 34:83-87.
Helmers, S., F.H. Top, and L.W. Knapp. 1971. Ammonia injuries in
agriculture. J. Iowa Med. Soc. 61:271-280.Henderson, Y. and H.W. Haggard. 1943. Noxious Gases and the Princi-
ples of Respiration Influencing Their Action. Chemical Catalog, NewYork, N.Y.
Hilado, C.J., C.J. Casey, and A. Furst. 1977. Effect of ammonia onSwiss albino mice. J. Combust. Toxicol. 4:385-388.
Holness, D.L., J.T. Purdham, and J.R. Nethercott. 1989. Acute and
chronic respiratory effects of occupational exposure to ammonia. Am.
Ind. Hyg. Assoc. J. 50:646-650.Industrial Bio-Test Laboratories. 1973. Irritation Threshold Evaluation
Study with Animals. Report to International Institute of Ammonia
Refrigeration. IBT 663-03161, March 1973.
58 SMACS FOR SELECTED AIRBORNE CONTAMINANTS
Kapeghian, J.C., H.H. Mincer, A.B. Jones, A.J. Verlangieri, and I.W.
Waters. 1982. Acute inhalation toxicity of ammonia in mice. Bull.Environ. Contam. Toxicol. 29:371-378.
Kass, I., N. Zamel, C.A. Dobry, and M. Holzer. 1972. Bronchiectasis
following ammonia burns of the respiratory tract. Chest 62:282-285.
Kustou, U.U. 1967. Means of Measuring the Maximum AllowableConcentrations of Toxic Products of Natural Human Metabolism.
NASA Report, Oct. 1967.Landahl, H.D. and R.G. Herrmann. 1950. Retention of vapors and gases
in the human nose and lung. Arch. Ind. Hyg. Occup. Med. 1:36-45.
MacEwen, J.D., J. Theodore, and E.H. Vernot. 1970. Human exposure
to EEL concentrations of monomethylhydrazine. Proc. 1st Ann. Conf.Environ. Toxicol., AMRL-TR-70-102, Paper 23, Sept. 1970. Wright-
Patterson Air Force Base, Dayton, Ohio.
Manninen, A., S. Anttila, and H. Savolainen. 1988. Rat metabolic
adaptation to ammonia inhalation. Proc. Soc. Exp. Biol. Med. 187:278-281.
Mayan, M.H. and C.P. Merilan. 1972. Effects ammonia inhalation onrespiration rate of rabbits. J. Animal Sci. 34:448-452.
Montague, T.J. and A.R. Macneil. 1980. Mass ammonia inhalation.Chest 77:496-498.
NIOSH. 1987. Registry of the Toxic Effects of Chemical Substances.
DHHS (NIOSH) Publ. No. 87-114. National Institute for Occupational
Safety and Health, Cincinnati, Ohio.Niden, A.H. 1968. Effects of Ammonia inhalation on the terminal air-
ways. Pp. 41-44 in Proceedings of the 1lth Aspen Emphysema Confer-
ence. Aspen, Colo.O'Kane, G.J. 1983. Inhalation of ammonia vapour. Anaesthesia 38:
1208-1213.
Petruk, Y.A., I.D. Makulova, and I.M. Suvorov. 1980. Evaluation of the
effect of prolonged and continuous exposure of a human subject to low(2 mg/m 3) ammonia concentrations under conditions of an airtight
chamber. Gig. Tr. Prof. Zabol. 12:63.
Price, S.K., J.E. Hughes, S.C. Morrison, and P.D. Potgieter. 1983.
Fatal ammonia inhalation. A case report with autopsy findings. Sa.
Mediese. Tydskrif. 64:952-955.
Silverman, L. 1949. Physiological response of man to ammonia at lowconcentrations. J. Ind. Hyg. Toxicol. 31:74-78.
AMMONIA 59
Sraubaev, E.N. and N.G. Ivanov. 1976. [Study of the activity of the
pulmonary surfactant in determining the threshold of the irritating actionof industrial poisons]. Gig. Tr. Prof. Zabol. 10:47-48.
Tepper, J.S., B. Weiss, and R.W. Wood. 1985. Alterations in behavior
produced by inhaled ozone or ammonia. Fund. Appl. Toxicol. 5:1110-1118.
TLV Committee. 1986. Documentation of TLV's and BEI's. American
Conference of Governmental Industrial Hygienists, Cincinnati, Ohio.Verberk, M.M. 1977. Effects of ammonia in volunteers. Int. Arch.
Occup. Environ. Health 39:73-81.
Vernot, E.H., J.D. MacEwen, C.C. Haun, and E.R. Kinkead. 1977.
Acute toxicity and skin corrosion data for some organic and inorganiccompounds and aqueous solutions. Toxicol. Appl. Pharmacol. 42:417-423.
Vigliani, E.C. and N. Zurlo. 1956. Ehfahrungen der clinica del lavoro
mit einigen maximalen arbeitsplatzkonzentrationen (MAK) ven
industrieniften. Arch. Gewerbepathol. Gewerbehyg. 13:528-534.Volimuth, T.A. and R.B. Sehlesinger. 1984. Measurement of respiratory
tract ammonia in the rabbit and implications to sulfuric acid inhalation
studies. Fund. Appl. Toxicol. 4:455-464.Weatherby, J.H. 1952. Chronic toxicity of ammonia fumes by inhalation.
Proc. Soc. Exp. Biol. Med. 81:300-301.White, A., P. Handler, E.L. Smith, R.L. Hill, and I.R. Lehman. 1978.
Amino acid metabolism. II. Pp 695-700 in Principles of Biochemistry.McGraw-Hill, New York, N.Y.


B3 Carbon Monoxide
King Lit Wong, Ph.D.
Johnson Space Center Toxicology Group
Biomedical Operations Research BranchHouston, Texas
PHYSICAL AND CHEMICAL PROPERTIES
Carbon monoxide is a colorless and odorless gas (NRC, 1985).
Formula:
CAS number:
Molecular weight:
Boiling point:Melting point:
Conversion factors at 25°C, 1 atm:
CO
630-08-0
28.0
-192°C
-250°C
1 ppm = 1.14 mg/m 31 mg/m 3 = 0.87 ppm
OCCURRENCE AND USE
Carbon monoxide (CO) is produced inside the body via hemoglobin
metabolism at a rate of 0.4 mL/h resulting in a carboxyhemogiobin(COHb) level of about 0.4% (Coburn et al., 1965). Other than an endo-
genous source, CO can also be produced in the thermodegradation of
materials containing carbon in an atmosphere containing oxygen, so gasstoves and furnaces can be sources of CO indoors. A COHb level of 0.6-
1.0% has been reported in nonsmokers in an indoor environment (Radford
et al., 1981).
Automobile exhaust is a major source of CO in the environment. The
urban atmospheric levels of CO vary with the traffic patterns (Rylander
61
?-.="""Yol) .... _Y t'E _,_,'r,
62 SMACS FOR SELECTED AIRBORNE CONTAMINANTS
and Vesterlund, 1981). On expressways in major metropolitan areas,
atmospheric CO levels commonly reach 25 ppm (Stewart, 1975). Asecond common source of CO is cigarette smoke. Most smokers who
smoke a pack a day have a COHb level of 5-6% (Stewart, 1975). There is
no known use of CO in spacecraft, but CO has been predicted to be an off-
gas product in spacecraft (Leban and Wagner, 1989).
PHARMACOKINETICS
CO is absorbed rapidly in the lung at a rate of about 25.8 mL/min ×
mm Hg (Jones et al., 1982). The minute volume, partial pressure of
oxygen in the pulmonary capillary, and hemoglobin concentration are someof the major factors affecting CO absorption (EPA, 1985). More than
99% of CO in the body is eliminated unchanged via the lung and less than1% is oxidized to carbon dioxide (Stewart, 1975). CO's elimination
half-life is 4-5 h in resting subjects when breathing ambient air and 24 min
when breathing hyperbaric oxygen.
TOXICITY SUMMARY
CO exerts its toxicity by binding reversibly to the heme group in
hemoglobin-forming COHb (Laties and Merigan, 1979). Because the
affinity of hemoglobin for CO is 200 times that for oxygen, less oxygen
will be carried by hemoglobin to tissues during CO inhalation. The hy-
poxia is exacerbated by the inhibition of CO on the dissociation of oxygenfrom hemoglobin as the blood reaches the tissue (Laties and Merigan,
1979). As a result, the main toxicity targets for CO are the brain and
heart, two organs with a critical need for oxygen.COHb is chert'y-red (Klaassen, 1990). Cherry-red skin has traditionally
been regarded as one of the classical signs of CO poisoning, but some
modern literature indicates that cherry-red skin might not be evident evenin fatal CO intoxication (Findlay, 1988).
Acute Toxicity
This subsection surnmarizes the toxicity of CO after an exposure ranging
CARBON MONOXIDE 63
from several minutes to 8 h. CO's toxicity is generally believed to corre-
late with the COHb level (Stewart, 1975). Because an exposure to CO at a
given concentration for a few hours will yield a COHb level similar to an
exposure at a higher concentration for a shorter time (Peterson and Stew-
art, 1975), to simplify the picture, toxic effects are described based on theCOHb level achieved.
A COHb level of 70% is lethal, and 50-60% leads to coma and con-
vulsions. Headache, nausea, and vomiting are the most common symp-toms of gross intoxication, and they are produced at 15-40% COHb
(DiMarco, 1988; Stewart et al., 1970). Myonecrosis has been reported todevelop in a case of acute CO poisoning with a COHb level of 16% in the
emergency room (Herman et al., 1988). CO, however, is known to
produce toxicity at even lower levels.
In humans, CO, at a COHb level of 7%, gives a feeling of having to
exert more during heavy exercise (Bunnell and Horvath, 1989) and, at7.5% COHb, it causes a 23% reduction in the duration an individual can
exercise maximally (Ekblom and Huot, 1972). At 3.4% or 4% COHb(Horvath et al., 1975; Aronow and Cassidy, 1975), it reduces the maxi-
mal-exercise duration by only 5%. A higher heart rate during exercise was
detected at 7% or 5% COHb (Bunnell and Horvath, 1989; Gliner et al.,
1975), but 2.7% or 3.4% COHb was found not to affect the heart rateduring exercise (Horvath et al., 1975; Raven et al., 1974). CO decreases
the maximal oxygen uptake during exercise at 20% COI-lb (Vogel et al.,
1972), whereas 5% or 2.7% COHb has no such effect (Gliner et al., 1975;
Raven et al., 1974).CO inhalations could affect the heart. An acute CO exposure reduces
the ventricular fibrillation threshold in dogs at 6.5% COHb (Aronow et al.,
1979a) and monkeys at 9.3% COHb (DeBias et al., 1976). A COHb levelof 6% increases the frequency of ventricular premature depolarization in
patients with coronary artery diseases (Sheps et al., 1990).There are contradictory reports on the neurological effects of low-level
CO exposures in humans (Laties and Merigan, 1979). CO has been shown
to impair vigilance in human subjects at a COHb level of 2, 5, or 6.6%
(Beard and Grandstaff, 1975; Putz et al., 1979; Horvath, 1971), but no
such impairment was detected at 2.3, 4.8, 7.1, 7.5, 8.2, or 12.6% COHb(Beard and Grandstaff, 1975; Christensen et al., 1977; Davies et al., 1981;
Benignus et al., 1987; Benignus and Otto, 1977). Similarly, reaction timeis known to be increased in humans by 5, 8.5, 10, or 12% COHb (Putz et
al., 1979; Ramsey, 1972, 1973; Ray and Rockwell, 1970), whereas no
64 SMACS FOR SELECTED AIRBORNE CONTAMINANTS
increase has been detected at 3.9, 7.5, 9, or 12% COHb (Stewart et al.,
1970; Beard and Grandstaff, 1975; Aronow et al., 1979b; Luria and
McKay, 1979).
Studies have _own that CO impairs hand-eye coordination at 5 or 8.2%COHb (Putz et al., 1979; Benignus et al., 1987). On the other hand, 6.6
or 10.4% COI-lb had no effect on hand-eye coordination in some studies
(Mikulka, 1970; O'Donnell et al., 1971). A COHb level of 4.5% has been
shown to decrease the light-detection sensitivity in humans (Halperin et al.,
1959), but 5, 8.5, 12, or 17% COHb did not affect the light detection
sensitivity (Ramsey, 1972, 1973; Hudnell and Benignus, 1989). Finally,
6% COHb was shown in one study not to affect the driving ability (McFar-land, 1973), but 5.6, 10, or 11% COHb was found to impair the driving
ability in others (Ray and Rockwell, 1970; Wright et al., 1973; McFarland,1973).
There are many neurological functions not affected by low-level CO
e_es in human subjects. CO has no effect on visual task performance
at 3% COHb (Putz et al., 1976), visual acuity at 17% COHb (Hudnell and
Benignus, 1989), night vision at 9% COI-Ib (Luria and McKay, 1979), time
perception at 3.9-18% COHb (Stewart et al., 1970; Aronow et ai., 1979b;Mikulka, 1970; O'Donnell et al., 1971; Stewart et al., 1973), perceptual
speed at 3.9% COHb (Aronow et al., 1979b), depth perception at 5-12%
COHb (Ramsey, 1972; Ramsey, 1973), number facility at 3.9 or 7.5%COHb (Beard and Grandstaff, 1975; Aronow et al., 1979b), mental perfor-
mance at 7-10% COI-Ib (Bender et al., 1972; Ettema and Zielhuis, 1975),
short-term memory at 7.5% COHb (Beard and Grandstaff, 1975), and
manual dexterity at 5-12% COI-Ib (Stewart et al., 1970; Mihevic et al.,
1983).
CO can produce latent effects on the nervous system. About 10% of the
patients who have apparently recovered from a severe episode of acute CO
poisoning might develop neurological sequelae in days or weeks (Smith andBrandon, 1973; Thom and Keim, 1989). In rats, the sciatic nerve conduc-
tion velocity is reduced 4 w after an acute CO intoxication in which the
COHb level of 19% was reached (Pankow et al., 1975).
CO is known to affect oxidative drug metabolism. It inhibits the cyto-
chrome P-450 system in vitro (Estabrook et al., 1970). In rats, 60 ppm of
CO reduces the hepatic benzopyrene hydroxylase activity, and an exposure
yielding 20% COI-Ib prolongs the hexobarbital sleeping time (Rondia,
1970; Montgomery and Rubin, 1971). COIqb at 10-12% has been shown
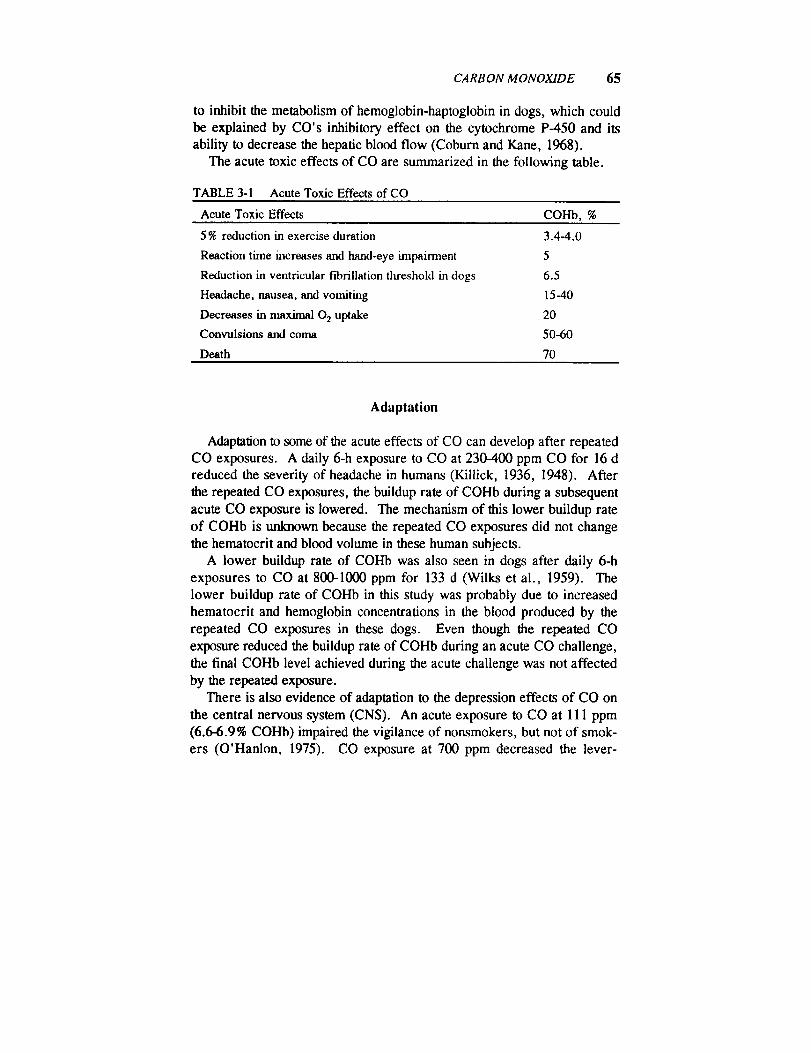
CARBON MONOXIDE 65
to inhibit the metabolism of hemoglobin-haptoglobin in dogs, which could
be explained by CO's inhibitory effect on the cytochrome P-450 and its
ability to decrease the hepatic blood flow (Coburn and Kane, 1968).
The acute toxic effects of CO are summarized in the following table.
TABLE 3-1 Acute Toxic Effects of CO
Acute Toxic Effects COHb, %
5 % reduction in exercise duration
Reaction time increases and hand-eye impairment
Reduction in ventricular fibrillation tlu'eshold in dogs
Headache, nausea, and vomiting
Decreases in nmximal 0 2 uptake
Convulsions and coma
Death
3.4-4.0
5
6.5
15-40
20
50-60
70
Adaptation
Adaptation to some of the acute effects of CO can develop after repeated
CO exposures. A daily 6-h exposure to CO at 230-400 ppm CO for 16 d
reduced the severity of headache in humans (Killick, 1936, 1948). After
the repeated CO exposures, the buildup rate of COHb during a subsequent
acute CO exposure is lowered. The mechanism of this lower buildup rate
of COHb is unknown because the repeated CO exposures did not change
the hematocrit and blood volume in these human subjects.
A lower buildup rate of COHb was also seen in dogs after daily 6-h
exposures to CO at 800-1000 ppm for 133 d (Wilks et al., 1959). The
lower buildup rate of COHb in this study was probably due to increased
hematocrit and hemoglobin concentrations in the blood produced by the
repeated CO exposures in these dogs. Even though the repeated CO
exposure reduced the buildup rate of COHb during an acute CO challenge,
the final COHb level achieved during the acute challenge was not affected
by the repeated exposure.
There is also evidence of adaptation to the depression effects of CO on
the central nervous system (CNS). An acute exposure to CO at 111 ppm
(6.6-6.9% COHb) impaired the vigilance of nonsmokers, but not of smok-
ers (O'Hanlon, 1975). CO exposure at 700 ppm decreased the lever-
66 SMACS FOR SELECTED AIRBORNE CONTAMINANTS
pressing response of rats to get food pellets (Ator and Merigan, 1980).
However, preconditioning with four daily 75-min exposures to 700 ppm ofCO abolished this effect of CO. A 7-d exposure to CO at 4000 ppm for
10-15 min/d increased the time it takes for CO at 4000 ppm to cause coma
by 50% in rats and mice (Gorbatow and Noro, 1948). A continuousexposure to CO at 300-2400 ppm for 6 w in mice has been shown to reduce
the CNS depression effect of CO (Killick, 1937). In the last two studies,
the adaptation could be due to increases in hematocrit and hemoglobin
concentrations produced by the repeated or continuous CO exposure.
Subchronic and Chronic Toxicity
This subsection summarizes the toxicity produced by CO exposures
lasting for 7 d or longer. In contrast to the abundance of studies on theacute neurological effects of CO, there are no reports on its neurological
effects after an exposure lasting 7 d or more. Stewart et al. (1970), how-
ever, reported that a 24-h exposure to 50-ppm CO (yielding 8% COI-Ib)
had no effect on response time, time perception, and manual dexterity inhumans.
In a human study, a 7- or 8-d continuous exposure to CO at 15, 50, or
75 ppm (2.4, 7.1, or 11% COHb) resulted in P-wave changes in the EKG(Davies and Smith, 1980). S-T-segment or T-wave changes were produced
by CO at 75 ppm. CO at 75 ppm also produced supraventricular extrasys-tole in one of nine subjects.
Whether CO exposures cause cardiovascular diseases is a question not
yet resolved (Kuller and Radford, 1983). Increased mortality from arter-iosclerotic heart disease was detected in New York City tunnel officers
employed between 1952 and 1981 (Stern et al., 1988). The average COconcentration in the tunnels was 38 ppm in 1981. Although this study
provides epidemiological evidence that CO inhalation is associated with
cardiac mortality, whether other automobile exhaust pollutants are re-
sponsible for the mortality is unclear (Walden and Gottlieb, 1990).In animal studies, the COHb levels produced by a CO concentration
varied with the species (Jones et al., 1971), so its toxicity in animals is
discussed below mainly in terms of COHb levels rather than its concen-
trations. Subchronic or chronic CO exposures have been shown to increase
the hemoglobin level and hematocrit in several animal species. These
CARBON MONOXIDE 67
effects were detected in continuous exposures at 50 ppm (7.3 % COHb) for
6 mo in dogs (Musselman et al., 1959), 96 ppm (7.5% COHb) for 90 d inrats (Jones et al., 1971), and 200 ppm (16 to 20% COHb) for 90 d in rats
and monkeys (Jones et al., 1971). These effects, however, were absent at
generally lower COHb levels, for instance in continuous exposures at 20
ppm (3.4% COHb) for 2 y in monkeys (Eckardt et al., 1972), 51 ppm (5%
COHb) for 90 d in monkeys and rats (Jones et al., 1971), and 66 ppm
(7.4% COIlb) for 2 y in monkeys (Eckardt et al., 1972).
Long-term exposures to CO do not seem to have any morphological
effects in laboratory animals. Continuous subchronic or chronic CO
exposures failed to induce histopathology in dogs at 50 ppm (7.3% COHb)
for 6 mo (Musselman et al., 1959), in rats at 200 ppm (16% COHb) for 90
d (Jones et al., 1971), and in monkeys at 66 ppm (7.4% COHb) for 2 y
(Eckardt et al., 1972), at 200 ppm (20% COHb) for 90 d (Jones et ai.,1971), or at 400 ppm (32% COHb) for 71 d followed by 500 ppm (33%
COHb) for 97 d (Theodore et al., 1971).
Finally, continuous exposures to CO in gestation days 6-15 or 18 were
not teratogenic in mice and rabbits at 250 ppm (10-15 % C OHb) (Schwetz
et al., 1979) and had no effect on fetal growth in mice at 65 ppm (Singh
and Scott, 1984). CO exposures at 125 ppm, however, retarded fetal
growth in mice CSingh and Scott, 1984). In addition, a COHb level as lowas 10% has been shown to decrease the birth weight and increase the
newborn mortality in rabbits (Astrup et al., 1972).
Synergistic Effects
No evidence that CO acts synergistically with other chemicals wasfound.
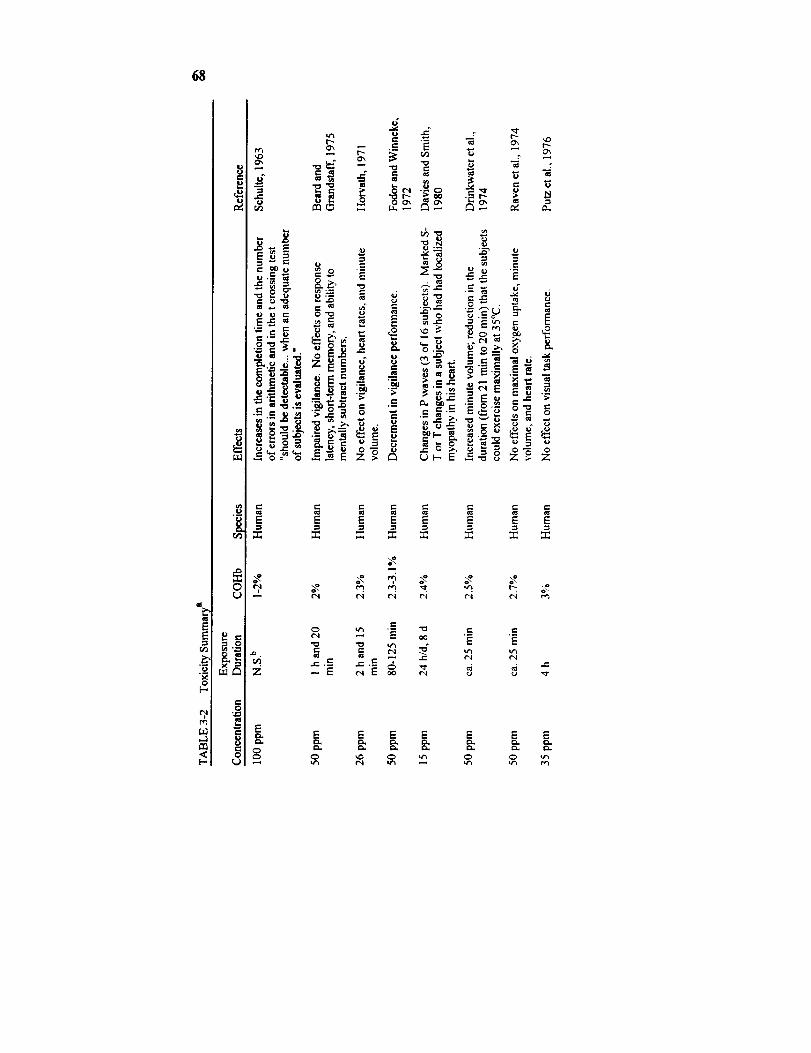
68
a
g_
u.l
i
r.._l-
ilE
t'-- "
,-n o, _ .E
r_ C_
• ,.
•_- ," r.._ N g "-_ __ _-_-'._ ___ ._
E E _ E
.__ ._ ._: "?
E E E
_ ____ _ _
.=-
r.- "
._ _ _
o_
_ E E
E E E
E E E

69
2-
-i
r',.0
0
;___ ",_._ ,_ . .-._",= _,
_'_-_._= _o_ =_
._._ _ __ =
N=.- ._
M
o
"_ _; o _ ." ,_._,-_._,
"_ _ _'o_ o "_
_'_
._ o i ._ .
_z _._
E E E
o.0
o.0 0 0
• , o.
Z
._=
Z
r,
._=E
E
00
Em
oo
E E E
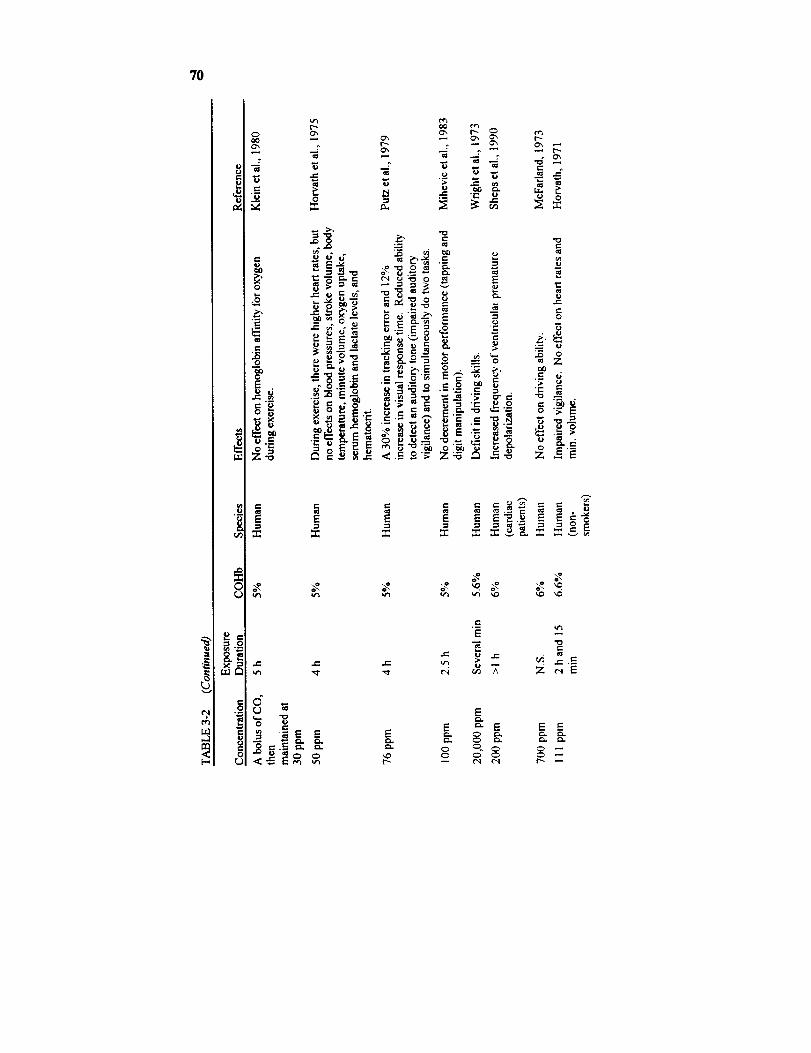
7O
0oOOx
,u ,-.
0
.ID0
Z"
I_ e-
°°
i,,
rj
Ox Ox I_- _ r_Ox _ Ox Ox t"-t'-, _ Ox Ox
= -- = -A: ,_ug _
13.
o_ _. = _._ °o
_ _ _._ ,
IE-- "0,= ,-
E
E _" E E E
xO 0 C_ 0 0
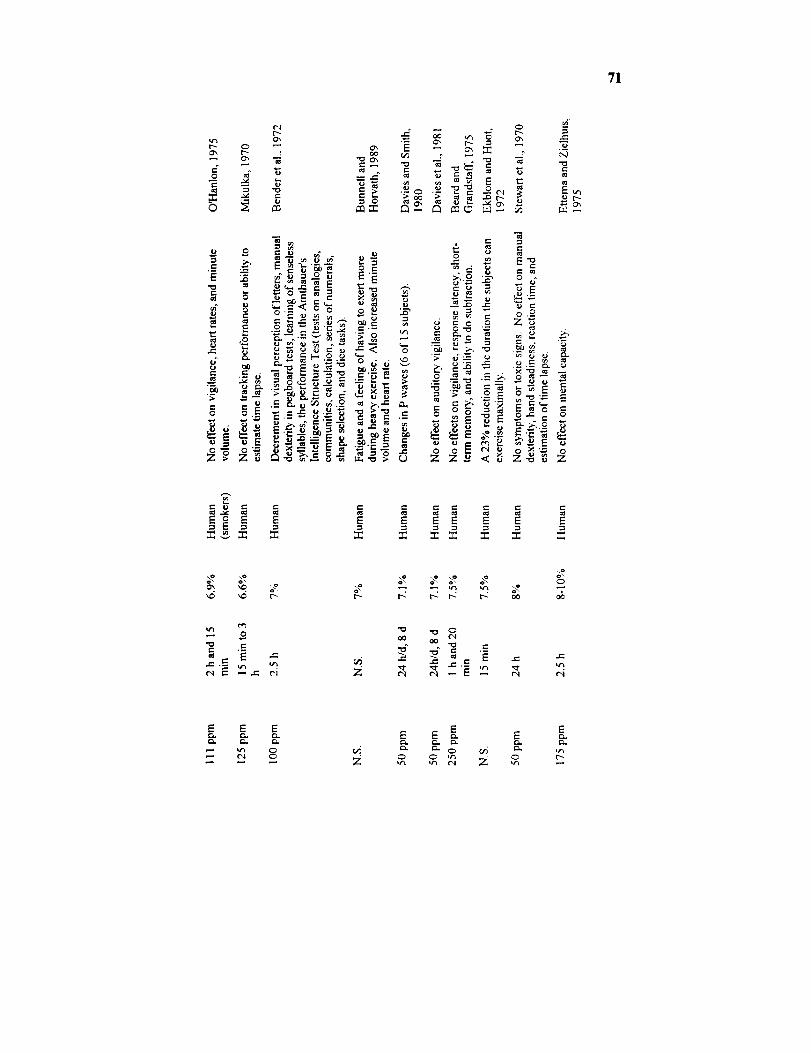
71
o_ _ _ _ ___ ___'
0
0", r-
o_
0
_.o°_
e-, t,-
N N "= o.- °
=o o Z_.-
-_. _,-_ _ __:,_ X _-_.
:_ _ --=
';_ o_ i _.-_o o o== o=
• ._o o_ _. o_.--_ o
Z Z_ < _ Z-_ _ Z
r.-
E
o\
r< r-: _ r- oo
0
06
•-, 0
•._ ¢.e- ._
Z
r--i
E .= ¢-
¢"1
E E
= n g Z
E E ,", _=
N NR z
Ee_
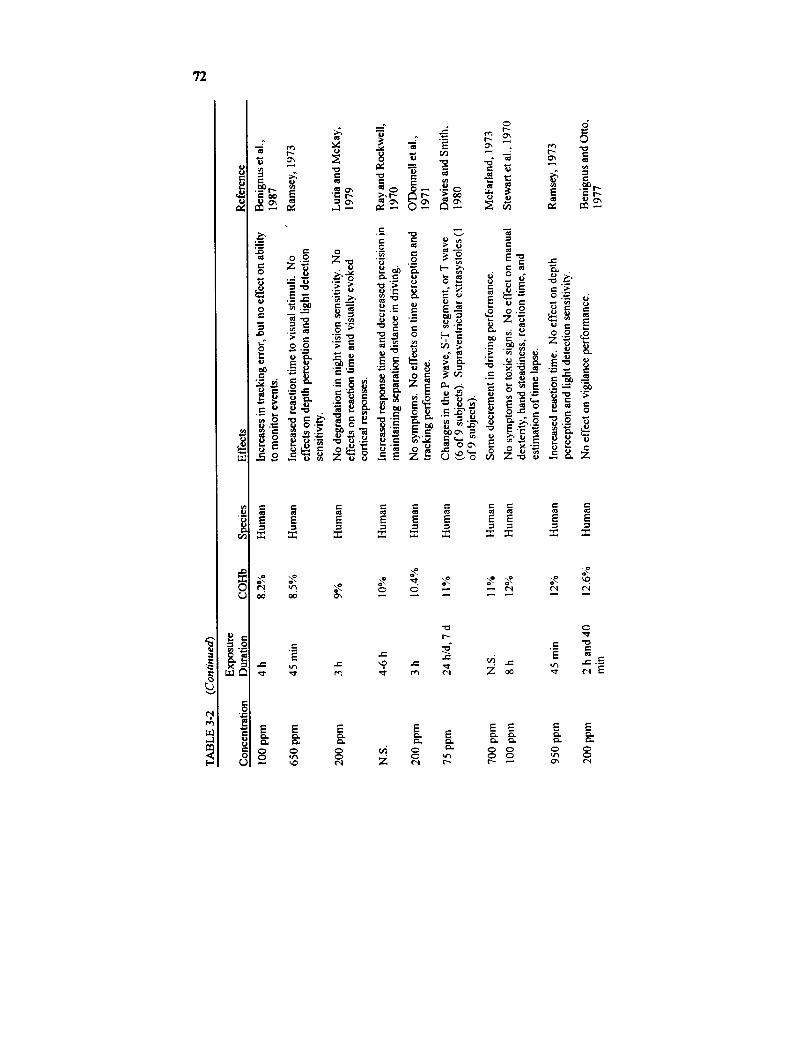
72
¢'t
,--1
e-
0
,-0
,t-O
ca
-- I"-
-- .=. g-
--°Or--
= ,_ . ,, =
.-- _ _,- 0 r" e-
r-=., = = = .= _= _= _= =E _ _ E E E E E E
--= _ "-=fll a= _ .= _=
III
,-._=
_E
E E E E E E E E
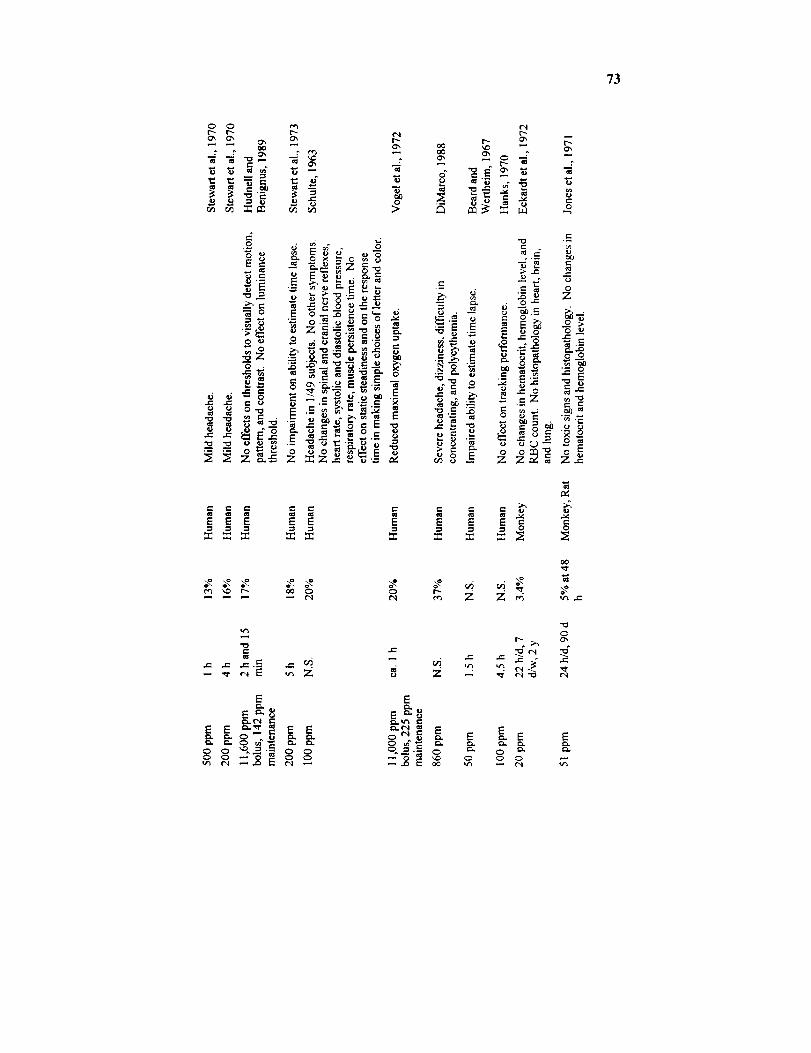
73
0 0 e'_
E?= _ ox
.,._ ""
_o _ _"
•_._ '_ z_=
_,oe _,o _
tel
"_ "_ ._,_.,:, ._
_Z
EE_ EE
E
E E _ E E
£'1
o _ _= "_ => i:5 = _: ::_ ,..eo
0
z_• ¢1 _.
e- e-,_'_
!°_'_ l:_
_ -__ ..=
.___ _0
.=
y.
E E E
0 t_e_ Z
e-
ccJ ,I-,
¢., _,-_ e'.
t-
_- ..o
0 _"
__ o
°z z_ "_
e'. ¢_
0 0
_0
__- ._
0
E E
0 ID,,, _,.

74
oo
.u
_L
._ I__, _ _ II_ _ ,_
0
z _
• o _._ _
_ -_ z_ 0--__ . .
•- . "_u -_o
_ _ _--_o__N N '_o ;20
-- . E -ooE -oE_=_ uN
oo .,._._._
e-
e_
0
E
= 8
00 "_
0
_,_ t "_ t"-
_._ . ,_¢',1 ("4
E E E
J
E E E E EE E _ _ _ _
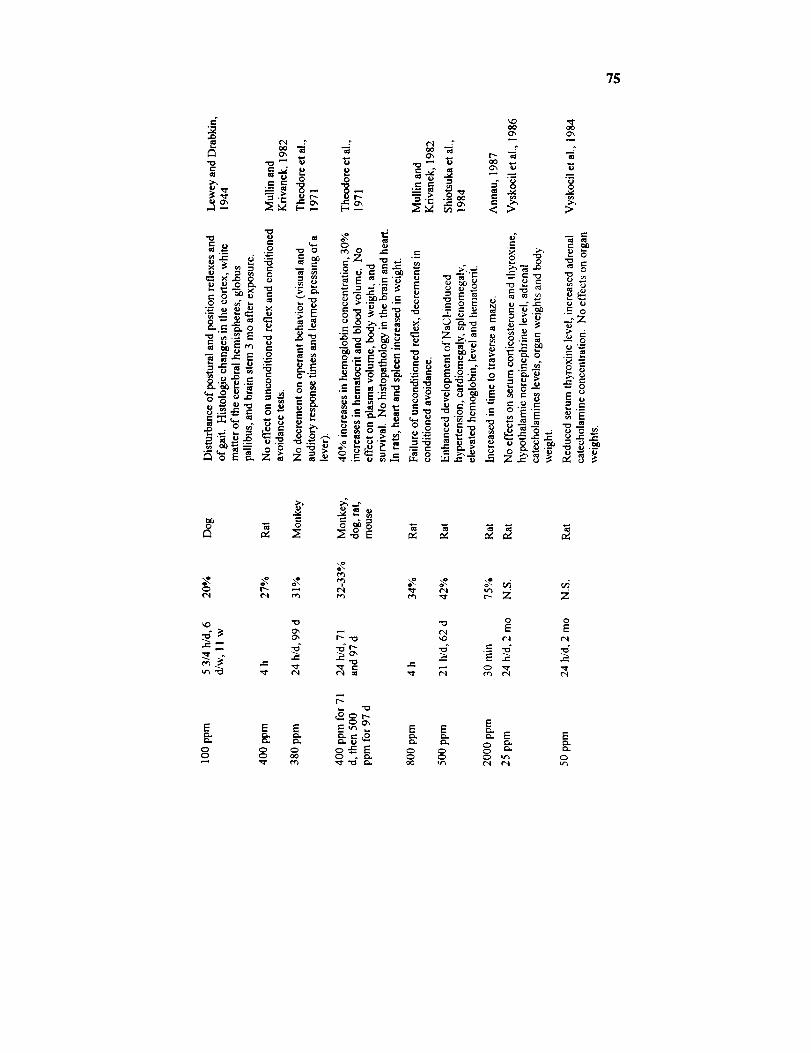
75
=-'v.D
e-
_..=_ o
_D r_
U "_ I
o_
Ox
0
:=_"0e.
6
.o
0
oOOx
rD .ZOx I"-
t- aid
cn
v., O
O_
;>
_o
0
-0.._ _ .
u ,-. _u r.
_D
0
E
00
r_
E
00
u
0
"0
OxO_
E
C_00
E
E E_.6 _ _- _. _
Z
0
E
E
0
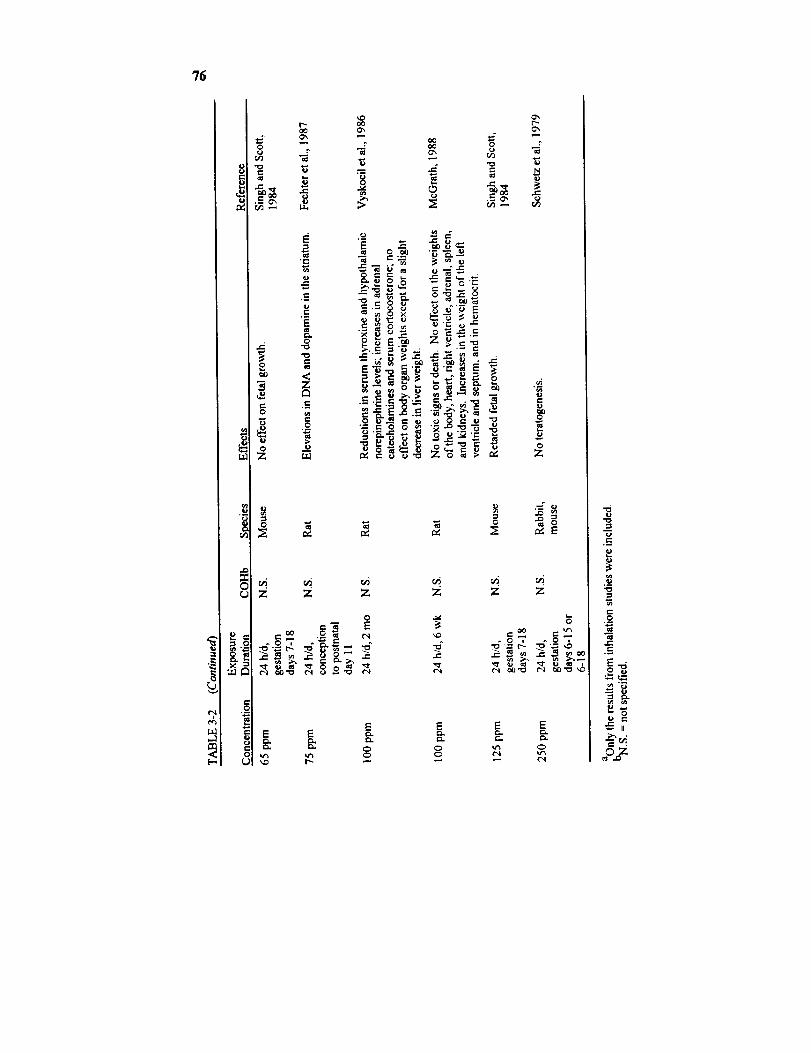
?6
u.1
I.)
e-,
u.l
e-'
o
0
r _ooo_
,.c
.E
C=
0"0
"0¢..
.=_
0
oOO_
II1
.g
>
z z z
0
EE E
e-. e- _.. _.""_ _ •
o _.__ z: _ =-__._- _ __._ _ ,,
__-_ ._ _-_,.,_ o
"_=oo_ -_
Z Z Z
E E E
c-
e., .
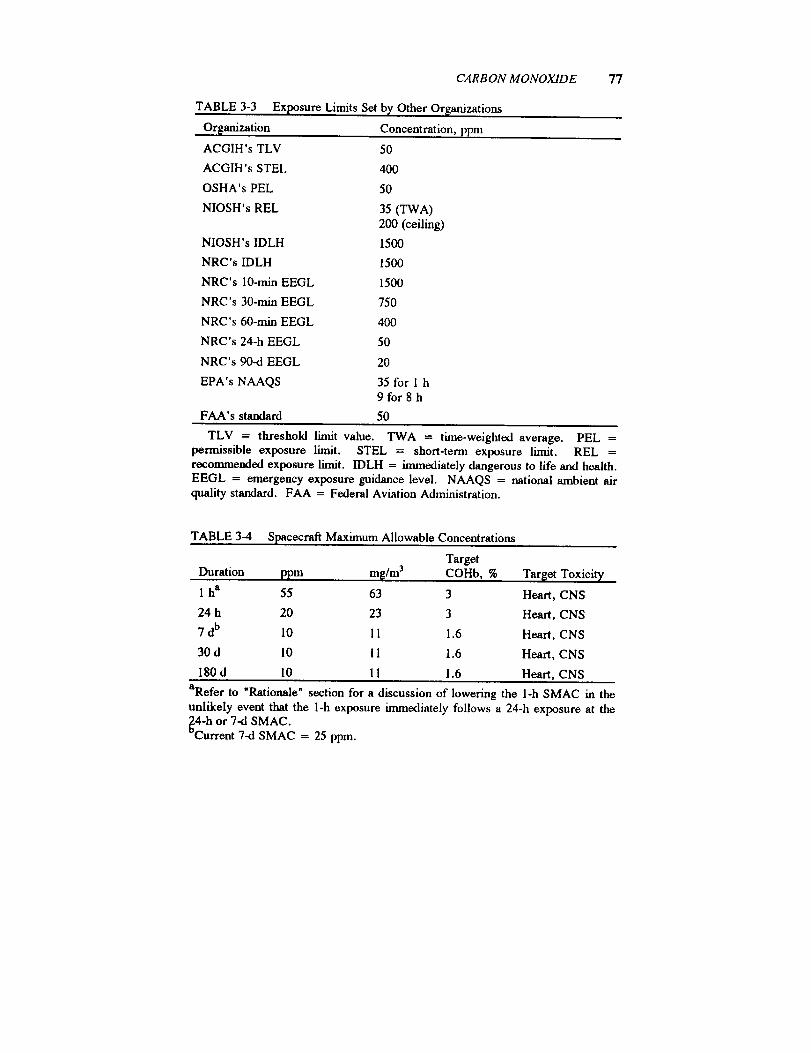
CARBON MONOXIDE
TABLE 3-3 Exposure Limits Set b_, Other Organizations
Organization Concentration, ppm
ACGIH's TLV 50
ACGIH's STEL 400
OSHA's PEL 50
NIOSH's REL 35 (TWA)200 (ceiling)
NIOSH's IDLH 1500
NRC's IDLH 1500
NRC's 10-rain EEGL 1500
NRC's 30-min EEGL 750
NRC's 60-min EEGL 400
NRC's 24-h EEGL 50
NRC's 90-d EEGL 20
EPA's NAAQS 35 for 1 h9for8h
FAA's standard 50
77
TLV = threshold limit value. TWA = time-weighted average. PEL =permissible exposure limit. STEL = short-term exposure limit. REL =recommended exposure limit. IDLH = immediately dangerous to life and health.EEGL = emergency exposure guidance level. NAAQS = national ambient airquality standard. FAA = Federal Aviation Administration.
TABLE 3-4 Spacecraft Maximum Allowable Concentrations
Target
Duration ppm m_/m 3 COHb, % Target Toxieit,/
1 ha 55 63 3 Heart, CNS
24 h 20 23 3 Heart, CNS
7 db 10 11 1.6 Heart, CNS
30 d 10 11 1.6 Heart, CNS
180 d I0 11 1.6 Heart, CNS
aRefer to "Rationale" section for a discussion of lowering the 1-h SMAC m the
unlikely event that the 1-h exposure immediately follows a 24-h exposure at the_c4-h or 7-d SMAC.
urrent 7-d SMAC = 25 ppm.
78 SMACS FOR SELEC-'TF.DAIRBORNE CONTAMINANTS
RATIONALE
The effects of acute CO exposures at low concentrations on mental
functions are controversial (Stewart, 1975). The lowest effective level is
2% COHb, which was found to impair vigilance in normal subjects (Beard
and Grandstaff, 1975). The practical significance of that finding is ques-
tionable because the same study showed that 7.5% COHb did not impair
vigilance.A COHb level of 3.4 or 4% has been shown to reduce the duration
subjects can exercise until exhaustion by 5% (Horvath et al., 1975;
Aronow and Cassidy, 1975). The SMACs are not set to protect againstthis effect because a reduction of the duration an individual can exercise
maximally, from 24 to 23 min (Horvath et al., 1975), will not significantly
affect the ability of astronauts to achieve the mission objectives.The next lowest effective level is 3.9% COHb, which was discovered to
cause "impairment" of the ability of cardiac patients to visually trace a line
through several tangled lines (Aronow et al., 1979b). This finding is
disregarded because of an uncertainty of whether the effect detected was
indeed an impairment. The score of that visual test represented the number
of Unes correctly traced (Aronow et al., 1979b), so the higher the score the
better the ability to visually trace the lines. In that study, the CO exposure
increased the score, compared with the pre-exposure baseline score, andthe air exposure decreased the score. Therefore, 3.9% COHb appeared
not to impair that ability in cardiac patients.The fourth lowest effective level is 4.5% COHb, which was found to
reduce the ability to detect flashes of light (Halperin et al., 1959). That
finding is not relied on to set the SMACs because no parallel control group
was used in that study (Hudnell and Benignus, 1989).
l-h SMAC
The studies of Ramsey (1972) and Putz, et al. (1979) are relied on to setthe 1-h SMAC. In these studies, 5% COHb was found to increase the
reaction time (about 30%) and to impair hand-eye coordination (a 12%
increase in tracking errors). Even though there are conflicting reports on
the effects of COHb levels higher than 5 % on reaction time and hand-eye
CARBON MONOXIDE 79
coordination (Stewart et al., 1970; Beard and Grandstaff, 1975; Benignus
et al., 1987; Ramsey, 1973; Ray and Rockwell 1970; Luria and McKay,
1979; Mikulka, 1970; O'Donnell et al., 1971), prudence dictates that we
have to assume that 5% COI-Ib would slow down the reaction and impairthe coordination of the crew. These impairments would clearly interfere
with the crew's ability to deal with a contingency. To prevent the interfer-
ence, the 1-h SMAC is aimed at a target COHb level of 3 %.
Three percent is chosen for three reasons. First, 5% COHb appears to
be the threshold of neurological detriments significant to mission's objec-tives. Second, EPA, NIOSH, and some scientists believed that CO causes
no significant CNS toxicity below 5% COHb (Rylander and Vesterlund,
1981; EPA, 1985; NIOSH, 1972). Third, a safety margin of 2% COHbshould be sufficient, considering that a l-h exposure at the 1-h NAAQS
produces 3% COHb during exercise (Rylander and Vesterlund, 1981) and
2% COHb during moderate activity (EPA, 1985). Because the NAAQS is
aimed at protecting the entire population, including potentially highlysensitive individuals, such as the old and the infirm, a SMAC that achieves
a COHb level comparable to that achieved at the NAAQS should protect
the astronauts also. This is because astronauts, being physically fit, are a
hyposusceptible group compared with the general population.
The CO concentration required to yield 3% COHb in 1 h was calculatedusing the Coburn-Forster-Kane equation (Peterson and Stewart, 1975). A
minute volume of 20 L/min, corresponding to the minute volume of an
adult at light activity (NRC, 1990), was used in calculating the CO concen-tration. A higher minute volume was not used, even though the crew is
expected to exercise more than 1 h/d, because NASA will issue a flight
rule that disallows exercise when the CO level in the spacecraft approaches
the 1-h SMAC. In addition, a pre--exposure COHb level of 0.6% and the
inflight hemoglobin concentration measured in Skylabs were used (Kimzey,
1977) in calculating the CO concentration. Under these conditions, CO at
55 ppm will yield 3% COHb in l h; therefore, 55 ppm becomes the 1-hSMAC.
The 1-h SMAC will also protect against the cardiotoxicity of CO.Because an exposure to CO at 100 ppm for over l h yielding 4% COHb
failed to increase the frequency of ventricular premature depolarization in
cardiac patients (Sheps et al., 1990), 3% COHb should not lead to EKG
changes in a healthy crew.
80 SMACS FOR SELECTED AIRBORNE CONTAMINANTS
24-h SMAC
There is only one report on the neurological effects of CO exposures
lasting over 8 h in humans. A 24-h exposure to 50 ppm, yielding 8%COHb, led to no effects on response time, manual dexterity, and time
perception in human subjects (Stewart et al., 1970). Unfortunately, thereare no data on the effect of a 24-h CO exposure on hand-eye coordination,
so 5% COHb, which impairs hand-eye coordination in 4 h (Putz et al.,
1979), is also assumed to impair hand-eye coordination in 24 h. The same
target COHb of 3% is, therefore, used to set the 24-h SMAC. With aminute volume of 20 m3/d used by NRC (1990) and the inflight hemoglobin
level obtained in Skylabs (Kimzey, 1977), 20 ppm is calculated to be the
CO concentration required to yield a COHb of 3% in 24 h (Peterson andStewart, 1975). The 24-h SMAC is, therefore, set at 20 ppm.
7-d SMAC
There is only one report on CO toxicity on humans for a continuous
exposure lasting 7 d or more. In that study, an 8-d CO exposure at 15 ppm
(2.4% COHb) or 50 ppm (7.1% COHb) resulted in P-wave changes in 3 of
16 subjects or 6 of 15 subjects, respectively (Davies and Smith, 1980).
The investigators concluded that the P-wave changes reflects CO toxicity
on atrial pacemaking or conducting tissue. At a higher concentration of 75
ppm (11% COHb), even more EKG changes, such as S-T-segment or T-
wave changes and supraventricular extrasystole, were detected (Davies andSmith, 1980). From these fndings, it is decided that the 7-d SMAC will
yield a COHb level less than 2.4%. Because the EPA's NAAQS of 9 ppm
for 8 h will yield 1.6% COHb in an exercising individual (Rylander andVestedund, 1981), 1.6% is selected to be the target COHb level for the 7-d
SMAC. With the use of the Coburn-Forster-Kane equation (Peterson and
Stewart, 1975), the minute volume of 20 m3/d recommended by NRC
(1990), and the inflight hemoglobin concentration obtained in Skylabs
(Kimzey, 1977), 10 ppm is calculated to be the 7-d SMAC.There are no data on the neurological effects of continuous CO ex-
posures lasting 7 d or more. It is believed that a target COHb of 1.6%
should be able to prevent any significant neurological effects on the crewfor 7 d. The reason is that 1.6% is not much higher than the 0.7-1.0%
COHb detected in nonsmokers in their everyday lives (Radford et al.,
CARBON MONOXIDE 81
1981), but it is lower than the 2.8-3.2% (O'Hanlon, 1975) or 4-5%
(Horvath et al., 1975) detected in smokers. It is also quite a bit lower than
the threshold of 5% COHb for significant neurological effects in acute CO
exposures discussed above. In addition, CO at 111 ppm (6.6-6.9%
COHb) was shown to impair the vigilance ability of nonsmokers, but not
smokers (O'Hanlon, 1975). That suggests that tolerance to CO's neurolog-ical toxicity may develop after repeated exposures. There are also data
indicating that tolerance develops toward the effect of CO in causingheadache in humans (Killick, 1936, 1948) and coma in mice (Gorbatow
and Noro, 1948; Killick, 1937) after repeated exposures. Taken together,
these studies point out that 1.6% COHb should provide sufficient margin of
safety toward potential CO's neurological effects in subchronic exposures.
It has been pointed out earlier that, in general, astronauts are hyposus-ceptible to the toxic effects of CO compared with the general populationbecause of their physical fitness. So using the COHb levels achievable in
an exposure to the EPA's NAAQS usually will provide enough protectionin setting the SMACs of CO. On the other hand, based on the cardiotoxi-
city of CO, the astronauts could be considered a hypersusceptible popula-
tion. The reason is that cardiac arrhythmias were occasionally detectedinflight during the Skylab missions (Smith et al., 1977). Nevertheless, a
COHb level of 1.6% should be sufficiently low to prevent cardiac toxicityof CO even in the "hypersusceptible" astronauts because 1.6% is onlyslightly higher than the COHb level in nonsmokers and is lower than the
COHb level in smokers. It should be noted that coronary disease patients
are also considered hypersusceptible to the cardiotoxic effect of CO. Shepset al. (1990) showed that it takes a COHb of 6% to increase the frequency
of ventricular premature depolarization in patients with coronary artery
disease, whereas 4% fails to cause any increase. That indicates that a
target COHb of 1.6% should prevent arrhythmia even in a hypersusceptiblepopulation, such as the astronauts. The Subcommittee on Guidelines for
Developing SMACs of the NRC's Committee on Toxicology also agreedwith this assessment.
30-d SMAC and 180-d SMAC
There are no data on CO's toxicity in humans after a continuous ex-posure lasting more than 8 d. Although there are several subchronic or
chronic studies in animals, very few of them used neurological or EKG
82 SMACS FOR SELECTED AIRBORNE CONTAMINANTS
effects as the end point (Jones et al., 1971; Musselman et al., 1959;
Eckardt et al., 1972; Theodore et al., 1971). One study did show that a
6-mo continuous exposure to CO at 50 ppm (7.3% COHb) produced no
EKG changes in dogs (Musselman et al., 1959). This finding is not used toset the 30- and 180-d SMACs because EKG changes were produced in
humans by a 7-d continuous CO at a much lower COHb of 2.4% (Davies
and Smith, 1980).A 99-d continuous exposure to CO at 380 ppm (31% COHb) did not
cause any decrement in operant behavior in monkeys (Theodore et al.,1971). This study is also not relied on in setting the 30- and 180-d SMACs
because significant neurological effects were detected in humans in acute
CO exposure at a much lower COHb of 5% (Putz et al., 1979; Ramsey,
1972). We also know that rats are up to 10-fold less sensitive than humanstoward the acute behavioral effects of CO (Ehrich et al., 1944). It is likely
that behavioral testing in monkeys also underestimates the no-behavioral-effect level for humans.
The target COHb level of 1.6% for 7-d SMAC would also be appro-
priate for the 30- and 180-d SMACs because the same rationale for the 7-d
SMAC should apply for a 30- or 180-d CO exposure. With 1.6% beinglower than the COHb levels commonly detected in smokers and the possi-
bility of tolerance, 1.6% COHb should provide a sufficient margin of
safety toward the neurological and cardiac effects of CO in a continuous
30- or 180-d exposure. Using the Coburn-Forster-Kane equation (Petersonand Stewart, 1975), both the 30- and 180-d SMACs are calculated to be 10
ppm. Exposures at these long-term SMACs also should not lead to anydetrimental effect on tissue morphology because none was detected in
monkeys with continuous CO exposures resulting in 3.4% COHb for 2 y or32-33% COHb for 168 d (Eckardt et al., 1972; Theodore et al., 1971).
Finally, the potential effect of microgravity-induced hematological
changes on CO's toxicity can be accounted for by using the inflight hemo-
globin concentration obtained in Skylabs to calculate the CO SMAC re-
quired to yield a given target COHb level. Therefore, no further adjust-ments of the SMACs are needed.
1-h and 24-h SMACs Immediately
Following CO Exposure
The SMACs were calculated assuming a baseline COHb of 0.6%.
CARBON MONOXIDE 83
However, it was pointed out by the NRC's Subcommittee on Guidelines for
Developing SMACs that NASA should also consider the impact on the 1-hand 24-h SMACs when the beginning COHb is not 0.6% (e.g., immedi-
ately after the COHb level has been raised by an exposure to CO at one of
its SMACs). Because the COHb level reaches equilibrium 24 h into a CO
exposure (Peterson and Stewart, 1975), we need only consider the impact
on the l-h and 24-h SMACs 24 h into a CO exposure at the 24-h or 7-dSMAC.
If a 1-h "spike" of 55-ppm CO occurs immediately after a 24-h COexposure at the 24-h SMAC of 20 ppm, the l-h spike will lead to a COHb
of 4.7%, which is too close to the 5% threshold of the CNS depression
effects of CO. Therefore, the l-h SMAC should be reduced to 20 ppm if
a 1-h exposure follows a 24-h CO exposure at the 24-h SMAC. Following
a 24-h CO exposure at the 24-h SMAC, a l-h CO exposure at 20 ppm willresult in a COHb level of 3%, which is acceptable.
A 1-h spike of 55 ppm following a 24-h exposure of CO at the 7-d
SMAC of 10 ppm will lead to a COHb level of 3.8%. Consequently, the1-h SMAC should be lowered to 40 ppm in the special situation in which a
1-h spike follows a CO exposure at the 7-d SMAC for 24 h or longer. In
that situation, CO at 40 ppm will lead to an acceptable COHb level of3.1%.
A similar analysis was done for a spike at the 24-h SMAC. As shown
before, a 24-h exposure at the 24-h SMAC of 20 ppm will result in a
COHb of only 3% starting from a COHb of 0.6%. If the 24-h exposure at20 ppm follows a 24-h exposure at the 7-d SMAC of 10 ppm (a starting
COHb of 1.6%), the 24-h exposure at 20 ppm will only produce a COHb
of only 3.2%, which is acceptable. Therefore, 20 ppm is low enough asthe 24-h SMAC for all CO exposure scenarios.
REFERENCES
Annau, Z. 1987. Complex maze performance during carbon monoxideexposure in rats. Neurotoxicol. Teratol. 9:151-155.
Aronow, W.S. and J. Cassidy. 1975. Effect of carbon monoxide onmaximal treadmill exercise. Ann. Intern. Med. 83:496-499.
Aronow, W.S., E.A. Stemmer, and S. Zweig. 1979a. Carbon monoxideand ventricular fibrillation threshold in normal dogs. Arch. Environ.Health 34:184-186.
SMACS FOR SELECTED AIRBORNE CONTAMINANTS
Aronow, W.S., R. Charter, and G. Seacat. 1979b. Effect of 4% car-
boxyhemoglobin on human performance in cardiac patients. Prev. Med.8:562-566.
Astrup, P., D. Trolle, H.M. Olsen, and K. Kjeldsen. 1972. Effect of
moderate carbon-monoxide exposure on fetal development. Lancet2:1220-1222.
Ator, N.A. and W.H. Merigan. 1980. Tolerance to the effects of carbon
monoxide on operant behavior in rats: Repeated brief exposures.Neurobehav. Toxicol. 2:367-372.
Beard, R.R. and N.W. Grandstaff. 1975. Carbon monoxide and human
functions. In Behavioral Toxicology. B. Weiss and V.G. Laties, eds.Plenum Press, New York.
Beard, R.R. and G.A. Wertheim. 1967. Behavioral impairment associ-ated with small doses of carbon monoxide. Am. J. Public Health
57:2012-2022.
Bender, W., M. GSthert, and G. Malorny. 1972. Effect of low carbon
monoxide concentrations on psychological function. Staub-Reinhalt.Lufl 32:54-60.
Benignus, V.A., K.E. Muller, C.N. Barton, and J.D. Prah. 1987. Effect
of low level carbon monoxide on compensatory tracking and eventmonitoring. Neurotoxicol. Teratol. 9:227-234.
Benignus, V.A. and D.A. Otto. 1977. Lack of effects of carbon mon-
oxide on human vigilance. Percept. Motor Skills 45: 1007-1014.
Bing, R.J., J.S.M. Sarma, R. Weishaar, A. Rackl, and G. Pawlik. 1980.
Biochemical and histological effects of intermittent carbon monoxide
exposure in cynomolgus monkeys (Macaca fascicularis) in relation toatherosclerosis. J. Clin. Pharmacol. 20:487- 499.
Brieger, H. 1944. Carbon monoxide polycythemia. J. Ind. Hyg. Toxi-col. 26:321-327.
Bunnell, D.E. and S.M. Horvath. 1989. Interactive effects of heat,
physical work, and CO exposure on metabolism and cognitive task
performance. Aviat. Space Environ. Med. 60:428-432.
Christensen, C.L., J.A. Gliner, S.M. Horvath, and J.A. Wagner. 1977.
Effects of three kinds of hypoxias on vigilance performance. Aviat.
Space Environ. Med. 48:491-496.Coburn, R.F., R.E. Forster, and P.B. Kane. 1965. Considerations of the
physiological variables that determine the blood carboxyhemoglobinconcentration in man. J. Clin. Invest. 44:1899-1910.
Coburn, R.F. and P.B. Kane. 1968. Maximal erythorcyte and hemoglo-
CARBON MONOXIDE 85
bin catabolism. J. Clin. Invest. 47:1435-46.
Davies, D.M., E.J. Jolly, R.J. Pethybridge, and W.P. Colquhoun. 1981.
The effects of continuous exposure to carbon monoxide on auditoryvigilance in man. Int. Arch. Occup. Environ. Health 48:25-34.
Davies, D.M. and D.J. Smith. 1980. Electrocardiographic changes in
healthy men during continuous low-level carbon monoxide exposure.Environ. Res. 21:197-206.
DeBias, D.A., C.M. Banerjee, N.C. Birkhead, C.H. Greene, D. Scott,and W.V. Harrer. 1976. Effects of carbon monoxide inhalation on
ventricular fibrillation. Arch. Environ. Health 31:42-46.
DiMarco, A. 1988. Carbon monoxide poisoning presenting as polycy-themia. N. Engl. J. Med. 319:874.
Drinkwater, B.L., P.B. Raven, S.M. Horvath, J.A. Gliner, R.O. Ruhling,N. W. Bolduan, and S. Taguchi. 1974. Air pollution, exercise, andheat stress. Arch. Environ. Health 28: 177-181.
Eckardt, R.E., H.N. MacFarland, Y.C.E. Alarie, and W.M. Busey.
1972. The biologic effect from long-term exposure of primates tocarbon monoxide. Arch. Environ. Health 25:381-387.
Ehrich, W.E., S. Bellet, and F.H. Lewey. 1944. Cardiac changes fromCO poisoning. Am. J. Med. Sci. 208:511-523.
Ekblom, B. and R. Huot. 1972. Response to submaximal and maximal
exercise at different levels of carboxyhemoglobin. Acta Physiol. Scand.86:474-482.
EPA. 1985. Review of the National Ambient Air Quality Standards for
carbon monoxide. Fed. Regist. 50:37484-37501.Estabrook, R.W., M.R. Franklin, and A.G. Hildebrandt. 1970. Factors
influencing the inhibitory effect of carbon monoxide on cytochromeP-450-catalyzed mixed function oxidation reactions. Ann. N.Y. Acad.Sci. 174:218-232.
Ettema, J.H. and R.L. Zielhuis. 1975. Effects of alcohol, carbon mon-
oxide and trichloroethylene exposure on mental capacity. Int. Arch.Occup. Environ. Health 35:117-132.
Fechter, L.D., M.D. Karpa, B. Proctor, A.G. Lee, and J.E. Storm.
1987. Disruption of neostiatal development in rats following perinatalexposure to mild, but chronic carbon monoxide. Neurotoxicol. Teratol.9:277.
Findlay, G.H. 1988. Carbon monoxide poisoning: Optics and histologyof skin and blood. Br. J. Dermatol. 119:45-51.
Fodor, G.G. and G. Winneke. 1972. Effect of low CO concentrations on
86 SMACS FOR SELECTED AIRBORNE CONTAMINANTS
resistance to monotony and on psychomotor capacity. Staub-Reinhalt.Luft 32:46-54.
Gliner, J.A., P.B. Raven, S.M. Horvath, B.L. Drinkwater, and J.C.
Sutton. 1975. Man's physiologic response to long-term work during
thermal and po.llutant stress. J. Appl. Physiol. 39:628-632.Gorbatow, O. and L. Noro. 1948. Acclimatization in connection with
acute carbon monoxide poisonings. Acta Physiol. Scand. 15:77-87.
Halperin, M.H., R.A. McFarland, J.I. Niven, and F.J.W. Roughton.1959. The time course of the effects of carbon monoxide on visual
thresholds. J. Physiol. 146:583-593.
Hanks, T.G. 1970. Human performance of a psychomotor test as a
function of exposure to carbon monoxide. Ann. N.Y. Acad. Sci.174:421-424.
Herman, G.D., A.B. Shapiro, and J. Leildn. 1988. Myonecrosis in
carbon monoxide poisoning. Vet. Human Toxicol. 30:28-30.Horvath, S.M. 1971. Carbon monoxide and human vigilance. A dele-
terious effect of present urban concentrations. Arch. Environ. Health23:343-347.
Horvath, S.M., P.B. Raven, T.E. Dahms, and D.J. Gray. 1975. Maxi-
mal aerobic capacity at different levels of carboxyhemoglobin. J. Appl.
Physiol. 38:300-303.
Hudnell, H.K. and V.A. Benignus. 1989. Carbon monoxide exposure andhuman visual detection thresholds. Neurotoxicol. Teratol. 11:369-371.
Jones, H.A., J.C. Clark, E.E. Davies, R.E. Forster, and J.M.Hughes.1982. Rate of uptake of carbon monoxide at different inspired con-
centrations in humans. J. Appl. Physiol. 52:109-1 I3.
Jones, R.A., J.A. Strickland, J.A. Stunkard, and J. Siegel. 1971. Effects
on experimental animals of long-term inhalation exposure to carbon
monoxide. Toxicol. Appl. Pharmacol. 19:46-53.
Killick, E.M. 1936. The acclimatization of the human subject to atmo-
spheres containing low concentrations of carbon monoxide. J. Physiol.(London) 87:41-55.
Killick, E.M. 1937. The acclimatization of mice to atmospheres con-
taining low concentrations of carbon monoxide. J. Physiol. 91:279-292.
Killick, E.M. 1948. The nature of the acclimatization occurring during
repeated exposure of the human subject to atmospheres containing low
concentrations of carbon monoxide. J. Physiol. 107:27-44.Kimzey, S.L. 1977. Hematology and immunology studies. P. 249 in
Biomedical Results from Skylab. R.S. Johnson and L.F. Dietlein, eds.
CARBON MONOXIDE 87
National Aeronautics and Space Administration, Washington, D.C.
Kuller, L.H. and E.P. Radford. 1983. Epidemiological bases for the
current ambient carbon monoxide standards. Environ. Health Perspect.52:131-139.
Klaassen, C.D. 1990. Nonmetallic environmental pollutants. P. 1618 in
Goodman and Gilman's The Pharmacological Basis of Therapeutics.
A.G. Gilman et al., eds. Pergamon Press, New York.
Klein, J.P., H.V. Forster, R.D. Stewart, and A. Wu. 1980. Hemoglobin
affinity for oxygen during short-term exhaustive exercise. J. Appl.
Physiol. 48:236-237.
Laties, V.G. and W.J. Merigan. 1979. Behavioral effects of carbonmonoxide on animals and man. Annu. Rev. Pharmacol. 19:357-392.
Leban, M.I. and P.A. Wagner. 1989. Space Station Freedom Gaseous
Trace Contaminant Load Model Development. SAE Technical Paper
Series 891513. Society of Automotive Engineers, Warrendale, Pa.
Lewey, F.H. and D.L. Drabkin. 1944. Experimental chronic carbon
monoxide poisoning of dogs. Am. J. Med. Sci. 208:502-511.
Luria, S.M. and C.L. McKay. 1979. Effects of low levels of carbonmonoxide on visions of smokers and nonsmokers. Arch. Environ.
Health 34:38-44.
McFarland, R.A. 1973. Low level exposure to carbon monoxide and
driving performance. Arch. Environ. Health 27:355-359.
McGrath, J.J. 1988. Body and organ weights of rats exposed to carbon
monoxide at high altitude. J. Toxicol. Environ. Health 23:303-310.Mihevic, P.M., J.A. Gliner, and S.M. Horvath. 1983. Carbon monoxide
exposure and information processing during perceptual-motor perfor-
mance. Int. Arch. Occup. Environ. Health 51:355-64.
Mikulka, P. 1970. The effect of carbon monoxide on human perfor-mance. Ann. N.Y. Acad. Sci. 174:409-420.
Montgomery, M.R. and R.J. Rubin. 1971. The effect of carbon monox-
ide inhalation on in vivo drug metabolism in the rat. J. Pharmacol. Exp.Ther. 179:465-473.
Mullin, L.S. and N.D. Krivanek. 1982. Comparison of unconditioned
reflex and conditioned avoidance tests in rats exposed by inhalation tocarbon monoxide, 1,1, l-trichloroethane, toluene or ethanol. Neuro-
toxicology 3: 126-137.Musselman, N.P., W.A. Groff, P.P. Yevich, F.T. Wilinsid, M.H. Weeks,
and F.W. Oberst. 1959. Continuous exposure of laboratory animals to
low concentration of carbon monoxide. Aerosp. Med. 30:524-529.
88 SMACS FOR SELECTED AIRBORNE CONTAMINANTS
NIOSH. 1972. Criteria for a Recommended Standard: Occupational
Exposure to Carbon Monoxide. NIOSH-TR-007-72. National Institute
for Occupational Safety and Health, Cincinnati, Ohio.NRC. 1985. Emergency and Continuous Exposure Guidance Levels for
Selected Airborne Contaminants. Vol. 4., p. 17. National Academy
Press, Washington, D.C.
NRC. 1990. Guidelines for Developing Spacecraft Maximum Allowable
Concentrations for Space Station Contaminants. National AcademyPress, Washington, D.C.
O'Dormell, R.D., R. Mikulka, P. Heinig, and J. Theodore. 1971. Low
level carbon monoxide exposure and human psychomotor performance.Toxicol. Appl. Pharmacol. 18:593-602.
O'Hanlon, J.F. 1975. Preliminary studies of the effects of carbon monox-ide on vigilance in man. Pp. 61-75 in Behavioral Toxicology. B. Weiss
and G. Laties, eds. Plenum Press, New York.
Pankow, D., W. Glatzel, K. Tietze, and W. Ponsold. 1975. Motor nerve
conduction velocity after carbon monoxide or m-dinitrobenzene poison-
ing following elimination of the poisons. Arch. Toxicol. 34:325-330.
Peterson, J.E. and R.D. Stewart. 1975. Predicting the carboxyhemo-
globin 11 levels resulting from carbon monoxide exposures. J. Appl.
Physiol. 39:633-11638.Putz, V.R., B.L. Johnson, and J.V. Setzer. 1976. Effects of CO on
Vigilance Performance: Effects of Low-Level Carbon Monoxide on
Divided Attention, Pitch Discrimination, and the Auditory Evoked
Potential. DHEW Publ. No. (NIOSH) 77-124. National Institute for
Occupational Safety and Health, Cincinnati, Ohio.
Putz, V.R., B.L. Johnson, and J.V. Setzer. 1979. A comparative study
of the effects of carbon monoxide and methylene chloride on human
performance. J. Environ. Pathol. Toxicol. 2:97-112.
Radford, E., T. Drizd, and R. Murphy. 1981. Blood carbon monoxide
levels in persons 3-74 years of age in the United States, 1976-80.Advance Data Report No. 76. U.S. Department of Health and Human
Services, National Center for Health Statistics, Hyattsville, Md.
Ramsey, J.M. 1972. Carbon monoxide, tissue hypoxia, and sensory
psychomotor response in hypoxaemic subjects. Clin. Sci. 42:619-625.
Ramsey, J.M. 1973. Effects of single exposures of carbon monoxide on
sensory and psychomotor responses. Am. Ind. Hyg. Assoc. J. 34:212-216.
Raven, P.B., B.L. Drinkwater, R.D. Ruhling, N. Bolduan, S. Taguchi, J.

CARBON MONOXIDE 89
Gliner, and S.M. Horvath. 1974. Effect of carbon monoxide and
peroxyacetyl nitrate on man's maximal aerobic capacity. J. Appl.
Physiol. 36:288-293.
Ray, A.M. and T.H. Rockwell. 1970. An exploratory study of automo-bile driving performance under the influence of low levels of carboxy-
hemoglobin. Ann. N.Y. Acad. Sci. 174:396-408.
Rondia, D. 1970. [Inhibition of hepatic benzopyrene hydroxylase activity
in vivo by the inhalation of carbon monoxide.] C.R. Acad. Sci. D271:617- 619.
Rylander, R. and J. Vesterlund. 1981. Carbon monoxide criteria. Scand.
J. Work Environ. Health 7(Suppl. 1): 1-39.Schulte, J.H. 1963. Effects of mild carbon monoxide intoxication. Arch.
Environ. Health 7:524-30.
Schwetz, B.A., F.A. Smith, B.K.J. Leong, and R.E. Staples. 1979.
Teratogenic potential of inhaled carbon monoxide in mice and rabbits.
Teratology 3:385-92.
Sheps, D.S., M.C. Herbst, A. L. Hinderliter, K.F. Adams, and L.G.
Ekelund. 1990. Production of arrhythmias by elevated carboxyhemo-
globin in patients with coronary artery disease. Arm. Intern. Med.113:343-351.
Shiotsuka, R.N., R.T. Drew, and R.W. Wehner. 1984. Carbon monox-
ide enhances development of hypertension in Dahl rats. Toxicol. Appl.Pharmacol. 76:225-233.
Singh, J. and L.H. Scott. 1984. Threshold for carbon monoxide inducedfetotoxicity. Teratology 30:253-257.
Smith, J.S. and S. Brandon. 1973. Morbidity from acute carbon monox-
ide poisoning at three-year follow-up. Br. Med. J. 1:318-321.
Smith, R.F., K. Stanton, D. Stoop, D. Brown, W. Janusq, and P. King.1977. Vectorcardiographic changes during extended space flight
(M093). Observations at rest and during exercise. Pp. 339-359 in
Biomedical Results from Skylab. R.S. Johnson and L.F. Dietlein, eds.
NASA, Washington, D.C.
Stern, F.B., W.E. Halperin, R.W. Hornung, V.L. Ringenburg, and C.S.
McCammon. 1988. Heart disease mortality among bridge and tunnel
officers exposed to carbon monoxide. Am. J. Epidemiol. 128: 1276-1288.
Stewart, R.D. 1975. The effect of carbon monoxide on humans. Ann.Rev. Pharmacol. 15:409-423.
Stewart, R.D., P.E. Newton, M.J. Hosko, and J.E. Peterson. 1973.
90 SMACS FOR SELECTED AIRBORNE CONTAMINANTS
Effect of carbon monoxide on time perception. Arch. Environ. Health27:155-160.
Stewart, R.D., J.E. Peterson, E.D. Baretta, R.T. Bachand, M.J. Hosko,
and A.A. Herrmann. 1970. Experimental human exposure to carbonmonoxide. Arch. Environ. Health 21:154-164.
Theodore, J., R.D. O'Donnell, and K.C. Back. 1971. Toxicological
evaluation of carbon monoxide in humans and other mammalian species.
J. Occup. Med. 13:242-255.Thom, S.R. and L.W. Keim. 1989. Carbon monoxide poisoning. A
review of epidemiology, pathophysiology, clinical findings, and treat-
ment options, including hyperbaric oxygen therapy. J. Toxicol. Clin.Toxicol. 27:141-156.
Vogel, J.A., M.A. Gleser, R.C. Wheeler, and B.K. Whitten. 1972.
Carbon monoxide and physical work capacity. Arch. Environ. Health24:198 -203.
Vyskocil, A., M. Tusl, and K. Zaydlar. 1984. The effect of chronic
exposure to 0.005% CO on hormone levels in brain and blood, and
organ weights in rats. J. Hyg. Epidemiol. Microbiol. 28:377-382.
Vyskocii, A., M. Tusl, and K. Zaydlar. 1986. The effect of carbonmonoxide on hormone levels and organ weights in rats. J. Appl. Toxi-col. 6:443-446.
Walden, S.M. and S.O. Gottlieb. 1990. Urban angina, urban arrhyth-mias: carbon monoxide and the heart. Intern. Med. 113:337-338.
Wilks, S.S., J.F. Tomashefsld, and R.T. Clark, Jr. 1959. Physiological
effects of chronic exposure to carbon monoxide. J. App. Physiol.14:305-310.
Wright, G., P. Randall, and R.J. Shephard. 1973. Carbon monoxide anddriving skills. Arch. Environ. Health 27:349-354.
B4 Formaldehyde
King Lit Wong, Ph.D.
Johnson Space Center Toxicology Group
Biomedical Operations and Research BranchHouston, Texas
PHYSICAL AND CHEMICAL PROPERTIES
Formaldehyde is a colorless gas with a strong, pungent odor (TLVCommittee, 1989; Sax, 1984).
Synonyms:
Formula:
CAS number:
Molecular weight:
Boiling point:
Melting point:
Lower explosive limit:
Upper explosive limit:Vapor pressure:
Vapor density:Conversion factors at 25°C, 1 arm:
Formic aldehyde; methylaldehyde; methanalHCHO50-00-0
30.0
-19.5°C
-92°C
7.0%
73.0%
10 mm Hg at -88°C
1.08 ( air's density = 1)1 ppm = 1.23 mg/m 3
1 mg/m 3 = 0.82 ppm
OCCURRENCE AND USE
Formaldehyde is not used in the operation of spacecraft, but it has
occasionally been used as a fixative in biological payload experiments.
91
92 SMACS FOR SELECTED AIRBORNE CONTAMINANTS
There is insufficient information to estimate the potential exposure level of
formaldehyde. However, Soviet cosmonauts gained sensitivity to for-
maldehyde during space missions (Peto, 1981). In addition, formaldehyde
might be released into the space-shuttle cabin air as a result ofthermodegradation of polymers, such as Delrin (James, 1991).
PHARMACOKINETICS AND METABOLISM
Inhaled formaldehyde does not appear to accumulate in blood. An
inhalation exposure to 14.4 ppm for 2 h in rats or 1.9 ppm for 40 min in
humans failed to increase the formaldehyde level in blood (Heck et al.,
1985). Likewise, no significant increase in formaldehyde in blood was
detected after a subchronic exposure (6 h/d, 5 d/w for 4 w) at 6 ppm inmonkeys (Casanova et al., 1988). The blood data support the hypothesis
that formaldehyde, being a highly water soluble compound, is retained
primarily by the mucosa of the upper respiratory tract, so that very little
enters the lung. After an intravenous injection in monkeys, formaldehyde
is rapidly eliminated from the blood, with a half-life of about 1.5 min(McMartin et al., 1979).
In mammals, formaldehyde is metabolized mainly via oxidation byformaldehyde dehydrogenase into formate and some formaldehyde is
incorporated into biological macromolecules via tetrahydrofolate-dependent
one-carbon biosynthetic pathways (Huennekens and Osborne, 1959;Koivusalo et al., 1982). Formaldehyde dehydrogenase has been found in
many tissues, including the human liver (Uotila and Koivusalo, 1974) and
the rat nasal mucosa (Casanova-Schmitz et al., 1984).
TOXICITY SUMMARY
Acute formaldehyde exposure produces mainly mucosal irritation of the
eye and upper respiratory tract in humans, and a long-term exposure leads
to the production of nasal tumors in rodents. Formaldehyde also causes
pulmonary function impairment and asthmatic reactions in sensitizedindividuals.
FORMALDEHYDE 93
Acute Toxicity
Most human studies have been done in the workplace so that the re-
ported formaldehyde exposure concentrations typically spanned a wide
range, making it difficult to determine the exact concentration-response
relationship or the no-observed-adverse-effect level (NOAEL). One studyshowed that eye, nose, and throat irritation was detected in workers ex-
posed to formaldehyde at an average peak level of 0.6 ppm (Alexandersson
and Hedenstierna, 1988). Another group of investigators reported that
workers complained of mucosal discomfort at formaldehyde concentrationsranging from 0.04 to 0.4 ppm (Holmstrom and Wilhelmsson, 1988).
These data do not reveal formaldehyde's nonirritating level.
Exposure concentrations are better controlled in experimental studies.
The few experimental human studies reported, unfortunately, used veryhigh levels of formaldehyde. For instance, two studies presented evidence
that formaldehyde exposure at 3 ppm, lasting more than an hour, caused
mild to severe irritation of the eye and upper respiratory tract (Green et
al., 1987; Sauder et al., 1986). Evidently, formaldehyde at 3 ppm was so
high that sufficient formaldehyde got past the nose to affect the lung,
reducing the forced expiratory volume in 1 s (FEV1) or forced expiratoryflow rate and forced vital capacity (FVC) in these test subjects. Another
experimental study demonstrated that formaldehyde is irritating to the
mucous membrane at 0.5, 1, or 2 ppm (Kulle et al., 1987). These experi-
mental studies show that formaldehyde is irritating at as low as 0.5 ppm.Two studies of residents in mobile homes and a recent occupational
study provide data on the concentration-response relationship of formal-dehyde's irritation effects. Formaldehyde has been shown to make 1-2%
of 87 residents in the mobile homes in Minnesota complain of eye irritation
at less than 0.1 ppm (Ritchie and Lehnen, 1987). At a formaldehyde
concentration of 0.1-0.3 ppm, 22% of 181 residents complained of eye
irritation and, when the concentration was above 0.3 ppm, about 90% of336 residents complained of eye irritation. From the data gathered in a
survey conducted with 61 mobile-home residents in Wisconsin, the pre-
dicted percentages of residents with eye irritation at different formaldehydeconcentrations were as follows (Hanrahan et al., 1984).
Formaldehyde Concentration (ppm): 0.1 0.2Mean Responding Rate (%): 4 18
95% Confidence Limits: 1, 18 8, 35
0.5 0.8
65 82
33, 86 44, 96
94 SMACS FOR SELECTED AIRBORNE CONTAMINANTS
Similarly, the predicted percentages of formaldehyde-exposed workers
afflicted with nose irritation obtained in a occupational study by Horvath et
al. (1988) using 109 test subjects and 254 control subjects are shownbelow.
Formaldehyde Concentration (ppm): 0.1 0.2 0.5 0.8
Mean Responding Rate (%): 2 4 21 3295% Confidence Limits: 1, 4 2, 8 16, 28 22, 44
Therefore, these studies suggest that the irritation threshold is below 0. 1
ppm. In fact, the National Research Council concluded 10 years ago that
formaldehyde causes irritation at as low as 0.1 ppm, and it is irritating in a
higher fraction of people at 1.0 ppm (NRC, 1980). It is, however, difficult
to accurately estimate the threshold concentration for formaldehyde'smucosal irritation effect. A few percentage of individuals respond to
formaldehyde at as low as 0.1 ppm. From the concentration-response data,
it appears that in a population there would always be a small group of
individuals who are sensitive to formaldehyde's irritation.
The Minnesota mobile-home study indicates that some individuals aremore sensitive to formaldehyde than others (Ritchie and Lehnen, 1987), an
observation also made by Horvath's group who detected wide individual
variability in response to formaldehyde (Horvath et al., 1988). Similarly,
Green et al. (1987) reported that, when 22 normal subjects were exposed to
formaldehyde at 3 ppm for 1 h, some of the subjects rated the eye, nose,and throat irritation as nonexistent, and some rated them severe.
Unlike lhe irritation sensation, there are no human data on the structural
effect of formaldehyde on the mucosa at concentrations that are not tooirritating. A 6-h exposure to formaldehyde at 0.5 or 2 ppm is known to
lead to the development of abnormal cilia in the nose of rats (Monteiro-
Riviere and Popp, 1986). However, a 6-h formaldehyde exposure at 2
ppm failed to affect the mucociliary function in the nose of rats (Morgan et
al., 1986). It takes a 6-h exposure at 15 ppm to impair the mucociliary
function (Morgan et al., 1986).
As mentioned above, as the formaldehyde concentration gets sufficiently
high, formaldehyde gas might reach the lung to affect lung function.
Formaldehyde at 3 ppm is known to reduce the FEV l and FVC in humans
(Green et al., 1987; Sauder et al., 1986). However, at 1 or 2 ppm, form-
aldehyde has no effect on lung function in volunteers (Kulle et al., 1987;Schachter et al., 1987; Day et al., 1984). There are species differences in
FORMALDEHYDE 95
the pulmonary effects of formaldehyde because formaldehyde has been
shown to increase pulmonary resistance and decrease lung compliance at aslow as 0.3 ppm in guinea pigs (Alexandersson and Hedenstierna, 1988).
Subchronic and Chronic Toxicity
Subchronic Data
In the workplace, repetitive formaldehyde exposures are known to
produce mucosal irritation and pulmonary function impairment similar to
acute exposures. Nasal and eye discomfort, as well as chest discomfort,have been reported in individuals working for up to 10.4 y in facilities with
the formaldehyde concentration ranging from 0.04 to 0.4 ppm (mean =
0.22 ppm) (Holmstrom and Wilhelmsson, 1988). In another report, runny
nose, runny eyes, squamous metaplasia, dysplasia, and goblet-cell hyper-
plasia of liae nasal mucosal have been found in workers exposed to 0.08-0.9ppm of formaldehyde for about 10.5 y (Edling et al., 1988). A slow
progressive impairment in FEV75.25 was reported in workers exposed to
0.04-1.3 ppm (mean = 0.4 ppm) of formaldehyde for greater than 5 y
(Alexandersson, 1988). It is of interest that the pulmonary function impair-ment went away during a 4-w vacation.
Unlike occupational studies, very few reports on experimental studies of
lhe subchronic effects of formaldehyde in humans can be found. A repeti-
tive exposure of human subjects to formaldehyde at 2 ppm, 40 min/d for 4
d, produced an unusual odor and eye irritation, but no pulmonary function
impairment (Schachter et al., 1987). A 7-mo exposure of medical students
to formaldehyde at less than 1 ppm, time-weighted average (TWA), re-sulted in eye and upper respiratory irritation, but no bronchoconstriction,
even in asthmatics (Uba et al., 1989).
Asthmatic reacfons to formaldehyde have been demonstrated. Five of
28 nurses in a renal dialysis unit, where formalin was used to sterilize the
dialysis machines, developed hypersensitivity to formaldehyde (Hendrickand Lane, 1977). Inhalation provocation challenge of these sensitizedindividuals to unknown concentrations of formaldehyde produced wheezing
attacks with productive cough and reduction in peak expiratory flow rates
beginning 2-3 h after the challenge and the symptoms and signs lasted for
hours. There is also epidemiological evidence linking formaldehyde with
asthma. A telephone survey in Massachusetts showed that indoor
96 SMACS FOR SELECTED AIRBORNE CONTAMINANTS
formaldehyde exposures, due to off-gassing from recently remodeled or
constructed houses, newly upholstered furniture, foam insulation in walls,
or mobile homes, were significantly associated with asthma, chronic
bronchitis, or allergies in the youngest child in the household (Tuthill,
1984).
There are many reports on the subchronic effects of formaldehyde onlaboratory animals and only a few of them will be discussed here. Gen-
erally, a 13-w formaldehyde exposure at 6 h/d, 5 d/w produces no his-
topathology, at the light microscopic level, at 1 or 2 ppm in rats (Wilmer etal., 1989; Woutersen et al., 1987), but a similar exposure at 10 ppm causes
squamous metaplasia of the nasal mucosa (Woutersen et al., 1987; Feron etal., 1988). However, 2 ppm is not the NOAEL in subchronic discontinu-
ous exposures, because, based on electron microscopic examinations, a 4-d
formaldehyde exposure at 6 h/d produced abnormal cilia at 0.5 ppm in rats
(Monteiro-Riviere and Popp, 1986). If the formaldehyde exposure concen-tration is sufficiently high, the rat does not recover from the morphological
injuries of formaldehyde. Feron's group has shown that the squamous
metaplasia produced by a 4-, 8-, or 13-w formaldehyde exposure at 20
ppm still remained after a 126-w nonexposure period (Feron et al., 1988).In terms of histopathology in animals, the concentration of formaldehyde
appears to be more important than the degree of cumulative exposure (C ×T) (Wilmer et al., 1989). Feron's group demonstrated that a 13-w formal-
dehyde exposure at 2 ppm for 8 h/d, 5 d/w produced no histopathology inrats, but an exposure at 4 ppm for 4 h/d, 5 d/w resulted in squamous
metaplasia and basal cell hyperplasia of the nasal mucosa (Wilmer et al.,
1989).Most of the subchronic data on formaldehyde were based on discon-
tinuous exposures. There has been only one report on formaldehyde's
toxicity after a subchronic near-continuous exposure. A 26-w formalde-
hyde exposure, 22 h/d, 7 d/w at 0.2 ppm resulted in increased nasal dis-charge, but no histopathology, in monkeys, rats, and hamsters (Rusch et
al., 1983).
Chronic Data
Long-term formaldehyde exposures at 6 h/d, 5 d/w for 84 or 104 w ledto nasal squamous cell carcinoma in Fischer F-344 rats at about 14 ppm
(Albert et al., 1982; Kerns et al., 1983). A 104-w exposure at 14.3 ppm

FORMALDEHYDE 97
also produced squamous cell carcinoma in B6C3F 1 mice (Kerns et al.,1983). The study with the 104-w exposure showed that the rat was more
sensitive than the mouse. The incidence in rats was 87 of 160 rats exposed
versus 0 of 160 controls, and the incidence in mice was 2 of 88 exposedversus 0 of 89 controls (Kerns et al., 1983; EPA, 1990; Starr, 1990).
Even a subchronic exposure to formaldehyde could be carcinogenic in
rats if the exposure concentration is sufficiently high. As mentioned above,a 13-w formaldehyde exposure at 10 ppm produced non-neoplastic changes
in the nasal mucosa of rats (Woutersen et al., 1987; Feron et al., 1988).
However, a 13-w exposure at 20 ppm is known to cause squamous cell
carcinoma, carcinoma in situ, and polyploid adenomas in rats (Feron et al.,
1988). It appears that the subchronic exposure has to be also sufficientlylong to result in carcinogenesis because a 4- or 8-w exposure at 20 ppm
failed to produce nasal cancers in rats (Feron et al., 1988).
The difference between rat and mouse sensitivity to formaldehyde's
carcinogenic effect appears to be related to the different responses to
formaldehyde's sensory irritation in the two species. Formaldehyde gasdepresses the respiration of rats and mice within a minute or two (Chang et
al., 1981). The mouse is more sensitive than the rat because it takes only
5 ppm to decrease the minute volume by 50% in the mouse, compared with32 ppm in the rat. The minute volume reduction is due to a corresponding
decrease in respiratory rate. Other than being less sensitive to formalde-
hyde's respiratory-depression effect than the mouse, the rat also tends to
recover from the respiratory-depression effect during a 10-min formalde-
hyde exposure, and the respiration of the mouse remains depressed during
the 10 min. The respiratory depression effect is the same in naive rats andmice or rats and mice pre-exposed to formaldehyde at 2-15 ppm for 6 h/dfor 4 d.
Epidemioiogical Data
Quite a number of epidemiology studies have been performed with
formaldehyde and only some of the more recent ones will be discussedhere. In general, the results are inconclusive, but there are indications that
certain tumors might be related to formaldehyde exposure in humans. In a
retrospective cohort study, conducted by Blair et al. (1986), of workers
employed in formaldehyde-using or -producing facilities (exposure concen-
trations at 0.1 to greater than 2 ppm), there was a significant increase in

98 SMACS FOR SELECTED AIRBORNE CONTAMINANTS
mortality from nasopharyngeal cancer (Blair et al., 1986). There werealso slight, but statistically insignificant, excesses of Hodgkin's disease and
cancers of the lung, prostate gland, and oropharynx (Blair et al., 1986).
Among these excesses, Hodgkin's disease was statistically correlated with
the concentration of exposure, but not with the degree of cumulative
exposure, i.e., C x T. The excesses of cancers in the other sites were notstatistically correlated with either C or C x T (Blair et al., 1986; Blair et
al., 1987). However, a reanalysis of the data by two other investigatorsdemonstrated a significantly higher risk for lung cancer, as well as for all
cancers, in workers with higher levels of formaldehyde exposure than those
with little or no exposure (Sterling and Weinkam, 1988). In a follow-up
study, mortality from lung cancer actually exhibited a slightly negativecorrelation with formaldehyde exposure in workers exposed to formalde-
hyde alone (Blair et al., 1990). The mortality from lung cancer, however,
was associated with exposure to wood dust, urea, melamine, and phenolrather than with exposure to formaldehyde in workers co-exposed to these
substances and formaldehyde, suggesting that exposure to these substances
may play a more important role than formaldehyde in causing hung cancer
mortality.In another retrospective cohort mortality study conducted by Stayner et
ai. (1988), where garment workers were potentially exposed to for-
maldehyde at 0.15 ppm or higher, there were significant excesses in
mortality from cancers of the connective tissue and buccal cavity. Theexcesses in mortality from leukemia and other lymphopoietic neoplasms
were not statistically significant. However, the mortality from buccal
cavity cancers, leukemia, and other lymphopoietic neoplasms increased
with duration of formaldehyde exposure or latency. The investigators'
conclusion was that formaldehyde exposure was possibly related to the
development of buccal cancers, leukemias, and other iymphopoietlc neo-
plasms in humans.Unlike the study by Blair et al. (1987), the study by Stayner et al. (1988)
did not show any excess in nasal cancer, probably due to the limitedstatistical power of the study. Another case-control study with 544
woodworkers exposed to formaldehyde also failed to show a significant
increase in the odds ratio for cancer in the upper respiratory tract (Partanen
et al., 1990). However, two ease-control studies showed that employment
in jobs with known formaldehyde exposures was associated with increased
risks of nasal and sinus cancers (Hayes et al., 1986; Vaughn et al.,
1986a,b).
FORMALDEHYDE 99
A similarity of the two epidemiology studies (Blair et al., 1986; Stayner
et al., 1988) is that they both demonstrated a potential link of formaldehydeexposure and iymphopoietic neoplasms, which has also been shown in
embalmers and pathologists (Levine et al., 1984; Harrington and Shannon,1975). Interestingly, lymphopoietic neoplasms were not found in theanimal bioassays (Albert et al., 1982; Kerns et al., 1983).
The U.S. Environmental Protection Agency has classified formaldehydeas a probable human carcinogen on the basis of limited evidence in humans
and sufficient evidence in animals (EPA, 1990). The International Agencyfor Research on Cancer considers the evidence for formaldehyde carcino-
genicity in humans limited and sufficient for carcinogenicity in animals
(IARC, 1987). Formaldehyde has been classified by the American Confer-ence of Governmental Industrial Hygienists as a suspected human carcino-
gen (TLV Committee, 1989).
Genetic Toxicity
Formaldehyde causes forward mutation in Salmonella typhimurium,
strain TM677, and it also initiates cell transformation of C3H/10T1/2 cells,
a cell line of mouse embryo fibroblasts (Boreiko et al., 1982). Data from
in vitro genotoxicity assays performed with formaldehyde should be inter-
preted with care for two reasons. First, formaldehyde's volatility is sogreat that 90% of the formaldehyde in a 250-ppm solution is lost to the
head space in closed vials after incubation at room temperature for 1 h
(Proctor et al., 1986). Second, formaldehyde is extremely reactive in
culture medium with fetal calf serum, and many interaction products wereformed in the medium after a l-h incubation at 38°C (Proctor et al., 1986).
These data suggest that only a small portion of formaldehyde remains to
act on the genome in in vitro assays. Nevertheless, formaldehyde has beendemonstrated to react with the genome in vitro.
Developmental Toxicity
Formaldehyde is not teratogenic in the rat (Saillenfait, 1989). Inhalation
exposure of pregnant rats, on days 6-20 of gestation, to 20- or 40-ppmformaldehyde reduced fetal body weight, but it caused no malformations
(Saillenfait, 1989).
100 SMACS FOR SELECTED AIRBORNE CONTAMINANTS
Synergistic Effects
Some evidence indicate that formaldehyde might act synergistically with
inert particles in causing certain, but not all, of its toxic end points. Due tothe fact that carbon particles have been known to exacerbate the mucosal
irritation of ammonia (Dalhamn and Reid, 1967), an irritant gas like
formaldehyde, it is of interest to determine if inert particles will also
potentiate formaldehyde's irritancy. In a Swedish study, in which the
exposure levels were not measured, the respiratory symptoms and lungfunction in workers exposed to formaldehyde alone or formaldehyde with
wood dust were compared (Holmstrom and Wilhelmsson, 1988). The
formaldehyde-only group developed nasal and eye discomfort sooner than
the formaldehyde-wood-dust group; these symptoms started 4.3 y after thestart of employment in the formaldehyde-only group versus 9.9 y in the
other group. Both groups suffered significant reduction in olfactory func-
tion and forced vital capacity, but no change in forced expiratory volume in1 s as a fraction of the forced vital capacity (Holmstrom and Wilhelmsson,
1988). The amount of reduction in olfactory function and forced vital
capacity were similar between the formaldehyde-only and formaldehyde-
wood-dust groups (Holmstrom and Wilhelmsson, 1988).In contrast, there appears to be synergism between formaldehyde and
wood dust in causing nasal cancers. In a Danish epidemiology study, a
nonstatistically significant higher risk ratio of carcinomas of the nasal
cavity and sinuses was found with occupational formaldehyde exposure, but
the risk ratio became statistically significant if there had been exposure to
both formaldehyde and wood dust (Olsen et al., 1984).
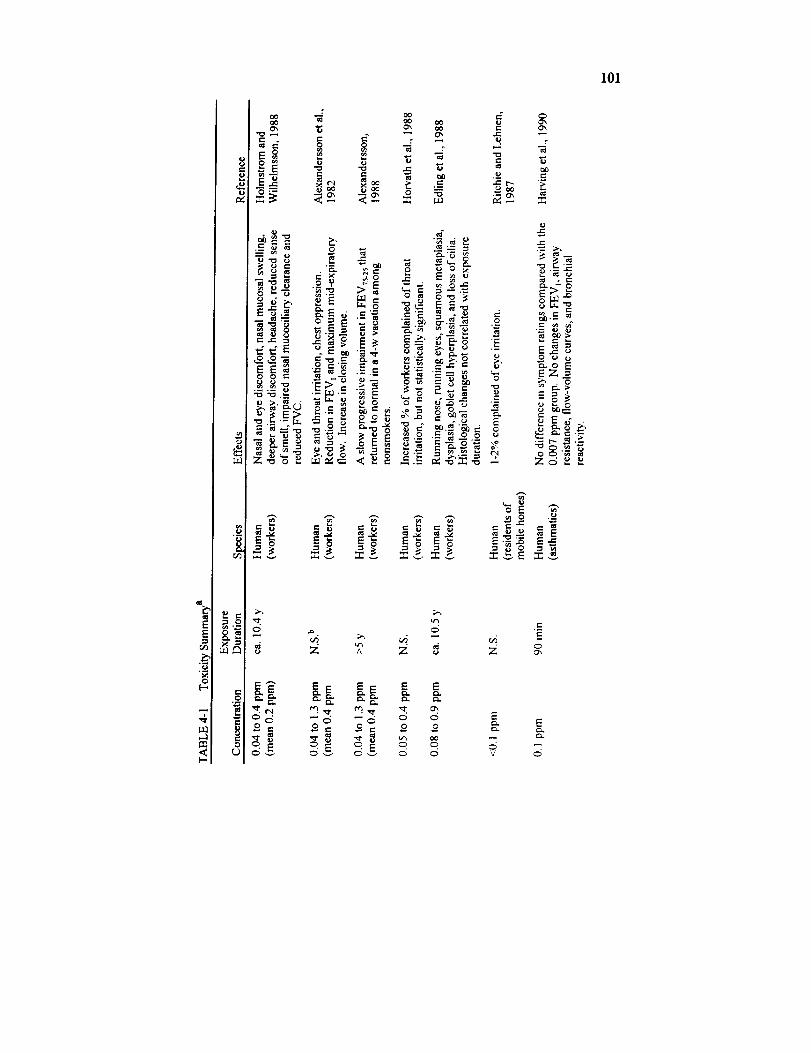
101
8
_a
_4
"7
._ =
_ E
- _ ,__-
o_ ._._ ._-_ ;> ,_ _ _ _ _._ _. -o,_.- o,, __ E>._
°°
"- " E_ _ =
_: -_ ;:I::._ Zo ,_ ._
? ,.=
8 z '2 Z _ ou, Z
E_ E E E
66 --c5 --6 6 6o= o,. o= o o
V 0
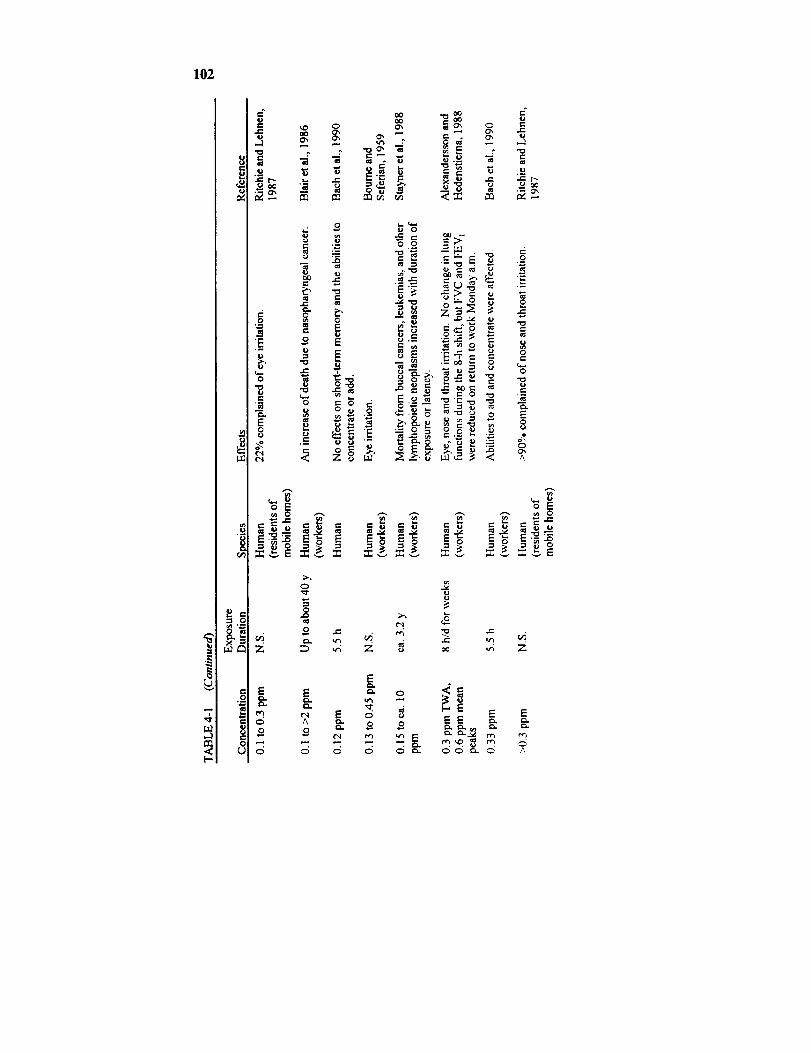
102
r_
._ e..c
e-c
cc
rj
0
E8
•._ t-
r_
E
0
8r.
e-
r-
e_
r'.
0
0
0
E
E
c-o
"_:._ _ _
o
E.___ "_'.'-_ _ _.z-,_- ._ _ - 8
o _. _._'_ .=-
_v r_ _ v _v
E
c5
0
o
Z
E
0
o
6
E
e_
A
o
0
e!.
Z
_E Er_
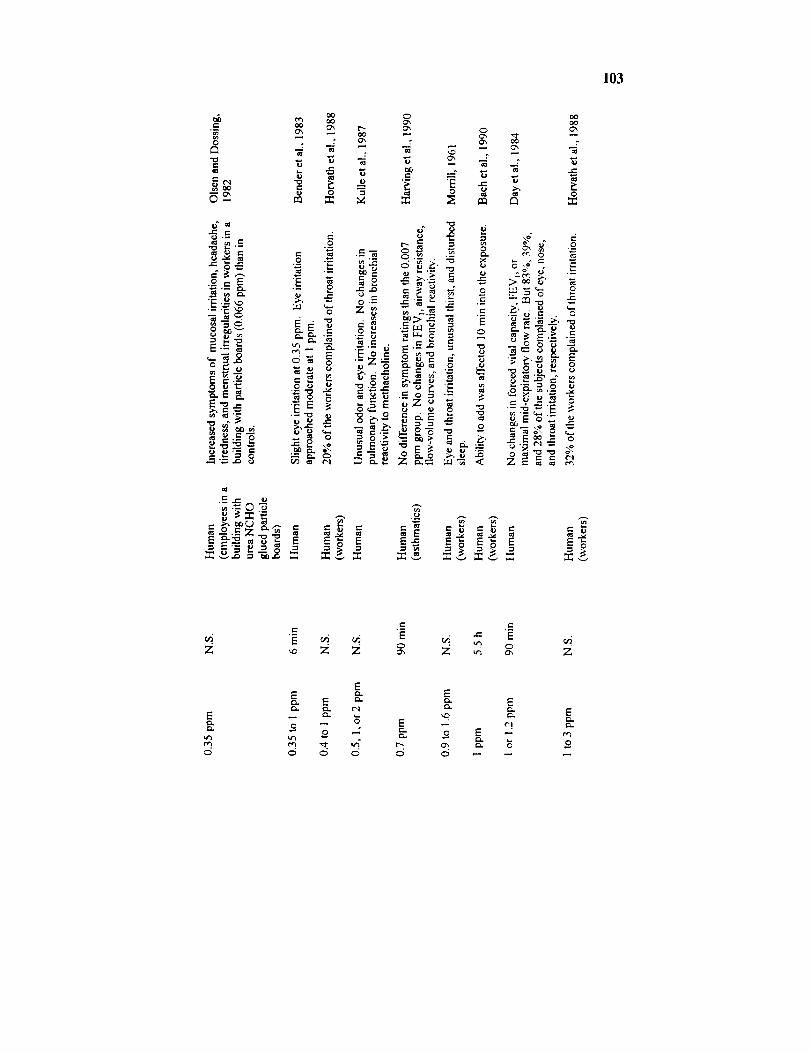
103
e-
8'= =
.o
,__..,_"E .._ ,_
E
_-o_.EK
oO0",
"6
v,.
v-0
ex e_
m
t-
oO
0
0
"E
e_
{
g¢"1
O'x
.-=7_
e-' .
F:o=T,z_
._o
E
_', oo
>oo$'
._,. "_ ._
e-
"_ g _ _ =
8 z _ _ _ -'_-E_=_._ ,, ,,.-,.._
_6._=E _ _6
._= ._=
_, Z ,,4 g Z
Ee-i
o
EE =-
0 M
E" E
Eo E -- m
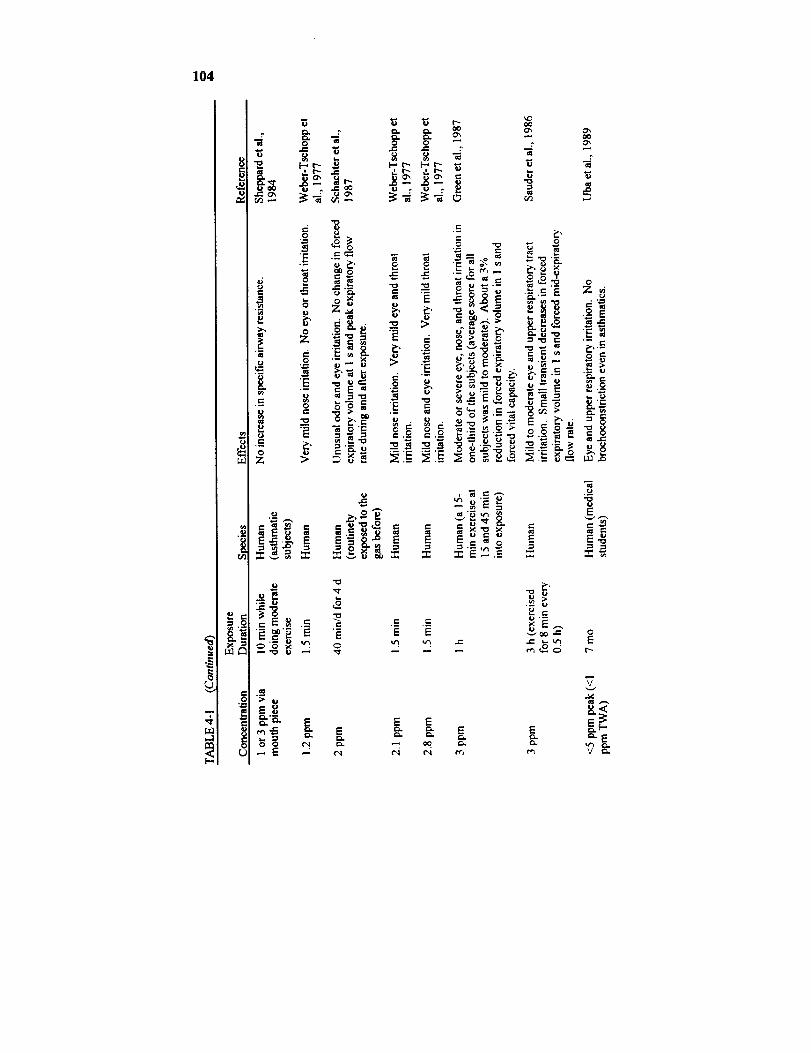
104
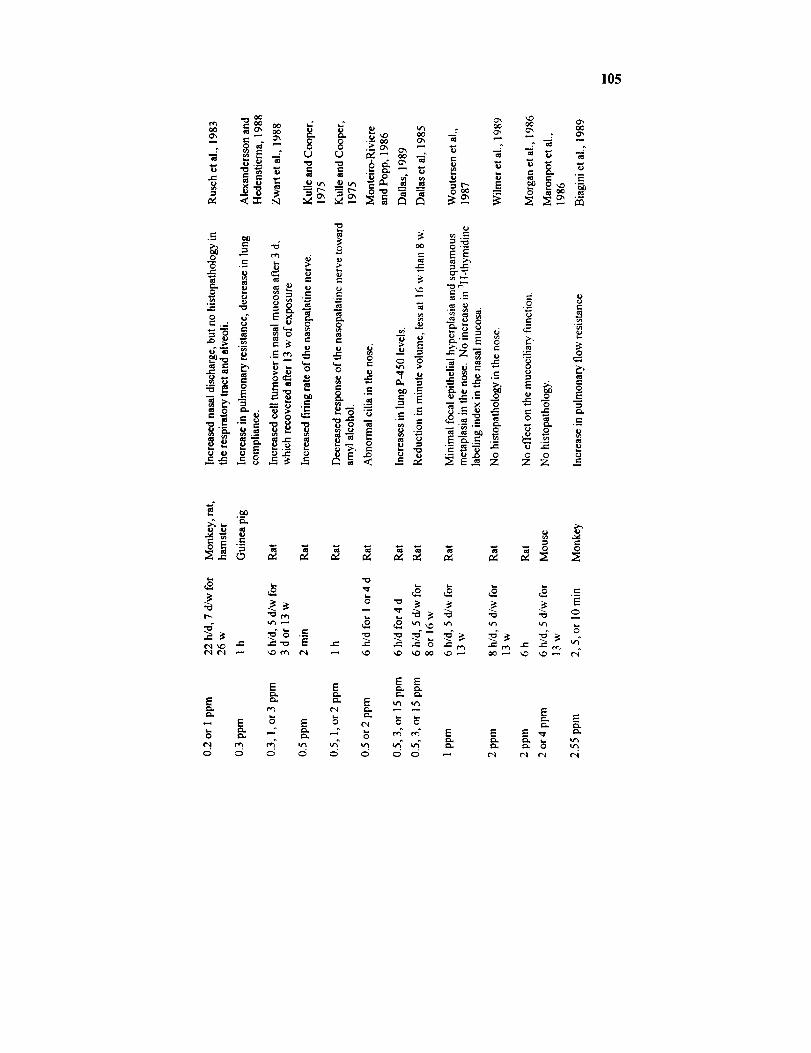
105
oo o',0'_ _ 0'_
0 ..
5
.-= _0" -o"
0 _
_ _ ._ ,.-
2_
.,-. "-- e-"_ _._._._ _ _.__ _
e-,
_ _ _ ___ _:
"..0
0", o_
¢..
N N°' i_
O0 0 "--
lJ,- _ ":2
•-_ _
o o-- Z _ o
K "- _ _ '-' = -- o E
_ _ - ._ __•- "-_." _ .-'_ _°
•,_ _ _-_ z z z -
°_
¢,t xl_ e-¢'t ,r't
o._..0 ee. I ¢.q
EmL
E E
_ E
E

106
!
l.d
e,5o_ox
bJ
CN¢'I
e-Q
°_
_ m
0
"o
.0 ._
,. ==_
o_ _ _o
E.=- -a
_.= o .=
o_0
.o
eq
"_ _..= _ _ _ _ _ __
o
_oo =
_,_° .__
_ "_._
"-_r_
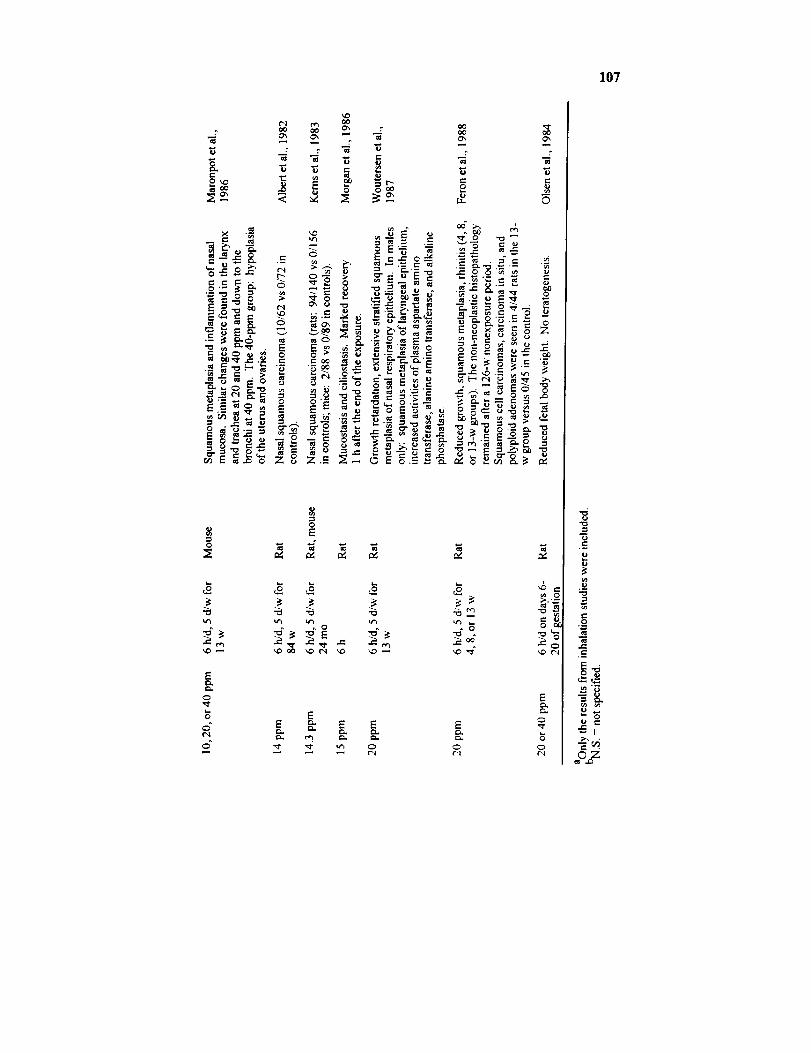
107
e-,
2_
0 _ _ _"
e-, _ e- ..
._o_E_-_E_"E
¢- ,_. -r"
_ _- .
--_ E o
EE o_
0
_l r_ QO
_ _ _ _
z_
0
_.__
eJ .
_-_
0
E
=_ = ._
_, _ =-= °---
._.__"_.__" 0 - --
_-_ _.._=
-=__ _ _
0 E o.--._ _.
"S =
_,_-o_ _-
_._'= = _"_.'E K'-,_ o__._ ._ _
_ ¢,- .
0
"0 "0 "0 "0 ._ e_
EE _" E E
E0
E
0¢-;
,_ _ .__
__.
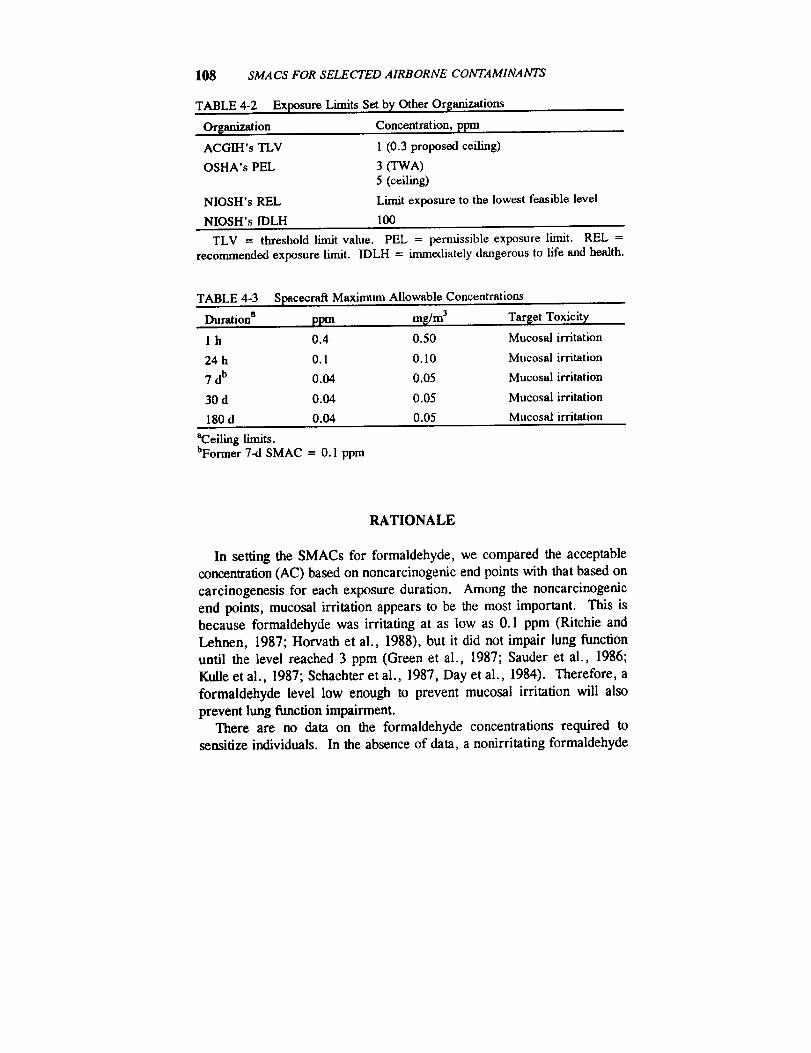
108 SMACS FOR SELECTED AIRBORNE CONTAMINANTS
TABLE 4-2
Orsanization
ACGIH's TLV
OSHA's PEL
NIOSH's REL
NIOSH's IDLH
Exposure Limits Set by Other Or[anizations
Concentration, ppm
1 (0.3 proposed ceiling)
3 ffWA)
5 (ceiling)
Limit exposure to the lowest feasible level
100
TLV = threshold limit value. PEL = permissible exposure limit. REL =recommended exposure limit. IDLH = immediately dangerous to life and health.
TABLE 4-3 Spacecraft Maximum Allowable Concentrations
Duration a ppm mg/m 3 Tar$et Toxicit_
1 h 0.4 0.50 Mucosat irritation
24 h 0.1 0.10 Mucosal irritation
7 db 0.04 0.05 Mucosal irritation
30 d 0.04 0.05 Mucosal irritation
180 d 0.04 0.05 Mucosal irritation
"Ceiling limits.bFormer 7-d SMAC = 0.1 ppm
RATIONALE
In setting the SMACs for formaldehyde, we compared the acceptable
concentration (AC) based on noncarcinogenic end points with that based on
carcinogenesis for each exposure duration. Among the noncarcinogenic
end points, mucosal irritation appears to be the most important. This is
because formaldehyde was irritating at as low as 0.1 ppm (Ritchie and
Lehnen, 1987; Horvath et al., 1988), but it did not impair lung function
until the level reached 3 ppm (Green et al., 1987; Sauder et al., 1986;
Kulle et al., 1987; Sehachter et al., 1987, Day et al., 1984). Therefore, a
formaldehyde level low enough to prevent mucosal irritation will also
prevent lung function impairment.
There are no data on the formaldehyde concentrations required to
sensitize individuals. In the absence of data, a nonirritating formaldehyde
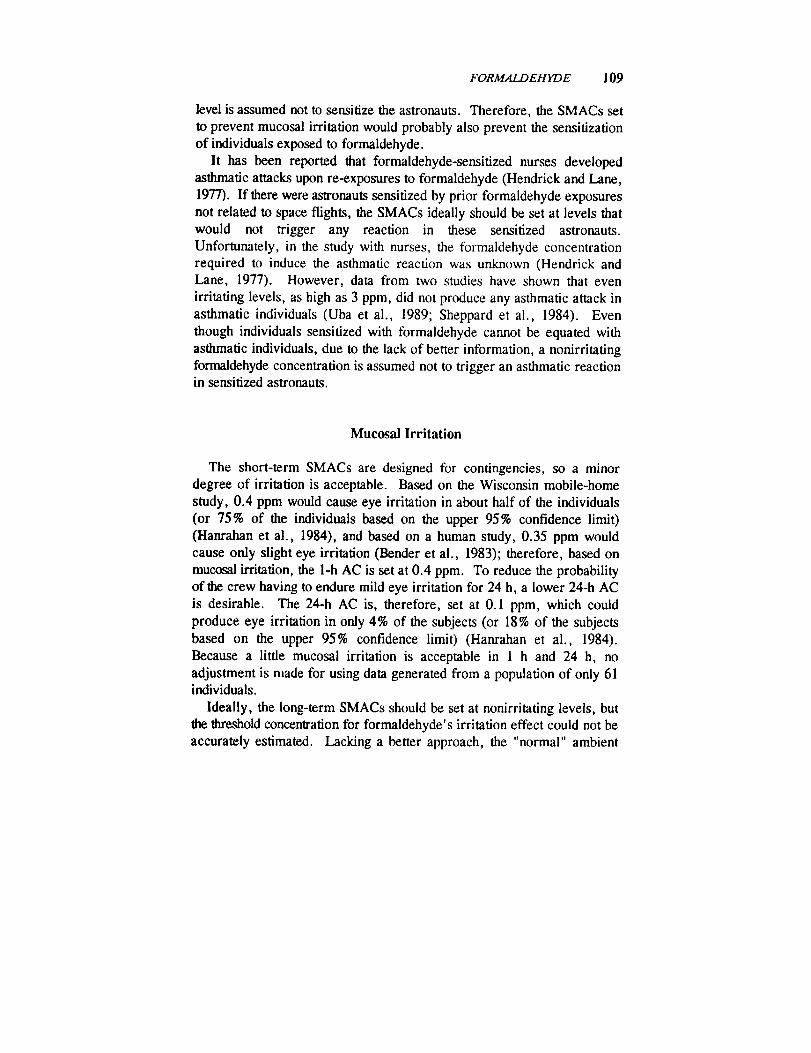
FORMALDEHYDE 109
level is assumed not to sensitize the astronauts. Therefore, the SMACs set
to prevent mucosal irritation would probably also prevent the sensitization
of individuals exposed to formaldehyde.
It has been reported that formaldehyde-sensitized nurses developedasthmatic attacks upon re-exposures to formaldehyde (Hendrick and Lane,
1977). If there were astronauts sensitized by prior formaldehyde exposures
not related to space flights, the SMACs ideally should be set at levels that
would not trigger any reaction in these sensitized astronauts.
Unfortunately, in the study with nurses, the formaldehyde concentrationrequired to induce the asthmatic reaction was unknown (Hendrick andLane, 1977). However, data from two studies have shown that even
irritating levels, as high as 3 ppm, did not produce any asthmatic attack in
asthmatic individuals (Uba et al., 1989; Sheppard et al., 1984). Even
though individuals sensitized with formaldehyde cannot be equated with
asthmatic individuals, due to the lack of better information, a nonirritatingformaldehyde concentration is assumed not to trigger an asthmatic reactionin sensitized astronauts.
Mucosal Irritation
The short-term SMACs are designed for contingencies, so a minordegree of irritation is acceptable. Based on the Wisconsin mobile-home
study, 0.4 ppm would cause eye irritation in about half of the individuals
(or 75% of the individuals based on the upper 95% confidence limit)
(Hartrahan et al., 1984), and based on a human study, 0.35 ppm wouldcause only slight eye irritation (Bender et al., 1983); therefore, based on
mucosal irritation, the 1-h AC is set at 0.4 ppm. To reduce the probabilityof the crew having to endure mild eye irritation for 24 h, a lower 24-h AC
is desirable. The 24-h AC is, therefore, set at 0.1 ppm, which could
produce eye irritation in only 4% of the subjects (or 18% of the subjects
based on the upper 95% confidence limit) (Hanrahan et al., 1984).
Because a little mucosai irritation is acceptable in l h and 24 h, no
adjustment is made for using data generated from a population of only 61individuals.
Ideally, the long-term SMACs should be set at nonirritating levels, but
the threshold concentration for formaldehyde's irritation effect could not be
accurately estimated. Lacking a better approach, the "normal" ambient
110 SMACS FOR SELECTED AIRBORNE CONTAMINANTS
level of formaldehyde is taken to be the practical irritation threshold. In
the Wisconsin mobile-home study, the outdoor formaldehyde level was
0.04 ± 0.03 ppm (mean + S.D.) (Hanrahan et al., 1984). The indoor
formaldehyde level in homes without urea formaldehyde constructionmaterials was 0.03 + 0.004 ppm (mean ± S.D.) (Gupta et al., 1982).
From these measurements, the "normal" ambient level appears to be about
0.04 ppm. The 180-d, 30-d, and 7-d ACs for irritation are, therefore, set
at 0.04 ppm. Based on an extrapolation of the concentration-response dataof the Wisconsin mobile-home study (Hanraham et al., 1984), the long-
term ACs of 0.4 ppm are expected to result in mucosal irritation in lessthan 1% of the individuals (or less than 10% of the individuals based on the
upper 95 % confidence limit).
Carcinogenesis
Some genotoxic carcinogens are known to produce tumors even after a
single exposure (Williams and Weisburger, 1985). Formaldehyde is
genotoxic and, consequently, its carcinogenicity has to be considered in
setting even the 24-h SMAC. Quantitative risk assessments of carcinogenshave traditionally been done using the exposure concentration as ameasurement of the extent of the carcinogen exposure. However, to
quantify the tumor risk of a carcinogen, such as formaldehyde, whichshows a tumor response nonlinearly proportional to the exposure
concentration in a bioassay, the dose at the target site is preferred over the
exposure concentration as a measurement of the extent of exposure (Hoel
et al., 1983). The dose at the target site is also preferred if interspecies
extrapolation will be done. This is because, for the same exposureconcentration, the dose at the target site could differ between the test
species and humans owing to species differences in anatomy and
physiology.A group in the Chemical Industry Institute of Toxicology has measured
the dose, represented by the amount of formaldehyde bound to DNA, as
DNA-protein crosslinks, in the nasal mucosa of rats and monkeys (Starr,1990; Heck et al., 1990). Their data are shown in the table below together
with the tumor data from the 2-y bioassay (Kerns et al., 1983; Starr,
1990).
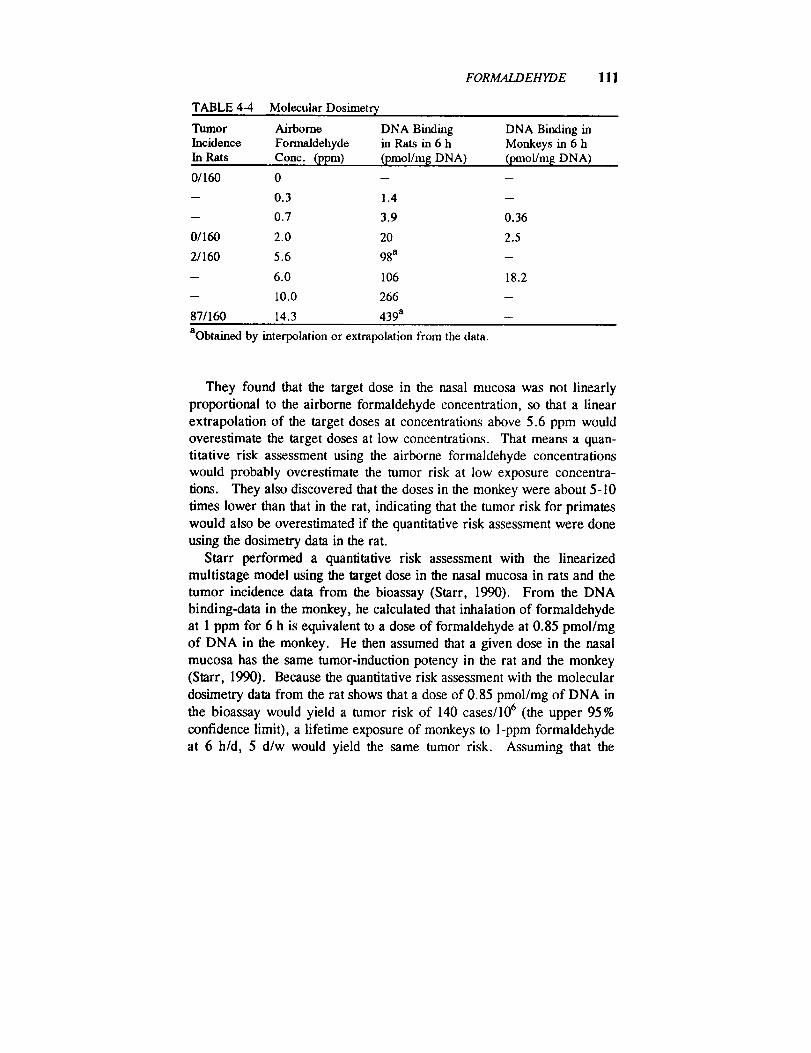
FORMALDEHYDE 111
TABLE 4-4 Molecular Dosimetry
Tumor Airborne DNA BindingIncidence Formaldehyde in Rats in 6 hIn Rats Conc. (ppm) (pmol/m[ DNA)
01160 0 -- --
-- 0.3 1.4 --
-- 0.7 3.9 0.36
01160 2.0 20 2.5
2/160 5.6 98a -
-- 6.0 106 18.2
-- 10.0 266 --
871160 14.3 439 a --
DNA Binding inMonkeys in 6 h
(pmol/m$ DNA)
aobtained by interpolation or extrapolation from the data.
They found that the target dose in the nasal mucosa was not linearly
proportional to the airborne formaldehyde concentration, so that a linear
extrapolation of the target doses at concentrations above 5.6 ppm would
overestimate the target doses at low concentrations. That means a quan-
titative risk assessment using the airborne formaldehyde concentrations
would probably overestimate the tumor risk at low exposure concentra-
lions. They also discovered that the doses in the monkey were about 5-10
limes lower than that in the rat, indicating that the tumor risk for primates
would also be overestimated if the quantitative risk assessment were done
using the dosimetry data in the rat.
Starr performed a quantitative risk assessment with the linearized
multistage model using the target dose in the nasal mucosa in rats and the
tumor incidence data from the bioassay (Starr, 1990). From the DNA
binding-data in the monkey, he calculated that inhalation of formaldehyde
at 1 ppm for 6 h is equivalent to a dose of formaldehyde at 0.85 pmol/mg
of DNA in the monkey. He then assumed that a given dose in the nasal
mucosa has the same tumor-induction potency in the rat and the monkey
(Starr, 1990). Because the quantitative risk assessment with the molecular
dosimetry data from the rat shows that a dose of 0.85 pmol/mg of DNA in
the bioassay would yield a tumor risk of 140 cases/106 (the upper 95%
confidence limit), a lifetime exposure of monkeys to 1-ppm formaldehyde
at 6 h/d, 5 d/w would yield the same tumor risk. Assuming that the
112 SMACS FOR SELECTED AIRBORNE CONTAMINANTS
molecular dosimetry of formaldehyde in humans and monkeys is the same,and assuming that the human is as sensitive as the rat toward
formaldehyde's carcinogenicity, a formaldehyde exposure at 1 ppm, 6 h/d,
5 d/w for 70 y would yield 140 cases of tumors/106 exposed human beings
(the upper 95% confidence limit) (Starr, 1990).
Assuming a linear dose response in the region of interest to us, alifetime continuous exposure at 1 ppm would produce in astronauts, based
on the molecular dosimetry approach,
a lifetime tumor risk
= (140/106) x (24 h/d × 7 d/w)/(6 h/d × 5 d/w)= 784/106
= 7.84/104.
To get a 10-4 lifetime tumor risk in astronauts, based on the molecular
dosimetry approach,
formaldehyde concentration= 1 ppm/7.84
= 0.13 ppm.
Because NRC's Subcommittee on Guidelines for Developing SMACs
felt that the molecular dosimetry approach had not been reviewed by thefull Committee on Toxicology (COT) and that it might be more appropriate
to express risk on the basis of picomole of formaldehyde bound per cellrather than on per milligram of DNA, the carcinogenic risk was also
estimated by the traditional approach.Based on the EPA's quantitative risk assessment using airborne for-
maldehyde concentrations as a measure of exposure (EPA, 1990), the
lifetime exposure concentration that would yield an upper 95 % confidencelimit tumor risk of 10-4 was calculated to be 0.0063 ppm. Therefore, the
lifetime exposure concentration yielding a 10-4 tumor risk from the
traditional approach is about 20 times lower than that estimated with theChemical Industrial Institute of Toxicology's molecular dosimetry
approach. According to the NRC subcommittee, the ACs, usingcarcinogenesis as the basis, are calculated below with the traditional
approach.Based on that approach (NRC, 1990) and setting k = 3, t = 25,550 d,
FORMALDEHYDE 113
and s I = 10,950 d, the adjustment factor is calculated to be 26,082 for
calculating a near-instantaneous exposure level that would yield the sameexcess tumor risk as a continuous lifetime exposure.
24-h exposure level that would yield an excess tumor risk of 10-4= 0.0063 ppm × 26,082
= 164 ppm.
For the 7-d, 30-d, and 180-d ACs, adjustment factors are calculated with
the COT approach (NRC, 1990), setting k = 3, t = 25,550 d, and
assuming that the earliest age of exposure is 30 y. The adjustment factors
are 3728, 871, and 146.7 for a continuous 7-d, 30-d, and 180-d exposure,respectively, that would yield the same excess tumor risk as a continuous
life-time exposure.
7-d exposure level that would yield an excess tumor risk of 10 "4
= 0.0063 ppm x 3728
= 23 ppm.
30-d exposure level that would yield an excess tumor risk of 10-4
= 0.0063 ppm x 871
= 6 ppm.
180-d exposure level that would yield an excess tumor risk of 10-4
= 0.0063 ppm x 146.7
= 0.9 ppm.
Establishment of SMACs
After the ACs for mucosal irritation and carcinogenesis are tabulated
below, it is quite apparent that mucosal irritation is a more sensitive endpoint. The I-h, 24-h, 7-d, 30-d, and 180-d SMACs are set at the cor-
responding ACs based on mucosal irritation and they are 0.4, 0.1, 0.04,
0.04, and 0.04 ppm, respectively. Finally, because it is not anticipated that
microgravity effects on the body would affect the irritancy or car-
einogenicity of formaldehyde, the SMACs are not adjusted for any
microgravity-induced physiological effects.

114 SMACS FOR SELECTED AIRBORNE CONTAMINANTS
TABLE 4-5 Acceptable Concontrations
Acceptable Concentrations, ppm
Toxic End Points 1 h 24 h 7 d 30 d 180 d
Mucosal irritation 0.4 0.1 0.04 0.04 0.04
Carcinogenesis 3400 164 23 6 0.9
SMAC 0.4 0.1 0.04 0.04 0.04
REFERENCES
Albert, R.E., A.R. SeUakumar, S. Laskin, M. Kruschner, and N. Nelson.
1982. Gaseous formaldehyde and hydrogen chloride induction of nasalcancer in the rat. J. Natl. Cancer Inst. 68:597-603.
Alexandersson, R. 1988. Decreased lung function and exposure to form-
aldehyde in the wood working industry. A five-year follow-up. Arh.Hig. Rada Toksikol./Arch. Ind. Hyg. Toxicol. 39:421-424.
Alexandersson, R. and G. I-ledenstierna. 1988. Respiratory hazards
associated with exposure to formaldehyde and solvents in acid-curing
paints. Arch. Environ. Health 43:222-227.Alexandersson, R., B. Kolmodin-Hedman, and G. Hedenstierna. 1982.
Exposure to formaldehyde: Effects on pulmonary function. Arch.Environ. Health 37:279-284.
Bach, B., O.F. Pedersen, and L. Molhave. 1990. Human performance
during experimental formaldehyde exposure. Environ. Int. 16:105-113.Bender, J.R., L.S. Mullin, J. Graepel, and W.E. Wilson. 1983. Eye
irritation response of humans to formaldehyde. Am. Ind. Hyg. Assoc.J. 44:463-465.
Biagini, R.E., W.J. Moorman, E.A. Knecht, J.C. Clark, and I.L. Bern-stein. 1989. Acute airway narrowing in monkeys from challenge with
2.5 ppm formaldehyde generated from formalin. Arch. Environ. Health44:12-17.
Blair, A., P. Stewart, M. O'Berg, W. Gaffey, J. Walrath, J. Ward, R.
Bales, S. Kaplan, and D. Cubit. 1986. Mortality among industrial
workers exposed to formaldehyde. J. Natl. Cancer Inst. 76:1071-1084.
Blair, A., P.A. Stewart, R.N. Hoover, J.F. Fraumeni, Jr., J. Walrath, M.
O'Berg, and W. Gaffey. 1987. Cancers of the naso/pharynx and
FORMALDEHYDE 115
oropharynx and formaldehyde exposure. J. Natl. Cancer Inst. 78: 191-193.
Blair, A., P.A. Stewart, and R.N. Hoover. 1990. Mortality from lung
cancer among workers employed in formaldehyde industries. Am. J.Ind. Med. 17:683-699.
Boreiko, C.J., D.B. Couch, and J.A. Swenberg. 1982. Mutagenic andcarcinogenic effects of formaldehyde. Pp. 353-367 in Genotoxic Effects
of Airborne Agents. R.R. Tice et al., eds. Plenum, New York.
Bourne, H.G. and S. Seferian. 1959. Formaldehyde in wrinkle-proof
apparel produces tears for milady. Ind. Med. Surg. 28:232.Casanova, M., H.d'A. Heck, J.I. Everitt, W.W. Harrington, Jr., and J.A.
Popp. 1988. Formaldehyde concentrations in the blood of rhesus
monkeys after inhalation exposure. Food Chem. Toxicol. 26:715-716.
Casanova-Schmitz, M., R.M. David, and J. d'A. Heck. 1984. Oxidation
of formaldehyde and acetaldehyde by NAD +-dependent dehydrogenases
in rat nasal mucosal homogenates. Biochem. Pharmacol. 33:1137-1142.Chang, J.C.F., W.H. Steinhagen, and C.S. Barrow. 1981. Effect of
single or repeated formaldehyde exposure to minute volume of B6C3F1
mice and F-344 rats. Toxicol. Appl. Pharmacol. 61:451-459.Coon, R.A., R.A. Jones, L.J. Jenkins, Jr., and J. Siegel. 1970. Animal
inhalation studies on ammonia, ethylene chloride, formaldehyde,dimethylamine, and ethanol. Toxicol. Appl. Pharmacol. 16:646-655.
Dalhamn, T. and L. Reid. 1967. Ciliary activity and histologic observ-
ations in the trachea after exposure to ammonia and carbon particles.
Pp. 299-306 in Inhaled Particles and Vapours II. C.N. Davies, ed.Oxford, U.K.: Pergamon Press.
Dallas, C.E. 1989. The influence of inhaled formaldehyde on rat lung
cytochrome P-450. Environ. Res. 49:50-59.Dallas, C.E., J.C. Theiss, R.B. Harriet, and E.J. Fairchild. 1985. Effect
of subchronic formaldehyde inhalation on minute volume and nasal
deposition in Sprague-Dawley rats. J. Toxicol. Environ. Health 16:553-564.
Day, J.H., R.E.M. Lees, R.H. Clark, and P.L. Pattee. 1984. Respira-tory response to formaldehyde and off-gas of urea formaldehyde foaminsulation. Can. Med. Assoc. J. 131:1061-1065.
Edling, C., H. Hellquist, and L. Odkvist. 1988. Occupational exposure to
formaldehyde and histopathological changes in the nasal mucosa. Br. J.Ind. Med. 45:761-765.
116 SMACS FOR SELECTED AIRBORNE CONTAMINANTS
EPA. 1990. Formaldehyde. In Integrated Risk Information System, a
computerized database by the Environmental Criteria and AssessmentOffice, U.S. Environmental Protection Agency, Cincinnati, Ohio.
Feron, V.J., J.P. Bruynitjes, R.A. Woutersen, H.R. Immel, and L.M.
Appelman. 1988. Nasal tumours in rats after short-term exposure to acytotoxic concentration of formaldehyde. Cancer Lett. 39:101-111.
Green, D.J., L.R. Sauder, T.J. Kulle, and R. Bascom. 1987. Acute
response to 3.0 ppm formaldehyde in exercising healthy nonsmokers and
asthmatics. Am. Rev. Resp. Dis. 135:1261-1266.
Gupta, K.C., A.G. Ulsamer, and P.W. Preuss. 1982. Formaldehyde in
indoor air: Source and toxicity. Environ. Int. 8:349-358.Hanrahan, L.P., L.P. Hanrahan, K.A. Dally, H.A. Anderson, M.S.
Kanarek, and J. Rankin. 1984. Formaldehyde vapor in mobile homes:
A cross sectional survey of concentrations and irritant effects. Am. J.Public Health 74:1026-1027.
Harrington, J.M and H.S. Shannon. 1975. Mortality study of pathologistsand medical laboratory technicians. Br. Med. J. 4:329-332.
Harving, H., J. Korsgaard, O.F. Pedersen, L. Molhave, and R. Dahi.
1990. Pulmonary function and bronchial reactivity in asthmatics duringlow-level formaldehyde exposure. Lung 168:15-21.
Hayes, R.B., J.W. Raatgever, and A. de Bruyn. 1986. Cancer of thenasal cavity and paranasal sinuses, and formaldehyde exposure. Int. J.Cancer 37:487-492.
Heck, H. d'A., M. Casanova, and T.B. Starr. 1990. Formaldehyde
toxicity -new understanding. Crit. Rev. Toxicol. 20:397-426.
Heck, H., M. Casanova-Schmitz, P.B. Dodd, E.N. Schachter, T.J. Witek,
and T. Tosun. 1985. Formaldehyde (CH20) concentration in the blood
of humans and Fischer-344 rats exposed to CH20 under controlled
conditions. Am. Ind. Hyg. Assoc. J. 46:1-3.
Hendriek, D.J. and D.J. Lane. 1977. Occupational formalin asthma. Br.J.Ind. Med. 34:11-18.
Hoel, D.G., N.L. Kaplan, and M.W. Anderson. 1983. Implication of
nonlinear kinetics on risk estimation in carcinogenesis. Science 219:1032-1037.
Holmstrom, M. and B. Wilhelmsson. 1988. Respiratory symptoms and
pathophysiological effects of occupational exposure to formaldehyde andwood dust. Scand. J. Work Environ. Health 14:306-311.
Horvath, E.P., Jr., H. Anderson, W.E. Pierce, L. Hanrahan, and J.D.
FORMALDEHYDE 117
Wendlick. 1988. The effects of formaldehyde on mucus membranes
and lungs. J. Am. Med. Assoc. 259:701-707.Huennekens, F.M. and M.J. Osborne. 1959. Folic acid coenzymes and
one-carbon metabolism. Adv. Enzymol. 21:369.
IARC. 1987. Formaldehyde. Pp. 211-215 in IARC Monographs on theEvaluation of Carcinogenic Risks to Humans. Overall Evaluations of
Carcinogenicity: An Updating of IARC Monographs. Vols. 1-42,
Suppl. 7. International Agency for Research on Cancer, Lyon, France.
James, J.T. 1991. Toxicological Assessment of Noxious Odors Produced
by the Orbiter Refrigerator Freezer During the STS-40 Mission. JSCMemorandum, SD4/91-308, Aug. 13, 1991. Johnson Space Center,
Houston, Tex.
Kerns, W.D., K.L. Pavkov, D.J. Donofrio, E.J. Galla, and J.A. Swen-
berg. 1983. Carcinogenicity of formaldehyde in rats and mice afterlong-term inhalation exposure. Cancer Res. 43:4382-4392.
Koivusalo, M., T. Koivula, and L. Uotila. 1982. Oxidation of formal-
dehyde by nicotinamide nucleotide dependent dehydrogenases. P. 155 inEnzymology of Carbonyl Metabolism: Aldehyde Dehydrogenase andAldol Keto Reductase. H. Weiner and B. Wermuth, eds. Alan R. Liss,New York.
Kulle, T.J. and G.P. Cooper. 1975. Effects of formaldehyde and ozone
on the trigeminal nasal sensory system. Arch. Environ. Health 30:237-243.
Kulle, T.J., L.R. Sauder, J.R. Hebel, D.J. Green, and M.D. Chatham.
1987. Formaldehyde dose-response in healthy non-smokers. J. Am.Pollut. Control Assoc. 37:919-924.
Levine, R.J., D.A. Andjelkovich, and L.K. Shaw. 1984. Mortality of
Ontario undertakers and a review of formaldehyde-related mortality
studies. J. Occup. Med. 26:740-746.
Maronpot, R.R., R.A. Miller, W.J. Clarke, R.B. Westerberg, J.R.Decker, and O.R. Moss. 1986. Toxicity of formaldehyde vapor in
B6C3F1 mice exposed for 13 weeks. Toxicology 41:253-266.
McMartin, K.E., G. Martin-Amat, P.E. Noker, and T.R. Tephly. 1979.
Lack of a role for formaldehyde in methanol poisoning in the monkey.Biochem. Pharmacol. 28:645-649.
Monteiro-Riviere, N.A. and J.A. Popp. 1986. Ultrastructural evaluation
of acute nasal toxicity in the rat respiratory epithelium in response to
formaldehyde gas. Fund. Appl. Toxicol. 6:251-262.
118 SMACS FOR SELECTED AIRBORNE CONTAMINANTS
Morgan, K.T., E.A. Gross, and D.L. Patterson. 1986. Distribution,
progression, and recovery of acute formaldehyde-induced inhibition of
nasal mucociliary function in F-344 rats. Toxicol. Appi. Pharmacol.86:448-456.
Morrill, Jr., E.E. 1961. Formaldehyde exposure from paper process
solved by air sampling and current studies. Air Cond. Heat. Vent.58:94-95.
NRC. 1980. Formaldehyde--An Assessment of Its Health Effects.
National Academy Press, Washington, D.C.NRC. 1990. Guidelines for Developing Spacecraft Maximum Allowable
Concentrations for Space Station Contaminants. National Academy
Press, Washington, D.C.Olsen, J.H. and M. Dossing. 1982. Formaldehyde induced symptoms in
day care centers. Am. Ind. Hyg. Assoc. J. 43:366-370.Olsen, J.H., S.P. Jensen, H. Morgan, K. Faurbo, N.O. Breum, and O.M.
Jensen. 1984. Occupational formaldehyde exposure and increased nasalcancer risk in man. Int. J. Cancer 34:639-644.
Partanen, T., T. Kauppinen, S. Hernberg, J. Nickels, R. Luukkonen, T.Hakulinen, and E. Pukkala. 1990. Formaldehyde exposure and respira-
tory cancer among woodworkers--An update. Scand. J. Work Environ.Health 16:394-400.
Peto, P.G. 1981. Results of Soviet-Hungarian Space Research. East
Europe Report No. 699, April 3, 1981. Pp. 4-12.Proctor, B.L., M.E. Gaulden, and M.A. Dowd. 1986. Reactivity and
fate of benzene and formaldehyde in culture medium with and without
fetal calf serum; relevance to in vitro mutagenicity testing. Mutat. Res.160: 259-266.
Ritchie, I.M and R.G. Lehnen. 1987. Formaldehyde-related complaints
of residents living in mobile and conventional homes. Am. J. PublicHealth 77:323-328.
Rusch, G.M., J.J. Clary, W.E. Rinehart, and H.F. Bolte. 1983. A
26-week inhalation toxicity study with formaldehyde in the monkey, rat,
and hamster. Toxicol. Appl. Pharmacol. 68:329-343.
Saillenfait, A.M. 1989. The effects of maternally inhaled formaldehyde
on embryonal and foetal development in rats. Food Chem. Toxicol.27:545-548.
Saldiva, P.H., M.P. do Rio Caldeira, E. Massad, D.F. Calheiros, L.M.
Cardoso, G.M. Bohm, and C.D. Saldiva. 1985. Effects of formalde-
FORMALDEHYDE 119
hyde and acetaldehyde inhalation on rat pulmonary mechanics. J. Appl.Toxicol. 5:288-292.
Sauder, L.R., M.D. Chatham, D.J. Green, and T.J. Kulle. 1986. Acute
pulmonary response to formaldehyde exposure in healthy nonsmokers.J. Occup. Med. 28:420-424.
Sax, N.I. 1984. P. 1451 in Dangerous Properties of Industrial Materials.
Van Nostrand Reinhold, New York.
Schachter, E.N., T.J. Witek, Jr., D.J. Brody, T. Tosun, G.J. Beck, and
B.P. Leaderer. 1987. A study of respiratory effects from exposure to
2.0 ppm formaldehyde in occupationally exposed workers. Environ.Res. 44:188-205.
Sheppard, D., W.L. Eschenbacher, and J. Epstein. 1984. Lack of
bronchomotor response to up to 3 ppm formaldehyde in subjects withasthma. Environ. Res. 35:133-139.
Starr, T.B. 1990. Workshop on indoor air quality. Quantitative cancer
risk estimation for formaldehyde. Risk Anal. 10:85-91.
Stayner, L.T., L. Elliott, L. Blade, R. Keenlyside, and W. Halperin.
1988. A retrospective cohort mortality study of workers exposed to
formaldehyde in the garment industry. Am. J. Ind. Med. 13:667-681.
Sterling, T.D. and J.J. Weinkam. 1988. Reanalysis of lung cancermortality in the National Cancer Institute study on mortality among
industrial workers exposed to formaldehyde. J. Occup. Med. 30:895-901.
TLV Committee. 1989. Documentation of TLV's and BEI's. American
Conference of Governmental Industrial Hygienists, Cincinnati, Ohio.
Tuthill, R.W. 1984. Brief reports. Woodstoves, formaldehyde, and
respiratory disease. Am. J. Epidemiol. 120: 952-955.
Uba, G., D. Pachorek, J. Bernstein, D.H. Garabrant, J.R. Balmes, W.E.
Wright, and R.B. Amar. 1989. Prospective study of respiratory effects
of formaldehyde among healthy and asthmatic medical students. Am. J.Ind. Med. 15:91-101.
Uotila, L. and M. Koivusalo. 1974. Formaldehyde dehydrogenase from
human liver: Purification, properties and evidence for the formation of
glutathione thiol esters by the enzyme. J. Biol. Chem. 249:7653-7663.
Vaughn, T.L., C. Strader, S. Davis, and J.R. Daling. 1986a. Formal-
dehyde and cancers of the pharynx, sinus and nasal cavity. I. Occupa-
tional exposures. Int. J. Cancer 38:677-683.
Vaughn, T.L., C. Strader, S. Davis, and J.R. Daling. 1986b. Formal-
120 SMACS FOR SELE_ AIRBORNE CONTAMINANTS
dehyde and cancers of the pharynx, sinus and nasal cavity. II. Resi-dential exposures. Int. J. Cancer 38:685-688.
Weber-Tschopp, A., T. Fischer, and E. Grandjean. 1977. [Irritating
effects of formaldehyde on man.] Int. Arch. Occup. Environ. Health39:207-218.
Williams, G.M. and J.H. Weisburger. 1985. P. 104 in Casarett andDoull's Toxicology: The Basic Science of Poisons. C.D. Klaassen,
M.O. Amdur, and J. Doull, eds. Macmillan, New York.
Wilmer, J.W.G.M., R.A. Woutersen, L.M. Appelman, W.R. Leeman,and V.J. Feron. 1989. Subchronic (13-week) inhalation toxicity study
of formaldehyde in male rats: 8-hour intermittent versus 8-hour contin-
uous exposures. Toxicol. Lett. 47:287-293.Woutersen, R.A., L.M. Appelman, J.W.G.M. Wilmer, H.E. Falke, and
V.J. Feron. 1987. Subchronic (13-week) inhalation toxicity study of
formaldehyde in rats. J. Appl. Toxicol. 7:43-49.
Zwart, A., R.A. Woutersen, J.W.G.M. Wilmer, B.J. Spit, and V.J.
Feron. 1988. Cytotoxic and adaptive effects in rat nasal epitheliumafter 3-day and 13-week exposure to low concentrations of formalde-
hyde vapour. Toxicology 51:87-99.
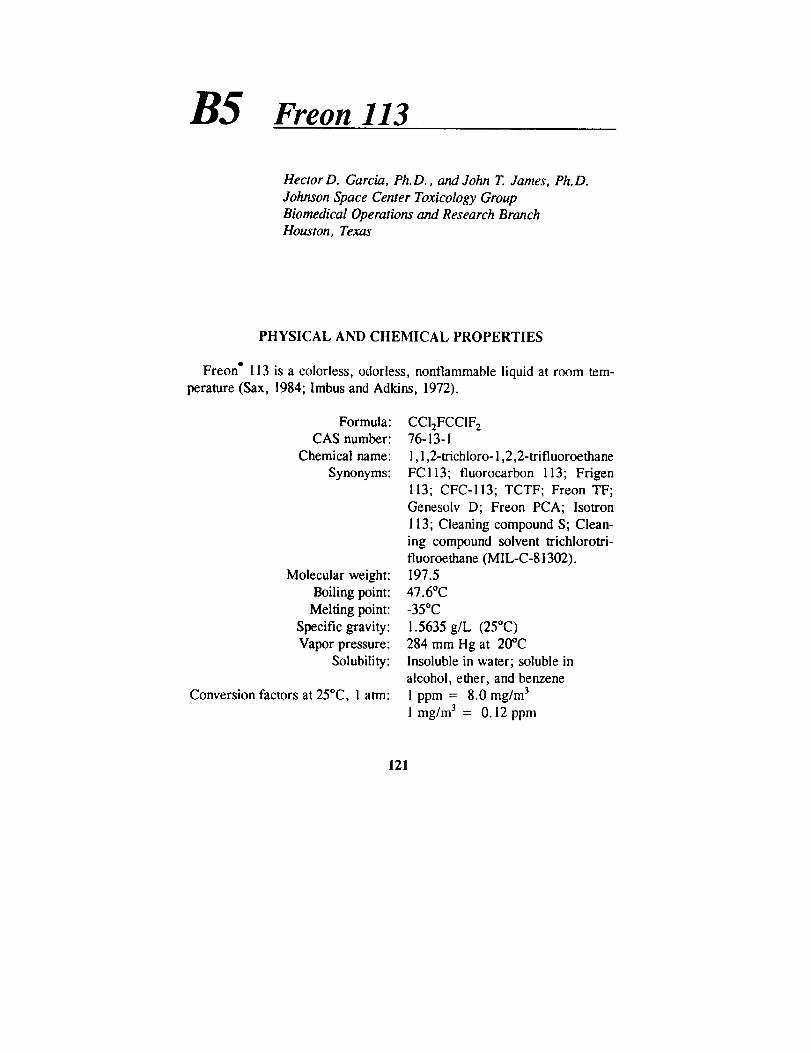
B5 Freon 113
Hector D. Garcia, Ph.D., and John T. James, Ph.D.
Johnson Space Center Toxicology GroupBiomedical Operations and Research BranchHouston, Texas
PHYSICAL AND CHEMICAL PROPERTIES
Freon ® 113 is a colorless, odorless, nonflammable liquid at room tem-
perature (Sax, 1984; Imbus and Adkins, 1972).
Formula:CAS number:
Chemical name:
Synonyms:
Molecular weight:
Boiling point:
Melting point:
Specific gravity:
Vapor pressure:
Solubility:
Conversion factors at 25°C, 1 atm:
CCI2FCCIF 276-13-1
1,1,2-trichloro- 1,2,2-trifluoroethane
FCll3; fluorocarbon 113; Frigen113; CFC-113; TCTF; Freon TF;
Genesolv D; Freon PCA; Isotron
113; Cleaning compound S; Clean-
ing compound solvent trichlorotri-
fluoroethane (MIL-C-81302).197.5
47.6°C
-35°C
1.5635 g/L (25°C)
284 mm Hg at 20°C
Insoluble in water; soluble in
alcohol, ether, and benzene
lppm = 8.0mg/m 3
lmg/m 3 = 0.12ppm
121
122 SMACS FOR SELECTED AIRBORNE CONTAMINANTS
OCCURRENCE AND USE
FC 113 does not occur naturally. It is manufactured for use principally
as a dry-cleaning solvent, refrigerant, and blowing agent. It is also used as
a cleaning solvent for metals and sensitive electronic parts and in the
maintenance of hydraulic piping systems in submarines. FC113 has been
piped into each of three clean rooms at Kennedy Space Center for use in
cleaning, hydrocarbon sampling, particle sampling and general degreasing.FCll3 is not used in the spacecraft during flight, but has been used to
clean and degrease spacecraft components between missions. It has been
detected in the atmosphere in the spacecraft in almost every mission,
usually at low levels, the highest to date being 8.7 ppm (Liebich et al.,
1975).
PHARMACOKINETICS
Inhaled FC113 distributes in a dose-dependent manner into the perirenal
fat and brain of rats; the concentrations were 126, 506, and 1133 nmol/g of
fat after exposure to 200, 1000, and 2000 ppm, respectively, for 6 h/d, 5
d/w, for 2 w (Savolainen and Pffiifli, 1980).Blood concentrations of FC113 in dogs inhaling FC 113 at 1000, 5000,
or 10,000 ppm increased rapidly during the first 5 min, then more slowlyor not at all for the remainder of a 10-min exposure (Trochimowicz et al.,
1974). The kinetics of blood-level variations suggest a tissue uptake of
FC113 during exposure, followed by a release into the venous blood after
the exposure is terminated. FCII3 is rapidly eliminated from the blood-stream and expelled through the lungs after cessation of exposure, having a
venous half-life of approximately 15 min.
A study (Woolen et al., 1990) in seven male human volunteers of blood
and breath levels during, and for several days after, exposure to FC113 for4 h at concentrations of 240, 490, or 920 ppm suggested a three compart-
ment model (e.g. blood, tissues, fat) with half-lives for the elimination ofFCll3 in the breath of 0.22, 2.3, and 29 h, respectively. Blood concentra-
tions of FC113 approached a plateau after approximately 30 min exposure
and peak concentrations were related to the exposure concentrations.
Pulmonary retention of 14% was measured during exposure but only 2.6-4.3 % of the dose was recovered unchanged in breath after the exposure

FREON 113 123
period, suggesting that FCII3 could be metabolized following inhalation
exposure. The data from this study do not permit a firm conclusion to be
drawn as to whether FC 113 is metabolized by humans (Auton and Woolen,1991).
In another study (Reinhardt et al., 1971), four human male volunteerswere exposed to FC 113 for 5 d at 500 ppm, 3 h each morning and 3 h
each afternoon, followed 3 d later by exposure for 5 d at 1000 ppm, 3 h
each morning and 3 h each afternoon. Measurements were taken of FC113
levels in end tidal breaths taken 1 min after the end of each exposure. The
highest measured level was 115 ppm on the afternoon following the first
exposure at 1000 ppm in one subJect. End tidal breath levels taken on the
third day following the last exposure showed FC 113 concentrations of 1.5
ppm in one subject and less than 1 ppm in the other three subjects. Al-though this result demonstrates that almost all FC113 that might have been
retained in the tissues under these exposure conditions was eliminated after
two successive exposure-free days, it is not sufficient to establish that a
gradual tissue build up of FC 113 would not occur under continuous expo-sure conditions.
TOXICITY SUMMARY
Acute Toxicity ( < 24 h Exposure)
Lethality
Human fatalities have been reported for exposures to FCII3 in Japan
and in the United States. One Japanese death involved a worker who was
exposed for less than 30 min to an atmosphere containing 13.7-17.5%
oxygen and FC113 at 118,000-140,000 ppm (11.8-14%, v/v) (Yonemitsuet al., 1983). One of two other Japanese workers died after being occupa-
tionally exposed for about 1 h to an undetermined concentration of FC113
(Hoshika et al., 1989). The dead worker had signs of central-nervous-
system (CNS) toxicity: urination and defecation as well as probable lung
injury (discharge from nose and ears). The survivor was exposed for about
half an hour before going to the clinic complaining of heart palpitations and
heavy-headedness. He was found to be anemic and had colitis. Within a
3-y period, four active-duty Navy and one civilian employee died in three
124 SMACS FOR SELECTED AIRBORNE CONTAMINANTS
separate incidents attributed to FCll3 exposure of unstated duration in
areas that could permit accumulation of vapors, including confined spaces
and low-lying areas aboard ships (Arnitz, 1985). FC113 may be responsi-
ble for some fatalities in cases of individuals intentionally inhaling aerosol
propellants, although FC113 was not one of the halocarbon propellantsidentified in the 110 "sudden sniffing deaths" reported by Bass (1970).
The 4-h LCso for rats is from 52,000 to 68,000 ppm (O.L. Dashiell,
J.W. Sarver, and T.K. Bogdanowicz, DuPont, unpublished data, 1971),while lethal concentrations for a 2-h exposure of rats, guinea pigs, mice,
and rabbits range from 50,000 to 120,000 ppm. The 15-rain LCso in rats is
130,000 ppm (Clark and Tinston, 1982). The oral LDs0 in rats is 43 g/kg
(Michaelson and Huntsman, 1964).
No-Observed-Adverse-Effect Level (NOAEL)
Two human males exposed to 1,500 ppm for 2.5 h showed no adverse
psychomotor effects (Stopps and McLaughlin, 1967). Because only two
subjects were exposed at a single FC 113 concentration and only behavioral
effects (manual dexterity, depth perception, card sorting) were examined,
limited weight can be given these results. Dogs exposed for 10 min to2500 ppm FC113 showed no cardiac sensitization to epinephrine-induced
arrhythmias (Reinhardt et al., 1973).
Cardiac Arrhythmia
Clinical experience indicates that halohydrocarbons might be cardiac
arrhythmogens (Back and Van Stee, 1977) at high concentrations. Hine etal. (1968) monitored EKGs during exposure of humans to nominal concen-
trations of bromotrifluoromethane at 50,000, 100,000, and 150,000 ppm.
Auriculoventricular (AV) dissociation and premature ventricular contrac-
lions (maximum 16.9%) were recorded during exposure to the highestconcentrations.
In a study of the cardiac effects of FC113, four dogs were exposed toFCll3 for 10 rain via face mask to 1000, 5000, and 10,000 ppm
(Reinhardt et al., 1973). At 10,000 ppm, three of four dog exposures
resulted in life-threatening cardiac arrhythmias (multiple consecutive
ventricular beats or ventricular fibrillation) after a challenge dose of
FREON 113 125
epinephrine at 8 #g/kg. At 5,000 ppm, the incidence was 10 of 29 dog
exposures, and at 2500 ppm, the incidence was 0 of 12 dog exposures.
In another study from the same lab, FC113 did not produce cardiacsensitization in dogs at 1000 ppm, and arterial blood concentrations (2.6
/_g/mL) were proportionally lower than arterial blood concentrations
associated with cardiac sensitization (12.5/zg/mL) (Trochimowicz, 1973).
An inspired concentration of 5000 ppm was required to sensitize the dogheart to the arrhythmic action (multiple consecutive ventricular beats or
ventricular fibrillation) of exogenous epinephrine (Trochimowicz et ai.,
1974; Trochimowicz, 1973). The ECs0 for cardiac sensitization to
epinephrine in dogs for a 5-min exposure to FC113 was reported to be
7000 ppm (Clark and Tinston, 1982). In mice, inhalation of 5000-ppmFCll3 is required to sensitize the heart to epinephrine-induced
arrhythmias, and a level of 10,000 ppm will induce arrhythmias without
exogenous epinephrine (Aviado and Belej, 1974). Sensitization is only a
temporary effect, however, since an epinephrine injection given 10 min
after exposure (at which time much of the FCll3 had probably been
eliminated from the blood) did not cause arrhythmia (Clark and Tinston,1971).
CNS Effects
The ECs0 for CNS stimulation (tremors of the limbs) for a lO-min
exposure of rats to FCll3 was found to be 28,000 ppm (Clark and Tinston,1982).
Eye and Skin
A single application or instillation of FC 113 was found to be practicallynonirritating to the ocular mucosa and skin of rabbits (Duprat et al., 1976).
Sleepiness
In a limited study involving six rats exposed to 12,000 ppm for up to 24
mo, a slight sleepiness was observed that disappeared immediately after
daily exposure stopped (Desoille et al., 1968).
126 SMACS FOR SELECTED AIRBORNE CONTAMINANTS
Subchronic Toxicity (1-13 w Exposure)
NOAEL
Four male volunteers exposed at 500 or 1000 ppm for 6 h/d, 5 d/w for 2
w showed no adverse effects on performance of complex mental tasks or
changes in clinical status or biochemical tests (Reinhardt et al., 1971).
Although the exposure of humans makes this study potentially valuable, thesmall number of subjects limits its usefulness.
Twenty-one rats exposed to FC113 at 2520 ppm for 7 h/d, 5 d/w for 6 w
showed no signs of toxicity during the exposure period and no gross or
microscopic pathology attributed to FC113 exposure (Limperos, 1954).
Similarly, no changes in behavior or external appearance were seen in rats
exposed to FCll3 at 10,000 ppm or dogs exposed to FCll3 at 5000 ppm;
both species were exposed for 6 h/d, 7 times a week for 90 d (Leuschner et
al., 1983).
Biochemical Effects on the CNS
Reported biochemical effects on the CNS of the rat include dose-depend-ent accumulation in brain tissue and perirenal fat, an increase of
NADPH-diaphorase activity at 200 ppm and a decrease in cerebral gluta-
thione at 2000 ppm in the first week of exposure for 2 w, 5 d/w, 6 h/d(Savolainen and Pffiifli, 1980). During the second week, these effects
disappeared while RNA tended to increase, and glutathione peroxidaseactivity tended to decrease at the highest dose. After a withdrawal period of
7 d, no FCII3 was detected and the neurochemical effects had disap-
peared, except that brain RNA at the highest exposure was below the
control range. It is not clear whether these biochemical changes are
detrimental or merely adaptive. Dose-response or time-response effectswere not demonstrated.
Hepatotoxicity
Male rats exposed to FCll3 at 1000 or 2000 ppm for 5 d/w, 6 h/d for
1 or 2 w showed subtle changes in liver cells (Vainio et al., 1980). Indica-
FREON 113 127
tions of lipid accumulation were seen in the light microscope. In the
electron microscope, a slight to moderate increase of the smooth endoplas-
mic reticulum with vacuolization was seen in the 1000- and 2000-ppm
groups after 1 and 2 w of exposure. These same groups also showed an
increased number of autophagous vacuoles, reduced glycogen, and conden-
sations in some mitochondria. All these observations were subjective in
nature. Biochemical studies on these rats after 1 w of exposure showed
dose-related decreases in the levels of NADPH cytochrome-c reductase andmicrosomal cytochrome P-450 and increases in UDP glucuronosyltrans-
ferase activity in liver but not in kidney (Vainio et al., 1980). These
reported effects were reduced or absent after 2 w of exposure; hence, the
meaning of the effects reported at l w is uncertain. It is not clear whether
the histological and biochemical changes reported at 1000 and 2000 ppm
actually occurred, and if they did, whether they were detrimental or merelyadaptive.
Chronic Toxicity ( > 13 w Exposure)
NOAEL
A group of 50 workers, exposed for an average of 2.77 y in an envi-
ronment that contained FCl13 at 46-4700 ppm, were given clinical and
laboratory examinations and compared to 50 workers who were not so
exposed. No significant differences were seen between the two groups,other than one individual who complained of dryness of the skin due to
FC113 exposure (Imbus and Adkins, 1972).
Carcinogenicity and Genotoxicity
A 2-y joint study by DuPont and Allied Corporation has concluded thatFCll3 has no carcinogenic or toxic effects in rats exposed to 0, 2000,
10,000, or 20,000 ppm (v/v) by inhalation for 6 h/d, 5 d/w for 104 w
(Trochimowicz et al., 1988). No significant toxic effects were observed,
including histopathology of 43 tissues, hematology, gross appearance,
behavior, and mortality (Trochimowicz et al., 1988). A 5-10% decrease in
body-weight gain was seen at the 10,000- and 20,000-ppm exposure levels.
128 SMACS FOR SELECTED AIRBORNE CONTAMINANTS
FCll3 was found to have no dominant lethal effects in mice (Epstein et al.,
1972) given i.p. doses of 200 mg/kg or 1000 mg/kg. FCll3 was not
mutagenic in Salmonella (Longstaff, 1988).
A 1988 study has shown that preparation of mierosomal enzymes fromlivers of mice exposed to FCll3 at 20,000 ppm for a total of 8 h greatly
enhanced the metabolic activation of procarcinogenic polyaromatic hydro-
carbons (aminofluorene, acetylaminofluorene) (Mahurin and Bernstein,
1988) as compared with microsomal enzymes prepared from the livers of
sham-exposed mice, although FC113 itself was not mutagenic as measured
by a microbial assay.
Kidney Effects
A study of Danish metal workers occupationally exposed to trichloro-
ethylene or FC113 concluded that chlorinated organic solvents can inducesubclinical nephropathy after long-term exposure. Concentrations were not
estimated, however (Rasmussen et al., 1988).
Memory and Psychomotor Effects
A study of 99 workers engaged in degreasing with haiogenated hydro-carbons found the following signs and symptoms of psychoorganic syn-
drome in the three workers who had heavy exposure to only FCII3 for
2.5-4.5 y: impaired psychomotor speed, impaired learning, and impaired
long-term memory (Rasmussen et al., 1988).
Mechanistic Studies
Comparison of the relative potencies of a wide range of halogenated and
unsubstituted hydrocarbons that can produce rapidly reversible effects on
the CNS and the heart suggests that these effects are probably structurally
nonspecific, i.e. these chemicals may be regarded as physical toxicants
whose effects are predictable from their physicochemical properties (Clark
and Tinston, 1982). These chemicals probably exert their toxic effects not
by combining with some specific target or receptor but by simply being
FREON 113 129
present in some part of the cell in a concentration sufficient to disorganize
its function temporarily. Such a model would predict that there should bea threshold tissue concentration below which this class of chemicals would
have no effect on a given tissue. Some effects, nevertheless, might be
subtle and might require long-term continuous exposure before becoming
significant.
Spaceflight Effects
There have been several reports of cardiac arrhythmias in U.S. astro-
nauts (Bungo, 1980) and Soviet cosmonauts (Gazenko et al., 1990) during
spaceflights. During the third month of a flight aboard the Soviet Mir
Space Station, the flight engineer of the second prime crew showed cardiac
rhythm irregularities in response to emotional and physical stress. During
an extravehicular activity (EVA) (April 11, 1987), he registered a series of
atrial extrasystoles with episodes of trigeminy. While performing graded
physical exercise on a treadmill soon after the EVA, he displayed marked
tachycardia incommensurate with the exercise level and a significantnumber of isolated supraventricular extrasystoles. Utilization of a number
of medical measures, adjustment of the prophylactic program, and stringent
organization of the work-rest schedule led to gradual normalization of
cardiac rhythm during exercise. No further cardiac arrhythmias were seenon two subsequent EVAs (June 12 and 16, 1987), but at the end of June,
supraventricular extrasystoles were again noted during exercise, although
the cosmonaut himself did not experience any associated sensations.
Postflight cardiological examination of this cosmonaut revealed no organic
changes in his myocardium, nor was any further disruption of cardiac
rhythm noted.
During the first four flights of the space shuttle, one crew memberexhibited uniform PVCs (premature ventricular contractions) during nearly
every minute of re-entry after the onset of gravitational loading. Although
preflight examinations had revealed occasional PVCs in this crew member,
the rate of ectopics per minute during re-entry was perhaps eight-fold
higher than preflight. A second crew member, who had no significant
prior history of ventricular ectopia, exhibited rare PVC during the entry
phase. Serum electrolytes were not abnormal in either crew member
(Bungo and Johnson, 1983).
130 SMACS FOR SELECTED AIRBORNE CONTAMINANTS
Unfortunately, there have been insufficient data collected on the base-
line incidence of cardiac arrhythmias of individuals on earth to assess the
health risk associated with these putative anomalies. Even in the shuttle
program, EKG measurements are routinely taken only during EVAs.
Synergism
FC 113 has been widely used domestically and industrially as a propel-
lant for pesticide mixtures containing piperonyl butoxide (PB) as a syner-
gist to inhibit detoxifying enzymes. FCll3 and PB, both relatively
low-toxicity compounds, were found to be highly toxic and carcinogenic
when a 10%-FC113, 5%-PB mixture dissolved in tricaprylin was injected
subcutaneously into neonatal mice, although neither compound alone was
toxic or carcinogenic under the same conditions (Epstein et al., 1967).
There is no basis to expect PB to be present in spacecraft air.
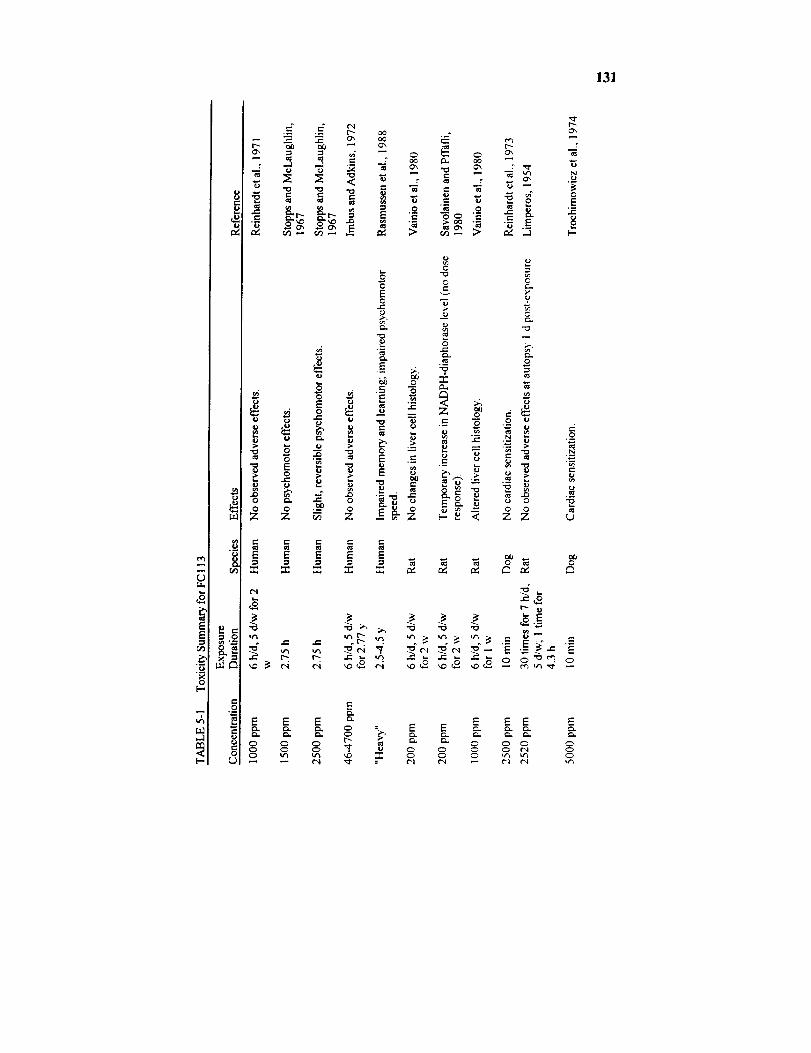
131
tel
g_
t--,
d_
ID
UI.1
8(..,
'W
=- =- _ r.--..-. .-. _'_ O0 ...._ Ox
: _ _ .- _ _ o, ._
2 E
0 ¢-- ,'_
.- r"
= _ _ .- _ _ ,-=. _ ._ _ o
_ __ _. _:_' ._ _ = :*2-- _. "='=_ _ _ o°
-_ --¢"- .-
o o _ o _o o_ o o o
E E E E E
E13.
E E E _ E E E E
o o o _ _ o o o o _ o
_" _ _ _ _ ..,,'_ _ "_
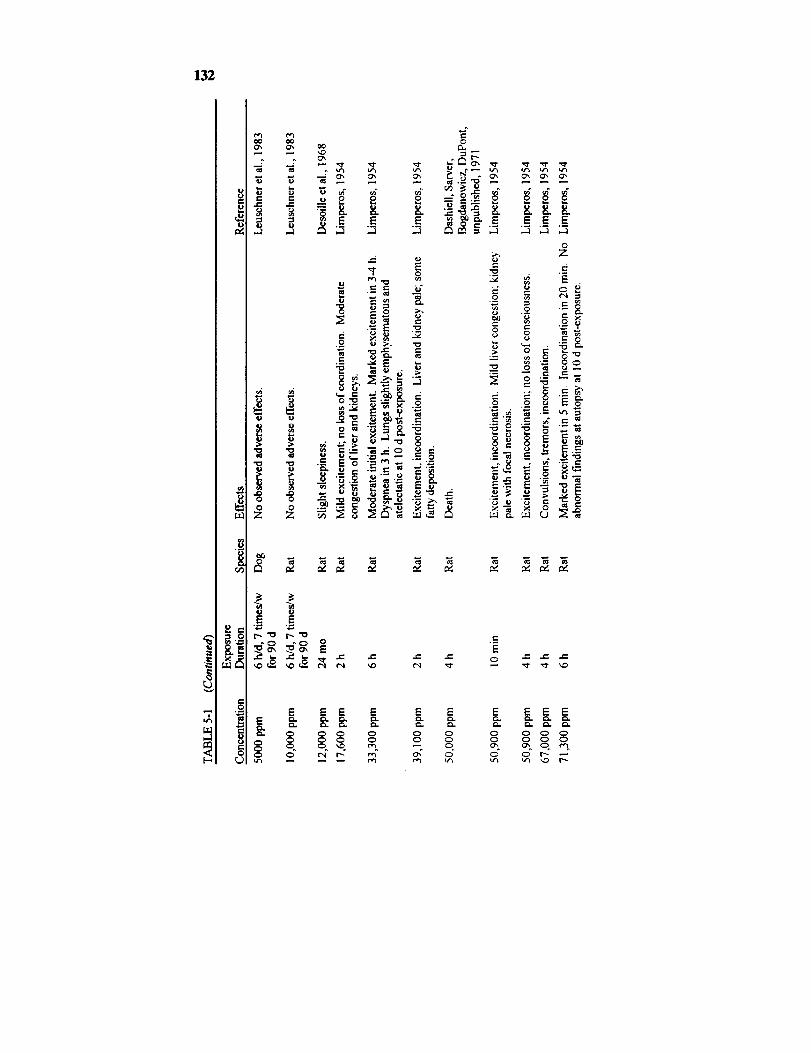
132
e-
_J
0
(o
t_ ¢'e3oO
_" " u 0
= E .E,--1
.o
..J
eel._
_ m
_ _ _-_i_.-
-_ _ _'-_ _ .o o _ _._._ -_
_ _ o
0
we_ _
_1 0 e.. ._
o.oo,9
...J ,.-.1
0
_ e
e-
.>___ _-_, _,__ _ ._ -_._.
•= ._ .__ __._ ,.
E
E E E E
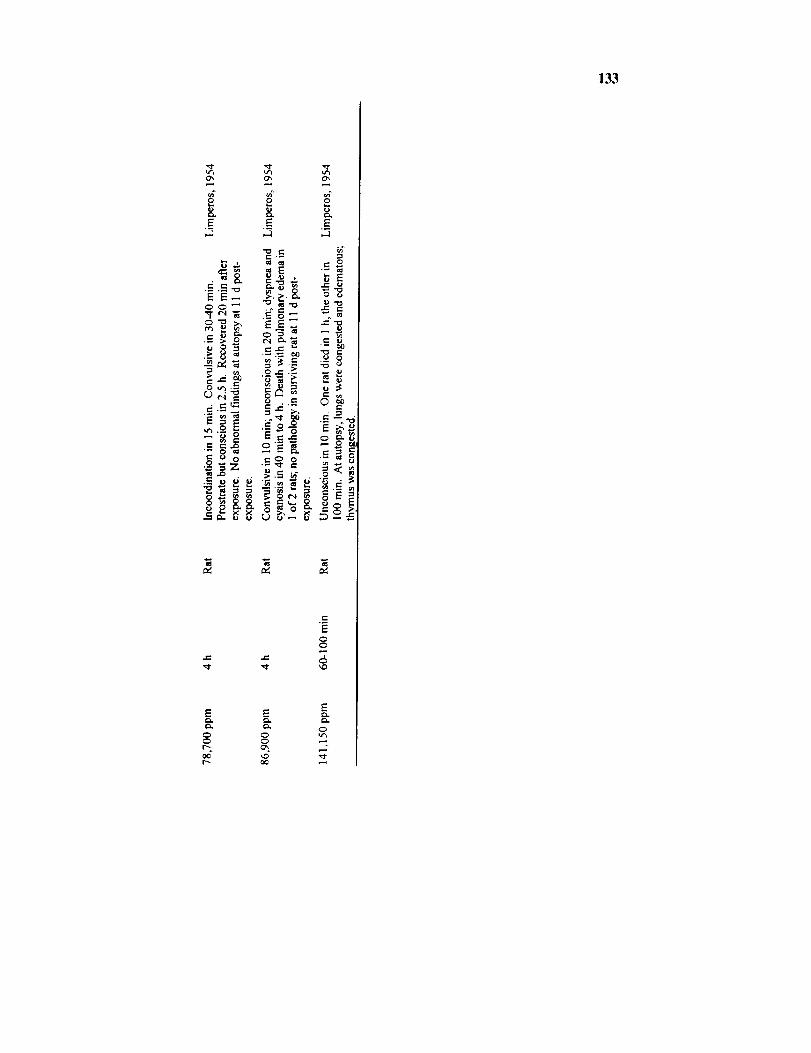
133
o8..E
C.C. _
0
. e- t._
-_i _
m
.o8.E
"_ e-e'- _-
_EU *1_ t
EE_
¢-, e- _',
._-_ _
8.
¢-
,_ "-_ .
.N_e
_,_
e- 6
E
0
e_
E
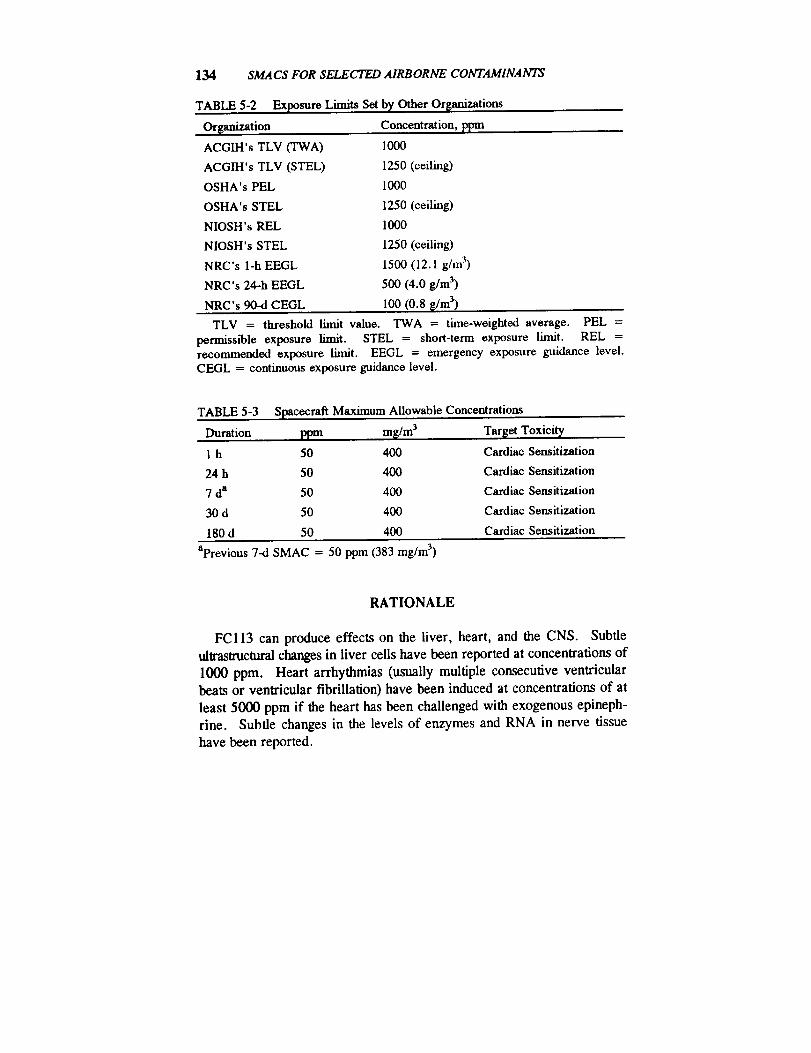
134 SMACS FOR SELECTED AIRBORNE CONTAMINANTS
TABLE 5-2 Exposure Limits Set
Organization
ACGIH's TLV (TWA)
ACGIH's TLV (STEL)
OSHA's PEL
OSHA's STEL
NIOSH's REL
NIOSH's STEL
NRC's 1-h EEGL
NRC's 24oh EEGL
NRC's 90-d CEGL
by Other Organizations
Concentration, ppm
1000
1250 (ceiling)
1000
1250 (ceiling)
1000
1250 (ceiling)
1500 (12.1 g/m 3)
500 (4.0 g/m 3)
100 (0.8 _/m 3)
TLV = threshold limit value. TWA = time-weighted average. PEL =permissible exposure limit. STEL = short-term exposure limit. REL =recommended exposure limit. EEGL = emergency exposure guidance level.CEGL = continuous exposure guidance level.
TABLE 5-3 Spacecraft Maximum Allowable Concentrations
Duration ppm m_/m 3 T_et Toxicity
1 h 50 400 Cardiac Sensitization
24 h 50 400 Cardiac Sensitization
7 da 50 400 Cardiac Sensitization
30 d 50 400 Cardiac Sensitization
180 d 50 400 Cardiac Sensitization
aPrevious 7-d SMAC = 50 ppm (383 mg/m 3)
RATIONALE
FCI13 can produce effects on the liver, heart, and the CNS. Subtle
ultrastruetural changes in liver cells have been reported at concentrations of
1000 ppm. Heart arrhythmias (usually multiple consecutive ventricular
beats or ventricular fibrillation) have been induced at concentrations of at
least 5000 ppm if the heart has been challenged with exogenous epineph-
rine. Subtle changes in the levels of enzymes and RNA in nerve tissue
have been reported.

FREON 113 135
Of these end points, the only definitely adverse effect is cardiac sensi-
tization. Mild, subclinical, "adaptive" effects on the liver, such as the
equivocal changes in enzyme activities and smooth endoplasmic reticulumin liver cells reported after exposure of rats to 1000 ppm for 6 h/d, 5 d/w
for 1 w, are not considered to be significant changes.
Cardiac arrhythmias are unacceptable because, although they might not
be incapacitating by themselves, some types might signal a substantiallyincreased risk of incapacitating or fatal cardiac injury. The SMAC for a l-
h exposure to FC113 was set at 50 ppm on the basis of the findings that a
10-min exposure to 2500 ppm did not sensitize dog hearts to the
arrhythmogenic action of epinephrine and then applying a species ex-
trapolation factor of 10 and an additional factor of 5 for possible space-
flight-enhanced sensitivity to arrhythmias. No time extrapolation should be
applied to the 50-ppm 1-h SMAC because this effect is dependent on bloodconcentration, which reaches a plateau in about 30 min in humans (10 min
in dogs).The SMACs for 24 h, 7 d, 30 d, and 180 d exposures to FCI13 were
also set at 50 ppm on the basis that arrhythmogenicity is dependent onblood concentration, which reaches a plateau in about 30 min, and is
apparently independent of time (Trochimowicz et al., 1974).This 50-ppm value is well below the concentration of 1000 ppm which,
based on only two test subjects, appears to have no effect on manual
dexterity in humans exposed 6 h/d, 5 d/w for 1 w immediately after expo-sure to 500 ppm for 1 w on the same schedule (Reinhardt et al., 1971).
REFERENCES
Arnitz, W.E. 1985. Discontinued use of trichlorotrifluoroethane. Office
of Chief of Naval Operations. Document No. X1-F-85-05.
Auton, T.R. and B.H. Woolen. 1991. A physiologically based mathe-
matical model for the human inhalation pharmacokinetics of 1,1,2-tri-
chloro-l,2,2-trifluoroethane. Int. Arch. Occup. Environ. Health 63:133-138.
Aviado, D.M. and M.A. Belej. 1974. Toxicity of aerosol propellants in
the respiratory and circulatory systems. I. Cardiac arrhythmia in the
mouse. Toxicology 2:31-42.Back, K.C. and E.W. Van Stee. 1977. Toxicology of haloalkane propel-
136 S_¢S FOR SELECTED AIRBORNE CONTAMINANTS
lants and fire extinguishants. Annu. Rev. Pharmacol. Toxicol. 17:83-95.
Bass, M. 1970. Sudden sniffing death. J. Am. Med. Assoc. 12:2075-2079.
Brogren, C.-H., J.M. Christensen, and K. Rasmussen. 1986. Occupa-
tional exposure to chlorinated organic solvents and its effect on the renal
excretion of N-acetyl-13-D-glucosaminidase. Arch. Toxicol. Suppl.9:460-464.
Bungo, M. 1989. The cardiopulmonary system. Pp. 197-199 in Space
Physiology and Medicine. Nicogossian, A.E., C.L. Huntoon, and S.L.Pool, eds. Lea & Febiger, Philadelphia.
Bungo, M.W. and P.C. Johnson. 1983. Cardiovascular examinations and
observations of deconditioning during the space shuttle orbital flight test
program. Aviat. Space Environ. Med. 1001-1004.Clark, D.G. and D.]. Tinston. 1971. The Influence of Fluorocarbon
Propellants on the Arrhythmogenic Activities of Adrenaline and Iso-
prenaline. Pp. 212-217 in Proceedings of the 12th Meeting of theEuropean Society for the Study of Drug Toxicity. European Society of
Toxicology, Basel, Switzerland.Clark, D.G. and D.J. Tinston. 1982. Acute inhalation toxicity of some
halogenated and non-halogenated hydrocarbons. Hum. Toxicol. 1:239-247.
Desoille, H., L. Truffert, A. Bourguignon, P. Delavierre, M. Philbert,and C. Girard-Wallon. 1968. l_tude experimentale de la toxicit6 du
trichlorotrifluoroethane (Freon 113). Arch. Mal. Prof. Med. Trav.Secur. Soc. 29:381-388.
Duprat, P., L. Delsaut, and D. Gradiski. 1976. Pouvoir irritant des
principaux solvants chlor6s aliphatiques sur la peau et les muqueusesoculaires du lapin. Eur. J. Toxicol. 9:171-177.
Epstein, S.S., E. Arnold, J. Andrea, W. Bass, and Y. Bishop. 1972.Detection of chemical mutagens by the dominant lethal assay in the
mouse. Toxicol. Appl. Pharmacol. 23:288-325.
Epstein, S.S., S. Joshi, J. Andrea, P. Clapp, H. Falk, and N. Mantel.
1967. Synergistic toxicity and carcinogenicity of "Freons" and piper-
onyl butoxide. Nature 214:526-528.Gazenko, O.G., A.I. Grigor'yev, S.A. Bugrov, V.V. Yegorov, V.V.
Bogomolov, I.B. Kozlovskaya, and I.K. Tarasov. 1990. Review of the
major results of medical research during the flight of the second prime
FREON 113 137
crew of the Mir Space Station. Kosmicheskaya Biologiya i
Aviakosmicheskaya Meditsina 23(4):3-11; translated and abstracted in
USSR Space Life Sciences Digest. NASA Contractor Rep. 3922(34):119-120.
Hine, C.H., H.W. Elliott, J.W. Kaufman, S. Leung, and M.D. Harrah.
1968. Clinical toxicologic studies on freon FE1301. Presented at the
4th Annual Conference on Atmospheric Contaminants in Confined
Spaces. AMRL-TR-68-175. Wright-Patterson Air Force Base, Dayton,Ohio.
Hoshika, Y., T. Tsuchiya, and N. Murayama. 1989. Two cases of acute
poisoning of l,l,2-trichloro-l,2,2-trifluoroethane (Freon 113). J. Ind.Health 31:248-249.
Imbus, H. R. and C. Adkins. 1972. Physical examinations of workers
exposed to trichlorotrifluoroethane. Arch. Environ. Health 24:257-261.Leuschner, F., B.-W. Neumann, and F. Hiibscher. 1983. Report on
subacute toxicological studies with several fluorocarbons in rats and
dogs by inhalation. Arzneimittel-Forschung./Drug Res. 33(II):1475-1476.
Liebich, H. M., W. Bertsch, A. Zlatkis, and H.J. Schneider. 1975.
Volatile organic components in the Skylab 4 spacecraft atmosphere.
Aviat. Space Environ. Med. 46:1002-1007.
Limperos, G. 1954. Inhalation toxicity of "Freon-ll3" (1,1,2-tri-chloro-l,2,2-trifluoroethane). Rep. 3-54. E.I. DuPont de Nemours &
Company, Haskell Laboratories for Toxicology and Industrial Medicine.
Longstaff, E. 1988. Carcinogenic and mutagenic potential of severalfluorocarbons. Ann. N.Y. Acad. Sci. 534:283-298.
Mahurin, R.G. and R.L. Bernstein. 1988. Fluorocarbon-enhanced muta-
genesis of polyaromatic hydrocarbons. Environ. Res. 45:10 l- 107.Michaelson, J.B. and D.J. Huntsman. 1964. Oral toxicity study of
1,2,2-trichloro-l,l,2-trifluoroethane. J. Med. Pharmacol. Chem.7:378-379.
Rasmussen, K., H.J. Jeppesen, and P. Arlien-Soborg. 1988. Psychoor-
ganic syndrome from exposure to fluorocarbon 113--An occupationaldisease? Eur. Neurol. 28:205-207.
Reinhardt, C.F., M. McLaughlin, M.E. Maxfield, L.S. Mullin, and P.E.
Smith, Jr. 1971. Human exposures to fluorocarbon 113. Am. Ind.
I-Iyg. Assoc. J. 32:143-151.Reinhardt, C.F., L.S. Mullin, and M.E. Maxfield. 1973. Epinephrine-
138 SMAC8 FOR SELECTED AIRBORNE CONTAMINANTS
induced cardiac arrhythmia potential of some common industrial sol-
vents. J. Occup. Med. 15:953-955.
Savolainen, H. and P. Pffiifli. 1980. Dose-dependent neurochemicaleffects of 1,1,2-trichloro-l,2,2-trifluoroethane inhalation exposure inrats. Toxicol. Lett. 6:43-49.
Sax, N.I., ed. 1984. Pp. 1762-1763 in Dangerous Properties of Industrial
Materials. Sixth edition. Van Nostrand Reinhold, New York.
Stopps, F.J. and M. McLaughlin. 1967. Psychophysiological testing of
human subjects exposed to solvent vapors. Am. Ind. Hyg. Assoc. J.28:43-50.
Trochimowicz, H.J. 1973. Blood levels of fluorocarbon during and after
acute inhalation. AMRL Tech. Rep. TR-73 125:137-147. U.S. Air
Force Armstrong Medical Research Laboratory, Dayton, Ohio.Trochimowicz, H.J., A. Azar, J.B. Terrill, and L.S. Mullin. 1974.
Blood levels of fuorocarbon related to cardiac sensitization: Part II.
Am. Ind. Hyg. Assoc. J. 35:632-639.Trochimowicz, H.J., G.M. Rusch, T. Chiu, and C.K.Wood. 1988.
Chronic inhalation toxicity/carcinogenicity study in rats exposed to
fluorocarbon 113 (FC-113). Fundam. Appl. Toxicol. 11:68-75.Vainio, H., J. Nickels, and T. Heinonen. 1980. Dose-related hepato-
toxicity of 1,1,2-trichloro-l,2,2-trifluoroethane in short-term intermibtent inhalation exposure in rats. Toxicology 18: 17-25.
Woolen, B.H., E.A. Guest, W. Howe, J.R. Marsh, H.K. Wilson, T.R.
Auton, and P.G. Blain. 1990. Human inhalation phamacokinetics of
1,1,2-trichloro-l,2,2-trifluoroethane (FCll3). Int. Arch. Occup.Environ. Health 62:73-78.
Yonemitsu, K., S. Tsunenari, and M. Kanda. 1983. An industrial acci-
dental death due to Freon 113 poisoning--Toxicological analysis of itscause of death. Nippon Hoigaku Zasshi 37:428-433.
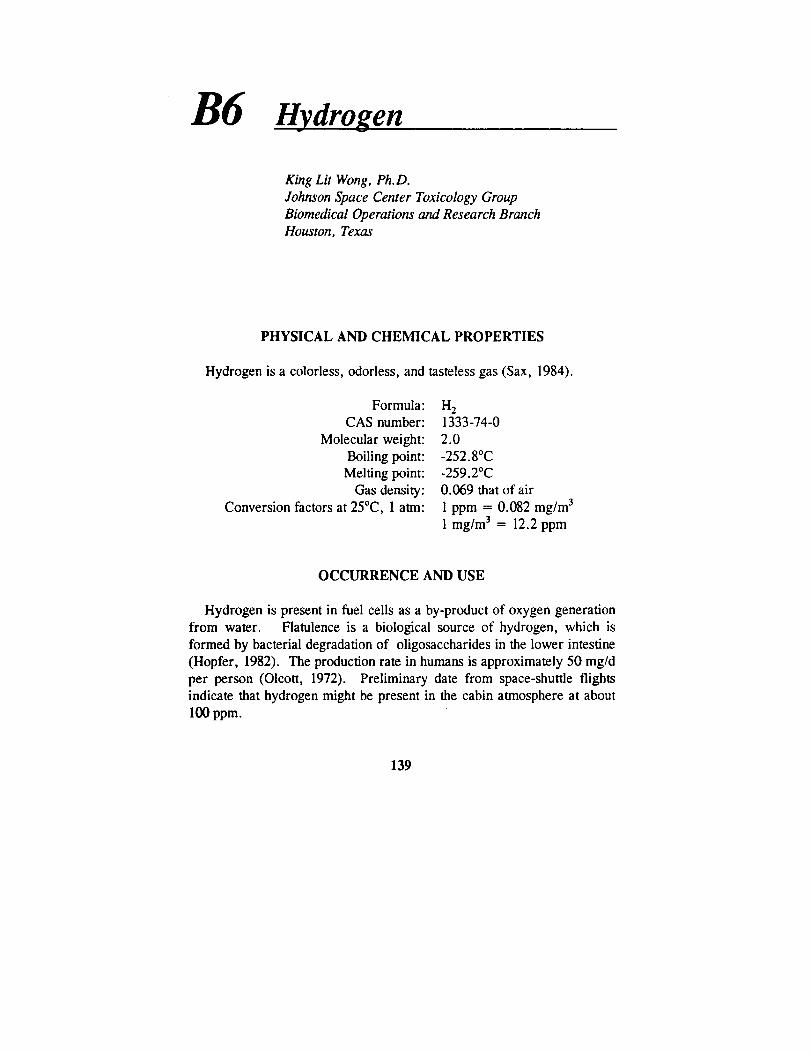
B6
King L# Wong, Ph.D.
Johnson Space Center Toxicology Group
Biomedical Operations and Research BranchHouston, Texas
PHYSICAL AND CHEMICAL PROPERTIES
Hydrogen is a colorless, odorless, and tasteless gas (Sax, 1984).
Formula:
CAS number:
Molecular weight:
Boiling point:
Melting point:
Gas density:Conversion factors at 25°C, 1 ann:
H 2
1333-74-0
2.0
-252.8°C-259.2°C
0.069 that of air
1 ppm = 0.082 mg/m 3
1 mg/m 3 = 12.2 ppm
OCCURRENCE AND USE
Hydrogen is present in fuel cells as a by-product of oxygen generation
from water. Flatulence is a biological source of hydrogen, which is
formed by bacterial degradation of oligosaccharides in the lower intestine(Hopfer, 1982). The production rate in humans is approximately 50 mg/d
per person (Olcott, 1972). Preliminary date from space-shuttle flightsindicate that hydrogen might be present in the cabin atmosphere at about
100 ppm.
139
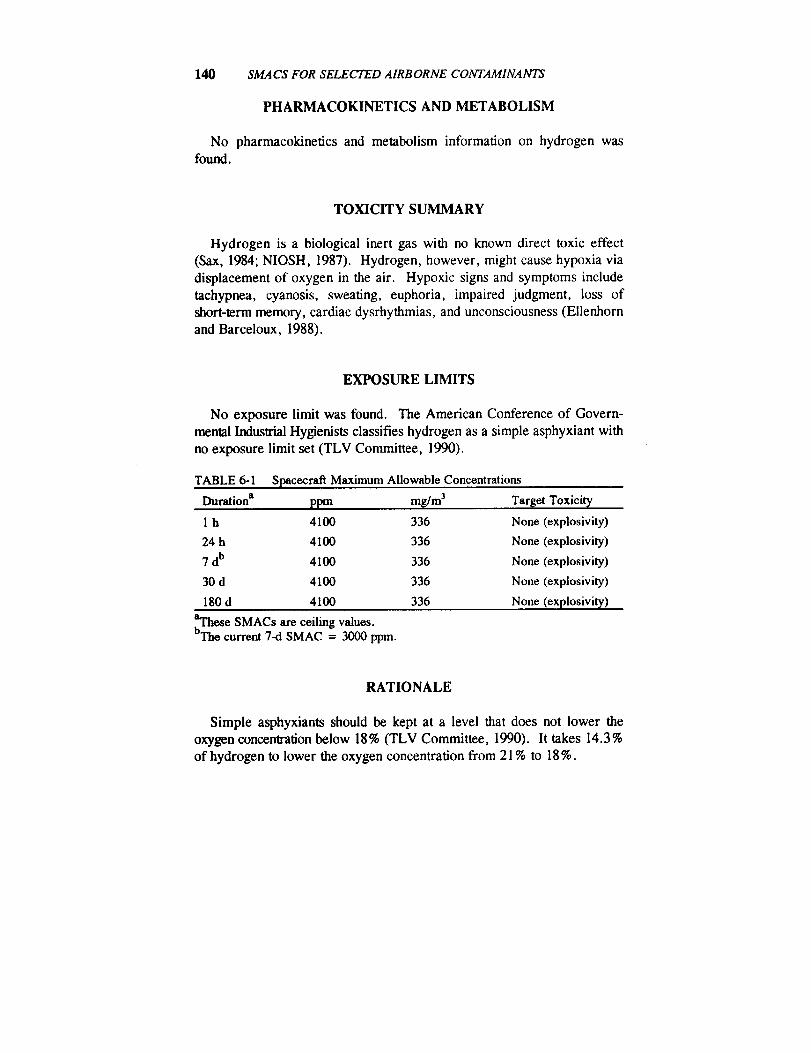
140 SMACS FOR SELECTED AIRBORNE CONTAMINANTS
PHARMACOKINETICS AND METABOLISM
No pharmacokinetics and metabolism information on hydrogen wasfound.
TOXICITY SUMMARY
Hydrogen is a biological inert gas with no known direct toxic effect
(Sax, 1984; NIOSH, 1987). Hydrogen, however, might cause hypoxia via
displacement of oxygen in the air. Hypoxic signs and symptoms include
tachypnea, cyanosis, sweating, euphoria, impaired judgment, loss of
short-term memory, cardiac dysrhythmias, and unconsciousness (Ellenhornand Barceloux, 1988).
EXPOSURE LIMITS
No exposure limit was found. The American Conference of Govern-
mental Industrial Hygienists classifies hydrogen as a simple asphyxiant withno exposure limit set (TLV Committee, 1990).
TABLE 6-1 Spacecraft Maximum Allowable Concentrations
Duration a ppm mg/m 3 Target Toxicit_
1 h 4100 336 None (explosivity)
24 h 4100 336 None (explosivity)
7 db 4100 336 None (explosivity)
30 d 4100 336 None (explosivity)
180 d 4100 336 None (explosivity)
aThese SMACs are ceiling values.bThe current 7-d SMAC = 3000 ppm.
RATIONALE
Simple asphyxiants should be kept at a level that does not lower the
oxygen concentration below 18% (TLV Committee, 1990). It takes 14.3%
of hydrogen to lower the oxygen concentration from 21% to 18%.

HYDROGEN 141
H 2 concentration = (21% - 18%) × 100/21= 14.3%.
However, simple asphyxiants are usually not a problem because oxygenconcentration in the spacecraft is continuously maintained at acceptable
levels. Because hydrogen's lower explosive limit is less than 14.3% (Sax,
1984), its SMACs are established based on explosivity rather than asphyxi-
ating action. With explosion being a very serious matter, a wide margin of
safety is called for. Therefore, all the SMACs of hydrogen are set atone-tenth of its lower explosive limit, i.e., at 4100 ppm. A safety factor of
10 agrees with the recommendation of the U.S. Environmental Protection
Agency that personnel doing environmental monitoring should evacuatewhen the concentration of an explosive gas reaches 10% of the lower
explosive limit (EPA, 1988).
REFERENCES
Ellenhorn, M.J. and D.G. Barceloux. 1988. Pp. 11-12 in Introduction
and Initial Evaluation in Medical Toxicology, Diagnosis and Treatment
of Human Poisoning. Elsevier, New York.
Hopfer, U. 1982. Digestion and absorption of basic nutritional con-stituents. P. 1160 in Textbook of Biochemistry with Clinical Correla-
tions. T.M. Devlin, ed. John Wiley & Sons, New York.
NIOSH. 1987. P. 2726 in Registry of Toxic Effects of Chemical Sub-
stances 1985-86. DHHS (NIOSH) Publ. No. 87-114. National Institute
for Occupational Safety and Health, Cincinnati, Ohio.Olcott, T.M. 1972. Development of a Sorbent Trace Contaminant Con-
trol System, Including Pre- and Postsorbers for a Catalytic Oxidizer.NASA CR-2027. Johnson Space Center, Houston, Tex.
Sax, I., ed. 1984. P. 1549 in Dangerous Properties of Industrial Materi-
als, 6th Edition. Van Nostrand Reinhold, New York.
TLV Committee. 1990. Pp. 8 and 26 in Threshold Limit Values and
Biological Exposure Indices. American Conference of Governmental
Industrial Hygienists, Cincinnati, Ohio.EPA. 1988. Air Surveillance for Hazardous Materials. Environmental
Response Team, Office of Emergency and Remedial Response, U.S.
Environmental Protection Agency, Washington, D.C.

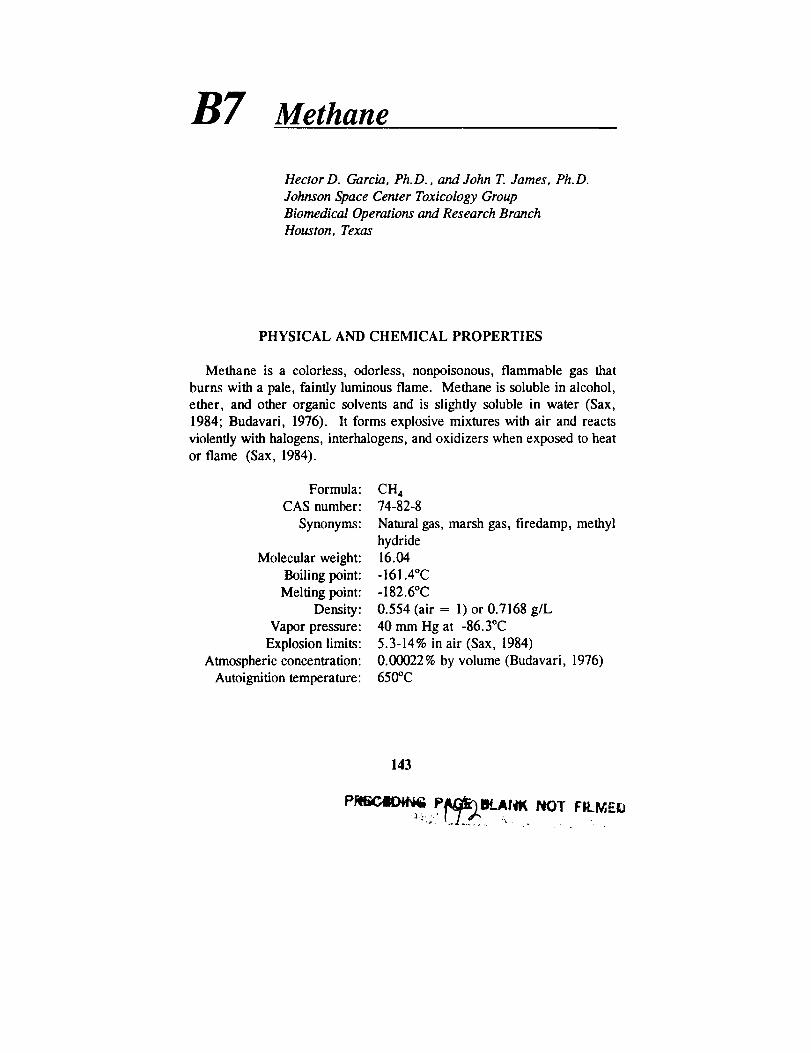
B7 Methane
Hector D. Garcia, Ph.D., and John T. James, Ph.D.
Johnson Space Center Toxicology Group
Biomedical Operations and Research BranchHouston, Texas
PHYSICAL AND CHEMICAL PROPERTIES
Methane is a colorless, odorless, nonpoisonous, flammable gas that
burns with a pale, faintly luminous flame. Methane is soluble in alcohol,ether, and other organic solvents and is slightly soluble in water (Sax,
1984; Budavari, 1976). It forms explosive mixtures with air and reacts
violently with halogens, interhalogens, and oxidizers when exposed to heator flame (Sax, 1984).
Formula:
CAS number:
Synonyms:
Molecular weight:
Boiling point:
Melting point:Density:
Vapor pressure:
Explosion limits:
Atmospheric concentration:
Autoignition temperature:
CH474-82-8
Natural gas, marsh gas, firedamp, methyl
hydride16.04
-161.4°C
- 182.6°C
0.554 (air = 1) or 0.7168 g/L
40 mm Hg at -86.3°C5.3-14% in air (Sax, 1984)
0.00022% by volume (Budavari, 1976)650_C
143
P_ P_I_. AhlK NOT.... FILMED:.,
144 SMACS FOR SELECTED AIRBORNE CONTAMINANTS
OCCURRENCE AND USE
Methane occurs naturally as a product of decaying vegetable matter. In
population studies, 35-61% of healthy human subjects have detectablemethane in their breath (Segal et al., 1988). It is used as a fuel for illumi-
nating and cooking; in organic syntheses; and in the manufacture of
hydrogen, hydrogen cyanide, ammonia, acetylene, and formaldehyde.
PHARMACOKINETICS
Methane installed into the human colon is exhaled (Bjorneklett and
Jenssen, 1982). Inhalation of commercial natural gas scented with 16.8
mg/m 3 tert-butylmercaptan and 7.2 mg/m 3 of methyl acrylate by mice in a
gas chamber for 2 h produced isopropanol, acetone, sec-butyl alcohol, and
methyl ethyl ketone in the blood and liver (Tsukamoto et al., 1985). Even
though the authors considered these substances to be metabolites of the
natural gas, the study did not distinguish between metabolism of the meth-ane and metabolism of the added fragrance compounds. The authors also
stated that methane (and propane) "can exert an anesthetic effect on ani-
mals even when sufficient oxygen exists, the results sometimes proving
lethal" (Tsukamoto et al., 1985); however, they gave no citation for that
report. No studies supporting this assertion were found.
TOXICITY SUMMARY
Methane is a simple asphyxiant and does not produce general systemic
effects (Klaassen et al., 1986). Studies of the morphology of lung tissues
of rats exposed to 8% methane, 20% oxygen for 1 h, followed by 100%methane found no effects attributable to the chemical specificity of methane
but only to the decrease of oxygen (Morita and Tabata, 1988). Although
patients with large bowel cancer have been found to have high levels ofmethane in their breath, no relationship has been found between in vivo
production of methane and the risk of developing large bowel cancer (Segalet al., 1988; Flick et al., 1990). No studies on the effects of chronicinhalation of methane were found in the literature. The bowel cancer
studies, however, found that outwardly healthy subjects had breath methane
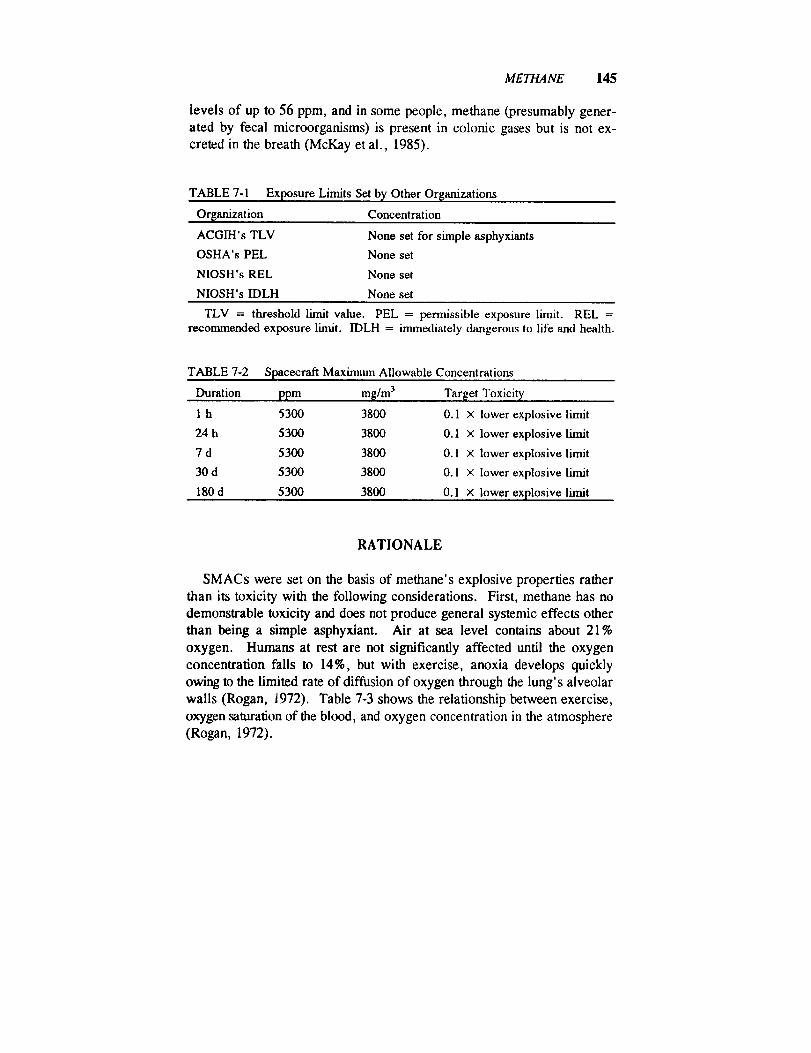
METHANE 145
levels of up to 56 ppm, and in some people, methane (presumably gener-
ated by fecal microorganisms) is present in colonic gases but is not ex-
creted in the breath (McKay et al., 1985).
TABLE 7-1 Exposure Limits Set by Other Or$anizations
Organization Concentration
ACGIH's TLV
OSHA's PEL
NIOSH's REL
NIOSH's IDLH
None set for simple asphyxiants
None set
None set
None set
TLV = threshold limit value. PEL = pemfissible exposure limit. REL =recommended exposure limit. IDLH = immediately dangerous to life and health.
TABLE 7-2 Spacecraft Maximum Allowable Concentrations
Duration ppm mg/m 3
1 h 5300 3800
24 h 5300 3800
7 d 5300 3800
30 d 5300 3800
180 d 5300 3800
Target Toxicity
0.1 × lower explosive limit
0.1 × lower explosive limit
0.1 × lower explosive limit
0.1 x lower explosive limit
0.1 × lower explosive limit
RATIONALE
SMACs were set on the basis of methane's explosive properties rather
than its toxicity with the following considerations. First, methane has no
demonstrable toxicity and does not produce general systemic effects other
than being a simple asphyxiant. Air at sea level contains about 21%
oxygen. Humans at rest are not significantly affected until the oxygen
concentration falls to 14%, but with exercise, anoxia develops quickly
owing to the limited rate of diffusion of oxygen through the lung's alveolar
walls (Rogan, 1972). Table 7-3 shows the relationship between exercise,
oxygen saturation of the blood, and oxygen concentration in the atmosphere
(Rogan, 1972).
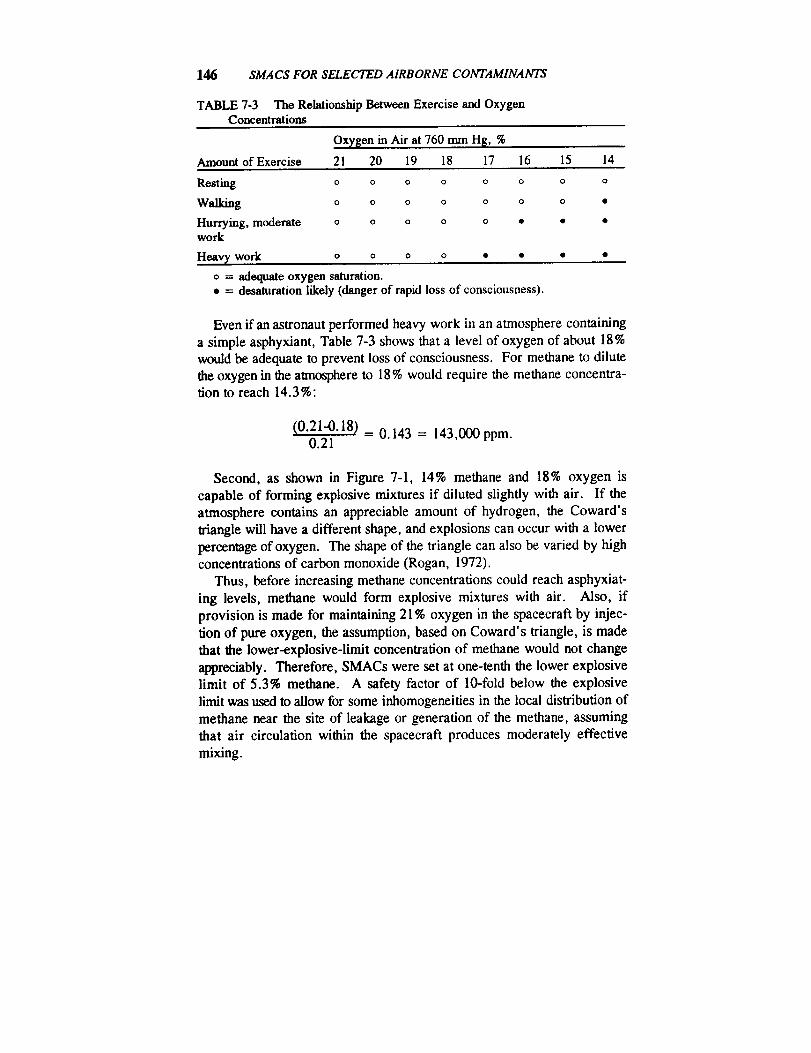
146 SMACS FOR SELECTED AIRBORNE CONTAMINANTS
TABLE 7-3 The Relationship Between Exercise and OxygenConcentrations
Oxygen in Air at 760 nun HI, %
Amount of Exercise 21 20 19 18 17 16 15 14
Resting o o o o o o o o
Walking o o o o o o o *
Hurrying,moderate o o o o o * * *work
Heav_, work o o o o * * * *
o = adequate oxygen saturation.• = desaturation likely (danger of rapid loss of consciousness).
Even if an astronaut performed heavy work in an atmosphere containing
a simple asphyxiant, Table 7-3 shows that a level of oxygen of about 18 %
would be adequate to prevent loss of consciousness. For methane to dilute
the oxygen in the atmosphere to 18% would require the methane concentra-
tion to reach 14.3%:
(0.21-0.18) = 0.143 = 143,000 ppm.0.21
Second, as shown in Figure 7-1, 14% methane and 18% oxygen is
capable of forming explosive mixtures if diluted slightly with air. If the
atmosphere contains an appreciable amount of hydrogen, the Coward's
Iriangle will have a different shape, and explosions can occur with a lower
percentage of oxygen. The shape of the triangle can also be varied by high
concentrations of carbon monoxide (Rogan, 1972).
Thus, before increasing methane concentrations could reach asphyxiat-
ing levels, methane would form explosive mixtures with air. Also, if
provision is made for maintaining 21% oxygen in the spacecraft by injec-
tion of pure oxygen, the assumption, based on Coward's triangle, is made
that the lower-explosive-limit concentration of methane would not change
appreciably. Therefore, SMACs were set at one-tenth the lower explosive
limit of 5.3% methane. A safety factor of 10-fold below the explosive
limit was used to allow for some inhomogeneities in the local distribution of
methane near the site of leakage or generation of the methane, assuming
that air circulation within the spacecraft produces moderately effective
mixing.
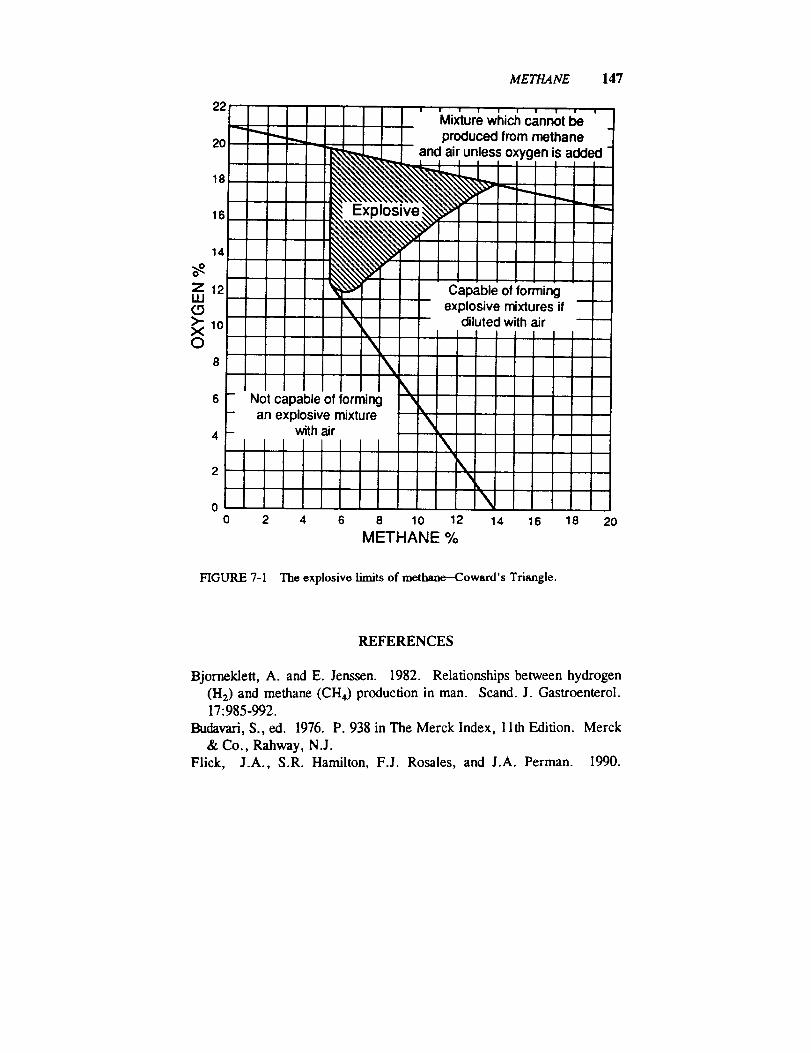
METHANE 147
22
20
18
16
14
o_Z 12UJ(.9>'10X0
0 2 4 6 8 10 12 14 16 18 20
METHANE %
FIGURE 7-1 The explosive limits of methane-Coward's Triangle.
REFERENCES
Bjorneklett, A. and E. Jenssen. 1982. Relationships between hydrogen
(H2) and methane (CH4) production in man. Scand. J. Gastroenterol.
17:985-992.
Budavari, S., ed. 1976. P. 938 in The Merck Index, 1 lth Edition. Merck
& Co., Rahway, N.J.
Flick, J.A., S.R. Hamilton, F.J. Rosales, and J.A. Perman. 1990.
148 SMACS FOR SELECTED AIRBORNE CONTAMINANTS
Methane excretion and experimental colonic carcinogenesis. DigestiveDis. Sci. 35:221-224.
Klaassen, C.D., M.O. Amdur, and J. Doull, eds. 1986. P. 658 in
Casarett and Doull's Toxicology, 3rd Edition. Macmillan, New York.
McKay, L.F., M.A. Eastwood, and W.G. Brydon. 1985. Methane
excretion in man--A study of breath, flatus, and faeces. Gut 26:69-74.Morita, M. and N. Tabata. 1988. Studies on asphyxia: On the changes of
the alveolar walls of rats in the hypoxic state. II. The hypoxic state
produced by carbon dioxide and methane gases. Forensic Sci. Int.39:257-262.
Sax, N.I., ed. 1984. Pp. 1762-1763 in Dangerous Properties of IndustrialMaterials, 6th Edition. Van Nostrand Reinhold, New York.
Segal, I., A.R.P. Walker, S. Lord, and J.H. Cummings. 1988. Breath
methane and large bowel cancer risk in contrasting African populations.Gut 29:608-613.
Tsukamoto, S., S. Chiba, T. Ishikawa, and M. Shimamura. 1985. Ex-
perimental study on the metabolism of volatile hydrocarbons by inhala-tion of natural gas (13 A-Tokyo Gas). Nihon Univ. J. Med. 27:33-38.
Rogan, J.M., ed. 1972. Pp. 224-227 in Medicine in the Mining Indus-tries. William Heinemann Medical Books, London.
B8 Methanol
King Lit Wong, Ph.D.
Johnson Space Center Toxicology GroupBiomedical Operations and Research BranchHouston, Texas
PHYSICAL AND CHEMICAL PROPERTIES
Methanol is a colorless liquid (ACGIH, 1986).
Synonyms:Formula:
CAS number:
Molecular weight:Boiling point:
Melting point:Vapor pressure:
Saturated vapor concentration:Conversion factors at 25°C, 1 aim:
Methyl alcohol, wood alcohol
CH3OH67-56-1
32.064.5°C
-97.8°C
92 torr at 20°C
121,053 ppm at 20°C, I alm
lppm = 1.31mg/m 3
I mg/m 3 = 0.76 ppm.
OCCURENCE AND USE
We are not aware of any use of methyl alcohol in the operation of
spacecraft. Methyl alcohol, however, has been used in payload experimentsin the space shuttle (Wong and I_am, 1990) and detected in off-gas tests of
flight hardware (H. Leano, Johnson Space Center, personal commun.,
1990). One potential source of methanol exposure is via the diet. Fruit
juices contain an average of 140 mg of methanol per liter (Francot and
149
150 SMACS FOR SELECTED AIRBORNE CONTAMINANTS
Geoffroy, 1956). Diet soda containing aspartame could release methanol,
equivalent to 10% of its weight, when aspartame is hydrolyzed in the
intestine (Stegink et al., 1981). A typical diet soda contains aspartame
equivalent to 56 mg of methanol per liter, so drinking a 12-oz. can (355
mL) of such beverages could lead to the absorption of 20 mg of methanol.However, adult humans who ingested an amount of aspartame equivalent tothat in 12 12-oz. cans of diet soda failed to increase the methanol concen-
tration in blood during the 24 h after ingestion (Stegink et al., 1981). It
took an amount of aspartame in 36 12-oz cans of diet soft drink to signifi-
cantly elevate the blood methanol concentration. Therefore, oral intake of
diet soda will not significantly contribute to methanol exposure in theastronauts.
PHARMACOKINETICS AND METABOLISM
The dog's respiratory system retains 81-88% of inhaled methanol in the
first few minutes of an exposure at 300-550 ppm (Egle and Gochberg,
1975). In a human study, except for the first few minutes of exposure, the
respiratory system consistently retained 58 % of inhaled methanol through-out an 8-h exposure (Sedivec et al., 1981). The degree of retention alsoremained constant as the methanol concentration varied from 78 to 216
ppm or as the minute volume was increased 2.5 times when the individual
exercised (Sedivec et al., 1981). After absorption, methanol is distributed
rapidly throughout the dog's body in body water (Yant and Schrenk, 1937).Methanol is first metabolized to formaldehyde, which is very rapidly
metabolized into formic acid, so that very little formaldehyde is detected in
tissues (Tephly et al., 1979). Formic acid is then metabolized to CO 2
(McMartin et al., 1977). The conversion rate of formic acid to CO 2 in
primates is less lhan half of that in nonprimates (McMartin et al., 1977).Formic acid is, therefore, methanol's major metabolite in primates, but not
in nonprimates (Clay et al., 1975). Formic acid is believed to be metha-nol's toxic metabolite (Clay et al., 1975), so toxicity data on nonprimates
should not be relied on in setting methanol's SMACs. The species differ-
enee in methanol metabolism explains why Gilger and Pott (1955) found
that methanol toxicity in monkeys differed from that in nonprimates.In addition to metabolism, methanol is also eliminated unchanged via the
lung and in the urine (Jacobsen et al., 1983; Leaf and Zatman, 1952). The
METHANOL 151
pulmonary clearance of methanol was determined to be 5.6 mL of blood
per minute in a man poisoned with methanol (Jacobsen et al., 1983).Humans excreted 0.76% of an oral dose of methanol unchanged in the
urine in 12 h (Leaf and Zatman, 1952). The major route of methanol
elimination is via metabolism, which was estimated to account for 97% of
the elimination in humans (Kavet and Nauss, 1990). In workers occupa-
tionally exposed to methanol at about 93 ppm for several months to 30
years, the venous methanol concentration reached 9 mg/L at the end of the
working week, and the urinary methanol and formic acid concentrationswere 22 and 30 mg/L, respectively (Heinrich and Angerer, 1982).
Methanol elimination depends on the dose. In monkeys, at a high
intraperitoneal dose of 1 g/kg, methanol elimination from the blood fol-
lowed zero-order kinetics, with a hourly elimination rate of 0.44 mg/L(Eells et al., 1983). In 24 h, 60% of the administered methanol was
eliminated (Fells et al., 1983). At lower doses, the elimination of methanoland its metabolites follows first-order kinetics. Methanol's half-life in
blood is about 1.5-2.0 h in humans exposed to methanol vapor at 100-300
ppm (Sedivec et al., 1981). In monkeys, the half-lives of formaldehyde
and formic acid in blood are about 1-1.5 min and 31-51 min, respectively(McMartin et al., 1977; Clay et al., 1975; McMartin et al., 1979).
TOXICITY SUMMARY
Acute Toxicity
Metabolic Acidosis, Headaches, and Ocular Toxicity
Methanol intoxication produces metabolic acidosis and ocular injuries in
humans (Klaassen, 1990). With single oral exposure to methanol at asufficient dose, headache, dizziness, nausea, abdominal pain, and blurred
vision develop after a latent period of 8-36 h (Klaassen, 1990). An inges-tion of as little as 15 mL of methanol is sufficient to cause blindness in
humans (Klaassen, 1990). The latent period is thought to be due partly tothe time for transformation of methanol to an active metabolite (Gosselin et
al., 1984). Formic acid has been proposed to be the active metabolite
because formic acid has been shown to produce both metabolic acidosis and
ocular injuries (McMartin et al., 1977; Clay et al., 1975; Gilger and Potts,
1955).
152 SMACS FOR SELECTED AIRBORNE CONTAMINANTS
CNS Effects Other Than Headaches
Ingestion of high doses of methanol causes inebriation, but methanol is
less potent than ethanol in causing inebriation (Klaassen, 1990). In addition
to causing inebriation, methanol intoxication has been shown to cause a
prolonged parkinsonian syndrome with lesions in the putamen in threehuman cases (Bourrat and Riboullard, 1986; Verslegers et al., 1988;
LeWitt and Martin, 1988). In one of the cases, the intoxication was so
severe that the individual developed permanent parkinsonism with visual
impairment, increased dopamine beta-hydroxylase activity and decreased
met-enkephalin levels in the cerebrospinal fluid (Verslegers et al., 1988).Brain hemorrhage was also documented in at least 13.5% of the cases of
accidental methanol poisoning (Phang et al., 1988). Other than being toxic
to the brain and eyes, methanol might also affect the heart. There has been
one report of acute methanol intoxication causing severe reversible cardiac
failure in a 55-year-old man (Cavalli et al., 1987). Because methanoi's
morphological effects on the brain and cardiac toxicity have been reportedto occur after acute poisoning at high doses and they have not been re-
ported to occur after inhalation exposures, the SMACs are not establishedaccording to _ morphological effects on the brain and the cardiac toxicity.
Subchronic Toxicity
Headaches and Ocular Toxicity
Kingsley and Hirsch (1955) reported that a number of workers com-
plained of frequent, recurrent headaches in the offices of a plant wherecertain duplicating machines were operated for the major part of an 8-h
working day. These machines used a duplicating fluid containing methanoland the airborne methanol concentration was 210-375 ppm in the winter,when most of the windows were shut. The methanol concentration reached
300 ppm at 1 h into the operation of a machine. These concentrations
persisted for as long as 4 h following a machine operation. The headacheswere more severe in the workers located close to the machine than those
more remotely situated. The most severe symptom was detected in the
machine operators. Because Kingsley and Hirsch did not report the num-
ber of employees involved in the study in that one plant, their results are
not used in setting SMACs.
METHANOL 153
Other than recurrent headaches, inhaled methanol could also cause
visual disturbances (Frederick et al, 1984). However, Kingsley and Hirsch(1955) failed to report whether the workers, exposed to methanol at 210-
375 ppm in that study, complained of any visual problems. In their paper,Kingsley and Hirsch did recognize that optic injury is a feature of methanol
poisoning.
An analysis of the data of a National Institute for Occupational Safety
and Health (NIOSH) study provides evidence that 391 ppm is probably thelowest-observed-effect level (LOEL) for methanol to cause visual toxicity
and headaches (Frederick et al., 1984). In this epidemiology study per-
formed by NIOSH, the prevalence of symptoms in 66 female teacher aides
and 66 female teachers of similar age were compared (Frederick et al.,
1984). The percentage of work hours spent at spirit duplicating machinesthat used methanol in poorly ventilated areas ranged from 0 to 90% for the
teacher aides and 0 to 20% for the teachers, so the teacher aides presum-
ably were exposed to methanol more often than the teachers. During the
month before the investigation, 22% more teacher aides complained ofblurred vision than teachers and 17% more teacher aides complained of
headaches than teachers (Frederick et al., 1984). Although the difference
between the teacher aides and teachers in the prevalence of blurred vision
was significant, there was no statistically significant difference in the
prevalence of "trouble with or changes in vision" between the teacher aidesand teachers (Frederick et al., 1984). The higher percentage of teacher
aides with headaches than teachers was statistically significant.
The higher prevalence of blurred vision in the teacher aides did not
appear to be due to eye irritation because the increased prevalence of eye
burning, itching, and tearing in the teacher aides was not statistically
significant compared with that in the teachers (Frederick et al., 1984).These teacher aides worked from 1 h/w to 40 h/w. Measurements made in
the breathing zone of the teacher aides at the duplicating machines showed
that the methanol concentrations varied from 365 to 3080 ppm. The attack
rates of methanol-related symptoms in the teacher aides and teachers were
correlated with the percentage of time spent at the duplicating machines perweek.
Using the Chauvenet's criterion (Gad and Weil, 1988), the highest
methanol concentration of 3080 ppm in table 1 of the NIOSI-I paper (Fred-
crick et ai., 1984) was found to be an outlier (the next two highest concen-
trations were 1440 and 1365 ppm). With the highest methanol concentra-tion discarded, the mean and standard deviation were calculated to be 960
1._4 SMACS FOR SELE_ AIRBORNE CONTAMINANTS
and 346 ppm, respectively, and the median is 1020 ppm. The scattergramof the methanol concentration data points shows that the concentration is
monomodal and is relatively evenly distributed around the mean. Themethanol concentration can be assumed to follow a normal distribution.
One way to interpret the NIOSH study (Frederick et al., 1984) is that
working in an environment with methanol at about 1000 ppm could resultin blurred vision and headaches. Unfortunately, the NIOSH investigators
did not present the methanol concentrations that the teacher aides afflictedwith blurred vision or headaches were exposed to versus that of the nonre-
sponding teacher aides. However, with three assumptions, the lowest-observed-adverse-effect level (LOAEL) based on visual disturbances and
headaches can be estimated. First, assume that about equal number of the
66 teacher aides worked with each of the 21 duplicating machines that
measured for methanol concentration (so that the percentage of teacher
aides exposed to methanol at a concentration greater than or equal to a
certain value can be estimated by the percentage of methanol-concentrationmeasurements at or above that value). Second, assume that these teacher
aides worked for equal amount of time with each of the duplicating ma-chines (so that the amount of exposure, C x T, could be approximated by
C alone). Finally, a normal distribution is assumed for the exposureconcentration. The lower 90% confidence limit of the teacher aides'
exposure concentration is calculated to be 391 ppm (mean - 1.645 × S.D.
= 960 ppm - 1.645 x 346 ppm = 391 ppm) (Steel and Torrie, 1980).The National Research Council's subcommittee on SMACs agreed that the
lower 90% confidence limit, i.e. 391 ppm, can be treated as the LOAEL
on the basis of blurred vision and headaches. That way of estimating the
LOAEL should be valid because only 23% of the teacher aides complained
of blurred vision and 17% complained of headaches (Frederick et al.,
1984), and if methanol-induced toxicity follows a concentration response,
the 23% and 17% responders (for blurred vision and headaches, respec-
tively) were probably exposed to methanol concentrations at the upper halfof the bell-shaped, concentration distribution curve.
In a German study, it was reported that a 4-y occupational exposure to
1200 to 8000 ppm of methanol impaired the vision in one worker
(Humperdinck, 1941). It appeared that the vision of other workers in the
same plant was not affected. The vision of this apparently sensitive worker
improved after exposures were stopped for 6 w.
METHANOL 155
Chronic and Genetic Toxicity
It should be noted that no carcinogenic data on methanol has been found.
Methanol is not genotoxic as evidenced by negative findings in the Ames
test, the methanol's inability to cause sister chromatid exchange in Chinese
hamster ovary cells, and micronuclei in mice (Florin et al., 1980; Obe andRistow, 1977; Gocke et al., 1981).
Developmental Toxicity
Unlike inhaled ethanol, which affects pregnant rats and is not teratogenicin fetuses at high concentrations, inhaled methanol affects both the fetuses
and dams at high concentrations (Nelson et al., 1985). Inhalation exposure
to methanol at 5000 ppm for 7 h/d on days 1-19 of gestation of pregnant
rats had no effects on the fetuses and dams (Nelson et al., 1985). Expo-
sure at 10,000 ppm, however, depressed fetal weight, but it did not affect
maternal body weight, behavior, and water and feed consumption. Expo-sure at 20,000 ppm caused fetal malformation and slightly unsteady gait inthe dams.
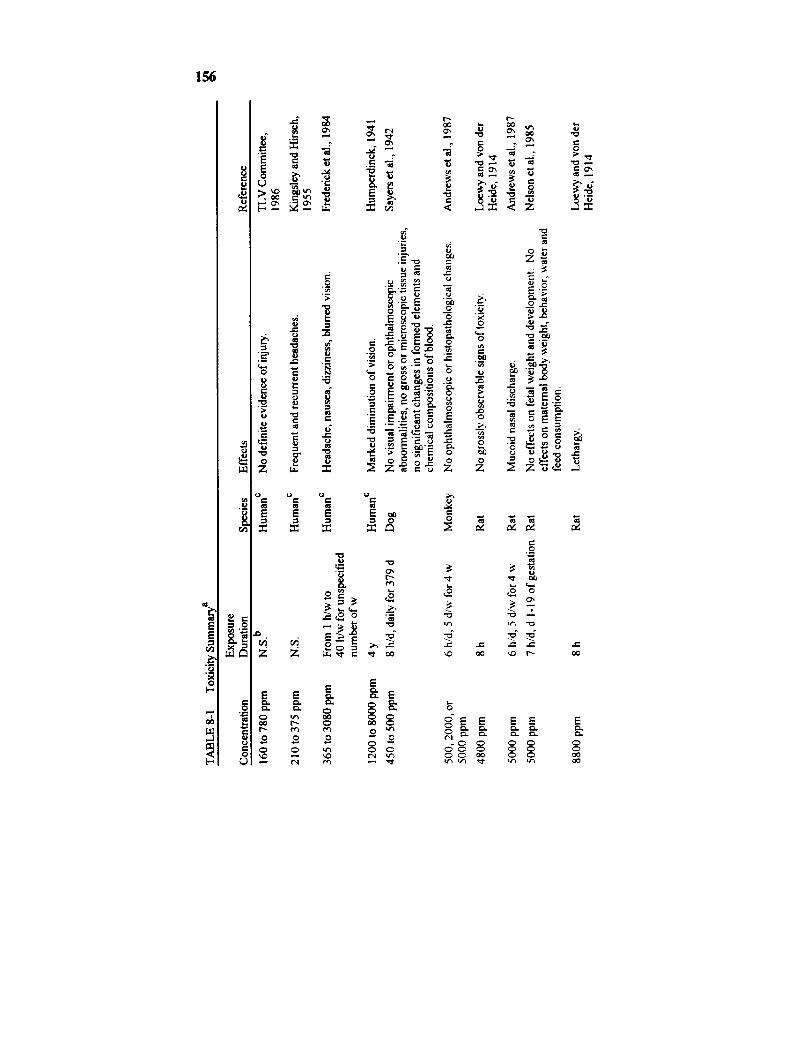
156
EE
[-.
"7O0
8.u
_.o
¢-0
°.
e.
0
0",
0
Ue-
.-- e.. g_
,. e-,
E E E
Z Z
EE E
Q _
._a -_ "_ __ _ _ _--
EN _
_ =o ._.
"0
E._
¢.)
',_ _ _
o _ _
._ _ _,o_
_o _
o'1
o_ _
o E _ .=
c-o
E
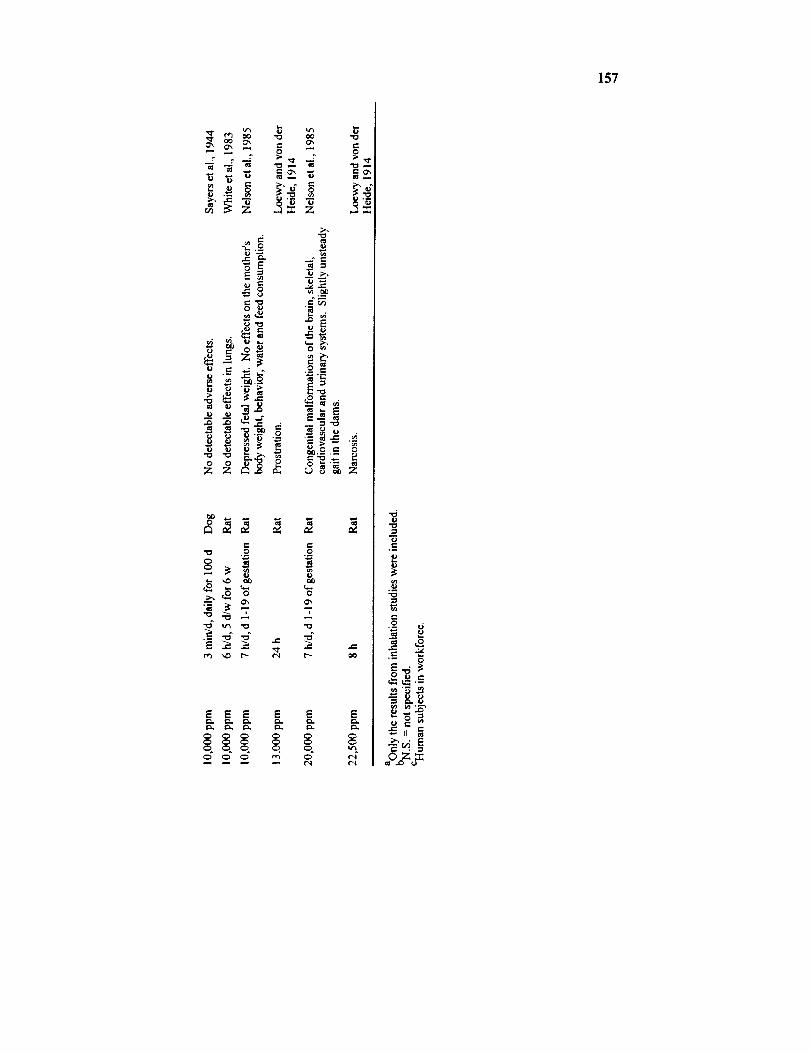
I
-i..o
e','_ ._,_
- _
.- _._ ._.=_•_ ;_ _,_
- - _.T="
_ _ _'_
z z _ z
e- ,-,'_ o o
E "o "= "_ ._I'_ _ t_ I'N P'_
E E E E E E
'9
_,__. _..-.
_m..,
157
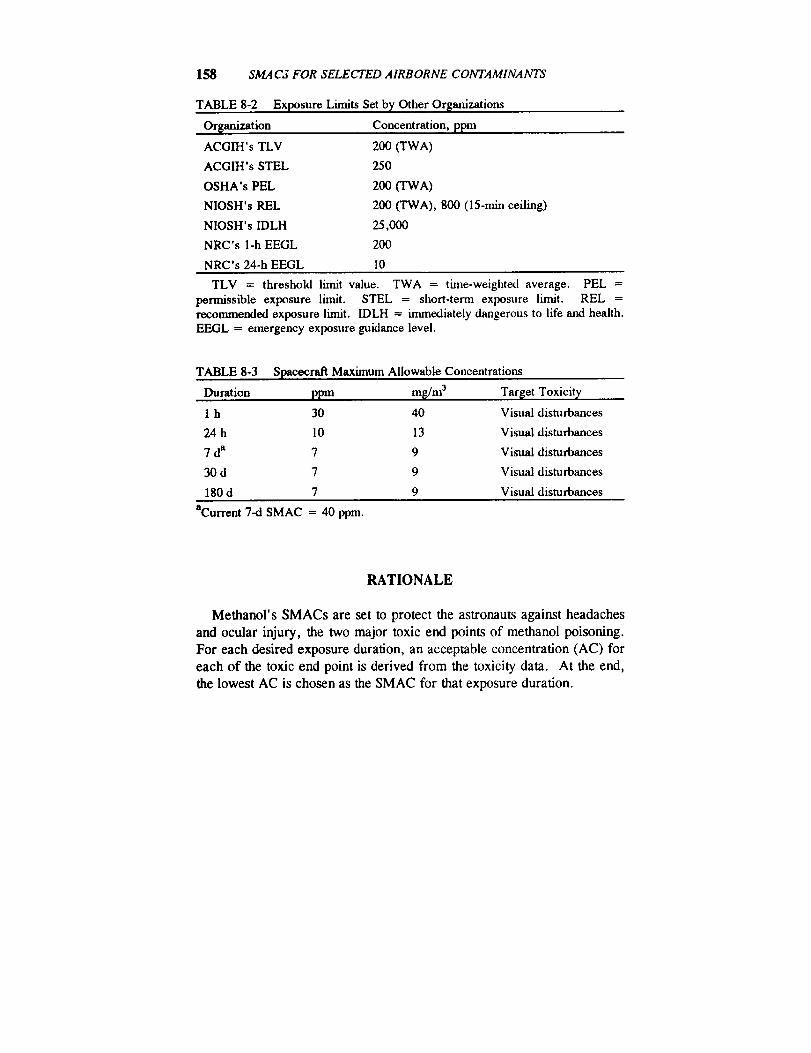
158 SMACS FOR SELECTED AIRBORNE CONTAMINANTS
TABLE 8-2 Exposure Limits Set by Other Or[anizations
Or[anization Concentration, ppm
ACGIH's TLV 200 (TWA)
ACGIH's STEL 250
OSHA's PEL 200 (TWA)
NIOSH's REL 200 (TWA), 800 (15-rain ceiling)
NIOSH's IDLH 25,000
NRC's 1-h EEGL 200
NRC's 24-h EEGL l0
TLV = threshold limit value. TWA = thne-weighted average. PEL =
permissible exposure limit. STEL = short-term exposure limit. REL =recommended exposure limit. IDLH = immediately dangerous to life and health.EEGL = emergency exposure guidance level.
TABLE 8-3 Spacecraft Maximum Allowable Concentrations
Duration ppm m[/m 3 Tar[et Toxicity
1 h 30 40 Visual disturbances
24 h 10 13 Visual disturbances
7 da 7 9 Visual disturbances
30 d 7 9 Visual disturbances
180 d 7 9 Visual disturbances
aCurrent 7-d SMAC = 40 ppm.
RATIONALE
Methanol's SMACs are set to protect the astronauts against headaches
and ocular injury, the two major toxic end points of methanol poisoning.
For each desired exposure duration, an acceptable concentration (AC) for
each of the toxic end point is derived from the toxicity data. At the end,
the lowest AC is chosen as the SMAC for that exposure duration.
METHANOL 159
Headache
1-h AC
In a study by Kingsley and Hirsch (1955) and in a NIOSH study(Frederick et al., 1984), workers complained of headaches when they
worked in the vicinity of duplicating machines in which methanol was used.
As described in "Toxicity Summary," the LOAEL for headaches is esti-
mated to be 391 ppm according to the data in the NIOSH study. Since
some degree of headache is acceptable during emergencies, the LOAEL in
an occupational setting is chosen to be the 1-h AC based on headaches.
1-h AC based on headaches
= occupational LOAEL
= 391 ppm.
24-h AC
In an emergency that lasts up to 24 h, it is not acceptable for the crew tohave to endure recurrent headaches for 24 h. So the 24-h SMAC should be
set lower than the 1-h SMAC. Unfortunately, there are no data on thelevel of methanol that does not cause headaches. The American Confer-
ence of Governmental Industrial Hygienists (ACGIH) cited a study per-
formed by the Massachusetts Division of Occupational Hygiene in 1937that detected no definite evidence of injury at 160-780 ppm (TLV Com-
mittee, 1986). Because two more recent reports showed that methanol
could produce headaches at less than 780 ppm (Kingsley and Hirsch, 1955;
Frederick et al., 1984), the apparently negative finding in the Massachu-
setts study was disregarded. Instead, to estimate a concentration that might
not cause headaches, an extrapolation factor of 5 is applied to the LOAEL,
391 ppm, based on headaches in an occupational study (Kingsley and
Hirsch, 1955). The factor of 5 is chosen because minor headaches are ac-
ceptable in a 24-h contingency, as a factor half the size of the traditionalfactor of 10 is used to estimate a no-observed-adverse-effect level
(NOAEL) from a LOAEL.Time adjustment is needed to account for the potential difference be-
160 SMAC,$ FOR SELECTED AIRBORNE CONTAMINANTS
tween an 8-h workday exposure and a 24-h continuous exposure. The time
adjustment for headaches is performed with the assumptions that headaches
are dependent on the blood concentration of methanol's active metabolite,formic acid, and that there is a threshold blood concentration below which
no headaches would occur. According to classical pharmacokinetics,
during a continuous exposure at a constant dose rate of a chemical thatfollows a one- or two-compartment model, the blood concentration will
reach 99% of the steady state seven elimination half-lives into the exposure
(Gibaldi and Perrier, 1975). Since methanol distributes rapidly throughout
the body in body water (Yant and Schrenk, 1937), one can assume thatmethanol follows a one-compartment model. However, the findings of
Leaf and Zatman (1952) tend to indicate that methanol follows either a one-
or a two-compartment model. They showed that the urinary methanol
concentration declined monoexponentially from 1 to 14 h after an ingestion
of up to 7 mL of methanol in adult males and the urinary methanol concen-
trations closely reflected the changes in blood concentration. That meansthe methanol concentration in blood declined monoexponentially from 1 to
14 h following an ingestion. Because Leaf and Zatman did not collect any
data in the first hour after methanol ingestion, they might have missed an
early exponential phase, so it is possible that methanol follows a two-com-
partment model. Regardless of whether a one- or two-compartment modelis used, with a half-life of 1.5-2 h in humans (Sedivec et al., 1981), it only
takes 14 h for the methanol blood level to essentially reach equilibrium.We need to estimate the time the blood level of methanol's active metab-
olite, i.e., formic acid, takes to reach equilibrium. As summarized above,
methanol is metabolized first to formaldehyde, which is further metabo-
lized to formic acid. Because formaldehyde is very rapidly metabolized to
formic acid (Tephly et al., 1979) and because the elimination half-life of
formaldehyde is only about 1/30th of that of formic acid (McMartin et al.,
1977, 1979; Clay et al., 1975), kinetically we can assume that the metabo-
lism of methanol to formic acid consists of only one step. It has beenshown that, for a metabolite with a elimination half-life less than the
elimination half-life of the parent compound, the blood level of the metabo-
life follows that of the parent compound after an initial period (Gibaldi andPerrier, 1975). Formic acid's elimination half-life is 31 min in monkeys
(McMartin et al, 1977) and that of methanol is 1.5-2 h in humans (Sedivec
et al., 1981). Assuming that formic acid's half-life in humans resembles
that in monkeys, the blood level of formic acid should, therefore, follow
the blood level of methanol after an initial period. Formic acid started to
METHANOL 161
appear in blood as soon as 2 h after monkeys ingested methanol (Tephly etal., 1979). It follows that formic acid's blood level probably lags behind
that of methanol by no more than 2 h during an inhalation exposure of
methanol. So formic acid's blood level should reach steady state at 14 h +
2 h, i.e. 16 h, in a continuous methanol inhalation exposure. That means
the time adjustment for any exposure longer than 16 h, e.g. 24 h, 7 d, 30
d, and 180 d, could be done using 16 h in place of the actual exposureduration. So the time-adjustment factor becomes 8 h/16 h. Such a time-
adjustment factor is conservative because it implies that the blood concen-
tration of formic acid increases linearly with exposure time for 16 h into a
methanol exposure. Actually, the blood concentration of formic acid will
probably increase in some exponential function to 16 h, but because thedata available do not allow for an accurate estimation of the exponential
function, a linear function is used instead.
24-h AC based on headaches
= occupational LOAEL x 1/extrapolation factor x time adjustment
= 391 ppm x 1/5 x 8 h/16 h
= 39 ppm.
7-d, 30-d, and 180-d ACs
Since formic acid reaches steady state in 16 h, the time adjustment for a
7-d, 30-d, or 180-d continuous exposure is all done using 16 h. To esti-
mate the NOAEL, a safety factor of 10 is applied onto the LOAEL.
Because the LOAEL is derived from a NIOSH study based on only 66teacher aides, all adjustment for "small n" is used to derive the 7-d, 30-d,
and 180-d ACs. The adjustment for small n is not needed for the 1-h and
24-h ACs based on headaches because a small degree of headache is
acceptable for 1 h or 24 h, so a wide safety margin is not needed.
7-d, 30-d, and 180-d AC based on headaches
= occupational LOAEL x 1/NOAEL factor × time adjustmentx 1/small-n factor
= 391 ppm x 1/10 × 8 h/16 h × (square root of n)/10
= 391 ppm x 1/I0 x 8 h/16 h x (square root of 66)/10
-- 16 ppm,
162 SMACS FOR SELECTED AIRBORNE CONTAMINANTS
where the NOAEL factor is the uncertainty factor used to estimate aNOAEL from a LOAEL.
Visual Disturbances
1-h AC
As discussed in "Toxicity Summary," the LOAEL for visual distur-
bances is estimated to be 391 ppm in an occupational exposure setting onthe basis of data from the NIOSH study of 66 teacher aides (Frederick et
al., 1984).
1-h AC based on visual disturbances
= occupational LOAEL x 1/NOAEL factor x l/small-n factor
= 391 ppm × 1/10 × (square root of n)/10
= 391 ppm x 1/10 x (square root of 66)/10
= 32 ppm.
24-h AC
Unlike headaches, methanol's occular toxicity might not be entirely
dependent on the blood concentration of formic acid and might not have athreshold. Methanol's occular toxicity is prudently assumed to be depen-
dent on the product of exposure concentration and exposure duration.
Because it is difficult to find a representative workday for the teacher aides
in the NIOSH study, the time adjustment used to derive the 24-h AC is
based on an occupational exposure of 8 h, so the time-adjustment factor is
8 h/24 h. Considering the fact that some of the teacher aides were exposedfor 1 h/w and others were exposed for years at 40 h/w, a time-adjustment
factor of 8 h/24 h seems to be an appropriate compromise.
24-h AC based on visual disturbances
= occupational LOAEL x 1/NOAEL factor x time adjustmentx 1/small-n factor
= 391 ppm x 1/10 × 8 h/24 h x (square root of n)/10
= 391 ppm x 1/10 x 8 h/24h x (square root of 66)/10
= 11 ppm.
METHANOL 163
7-d, 30-d, and 180-d ACs
A similar rationale is used in deriving the longer-term ACs. As a
compromise for the facts that some workers were exposed to less than 40
h/w for less than a year, while others were exposed for years at 40 h/w, alltime adjustments are done on a per-week basis regardless of whether the
AC is for 7, 30, or 180 d.
7-d, 30-d, and 180-d ACs based on visual disturbances
= occupational LOAEL × 1/NOAEL factor x time adjustmentx 1/small-n factor
= 69 ppm x 1/10 x (40 h/w)/(24 h/d x 7 d/w)x (square root of n)/10
= 69 ppm x 1/10 x (40 h/w)/(24 h/d x 7 d/w)
x (square root of 66)/10
= 7 ppm.
The data of a subchronic exposure of monkeys to methanol can be usedto check if the 180-d AC of 7 ppm can prevent ocular damage in a 180-d
exposure. Andrews et al. (1987) showed that an exposure of monkeys to
methanol at 500, 2000, or 5000 ppm, 6 h/d, 5 d/w for 4 w failed to pro-
duce any eye injury on the basis of microscopic and ophthalmoscopicexaminations (Andrews et al., 1987). Therefore, 5000 ppm is considered
the NOAEL in this 4-w study. Haber's rule is used in adjusting for the
differences in exposure durations.
180-d acceptable concentration derived from data in monkeys
= 4-w NOAEL × species extrapolation factor × time adjustment
= 5000 ppm × 1/10 × (6 h/d x 5 d/w x 4 w)/(24 h/dx 180 d)
= 5000 ppm x I/lO × 0.03
= 14 ppm.
Since the 180-d AC derived from the human data of NIOSH is lower
than the acceptable methanol exposure concentration based on the data in
monkeys, the 180-d AC appears to be appropriate. With a preference of
human data over animal data, the 180-d acceptable concentration derived
from data in monkeys is not adopted in setting the 180-d SMAC.
Because methanol's toxicity in primates differs from that in nonprimates
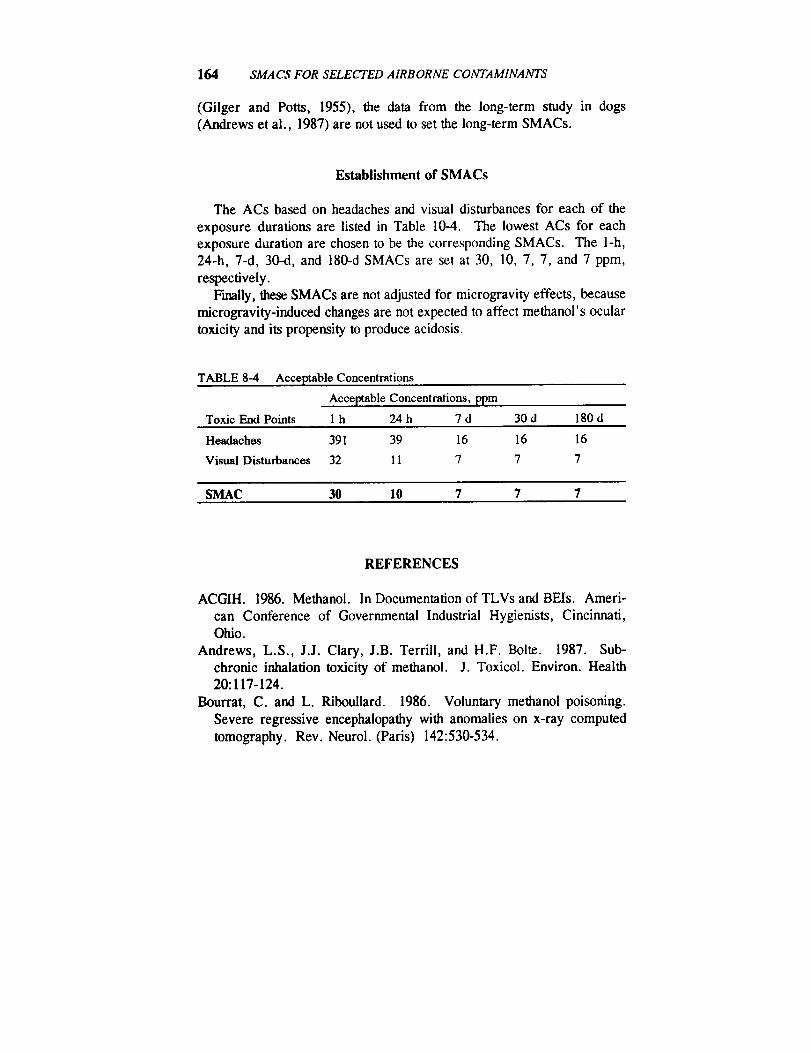
164 SMACS FOR SELECTED AIRBORNE CONTAMINANTS
(Gilger and Potts, 1955), the data from the long-term study in dogs
(Andrews et al., 1987) are not used to set the long-term SMACs.
Establishment of SMACs
The ACs based on headaches and visual disturbances for each of the
exposure durations are listed in Table 10-4. The lowest ACs for each
exposure duration are chosen to be the corresponding SMACs. The I-h,
24-h, 7-d, 30-d, and 180-d SMACs are set at 30, 10, 7, 7, and 7 ppm,
respectively.
Finally, these SMACs are not adjusted for microgravity effects, because
microgravity-induced changes are not expected to affect methanol's ocular
toxicity and its propensity to produce acidosis.
TABLE 8-4 Acceptable Concentrations
Acceptable Concentrations, ppm
Toxic End Points 1 h 24 h 7 d 30 d 180 d
Headaches 391 39 16 16 16
Visual Disturbances 32 11 7 7 7
SMAC 30 10 7 7 7
REFERENCES
ACGIH. 1986. Methanol. In Documentation of TLVs and BEIs. Ameri-
can Conference of Governmental Industrial Hygienists, Cincinnati,
Ohio.
Andrews, L.S., J.J. Clary, J.B. Terrill, and H.F. Bolte. 1987. Sub-
chronic inhalation toxicity of methanol. J. Toxicol. Environ. Health20:117-124.
Bourrat, C. and L. Riboullard. 1986. Voluntary methanol poisoning.
Severe regressive encephalopathy with anomalies on x-ray computed
tomography. Rev. Neurol. (Paris) 142:530-534.
METHANOL 165
Cavalli, A., A. Volpi, A.P. Maggioni, M. Tusa, and G. De Pieri. 1987.Severe reversible cardiac failure associated with methanol intoxication.
Postgrad. Med. J. 63:867-868.
Clay, K.L., R.C. Murphy, and W.D. Watkins. 1975. Experimentalmethanol toxicity in the primate: Analysis of metabolic acidosis.
Toxicol. Appl. Pharmacol. 34:49-61.Eells, J.T., K.A. Black, C.E. Tedford, and T.R. Tephly. 1983. Metha-
nol toxicity in the monkey: Effects of nitrous oxide and methionine. J.Pharmacol. Exp. Ther. 227:349-353.
Egle, J.L. and B.J. Gochberg. 1975. Retention of inhaled isoprene and
methanol in the dog. Am. Ind. Hyg. Assoc. J. 36:369-373.
Florin, I., L. Rutberg, M. Curvall, and C.R. Enzell. 1980. Screening oftobacco smoke constituents for mutagenicity using the Ames test.
Toxicology 15:219-232.
Francot, P. and P. Geoffroy. 1956. Le methanol dans les jus de fruits, lesboissons, fermentees, les alcools et spiriteux. Rev. Ferment. Ind.Aliment. 11:279.
Frederick, L.J., P.A. Schulte, and A. Apol. 1984. Investigation and
control of occupational hazards associated with the use of spirit dupli-
cators. Am. Ind. Hyg. Assoc. J. 45:51-55.Gad, S. and C.S. Weil. 1988. P. 13 in Statistics and Experimental Design
for Toxicologists. Telford Press, Caldwell, N.J.Gibaldi, M. and D. Perrier. 1975. Pharmacokinetics. Marcel Dekker,
New York.
Gilger, A.P. and A.M. Potts. 1955. Studies of the visual toxicity of
methanol. Am. J. Ophthalmol. 39:63-86.
Gocke, E., M.T. King, K. Eckhardt, and D. Wild. 1981. Mutagenicity of
cosmetics ingredients licensed by the European communities. Mutat.Res. 90:91-109.
Gosselin, R.E., R.P. Smith, and H.C. Hodge. 1984. Pp. III-275 in
Clinical Toxicology of Commercial Products. Williams and Wilkins,
Baltimore, Md.
Heinrich, R. and J. Angerer. 1982. Occupational chronic exposure toorganic solvents. X. Biological monitoring parameters for methanol
exposure. Int. Arch. Occup. Environ. Health 50:341-349.
Humperdinck, K. 1941. [On the problem of chronic intoxication with
methanol vapors.] Arch. Gewerbepathol. U. Gewerbehyg. 10:569-574.
Jacobsen, D., S. Ovreb:, E. Arnesen, and P.N. Paus. 1983. Pulmonary

166 SMACS FOR SELECTED AIRBORNE CONTAMINANTS
excretion of methanol in man. Scand. J. Clin. Lab. Invest. 43:377-379.
Kavet, R. and K.M. Nauss. 1990. The toxicity of inhaled methanol
vapors. Crit. Rev. Toxicol. 21:21-50.
Kingsley, W.H. and F.C. Hirsch. 1955. Toxicologic considerations in
direct process spirit duplicating machines. Compen. Med. 40:7-8.Klaassen, C.D. 1990. Solvents and vapors. P. 1624 in Goodman and
Gilman's The Pharmacological Basis of Therapeutics. A.G. Gilman, etal., eds. Macmillan, New York.
Leaf, G. and L.J. Zatman. 1952. A study of the condition under which
methanol may exert a toxic hazard in industry. Br. J. Ind. Med. 9: 19-31.
LeWitt, P.A. and S.D. Martin. 1988. Dystonia and hypokinesis with
putaminal necrosis after methanol intoxication. Clin. Neuropharmacol.11:161-167.
Loewy, A. and R. von tier Heide. 1914. Uber die aufnahme des methyl-alkohls durch die aanung. Biochem. Z. 65:230-252.
Mahieu, P., A. Hassoun, and R. Lauwerys. 1989. Predictors of methanolintoxication with unfavourable outcome. Hum. Toxicol. 8:135-137.
McMartin, K.E., G. Martin-Amat, A.B. Makar, and T.R. Tephly. 1977.
Methanol poisoning. V. Role of formate metabolism in the monkey. J.
Pharmacol. Exp. Ther. 201:564-572.McMartin, K.E., G. Martin-Amat, P.E. Noker, and T.R. Tephly. 1979.
Lack of a role of formaldehyde in methanol poisoning in the monkey.Biochem. Pharmacol. 28:645-649.
Nelson, B.K., W.S. Brithwell, D.R. Mackenzie, A. Khan, J.R. Burg,
W.W. Weigel, and P.T. Goad. 1985. Teratological assessment of
methanol and ethanol at high inhalation levels in rats. Fundam. Appl.Toxicol. 5:727-736.
Obe, G. and H. Ristow. 1977. Acetaldehyde, but not ethanol, induces
sister chromatid exchanges in Chinese hamster cells in vitro. Mutat.Res. 56:211-213.
Phang, P.T., L. Passerini, B. Mielke, R, Berendt, and E.G. King. 1988.
Brain hemorrhage associated with methanol poisoning. Crit. Care Med.16:137-140.
Sayers, R.R., W.P. Yant, H.H. Schrenk, J. Chornyak, S.J. Pearce, F.A.
Patty, and J.G. Lima. 1942. P. 1 in Methanol poisoning--I. Exposure
of dogs to 450-500 ppm methanol vapor in air. Rep. Invest. No. 3617.U.S. Department of the Interior, Bureau of Mines, Washington, D.C.
Sayers, R.R., W.P. Yant, H.H. Schrenk, J. Chornyak, S.J. Pearce, F.A.
METHANOL 167
Patty, and J.G. Linn. 1944. Methanol poisoning II. Exposure of dogsfor brief periods eight times daily to high concentrations of methanol
vapor in air. J. Ind. Hyg. Toxicol. 26:255-259.
Sedivec, V., M. Mr_iz, and J. Flek. 1981. Biological monitoring ofpersons exposed to methanol vapors. Int. Arch. Occup. Environ.Health 48:257-271.
Steel, R.G.D. and J.H. Torrie. 1980. Pp. 55-56 in Principles and Proce-
dures of Statistics. A Biomedical Approach. McGraw-Hill, New York.
Stegink, L.D., M.C. Brummel, K. McMartin, G. Matin-Amat, L.J. Filer,
G.L. Baker, and T.R. Tephly. 1981. Blood methanol concentrations in
normal adult subjects administered abuse doses of aspartame. J. Toxi-col. Environ. Health 7:281-290.
Tephly, T.R., A.B. Makar, K.E. McMartin, S.S. Hayreh, and G. Martin-
Amat. 1979. Methanol: Its metabolism and toxicity. Pp. 145-164 in
Biochemistry and Pharmacology of Ethanol. Vol. I. E. Majchrowiczand E.P. Noble, eds. Plenum, New York.
Verslegers, W., M. Van den Kerchove, R. Crols, W. De Potter, B.Appel, and A. Lowenthal. 1988. Methanol intoxication. Parkinsonism
and decreased met-enkephalin levels due to putaminal necrosis. Acta
Neurol. Belg. 88:163-171.White, L.R., A.B. Marthinsen, R.J. Richards, K.B. Eik-Nes, and O.G.
Nilsen. 1983. Biochemical and cytological studies of rat lung after
inhalation of methanol vapour. Toxicol. Lett. 17: 1-5.
Wong, K.L. and C.-W. Lam. 1990. STS-31 Orbiter Payload, DSO and
Utility Chemicals. Toxicologic Information and Risk Assessments. JSC
24227. Toxicology Group, Biomedical Operations and ResearchBranch, Medical Sciences Division, Johnson Space Center, NASA,
Houston, Tex.
Yant, W.P. and H.H. Schrenk. 1937. Distribution of methanol in dogs
after inhalation and administration by stomach tube and subcutaneously.
J. Ind. Hyg. Toxicol. 19:337-345.

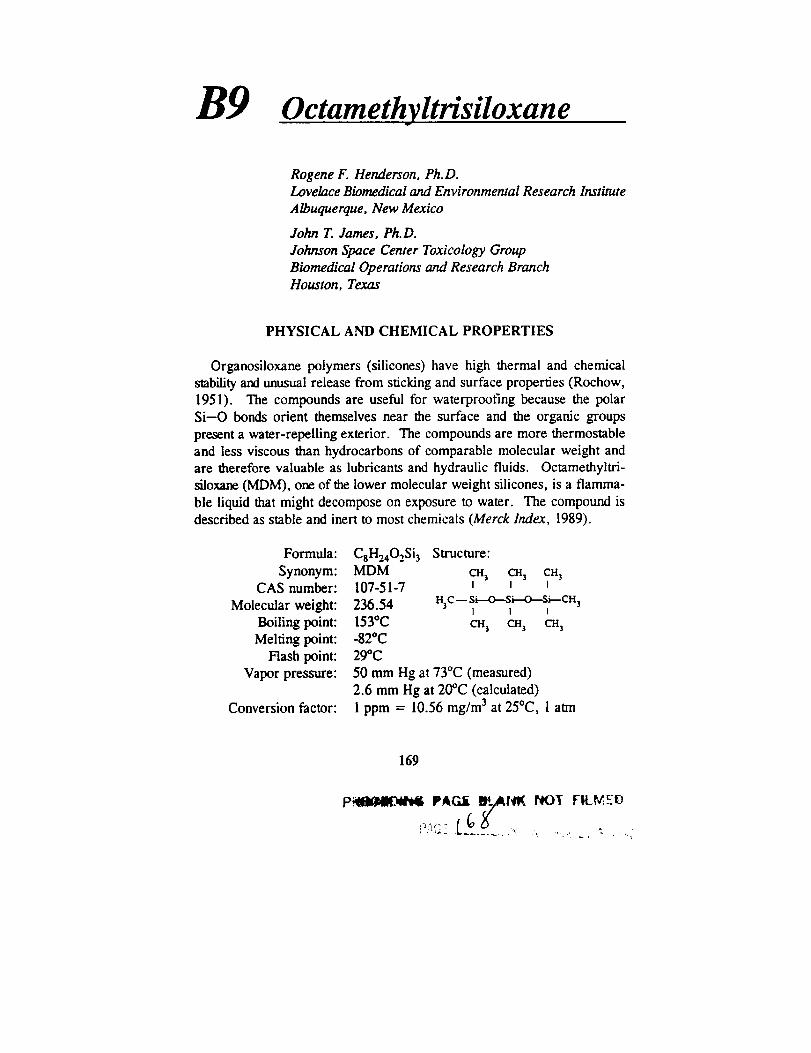
B9 Octameth fltrisiloxane
Rogene F. Henderson, Ph.D.Lovelace Biomedical and Environmental Research Institute
Albuquerque, New Mexico
John T. James, Ph.D.
Johnson Space Center Toxicology Group
Biomedical Operations and Research BranchHouston, Texas
PHYSICAL AND CHEMICAL PROPERTIES
Organosiloxane polymers (silicones) have high thermal and chemical
stability and unusual release from sticking and surface properties (Rochow,
1951). The compounds are useful for waterproofing because the polarSi--O bonds orient themselves near the surface and the organic groups
present a water-repelling exterior. The compounds are more thermostable
and less viscous than hydrocarbons of comparable molecular weight and
are therefore valuable as lubricants and hydraulic fluids. Octamethyltri-siloxane (MDM), one of the lower molecular weight silicones, is a flamma-
ble liquid that might decompose on exposure to water. The compound isdescribed as stable and inert to most chemicals (Merck Index, 1989).
Formula:
Synonym:CAS number:
Molecular weight:
Boiling point:
Melting point:
Flash point:Vapor pressure:
Conversion factor:
CaH2402Si 3 Structure:
MDM CH3 Cn3 cI-I3107-51-7 t t I
236.54 n3c-- si-°--si-°--si--c_3I I I
153°C ca 3 CH_ cH3-820C
29"C
50 mm Hg at 73°C (measured)
2.6 mm Hg at 20°C (calculated)
1 ppm = 10.56 mg/m 3 at 25°C, 1 atm
169
170 SMACS FOR SELECTED AIRBORNE CONTAMINANTS
OCCURRENCE AND USE
MDM is one of a series of compounds known as silicones. They areused as lubricants, hydraulic oils, heat transfer media, and dielectric oils;
in rubber for electrical coatings, for molding, and as release agents for the
food industry, metal-working applications, and rubbers, plastics, and
ceramics; as water repellents for textiles, paper, masonry, and concrete;
and in cosmetic and pharmaceutical formulations. A specialty productknown as "silly putty" has unusual rheologicai properties that have made it
popular as a toy for children. Medicinally, silicones have been used as
antifrothing agents (antiflatulent; bronchial antifoam) and as dermal im-
plants for soft tissue augmentation.
MDM is used in making silicone oils or fluids designed to withstand
extremes of temperature and as a foam suppressant in petroleum lubricat-
ing oil. It was detected in the Skylab 4 spacecraft atmosphere at con-centrations of 105 to 138 ppb (Liebich et al., 1975).
PHARMACOKINETICS AND METABOLISM
No pharmacokinetic and metabolism papers were found in the literature
for MDM specifically. However, some studies have been done on medi-
cal-grade polydimethylsiloxane fluids. Bruggeman et al. (1984) reported
on the absorption and retention of high-molecular-weight poly-
dimethyisiloxanes in fish. In contrast to polychlorinated biphenyls, only
very small amounts of the silicones were retained by fish after 6 w of
feeding. The authors had not expected such low retention based on
octanol:water partitioning coefficients. Apparently, rapid evaporation ofthe lower molecular weight components (including MDM) from the test
food prevented a measurement of the "magnification factor" (concentration
in fish/concentration in food). Because hexamethyldisiloxane (HMDS) is
toxic and irritating (Rowe et al., 1948), it is clearly absorbed to some
extent. It is not clear whether MDM would be absorbed during an inhala-
tion exposure.
Ingestion of massive amounts of silicone fluids in the rat appears to
cause no local or systemic effects (Ashley et al., 1967), suggesting that the
material was not absorbed. Tissue histiocytes can phagocytize silicone and
migrate to other organs with it (Rees et al., 1970; Travis et al., 1985;Achauer, 1983).
OCTAMETHYLTRISILOXANE 171
TOXICITY SUMMARY
A summary of the early toxicity studies performed with silicone oils can
be found in a review by McGregor (1954). Rowe et al. (1948) state that"the silicones (methyl and mixed methyl and phenyl polysiloxanes) as a
class are very low in toxicity and present no significant handling prob-
lems." Massive feeding of animals resulted only in a laxative actionsimilar to mineral oil (Barondes et al., 1950). There was no irritation to
the skin and only mild transitory irritation to the eyes. Injections of ani-
mals intramuscularly produced no reaction and led to the suggestion of the
oils as nonaqueous vehicles for administration of drugs (McNamara et al.,
1950).
The vapor pressures of most siloxane polymers are too low to present a
problem as an airborne vapor (Flaningam, 1986). If one looks at the lower
boiling HMDS (boiling point, 99.5°C), guinea pigs and rats exposed
repeatedly for 7-h periods to 4400 ppm showed no signs of discomfort, butthe concentration was disagreeable to humans (Rowe et al. 1948). Expo-
sure of the animals to HMDS at 40,000 ppm caused death in 15-20 min due
to respiratory failure.Feeding studies with methylsiloxanes have been reported in rats (Rowe
et al., 1950) and dogs (Child et al., 1951). The rats were fed a diet con-
taining 0.3% methylpolysiloxane oils (DC Antifoam A) for 2 y. Noadverse effects were observed based on growth, mortality, gross appear-
anee and behavior, hematology, blood urea nitrogen, organ weights,
hepatic lipid, and histopathology of tissues. The dogs were fed the samematerial at 3 g/d/kg body weight for 6 mo and also showed no ill effects.
A more recent review of the toxicity of silicone oils (Clark et al., 1989)
indicates that medical-grade silicones are near-inert compounds. Animal
studies (mice, rats, guinea pigs, rabbits, dogs, and monkeys), including
ingestion studies up to 20 g/kg, showed no ill effects (Ashley et al., 1967;Hawthorne et al., 1970; Rees et al., 1970). In humans, cosmetic injections
of silicone oils were reported to cause no tissue reaction when small
amounts of medical-grade silicone were used.The oral toxicity studies cited above were performed with a mixture of
methyl and phenyl siloxanes. No data on the toxicity of pure MDM were
found. However, the National Toxicology Program has selected this
compound as a candidate for a 2-y carcinogenesis assay, reflecting a
growing interest in the potential toxicity of polymers.

172 SMACS FOR SELECTED AIRBORNE CONTAMINANTS
EXPOSURE LIMITS
No limits were found to have been set by other organizations.
RATIONALE
The most pertinent toxicity data are reported by Rowe et al. (1948) for
HMDS and dodecamethylpentasiloxane (DMPS). Structurally, these two
compounds bracket MDM and provide the basis tbr setting SMACs from
structure-activity relationships (SARs). Both HMDS and DMPS were
tested by single doses given by intraperitoneal injection, intradermal
injection, subcutaneous injection, and oral gavage. The findings are shown
in Table 9-1.
TABLE 9-1 HMDS and DMPS Data
Route Response Response
(Species) Dosa[e to HMDS to DMPS
Oral (rat) 10 mL/kg 0 of 7 died 0 of 3 died, slight laxative
Oral (rat) 30 mL/kg 0 of 7 died 0 of 6 died, moderatelaxative
Oral (rat) 50 mL/kg 1 of 10 died (CNS 3 of 3 dieddepression)
Intraperitoneal 0.1-10 Some deaths, local No effect(rat) mL/kg irritation, adhesion
Intradermal 0.1 mL Inflammation, edema, Blebs, no local reaction
(rnbbiO necrosis
Subcutaneous 0.1 mL Irritation, necrosis No effect
(rabbit)
It is clear from this table that except for the laxative effect of DMPS by
oral administration, HMDS is more toxic. This effect is not relevant to the
inhalation route of administration because the effect is induced by local
nlubrication" of the gastrointestinal tract. More rats died after oral admin-
istration of DMPS than HMDS; however, that occurred only at the extreme
dosage of 50 mL/kg and is not pertinent to the inhalation route.
Inhalation data are available for repeated exposures of rats and guinea
OCTAMETHYLTRISILOXANE 173
pigs to HMDS; however, no inhalation data are available on DMPS. For
HMDS it was reported that 15 7-h exposures of rats to 4400 ppm onlycaused 10% decreases in the weights of liver and kidney (Rowe et al.,
1948). Histological changes were not found in these organs or any of the
others examined in this limited study. It was also reported that 20 7-h
exposures of guinea pigs to 4400 ppm caused only a 10% decrease in body
weight without effect on organ weights or histopathology. Changes in body
weight or organ weight of this magnitude, in the absence of other changes,are not considered adverse effects. Hence, to avoid possible liver or
kidney effects, 4400 ppm is considered to be a no-observed-adverse-effect
level (NOAEL) for repeated exposures of guinea pigs or rats to HMDS.
Unfortunately, no inhalation data are available on DMPS, so it is not
possible to form a complete picture of SARs. Based on the other routes of
administration, it can be concluded that DMPS is very unlikely to be as
toxic by inhalation as HMDS. However, because the SAR is not completefor the inhalation route, the inhalation NOAEL estimate for HMDS (4400
ppm) is reduced by a factor of 3 to estimate a NOAEL for MDM, the
compound of interest. The 7-d SMAC for MDM is calculated using thatfactor and others as shown below:
7-d SMAC
= 4400 ppm × 1/3 × 1/10 × (15 × 7 h)/(7 x 24 h) = 92 ppm.(SAR) (species) (time factors)
Since a clear target organ or mechanism of toxic action is not known for
these compounds, it is not apparent how to extrapolate to longer exposures.
The conservative approach is to use Haber's rule to give 30- and 180-d
SMACs of 21 and 3.6 ppm, respectively.
The short-term SMACs may be estimated from the acute inhalation dataon HMDS. For that compound, a 30-min exposure to 25,000 ppm caused
no clinical effects or deaths. A NOAEL for a 1-h exposure can be esti-mated as follows:
1-h SMAC
= 25,000 ppm × 1/3 × 1/10 × 30/60 = 420 ppm.(SAR) (species) (time)
The 24-h SMAC should be between that value and the 7-d SMAC
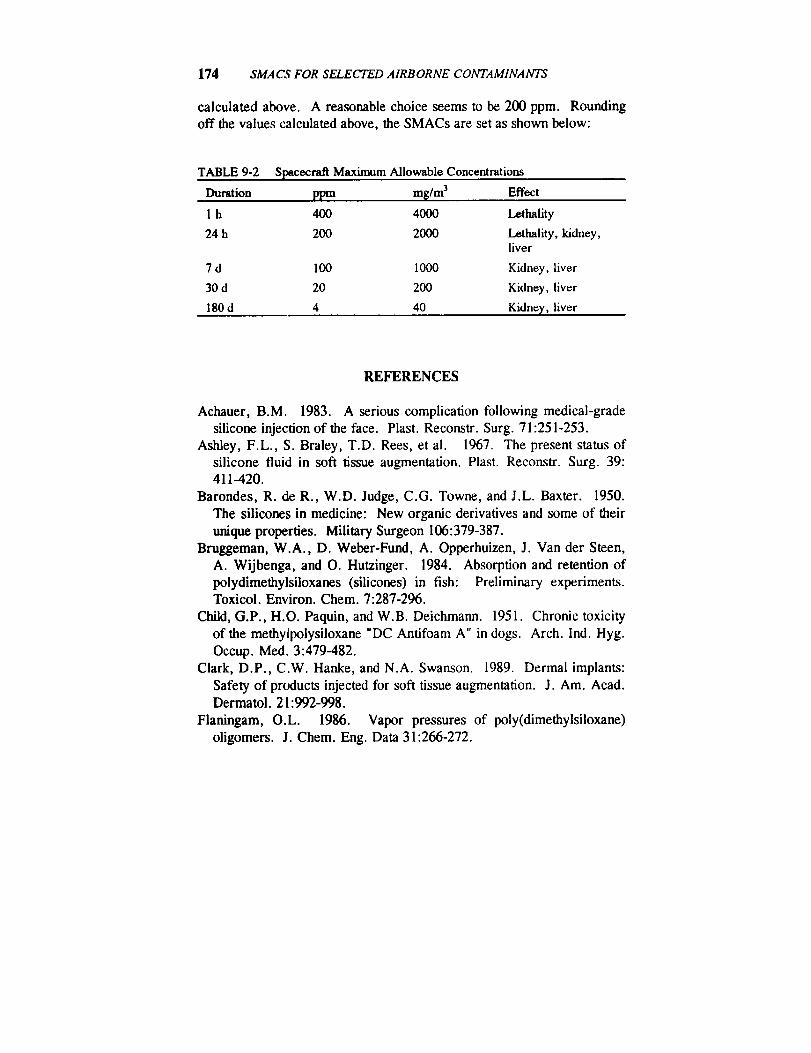
174 SMACS FOR SELECTED AIRBORNE CONTAMINANTS
calculated above. A reasonable choice seems to be 200 ppm. Rounding
off the values calculated above, the SMACs are set as shown below:
TABLE 9-2 Spacecraft Maximum Allowable Concentrations
Duration ppm m_/m 3 Effect
1 h 400 4000
24 h 200 2000
7 d 100 1000
30 d 20 200
180 d 4 40
Lethality
Lethality, kidney,liver
Kidney, liver
Kidney, liver
Kidne],,, liver
REFERENCES
Achauer, B.M. 1983. A serious complication following medical-grade
silicone injection of the face. Plast. Reconstr. Surg. 71:251-253.
Ashley, F.L., S. Braley, T.D. Rees, et al. 1967. The present status of
silicone fluid in soft tissue augmentation. Plast. Reconstr. Surg. 39:
411-420.
Barondes, R. de R., W.D. Judge, C.G. Towne, and J.L. Baxter. 1950.
The silicones in medicine: New organic derivatives and some of their
unique properties. Military Surgeon 106:379-387.
Bruggeman, W.A., D. Weber-Fund, A. Opperhuizen, J. Van der Steen,
A. Wijbenga, and O. Hutzinger. 1984. Absorption and retention of
polydimethylsiloxanes (silicones) in fish: Preliminary experiments.Toxicol. Environ. Chem. 7:287-296.
Child, G.P., H.O. Paquin, and W.B. Deichmann. 1951. Chronic toxicity
of the methylpolysiloxane "DC Antifoam A" in dogs. Arch. Ind. Hyg.
Occup. Med. 3:479-482.
Clark, D.P., C.W. Hanke, and N.A. Swanson. 1989. Dermal implants:
Safety of products injected for soft tissue augmentation. J. Am. Acad.Dermatol. 21:992-998.
Flaningam, O.L. 1986. Vapor pressures of poly(dimethylsiloxane)
oligomers. J. Chem. Eng. Data 31:266-272.
OCTAMETHYLTRISILOXANE 175
Hawthorne, G.A., D.L. Bailantyne, Jr., T.D. Rees, and I. Seidman.1970. Hematological effects of dimethylpolysiloxane fluid in rats. J.Reticuloendothel. Soc. 7:587-593.
Liebich, H.M., W. Bertsch, A. Zaltkis, and H.J. Schneider. 1975.
Volatile organic components in the Skylab 4 spacecraft atmosphere.Aviat. Space Environ. Med. 46:1002-1007.
McGregor, R.R. 1954. Silicones and Their Uses. McGraw-Hill, NewYork.
McNamara, B.P., E.A. McKay, and M.M. Quille. 1950. Silicon fluidsas vehicles for the intramuscular administration of drugs. Fed. Proc.
Fed. Am. Soc. Exp. Biol. 9:301.Merck Index. 1989. P. 6674 in Merck Index. llth Edition. S. Budavari,
ed. Merck & Co., Rahway, N.J.
Rees, T.D., D.L. Ballantyne, and G.A. Hawthorne. 1970. Silcone fluid
research: A follow-up summary. Plast. Reconst. Surg. 46:56-56.Rochow, E.G. 1951. An Introduction to the Chemistry of the Silicones.
2nd Edition. Wiley, New York.
Rowe, V.K., H.C. Spencer, and S.L. Bass. 1948. Toxicological studies
on certain commercial silicones and hydrolyzable silane intermediates.J. Ind. Hyg. Toxicol. 30:332-352.
Rowe, V.K., H.C. Spencer, and S.L. Bass. 1950. Toxicological studies
on certain commercial silicones. Arch. Ind. Hyg. Occup. Med. 1:539-544.
Travis, W.D., K. Balogh, and J. Abraham. 1985. Silicone granulomas:
Report of three cases and review of the literature. Hum. Pathol. 16:19-27.

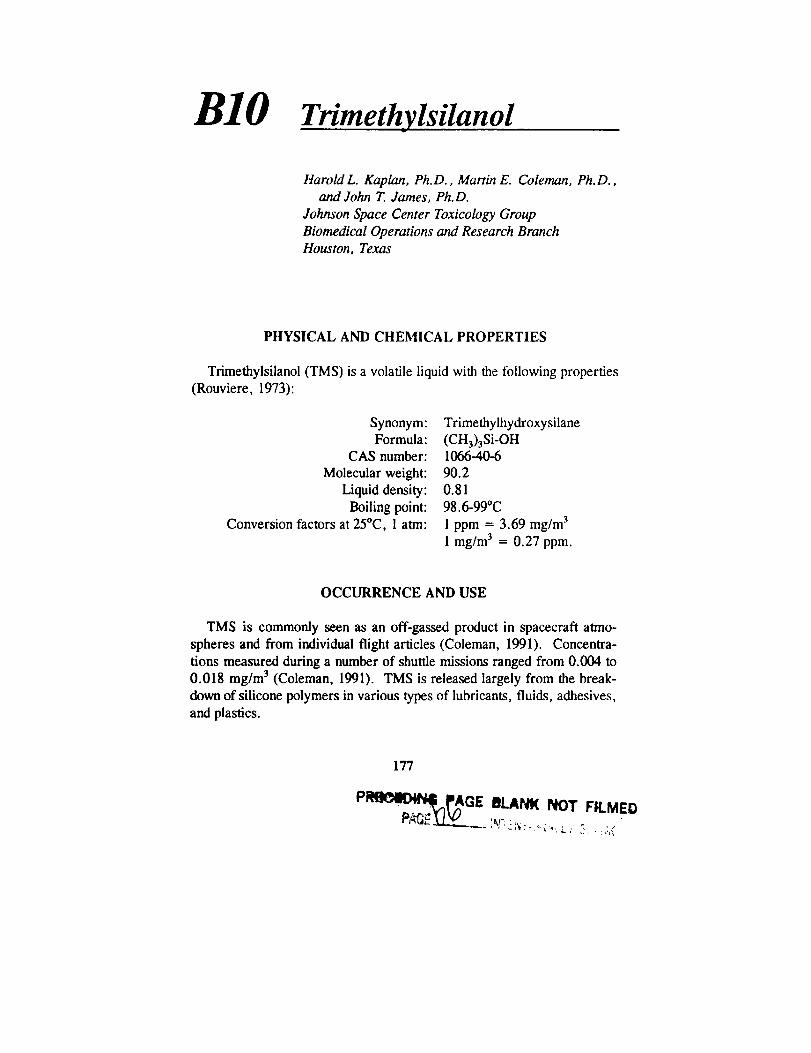
BIO Trimeth y lsilano l
Harold L. Kaplan, Ph.D., Martin E. Coleman, Ph.D.,and John T. James, Ph.D.
Johnson Space Center Toxicology Group
Biomedical Operations and Research BranchHouston, Texas
PHYSICAL AND CHEMICAL PROPERTIES
Trimethylsilanoi (TMS) is a volatile liquid with the following properties
(Rouviere, 1973):
Synonym:Formula:
CAS number:
Molecular weight:
Liquid density:Boiling point:
Conversion factors at 25°C, 1 atm:
Trimethylhydroxysilane
(CH3)3Si-OH1066-40-690.2
0.81
98.6-99°C
1 ppm = 3.69 mg/m 3
1 mg/m 3 = 0.27 ppm.
OCCURRENCE AND USE
TMS is commonly seen as an off-gassed product in spacecraft atmo-spheres and from individual flight articles (Coleman, 1991). Concentra-
tions measured during a number of shuttle missions ranged from 0.004 to
0.018 mg/m 3 (Coleman, 1991). TMS is released largely from the break-
down of silicone polymers in various types of lubricants, fluids, adhesives,
and plastics.
177
P__AGE _NI¢ NOT FILMED

178 SMACS FOR SELECTED AIRBORNE CONTAMINANTS
PHARMACOKINETICS
AND METABOLISM
There is no information on the pharmacokinetics of TMS vapor because,to our knowledge, inhalation studies with this compound have not been
conducted in animals or humans. However, analyses of urine, blood, and
tissues indicate that TMS administered orally to the rat is absorbed from
the gastrointestinal tract into the systemic circulation and is eliminated
within 48 h from the body (Dow Corning Corp., 1972). In a study inwhich TMS was administered orally to rats at doses of 33 and 100 mg/kg/d
for 31 d, there was no evidence of TMS or organosoluble silicon metabo-
lites in blood, liver, or kidneys or of silicon in urine beyond 48 h following
the last dosing (Dow Corning Corp., 1972).
TOXICITY SUMMARY
Acute and Short-Term Studies
Inhalation studies of the toxicity of TMS have not been conducted inanimals or humans (Dow Corning Corp., 1991), and published animal
studies of TMS by other routes of administration are rare. The available
studies do not provide much relevant information. The most useful infor-
mation for establishing SMAC values for TMS are in internal research
reports, abstracts of which were provided by Dow Corning Corp. of
Midland, Michigan. On the basis of these reports, TMS is a centralnervous system (CNS) depressant, producing states of sedation, hypnosis,
or general anesthesia in the rat, guinea pig, and rabbit, depending on the
dose and route of administration (Dow Corning Corp., 1991). Depression
of the CNS was the only effect observed grossly in studies in which TMS(in a 2 % solution in saline) was administered by oral, subcutaneous (sc),
intramuscular (im), intraperitoneal (ip), or intravenous (iv) routes. Thiseffect was reversible. Qualitatively, it was the same as that of a carbon
analog, tert-butyl alcohol, but TMS appeared to be more potent.
In a Russian study of the tranquilizing activity of several silicon com-
pounds, the sUating agent, TMS, at doses of 6.25-25 mg/kg (route not
specified in English abstract) did not produce a tranquilizing effect in mice
nor did it alter neuromediator (GABA, dopamine) turnover in the brain(Tsareva et al., 1982).
TRIMETHYLSILANOL 179
Intraperitoneal or intravenous administration of TMS to the rat, guinea
pig, and rabbit in doses of 100-200 mg/kg produced light-to-moderate
anesthesia, persisting for 10 to 60 min (Dow Corning Corp., 1991). Thelowest reported lethal ip dose of a lithium derivative of TMS in the mouse
is 125 mg/kg (DHHS, 1988). However, this report is not relevant to
SMAC values for TMS because of possible interactive effects of lithium
with CNS depressants. A Dow Corning Corp. internal report stated that
the initial data suggest that rapid attainment of a blood level of 1 mg/mL of
TMS is necessary to produce a state of light anesthesia (Dow CorningCorp., 1991). The statement most likely was intended to indicate that ip or
iv administration of 100-200 mg/kg of TMS results in rapid absorption of
TMS and blood levels of 1 mg/mL necessary for light anesthesia.
Subchronic and Chronic Studies
In a study in which TMS was administered by gavage once daily for 5
d/w for 2 w to four groups of male Sprague-Dawley rats (number unspeci-fied) at doses of 0, 250, 500, or 750 mg/kg/d, no significant toxic or
adverse effects, including behavioral changes, gross pathological changes,
or effects on food consumption or body or organ weights, were observed at
the lowest TMS dose of 250 mg/kg/d (Dow Corning Corp., 1983). Atdoses of 500 and 750 mg/kg/d, CNS depressant effects were observed,
consisting of ataxia, decreased locomotor activity, dyspnea, irregular
respiration, weakness of hind-leg muscles, and loss of consciousness. At
both doses there were significant reductions in total body-weight gains, but
there were no significant dose-related pathological changes or effects on
food consumption or organ weights. There was one death at the 750-
mg/kg/d dose (Dow Corning Corp., 1983).
In a 31-d study in which TMS was administered to rats in single daily
oral doses of 33 and 100 mg/kg, there were no deaths or significant alter-
ations in hematology or body and organ weight ratios of the liver, kidneys,adrenals, heart, or gonads (Dow Corning Corp, 1972). There also were
no histopathological changes or significant alterations in clinical blood
chemistry parameters (uric acid, cholesterol, triglycerides, total lipid,
creafinine, bilirubin, LDH, SGOT, AP, albumin, total protein). Analyses
for total silicon in urine and for organosoluble silicon in blood, liver, and
kidneys indicated the absence of TMS in blood, tissues, and urine at 48 h
following the last dose.
180 SMACS FOR SELECTED AIRBORNE CONTAMINANTS
Genotoxicity
Results of in vivo bone marrow cytogenic assays indicate that TMS is
not genotoxic at doses of 100-500 mg/kg administered ip to rats (Isquith et
al., 1988). The lack of significant clastogenic potential of TMS also wasevident in a rodent dominant lethal test in which oral doses of 20-200
mg/kg/d, 5 d/w for 8 w had no effect on fertility index, pre-implantationloss, or fetal resorptions in the rat (Isquith et al., 1988). No data are
available on the carcinogenicity of TMS by any route of administration.

181
"_ ._ .__
,.., .u
_ '_ _._
'_ _e_.
_o_ ,- • ._
i._ _
"_ "_ O'--
Z_ Z_
•_ _ ._ _
-%
@ 0 0
._- _ "_ _ .- .__e, E E
oE _ _ -- o o
-- __ _ _ _- _--
,- E ,_ .>_ _ _ "_
'._ _ _,,_ ,-,
O
I_ 0
O "_ " _ O 0_ z.-__.-_o z_ z
Z_
E E _.- ._ -_ .= :_ ;_
"_, _,
z_
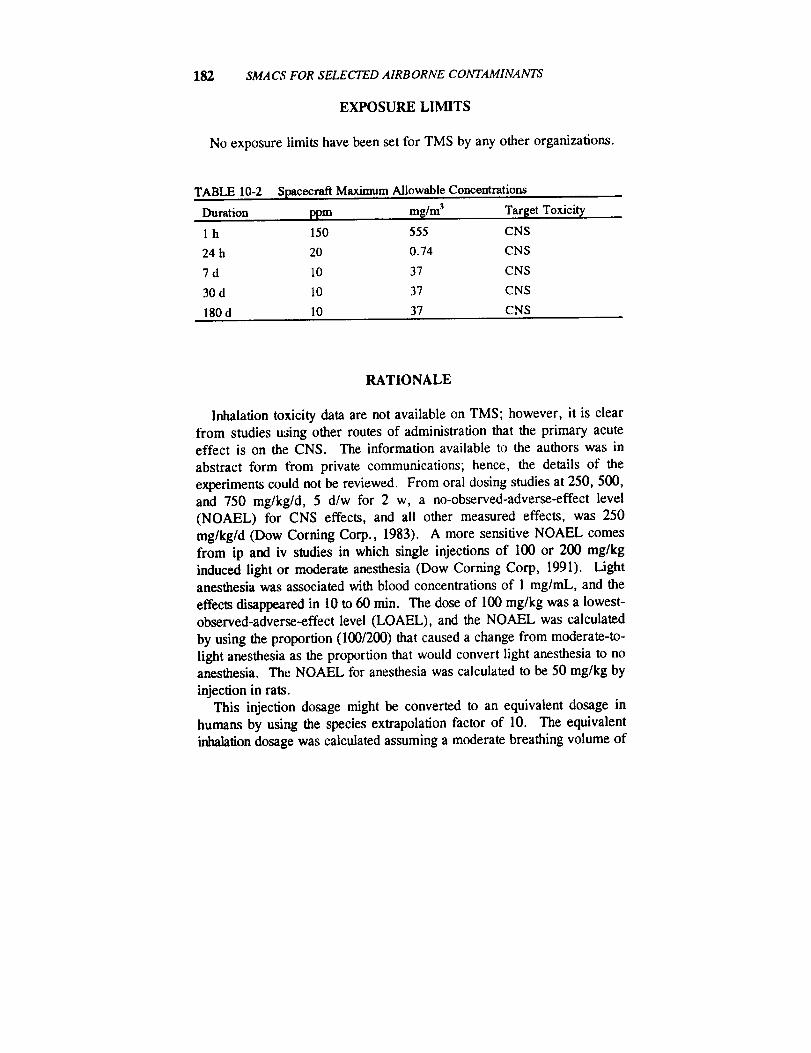
182 SMACS FOR SELECTED AIRBORNE CONTAMINANTS
EXPOSURE LIMITS
No exposure limits have been set for TMS by any other organizations.
TABLE 10-2 Spacecraft Maximum Allowable Concentrations
Duration ppm mg/m3 Target Toxicit,/
1 h 150 555 CNS
24 h 20 0.74 CNS
7 d 10 37 CNS
30 d 10 37 CNS
180 d 10 37 CNS
RATIONALE
Inhalation toxicity data are not available on TMS; however, it is clear
from studies u_ing other routes of administration that the primary acuteeffect is on the CNS. The information available to the authors was in
abstract form from private communications; hence, the details of the
experiments could not be reviewed. From oral dosing studies at 250, 500,and 750 mg/kg/d, 5 d/w for 2 w, a no-observed-adverse-effect level
(NOAEL) for CNS effects, and all other measured effects, was 250
mg/kg/d (Dow Corning Corp., 1983). A more sensitive NOAEL comesfrom ip and iv studies in which single injections of 100 or 200 mg/kg
induced light or moderate anesthesia (Dow Corning Corp, 1991). Lightanesthesia was associated with blood concentrations of 1 mg/mL, and the
effects disappeared in 10 to 60 min. The dose of 100 mg/kg was a lowest-observed-adverse-effect level (LOAEL), and the NOAEL was calculated
by using the proportion (100/200) that caused a change from moderate-to-
light anesthesia as the proportion that would convert light anesthesia to noanesthesia. The NOAEL for anesthesia was calculated to be 50 mg/kg by
injection in rats.This injection dosage might be converted to an equivalent dosage in
humans by using the species extrapolation factor of 10. The equivalent
inhalation dosage was calculated assuming a moderate breathing volume of
TRIMETHYLSILANOL 183
20 L/min and a body weight of 70 kg. Additional assumptions were thatthe uptake was 50% from the inspired air and that there was no clearance
of TMS from blood during a l-h exposure. A 50% uptake is typical ofmany organic vapors (Dahl et al., 1991). The computation was as follows:
C = 50 mg/kg x 1/10 × 70 kg + (50% × 20 L/min x 60 min)= 580 mg/m 3
= 157 ppm.
The 1-h SMAC was set at 150 ppm to protect against CNS effects.
The 24-h SMAC was set using the same starting point except the aver-age breathing volume was 15 L/min and it was assumed that at least 50%
of inhaled TMS was cleared from the blood in a 24-h period. This latterassumption was based on the fact that no trace of TMS could be found 48 h
after administration (Dow Corning Corp, 1972) and clinical anesthesia
disappeared quickly after rats were injected with TMS (Dow CorningCorp., 1991). The computation was as follows:
C = 50 mg/kg x 1/10 x 70 kg +
(50% × 50% x 15 L/min x 1440 min) = 18 ppm.
The 24-h SMAC was rounded to 20 ppm.The long-term SMACs were based on the NOAEL from 31 d of oral
dosing of rats with 100 mg/kg/d (Dow Corning Corp., 1972). Since theCNS appears to be the target of TMS, there should be a threshold below
which no effects occur even in prolonged exposure. That threshold was
determined from the rat oral data, assuming a species factor of 10, a bodyweight of 70 kg, and a breathing volume of 15 L/min. The concentrationwas
C = 100 mg/kg/d × 1/10 x 70 kg + (15 L/min x 1440 min/d)= 32 mg/m 3
= 9 ppm.
Therefore, the 7-d, 30-d, and 180-d SMACs were set at 10 ppm by round-
ing of the value above. It should be noted that factors for uptake from the
respiratory system and elimination were not used because the comparativeuptake and elimination using the oral and inhalation routes are unknown.
184 SMACS FOR SELECTED AIRBORNE CONTAMINANTS
Since there is no evidence that spaceflight-induced physiological changes
would sensitize astronauts to anesthetics, no factor was applied to thevalues derived above.
REFERENCES
Coleman, M. 1991. Summary Report of Postflight Atmospheric Analysisfor STS-26 to STS-36, SD4-91-430. National Aeronautics and Space
Administration, Washington, D.C.Dahl, A.R., M.B. Snipes, and P. Gerde. 1991. Sites for uptake of
inhaled vapors in Beagle dogs. Toxicol. Appl. Pharmacol. 109:263-275.
Dow Corning Corp. 1972. A toxicological evaluation of trimethylsilanol
and dimethylsilanediol in the rat. Dow Corning Internal Research
Report Abstract. Dow Corning Corp., Midland, Mich.
Dow Coming Corp. 1983. A two-week maximum tolerated dose study of
trimethylsilanol in the rat. Dow Corning Internal Research ReportAbstract. Dow Corning Corp., Midland, Mich.
Dow Corning Corp. 1991. Trimethylsilanol. Dow Corning Internal
Research Report Summary. Dow Corning Corp., Midland, Mich.
Isquith, A., R. Slesinski, and D. Matheson. 1988. Genotoxicity studies on
selected organosilicon compounds: In vivo assays. Fd. Chem. Toxic.26:263-266.
Rouviere, J., V. Tabacik, and G. Fleury. 1973. Vibrational spectra of
trimethylsilanol. Part A. Spectrochim. Acta 29:229-242.Tsareva, T.A., E.P. Kramarova, and A.M. Zharkovskii. 1982. Phar-
macological characteristics of the silyl derivatives of alpha-pyrrolidine
[English abstract]. Farmakol. Toksikol. 45:20-23.DHHS. 1988. No. 77713, Silanol, trimethyl-, lithium derivative. In
Registry of Toxic Effects of Chemical Substances. 1985-86 Edition.
U.S. Department of Health and Human Services, Washington, D.C.
Bll Vinyl Chloride
King Lit Wong, Ph. D.
Johnson Space Center Toxicology GroupBiomedical Operations and Research BranchHouston, Texas
PHYSICAL AND CHEMICAL PROPERTIES
Vinyl chloride is a colorless gas with a high flammability and an odorlike that of ether (ACGIH, 1986).
Synonyms:Formula:
CAS number:
Molecular weight:
Boiling point:Melting point:
Vapor pressure:
Conversion factors at 25°C, 1 atm:
Chloroethene, chloroethylene
CH2CHCI75-01-462.5
-13.9°C
Not applicable2530 mm Hg at 20°C
1 ppm = 2.55 mg/m 3
1 mg/m 3 = 0.39 ppm
OCCURRENCE AND USE
Vinyl chloride is used primarily in the manufacture of polyvinyl chloride
resins (ACGIH, 1986). It is also used in organic syntheses. There is noknown use of vinyl chloride in spacecraft, and it has never been found in
air samples taken during space-shuttle missions. However, vinyl chloridehas been predicted to be off-gassed in the space station (Leban and Wag-ner, 1989).
185

186 SMACS FOR SELECTED AIRBORNE CONTAMINANTS
PHARMACOKINETICS AND METABOLISM
When inhaled, vinyl chloride is absorbed quite well by human subjects.In male human volunteers exposed to 7.5-60 mg/m 3 (3-24 ppm) for 6 h,
about 42 % of the inhaled vinyl chloride was retained by the respiratory
system; i.e., the exhaled concentration was 42% less than the inhaledconcentration (Krajewski et al., 1980). The degree of respiratory retention
achieved a relatively stable level 30 min into the 6-h exposure and appeared
not to vary significantly with the exposure concentration, which ranged
from 3 to 24 ppm.
Rats tend to readily absorb vinyl chloride in inhalation exposure. In ratsexposed to t4C-labeled vinyl chloride at 20,000 ppm for 5 min, radioac-
tivity was detected in the liver, bile duct, kidney, and gastrointestinal tract
within 10 min (Duprat et al., 1977). Similarly, in rats exposed to 14C-
labeled vinyl chloride at 50 or 100 ppm for 5 or 6 h, liver and kidney had
the highest concentration of radioactivity among all the tissues after the
exposure (Bolt et al., 1976; Watanabe et al., 1976).
In rats exposed to vinyl chloride at 1000 ppm for 1-6 h, it has beenpostulated that vinyl chloride was oxidized to 2-chloroacetaldehyde via
three pathways, listed as follows (Hefner et al., 1975). (1) At low con-
centrations, vinyl chloride is oxidized first to 2-chloroethanol, which is
further oxidized by alcohol dehydrogenase to 2-chloroacetaldehyde. (2)
When the first pathway is saturated, vinyl chloride is oxidized by mixed
function oxidase to an epoxide, 2-chloroethylene oxide, which arranges to
2-ehloroacetaldehyde. (3) Alternatively, when the first pathway is satu-
rated, vinyl chloride is oxidized by catalase to 2-chloroethyl hydro-
peroxide, which in turn is converted to 2-chloroacetaldehyde.Because pretreatment of rats with 6-nitro-1,2,3-benzothiadiazole, which
inhibits some microsomal eytochrome P-450 pathways, completely blocked
vinyl chloride metabolism in rats exposed to vinyl chloride, Bolt et al.
(1977) postulated that microsomal mixed function oxidase is the major
enzyme for vinyl chloride metabolism.
Most of the 2-chloroacetaldehyde formed from vinyl chloride reacts with
sulfhydryl groups in the ceils, but some of it is oxidized by aldehyde
dehydrogenase to 2-chloroacetic acid (Hefner et al., 1975). The reaction
of 2-chloroacetaldehyde with sulfhydryl groups explains the formation of
n-acetyl-S-(2-hydroxyethyl) cysteine, S-(2-hydroxyethyl) cysteine, and
mercaptoacetic acid in the urine of rats exposed to vinyl chloride 0Vata-
VINYLCHLORIDE 187
nabe et al., 1976, 1978a). Urinary mercaptoacetic acid has also been
found in workers exposed to vinyl chloride (Shu, 1986).
Bolt et al. (1977) exposed rats to vinyl chloride at 50-1200 ppm in aclosed inhalation system and they found that vinyl chloride metabolism was
saturated at about 250 ppm. Similarly, Buchter et al. (1980) discovered
that vinyl-chloride metabolism in rhesus monkeys was saturated at 200
ppm. In rats exposed to vinyl chloride at 10, 1000, or 5000 ppm for 6 h,
Watanabe's group presented evidence that vinyl chloride metabolismappeared to be saturated at 1000 ppm (Watanabe et al., 1976, 1978a;
Watanabe and Gehring, 1976). At l0 ppm, 68% of the body burden wasexcreted in the urine, 12% was expired as CO 2, 4% was excreted in the
feces, and about 2% was expired unchanged (Watanabe et al., 1976;Watanabe and Gehring, 1976). When the exposure level was increased to
I000 ppm, however, the fraction of the body burden eliminated in the urine
was reduced to 56% and that expired as vinyl chloride increased to 12%.
There is evidence that vinyl chloride's epoxide metabolite, 2-chlor-
oethylene oxide, and its rearrangement product, 2-chloroacetaldehyde,
could bind to macromolecules in rats. Watanabe and his colleagues
showed that, in rats exposed to vinyl chloride, the amount of macromo-lecular binding directly increased with the exposure concentration or
phenobarbital pretreatment (Watanabe et al., 1978a,b; Guengerich andWatanabe, 1979). It has been postulated that the epoxide metabolite is the
active metabolite of vinyl chloride and the macromolecular binding is
responsible for vinyl chloride's carcinogenicity.
There are few data on vinyl chloride metabolism in humans. However,
it has been shown that incubation of Salmonella typhimurium with S-9
fraction isolated from human liver increased the mutational frequency in a
similar magnitude as incubation with rat S-9 fraction (Sabadie et al., 1980).
This indicates that electrophilic metabolites could be formed by the actionof human mixed function oxidase on vinyl chloride.
TOXICITY SUMMARY
Acute and Short-Term Toxicity
Mucosal Irritation
Vinyl chloride is known to cause mucosal irritation at over 500 ppm in

188 SMACS FOR SELECTED AIRBORNE CONTAMINANTS
humans (Lefaux, 1968). Baretta et al. (1969) reported that two of seven
human subjects complained of dryness of nose and eyes in an exposure to
500-ppm vinyl chloride lasting for 3.5 h. The dryness of nose and eyeswas probably an indication of very slight mucosal irritation. It appears that
500 ppm is probably the threshold for vinyl chloride's mucosal irritation.
Since none of the four subjects exposed to 250 ppm for 7.5 h complained
of dryness of nose or eyes (Baretta et al., 1969), the no-observed-adverse-effect level (NOAEL) for mucosal irritation is 250 ppm.
Miscellaneous Symptoms
In a study by Lester et al. (1963) nausea was reported in five of sixhuman subjects exposed to vinyl chloride at 16,000 ppm for 5 min. In that
study, one of six human subjects exposed to vinyl chloride at 20,000 ppmfor 5 min experienced headache, which lasted for 30 min. Baretta et al.
(1969) reported that two of seven men exposed to 500 ppm for 3.5 h
complained of mild headache, but they did not complain of nausea. There-fore, the concentration of vinyl chloride causing headache is lower than
that causing nausea. Because nausea was detected only at such a high
exposure concentration (it was absent in a 5-min exposure at 12,000 ppm
or less), nausea will not be relied on in setting the SMACs. None of the
four men in the study of Baretta et al. (1969) complained of headache in a
7.5-h exposure to 250-ppm vinyl chloride. The NOAEL for headache is
250 ppm in acute vinyl chloride exposures.
Liver Toxicity
As will be discussed later, liver is the major target organ of vinyl chlo-
ride in subchronlc and long-term exposures. Whether vinyl chloride could
cause non-neoplastic liver toxicity in humans in acute exposures is debat-
able. A group of Hungarian scientists exposed mice, rats, and rabbits to
vinyl chloride at 1500 ppm for 24 h (Tatrai and Ungvary, 1981). No liver
pathology was found in rats and rabbits. However, in mice, vasomotor
paralysis and shock developed during the exposure, followed by hepatic
histopathology, which included coagulation necrosis and confluent hemor-
rhages in the centrilobular zone, and ultrastructural changes, such asdilation of flae cisterns of rough endoplasmic reticulum and Golgi apparatus
VINYL CHLORIDE 189
and atrophy of some mitochondria. All the mice died as a result of the 24-
h exposure at 1500 ppm, whereas a 12-h exposure killed 16 of 20 mice. In
contrast, no rats or rabbits were killed by the 24-h exposure (Tatrai andUngvary, 1981). In a human study, Baretta et al. (1969) failed to detect
any changes in the serum levels of glutamyl pyruvate transaminase, alka-
line phosphatase, lactic dehydrogenase, bilirubin, blood urea nitrogen, and
creatinine in four men 24 h after a 7.5-h exposure to vinyl chloride at 500or 250 ppm. Therefore, if vinyl chloride is indeed acutely toxic to the liver
in humans, 500 ppm appears to be the NOAEL.
Central Nervous System Toxicity
Vinyl chloride could impair the central nervous system (CNS). Lester
et al. (1963) reported that light-headedness, dizziness, and dulling of vision
and hearing were detected in five of six human subjects exposed at 16,000
ppm for 5 min. When these six subjects were exposed at 12,000 ppm for 5
min, two subjects felt slight dizziness. At 8000 ppm, only one of six
subjects felt light-headed. No CNS symptoms were detected in a 5-minexposure at 4000 ppm (Lester et al., 1963). According to Lefaux (1968),
vinyl chloride at 1000 ppm produces drowsiness, slight visual disturbances,
tingling sensation on the limbs, numbness, and faltering gait. Vinyl chlo-ride has no perceptible action on the CNS below 1000 ppm (Lefaux, 1968).
Baretta et al. (1969) reported no CNS impairment in seven subjects ex-
posed to vinyl cldoride at 500 ppm for 3.5 h or in four subjects exposed for
7.5 h. The NOAEL for acute CNS impairment is, therefore, 500 ppm.
Mortality
A person was reported killed by a massive exposure to vinyl chloride atan unknown concentration (Damziger, 1966). Although the lethal concen-
tration of vinyl chloride in humans is not known for certain, it is probably
over 10,000 ppm based on the animal data of Mastromatteo et al. (1960).
This group of scientists exposed five mice, five rats, and five guinea pigs to
various concentrations of vinyl chloride for 30 rain. No deaths occurred at
10,000 ppm. One of five mice died but no rats or guinea pigs died at
20,000 ppm. At 30,000 ppm, all five mice and all five rats died, and one
of the five guinea pigs died. Because the lethal concentration of vinyl

190 SMACS FOR SELECTED AIRBORNE CONTAMINANTS
chloride is esfinuated to be much higher than the concentrations required to
cause other toxic effects, mortality is not used as a toxic end point in
deriving the SMACs.
Subchronic and Chronic Toxicity
Liver Toxicity
Liver is the major target organ of vinyl chloride. Liver function impair-
ment and hepatic histological changes have been reported in workers
employed in places where vinyl chloride was manufactured or used (Lilliset ai., 1975; Popper and Thomas, 1975; Tamburro et al., 1984). Clini-
cally, occupational exposure to vinyl chloride might cause abdominal pain
in the upper right-hand quadrant, hepatomegaly, portal hypertension,
esophageal varices, and liver cirrhosis (Lillis et al., 1975; Popper and
Thomas, 1975; Lee et al., 1977). No exposure-concentration data weregiven in these reports. In a study conducted with 168 workers in two
Romanian factories where they were exposed to vinyl chloride from 1962
to 1972, the investigators compared, among other things, the rates of
nervous symptoms and gastroenterological symptoms in the workers in
1962 with those in 1966 (Suciu et al., 1975).
Without specifying the analytical method, the investigators reported that
the average vinyl chloride concentrations in 1962 and 1966 were 2298 and98 mg/m 3 (896 and 38 ppm), respectively (Suciu et al., 1975). They
detected a higher rate of euphoria, dizziness, somnolence, nervousness,headache, complete narcosis, weight loss, anorexia, epigastric pains, and
hepatomegaly in the year the workers were exposed to 896 ppm than in the
year they were exposed to 38 ppm (Suciu et al., 1975). The rate of pains
in the right hypochondrium was lower, however, at 896 ppm than at 38
ppm. Because no control group was used and because of a lack of infor-
mation on how the exposure concentrations were determined, the Roma-
nian data are not used in setting SMACs. Nevertheless, the data illustrate
the potential toxicity of vinyl chloride in the CNS and liver in humanworkers.
Kramer and Mutchler (1972) did a medical study with 98 workers
employed over two decades in two vinyl chloride polymerization facilities.
These workers were exposed mainly to vinyl chloride, but there were
co-exposures to vinylidene chloride, which was at lower concentrations.

VINYL CHLORIDE 191
The exposures to vinylidene chloride in the second decade of the occupa-
tional exposure were probably negligible because vinylidene chloride wasfrequently detected only at trace levels. During the two decades of em-
ployment, there were environmental monitoring and medical surveillance.
The investigators did not report all the results of the environmental moni-
toring during the two decades, but they stated that "in more recent mea-surements, infrared and gas chromatographic techniques have established
that the vinyl chloride concentrations average 10 ppm." When compared
with a control group, the vinyl-chloride workers had no significant disease.
There were no differences in chest x-rays and electrocardiograms between
the two groups. No acroosteolysis was detected. Based on the medical
history taken periodically in the medical surveillance program, the exposed
workers reported a higher history of asthma and kidney stone and bloodurine but a lower history of gastrointestinal and hepatic trouble and nervous
symptoms. By physical examinations, the investigators found a higher rate
of anal and rectal abnormalities in the exposed workers than in the con-
trois. From a regression analysis of the data collected, the investigators
estimated that, in 60-y-old workers who had been on the job for 20 y, vinylchloride at 300 ppm time-weighted average (TWA) would increase the
bromsulphalein clearance time by five-fold, 150 ppm would raise it by two-
fold, and 50 ppm would increase it by 80%. They concluded that repeated
exposure to vinyl chloride at 300 ppm or higher for a working lifetimecould cause some impairment in liver function.
In a study by Ho et al. (1991) 12 of over 100 workers in a polyvinylchloride plant in Singapore were found to have elevated serum glutamic
pyruvic transaminase and gamma glutamyl transpeptidase levels, when they
worked in an environment with the vinyl chloride concentrations ranging
between 1 and 21 ppm, with a geometric mean of 6 ppm for 1-13 y. Nine
of the 12 workers had mild-to-moderate nonspecific fatty changes on liverbiopsies. None of them had a history of jaundice, Raynaud's disease, or
blood transfusion. No liver function impairment attributable to vinylchloride was detected in the workers after the vinyl chloride was lowered
to 0.6-2.9 ppm, with a geometric mean of 1.5 ppm, in 1983. In workers
afflicted by vinyl-chloride-induced liver disease, their liver function im-
proved within 0.5-2 y after they were removed from further exposure (I-Ioet al., 1991). Based on the human data of I-Io et al., the NOAEL for
non-neoplastic liver toxicity is about 1.5 ppm.
Lee et al. (1977) showed that increased cell turnover and DNA synthesis
were detected in the livers of rats exposed to vinyl chloride at 50 or 250
192 SMACS FOR SELECTED AIRBORNE CONTAMINANTS
ppm, 6 h/d, 5 d/w for 12 mo. Because increased cell turnover and DNAsynthesis, by themselves, are not considered adverse clinically, the SMACs
are not set to prevent them. Similarly, increased liver weight by itself isnot considered a significant toxic end point. So the SMACs are not derived
from the discovery made by Bi et al. (1985) that the liver weight increased
in rats exposed to vinyl chloride at 10, 100, or 3000 ppm, 6 h/d, 6 d/w for6 mo.
Torkelson et al. (1961) found that there were species differences in the
sensitivity to vinyl chloride's liver toxicity. In a 6-mo exposure, at 7 h/d,5 d/w, of guinea pigs, rats, and rabbits to 200-ppm vinyl chloride, no
changes were seen in guinea pigs, but increased liver weight was detectedin rats and the liver in rabbits developed centrilobular degeneration and
necrosis (Torkeison et al., 1961). Therefore, the rat is more sensitive than
the guinea pig. However, it is not clear whether the rabbit is more sensi-tive than the rat because only three male and three female rabbits were
used in the experiment, making it difficult to draw a conclusion.
In the study of Torkelson et al. (1961) a 4.5-mo exposure of rats at 500
ppm resulted in centrilobular degeneration in liver. A similar exposure of
rats at 100 or 200 ppm led to increased liver weight, but an exposure at 50
ppm failed to cause any significant changes.There are reports of liver toxicity in animals subchronically exposed to
very high concentrations of vinyl chloride. The group of Feron showed
that an exposure of rats to 5000 ppm, 7 h/d, 5 d/w for 52 w produced
degeneration, hyperplasia, hepatocellular carcinoma, and angiosarcoma in
the liver (Feron and Kroes, 1979). Viola (1970) discovered hepatomegaly,
hepatfis, and liver necrosis in male rats exposed to vinyl chloride at 30,000
ppm for 4 h/d, 5 d/w for 1 y.
Kidney Toxicity
Kidney is the second major organ affected by vinyl chloride. At a veryhigh concentration of 30,000 ppm, Viola (1970) found that vinyl chloride
produced tubular nephrosis and chronic interstitial nephritis in rats exposed4 h/d, 5 d/w for 1 y. Tubular nephrosis was also produced in rats exposed
to vinyl chloride at 5000 ppm for 7 h/d, 5 d/w for 1 y (Feron and Kroes,
1979). Torkelson et al. (1961) discovered that 500-ppm vinyl chloride
could cause histopathology in the interstitial and tubular areas of the kidney
VINYLCHLORIDE 193
in rats exposed 7 h/d, 5 d/w for 4.5 mo. Because a similar exposure of
rats at 200 ppm failed to produce any histological changes (Torkelson etal., 1961), the NOAEL for kidney toxicity is 200 ppm.
Neurological Toxicity
Psychiatric disease and mild distal axonal neuropathy have been reported
in workers exposed to vinyl chloride repetitively at unknown concentrations
(Halama et al., 1985; Perticonti et al., 1986). Since the exposure concen-trations were not measured, these human data cannot be used to set the
SMACs. In the experiment conducted by Viola (1970) an exposure tovinyl chloride at 30,000 ppm for 4 h/d, 5 d/w for 1 y led to diffuse degen-
eration of the white and gray matter in the brain and atrophy of granularcells in the cerebellum in rats. Because Feron and Kroes (1979) showed
that 5000 ppm failed to cause any nonneoplastic injuries in the brain of rats
exposed 7 h/d, 5 d/w for 1 y, the NOAEL for brain toxicity is 5000 ppm.
Effects on the Extremities
Occupational exposures to vinyl chloride are known to cause circulatory
disturbance in the extremities, Raynaud's disease (Lillis et al., 1975;
Preston et al., 1976), acroosteolysis, and scleroderma (Dinman et al.,
1971; Wilson et al., 1967; Sakabe, 1975). Unfortunately, the exposureconcentrations at which these effects were seen in workers are not known.
Because Raynaud's disease was usually detected before acroosteolysis in
vinyl-chloride workers, vascular lesion is believed to precede the bone
changes (Dodson and Dinman, 1971). Viola (1970) reported that anexposure of rats at 30,000 ppm for 4 h/d, 5 d/w for 1 y resulted in pathol-
ogy in the paws, such as metaplasia of metatarsal bones, chondroid meta-
plasia, epidermal edema, epidermal hyperkeratosis, and degeneration of
basal cells. These pathological changes in rats somewhat resemble the
acroosteolysis and scleroderma seen in vinyl-chloride workers. Becausethere are no concentration-response data and 30,000 ppm is a very high
concentration, Viola's data on the paws of rats are not suitable for settingthe SMACs.
194 SMACS FOR SELECTED AIRBORNE CONTAMINANTS
Effects on the Respiratory System
In an epidemiology study performed by Wong et al. (1991), a significant
mortality excess from emphysema and chronic obstructive pulmonary
disease was found in vinyl-chloride workers. Since emphysema and
chronic obstructive pulmonary disease have not been found to be associatedwith occupational vinyl chloride exposures in other epidemiology studies, it
is uncertain whether vinyl chloride causes emphysema or chronic obstruc-
tive pulmonary disease in humans. However, there is some evidence of thepulmonary toxicity of vinyl chloride in animals. Suzuki (1978, 1980)
exposed male mice to vinyl chloride at 2500 or 6000 ppm for 5 h/d, 5 d/w
for 5 or 6 mo. In the exposed mice, he found hyperplasia of the alveolar
epithelium, degeneration of the alveolar septal cells, hypertrophy and
hyperplasia of Clara cells and ciliated epithelial cells in the terminalbronchioles, and bronchiolitis. It appears that the lowest-observed-effect
level (LOEL) for lung toxicity is 2500 ppm. Taken together, the epidemi-
ology data of Wong et al. and Suzuki's data in mice show that vinyl chlo-ride might produce lung injuries in humans, so the SMACs are prudently
set to prevent this toxic end point.
Effects on the Reproductive System
There were two Soviet reports on the reproductive effects of vinyl
chloride in workers (Makarov, 1984; Makarov et al., 1984). A decline in
sexual function, which was evaluated by questionnaire, was found in men
and women exposed to vinyl chloride occupationally. In the exposed
women workers, gynecological examinations revealed increased incidences
of ovarian dysfunction, benign uterine growths, and prolapsed genital
organs. The Agency for Toxic Substances and Disease Registry character-
ized the two reports as "not adequately reported for proper evaluation;therefore, such data cannot be used to identify thresholds" (ATSDR, 1989).
So the SMACs are not set relying on the Soviet data. Instead the animaldata of Bi et al. (1985) are used.
In the study of Bi et al., 74 or 75 male rats were exposed to vinyl
chloride at 0, 10, 100, or 3000 ppm, 6 h/d, 6 d/w for 1 y. Sacrifices were
made of 8, 30, 6, and 10 rats at the 3rd, 6th, 9th, and 12th mo, respec-
tively, and the surviving rats were killed 6 mo after the 12-mo exposure.
Testicular histology was evaluated in the rats sacrificed and also in rats that
VINYL CHLORIDE 195
died before the interim and final sacrifices. A reduction in the testicular-
to-body-weight ratio was found in the 100- and 3000-ppm groups after 6mo of exposure. With the rats killed at different time points taken to-
gether, Bi et al. (1985) reported a statistically higher rate of testicular
injuries in the 100- and 3000-ppm groups, but not in the 10-ppm group.
There was fusion of spermatids or spermatocytes into giant cells. Sperma-tids disappeared first, followed by sloughing of secondary and primary
spermatocytes into the lumen of seminiferous tubules, leaving behind
spermatogonia and Sertoli cells. The degeneration and necrosis distributed
randomly in the testis without any relationship to the vascular system.
Carcinogenicity
Vinyl chloride was found to cause liver cancers, especially angiosar-
coma, in vinyl-chloride workers in the 1970s (Health et al., 1975; Taber-
shaw and Gaffey, 1974; Nicholson et al., 1975; Fox and Collier, 1977).
An epidemioiogy study showed that the mortality excess from liver cancersincreased with duration of employment (Health et al., 1975). Other than
liver cancers, there have been epidemiological reports that vinyl-chloride
exposures may produce cancer in other tissues. For instance, Heldaas et
al. (1987) observed 6 cases of malignant melanoma in 454 vinyl-chlorideand polyvinyl-chloride workers in Norway, where only 1.1 cases were
expected. Nevertheless, Heldaas et al. admitted that it was difficult to
make a solid conclusion on the causality between vinyl chloride and malig-nant melanoma.
More recently, there have been reports of a multiplant cohort study in
the United States by Wong et al. (1991) and one in Europe by Simonato et
al. (1991). Both the U.S. and European studies confirmed the findings of
earlier epidemiology studies on the excesses of liver cancers in general andangiosarcoma in particular caused by occupational exposures to vinyl
chloride (Wong et al., 1991; Simonato et al., 1991). Both studies also
found an increase in brain tumors in vinyl-chloride workers. In addition,
an increase in bifiary-tract cancers was discovered in the U.S. study and an
increase in lymphoma was found in the European study. In the European
study, the mortality excess from liver cancers was found to be related to
time since initial exposure to vinyl chloride, duration of employment, and
estimated exposure levels (Simonato et al., 1991).
196 SMACS FOR SELECTED AIRBORNE CONTAMINANTS
The mortality excesses from lymphoma and brain tumor, however, were
not correlated with these exposure variables in the European study
(Simonato et al., 1991). That makes it doubtful whether vinyl chloride
could cause lymphoma and brain tumor. Similarly, a case-control study byWu et al. (1989) found mortality excesses due to liver, lung, and brain
cancers in 3635 workers exposed to vinyl chloride. Wu et al. also demon-
strated that, among tumors in those three sites, only the excess mortality
for liver cancer was significantly associated with the cummulative dose of
vinyl chloride. It can be concluded from these recent epidemiology studies
that vinyl chloride could cause liver cancers in humans, but the evidencethat vinyl chloride also causes tumors in other sites in humans is ratherweak.
Viola et al. (1971) were the first group to demonstrate vinyl chloride's
carcinogenicity in laboratory animals. They exposed rats to vinyl chloride
at 30,000 ppm for 4 h/d, 5 d/w for 1 y and found that vinyl chloride causedlung carcinoma, osteochondroma, and epidermoid carcinoma in the skin.
In a study conducted by Lee et al. (1978), an exposure of rats or mice to
vinyl chloride at 50, 250, or 1000 ppm for 6 h/d, 5 d/w for I y resulted in
liver hemangiosarcoma in rats at 250 ppm or greater and liver hemangio-sarcoma and bronchoalveolar adenoma in the lung in mice at 50 ppm or
greater. The most extensive animal bioassay was done by Maltoni and co-
workers (Maltoni, 1977; Maltoni et al., 1981). They also exposed rats to
vinyl chloride for 1 y (4 h/d, 5 d/w) but held the rats for 83-103 w afterexposure before sacrificing them. Maltoni et al. found that, in Sprague-
Dawley rats, vinyl chloride produced liver angiosarcoma at as low as 100
ppm and nephroblastoma in the kidney at 25 ppm or greater. The inci-dences of these tumors in male and female rats combined are shown inTable 11-1.
Maltoni and co-workers also tested with mice and hamsters in the bioas-
says. In mice exposed to vinyl chloride 4 h/d, 5 d/w for 30 w and held for
observation for 51 w, increased incidences of liver angiosarcoma and lung
tumor were detected at 250 ppm or greater. They found that 79 w afterhamsters were exposed to vinyl chloride at 2500 ppm or greater for 30 w,
papillomas and acanthomas of the forestomach were increased.
The data gathered in the literature indicate that vinyl chloride is a potent
carcinogen in rodents because many studies showed that vinyl chloride was
carcinogenic after an exposure for less than half of the normal lifespan of
the test species (Viola et al., 1971; Lee et al., 1978; Maltoni, 1977;
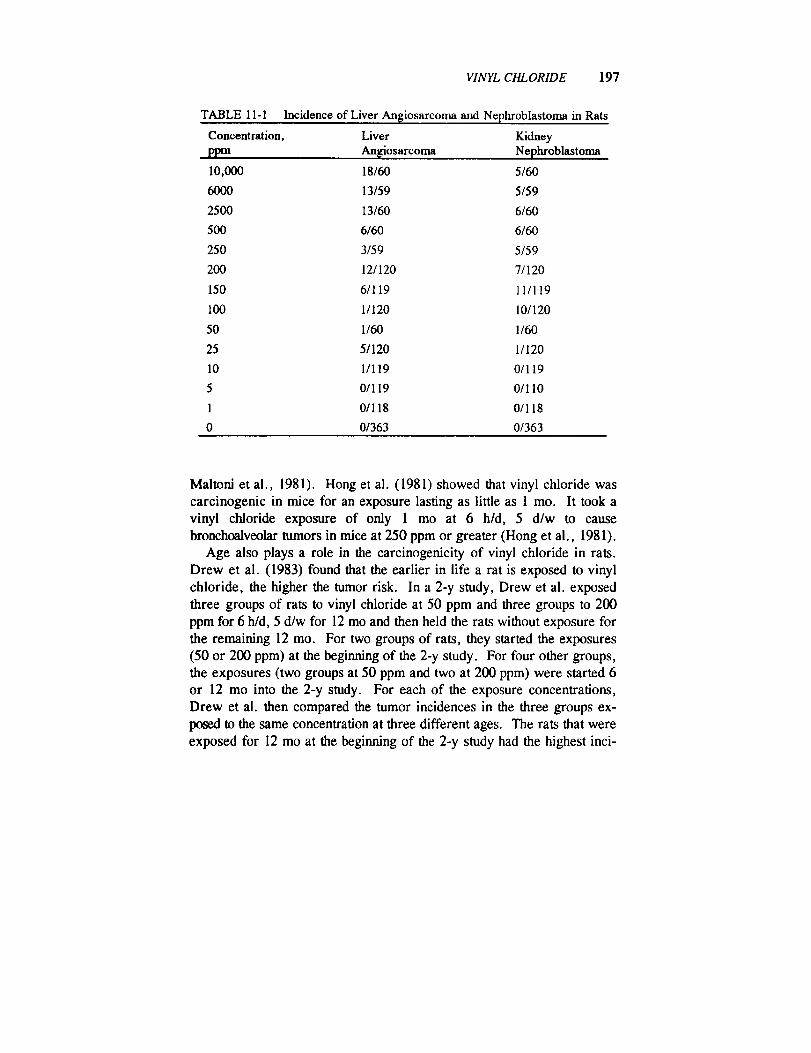
VINYL CHLORIDE 197
TABLE 11 - 1
Concentration,
ppm
Incidence of Liver Angiosarcoma and Nephroblastoma in Rats
Liver Kidney
An[giosarcoma Nephroblastoma
10,000 18/60 5/60
6000 13/59 5/59
2500 13/60 6/60
500 6/60 6/60
250 3/59 5/59
200 12/120 7/120
150 6/119 11/119
100 1/120 10/120
50 1/60 1/60
25 5/120 1/120
10 1/119 0/119
5 0/119 0/110
1 0/118 0/118
0 0/363 0/363
Maltonl et al., 1981). Hong et al. (1981) showed that vinyl chloride was
carcinogenic in mice for an exposure lasting as little as 1 me. It took a
vinyl chloride exposure of only 1 me at 6 h/d, 5 d/w to cause
bronchoalveolar tumors in mice at 250 ppm or greater (Hong et al., 1981).
Age also plays a role in the carcinogenlcity of vinyl chloride in rats.
Drew et al. (1983) found that the earlier in life a rat is exposed to vinyl
chloride, the higher the tumor risk. In a 2-y study, Drew et al. exposed
three groups of rats to vinyl chloride at 50 ppm and three groups to 200
ppm for 6 h/d, 5 d/w for 12 me and then held the rats without exposure for
the remaining 12 me. For two groups of rats, they started the exposures
(50 or 200 ppm) at the beginning of the 2-y study. For four other groups,
the exposures (two groups at 50 ppm and two at 200 ppm) were started 6
or 12 me into the 2-y study. For each of the exposure concentrations,
Drew et al. then compared the tumor incidences in the three groups ex-
posed to the same concentration at three different ages. The rats that were
exposed for 12 me at the beginning of the 2-y study had the highest inci-
198 SMACS FOR SELECTED AIRBORNE CONTAMINANTS
dences of hepatocellular carcinomas, hemangiosarcomas, and mammary
gland carcinomas. The rats that were held for 6 mo before being exposed
also developed tumors, albeit at lower incidences. However, there were nostatistically significant increases in tumor incidences in the rats exposed in
the last 12 mo of the 2-y study.Based on the data available, the International Agency for Research on
Cancer concluded that there is sufficient evidence to support vinyl chlo-
ride's carcinogenicity to both humans and animals (IARC, 1987). TheU.S. Environmental Protection Agency also classified vinyl chloride as a
known human carcinogen (EPA, 1984).
Genotoxicity
There are in vivo data showing that vinyl chloride is genotoxic in hu-
rnans. Hansteen et al. (1978) found an increase in the percent of peripheral
lymphocytes with chromosomal aberrations in workers exposed to 25-ppm
vinyl chloride but not in workers exposed to 1-ppm. In another study, anincrease in peripheral lymphocytes with chromosomal aberrations was
noted in workers exposed to about 50-ppm vinyl chloride (Anderson et al.,
1980). No significant increase in chromosomal aberrations was seen in the
workers after the vinyl chloride concentration had been lowered to a levelestimated to be less than 5 ppm (Anderson et al., 1980). There is also in
vivo evidence of the genotoxicity of vinyl chloride in animals. Vinyl
chloride was tested negative in the dominant lethal test and positive in themieronueleus test in mice (Jenssen and Ramel, 1980; Purchase et al.,
1975).Vinyl chloride has been shown to be genotoxic in various in vitro assays
in numerous reports. Only some of them will be summarized here. Vinyl
chloride was shown to be mutagenic in the Ames test, with or without
activation by S-9 fraction, by Bartsch et al. (1975) and Andrews et al.
(1976). Even without S-9 activation, vinyl chloride produced forwardmutation in Chinese hamster cell V79 and cell transformation of neonatal
hamster kidney cells (Drevon and Kuroki, 1979; Styles, 1977).
Developmental Toxicity
There is conflicting evidence on whether vinyl chloride causes devel-
VINYL CHLORIDE 199
opmental toxicity in humans. In an Ohio city, Edmonds et ai. (1975) found
no differences between how far parents of malformed infants lived from a
local polyvinyl chloride plant and how far parents of normal infants livedfrom it. They concluded that malformations were not associated with
parental exposures to vinyl chloride. Theriault et al. (1983) conducted a
similar study in a Canadian town with a polyvinyl chloride plant andarrived at the same conclusion as Edmonds et al. In contrast, Infante et al.
(1976) reported a higher rate of fetal loss, based on questionnaires, in
pregnant wives of vinyl-chloride workers than in rubber workers not
exposed to vinyl chloride. Infante (1976) also found a higher incidence of
malformations in three Ohio cities that have a polyvinyl chloride production
plant than in other parts of the counties where the three cities are situated.These two studies of Infante have been criticized as being deficient in the
way the studies were conducted and in the data analyses, so the "positive"
findings are highly questionable (Hatch et al., 1981; Stallones, 1987).
Animal data showed that vinyl chloride caused some malformations inrats at concentrations that also caused maternal toxicity (John et al., 1977).
Vinyl chloride did not produce any malformations in mice and rabbits(John et al., 1977). Therefore, it can be concluded that vinyl chloride does
not appear to be a serious teratogenic threat. John et al. (1977) showed
that vinyl chloride, at 500 or 2500 ppm, failed to produce developmental
toxicity and maternal toxicity in rabbits exposed 7 h/d on gestation days 6-18. In the same study, a similar exposure of rats to vinyl chloride at 2500
ppm on gestation days 6-15 increased the incidence of dilated ureters in the
fetuses and reduced the body-weight gain and food consumption in the
mothers. An exposure of rats to 500 ppm increased the incidence of
lumbar spurs in the fetuses and reduced the body-weight gain in the moth-
ers. In mice, an exposure of 500 ppm for 7 h/d on gestation days 6-15
failed to produce any malformations, but vinyl chloride caused increasedfetal resorption, decreased fetal weight, reduced litter size, retarded ossifi-
cation of the cranium and sternum in the fetuses. Vinyl chloride exposure
at 500 ppm was also toxic to the mothers, causing mortality, reduced body-
weight gain, and decreased liver weight (John et al., 1977). It should be
noted that the measurement of maternal body weight for days 6-18 of
gestation might not be adequate. Nevertheless, these data indicate that
vinyl chloride does not have selective developmental toxicity because it
produced developmental effects only in the exposure range that also af-fected the mothers.
200 SMACS FOR SELECTED AIRBORNE CONTAMINANTS
Synergistic Effects
Pretreatments of rats with chemicals, such as phenobarbital and
polyehlorinated biphenyls, which induce microsomal enzymes, are known
to potentiate vinyl chloride's acute hepatotoxieity (Jaeger et al., 1974;
Reynolds et al., 1975). These findings support the theory that vinyl chlo-ride acts through its epoxide metabolite formed via microsomal oxidation.
Therefore, in the event that an astronaut is exposed to vinyl chloride and aknown microsomal inducer, one should be aware of the potential toxicity of
vinyl chloride.
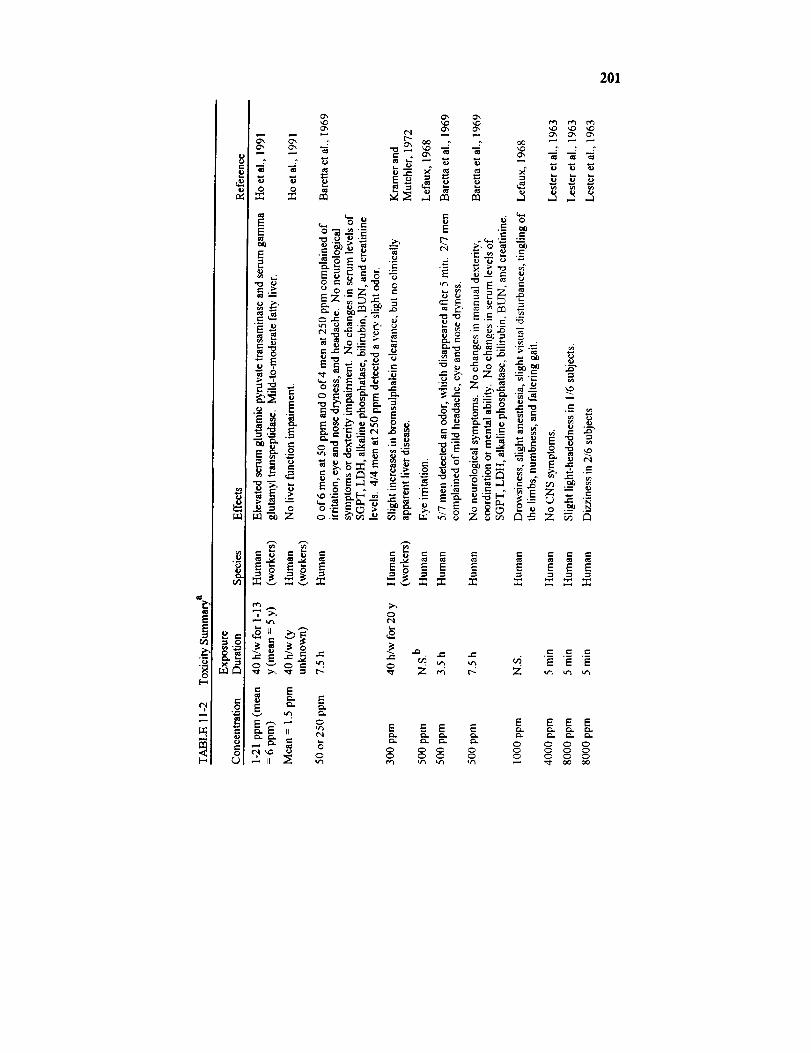
201
E E
E E E E
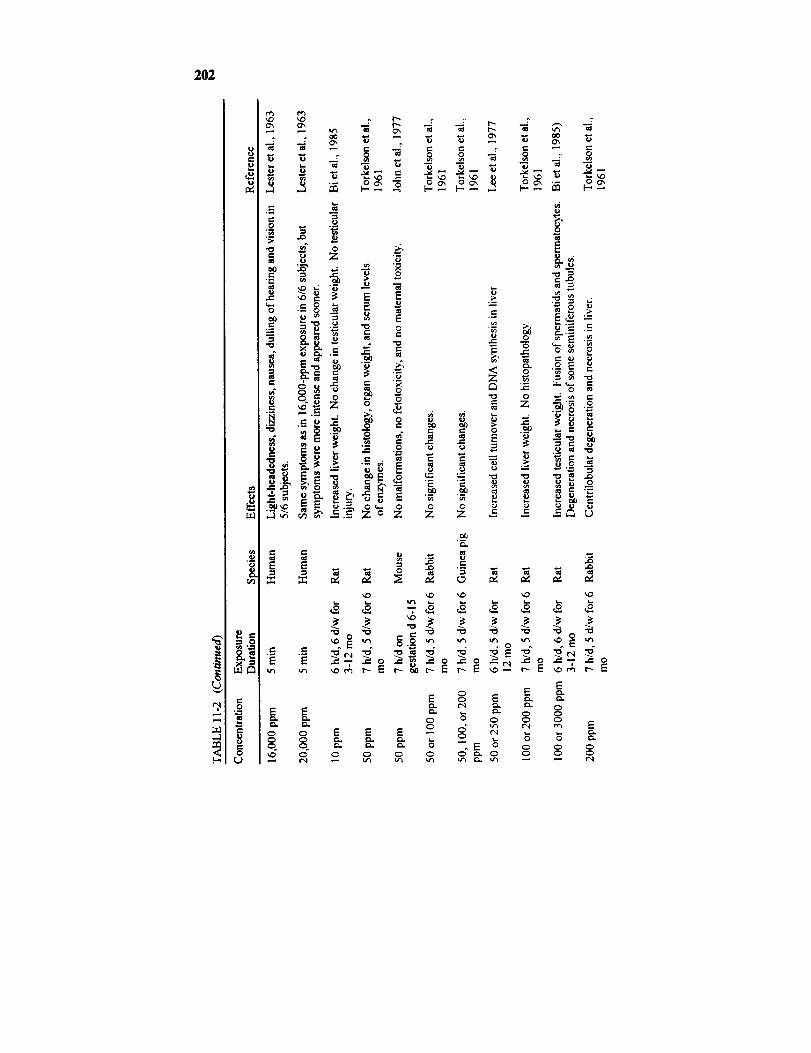
202
8e-,
,,5
Ld
_ .=
0
o_
E E
E"0 0
= ='-o
e- ""
m e_
._= __
o _ "_"N e_
.r-
_, ,o ''_
e i
.E
_,. Z o o
°
_ _ i_zo z
o o ._ o ..2 @
_4
-_- _ r.;
,- o _
Z "_ _'_
"0 0 ..; m e'-
• . 0 ',_
_" _" 0 .--_ _. _ e-
;._ ,_. --
•_. ._. _
Z Z _ -= --
E
m E
_, _, _
.... _ _ "_,,_ ,,, mr- Nr- r- ,o- ¢,,'-
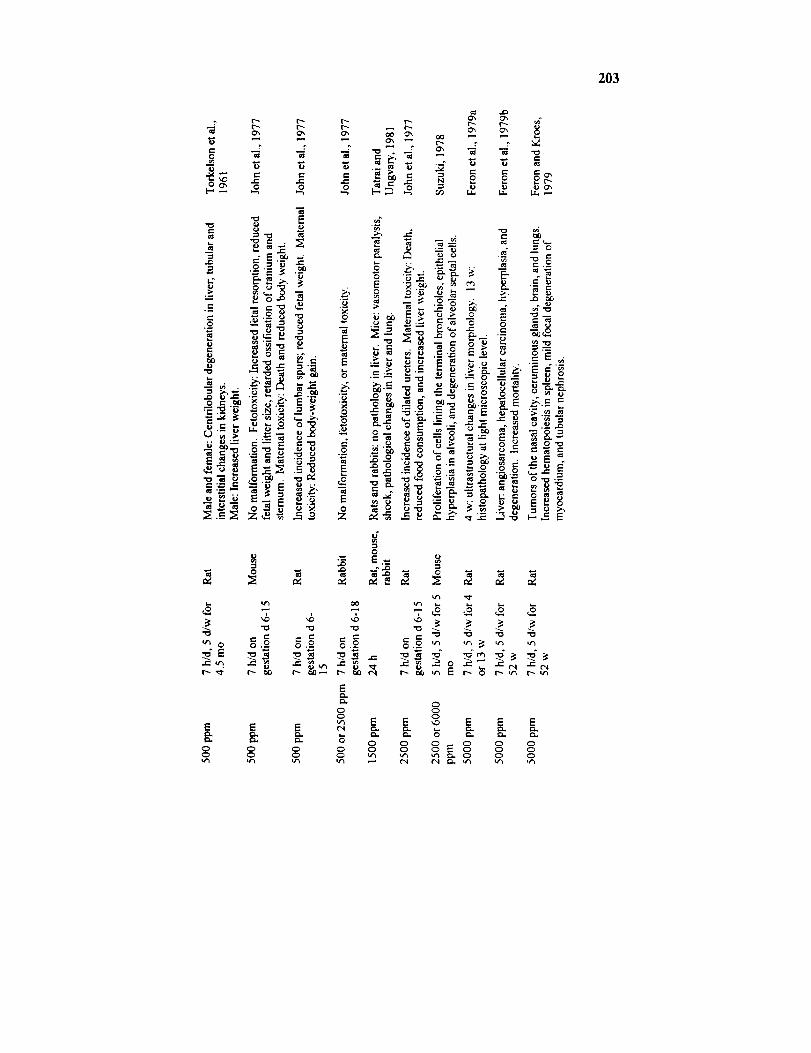
203
,m
_ E
8 o o o _
"7
I_ _
N _ R .*rz
_ _ _ _.__
:._ ._ -_.__
__ - _ E6.o_ _, : _
i.. ¢j ¢J --- _.-
e- "-- 0
:_' "-o o__.-Z _.---_
.o.__ _-_ o _
i..,
_o ='_ "_ -_u-_ I:= I_ 0 t--, u'_ I'-,- u'_
0o
E _ E E E
o o°_o ° oo oo
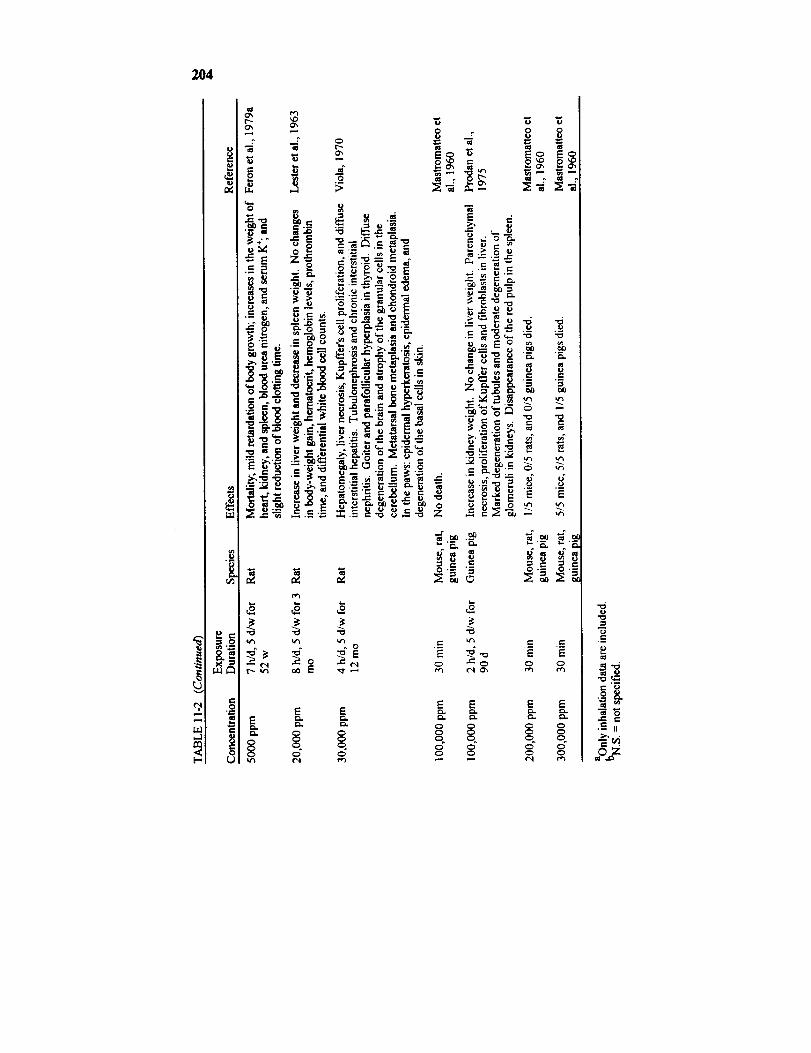
204
0
_E
-_ _,.,_C
e_
0
_E
.No_
_8
_N
1".=_ ._
E¢.1
¢'t
Ot",-
M
.o>
_0._
_-._. _ "=oo_
_ _.'_ i
"_ _,,_ _ ..
___ "_, p. .
re
E
0
.oo,
e-
_
._=
t¢1
Eg%.
ms
E
___ _Z
E o
°_--_ [
_0 0
._o_
•,_._ ,..._
,- ,_ _ =
c-I _',
E
._ ._.
E
.= ._=E EC_ C_
E E
C_ C_C_ C_
o ooC_
.=_
.._-_._-H
_ •
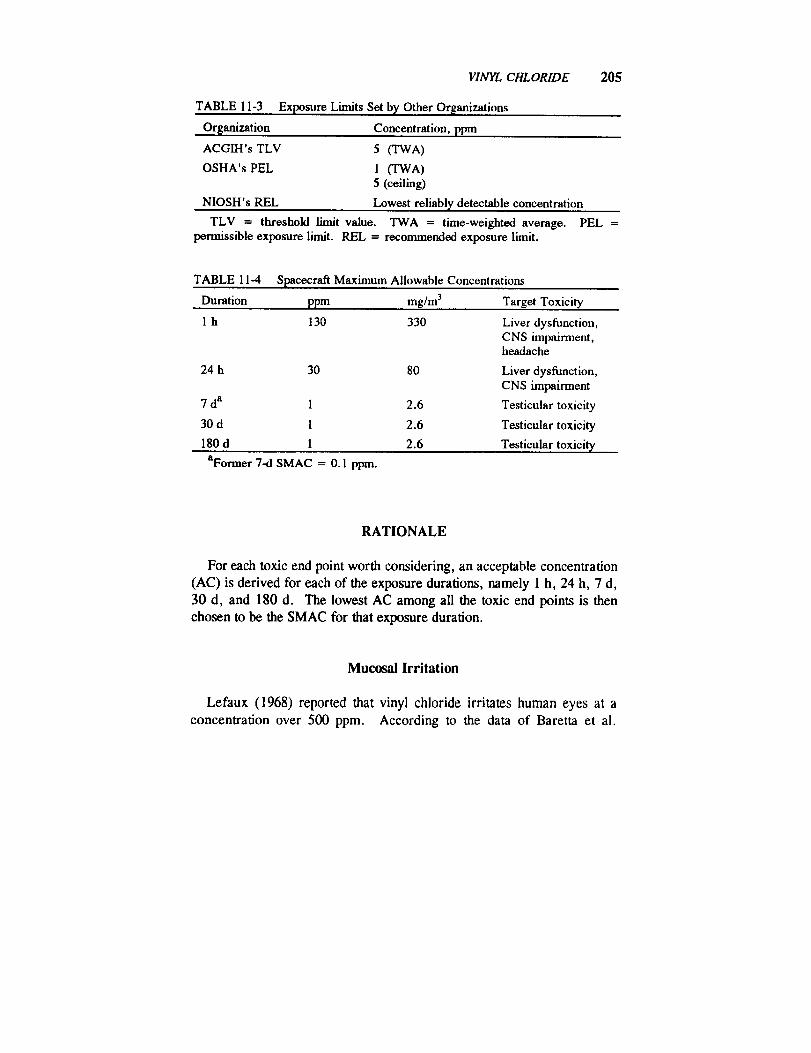
VINYL CHLORIDE 205
TABLE 11-3
Organization
ACGIH's TLV
OSHA's PEL
NIOSH's REL
TLV = threshold limit value. TWA = time-weight_l average.permiss_le exposure limit. REL = recommended exposure limit.
Exposure Limits Set by Other Organizations
Concentration, ppm
5 (TWA)
1 (TWA)5 (ceiling)
Lowest reliably detectable concentration
PEL =
TABLE 11-4 Spacecraft Maximum Allowable Concentrations
Duration ppm mg/m 3
1 h 130
24 h 30
7 da 1
30 d 1
180 d 1
Target Toxicity
330 Liver dysfunction,CNS impairment,headache
80 Liver dysfunction,CNS impairment
2.6 Testicular toxicity
2.6 Testicular toxicity
2.6 Testieular toxicity
aFormer 7-d SMAC = 0.1 ppm.
RATIONALE
For each toxic end point worth considering, an acceptable concentration
(AC) is derived for each of the exposure durations, namely 1 h, 24 h, 7 d,
30 d, and 180 d. The lowest AC among all the toxic end points is then
chosen to be the SMAC for that exposure duration.
Mucosal Irritation
Lefaux (1968) reported that vinyl chloride irritates human eyes at a
concentration over 500 ppm. According to the data of Baretta et al.
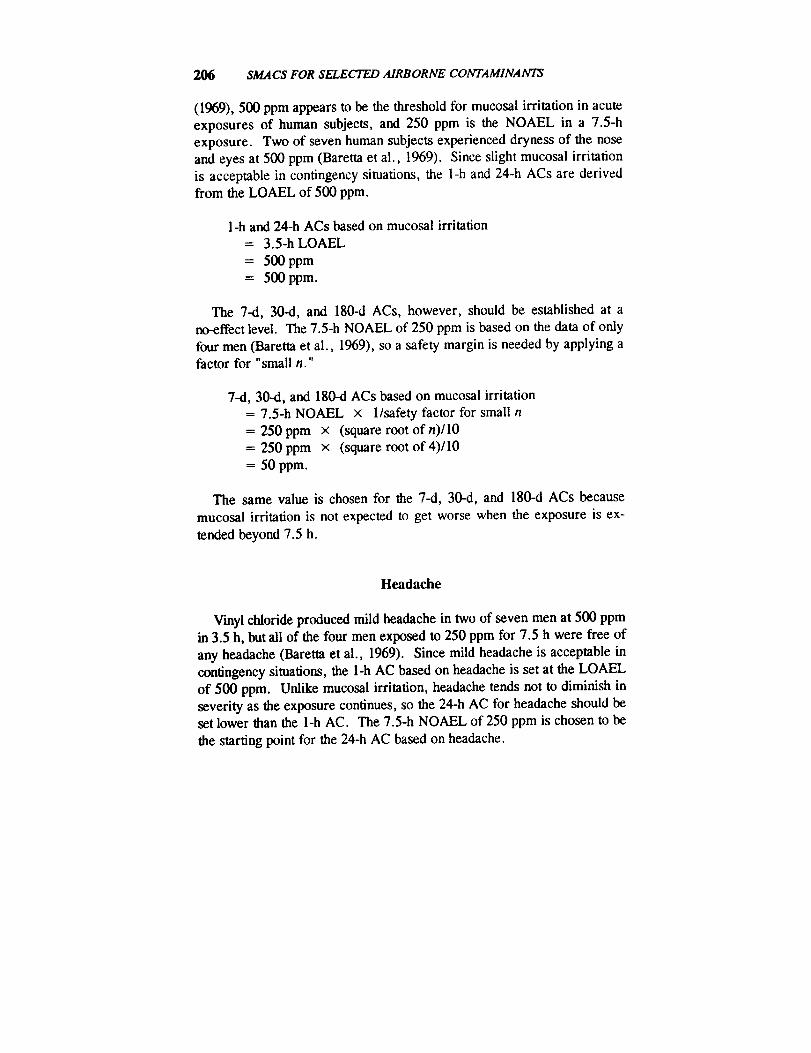
206 8MAC8 FOR SELECTED AIRBORNE CONTAMINANTS
(1969), 500 ppm appears to be the threshold for mucosai irritation in acute
exposures of human subjects, and 250 ppm is the NOAEL in a 7.5-hexposure. Two of seven human subjects experienced dryness of the nose
and eyes at 500 ppm (Baretta et al., 1969). Since slight mucosal irritation
is acceptable in contingency situations, the 1-h and 24-h ACs are derivedfrom the LOAEL of 500 ppm.
l-h and 24-h ACs based on mucosal irritation
= 3.5-h LOAEL
= 500 ppm
= 500 ppm.
The 7-d, 30-d, and 180-d ACs, however, should be established at ano-effect level. The 7.5-h NOAEL of 250 ppm is based on the data of only
four men (Baretta et al., 1969), so a safety margin is needed by applying afactor for "small n."
7-d, 30-d, and 180-d ACs based on mucosal irritation= 7.5-h NOAEL x 1/safety factor for small n
= 250 ppm x (square root of n)/10
= 250 ppm x (square root of 4)/10
= 50 ppm.
The same value is chosen for the 7-d, 30-d, and 180-d ACs because
mucosal irritation is not expected to get worse when the exposure is ex-
tended beyond 7.5 h.
Headache
Vinyl chloride produced mild headache in two of seven men at 500 ppmin 3.5 h, but all of the four men exposed to 250 ppm for 7.5 h were free of
any headache (Baretta et al., 1969). Since mild headache is acceptable in
contingency situations, the 1-h AC based on headache is set at the LOAEL
of 500 ppm. Unlike mucosal irritation, headache tends not to diminish in
severity as the exposure continues, so the 24-h AC for headache should beset lower than the 1-h AC. The 7.5-h NOAEL of 250 ppm is chosen to be
the starting point for the 24-h AC based on headache.

VINYL CHLORIDE 207
24-h AC based on headache
= 7.5-h NOAEL x (square root of n)/10 × time adjustment= 250 ppm x (square root of 4)/10 x 7.5 h/24 h
-- 50 ppm.
Because the use of Haber's rule to extrapolate from the 7.5-h NOAEL
to an AC for an exposure lasting 7-d, 30-d, or 180-d is probably not valid,
the setting of 7-d, 30-d, and 180-d ACs for headache is not attempted.
CNS Impairment
The NOAEL for CNS impairment was 500 ppm for 3.5 h based on thedata of seven men; it was 500 ppm for 7.5 h based on the data from four
men (Baretta et al., 1969).
l-h AC based on CNS effects
= 3.5-h NOAEL x l/safety factor for small n
= 500 ppm × (square root of n)/10= 500 ppm × (square root of 7)/10
= 130 ppm.
24-h AC based on CNS effects
7.5-h NOAEL x l/safety factor for small n × time adjustment
500 ppm x (square root of n)/10 x 7.5 h/24 h
500 ppm × (square root of 4)/10 x 7.5 h/24 h
30 ppm.
Due to a lack of data on the time response of vinyl chloride's CNS
impairment, no acceptable concentrations are estimated beyond 24 h.
Non-neoplastic CNS Injury
In long-term exposures, vinyl chloride has been shown to cause degen-
eration of the white and gray matter of the brain and atrophy of the granu-lar cells in the cerebellum of rats (Viola, 1970). The NOAEL for CNS
injury, based on a 1-y exposure of rats, is 5000 ppm.
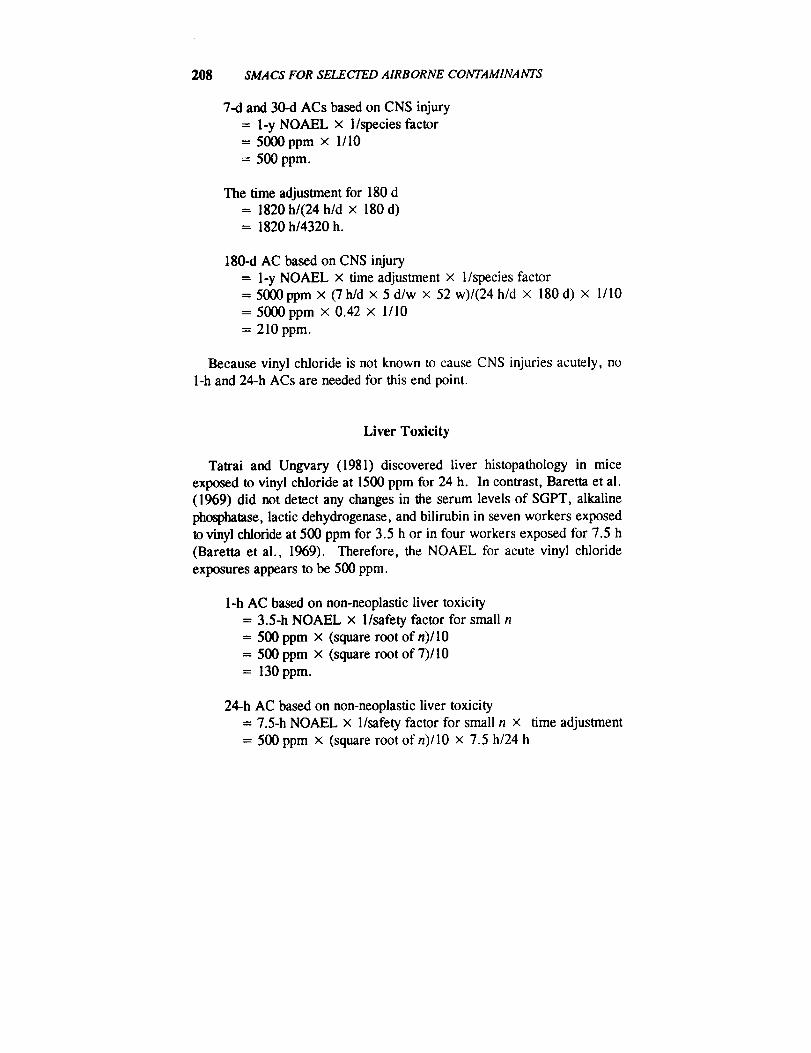
208 SMACS FOR SELECTED AIRBORNE CONTAMINANTS
7-d and 30-d ACs based on CNS injury
= 1-y NOAEL x 1/species factor= 5000 ppm × 1/I0
= 500 ppm.
The time adjustment for 180 d
= 1820 h/(24 h/d × 180 d)= 1820 h/4320 h.
180-d AC based on CNS injury
= 1-y NOAEL × time adjustment × 1/species factor
= 5000ppm × (7h/d x 5 d/w x 52 w)/(24 h/d × 180 d) x
= 5000 ppm × 0.42 x 1/10
= 210 ppm.
1/10
Because vinyl chloride is not known to cause CNS injuries acutely, no
l-h and 24-h ACs are needed for this end point.
Liver Toxicity
Tatrai and Ungvary (1981) discovered liver histopathology in mice
exposed to vinyl chloride at 1500 ppm for 24 h. In contrast, Baretta et al.(1969) did not detect any changes in the serum levels of SGPT, alkaline
phosphatase, lactic dehydrogenase, and bilirubin in seven workers exposed
to vinyl chloride at 500 ppm for 3.5 h or in four workers exposed for 7.5 h
(Baretta et al., 1969). Therefore, the NOAEL for acute vinyl chloride
exposures appears to be 500 ppm.
1-h AC based on non-neoplastic liver toxicity
= 3.5-h NOAEL x 1/safety factor for small n
= 500 ppm x (square root of n)/10
= 500 ppm × (square root of 7)/10
= 130 ppm.
24-h AC based on non-neoplastic liver toxicity7.5-h NOAEL x l/safety factor for small n × time adjustment
500 ppm x (square root of n)/10 x 7.5 h/24 h
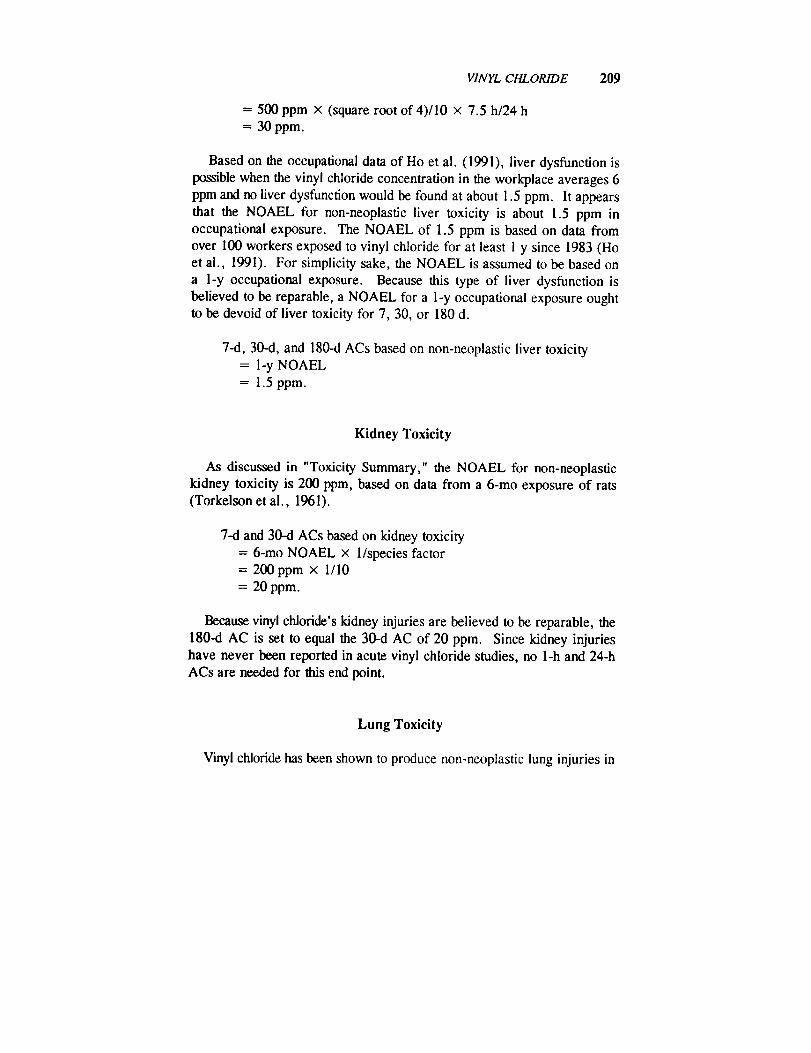
VINYL CHLORIDE 209
= 500 ppm x (square root of 4)/10 x 7.5 h/24 h= 30 ppm.
Based on the occupational data of I4o et al. (1991), liver dysfunction is
possible when the vinyl chloride concentration in the workplace averages 6ppm and no liver dysfunction would be found at about 1.5 ppm. It appears
that the NOAEL for non-neoplastic liver toxicity is about 1.5 ppm in
occupational exposure. The NOAEL of 1.5 ppm is based on data from
over 100 workers exposed to vinyl chloride for at least 1 y since 1983 (Hoet al., 1991). For simplicity sake, the NOAEL is assumed to be based on
a l-y occupational exposure. Because this type of liver dysfunction is
believed to be reparable, a NOAEL for a 1-y occupational exposure oughtto be devoid of liver toxicity for 7, 30, or 180 d.
7-d, 30-d, and 180-d ACs based on non-neoplastic liver toxicity= 1-y NOAEL
= 1.5 ppm.
Kidney Toxicity
As discussed in "Toxicity Summary," the NOAEL for non-neoplastickidney toxicity is 200 ppm, based on data from a 6-mo exposure of rats(Torkelson et al., 1961).
7-d and 30-d ACs based on kidney toxicity
= 6-mo NOAEL x 1/species factor= 200 ppm × 1/10
= 20 ppm.
Because vinyl chloride's kidney injuries are believed to be reparable, the
180-d AC is set to equal the 30-d AC of 20 ppm. Since kidney injurieshave never been reported in acute vinyl chloride studies, no 1-h and 24-h
ACs are needed for this end point.
Lung Toxicity
Vinyl chloride has been shown to produce non-neoplastic lung injuries in
210 SMACS FOR SELECTED AIRBORNE CONTAMINANTS
mice (Suzuki, 1978, 1980). The LOAEL based on a 6-too exposure of
mice is 2500 ppm (Suzuki, 1978, 1980), so the NOAEL is estimated to be
250 ppm.
7-d and 30-d ACs based on lung toxicity
= 6-mo NOAEL x l/species factor
=250ppm x 1/10
= 25 ppm.
180-d AC based on lung toxicity
= 6-mo NOAEL × time adjustment x 1/species factor
= 250ppm x (5 h/d x 5 d/w × 26 w)/(24 h/d x 180 d) × 1/10
-- 250 ppm x 650 h/4320 h x 1/10
= 250 ppm x 0.15 x 1/10
= 4 ppm.
No 1-h and 24-h ACs are needed because vinyl chloride is not known to
cause lung toxicity acutely.
Testicular Toxicity
According to the data of Bi et ai. (1985), vinyl chloride is known to
cause testicular injuries in rats in long-term exposures. A reduction in
testicular weight was noted in rats exposed to vinyl chloride at 100 or 3000
ppm for 6 h/d, 6 d/w for 6 mo. Bi et al. expressed the pathology data by
combining the histopathological data of rats sacrificed after a 3-, 6-, 9-, or
12-mo exposure to vinyl chloride at 0, 10, 100, or 3000 ppm. They found
that exposures to 100 or 3000 ppm produced a higher percent of rats withfusion of cells and degeneration of seminiferous tubules in the testis than
the control. The NOAEL was 10 ppm. Since the number of rats sacrificed
after 6 mo of exposure approximately equaled the combined number of ratssacrificed immediately after a 3-, 9-, or 12-mo exposure, the NOAEL of
10 ppm is assumed to represent a NOAEL based on a 6-mo exposure.
7-d and 30-d ACs based on testicular toxicity
= 6-mo NOAEL x 1/species factor
= 10ppm x 1/10
= 1 ppm.
VINYLCHLORIDE 211
Because the cell types that could be injured by vinyl chloride are
spermatids and spermatocytes, vinyl chloride's testicular injuries are
believed to be reversible. As a result, the 180-d AC is set to equal the 30-dAC.
180-d AC based on testicular toxicity= 30-d AC
= 1 ppm.
Because there is no evidence that acute vinyl chloride exposures aretoxic to the testis, the l-h and 24-h ACs are not derived.
Carcinogenicity
Vinyl chloride exposures could lead to the production of tumors inseveral organs, especially in the liver. Based on the rat data from Maltoni
and his colleagues (Maltoni, 1977), the U.S. Environmental Protection
Agency, using the linearized multistage model, estimated that a life-time
exposure of humans at 1 ppm has a tumor risk of 6.80 × 10.3 (EPA,1984). The life-time exposure concentration that would yield a 10.4 tumor
risk, which is the tumor risk accepted by NASA, is calculated as follows:
Life-time exposure concentration that would generate a 10-4 tumor risk= (1 ppm/6.80 × 103) × 10.4
= 0.0147 ppm.
This life-time exposure concentration is converted to the ACs using the
Crump and Howe approach as suggested by the NRC's Committee on
Toxicology (NRC, 1992; Crump and Howe, 1984). Setting k = 3, t =25,550 d, and s I = 10,950 d, the adjustment factor is calculated to be
26,082 for estimating a near-instantaneous exposure level that would yield
the same excess tumor risk as a continuous life-time exposure.
24-h AC based on carcinogenicity= 0.0147 ppm × 26,082
= 380 ppm.
For the 7-d, 30-d, and 180-d ACs based on carcinogenicity, the adjustment
212 SMACS FOR SELECTED AIRBORNE CONTAMINANTS
factors are 3728, 871, and 146.7, respectively, assuming k = 3, t =
25,550 d, and the earliest age of exposure to be 30 y.
7-d AC based on carcinogenicity
= 0.0147 ppm x 3728
= 55 ppm.
30-d AC based on carcinogenicity
= 0.0147 ppm × 871
= 13 ppm.
180-d AC based on carcinogenicity
= 0.0147 ppm x 146.7
= 2 ppm.
Establishment of SMACs
By selecting the lowest ACs among the various toxic end points for an
exposure duration, the l-h, 24-h, 7-d, 30-d, and 180-d SMACs are set at
130, 30, 1, 1, and 1 ppm, respectively. Because these toxic end points are
not expected to be affected by any microgravity-induced physiological
changes, the SMACs are not adjusted any further.
TABLE 11-5 Acceptable Concentrations
Acceptable Concentration, ppm
Toxic End Point 1 h 24 h 7 d 30 d 180 d
Mucosal irritation 500 500 50 50 50
Headache 130 50 - - -
CNS impairment 130 30 - - -
Liver toxicity 130 30 1.5 1.5 1.5
Kidney toxicity -- - 20 20 20
Lung toxicity -- -- 25 25 4
Tosticular toxicity -- -- 1 1 1
Careinogenicity -- 380 55 130 2
SMAC 130 30 1 1 1
VINYL CHLORIDE 213
REFERENCES
ACGIH. 1986. Vinyl chloride. Pp. 623-626 in Threshold Limit Valuesand Biological Exposure Indices. American Conference of Govern-
mental Industrial Hygienists, Cincinnati, Ohio.
Anderson, D., C.R. Richardson, T.M. Weight, and W.G. Adams. 1980.
Chromosomal analyses in vinyl chloride exposed workers. Results from
analysis 18 and 42 months after an initial sampling. Mutat. Res.79:151-162.
Andrews, A.W., E.S. Zawistowski, and C.R. Valentine. 1976. A com-
parison of the mutagenic properties of vinyl chloride and methyl chlo-ride. Mutat. Res. 40:273-275.
ATSDR. 1989. P. 51 in Toxicology Profile for Vinyl Chloride.
ATSDR/TP-88/25. Agency for Toxic Substances and Disease Registry,
U.S. Public Health Service, and U.S. Environmental Protection Agen-cy, Washington, D.C.
Baretta, E.D., R.D. Stewart, and J.E. Mutchler. 1969. Monitoringexposures to vinyl chloride vapor breath analysis and continuous air
sampling. Am. Ind. Hyg. Assoc. J. 30:537-544.Bartsch, H., C. Malaveille, and R. Montesano. 1975. Human, rat and
mouse liver-mediated mutagenicity of vinyl chloride in S. typhimuriumstrains. Int. J. Cancer 15:429-437.
Bi, W., Y. Wang, M. Huang, and D. Meng. 1985. Effect of vinyl
chloride on testis in rats. Ecotoxicol. Environ. Safety 10:281-289.
Bolt, H.M., H. Kappus, A. Buchter, and W. Bolt. 1976. Disposition of(1,2J4C) vinyl chloride in the rat. Arch. Toxicol. 35:153-162.
Bolt, H.M., R.J. Laib, H. Kappus, and A. Buchter. 1977. Pharmaco-
kinetics of vinyl chloride in the rat. Toxicology 7:179-188.Buchter, A., J.G. Filser, H. Peter, and H.M. Bolt. 1980. Pharmaco-
kinetics of vinyl chloride in the rhesus monkey. Toxicol. Lett. 6:33-36.
Crump, K.S. and R.B. Howe. 1984. The multistage model with a time-
dependent dose pattern: Applications to carcinogenic risk assessment.Risk Anal. 4:163-176.
Damziger, H. 1966. Accidental poisoning by vinyl chloride: Report oftwo cases. Can. Med. Assoc. J. 82:828.
Dinman, B.D., W.A. Cook, W.M. Whitehouse, H.J. Magnuson, and T.
Ditcheck. 1971. Occupational acroosteolysis. I. An epidemiologicalstudy. Arch. Environ. Health 22:61-73.
Dodson, V.N. and B.D. Dinman. 1971. Occupational acroosteolysis. III.
214 SMACS FOR SELECTED AIRBORNE CONTAMINANTS
A clinical study. Arch. Environ. Health 22:83-91.Drevon, C. and T. Kuroki. 1979. Mutagenicity of vinyl chloride, vinyl-
idene chloride and chloroprene in V79 Chinese hamster cells. Mutat.Res. 67:173-182.
Drew, R.T., G.A. Boorman, J.K. Haseman, E.E. McConnell, W.M.
Busey, and J.A. Moore. 1983. The effect of age and exposure duration
on cancer induction by a known carcinogen in rats, mice, and hamsters.Toxicol. Appl. Pharmacol. 68:120-130.
Duprat, P., J.P. Fabry, D. Gradiski, and J.L. Magadur. 1977. Metabolic
approach to industrial poisoning: Blood kinetics and distribution of 14C-
vinyl chloride (VCM). Acta Pharmacol. Toxicol. Suppl. (Kbh). 41:142-143.
Edmonds, L.D., H. Falk, and J.E. Nissim. 1975. Congenital malfor-
mations and vinyl chloride. Lancet 2(7944): 1098.EPA. 1984. Health Effects Assessment for Vinyl Chloride. EPA/540/1-
86-036. U.S. Environmental Protection Agency, Washington, D.C.
Feron, V.J. and R. Kroes. 1979. One-year time-sequence inhalation
toxicity study of vinyl chloride in rats. II. Morphological changes in the
respiratory tract, ceruminous glands, brain, kidneys, heart, and spleen.
Toxicology 13:131-141.Feron, V.J., B.J. Spit, H.R. Immel, and R. Kroes. 1979a. One-year
time-sequence inhalation toxicity study of vinyl chloride in rats. III.
Morphological changes in the liver. Toxicology 13: 143-154.
Feron, V.J., A. Kruysse, and H.P. Til. 1979b. One-year time-sequence
inhalation toxicity study of vinyl chloride in rats. I. Growth, mortality,
haematology, clinical chemistry, and organ weights. Toxicology 13:25-35.
Fox, A.J. and P.F. Collier. 1977. Mortality experience of workers
exposed to vinyl chloride monomer in the manufacture of polyvinylchloride. Br. J. Ind. Med. 34:1-10.
Guengerich, F.P. and P.G. Watanabe. 1979. Metabolism of (_4C)- and
(36Cl)-labeled vinyl chloride in vivo and in vitro. Biochem. Pharmacol.28:589-596.
Halama, J., S. Becker-Stone, and J.M. Halama. 1985. Das haeman-
giosarkom der bei arbeitern in der PVC-inductrie and andere VC-
bedingte erkrankungen mit angiologish-dermatologischer, heptaiogisch-
er, radiologischer and neurologischer symptomatik. Der Radiolog.25:22-29.
VINYL CHLORIDE 215
Hansteen, I.L., L. Hillestad, E. Thiis-Evensten, and S.S. Heldaas. 1978.
Effects of vinyl chloride in man: A cytogenetic follow-up study. Mutat.Res. 51:271-278.
Hatch, M., J. Kline, and Z. Stein. 1981. Power considerations in studies
of reproductive effects of vinyl chloride and some structural analogs.
Environ. Health Perspect. 41:195-201.
Health, C.W., Jr., H. Fable, and J.L. Creech, Jr. 1975. Characteristics
of cases of angiosarcoma of the livers among vinyl chloride workers inthe United States. Ann. N.Y. Acad. Sci. 246:231-236.
Hefner, R.E., Jr., P.G. Watanabe, and P.J. Gehring. 1975. Preliminary
studies of the fate of inhaled vinyl chloride monomer in rats. Ann.N.Y. Acad. Sci. 246:135-148.
Heldaas, S.S., A.A. Andersen, and S. Langard. 1987. Incidence of
cancer among vinyl chloride and polyvinyl chloride workers: Further
evidence for an association with malignant melanoma. Br. J. Ind. Med.44:278-280.
Ho, S.F., W.H. Phoon, S.L. Gan, and Y.K. Chan. 1991. Persistent liver
dysfunction among workers at a vinyl chloride monomer polymerization
plant. J. Soc. Occup. Med. 41:10-16.
Hong, C.B., J.M. Winston, L.P. Thornburg, and C.C. Lee. 1981.
Follow-up study on the carcinogenicity of vinyl chloride and vinylidene
chloride in rats and mice: Tumor incidence and mortality subsequent to
exposure. J. Toxicol. Environ. Health 7:909-924.
IARC. 1987. Pp. 373-376 in IARC Monographs on the Evaluation of
Carcinogenic Risks to Humans, Suppl. 7. International Agency for
Research on Cancer, Lyon, France.
Infante, P.F. 1976. Oncogenic and mutagenic risks in communities with
polyvinyl chloride production facilities. Ann. N.Y. Acad. Sci. 271:49-57.
Infante, P.F., J.K. Wagoner, A.J. McMichael, R.J. Waxweiler, and H.
Falk. 1976. Genetic risks of vinyl chloride. Lancet. 1:734-735.
Jaeger, R.J., E.S. Reynolds, R.B. Conolly, M.T. Moslen, S. Szabo, and
S.D. Murphy. 1974. Acute hepatic injury by vinyl chloride in rats
pretreated with phenobarbital. Nature 252:724-726.
Jenssen, D. and C. Ramel. 1980. The micronucleus test as part of a
short-term mutagenicity test program for the prediction of carcinogeni-
city evaluated by 143 agents tested. Mutat. Res. 75:191-202.
John, J.A., F.A. Smith, B.K.J. Leong, and B.A. Schwetz. 1977. The
216 $MACS FOR SELECTED AIRBORNE CONTAMINANTS
effects of maternally inhaled vinyl chloride on embryonal and fetal
development in mice, rats, and rabbits. Toxicol. Appl. Pharmacol.39:497-513.
Krajewski, J., M. Dobecki, and J. Gromiec. 1980. Retention of vinyl
chloride in the human lung. Br. J. Ind. Med. 37:373-374.Kramer, C.G. and J.E. Mutchler. 1972. The correlation of clinical and
environmental measurements for workers exposed to vinyl chloride.Am. Ind. Hyg. Assoc. J. 33:19-30.
Leban, M.I. and P.A. Wagner. 1989. Space Station Freedom Gaseous
Trace Contaminant Load Model Development. SAE Technical Paper
Series 891513. Society of Automotive Engineers, Warrendale, Pa.
Lee, C.C., J.C. Bhandari, and J.M. Winston. 1977. Inhalation toxicityof vinyl chloride and vinylidene chloride. Environ. Health Perspect.21:25-32.
lee, C.C., J.C. Bhandari, J.M. Winston, W.B. House, R.L. Dixon, and
J.S. Woods. 1978. Carcinogenicity of vinyl chloride and vinylidenechloride. J. Toxicol. Environ. Health 4:15-30.
Lefaux, R. 1968. Industrial toxicology. Pp. 63-83 in Practical Toxicol-
ogy of Plastics, P.P. Hopf, ed. CRC Press, Boca Raton, Fla.
Lester, D., L.A. Greenberg, and W.R. Adams. 1963. Effects of single
and repeated exposures of humans and rats to vinyl chloride. Am. Ind.
Hyg. Assoc. J. 24:265-275.Lillis, R., H. Anderson, W.J. Nicholson, S. Daum, A.S. Fischbein, and
I.J. Selikoff. 1975. Prevalence of disease among vinyl chloride andpolyvinyl chloride workers. Ann. N.Y. Acad. Sci. 246:22-41.
Makarov, I.A. 1984. Sexual disorders in male workers occupationally
exposed to methyl-methacrylate vinyl chloride. Gig. Tr. Prof. Zabol.6:19-23.
Makarov, I.A., M.S. Solovyeva, and G.I. Vnelitsky. 1984. On sexual
disorders in women chronically exposed to methylmethacrylate and
vinyl chloride. Gig. Tr. Prof. Zabol. 3:22-27.
Maltoni, C. 1977. Recent findings on the carcinogenicity of chlorinated
olefins. Environ. Health Perspect. 21:1-5.Maltoni, C., G. Lefemine, A. Ciliberti, G. Cotti, and D. Carretd. 1981.
Carcinogenicity bioassay of vinyl chloride monomer: A model of risk
assessment on an experimental basis. Environ. Health Perspect. 41:3-29.
Mastromatteo, E., A.M. Fischer, H. Christie, and H. Danziger. 1960.
VINYL CHLORIDE 217
Acute inhalation toxicity of vinyl chloride to laboratory animals. Am.Ind. Hyg. Assoc. J. 21:394-398.
Nicholson, W.J., E.C. Hammond, H. Seidman, and l.J. Selikoff. 1975.
Mortality experience of a cohort of vinyl chloride-polyvinyl chlorideworkers. Ann. N.Y. Acad. Sci. 246:225-230.
NRC. 1992. Guidelines for Developing Spacecraft Maximum Allowable
Concentrations for Space Station Contaminants. National AcademyPress, Washington, D.C.
Perticonti, G.F., G. Abbritti, T.A. Cantisani, L. Bond, and L. Mauro.
1986. Polineuropathy in workers with long exposure to vinyl chloride.
Electro-physiological study. Electromyogr. Clin. Neurophysiol. 26:41-47.
Popper, H. and L.B. Thomas. 1975. Alterations of liver and spleen
among workers exposed to vinyl chloride. Ann. N.Y. Acad. Sci.246:172-194.
Preston, B.J., K.L. Jones, and R.G. Grainger. 1976. Clinical aspects ofvinyl chloride disease. Proc. Soc. Med. 69:284-306.
Prodan, L., I. Suciu, V. Pilaru, E. Ilea, and L. Pascu. 1975. Experi-mental chronic poisoning with vinyl chloride (monochloroethane).Ann. N.Y. Acad. Sci. 246:159-163.
Purchase, I.F.H., C.R. Richardson, and D. Anderson. 1975. Chromo-
somal and dominant lethal effects of vinyl chloride. Lancet. 2:410-411.
Reynolds, E.S., M.T. Moslen, and S. Szabo. 1975. Hepatotoxicity of
vinyl chloride and 1, l-dichloroethylene. Am. J. Pathol. 81:219-231.Sabadie, N., C. Malaveille, A.M. Camus, and H. Bartsch. 1980. Com-
parison of the hydroxylation of benzo(a)pyrene with the metabolism of
vinyl chloride, n-nitrosomorpholine, and n-nitroso-n-methylpiperazineto mutagens by human and rat liver microsomal fractions. Cancer Res.409:119-126.
Sakabe, H. 1975. Bone lesions among polyvinyl chloride production
workers in Japan. Ann. N.Y. Acad. Sci. 246:78-79.
Shu, P. 1986. Study of excretion regularity of thiodiglycolic acid in
urine of vinyl chloride-exposed workers. Clin. J. Prev. Med. 20:87-89.
Simonato, L., K.A. L'Abbe, A. Andersen, S. Beili, P. Comba, G.
Engholm, G. Ferro, L. I-Iagrnar, and S. Langard. 1991. A collabora-
tive study of cancer incidence and mortality among vinyl chloride

218 SMACS FOR SELECTED AIRBORNE CONTAMINANTS
workers. Stand. J. Work Environ. Health. 17:159-169.
Stallones, R.A. 1987. The use and abuse of subgroup analysis in epi-
demiological research. Prev. Med. 16:183-194.
Styles, J.A. 1977. A method for detecting carcinogenic organic chemi-cals using mammalian cells in culture. Br. J. Cancer 36:558-563.
Suciu, I., L. Prodan, E. Ilea, A. Paduraru, and L. Pascu. 1975. Clinicalmanifestations in vinyl chloride poisoning. Ann. N.Y. Acad. Sci.
246:53-69.
Suzuki, Y. 1978. Pulmonary tumors induced in mice by vinyl chloridemonomer. Environ. Res. 16:285-301.
Suzuki, Y. 1980. Nonneoplastic effects of vinyl chloride in mouse lung.Environ. Res. 21:235-253.
Tabershaw, I.R. and W.R. Gaffey. 1974. Mortality study of workers in
the manufacture of vinyl chloride and its polymers. J. Occup. Med.16:509-518.
Tamburro, C.H., L. Makk, and H. Popper. 1984. Early hepatic his-
tologic alterations among chemical (vinyl monomer) workers. Hepa-
tology 4:413-418.Tatrai, E. and G. Ungvary. 1981. On the acute hepatotoxicity of inhaled
vinyl chloride. Acta Morphol. Acad. Sci. Hung. 29:221-226.
Theriault, G., H. Iturra, and S. Gingras. 1983. Evaluation of the as-sociation between birth defects and exposure to ambient vinyl chloride.
Teratology 27:359-370.
Torkelson, T.R., F. Oygen, and V.K. Rowe. 1961. The toxicity of vinylchlroide as determined by repeated exposure of laboratory animals.
Am. Ind. Hyg. Assoc. J. 22:354-361.Viola, P.L. 1970. Pathology of vinyl chloride. Med. Lav. 61:174-180.
Viola, P.L., A. Bigotti, and A. Caputo. 1971. Oncogenic response of rat
skin, lungs, and bones to vinyl chloride. Cancer Res. 31:516-522.
Watanabe, P.G. and P.J. Gehring. 1976. Dose-dependent fate of vinyl
chloride and its possible relationship to oncogenicity in rats. Environ.
Health Perspect. 17:145-152.Watanabe, P.G., G.R. McGowan, E.O. Madrid, and P.J. Gehring.
1976. Fate of (14C) vinyl chloride following inhalation exposure in
rats. Toxicol. Appl. Pharmacol. 37:49-59.Watanabe, P.G., J.A. Zempel, and P.J. Gehring. 1978a. Comparison of
the fate of vinyl chloride following single and repeated exposure in rats.
Toxicol. Appl. Pharmacol. 44:391-399.
VINYL CHLORIDE 219
Watanabe, P.G., J.A. Zempel, D.G. Pegg, and P.J. Gehring. 1978b.
Hepatic macromolecular binding following exposure to vinyl chloride.Toxicol. Appi. Pharmacol. 44:571-579.
Wilson, R.H., W.E. McCormick, C.F. Tatum, and J.L. Creech. 1967.
Occupational acroosteolysis report of 31 cases. J. Am. Med. Assoc.201:577-580.
Wong, O., M.D. Whorton, D.E. Foliart, and D. Ragland. 1991. An
industry-wide epidemiology study of vinyl chloride workers, 1942-1982. Am. J. Ind. Med. 20:317-334.
Wu, W., K. Steenland, D. Brown, V. Wells, J. Jones, P. Schulte, and W.
Halperin. 1989. Cohort and case-control analyses of workers exposed
to vinyl chloride: An update. J. Occup. Med. 31:518-523.


NATIONAl, ACADEMY PRESS
N<_tit+n<ll .,\c<+ctt'Ili\ t>i Hcic'ncc<<_t<+i_+ubli_h th<' t<'port+i+->tic,ct I',v lh<, \c,lch,m\ nnct b\ the' Nnlit+nnt .'\c<lch'inv
c>l tl+_illtx'rin_ Ihc' It+-_tltcih' <+i klc'cticinc', <+ilct thr
N<tli<+n</I I<c'<-+u<lr<hC i)llll< iI, <ill t+t+c'i<_tiii_ ui+tctc'F the'
c'h<lllt'l" _l'<illtt'tt t_.ithL' N,iiionnl ,\c,/ctt'l+l\ <)t Htit'ilc-t'<4
bv tht, Cltln__.Wc,._+ot thu Llnitvct 5L/to+.