NTP TOXICITY STUDY REPORT ON CELLULOSE INSULATION
117
National Toxicology Program Toxicity Report Series Number 74 NTP Toxicity Study Report on the Atmospheric Characterization, Particle Size, Chemical Composition, and Workplace Exposure Assessment of Cellulose Insulation (CELLULOSEINS) August 2006 National Institutes of Health Public Health Service U.S. Department of Health and Human Services
Transcript of NTP TOXICITY STUDY REPORT ON CELLULOSE INSULATION

National Toxicology Program Toxicity Report Series Number 74
NTP Toxicity Study Reporton the Atmospheric Characterization, Particle Size, Chemical Composition,
and Workplace Exposure Assessment of
Cellulose Insulation(CELLULOSEINS)
August 2006
National Institutes of Health
Public Health Service
U.S. Department of Health and Human Services

FOREWORD
The National Toxicology Program (NTP) is an interagency program within the Public Health Service (PHS) of the Department of Health and Human Services (HHS) and is headquartered at the National Institute of Environmental Health Sciences of the National Institutes of Health (NIEHS/NIH). Three agencies contribute resources to the program: NIEHS/NIH, the National Institute for Occupational Safety and Health of the Centers for Disease Control and Prevention (NIOSH/CDC), and the National Center for Toxicological Research of the Food and Drug Administration (NCTR/FDA). Established in 1978, the NTP is charged with coordinating toxicological testing activities, strengthening the science base in toxicology, developing and validating improved testing methods, and providing information about potentially toxic substances to health regulatory and research agencies, scientific and medical communities, and the public.
NTP Toxicity Study Reports are indexed in the NIH/NLM PubMed database and are available free of charge electronically on the NTP website (http://ntp.niehs.nih.gov) or in hardcopy upon request from the NTP Central Data Management group at [email protected] or (919) 541-3419.

National Toxicology Program Toxicity Report Series
Number 74
NTP Toxicity Study Reporton the Atmospheric Characterization, Particle Size, Chemical Composition,
and Workplace Exposure Assessment of
Cellulose Insulation(CELLULOSEINS)
Daniel L. Morgan, Ph.D., Study Scientist
National Toxicology ProgramP.O. Box 12233
Research Triangle Park, NC 27709
NIH Publication No. 06-5963
National Institutes of Health
Public Health Service
U.S. Department of Health and Human Services

2
CONTRIBUTORS
National Toxicology Program Evaluated and interpreted results and reported findings
D.L. Morgan, Ph.D., Study Scientist
J.R. Bucher, Ph.D. R.S. Chhabra, Ph.D. J.R. Hailey, D.V.M. J.K. Haseman, Ph.D. R.R. Maronpot, D.V.M. S.D. Peddada, Ph.D. J.H. Roycroft, Ph.D. C.S. Smith, Ph.D. G.S. Travlos, D.V.M.
Battelle Pacific Northwest Laboratories Conducted atmospheric characterization, particle size, and chemical composition studies
J.A. Dill, Ph.D. R.B. Westerberg, Ph.D. S. Yin-Fong, Ph.D.
Pathology Associates International Evaluated slides and prepared pathology report on rats
J.C. Turnier, V.M.D.
National Institute of Occupational Safety and Health Conducted workplace exposure assessment
J.E. Fernback R.M. Hall, M.S. R.E. McCleery, M.S.P.H. J. McCullough, M.D.
Biotechnical Services, Inc. Prepared Toxicity Study Report
S.R. Gunnels, M.A., Principal Investigator
M.P. Barker, B.A. J.I. Powers, M.A.P. R.E. Shaver, B.A. R.A. Willis, B.A., B.S. P.A. Yount, B.S.

3
PEER REVIEW
The draft report on the toxicity studies of cellulose insulation was evaluated by the reviewers listed below. These reviewers serve as independent scientists, not as representatives of any institution, company, or governmental agency. In this capacity, reviewers determine if the design and conditions of these NTP studies are appropriate and ensure that this Toxicity Study Report presents the experimental results and conclusions fully and clearly.
Richard B. Schlesinger, Ph.D. Maria T. Morandi, Ph.D., C.I.H. Department of Biology and Health Sciences School of Public Health Pace University Houston Health Science Center Pleasantville, NY University of Texas
Houston, TX
4
CONTENTS
ABSTRACT . . . . . . . . . . . . . . . . . . . . . . . . . . . . . . . . . . . . . . . . . . . . . . . . . . . . . . . . . . . . . . . . . . . . . . . . . . . . . 7Evaluation of the Chemical Composition, Particle Size, and Pulmonary Toxicity of Cellulose Insulation . 7Exposure Assessment of Cellulose Insulation Applicators . . . . . . . . . . . . . . . . . . . . . . . . . . . . . . . . . . . . . . 8Conclusions . . . . . . . . . . . . . . . . . . . . . . . . . . . . . . . . . . . . . . . . . . . . . . . . . . . . . . . . . . . . . . . . . . . . . . . . . . 9
INTRODUCTION . . . . . . . . . . . . . . . . . . . . . . . . . . . . . . . . . . . . . . . . . . . . . . . . . . . . . . . . . . . . . . . . . . . . . . . . 11 Study Rationale . . . . . . . . . . . . . . . . . . . . . . . . . . . . . . . . . . . . . . . . . . . . . . . . . . . . . . . . . . . . . . . . . . . . . . . 11 Chemical and Physical Properties . . . . . . . . . . . . . . . . . . . . . . . . . . . . . . . . . . . . . . . . . . . . . . . . . . . . . . . . . 12Production, Use, and Human Exposure . . . . . . . . . . . . . . . . . . . . . . . . . . . . . . . . . . . . . . . . . . . . . . . . . . . . . 12Regulation . . . . . . . . . . . . . . . . . . . . . . . . . . . . . . . . . . . . . . . . . . . . . . . . . . . . . . . . . . . . . . . . . . . . . . . . . . . 15Toxicity and Carcinogenicity . . . . . . . . . . . . . . . . . . . . . . . . . . . . . . . . . . . . . . . . . . . . . . . . . . . . . . . . . . . . . 16
EVALUATION OF THE CHEMICAL COMPOSITION, PARTICLE SIZE, AND PULMONARY TOXICITY OF CELLULOSE INSULATION . . . . . . . . . . . . . . . . . . . . . . . . . . . . . . 19
Materials and Methods . . . . . . . . . . . . . . . . . . . . . . . . . . . . . . . . . . . . . . . . . . . . . . . . . . . . . . . . . . . . . . . . . . 19Results . . . . . . . . . . . . . . . . . . . . . . . . . . . . . . . . . . . . . . . . . . . . . . . . . . . . . . . . . . . . . . . . . . . . . . . . . . . . . . 24Discussion . . . . . . . . . . . . . . . . . . . . . . . . . . . . . . . . . . . . . . . . . . . . . . . . . . . . . . . . . . . . . . . . . . . . . . . . . . . 37
EXPOSURE ASSESSMENT OF CELLULOSE INSULATION APPLICATORS . . . . . . . . . . . . . . . . . . . 41Materials and Methods . . . . . . . . . . . . . . . . . . . . . . . . . . . . . . . . . . . . . . . . . . . . . . . . . . . . . . . . . . . . . . . . . . 42Results . . . . . . . . . . . . . . . . . . . . . . . . . . . . . . . . . . . . . . . . . . . . . . . . . . . . . . . . . . . . . . . . . . . . . . . . . . . . . . 47Discussion . . . . . . . . . . . . . . . . . . . . . . . . . . . . . . . . . . . . . . . . . . . . . . . . . . . . . . . . . . . . . . . . . . . . . . . . . . . 51
REFERENCES . . . . . . . . . . . . . . . . . . . . . . . . . . . . . . . . . . . . . . . . . . . . . . . . . . . . . . . . . . . . . . . . . . . . . . . . . . 57
APPENDIXES Appendix A Cellulose Insulation Application and Field Studies Results . . . . . . . . . . . . . . . . . . . . . . . A-1Appendix B Medical History Questionnaire . . . . . . . . . . . . . . . . . . . . . . . . . . . . . . . . . . . . . . . . . . . . . B-1Appendix C Acute Symptoms Survey . . . . . . . . . . . . . . . . . . . . . . . . . . . . . . . . . . . . . . . . . . . . . . . . . . C-1

5 Cellulose Insulation, NTP TOX 74
SUMMARY
Background Cellulose insulation is produced mainly from recycled newspapers, which are shredded and treated with fire-retardant chemicals. The materials are installed by blowing, which creates a potential hazard to workers. We studied the physical and chemical properties of cellulose insulation aerosols and surveyed several workplace exposure conditions to determine if such a hazard exists.
Methods We generated particles of cellulose insulation by the process used at work sites and separated them by size. We also investigated ten worksites in different parts of the country, examined the size of the dust particles or fibers, and surveyed the health of the workers.
Results Of the cellulose insulation particles examined by the generator, less than 0.1% were of the size that were respirable by the lung. Similarly at the worksites, the amounts of respirable size dusts were typically low. While workers had occasional eye or mucous membrane irritation, there was little evidence of any lower respiratory health conditions.
Conclusions We conclude that because almost all of the generated cellulose insulation particles are not respirable, additional studies of cellulose insulation in laboratory animals are not needed.

6 Cellulose Insulation, NTP TOX 74

7
ABSTRACT
Cellulose InsulationCELLULOSEINS
Synonym: CI
Cellulose insulation (CI) is a type of thermal insulation produced primarily from recycled newspapers. The
newspapers are shredded, milled, and treated with fire-retardant chemicals. The blowing process for installing CI
generates a significant quantity of airborne material that presents a potential inhalation hazard to workers. CI was
selected for study based upon the high production volume, the potential for widespread human exposure, and a lack
of toxicity data; insufficient information was available to determine whether inhalation studies in laboratory animals
were technically feasible or necessary. Studies were conducted to characterize the chemical and physical properties
of CI aerosols, to evaluate the potential acute pulmonary toxicity of CI, and to assess occupational exposure of CI
installers. Workplace exposure assessments were conducted in collaboration with the National Institute for
Occupational Safety and Health (NIOSH, 2001).
EVALUATION OF THE CHEMICAL COMPOSITION, PARTICLE SIZE, AND PULMONARY TOXICITY OF CELLULOSE INSULATION
Chemical analyses were performed on samples of bulk CI from four major United States manufacturers. All samples
of the bulk CI were found to contain primarily amorphous cellulose (60% to 65%) with a smaller crystalline
component (35% to 40%). The crystalline phase was primarily native cellulose (75% to 85%) with a minor amount
of cellulose nitrate (15% to 25%). Elemental analyses of acid digests of CI materials indicated that the major
components (>0.1% by weight) included aluminum, boron, calcium, sodium, and sulfur. An acid-insoluble residue
present in all four materials (3% to 5% of original sample weight) was found to consist primarily of aluminum silicate
hydroxide (kaolinite; ~85%) with minor amounts (#5% each) of magnesium silicate hydroxide (talc), potassium
aluminum silicate hydroxide (muscovite), and titanium dioxide (rutile). Solvent extracts of the bulk materials were
analyzed for organic components by gas chromatography with flame ionization detection. Analyses revealed a mass
of poorly resolved peaks. Because of the very low concentrations, further quantitative and qualitative analyses were
not performed.

8 Cellulose Insulation, NTP TOX 74
An aerosol generation system was designed to separate CI particles based upon aerodynamic size and to simulate the
process used during CI installation at work sites. Less than 0.1% of each of the CI samples was collected as the small
respirable particle fraction. The mean equivalent diameter of respirable particles ranged from 0.6 to 0.7 µm. The
numbers of fibers in the respirable fractions ranged from 9.7 × 10³ to 1.4 × 10⁶ fibers/g of CI. The respirable particle
fractions did not contain cellulose material and consisted mainly of fire retardants and small quantities of clays.
The respirable fraction from one CI sample was administered by intratracheal instillation to male Fischer 344 rats at
doses of 0, 0.625, 1.25, 2.5, 5, or 10 mg/kg body weight; the bronchoalveolar lavage (BAL) fluid cellularity was
evaluated 3 days later. Based upon the relatively mild severity of the inflammatory response, a dose of 5 mg/kg body
weight was selected for use in a subsequent 28-day study. Rats received CI, titanium dioxide (particle controls), or
sterile saline (controls). BAL fluid was evaluated 1, 3, 7, 14, and 28 days after instillation, and lung histopathology
was evaluated 14 and 28 days after treatment. CI caused a greater influx of inflammatory cells than titanium dioxide
and caused significant increases in BAL fluid protein and lactate dehydrogenase. These CI-induced changes in BAL
fluid parameters were transient and by day 14 were not significantly different than those observed in rats treated with
titanium dioxide or phosphate-buffered saline. Unlike titanium dioxide, CI treatment caused a minimal to mild
nonprogressive, minimally fibrosing granulomatous pneumonitis characterized by nodular foci of macrophages and
giant cells.
These results indicated that few respirable particles or fibers are likely generated during the CI application and that
the acute pulmonary toxicity is minimal.
EXPOSURE ASSESSMENT OF CELLULOSE INSULATION APPLICATORS
The CI exposure assessment was conducted with 10 contractors located across the United States. Air samples of total
dust and respirable dust were collected for scanning electron microscopy (SEM) to characterize any fibers in the dust.
Two SEM air samples for each day of CI activities were collected from the installer and hopper operator. Bulk CI
samples were collected and analyzed for metal, boron, and sulfate content. Real-time and video exposure monitoring
was conducted to further characterize the CI dust and workers’ exposures. The exposure assessment also included a
medical component.
Investigators collected 175 personal breathing zone (PBZ) total dust, 106 area total dust, and 90 area respirable dust
air samples during CI-related activities at the 10 contractor sites. Twenty-six employees’ total dust 8-hour time-
weighted averages (TWAs) exceeded the Occupational Safety and Health Administration (OSHA) permissible
exposure limit (PEL) of 15 mg/m3, and 42 exceeded the American Conference of Governmental Industrial Hygienists
(ACGIH) threshold-limit value (TLV) of 10 mg/m3. Respirable dust air sampling and real-time monitoring with

9 Cellulose Insulation, NTP TOX 74
particle size discrimination indicated low levels of respirable dust generation. The SEM analyses revealed that fibers
were an average 28 µm in length and ranged from 5 µm to 150 µm. CI installers’ PBZ total dust, area total dust, and
area respirable dust air samples were all significantly higher during dry attic applications than wet attic applications
(P<0.01). Conversely, the hopper operators’ total dust exposures were significantly higher during wet wall and
ceiling applications than dry wall and ceiling applications (P=0.02). Analyses of variance tests revealed that
exposure concentrations in total dust air samples collected in the PBZ of all CI workers, including installers working
in attics, installers during wall applications, hopper operators during attic applications, and hopper operators during
wall and ceiling applications, varied significantly during dry applications (P<0.01). The respirable dust air samples
collected in attic areas, hopper areas during attic applications, and hopper areas during wall and ceiling applications
also differed significantly during dry applications (P=0.03).
Twenty-three workers participated in the medical phase of the investigation. The workers completed medical and
work history questionnaires, performed serial peak flow tests, and completed multiple acute symptom surveys. The
medical questionnaires indicated respiratory, nasal, and skin symptoms that employees attributed to CI exposure. The
most common symptoms reported while working with CI included nasal symptoms (35%), eye symptoms (35%), and
morning phlegm production (25%). There was a temporal association between CI exposure and eye symptoms, but
there was little evidence of lower respiratory system health conditions associated with CI exposure.
CONCLUSIONS
Chemical analyses of the four bulk CI samples revealed only minor differences in additives. The major elemental
components detected were aluminum, boron, calcium, sodium, and sulfur, but they were attributed to the fire
retardants aluminum sulfate, boric acid, and sodium sulfate. For all four CI samples, less than 0.1% by weight was
collected as the small respirable particle fraction. The fractions consisted mainly of fire retardants and smaller
quantities of clays and did not contain cellulose material. Intratracheal instillation of the respirable fraction in rats
produced minimal to mild inflammatory responses in the lungs with no increase in severity by 28 days after dosage.
Although a significant increase in lung collagen was detected at day 28 in treated rats, microscopic evaluation
revealed only a minimal to mild increase in collagen fibrils associated with granulomatous nodules.
The results of these studies indicated that few respirable particles or fibers are generated during the aerosolization of
CI, and that even at very high doses of respirable CI particles, acute pulmonary toxicity is minimal.
These results are supported by the NIOSH workplace exposure assessment conducted on CI workers. Based on the
air sample data collected from the 10 contractor site visits, there is a potential for overexposure to CI; however,
respirable dust concentrations were typically low. There was increased potential for 8-hour TWAs exceeding the

10 Cellulose Insulation, NTP TOX 74
OSHA PEL for total and respirable dust when employees were involved in CI application activities for longer periods
of time. There was evidence of work-related eye and mucous membrane irritation among some workers, which were
possibly caused by the additives present in CI, such as boric acid. There was little evidence of lower respiratory
system health conditions associated with CI exposure.
Based upon the results of the CI chemical characterization studies, the pulmonary toxicity study, and the worksite
exposure assessment, the NTP concluded that additional studies of CI in laboratory animals are not warranted at this
time. However, the animal pulmonary toxicity studies and worker health surveys focused on acute CI exposures and
do not preclude the possibility of toxicity resulting from chronic exposure. Although exposure concentrations of
respirable CI particulate matter were low, additional information is needed on the biodurability and reactivity of CI
particles and fibers in the respiratory tract. CI should continue to be regarded as a nuisance dust, and workers should
continue to wear protective masks to prevent inhalation exposure to CI dusts.

11
INTRODUCTION
STUDY RATIONALE
Cellulose insulation (CI) was nominated to the National Toxicology Program (NTP) in 1994 for a comprehensive
toxicologic evaluation including long-term inhalation bioassay. The nomination was based upon the potential for
widespread human exposure, promotion of CI as a safe alternative to asbestos, and the lack of data on the potential
carcinogenicity of CI. After reviewing the available data on CI, the NTP study design team identified two major data
gaps that needed to be addressed in order to determine if chronic CI dust inhalation studies were technologically
feasible and to determine if animal studies were warranted. Information was needed on the chemical and physical
characteristics of CI and on the variability in composition between CI products. Because CI is a complex mixture
containing a number of proprietary additives, the variability in chemical composition of CI from different
manufacturers was unknown. In addition, little information was available concerning the physical characteristics of
CI particulates. During an aerosol exposure, the dose, or amount of particulate reaching the lung, is dependent upon
particle size. The greatest concern is for particles small enough to reach the deep lung (respirable particles). In
addition, the shape of the particle (fibrous, nonfibrous) can influence deposition and toxicity. The amounts of
respirable fibrous and nonfibrous particulates are different in CI from different manufacturers because of differences
in production methods.
Although there is potential for widespread human exposure, CI applicators would receive the greatest exposure.
Little information was available on the exposure concentrations or the chemical and physical characteristics of CI
aerosol to which workers are exposed, and no information was available to indicate that there are adverse health
effects for workers using CI.
The NTP study design team recommended that initial studies be conducted to obtain data on the chemical and
physical characteristics of CI and to conduct an exposure assessment for CI applicators. These data were obtained
through the collaborative efforts of the National Institute of Environmental Health Sciences (NIEHS) and the
National Institute for Occupational Safety and Health (NIOSH), two member agencies of the NTP. Because of its
extensive experience in conducting exposure assessments, NIOSH provided worksite exposure assessments,
evaluated the chemical and physical characteristics of CI particulates in the workplace, and evaluated health
information on CI workers. NIEHS developed and tested a CI aerosol generation system and evaluated the chemical
and physical characteristics of bulk CI and CI aerosols from four major manufacturers. This work was conducted
through NTP chemical support contracts. The collaborative efforts between NTP agencies resulted in a more
comprehensive evaluation of the potential toxicity of CI.

12 Cellulose Insulation, NTP TOX 74
CHEMICAL AND PHYSICAL PROPERTIES
CI is a type of thermal insulation produced primarily from recycled newspapers and sometimes from other uncoated
paper products and wood chips. The newspapers are shredded and milled to obtain a homogeneous light-density
material. Because paper is flammable, the material is treated with fire-retardant chemicals to about 20% to 25%
loading. The composition of CI products varies depending on the chemicals the manufacturer selects to improve fire-
retardant and settling properties. The primary fire retardants used are ammonium sulfate, boric acid, borax, and other
borates. The fire-retardant chemicals are finely ground to more readily disperse into the CI and may be applied wet
or dry. The finished product may also contain buffers (e.g., gypsum), residuals of the paper production process (e.g.,
sodium hydroxide, sodium sulfide, formaldehyde, chlorine, fluorine, lead, iron, sulfur compounds), and remnants of
dyes, resins, gums, talc, printing inks, and various solvents (Davis, 1993; Lea, 1995). The chemical composition and
the physical form of CI are significantly different from pure cellulose and other cellulose compounds. Pure cellulose
is a white, solid polysaccharide and is a component of plant fiber (Merck Index, 1996). Cotton is the purest natural
form, and rayon is regenerated cellulose.
Kelman et al. (1999) conducted a preliminary study of the chemical composition of several samples of insulation
currently in use. Headspace air (90° C) and methylene chloride extracts of CI contained traces of aliphatic and
aromatic hydrocarbons and higher aldehydes. No formaldehyde was detected. The CI was composed of
approximately 98% paper fiber and 2% gelatinized starch with detectable levels of the fire retardants boron and
sodium. By weight, approximately 0.01% of the CI was present as a fine dust of cellulose origin. About 13% of
these small particles were fibers (aspect ratio $3:1). Most of these fibers were greater than 2 µm wide and 10 to
20 µm long.
Performance Standards
In 1978, to ensure the safety of CI, the Consumer Product Safety Commission (CPSC) issued performance standards
that are mandatory for all manufacturers (Chrenka, 1980). These standards required that all CI produced after
September 7, 1978, pass flammability and corrosiveness tests as specified in the General Services Administration
standard HH-I-515-C, which mandates performance of CI products purchased by government agencies. There are
also two standard specifications issued by the American Society for Testing and Materials (ASTM, 1991, 1997)
pertaining to CI. Both ASTM standards address density, thermal resistance, smoldering combustion, fungal
resistance, corrosion, moisture vapor absorption, and odor.
PRODUCTION, USE, AND HUMAN EXPOSURE
Production and Producers
CI is manufactured from cellulosic materials generally derived from recycled newspapers. Coated paper and fine
paper are best avoided because coatings and smooth surface textures resist fire-retardant chemicals (Zicherman and

13 Cellulose Insulation, NTP TOX 74
Fisher, 1978; Chrenka, 1980; Barton et al., 1981; McConnell, 1994). The recycled paper is processed to gain the
proper consistency. Today, CI manufacturers use rotating disks (light density mill, AFT ringer, or Haybuster) to
produce a light-density product of about 1.5 to 1.8 lbs/ft3. This method does not crush the fibers and brings the paper
back to the pulp state, unlike previous methods (Lea, 1995). In the 1970s, CI manufacturing used the hammer mill
technology to produce insulation with a density of about 2 lbs/ft3 or more. In a typical hammer mill operation, raw
materials were first sorted then conveyed into mills that preshredded and pulverized the materials into a fibrous,
reasonably homogeneous bulk material. In the shredder, which had either fixed or swinging rotary hammers,
material was forced out through a mill screen with approximately 3-inch openings. The shredded paper was then
pneumatically moved into an intermediate mill where it was forced through a smaller mill screen. After leaving the
intermediate mill, the material was fed into a holding bin that was used to achieve a uniform feed rate to the next,
and final, mill. In the final mill, the material was forced through a mill screen with about ¼-inch openings.
Chemicals with fire-retardant properties, typically boric acid, borax, and aluminum trihydrate, were introduced
simultaneously at 20% to 25%, loading with the ground paper to achieve flame retardancy. Prior to being added at
this stage, the chemicals were blended, proportioned, and finely ground in order to disperse into the fiber more
readily. In the final stage of the process, the finished product was conveyed to a bagging unit for packaging and then
to a dust collector (Zicherman and Fisher, 1978; Chrenka, 1980; Lea, 1995).
Several leading brands of CI are manufactured primarily from recycled newspaper that has been treated with borax
and boric acid (Sinanoglu, 1994). One United States company patented a method of making fire-resistant CI
consisting of finely divided cellulose mixed with talc (5% to 25% by weight), the option of boron compounds (up to
10% by weight), and other additives (Bird et al., 1980). According to the Cellulose Insulation Manufacturers
Association (CIMA), talc is not currently used in the manufacture of CI (Lea, 1995).
Prior to the mid-1970s, there were roughly 100 firms manufacturing CI. Between 1975 and 1976, the demand for
insulation heightened because of new energy efficiency awareness, and a surge of companies began producing CI.
By the end of 1977, there were approximately 950 manufacturers. The number of CI manufacturers dropped to fewer
than 450 firms in 1978, 200 in 1980, and 169 in 1983 (Anonymous, 1980a, 1984; Chrenka, 1980). In 1991, there
were about 100 CI manufacturers (Anonymous, 1991). CIMA estimates that there are approximately 50 companies
that presently manufacture CI (Lea, 1995).
Production levels are difficult to obtain because many of the CI producers are small enterprises and are not required
to report production volumes. The estimated production capacity of cellulose loose-fill insulation was 2.4 million
tons in 1980 (Neisel and Verschoor, 1981). According to an industry survey, CI manufacturing sales fell from
$39.4 million in 1982 to $36.3 million in 1983 as production declined from 689,000 tons to 634,000 tons
(Anonymous, 1984). The best available data indicate that CI production is presently between 270,000 and
420,000 tons per year (McConnell, 1994).

14 Cellulose Insulation, NTP TOX 74
CI manufacturing accounted for 14% of waste newspaper consumption in 1977 and 24% in 1980 (Barton et al.,
1981). In 1979, CI manufacturers consumed an estimated 646,000 tons of old newspaper (Anonymous, 1980b). A
report on the markets for waste newspaper in four South Atlantic states found that CI producers in Georgia consumed
78,200 tons of newspapers in 1980 compared with 14,700 tons in Florida and a combined 18,300 tons in North
Carolina and South Carolina (Barton et al., 1981).
CI accounted for 20% of the entire building insulation market in 1975, 20% to 25% in 1978, and 15% to 20% shortly
afterwards. Relative demand for CI in 1975 was 10% for industrial equipment and pipes and 90% for building
construction (10% for new residential construction, 75% for reinsulation and remodeling, and 5% for
commercial/industrial construction) (ICF, Inc., 1977; Anonymous, 1981; Barton et al., 1981). In 1979, CI
manufactured by Diversified Insulation in the United Kingdom accounted for 40% of the United States insulation
market (Anonymous, 1979). However, demand for CI has declined since the 1970s. CI accounted for only 10% of
the insulation market for single-family residential homes in 1991 and 1993 (Anonymous, 1991).
Use and Human Exposure
Although patents for CI were issued in the 1800s, the product did not find a firm foundation in the marketplace until
the 1950s. Since that time, it has been one of the principal thermal insulations used in retrofitting (i.e., adding thermal
insulation) private homes, small, multiple-dwelling units, and, to a limited extent, new construction. The utility of
CI is based on the ability of cellulose to trap air both between fibers and within fibers, creating its excellent insulating
quality. CI is more economical than other types of thermal insulation because it is more efficient. It can also reach
more areas than other insulation materials because of its blown application process (Anonymous, 1977; Zicherman
and Fisher, 1978; Chrenka, 1980; Sinanoglu, 1994). See Erratum
The most common method of applying CI is blowing it into new or existing structures. It is normally applied in attics
using an open blowing process and into sidewalls and retrofit situations using a closed blowing process. CI can also
be applied by pouring it out of a bag between and over attic joists. Contractors install CI into existing exterior walls
by drilling holes in siding materials between wall studs and blowing the insulation into the wall cavities (Anonymous,
1977; Zicherman and Fisher, 1978; Davis, 1993; McConnell, 1994). “Stabilized” CI can be applied with a spray gun.
“Stabilized Cellulose” is a form of CI that is mixed with a water-based adhesive and a small amount of water, which
stabilizes the applied depth of the CI. The water also assists in securing it between wall studs. Spray-applied CI has
been used to cover and protect from existing asbestos-containing insulation (Cohn, 1981). It can also be installed on
complex surfaces and substrates (e.g., barrel vaults, corrugated decks, concrete “T”s or pans, flat surfaces, wood,
concrete, metal, sheetrock, plaster, etc.) and can be used in new construction and renovation. The thickness of the
finished product can be altered to provide different levels of thermal or acoustical performance (Anonymous, 1990).
soward
Cross-Out

15 Cellulose Insulation, NTP TOX 74
Between 1975 and 1980, one in eight homeowners insulated their homes with CI. During this same period, federally
funded weatherization programs insulated homes of low-income families using CI almost exclusively (Chrenka,
1980). A survey by the CPSC in 1978 estimated that 3 million houses had CI installed between January 1976 and
September 1978 (Levin and Purdom, 1983).
REGULATION
CI is considered a “nuisance dust” and is classified by the American Conference of Governmental Industrial
Hygienists (ACGIH, 1991) as a particulate not otherwise classified (PNOC) and by the Occupational Safety and
Health Administration (OSHA) as a particulate not otherwise regulated (PNOR). Nuisance dusts have been defined
as dusts that have little adverse effect on the lungs and, when maintained under reasonable control, do not result in
significant organic disease or toxic effect. However, in sufficient quantities, any dust will elicit some cellular
response in the lung. The lung tissue reaction caused by the inhalation of PNOCs has the following characteristics:
the architecture of the air spaces remains intact; collagen (scar tissue) is not synthesized to a significant extent; and
the tissue reaction is potentially reversible.
Extreme concentrations of PNOCs in the workplace air may cause a serious reduction in visibility or unpleasant
deposits in the eyes, ears, and nasal passages. PNOCs may also contribute to skin or mucous membrane injury by
chemical or physical actions or by the rigorous skin cleansing procedures necessary for their removal.
The OSHA permissible exposure limit (PEL) for PNORs is 15 mg/m3 for total dust and 5 mg/m3 for respirable dust.
Although a NIOSH recommended exposure limit (REL) for particulates has not been established, after reviewing
available published literature, NIOSH provided comments to OSHA on August 1, 1988, regarding the “Proposed
Rule on Air Contaminants” (29 CFR 1910). In these comments, NIOSH questioned whether the proposed OSHA
PEL of an 8-hour time weighted average (TWA) of 10 mg/m3 for PNORs (defined as total dust in this report) was
adequate to protect workers from recognized health hazards.
ACGIH (2003) recommends a total dust 8-hour threshold limit value (TLV)-TWA of 10 mg/m3 for inhalable PNOCs
containing no asbestos and less than 1% crystalline silica and 3 mg/m3 for respirable dust. For substances such as
PNOCs without a short-term exposure limit (a 15 minute TWA, which cannot be exceeded at any time during the
workday), ACGIH recommends an excursion limit. Excursions in worker exposure levels may exceed three times
the TLV-TWA for no more than 30 minutes during an 8-hour workday. Excursions in worker exposure levels should
never exceed 5 times the TLV-TWA.

16 Cellulose Insulation, NTP TOX 74
TOXICITY AND CARCINOGENICITY
Experimental Animals
The toxicity of cellulose has been studied in animals using forms from pure microcrystalline cellulose (Adamson
et al., 1999) to wood (Tatrai et al., 1995) and soft paper dust (Ericsson et al., 1988; Järvholm et al., 1988).
Unfortunately, the toxicity of cellulose is highly dependent upon the form studied, so one cannot extrapolate from
studies using other forms of cellulose. Only one animal inhalation study of CI has been reported. Hadley et al.
(1992) exposed male and female Wistar rats by nose-only inhalation to 100, 500, or 2,000 mg/m3 of Thermolite® CI
for 6 hours per day, 5 days per week, for 21 exposures. Diffuse macrophage infiltration, microgranuloma formation,
alveolitis, and epithelial hyperplasia were observed in the lungs of all treated rats. The severity of this effect
increased with the exposure concentration. The authors stated that, because these effects were observed after short-
term exposure to dust levels that were within an order of magnitude of reported work place exposures, human
exposure to CI should be minimized. However, the CI exposures in this study were not representative of workplace
exposures to CI. The Thermolite® CI was preprocessed in order to increase the amount of respirable material to
between 38% and 47% rat respirable particles (mass median aerodynamic diameter #3 µm). Exposing animals to
high concentrations of CI containing up to 47% respirable particles results in lung burdens that inhibit lung clearance
mechanisms and cause an inflammatory response.
Adamson et al. (1999) compared the pulmonary effects of CI, bleached cellulose, and microcrystalline cotton
cellulose following intratracheal instillation in male Fischer rats. Rats were given four consecutive daily instillations
of presized particulate for total doses of 0, 0.25, 1.0, and 4.0 mg/animal. Animals were evaluated up to 90 days after
treatment. Evidence of a transient pulmonary inflammation characterized by neutrophil and leukocyte infiltration
was observed at the highest doses of CI, bleached cellulose, and microcrystalline cotton cellulose, with CI causing
the greatest effect. The authors concluded that these cellulose materials behaved in a manner consistent with that of
other poorly soluble particulates, and the inflammatory effects at the highest doses were likely confounded by
impairment of clearance.
Humans
No epidemiological studies investigating the association of exposure to CI and respiratory disease in humans were
identified in the published medical literature. One case report postulates that inhalation of CI may result in
pulmonary alveolar proteinosis. McDonald et al. (2000) report the development of this disorder after exposure to
household dust from a ventilation system. The dust contained cellulose fire-resistant fibrous insulation material. The
affected individual showed symptomatic improvement once exposure to the insulation material ceased.
Two NIOSH investigations and a German study have documented occupational exposure to CI. A 1984 NIOSH
investigation of health problems among personnel working with various insulating materials used for weatherization
of homes found that concentrations of total particulate exceeded the ACGIH-recommended TLV and the OSHA PEL.
17 Cellulose Insulation, NTP TOX 74
The bulk of the material composing the CI would be considered nuisance dust. The highest concentrations were
present in personal samples collected while blowing cellulose into attic areas, with 8-hour TWAs of 20.8 and
34.5 mg/m3 found at the two different sites monitored. Concentrations were significantly lower when blowing
insulation in outside walls (5.2 mg/m3) and when loading the hopper off the back of the weatherization truck
(4.3 g/m3). The respirable fraction and further characterization of the particulate were not measured. The NIOSH
investigators noted that all personnel working at these activities were wearing Mine Safety and Health
Association/NIOSH-approved respiratory protection, which, if properly used and fitted, should have greatly reduced
the actual exposure (NIOSH, 1985).
A 1990 NIOSH evaluation of asbestos exposure during low-income housing weatherization procedures documented
high levels of dusts and cellulose fibers associated with CI installation. These short term exposures included levels
of 2.2 to 4.6 mg/m3 for workers blowing insulation in holes in walls, 13.4 mg/m3 for a worker feeding bags of CI into
the hopper, and more than 40.8 mg/m3 for a worker blowing insulation inside an attic. The respirable fraction was
not measured and further characterization of the particulate was not conducted. The investigators noted that company
policy required workers to wear a half-mask respirator with a combination high efficiency particulate arrestor
(HEPA)/organic vapor cartridge when spraying CI or when entering an attic, a crawl space, or knee wall (NIOSH,
1990; Tharr, 1991). Therefore, workers adhering to the respirator policy should have minimal respiratory exposure
to cellulose particulates.
A German study investigated fibrous dust emission from CI (Isofloc®) during installation and use. In all
measurements, a large increase in fiber and dust exposure was noted with increasing time of exposure during
installation. The tests were conducted primarily during the beginning of the installation phase and up to 2.5 hours
into the installation phase. During insulation of a wooden floor, the German TLV for respirable dust of 6 mg/m3 was
exceeded. The investigators noted that the manufacturer of the insulation permits the installation of its products only
by specialty firms and encourages them to use masks and respirators (Tiesler and Schnitteger, 1992). A response to
the investigation further pointed out that the CI investigated in the study is used primarily in the interior of air-tight
hollow spaces. In addition, the technical information and training provided to the installers of these air-tight layers
further precludes any dust exposure to the occupants (Welteke, 1993).
Although direct effects of CI on human health have not been studied, cellulose particles from other sources have been
associated with the formation of foreign body granulomas in humans. Zeltner et al. (1982) reported a fatal case of
pulmonary granulomatosis in a male drug abuser caused by illicit intravenous injections of microscopic cellulose, a
binding agent in pentazocine tablets. Brittan et al. (1984) described a case of cellulose granulomatous peritonitis in
a woman that was ascribed to cellulose contamination during a previous surgery. Within the giant cells and necrotic
debris, there were numerous hollow fibers of varying length with the characteristic morphological features of
vegetable cellulose fibers.

18 Cellulose Insulation, NTP TOX 74
Although there are no occupational health studies of CI workers, a Swedish team reported adverse health outcomes
in a soft paper mill. The odds ratios for mortality from chronic obstructive pulmonary disease and from asthma
among exposed workers were significantly elevated (Thoren et al., 1989). A morbidity study found dose-related
irritation of the upper respiratory tract. A decrease in vital capacity of the lung was associated with long-term
exposure to dust (Järvholm et al., 1988). Heederik et al. (1987) found lower FEV1 in workers exposed to paper mill
dust than in unexposed workers.
On two different occasions, NIOSH (1985, 1990) evaluated CI exposures of employees who weatherize homes. The
first evaluation involved a weatherization company that applied CI in an attic and outside walls. The 8-hour TWAs
were as follows: 20.6 and 34.5 mg/m3 for the installers in the attic, 5.2 mg/m3 for the installers at the outside walls,
and 0.9 mg/m3 and 4.3 mg/m3 for the hopper operator. Employees wore NIOSH-approved half-mask respirators with
cartridges for dusts, fumes, and mist while blowing CI into attics, and they wore disposable dust masks while loading
CI into the hopper. The second evaluation was another weatherization program involved with reducing the energy
consumption of low-income housing. Personal breathing zone air samples were collected for total dust during CI
application activities and resulted in the following air sample concentrations: 4.6 mg/m3 for the employee applying
CI into walls, 13.8 g/m3 for the employee trying to get the hopper running, 2.2 mg/m3 for the other employee working
on the hopper, 4.3 mg/m3 for the hopper operator, and 40.8 mg/m3 for the installer in the attic. All the employees
wore half-mask respirators with HEPA/organic vapor cartridges.

19
EVALUATION OF THE CHEMICAL COMPOSITION, PARTICLE SIZE, AND PULMONARY TOXICITY
OF CELLULOSE INSULATION
In order to conduct relevant inhalation studies of cellulose insulation (CI) in animals, the CI test material must be
representative of that used in the workplace. However, insufficient data are available on the chemical composition
and variability of CI from different manufacturers. NTP studies were conducted to characterize the fiber and particle
size distribution in CI samples from four major United States manufacturers. CI samples were acquired with the
assistance of the Cellulose Insulation Manufacturers Association (CIMA). These studies were designed to provide
information about fibrous and nonfibrous particulates as well as how much of the CI is potentially respirable. In
addition, chemical analyses were performed on these four CI samples to determine the chemical identity and relative
concentration of major inorganic additives, the relative concentrations of inorganic trace element impurities, and the
identity and relative concentrations of organic materials. These studies were designed to provide information on the
presence of potentially toxic chemicals and to evaluate the variability between products from different
manufacturers.
To measure acute pulmonary toxicity, the respirable fraction from one of the four samples was administered to
Fischer 344 rats by intratracheal instillation. Toxicity endpoints were evaluated over 28 days and compared with the
effects of the same dose of titanium dioxide, a relatively inert particle. This information is needed in order to
determine the feasibility of conducting inhalation toxicity studies in animals at CI concentrations that are relevant to
human exposures.
MATERIALS AND METHODS
CHEMICAL CHARACTERIZATION STUDIES
Chemicals
Bulk CI samples from four major United States manufacturers were obtained with the assistance of the CIMA. For
proprietary reasons, the CI products were identified as Samples 1 to 4.
Inorganic Chemical Characterization
Elemental Analysis: Triplicate samples of each CI sample were weighed in Teflon® microwave digestion vessels and
digested with nitric acid. The digests were diluted with water and centrifuged to remove insoluble residue. The clear

20 Cellulose Insulation, NTP TOX 74
supernatants were analyzed for inorganic elements by inductively coupled plasma-atomic emission spectroscopy
(ICP-AES).
X-Ray Diffraction (XRD): The insoluble residue from each sample was dried and analyzed by XRD. XRD analysis
was used to obtain qualitative and semiquantitative identification of crystalline phases in the four CI samples.
Organic Chemical Characterization
CI samples were extracted with methylene chloride. The extracts were analyzed using gas chromatography with
flame ionization detection (GC-FID) and mass spectroscopy (GC-MS). The chromatographic profiles and relative
responses of the total organic material from each of the test sample extracts were compared.
Fractionation of Particulates by Inertia in an Air Stream
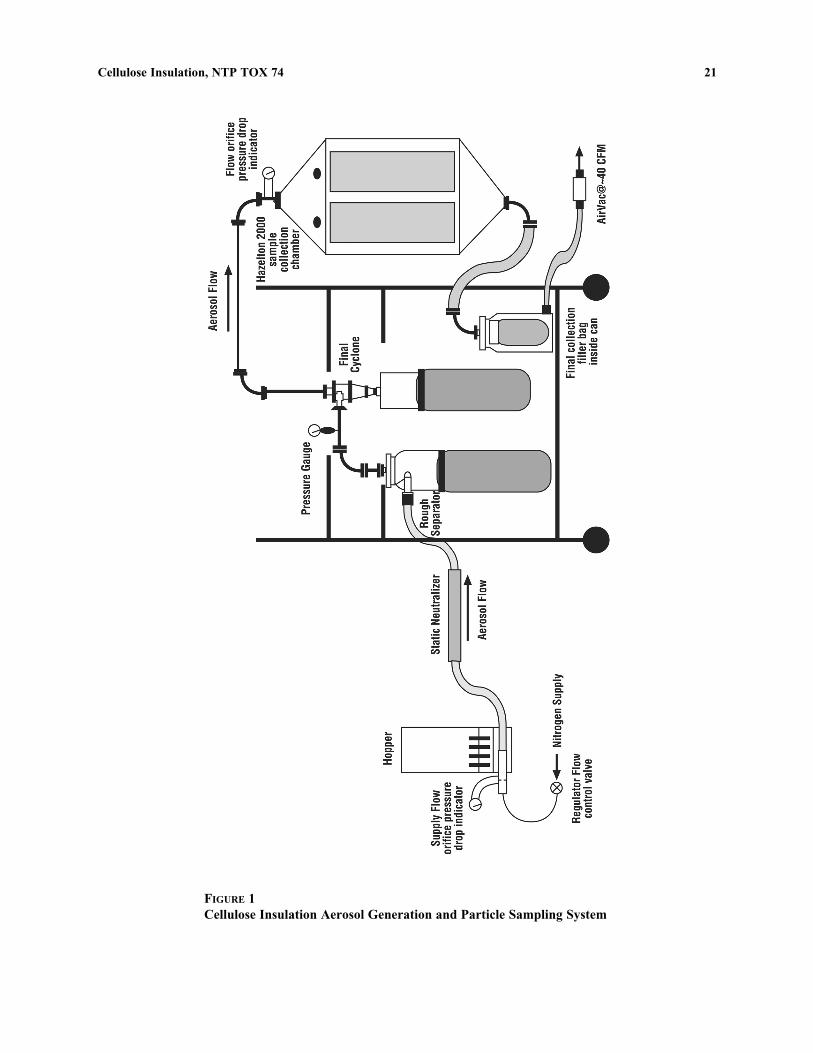
A test system was built to generate an aerosol and to fractionate the bulk CI (Figure 1). The test system included a
commercial insulation blower, a rough separator, a cyclone separator, a sampling chamber, and a membrane filter bag.
The bulk CI was placed in the hopper of the blower where agitator paddles broke the material into small pieces.
Agitator vanes at the bottom of the hopper pushed the small pieces into an airlock chamber where about 40 cfm of
nitrogen was used to carry the test material through a static charge neutralizer into the rough separator. The rough
separator was designed to collect at least 50% of particulates with aerodynamic diameters greater than or equal to
12 µm at a flow rate of 40 cfm. Particulates that passed through the rough separator entered the cyclone, which was
designed to allow at least 75% of particulates with aerodynamic diameters less than 10 µm to pass into the sampling
chamber. Neither the rough separator nor the cyclone removes fibers that are considered to have a high potential risk
to human health.
Individual plastic collection bags at the ends of both the rough separator and the cyclone allowed weighing of
collected material. The majority of particulates with aerodynamic diameters less than 10 µm penetrate the cyclone
to the sampling chamber where filter samples (0.2 µm pore size) were taken for various analyses. Particulates in the
aerosol leaving the sampling chamber were collected downstream in a filter bag. All collection bags were weighed
before and after each experiment to determine the fraction in each size range. After weighing the filter bags, the
collected materials were transferred to tared Teflon®-coated filters and weighed again. During each test run, filter
samples were taken from the sampling chamber to determine aerosol concentration and estimate size distribution.
The aerosol concentration was determined by collecting duplicate samples at known flow rates (8.9 L/minute) for the
duration of each test run. Duplicate samples for size distribution analysis using scanning electron microscopy (SEM)
were taken at 0.5 L/minute for 4 minutes.
21 Cellulose Insulation, NTP TOX 74
FIGURE 1Cellulose Insulation Aerosol Generation and Particle Sampling System

22 Cellulose Insulation, NTP TOX 74
Particulate Counting and Size Distribution Analysis
The size distribution of particulates collected in the cyclone collection bag was determined to evaluate the amount of
respirable fibers that were collected in the cyclone separator. Samples were prepared for SEM by dispersing a small
amount of this material onto a glass slide. Slides were turned upside down to remove large particles and clusters.
Particle size distribution was analyzed by SEM using one slide from each test sample. Another filter sample from
each test sample was taken from the sampling chamber and analyzed using SEM to determine number, concentration,
and size distribution of the collected particles. Micrographs of 20 randomly selected fields per sample were digitized
and saved as image files. Using commercial software, an image was randomly selected to determine number and size
distribution of total particulates (both fibrous and nonfibrous particulates) for each sample. At least 100 particles per
sample were measured.
Micrographs of filters were examined by electron microscopy to determine the number and size distribution of fibers
in the sampling chamber. For Samples 1, 2, and 3, all 20 fields (2,000×) of each filter from the sample chamber were
examined for size distribution of fibrous particulates. Because Sample 4 had a very low particle population, six fields
were examined at 500× (equivalent to 96 fields at 2,000×). Micrographs of filters were examined using commercial
software to determine the number and size distribution of fibers. This software requires manual identification of
fibers and manual tracking of length and width. Only particulates with lengths greater than 5 µm, widths less than
or equal to 3 µm, and aspect ratios (length to width) greater than or equal to 3 µm were counted as fibers. Additional
counting rules stated in NIOSH Method 7400 were followed (NIOSH, 1994). For a fiber of 3 µm diameter to have
an aerodynamic diameter of 12 µm, the length must be greater than 30 µm; for a 1 µm diameter fiber, the length
would be much greater than 100 µm, assuming the specific gravity of the fiber is 1 (Baron, 1993).
The collection efficiencies of the rough separator and the cyclone separator were not experimentally validated
because of the unavailability of monodisperse fibers of known sizes. In addition, the measurement protocol for fibers
that penetrated the cyclone separator excluded fibers substantially larger (>>10 µm) than the design cutoff (about
12 µm). The fraction of small particles that deposited in the rough separator or cyclone separator instead of in the
final filter was not determined. Therefore, the chamber concentration data were biased downward by the unknown
number of small particles collected in the first two stages.
ANIMAL STUDIES
Animals
Male Fischer 344 rats (Charles River Breeding Laboratory, Raleigh, NC) weighing 180 to 200 g (42 to 48 days old)
were acclimated for 10 to 14 days after arrival. During acclimation, rats were randomized into treatment groups, five
rats per group. Animals were provided NIH-07 diet and tap water ad libitum throughout the study.

23 Cellulose Insulation, NTP TOX 74
Treatment
The respirable fraction of Sample 2 was administered by intratracheal instillation to lightly anesthetized (isoflurane)
male Fischer 344 rats (8 weeks old). Only Sample 2 contained sufficient respirable material for the intratracheal
instillation study. The CI was suspended in sterile saline, and the dosing volume was 0.15 mL/100 g body weight.
An initial range-finding study was conducted by instilling saline containing 0, 0.625, 1.25, 2.5, 5, 10, or 20 mg CI/kg
body weight. Bronchoalveolar lavage (BAL) fluids parameters were evaluated 3 days later. Based upon results of
the range-finding study, 5 mg CI/kg body weight was selected as the dose to be used in the 28-day study.
In the 28-day study, rats were instilled with either saline (vehicle controls), 5 mg titanium dioxide/kg body weight
suspended in saline (particle controls), or 5 mg CI/kg body weight suspended in saline (respirable fraction). Five rats
per treatment group were euthanized (intraperitoneal Nembutal) 1, 3, 7, 14, and 28 days after instillation.
Histology
At 14 and 28 days after dosing, five rats per treatment group were weighed then euthanized. Lungs were weighed,
then infused with 10% neutral-buffered formalin. Paraffin-embedded sections were stained with Masson’s trichrome
and evaluated by light microscopy. Wet weights were recorded for liver, kidney, and spleen.
Bronchoalveolar Lavage
At 1, 3, 7, 14, and 28 days after instillation, five rats per treatment group were euthanized, and their lungs were
lavaged in situ three times with 10 mL cold calcium- and magnesium-free Hanks balanced salts solution. The BAL
fluids were centrifuged (10 minutes, 2,000 rpm, 4° C), and the cell pellets were combined for total and differential
cell counts. The cell-free supernatant of the first BAL fluid fraction was used for lactate dehydrogenase (LDH) and
protein measurements.
BAL Fluid Cell Counts
The BAL fluid cell pellets were suspended in 5 mL of balanced salts solution, and the total number of white cells
was determined using a Coulter counter. The cells were differentiated on cyto-centrifuge preparations fixed in
methanol and stained with Diff-Quik. Differential counts were based on 300 cells per animal.
Biochemical Analyses
The first cell-free lavage fraction was analyzed for LDH activity and total protein (Bio-Rad) using an automated
system (Monarch 2000, Laboratory Instrumentation, Lexington, MA). After collecting BAL fluid, lung tissue
samples from all the rats were collected and analyzed for 4-hydroxyproline (Woessner, 1961).
Statistics
Data were analyzed for statistically significant differences by one-way analyses of variance and Duncan’s multiple
comparison test (Sokal and Rohlf, 1981).

24 Cellulose Insulation, NTP TOX 74
RESULTS CHEMICAL CHARACTERIZATION STUDIES
Inorganic Chemical Characterization
Elemental Analysis: Elements that were consistently present in all bulk samples of CI in quantities greater than about
0.1% by weight included aluminum, boron, calcium, sodium, and sulfur (Table 1). Samples 1 and 4 contained higher
boron and sodium concentrations, and Samples 2 and 3 contained higher concentrations of aluminum and calcium.
All four samples contained sulfur concentrations greater than 1%. Mean concentrations of beryllium, cadmium,
cobalt, chromium, potassium, molybdenum, nickel, lead, antimony, and selenium were below the quantifiable limits
in all four samples.
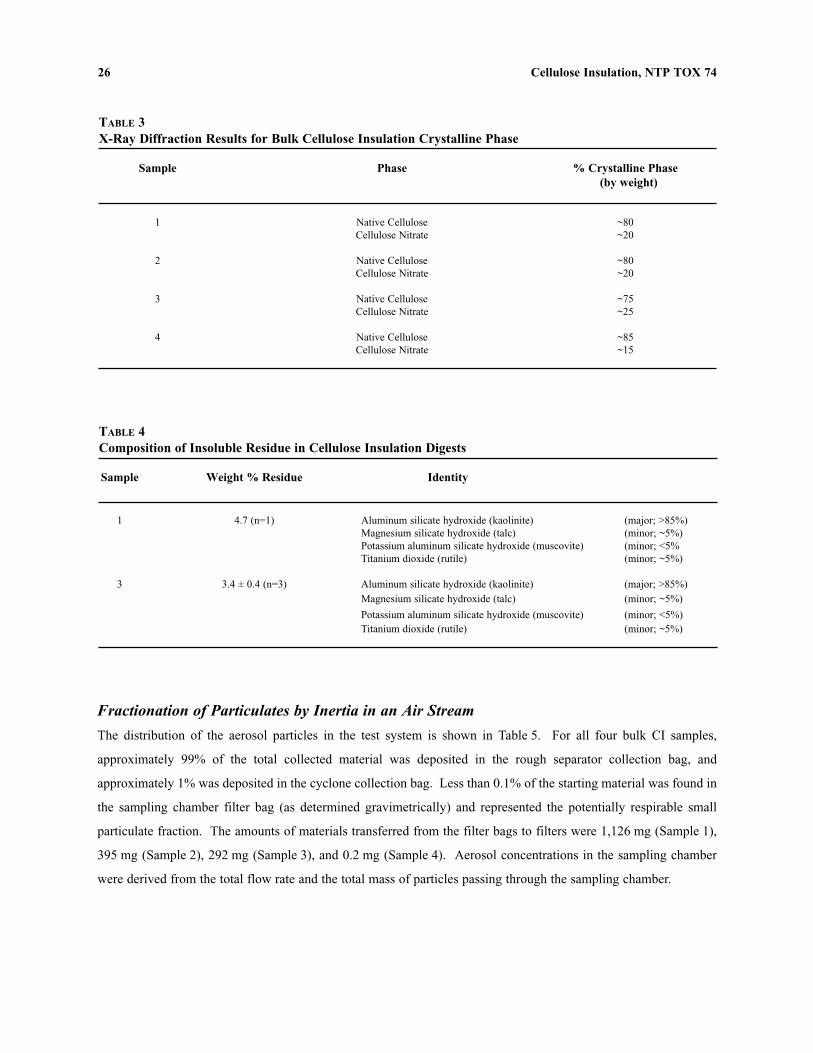
X-Ray Diffraction (XRD): XRD analyses indicated that the compositions of all four CI samples were similar. The
compositions were primarily amorphous (60% to 65% by volume), with crystalline phases comprising the remaining
fractions (35% to 40% by volume) (Table 2). The composition of the crystalline fraction was also very similar for
all four CI samples (Table 3). The crystalline fraction was primarily composed of native cellulose (75% to 85% by
weight), with a smaller amount of cellulose nitrate (15% to 25% by weight).
The composition of the insoluble residue that remained in the digested test material was determined for Samples 1
and 3 (Table 4). The relative amounts and compositions of the residue were remarkably similar in the two samples
analyzed. The insoluble residue comprised approximately 3% to 5% of the original sample’s weight and was
composed primarily of aluminum silicate hydroxide (kaolinite, ~85%), with smaller quantities (<5% each) of
magnesium silicate hydroxide (talc), potassium aluminum silicate hydroxide (muscovite), and titanium dioxide
(rutile).
Organic Chemical Characterization
In general, the organic material found in the extracts was represented as a mass of poorly resolved peaks with some
prevalent compounds present as resolved peaks in the GC-FID chromatograms (data not shown). The summed area
response for organic compounds was similar in all extracts with the exception of CI Sample 4, which contained
approximately six times the total FID response exhibited by the other three samples. Because of the very low
concentrations of organic compounds, identification and quantification of individual compounds in the extracts were
not performed.

25 Cellulose Insulation, NTP TOX 74
TABLE 1 Elemental Analysis of Bulk Cellulose Insulation
Cellulose Insulation Samplesa
Element 1 2 3 4
Aluminum 0.49 ± 0.04 0.52 ± 0.04 0.8 ± 0.1 0.4 ± 0.01 Antimony <0.004 <0.004 <0.004 <0.004 Arsenic <0.007 0.007 ± 0.001 0.008 ± 0.002 0.007 ± 0.001 Beryllium <0.00005 <0.00005 <0.00005 <0.00005 Boron 2.0 ± 0.1 0.52 ± 0.01 0.53 ± 0.005 1.37 ± 0.001 Cadmium <0.0005 <0.0005 <0.0005 <0.0005 Calcium 0.23 ± 0.03 0.33 ± 0.02 0.24 ± 0.02 0.11 ± 0.01 Chromium <0.001 <0.001 <0.001 <0.001 Cobalt <0.001 <0.001 <0.001 <0.001 Copper 0.0028 ± 0.0001 0.0023 ± 0.00006 0.0025 ± 0.00009 0.0020 ± 0.0002 Iron 0.033 ± 0.002 0.027 ± 0.01 0.031 ± 0.002 0.017 ± 0.003 Lead <0.005 <0.005 <0.005 <0.005 Magnesium 0.057 ± 0.001 0.027 ± 0.0006 0.022 ± 0.001 0.024 ± 0.0003 Manganese 0.0024 ± 0.0001 0.0032 ± 0.00003 0.0021 ± 0.00004 0.0029 ± 0.00003 Molybdenum <0.001 <0.001 <0.001 <0.001 Nickel <0.001 <0.001 <0.001 <0.001 Phosphorus <0.01 0.167 ± 0.003 0.042 ± 0.002 <0.01 Potassium <0.1 <0.1 <0.7 <0.1 Selenium <0.006 <0.006 <0.006 <0.006 Silicon 0.03 ± 0.01 0.026 ± 0.001 0.032 ± 0.003 0.037 ± 0.007 Sodium 2.12 ± 0.05 0.082 ± 0.001 0.12 ± 0.01 1.47 ± 0.015 Sulfur 1.43 ± 0.02 2.47 ± 0.04 2.81 ± 0.06 3.60 ± 0.10 Titanium 0.0077 ± 0.0007 0.0063 ± 0.0005 0.009 ± 0.001 0.007 ± 0.002
a Values expressed as percent by weight; mean ± standard deviation; n=3; less than (<) values are below the quantifiable limit for the ARL-3410 ICP-AES.
TABLE 2 X-Ray Diffraction Results for Bulk Cellulose Insulation
Sample Phase % Composition (by volume)
1 Crystalline Amorphous
~35 ~65
2 Crystalline Amorphous
~35 ~65
3 Crystalline Amorphous
~40 ~60
4 Crystalline Amorphous
~35 ~65
26 Cellulose Insulation, NTP TOX 74
TABLE 3 X-Ray Diffraction Results for Bulk Cellulose Insulation Crystalline Phase
Sample Phase % Crystalline Phase (by weight)
1 Native Cellulose Cellulose Nitrate
~80 ~20
2 Native Cellulose Cellulose Nitrate
~80 ~20
3 Native Cellulose Cellulose Nitrate
~75 ~25
4 Native Cellulose Cellulose Nitrate
~85 ~15
TABLE 4 Composition of Insoluble Residue in Cellulose Insulation Digests
Sample Weight % Residue Identity
1 4.7 (n=1) Aluminum silicate hydroxide (kaolinite) Magnesium silicate hydroxide (talc) Potassium aluminum silicate hydroxide (muscovite) Titanium dioxide (rutile)
(major; >85%) (minor; ~5%) (minor; <5% (minor; ~5%)
3 3.4 ± 0.4 (n=3) Aluminum silicate hydroxide (kaolinite)
Magnesium silicate hydroxide (talc)
Potassium aluminum silicate hydroxide (muscovite) Titanium dioxide (rutile)
(major; >85%)
(minor; ~5%)
(minor; <5%) (minor; ~5%)
Fractionation of Particulates by Inertia in an Air Stream
The distribution of the aerosol particles in the test system is shown in Table 5. For all four bulk CI samples,
approximately 99% of the total collected material was deposited in the rough separator collection bag, and
approximately 1% was deposited in the cyclone collection bag. Less than 0.1% of the starting material was found in
the sampling chamber filter bag (as determined gravimetrically) and represented the potentially respirable small
particulate fraction. The amounts of materials transferred from the filter bags to filters were 1,126 mg (Sample 1),
395 mg (Sample 2), 292 mg (Sample 3), and 0.2 mg (Sample 4). Aerosol concentrations in the sampling chamber
were derived from the total flow rate and the total mass of particles passing through the sampling chamber.

27 Cellulose Insulation, NTP TOX 74
TABLE 5 Distribution of Cellulose Insulation in the Test System
Amount Deposited in Collectors
Sample Mass Rough Cyclone Chamber Chamber Processed (kg) Separator (%)a (%)a Filter Bag Aerosol Concentrationb
(mg) (mg/m3)
1 13.6 98.7 1.3 8.3 × 10⁻⁵ 48.3 ± 9.9 2 14.1 99.0 1.0 2.8 × 10⁻⁵ 22.9 ± 0.2 3 14.2 99.1 0.9 2.1 × 10⁻⁵ 15.4 ± 0.2 4 8.6 99.5 0.5 2.3 × 10⁻⁸ 0.3 ± 0.1
a Values expressed as percent by weight
b Estimated from air flow rate through chamber and amount of particulate collected on filters
Particulate Counting and Size Distribution Analysis
The size distributions of total particulates collected from the cyclone separator collection bag and the sampling
chamber were determined. The mean equivalent diameters for particulates collected in the cyclone collection bag
ranged from 3.5 to 11.4 µm (Table 6). Most of the material collected in the cyclone was in crumbs (several mm in
diameter) and therefore not included in the size determination. The mean equivalent diameters for particulates
collected in the sampling chamber ranged from 0.6 to 0.7 µm. These measurements demonstrated a difference in
particle size distribution between samples collected from the cyclone and the sample chamber. Only one field from
each sample (2,000×) was examined for particulate size distribution because there were more than 100 particulates
on each field. The filter from the sampling chamber for Sample 4 had a very low particle population compared to
the other test samples.

28 Cellulose Insulation, NTP TOX 74
TABLE 6 Number and Size Distribution of Total Cellulose Insulation Particulates
Equivalent Diameter (µm)a
Sample Particle Countb Mean Standard Deviation Min Max
Cyclone Collector
1 136 6.8 3.93 0.7 23.0 2 434 3.5 4.02 0.4 27.5 3 286 7.5 6.54 0.9 52.6 4 196 11.4 9.91 0.7 64.4
Sampling Chamber
1 2,658 0.6 0.49 0.1 6.9 2 6,930 0.7 0.57 0.1 10.8 3 4,933 0.6 0.59 0.1 5.5 4 18 0.6 0.62 0.2 2.8
a The diameter of a circle having the same surface area as the target item
b Total particulates in one field at 2,000×
Fibers
Micrographs of filters were examined by electron microscopy to determine the number and size distribution of fibers
in the sampling chamber (Plates 1 through 4). The observed fibers were curved or twisted, nonuniform in diameter,
and had several branches, making it difficult to identify the endpoints of some fibers. Many fibers lay across the
boundary of the SEM field, and an additional image at different magnification (500×) was required to determine the
length of those fibers. All of these complications made it virtually impossible to automatically measure the size of
the cellulose fibers by computerized image analysis; therefore, the reported fiber width is the average width visually
estimated by the operator.
The size ranges of fibers found in the sampling chamber varied considerably; however, fibers from Sample 4 were
generally shorter and narrower than the other three CI samples (Table 7). The total number of fibers identified in the
examined fields ranged from 6 (Sample 4) to 172 (Sample 2) (Table 8). Based on these counts, the concentrations
of fibers in the air of the sampling chambers were estimated to be 5 (Sample 4), 146 (Sample 1), 538 (Sample 3),
and 847 (Sample 2) fibers/cc. The total number of fibers generated was estimated based on flow rate and sample
times, and these data were used to calculate the total number of fibers per gram of insulation. Sample 4 generated
considerably fewer fibers than the other samples.

c
29 Cellulose Insulation, NTP TOX 74
TABLE 7 Size Ranges of Fibers Found in the Sampling Chamber
Sample Length (µm) Width (µm) Aspect Ratioa
Number Max Min Max Min Max Min
1 33.3 5.2 2.4 0.2 35.2 3.9 2 53.5 5.0 2.9 0.2 56.3 3.3 3 29.1 5.0 2.9 0.2 91.1 4.3 4 18.5 7.7 1.2 0.6 18.2 11.7
a Ratio of length:width
TABLE 8 Number of Fibers in Samples from the Chamber
Sample Number Number of Fibersa Fibers/Filter Fibers/cc Air Total Fibersb Fibers/g Insulation
1 30 2.4 × 10⁵ 146 5.6 × 10⁹ 4.1 × 10⁵
2 172 1.4 × 10⁶ 847 1.9 × 10¹⁰ 1.4 × 10⁶
3 109 9.0 × 10⁵ 538 1.2 × 10¹⁰ 8.6 × 10⁵
c4 6 1.1 × 10⁴ 5 8.4 × 10⁷ 9.7 × 10³
a Total fiber counts in 20 fields at 2,000×
b Total number of fibers generated from cellulose insulation; estimated based on flow rate and sample time
Total fiber counts in six fields at 500× (equivalent to 96 fields at 2,000×)
Chemical Analysis of Respirable Particle Fractions
XRD analysis of the respirable particle fractions from CI Samples 1, 2, and 3 did not indicate the presence of any
cellulose material. These fractions consisted primarily of the fire retardants boric acid and sodium (ammonium
sulfate) with smaller quantities of clays such as kaolinite and muscovite (Table 9).
Nitric acid digests of the respirable particle fractions are shown in Table 10. Boron concentrations were relatively
high in the respirable fraction from Sample 1 but were low in Samples 2 and 3. The material from Sample 1 also
contained significantly more sodium than the other two samples. Sulfur concentrations were comparable in all three
samples. Concentrations of the toxic elements lead, cadmium, chromium, arsenic, and selenium were very low in all
of the CI samples tested.

30 Cellulose Insulation, NTP TOX 74
TABLE 9 X-Ray Diffraction Analysis of Nitric Acid Digests of Respirable Fractions
Sample Number Composition Phase % by Weight
1 Sassolite, B(OH)3 Thenardite, (Na2SO4) Sodium sulfate, Na2SO4 Kaolinite, Al2Si2O5 (OH)4
~65 ~20 ~15 < 5
2 Mascagnite (Na2SO4) Kaolinite, Al2Si2O5 (OH)4 Muscovite KAl2(Si3Al)O10(OH,F)2 Unidentified (11 peaks)
~55 ~15 ~10 ~20
3 Mascagnite (Na2SO4) Kaolinite, Al2Si2O5(OH)4 Muscovite KAl2(Si3Al)O
10(OH,F)2
Unidentified (11 peaks)
~45 ~25 ~10 ~20
The respirable fractions consisted primarily of fire retardants (boric acid and sodium or ammonium sulfate) together with smaller amounts of clays such as kaolinite and muscovite. Cellulose material was not detected. Sample 4 did not contain sufficient respirable material for analysis.
TABLE 10 Elemental Analysis of Respirable Fraction of Cellulose Insulation Samples
Cellulose Insulation Samplesa
Element 1 2 3
Aluminum 1.61 ± 0.08 3.5 ± 0.03 5.6 ± 0.4 Arsenic <0.02 0.029 ± 0.003 0.048 ± 0.003 Beryllium <0.0002 <0.0002 <0.0002 Boron 7.4 ± 0.3 0.024 ± 0.0005 0.019 ± 0.0005 Cadmium <0.003 <0.003 <0.003 Calcium 1.04 ± 0.04 3.24 ± 0.08 1.9 ± 0.1 Chromium <0.005 <0.005 <0.005 Cobalt <0.004 <0.004 <0.004 Copper 0.0095 ± 0.0002 0.0135 ± 0.0003 0.0186 ± 0.0007 Iron 0.89 ± 0.005 0.17 ± 0.01 0.042 ± 0.01 Lead <0.02 <0.02 <0.02 Magnesium 0.116 ± 0.005 0.120 ± 0.005 0.132 ± 0.0008 Manganese 0.0024 ± 0.0002 0.0097 ± 0.0004 0.0069 ± 0.0003 Molybdenum <0.005 <0.005 <0.005 Nickel <0.005 <0.005 <0.005 Phosphorus <0.04 0.50 ± 0.03 0.209 ± 0.0008 Potassium <0.07 0.097 ± 0.002 0.115 ± 0.009 Selenium <0.02 <0.02 <0.02 Silicon 0.4 ± 0.4 0.2 ± 0.1 0.4 ± 0.5 Sodium 5.8 ± 0.3 0.3 ± 0.02 0.3 ± 0.02 Sulfur 4.7 ± 0.2 6.3 ± 0.1 4.0 ± 0.1 Titanium 0.025 ± 0.001 0.027 ± 0.002 0.035 ± 0.002
a Values expressed as percent by weight; mean ± standard deviation; n=3; less than (<) values are below the quantifiable limit for the ARL-3410 ICP-AES.

31 Cellulose Insulation, NTP TOX 74
A gray residue remained after the acid digestion of the three respirable fractions from the three samples. The
insoluble residue comprised about 5% to 18% by weight of the respirable particle fraction (Table 11). The digestion
residue from Samples 2 and 3 was composed mainly of kaolinite, with smaller quantities of titanium dioxide (rutile
and anatase), quartz, and talc. Conversely, the residue in the small particle fraction of insulation from Sample 1
consisted primarily of talc, with smaller quantities of kaolinite, titanium dioxide, and quartz. The sodium nitrate and
calcium carbonate component in this material is possibly an artifact of the nitric acid digestion.
TABLE 11 X-Ray Diffraction of Undissolved Residue in Nitric Acid Digests of Cellulose Insulation Respirable Fractions
Sample Number Weight % Residuea Identity % by Weight
1 5.4 ± 0.7 Talc, Mg3Si4O10(OH)2 Kaolinite, Al2Si2O5(OH)4 Anatase, TiO2 Rutile, TiO2 Quartz, SiO2
b
Nitratine, NaNO3 and or calcite CaCO3 b
Unidentified (1 peak)
~40 10-15 10-15
~10 ~10 ~10 ~ 5
2 11.9 ± 0.8 Talc, Mg3Si4O10(OH)2 Kaolinite, Al2Si2O5(OH)4 Anatase, TiO2 Rutile, TiO2 Quartz, SiO2
< 5 ~50 ~25 ~15 ~5-10
3 18.3 ± 3.2 Talc, Mg3Si4O10(OH)2 Kaolinite, Al2Si2O5(OH)4 Anatase, TiO2 Rutile, TiO2 Quartz, SiO2
b
< 5 ~65
15-20 ~10 ~ 5
The digestion residue of the insoluble materials consisted primarily (>85%) of kaolinite (aluminum silicate hydroxide) with smaller amounts (<5% each) of talc (magnesium silicate hydroxide), muscovite (potassium aluminum silicate hydroxide), and rutile (titanium dioxide).a
Gravimetric analysis, % by weight of respirable fraction samples; values are represented as mean ± standard deviation, n=3.b
Tentative identification only
32 Cellulose Insulation, NTP TOX 74
ANIMAL STUDIES
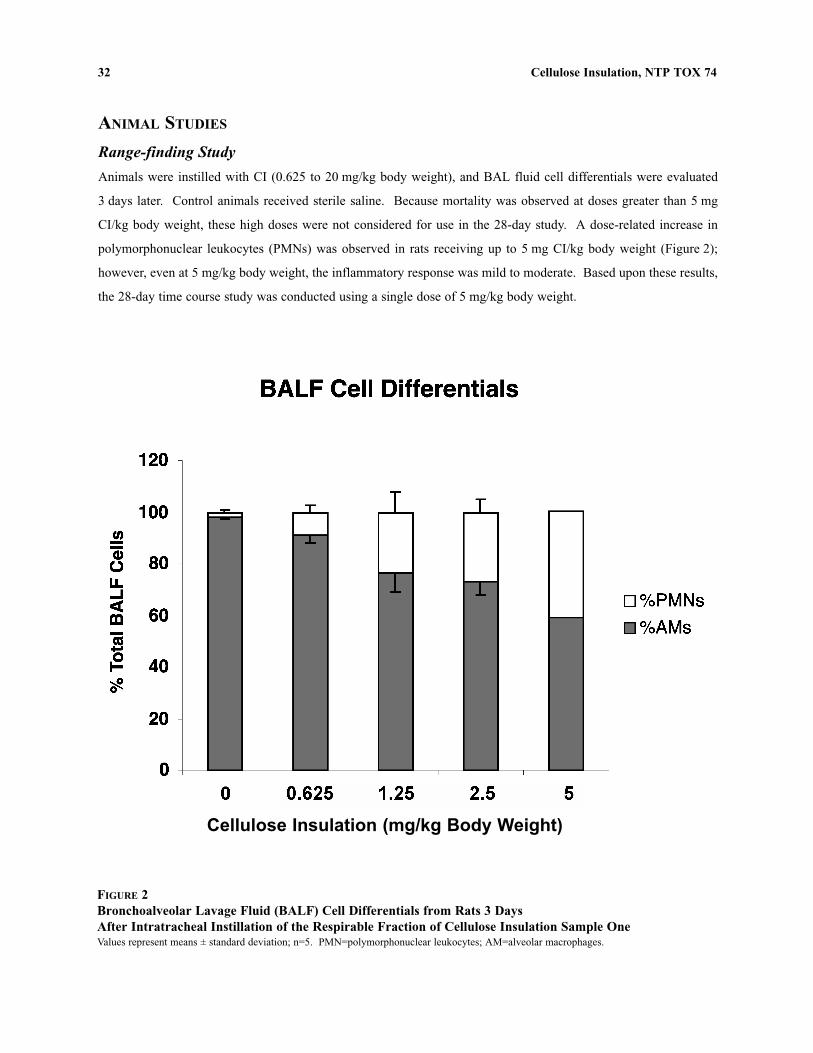
Range-finding Study
Animals were instilled with CI (0.625 to 20 mg/kg body weight), and BAL fluid cell differentials were evaluated
3 days later. Control animals received sterile saline. Because mortality was observed at doses greater than 5 mg
CI/kg body weight, these high doses were not considered for use in the 28-day study. A dose-related increase in
polymorphonuclear leukocytes (PMNs) was observed in rats receiving up to 5 mg CI/kg body weight (Figure 2);
however, even at 5 mg/kg body weight, the inflammatory response was mild to moderate. Based upon these results,
the 28-day time course study was conducted using a single dose of 5 mg/kg body weight.
Cellulose Insulation (mg/kg Body Weight)
FIGURE 2 Bronchoalveolar Lavage Fluid (BALF) Cell Differentials from Rats 3 Days After Intratracheal Instillation of the Respirable Fraction of Cellulose Insulation Sample One Values represent means ± standard deviation; n=5. PMN=polymorphonuclear leukocytes; AM=alveolar macrophages.

33 Cellulose Insulation, NTP TOX 74
28-Day Time Course Study
BAL Fluid Cellularity: Animals were instilled with either sterile saline (controls), CI (5 mg/kg body weight), or
titanium dioxide (5 mg/kg body weight), and the number of cells in BAL fluid was evaluated 1, 3, 7, 14, and 28 days
after instillation (Figure 3). Relative to controls, CI caused a significant increase (P<0.05) in total BAL fluid cell
numbers only on day 1. BAL fluid cell numbers in titanium dioxide-treated rats were greater than in the saline
controls only on day 7. The increase in BAL fluid cell numbers was caused primiarily by an influx of PMNs in both
CI- and titanium dioxide-treated rats (Figure 4). Saline instillation caused a slight (~5%) increase in PMNs that was
present only on day 1. This minor, transient effect is often observed after saline instillation (Morgan et al., 1997).
CI instillation caused a significant influx of PMNs into the lung. This inflammatory response was greatest the day
after instillation and was significantly greater than the effect in titanium dioxide-treated rats. Numbers of PMNs in
BAL fluids from CI-treated rats gradually decreased through day 7 and returned to control levels by day 14. Titanium
dioxide instillation caused a significant (P<0.05) influx of PMNs. PMN numbers remained elevated 1 and 3 days
after instillation and returned to control levels by 7 days after treatment.
BAL Fluid Protein: Protein in BAL fluid is an indication of vascular leakage caused by treatment. Total protein was
significantly increased (P<0.05) in the acellular BAL fluid at 1, 3, and 7 days after CI treatment (Table 12). This mild
effect was transient and was not present when evaluated 14 and 28 days after instillation. Titanium dioxide had no
significant effect on BAL fluid protein levels.
BAL Fluid LDH: CI also caused significant increases in BAL fluid levels of LDH that were only present on the day
after instillation (Table 12). LDH is a cytoplasmic enzyme, and its presence in BAL fluid is an indication of cell
injury. Titanium dioxide had no effect on LDH levels in BAL fluid.
Lung Hydroxyproline: 4-Hydroxyproline is an amino acid that is present primarily in collagen; its measurement is
used to monitor collagen production and fibrosis. 4-Hydroxyproline was measured in lungs of saline-, CI-, and
titanium dioxide-treated rats 7, 14, and 28 days after instillation. Only CI caused a significant increase (P<0.05) in
4-hydroxyproline that was present on day 28 (Table 12).

34 Cellulose Insulation, NTP TOX 74
FIGURE 3Total Bronchoalveolar Lavage Fluid (BALF) Cell Differentials at 1, 3, 7, 14, and 28 Days After a Single Intratracheal Instillation of Respirable Cellulose Insulation (CI) or Titanium Dioxide (TiO2) Particles (5 mg/kg Body Weight)Controls received phosphate buffered saline (PBS). Values represent means ± standard deviation; n=5. For each time point, values with different letters are significantly different (P<0.05).

35 Cellulose Insulation, NTP TOX 74
FIGURE 4 Bronchoalveolar Lavage Fluid (BALF) Cell Differentials at 1, 3, 7, 14, and 28 Days After a Single Intratracheal Instillation (5 mg/kg Body Weight) with Cellulose Insulation (CI) or Titanium Dioxide (TiO ) Particles
2
Controls received phosphate buffered saline (PBS). Values represent means ± standard deviation; n=5. For each time point, values with different letters are significantly different (P<0.05). PMN=polymorphonuclear leukocytes; AM=alveolar macrophages.

36
c
Cellulose Insulation, NTP TOX 74
TABLE 12 Pulmonary Toxicity of Intratracheally Instilled Cellulose Insulation and Titanium Dioxide Particulatesa
Days After Intratracheal Instillation 1 3 7 14 28
BAL Fluid Proteinb
Saline 0.19 ± 0.04 0.22 ± 0.05 0.11 ± 0.01 0.15 ± 0.02 0.19 ± 0.09 Titanium dioxide 0.29 ± 0.04 0.24 ± 0.04 0.13 ± 0.02 0.19 ± 0.03 0.09 ± 0.01 Cellulose insulation 0.46 ± 0.05* 0.38 ± 0.05* 0.19 ± 0.02* 0.21 ± 0.02 0.09 ± 0.01
BAL Fluid LDHc
Saline 11 ± 5 48 ± 20 12 ± 1 8 ± 3 3 ± 0.7 Titanium dioxide 50 ± 22 32 ± 9 10 ± 2 16 ± 5 3 ± 0.3 Cellulose insulation 164 ± 21* 52 ± 16 6 ± 3 2 ± 4 2 ± 0.4
Lung 4-hydroxyprolined
Saline — e
— 23 ± 2 36 ± 12 7 ± 0.4 Titanium dioxide — — 45 ± 9 34 ± 19 38 ± 10 Cellulose insulation — — 24 ± 3 24 ± 4 811 ± 15*
* Significantly different from saline controls (P<0.05) a
Values are represented as mean ± standard deviation, n=5. b
mg protein/mL BAL fluidIU lactate dehydrogenase/L BAL fluid
d mg/lung
e Not determined
Histopathological Evaluation of Lungs
Lungs of saline-, CI-, and titanium dioxide-treated rats were collected for histopathological evaluation 14 and
28 days after instillation. Lungs from saline-treated rats were normal in appearance when evaluated microscopically
on day 28 (Plate 5). CI-exposed lungs had scattered foci of minimal to mild granulomatous pneumonitis
characterized by focal alveolar thickening (comprised primarily of macrophages) and discrete nodular foci of
macrophages and giant cells often located adjacent to terminal bronchioles and alveolar ducts (Plate 6). Nodular foci
occasionally contained greenish spicular material and/or granular punctate dark pigment or material (Plate 8). Wisps
of blue staining collagen fibers (Masson’s trichrome stain) were present (minimal increased collagen) within these
nodular foci (Plate 6). There were no significant differences between animals and therefore no appreciable
progression in the severity or distribution of lesions from day 14 to day 28 (Table 13). Epithelial changes were not
present. One lymph node had mild hemorrhage, and another lymph node had minimal lymphoid hyperplasia.
Minimal to mild granulomatous pneumonitis and collagen staining were present in all 10 CI-treated rats (Table 13).
Titanium dioxide-exposed lungs were characterized by scattered minimal intra-alveolar histiocytic macrophages
laden with black pigment in nine of 10 rats (Table 13). There were no appreciable increases in blue staining collagen
(Masson’s trichrome stain) (Plates 7 and 9). Epithelial changes were not present. There were no significant
differences between animals and therefore no appreciable progression in the severity or distribution of lesions from
day 14 to day 28 (Table 13). Two bronchial lymph node sections contained pigment or pigment-laden macrophages.
One lymph node had a moderate hemorrhage.

37 Cellulose Insulation, NTP TOX 74
TABLE 13 Incidence and Severity of Histopathologic Lesions in the Lung in the 28-Day Study
Saline Controls
Day 14 Day 28
Cellulose Insulation (5 mg/kg body weight) Day 14 Day 28
Titanium Dioxide (5 mg/kg body weight) Day 14 Day 28
Hemorrhage a b
2/5 (0.4) 2/5 (0.4) 3/5 (0.6) 1/5 (0.2) 3/5 (0.6) 3/5 (0.6)
Alveolar histiocytosis 0/5 0/5 0/5 0/5 0/5 1/5 (0.1)
Granulomatous pneumonitis 0/5 0/5 5/5 (1.8) 5/5 (1.8) 0/5 0/5
Pigmented histiocytes 0/5 0/5 0/5 0/5 4/5 (0.8) 5/5 (1.0)
Collagen staining 0/5 0/5 5/5 (1.0) 5/5 (1.2) 0/5 0/5
a Number of animals with lesion/total animals examined
b Mean lesion severity grade based on a scale of 1 to 4 where 1=minimal, 2=mild, 3=moderate, and 4=severe.
DISCUSSION Cellulose insulation is a complex mixture of fibrous and nonfibrous particulates, fire retardants, and other proprietary
additives. Toxicity studies have been conducted on many different forms of cellulose from soft paper dusts and wood
(Järvholm et al., 1988; Tatrai et al., 1995) to pure microcrystalline cellulose (Adamson et al., 1999); however, little
toxicological information is available for CI. Because the toxicity of cellulose is highly dependent upon the physical
and chemical form, the potential toxicity of CI cannot be extrapolated from the toxicity data for other forms of
cellulose. Cellulose insulation products can differ in chemical composition and in the amounts and size fractions of
fibrous and nonfibrous particles, depending on the paper source and the methods used to process the paper. These
studies were conducted to evaluate the variability in the chemical and physical composition of CI products from four
major United States manufacturers.
Chemical analyses of the four CI products revealed only minor differences in inorganic additives. Organic
components were present in low concentrations; therefore, no qualitative analyses were performed. Known toxic
chemicals such as beryllium, cadmium, cobalt, chromium, potassium, molybdenum, nickel, lead, antimony, and
selenium were below quantifiable concentrations in all four CI samples tested. The major elemental components
detected were aluminum, boron, calcium, sodium, and sulfur. The presence of these chemicals is primarily due to
the fire retardants aluminum sulfate, boric acid, and sodium sulfate. Samples 1 and 4 contained significantly more
sodium than the other two samples. This difference was attributed to the use of sodium sulfate as the fire retardant
in Samples 1 and 4, whereas ammonium sulfate was used in Samples 2 and 3. Sulfur concentrations were similar in
all four samples.

38 Cellulose Insulation, NTP TOX 74
Boric acid was added as a fire retardant to all four samples and was detected at relatively high concentrations in the
bulk CI samples. However, only Sample 1 contained boric acid in the small respirable particle fraction. It is possible
that boric acid may have been added as a solid particulate to Sample 1, whereas it was added as a solution and
absorbed into the cellulose fibers in the other samples. Absorption of boric acid into the cellulose may have resulted
in its deposition in the cyclone or rough separator along with the larger particles and fibers during particle
classification, which would prevent it from being segregated with the small respirable particle fraction.
Alternatively, boric acid may have been added to Samples 2, 3, and 4 as a solid consisting of large particles.
Collections of these large particles in the rough separator or cyclone during the particle separation process would
account for the absence of boron in these samples.
The physical composition of bulk CI from the different manufacturers was similar, composed primarily of large
crumbs or particles. The composition of the four CI samples was determined by generating an aerosol of the bulk
materials and evaluating the particle and fiber size distributions. The aerosol generation/separation system simulated
the process used during installation of CI at work sites and separated the CI particles based on aerodynamic size. For
all four products, less than 0.1% of the CI was collected as the small respirable particle fraction. The concentrations
of respirable particles in the sampling chamber were less than 60 mg/m3, or 2% of the TLV of 3,000 mg/m3 for
respirable nuisance particles. These data indicated that the exposure of CI applicators to significant levels of
respirable particles is not likely. Sample 4 had significantly fewer respirable particles than the other samples. It was
not apparent whether this reduced level was caused by a difference in stock material or manufacturing method. A
manufacturing method that reduces the number of respirable products would be important for improving the safety
of CI products.
The potential presence of respirable fibrous particles in the CI was a concern because of the known toxicity of
asbestos and glass fibers. The numbers of respirable CI fibers generated from the four samples ranged from 9.7 × 10³
to 1.4 × 10⁶ fibers/gram test material in the sampling chamber. Although the numbers of CI fibers were very low,
these fiber concentrations exceeded the stated limits for cited toxic and carcinogenic glass and mineral fibers.
Concentration limits for various highly regulated fibers set by regulatory agencies are 0.1 asbestos fibers/cc 8-hour
TWA; 1 asbestos fiber/cc per 30 minute excursion; 1 glass fiber/cc; 0.2 crocidolite, 0.5 amosite, 2 chrysotile, and
other asbestos/cc (29 CFR 1910; ACGIH, 2003). Although numbers of cellulose fibers exceeded the acceptable
levels of asbestos and glass fibers, CI is not considered to be as reactive or toxic as asbestos or glass fibers.
Although the number of fibers generated from cellulose insulation was very low, further characterization of these
fibers may be warranted to evaluate solubility and durability in lung fluid and potential toxicity. Muhle et al. (1997)
investigated the biodurability of cellulose fibers isolated from Isofloc® thermal insulation. The Isofloc® was
processed to a median fiber length of 7.6 mm and a median fiber diameter of 0.50 mm. One year after intratracheal
instillation of 2 mg of fibers in rats, fibers were still present in the lungs. Although fiber number and diameter could

39 Cellulose Insulation, NTP TOX 74
not be determined because of the splitting of fibers, the presence of fibers in the lung after 1 year indicates that
Isofloc® fibers are highly durable and can persist in the lung.
Toxicity studies of CI were limited to an intratracheal instillation study because of the small amount of respirable CI
particulate available. The potential pulmonary toxicity of the respirable CI particles was evaluated for up to 4 weeks
after a single intratracheal instillation in rats. Intratracheal instillation of a high dose of respirable CI particles caused
a mild, transient, pulmonary inflammatory reaction similar to that caused by an equivalent dose of titanium dioxide,
a relatively inert particle. Microscopic examination of lungs from CI-treated rats 2 and 4 weeks after treatment
revealed a minimal to mild granulomatous pneumonitis. Although the histological appearance and the severity of
the lesions did not increase between weeks 2 and 4, biochemical analyses detected a significant increase in lung
collagen during this time. Light microscopic evaluation of lung sections stained with Masson’s trichrome stain for
collagen demonstrated a slight increase in collagen fibrils associated with the granulomatous nodules. It could not
be determined from this study if this lesion was the result of a high bolus dose of particulate or if the slight increase
in collagen associated with granulomatous nodules could progress to focal pulmonary fibrosis.
The instilled respirable CI particles were primarily composed of fire retardant chemicals. Of these chemicals, boron
has the most significant toxicological properties at low doses. Little information is available concerning the
absorption and distribution of inhaled borates. Significant concentrations of boron were found in the kidney and liver
of mice exposed to high concentrations of amorphous boron (72.8 mg/m3) for 7 hours per day, 5 days per week, for
30 days (Stokinger and Speigel, 1953), indicating that pulmonary absorption and systemic exposure can result from
inhalation exposure. Inhalation exposure of rats to boron oxide aerosol (77 mg/m3 for 6 hours per day, 5 days per
week, for 6 weeks) resulted in significant levels of boron in the urine, providing evidence that boron oxide is
absorbed from the lungs (Wilding et al., 1959). In humans, inhalation of borax in the range of 3.3 to 18 mg/m3
resulted in measurable levels of boron in the urine and blood (Culver et al., 1994). Oral administration of boron has
been shown to result in reproductive (NTP, 1990; Fail et al., 1990, 1991; Treinen and Chapin, 1991; Ku et al., 1993)
and developmental (NTP, 1989; Heindel et al., 1992; Price et al., 1996) toxicity in laboratory animals. Subchronic
inhalation exposure of lab animals to boron trifluoride (2 to 18 mg/m3) caused reduced body weight gains, decreased
organ weights, and pneumonitis (Torkelson et al., 1961; Rusch et al., 1986). However, based on the small quantities
of boron present in the respirable fraction, it is unlikely that inhalation of CI by applicators would result in significant
systemic exposure.
Chemical characterization studies indicate that it is not technically feasible to obtain the amount of respirable
particulate needed for an inhalation study from commercially available CI. These studies also determined that the
small amount of respirable particulate obtained from CI aerosols was composed primarily of fire retardant chemicals
and not cellulose. Although the bulk CI could be mechanically processed to reduce the particle size, the processed
CI particles would not have the same chemical and physical properties as the CI particulates to which workers are

40 Cellulose Insulation, NTP TOX 74
exposed. Toxicity studies of the respirable particulate were limited to a short-term intratracheal instillation study
because of the small amount of respirable particulate available. The respirable particles caused a mild, transient
pulmonary inflammatory reaction similar to that caused by an equivalent dose of titanium dioxide, a relatively inert
particle. CI particulates also caused a minimal to mild granulomatous pneumonitis with a slight increase in collagen
fibrils associated with granulomatous nodules. It could not be determined from this study whether this lesion could
progress to focal pulmonary fibrosis. More information is needed on the potential pulmonary toxicity of the fire
retardant particulates present in CI.

41
EXPOSURE ASSESSMENT OF CELLULOSE INSULATION APPLICATORS
Cellulose insulation (CI) was nominated to the NTP for a comprehensive toxicological evaluation. As part of this
evaluation, the Hazard Evaluations and Technical Assistance Branch of NIOSH worked in collaboration with NIEHS
to conduct an exposure assessment. The study was performed on United States contractors installing CI in residential
and commercial buildings.
Although CI has been used for over 50 years, no adequate assessments of CI exposure have been conducted. The
CI industry is composed of many small companies with small workforces, and little information has been collected
on worker exposure levels. Because there is no evidence that CI dust poses a health risk to workers, there was some
question as to whether animal studies of CI were warranted. For this reason, a workplace exposure assessment was
conducted to characterize the CI particulates to which workers are exposed and to determine whether or not a
potential health risk for workers exists. This study has been reported separately (NIOSH, 2001).
CI application in attics begins with attic preparation. Attic preparation may be performed by a separate crew or by
the same crew that conducts the CI application. Fiberglass batting is laid over pipes and recessed lights; barriers are
installed in the attic soffit areas to prevent CI from passing to the outside; and other activities are performed as
needed. An application hose is brought up to the attic through an attic access panel. CI is then applied at the
specified depth to achieve the desired R-value (resistance to heat flow) (16 CFR 460). CI can be applied wet or dry.
In wet applications, there is an in-line misting device in the application hose close to the hopper area. Dry application
for existing walls begins with drilling holes in the inside or outside wall between the studs. CI is then applied through
a hose that is smaller in diameter (1 to 2 inches) than hoses used with the other methods. The hose is pulled out of
the wall as pressure builds so that the wallboard does not release from the wall. The drilled hole is then plugged.
Plugs are made from many different types of materials.
During wet application for newly constructed walls, a misting device is placed at the end of the application hose. As
the CI passes through the hose, the water moistens the CI and the wall surface to gain adherence. Excess material
protruding between the wall studs is removed with an electric roller. The excess material is then vacuumed directly
into the hopper or shoveled into trash bags and manually put into the hopper for reuse. In some cases, polyethylene
sheeting is stapled to exterior wall studs to serve as a vapor barrier and to keep the CI in the wall space. For interior
walls with no wallboard backing material, contractors staple white cloth material to the wall studs. CI is then applied

42 Cellulose Insulation, NTP TOX 74
to that surface, and the process proceeds as described previously. After installation, some contractors will staple a
wire mesh to the wall studs to keep the CI in place.
CI hoppers come in various forms. Two basic types were observed during this project, those with built-in recycling
capability and those without. Hoppers with built-in recycling capability are larger and have more advanced operation
controls (i.e., setting units measured in rpm and psi). Hoppers without built-in recycling capability are smaller, use
control plates to set the amount of material being fed to the hose, and have a dial to control the amount of air being
sent through the hose. Attic applications are typically set to full air and do not use control plates. Existing wall
applications use less air and fewer plates to reduce the amount of material.
After contacting various contractors, discussing the nature of the research project, and receiving support by contractor
management, a CI exposure assessment was conducted with 10 contractors from across the United States. An initial
environmental protocol development investigation was conducted in Colorado in January of 1998. Based upon the
initial findings, the investigators determined the sampling methods needed to characterize CI applicators’ exposure
to generated CI dust. This section summarizes the worksite evaluation and provides recommendations for improving
occupational health and safety of CI applicators.
MATERIALS AND METHODS
FIELD STUDIES
Site Selection
Site selection and the number of site visits were based on: (1) having at least one contractor from each section of the
country (i.e., Northwest, Midwest, Southeast, etc.), (2) the number of consenting contractors, (3) the ability to provide
wall and attic CI application sites during the survey time period, and (4) the appropriate sample size for various
statistical comparisons. Before NIOSH personnel arrived for the survey, each contractor was contacted to obtain their
consent and a mutually agreeable date of the survey and to discuss the planned sampling efforts and details of their
operation. After each site visit, the contractor received a report, which included discussions of job sites sampled,
sections on sampling methods, air sample results, conclusions, and recommendations.
Sampling Protocol Development
The first contractor survey was conducted over a 3-day period to develop a sampling protocol for the rest of the
project. The survey involved personal breathing zone (PBZ) and area air sampling, real-time monitoring using a
portable dust monitor, and video exposure monitoring (VEM) during application activities. The survey objectives
were to observe the CI application process, work with the various sampling methods, determine the most effective
setup, and facilitate discussion about the process among the employees conducting the application.

43 Cellulose Insulation, NTP TOX 74
Sample Collection
Samples were collected from two main areas of each application site, around the installer and around the employee
dumping bags of CI into the hopper. Area and PBZ air samples for total and respirable dust were collected in both
areas and subsequently analyzed gravimetrically; they were also analyzed for boron and sulfate content. Two PBZ
scanning electron microscopy (SEM) samples were collected from each of the two areas. The sampling time
depended on the extent of material loading on the filters. Real-time monitoring of total and respirable dust was also
conducted during CI applications when feasible.
Employee duties throughout the day were highly variable, and no specific task lasted a full 8 hours. Therefore, the
air sampling protocol was designed to collect task-based (i.e., short term) samples for each worker involved with
specific CI activities. Analytical results were used to calculate the total and respirable dust concentrations for each
task-based sample and the 8-hour time-weighted average (TWA) exposures for each worker. The 8-hour TWAs
included all task-based samples for each worker’s entire shift. Area 8-hour TWAs were based on the compiled
exposure results from each area during the entire task period. Calculated area 8-hour TWA exposures were intended
to represent potential exposure. Time periods of noninvolvement with CI-related activities were not sampled and
were considered to be a zero exposure.
In-depth Surveys
Four in-depth surveys were conducted. Two of these surveys used VEM along with air sampling, portable dust
monitor measurements, and medical evaluations. During CI applications, VEM was conducted inside the attic with
the installer and inside the truck with the hopper operator. The other two surveys involved return visits because of
CI application changes. One contractor changed from a dry application system to a wet application system. Another
contractor changed back to the company’s usual wet application system, which was not used during the initial visit.
Total and Respirable Dust
Area and PBZ air samples for total dust were collected on tared 37 mm diameter, 5 µm pore size polyvinyl chloride
(PVC) filters at a calibrated flow rate of 1.0 L/min. The filters were gravimetrically analyzed according to NIOSH
Method 0500 (NIOSH, 1994). Area air samples for respirable dust were collected with tared 37 mm diameter, 5 µm
PVC filters in line with a 10 mm cyclone at a calibrated flow rate of 1.7 L/min. The filters were gravimetrically
analyzed according to NIOSH Method 0600 (NIOSH, 1994). The analytical limits of detection for the total and
respirable dust filters were 0.08 and 0.02 mg, respectively, which are equivalent to minimum detectable
concentrations of 0.8 and 0.2 mg/m3, respectively, assuming a sample volume of 100 L.

44 Cellulose Insulation, NTP TOX 74
Scanning Electron Microscopy (SEM) Sample
PBZ air samples of the CI dust were collected using a modified version of NIOSH Method 7402 (NIOSH, 1994).
Samples were collected using a 25 mm diameter cassette with an electrically conductive extension cowl and 0.8 µm
pore size polycarbonate filters at a calibrated flow rate of 1.0 L/min. The filters were analyzed by SEM for fiber
count, fiber size, and fiber characteristics (i.e., cellulose, fiberglass, and others).
The samples were first given a conductive carbon coat to minimize fiber charging and to improve the secondary
electron images. The prepared samples were then placed in the instrument sample holder and were analyzed using a
secondary electron detector adjusted to a magnification of 1,200×. The center of the filter was found using X-Y
manipulators, and fields were examined at regular intervals along a traverse in one direction. Fibers were counted in
each field using the “A” rules. Based upon morphology, cellulose and other fiber types were distinguished, and the
relative proportion of fibrous to nonfibrous material in the field was recorded. A minimum of 40 fields were counted.
If the edge of the filter was encountered before 40 fields were analyzed, a new traverse began from the center of the
filter. The actual analysis was conducted on an image analyzer that had greater resolution than the SEM screen. At
least two fields were captured and saved on disk for archival and presentation purposes. The fibers were sized by
comparison to a calibrated, overlying micron bar.
Bulk Material Sampling
Bulk CI samples were collected from each contractor and analyzed by two methods. The first method was water
extraction, which checked boron and sulfate content. The second method was NIOSH Method 7300 (NIOSH, 1994),
which analyzed boron, sulfate, and other elemental constituents. These methods tested for aluminum, arsenic,
barium, beryllium, calcium, cadmium, cobalt, chromium, copper, iron, lithium, magnesium, manganese,
molybdenum, nickel, lead, phosphorus, platinum, selenium, silver, sodium, tellurium, thallium, titanium, vanadium,
yttrium, zinc, and zirconium. Samples were analyzed with both methods using an inductively coupled plasma
emission spectrometer.
Particle Count and Sizing
Real-time sampling was conducted to monitor the particulates generated by distinct events during CI application
activities in the attics and around hoppers. The Grimm Model 1.105 Dust Monitor (Labortechnik GmbH and CoKG,
Ainring, Germany) was used to collect the real-time data. This portable dust monitor is a light-scattering aerosol
spectrometer designed for real-time particulate measurement with particle size discrimination. Eight channels collect
count information for particle sizes 0.75, 1, 2, 3.5, 5, 7.5, 10, and 15 µm. For each operation, data were integrated
for 1 minute and stored sequentially on the Grimm data card for the entire time period. Particle count and size
information were then downloaded to a computer. Start and stop times for distinct events were also recorded.

45 Cellulose Insulation, NTP TOX 74
The mass distribution of particles was reported as a concentration in micrograms of particulates per cubic meter of
air. Particles are sized based on the amount of light scattered by individual particles. The monitor operates at a flow
rate of 1.2 L/minute. Estimates were made of the mass median aerodynamic diameter (MMAD) and the associated
geometric standard deviation (GSD) based on the integrated particle size discrimination provided by the instrument.
The MMAD is the mid-point of the aerodynamic size distribution, the point where half the particles are larger and
half are smaller. A CI density correction factor for the personal dust monitor was applied during data analyses. The
density correction factor is the ratio of an integrated total dust sample to the indicated instrument total dust weight of
the CI sampled. The conversion factors were used to adjust the instrument concentration values.
Video Exposure Monitoring (VEM)
Real-time particulate sampling was coupled with video recording and performed during two surveys to evaluate
worker exposures. VEM was typically conducted concurrently during attic applications and hopper loading
operations. The objective of VEM during CI-related activities was to observe the work practices and associated total
dust exposures of the installer and hopper operator. The VEM may indicate certain work practices that can increase
or reduce the concentration of dust in the air.
During application activities, a Handheld Aerosol Monitor (HAM) (PPM, Inc., Knoxville, TN) was used to measure
PBZ relative air contaminant concentrations. The HAM operates by continuously drawing aerosols through an
illuminated sensing volume and detecting the amount of light scattered by all the particles in that volume (NIOSH,
1992). The analog output of the HAM was recorded by a data logger. The information collected on the data logger
was downloaded to a computer and converted into a spreadsheet for analysis. The HAM was operated on a
0 to 200 volt scale during monitored activities in the attic and around the hopper.
VEM was used to identify the source of air contaminants, evaluate how exposures vary among the components of a
job, identify potential shortcomings of a control, and determine how quickly air contaminants decay once an
operation has stopped (Gressel et al., 1987, 1988). While the HAM measured air concentrations, workplace activities
were recorded on videotape. The analog output from direct reading instruments can be overlaid on a video recording
as a moving bar that has a height proportional to the air contaminant concentration. This technique shows how
worker exposures are related to work activities, and it permits control recommendations that are focused upon actual
exposure sources.

46 Cellulose Insulation, NTP TOX 74
MEDICAL MONITORING
Health Assessment of Symptoms and Lung Function
Available CI workers were recruited at each work site. The workers were asked to complete self-administered
questionnaires, perform serial peak flow tests, and complete a repeated acute symptoms survey.
Questionnaires
A modified version of the American Thoracic Society standardized questionnaire (Appendix B) was administered to
all participants to obtain the prevalence of chronic respiratory, eye, nose, throat, and skin symptoms. Information
concerning smoking history and work history was also solicited. The questionnaires took approximately 10 to
15 minutes to complete. Investigators also administered short acute symptoms surveys (Appendix C) before and after
each work shift, twice during the work shift, and once at bedtime (self-administered) for a total of five data collection
periods per day.
Peak Expiratory Flow Rate (PEFR)
Serial determinations of PEFR , the amount of air that can be blown through the flow meter in one sharp breath, were
obtained using Wright portable flow meters. PEFR was measured (L/min) concurrently with the acute symptom
surveys (five times per day for 1 to 4 days). The participants were taught how to use portable meters. Three
exhalations were recorded each session, and the highest of the three was accepted as the PEFR. Participants were
considered to have significant bronchial liability if their amplitude percent means of PEFR
[(maximum – minimum)/mean] were greater than 20% (Higgens et al., 1992).
Statistics
Individual air sample concentrations for total and respirable dust were compiled into a statistical analysis system
(SAS) database. The data were arranged and grouped according to the type of sample (PBZ or area) and type of
application. Concentration data were analyzed to compare CI dust concentrations during wet and dry applications.
T-tests were used to accept or reject a null hypothesis of no significant difference in wet and dry concentrations.
Statistical significance was set at P#0.05. Additionally, all employee tasks and respective air sample concentrations
during wet or dry applications were grouped separately and analyzed to compare exposure potential. Analysis of
variance was used to accept or reject a null hypothesis of no significant difference in employee exposures. Statistical
significance was set at P#0.05.

47 Cellulose Insulation, NTP TOX 74
RESULTS PERSONAL PROTECTIVE EQUIPMENT
Most of the evaluated contractors provided disposable particulate respirators to their employees. These respirators
included North® full-face masks with HEPA filters, 3M® particulate facepieces, and Gerson® particulate facepieces.
Approximately half of the contractors were familiar with the new OSHA Respiratory Protection Standard
(29 CFR 1910) and the NIOSH respirator certification system (NIOSH, 1996) and had implemented them into each
of their company’s day-to-day operations. A few contractors had written respiratory protection programs established
in their workplaces. One contractor’s employees wore Tyvek™ suits during attic preparation and CI application.
CELLULOSE INSULATION STATISTICAL ANALYSIS
The airborne CI concentration data were log-transformed to perform statistical analyses on normally distributed data
(Table 14). Installers’ exposures to total dust are significantly higher during dry attic applications than wet attic
applications (P<0.01). Area air samples for total and respirable dust also revealed a significantly higher CI
concentration during dry attic applications than wet attic applications (P<0.01). Conversely, hopper operators’
exposures to total dust are significantly higher during wet wall and ceiling applications than dry wall and ceiling
applications (P=0.02).
Table 15 displays the ANOVA analyses comparing employee area exposure concentrations during wet and dry
applications. PBZ air samples for total dust varied significantly during dry applications (P<0.01). The area air
samples for respirable dust also indicated a significant difference in concentration during dry applications (P=0.03).
MEDICAL EVALUATION
Twenty-three CI workers participated in the medical phase of the investigation. All of the workers present at the site
visits agreed to participate. Medical evaluations took place at seven sites. The average age at the time of the
investigations was 36 years (range 21 to 62). The average time the workers were employed in the CI industry was
4 years. Almost all of the workers installed CI full-time and year round.
Medical History Questionnaire
On the questionnaires, workers reported suffering from several symptoms while working with CI. Six workers (26%)
reported that they had experienced some respiratory symptoms since working with CI. The only chronic respiratory
symptom reported on the questionnaires was the production of phlegm in the morning; one worker reported having
it always, two often, two sometimes, and one rarely. Of the workers who reported morning phlegm, four were current
smokers, one was an ex-smoker, and one was a nonsmoker. Smokers were more likely to report phlegm production
than nonsmokers, but the difference was not statistically significant.

48 Cellulose Insulation, NTP TOX 74
TABLE 14 Concentrations of Airborne Cellulose Insulation During Dry or Wet Applicationa
Range Geometric Group n (mg/m3) Mean ± Standard Deviation P Valueb
Personal Breathing Zone, Total Dust Attic CI application, CI installer, dry 22 16.2 - 431 74.8 ± 2.33 Attic CI application, CI installer, wet 29 1.27 - 97.3 18.7 ± 2.85 <0.01
Wall/ceiling CI application, CI installer, dry 9 3.86 - 78.7 20.2 ± 2.66 Wall/ceiling CI application, CI installer, wet 27 4.34 - 80.6 26.2 ± 1.80 0.47
Attic CI application, hopper operator, dry 13 2.17 - 140 25.8 ± 3.09 Attic CI application, hopper operator, wet 24 0.82 - 58.3 17.8 ± 2.56 0.29
Wall/ceiling CI application, hopper operator, dry 7 1.22 - 44.6 9.99 ± 2.98 Wall/ceiling CI application, hopper operator, wet 30 2.08 - 61.3 22.2 ± 2.03 0.02
Area, Total Dust Attic CI application, dry 11 7.68 - 98.1 23.8 ± 2.32 Attic CI application, wet 19 0.31 - 38.3 6.19 ± 4.09 <0.01
Hopper with attic CI application, dry 10 1.67 - 101 13.4 ± 3.32 Hopper with attic CI application, wet 23 0.74 - 202 15.0 ± 3.82 0.82
Hopper with wall CI application, dry 5 0.73 - 61.1 5.46 ± 9.20 Hopper with wall CI application, wet 22 1.3 - 61.3 11.5 ± 2.82 0.50
Area, Respirable Dust Attic CI application, dry 10 0.84 - 3.52 1.53 ± 1.62 Attic CI application, wet 19 0.01 - 8.54 0.11 ± 12.8 <0.01
Hopper with attic CI application, dry 9 0.01 - 1.24 0.15 ± 8.10 Hopper with attic CI application, wet 21 0.01 - 12.9 0.45 ± 5.38 0.15
Hopper with wall CI application, dry 5 0.01 - 8.70 0.36 ± 14.7 Hopper with wall CI application, wet 12 0.01 - 2.43 0.28 ± 6.18 0.83
a CI=cellulose insulation
b Pairwise comparison between wet and dry CI applications by a t-test

49 Cellulose Insulation, NTP TOX 74
TABLE 15 Area Exposure Concentrations of Cellulose Insulation During Dry or Wet Applicationa
Group n Range
(mg/m3) Geometric
Mean ± Standard Deviation P Valueb
Personal Breathing Zone, Total Dust Attic CI application, CI installer, dry Attic CI application, hopper operator, dry Wall/ceiling CI application, CI installer, dry Wall/ceiling CI application, hopper operator, dry
22 13
9 7
16.2 - 431 2.17 - 140 3.86 - 78.7 1.22 - 44.6
74.8 ± 2.33 25.8 ± 3.09 20.2 ± 2.66 9.99 ± 2.98 <0.01
Attic CI application, CI installer, wet Attic CI application, hopper operator, wet Wall/ceiling CI application, CI installer, wet Wall/ceiling CI application, hopper operator, wet
29 24 27 30
1.27 - 97.3 0.82 - 58.3 4.34 - 80.6 2.08 - 61.3
18.7 ± 2.85 17.8 ± 2.56 26.2 ± 1.80 22.2 ± 2.03 0.33
Area, Total Dust Attic CI application, dry Hopper with attic CI application, dry Hopper with wall CI application, dry
11 10 5
7.68 - 98.1 1.67 - 101 0.73 - 61.1
23.8 ± 2.32 13.4 ± 3.32 5.46 ± 9.20 0.14
Attic CI application, wet Hopper with attic CI application, wet Hopper with wall CI application, wet
19 23 22
0.31 - 38.3 0.74 - 202 1.3 - 61.3
6.19 ± 4.09 15.0 ± 3.82 11.5 ± 2.82 0.08
Area, Respirable Dust Attic CI application, dry Hopper with attic CI application, dry Hopper with wall CI application, dry
10 9 5
0.84 - 3.52 0.01 - 1.24 0.01 - 8.70
1.53 ± 1.62 0.15 ± 8.10 0.36 ± 14.7 0.03
Attic CI application, wet Hopper with attic CI application, wet Hopper with wall CI application, wet
19 21 12
0.01 - 8.54 0.01 - 12.9 0.01 - 2.43
0.11 ± 12.8 0.45 ± 5.38 0.28 ± 6.18 0.09
a
b CI=cellulose insulation Trend test by ANOVA

50 Cellulose Insulation, NTP TOX 74
Eight workers (35%) reported nasal symptoms, including stuffiness or drainage. However, none of these workers
reported a temporal relationship between their nasal symptoms and CI exposure. Eight workers (35%) reported eye
symptoms, having red, itchy, or watery eyes more than twice in the previous 12 months, and four of these (50%)
reported a temporal association between their eye symptoms and work. Three workers (13%) reported skin
symptoms, which included skin rash, dermatitis, hives, or eczema. Two of these three workers reported a workplace
association with their skin symptoms.
Acute Symptoms Survey
Ten of the 23 workers (43%) reported at least one symptom during the survey. The most common symptom reported
was coughing; five of the 23 workers reported being bothered by coughing on at least one occasion. Two workers
reported wheezing. One of these workers reported wheezing on 25% of the symptoms survey responses; however,
this worker noted that he had a respiratory tract infection at the time of the survey.
The next most common symptoms were nose symptoms and throat symptoms; four workers reported at least one nose
symptom, and four reported at least one throat symptom. Only two workers reported eye symptoms, and each
reported it only once during the site visit. Seven workers reported job-related ache or pain within the previous
12 months. The most common complaint was lower back pain (five workers), followed by shoulder pain
(two workers).
Peak Expiratory Flow Rate (PEFR)
PEFR was measured on 22 workers five times per day. The median number of days that the workers were monitored
was three (range 1 to 4). All monitoring was at work except the bedtime reading. No monitoring occurred on days
the employees were away from work. The percent amplitude mean was less than 20% for all workers. The median
percent amplitude mean was 7.8%. The highest was 16.9%. None of the three workers with percent amplitude means
greater than 15% reported acute respiratory symptoms on the symptoms survey.
Individual Contractor Results
Appendix A presents the individual contractor data in tabular form for PBZ and area air samples, SEM air samples,
bulk sample analyses, personal dust monitor, and VEM results, respectively. For the SEM analyses, the fiber lengths
and averages are estimates and are probably understated because of the difficulty of accurately measuring the fibers.
Each contractor received an individual copy of their evaluation after the site visit was completed.

51 Cellulose Insulation, NTP TOX 74
DISCUSSION Dry CI applications in attic areas generated significantly higher PBZ total dust air sample concentrations than wet
attic applications (P<0.01). The installer in the attic environment has a considerable potential for an 8-hour TWA
exceeding the OSHA permissible exposure limit (PEL) for total dust. This is especially true when the actual
application time increases, the attic area is small, or when the installer is required to crawl into enclosed areas, such
as cathedral ceilings. Because the settling of CI dust is relatively slow, as application time increases, the cloud of CI
dust becomes denser, increasing the potential for higher exposure.
Also, when applying CI in existing walls, pressure is generated in the wall. When the application nozzle is taken out
of the wall, the pressure forces CI out of the wall hole and creates a considerable cloud of dust. The dust is typically
released into the PBZ of the installer. Some contractors, when involved with this type of application, hang
polyethylene sheeting to reduce the amount of CI dust settling on furniture, pictures, etc. This creates an enclosed
area where the generated dust can become denser, which also increases the exposure potential.
The area respirable dust concentrations varied significantly by work area during dry applications (P=0.03). Higher
respirable concentrations were found in attic spaces than in other areas during CI application. Two possible reasons
are the extensive amount of CI dust generated naturally contains a larger amount of respirable material, and the
enclosed nature of attic spaces creates an environment with minimal air movement and lack of air exchange with the
outdoors. Limited air movement will bias airborne concentrations to the respirable range as larger particulates settle
out. Therefore, the attic space should see a gradual increase in airborne respirable CI over time.
A moistening system can reduce the dust concentrations during attic applications, resulting in less potential for
installers to exceed the OSHA PEL for total dust. Proper operation of the system depends on the correct amount of
water (per manufacturers’ specifications) and sufficient hopper strength to force moistened CI from the truck into the
attic. Problems with the system can increase exposure potential. High concentrations were found during this wet
attic application that were not found during any other site visits with contractors who used misting systems.
During wet wall applications, installers, hopper operators, and recyclers could have 8-hour TWAs that exceed the
OSHA PEL for total dust. When applying CI between wall studs, the force of the CI releasing from the application
hose and hitting the wall generates a cloud of CI dust. Because this application requires all three types of employees
to be close to the wall, they are close to the generated dust as well. After the CI has filled the space between the wall
studs, workers use rollers to remove excess CI and provide a consistent depth. To roll off the material 8 to 10 feet
high, workers must reach up to the top of the wall; this results in excess CI falling onto those employees and into
their PBZs. Workers then use a vacuum connected to the hopper to recycle this excess material; it can also be
52 Cellulose Insulation, NTP TOX 74
collected by shovel and deposited back into the hopper. The close proximity of the recycling operation to the
application area can lead to high airborne concentrations as well. During wet wall and ceiling applications, the
hopper operators work with the hopper, the roller, and sometimes the recycling portion of the process; this increases
the hopper operators’ exposure potential. The hopper operators have total dust exposures significantly higher during
wet wall and ceiling applications than dry (P=0.02).
Cellulose fibers were observed and characterized by SEM analysis, which indicated the length of the fibers averaged
28 mm and ranged from 5 to 150 mm. The fibers came in various shapes and sizes, were rarely linear, could be found
attached to cellulose particles, and did not typically have a uniform diameter. The variable fiber diameter could not
easily be measured because the fibers, especially the longer fibers, tended to curve and twist into shapes that were
difficult to characterize (Plates 10 and 11). Many of the fibers did not lay flat on the filter, which then resulted in
differential charging, making them less stable. This reduction in stability primarily affected the image quality.
The fibers’ nonlinearity, along with their varying shapes, sizes, and diameters, complicates the issue of fiber
respirability. Classifying respirability depends heavily on the diameter of the fiber, so not being able to measure the
diameter makes it difficult to conclude whether or not a fiber is respirable.
The bulk CI samples were analyzed by water extraction and strong acid extraction. The water extraction indicated a
boron and sulfate range of 4,700 to 25,000 mg/g of material and 25,000 to 97,000 mg/g of material, respectively. The
strong acid extraction indicated a boron and sulfate range of 5,900 to 26,000 mg/g of material and 29,577 to
94,000 mg/g of material, respectively. Assuming that all detected boron and sulfate originated from the fire-retardant
materials added, the amount of each was approximately 0.5% to 2.5% and 2.5% to 10% by weight of CI material,
respectively. The boron levels were low in the bulk samples, and the potential for exposure to high concentrations
of boron in individual air samples is extremely unlikely. Sulfate levels were higher than boron levels in the bulk
samples. However, sulfates occur naturally in wood products, which probably added to the overall amount detected.
Both extraction methods found a number of other metals in their analyses. The metals consistently detected included
aluminum, calcium, copper, iron, lithium, magnesium, manganese, sodium, titanium, and zinc.
Real-time monitoring with a personal dust monitor assisted in characterizing the particulate size of the generated CI
dust. Monitoring results from various activities revealed MMADs typically greater than 10 µm with GSDs between
2.0 and 3.0 (Table A5). These data indicated that the particle size distribution was biased towards particle sizes out
of the respirable range of 10 µm and larger. A large amount of respirable material was not generated during CI
application. The respirable material was typically less than 11%, which coincided with calculations from the personal
dust monitor data. However, the personal dust monitor and respirable dust samples were area samples, not PBZ

53 Cellulose Insulation, NTP TOX 74
samples. A higher concentration of dust, as seen in attics during dry application, may result in a larger amount of
respirable material and increased exposure potential for employees, which are not indicated by area sampling.
The personal dust monitor has a maximum concentration that it can measure. At or above this maximum
concentration, the instrument is unable to classify the particles into the eight size ranges. Two contractors (7 and 8)
had real-time monitoring events where the calculated respirable mass fraction was at or slightly above 0%. The
instrument indicated that each size range had the same amount of mass. Therefore, when the respirable mass fraction
was calculated from the data provided by the instrument and that data had concentration readings above the
maximum, the percentage was lower.
The VEM explained the relationship between CI-related activities and total dust concentrations (Figures A1 and A2).
A qualitative assessment of the concentrations measured with the HAM during VEM indicated that installers were
exposed to the highest particulate concentrations when working in “tight areas,” such as the corners or edges of an
attic, or when applying insulation near the body. Hopper operators are exposed to the highest particulate
concentrations when dumping bags of CI into the hopper. The initial positioning of the CI block in the hopper creates
a large cloud of dust, producing a higher concentration as well.
Engineering controls in the hopper area can assist in controlling CI dust (Figures 5 and 6). The figures show an
exhaust fan and baffles around the sides of the hopper. The baffles keep the CI dust in a controlled area, and the fan
blows the dust to the outside of the truck. (Note: Figure 5 - High winds could decrease the effectiveness of the
exhaust fan). Implementing engineering controls in other CI applications is not a practical solution to controlling
dust concentrations. Instead, because VEM indicated that employees had greater exposure potential when applying
CI in corners and near the body, workers should minimize these practices when possible to reduce exposure potential.
This may be accomplished by using a lightweight pole that extends approximately 4 feet from the end of the
application hose. The extension has handles so the workers can manipulate the hose into tight areas without entering
the areas themselves.
The wide range of dust concentrations measured during CI applications complicates the respirator selection process
for the industry. The exposure data in this report indicate that workers were exposed to CI total dust concentrations
above the OSHA PEL. Therefore, until engineering controls and work practices are developed to reduce exposures
to safe levels, the OSHA Respiratory Protection Standard (29 CFR 1910) requires that employers provide respirators
to CI workers and establish and maintain respiratory protection programs in accordance with the standard’s
requirements.

54 Cellulose Insulation, NTP TOX 74
FIGURE 5 Proposed Engineering Control for Hopper Area
FIGURE 6 Proposed Engineering Control (#2) for Hopper Area

55 Cellulose Insulation, NTP TOX 74
Respirators typically have an assigned protection factor (APF), which describes the level of respiratory protection
that should be expected when an employee has been fit tested and has received appropriate training. Based on the
OSHA PEL for total dust, the APF for each respirator, and the variations in CI total dust concentrations, employees
in all CI-related activities (installers, hopper operators, and recyclers) should wear at minimum a disposable half-
mask particulate-filtering respirator. Respirators should be quantitatively fit-tested and NIOSH-approved with an
N95 designation (NIOSH, 1996). The N95 designation indicates that the filter material has been shown to remove
95% of particles greater than or equal to 0.3 mm. Although there is no APF for disposable respirators, a NIOSH
(1997) document on histoplasmosis suggests an APF of 5 to 10. NIOSH is currently studying disposable respirators
to determine an official APF.
The exposure data indicate that there are instances, such as dry attic applications, where a more protective respirator
should be used. Elastomeric half-face air-purifying respirators with N95 filters have an APF of 10 and are acceptable
for dust concentrations 10 times the OSHA PEL (150 mg/m3). Elastomeric full-face air-purifying respirators have
an APF 50 times the PEL (750 mg/m3) with the added benefit of eye protection. Employers should review the
exposure data and choose the most appropriate respiratory protection for their workers.
Twenty-three workers were studied for possible health effects associated with CI exposure. These workers reported
a variety of symptoms that may or may not be associated with their workplace exposure to CI. The most common
chronic respiratory symptom reported was morning phlegm production. However, most of the workers who reported
the symptom were current smokers, which could also explain their symptoms.
Eye irritation was the most common symptom related to CI exposure that was reported on the questionnaire. Thirty-
five percent of the workers reported having eye symptoms that were worse during CI exposure. These symptoms
may be caused by dust or by additives, such as boric acid. Most workers did not wear eye protection and reported
that their eye symptoms improved once exposure ended. Cough and nasal symptoms were also reported relatively
frequently, but they were not temporally related to CI exposure.
None of the workers had evidence of bronchial hyperreactivity (percent amplitude means of greater than 20%), an
indication of occupational asthma. However, studying such a small number of workers decreased the likelihood of
finding bronchial hyperreactivity (Bernstein and Bernstein, 1997). Also, PEFR was measured mostly at work, which
limits the ability to detect the maximum change in PEFR that may have occurred. Measuring PEFR on workdays
only and not on weekends or extended times away from work reduces the likelihood of seeing work-related patterns
or delayed effects. A few workers reported lower respiratory tract symptoms, but these symptoms were classified as
mild and infrequent and did not worsen with continued exposure.

56 Cellulose Insulation, NTP TOX 74

PLATE 1 PLATE 2 Scanning electron micrograph (SEM) of respirable particles collected on filters SEM of respirable particles collected on filters from the sampling chamber. from the sampling chamber. Cellulose insulation (CI) sample 1. CI sample 2.
PLATE 3 PLATE 4 SEM of respirable particles collected on filters from the sampling chamber. SEM of respirable particles collected on filters from the sampling chamber. CI sample 3. CI sample 4.

PLATE 5 Rat lung 28 days after intratracheal instillation of phosphate buffered saline (controls). Tissue sections were stained with Masson’s trichrome stain for collagen (blue fibrils); 20× magnification.
PLATE 6 Rat lung 28 days after intratracheal instillation (5 mg/kg) of CI. Tissue sections were stained with Masson’s trichrome stain for collagen (blue fibrils); 20× magnification.
PLATE 7 Rat lung 28 days after intratracheal instillation (5 mg/kg) of titanium dioxide (TiO2). Tissue sections were stained with Masson’s trichrome stain for collagen (blue fibrils); 20× magnification.

PLATE 8 PLATE 9 Rat lung 28 days after intratracheal instillation (5 mg/kg) of CI. Tissue sections Rat lung 28 days after intratracheal instillation (5 mg/kg) of TiO2. Tissue sections
were stained with hematoxylin and eosin; 60× magnification. A green, spicular were stained with hematoxylin and eosin; 60× magnification. Black particle-laden
material was occasionally present within nodular foci in CI-treated lungs (arrow). alveolar macrophages are present in TiO -treated lungs (arrows).2

PLATE 10 Example of a group of CI fibers from SEM analysis.
PLATE 11 Example of CI fiber. Note the variation in fiber diameter.

57
REFERENCES
Adamson, G.M., Muhle, H., Creutzenberg, O., Bellmann, B., and Dasenbrock, C. (1999). Effects of different
cellulose-containing respirable samples in the lung of Fischer 344 rats [Abstract]. Toxicologist 53, 552.
American Conference of Governmental Industrial Hygienists (ACGIH) (1991). Particulates not otherwise classified
(PNOC). Threshold Limit Values for Chemical Substances and Physical Agents and Biological Exposure Indices.
Cincinnati, OH.
American Conference of Governmental Industrial Hygienists (ACGIH) (2003). 2003 TLVs® and BEIs® . Threshold
Limit Values for Chemical Substances and Physical Agents and Biological Exposure Indices. Cincinnati, OH.
American Society for Testing and Materials (ASTM) (1991). Standard specification for cellulosic fiber (wood base)
loose-fill thermal insulation (ASTM C1149-93), Philadelphia, PA.
American Society for Testing and Materials (ASTM) (1997). Standard specification for self-supported spray applied
cellulosic thermal insulation (ASTM C1149-97), Philadelphia, PA.
Anonymous (1977). Paper being recycled for use in insulation. Timber Producer 10, 38.
Anonymous (1979). The production and laboratory testing of cellulose fibre. Insulation July/August, 5-8.
Anonymous (1980a). Cellulose insulation reviving. Pulp & Paper January, 23.
Anonymous (1980b). Layer former aids production of Cellcem board. Pulp & Paper January, 27.
Anonymous (1981). Insulation is thriving, but glass fiber’s share lags. Chemical Week March 11, 321.
Anonymous (1984). Building insulation sales. Construction Review 30, 2-3.
Anonymous (1990). Tapping into new markets with sprayed cellulose. Roofing Siding Insulation November, 24-26.

58 Cellulose Insulation, NTP TOX 74
Anonymous (1991). Business turns recycled newspapers into insulation. Cell-Pak: Makes home insulation out of
recycled newspapers. Birmingham News February 24, D1, D4.
Baron, P.A. (1993). Measurement of asbestos and other fibers. In Aerosol Measurement (K. Willeke and P.A. Baron,
Eds.), pp. 564-565. Van Nostrand Reinhold, New York.
Barton, D.R., Friedman, D.B., Post, H.A., and Williams, F.E. (1981). Marketing Information Report: Waste
Newspapers in Four South Atlantic States 1980 (NBS-GCR 82-371; US NTIS PB82-170382), Bureau of Industrial
Economics, U.S. Department of Commerce, Washington, DC.
Bernstein, J.A., and Bernstein, I.L. (1997). Occupationally induced asthma. In Allergy, 2nd ed. (A.P. Kaplan, Ed.),
pp. 511-524. W.B. Saunders Company, Philadelphia, PA.
Bird, T.O., White, J., and Bird, C.H. (1980). Fire-retardant cellulose insulation and process for making same.
Assignee: White-Bird Enterprises, Inc. (Patent No. US 4,230,585).
Brittan, R.F., Studley, J.G., Parkin, J.V., Rowles, P.M., and Le Quesne, L.P. (1984). Cellulose granulomatous
peritonitis. Br. J. Surg. 71, 452-453.
Chrenka, G.A. (1980). Use of secondary fiber for insulation. In Proceedings of the Technical Association of the Pulp
and Paper Industry, 1980 Pulping Conference, pp. 141-143. Technical Association of the Pulp and Paper Industry,
Atlanta, GA.
Cohn, L. (1981). Cellulose insulation industry plans certification program. Energy User News 6, 1, 11.
Code of Federal Regulations (CFR) 16, Part 460.
Code of Federal Regulations (CFR) 29, Parts 1910, 1915, and 1926.
Culver, B.D., Shen, P.T., Taylor, T.H., Lee-Feldstein, A., Anton-Culver, H., and Strong, P.L. (1994). The relationship
of blood- and urine-boron to boron exposure in borax-workers and the usefulness of urine-boron as an exposure
marker. Environ. Health Perspect. 102 (Suppl. 7), 133-137.
Davis, J. (1993). The need for standardised testing procedures for all products capable of liberating respirable fibres;
the example of materials based on cellulose. Br. J. Ind. Med. 50, 187-190.

59 Cellulose Insulation, NTP TOX 74
Ericsson, J., Järvholm, B., and Norin, F. (1988). Respiratory symptoms and lung function following exposure in
workers exposed to soft paper tissue dust. Int. Arch. Occup. Environ. Health 60, 341-345.
Fail, P.A., George, J.D, Grizzle, T.B., Heindel, J.J., and Chapin, R.E. (1990). Final report on the repoductive toxicity
of boric acid (CAS No. 10043-35-3) in Swiss (CD-1) mice. United States Department of Health and Human
Services, National Toxicology Program (NTP Report No. 90-105). Research Triangle Park, NC.
Fail, P.A., George, J.D., Seely, J.C., Grizzle, T.B., and Heindel, J.J. (1991). Reproductive toxicity of boric acid in
Swiss (CD-1) mice: Assessment using the continuous breeding protocol. Fundam. Appl. Toxicol. E17, 225-239.
Gressel, M.G., Heitbrink, W.A., McGlothlin, J.D., and Fischback, T.J. (1987). Real-time, integrated, and ergonomic
analysis of dust exposure during manual materials handling. Appl. Ind. Hyg. 2, 108-113.
Gressel, M.G., Heitbrink, W.A., McGlothlin, J.D., and Fischback, T.J. (1988). Advantages of real-time data
acquisition for exposure assessment. Appl. Ind. Hyg. 3, 316-320.
Hadley, J.G., Kotlin, P., and Bernstein, D.M. (1992). Subacute (28 days) repeated dose inhalation toxicity of
cellulose building insulation in the rat. Toxicologist 12, 225.
Heederik, D., Burdorf, L., Boleij, J., Willems, H., and van Bilsen, J. (1987). Pulmonary function and intradermal
tests in workers exposed to soft-paper dust. Am. J. Ind. Med. 11, 637-645.
Heindel, J.J., Price, C.J., Field, E.A., Marr, M.C., Myers, C.B., Morrissey, R.E., and Schwetz, B.A. (1992).
Developmental toxicity of boric acid in mice and rats. Fundam. Appl. Toxicol. 18, 266-277.
Higgins, B.G., Britton, J.R., Chinn, S., Cooper, S., Burney, P.G., and Tattersfield, A.E. (1992). Comparison of
bronchial reactivity and peak expiratory flow variability measurements for epidemiologic studies. Am. Rev. Respir.
Dis. 145, 588-593.
ICF, Inc. (1977). Supply Response to Residential Retrofit Demand (Federal Energy Administration Report
No. FEA/B-77/303; NTIS PB-27- 445).
Järvholm, B., Thoren, K., Brolin, I., Ericsson, J., Morgan, U., Tylen, U., and Bake, B. (1988). Lung function in
workers exposed to soft paper dust. Am. J. Ind. Med. 14, 457-464.
Kelman, B.J., Swenson, L.J., Uppala, L.V., Cohen, J.M., Millette, J.R., and Mueller, W.F. (1999). Chemical
components of shredded paper insulation: A preliminary study. Appl. Occup. Environ. Hyg. 14, 192-197.

60 Cellulose Insulation, NTP TOX 74
Ku, W.W., Chapin. R.E., Wine, R.N., and Gladen, B.C. (1993). Testicular toxicity of boric acid (BA): Relationship
of dose to lesion development and recovery in the F344 rat. Reprod. Toxicol. 7, 305-319.
Lea, D. (1995). Personal communication by telephone to Maureen King, Technical Resources International, Inc.,
from Daniel Lea, Cellulose Insulation Manufacturers Association, 5/11/95. Prepared for NTP by Technical
Resources International, Inc., under NCI Contract No. N01-CP-56019 (6/95) 23, Cellulose Insulation.
Levin, L., and Purdom, P.W. (1983). A review of the health effects of energy conserving materials. Am. J. Public
Health 73, 683-690.
McConnell, E.E. (1994). Personal communication [letter, July 22] from Ernest McConnell, Consultant in Toxicology
and Pathology, Raleigh, NC, to Errol Zeiger, National Toxicology Program, Research Triangle Park, NC.
McDonald, J.W., Alvarez, F., and Keller, C.A. (2000). Pulmonary alveolar proteinosis in association with household
exposure to fibrous insulation material. Chest 117, 1813-1817.
The Merck Index (1996). 12th ed. (S. Budavari, Ed.), p. 1365. Merck and Company, Rahway, NJ.
Morgan, D.L., Shines, C.J., Jeter, S.P., Blazka, M.E., Elwell, M.R., Wilson, R.E., Ward, S.M., Price, H.C., and
Moskowitz, P.D. (1997). Comparative pulmonary absorption, distribution, and toxicity of copper gallium diselenide,
copper indium diselenide, and cadmium telluride in Sprague-Dawley rats. Toxicol. Appl. Pharmacol. 147, 399-410.
Muhle, H., Ernst, H., and Bellmann, B. (1997). Investigation of the durability of cellulose fibres in rat lungs. Ann.
Occup. Hyg. 41 (Suppl. 1), 184-188.
National Institute for Occupational Safety and Health (NIOSH) (1985). Duluth Community Action Program, Duluth,
MN. HETA 84-213, 391-1619. NIOSH, Cincinnati, OH.
National Institute for Occupational Safety and Health (NIOSH) (1990). Westside Energy Co-op, Denver, CO.
HETA 90-151-L2067 (NTIS PB91- 152025). NIOSH, Cincinnati, OH.
National Institute for Occupational Safety and Health (NIOSH) (1992). Analyzing Workplace Exposures Using
Direct Reading Instruments and Video Exposure Monitoring Techniques (Publication No. 92-104). NIOSH,
Cincinnati, OH.
National Institute for Occupational Safety and Health (NIOSH) (1994). NIOSH Manual of Analytical Methods,
4th ed. (Publication No. 94-113). NIOSH, Cincinnati, OH.

61 Cellulose Insulation, NTP TOX 74
National Institute for Occupational Safety and Health (NIOSH) (1996). NIOSH Guide to the Selection and Use of
Particulate Respirators Certified under 42 CFR 84 (Publication No. 96-101). NIOSH, Cincinnati, OH.
National Institute for Occupational Safety and Health (NIOSH) (1997). Histoplasmosis-Protecting Workers at Risk.
(Publication No. 97-146). NIOSH, Cincinnati, OH.
National Institute for Occupational Safety and Health (NIOSH) (2001). NIOSH Exposure Assessment of Cellulose
Insulation Applicators. Health Hazard Evaluation Report, HETA 2000-0322-2827. NIOSH, Cincinnati, OH.
National Toxicology Program (NTP) (1989). Final Report on the Developmental Toxicity of Boric Acid (CAS
No. 10043-35-3) in CD-1 Swiss mice (NTP Report No. 89-250). U.S. Department of Health and Human Services,
National Toxicology Program, Research Triangle Park, NC.
National Toxicology Program (NTP) (1990). Final Report on the Reproductive Toxicity of Boric Acid (CAS
No. 10043-35-3) in CD-1 Swiss Mice (NTP Report No. 90-105). U.S. Department of Health and Human Services,
National Toxicology Program, Research Triangle Park, NC.
Neisel, R.H., and Verschoor, J.D. (1981). Insulation, thermal. In Kirk-Othmer Encyclopedia of Chemical
Technology, 3rd ed. (M. Grayson and D. Eckroth, Eds.), Vol. 13, pp. 600-601. John Wiley and Sons, Inc., New York.
Price, C.J., Marr, M.C., Myers, C.B., Seely, J.C., Heindel, J.J., and Schwetz, B.A. (1996). The developmental
toxicity of boric acid in rabbits. Fundam. Appl. Toxicol. 34, 176-187.
Rusch, G.M., Hoffman, G.M., McConnell, R.F., and Rinehart, W.E. (1986). Inhalation toxicity studies with boron
trifluoride. Toxicol. Appl. Pharmacol. 83, 69-78.
Sinanoglu, E. (1994). Pass on the pink stuff when you pick insulation. Money 23, 182.
Sokal, R.R., and Rohlf, F.J. (1981). Biometry: The Principles and Practice of Statistics in Biological Research,
2nd ed. W.H. Freeman and Company, San Francisco.
Stokinger, H.E., and Speigel, C.J. (1953). Special materials, Part A: Inhalation toxicity studies of boron halides and
certain fluorinated hydrocarbons. In Pharmacology and Toxicology of Uranium Compounds: Chronic Inhalation
and Other Studies (C. Voegtlin and H.C. Hodge, Eds.) pp. 2291-2321. McGraw-Hill, New York.
Tatrai, E., Adamis, Z., Bohm, U., Meretey, K., and Ungvary, G. (1995). Role of cellulose in wood dust-induced
fibrosing alveo-bronchiolitis in rat. J. Appl. Toxicol. 15, 45-48.

62 Cellulose Insulation, NTP TOX 74
Tharr, D. (1991). Asbestos exposure during low-income housing weatherization. Appl. Occup. Environ. Hyg. 6,
347-348.
Thoren, K., Järvholm, B., and Morgan, U. (1989). Mortality from asthma and chronic obstructive pulmonary disease
among workers in a soft paper mill: A case-referent study. Br. J. Ind. Med. 46, 192-195.
Tiesler, H., and Schnitteger, J. (1992). Investigation of fibrous dust emission from cellulose insulating materials
during installation (Ger.). Zentralbl. Arbeitsmed. Arbeitsshutz. Prophyl. Ergon. 42, 278-285.
Torkelson, T.R., Sadek, S.E., and Rowe, V.K. (1961). The toxicity of boron trifluoride when inhaled by laboratory
animals. Am. Ind. Hyg. Assoc. J. 22, 263-270.
Treinen, K.A., and Chapin, R.E. (1991). Development of testicular lesions in F344 rats after treatment with boric
acid. Toxicol. Appl. Pharmacol. 107, 325-335.
Welteke, U. (1993). Comments on investigation of fibrous dust (Ger.). Zentralbl. Arbeitsmed. Arbeitsshutz. Prophyl.
Ergon. 43, 50-51.
Wilding, J.L., Smith, W.J., Yevich, P., Sicks, M.E., Ryan, S.G., and Punte, C.L. (1959). The toxicity of boron oxide.
Am. Ind. Hyg. Assoc. J. 20, 284-289.
Woessner, J.F., Jr. (1961). The determination of hydroxyproline in tissue and protein samples containing small
proportions of this amino acid. Arch. Biochem. Biophys. 93, 440-447.
Zeltner, T.B., Nussbaumer, U., Rudin, O., and Zimmerman, A. (1982). Unusual pulmonary vascular lesions after
intravenous injections of microcrystalline cellulose. A complication of pentazocine tablet abuse. Virchows Arch. A.
Pathol. Anat. Histol. 395, 207-216.
Zicherman, J.B., and Fisher, F.L. (1978). Fire Protection Problems Associated with Cellulose Based Insulation
Products (Technical Report No. SFPE-TR-78-7). Society of Fire Protection Engineering, Boston, MA.

A-1
APPENDIX ACELLULOSE INSULATION APPLICATION
AND FIELD STUDIES RESULTS
TABLE A1 Total and Respirable Dust Sampling Results . . . . . . . . . . . . . . . . . . . . . . . . . . . . . . . . . . . . . . A-2 TABLE A2 Fiber Characterization of Cellulose Insulation Application in Air Samples
by Scanning Electron Microscopy . . . . . . . . . . . . . . . . . . . . . . . . . . . . . . . . . . . . . . . . . . . . . . . A-25 TABLE A3 Chemical Elements in Bulk Samples of Cellulose Insulation – Water Extraction . . . . . . . . A-29TABLE A4 Chemical Elements in Bulk Samples of Cellulose Insulation – Strong Acid Extraction . . . A-31TABLE A5 Estimated Particle Size Data from Real-Time Particulate Measurements . . . . . . . . . . . . . . A-33FIGURE A1 Video Exposure Monitoring of Cellulose Installation Activities in the Attic . . . . . . . . . . . . . A-34FIGURE A2 Video Exposure Monitoring of Cellulose Installation Activities in the Truck . . . . . . . . . . . A-35

Sample Sample Sample 8-hour Location Time Volume Concentration TWA
(military) (liters) (mg/m3) (mglm3)
-----~~~~~~~!!~~~~~~~~~~~~~-~~~-a~-~~~~~~-~~~~n!~~!~~~~~!:~st~~~~~!~~n~~~~~~-~~~~~~c~~~~~---Area (total) - Inside truck - near hopper 1000-1047 90 100.9 9.88
Area (total) - Inside attic, on rafter, middle of attic 1009-1052 85.4 52.31 4.69
PBZ (total)- Hopper operator sample 1000-1045 88.5 100.4 9.41
PBZ (total)- CI installer sample 1006-1046 78.8 109.3 9.11
Area (respirable)- Inside truck- near hopper 1000-1047 79.3 0.57 0.06
Area (respirable) - Inside attic, on rafter, middle of attic 1009-1052 71.8 2.65 0.24
Results of January 13, 1998, area and PBZ air sampling during an existing residential wall CI application.
Area (total) - In truck on hose holder 1410- 1438 27.6 0.725 0.04
PBZ (total)- Wall CI installer- upstairs and basement 1354-1437 84.7 8.74 0.78
PBZ (total)- Hopper operator -using HAM instrument 1404-1445 82 1.22 0.10
Area (respirable)- In truck on hose holder 1410- 1438 47.2 0.636 0.04
Results of January 14, 1998, area and PBZ air sampling during an existing residential attic CI application.
Area (total)- In truck above hopper 1328-1352 24.8 29.44
Area (total)- 2"d sample - in truck- hopper 1352-1500 70.2 31.77 5.97
Area (total)- west side of house- close to attic 1333-1444 64.9 8.48 1.25 entrance
PBZ (total)- Hopper operator sample 1326-1357 31.4 8.92
PBZ (total)- 2"d Hopper operator sample 1357-1457 60.8 10.69
PBZ (total)- 3'd Hopper operator sample- using HAM instrument
1421- 1457 72 6.81 2.42
PBZ (total)- CI installer sample 1427-1442 14.7 68.71
PBZ (total)- 2"d CI installer sample- using HAM instrument
1339-1356 34 27.94 3.14
Area (respirable)- west side of house- close to attic 1333-1444 108.8 1.38 0.20 entrance
Area (respirable)- In truck above hopper 1328-1500 153 1.24 0.24
A-2 Cellulose Insulation, NTP TOX 74
TABLE A1 Total and Respirable Dust Sampling Resultsa
Contractor 1

Sample Sample Sample 8-hour Location Time Volume Concentration TWA
(military) (liters) (mg/m3) (mg/m3)
Results of April 27, 1998, area and PBZ air sampling during a new residential attic CI application. ----------------------------------------------- ------------ -------- ------------- ---------Area (total)- Indoor background 0941-1243 190 0.58
Area (total)- Attic sample- near attic entrance 1031- 1150 80.1 98.1 16.2
Area (total)- Hopper sample- tort. of hopper 1028-1244 140 5.08 1.44
PBZ (total)...,.. CI installer 1027-1051 25.7 220
PBZ (total)- 2nd attic sample- CI installer 1051-1135 47.2 199
PBZ (total)- 3'd attic sample- CI installer 1135-1146 11.8 431 39.0
PBZ (total)- Hopper operator 1029-1244 138 18.1 5.08
Area (respirable)- Indoor background 0941-1243 319 ND
Area (respirable)- Attic sample- near attic entrance 1031 -1150 138 1.38 0.23
Area (respirable)- Hopper sample- to rt. of hopper 1028-1245 237 0.29 0.08
Results of April28, 1998, area and PBZ air sampling during an existing residential garage ceiling CI application.
Area (total)- Garage sample- middle steel support 1029-1107 38.4 ND
Area (total)- 2nd garage sample- middle steel support 1334-1622 170 4.06 1.42
Area (total)- Hopper sample- tort. of hopper 1035-1110 207 1.70 0.72 1338-1627
PBZ (total)- Garage ceiling- drilling drywall 0939- 1009 30.3 32.3
PBZ (total)- Garage ceiling- CI application 1028- 1106 207 21.9 11.4 1334- 1621
PBZ (total)- Hopper operator 1037- 1107 202 12.9 5.41 1337-1627
Area (respirable)- Garage sample- middle steel 1029-1107 353 0.11 0.05 support 1334-1622
Area (respirable)- Hopper sample- to rt. of hopper 1035- 1110 345 0.06 0.03 1338-1627
A-3 Cellulose Insulation, NTP TOX 74
TABLE A1 Total and Respirable Dust Sampling Results
Contractor 2

Sample Sample Sample 8-hour Location Time Volume Concentration TWA
(military) (liters) (mg/m3) (mg/m3)
Results of Apri129, 1998, area and PBZ air sampling during an existing residential attic CI application. ----------------------------------------------- ------------ -------- ------------- ---------Area (total)- Attic above garage- driveway side- on 1143- 1303 117 23.1 5.34 rafter 1349-1420
Area (total)- Hopper sample- to rt. of hopper 1205-1306 102 1.67 0.35 1349-1428
PBZ (total)- CI installer sample 1143 -1237 54.1 54.2
PBZ (total)- 2"d CI installer sample 1237-1302 70.1 105 21.4 1349-1434
PBZ (total)- Hopper operator sample 1135-1302 88.3 20.4
PBZ (total)- 2"d Hopper operator sample 1353-1428 35.5 94.4 10.6
Area (respirable)- Attic above garage- driveway side 1143-1303 192 0.84 0.19 -on rafter 1349-1420
Area (respirable)- Hopper sample- tort. of hopper 1205-1306 171 ND ND 1349-1428
Results of April30, 1998, area and PBZ air sampling during an existing residential attic CI application.
Area (total)- Attic prep.- near attic entrance 1023-1212 107 5.12
Area (total) - CI application - near attic entrance 1307-1354 46.3 38.2 4.91
Area (total)- Hopper sample- rt. of hopper 1308-1446 99.5 5.33 1.09
PBZ (total)- attic preparation- using fiberglass 1027-1209 99.1 41.5
PBZ (total)- CI installer sample 1306-1331 24.3 164
PBZ (total)- 2"d CI installer sample 1331 -1350 18.5 50.3 18.8
PBZ (total)- Hopper operator sample 1310-1446 99.1 32.8 6.56
Area (respirable)- Attic prep.- near attic entrance 1032- 1212 169 0.65
Area (respirable)- CI application- near attic entrance 1307-1354 79.6 3.52 0.48
Area (respirable)- Hopper sample- rt. of hopper 1308-1446 169 0.47 0.10
A-4 Cellulose Insulation, NTP TOX 74
TABLE A1 Total and Respirable Dust Sampling Results
Contractor 2 (continued)

Sample Sample Sample 8-hour Location Time Volume Concentration TWA
(military) (liters) (mg/m3) (mg/m3)
Results of July 7, 1998, area and PBZ air sampling during an existing residential wall CI application. ----------------------------------------------- ----------~- -------- ----------------------Area (total)- Indoor background 0920-1148 150 0.67
Area (total)- Hopper sample- tort. of hopper 0917- 1145 151 1.06 0.33
PBZ (total)- CI installer sample 0926-1001 34.8 78.7
PBZ (total)- 2"d CI installer sample 1001 -1038 36.8 43.7
PBZ (total)- 3'd CI installer sample 1107- 1145 37.8 51.8 13.2
PBZ (total)- Wall hole driller 0925-1038 73.7 14.7
PBZ (total)- 2"d wall hole driller sample 1056-1147 51.5 13.6 3.68
PBZ (total)- Hopper operator sample 0920-1040 78.1 8.58
PBZ (total)- 2"d Hopper operator sample 1057- 1149 50.7 10.1 2.52
Area (respirable)- Indoor background 0920-1148 246 ND
Area (respirable)- Hopper sample- tort. of hopper 0915- 1145 251 ND ND
Results of July 8, 1998, area and PBZ air sampling during a new residential attic CI application.
Area (total)- 1 '1 attic- near entrance 0938-1000 22.2 58.2
Area (total)- 2"d attic- near entrance 1045- 1103 18.1 29.8 3.78
Area (total)- Hopper sample- 151 attic install 0937- 1011 34.8 6.03
Area (total)- Hopper sample- 2"d attic install 1045- 1108 23.6 12.3 1.02
Area (total)- Background sample- in house 0903-1130 151 0.53
PBZ (total)- CI installer sample- 151 attic 0938-0951 13.2 141
PBZ (total)- 2"d CI installer sample- 151 attic 0951-1000 9.11 Ill
PBZ (total)- 3rd CI installer sample- 2"d attic 1045- 1055 10.1 70.2
PBZ (total)- 4th CI installer sample- 2"d attic 1055- 1110 15.2 89.6 10.2
PBZ (total)- Hopper operator sample- 1st attic 0936- 1005 28.2 20.2
PBZ (total)- 2"d Hopper operator sample- 2nd attic 1041- 1102 20.4 21.1
PBZ (total)- 3'd Hopper operator sample- 2"d attic 1102-1108 5.83 17.2 2.36
Area (respirable)- 1 '1 attic- near entrance 0938-1000 38.6 2.59
Area (respirable)- 2"d attic- near entrance 1045- 1103 31.6 1.58 0.18
Area (respirable)- Hopper sample- 1 '1 attic install 0937- 1011 60.0 ND Area (respirable)- Hopper sample- 2"d attic install 1045- 1108 40.6 ND ND
Area (respirable)- Background sample- in house 0903-1130 249 ND
A-5 Cellulose Insulation, NTP TOX 74
TABLE A1 Total and Respirable Dust Sampling Results
Contractor 3

Sample Sample Sample 8-hour Location Time Volume Concentration TWA
(military) (liters) (mg/m3) (mg/m3)
Results of July 9, 1998, area and PBZ air sampling during two existing residential attic CI applications. ----------------------------------------------- ------------ -------- ----------------------Area (total)- I 51 attic- near entrance 0957 -I04I 44.5 I9.1
Area (total)- 2"d attic- near entrance 1305-1325 20.2 I0.9 2.21
Area (total)- Hopper sample- I 51 and 2"d attic 1001-1057 76.9 22.8 3.56 1310-1329
PBZ (total)- Prep. work- 2 unit attic- worker #1 0840-0925 45.9 2.17
PBZ (total)- Prep. work- 2 unit attic- worker #2 084I- 0925 45.4 22.5
PBZ (total)- CI installer sample- 151 attic 0954-10I6 22.4 73.8
PBZ (total)- 2"d CI installer sample- 151 attic 10I6 -I054 38.6 72.7
PBZ (total)- 3n1 CI installer sample- 2nd attic 1304-1318 14.2 16.2
PBZ (total)- 4th CI installer sample- 2"d attic 1318-1333 15.3 21.0 10.3
PBZ (total)- Hopper operator sample- worker #1 0958-1021 1310-1329
42.3 34.8 3.25
PBZ (total) - Hopper operator sample -worker #2 I021-1057 36.2 18.5 3.45
Area (respirable) - 151 attic -near entrance 0957-1041 73.7 1.22
Area (respirable)- 2"d attic- near entrance 1305-1325 33.5 0.89 0.15
Area (respirable) -Hopper sample - 151 and 2nd attic IOOI- 1057 I30 0.93 0.15 1310- 1329
Results of July 10, 1998, area and PBZ air sampling during an existing residential attic CI application.
Area (total)- Attic application- near entrance 1328- 1341 13.3 12.8
Area (total)- Attic sample #2- near entrance 1341- 1355 14.3 7.68 0.57
Area (total)- Hopper sample 1335-1407 31.8 25.8 1.72
PBZ (total)- CI installer sample 1325-1344 18.9 22.1
PBZ (total)- 2nd CI installer sample 1344-1403 18.9 32.1 2.15
PBZ (total)- Hopper operator sample 1336-1407 31.4 47.1 3.04
Area (respirable) -Attic application- near entrance 1328-1356 45.7 1.09 0.06
!Area (resnirable)- Honner samnle 1135-1407 A:i4.8 0.55 0.04
A-6 Cellulose Insulation, NTP TOX 74
TABLE A1 Total and Respirable Dust Sampling Results
Contractor 3 (continued)

Sample Sample Sample 8-hour Location Time Volume Concentration TWA
(military) (liters) (mg/m3) (mg/m3)
--~C:.S_!I~~~~!~~~~~~!~~!~~~!.~~~~_a-~~!-~~-~i!_~~~p~in_~~_!l!~~~-a-~~w-~~~-~~!c~~-~~!~~~-~~li~~~~!: __
Area (total)- Indoor background 1117- 1656 345 0.44
Area (total)- Hopper sample- to rt. of hopper 0924-1104 102 11.5
Area (total)- 2"d hopper sample 1104-1358 178 11.0
Area (total)- 3rt1 hopper sample 1358-1705 191 17.8 13.4
PBZ (total)- CI installer sample 0925-1100 98.7 16.0
PBZ (total)- 2"d CI installer sample 1138-1359 147 19.9
PBZ (total)- 3'd CI installer sample 1359-1702 190 30.7 20.7
PBZ (total)- Hopper/roller operator sample 0927-1102 95.1 11.1
PBZ (total)- 2"d Hopper/roller operator sample 1102-1400 178 10.2
PBZ (total)- 3n1 Hopper/roller operator sample 1400-1703 183 33.3 18.7
PBZ (total)- Worker with misc. tasks sample 1142- 1401 141 32.3
PBZ (total)- 2"d Worker with misc. tasks sample 1401-1703 184 19.5 16.7
Area (respirable)- Indoor background 1117-1656 597 0.07
Area (respirable)- Hopper sample- tort. ofhopper 0924-1705 779 0.28 0.27
Results of August 11, 1998, area and PBZ air sampling during a new commercial wall CI application.
Area (total)- Indoor background 0856-1401 327 0.65
Area (total)- Hopper sample- to rt. of hopper 1043-1325 164 16.9
Area (total)- 2"d Hopper sample 1325-1357 32.5 13.9 6.64
PBZ (total)- CI installer sample 1123 -1329 126 27.9
PBZ (total)- 2"d CI installer sample 1329- 1351 22.0 14.2 7.97
PBZ (total)- Hopper/roller operator sample 1134- 1328 113 9.39
PBZ (total)- 2"d Hopper/roller operator sample 1328- 1359 30.8 20.6 3.56
PBZ (total)- Worker with misc. tasks sample 0935-1051 96.7 3.43 0.69 1129-1149
Area (respirable)- Indoor background 0856-1401 522 0.64
Area (respirable)- Hopper sample- tort. of hopper 1043 -1357 327 0.17 0.07
A-7 Cellulose Insulation, NTP TOX 74
TABLE A1 Total and Respirable Dust Sampling Results
Contractor 4

Sample Sample Sample 8-hour Location Time Volume Concentration TWA
(military) (liters) (mg/m3) (mg/m3)
-~e!~~~~~~~~~~~~~:~~~~~~~~~~!_n_~!~~-~~!!_~P!~g-~~~~~~~-o-~e~~~~~~~t~~-~~~~~!-~~~li5~!~~!:_ Area (total)- 1 '1 attic- near entrance 0958-1035 38.5 0.31
Area (total)- 2"d attic- near entrance 1210- 1343 96.7 0.85 0.11
Area (total)- 1st attic hopper sample 0955-1042 47.8 6.74
Area (total)- 2"d attic hopper sample 1207- 1356 111 0.74 0.83
PBZ (total)- I st attic CI installer sample 0954- 1042 48.2 3.57
PBZ (total)- 2"d attic CI installer sample 1209-1356 107 3.18 2.28
PBZ (total)- 1st attic hopper operator sample 0959-1043 45.0 9.82
PBZ (total)- 2"d attic hopper operator sample 1206-1355 112 8.45 1.61
Area (respirable)- 1st attic- near entrance 0958-1035 62.9 1.18
Area (respirable)- 2"d attic- near entrance 1210- 1343 158 ND 0.09
Area (respirable)- 1'1 attic hopper sample 0955-1042 79.5 0.93
Area (respirable)- 2"d attic hopper sample 1207-1356 184 0.35 0.17
Results of August 13, 1998, area and PBZ air sampling during a new residential attic CI application.
Area (total)- Attic- near entrance 0845-1050 128 0.72 0.19
Area (total)- Hopper sample- rt. of hopper 0842-1052 133 2.73 0.74
PBZ (total)- CI installer sample 0843-0949 67.5 2.99
PBZ (total)- 2"d CI installer sample 0949-1054 64.7 1.27 0.95
PBZ (total)- Hopper operator sample 0937-0947 9.95 0.82
PBZ (total) - 2"d hopper operator sample 0950-1051 62.3 4.20 0.34
Area (respirable)- Attic- near attic entrance 0845-1050 217 ND ND
Area (respirable)- Hopper sample- rt. of hopper 0842-1052 221 0.29 0.08
A-8 Cellulose Insulation, NTP TOX 74
TABLE A1 Total and Respirable Dust Sampling Results
Contractor 4 (continued)

Sample Sample Sample 8-hour Location Time Volume Concentration TWA
(military) (liters) (mg/m3) (mg/m3)
Results of September 29, 1998, area and PBZ air sampling during three new residential attic CI applications. ----------------------------------------------- ------------ -------- -----------------------Area (total)- Attic sample (1 '1 attic) 0937-1029 52.9 2.08
Area (total) -Attic sample (2"d attic) 1314-1358 44.8 5.13
Area (total)- Attic sample (3'd attic) 1642-1658 16.3 9.82 1.02
Area (total)- Hopper sample (1st attic) 0931-1102 95.6 3.98
Area (total)- Hopper sample (2"d attic) 1311-1455 109 60.9
Area (total)- Hopper sample (3'd attic) 1639- 1805 90.3 11.2 16.0
PBZ (total)- CI installer sample (1'1 attic) 0929-1059 88.4 18.6
PBZ (total)- CI installer sample (2"d attic) 1312-1438 84.5 35.5
PBZ (total)- 2nd CI installer sample (2nd attic) 1438-1454 15.7 24.8
PBZ (total)- CI installer sample (3rd attic) 1635- 1800 83.5 16.2 13.5
PBZ (total)- Hopper operator sample (1st attic) 0931-1059 89.3 19.4
PBZ (total)- Hopper operator sample (2"d attic) 1311-1455 106 9.66
PBZ (total)- Hopper operator sample (3rd attic) 1639-1805 87.3 16.9 8.68
Area (respirable)- Attic sample (1 51 attic) 0937-1029 89.4 ND
Area (respirable) -Attic sample (2nd attic) 1314-1358 75.7 ND
Area (respirable) -Attic sample (3rd attic) 1642-1658 27.5 ND ND
Area (respirable) -Hopper sample (1st attic) 0931 -1102 155 0.13
Area (respirable)- Hopper sample (2"d attic) 1311 -1455 177 0.17
Area (respirable)- Hopper sample (3rd attic) 1639- 1805 146 0.27 0.11
A-9 Cellulose Insulation, NTP TOX 74
TABLE A1 Total and Respirable Dust Sampling Results
Contractor 5

Sample Sample Sample 8-hour Location Time Volume Concentration TWA
(military) (liters) (mg/m3) (mg/m3)
Results of September 30, 1998, area and PBZ air sampling during two new residential attic CI applications.
Area (total)- Attic sample (1"1 attic) 1247-1308 21.3 12.7
Area (total)- Attic sample (2"d attic) 1545-1644 59.9 17.5 2.71
Area (total)- Hopper sample (1 "1 attic) 1245-1324 39.5 11.6
Area (total)- Hopper sample (2"d attic) 1540-1649 69.9 14.9 3.08
PBZ (total)- CI installer sample (1st attic) 1243-1325 42.6 13.2
PBZ (total)- CI installer sample (2"d attic) 1540-1620 40.5 33.6
PBZ (total)- 2"d CI installer sample (2"d attic) 1620-1649 29.4 11.6 4.66
PBZ (total)- Hopper operator 1245-1324 38.9 23.4
PBZ (total)- Hopper operator (2"d attic) 1540-1649 68.7 34.8 6.90
Area (respirable)- Attic sample (1"1 attic) 1247-1308 35.7 0.56
Area (respirable)- Attic sample (2"d attic) 1545-1644 100 0.40 0.07
Area (respirable) -Hopper sample (1st attic) 1245-1324 65.6 0.76
Area (respirable) -Hopper sample (2"d attic) 1540-1649 116 0.26 0.10
A-10 Cellulose Insulation, NTP TOX 74
TABLE A1 Total and Respirable Dust Sampling Results
Contractor 5 (continued)

Sample Sample Sample 8-hour Location Time Volume Concentration TWA
(military) (liters) (mg/m3) (mg/m3)
Results of October 1, 1998, area and PBZ air sampling during a new residential attic CI application. ----------------------------------------------- ------------ -------- ------------- ---------Area (total)- Attic sample 1009- 1022 13.3 35.3 0.96
Area (total)- Hopper sample 1009- 1027 18.1 34.8 1.31
PBZ (total)- CI installer sample 1008- 1027 19.4 47.4 1.88
PBZ (total)- Hopper operator sample 1009-1027 18.4 41.9 1.57
Area (respirable)- Attic sample 1009-1022 22.2 0.90 0.02
Area (respirable)- Hopper sample 1009-1027 30.2 0.99 0.04
Results of October 2, 1998, area and PBZ air sam piing during a new. residential wall CI application.
Area (total) -Hopper sample 0845-1322 277 3.59 2.07
PBZ (total)- CI installer sample 0843-0928 45.9 36.3
PBZ (total)- 2"d CI installer sample 0928-1109 103 24.1
PBZ (total)- 3'd CI installer sample 1109-1345 159 27.3 17.4
PBZ (total)- Hopper operator sample 0845-0939 55.2 16.1
PBZ (total)- 2"d hopper operator sample 0939-1147 131 12.5
PBZ (total)- 3'd hopper operator sample 1147-1345 121 15.4 8.93
Area (respirable)- Hopper sample 0845-1322 279 0.22 0.13
A-11 Cellulose Insulation, NTP TOX 74
TABLE A1 Total and Respirable Dust Sampling Results
Contractor 5 (continued)

Sample Sample Sample 8-hour Location Time Volume Concentration TWA
(military) (liters) (mg/m3) (mg/m3)
Results of December 15,1998, area and PBZ air sampling during six new residential attic CI applications. ----------------------------------------------- ------------ -------- ------------- ---------Area (total)- 1st attic sample- near entrance 1148- 1202 40.9 10.0
1252- 1301 1358- 1408 1419-1427
Area (total)- 2"d attic sample- near entrance 1624-1635 20.9 5.26 1.08 1652-1702
Area (total)- 1'1 hopper sample- left of entrance 1029- 1108 41.5 9.88
Area (total)- 2"d hopper sample- left of entrance 1145-1203 35.1 42.7 1248- 1303
Area (total)- 3'd hopper sample -left of entrance 1356- 1431 37.2 48.4
Area (total)- 4th hopper sample- left of entrance 1620-1638 34.1 55.1 10.9 1649-1703
PBZ (total) - 151 CI installer sample 1032- 1120 48.5 28.9
PBZ (total) -2nd CI installer sample 1138-1207 88.9 16.9 1247-1307 1355-1434
PBZ (total)- 3'd CI installer sample 1619- 1641 35.4 15.0 7.08 1649-1702
PBZ (total) - 1st hopper operator sample 1029- 1118 52.0 19.8
PBZ (total)'- 2"d hopper operator sample 1139-1203 47.7 23.9 1242-1303
PBZ (total)- 3rd hopper operator sample 1353- 1430 39.3 41.7
PBZ (total)- 4th hopper operator sample 1620-1640 35.0 22.0 8.99 1649-1702
Area (respirable) -1st attic sample- near entrance 1148-1202 69.5 ND 1252- 1301 1358-1408 1419-1427
Area (respirable)- 2"d attic sample- near entrance 1624-1635 35.6 ND ND 1652-1702
Area (respirable)- 151 hopper sample- left of entrance 1029-1108 41.5 0.61
Area (respirable)- 2"d hopper sample -left of entrance 1145- 1203 35.1 1.08 1248-1303
Area (respirable)- 3'd hopper sample -left of entrance 1356- 1431 37.2 1.36
Area (respirable)- 4th hopper sample -left of entrance 1620-1638 34.1 ND 0.22 1649-1703
A-12 Cellulose Insulation, NTP TOX 74
TABLE A1 Total and Respirable Dust Sampling Results
Contractor 6

Sample Sample Sample 8-hour Location Time Volume Concentration TWA
(military) (liters) (mg/m3) (mg/m3)
Results of December 16, 1998, area and PBZ air sampling during a new residential wall CI application.
Area (total)- Indoor background 1001- 1516 263 0.72
Area (total)- 1st hopper sample- ceiling of truck 1004- 1149 112 22.4
Area (total)- 2nd hopper sample- ceiling of truck 1149- 1235 48.9 17.8
Area (total)- 3'd hopper sample- ceiling of truck 1235-1325 151 25.2 14.1 1348- 1520
PBZ (total) - 151 CI installer sample 1000-1117 79.8 10.7
PBZ (total)- 2nd CI installer sample 1117-1323 226 21.0 11.3 1348-1520
PBZ (total) - 151 hopper/roller operator sample 1013- 1144 96.2 14.0
PBZ (total)- 2nd hopper/roller operator sample 1144-1323 201 14.0 8.20 1348-1519
Area (respirable)- Indoor background 1001- 1516 255 ND
Area (respirable)- Hopper sample- ceiling of truck 1004-1325 507 2.41 1.01 1348-1520
A-13 Cellulose Insulation, NTP TOX 74
TABLE A1 Total and Respirable Dust Sampling Results
Contractor 6 (continued)
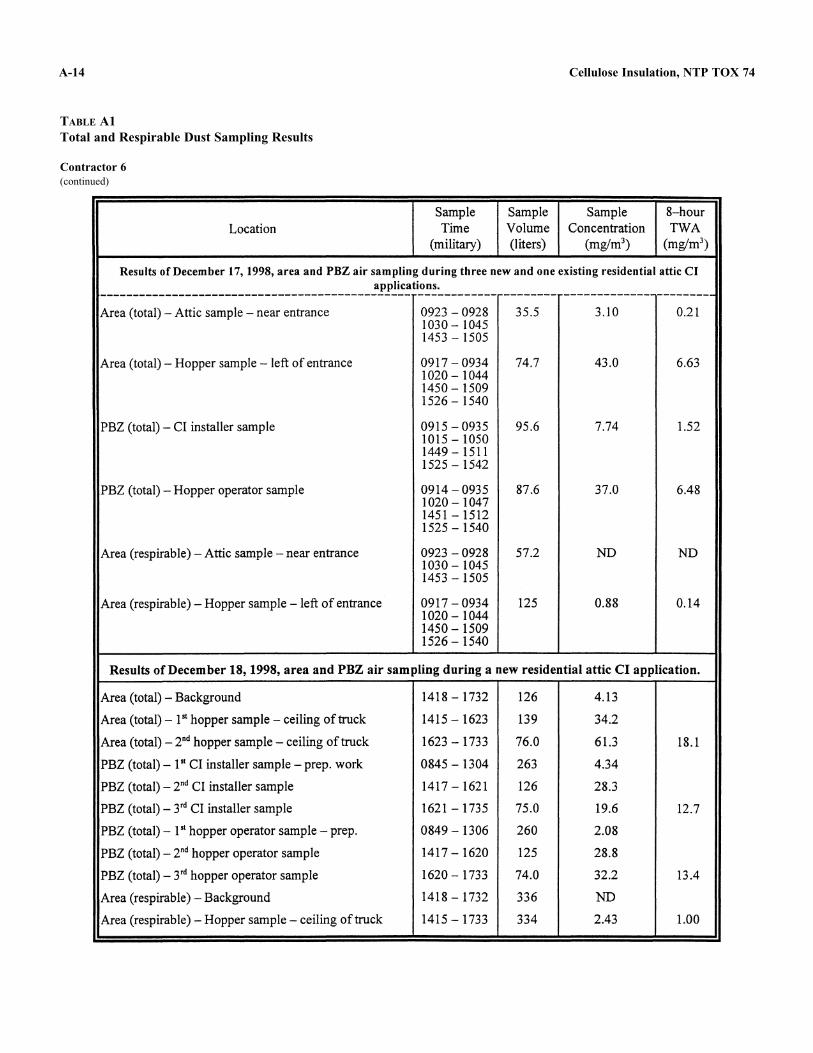
Sample Sample Sample 8-hour Location Time Volume Concentration TWA
(military) (liters) (mg/m3) (mg/m3)
Results of December 17, 1998, area and PBZ air sampling during three new and one existing residential attic Cl applications.
----------------------------------------------- ------------ -------- -----------------------Area (total)- Attic sample- near entrance 0923-0928 35.5 3.10 0.21
1030- 1045 1453- 1505
Area (total)- Hopper sample -left of entrance 0917-0934 74.7 43.0 6.63 1020- 1044 1450-1509 1526- 1540
PBZ (total)- CI installer sample 0915-0935 95.6 7.74 1.52 1015-1050 1449-1511 1525-1542
PBZ (total) -Hopper operator sample 0914-0935 1020- 1047
87.6 37.0 6.48
1451- 1512 1525-1540
Area (respirable)- Attic sample- near entrance 0923-0928 57.2 ND ND 1030- 1045 1453- 1505
Area (respirable)- Hopper sample -left of entrance 0917-0934 125 0.88 0.14 1020- 1044 1450-1509 1526-1540
Results of December 18, 1998, area and PBZ air sampling during a new residential attic CI application.
Area (total)- Background 1418- 1732 126 4.13
Area (total)- 151 hopper sample - ceiling of truck 1415- 1623 139 34.2
Area (total)- 2"d hopper sample- ceiling of truck 1623-1733 76.0 61.3 18.1
PBZ (total)- 151 CI installer sample- prep. work 0845-1304 263 4.34
PBZ (total) - 2"d CI installer sample 1417-1621 126 28.3
PBZ (total)- 3rd CI installer sample 1621-1735 75.0 19.6 12.7
PBZ (total) - 1 '1 hopper operator sample -prep. 0849-1306 260 2.08
PBZ (total)- 2"d hopper operator sample 1417-1620 125 28.8
PBZ (total)- 3rd hopper operator sample 1620- 1733 74.0 32.2 13.4
Area (respirable)- Background 1418- 1732 336 ND
Area (respirable)- Hopper sample- ceiling of truck 1415- 1733 334 2.43 1.00
A-14 Cellulose Insulation, NTP TOX 74
TABLE A1 Total and Respirable Dust Sampling Results
Contractor 6 (continued)

Sample Sample Sample 8-hour Location Time Volume Concentration TWA
(military) (liters) (mg/m3) (mg/m3)
Results of February 24, 1999, area and PBZ air sampling during an existing residential attic CI application.
-------------------------------------- ----------- --------- ------------- -----------------Area (total)- Attic sample 1102- 1222 83.4 36.8 6.I3
Area (total)- Hopper sample 1054-1237 I09 202 See Hopper #I below
PBZ (total)- 1 "1 CI installer sample- HAM 1052-1143 104 39.7
PBZ (total)- 2"d CI installer sample- HAM 1204-1236 64.9 53.3 7.77
PBZ (total)- Hopper operator- attic 0948-1041 54.5 26.2 preparation
PBZ (total) - Hopper operator sample 1055-1234 102 ;,8.3 See H.O. #I below
Area (respirable)- Attic sample 1102-1222 137 8.54 1.42
Area (respirable)- Hopper sample 1054-1237 175 7.I4 See Hopper# 1 below
Results of February 24, 1999, area and PBZ air sampling during an existing residential wall CI application.
Area (total)- Hopper #1 sample 1329-1451 87.1 60.3 53.7
Area (total)- Hopper #2 sample 1329-1451 88.5 61.1 10.8
PBZ (total)- CI installer #1 sample 1328-1452 86.8 10.4 1.82
PBZ (total)- CI installer #2 sample 1326-1453 90.7 3.86 0.70
PBZ (total)- Hopper operator #1 sample 1326-1452 88.5 18.4 18.2
PBZ (total)- Hopper operator #2 sample 327-1452 85.9 44.6 7.90
Area (respirable)- Hopper #1 sample 1328-1453 140 1.71 1.82
Area (respirable)- Hopper #2 sample 1328-1453 146 8.70 1.54
A-15 Cellulose Insulation, NTP TOX 74
TABLE A1 Total and Respirable Dust Sampling Results
Contractor 7

Sample Sample Sample 8-hour Location Time Volume Concentration TWA
(military) (liters) (mg/m3) (mg/m3)
Results of February 26, 1999, area and PBZ air sampling during an existing residential attic CI application.
----------------------------------------------- ------------ -------- ------------- --------Area (total)- Attic sample 1254-1400 69.9 36.9 5.07
Area (total)- Hopper sample 1242-1404 84.8 187 32.0
PBZ (total)- Attic preparation worker 0912-1041 94.3 3.82 0.71
PBZ (total)- 151 CI installer sample- HAM 1245-1320 70.8 34.6
PBZ (total)- 2nd CI installer sample 1343-1405 22.7 171 10.4
PBZ (total)- Hopper operator- preparation work 0911- 1041 92.8 14.4
PBZ (total)- 1'1 Hopper operator sample 1246-1334 49.5 46.7
PBZ (total) - 2"d Hopper operator sample -HAM 1343-1405 44.5 140 13.8
Area (respirable)- Attic sample 1254-1400 113 6.55 0.90
Area (respirable)- Hopper sample 1242-1404 140 12.9 2.20
A-16 Cellulose Insulation, NTP TOX 74
TABLE A1 Total and Respirable Dust Sampling Results
Contractor 7 (continued)

Sample Sample Sample 8-hour
Location Time Volume Concentration TWA (military) (liters) (mg/m3) (mglm3)
Results of March 23, 1999, area and PBZ air sampling during a new residential wall CI application. ----------------------------------------------- ------------ -------- ------------- --------Area (total)- Background sample 0815- 1147 222 1.26
Area (total)- Hopper sample 0824-1144 205 9.46 3.94
PBZ (total)- CI installer #I sample 0817-1150 217 22.1 9.81
PBZ (total)- Hopper-roller/recycle operator #2 sample 0821 - 1155 215 61.3 27.3
PBZ (total)- Hopper-roller/recycle operator #3 sample 0820-1150 219 34.2 15.0
Area (respirable) -Background sample 0815- 1147 366 ND
Area (respirable) - Hopper sample 0824-1144 345 0.26 0.11
Results of March 24, 1999, area and PBZ air sampling during a new residential wall CI application.* ----------------------------------------------- ------------ -------- ------------- --------Area (total)- Background sample 0800-1230 286 2.03
Area (total)- Hopper sample 0757-1230 286 2.87 1.63
PBZ (total)- 1st CI installer #1 sample 0759-0951 115 29.3
PBZ (total)- 2nd CI installer #1 sample 0952-1237 170 20.6 13.9
PBZ (total)- 1st Hopper-roller/recycle operator #2 0800-0953 116 45.7 sample
PBZ (total)- 2"d Hopper-roller/recycle operator #2 0953-1239 170 23.4 18.9 sample
PBZ (total)- 151 Hopper-roller/recycle operator #3 0800-0952 114 33.8 sample
PBZ (total)- 2"d Hopper-roller/recycle operator #3 0952-1239 171 12.9 12.4 sample
Area (respirable)- Background sample 0800-1230 467 0.17
Area (respirable)- Hopper sample 0757-1230 472 0.17 0.10
A-17 Cellulose Insulation, NTP TOX 74
TABLE A1 Total and Respirable Dust Sampling Results
Contractor 8

Sample Sample Sample 8-hour Location Time Volume Concentration TWA
(military) (liters) {mg/m3) (mg/m3)
Results of March 25, 1999, area and PBZ air sampling during a new residential attic and wall CI application.
----------------------------------------------- ------------ -------- ------------- ---------Area (total)- Attic sample 0837- 1157 209 12.3 5.13
Area (total)- Hopper sample (attic CI install) 0830-1228 242 5.91
Area (total)- Hopper sample (wall CI install) 1350-1810 275 10.8 8.78
PBZ (total)- 151 CI installer #2 sample- attic 0824- 1013 112 84.9
PBZ (total)- 2"d CI installer #2 sample- attic 1013-1229 139 90.7
PBZ (total)- Hopper-roller/recycle operator #2 sample 1352-1808 263 37.2 64.8
PBZ (total)- 151 CI installer helper #3 sample- attic 0822-1013 114 23.3
PBZ (total)- 2"d CI installer helper #3 sample- attic 1013- 1229 140 37.5
PBZ (total) - roller/recycle operator #3 sample -wall 1352-1808 268 80.6 59.0 install & CI installer of ceiling
PBZ (total)- Hopper operator #I sample- attic 0830-1230 254 16.3
PBZ (total)- CI installer #1 sample- wall 1351 -1808 261 31.8 25.2
Area (respirable) -Attic sample 0837-1157 346 0.09 0.04
Area (respirable)- Hopper sample (attic CI install) no sample bad filter
Area (respirable)- Hopper sample (wall CI install) 1350- 1810 450 0.40 0.40
A-18 Cellulose Insulation, NTP TOX 74
TABLE A1 Total and Respirable Dust Sampling Results
Contractor 8 (continued)

Sample Sample Sample 8-hour Location Time Volume Concentration TWA
(military) (liters) (mg/m3) (mg/m3)
Results of March 26, 1999, area and PBZ air sampling during a new residential attic and wall CI application.
----------------------------------------------- ------------ -------- ------------- --------Area (total)- Background sample- wall CI install 0732-1020 176 21.7
Area (total)- Hopper sample- wall CI install 0731 -1027 181 21.9
Area (total)- Hopper sample 1027-1240 137 6.20 9.75
Area (total)- Attic sample 1050-1235 110 38.3 8.38
PBZ (total)- CI installer #I sample- wall 0728-1027 190 41.1
PBZ (total)- Hopper operator #1 sample- attic 1027-1243 144 20.2 21.1
PBZ (total)- Hopper-roller/recycle operator #2 sample 0730-1027 181 48.9
PBZ (total)- CI installer #2 sample- attic 1027-1244 140 97.3 45.8
PBZ (total) - Hopper-roller/recycle operator #3 sample 0730-1025 186 48.5
PBZ (total)- CI installer helper #3 sample- attic 1025-1247 151 20.2 23.7
Area (respirable)- Background sample- wall CI install 0732-1020 291 1.79
Area (respirable)- Hopper sample- wall CI install 0731 -1027 305 1.08
Area (respirable)- Hopper sample 1027-1240 182 0.91 0.65
Area (respirable)- Attic sample 1050-1235 230 4.51 0.99
A-19 Cellulose Insulation, NTP TOX 74
TABLE A1 Total and Respirable Dust Sampling Results
Contractor 8 (continued)

Sample Sample Sample 8-hour Location Time Volume Concentration TWA
(military) (liters) (mg/m3) (mg/m3)
Results of September 27, 1999, area and PBZ air sampling during a new residential wall CI application. ----------------------------------------------- ------------ -------- ------------- --------Area (total)- Background sample 1122-1652 340 4.32
Area (total)- Hopper sample 1128- 1655 330 1.30 0.89
PBZ (total)- 151 CI installer sample 1120- 1235 74.3 46.2
PBZ (total)- 2"d CI installer sample 1343- 1650 185 58.9 30.2
PBZ (total)- 1"1 Hopper operator sample 1138-1244 66 14.4
PBZ (total)- 2"d Hopper operator sample 1343-1653 197 13.7 7.40
PBZ (total)- Worker picking-up CI sample 1217-1235 203 17.2 7.35 1343 -1650
Area (respirable)- Background sample 1122-1652 566 ND
Area (respirable)- Hopper sample 1128- 1655 578 ND
Results of September 28, 1999, area and PBZ air sampling during new residential attic CI applications. ----------------------------------------------- ------------ -------- --------------r--------Area (total)- Attic sample 1058-1400 307 5.21 3.19
1415-1607
Area (total) -Hopper sample 1103- 1618 333 5.83 3.83
PBZ (total)- 151 CI installer sample 1056-1236 103 39.2
PBZ (total)- 2"d CI installer sample 1236- 1611 222 11.9 13.5
PBZ (total)- 151 Hopper operator sample 1102-1155 54.0 12.6
PBZ (total)- 2"d Hopper operator sample 1201-1331 218 40.9 19.6 1407- 1611
PBZ (total)- Attic helper sample 1212- 1616 248 10.1 5.13
Area (respirable)- Attic sample 1058-1400 513 ND 1415- 1607
Area (respirable)- Hopper sample 1103- 1618 546 0.20 0.13
A-20 Cellulose Insulation, NTP TOX 74
TABLE A1 Total and Respirable Dust Sampling Results
Contractor 9

Sample Sample Sample 8-hour Location Time Volume Concentration TWA
(military) (liters) (mg/m3) (mg/m3)
Results of September 29, 1999, area and PBZ air sampling during a new residential attic CI application. ----------------------------------------------- ------------ -------- ------------- ---------Area (total)- Attic sample 1012- 1134 82.0 2.07 0.35
Area (total)- Hopper sample 1020-1202 104 8.46 1.80
PBZ (total)- CI installer sample lOll- 1155 105 16.5 3.58
PBZ (total)- Hopper operator sample 1019- 1200 102 51.3 10.8
Area (respirable)- Attic sample 1012- 1134 139 0.29 0.05
Area (respirable) -Hopper sample 1020-1202 178 ND
Results of September 30, 1999, area and PBZ air sampling during an existing residential wall CI application.
----------------------------------------------- ------------ -------- ------------- --------Area (total)- Hopper sample 1010-1549 348 1.44 1.02
PBZ (total) - CI installer sample 1011 -1230 273 12.6 6.93 1345-1550
PBZ (total)- Hopper operator/drilling holes in wall 1009-1231 266 8.87 4.92 sample 1348-1552
Area (respirable)- Hopper sample 1010-1549 586 ND
A-21 Cellulose Insulation, NTP TOX 74
TABLE A1 Total and Respirable Dust Sampling Results
Contractor 9 (continued)
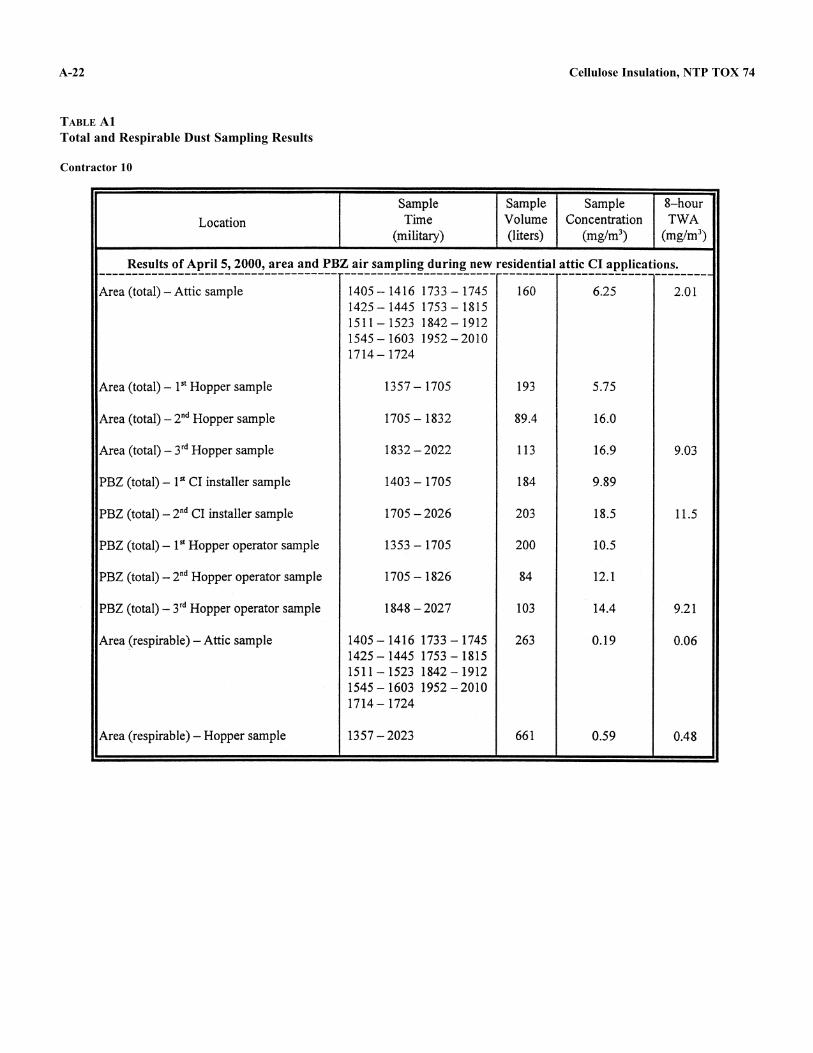
Sample Sample Sample 8-hour
Location Time Volume Concentration TWA (military) (liters) (mg/m3) (mg/m3)
----~~~~!~~!~~~~~23_~~~-~~e!_~~~-~~~~~~~~~~~~~-~~~~~-~~~-r~~~~~!~a~~~~~~!-~~~~~~t~~!: ____
Area (total) -Attic sample 1405-1416 1733-1745 160 6.25 2.01 1425-1445 1753- 1815 1511- 1523 1842-1912 1545-1603 1952-2010 1714-1724
Area (total)- 1 '1 Hopper sample 1357-1705 193 5.75
Area (total) - 2"d Hopper sample 1705-1832 89.4 16.0
Area (total)- 3rd Hopper sample 1832-2022 113 16.9 9.03
PBZ (total) - 151 CI installer sample 1403-1705 184 9.89
PBZ (total)- 2"d CI installer sample 1705-2026 203 18.5 11.5
PBZ (total) - 151 Hopper operator sample 1353-1705 200 10.5
PBZ (total) -2nd Hopper operator sample 1705-1826 84 12.1
PBZ (total)- 3rd Hopper operator sample 1848-2027 103 14.4 9.21
Area (respirable)- Attic sample 1405-14161733-1745 263 0.19 0.06 1425-1445 1753-1815 1511- 1523 1842- 1912 1545-1603 1952-2010 1714-1724
Area (respirable)- Hopper sample 1357-2023 661 0.59 0.48
A-22 Cellulose Insulation, NTP TOX 74
TABLE A1 Total and Respirable Dust Sampling Results
Contractor 10

Sample Sample Sample 8-hour Location Time Volume Concentration TWA
(military) (liters) (mg/m3) (mg/m3)
Results of April 6, 2000, area and PBZ air sampling during new residential wall CI applications. ----------------------------------------------- ------------ -------- ------------- --------Area (total)- I 51 General house area sample 0743-0850 67.9 1.33
Area (total)- 2nd General house area sample 1149- 1325 97.3 3.19
Area (total)- 3'd General house area sample 1352-1717 208 6.39 3.55
Area (total)- 1 "1 Hopper sample 0735-0833 60.6 14.4
Area (total)- 2•d Hopper sample 1147-1307 83.6 2.51
Area (total)- 3'd Hopper sample 1354-1703 198 23.9 11.6
PBZ (total)- 151 CI installer sample 0734-0838 67.5 16.9
PBZ (total)- 2nd CI installer sample 1149-1322 98.1 31.8
PBZ (total)- 3rd CI installer sample 1354-1726 224 68.7 38.8
PBZ (total)- 1"1 Hopper-roller/recycle operator sample 0733-0842 71.2 35.5
PBZ (total)- 2nd Hopper-roller/recycle operator sample 1145-1323 101 39.2
PBZ (total)- 3'd Hopper-roller/recycle operator sample 1351-1724 220 48.1 34.5
PBZ (total)- 1"1 Roller/recycle operator sample 0731-0838 69.3 18.3
PBZ (total)- 2nd Roller/recycle operator sample 1148-1323 98.2 20.2
PBZ (total)- 3'd Roller/recycle operator sample 1351-1724 220 29.1 19.5
Area (respirable)- General house area sample 0740-0850 643 0.42 0.42 1149- 1325 1352-1717
Area (respirable)- Hopper sample 0735-0833 562 0.94 0.64 1147-1307 1354-1703
A-23 Cellulose Insulation, NTP TOX 74
TABLE A1 Total and Respirable Dust Sampling Results
Contractor 10 (continued)

A-24 Cellulose Insulation, NTP TOX 74
TABLE A1 Total and Respirable Dust Sampling Results
Contractor 10 (continued)
a PBZ=personal breathing zone; TWA=time-weighted averages; ND=not detected; CI=cellulose insulation

A-25 Cellulose Insulation, NTP TOX 74
TABLE A2 Fiber Characterization of Cellulose Insulation Application in Air Samples by Scanning Electron Microscopya
Sample CI Fiber Fibrous/ Average Size Location Time Concentration Nonfibrous Fiber Length Range
(minutes) (fibers/mm2) Ratio (µm) (µm)
Contractor 2 New Residential Attic
CI installer sample 1 8 66 40/60 33 6 - 90+ CI installer sample 2 3 73 35/65 39 6 - 90+ Hopper operator sample 1 3 15 35/65 31 7 - 80+ Hopper operator sample 2 5 13 35/65 24 8 - 55
Existing Residential Garage Ceiling CI installer sample 1 56 65 35/65 34 5 - 100+ CI installer sample 2 33 42 45/55 27 5 - 100+ Hopper operator sample 1 6 68 35/65 40 5 - 85+ Hopper operator sample 2 5 2 25/75 55 50 - 60+
Existing Residential Attic CI installer sample 1 16 24 35/65 35 5 - 100+ CI installer sample 2 13 48 35/65 37 8 - 75+ Hopper operator sample 1 5 66 35/65 40 7 - 100+ Hopper operator sample 2 4 9 35/65 49 7 - 100+
CI installer sample 1 CI installer sample 2
4 11
71 —
b 40/60 42 8 - 90+
Hopper operator sample 1 6 41 40/60 31 7 - 120+ Hopper operator sample 2 3 16 35/65 36 8 - 150+
Contractor 3 Existing Residential Wall
CI installer sample 8 110 35/65 47 5 - 58+ Hopper operator sample 2 5 35/65 27 9 - 75+
New Residential Attic CI installer sample 3 60 40/60 34 7 - 90+ Hopper operator sample 7 32 35/65 27 6 - 90+
Two Existing Residential Attics CI installer sample 6 22 30/70 31 5 - 90+ Hopper operator sample 3 34 35/65 32 5 - 80+
Existing Residential Attic CI installer sample 3 43 40/60 30 7 - 90+ Hopper operator sample 5 42 40/60 35 8 - 90+

A-26 Cellulose Insulation, NTP TOX 74
TABLE A2 Fiber Characterization of Cellulose Insulation Application in Air Samples by Scanning Electron Microscopy
Sample CI Fiber Fibrous/ Average Size Location Time Concentration Nonfibrous Fiber Length Range
(minutes) (fibers/mm2) Ratio (µm) (µm)
Contractor 4 New Commercial Wall
CI installer sample 14 38 40/60 31 5 - 90+ Hopper operator sample 12 47 35/65 29 5 - 80+
New Commercial Wall CI installer sample 16 14 40/60 42 6 - 90+ Hopper operator sample 9 10 40/60 39 5 - 80+
Two New Residential Attics CI installer sample 7 5 35/65 19 7 - 50+ Hopper operator sample 3 28 35/65 30 5 - 85+
New Residential Attic CI installer sample 7 6 40/60 35 5 - 90+ Hopper operator sample 5 26 35/65 22 5 - 80+
Contractor 5 Three New Residential Attics
CI installer sample 5 32 35/65 25 5 - 90+ Hopper operator sample 5 3 35/65 42 5 - 85+
Two New Residential Attics CI installer sample 3 50 40/60 31 5 - 90+ Hopper operator sample 6 13 40/60 32 5 - 80+
New Residential Wall CI installer sample 11 23 40/60 39 6 - 85+ Hopper operator sample 12 16 35/65 36 7 - 90+
Contractor 6 Six New Residential Attics
CI installer sample 12 6 40/60 22 6 - 75+ Hopper operator sample 18 18 35/65 23 5 - 80+
New Residential Wall CI installer sample 2 4 35/65 21 5 - 65+ Hopper operator sample 6 6 40/60 25 5 - 80+
One Existing and Three New Residential Attics CI installer sample 8 5 35/65 19 5 - 70+ Hopper operator sample 7 9 35/65 16 5 - 60+
New Residential Attic CI installer sample 4 6 35/65 37 7 - 80+ Hopper operator sample 7 5 40/60 29 6 - 85+
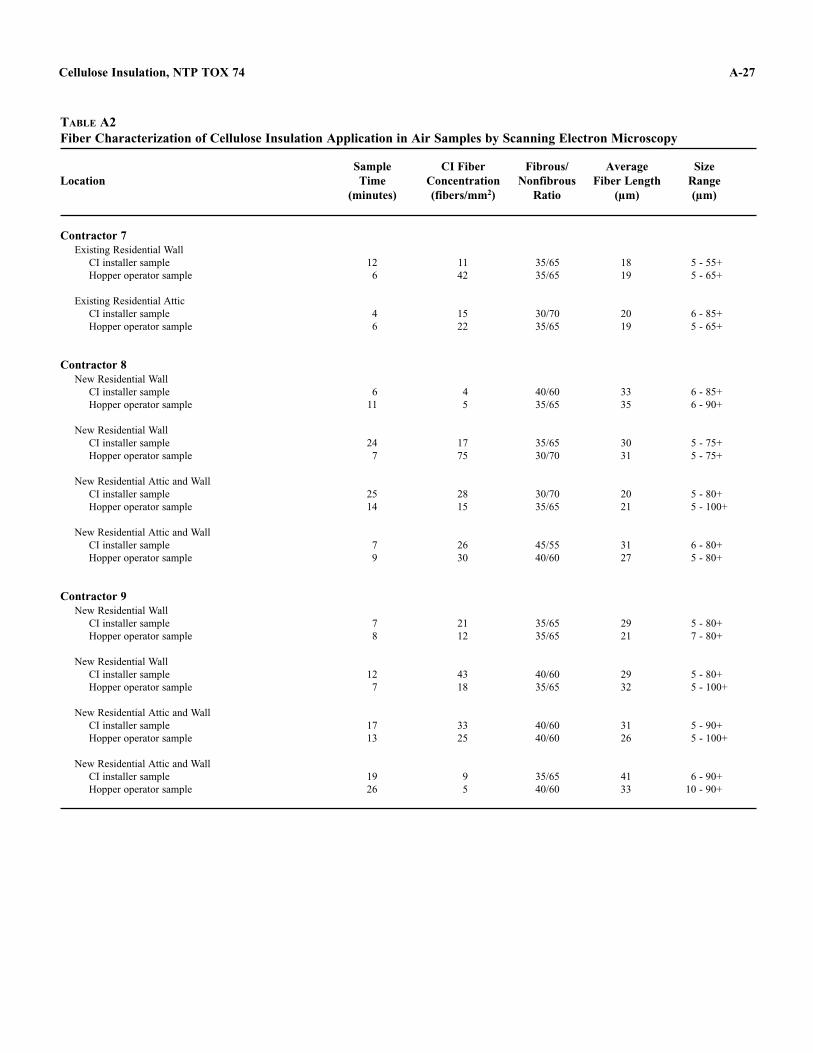
A-27 Cellulose Insulation, NTP TOX 74
TABLE A2 Fiber Characterization of Cellulose Insulation Application in Air Samples by Scanning Electron Microscopy
Sample CI Fiber Fibrous/ Average Size Location Time Concentration Nonfibrous Fiber Length Range
(minutes) (fibers/mm2) Ratio (µm) (µm)
Contractor 7 Existing Residential Wall
CI installer sample 12 11 35/65 18 5 - 55+ Hopper operator sample 6 42 35/65 19 5 - 65+
Existing Residential Attic CI installer sample 4 15 30/70 20 6 - 85+ Hopper operator sample 6 22 35/65 19 5 - 65+
Contractor 8 New Residential Wall
CI installer sample 6 4 40/60 33 6 - 85+ Hopper operator sample 11 5 35/65 35 6 - 90+
New Residential Wall CI installer sample 24 17 35/65 30 5 - 75+ Hopper operator sample 7 75 30/70 31 5 - 75+
New Residential Attic and Wall CI installer sample 25 28 30/70 20 5 - 80+ Hopper operator sample 14 15 35/65 21 5 - 100+
New Residential Attic and Wall CI installer sample 7 26 45/55 31 6 - 80+ Hopper operator sample 9 30 40/60 27 5 - 80+
Contractor 9 New Residential Wall
CI installer sample 7 21 35/65 29 5 - 80+ Hopper operator sample 8 12 35/65 21 7 - 80+
New Residential Wall CI installer sample 12 43 40/60 29 5 - 80+ Hopper operator sample 7 18 35/65 32 5 - 100+
New Residential Attic and Wall CI installer sample 17 33 40/60 31 5 - 90+ Hopper operator sample 13 25 40/60 26 5 - 100+
New Residential Attic and Wall CI installer sample 19 9 35/65 41 6 - 90+ Hopper operator sample 26 5 40/60 33 10 - 90+
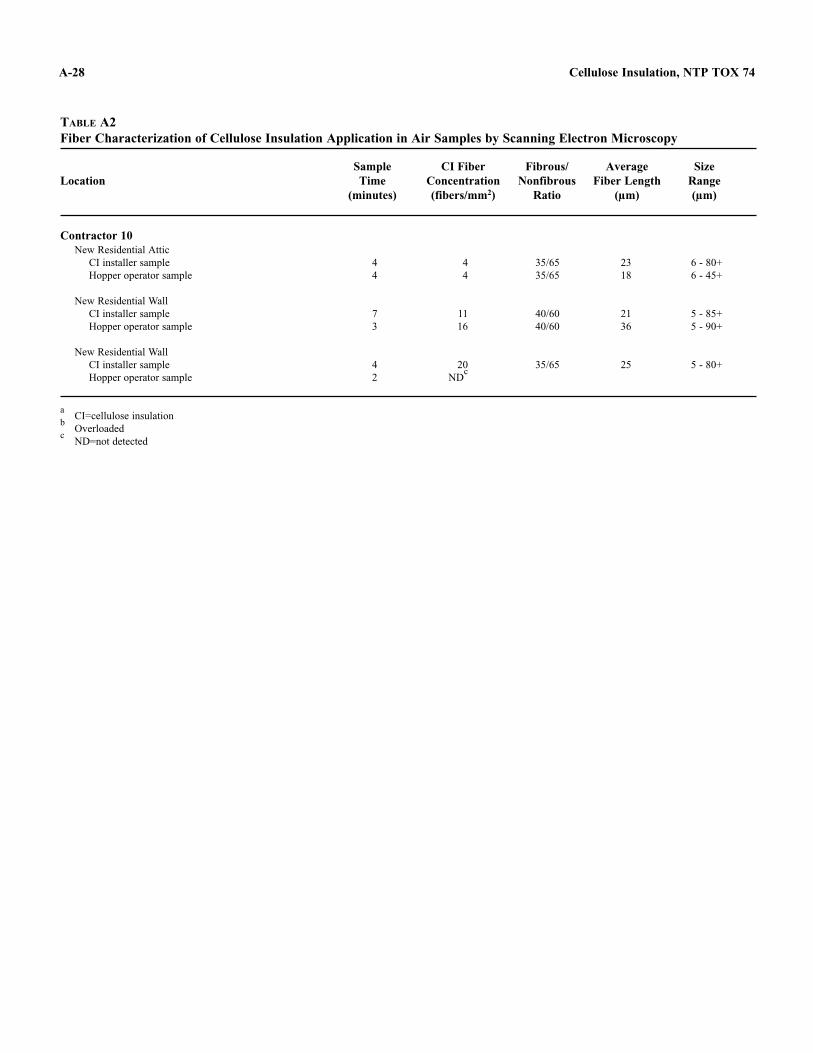
A-28
c
Cellulose Insulation, NTP TOX 74
TABLE A2 Fiber Characterization of Cellulose Insulation Application in Air Samples by Scanning Electron Microscopy
Sample CI Fiber Fibrous/ Average Size Location Time Concentration Nonfibrous Fiber Length Range
(minutes) (fibers/mm2) Ratio (µm) (µm)
Contractor 10 New Residential Attic
CI installer sample 4 4 Hopper operator sample 4 4
New Residential Wall CI installer sample 7 11 Hopper operator sample 3 16
New Residential Wall CI installer sample Hopper operator sample
4 2
20 ND
c
35/65 23 6 - 80+ 35/65 18 6 - 45+
40/60 21 5 - 85+ 40/60 36 5 - 90+
35/65 25 5 - 80+
a CI=cellulose insulation
b Overloaded ND=not detected

A-29
TA
BL
E A
3C
hem
ical
Ele
men
ts in
Bul
k Sa
mpl
es o
f C
ellu
lose
Ins
ulat
ion
– W
ater
Ext
ract
iona
]-2
Con
trac
tor
Al
As
Ba
Be
B
[SO
4 C
a C
d C
o C
r C
u F
e L
i M
g M
n
b 1a
N
D
ND
T
race
N
D
16,5
80
41,0
74
1,12
2 N
D
ND
N
D
Tra
ce
ND
0.
86
65.6
8.
26
1b
Tra
ce
ND
2.
63
ND
19
,353
48
,207
1,
777
ND
N
D
ND
T
race
N
D
1.07
79
.2
11.7
2a
ND
N
D
Tra
ce
ND
10
,000
78
,000
1,
900
ND
T
race
N
D
ND
N
D
Tra
ce
75
8.8
2b
43
Tra
ce
3.9
ND
5,
700
83,0
00
320
ND
N
D
ND
N
D
ND
0.
84
45
14
3 N
D
ND
3.
3 N
D
13,0
00
95,0
00
3,10
0 N
D
ND
N
D
Tra
ce
ND
T
race
1,
400
13
4a
49
ND
T
race
N
D
5,10
0 42
,000
98
0 N
D
ND
N
D
ND
N
D
0.92
54
15
4b
91
T
race
T
race
N
D
7,10
0 48
,000
1,
700
ND
T
race
N
D
ND
T
race
0.
86
77
14
5 11
0 N
D
ND
N
D
4,70
0 36
,000
32
0 N
D
ND
N
D
ND
N
D
ND
42
20
6a
ND
T
race
3.
9 N
D
7,70
0 45
,000
3,
600
ND
T
race
N
D
ND
N
D
ND
89
14
6b
N
D
ND
5.
5 N
D
9,80
0 55
,000
4,
600
ND
N
D
ND
N
D
ND
N
D
98
17
6c
180
Tra
ce
2.2
Tra
ce
6,20
0 57
,000
4,
600
ND
N
D
ND
N
D
58
ND
11
0 27
7a
39
ND
N
o da
ta
ND
21
,000
36
,000
6,
300
ND
N
D
ND
T
race
N
D
Tra
ce
160
9.5
7b
54
ND
N
o da
ta
ND
20
,000
31
,000
4,
400
ND
T
race
N
D
ND
N
D
ND
11
0 9.
0
8a
120
Tra
ce
No
data
N
D
5,90
0 32
,000
2,
600
ND
N
D
ND
T
race
N
D
Tra
ce
100
3.7
8b
45
Tra
ce
No
data
N
D
7,50
0 25
,000
2,
500
ND
N
D
ND
N
D
ND
T
race
11
0 4.
2
9a
Tra
ce
ND
N
o da
ta
ND
25
,000
47
,000
2,
300
Tra
ce
ND
N
D
ND
N
D
2.1
120
12
9b
ND
N
D
No
data
N
D
13,0
00
97,0
00
3,50
0 N
D
ND
N
D
ND
N
D
Tra
ce
110
20
10a
ND
N
D
No
data
T
race
6,
400
31,0
00
5,40
0 N
D
ND
N
D
ND
N
D
ND
17
0 18
10
b T
race
N
D
No
data
T
race
5,
400
32,0
00
2,90
0 N
D
ND
N
D
ND
N
D
ND
13
0 15
Cellulose Insulation, NTP TOX 74

TA
BL
EA
3C
hem
ical
Ele
men
ts in
Bul
k Sa
mpl
es o
f C
ellu
lose
Ins
ulat
ion
– W
ater
Ext
ract
ion
Con
trac
tor
Mo
Ni
Pb
PP
tSe
Ag
Na
Te
Tl
Ti
VY
Zn
Zr
A-30
1a
ND
N
D
ND
T
race
N
D
ND
N
D
18,5
77
ND
N
D
ND
N
D
12.2
N
D
Tra
ce
1b
ND
N
D
ND
T
race
N
D
ND
N
D
21,9
63
ND
N
D
ND
N
D
13.1
N
D
Tra
ce
2a
Tra
ce
ND
N
D
Tra
ce
ND
N
D
ND
11
,000
N
D
ND
N
D
ND
N
D
ND
N
D
2b
ND
N
D
Tra
ce
Tra
ce
ND
N
D
ND
6,
700
ND
N
D
ND
N
D
ND
T
race
N
D
3 N
D
ND
N
D
ND
N
D
ND
N
D14
,000
N
D
ND
N
D
ND
N
D
ND
N
D
4a
ND
N
D
ND
2,
100
ND
N
D
ND
76
0 T
race
N
D
ND
T
race
N
D
ND
N
D
4b
ND
T
race
N
D
2,70
0 N
D
ND
N
D
1,10
0 N
D
ND
N
D
Tra
ce
ND
T
race
N
D
5 N
D
ND
N
D
3,80
0 N
D
ND
N
D
1,20
0 N
D
ND
N
D
Tra
ce
ND
N
D
ND
6a
ND
N
D
ND
N
D
ND
T
race
N
D
540
ND
N
D
ND
T
race
N
D
Tra
ce
ND
6b
N
D
ND
N
D
ND
N
D
ND
N
D
680
ND
N
D
ND
N
D
ND
Tra
ce
ND
6c
N
D
ND
N
D
4,20
0 N
D
Tra
ce
ND
1,
100
ND
T
race
T
race
T
race
N
D
23
ND
7a
ND
N
D
ND
N
D
Tra
ce
ND
N
D
21,0
00
ND
N
D
ND
T
race
N
D
ND
N
D
7b
ND
N
D
ND
N
D
Tra
ce
Tra
ce
ND
19
,000
N
D
ND
N
D
ND
N
D
Tra
ce
ND
8a
ND
N
D
ND
25
0 T
race
N
D
Tra
ce
670
ND
N
D
8.2
Tra
ce
ND
T
race
N
D
8b
Tra
ce
ND
N
D
260
ND
N
D
Tra
ce
870
ND
N
D
ND
T
race
N
D
Tra
ce
ND
9a
ND
N
D
ND
N
D
ND
N
D
Tra
ce
22,0
00
ND
N
D
ND
N
D
Tra
ce
ND
N
D
9b
Tra
ce
ND
N
D
ND
N
D
ND
N
D
12,0
00
ND
N
D
ND
N
D
ND
T
race
N
D
10a
ND
N
D
ND
2,20
0 N
D
ND
N
D
720
ND
N
D
ND
N
D
ND
79
N
D
10b
ND
N
D
ND
1,
800
Tra
ce
ND
T
race
62
0 N
D
ND
N
D
Tra
ce
Tra
ce
67
ND
a R
esul
ts r
epor
ted
in µ
g/g;
Al=
alum
inum
, As=
arse
nic,
Ba=
bari
um, B
e=be
ryll
ium
, B=
boro
n, [
SO
]-2
=su
lfat
e, C
a=ca
lciu
m, C
d=ca
dmiu
m, C
o=co
balt
, Cr=
chro
miu
m, C
u=co
pper
, Fe=
iron
, 4
Li=
lith
ium
, Mg=
mag
nesi
um, M
n=m
anga
nese
, Mo=
mol
ybde
num
, Ni=
nick
el, P
b=le
ad, P
=ph
osph
orus
, Pt=
plat
inum
, Se=
sele
nium
, Ag=
silv
er, N
a=so
dium
, Te=
tell
uriu
m, T
l=th
alli
um,
Ti=
tita
nium
, V=
vana
dium
, Y=
yttr
ium
, Zn=
zinc
, Zr=
zirc
oniu
mb
ND
=no
t de
tect
ed
Cellulose Insulation, NTP TOX 74

A-31
TA
BL
E A
4C
hem
ical
Ele
men
ts in
Bul
k Sa
mpl
es o
f C
ellu
lose
Ins
ulat
ion
– St
rong
Aci
d E
xtra
ctio
na
]-2
Con
trac
tor
Al
As
Ba
Be
B
[SO
4 C
a C
d C
o C
r C
u F
e L
i M
g M
n
b 1a
2,
003
ND
13
.4
ND
9,
243
29,5
77
3,33
4 N
D
ND
N
D
27.5
93
.7
3.22
17
6 23
.1
1b
1,69
0 N
D
12.0
N
D
12,3
65
35,6
95
2,83
1 N
D
ND
N
D
21.9
99
.3
3.22
16
8 25
.6
2a
2,80
0 N
D
14
ND
11
,000
N
o da
ta
5,10
0 N
D
ND
N
D
27
150
3.8
200
23
2b
1,70
0 N
D
15
ND
5,
900
No
data
53
0 N
D
ND
N
D
8.1
71
Tra
ce
97
20
3 1,
400
ND
9.
2 N
D
No
data
94
,000
3,
700
ND
N
D
ND
21
61
1.
5 1,
400
23
4a
820
Tra
ce
12
ND
7,
100
52,0
00
2,50
0 T
race
N
D
Tra
ce
25
83
1.1
140
35
4b
600
Tra
ce
9.8
ND
6,
400
46,0
00
1,90
0 T
race
T
race
7.
7 24
95
0.
98
130
37
5 2,
800
Tra
ce
12
0.33
6,
600
41,0
00
1,20
0 N
D
ND
7.
6 17
21
0 2.
4 16
0 80
6a
2,60
0 T
race
14
N
D
8,60
0 N
o da
ta
5,60
0 N
D
ND
N
D
25
250
2.2
190
200
6b
2,60
0 T
race
15
N
D
9,80
0 N
o da
ta
5,20
0 N
D
ND
N
D
24
120
3.1
170
32
6c
3,10
0 T
race
17
T
race
6,
300
No
data
6,
200
ND
N
D
Tra
ce
32
460
2.7
230
36
7a
640
ND
N
o da
ta
ND
18
,000
N
o da
ta
6,90
0 N
D
ND
N
D
26
79
1.6
190
17
7b
1,20
0 N
D
No
data
N
D
15,0
00
No
data
7,
300
ND
N
D
ND
26
15
0 1.
7 20
0 15
8a
1,70
0 T
race
N
o da
ta
ND
9,
000
No
data
8,
200
ND
N
D
Tra
ce
31
180
0.78
24
0 19
8b
1,
600
Tra
ce
No
data
N
D
8,50
0 N
o da
ta
7,90
0 N
D
ND
T
race
29
16
0 0.
78
220
17
9a
2,30
0 N
D
No
data
N
D
26,0
00
No
data
5,
800
ND
N
D
Tra
ce
22
210
3.0
280
30
9b
2,20
0 N
D
No
data
N
D
14,0
00
No
data
4,
000
ND
N
D
Tra
ce
26
140
2.9
210
32
10a
3,50
0 N
D
No
data
0.
11
8,10
0 N
o da
ta
7,50
0 T
race
N
D
Tra
ce
22
520
2.2
370
33
10b
1,90
0 N
D
No
data
T
race
6,
400
No
data
4,
100
Tra
ce
ND
T
race
18
34
0 1.
6 21
0 27
Cellulose Insulation, NTP TOX 74
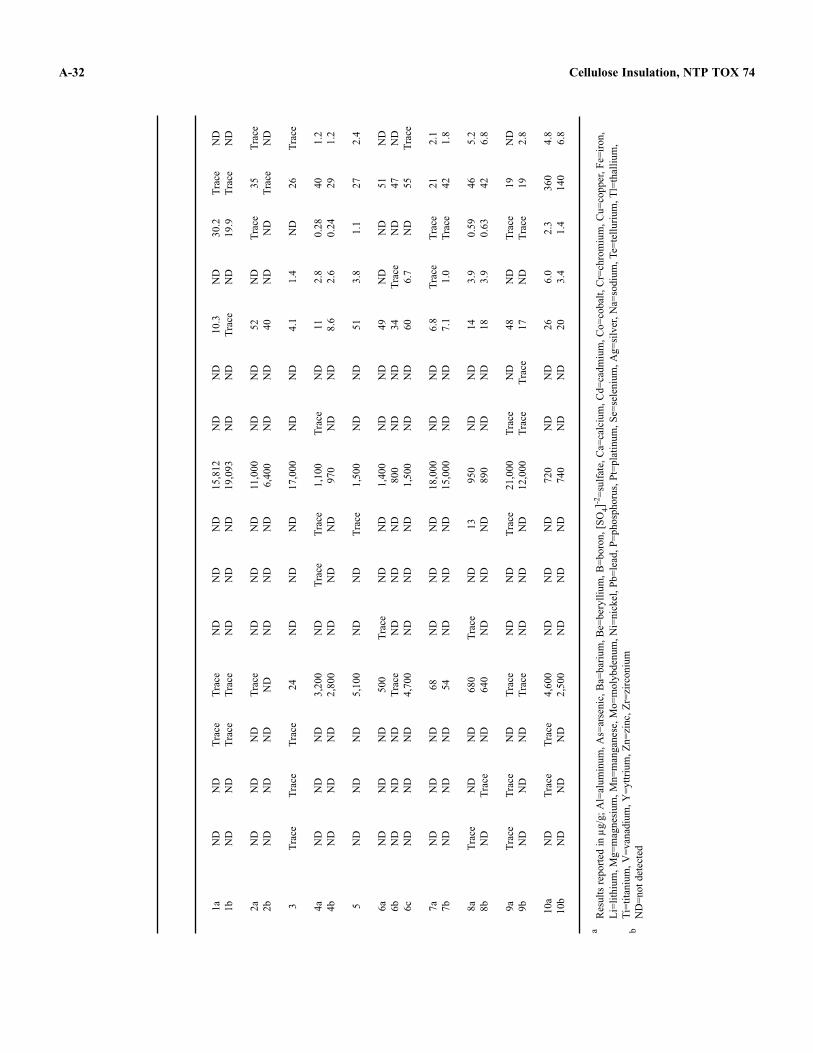
TA
BL
EA
4C
hem
ical
Ele
men
ts in
Bul
k Sa
mpl
es o
f C
ellu
lose
Ins
ulat
ion
– St
rong
Aci
d E
xtra
ctio
n
Con
trac
tor
Mo
Ni
Pb
PP
tSe
Ag
Na
Te
Tl
Ti
VY
Zn
Zr
A-32
1a
ND
N
D
Tra
ce
Tra
ce
ND
N
D
ND
15
,812
N
D
ND
10
.3
ND
30
.2
Tra
ce
ND
1b
N
D
ND
T
race
T
race
N
D
ND
N
D
19,0
93
ND
N
D
Tra
ce
ND
19
.9
Tra
ce
ND
2a
ND
N
D
ND
T
race
N
D
ND
N
D
11,0
00
ND
N
D
52
ND
T
race
35
T
race
2b
N
D
ND
N
D
ND
N
D
ND
N
D
6,40
0 N
D
ND
40
N
D
ND
Tra
ce
ND
3 T
race
T
race
T
race
24
N
D
ND
N
D
17,0
00
ND
N
D
4.1
1.4
ND
26
T
race
4a
ND
N
D
ND
3,
200
ND
T
race
T
race
1,
100
Tra
ce
ND
11
2.
8 0.
28
40
1.2
4b
ND
N
D
ND
2,
800
ND
N
D
ND
97
0 N
D
ND
8.
6 2.
6 0.
24
29
1.2
5 N
D
ND
N
D
5,10
0 N
D
ND
T
race
1,
500
ND
N
D
51
3.8
1.1
27
2.4
6a
ND
N
D
ND
50
0 T
race
N
D
ND
1,40
0 N
D
ND
49
N
D
ND
51
N
D
6b
ND
N
D
ND
Tra
ce
ND
N
D
ND
80
0 N
D
ND
34
Tra
ce
ND
47
N
D
6c
ND
N
D
ND
4,
700
ND
N
D
ND
1,
500
ND
N
D
60
6.7
ND
55
T
race
7a
ND
N
D
ND
68
N
D
ND
N
D
18,0
00
ND
N
D
6.8
Tra
ce
Tra
ce
21
2.1
7b
ND
N
D
ND
54
N
D
ND
N
D
15,0
00
ND
N
D
7.1
1.0
Tra
ce
42
1.8
8a
Tra
ce
ND
N
D
680
Tra
ce
ND
13
95
0 N
D
ND
14
3.
9 0.
59
46
5.2
8b
ND
T
race
N
D
640
ND
N
D
ND
89
0 N
D
ND
18
3.
9 0.
63
42
6.8
9a
Tra
ce
Tra
ce
ND
T
race
N
D
ND
T
race
21
,000
T
race
N
D
48
ND
T
race
19
N
D
9b
ND
N
D
ND
T
race
N
D
ND
N
D
12,0
00
Tra
ce
Tra
ce
17
ND
T
race
19
2.
8
10a
ND
T
race
T
race
4,
600
ND
N
D
ND
72
0 N
D
ND
26
6.
0 2.
3 36
0 4.
8 10
b N
D
ND
N
D
2,50
0 N
D
ND
N
D
740
ND
N
D
20
3.4
1.4
140
6.8
a R
esul
ts r
epor
ted
in µ
g/g;
Al=
alum
inum
, As=
arse
nic,
Ba=
bari
um, B
e=be
ryll
ium
, B=
boro
n, [
SO
]-2
=su
lfat
e, C
a=ca
lciu
m, C
d=ca
dmiu
m, C
o=co
balt
, Cr=
chro
miu
m, C
u=co
pper
, Fe=
iron
, 4
Li=
lith
ium
, Mg=
mag
nesi
um, M
n=m
anga
nese
, Mo=
mol
ybde
num
, Ni=
nick
el, P
b=le
ad, P
=ph
osph
orus
, Pt=
plat
inum
, Se=
sele
nium
, Ag=
silv
er, N
a=so
dium
, Te=
tell
uriu
m, T
l=th
alli
um,
Ti=
tita
nium
, V=
vana
dium
, Y=
yttr
ium
, Zn=
zinc
, Zr=
zirc
oniu
mb
ND
=no
t de
tect
ed
Cellulose Insulation, NTP TOX 74

A-33 Cellulose Insulation, NTP TOX 74
TABLE A5 Estimated Particle Size Data from Real-Time Particulate Measurementsa
Respirable Fraction MMADb Geometric Location Activity (%) (µm) Standard Deviation
Contractor 1 (Colorado) Existing Residential Attic 13 January 1998 Preparation 20 7.9 1.9
CI application 10 15 2.5 CI application, hopper area 5 18 2.2
14 January 1998 CI activities 2 28 2.4 CI application, hopper area 1 58 2.8
Contractor 2 (Missouri) Existing Residential Garage Ceiling 28 April 1998 CI application, hopper area 11 11 1.9
Existing Residential Attic 29 April 1998 CI application, truck 9 13 2.1 30 April 1998 CI application 7 20 2.5
Contractor 4 (Wisconsin) New Commercial Wall 11 August 1998 CI application, hopper area 11 16 2.9
New Residential Attic 12 August 1998 CI application 28 8.2 3.2 13 August 1998 CI application 32 8.5 4.2
Contractor 5 (Michigan) New Residential Attic 29 September 1998 CI application 8 15 2.4
Contractor 7 (Colorado) Existing Residential Attic 24 February 1999 CI application, hopper area 2.5 29 2.5
CI activities, hopper area 2.5 20 2.3 26 February 1999 CI application 0 64 2.5
CI activities, hopper area 1.0 55 2.8
Contractor 8 (Arizona) New Residential Attic and Wall 25 March 1999 CI application 0 115 3.4 26 March 1999 CI application, hopper area 11 13 2.4
Contractor 10 (Colorado) New Residential Attic or Wall 5 April 2000 CI application, hopper area 7 17 2.3 6 April 2000 CI application, hopper area 11 13 2.4 7 April 2000 CI application, hopper area 7 18 2.5
a CI=cellulose insulation
b Mass median aerodynamic diameter
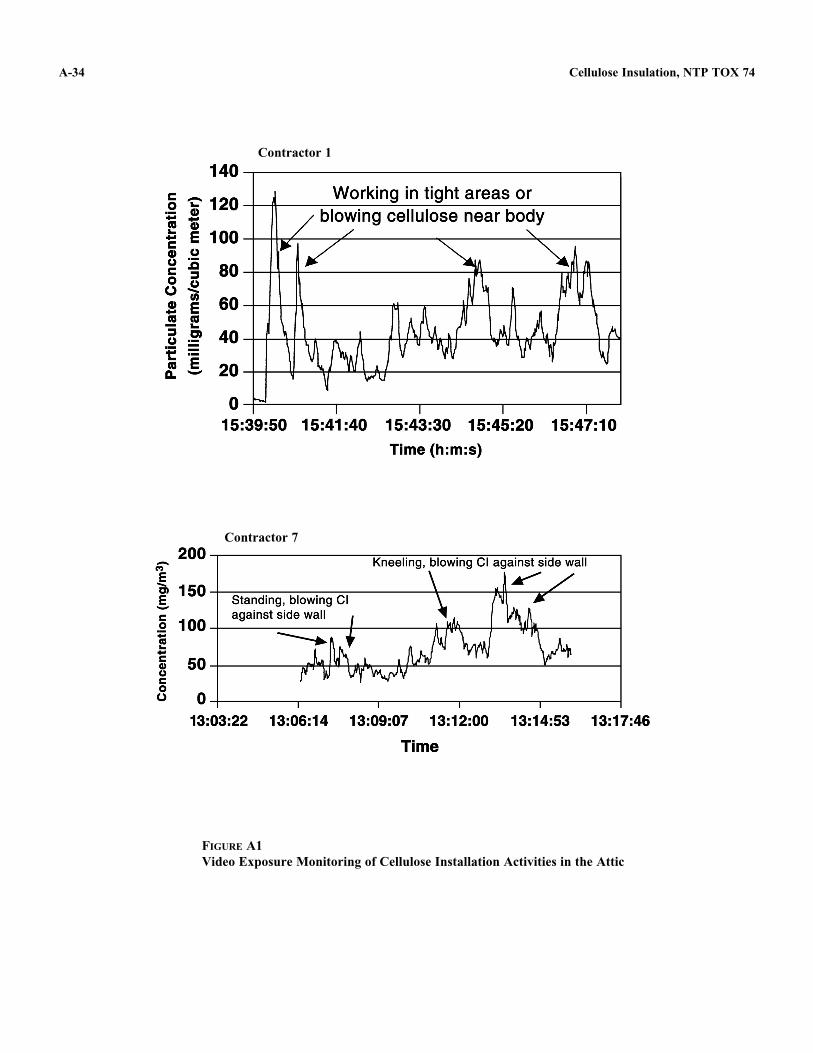
A-34 Cellulose Insulation, NTP TOX 74
Contractor 1
Contractor 7
FIGURE A1 Video Exposure Monitoring of Cellulose Installation Activities in the Attic

A-35 Cellulose Insulation, NTP TOX 74
Contractor 1
Contractor 7
FIGURE A2 Video Exposure Monitoring of Cellulose Installation Activities in the Truck

A-36 Cellulose Insulation, NTP TOX 74

B-1
APPENDIX BMEDICAL HISTORY QUESTIONNAIRE
TABLE B1 Health Questionnaire: Cellulose Insulation Study . . . . . . . . . . . . . . . . . . . . . . . . . . . . . . . . . B-2

Medical History Questionnaire
Health Questionnaire: Cellulose Insulation Study IDENTIFYING INFORMATION
Complete the entire form. DO NOT LEAVE ANY BLANKS.
II~Nomo. __ First Name: ______________ _
Street Address: City/Town:
State: Zip Code:
Home Phone Number: Work Phone Number:
( ) ( )
Sex: 1. M 0 2. F 0
Date of birth: ---- (MMIDD/YY) Age: __ _
Height: __ feet __ inches
Weight: ___ pounds
WORK HISTORY
1. In What Year Did You First Begin Working in Cellulose Insulation? 19 __
2. What Term Best Describes Your Current Job Title?
3. How Long Have You Worked at Your Current Job Title? ___ (Weeks I months I years) (Circle One)
4. How Many Weeks per Year Do You Perform Cellulose Insulation? __ _
ID# ---
II
5. On Average, for the Weeks That You Perform Insulation Work, How Many Hours Do You Work Each Week? ____ Hrs.
B-2 Cellulose Insulation, NTP TOX 74
TABLE B1 Health Questionnaire: Cellulose Insulation Study

Complete the entire form. DO NOT LEAVE ANY BLANKS
1 . Do you usually cough first thing in the morning? 1. Yes 0 2. No 0 {5}
Count a cough with the first cigarette or on first going out of doors. Exclude clearing the throat or a single cough. "Usually" means 4 or more days per week.
2. Do you usually cough during the day? 1. Yes 0 2. No 0 {6}
Ignore an occasional cough. "Usually" means 4 or more days per week.
(If "NO" to BOTH questions #1 and #2, go to Question #3 below.) (If "YES" to either #1 or #2 answer questions in the box below and continue.)
2a. Do you cough like this on most days for as much as three months during the year? 1. Yes 0 2. No 0
2b. If yes, how many years have_you coughed like this? #years.
PHLEGM
3. Do you usually bring up any phlegm from your chest on getting up, or first thing in the morning?
1. Yes 0 2. No 0
Count phlegm with first cigarette or on first going out of doors. Exclude phlegm from the nose. Count swallowed phlegm. "Usually" means 4 or more days per week.
B-3 Cellulose Insulation, NTP TOX 74
TABLE B1 Health Questionnaire: Cellulose Insulation Study (continued)

4. Do you usually bring up phlegm from your chest during the day?
1. Yes D 2. No D
"Usually" means 4 or more days per week. Answer "YES" if it occurs twice or more.
(If "NO" to BOTH questions #3 and #4, go to question #5.) (If "YES" to either #3 or #4, answer questions in the box below and continue.)
RESPIRATORY
4a. Do you bring up phlegm like this on most days for as much as three months during the year? 1. Yes 0 2. No 0
4b. If yes, how many years have you brought up phlegm like this? ____ # years
5. Are you troubled by shortness of breath when hurrying on level ground or walking up a slight hill?
1. Yes D 2. No D
(If "YES" to #5, answer questions in the box below. If "NO", go to question #6.)
5a. Do you get short of breath walking with other people of your own age on level ground? 1. Yes 0 2. No 0
5b. Do you have to stop for breath when walking at a normal pace at level ground? 1. Yes 0 2. No D
6. Does your chest ever feel tight or your breathing become difficult?
1. Yes D 2. No D
(If "YES" to #6, continue with questions in the box below. If "NO", skip to question #7)
6a. What time of day? (choose one) 0 1 • No set pattern 0 2. Before entering the work site? 0 3. After entering the work site? 0 4. Shortly after leaving the work site (1-3 hours)? 0 5. Some hours after leaving the work site (3-8 hours)?
6b. Are/were the attacks of chest tightness accompanied by either fever or shivering? 1. Yes D 2. No D
6c. Are/were the attacks accompanied by headache? 1. Yes D 2. No D
6d. Are/were the attacks accompanied by muscle ache? 1. Yes D 2. No D
6e. Does your chest tightness or your breathing difficulty occur on any particular day of the week? 1. Yes D 2. No
(If "YES" to #6e answer questions in the following box. If "NO", go to question #7)
B-4 Cellulose Insulation, NTP TOX 74
TABLE B1 Health Questionnaire: Cellulose Insulation Study (continued)

6e-1 . Which day? (choose one)
1. 0 Monday 2. 0 Tuesday 3. 0 Wednesday 4. 0 Thursday 5. 0 Friday 6. 0 Saturday 7. 0 Sunday
6e-2. Is the day you checked the first day of your work week? 1. Yes 0 2. No 0
7. Do you ever have wheezing or whistling noises in your chest? 1. Yes 0 2. No 0
(If "YES" to# 7 answer question in box below. If "NO", go to question #8)
7a. Does this happen as often as once per week? 1. Yes 0 2. No 0
8. Have you ever had attacks of shortness of breath with wheezing? 1. Yes 0 2. No 0
(If "YES" to #8 answer questions in box below. If "NO", go to question #9)
Sa. Was your breathing absolutely normal between attacks? 1. Yes 0 2. No 0
Sb. How many attacks like this have you had in the past three years?_# attacks
Be. How many years have you had attacks like this?
9 Since childhood, have you ever had: Hay fever 1. Yes 0 Emphysema 1. Yes 0 Tuberculosis 1. Yes 0 Bronchitis 1. Yes 0 Pneumonia 1. Yes 0
2. No 0 2. No 0 2. No 0 2. No 0 2. No 0
10. Have you ever had asthma? (check the number for the best answer) 01. No, I have never had asthma.
#years
02. Yes, I had asthma as a child and it has continued as an adult. 03. Yes, I had asthma as a child, the symptoms went away, but started again. 04. Yes, ·I had asthma as a child, but it went away and has not returned. 05. Yes, I have asthma as an adult, but I never had it when I was a child.
"YES" to #10 answer questions in box below. If "NO", go to question #11
1 Oa. If you have had asthma has it ever been confirmed by a physician? 1. 0 Yes 2. 0 No
1 Ob. Have you developed asthma or has your asthma gotten worse since starting work on a Cl crew? 1. 0 Yes 2. 0 No
1 Oc. Have you ever taken a prescription medication for asthma? 1.0Yes 2.0No
B-5 Cellulose Insulation, NTP TOX 74
TABLE B1 Health Questionnaire: Cellulose Insulation Study (continued)

SINUS/NASAL
11. Do you usually have a stuffy nose, or drainage at the back of your nose?
1. Yes 0 2. No 0
12. During the past 12 months, have you had two or more episodes of blocked, itchy, or runny nose?
1. Yes 0 2. NoD
(If "YES" to # 11 or # 12, answer questions in the box below. If "NO • to BOTH # 11 and # 12, go to question # 13)
12a. Do you usually have these nose symptoms at any particular time of year? 1. Yes 0 2. No 0
If "Yes", which is the worst season? (choose one) 1. 0 Winter 2. 0 Spring 3. 0 Summer 4. 0 Fall
12b. When you have nose symptoms, do you usually have fever, headache, or general body ache? 1. Yes 0 2. No 0
12c. Were these nose symptoms mainly due to one of the following? (choose one) 1 . 0 cold or flu 2. 0 hay fever 3. 0 other allergies 4. 0 something else
(specify: ___________________ _
12d. Do the nose symptoms seem better or worse when you are away from work, such as on weekends, vacation, sick leave, or lay-off? (choose one) 1 . 0 neither better nor worse away from work 2. 0 better away from work 3. 0 worse awa from work
B-6 Cellulose Insulation, NTP TOX 74
TABLE B1 Health Questionnaire: Cellulose Insulation Study (continued)

EYES
13. During the past 12 months, have your eyes been red, itchy, or watery more than twice?
1. Yes 0 2. No 0
(If "YES • to # 13, answer questions in the box below. If "NO", go to question # 14)
13a. Over the past year, about how often have you noticed these eye symptoms? (choose one) 1 . 0 less than 1-2 days altogether 2. 0 less than 7 days 3. 0 less than 30 days 4. 0 more than 30 days
13b. Do you usually have these eye symptoms at any particular time of the year? 1. Yes 0 2. No 0
If "Yes" which is the worst season? (choose one) 1. 0 Winter 2. 0 Spring 3. 0 Summer 4. 0 Fall
13c. When you have eye symptoms, do you usually have fever, headache, or general body ache? 1. Yes 0 2. No 0
13d. Were these eye symptoms mainly due to one of the following? (choose one) 1. 0 contact lenses 2. 0 cold or flu 3. 0 hay fever 4. 0 other allergies 5. 0 something else
(specify------------------------
13e. Did/do the eye symptoms seem better or worse when you were away from work, such as on weekends, vacation, sick leave, or lay-off? (choose one) 1 . 0 stayed the same 2. 0 got better 3. 0 got worse
B-7 Cellulose Insulation, NTP TOX 74
TABLE B1 Health Questionnaire: Cellulose Insulation Study (continued)

SKIN
14. During the last 12 months have you had a skin rash, dermatitis, hives, or eczema? 1. Yes 0 2. No 0
(If "YES" to #14, answer questions in box below. If "NO", go to question #15)
14a. Is/was this rash related to anything you do at work? 1. 0 Yes 2. 0 No
If "YES" to #18a what is this rash related to?----------
14b. What parts of your body were affected? Scalp 1. 0 Yes 2. 0 No Face 1. 0 Yes 2. 0 No Hand or arm 1. 0 Yes 2. 0 No Trunk 1. 0 Yes 2. 0 No Groin or private parts 1. 0 Yes 2. 0 No Feet or legs 1. 0 Yes 2. 0 No Other 1. 0 Yes 2. 0 No
(Specify:------------------·
14c. Did/does your skin seem better or worse when you were away from work such as weekends, vacation, sick leave, or lay-off? (choose one) 1 . 0 stayed the same 2. 0 got better 3. 0 ot worse
15. Have you seen a doctor for any problem in the last year? 1. Yes 0 2. No 0 If "Yes", please specify:------------------.,.---------
16. Do you presently take any medications, including non-prescription medicine, for any reason? 1. Yes 0 2. No 0 If "Yes", please specify:
SMOKING HISTORY
17. Have you smoked, altogether, as many as 5 packs of cigarettes during your entire life? 1. Yes 0 2. No 0 3. Never smoked 0
(If "YES" to # 17, answer questions in box below. If "NO •, o to "Musuloske/etal" section top of pa e 11 J
17a. Over the years that you smoked, on average how many cigarettes do (did) you smoke? 0 1 . less than % pack per day
17b.
0 2. more than 1/2 to one pack per day 0 3. 1-2 packs per day 0 4. more than two packs per day
How old were you when you started smoking? ___ years old
17c. If you have stopped smoking, how old were you when you stopped? __ years old
17d. During the years that you smoked, did you ever quit for a year or more? 1. Yes 0 2. No 0
IF "YES", ADDING ALL THE NON-SMOKING PERIODS TOGETHER FOR HOW MANY TOTAL YEARS WERE YOU NOT SMOKING? # ears.
18. Do you regularly smoke during work? Yes 0 2. No 0
B-8 Cellulose Insulation, NTP TOX 74
TABLE B1 Health Questionnaire: Cellulose Insulation Study (continued)

MUSCULOSKELETAL
1. ARE YOU:
RIGHT-HANDED __ LEFT-HANDED __ USE BOTH HANDS EQUALLY __ _
2. WHICH HAND DO YOU MOST OFTEN USE AT WORK?
RIGHT___ LEFT___ USE BOTH HANDS EQUALLY __ _
3. Next, we have a few questions about physical symptoms you could experience from working on a road crew.
During the last 12 months have During the last 12 months have During the last 12 months have you had a job-related ache, you been prevented from doing your you seen a physician for this pain, discomfort, etc. in your: day's work due to this condition? condition?
NECK No Yes No Yes No Yes - - -
UPPER BACK No Yes No Yes No Yes - - -
LOW BACK No Yes - No _Yes No Yes -
SHOULDERS No Yes No Yes No Yes - - -
ELBOWS - No Yes - No _Yes - No _Yes
WRISTS/HANDS - No _Yes - No Yes - No _Yes
HIPS/THIGHS - No - Yes - No _Yes No _Yes -
KNEES - No Yes - No _Yes No Yes -
ANKLES/FEET - No _Yes - No _Yes No _Yes -
That is all the questions we have. Thank you so much for your cooperation!
Interviewer Name:
Interviewer Comments:
B-9 Cellulose Insulation, NTP TOX 74
TABLE B1 Health Questionnaire: Cellulose Insulation Study (continued)

B-10 Cellulose Insulation, NTP TOX 74
C-1
APPENDIX CACUTE SYMPTOMS SURVEY
TABLE C1 Acute Symptoms Survey: Cellulose Insulation Study . . . . . . . . . . . . . . . . . . . . . . . . . . . . . . . C-2

lAST· FI~ST : DATE :
TIME (nearest qtr hour) PEAK FLOW TESTS
I) (am I pm) pre-shift I) Peak Flow 1: --- Peak Flow 2: --- Peak flow 3: ---2) (amlpm) 2) Peak Flow 1: --- Peak Flow 2: --- Peak Flow 3: ---3) (amlpm) 3) Peak Flow 1: --- Peak Flow 2: --- Peak Flow 3: ---4) (amlpm) 4) Peak flow 1: --- Peak Flow 2: --- Peak Flow 3: ---5) (amlpm) 5) Peak Flow 1: --- P.iak Flow 2: --- Peak Flow 3: ---
MAJOR ACfiVITIES (approx. duradon) Duration cellulose exp. since last ques. (nearest qlr. hr.) I ) pre-shill: I) (pre-shift) 2) 2) 3) 3) 4) 4) 5) 5)
How many cigarettes I cigars haw you smoked since getting up today I) None -- ~5 __ 6-10 -- 11·20 -- >20 -- last smoke time: ---OR since the last questionnaire? 2) None -- ~5 -- 6-10 -- 11·20 -- >20 -- last smoke lime: ---
3) None -- ~5 __ 6-10 -- 11·20 -- >20 -- last smoke time: ---4) None -- ~5 -- 6-10 -- 11·20 -- >20 -- last smoke time: ---5) None -- ~5 -- 6-10 -- 11·20 -- >20 -- last smoke time: ---
Have your EYES been burning, itchy, painful, or irritated since getjjog I) NO_Mild_Mod_Sew!re_ Still haw Sxs: YIN II no, dur. Sxs _ (qtr hr) up 2) NO_Mild_Mod_Sew!re_ Still haw Sxs: YIN II no, dur. Sxs __ today OR since the last questionnaire? 3) NO_Mild_Mod_Sew!re_ Still have Sxs : Y I N II no, dur. Sxs __
4) NO_Mild_ Mod_Sew!re_ Still haw Sxs: YIN · II no, dur. Sxs __ 5) NO_ Mild_ Mod_ Sew!re_ StillhawSxs:YIN If no, dur. Sxs __
Has your NOSE been burning, itchy, stulfy, or irritated since getdng up I) NO_Mild_Mod_Sew!re_ Stili haw Sxs: Y I N II no, dur. Sxs _ (qtr hr) today OR since the last questionnaire? 2) NO_Mild_Mod_Sew!re_ Still have Sxs : Y I N II no, dur. Sxs __
3) NO_ Mild_ Mod_ Sew!re_ StillhawSxs:YIN If no, dur. Sxs __ 4) NO_Mild_Mod_Sew!re_ StillhawSxs:YIN II no, dur. Sxs __ 5) NO_ Mild_ Mod_ s..ere_ StillhawSxs:YIN II no, dur. Sxs __
Has your THROAT been sore, dry, scratchy, or irritated since getting I) NO_Mild_Mod_Sew!re_ StillhawSxs:YIN II no, dur. Sxs _ (qtr hr) up 2) NO_ Mild_ Mod_ Sew!re_ Still haw Sxs : Y I N If no, dur. Sxs __ today OR since the last questionnaire? 3) NO_ Mild-'- Mod_ s..ere_ Still have Sxs : Y I N II no, dur. Sxs __
4) NO_ Mild_ Mod_ Sew!re_ Still have Sxs : Y I N II no, dur. Sxs __ 5) NO_ Mild_ Mod_ Sew!re_ StillhawSxs:YIN II no, dur. Sxs __
Has your SKIN been burning, itchy, irritated or dewloped a rash since I) NO_Mild_Mod_Sew!re_ StillhawSxs:YIN II no, dur. Sxs _ (qtr hr) getdng up today OR since the last questionnaire? 2) NO_ Mild_ Mod_ s..ere_ Still haw Sxs : Y I N If no, dur. Sxs __
3) NO_ Mild_ Mod_ s..ere_ StillhawSxs:Y/N If no, dur. Sxs __ 4) NO_ Mild_ Mod_ Sew!re_ Still haw Sxs : Y I N If no, dur. Sxs __ 5) NO_Mild_Mod_Sew!re_ Still haw Sxs : Y I N If no, dur. Sxs __
Haw you been bothered by COUGHING since getdng up today OR I) NO_Mild_Mod_Sew!re_ Still haw Su : Y I N linn, dur. Su_ (qtrhr) since the last questionnaire? 2) NO_Mild_Mod_Sew!re_ Still have Sxs : Y I N If no, dur. Su __
3) NO_Mild_Mod_Sew!re_ StillhawSu:YIN II no, dur. Su __ 4) NO_ Mild_ Mod_ Sew!re_ StillhawSu:YIN II no, dur. Su __ 5) NO_ Mild_ Mod_ Sew!re_ StillhaveSu:YIN II no, dur. Sxs __
Haw you experienced CHEST TIGHTNESS, or difficulty breathing I) NO_Mild_Mod_Sew!re_ Still have Sxs : Y I N II no, dur. Sxs _ (qtr hr) since getting up today OR since the last questionnaire? 2) NO_ Mild_ Mod_ Sew!re_ Still haw Su : Y I N II no, dur. Su __
3) NO_ Mild_ Mod_ Sew!re_ Still haw Su : Y I N If no, dur. Sxs __ 4) NO_Mild_Mod_Sew!re_ StillhawSxs:YIN If no, dur. Sxs __ 5) NO_ Mild_ Mod_ Sew!re_ StillhawSu:YIN If no, dar. Sxs __
Haw you experienced WHEEZING or whistling in your chest since I) NO_ Mild_ Mod_ Sew!re_ Still have Sxs: Y./ N If no, dur. Sxs _ (qtr hr) getting up today OR since the last questionnaire? 2) NO_Mild_Mod_Sew!re_ StillhaveSu:YIN If no, dur. Sxs __
3) NO_ Mild_ Mod_ Sew!re_ StillhaveSu:YIN II no, dur. Sxs __ 4) NO_Mild_Mod_Sew!re_ Still have Sxs : Y I N If ao, dur. Sxs __ 5) NO_ Mild_ Mod_ Sew!re_ StillhawSu:YIN II no, dur. Sxs __
C-2 Cellulose Insulation, NTP TOX 74
TABLE C1 Acute Symptoms Survey: Cellulose Insulation Study

Erratum -- TOX-74, NTP Toxicity Study Report on the Atmospheric Characterization, Particle Size, Chemical Composition, and Workplace Exposure Assessment of Cellulose Insulation. The following sentences found on page 14, section on Use and Human Exposure are deleted from this report:
CI is more economical than other types of thermal insulation because it is more efficient. It can also reach more areas than other insulation materials because of its blown application process (Anonymous, 1977; Zicherman and Fisher, 1978; Chrenka, 1980; Sinanoglu, 1994).