NTP 43 TR o-,m- and p- choloaniline - Home - National ... · Other information about NTP studies is...
148
National Toxicology Program Toxicity Report Series Number 43 NTP Technical Report on Comparative Toxicity Studies of o-, m-, and p-Chloroaniline (CAS Nos. 95-51-2, 108-42-9, and 106-47-8) Administered by Gavage to F344/N Rats and B6C3F Mice 1 Rajendra S. Chhabra, Ph.D., Study Scientist National Toxicology Program Post Office Box 12233 # Research Triangle Park, NC 27709 # United States Department of Health and Human Services Public Health Service National Institutes of Health
-
Upload
vuongquynh -
Category
Documents
-
view
213 -
download
0
Transcript of NTP 43 TR o-,m- and p- choloaniline - Home - National ... · Other information about NTP studies is...

National Toxicology Program Toxicity Report Series
Number 43
NTP Technical Report on Comparative Toxicity Studies of
o-, m-, and p-Chloroaniline (CAS Nos. 95-51-2, 108-42-9, and 106-47-8)
Administered by Gavage to F344/N Rats and B6C3F Mice1
Rajendra S. Chhabra, Ph.D., Study Scientist National Toxicology Program
Post Office Box 12233#Research Triangle Park, NC 27709#
United States Department of Health and Human Services Public Health Service
National Institutes of Health

Note to the Reader
The National Toxicology Program (NTP) is made up of four charter agencies of the United States Department of Health and Human Services (DHHS):
• the National Cancer Institute (NCI) of the National Institutes of Health; • the National Institute of Environmental Health Sciences (NIEHS) of the National Institutes of
Health; • the National Center for Toxicological Research (NCTR) of the Food and Drug Administration; and • the National Institute for Occupational Safety and Health (NIOSH) of the Centers for Disease
Control. In July 1981, the Carcinogenesis Bioassay Testing Program was transferred from NCI to NIEHS. NTP coordinates the relevant Public Health Service programs, staff, and resources that are concerned with basic and applied research and with biological assay development and validation.
The NTP develops, evaluates, and disseminates scientific information about potentially toxic and hazardous chemicals. This knowledge is used for protecting the health of the American people and for the primary prevention of disease.
The NTP designs and conducts studies to characterize and evaluate the toxicologic potential of selected chemicals in laboratory animals (usually two species, rats and mice). Chemicals selected for NTP toxicology studies are chosen primarily on the bases of human exposure, level of production, and chemical structure. The interpretive conclusions presented in this Toxicity Study Report are based only on the results of these NTP studies. Extrapolation of these results to other species and quantitative risk analyses for humans require wider analyses beyond the purview of these studies. Selection per se is not an indicator of a chemical's toxic potential.
The studies described in this Toxicity Study Report were performed under the direction of NIEHS and were conducted in compliance with NTP laboratory health and safety requirements. These studies met or exceeded all applicable federal, state, and local health and safety regulations. Animal care and use were in accord and compliance with the Public Health Service Policy on Humane Care and Use of Animals.
Listings of all published NTP reports and ongoing studies are available from NTP Central Data Management, NIEHS, P.O. Box 12233, MDE1-02, Research Triangle Park, NC 27709 (919-541-3419). Other information about NTP studies is available at the NTP's World Wide Web site: http://ntp-server.niehs.nih.gov.

National Toxicology Program Toxicity Report Series
Number 43
NTP Technical Report on Comparative Toxicity Studies of
o-, m-, and p-Chloroaniline (CAS Nos. 95-51-2, 108-42-9, and 106-47-8)
Administered by Gavage to F344/N Rats and B6C3F Mice1
Rajendra S. Chhabra, Ph.D., Study Scientist National Toxicology Program
Post Office Box 12233#Research Triangle Park, NC 27709#
United States Department of Health and Human Services Public Health Service
National Institutes of Health

2 o-, m-, & p-Chloroaniline, NTP TOX 43
CONTRIBUTORS
National Toxicology Program Evaluated and interpreted results and reported findings
R.S. Chhabra, Ph.D., Study Scientist
J.R. Bucher, Ph.D. L.T. Burka, Ph.D. R.E. Chapin, Ph.D. M.R. Elwell, D.V.M., Ph.D. J. Mahler, D.V.M. G.S. Travlos, D.V.M. K.L. Witt, M.S., Integrated Laboratory Systems
Battelle Columbus Laboratories Conducted studies and evaluated pathology findings
P.J. Kurtz, Ph.D., Principal Investigator M.R. Hejtmancik, Ph.D. R.L. Persing, D.V.M. M.J. Ryan, D.V.M., Ph.D. B.A. Trela, Ph.D. J.T. Yarrington, D.V.M., Ph.D.
NTP Pathology Working Group o-Chloroaniline: Evaluated slides and prepared pathology report (27 April 1993)
P.K. Hildebrandt, D.V.M., Chairperson PATHCO, Inc.
M.R. Elwell, D.V.M., Ph.D. National Toxicology Program
W.F. MacKenzie, D.V.M., M.S. Consultant
R.A. Herbert, D.V.M., Ph.D. National Toxicology Program
R.C. Sills, D.V.M., Ph.D. National Toxicology Program
S.A. Stefanski, D.V.M., M.S. North Carolina State University
NTP Pathology Working Group m-Chloroaniline: Evaluated slides and prepared pathology report (4 October 1994)
P.K. Hildebrandt, D.V.M., Chairperson PATHCO, Inc.
R. Cattley, V.M.D., Ph.D. Chemical Industry Institute of Toxicology
F. Geoly, D.V.M., Observer North Carolina State University
D.S. Marsman, D.V.M., Ph.D. National Toxicology Program
A. Radovsky, D.V.M., Ph.D. National Toxicology Program
C.C. Shackelford, D.V.M., M.S., Ph.D. Experimental Pathology Laboratories, Inc.
R.C. Sills, D.V.M., Ph.D. National Toxicology Program
Experimental Pathology Laboratories, Inc. Provided pathology quality assurance
J. Peckham, D.V.M., M.S., Ph.D. C.C. Shackelford, D.V.M., M.S., Ph.D.
Environmental Health Research and Testing, Inc. Provided sperm motility and vaginal cytology evaluations
T. Cocanougher, B.A. D.K. Gulati, Ph.D. S. Russell, B.A.
Analytical Sciences, Inc. Provided statistical analyses
R.W. Morris, M.S., Principal Investigator S. R. Lloyd, M.S. N.G. Mintz, B.S.
Biotechnical Services, Inc. Prepared Toxicity Study Report
S.R. Gunnels, M.A., Principal Investigator A.M. Macri-Hanson, M.A., M.F.A. W.D. Sharp, B.A., B.S.

3 o-, m-, & p-Chloroaniline, NTP TOX 43
PEER REVIEW
The draft report on the toxicity studies of o-chloroaniline, m-chloroaniline, and p-chloroaniline was evaluated by the reviewers listed below. These reviewers serve as independent scientists, not as representatives of any institution, company, or governmental agency. In this capacity, reviewers determine if the design and conditions of these NTP studies are appropriate and ensure that the toxicity study report presents the experimental results and conclusions fully and clearly.
Gary P. Carlson, Ph.D. John Mennear, Ph.D. School of Health Sciences Raleigh, NC Purdue University West Lafayette, IN

4 o-, m-, & p-Chloroaniline, NTP TOX 43#
CONTENTS
ABSTRACT . . . . . . . . . . . . . . . . . . . . . . . . . . . . . . . . . . . . . . . . . . . . . . . . . . . . . . . . . . . . 5 #
INTRODUCTION . . . . . . . . . . . . . . . . . . . . . . . . . . . . . . . . . . . . . . . . . . . . . . . . . . . . . . . . 7 #Physical Properties, Production, Use, and Exposure . . . . . . . . . . . . . . . . . . . . . . . . . . . . . . . . 7 #Disposition and Metabolism . . . . . . . . . . . . . . . . . . . . . . . . . . . . . . . . . . . . . . . . . . . . . . . . 8 #Toxicity . . . . . . . . . . . . . . . . . . . . . . . . . . . . . . . . . . . . . . . . . . . . . . . . . . . . . . . . . . . . . 8 #Study Rationale and Design . . . . . . . . . . . . . . . . . . . . . . . . . . . . . . . . . . . . . . . . . . . . . . . . 12 #
MATERIALS AND METHODS . . . . . . . . . . . . . . . . . . . . . . . . . . . . . . . . . . . . . . . . . . . . . . . 13 #Procurement and Characterization of o-Chloroaniline and m-Chloroaniline . . . . . . . . . . . . . . . . . . 13 #Dose Formulations . . . . . . . . . . . . . . . . . . . . . . . . . . . . . . . . . . . . . . . . . . . . . . . . . . . . . . 13 #Toxicity Study Designs . . . . . . . . . . . . . . . . . . . . . . . . . . . . . . . . . . . . . . . . . . . . . . . . . . . 14 #Statistical Methods . . . . . . . . . . . . . . . . . . . . . . . . . . . . . . . . . . . . . . . . . . . . . . . . . . . . . . 19 #Quality Assurance . . . . . . . . . . . . . . . . . . . . . . . . . . . . . . . . . . . . . . . . . . . . . . . . . . . . . . 19 #Genetic Toxicity Studies . . . . . . . . . . . . . . . . . . . . . . . . . . . . . . . . . . . . . . . . . . . . . . . . . . 20 #
RESULTS . . . . . . . . . . . . . . . . . . . . . . . . . . . . . . . . . . . . . . . . . . . . . . . . . . . . . . . . . . . . . . 25 #13-Week Gavage Studies in F344/N Rats . . . . . . . . . . . . . . . . . . . . . . . . . . . . . . . . . . . . . . . . 25 #13-Week Gavage Studies in B6C3F Mice 1 . . . . . . . . . . . . . . . . . . . . . . . . . . . . . . . . . . . . . . . 46 #Genetic Toxicity . . . . . . . . . . . . . . . . . . . . . . . . . . . . . . . . . . . . . . . . . . . . . . . . . . . . . . . 62 #
DISCUSSION . . . . . . . . . . . . . . . . . . . . . . . . . . . . . . . . . . . . . . . . . . . . . . . . . . . . . . . . . . . 65 #
REFERENCES . . . . . . . . . . . . . . . . . . . . . . . . . . . . . . . . . . . . . . . . . . . . . . . . . . . . . . . . . . 71 #
APPENDIXES Appendix A Summary of Nonneoplastic Lesions in Rats . . . . . . . . . . . . . . . . . . . . . . . . . . . A-1#
Appendix B Summary of Nonneoplastic Lesions in Mice . . . . . . . . . . . . . . . . . . . . . . . . . . B-1#
Appendix C Organ Weights and Organ-Weight-to-Body-Weight Ratios . . . . . . . . . . . . . . . . . C-1#
Appendix D Hematology and Clinical Chemistry Results . . . . . . . . . . . . . . . . . . . . . . . . . . D-1#
Appendix E Reproductive Tissue Evaluations and Estrous Cycle Characterization . . . . . . . . . . . . . . . . . . . . . . . . . . . . . . . . E-1#
Appendix F Genetic Toxicology . . . . . . . . . . . . . . . . . . . . . . . . . . . . . . . . . . . . . . . . . . F-1#
5
ABSTRACT
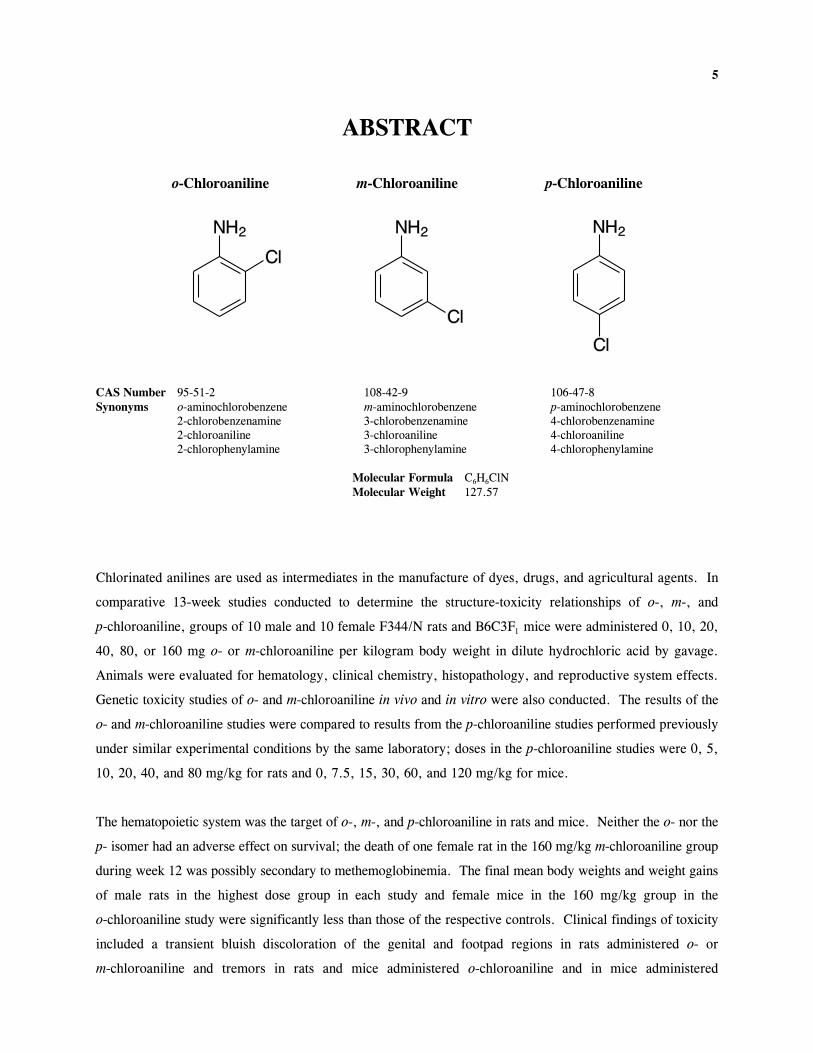
o-Chloroaniline m-Chloroaniline p-Chloroaniline
CAS Number 95-51-2 108-42-9 106-47-8 Synonyms o-aminochlorobenzene m-aminochlorobenzene p-aminochlorobenzene
2-chlorobenzenamine 3-chlorobenzenamine 4-chlorobenzenamine 2-chloroaniline 3-chloroaniline 4-chloroaniline 2-chlorophenylamine 3-chlorophenylamine 4-chlorophenylamine
Molecular Formula C H ClN6 6
Molecular Weight 127.57
Chlorinated anilines are used as intermediates in the manufacture of dyes, drugs, and agricultural agents. In
comparative 13-week studies conducted to determine the structure-toxicity relationships of o-, m-, and
p-chloroaniline, groups of 10 male and 10 female F344/N rats and B6C3F mice were administered 0, 10, 20,1
40, 80, or 160 mg o- or m-chloroaniline per kilogram body weight in dilute hydrochloric acid by gavage.
Animals were evaluated for hematology, clinical chemistry, histopathology, and reproductive system effects.
Genetic toxicity studies of o- and m-chloroaniline in vivo and in vitro were also conducted. The results of the
o- and m-chloroaniline studies were compared to results from the p-chloroaniline studies performed previously
under similar experimental conditions by the same laboratory; doses in the p-chloroaniline studies were 0, 5,
10, 20, 40, and 80 mg/kg for rats and 0, 7.5, 15, 30, 60, and 120 mg/kg for mice.
The hematopoietic system was the target of o-, m-, and p-chloroaniline in rats and mice. Neither the o- nor the
p- isomer had an adverse effect on survival; the death of one female rat in the 160 mg/kg m-chloroaniline group
during week 12 was possibly secondary to methemoglobinemia. The final mean body weights and weight gains
of male rats in the highest dose group in each study and female mice in the 160 mg/kg group in the
o-chloroaniline study were significantly less than those of the respective controls. Clinical findings of toxicity
included a transient bluish discoloration of the genital and footpad regions in rats administered o- or
m-chloroaniline and tremors in rats and mice administered o-chloroaniline and in mice administered

6 o-, m-, & p-Chloroaniline, NTP TOX 43
m-chloroaniline; these effects occurred primarily in the 80 and 160 mg/kg groups. Methemoglobin
concentrations were increased in dosed rats and mice in all studies and resulted in a secondary anemia; the
severity of the anemia increased with increasing dose. Microscopic lesions considered related to chemical
administration in rats and mice included hemosiderin pigmentation in the bone marrow, kidney, liver, and
spleen; hematopoiesis in the liver and spleen; and erythroid cell hyperplasia in the bone marrow. These lesions
reflected the response to hemolytic anemia and methemoglobinemia induced by the chloroanilines. A
comparative analysis of the results suggests that p-chloroaniline is the most potent of the chloroaniline isomers
in the induction of methemoglobin formation in rats and mice, followed by m-chloroaniline and then by
o-chloroaniline. This order of potency was also observed for changes in other hematology parameters and in
spleen weights, gross and microscopic lesions, and the severity of hemosiderin deposition.
Although the o-, m-, and p- isomers of chloroaniline all exhibit genetic toxicity, the profiles of activity among
the three isomers are not identical. p-Chloroaniline was mutagenic in all assays in which it was tested, including
the Salmonella assay, the mouse lymphoma assay, in vitro Chinese hamster ovary cell cytogenetics assays, and
the in vivo mouse bone marrow micronucleus assay; in contrast, o- and m-chloroaniline gave mixed results
among the various assays in which each was tested.
In conclusion, chloroaniline isomers are hematotoxic and have the same pattern of toxicity in rats and mice.
Hematotoxicity occurred at all doses in these studies. p-Chloroaniline induces the most severe hematotoxic
effect, followed by m-chloroaniline, then o-chloroaniline. Each of the three isomers is more toxic to rats than
to mice. p-Chloroaniline is clearly genotoxic in various test systems, while the results for the o- and m- isomers
are inconsistent and indicate weak or no genotoxic effects.

7
INTRODUCTION
PHYSICAL PROPERTIES, PRODUCTION, USE, AND EXPOSURE
o-Chloroaniline and m-chloroaniline are synthesized by the reduction of 1-chloro-2-nitrobenzene and
1-chloro-3-nitrobenzene, respectively (Merck Index, 1983). Some of the physical properties of these aromatic
amines are given in Table 1.
TABLE 1 Physical Properties of o-Chloroaniline and m-Chloroanilinea
Parameter o-Chloroaniline m-Chloroaniline
Boiling point 208.84E C 230.5E C
Density at 22E C 1.12114 1.2150
Vapor pressure 0.17 mm Hg at 20E C <0.1 mm Hg at 30E C
Solubility Practically insoluble in water; Practically insoluble in water; soluble in acids and organic solvents soluble in organic solvents
a HSDB, 1995
o-Chloroaniline is used as a dye intermediate and as an intermediate in the manufacture of petroleum solvents,
rubber, and fungicides (IARC, 1982; Hawley's Condensed Chemical Dictionary, 1987). The Toxic Substances
Control Act Chemical Substances Inventory reported in 1977 that between 100,000 and 1,000,000 pounds were
produced in the United States and approximately 200,000 pounds were imported (USEPA, 1983).
m-Chloroaniline is used as an intermediate in the production of azo dyes and pigments, pharmaceuticals,
insecticides, and herbicides (Hawley's Condensed Chemical Dictionary, 1987). Its major use is in the
manufacture of the herbicide chlorpropham; in 1978, 4,500,000 grams of m-chloroaniline were produced
(HSDB, 1995).
Chloroanilines may be released into the environment from process/waste emissions involved in their production
or use and may also enter the environment as degradation products of various pesticides (Hargesheimer et al.,
1981) or from residues in food (HSDB, 1995). Chloroanilines bond with humic materials in water and soil
(Lyman et al., 1982). Detectable levels of m-chloroaniline in the Rhine River and its tributaries have been
attributed to wastewater effluents from chemical and other industrial plants (Greve and Wegman, 1975).
Following the application of the herbicide propanil to irrigated fields, m-chloroaniline was identified as a
propanil-derived metabolite in fish and algae of irrigation reservoirs (Barabanova and Motoenkov, 1973).

8 o-, m-, & p-Chloroaniline, NTP TOX 43
o-Chloroaniline and m-chloroaniline have also been designated as hazardous wastes by the U.S. Environmental
Protection Agency (40 CFR, Part 61).
Occupational exposure to o- and m-chloroaniline occurs primarily by dermal contact or inhalation. NIOSH
surveys showed that approximately 18,138 workers were exposed to o-chloroaniline in the U.S. between 1972
and 1974 (NIOSH, 1990a) and approximately 851 workers were exposed to m-chloroaniline between 1981 and
1983 (NIOSH, 1990b).
DISPOSITION AND METABOLISM
Urinary metabolites in an unspecified strain of rats were analyzed 24 hours after the intragastric administration
in oil of 150 mg m-chloroaniline per kilogram body weight (Böhme and Grunow, 1969). Aromatic
hydroxylation was the primary route of metabolism for m-chloroaniline-derived material in the urine.
m-Chloroaniline was preferentially hydroxylated at the carbon opposite to the amino group, forming 2-chloro-
4-aminophenol; 38.6% of the administered dose was excreted in this form. A smaller percentage of the
administered dose (16.4%) was excreted as ortho-hydroxy congeners. Of the two potential forms of o-hydroxy
metabolites, 2-amino-4-chlorophenol was detected in the greatest amount. The other o-hydroxy compound,
2-amino-6-chlorophenol, was found in trace quantities as the glucuronide or sulfate, and 0.8% of the
administered dose was excreted unchanged. The phenolic metabolites of m-chloroaniline were eliminated solely
in the conjugated form; only trace amounts of free phenol were found. N-Acetyl derivatives of
aminochlorophenols were also detected. Bray et al. (1956) reported that in female rabbits administered 0.1 g/kg
o-chloroaniline (route not specified), o-chloroaniline is metabolized to 2-amino-3-chlorophenol and 4-amino-
3-chlorophenol.
TOXICITY
The major toxic effect of aniline and its aromatic amine and chlorinated derivatives is methemoglobin formation
in erythrocytes, resulting from the oxidation of heme iron from the ferrous to the ferric state (McLean et al.,
1969; de Bruin, 1976; Chhabra et al., 1990). Aniline derivatives are only effective as methemoglobin-inducing
agents in vivo, and it has therefore been speculated that the ultimate hematotoxic species are aminophenol or
N-hydroxylamine metabolites (Smith, 1996). Because methemoglobin is physiologically inactive and cannot
bind reversibly with oxygen, the cooperativity between heme groups that is required for the loading and
unloading of oxygen is compromised, and a smaller proportion of blood oxygen is available for release into
tissues. Circulating levels of methemoglobin have been shown to produce a greater impairment in peripheral
oxygen transport than an equivalent true anemia produced by a reduction in erythrocyte count (Darling and

9 o-, m-, & p-Chloroaniline, NTP TOX 43
Roughton, 1942). Methemoglobinemia is usually a transient effect due to intraerythrocytic mechanisms that
facilitate the conversion of methemoglobin to hemoglobin, but it may be sustained under repeated chemical
exposure. The resulting generalized hypoxia may lead to secondary central nervous system and cardiac
disorders.
Toxic Effects in Humans
Exposure to chloroanilines has been associated with methemoglobinemia, with potential liver and kidney
damage, in humans (Benya and Cornish, 1994).
Toxic Effects in Animals
Median lethal inhalation concentrations (LC 50) or oral or dermal lethal doses (LD )50 of o-, m-, and
p-chloroaniline are given in Table 2.
The lowest lethal concentration (LCLo) of m-chloroaniline is 900 ppm in rats exposed by inhalation for 6 hours
(RTECS, 1995). LDLos of o-, m-, and p-chloroaniline in cats following subcutaneous injection are 310, 125,
and 125 mg/kg, respectively (Lehmann, 1933); following intravenous administration, LD Los in dogs are
50 mg/kg for m-chloroaniline and 100 mg/kg for p-chloroaniline (Kiese, 1963).
The formation of methemoglobin was followed over 5 hours in a group of five cats administered 0.25 mmol
o- or m-chloroaniline orally (McLean et al., 1969). For o-chloroaniline, the percentage of methemoglobin in
the blood was greatest (62%) 2 hours after treatment and was decreased to 41% after 5 hours. Five hours after
dosing with m-chloroaniline, the methemoglobin concentration was 58%. The methemoglobin-generating
potential of m-chloroaniline was roughly equivalent to that of aniline and o-chloroaniline but was substantially
less than that of p-chloroaniline. Watanabe et al. (1976) reported a 12% increase in methemoglobin 5 hours
after rats received a single intraperitoneal injection of o-chloroaniline. These studies showed that chloroanilines
tend to produce a long-lasting methemoglobin response, which has been associated with the formation of Heinz
bodies in erythrocytes (Rentsch, 1968). A similar rank order of methemoglobin-inducing activity for the
chloroaniline isomers has been reported in dogs (Kiese, 1963).

10 o-, m-, & p-Chloroaniline, NTP TOX 43
TABLE 2 Summary of Selected Animal Toxicity Data for o-Chloroaniline, m-Chloroaniline, and p-Chloroaniline
Route of Species Exposure LC or LD Reference50 50
o-Chloroaniline
Mouse Inhalation 2.00 mmol/kg RTECS, 1995#Mouse Dermal 256 mg/kg RTECS, 1995#Cat Inhalation 1.74 mmol/kg RTECS, 1995#Cat Dermal 222 mg/kg RTECS, 1995#
m-Chloroaniline
Rat Oral 256 mg/kg Malkova, 1966 Rat Dermal 250 mg/kg Izmerov et al., 1982 Rat Intraperitoneal 200 mg/kg RTECS, 1995 Mouse Inhalation 550 mg/m3/4H Izmerov et al., 1982 Mouse Inhalation 2.62 mmol/kg RTECS, 1995 Mouse Dermal 334 mg/kg RTECS, 1995 Mouse Intraperitoneal 200 mg/kg RTECS, 1995 Guinea pig Oral 250 mg/kg Malkova, 1966 Guinea pig Intraperitoneal 100 mg/kg RTECS, 1995 Cat Inhalation 1.75 mmol/kg RTECS, 1995 Cat Dermal 223 mg/kg RTECS, 1995
p-Chloroaniline
Rat Oral 300 mg/kg Khamuev, 1967 Rat Dermal 3,200 mg/kg Sziza and Podhragyai, 1957 Rat Intraperitoneal 420 mg/kg Sziza and Podhragyai, 1957 Mouse Oral 100 mg/kg RTECS, 1995 Mouse Inhalation 1.79 mmol/kg RTECS, 1995 Mouse Dermal 228 mg/kg RTECS, 1995 Mouse Intraperitoneal 200 mg/kg RTECS, 1995 Rabbit Dermal 360 mg/kg Smyth et al., 1962 Guinea pig Oral 350 mg/kg Izmerov et al., 1982 Cat Inhalation 1.88 mmol/kg RTECS, 1995 Cat Dermal 239 mg/kg RTECS, 1995
The nephrotoxic potential of aniline and of o-, m-, and p-chloroaniline was assessed in Fischer 344 rats after
single intraperitoneal injections ranging from 0.4 to 1.5 mmol/kg (Rankin et al., 1986). In vitro tests were also
performed in which renal cortical slices were incubated with aniline or a derivative and p-aminohippurate (PAH)
or tetraethylammonium. Intraperitoneal injection of o-chloroaniline (1.0 mmol/kg) caused decreased urine
volume, elevated urea nitrogen concentration, and decreased basal and lactate-stimulated PAH accumulation.
Eight of 12 rats administered 1.5 mmol/kg m-chloroaniline died. Renal effects including hematuria, proteinuria,
decreased urine volume, and increased urea nitrogen were observed in animals receiving 1.5 mmol/kg m- or
p-chloroaniline. In rats and mice administered p-chloroaniline for 13 weeks, methemoglobin formation,
hemolytic anemia, splenomegaly, and extramedullary hematopoiesis were observed (Chhabra et al., 1990).

11 o-, m-, & p-Chloroaniline, NTP TOX 43
Reproductive Effects
No sperm abnormalities were observed in male (CBA × BALB/c)F mice administered an intraperitoneal dose1
of 25 to 500 mg/kg o-chloroaniline daily for 5 days (Topham, 1980).
Carcinogenicity
A literature review revealed no references that pertained to prechronic toxicity or chronic carcinogenicity studies
of o- or m-chloroaniline in rodents. In addition, no epidemiologic studies or case reports examining the
relationship between exposure to o- or m-chloroaniline and human cancer were found in the literature (HSDB,
1995).
Aniline hydrochloride has been shown to be carcinogenic in rats (Gralla et al., 1979). Azobenzene, D & C Red
No. 9, dapsone, and o-toluidine hydrochloride, all structurally related to aniline, are carcinogenic in rats (NCI,
1977, 1979a,b; NTP, 1982). In 2-year studies, groups of 50 male and 50 female F344/N rats were
administered 2, 6, or 18 mg p-chloroaniline per kilogram body weight in water by gavage; groups of 50 male
and 50 female B6C3F1 mice were administered 3, 10, or 30 mg/kg p-chloroaniline (NTP, 1989). There was
clear evidence of carcinogenicity in the male rat and equivocal evidence in the female rat, as indicated by an
increased number of rare sarcomas of the spleen. Pheochromocytomas also appeared to be associated with
p-chloroaniline treatment. Compound-related splenic fibrosis was observed in male and female rats. There was
some evidence of carcinogenicity in the male mouse, as indicated by increased incidences of hepatocellular
neoplasms and hemangiosarcomas of the spleen and liver. There was no evidence of carcinogenic activity in
female B6C3F mice that were treated with p-chloroaniline for 2 years.1
Genetic Toxicity
Positive results were obtained with o-chloroaniline in tests for induction of differential growth inhibition in a
DNA repair-deficient strain of Escherichia coli (Rosenkranz and Poirier, 1979; Thompson et al., 1983); these
findings indicate DNA damage. Positive results were also obtained for induction of mutations in L5178Y mouse
lymphoma cells (McGregor et al., 1991). These positive responses contrast with the negative results reported
for all assays in which m-chloroaniline was tested. Other assays in which o-chloroaniline was tested yielded
negative results. o-Chloroaniline did not induce mutations in E. coli (Thompson et al., 1983) or Salmonella
typhimurium (Garner and Nutman, 1977; Rosenkranz and Poirier, 1979; Simmon, 1979; Zimmer et al., 1980;
Miyata et al., 1981; Thompson et al., 1983; Zeiger et al., 1987), with or without S9; unscheduled DNA
synthesis in Fischer 344 rat hepatocytes exposed in vitro (Thompson et al., 1983); or sperm head abnormalities
in (CBA × BALB/c)F1 mice treated with up to 500 mg/kg for 5 days (Topham, 1980). Additional data are
needed for a complete assessment of the genotoxicity of o-chloroaniline.

12 o-, m-, & p-Chloroaniline, NTP TOX 43
The short-term genotoxicity test data available for m-chloroaniline, although limited in type and amount,
indicate that m-chloroaniline is not mutagenic. No induction of gene mutations was observed with
m-chloroaniline, with or without S9, in E. coli (Thompson et al., 1983) or S. typhimurium (Garner and Nutman,
1977; Miyata et al., 1981; Thompson et al., 1983; Lyons et al., 1985; Zeiger et al., 1987). Likewise, results
of mammalian cell genotoxicity tests with m-chloroaniline show no induction of unscheduled DNA synthesis
in Fischer 344 rat hepatocytes (Thompson et al., 1983) or sperm head abnormalities in (CBA × BALB/c)F 1
mice treated with up to 400 mg/kg per day for 5 days (Topham, 1980).
STUDY RATIONALE AND DESIGN
o-Chloroaniline and m-chloroaniline were selected for study to evaluate the structure-activity relationship for
toxicity among the three isomers of chloroaniline. The third isomer, p-chloroaniline, has been evaluated
previously by the NTP (1989). Gavage was chosen as the route of exposure for o-chloroaniline and
m-chloroaniline because p-chloroaniline was studied by that route due to its instability in feed. Endpoints
evaluated during these 13-week studies included histopathology and clinical pathology in F344/N rats and
B6C3F mice. The reproductive toxicity of o-chloroaniline and m-chloroaniline was assessed by the evaluation 1
of testicular and spermatozoal parameters and by determination of the length of the estrous cycle. In addition,
the genetic toxicity of these chemicals was assessed in studies in S. typhimurium and cultured Chinese hamster
ovary cells and by determinations of the induction of trifluorothymidine resistance in L5178Y mouse lymphoma
cells and of micronuclei in bone marrow cells of rats and mice from the 13-week studies.

13
MATERIALS AND METHODS
PROCUREMENT AND CHARACTERIZATION OF O-CHLOROANILINE
AND M-CHLOROANILINE
Single lots of o-chloroaniline (Lot 04921TX) and m-chloroaniline (Lot 04214PV) were obtained from Aldrich
Chemical Company (Milwaukee, WI). Information on identity and purity was provided by the supplier.
o-Chloroaniline, a colorless liquid, and m-chloroaniline, a pale yellow liquid, were identified by infrared
spectroscopy; each spectrum was consistent with a literature reference (Aldrich Library of FT-IR Spectra, 1985)
and with that expected for the chemical structure. Gas chromatography indicated a purity greater than 99% for
each chemical.
Throughout the 13-week studies, o-chloroaniline and m-chloroaniline were stored in amber glass bottles sealed
with Teflon®-lined lids at room temperature; periodic reanalyses performed by the study laboratory using high-
performance liquid chromatography (HPLC) and infrared spectroscopy indicated no decomposition.
DOSE FORMULATIONS
Gavage solutions were prepared by mixing o-chloroaniline or m-chloroaniline with 1 M hydrochloric acid,
sonicating for 20 minutes, and diluting to volume with deionized water. The pH was measured and adjusted
with hydrochloric acid (pH 1.5 to 2.0). The dose levels are expressed as base o- or m-chloroaniline.
Stability studies of the gavage solutions were performed by the study laboratory using HPLC. The results
indicated that 1 mg/mL solutions of o-chloroaniline and m-chloroaniline were stable for 35 days when stored
sealed, in the dark, at room temperature or at 5E C; the solutions were stable for 3 hours under simulated dosing
conditions.
During the 13-week studies, the gavage solutions were stored at 5E C in containers resistant to ultraviolet/visible
light. The study laboratory periodically analyzed the gavage solutions and animal room samples by HPLC.
All dose formulations administered to rats and mice were within 10% of the theoretical concentrations. All
animal room samples for rats in the o-chloroaniline study and rats and mice in the m-chloroaniline studies were
within 10% of the theoretical concentrations; four of five animal room samples for mice in the o-chloroaniline
study were within 10% of the theoretical concentrations.

14 o-, m-, & p-Chloroaniline, NTP TOX 43
TOXICITY STUDY DESIGNS
Core Studies
Male and female F344/N rats and B6C3F1 mice were obtained from Charles River Breeding Laboratories
(Raleigh, NC) and were 36 days old at receipt. Rats and mice were quarantined 11 to 14 days and were
approximately 7 weeks old when the studies began. Blood samples were collected from five male and five
female rats and mice at the beginning of the o-chloroaniline and m-chloroaniline studies. The sera were
analyzed for antibody titers to rodent viruses (Boorman et al., 1986; Rao et al., 1989a,b); all results were
negative. Additional details concerning the study design are provided in Table 3.
The doses for the 13-week studies were selected based on literature values. In the core studies, groups of
10 male and 10 female rats and mice were administered 0, 10, 20, 40, 80, or 160 mg o-chloroaniline or
m-chloroaniline per kilogram body weight in dilute hydrochloric acid by gavage 5 days a week for 13 weeks.
Rats were housed five per cage by sex and mice were housed individually. NIH-07 Open Formula Diet (Zeigler
Brothers, Inc., Gardners, PA) and water (Columbus Municipal Supply) were available ad libitum. Animal
rooms were maintained at 69E to 75E F and 35% to 65% relative humidity, with 12 hours of fluorescent light
per day and at least 10 room air changes per hour.
Complete necropsies were performed on all core study animals. Organs and tissues were examined for gross
lesions and fixed in 10% neutral buffered formalin. Tissues to be examined microscopically were trimmed,
embedded in paraffin, sectioned, and stained with hematoxylin and eosin. Complete histopathologic
examinations were performed on all vehicle control animals, all animals in the highest dose groups with 60%
survival, and all animals that died early. Gross lesions and selected organs of rats and mice in lower dose
groups were examined until a no-observed-effect level was determined. Organs weighed and tissues examined
microscopically are listed in Table 3.
Upon completion of the laboratory pathologist's histopathologic evaluation, the slides, paraffin blocks, and
residual wet tissues were sent to the NTP Archives for inventory, slide/block match, and wet tissue audit. The
slides, individual animal data records, and pathology tables were sent to an independent pathology laboratory
where quality assessment was performed. Results were reviewed and evaluated by the NTP Pathology Working
Group (PWG); the final diagnoses represent a consensus of contractor pathologists and the PWG. Details of
these review procedures have been described by Maronpot and Boorman (1982) and Boorman et al. (1985).
During the quality assessment and PWG review of m-chloroaniline, slides from the studies of p-chloroaniline
(NTP, 1989) were reviewed; for comparison purposes, data were reported with terminology and severity
grading consistent with those used in the o- and m-chloroaniline studies.

15 o-, m-, & p-Chloroaniline, NTP TOX 43
Supplemental Evaluations
Clinical Pathology
Clinical pathology studies were performed on rats designated for clinical pathology testing and on all core study
rats and mice at the end of the 13-week studies. Ten animals per sex and dose level were evaluated. Blood for
hematology and clinical chemistry evaluations was collected from clinical pathology study rats on days 3 and
23; blood was collected from core study rats and mice at the end of the studies. The animals were anesthetized
with a CO 2:O2 mixture, and blood samples were drawn from the retroorbital sinus. Samples for hematology
analysis were placed in micro-collection tubes (Sarstedt, Inc., Nümbrecht, Germany) coated with potassium
EDTA; samples for clinical chemistry evaluations were placed in similar tubes devoid of anticoagulant. The
latter samples were allowed to clot; the samples were then centrifuged and serum was removed.
Hematologic determinations were made on a Serono-Baker Diagnostics System 9000 Hematology Analyzer
(Serono-Baker Diagnostics, Allentown, PA) with reagents obtained from the manufacturer. The parameters that
were evaluated are listed in Table 3. Differential leukocyte counts and morphologic evaluation of blood cells
were determined by light microscopy from blood smears stained with modified Wright-Giemsa. Smears made
from blood samples stained with new methylene blue or brilliant cresyl blue were examined microscopically
for quantitative determination of reticulocytes and Heinz bodies. Neutralized cyanide was added to a buffered
hemolysate to convert methemoglobin to cyanmethemoglobin, which was then measured spectrophotometrically.
Clinical chemistry variables were measured with a Hitachi 704® chemistry analyzer (Boehringer Mannheim,
Indianapolis, IN). The parameters that were evaluated are listed in Table 3. Reagent for assays of sorbitol
dehydrogenase was obtained from Sigma Chemical Company (St. Louis, MO); other reagents were obtained
from the equipment manufacturer.
Sperm Motility and Vaginal Cytology Evaluations
Vaginal cytology and sperm motility evaluations were performed on core study rats and mice at the end of the
studies. Ten male and 10 female rats from the vehicle control, 40, 80, and 160 mg/kg groups were evaluated.
The parameters that were evaluated are listed in Table 3. Methods were those described in the NTP Statement
of Work (NTP, 1991). Briefly, for the 12 days prior to sacrifice, the vaginal vaults of 10 female rats and mice
per dose group were moistened with saline, if necessary, and samples of vaginal fluid and cells were stained.
Relative numbers of leukocytes, nucleated epithelial cells, and large squamous epithelial cells were determined
and used to ascertain estrous cycle stage (i.e., diestrus, proestrus, estrus, and metestrus).
Sperm motility was evaluated at necropsy in the following manner. The left epididymis was isolated and
weighed. The tail of the epididymis (cauda epididymis) was then removed from the epididymal body (corpus

16 o-, m-, & p-Chloroaniline, NTP TOX 43
epididymis) and weighed. Test yolk (rats) or modified Tyrode's buffer (mice) was applied to slides and a small
incision was made at the distal border of the cauda epididymis. The sperm effluxing from the incision were
dispersed in the buffer on the slides, and the numbers of motile and nonmotile spermatozoa were counted for
five fields per slide by two observers.
Following completion of sperm motility estimates, each left cauda epididymis was placed in buffered saline
solution. Caudae were finely minced and the tissue was incubated in the saline solution and then heat fixed at
65E C. Sperm density was then determined microscopically with the aid of a hemacytometer. To quantify
spermatogenesis, testicular spermatid head count was determined by removing the tunica albuginea and
homogenizing the left testis in phosphate-buffered saline containing 10% dimethyl sulfoxide. Homogenization-
resistant spermatid nuclei were counted with a hemacytometer.

17 o-, m-, & p-Chloroaniline, NTP TOX 43
TABLE 3 Experimental Design and Materials and Methods in the 13-Week Gavage Studies of o-Chloroaniline and m-Chloroaniline
o-Chloroaniline Studies m-Chloroaniline Studies
EXPERIMENTAL DESIGN
Study Laboratory Battelle Columbus Laboratories (Columbus, OH) Same as o-chloroaniline studies
Strain and Species F344/N rats Same as o-chloroaniline studies B6C3F mice1
Animal Source Charles River Breeding Laboratories (Raleigh, NC) Same as o-chloroaniline studies
Size of Study Groups 10 males and 10 females Same as o-chloroaniline studies
Doses 0, 10, 20, 40, 80, or 160 mg/kg body weight in dilute hydrochloric Same as o-chloroaniline studies acid by gavage 5 days a week for 13 weeks plus 2 days
Date of First Dose Rats: 27 January 1992 (males), 28 January 1992 (females) Rats: 16 March 1992 (males), 17 March 1992 (females) Mice: 29 January 1992 (males), 30 January 1992 (females) Mice: 18 March 1992 (males), 19 March 1992 (females)
Date of Last Dose and Necropsy Rats: 28 April 1992 (males), 29 April 1992 (females) Rats: 16 June 1992 (males), 17 June 1992 (females) Mice: 30 April 1992 (males), 1 May 1992 (females) Mice: 18 June 1992 (males), 19 June 1992 (females)
Type and Frequency of Observation Animals were observed twice daily and were weighed at the start of Same as o-chloroaniline studies the study, weekly thereafter, and at necropsy. Clinical observations were recorded weekly.
Necropsy Complete necropsies were performed on all animals in the core Same as o-chloroaniline studies studies. The following organs were weighed: heart, right kidney, liver, lungs, spleen, right testis, and thymus.
Histopathologic Examination Histopathologic evaluations were performed on all animals in the Histopathologic evaluations were performed on all animals in the vehicle control and 160 mg/kg groups. The following tissues were vehicle control and 160 mg/kg groups. Tissues routinely examined examined: adrenal glands, brain (three sections), clitoral glands, were the same as those examined in the o-chloroaniline studies. esophagus, eyes (if grossly abnormal), femur and marrow, Tissues examined in lower dose groups included the bone marrow, gallbladder (mice only), gross lesions and tissue masses, heart, kidneys, liver, and spleen in rats and mice. kidneys, large intestine (cecum, colon, rectum), liver (two sections), lungs, lymph nodes (mandibular and mesenteric), mammary gland, nasal cavity and turbinates (three sections), ovaries, pancreas, parathyroid glands, pituitary gland, preputial glands, prostate gland, salivary gland, seminal vesicle, small intestine (duodenum, jejunum, ileum), spinal cord/sciatic nerve (if neurological signs were present), spleen, stomach (forestomach and glandular stomach), testes (with epididymis), thigh muscle, thymus, thyroid gland, trachea, urinary bladder, uterus, and vagina (females in vaginal cytology studies only). Gross lesions and tissue masses of rats and mice in all lower dose groups were examined. Tissues examined in lower dose groups included the bone marrow, kidneys, liver, and spleen in rats and the spleen in mice.

18 o-, m-, & p-Chloroaniline, NTP TOX 43
TABLE 3 Experimental Design and Materials and Methods in the 13-Week Gavage Studies of o-Chloroaniline and m-Chloroaniline (continued)
o-Chloroaniline Studies m-Chloroaniline Studies
Supplemental Evaluations Clinical Pathology Blood for hematology and clinical chemistry evaluations was collected on days 3 and 23 from rats in the clinical pathology study groups. Core study rats and mice were evaluated at the end of the studies. Hematology parameters included hematocrit, hemoglobin concentration, erythrocyte count, reticulocyte count, nucleated erythrocyte count, mean cell volume, mean cell hemoglobin, mean cell hemoglobin concentration, platelet count, leukocyte count and differential, methemoglobin concentration, and Heinz body count. Clinical chemistry parameters included urea nitrogen, creatinine, total protein, albumin, alanine aminotransferase, alkaline phosphatase, creatine kinase, sorbitol dehydrogenase, and bile salts. Sperm Motility and Vaginal Cytology Evaluations Sperm motility and vaginal cytology evaluations were performed on core study animals at the end of the studies. Rats and mice in the 0, 40, 80, and 160 mg/kg groups were evaluated. Male rats and mice were evaluated for necropsy body and reproductive tissue weights, epididymal spermatozoal data, and spermatogenesis. Females were evaluated for necropsy body weight, estrous cycle length, and the percentage of cycle spent in the various stages.
Same as o-chloroaniline studies
Same as o-chloroaniline studies
ANIMAL MAINTENANCE
Time Held Before Study Rats: 11 days (males), 12 days (females) Mice: 13 days (males), 14 days (females)
Same as o-chloroaniline studies
Age When Study Began Approximately 7 weeks Same as o-chloroaniline studies
Age When Killed 20 weeks Same as o-chloroaniline studies
Method of Animal Distribution Animals were distributed randomly into groups of approximately equal initial mean body weight.
Same as o-chloroaniline studies
Diet NIH-07 Open Formula Diet (Zeigler Brothers, Inc., Gardners, PA) in pellet form and water (Columbus Municipal Supply) were available ad libitum.
Same as o-chloroaniline studies
Animal Room Environment Rats were housed five per cage by sex and mice were housed individually. The temperature was maintained at 69E to 75E F and relative humidity at 35% to 65%, with at least 10 air changes per hour. Fluorescent light was provided for 12 hours per day.
Same as o-chloroaniline studies

19 o-, m-, & p-Chloroaniline, NTP TOX 43
STATISTICAL METHODS
Calculation and Analysis of Lesion Incidences
The incidences of lesions as presented in Appendixes A and B are given as the number of animals bearing such
lesions at a specific anatomic site and the number of animals with that site examined microscopically. The
Fisher exact test, a procedure based on the overall proportion of affected animals, was used to determine
significance (Gart et al., 1979).
Analysis of Continuous Variables
Two approaches were employed to assess the significance of pairwise comparisons between dosed and control
groups in the analysis of continuous variables. Organ and body weight data, which are approximately normally
distributed, were analyzed with the parametric multiple comparisons procedures of Williams (1971, 1972) or
Dunnett (1955). Clinical chemistry, hematology, spermatid, and epididymal spermatozoal data, which typically
have skewed distributions, were analyzed with the nonparametric multiple comparisons methods of Shirley
(1977) or Dunn (1964). Jonckheere's test (Jonckheere, 1954) was used to assess the significance of dose-
response trends and to determine whether a trend-sensitive test (Williams, Shirley) was more appropriate for
pairwise comparisons than a test capable of detecting departures from a monotonic dose response (Dunnett,
Dunn). If the P value from Jonckheere's test was greater than or equal to 0.10, Dunn's or Dunnett's test was
used rather than Shirley's or Williams' test.
The outlier test of Dixon and Massey (1951) was employed to detect extreme values. No value selected by the
outlier test was eliminated unless it was at least twice the next largest value or at most half of the next smallest
value. Extreme values identified by the statistical test were reviewed by NTP personnel before being eliminated
from the analysis.
Because vaginal cytology data are proportions (the proportion of the observation period that an animal was in
a given estrous stage), an arcsine transformation was used to bring the data into closer conformance with
normality assumptions. Treatment effects were investigated by applying a multivariate analysis of variance
(Morrison, 1976) to the transformed data to test for simultaneous equality of measurements across dose levels.
QUALITY ASSURANCE
The animal studies of o-chloroaniline and m-chloroaniline were performed in compliance with United States
Food and Drug Administration Good Laboratory Practices regulations (21 CFR, Part 58). The Quality

20 o-, m-, & p-Chloroaniline, NTP TOX 43
Assurance Unit of EG&G Mason Research Institute performed audits and inspections of protocols, procedures,
data, and reports throughout the course of the studies.
GENETIC TOXICITY STUDIES
Salmonella typhimurium Mutagenicity Test Protocol
Testing was performed as reported by Zeiger et al. (1987). o-Chloroaniline and m-chloroaniline were sent to
the testing laboratories as coded aliquots and were incubated with the S. typhimurium tester strains TA97, TA98,
TA100, TA1535, and TA1537 either in buffer or S9 mix (metabolic activation enzymes and cofactors from
Aroclor 1254-induced male Sprague-Dawley rat or Syrian hamster liver) for 20 minutes at 37E C. Top agar
supplemented with L-histidine and d-biotin was added, and the contents of the tubes were mixed and poured onto
the surfaces of minimal glucose agar plates. Histidine-independent mutant colonies arising on these plates were
counted following incubation for 2 days at 37E C.
Each trial consisted of triplicate plates of concurrent positive and negative controls and of at least five doses of
o- or m-chloroaniline. The high dose was limited by toxicity.
A positive response in the S. typhimurium assay is defined as a reproducible, dose-related increase in
histidine-independent (revertant) colonies in any one strain/activation combination. An equivocal response is
defined as an increase in revertants that was not dose related, not reproducible, or not of sufficient magnitude
to support a determination of mutagenicity. A negative response was obtained when no increase in revertant
colonies was observed following chemical treatment. There was no minimum percentage or fold increase
required for a chemical to be judged positive or weakly positive.
Mouse Lymphoma Mutagenicity Test Protocol
The experimental protocol is presented in detail by McGregor et al. (1991). o-Chloroaniline and
m-chloroaniline were supplied as coded aliquots. The high dose was limited by toxicity. L5178Y mouse
lymphoma cells were maintained at 37E C as suspension cultures in supplemented Fischer's medium; normal
cell cycling time was approximately 10 hours. To reduce the number of spontaneously occurring
trifluorothymidine-resistant cells, subcultures were exposed once to medium containing THMG (thymidine,
hypoxanthine, methotrexate, and glycine) for 1 day, to medium containing THG for 1 day, and to normal
medium for 3 to 5 days. For cloning, the horse serum content was increased and Noble agar was added.
All treatment levels within an experiment, including concurrent positive and solvent controls, were replicated.
Treated cultures contained 6 × 10⁶ cells in 10 mL of medium. This volume included the S9 fraction in those
21 o-, m-, & p-Chloroaniline, NTP TOX 43
experiments performed with metabolic activation. Incubation with o- or m-chloroaniline continued for 4 hours,
at which time the medium plus chemical was removed and the cells were resuspended in fresh medium and
incubated for an additional 2 days to express the mutant phenotype. Cell density was monitored so that log
phase growth was maintained. After the 48-hour expression period, cells were plated in medium and soft agar
supplemented with trifluorothymidine (TFT) for selection of TFT-resistant cells and plated in nonselective
medium and soft agar to determine cloning efficiency. Plates were incubated at 37E C in 5% CO 2 for 10 to
12 days. The assays were initially performed without S9 and were repeated using freshly prepared S9 from the
livers of Aroclor 1254-induced male F344/N rats.
Minimum criteria for accepting an experiment as valid and a detailed description of the statistical analysis and
data evaluation are presented in Caspary et al. (1988). All data were evaluated statistically for both trend and
peak responses. Both responses had to be significant (P#0.05) for a chemical to be considered capable of
inducing TFT resistance; a single significant response led to a "questionable" conclusion, and the absence of
both a trend and a peak response resulted in a "negative" call.
Chinese Hamster Ovary Cell Cytogenetics Protocols
Testing was performed as reported by Galloway et al. (1987). m-Chloroaniline was supplied as a coded aliquot.
The aliquot was tested in cultured Chinese hamster ovary (CHO) cells for induction of sister chromatid
exchanges (SCEs) and chromosomal aberrations (Abs) both in the presence and the absence of Aroclor
1254-induced male Sprague-Dawley rat liver S9 and cofactor mix. Cultures were handled under gold lights to
prevent photolysis of bromodeoxyuridine-substituted DNA. Each test consisted of concurrent solvent and
positive controls and of at least three doses of m-chloroaniline; the high dose was limited by toxicity. A single
flask per dose was used.
Sister Chromatid Exchange Test: In the SCE test without S9, CHO cells were incubated for 32.8 hours with
m-chloroaniline in supplemented McCoy's 5A medium. Bromodeoxyuridine (BrdU) was added 2 hours after
culture initiation. After 32.8 hours, the medium containing m-chloroaniline was removed and replaced with
fresh medium plus BrdU and Colcemid, and incubation was continued for 2 hours. Cells were then harvested
by mitotic shake-off, fixed, and stained with Hoechst 33258 and Giemsa. The incubation time of 32.8 hours
was extended from the normal time of 26 hours to offset m-chloroaniline-induced cell cycle delay and to ensure
a sufficient number of scorable (second-division metaphase) cells. In the SCE test with S9, cells were incubated
with m-chloroaniline, serum-free medium, and S9 for 2 hours. The medium was then removed and replaced
with medium containing serum and BrdU and no m-chloroaniline, and incubation proceeded for an additional
25.5 hours, with Colcemid present for the final 2 hours. Harvesting and staining were the same as for cells
22 o-, m-, & p-Chloroaniline, NTP TOX 43
treated without S9. All slides were scored blind and those from a single test were read by the same person.
Fifty second-division metaphase cells were scored for frequency of SCEs per cell from each dose level.
Statistical analyses were conducted on the slopes of the dose-response curves and the individual dose points
(Galloway et al., 1987). An SCE frequency 20% above the concurrent solvent control value was chosen as a
statistically conservative positive response. The probability of this level of difference occurring by chance at
one dose point is less than 0.01; the probability for such a chance occurrence at two dose points is less than
0.001. An increase of 20% or greater at any single dose was considered weak evidence of activity; increases
at two or more doses indicated that the trial was positive. A statistically significant trend (P<0.05), in the
absence of any responses reaching 20% above background, led to a call of equivocal.
Chromosomal Aberrations Test: In the Abs test without S9, cells were incubated in McCoy's 5A medium with
m-chloroaniline for 18.8 hours; Colcemid was added and incubation continued for 2 hours. The cells were then
harvested by mitotic shake-off, fixed, and stained with Giemsa. For the Abs test with S9, cells were treated
with m-chloroaniline and S9 for 2 hours, after which the treatment medium was removed and the cells were
incubated for 8.5 hours in fresh medium, with Colcemid present for the final 2 hours. Cells were harvested
in the same manner as for the treatment without S9. The harvest time for the Abs test was based on the cell
cycle information obtained in the SCE test; because cell cycle delay was anticipated in the trial without S9, the
incubation period was extended.
Cells were selected for scoring on the basis of good morphology and completeness of karyotype
(21 ± 2 chromosomes). All slides were scored blind and those from a single test were read by the same person.
One hundred first-division metaphase cells were scored at each dose level. Classes of aberrations recorded
included simple (breaks and terminal deletions), complex (rearrangements and translocations), and other
(pulverized cells, despiralized chromosomes, and cells containing 10 or more aberrations).
Chromosomal aberration data are presented as the percentages of cells with aberrations. To arrive at a statistical
call for a trial, analyses were conducted on both the dose-response curve and individual dose points (Galloway
et al., 1987). For a single trial, a statistically significant (P<0.05) difference for one dose point and a
significant trend (P<0.015) were considered weak evidence for a positive response; significant differences for
two or more doses indicated the trial was positive. A positive trend, in the absence of a statistically significant
increase at any one dose point, led to a conclusion of equivocal activity. Ultimately, the trial calls were based
on a consideration of the statistical analyses as well as the biological information available to the reviewers.

23 o-, m-, & p-Chloroaniline, NTP TOX 43
Rat and Mouse Bone Marrow Micronucleus Test Protocol
Preliminary range-finding studies were performed; factors affecting dose selection included chemical solubility
and toxicity and the extent of cell cycle delay induced by chemical exposure. In the bone marrow micronucleus
evaluations, male F344/N rats received three intraperitoneal injections of o- or m-chloroaniline dissolved in corn
oil at 24-hour intervals. Male B6C3F mice received one intraperitoneal injection of o- or m-chloroaniline or 1
three injections of m-chloroaniline at 24-hour intervals. The total dosing volume was 0.4 mL. Solvent control
rats and mice were injected with corn oil only; the positive control animals received injections of 25 mg/kg
cyclophosphamide. Twenty-four hours after the final injection, the animals were killed and smears of the bone
marrow cells obtained from the femurs were prepared. Air-dried smears were fixed and stained;
2,000 polychromatic erythrocytes (PCEs) were scored for frequency of micronucleated cells in each of five
animals per dose group. In addition, the percentage of PCEs among the total erythrocyte population in the bone
marrow was scored for each dose group as a measure of toxicity; no bone marrow toxicity was observed.
The results were tabulated as the mean of the pooled results from all animals within a treatment group, plus or
minus the standard error of the mean. The frequency of micronucleated cells among normochromatic
erythrocytes was analyzed by a statistical software package that tested for increasing trend over dose groups
using a one-tailed Cochran-Armitage trend test, followed by pairwise comparisons between each dosed group
and the control group (Margolin et al., 1990). In the presence of excess binomial variation, as detected by a
binomial dispersion test, the binomial variance of the Cochran-Armitage test was adjusted upward in proportion
to the excess variation. In the micronucleus test, an individual trial was considered positive if the trend test
P value was greater than or equal to 0.025 or if the P value for any single dose group was greater than or equal
to 0.025 divided by the number of dose groups. A final call of positive for micronucleus induction is preferably
based on reproducibly positive trials (as noted above). Results of the 13-week studies were accepted without
repeat tests, because additional test data could not be obtained. Ultimately, the final call is determined by the
scientific staff after considering the results of statistical analyses, the reproducibility of any effects observed,
and the magnitudes of those effects.
Mouse Peripheral Blood Micronucleus Protocol
A detailed discussion of this assay is presented in MacGregor et al. (1990). At the end of the 13-week toxicity
study, blood was obtained from male and female mice and smears were immediately prepared and fixed in
absolute methanol. The methanol-fixed slides were stained with a chromatin-specific fluorescent dye (acridine
orange) and coded. Slides were scanned to determine the frequency of micronuclei in 2,000 normochromatic
erythrocytes in each of five animals per dose group. Statistical analyses were performed as described for the
rat and mouse bone marrow micronucleus analyses.

24 o-, m-, & p-Chloroaniline, NTP TOX 43

25
RESULTS
13-WEEK GAVAGE STUDIES IN F344/N RATS
In the o-chloroaniline study, one male in the 40 mg/kg group and one female in the 20 mg/kg group died of
undetermined causes before the end of the study (Table 4); one female rat in the 160 mg/kg group in the
m-chloroaniline study died during week 12 of suspected erythrotoxicity (Table 5). The final mean body weights
and mean body weight gains of male rats in the 160 mg/kg groups in both studies were significantly less than
those of the respective vehicle controls; in both studies, the final mean body weights and mean body weight
gains of dosed females were similar to those of the vehicle controls (Tables 4 and 5 and Figures 1 and 2).
In both studies, clinical findings of toxicity were generally observed beginning 30 minutes after dosing. In the
o-chloroaniline study, rats in the 80 and 160 mg/kg groups frequently had tremors, and females in the
160 mg/kg group appeared thin during the second week of the study. In the o-chloroaniline study, male and
female rats administered 40 mg/kg or greater developed a bluish discoloration of the genital and footpad
regions. In male and female rats in the 80 and 160 mg/kg groups in the m-chloroaniline study, a similar
discoloration of the ear, nasal, genital, and footpad regions was observed.

26
c
o-, m-, & p-Chloroaniline, NTP TOX 43
TABLE 4 Survival and Body Weights of F344/N Rats in the 13-Week Gavage Study of o-Chloroaniline
Mean Body Weightb (g) Final Weight aDose Survival Initial Final Change Relative to Controls
(mg/kg) (%)
MALE
0 10/10 135 ± 2 326 ± 3 191 ± 2 10 10/10 134 ± 2 321 ± 6 187 ± 5 99 20 10/10 136 ± 2 330 ± 6 194 ± 5 101 40 80
9/10c
10/10d 132 ± 2 135 ± 2
324 ± 4 317 ± 5
190 ± 3 184 ± 5
99 97
160 10/10 133 ± 3 304 ± 4** 170 ± 3** 93
FEMALE
0 10/10 112 ± 1 185 ± 2 73 ± 2 10 10/10 113 ± 2 186 ± 3 73 ± 3 101 20 9/10e 113 ± 1 189 ± 3 77 ± 3 102 40 10/10 110 ± 2 178 ± 3 69 ± 3 97 80 10/10 111 ± 2 180 ± 2 69 ± 3 98
160 10/10 111 ± 1 178 ± 2 66 ± 2 96
** Significantly different (P#0.01) from the vehicle control group by Williams' test a Number surviving at 13 weeks/number initially in group b Weights and weight changes are given as mean ± standard error.
Week of death: 2 d The initial and final body weights of one rat are not included in the means. e Week of death: 6

27
c
o-, m-, & p-Chloroaniline, NTP TOX 43
TABLE 5 Survival and Body Weights of F344/N Rats in the 13-Week Gavage Study of m-Chloroaniline
Mean Body Weight (g)b Final Weight Dose Survivala Initial Final Change Relative to Controls
(mg/kg) (%)
MALE
0 10/10 156 ± 2 323 ± 6 166 ± 7 10 10/10 154 ± 1 321 ± 9 167 ± 8 100 20 10/10 155 ± 2 311 ± 7 156 ± 6 96 40 10/10 156 ± 1 320 ± 5 165 ± 5 99 80 10/10 156 ± 2 313 ± 6 157 ± 6 97
160 10/10 157 ± 1 289 ± 6** 132 ± 7** 90
FEMALE
0 10/10 124 ± 1 183 ± 3 59 ± 3 10 10/10 124 ± 1 186 ± 3 62 ± 3 102 20 10/10 123 ± 1 185 ± 3 62 ± 3 101 40 10/10 123 ± 1 186 ± 3 62 ± 2 101 80 10/10 124 ± 1 178 ± 3 54 ± 2 97
160 9/10c 126 ± 1 184 ± 3 58 ± 2 100
** Significantly different (P#0.01) from the vehicle control group by Williams' test a Number surviving at 13 weeks/number initially in group b Weights and weight changes are given as mean ± standard error.
Week of death: 12

28 o-, m-, & p-Chloroaniline, NTP TOX 43
FIGURE 1 Body Weights of F344/N Rats Administered o-Chloroaniline by Gavage for 13 Weeks

29 o-, m-, & p-Chloroaniline, NTP TOX 43
FIGURE 2 Body Weights of F344/N Rats Administered m-Chloroaniline by Gavage for 13 Weeks

30 o-, m-, & p-Chloroaniline, NTP TOX 43
o-Chloroaniline: Hematology and clinical chemistry data are listed in Tables 6 and D1. Administration of
o-chloroaniline caused a minimal to marked, dose- and time-dependent methemoglobinemia, evidenced by
increased methemoglobin concentrations, in all groups of dosed male and female rats at week 13. Increased
methemoglobin concentrations also occurred in males in the 80 and 160 mg/kg groups and in females
administered 40 mg/kg or greater on day 3; by day 23, methemoglobin concentrations were increased in males
administered 40 mg/kg or greater and females administered 20 mg/kg or greater. In all dosed groups, the
increases in methemoglobin concentration became more severe with time. Female rats appeared to be more
susceptible to the methemoglobin-inducing effects of o-chloroaniline, based on the occurrence of
methemoglobinemia in groups receiving lower doses or at earlier time points than in males.
A minimal to mild, dose- and time-related anemia, evidenced by decreases in hematocrit (Hct) values,
hemoglobin (Hgb) concentrations, and erythrocyte (RBC) counts, occurred in males in the 160 mg/kg group
and females in the 80 and 160 mg/kg groups on day 23. By week 13, the anemia occurred in males
administered 80 or 160 mg/kg and females administered 20 mg/kg or greater. The anemia was characterized
as macrocytic, normochromic, and responsive. Evidence of macrocytosis included increases in the mean cell
volume (MCV) in female rats in the 160 mg/kg group on day 23 and in males administered 80 or 160 mg/kg
and females administered 40 mg/kg or greater at week 13. The macrocytosis was attributed to the increased
numbers of larger reticulocytes in the bloodstream and would be consistent with an erythropoietic response to
anemia. Normochromic RBCs were evidenced by the lack of change in mean cell hemoglobin concentration
(MCHC). Evidence of an erythropoietic response was demonstrated by increases in reticulocyte and nucleated
erythrocyte (NRBC) counts. Reticulocyte counts were increased in males in the 160 mg/kg group and females
in the 80 and 160 mg/kg group on day 23 and in males administered 40 mg/kg or greater and females
administered 20 mg/kg or greater at week 13. Increases in NRBC counts accompanied the increases in
reticulocyte counts. Reticulocytosis can cause slightly increased mean cell hemoglobin (MCH) values; thus,
the minimal increases in MCH on day 23 and at week 13 in males in the 160 mg/kg group and females in the
80 and 160 mg/kg groups would be consistent with the increased reticulocyte counts in these groups. Dosed
female rats appeared to be more susceptible to the development of anemia than males; this finding is consistent
with the sex difference observed for the methemoglobin results.

31 o-, m-, & p-Chloroaniline, NTP TOX 43
TABLE 6 Selected Hematology Data for F344/N Rats in the 13-Week Gavage Study of o-Chloroanilinea
Dose (mg/kg)
Vehicle 10 20 40 80 160 Control
MALE
n Day 3 10 10 10 10 10 10 Day 23 10 10 9 10 10 10 Week 13 10 10 10 9 9 10
Methemoglobin (g/dL) Day 3 Day 23
0.28 ± 0.03 0.15 ± 0.02
0.24 ± 0.02 0.14 ± 0.02
0.34 ± 0.03 0.20 ± 0.03b
0.31 ± 0.04 0.39 ± 0.05**
0.53 ± 0.02** 0.81 ± 0.07**
1.24 ± 0.08** 1.70 ± 0.10**
Week 13 0.30 ± 0.02 0.40 ± 0.02** 0.59 ± 0.04** 0.84 ± 0.04** 1.59 ± 0.06** 2.79 ± 0.09** Hematocrit (%)
Day 3 39.8 ± 0.5 40.2 ± 0.7 40.3 ± 0.4 40.7 ± 0.4 40.2 ± 0.5 41.1 ± 0.4 Day 23 45.3 ± 0.3 45.9 ± 0.6 45.4 ± 0.5 45.6 ± 0.5 45.4 ± 0.4 42.9 ± 0.3** Week 13 45.4 ± 0.4 45.7 ± 0.3 45.7 ± 0.3 44.6 ± 0.4 43.2 ± 0.6* 43.7 ± 0.3**
Hemoglobin (g/dL) Day 3 14.2 ± 0.1 14.3 ± 0.1 14.1 ± 0.1 14.1 ± 0.1 14.3 ± 0.1 14.3 ± 0.1 Day 23 16.2 ± 0.1 16.0 ± 0.1 16.1 ± 0.1 16.2 ± 0.1 16.1 ± 0.2 15.1 ± 0.1** Week 13 16.1 ± 0.1 16.2 ± 0.1 16.1 ± 0.2 15.6 ± 0.1* 15.2 ± 0.2** 15.4 ± 0.1**
Erythrocytes (10 /µL)6
Day 3 6.63 ± 0.08 6.65 ± 0.12 6.70 ± 0.08 6.75 ± 0.06 6.71 ± 0.09 6.83 ± 0.06 Day 23 7.86 ± 0.06 8.02 ± 0.11 7.98 ± 0.10 7.97 ± 0.10 8.00 ± 0.10 7.41 ± 0.06** Week 13 8.55 ± 0.07 8.63 ± 0.06 8.71 ± 0.07 8.48 ± 0.10 7.91 ± 0.13** 7.52 ± 0.07**
Reticulocytes (10 /µL)6
Day 3 0.15 ± 0.02 0.13 ± 0.03 0.13 ± 0.02 0.12 ± 0.02 0.19 ± 0.02 0.15 ± 0.03 Day 23 0.16 ± 0.01 0.18 ± 0.01 0.16 ± 0.01 0.17 ± 0.01 0.17 ± 0.01 0.29 ± 0.04** Week 13 0.16 ± 0.01 0.15 ± 0.02 0.19 ± 0.01 0.21 ± 0.02* 0.32 ± 0.04** 0.46 ± 0.02**
Nucleated erythrocytes (10 /µL)3
Day 3 0.01 ± 0.01 0.00 ± 0.00 0.00 ± 0.00 0.02 ± 0.02 0.03 ± 0.01 0.01 ± 0.01 Day 23 0.01 ± 0.01 0.01 ± 0.01 0.01 ± 0.01 0.01 ± 0.01 0.01 ± 0.01 0.05 ± 0.02 Week 13 0.01 ± 0.01 0.00 ± 0.00 0.01 ± 0.01 0.02 ± 0.01 0.03 ± 0.01* 0.13 ± 0.03**
Mean cell volume (fL) Day 3 60.1 ± 0.2 60.4 ± 0.2 60.1 ± 0.2 60.4 ± 0.3 59.9 ± 0.2 60.1 ± 0.1 Day 23 57.6 ± 0.2 57.2 ± 0.2 56.9 ± 0.2 57.2 ± 0.1 56.7 ± 0.4** 58.0 ± 0.1 Week 13 53.1 ± 0.2 53.0 ± 0.2 52.4 ± 0.2 52.6 ± 0.3 54.6 ± 0.4* 58.1 ± 0.5**
Mean cell hemoglobin (pg) Day 3 21.4 ± 0.1 21.6 ± 0.3 21.0 ± 0.2* 20.9 ± 0.1* 21.3 ± 0.3 21.0 ± 0.1 Day 23 20.6 ± 0.1 20.0 ± 0.2 20.2 ± 0.2 20.3 ± 0.2 20.1 ± 0.2* 20.4 ± 0.1 Week 13 18.9 ± 0.1 18.8 ± 0.1 18.5 ± 0.1 18.4 ± 0.2 19.2 ± 0.2 20.5 ± 0.2**
Heinz bodies (%) Week 13 0.0 ± 0.0 0.0 ± 0.0 0.0 ± 0.0 0.0 ± 0.0 0.0 ± 0.0 6.2 ± 0.6**
32 o-, m-, & p-Chloroaniline, NTP TOX 43
TABLE 6 Selected Hematology Data for F344/N Rats in the 13-Week Gavage Study of o-Chloroaniline (continued)
Dose (mg/kg)
Vehicle 10 20 40 80 160 Control
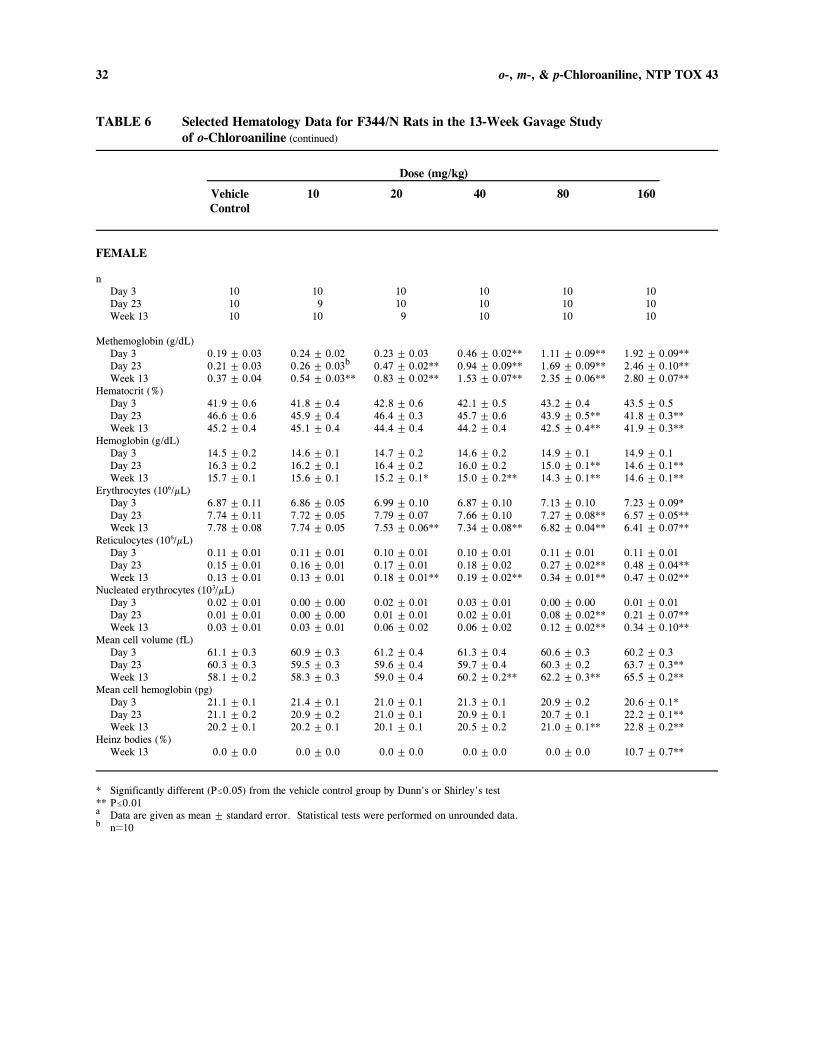
FEMALE
n Day 3 10 10 10 10 10 10 Day 23 10 9 10 10 10 10 Week 13 10 10 9 10 10 10
Methemoglobin (g/dL) Day 3 Day 23
0.19 ± 0.03 0.21 ± 0.03
0.24 ± 0.02 0.26 ± 0.03b
0.23 ± 0.03 0.47 ± 0.02**
0.46 ± 0.02** 0.94 ± 0.09**
1.11 ± 0.09** 1.69 ± 0.09**
1.92 ± 0.09** 2.46 ± 0.10**
Week 13 0.37 ± 0.04 0.54 ± 0.03** 0.83 ± 0.02** 1.53 ± 0.07** 2.35 ± 0.06** 2.80 ± 0.07** Hematocrit (%)
Day 3 41.9 ± 0.6 41.8 ± 0.4 42.8 ± 0.6 42.1 ± 0.5 43.2 ± 0.4 43.5 ± 0.5 Day 23 46.6 ± 0.6 45.9 ± 0.4 46.4 ± 0.3 45.7 ± 0.6 43.9 ± 0.5** 41.8 ± 0.3** Week 13 45.2 ± 0.4 45.1 ± 0.4 44.4 ± 0.4 44.2 ± 0.4 42.5 ± 0.4** 41.9 ± 0.3**
Hemoglobin (g/dL) Day 3 14.5 ± 0.2 14.6 ± 0.1 14.7 ± 0.2 14.6 ± 0.2 14.9 ± 0.1 14.9 ± 0.1 Day 23 16.3 ± 0.2 16.2 ± 0.1 16.4 ± 0.2 16.0 ± 0.2 15.0 ± 0.1** 14.6 ± 0.1** Week 13 15.7 ± 0.1 15.6 ± 0.1 15.2 ± 0.1* 15.0 ± 0.2** 14.3 ± 0.1** 14.6 ± 0.1**
Erythrocytes (10 /µL)6
Day 3 6.87 ± 0.11 6.86 ± 0.05 6.99 ± 0.10 6.87 ± 0.10 7.13 ± 0.10 7.23 ± 0.09* Day 23 7.74 ± 0.11 7.72 ± 0.05 7.79 ± 0.07 7.66 ± 0.10 7.27 ± 0.08** 6.57 ± 0.05** Week 13 7.78 ± 0.08 7.74 ± 0.05 7.53 ± 0.06** 7.34 ± 0.08** 6.82 ± 0.04** 6.41 ± 0.07**
Reticulocytes (10 /µL)6
Day 3 0.11 ± 0.01 0.11 ± 0.01 0.10 ± 0.01 0.10 ± 0.01 0.11 ± 0.01 0.11 ± 0.01 Day 23 0.15 ± 0.01 0.16 ± 0.01 0.17 ± 0.01 0.18 ± 0.02 0.27 ± 0.02** 0.48 ± 0.04** Week 13 0.13 ± 0.01 0.13 ± 0.01 0.18 ± 0.01** 0.19 ± 0.02** 0.34 ± 0.01** 0.47 ± 0.02**
Nucleated erythrocytes (10 /µL)3
Day 3 0.02 ± 0.01 0.00 ± 0.00 0.02 ± 0.01 0.03 ± 0.01 0.00 ± 0.00 0.01 ± 0.01 Day 23 0.01 ± 0.01 0.00 ± 0.00 0.01 ± 0.01 0.02 ± 0.01 0.08 ± 0.02** 0.21 ± 0.07** Week 13 0.03 ± 0.01 0.03 ± 0.01 0.06 ± 0.02 0.06 ± 0.02 0.12 ± 0.02** 0.34 ± 0.10**
Mean cell volume (fL) Day 3 61.1 ± 0.3 60.9 ± 0.3 61.2 ± 0.4 61.3 ± 0.4 60.6 ± 0.3 60.2 ± 0.3 Day 23 60.3 ± 0.3 59.5 ± 0.3 59.6 ± 0.4 59.7 ± 0.4 60.3 ± 0.2 63.7 ± 0.3** Week 13 58.1 ± 0.2 58.3 ± 0.3 59.0 ± 0.4 60.2 ± 0.2** 62.2 ± 0.3** 65.5 ± 0.2**
Mean cell hemoglobin (pg) Day 3 21.1 ± 0.1 21.4 ± 0.1 21.0 ± 0.1 21.3 ± 0.1 20.9 ± 0.2 20.6 ± 0.1* Day 23 21.1 ± 0.2 20.9 ± 0.2 21.0 ± 0.1 20.9 ± 0.1 20.7 ± 0.1 22.2 ± 0.1** Week 13 20.2 ± 0.1 20.2 ± 0.1 20.1 ± 0.1 20.5 ± 0.2 21.0 ± 0.1** 22.8 ± 0.2**
Heinz bodies (%) Week 13 0.0 ± 0.0 0.0 ± 0.0 0.0 ± 0.0 0.0 ± 0.0 0.0 ± 0.0 10.7 ± 0.7**
* Significantly different (P#0.05) from the vehicle control group by Dunn's or Shirley's test ** P#0.01 a Data are given as mean ± standard error. Statistical tests were performed on unrounded data. b n˘10
33 o-, m-, & p-Chloroaniline, NTP TOX 43
Morphologic review of RBCs revealed Heinz bodies, schistocytes, keratocytes, spherocytes, and acanthocytes,
occurring occasionally or at minimally increased numbers, in males and females in the 160 mg/kg groups at all
time points. The Heinz bodies were 1- to 3-µm spherical structures seen as nipples protruding from the RBC
surface. Increased numbers of polychromatophilic red cells occurred in males and females in the 160 mg/kg
groups on day 23 and at week 13. The presence of treatment-related altered red cell morphology (e.g. Heinz
bodies, schistocytes, keratocytes, spherocytes, and acanthocytes) is consistent with red cell injury and suggests
that the anemia was of hemolytic origin. The presence of Heinz bodies indicates that hemoglobin was a target
of the oxidative injury and is consistent with the methemoglobinemia. The increase in polychromasia in dosed
rats would be consistent with a bone marrow response to the anemia.
An apparent minimal to mild leukocytosis, evidenced by increased total leukocyte (WBC) counts, occurred in
females in the 80 and 160 mg/kg groups on day 23 and in males administered 40 mg/kg or greater and females
administered 20 mg/kg or greater at week 13 (Table D1). Estimates of WBC counts from blood smears,
however, did not support the quantitative results, suggesting that the automated WBC counts were erroneously
elevated because of the presence of nonlysed reticulocytes or RBC fragments, Heinz bodies, or large platelets,
which were counted as WBCs by the automated cell counter. Platelet counts were minimally increased in males
in the 160 mg/kg group and females in the 80 and 160 mg/kg groups on day 23; at week 13, platelet counts
were increased in males administered 80 or 160 mg/kg and females administered 20 mg/kg or greater
(Table D1). The increased platelet counts could have been related to a general increase in hematopoietic activity
or could have been erroneously elevated due to the presence of free Heinz bodies and/or RBC fragments in the
circulation.
Evidence of increased hepatocellular leakage and/or altered function was demonstrated by increased sorbitol
dehydrogenase (SDH) activities and bile salt concentrations in dosed males and females at week 13 (Table D1).
The increases in these parameters were minimal to mild and were most pronounced in the 160 mg/kg groups.
Absolute and relative spleen weights of male and female rats generally increased with increasing dose (Tables 7
and C1). The absolute spleen weights of male rats administered 80 or 160 mg/kg and females administered
20 mg/kg or greater were significantly greater than those of the vehicle controls; relative spleen weights of
males and females in the 40, 80, and 160 mg/kg groups were also significantly greater than those of the vehicle
controls. Differences in the relative heart, right kidney, liver, and right testis weights of dosed males and
relative heart and liver weights of females in the 160 mg/kg group (Table C1) generally reflected differences
in necropsy body weights.

34 o-, m-, & p-Chloroaniline, NTP TOX 43
TABLE 7 Spleen Weights and Spleen-Weight-to-Body-Weight Ratios for F344/N Rats in the 13-Week Gavage Study of o-Chloroanilinea
Dose (mg/kg)
Vehicle 10 20 40 80 160 Control
MALE
n 10 10 10 9 9 10
Necropsy body wt 334 ± 3 328 ± 6 334 ± 7 329 ± 4 319 ± 5 304 ± 5**
Spleen Absolute 0.684 ± 0.014 0.663 ± 0.012 0.681 ± 0.018 0.750 ± 0.013 0.861 ± 0.043** 1.104 ± 0.024** Relative 2.05 ± 0.04 2.02 ± 0.02 2.05 ± 0.05 2.28 ± 0.03* 2.70 ± 0.13** 3.63 ± 0.06**
FEMALE
n 10 10 9 10 10 10
Necropsy body wt 183 ± 3 189 ± 3 190 ± 3 176 ± 3 178 ± 2 174 ± 2*
Spleen Absolute 0.419 ± 0.009 0.432 ± 0.007 0.459 ± 0.010* 0.460 ± 0.010* 0.594 ± 0.013** 0.907 ± 0.018** Relative 2.28 ± 0.03 2.29 ± 0.02 2.42 ± 0.04 2.61 ± 0.05** 3.33 ± 0.06** 5.23 ± 0.09**
* Significantly different (P#0.05) from the vehicle control group by Williams' test ** P#0.01 a Spleen weights (absolute weights) and body weights are given in grams; spleen-weight-to-body-weight ratios (relative weights) are given as
mg organ weight/g body weight (mean ± standard error).
The spleens of all rats in the 80 and 160 mg/kg groups were enlarged and dark red. There were no other
treatment-related gross findings.
Minimal to mild hemosiderin pigmentation was observed microscopically in the spleen, liver, and renal cortex
of male and female rats in the 160 mg/kg groups and in the spleen of females in the 80 mg/kg group (Tables 8,
A1, and A2). Hematopoietic cell proliferation and capsule fibrosis of minimal to mild severity occurred in the
spleens of males and females in the 80 and 160 mg/kg groups. All males and females administered 80 or
160 mg/kg o-chloroaniline and one male administered 40 mg/kg had minimal to mild hyperplasia of the bone
marrow erythroid cells.
There were no significant differences in sperm motility or vaginal cytology parameters between dosed and
vehicle control males or females (Tables E1 and E2).

35
c
o-, m-, & p-Chloroaniline, NTP TOX 43
TABLE 8 Incidence of Selected Lesions in F344/N Rats in the 13-Week Gavage Study of o-Chloroaniline
Dose (mg/kg)
Vehicle 10 20 40 80 160 Control
MALE
Bone marrow a 10 10 10 10 10 10 Erythroid cell, hyperplasiab 0 0 0 1 (2.0) c 10** (1.6) 10** (2.0)
Kidney 10 10 10 10 10 10 Cortex, pigmentation, hemosiderin
Liver 0
10 0 —d
0 1
0 1
0 —
10** (1.4) 10
Kupffer cell, pigmentation, hemosiderin 0 0 0 10** (1.0)
Spleen 10 10 10 10 10 10 Hematopoietic cell proliferation 0 0 0 0 10** (1.8) 10** (2.0) Pigmentation, hemosiderin 0 0 0 0 0 9** (1.4) Capsule, fibrosis 0 0 0 0 10** (1.0) 9** (2.0)
FEMALE
Bone marrow 10 10 10 10 10 10 Erythroid cell, hyperplasia 0 0 0 0 10** (1.8) 10** (2.0)
Kidney 10 10 10 10 10 10 Cortex, pigmentation, hemosiderin 0 0 0 0 0 10** (1.1)
Liver 10 — 1 — — 10 Kupffer cell, pigmentation, hemosiderin 0 0 10** (1.0)
Spleen 10 10 10 10 10 10 Hematopoietic cell proliferation 0 0 0 0 10** (2.0) 10** (1.9) Pigmentation, hemosiderin 0 0 0 0 9** (1.8) 9** (1.9) Capsule, fibrosis 0 0 0 0 10** (1.0) 10** (2.0)
** Significantly different (P#0.01) from the vehicle control group by the Fisher exact test a Number of animals with tissue examined microscopically b Number of animals with lesion
Average severity of lesions in affected animals: 1˘minimal, 2˘mild, 3˘moderate, and 4˘marked d Not examined

36 o-, m-, & p-Chloroaniline, NTP TOX 43
m-Chloroaniline: Hematology and clinical chemistry data are listed in Tables 9 and D2. In general,
hematological and serum chemistry alterations similar to those occurring in the o-chloroaniline study occurred
in the m-chloroaniline study; however, the changes caused by m-chloroaniline were more severe.
Administration of m-chloroaniline caused a dose-dependent methemoglobinemia, evidenced by increased
methemoglobin concentrations in all dosed groups at all time points, which was similar to, but more severe than,
that occurring in the o-chloroaniline study. In males and females, the increases in methemoglobin concentration
in the 10, 20, and 40 mg/kg groups became more severe with time; the methemoglobinemia in the 80 and
160 mg/kg groups was most severe at day 3 and appeared to ameliorate slightly on day 23 and at week 13. As
in the o-chloroaniline study, female rats appeared to be more susceptible to the methemoglobin-inducing effects
of m-chloroaniline than males, as evidenced by the greater severity of methemoglobinemia in all dosed groups
of females at all time points.
As with o-chloroaniline administration, a dose-related, macrocytic, normochromic, responsive anemia of
minimal to moderate severity occurred in males administered 20 mg/kg or greater and in all dosed groups of
females (Table 9). The anemia was evidenced by decreased Hct values, Hgb concentrations, and RBC counts.
The macrocytosis was evidenced by increased MCV values. Elevations in MCH values accompanied and
reflected the increases in MCV. The increases in reticulocyte and NRBC counts would be consistent with an
erythropoietic response to the anemia. There were no consistent changes in MCHC in dosed males or females.
Microscopic evaluation of blood smears revealed minimally to moderately increased numbers of Heinz bodies,
schistocytes, keratocytes, spherocytes, acanthocytes, stomatocytes, and eccentrocytes in males and females in
the 160 mg/kg groups at all time points but were most prominent on day 23 and at week 13. Altered RBC
morphology also occurred in the lower dosed groups. The presence of Heinz bodies, schistocytes, keratocytes,
spherocytes, and eccentrocytes is consistent with oxidative injury to mature RBCs and suggests that the anemia
was of hemolytic origin. A marked increase in the numbers of polychromatophilic red cells occurred in the
160 mg/kg groups on day 23 and at week 13; increased polychromasia also occurred in the 80 mg/kg groups.
The increase in polychromasia in dosed rats would be consistent with a bone marrow response to the anemia.
On day 23, basophilic stippling occurred in rats in the 160 mg/kg groups; this would also be consistent with
a bone marrow response.

37 o-, m-, & p-Chloroaniline, NTP TOX 43
TABLE 9 Selected Hematology Data for F344/N Rats in the 13-Week Gavage Study of m-Chloroanilinea
Dose (mg/kg)
Vehicle 10 20 40 80 160 Control
MALE
n 10 10 10 10 10 10
Methemoglobin (g/dL) Day 3 0.39 ± 0.04 0.56 ± 0.05** 1.64 ± 0.15** 2.54 ± 0.17** 4.57 ± 0.26** 6.13 ± 0.09** Day 23 0.21 ± 0.03 0.80 ± 0.07** 1.70 ± 0.10** 3.12 ± 0.12** 4.79 ± 0.15** 5.11 ± 0.25** Week 13 0.31 ± 0.02 1.11 ± 0.06** 2.13 ± 0.06** 3.65 ± 0.19** 4.89 ± 0.20** 5.83 ± 0.18**
Hematocrit (%) Day 3 42.5 ± 0.6 43.5 ± 0.7 44.6 ± 0.4 42.8 ± 0.4 42.5 ± 0.4 41.8 ± 0.5 Day 23 49.8 ± 1.4 46.0 ± 0.3 43.4 ± 0.2** 43.6 ± 0.3** 42.7 ± 0.5** 42.4 ± 0.4** Week 13 46.7 ± 0.8 46.0 ± 0.6 44.8 ± 0.4* 44.9 ± 0.9** 43.1 ± 0.5** 47.4 ± 1.0*
Hemoglobin (g/dL) Day 3 15.0 ± 0.2 15.1 ± 0.2 15.5 ± 0.2 14.7 ± 0.1 14.7 ± 0.1 14.6 ± 0.1 Day 23 17.6 ± 0.4 16.3 ± 0.1* 15.5 ± 0.1** 15.2 ± 0.1** 15.2 ± 0.2** 15.0 ± 0.1** Week 13 16.0 ± 0.3 15.8 ± 0.2 15.3 ± 0.1** 15.6 ± 0.3** 15.4 ± 0.1** 15.5 ± 0.3*
Erythrocytes (10 /µL)6
Day 3 7.16 ± 0.11 7.39 ± 0.14 7.54 ± 0.07 7.24 ± 0.07 7.15 ± 0.08 6.94 ± 0.10 Day 23 8.81 ± 0.23 8.36 ± 0.07 7.84 ± 0.04** 7.53 ± 0.06** 6.73 ± 0.08** 5.52 ± 0.06** Week 13 8.89 ± 0.13 8.75 ± 0.11 8.33 ± 0.08** 7.79 ± 0.16** 6.62 ± 0.07** 5.83 ± 0.08**
Reticulocytes (10 /µL)6
Day 3 0.29 ± 0.01 0.29 ± 0.02 0.30 ± 0.03 0.31 ± 0.03 0.37 ± 0.02* 0.40 ± 0.03* Day 23 0.16 ± 0.01 0.20 ± 0.01* 0.25 ± 0.02** 0.41 ± 0.03** 0.48 ± 0.03** 0.82 ± 0.06** Week 13 0.12 ± 0.01 0.18 ± 0.01** 0.21 ± 0.01** 0.36 ± 0.03** 0.57 ± 0.03** 1.85 ± 0.11**
Nucleated erythrocytes (10 /µL)3
Day 3 Day 23
0.03 ± 0.01 0.01 ± 0.01
0.01 ± 0.01 0.01 ± 0.01
0.07 ± 0.04 0.03 ± 0.02
0.04 ± 0.02 0.07 ± 0.03*
0.08 ± 0.03 0.49 ± 0.15**
0.26 ± 0.08** 4.16 ± 0.32**b
Week 13 0.01 ± 0.01 0.01 ± 0.01 0.06 ± 0.02* 0.10 ± 0.03** 0.15 ± 0.04** 0.54 ± 0.07** Mean cell volume (fL)
Day 3 59.4 ± 0.3 58.8 ± 0.2 59.2 ± 0.2 59.1 ± 0.2 59.4 ± 0.2 60.3 ± 0.3 Day 23 56.5 ± 0.3 55.1 ± 0.1 55.4 ± 0.2 57.8 ± 0.1 63.4 ± 0.3** 76.9 ± 0.6** Week 13 52.5 ± 0.2 52.6 ± 0.2 53.8 ± 0.2** 57.6 ± 0.2** 65.2 ± 0.3** 81.3 ± 1.1**
Mean cell hemoglobin (pg) Day 3 20.9 ± 0.2 20.5 ± 0.2 20.5 ± 0.1 20.3 ± 0.2* 20.6 ± 0.1 21.0 ± 0.2 Day 23 19.9 ± 0.1 19.6 ± 0.1 19.8 ± 0.1 20.2 ± 0.2 22.7 ± 0.1** 27.1 ± 0.2** Week 13 18.0 ± 0.2 18.1 ± 0.1 18.4 ± 0.1 20.1 ± 0.1** 23.3 ± 0.2** 26.7 ± 0.3**
Mean cell hemoglobin concentration (g/dL) Day 3 35.3 ± 0.2 34.8 ± 0.3 34.7 ± 0.1* 34.3 ± 0.3** 34.6 ± 0.1** 34.8 ± 0.1* Day 23 35.3 ± 0.3 35.5 ± 0.2 35.8 ± 0.2 34.9 ± 0.2 35.7 ± 0.2 35.3 ± 0.2 Week 13 34.4 ± 0.2 34.3 ± 0.1 34.2 ± 0.2 34.9 ± 0.2 35.8 ± 0.2* 32.8 ± 0.3*
Heinz bodies (%) Week 13 0.0 ± 0.0 0.0 ± 0.0 0.0 ± 0.0 6.7 ± 0.9** 16.4 ± 1.1** 1.7 ± 0.6**
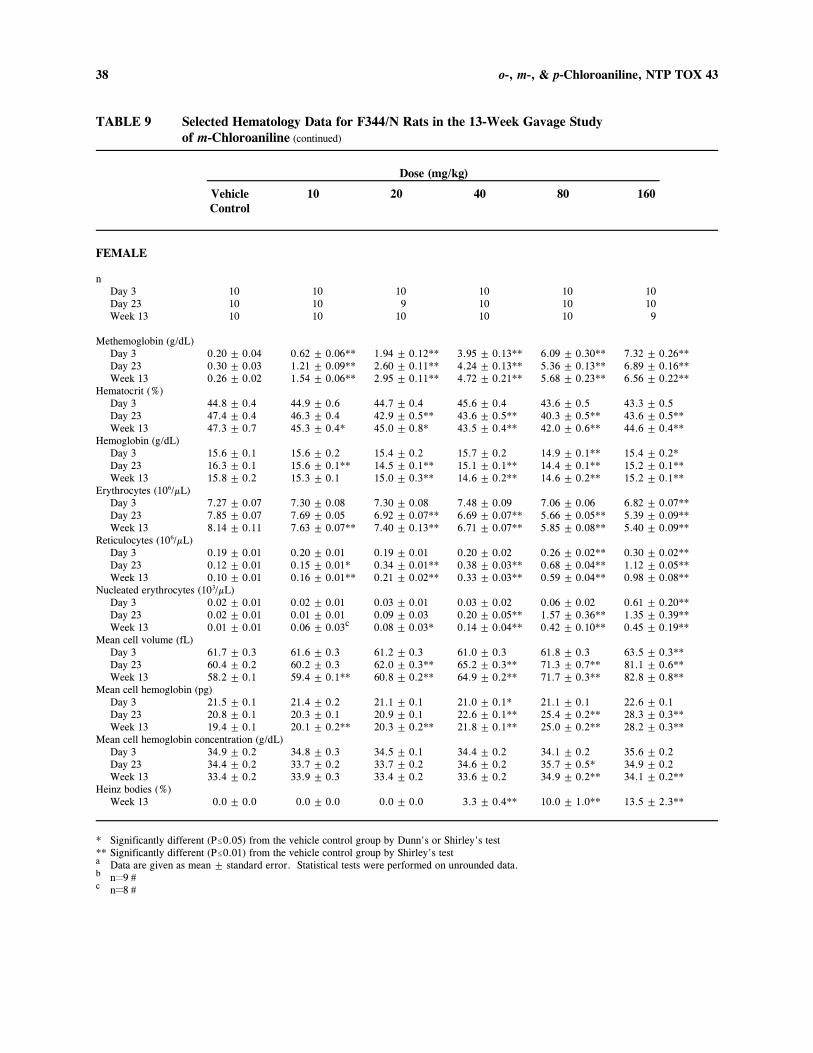
38 o-, m-, & p-Chloroaniline, NTP TOX 43
TABLE 9 Selected Hematology Data for F344/N Rats in the 13-Week Gavage Study of m-Chloroaniline (continued)
Dose (mg/kg)
Vehicle 10 20 40 80 160 Control
FEMALE
n Day 3 10 10 10 10 10 10 Day 23 10 10 9 10 10 10 Week 13 10 10 10 10 10 9
Methemoglobin (g/dL) Day 3 0.20 ± 0.04 0.62 ± 0.06** 1.94 ± 0.12** 3.95 ± 0.13** 6.09 ± 0.30** 7.32 ± 0.26** Day 23 0.30 ± 0.03 1.21 ± 0.09** 2.60 ± 0.11** 4.24 ± 0.13** 5.36 ± 0.13** 6.89 ± 0.16** Week 13 0.26 ± 0.02 1.54 ± 0.06** 2.95 ± 0.11** 4.72 ± 0.21** 5.68 ± 0.23** 6.56 ± 0.22**
Hematocrit (%) Day 3 44.8 ± 0.4 44.9 ± 0.6 44.7 ± 0.4 45.6 ± 0.4 43.6 ± 0.5 43.3 ± 0.5 Day 23 47.4 ± 0.4 46.3 ± 0.4 42.9 ± 0.5** 43.6 ± 0.5** 40.3 ± 0.5** 43.6 ± 0.5** Week 13 47.3 ± 0.7 45.3 ± 0.4* 45.0 ± 0.8* 43.5 ± 0.4** 42.0 ± 0.6** 44.6 ± 0.4**
Hemoglobin (g/dL) Day 3 15.6 ± 0.1 15.6 ± 0.2 15.4 ± 0.2 15.7 ± 0.2 14.9 ± 0.1** 15.4 ± 0.2* Day 23 16.3 ± 0.1 15.6 ± 0.1** 14.5 ± 0.1** 15.1 ± 0.1** 14.4 ± 0.1** 15.2 ± 0.1** Week 13 15.8 ± 0.2 15.3 ± 0.1 15.0 ± 0.3** 14.6 ± 0.2** 14.6 ± 0.2** 15.2 ± 0.1**
Erythrocytes (10 /µL)6
Day 3 7.27 ± 0.07 7.30 ± 0.08 7.30 ± 0.08 7.48 ± 0.09 7.06 ± 0.06 6.82 ± 0.07** Day 23 7.85 ± 0.07 7.69 ± 0.05 6.92 ± 0.07** 6.69 ± 0.07** 5.66 ± 0.05** 5.39 ± 0.09** Week 13 8.14 ± 0.11 7.63 ± 0.07** 7.40 ± 0.13** 6.71 ± 0.07** 5.85 ± 0.08** 5.40 ± 0.09**
Reticulocytes (10 /µL)6
Day 3 0.19 ± 0.01 0.20 ± 0.01 0.19 ± 0.01 0.20 ± 0.02 0.26 ± 0.02** 0.30 ± 0.02** Day 23 0.12 ± 0.01 0.15 ± 0.01* 0.34 ± 0.01** 0.38 ± 0.03** 0.68 ± 0.04** 1.12 ± 0.05** Week 13 0.10 ± 0.01 0.16 ± 0.01** 0.21 ± 0.02** 0.33 ± 0.03** 0.59 ± 0.04** 0.98 ± 0.08**
Nucleated erythrocytes (10 /µL)3
Day 3 0.02 ± 0.01 0.02 ± 0.01 0.03 ± 0.01 0.03 ± 0.02 0.06 ± 0.02 0.61 ± 0.20** Day 23 0.02 ± 0.01 0.01 ± 0.01 0.09 ± 0.03 0.20 ± 0.05** 1.57 ± 0.36** 1.35 ± 0.39** Week 13 0.01 ± 0.01 0.06 ± 0.03c 0.08 ± 0.03* 0.14 ± 0.04** 0.42 ± 0.10** 0.45 ± 0.19**
Mean cell volume (fL) Day 3 61.7 ± 0.3 61.6 ± 0.3 61.2 ± 0.3 61.0 ± 0.3 61.8 ± 0.3 63.5 ± 0.3** Day 23 60.4 ± 0.2 60.2 ± 0.3 62.0 ± 0.3** 65.2 ± 0.3** 71.3 ± 0.7** 81.1 ± 0.6** Week 13 58.2 ± 0.1 59.4 ± 0.1** 60.8 ± 0.2** 64.9 ± 0.2** 71.7 ± 0.3** 82.8 ± 0.8**
Mean cell hemoglobin (pg) Day 3 21.5 ± 0.1 21.4 ± 0.2 21.1 ± 0.1 21.0 ± 0.1* 21.1 ± 0.1 22.6 ± 0.1 Day 23 20.8 ± 0.1 20.3 ± 0.1 20.9 ± 0.1 22.6 ± 0.1** 25.4 ± 0.2** 28.3 ± 0.3** Week 13 19.4 ± 0.1 20.1 ± 0.2** 20.3 ± 0.2** 21.8 ± 0.1** 25.0 ± 0.2** 28.2 ± 0.3**
Mean cell hemoglobin concentration (g/dL) Day 3 34.9 ± 0.2 34.8 ± 0.3 34.5 ± 0.1 34.4 ± 0.2 34.1 ± 0.2 35.6 ± 0.2 Day 23 34.4 ± 0.2 33.7 ± 0.2 33.7 ± 0.2 34.6 ± 0.2 35.7 ± 0.5* 34.9 ± 0.2 Week 13 33.4 ± 0.2 33.9 ± 0.3 33.4 ± 0.2 33.6 ± 0.2 34.9 ± 0.2** 34.1 ± 0.2**
Heinz bodies (%) Week 13 0.0 ± 0.0 0.0 ± 0.0 0.0 ± 0.0 3.3 ± 0.4** 10.0 ± 1.0** 13.5 ± 2.3**
* Significantly different (P#0.05) from the vehicle control group by Dunn's or Shirley's test ** Significantly different (P#0.01) from the vehicle control group by Shirley's test a Data are given as mean ± standard error. Statistical tests were performed on unrounded data. b n˘9#
n˘8#c

39 o-, m-, & p-Chloroaniline, NTP TOX 43
An apparent mild to marked leukocytosis, evidenced by increased WBC counts, occurred in female rats in the
80 and 160 mg/kg groups on day 23 and in males administered 40 mg/kg or greater and females administered
20 mg/kg or greater at week 13. Estimates of WBC counts from blood smears, however, did not support the
quantitative results, suggesting that the automated WBC counts were erroneously elevated because of the
presence of nonlysed reticulocytes or RBC fragments, Heinz bodies, or large platelets, which were counted as
WBCs by the automated cell counter. A thrombocytosis, evidenced by mild increases in platelet counts,
occurred in males and females in the 80 and 160 mg/kg groups on day 3 and in various dosed groups on day 23.
At week 13, however, a thrombocytopenia, evidenced by mildly to moderately decreased platelet counts,
occurred in males in the 80 and 160 mg/kg groups and females in the 160 mg/kg group.
Biochemical evidence of increased hepatocellular leakage and/or altered function was demonstrated by increased
SDH activities and bile salt concentrations in dosed males and females at week 13 (Table D2). The increases
in these parameters were minimal to mild and were most pronounced in the 160 mg/kg groups. In contrast,
alanine aminotransferase activity, another biomarker of hepatocellular leakage, was decreased in males
administered 20 mg/kg or greater and in females in the 160 mg/kg group. Serum creatine kinase activity, a
marker of muscle injury, was minimally increased in the 160 mg/kg groups. Alkaline phosphatase activity was
minimally decreased in the 160 mg/kg groups; this decrease would be consistent with decreased feed
consumption (feed consumption data not available). Minimally increased creatinine concentrations in all dosed
groups of males and females could suggest a minimally decreased glomerular filtration rate. However, the
creatinine concentrations of dosed rats were within physiological ranges and did not demonstrate a dose
relationship, and serum urea nitrogen concentrations, another marker of the glomerular filtration rate, were not
increased. This suggests that the elevated creatinine concentrations were not toxicologically relevant and may
reflect a nonphysiological mechanism such as compound-related interference with the analytical method.
The absolute and relative spleen weights of male and female rats increased with increasing dose, and the spleen
weights of rats administered 20 mg/kg or greater were significantly greater than those of the vehicle controls
(Tables 10 and C2). The absolute and relative heart, right kidney, liver, and thymus weights of female rats in
the 160 mg/kg group were significantly greater than those of the vehicle controls; females in the 80 mg/kg
group also had greater absolute and relative liver weights than those of the vehicle controls (Table C2). The
absolute and relative lung weights of females administered 20 mg/kg or greater were significantly less than those
of the vehicle controls; however, these differences were not dose related.
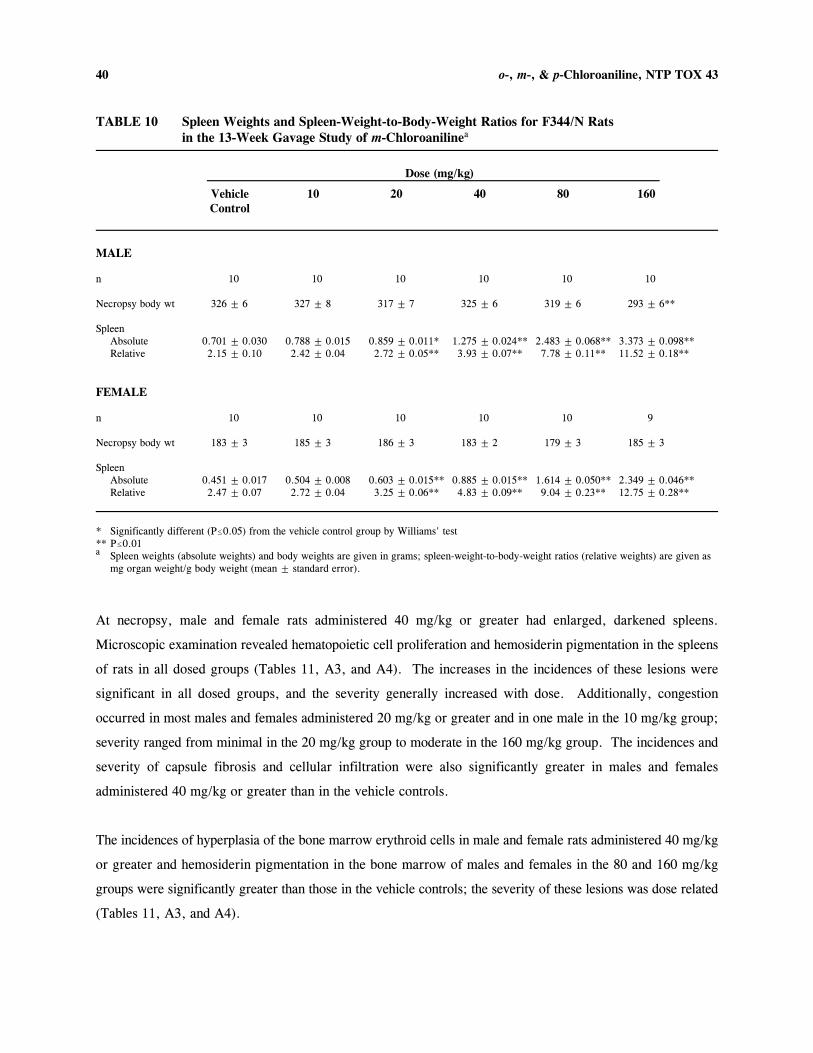
40 o-, m-, & p-Chloroaniline, NTP TOX 43
TABLE 10 Spleen Weights and Spleen-Weight-to-Body-Weight Ratios for F344/N Rats in the 13-Week Gavage Study of m-Chloroanilinea
Dose (mg/kg)
Vehicle 10 20 40 80 160 Control
MALE
n 10 10 10 10 10 10
Necropsy body wt 326 ± 6 327 ± 8 317 ± 7 325 ± 6 319 ± 6 293 ± 6**
Spleen Absolute 0.701 ± 0.030 0.788 ± 0.015 0.859 ± 0.011* 1.275 ± 0.024** 2.483 ± 0.068** 3.373 ± 0.098** Relative 2.15 ± 0.10 2.42 ± 0.04 2.72 ± 0.05** 3.93 ± 0.07** 7.78 ± 0.11** 11.52 ± 0.18**
FEMALE
n 10 10 10 10 10 9
Necropsy body wt 183 ± 3 185 ± 3 186 ± 3 183 ± 2 179 ± 3 185 ± 3
Spleen Absolute 0.451 ± 0.017 0.504 ± 0.008 0.603 ± 0.015** 0.885 ± 0.015** 1.614 ± 0.050** 2.349 ± 0.046** Relative 2.47 ± 0.07 2.72 ± 0.04 3.25 ± 0.06** 4.83 ± 0.09** 9.04 ± 0.23** 12.75 ± 0.28**
* Significantly different (P#0.05) from the vehicle control group by Williams' test ** P#0.01 a Spleen weights (absolute weights) and body weights are given in grams; spleen-weight-to-body-weight ratios (relative weights) are given as
mg organ weight/g body weight (mean ± standard error).
At necropsy, male and female rats administered 40 mg/kg or greater had enlarged, darkened spleens.
Microscopic examination revealed hematopoietic cell proliferation and hemosiderin pigmentation in the spleens
of rats in all dosed groups (Tables 11, A3, and A4). The increases in the incidences of these lesions were
significant in all dosed groups, and the severity generally increased with dose. Additionally, congestion
occurred in most males and females administered 20 mg/kg or greater and in one male in the 10 mg/kg group;
severity ranged from minimal in the 20 mg/kg group to moderate in the 160 mg/kg group. The incidences and
severity of capsule fibrosis and cellular infiltration were also significantly greater in males and females
administered 40 mg/kg or greater than in the vehicle controls.
The incidences of hyperplasia of the bone marrow erythroid cells in male and female rats administered 40 mg/kg
or greater and hemosiderin pigmentation in the bone marrow of males and females in the 80 and 160 mg/kg
groups were significantly greater than those in the vehicle controls; the severity of these lesions was dose related
(Tables 11, A3, and A4).

41 o-, m-, & p-Chloroaniline, NTP TOX 43
TABLE 11 Incidence of Selected Lesions in F344/N Rats in the 13-Week Gavage Study of m-Chloroaniline
Dose (mg/kg)
Vehicle 10 20 40 80 160 Control
MALE
Bone marrow a 10 10 10 10 10 10 Pigmentation, hemosiderinb 0 0 0 0 10** (1.5) c 10** (1.9) Erythroid cell, hyperplasia 0 0 0 10** (1.0) 10** (1.6) 10** (2.9)
Kidney 10 10 10 10 10 10 Cortex, pigmentation, hemosiderin 0 0 0 10** (1.2) 10** (1.7) 10** (3.0)
Liver 10 10 10 10 10 10 Hematopoietic cell proliferation 0 1 (1.0) 0 0 9** (1.0) 9** (1.0) Kupffer cell, pigmentation, hemosiderin 0 0 0 9** (1.0) 10** (1.0) 10** (1.2)
Spleen 10 10 10 10 10 10 Congestion 0 1 (1.0) 9** (1.1) 10** (2.3) 10** (2.9) 10** (3.0) Hematopoietic cell proliferation 0 7** (1.0) 10** (1.0) 10** (1.5) 10** (1.2) 10** (1.8) Pigmentation, hemosiderin 0 6** (1.0) 10** (1.0) 10** (1.8) 10** (1.5) 10** (2.4) Capsule, fibrosis 0 2 (1.0) 2 (1.0) 8** (1.3) 10** (2.3) 10** (2.0) Capsule, cellular infiltration 1 (1.0) 2 (1.0) 2 (1.0) 10** (2.0) 10** (2.4) 10** (2.0)
FEMALE
Bone marrow 10 10 10 10 10 10 Cellular infiltration, histiocyte 0 1 (1.0) 2 (1.0) 3 (1.0) 0 1 (1.0) Myelofibrosis 3 (1.3) 1 (1.0) 0 1 (1.0) 1 (2.0) 1 (1.0) Pigmentation, hemosiderin 0 0 0 3 (1.0) 10** (1.3) 9** (2.0) Erythroid cell, hyperplasia 0 0 0 6** (1.0) 10** (1.6) 10** (3.0)
Kidney 10 10 10 10 10 10 Cortex, pigmentation, hemosiderin 0 0 1 (1.0) 10** (1.2) 10** (2.0) 10** (2.9)
Liver 10 10 10 10 10 10 Hematopoietic cell proliferation 2 (1.0) 0 1 (1.0) 10** (1.0) 10** (1.0) 10** (1.0) Kupffer cell, pigmentation, hemosiderin 0 0 0 10** (1.0) 10** (1.0) 10** (1.8)
Spleen 10 10 10 10 10 10 Congestion 0 0 8** (1.0) 9** (1.3) 10** (2.2) 10** (2.8) Hematopoietic cell proliferation 0 5* (1.0) 8** (1.0) 10** (1.3) 10** (2.5) 9** (2.0) Pigmentation, hemosiderin 0 10** (1.0) 10** (1.0) 9** (2.3) 10** (1.9) 10** (2.8) Capsule, fibrosis 0 0 0 6** (1.3) 10** (2.1) 9** (1.6) Capsule, cellular infiltration 1 (1.0) 1 (1.0) 0 9** (1.4) 10** (2.0) 8** (1.9)
* Significantly different (P#0.05) from the vehicle control group by the Fisher exact test ** P#0.01 a Number of animals with tissue examined microscopically b Number of animals with lesion
Average severity of lesions in affected animals: 1˘minimal, 2˘mild, 3˘moderate, and 4˘marked c

42 o-, m-, & p-Chloroaniline, NTP TOX 43
Hemosiderin pigmentation also occurred with dose-related increases in severity in the Kupffer cells of the liver
and in the renal cortex in male and female rats administered 40 mg/kg or greater (Tables 11, A3, and A4).
Additionally, females in these groups and males in the 80 and 160 mg/kg groups had significantly greater
incidences of minimal hematopoietic cell proliferation in the liver than did the vehicle controls.
The sperm motility of males in the 160 mg/kg group was significantly less than that of the vehicle controls
(Table E3). The decrease in sperm motility in this group could have been due to a significant reduction in body
weight. In the absence of a dose-related effect in rats or any similar effect in mice, this observation was not
considered to be biologically significant. The percentage of time spent in the various estrous stages and the
estrous cycle length of dosed and vehicle control females were similar (Table E4).

43 o-, m-, & p-Chloroaniline, NTP TOX 43
p-Chloroaniline: The results of the 16-day, 13-week, and 2-year p-chloroaniline studies have been published
(NTP, 1989). There were no deaths or clinical findings related to p-chloroaniline administration in the 13-week
rat study. The final mean body weight and mean body weight gain of males in the 80 mg/kg group were less
than those of the vehicle controls.
Blood samples for hematology analyses were collected 72 hours after the final dose was administered for males
and 24 hours after the final dose for females. All dosed groups of males and females had significantly lower
Hct values, Hgb concentrations, and RBC counts and significantly greater methemoglobin concentrations than
did the vehicle controls (Table 12). Males administered 10 mg/kg or greater had significantly higher NRBC
counts, MCV, MCH, and MCHC than the vehicle controls, and males in the 40 mg/kg group had significantly
higher WBC, lymphocyte, and segmented neutrophil counts than the vehicle controls. Females in all dosed
groups had significantly higher WBC and lymphocyte counts and MCV than the vehicle controls. The
segmented neutrophil counts and MCH of females administered 10 mg/kg or greater were significantly higher
than those of the vehicle controls. Females administered 20 mg/kg or greater had significantly higher NRBC
counts and MCHC than the vehicle controls.
The absolute spleen weights of male and female rats administered p-chloroaniline increased with increasing
dose. The differences were significant for males administered 20 mg/kg or greater (versus the 5 mg/kg group;
spleen weights of vehicle control males were not recorded) and for all groups of dosed females.
The histopathologic slides of lesions from the p-chloroaniline study were reviewed in parallel with those from
the o- and m-chloroaniline studies to ensure that diagnostic terminology and severity grading criteria were
consistent between the studies. The spectrum of lesions caused by p-chloroaniline (Table 13) and the sites of
toxicity were similar to those for the o- and m- isomers.
Males and females in all dosed groups had significantly greater incidences of splenic congestion and
hematopoietic cell proliferation than the vehicle controls; males in all dosed groups except the 40 mg/kg group
also had significantly increased incidences of hemosiderin pigmentation in the spleen (Table 13). Males in the
40 mg/kg group and females administered 20 mg/kg or greater had significantly increased incidences of capsule
fibrosis in the spleen. Males in all dosed groups and females administered 10 mg/kg or greater had significantly
greater incidences of bone marrow erythroid cell hyperplasia and renal cortex hemosiderin pigmentation than
did the vehicle controls. Males and females administered 10 mg/kg or greater had significantly increased
incidences of hematopoietic cell proliferation in the liver; males administered 20 mg/kg or greater and females
administered 10 mg/kg or greater had significantly increased incidences of Kupffer cell hemosiderin
pigmentation.
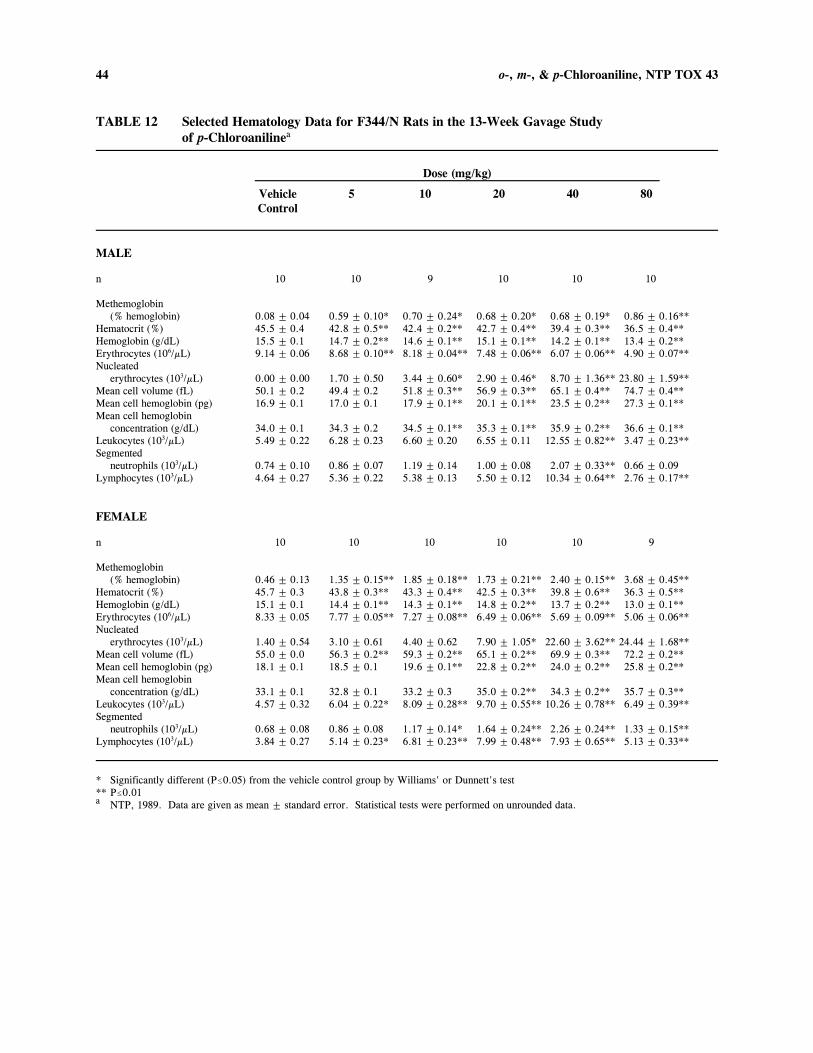
44 o-, m-, & p-Chloroaniline, NTP TOX 43
TABLE 12 Selected Hematology Data for F344/N Rats in the 13-Week Gavage Study of p-Chloroanilinea
Dose (mg/kg)
Vehicle 5 10 20 40 80 Control
MALE
n 10 10 9 10 10 10
Methemoglobin (% hemoglobin) 0.08 ± 0.04 0.59 ± 0.10* 0.70 ± 0.24* 0.68 ± 0.20* 0.68 ± 0.19* 0.86 ± 0.16**
Hematocrit (%) 45.5 ± 0.4 42.8 ± 0.5** 42.4 ± 0.2** 42.7 ± 0.4** 39.4 ± 0.3** 36.5 ± 0.4** Hemoglobin (g/dL) 15.5 ± 0.1 14.7 ± 0.2** 14.6 ± 0.1** 15.1 ± 0.1** 14.2 ± 0.1** 13.4 ± 0.2** Erythrocytes (10 /µL)6 9.14 ± 0.06 8.68 ± 0.10** 8.18 ± 0.04** 7.48 ± 0.06** 6.07 ± 0.06** 4.90 ± 0.07** Nucleated
erythrocytes (10 /µL)3 0.00 ± 0.00 1.70 ± 0.50 3.44 ± 0.60* 2.90 ± 0.46* 8.70 ± 1.36** 23.80 ± 1.59** Mean cell volume (fL) 50.1 ± 0.2 49.4 ± 0.2 51.8 ± 0.3** 56.9 ± 0.3** 65.1 ± 0.4** 74.7 ± 0.4** Mean cell hemoglobin (pg) 16.9 ± 0.1 17.0 ± 0.1 17.9 ± 0.1** 20.1 ± 0.1** 23.5 ± 0.2** 27.3 ± 0.1** Mean cell hemoglobin
concentration (g/dL) 34.0 ± 0.1 34.3 ± 0.2 34.5 ± 0.1** 35.3 ± 0.1** 35.9 ± 0.2** 36.6 ± 0.1** Leukocytes (10 /µL)3 5.49 ± 0.22 6.28 ± 0.23 6.60 ± 0.20 6.55 ± 0.11 12.55 ± 0.82** 3.47 ± 0.23** Segmented
neutrophils (10 /µL)3 0.74 ± 0.10 0.86 ± 0.07 1.19 ± 0.14 1.00 ± 0.08 2.07 ± 0.33** 0.66 ± 0.09 Lymphocytes (10 /µL)3 4.64 ± 0.27 5.36 ± 0.22 5.38 ± 0.13 5.50 ± 0.12 10.34 ± 0.64** 2.76 ± 0.17**
FEMALE
n 10 10 10 10 10 9
Methemoglobin (% hemoglobin) 0.46 ± 0.13 1.35 ± 0.15** 1.85 ± 0.18** 1.73 ± 0.21** 2.40 ± 0.15** 3.68 ± 0.45**
Hematocrit (%) 45.7 ± 0.3 43.8 ± 0.3** 43.3 ± 0.4** 42.5 ± 0.3** 39.8 ± 0.6** 36.3 ± 0.5** Hemoglobin (g/dL) 15.1 ± 0.1 14.4 ± 0.1** 14.3 ± 0.1** 14.8 ± 0.2** 13.7 ± 0.2** 13.0 ± 0.1** Erythrocytes (10 /µL)6 8.33 ± 0.05 7.77 ± 0.05** 7.27 ± 0.08** 6.49 ± 0.06** 5.69 ± 0.09** 5.06 ± 0.06** Nucleated
erythrocytes (10 /µL)3 1.40 ± 0.54 3.10 ± 0.61 4.40 ± 0.62 7.90 ± 1.05* 22.60 ± 3.62** 24.44 ± 1.68** Mean cell volume (fL) 55.0 ± 0.0 56.3 ± 0.2** 59.3 ± 0.2** 65.1 ± 0.2** 69.9 ± 0.3** 72.2 ± 0.2** Mean cell hemoglobin (pg) 18.1 ± 0.1 18.5 ± 0.1 19.6 ± 0.1** 22.8 ± 0.2** 24.0 ± 0.2** 25.8 ± 0.2** Mean cell hemoglobin
concentration (g/dL) 33.1 ± 0.1 32.8 ± 0.1 33.2 ± 0.3 35.0 ± 0.2** 34.3 ± 0.2** 35.7 ± 0.3** Leukocytes (10 /µL)3 4.57 ± 0.32 6.04 ± 0.22* 8.09 ± 0.28** 9.70 ± 0.55** 10.26 ± 0.78** 6.49 ± 0.39** Segmented
neutrophils (10 /µL)3 0.68 ± 0.08 0.86 ± 0.08 1.17 ± 0.14* 1.64 ± 0.24** 2.26 ± 0.24** 1.33 ± 0.15** Lymphocytes (10 /µL)3 3.84 ± 0.27 5.14 ± 0.23* 6.81 ± 0.23** 7.99 ± 0.48** 7.93 ± 0.65** 5.13 ± 0.33**
* Significantly different (P#0.05) from the vehicle control group by Williams' or Dunnett's test ** P#0.01 a NTP, 1989. Data are given as mean ± standard error. Statistical tests were performed on unrounded data.

45
c
o-, m-, & p-Chloroaniline, NTP TOX 43
TABLE 13 Incidence of Selected Lesions in F344/N Rats in the 13-Week Gavage Study of p-Chloroanilinea
Dose (mg/kg)
Vehicle 5 10 20 40 80 Control
MALE
Bone marrow b 10 10 10 10 10 10 Erythroid cell, hyperplasiac 0 6** (1.2) d 9** (1.0) 10** (1.5) 10** (2.3) 10** (2.8)
Kidney 10 10 10 10 10 10 Cortex, pigmentation, hemosiderin 0 10** (1.0) 9** (1.0) 10** (1.1) 10** (2.1) 10** (3.0)
Liver 10 10 10 10 10 10 Hematopoietic cell proliferation 0 2 (1.0) 8** (1.0) 5* (1.0) 7** (1.0) 10** (1.0) Kupffer cell, pigmentation, hemosiderin 0 0 0 7** (1.0) 10** (1.1) 10** (1.9)
Spleen 10 10 10 10 10 10 Congestion 1 (2.0) 10** (1.0) 10** (1.7) 10** (2.3) 10** (3.0) 10** (2.9) Hematopoietic cell proliferation 0 5* (1.4) 10** (1.5) 10** (1.5) 10** (1.5) 10** (2.1) Pigmentation, hemosiderin 1 (2.0) 9** (1.4) 10** (1.6) 9** (1.9) 3 (1.0) 9** (1.6) Capsule, fibrosis 0 0 0 2 (1.0) 10** (1.3) 2 (1.0)
FEMALE
Bone marrow 10 10 10 10 10 10 Erythroid cell, hyperplasia 0 2 (1.0) 9** (1.0) 10** (2.0) 10** (3.0) 10** (3.1)
Kidney 10 10 10 10 10 10 Cortex, pigmentation, hemosiderin 0 2 (1.0) 9** (1.0) 10** (1.0) 10** (3.3) 10** (3.5)
Liver 10 10 10 10 10 10 Hematopoietic cell proliferation 2 (1.0) 5 (1.0) 7* (1.0) 8* (1.0) 9** (1.0) 9** (1.0) Kupffer cell, pigmentation, hemosiderin 0 1 (1.0) 10** (1.0) 10** (1.2) 10** (1.3) 10** (1.9)
Spleen 10 10 10 10 10 10 Congestion 0 10** (1.3) 10** (1.9) 10** (2.9) 10** (2.7) 10** (3.1) Hematopoietic cell proliferation 4 (1.5) 10** (1.5) 10** (1.9) 10** (1.4) 10** (2.4) 10** (1.6) Pigmentation, hemosiderin 9 (1.8) 10 (1.6) 10 (1.9) 9 (2.2) 10 (1.3) 9 (2.0) Capsule, fibrosis 0 3 (1.0) 3 (1.0) 10** (1.0) 7** (1.0) 5* (1.0)
* Significantly different (P#0.05) from the vehicle control group by the Fisher exact test ** P#0.01 a NTP, 1989 (Slides were reviewed by a quality assessment pathologist and are presented in this report with terminology and severity grading
consistent with those used for the o- and m-chloroaniline data.)b Number of animals with tissue examined microscopically
Number of animals with lesion d Average severity of lesions in affected animals: 1˘minimal, 2˘mild, 3˘moderate, and 4˘marked

46 o-, m-, & p-Chloroaniline, NTP TOX 43
13-WEEK GAVAGE STUDIES IN B6C3F MICE1
Three mice in the o-chloroaniline study and nine mice in the m-chloroaniline study died due to gavage accidents
(Tables 14 and 15); no deaths were attributed to chemical effects. In the o-chloroaniline study, the final mean
body weight and mean body weight gain of females in the 160 mg/kg group were significantly less than those
of the vehicle controls (Table 14 and Figure 3). In the m-chloroaniline study, the final mean body weights and
mean body weight gains of dosed male and female mice were similar to those of the vehicle controls (Table 15
and Figure 4).
Males and females in the 160 mg/kg groups in both studies had tremors that developed immediately after dosing
and persisted for 10 to 15 minutes; mice in the 160 mg/kg groups in the m-chloroaniline study also had ataxia.
TABLE 14 Survival and Body Weights of B6C3F Mice in the 13-Week Gavage Study 1
of o-Chloroaniline
Mean Body Weightb (g)# Final Weight aDose Survival Initial Final Change Relative to Controls
(mg/kg) (%)
MALE
c0 9/10 25.1 ± 0.3 35.4 ± 1.5 10.3 ± 1.4 10 9/10d 25.2 ± 0.3 35.2 ± 0.9 9.9 ± 0.7 99 20 10/10 25.4 ± 0.3 35.5 ± 1.0 10.1 ± 0.9 100
c40 9/10 25.6 ± 0.4 35.3 ± 0.4 9.6 ± 0.3 100 80 10/10 25.1 ± 0.2 35.0 ± 0.5 9.9 ± 0.4 99
c160 9/10 24.8 ± 0.3 33.5 ± 0.9 8.7 ± 0.9 95
FEMALE
0 10/10 20.6 ± 0.3 30.0 ± 0.8 9.3 ± 0.7 10 10/10 20.4 ± 0.3 31.4 ± 1.0 11.0 ± 0.8 105
e20 9/10 20.6 ± 0.3 31.1 ± 0.7 10.5 ± 0.6 104 40 10/10 20.6 ± 0.4 29.4 ± 0.7 8.8 ± 0.5 98 80 10/10 20.5 ± 0.2 30.5 ± 0.7 10.0 ± 0.7 102
e160 9/10 20.4 ± 0.2 27.6 ± 0.5* 7.2 ± 0.4* 92
*#Significantly different (P#0.05) from the vehicle control group by Williams' test a Number surviving at 13 weeks/number initially in group. b Weights and weight changes are given as mean ± standard error.
One mouse in this group died during blood collection at the end of the study, after the final weighing; body weight data for this animal are included in the means.
d Week of death: 2 (gavage accident) e One mouse in this group died due to a gavage accident during the final week of the study; body weight data for this animal are included in
the means.
c

47 o-, m-, & p-Chloroaniline, NTP TOX 43
TABLE 15 Survival and Body Weights of B6C3F Mice in the 13-Week Gavage Study 1
of m-Chloroaniline
Mean Body Weight (g)b Final Weight Dose Survivala Initial Final Change Relative to Controls
(mg/kg) (%)
MALE
0 9/10 25.5 ± 0.3 35.0 ± 1.1 9.6 ± 1.1 10 10/10 25.6 ± 0.3 35.3 ± 1.4 9.7 ± 1.1 101 20 7/10 25.3 ± 0.4 33.6 ± 0.6 8.4 ± 0.4 96 40 10/10 25.1 ± 0.4 33.9 ± 0.4 8.9 ± 0.3 97 80 10/10 25.7 ± 0.3 35.3 ± 0.4 9.5 ± 0.4 101
160 10/10 25.1 ± 0.3 35.3 ± 0.8 10.2 ± 0.9 101
FEMALE
0 9/10 21.1 ± 0.2 28.2 ± 0.7 7.2 ± 0.7 10 9/10 21.1 ± 0.3 28.4 ± 0.7 7.4 ± 0.6 101 20 10/10 20.9 ± 0.2 27.8 ± 0.7 6.9 ± 0.7 99 40 8/10 21.3 ± 0.2 29.6 ± 1.2 8.3 ± 1.1 105 80 10/10 20.9 ± 0.3 27.9 ± 0.4 6.9 ± 0.5 99
160 9/10 21.4 ± 0.2 28.3 ± 0.5 6.9 ± 0.5 100
a Number surviving at 13 weeks/number initially in group. All early deaths were due to gavage accidents and occurred during the first 2 weeks of the study.
b Weights and weight changes are given as mean ± standard error. Differences from the vehicle control group are not significant by Dunnett's test.

48 0-, m-, & p-Chloroaniline, NTP TOX 43
FIGURE 3 Body Weights of B6C3F1 Mice Administered o-Chloroaniline by Gavage for 13 Weeks

49 o-, m-, & p-Chloroaniline, NTP TOX 43
FIGURE 4 Body Weights of B6C3F1 Mice Administered m-Chloroaniline by Gavage for 13 Weeks

50 o-, m-, & p-Chloroaniline, NTP TOX 43
o-Chloroaniline: Hematology and clinical chemistry data are listed in Tables 16 and D3. Administration of
o-chloroaniline caused a dose-dependent methemoglobinemia evidenced by minimal to marked increases in
methemoglobin concentration in all dosed groups of males and females. Evidence of a minimal anemia was
demonstrated by treatment-related decreases in Hct values and RBC counts in the 80 and 160 mg/kg groups of
males and females. In the 160 mg/kg groups, Hgb concentrations were inappropriately increased in males and
less severely affected in females compared to the changes in Hct and RBC; these inappropriate or
disproportionate responses would be consistent with erroneously elevated Hgb concentrations due to the
presence of large numbers of Heinz bodies. MCV was not affected, indicating that the anemia was normocytic.
MCHC elevations in males in the 80 and 160 mg/kg groups and females in the 160 mg/kg group indicate that
the anemia was hyperchromic and are consistent with either a hemolytic process or the presence of large
numbers of Heinz bodies causing erroneously elevated Hgb concentrations; increased MCH values accompanied
the MCHC increases and would reflect similar effects. Reticulocyte counts were increased in males
administered 80 or 160 mg/kg and females administered 160 mg/kg; these increases would be consistent with
an erythropoietic response to the anemia.
Microscopic evaluation of blood smears revealed minimally to moderately increased numbers of Heinz bodies
and schistocytes in males and females in the 160 mg/kg groups at 13 weeks. The Heinz bodies were 1- to 3-µm
spherical structures that were freely scattered between red cells or that occurred as nipples protruding from the
RBC surface. Altered RBC morphology also occurred in the 80 mg/kg groups. The presence of Heinz bodies
and schistocytes is consistent with oxidative red cell injury and suggests that the anemia was of hemolytic origin.
Increased numbers of polychromatophilic red cells also occurred in the 160 mg/kg groups; increased
polychromasia would be consistent with the increased reticulocyte counts and indicates a bone marrow response
to the anemia. A mild leukocytosis, evidenced by an increased WBC count, occurred in females in the
160 mg/kg group; this increase was apparently related to an elevation in neutrophil count. However, estimates
of WBC counts from blood smears did not support the quantitative results, suggesting that the automated
leukocyte counts were erroneously elevated due to the presence of nonlysed reticulocytes or RBC fragments or
of Heinz bodies.
No biologically significant differences in clinical chemistry parameters were observed in dosed mice (Table D3).

51 o-, m-, & p-Chloroaniline, NTP TOX 43
TABLE 16 Selected Hematology Data for B6C3F Mice in the 13-Week Gavage Study 1
of o-Chloroanilinea
Dose (mg/kg)
Vehicle 10 20 40 80 160 Control
MALE
n 10 9 10 10 10 10
Methemoglobin (g/dL) 0.15 ± 0.02 0.24 ± 0.03* 0.27 ± 0.03** 0.44 ± 0.03** 0.79 ± 0.04** 2.12 ± 0.32**b
Hematocrit (%) 50.2 ± 0.5 51.1 ± 1.0 50.2 ± 0.7 48.2 ± 0.8 47.0 ± 0.7** 45.5 ± 0.7** Hemoglobin (g/dL) 16.6 ± 0.1 16.7 ± 0.3 16.6 ± 0.1 16.2 ± 0.2 16.1 ± 0.1 17.3 ± 0.3 Erythrocytes (10 /µL)6 10.10 ± 0.10 10.34 ± 0.21 10.16 ± 0.15 9.77 ± 0.16 9.37 ± 0.13** 9.10 ± 0.14** Reticulocytes (10 /µL)6 0.24 ± 0.02 0.22 ± 0.02 0.28 ± 0.03 0.22 ± 0.02 0.38 ± 0.03** 0.65 ± 0.04** Mean cell volume (fL) 49.7 ± 0.1 49.4 ± 0.1 49.4 ± 0.3 49.3 ± 0.2 50.2 ± 0.2 50.0 ± 0.2 Mean cell hemoglobin (pg) 16.5 ± 0.2 16.2 ± 0.2 16.3 ± 0.2 16.6 ± 0.1 17.2 ± 0.2* 19.0 ± 0.2** Mean cell hemoglobin
concentration (g/dL) 33.1 ± 0.4 32.8 ± 0.3 33.1 ± 0.3 33.7 ± 0.3 34.3 ± 0.3* 37.9 ± 0.4** Heinz bodies (%) 0.0 ± 0.0 0.0 ± 0.0 0.0 ± 0.0 0.0 ± 0.0 0.1 ± 0.1 6.4 ± 0.8**
FEMALE
n 10 10 9 10 10 9
Methemoglobin (g/dL) 0.14 ± 0.02 0.22 ± 0.02* 0.24 ± 0.02** 0.48 ± 0.03** 1.08 ± 0.13** 2.39 ± 0.16** Hematocrit (%) 47.7 ± 0.9 46.7 ± 0.6 46.5 ± 0.7 46.8 ± 0.5 45.4 ± 0.3* 44.4 ± 0.6** Hemoglobin (g/dL) 16.7 ± 0.3 16.2 ± 0.1 15.9 ± 0.1* 16.1 ± 0.1* 15.6 ± 0.1** 16.3 ± 0.2* Erythrocytes (10 /µL)6 9.59 ± 0.21 9.46 ± 0.13 9.36 ± 0.11 9.45 ± 0.11 9.19 ± 0.07 8.80 ± 0.11** Reticulocytes (10 /µL)6 0.29 ± 0.02 0.30 ± 0.03 0.31 ± 0.03 0.34 ± 0.02 0.38 ± 0.03 0.71 ± 0.06** Mean cell volume (fL) 49.7 ± 0.2 49.5 ± 0.2 49.7 ± 0.2 49.5 ± 0.2 49.4 ± 0.1 50.5 ± 0.3 Mean cell hemoglobin (pg) 17.4 ± 0.2 17.2 ± 0.1 17.0 ± 0.1 17.1 ± 0.1 17.0 ± 0.1 18.6 ± 0.1* Mean cell hemoglobin
concentration (g/dL) 35.0 ± 0.2 34.7 ± 0.2 34.3 ± 0.3 34.5 ± 0.2 34.4 ± 0.1 36.8 ± 0.2 Heinz bodies (%) 0.0 ± 0.0 0.0 ± 0.0 0.0 ± 0.0 0.0 ± 0.0 0.0 ± 0.0 6.4 ± 0.5**
* Significantly different (P#0.05) from the vehicle control group by Dunn's or Shirley's test ** Significantly different (P#0.01) from the vehicle control group by Shirley's test a Data are given as mean ± standard error. Statistical tests were performed on unrounded data. b n˘9

52 o-, m-, & p-Chloroaniline, NTP TOX 43
Absolute and relative spleen weights of male and female mice generally increased with increasing dose, and the
spleen weights of males and females in the 80 and 160 mg/kg groups were significantly greater than those of
the vehicle controls (Tables 17 and C3). The relative heart and right testis weights of males and the absolute
and relative heart weights of females administered 160 mg/kg were also greater than those of the vehicle
controls.
TABLE 17 Spleen Weights and Spleen-Weight-to-Body-Weight Ratios for B6C3F Mice1
in the 13-Week Gavage Study of o-Chloroanilinea
Dose (mg/kg)
Vehicle 10 20 40 80 160 Control
MALE
n 9 9 10 9 10 9
Necropsy body wt 36.1 ± 1.3 34.7 ± 1.0 35.6 ± 1.0 35.0 ± 0.4 35.4 ± 0.6 33.4 ± 1.1
Spleen Absolute 0.074 ± 0.003 0.077 ± 0.003 0.077 ± 0.001 0.084 ± 0.003 0.109 ± 0.005** 0.155 ± 0.005** Relative 2.06 ± 0.09 2.22 ± 0.09 2.18 ± 0.07 2.39 ± 0.07 3.09 ± 0.17** 4.67 ± 0.15**
FEMALE
n 10 10 9 10 10 9
Necropsy body wt 28.7 ± 0.7 30.8 ± 1.2 30.7 ± 0.6 28.5 ± 0.7 30.2 ± 0.6 27.8 ± 0.6
Spleen Absolute 0.093 ± 0.004 0.102 ± 0.004 0.111 ± 0.007 0.106 ± 0.004 0.131 ± 0.006** 0.205 ± 0.009** Relative 3.27 ± 0.16 3.32 ± 0.11 3.66 ± 0.29 3.74 ± 0.14 4.33 ± 0.18** 7.36 ± 0.24**
** Significantly different (P#0.01) from the vehicle control group by Williams' test a Spleen weights (absolute weights) and body weights are given in grams; spleen-weight-to-body-weight ratios (relative weights) are given as
mg organ weight/g body weight (mean ± standard error).

53
c
o-, m-, & p-Chloroaniline, NTP TOX 43
At necropsy, male and female mice in the 160 mg/kg groups had enlarged, darkened spleens. Microscopically,
the spleens of one male in the 80 mg/kg group, all males in the 160 mg/kg group, and most females
administered 40 mg/kg or greater had hemosiderin pigmentation (Tables 18, B1, and B2). Hematopoietic cell
proliferation was observed in the spleens of males administered 40 mg/kg or greater and females in the 80 and
160 mg/kg groups. The severity of these lesions increased with increasing dose.
TABLE 18 Incidence of Lesions of the Spleen in B6C3F Mice in the 13-Week Gavage Study 1
of o-Chloroaniline
Dose (mg/kg)
Vehicle 10 20 40 80 160 Control
MALE
Spleena
Hematopoietic cell proliferation b 10 0
10 0
10 0
10 6** (1.0) c
10 10** (1.5)
10 10** (1.6)
Pigmentation, hemosiderin 0 0 0 0 1 (1.0) 10** (1.6)
FEMALE
Spleen 10 10 10 10 10 10 Hematopoietic cell proliferation 0 0 0 0 9** (1.8) 10** (2.0) Pigmentation, hemosiderin 0 0 0 10** (1.0) 9** (1.3) 10** (1.8)
** Significantly different (P#0.01) from the vehicle control group by the Fisher exact test a Number of animals with spleen examined microscopically b Number of animals with lesion
Average severity of lesion in affected animals: 1˘minimal, 2˘mild, 3˘moderate, and 4˘marked
There were no biologically significant differences in sperm motility or vaginal cytology parameters between
male or female dosed and vehicle control mice (Tables E5 and E6).

54 o-, m-, & p-Chloroaniline, NTP TOX 43
m-Chloroaniline: Hematology and clinical chemistry data are listed in Tables 19 and D4. As in the
o-chloroaniline study, administration of m-chloroaniline caused a dose-dependent methemoglobinemia,
evidenced by minimal to marked increases in methemoglobin concentration in all dosed groups of males and
females at week 13. The methemoglobinemia was more severe in the m-chloroaniline study. Evidence of a
mild to moderate anemia was demonstrated by treatment-related decreases in Hct values and RBC counts in
males administered 20 mg/kg or greater and females administered 40 mg/kg or greater. The Hgb concentrations
in the 80 and 160 mg/kg groups were inappropriately unchanged or increased in relation to the changes in Hct
values and RBC counts. This inappropriate response would be consistent with the erroneous elevation of Hgb
concentrations due to the presence of large numbers of Heinz bodies. An erythropoietic response to the anemia
was evidenced by increased reticulocyte counts. Similar to that occurring in the o-chloroaniline study, the
anemia was normocytic and hyperchromic, as evidenced by the lack of change in MCV and the minimal to
moderate increases in MCHC. Increased MCH values accompanied the changes in MCHC; the increases in
these parameters would be consistent with either a hemolytic process or the presence of large numbers of Heinz
bodies causing erroneously elevated Hgb concentrations.
Microscopic evaluation of blood smears revealed moderately increased numbers of Heinz bodies and
schistocytes in males and females in the 160 mg/kg groups at 13 weeks; occasional keratocytes and acanthocytes
were also observed. Increased numbers of Heinz bodies and schistocytes also occurred in the 40 and 80 mg/kg
groups. The presence of Heinz bodies and schistocytes is consistent with oxidative red cell injury and suggests
that the anemia was of hemolytic origin. Increased numbers of polychromatophilic red cells occurred in the
80 and 160 mg/kg groups; increased polychromasia would be consistent with a bone marrow response to the
anemia. While similar RBC alterations occurred in the o-chloroaniline study, the incidences, types, and
severities of the alterations caused by m-chloroaniline administration were more pronounced. A minimal
leukocytosis, evidenced by an increased WBC count, occurred in females in the 160 mg/kg group; this increase
was related to an increase in lymphocyte count. Because the differences between females in the vehicle control
and 160 mg/kg groups were minor, substantiating the leukocytosis by estimating WBC numbers from blood
smears was not feasible; however, based on the findings in the o-chloroaniline study, the increased automated
leukocyte counts in the m-chloroaniline study may have been erroneously elevated due to the presence of Heinz
bodies, RBC fragments, and/or reticulocytes in the bloodstream.
No biologically significant differences in clinical chemistry parameters were observed in dosed mice (Table D4).

55 o-, m-, & p-Chloroaniline, NTP TOX 43
TABLE 19 Selected Hematology Data for B6C3F Mice in the 13-Week Gavage Study 1
of m-Chloroanilinea
Dose (mg/kg)
Vehicle 10 20 40 80 160 Control
MALE
n 9 10 7 10 10 10
Methemoglobin (g/dL) 0.19 ± 0.03 0.28 ± 0.04 0.50 ± 0.08** 1.72 ± 0.27** 3.22 ± 0.39** 3.77 ± 0.09** Hematocrit (%) 49.9 ± 0.6 49.2 ± 0.6 46.9 ± 0.3** 45.2 ± 0.3** 44.4 ± 0.7** 42.1 ± 0.5** Hemoglobin (g/dL) 16.8 ± 0.1 16.6 ± 0.1 15.8 ± 0.1* 15.8 ± 0.3** 16.3 ± 0.1 17.3 ± 0.2 Erythrocytes (10 /µL)6 10.24 ± 0.13 10.15 ± 0.12 9.57 ± 0.09** 9.18 ± 0.07** 9.08 ± 0.15** 8.52 ± 0.12** Reticulocytes (10 /µL)6 0.20 ± 0.01 0.24 ± 0.02 0.20 ± 0.02 0.33 ± 0.04** 0.38 ± 0.03** 0.95 ± 0.08** Mean cell volume (fL) 48.7 ± 0.2 48.5 ± 0.2 49.0 ± 0.2 49.2 ± 0.2 48.9 ± 0.1 49.4 ± 0.4* Mean cell hemoglobin (pg) 16.4 ± 0.1 16.4 ± 0.1 16.5 ± 0.1 17.2 ± 0.4* 18.0 ± 0.2** 20.3 ± 0.4** Mean cell hemoglobin
concentration (g/dL) 33.7 ± 0.2 33.7 ± 0.2 33.8 ± 0.2 34.9 ± 0.7* 36.7 ± 0.4** 41.1 ± 0.7** Heinz bodies (%) 0.0 ± 0.0 0.0 ± 0.0 0.0 ± 0.0 1.4 ± 1.4 2.4 ± 0.7** 13.8 ± 3.5**
FEMALE
n 9 9 10 8 10 9
Methemoglobin (g/dL) 0.18 ± 0.03 0.30 ± 0.03* 0.60 ± 0.04** 1.86 ± 0.29** 3.62 ± 0.21** 4.60 ± 0.19** Hematocrit (%) 47.4 ± 0.4 48.3 ± 0.5 47.6 ± 0.4 45.9 ± 0.4* 43.9 ± 0.3** 44.0 ± 0.6** Hemoglobin (g/dL) 16.3 ± 0.1 16.4 ± 0.1 16.2 ± 0.1 15.7 ± 0.1 15.8 ± 0.2 16.8 ± 0.2 Erythrocytes (10 /µL)6 9.62 ± 0.10 9.89 ± 0.11 9.76 ± 0.12 9.38 ± 0.08 9.00 ± 0.06** 8.95 ± 0.13** Reticulocytes (10 /µL)6 0.19 ± 0.02 0.24 ± 0.01 0.26 ± 0.01* 0.30 ± 0.02** 0.57 ± 0.03** 0.99 ± 0.11** Mean cell volume (fL) 49.2 ± 0.2 48.9 ± 0.1 48.8 ± 0.3 48.9 ± 0.2 48.7 ± 0.2 49.1 ± 0.4 Mean cell hemoglobin (pg) 16.9 ± 0.1 16.6 ± 0.1 16.6 ± 0.2 16.8 ± 0.1 17.6 ± 0.2* 18.8 ± 0.2** Mean cell hemoglobin
concentration (g/dL) 34.3 ± 0.2 33.9 ± 0.1 34.0 ± 0.2 34.3 ± 0.1 36.0 ± 0.3** 38.3 ± 0.4** Heinz bodies (%) 0.0 ± 0.0 0.0 ± 0.0 0.0 ± 0.0 0.0 ± 0.0 1.8 ± 0.6** 5.4 ± 1.4**
* Significantly different (P#0.05) from the vehicle control group by Dunn's or Shirley's test ** P#0.01 a Data are given as mean ± standard error. Statistical tests were performed on unrounded data.

56 o-, m-, & p-Chloroaniline, NTP TOX 43
The absolute and relative spleen weights of male and female mice increased with increasing dose, and the spleen
weights of males administered 40 mg/kg or greater and females administered 20 mg/kg or greater were
significantly greater than those of the vehicle controls (Tables 20 and C4).
TABLE 20 Spleen Weights and Spleen-Weight-to-Body-Weight Ratios for B6C3F Mice1
in the 13-Week Gavage Study of m-Chloroanilinea
Dose (mg/kg)
Vehicle 10 20 40 80 160 Control
MALE
n 9 10 7 10 10 10
Necropsy body wt 36.2 ± 0.9 35.4 ± 1.3 33.8 ± 0.6 34.4 ± 0.4 35.1 ± 0.3 35.6 ± 1.0
Spleen Absolute 0.081 ± 0.002 0.081 ± 0.002 0.088 ± 0.005 0.111 ± 0.003** 0.163 ± 0.003** 0.295 ± 0.012** Relative 2.27 ± 0.09 2.32 ± 0.09 2.60 ± 0.15 3.25 ± 0.11** 4.65 ± 0.07** 8.32 ± 0.39**
FEMALE
n 9 9 10 8 10 9
Necropsy body wt 28.4 ± 0.7 28.8 ± 0.7 28.9 ± 0.8 29.9 ± 1.2 28.1 ± 0.5 28.0 ± 0.7
Spleen Absolute 0.094 ± 0.003 0.104 ± 0.005 0.116 ± 0.004* 0.138 ± 0.004** 0.193 ± 0.009** 0.282 ± 0.009** Relative 3.33 ± 0.15 3.63 ± 0.13 4.05 ± 0.14* 4.67 ± 0.21** 6.87 ± 0.29** 10.11 ± 0.22**
* Significantly different (P#0.05) from the vehicle control group by Williams' test ** P#0.01 a Spleen weights (absolute weights) and body weights are given in grams; spleen-weight-to-body-weight ratios (relative weights) are given as
mg organ weight/g body weight (mean ± standard error).

57 o-, m-, & p-Chloroaniline, NTP TOX 43
At necropsy, the spleens of males and females in the 80 and 160 mg/kg groups were enlarged. Hemosiderin
pigmentation was observed microscopically in the spleens of mice in all dosed groups, and the incidences were
significant in males administered 20 mg/kg or greater and in all dosed groups of females (Tables 21, B3, and
B4). Males administered 40 mg/kg or greater and females administered 20 mg/kg or greater also had
significantly greater incidences of hematopoietic cell proliferation than those in the vehicle controls; three males
in the 10 mg/kg group and two females in the 10 mg/kg group also had this lesion. The severity of the spleen
lesions increased with increasing dose.
Hemosiderin pigmentation was observed in the bone marrow of male mice administered 40 mg/kg or greater
and females in all dosed groups; the severity of this lesion generally increased with increasing dose (Tables 21,
B3, and B4). Four males and two females in the 160 mg/kg groups had bone marrow erythroid cell
hyperplasia; this lesion was of minimal to mild severity in males and minimal severity in females. Additionally,
one female in the 40 mg/kg group had moderate myeloid cell hyperplasia.
The livers of three male and nine female mice in the 80 mg/kg groups and nine males and nine females in the
160 mg/kg group had Kupffer cell pigmentation consistent with hemosiderin; this lesion was of minimal severity
in males and females in the 80 mg/kg groups and minimal to mild in males and females in the 160 mg/kg groups
(Tables 21, B3, and B4). Eight males and seven females administered 160 mg/kg and one female administered
80 mg/kg had mild hematopoietic cell proliferation in the liver. Six females in the 160 mg/kg group also had
mild pigmentation in the kidney.
No significant differences in sperm motility or vaginal cytology parameters occurred in male or female mice
dosed with m-chloroaniline (Tables E7 and E8).

58
c
o-, m-, & p-Chloroaniline, NTP TOX 43
TABLE 21 Incidence of Selected Lesions in B6C3F Mice in the 13-Week Gavage Study 1
of m-Chloroaniline
Dose (mg/kg)
Vehicle 10 20 40 80 160 Control
MALE
Bone marrow a 10 10 10 10 10 10 Pigmentation, hemosiderinb 0 0 0 10** (1.1) c 10** (2.1) 10** (3.6) Erythroid cell, hyperplasia
Liver 0
10 0 —d
0 3
0 —
0 3
4* 10
(1.3)
Hematopoietic cell proliferation 0 0 0 8** (1.0) Kupffer cell, pigmentation, hemosiderin 0 0 3 (1.0) 9** (1.4)
Spleen 10 10 10 10 10 10 Hematopoietic cell proliferation 0 0 3 (1.0) 10** (1.9) 10** (2.8) 10** (3.8) Pigmentation, hemosiderin 0 1 (1.0) 4* (1.5) 10** (1.9) 10** (3.0) 10** (4.0)
FEMALE
Bone marrow 10 10 10 10 10 10 Pigmentation, hemosiderin 0 4* (1.8) 8** (1.1) 7** (1.6) 10** (2.0) 9** (2.8) Erythroid cell, hyperplasia 0 0 0 0 0 2 (1.0)
Kidney 10 1 — 2 — 10 Cortex, pigmentation, hemosiderin 0 0 0 6** (1.0)
Liver 10 1 — 2 9 10 Hematopoietic cell proliferation 0 0 0 1 (1.0) 7** (1.0) Kupffer cell, pigmentation, hemosiderin 0 0 0 9** (1.0) 9** (2.0)
Spleen 10 10 10 10 10 10 Hematopoietic cell proliferation 0 2 (1.0) 7** (1.4) 7** (2.0) 10** (2.7) 9** (3.6) Pigmentation, hemosiderin 0 9** (1.3) 10** (1.8) 8** (2.4) 10** (3.3) 9** (3.9)
* Significantly different (P#0.05) from the vehicle control group by the Fisher exact test ** P#0.01 a Number of animals with tissue examined microscopically b Number of animals with lesion
Average severity of lesions in affected animals: 1˘minimal, 2˘mild, 3˘moderate, and 4˘marked d Not examined

59 o-, m-, & p-Chloroaniline, NTP TOX 43
p-Chloroaniline: The results of the 16-day, 13-week, and 2-year p-chloroaniline studies have been published
(NTP, 1989). There were no deaths or clinical findings related to p-chloroaniline administration in the 13-week
mouse study. The final mean body weights and mean body weight gains of dosed mice were similar to those
of the vehicle controls.
The Hct values and RBC counts of male mice administered 15 mg/kg or greater were significantly less than
those of the vehicle controls (Table 22). Males in all dosed groups had significantly greater methemoglobin
concentrations than the vehicle controls. Females in all dosed groups had significantly lower Hct values than
the vehicle controls; for females administered 15 mg/kg or greater, RBC counts were significantly lower and
methemoglobin concentrations were significantly greater than those of the vehicle controls. Males and females
in the 60 and 120 mg/kg groups had significantly greater Hgb concentrations than the vehicle controls. NRBC
counts and MCV of males and females in the 120 mg/kg groups and MCH and MCHC of males and females
administered 30 mg/kg or greater were significantly higher than those of the vehicle controls; males in the
15 mg/kg group also had significantly higher MCH than the vehicle controls. Females in the 60 and 120 mg/kg
groups had significantly higher segmented neutrophil counts than the vehicle controls. Male and female mice
in the 30 and 120 mg/kg groups had moderately to markedly increased numbers of Heinz bodies compared to
the vehicle controls. Moderate to marked polychromasia and poikilocytosis were also observed in dosed mice.
Absolute spleen weights increased with increasing dose. The differences were significant for all groups of
dosed males and for females administered 30 mg/kg or greater.
The histopathologic slides of lesions from the p-chloroaniline study were reviewed in parallel with those from
the o- and m-chloroaniline studies to ensure that diagnostic terminology and severity grading criteria were
consistent between the studies. The spectrum of lesions caused by p-chloroaniline (Table 23) and the sites of
toxicity were similar to those for the o- and m- isomers.
All dosed groups of male and female mice had significantly increased incidences of hematopoietic cell
proliferation and hemosiderin pigmentation in the spleen (Table 23). Males and females administered
120 mg/kg had significantly increased incidences of bone marrow erythroid cell hyperplasia. Incidences of
renal cortex hemosiderin pigmentation were increased in males and females in the 120 mg/kg groups and
females in the 60 mg/kg group. Males and females in the 60 and 120 mg/kg groups had Kupffer cell
hemosiderin pigmentation. The severity of these lesions generally increased with increasing dose.
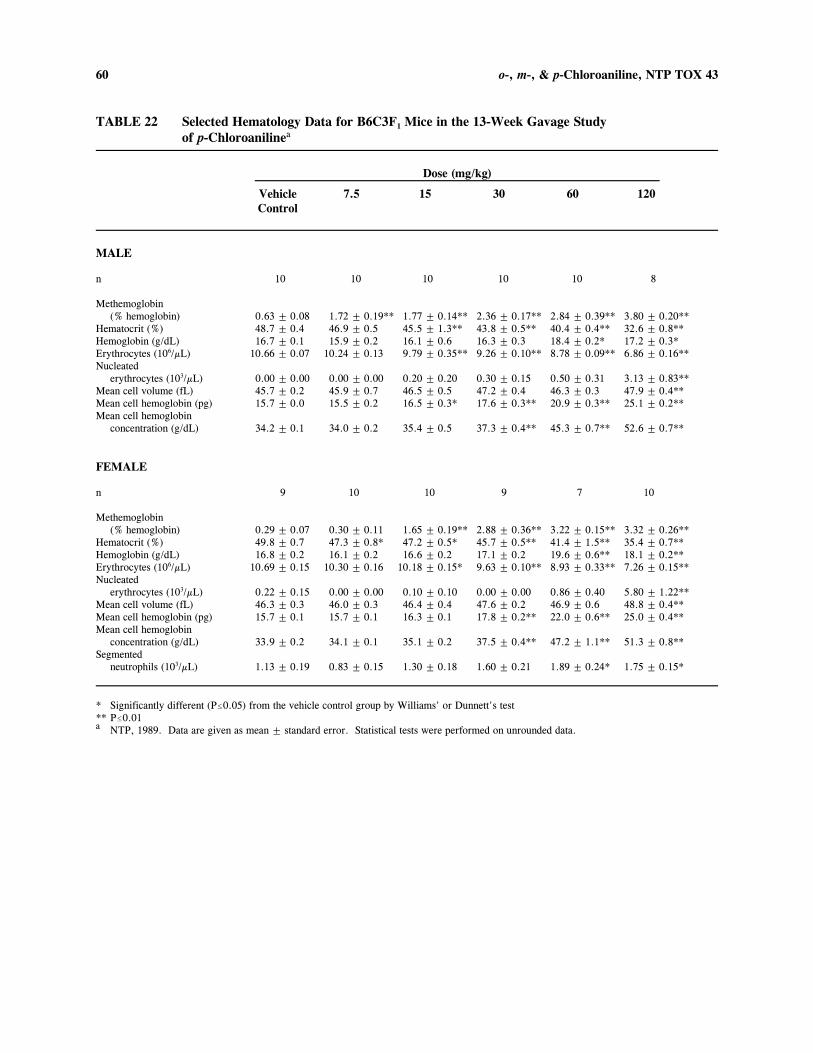
60 o-, m-, & p-Chloroaniline, NTP TOX 43
TABLE 22 Selected Hematology Data for B6C3F Mice in the 13-Week Gavage Study 1
of p-Chloroanilinea
Dose (mg/kg)
Vehicle 7.5 15 30 60 120 Control
MALE
n 10 10 10 10 10 8
Methemoglobin (% hemoglobin) 0.63 ± 0.08 1.72 ± 0.19** 1.77 ± 0.14** 2.36 ± 0.17** 2.84 ± 0.39** 3.80 ± 0.20**
Hematocrit (%) 48.7 ± 0.4 46.9 ± 0.5 45.5 ± 1.3** 43.8 ± 0.5** 40.4 ± 0.4** 32.6 ± 0.8** Hemoglobin (g/dL) 16.7 ± 0.1 15.9 ± 0.2 16.1 ± 0.6 16.3 ± 0.3 18.4 ± 0.2* 17.2 ± 0.3* Erythrocytes (10 /µL)6 10.66 ± 0.07 10.24 ± 0.13 9.79 ± 0.35** 9.26 ± 0.10** 8.78 ± 0.09** 6.86 ± 0.16** Nucleated
erythrocytes (10 /µL)3 0.00 ± 0.00 0.00 ± 0.00 0.20 ± 0.20 0.30 ± 0.15 0.50 ± 0.31 3.13 ± 0.83** Mean cell volume (fL) 45.7 ± 0.2 45.9 ± 0.7 46.5 ± 0.5 47.2 ± 0.4 46.3 ± 0.3 47.9 ± 0.4** Mean cell hemoglobin (pg) 15.7 ± 0.0 15.5 ± 0.2 16.5 ± 0.3* 17.6 ± 0.3** 20.9 ± 0.3** 25.1 ± 0.2** Mean cell hemoglobin
concentration (g/dL) 34.2 ± 0.1 34.0 ± 0.2 35.4 ± 0.5 37.3 ± 0.4** 45.3 ± 0.7** 52.6 ± 0.7**
FEMALE
n 9 10 10 9 7 10
Methemoglobin (% hemoglobin) 0.29 ± 0.07 0.30 ± 0.11 1.65 ± 0.19** 2.88 ± 0.36** 3.22 ± 0.15** 3.32 ± 0.26**
Hematocrit (%) 49.8 ± 0.7 47.3 ± 0.8* 47.2 ± 0.5* 45.7 ± 0.5** 41.4 ± 1.5** 35.4 ± 0.7** Hemoglobin (g/dL) 16.8 ± 0.2 16.1 ± 0.2 16.6 ± 0.2 17.1 ± 0.2 19.6 ± 0.6** 18.1 ± 0.2** Erythrocytes (10 /µL)6 10.69 ± 0.15 10.30 ± 0.16 10.18 ± 0.15* 9.63 ± 0.10** 8.93 ± 0.33** 7.26 ± 0.15** Nucleated
erythrocytes (10 /µL)3 0.22 ± 0.15 0.00 ± 0.00 0.10 ± 0.10 0.00 ± 0.00 0.86 ± 0.40 5.80 ± 1.22** Mean cell volume (fL) 46.3 ± 0.3 46.0 ± 0.3 46.4 ± 0.4 47.6 ± 0.2 46.9 ± 0.6 48.8 ± 0.4** Mean cell hemoglobin (pg) 15.7 ± 0.1 15.7 ± 0.1 16.3 ± 0.1 17.8 ± 0.2** 22.0 ± 0.6** 25.0 ± 0.4** Mean cell hemoglobin
concentration (g/dL) 33.9 ± 0.2 34.1 ± 0.1 35.1 ± 0.2 37.5 ± 0.4** 47.2 ± 1.1** 51.3 ± 0.8** Segmented
neutrophils (10 /µL)3 1.13 ± 0.19 0.83 ± 0.15 1.30 ± 0.18 1.60 ± 0.21 1.89 ± 0.24* 1.75 ± 0.15*
* Significantly different (P#0.05) from the vehicle control group by Williams' or Dunnett's test ** P#0.01 a NTP, 1989. Data are given as mean ± standard error. Statistical tests were performed on unrounded data.

61
c
o-, m-, & p-Chloroaniline, NTP TOX 43
TABLE 23 Incidence of Selected Lesions in B6C3F Mice in the 13-Week Gavage Study 1
of p-Chloroanilinea
Dose (mg/kg)
Vehicle 7.5 15 30 60 120 Control
MALE
Bone marrow b 10 10 10 10 10 10 Erythroid cell, hyperplasiac 0 0 0 0 0 6** (1.7) d
Kidney 10 10 10 10 10 10 Cortex, pigmentation, hemosiderin 0 0 0 0 0 9** (2.1)
Liver 10 10 10 10 10 10 Hematopoietic cell proliferation 1 (1.0) 0 2 (1.0) 0 0 1 (1.0) Kupffer cell, pigmentation, hemosiderin 0 0 0 2 (1.0) 10** (1.4) 9** (2.8)
Spleen 10 10 10 10 10 10 Hematopoietic cell proliferation 0 8** (1.0) 10** (1.6) 10** (2.8) 10** (1.9) 8** (2.6) Pigmentation, hemosiderin 0 9** (1.0) 9** (1.2) 9** (1.3) 10** (1.5) 7** (2.7)
FEMALE
Bone marrow 10 10 10 10 10 10 Erythroid cell, hyperplasia 0 0 0 0 0 4* (1.3)
Kidney 10 10 10 10 10 10 Cortex, pigmentation, hemosiderin 0 0 0 0 4* (1.0) 10** (2.5)
Liver 10 10 10 10 10 10 Hematopoietic cell proliferation 2 (1.0) 0 1 (1.0) 2 (1.0) 0 6 (1.5) Kupffer cell, pigmentation, hemosiderin 0 0 0 0 7** (1.0) 10** (2.8)
Spleen 10 10 10 10 10 10 Hematopoietic cell proliferation 1 (1.0) 9** (1.2) 10** (1.3) 9** (2.4) 8** (3.3) 10** (3.1) Pigmentation, hemosiderin 0 10** (1.0) 10** (1.1) 9** (1.4) 7** (2.0) 10** (2.9)
* Significantly different (P#0.05) from the vehicle control group by the Fisher exact test ** P#0.01 a NTP, 1989 (Slides were reviewed by a quality assessment pathologist and are presented in this report with terminology and severity grading
consistent with those used for the o- and m-chloroaniline data.)b Number of animals with tissue examined microscopically
Number of animals with lesion d Average severity of lesions in affected animals: 1˘minimal, 2˘mild, 3˘moderate, and 4˘marked

62 o-, m-, & p-Chloroaniline, NTP TOX 43
GENETIC TOXICITY
o-Chloroaniline (1 to 3,333 µg/plate) and m-chloroaniline (1 to 2,000 µg/plate) were each tested with a
preincubation protocol at two laboratories for mutagenicity in Salmonella typhimurium strains TA97, TA98,
TA100, TA1535, and TA1537, with and without Aroclor 1254-induced male Sprague-Dawley rat or Syrian
hamster liver S9; no mutagenic activity by either chemical was observed (Tables F1 and F2; Zeiger et al.,
1987).
In contrast to the lack of mutagenic activity seen in S. typhimurium, o-chloroaniline induced significant increases
in trifluorothymidine mutations in L5178Y mouse lymphoma cells treated with S9 activation enzymes (Table F3;
McGregor et al., 1991), and m-chloroaniline induced significant increases in trifluorothymidine mutations in
mouse lymphoma cells treated with and without S9 activation enzymes (Table F4). The lowest effective dose
of o-chloroaniline that produced a mutagenic response was 300 µg/mL. o-Chloroaniline produced a significant
increase in mutant colonies only at the highest concentration tested (400 µg/mL) in the second trial performed
without S9; results of the first trial without S9 were considered to be inconclusive, because although no increase
in mutant colonies was observed, the relative total growth (33%) observed at the highest dose indicated that
higher concentrations of o-chloroaniline could have been tested. The lowest effective doses of m-chloroaniline
producing a mutagenic response were 300 µg/mL without S9 and 240 µg/mL with S9.
m-Chloroaniline also induced sister chromatid exchanges and chromosomal aberrations in cultured Chinese
hamster ovary cells with and without S9 (Tables F5 and F6). In the sister chromatid exchange test without S9,
a delayed harvest protocol was used to offset cell cycle delay induced by m-chloroaniline and maximize the
number of second-division metaphase cells available for scoring. Positive responses were obtained at
concentrations of 80 µg/mL without S9 and 600 µg/mL with S9. In the chromosomal aberrations test without
S9, a delayed harvest protocol was used, and the lowest effective dose was 300.2 µg/mL. With S9, only the
highest nonlethal dose tested (598.9 µg/mL) induced a significant increase in chromosomal aberrations.
Results from an in vivo rat bone marrow micronucleus test with o-chloroaniline were positive (Table F7). Both
trials showed a dose-related increase (P<0.01) in micronucleated erythrocytes following a series of three
injections of o-chloroaniline administered at 24-hour intervals. However, results of a mouse bone marrow
micronucleus test were concluded to be negative (Table F9). In the first trial, a positive response was obtained
at two of the four doses tested in mice; a second trial showed no significant increase in the frequency of
micronucleated erythrocytes at these or at higher doses of o-chloroaniline. Neither o- nor m-chloroaniline
exposure led to an increase in the frequencies of micronucleated normochromatic erythrocytes in peripheral
blood samples obtained from male and female mice at the end of the 13-week studies.
63 o-, m-, & p-Chloroaniline, NTP TOX 43
Despite the positive responses recorded in in vitro mammalian cell mutagenicity tests, results from in vivo rat
and mouse bone marrow micronucleus tests with m-chloroaniline were negative (Tables F8 and F10). In the
single trial performed with male rats, only two dose groups survived, but these were sufficient for a valid test;
no significant increase in the number of micronucleated erythrocytes was observed in rats (Table F8). In the
mouse micronucleus tests, results of the first trial shown in Table F10 were positive (P<0.001), but the results
of a second trial performed with the same experimental protocol (single intraperitoneal injection) were negative
(P˘0.946). Subsequently, a third trial was conducted with a different protocol for chemical administration
(three injections versus a single injection, to increase the total amount of chemical administered), and the results
from this third trial were again negative. Thus, m-chloroaniline was concluded to be negative in the mouse bone
marrow micronucleus test.
In conclusion, although neither o-chloroaniline nor m-chloroaniline induced mutations in S. typhimurium, both
chemicals were genotoxic to mammalian cells in vitro. In vivo, o-chloroaniline induced micronuclei in the bone
marrow erythrocytes of rats, but not mice. m-Chloroaniline did not induce micronuclei in either rats or mice.
The data from genetic toxicity tests conducted with p-chloroaniline indicated a broader range of activity for this
isomer, with positive results noted in all assays in which it was tested, including the S. typhimurium assay, the
mouse lymphoma assay, in vitro Chinese hamster ovary cell cytogenetics assays, and the in vivo mouse bone
marrow micronucleus assay.

64 o-, m-, & p-Chloroaniline, NTP TOX 43

65
DISCUSSION
As reported for aniline (Kiese, 1966) and its chlorinated derivatives (McLean et al., 1969; Chhabra et al.,
1990), the hematopoietic system was the major target for toxicity in rats and mice exposed to o- or
m-chloroaniline. The pattern of toxic effects caused by o- and m-chloroaniline in the current studies was similar
in rats and mice. Methemoglobin formation and the accompanying hemolytic anemia, extramedullary
hematopoiesis, and Heinz body formation were indicative of erythrocyte toxicity induced by chloroanilines.
In the current studies, dose-related increases in spleen weights occurred in rats and mice. Similar enlargements
of the spleen were reported in rats administered aniline (Gralla et al., 1979) and in rats and mice administered
p-chloroaniline (Chhabra et al., 1990). Splenomegaly in dosed animals was attributed to the sequestration of
damaged erythrocytes in splenic sinusoids and to a compensatory increase in hematopoiesis. These spleen
effects appeared to be secondary to erythrocyte toxicity, as there were no direct or primary microscopic
abnormalities in the spleen.
The lowest doses of chloroaniline isomers affecting various toxicity parameters are given in Table 22. At
equivalent doses, m-chloroaniline was more potent than o-chloroaniline in producing erythrocyte toxicity.
Additionally, toxicity was induced at lower doses by m-chloroaniline than by o-chloroaniline. The magnitude
of methemoglobin response was also much greater in the m-chloroaniline studies; a high concentration of
methemoglobin was found at each evaluation period in the 160 mg/kg groups, suggesting that a sustained
maximal response had been achieved. In contrast, a more gradual increase in methemoglobin concentration
occurred in the o-chloroaniline studies. These results are consistent with studies of methemoglobin formation
in cats (McLean et al., 1969), in which m- and p-halo aniline derivatives appeared to be the most potent
methemoglobin inducers. In previous studies with p-chloroaniline, significant increases in methemoglobin
concentration occurred at gavage doses that were lower than the doses used in the present studies (NTP, 1989;
Chhabra et al., 1990). These findings suggest that p-chloroaniline is the most potent of the chloroaniline
isomers in the induction of methemoglobin formation in rats and mice, followed by m-chloroaniline, then
o-chloroaniline. A similar order of potency occurred with changes in other hematology parameters, spleen
weights, gross and microscopic abnormalities, and the severity of hemosiderin deposition. The varying potency
among chloroaniline isomers and quantitative species differences in toxicity could be related to possible
dissimilarity in the ratios of bioactivation or inactivation of reactive intermediates of the isomers (Rankin et al.,
1993).

66 o-, m-, & p-Chloroaniline, NTP TOX 43
TABLE 22 Lowest Doses Causing Adverse Effects in F344/N Rats and B6C3F Mice1
in the 13-Week Gavage Studies of o-, m-, and p-Chloroanilinea
Isomer
ortho meta para
RATS
Male
Hematotoxicity #10 #10 #5 Increased spleen weight 40 20 #5 Histopathologic lesions
Bone marrow 80 40 #5 Kidney 160 40 #5 Liver 80 40 #10 Spleen 80 #10 #5
Female
Hematotoxicity #10 #10 #5 Increased spleen weight 40 20 #5 Histopathologic lesions
Bone marrow 80 40 #10 Kidney 160 40 #10 Liver 80 40 #10 Spleen 80 #10 #5
MICE
Male
Hematotoxicity #10 20 #7.5 Increased spleen weight 80 40 #7.5 Histopathologic lesions
bBone marrow — 40 120 Kidney — — 120 Liver — 160 60 Spleen 40 20 #7.5
Female
Hematotoxicity #10 #10 #7.5 Increased spleen weight 40 20 15 Histopathologic lesions
Bone marrow — 10 120 Kidney — 160 60 Liver — 80 60 Spleen 40 #10 #7.5
a Doses are given in milligrams per kilogram body weight. o-Chloroaniline and m-chloroaniline doses were 0, 10, 20, 40, 80, and 160 mg/kg; p-chloroaniline doses were 0, 5, 10, 20, 40, and 80 mg/kg for rats and 0, 7.5, 15, 30, 60, and 120 mg/kg for mice (NTP, 1989).
b No adverse effects observed
67 o-, m-, & p-Chloroaniline, NTP TOX 43
The methemoglobin response to each isomer in all groups was consistently greater in rats than in male or female
mice. Except for cats (Thompson et al., 1989), there does not appear to be a significant difference in the
susceptibility of hemoglobin from different species to be oxidized to methemoglobin (Smith, 1996). Short-term
exposure of humans to chloroanilines produces cyanosis, a manifestation of methemoglobin formation. Long-
term exposure may result in reversible anemia (Linch, 1974). The methemoglobin can be reduced to
hemoglobin in mammalian species by NADH-dependent methemoglobin reductase located in the erythrocytes.
A 10-fold difference in the activity of this enzyme exists among various species. Enzymic activity is five times
higher in rat erythrocytes and 10 times higher in mouse erythrocytes than in human erythrocytes (Smith, 1996),
suggesting that humans are more susceptible to this particular toxic effect of aniline and its isomers. The
difference in enzyme activity could explain the more severe methemoglobinemia in rats than in mice.
Female rats appeared to be more susceptible to the formation of methemoglobin and the development of anemia
than male rats in the o- and m-chloroaniline studies. The mechanism for this sex difference is unknown.
Generally, female rats have slightly fewer but larger erythrocytes than male rats (Jain, 1986); this may
predispose the erythrocytes of female rats to be more sensitive to oxidative injury. Additionally, male animals
may be better able to respond to an anemia due to the stimulatory effect of androgens on erythropoiesis
(Wintrobe, 1981; Jain, 1986).
Methemoglobin concentrations were increased in rats administered 40 (females), 80, or 100 mg/kg
o-chloroaniline or any dose of m-chloroaniline at the earliest sampling time (day 3), indicating that marked
oxidative red cell injury developed rapidly after administration. Methemoglobin concentrations have been
shown to increase in cats and Wistar rats within hours after oral or intraperitoneal administration of o- or
m-chloroaniline (McLean et al., 1969; Watanabe et al., 1976). For rats in the m-chloroaniline study, the
greatest methemoglobin concentrations occurred in the 160 mg/kg groups on day 3; methemoglobin
concentrations in these groups declined somewhat by day 23, remaining stable at week 13. This observation
suggests that increased activity of the enzyme systems involved in methemoglobin reduction occurred and could
be explained by an absolute increase in enzyme-rich reticulocytes that appeared in response to the anemia.
Similar time-dependent methemoglobin concentration findings have been observed for rats exposed to other
methemoglobin-forming compounds (Travlos et al., 1996; NTP, 1998). In contrast, the severity of the
methemoglobinemia increased with time in the lower dose groups and for male and female rats in the
o-chloroaniline study, suggesting that the red cell injury may not have been as severe, and thus red cells with
oxidized hemoglobin were allowed to remain in the bloodstream longer.
The increased platelet counts that occurred in the o- and m-chloroaniline studies could have been related to a
general increase in hematopoietic activity or to a physiologic response resulting in splenic contraction, or the
counts could have been erroneously elevated due to the presence of free Heinz bodies or erythrocyte fragments

68 o-, m-, & p-Chloroaniline, NTP TOX 43
in the bloodstream. The decreased platelet counts that occurred in dosed male and female rats at the end of the
m-chloroaniline study would be consistent with the greatly increased spleen weights. In animals, the spleen will
sequester approximately a third of the circulating platelet mass (Jain, 1986). In cases of splenomegaly, there
is abnormal pooling of platelets within the spleen, resulting in thrombocytopenia; the magnitude of
thrombocytopenia is related to spleen size.
The biochemical evidence of increased hepatocellular leakage and/or altered liver function suggests that the liver
was a target of toxic effects of o- and m-chloroaniline in rats. However, effects on the liver could have been
secondary to the decreased erythrocyte oxygen-carrying capacity, related to the methemoglobinemia, which
resulted in mild hepatocellular hypoxia and increased cell membrane permeability.
Based on the methemoglobin concentrations, a no-observed-adverse-effect level for hematotoxicity was not
determined for any of the isomers in the current studies. However, the data can be used to establish reference
dose concentrations or minimum risk levels for chlorinated anilines.
Although the o-, m-, and p- isomers of chloroaniline all exhibit genetic toxicity, the profiles of activity are not
consistent. p-Chloroaniline (NTP, 1989) was mutagenic in all assays in which it was tested, including the
Salmonella typhimurium assay (Mortelmans et al., 1986), the mouse lymphoma assay, in vitro Chinese hamster
ovary cell cytogenetics assays, and the in vivo mouse bone marrow micronucleus test (NTP, unpublished data).
In contrast, neither o- nor m-chloroaniline demonstrated consistent responses among the various assays in which
the compounds were tested. Neither chemical was mutagenic in S. typhimurium, but both compounds induced
gene mutations in mouse lymphoma cells. Only m-chloroaniline was tested for induction of chromosomal
damage in cultured Chinese hamster ovary cells, and the results were positive. However, m-chloroaniline did
not induce micronuclei (an indication of chromosomal damage) in bone marrow erythrocytes of rats or mice
following intraperitoneal injection or gavage administration. In contrast, o-chloroaniline was positive for
induction of micronuclei in rat, but not mouse, bone marrow cells. Thus, neither o- nor m-chloroaniline
exhibits the spectrum of mutagenic activity seen with p-chloroaniline.
The available epidemiological data are insufficient to allow a conclusion as to the carcinogenicity of anilines
to humans (IARC, 1982). Aniline produced splenic sarcomas in male F344 rats (Goodman et al., 1984).
p-Chloroaniline produced splenic sarcomas in male rats and hepatocellular neoplasms and hemangiosarcomas
in the liver and spleen of male mice (Ward et al., 1980; Chhabra, 1990). o-Toluidine hydrochloride and
azobenzene, compounds structurally related to aniline, have also been shown to be carcinogens in male and
female rats (NCI, 1979a,b); two other structurally related compounds, 4,4N-sulfonyldianiline (dapsone) and
D & C Red No. 9, have been shown to be carcinogens in male rats (NCI, 1977; NTP, 1982). Goodman et al.
(1984) studied splenic lesions from male rats in these NCI and NTP studies and proposed that fibrosis of the

69 o-, m-, & p-Chloroaniline, NTP TOX 43
splenic parenchyma was a potential preneoplastic lesion; the authors postulated that methemoglobin bound with
aniline compounds or their reactive intermediates was broken down in the red pulp of the spleen. Reactive
metabolites were released to bind with mesenchymal tissue, resulting in fibrosis that progressed to neoplasm
formation. There is a strong possibility for the nongenetic mechanism in the formation of splenic neoplasms
(Bus and Popp, 1987). However, aniline has been shown to induce DNA damage in vivo in the liver and kidney
of rats, suggesting a direct genotoxic mechanism as well (Parodi et al., 1982a,b; McCarthy et al., 1985).
o-Chloroaniline and m-chloroaniline have not been evaluated for potential carcinogenicity in laboratory animals.
The toxicity data for o- and m-chloroaniline suggest that if progression of erythrocyte toxicity leads to the
formation of splenic lesions in rats, then o- and m-chloroaniline would likely be positive in the rodent
carcinogen bioassay. However, if carcinogenicity is dependent on genotoxicity, then the o- and m- isomers,
which display weaker genotoxic activity, may not be carcinogenic in a rodent bioassay. It is therefore difficult
to predict carcinogenic activity of o- and m-chloroaniline based on the available information.
In conclusion, chloroaniline isomers are hematotoxic and have the same pattern of toxicity in rats and mice.
No-observed-adverse-effect levels for hematotoxicity were not attained in these studies. The structure-toxicity
relationship establishes p-chloroaniline as the most toxic isomer, followed by m-chloroaniline, then
o-chloroaniline. The magnitude of toxicity induced is greater in rats than in mice for each of the three isomers.
p-Chloroaniline is clearly genotoxic in various test systems, while results for o- and m-chloroaniline are
inconsistent and indicate that genotoxic effects, if any, are weak.

70 o-, m-, & p-Chloroaniline, NTP TOX 43

71
REFERENCES
THE ALDRICH LIBRARY OF FT-IR SPECTRA (1985). 1st ed. (C.J. Pouchert, Ed.), p. 1194D (o-chloroaniline) and
p. 1198D (m-chloroaniline). Aldrich Chemical Company, Milwaukee, WI.
BARABANOVA, G.S., AND MOTOENKOV, Y.M. (1973). E?)+C/!=3+ AC?A!=3)! % =+7?G?CYM
7?;A?=+=G!M %?)?+;?% % E%a13 E AC3;+=+=3+; +'? % C3E?%?)EG%+. Nauchn.
Osn. Okhn. Prir. 2, 202-205.
BENYA, T.J., AND CORNISH, H.H. (1994). Aromatic nitro and amino compounds. In Patty's Industrial Hygiene
and Toxicology, 4th ed. (G.D. Clayton and F.E. Clayton, Eds.), Vol. 2B, pp. 947-1085. John Wiley and
Sons, New York.
BÖHME, C., AND GRUNOW, W. (1969). Über den Stoffwechsel von Carbamat-Herbiciden in der Ratte.
1. Mitteilung. Stoffwechsel des m-Chloranilins als Bestandteil von Chlorpropham und Barban. Food
Cosmet. Toxicol. 7, 125-133.
BOORMAN, G.A., MONTGOMERY, C.A., JR., EUSTIS, S.L., WOLFE, M.J., MCCONNELL, E.E., AND
HARDISTY, J.F. (1985). Quality assurance in pathology for rodent carcinogenicity studies. In Handbook
of Carcinogen Testing (H.A. Milman and E.K. Weisburger, Eds.), pp. 345-357. Noyes Publications, Park
Ridge, NJ.
BOORMAN, G.A., HICKMAN, R.L., DAVIS, G.W., RHODES, L.S., WHITE, N.W., GRIFFIN, T.A., MAYO, J., AND
HAMM, T.E., JR. (1986). Serological titers to murine viruses in 90-day and 2-year studies. In
Complications of Viral and Mycoplasmal Infections in Rodents to Toxicology Research and Testing
(T.E. Hamm, Jr., Ed.), pp. 11-23. Hemisphere, New York.
BRAY, H.G., JAMES, S.P., AND THORPE, W.V. (1956). The metabolism of the monochloronitrobenzenes in the
rabbit. Biochem. J. 64, 38-44.
BUS, J.S., AND POPP, J.A. (1987). Perspectives on the mechanism of action of the splenic toxicity of aniline
and structurally-related compounds. Food Chem. Toxicol. 25, 619-626.

72 o-, m-, & p-Chloroaniline, NTP TOX 43
CASPARY, W.J., LEE, Y.J., POULTON, S., MYHR, B.C., MITCHELL, A.D., AND RUDD, C.J. (1988). Evaluation
of the L5178Y mouse lymphoma cell mutagenesis assay: Quality-control guidelines and response
categories. Environ. Mol. Mutagen. 12 (Suppl. 13), 19-36.
CHHABRA, R.S., THOMPSON, M., ELWELL, M.R., AND GERKEN, D.K. (1990). Toxicity of p-chloroaniline in
rats and mice. Food Chem. Toxicol. 28, 717-722.
CODE OF FEDERAL REGULATIONS (CFR) 21, Part 58.
CODE OF FEDERAL REGULATIONS (CFR) 40, Part 61.
DARLING, R.C., AND ROUGHTON, F.J.W. (1942). The effect of methemoglobin on the equilibrium between
oxygen and hemoglobin. Am. J. Physiol. 137, 56-68.
DE BRUIN, A. (1976). Anomalies in hemoglobin — methemoglobinemia. In Biochemical Toxicology of
Environmental Agents, pp. 1259-1282. Elsevier/North-Holland Biomedical Press, Amsterdam.
DIXON, W.J., AND MASSEY, F.J., JR. (1951). Introduction to Statistical Analysis, 1st ed., pp. 145-147.
McGraw-Hill Book Company, New York.
DUNN, O.J. (1964). Multiple comparisons using rank sums. Technometrics 6, 241-252.
DUNNETT, C.W. (1955). A multiple comparison procedure for comparing several treatments with a control.
J. Am. Stat. Assoc. 50, 1096-1121.
GALLOWAY, S.M., ARMSTRONG, M.J., REUBEN, C., COLMAN, S., BROWN, B., CANNON, C., BLOOM, A.D.,
NAKAMURA, F., AHMED, M., DUK, S., RIMPO, J., MARGOLIN, B.H., RESNICK, M.A., ANDERSON, B., AND
ZEIGER, E. (1987). Chromosome aberrations and sister chromatid exchanges in Chinese hamster ovary
cells: Evaluations of 108 chemicals. Environ. Mol. Mutagen. 10 (Suppl. 10), 1-175.
GARNER, R.C., AND NUTMAN, C.A. (1977). Testing of some azo dyes and their reduction products for
mutagenicity using Salmonella typhimurium TA 1538. Mutat. Res. 44, 9-19.
GART, J.J., CHU, K.C., AND TARONE, R.E. (1979). Statistical issues in interpretation of chronic bioassay tests
for carcinogenicity. JNCI 62, 957-974.

73 o-, m-, & p-Chloroaniline, NTP TOX 43
GOODMAN, D.G., WARD, J.M., AND REICHARDT, W.D. (1984). Splenic fibrosis and sarcomas in F344 rats fed
diets containing aniline hydrochloride, p-chloroaniline, azobenzene, o-toluidine hydrochloride,
4,4N-sulfonyldianiline, or D & C Red No. 9. JNCI 73, 265-273.
GRALLA, E.J., BUS, J.S., RENO, F., CUSHMAN, J.R., AND ULLAND, B.N. (1979). Studies of aniline HCl in rats.
Toxicol. Appl. Pharmacol. 48, A97. (Abstr.)
GREVE, P.A., AND WEGMAN, R.C.C. (1975). Bestimmung und Vorkommen von aromatischen Aminen und
ihrer Derivaten in niederländischen Oberflächengewässern. SchrReihe Ver. Wass.-Boden-Lufthyg., Berlin-
Dahlem 46, 59-80.
HARGESHEIMER, E.E., COUTTS, R.T., AND PASUTTO, F.M. (1981). Gas-liquid chromatographic determination
of aniline metabolites of substituted urea and carbamate herbicides in aqueous solution. J. Assoc. Off. Anal.
Chem. 64, 833-840.
HAWLEY'S CONDENSED CHEMICAL DICTIONARY (1987). 11th ed. (N.I. Sax and R.J. Lewis, Sr., Eds.), p. 262.
Van Nostrand Reinhold, New York.
HAZARDOUS SUBSTANCES DATA BANK (HSDB) (1995). Maintained, reviewed, and updated on the National
Library of Medicine's Toxicology Data Network (TOXNET). Available through the Medlars System.
INTERNATIONAL AGENCY FOR RESEARCH ON CANCER (1982). Aniline and aniline hydrochloride. In Some
Aromatic Amines, Anthraquinones and Nitroso Compounds, and Inorganic Fluorides Used in Drinking-
Water and Dental Preparations. IARC Monographs on the Evaluation of the Carcinogenic Risk of
Chemicals to Humans, Vol. 27, pp. 39-61. IARC, Lyon.
IZMEROV, N.F., SANOTSKY, I.V., AND SIDOROV, K.K. (1982). Toxicometric Parameters of Industrial Toxic
Chemicals Under Single Exposure. United Nations Environment Programme, Centre of International
Projects, GKNT, Moscow.
JAIN, N.C. (1986). Schalm’s Veterinary Hematology, 4th ed., pp. 274-349, 466-486, and 487-513. Lea and
Febiger, Philadelphia, PA.
JONCKHEERE, A.R. (1954). A distribution-free k-sample test against ordered alternatives. Biometrika 41,
133-145.

74 o-, m-, & p-Chloroaniline, NTP TOX 43
KHAMUEV, G.D. (1967). Data to substantiate the maximal permissible concentrations of para-chloraniline and
meta-chloraniline in water bodies [in Russian, English summary]. Gig. Sanit. 32, 13-19.
KIESE, M. (1963). The effect of certain substituents upon the N-oxidation of aniline in vivo.
Naunyn-Schmiedeberg's Arch. Exp. Pathol. Pharmakol. 244, 387-404.
KIESE, M. (1966). The biochemical production of ferrihemoglobin-forming derivatives from aromatic amines,
and mechanisms of ferrihemoglobin formation. Pharmacol. Rev. 18, 1091-1161.
LEHMANN, K.B. (1933). Studien über die Wirkung der Chloraniline und Chlortoluidine und des salzsauren
5-Chlor-2-Toluidins. Arch. Hyg. Bakteriol. 110, 12-32.
LINCH, A.L. (1974). Biological monitoring for industrial exposure to cyanogenic aromatic nitro and amino
compounds. Am. Ind. Hyg. Assoc. J. 35, 426-432.
LYMAN, W.J., REEHL, W.F., AND ROSENBLATT, D.H. (1982). Handbook of Chemical Property Estimation
Methods. Environmental Behavior of Organic Compounds, pp. 15—21 to 15—29. McGraw-Hill Book
Company, New York.
LYONS, C.D., KATZ, S.E., AND BARTHA, R. (1985). Persistence and mutagenic potential of herbicide-derived
aniline residues in pond water. Bull. Environ. Contam. Toxicol. 35, 696-703.
MCCARTHY, D.J., WAUD, W.R., STRUCK, R.F., AND HILL, D.L. (1985). Disposition and metabolism of aniline
in Fischer 344 rats and C57BL/6 × C3H F mice. Cancer Res. 45, 174-180.1
MCGREGOR, D.B., BROWN, A.G., HOWGATE, S., MCBRIDE, D., RIACH, C., AND CASPARY, W.J. (1991).
Responses of the L5178Y mouse lymphoma cell forward mutation assay. V: 27 coded chemicals. Environ.
Mol. Mutagen. 17, 196-219.
MACGREGOR, J.T., WEHR, C.M., HENIKA, P.R., AND SHELBY, M.D. (1990). The in vivo erythrocyte
micronucleus test: Measurement at steady state increases assay efficiency and permits integration with
toxicity studies. Fundam. Appl. Toxicol. 14, 513-522.
MCLEAN, S., STARMER, G.A., AND THOMAS, J. (1969). Methaemoglobin formation by aromatic amines. J.
Pharm. Pharmacol. 21, 441-450.
75 o-, m-, & p-Chloroaniline, NTP TOX 43
MALKOVA, V.B. (1966). Experimental data to substantiate the maximum permissible concentration of
methachloranilin in water bodies [in Russian, English summary]. Gig. Sanit. 31, 6-10.
MARGOLIN, B.H., RISKO, K.J., FROME, E.L., AND TICE, R.R. (1990). A general purpose statistical analysis
program for micronucleus assay data. Appendix 2: Micronucleus data management and analysis
version 1.4a. Integrated Laboratory Systems, Research Triangle Park, NC.
MARONPOT, R.R., AND BOORMAN, G.A. (1982). Interpretation of rodent hepatocellular proliferative alterations
and hepatocellular tumors in chemical safety assessment. Toxicol. Pathol. 10, 71-80.
THE MERCK INDEX (1983). 10th ed. (M. Windholz, Ed.), p. 297. Merck and Company, Rahway, NJ.
MIYATA, R., NOHMI, T., YOSHIKAWA, K., AND ISHIDATE, M., JR. (1981). Metabolic activation of p-nitrotoluene
and trichloroethylene by rat-liver S9 or mouse-liver S9 fractions in Salmonella typhimurium strains [in
Japanese, English summary]. Eisei Shikenjo Hokoku 99, 60-65.
MORRISON, D.F. (1976). Multivariate Statistical Methods, 2nd ed., pp. 170-179. McGraw-Hill Book
Company, New York.
MORTELMANS, K., HAWORTH, S., LAWLOR, T., SPECK, W., TAINER, B., AND ZEIGER, E. (1986). Salmonella
mutagenicity tests: II. Results from the testing of 270 chemicals. Environ. Mutagen. 8 (Suppl. 7), 1-119.
NATIONAL CANCER INSTITUTE (NCI) (1977). Bioassay of Dapsone for Possible Carcinogenicity (CAS
No. 80-08-0). Technical Report Series No. 20. NIH Publication No. 77-820. U.S. Department of Health,
Education, and Welfare, Public Health Service, National Institutes of Health, Bethesda, MD.
NATIONAL CANCER INSTITUTE (NCI) (1979a). Bioassay of o-Toluidine Hydrochloride for Possible
Carcinogenicity (CAS No. 636-21-5). Technical Report Series No. 153. NIH Publication No. 79-1709.
U.S. Department of Health, Education, and Welfare, Public Health Service, National Institutes of Health,
Bethesda, MD.
NATIONAL CANCER INSTITUTE (NCI) (1979b). Bioassay of Azobenzene for Possible Carcinogenicity (CAS
No. 103-33-3). Technical Report Series No. 154. NIH Publication No. 79-1710. U.S. Department of
Health, Education, and Welfare, Public Health Service, National Institutes of Health, Bethesda, MD.

76 o-, m-, & p-Chloroaniline, NTP TOX 43
NATIONAL INSTITUTE FOR OCCUPATIONAL SAFETY AND HEALTH (NIOSH) (1990a). National Occupational
Hazard Survey (1972 to 1974). Cincinnati, OH.
NATIONAL INSTITUTE FOR OCCUPATIONAL SAFETY AND HEALTH (NIOSH) (1990b). National Occupational
Exposure Survey (1981 to 1983), unpublished provisional data as of July 1, 1990. Cincinnati, OH.
NATIONAL TOXICOLOGY PROGRAM (NTP) (1982). Carcinogenesis Bioassay of D & C Red No. 9 (CAS
No. 5160-02-1) in F344 Rats and B6C3F1 Mice (Feed Study). Technical Report Series No. 225. NIH
Publication No. 82-1781. U.S. Department of Health and Human Services, Public Health Service, National
Institutes of Health, Research Triangle Park, NC, and Bethesda, MD.
NATIONAL TOXICOLOGY PROGRAM (NTP) (1989). Toxicology and Carcinogenesis Studies of para-Chloroaniline
Hydrochloride (CAS No. 20265-96-7) in F344/N Rats and B6C3F1 Mice (Gavage Studies). Technical
Report Series No. 351. NIH Publication No. 89-2806. U.S. Department of Health and Human Services,
Public Health Service, National Institutes of Health, Research Triangle Park, NC.
NATIONAL TOXICOLOGY PROGRAM (NTP) (1991). Technical Protocol for Sperm Morphology and Vaginal
Cytology Evaluations in Toxicity Testing for Rats and Mice, 10/31/82 version (updated May 1991). U.S.
Department of Health and Human Services, Public Health Service, National Institutes of Health, Research
Triangle Park, NC.
NATIONAL TOXICOLOGY PROGRAM (NTP) (1998). Toxicity Studies of Methyl Ethyl Ketoxime (CAS
No. 96-29-7) Administered in Drinking Water to F344/N Rats and B6C3F Mice. Toxicity Report Series 1
No. 51. U.S. Department of Health and Human Services, Public Health Service, National Institutes of
Health, Research Triangle Park, NC. (in preparation)
PARODI, S., PALA, M., RUSSO, P., ZUNINO, A., BALBI, C., ALBINI, A., VALERIO, F., CIMBERLE, M.R., AND
SANTI, L. (1982a). DNA damage in liver, kidney, bone marrow, and spleen of rats and mice treated with
commercial and purified aniline as determined by alkaline elution assay and sister chromatid exchange
induction. Cancer Res. 42, 2277-2283.
PARODI, S., TANINGHER, M., BOERO, P., AND SANTI, L. (1982b). Quantitative correlations amongst alkaline
DNA fragmentation, DNA covalent binding, mutagenicity in the Ames test and carcinogenicity, for
21 compounds. Mutat. Res. 93, 1-24.
77 o-, m-, & p-Chloroaniline, NTP TOX 43
RANKIN, G.O., YANG, D.J., CRESSEY-VENEZIANO, K., CASTO, S., WANG, R.T., AND BROWN, P.I. (1986). In
vivo and in vitro nephrotoxicity of aniline and its monochlorophenyl derivatives in the Fischer 344 rat.
Toxicology 38, 269-283.
RANKIN, G.O., VALENTOVIC, M.A., BEERS, K.W., NICOLL, D.W., BALL, J.G., ANESTIS, D.K., BROWN, P.I.,
AND HUBBARD, J.L. (1993). Renal and hepatic toxicity of monochloroacetanilides in the Fischer 344 rat.
Toxicology 79, 181-193.
RAO, G.N., HASEMAN, J.K., AND EDMONDSON, J. (1989a). Influence of viral infections on body weight,
survival, and tumor prevalence in Fischer 344/NCr rats on two-year studies. Lab. Anim. Sci. 39, 389-393.
RAO, G.N., PIEGORSCH, W.W., CRAWFORD, D.D., EDMONDSON, J., AND HASEMAN, J.K. (1989b). Influence
of viral infections on body weight, survival, and tumor prevalence of B6C3F1 (C57BL/6N × C3H/Hen)
mice in carcinogenicity studies. Fundam. Appl. Toxicol. 13, 156-164.
REGISTRY OF TOXIC EFFECTS OF CHEMICAL SUBSTANCES (RTECS) (1995). Maintained, reviewed, and updated
on the National Library of Medicine's Toxicology Data Network (TOXNET). Available through the
Medlars System.
RENTSCH, G. (1968). Genesis of Heinz bodies and methemoglobin formation. Biochem. Pharmacol. 17,
423-427.
ROSENKRANZ, H.S., AND POIRIER, L.A. (1979). Evaluation of the mutagenicity and DNA-modifying activity
of carcinogens and noncarcinogens in microbial systems. JNCI 62, 873-892.
SHIRLEY, E. (1977). A non-parametric equivalent of Williams' test for contrasting increasing dose levels of a
treatment. Biometrics 33, 386-389.
SIMMON, V.F. (1979). In vitro mutagenicity assays of chemical carcinogens and related compounds with
Salmonella typhimurium. JNCI 62, 893-899.
SMITH, R.P. (1996). Toxic responses of the blood. In Casarett and Doull's Toxicology: The Basic Science
of Poisons, 5th ed. (C.D. Klaassen, Ed.), pp. 335-354. McGraw-Hill, New York.

78 o-, m-, & p-Chloroaniline, NTP TOX 43
SMYTH, H.F., JR., CARPENTER, C.P., WEIL, C.S., POZZANI, U.C., AND STRIEGEL, J.A. (1962). Range-finding
toxicity data: List VI. Am. Ind. Hyg. Assoc. J. 23, 95-107.
SZIZA, M., AND PODHRAGYAI, L. (1957). Toxikologische Untersuchung einiger in der ungarischen Industrie
zur Anwendung gelangenden aromatischen Amidoverbindungen. Arch. Gewerbepathol. Gewerbehyg. 15,
447-456.
THOMPSON, C.Z., HILL, L.E., EPP, J.K., AND PROBST, G.S. (1983). The induction of bacterial mutation and
hepatocyte unscheduled DNA synthesis by monosubstituted anilines. Environ. Mutagen. 5, 803-811.
THOMPSON, J.C., PAULI, J.V., HOPCROFT, D.H., AND BELL, G.H. (1989). An unusual Heinz body anaemia
in a cat. J. Comp. Pathol. 100, 343-347.
TOPHAM, J.C. (1980). The detection of carcinogen-induced sperm head abnormalities in mice. Mutat. Res.
69, 149-155.
TRAVLOS, G.S., MAHLER, J., RAGAN, H.A., CHOU, B.J., AND BUCHER, J.R. (1996). Thirteen-week inhalation
toxicity of 2- and 4-chloronitrobenzene in F344/N rats and B6C3F1 mice. Fundam. Appl. Toxicol. 30,
75-92.
UNITED STATES ENVIRONMENTAL PROTECTION AGENCY (USEPA) (1983). Computer Printout (CICIS): 1977
production statistics for chemicals in the nonconfidential initial TSCA Chemical Substances Inventory. U.S.
Environmental Protection Agency, Office of Pesticides and Toxic Substances, Washington, DC.
WARD, J.M., REZNIK, G., AND GARNER, F.M. (1980). Proliferative lesions of the spleen in male F344 rats fed
diets containing p-chloroaniline. Vet. Pathol. 17, 200-205.
WATANABE, T., ISHIHARA, N., AND IKEDA, M. (1976). Toxicity of and biological monitoring for 1,3-diamino-
2, 4, 6-trinitrobenzene and other nitro-amino derivatives of benzene and chlorobenzene. Int. Arch. Occup.
Environ. Health 37, 157-168.
WILLIAMS, D.A. (1971). A test for differences between treatment means when several dose levels are compared
with a zero dose control. Biometrics 27, 103-117.

79 o-, m-, & p-Chloroaniline, NTP TOX 43
WILLIAMS, D.A. (1972). A comparison of several dose levels with a zero dose control. Biometrics 28,
519-531.
WINTROBE, M.M. (1981). Control of erythropoiesis. In Clinical Hematology, 8th ed. (M.M. Wintrobe, G.R.
Lee, D.R. Boggs, T.C. Bithell, J. Foerster, J.W. Athens, and J.N. Lukens, Eds.), pp. 125-135. Lea and
Febiger, Philadelphia.
ZEIGER, E., ANDERSON, B., HAWORTH, S., LAWLOR, T., MORTELMANS, K., AND SPECK, W. (1987). Salmonella
mutagenicity tests: III. Results from the testing of 255 chemicals. Environ. Mutagen. 9 (Suppl. 9), 1-110.
ZIMMER, D., MAZUREK, J., PETZOLD, G., AND BHUYAN, B.K. (1980). Bacterial mutagenicity and mammalian
cell DNA damage by several substituted anilines. Mutat. Res. 77, 317-326.

80 o-, m-, & p-Chloroaniline, NTP TOX 43

A-1
APPENDIX A SUMMARY OF NONNEOPLASTIC LESIONS IN RATS
TABLE A1 Summary of the Incidence of Nonneoplastic Lesions in Male F344/N Rats in the 13-Week Gavage Study of o-Chloroaniline . . . . . . . . . . . . . . . . . . . . . . . . . . . . . . . . A-2#
TABLE A2 Summary of the Incidence of Nonneoplastic Lesions in Female F344/N Rats in the 13-Week Gavage Study of o-Chloroaniline . . . . . . . . . . . . . . . . . . . . . . . . . . . . . . . . A-4#
TABLE A3 Summary of the Incidence of Nonneoplastic Lesions in Male F344/N Rats in the 13-Week Gavage Study of m-Chloroaniline . . . . . . . . . . . . . . . . . . . . . . . . . . . . . . . . A-6#
TABLE A4 Summary of the Incidence of Nonneoplastic Lesions in Female F344/N Rats in the 13-Week Gavage Study of m-Chloroaniline . . . . . . . . . . . . . . . . . . . . . . . . . . . . . . . . A-8#
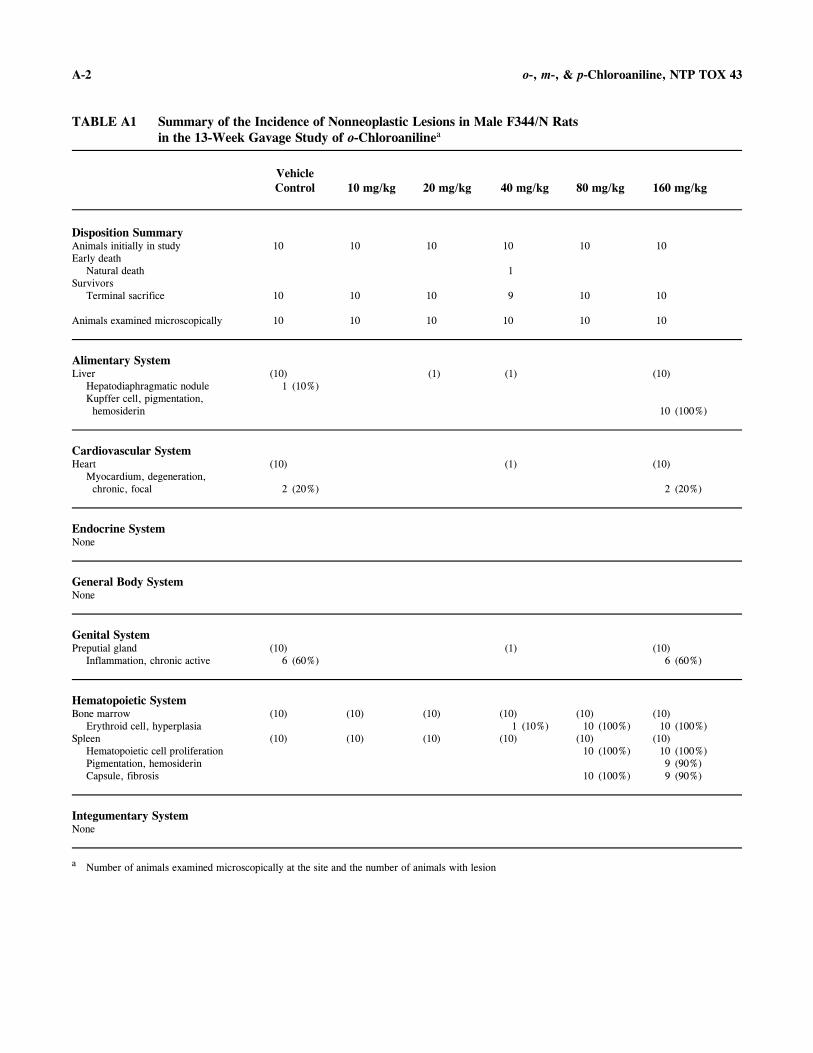
A-2 o-, m-, & p-Chloroaniline, NTP TOX 43
TABLE A1 Summary of the Incidence of Nonneoplastic Lesions in Male F344/N Rats in the 13-Week Gavage Study of o-Chloroanilinea
Vehicle Control 10 mg/kg 20 mg/kg 40 mg/kg 80 mg/kg 160 mg/kg
Disposition Summary Animals initially in study Early death
Natural death Survivors
Terminal sacrifice
Animals examined microscopically
10
10
10
10
10
10
10
10
10
10
1
9
10
10
10
10
10
10
10
Alimentary System Liver
Hepatodiaphragmatic noduleKupffer cell, pigmentation, hemosiderin
(10) 1 (10%)
(1) (1) (10)
10 (100%)
Cardiovascular System Heart
Myocardium, degeneration, chronic, focal
(10)
2 (20%)
(1) (10)
2 (20%)
Endocrine System None
General Body System None
Genital System Preputial gland (10) (1) (10)
Inflammation, chronic active 6 (60%) 6 (60%)
Hematopoietic System Bone marrow (10) (10) (10) (10) (10) (10)
Erythroid cell, hyperplasia 1 (10%) 10 (100%) 10 (100%) Spleen (10) (10) (10) (10) (10) (10)
Hematopoietic cell proliferation 10 (100%) 10 (100%) Pigmentation, hemosiderin 9 (90%) Capsule, fibrosis 10 (100%) 9 (90%)
Integumentary System None
a Number of animals examined microscopically at the site and the number of animals with lesion

A-3 o-, m-, & p-Chloroaniline, NTP TOX 43
TABLE A1 Summary of the Incidence of Nonneoplastic Lesions in Male F344/N Rats in the 13-Week Gavage Study of o-Chloroaniline (continued)
Vehicle Control 10 mg/kg 20 mg/kg 40 mg/kg 80 mg/kg 160 mg/kg
Musculoskeletal System None
Nervous System None
Respiratory System None
Special Senses System None
Urinary System Kidney (10) (10) (10) (10) (10) (10)
Mineralization, diffuse 9 (90%) 10 (100%) 10 (100%) 10 (100%) 10 (100%) 9 (90%) Mineralization, focal 1 (10%) Cortex, pigmentation, hemosiderin 10 (100%)

A-4 o-, m-, & p-Chloroaniline, NTP TOX 43
TABLE A2 Summary of the Incidence of Nonneoplastic Lesions in Female F344/N Rats in the 13-Week Gavage Study of o-Chloroanilinea
Vehicle Control 10 mg/kg 20 mg/kg 40 mg/kg 80 mg/kg 160 mg/kg
Disposition Summary Animals initially in study Early death
Natural death Survivors
Terminal sacrifice
Animals examined microscopically
10
10
10
10
10
10
10
1
9
10
10
10
10
10
10
10
10
10
10
Alimentary System Liver
Kupffer cell, pigmentation, hemosiderin
(10) (1) (10)
10 (100%)
Cardiovascular System Heart
Myocardium, degeneration, chronic, focal
(10) (1) (10)
1 (10%)
Endocrine System None
General Body System None
Genital System Clitoral gland (10) (1) (10)
Inflammation, chronic active 3 (30%) 1 (10%) Ovary (10) (1) (10)
Periovarian tissue, cyst 1 (10%)
Hematopoietic System Bone marrow (10) (10) (10) (10) (10) (10)
Erythroid cell, hyperplasia 10 (100%) 10 (100%) Spleen (10) (10) (10) (10) (10) (10)
Hematopoietic cell proliferation 10 (100%) 10 (100%) Pigmentation, hemosiderin 9 (90%) 9 (90%) Capsule, fibrosis 10 (100%) 10 (100%)
Integumentary System None
a Number of animals examined microscopically at the site and the number of animals with lesion

A-5 o-, m-, & p-Chloroaniline, NTP TOX 43
TABLE A2 Summary of the Incidence of Nonneoplastic Lesions in Female F344/N Rats in the 13-Week Gavage Study of o-Chloroaniline (continued)
Vehicle Control 10 mg/kg 20 mg/kg 40 mg/kg 80 mg/kg 160 mg/kg
Musculoskeletal System None
Nervous System None
Respiratory System None
Special Senses System None
Urinary System Kidney (10) (10) (10) (10) (10) (10)
Mineralization, diffuse 10 (100%) 10 (100%) 9 (90%) 10 (100%) 10 (100%) 9 (90%) Cortex, pigmentation, hemosiderin 10 (100%)

A-6 o-, m-, & p-Chloroaniline, NTP TOX 43
TABLE A3 Summary of the Incidence of Nonneoplastic Lesions in Male F344/N Rats in the 13-Week Gavage Study of m-Chloroanilinea
Vehicle Control 10 mg/kg 20 mg/kg 40 mg/kg 80 mg/kg 160 mg/kg
Disposition Summary Animals initially in study Survivors
Terminal sacrifice
Animals examined microscopically
10
10
10
10
10
10
10
10
10
10
10
10
10
10
10
10
10
10
Alimentary System Liver
Hematopoietic cell proliferationHemorrhageInflammation, acuteInflammation, chronic activeNecrosis, focalNecrosis, multifocalVacuolization cytoplasmicKupffer cell, pigmentation, hemosiderin
PancreasAcinus, atrophy
(10)
1 (10%)
1 (10%)
(10)
(10) 1 (10%)
1 (10%)
1 (10%) 1 (10%)
(10) (10)
1 (10%)
9 (90%)
(10) 9 (90%)
10 (100%)
(10) 9 (90%)
10 (100%) (10) 1 (10%)
Cardiovascular System Heart
Cardiomyopathy (10)
10 (100%)(10) 5 (50%)
Endocrine System Thyroid gland
Ultimobranchial cyst (10)
1 (10%) (10) 1 (10%)
General Body System None
Genital System Preputial gland (10) (10)
Inflammation, chronic 1 (10%) 4 (40%) Inflammation, chronic, focal 1 (10%) Inflammation, chronic, multifocal 4 (40%) Inflammation, chronic, suppurative 1 (10%) 1 (10%) Inflammation, granulomatous 1 (10%)
Testes (10) (10) Atrophy 1 (10%)
a Number of animals examined microscopically at the site and the number of animals with lesion

A-7 o-, m-, & p-Chloroaniline, NTP TOX 43
TABLE A3 Summary of the Incidence of Nonneoplastic Lesions in Male F344/N Rats in the 13-Week Gavage Study of m-Chloroaniline (continued)
Vehicle Control 10 mg/kg 20 mg/kg 40 mg/kg 80 mg/kg 160 mg/kg
Hematopoietic System Bone marrow (10) (10) (10) (10) (10) (10)
Pigmentation, hemosiderin 10 (100%) 10 (100%) Erythroid cell, hyperplasia 10 (100%) 10 (100%) 10 (100%)
Spleen (10) (10) (10) (10) (10) (10) Congestion 1 (10%) 9 (90%) 10 (100%) 10 (100%) 10 (100%) Fibrosis 1 (10%) Hematopoietic cell proliferation 7 (70%) 10 (100%) 10 (100%) 10 (100%) 10 (100%) Pigmentation, hemosiderin 6 (60%) 10 (100%) 10 (100%) 10 (100%) 10 (100%) Capsule, fibrosis 2 (20%) 2 (20%) 8 (80%) 10 (100%) 10 (100%) Capsule, infiltration cellular 1 (10%) 2 (20%) 2 (20%) 10 (100%) 10 (100%) 10 (100%)
Integumentary System None
Musculoskeletal System None
Nervous System None
Respiratory System Lung (10) (10)
Hemorrhage, focal 1 (10%) 1 (10%) Alveolar epithelium, hyperplasia 1 (10%) Artery, mineralization 6 (60%) 5 (50%) Interstitium, inflammation, chronic, focal 1 (10%)
Interstitium, inflammation, chronic, multifocal 1 (10%)
Vein, mineralization 1 (10%) Nose (10) (10)
Lateral wall, inflammation, granulomatous 1 (10%)
Special Senses System None
Urinary System Kidney (10) (10) (10) (10) (10) (10)
Inflammation, chronic, multifocal 1 (10%) Mineralization 10 (100%) 10 (100%) 9 (90%) 10 (100%) 10 (100%) 10 (100%) Cortex, pigmentation, hemosiderin 10 (100%) 10 (100%) 10 (100%) Renal tubule, regeneration, focal 2 (20%) 1 (10%) 2 (20%) Renal tubule, regeneration, multifocal 7 (70%) 8 (80%) 7 (70%) 2 (20%)

A-8 o-, m-, & p-Chloroaniline, NTP TOX 43
TABLE A4 Summary of the Incidence of Nonneoplastic Lesions in Female F344/N Rats in the 13-Week Gavage Study of m-Chloroanilinea
Vehicle Control 10 mg/kg 20 mg/kg 40 mg/kg 80 mg/kg 160 mg/kg
Disposition Summary Animals initially in study Early death
Natural death Survivors
Terminal sacrifice
Animals examined microscopically
10
10
10
10
10
10
10
10
10
10
10
10
10
10
10
10
1
9
10
Alimentary System Esophagus
Muscularis, inflammation, chronic, focal
LiverHematopoietic cell proliferationHepatodiaphragmatic noduleInflammation, chronic, multifocalPigmentationBile duct, inflammation, chronic, focal
Kupffer cell, pigmentation, hemosiderin
PancreasAcinus, atrophy
(9)
(10) 2 (20%) 1 (10%) 1 (10%) 3 (30%)
(10) 1 (10%)
(10) (10) 1 (10%)
(10) 10 (100%)
10 (100%)
(10) 10 (100%)
10 (100%)
(10)
1 (10%) (10) 10 (100%)
1 (10%)
10 (100%) (10)
Cardiovascular System Heart
Cardiomyopathy (10)
4 (40%) (10) 5 (50%)
Endocrine System Thyroid gland
CystUltimobranchial cyst
(10)
1 (10%)
(1) 1 (100%)
(10)
General Body System None
Genital System Clitoral gland (10) (10)
Inflammation, chronic 1 (10%) Inflammation, chronic, focal 1 (10%) 1 (10%) Inflammation, chronic, multifocal 3 (30%) 6 (60%) Inflammation, chronic, multifocal, suppurative 1 (10%)
a Number of animals examined microscopically at the site and the number of animals with lesion

A-9 o-, m-, & p-Chloroaniline, NTP TOX 43
TABLE A4 Summary of the Incidence of Nonneoplastic Lesions in Female F344/N Rats in the 13-Week Gavage Study of m-Chloroaniline (continued)
Vehicle Control 10 mg/kg 20 mg/kg 40 mg/kg 80 mg/kg 160 mg/kg
Hematopoietic System Bone marrow (10) (10) (10) (10) (10) (10)
Infiltration cellular, multifocal, histiocyte 1 (10%)
Infiltration cellular, histiocyte 1 (10%) 2 (20%) 3 (30%) Myelofibrosis 3 (30%) 1 (10%) 1 (10%) 1 (10%) Pigmentation, hemosiderin 3 (30%) 10 (100%) 9 (90%) Erythroid cell, hyperplasia 6 (60%) 10 (100%) 10 (100%) Erythroid cell, myelofibrosis 1 (10%)
Lymph node (1) Lumbar, pigmentation 1 (100%)
Lymph node, mesenteric (10) (10) Hyperplasia, histiocytic 1 (10%)
Spleen (10) (10) (10) (10) (10) (10) Congestion 8 (80%) 9 (90%) 10 (100%) 10 (100%) Hematopoietic cell proliferation 5 (50%) 8 (80%) 10 (100%) 10 (100%) 9 (90%) Pigmentation, hemosiderin 10 (100%) 10 (100%) 9 (90%) 10 (100%) 10 (100%) Capsule, fibrosis 6 (60%) 10 (100%) 9 (90%) Capsule, infiltration cellular 1 (10%) 1 (10%) 9 (90%) 10 (100%) 8 (80%) Lymphoid follicle, atrophy 1 (10%)
Integumentary System None
Musculoskeletal System None
Nervous System None
Respiratory System Lung (10) (10)
Congestion 1 (10%) Inflammation, chronic active, focal 1 (10%) Inflammation, chronic active, multifocal 1 (10%)
Arteriole, inflammation, granulomatous 1 (10%)
Artery, mineralization 3 (30%) 5 (50%) Vein, mineralization 1 (10%)
Nose (10) (10) Respiratory epithelium, inflammation, chronic 1 (10%)

A-10 o-, m-, & p-Chloroaniline, NTP TOX 43
TABLE A4 Summary of the Incidence of Nonneoplastic Lesions in Female F344/N Rats in the 13-Week Gavage Study of m-Chloroaniline (continued)
Vehicle Control 10 mg/kg 20 mg/kg 40 mg/kg 80 mg/kg 160 mg/kg
Special Senses System None
Urinary System Kidney (10) (10) (10) (10) (10) (10)
Mineralization 10 (100%) 10 (100%) 10 (100%) 10 (100%) 10 (100%) 9 (90%) Cortex, inflammation, chronic, focal 1 (10%) Cortex, pigmentation, hemosiderin 1 (10%) 10 (100%) 10 (100%) 10 (100%) Renal tubule, regeneration, focal 2 (20%) 1 (10%)

B-1
APPENDIX B SUMMARY OF NONNEOPLASTIC LESIONS IN MICE
TABLE B1 Summary of the Incidence of Nonneoplastic Lesions in Male B6C3F Mice1
in the 13-Week Gavage Study of o-Chloroaniline . . . . . . . . . . . . . . . . . . . . . . . . . . . . . . . . B-2 TABLE B2 Summary of the Incidence of Nonneoplastic Lesions in Female B6C3F Mice1
in the 13-Week Gavage Study of o-Chloroaniline . . . . . . . . . . . . . . . . . . . . . . . . . . . . . . . . B-4 TABLE B3 Summary of the Incidence of Nonneoplastic Lesions in Male B6C3F Mice1
in the 13-Week Gavage Study of m-Chloroaniline . . . . . . . . . . . . . . . . . . . . . . . . . . . . . . . . B-6 TABLE B4 Summary of the Incidence of Nonneoplastic Lesions in Female B6C3F Mice1
in the 13-Week Gavage Study of m-Chloroaniline . . . . . . . . . . . . . . . . . . . . . . . . . . . . . . . . B-8

B-2 o-, m-, & p-Chloroaniline, NTP TOX 43
TABLE B1 Summary of the Incidence of Nonneoplastic Lesions in Male B6C3F Mice1
in the 13-Week Gavage Study of o-Chloroanilinea
Vehicle Control 10 mg/kg 20 mg/kg 40 mg/kg 80 mg/kg 160 mg/kg
Disposition Summary Animals initially in study Early death
Accidental death Survivors
Died last week of study Terminal sacrifice
10
1 9
10
1
9
10
10
10
1 9
10
10
10
1 9
Animals examined microscopically 10 10 10 10 10 10
Alimentary System Esophagus
Inflammation, suppurative (10) (1)
1 (100%) (1) (10)
Cardiovascular System None
Endocrine System None
General Body System None
Genital System None
Hematopoietic System Spleen (10) (10) (10) (10) (10) (10)
Hematopoietic cell proliferation 6 (60%) 10 (100%) 10 (100%) Pigmentation, hemosiderin 1 (10%) 10 (100%)
Thymus (10) (1) (1) (10) Inflammation, suppurative 1 (100%)
Integumentary System None
Musculoskeletal System None
Nervous System None
a Number of animals examined microscopically at the site and the number of animals with lesion

B-3 o-, m-, & p-Chloroaniline, NTP TOX 43
TABLE B1 Summary of the Incidence of Nonneoplastic Lesions in Male B6C3F Mice1
in the 13-Week Gavage Study of o-Chloroaniline (continued)
Vehicle Control 10 mg/kg 20 mg/kg 40 mg/kg 80 mg/kg 160 mg/kg
Respiratory System Pleura (1)
Inflammation, suppurative 1 (100%)
Special Senses System None
Urinary System Kidney (10) (1) (1) (10)
Nephropathy 1 (10%)

B-4 o-, m-, & p-Chloroaniline, NTP TOX 43
TABLE B2 Summary of the Incidence of Nonneoplastic Lesions in Female B6C3F Mice1
in the 13-Week Gavage Study of o-Chloroanilinea
Vehicle Control 10 mg/kg 20 mg/kg 40 mg/kg 80 mg/kg 160 mg/kg
Disposition Summary Animals initially in study Survivors
Died last week of study Terminal sacrifice
10
10
10
10
10
1 9
10
10
10
10
10
1 9
Animals examined microscopically 10 10 10 10 10 10
Alimentary System None
Cardiovascular System None
Endocrine System Parathyroid gland (7) (1) (9)
Cyst 1 (11%) Thyroid gland (10) (1) (10)
Cyst 1 (10%) Inflammation, granulomatous 1 (100%)
General Body System None
Genital System Ovary (10) (1) (1) (10)
Cyst 1 (100%)
Hematopoietic System Spleen (10) (10) (10) (10) (10) (10)
Hematopoietic cell proliferation 9 (90%) 10 (100%) Pigmentation, hemosiderin 10 (100%) 9 (90%) 10 (100%)
Thymus (10) (1) (10) Hemorrhage 1 (10%) Inflammation, granulomatous 1 (100%)
Integumentary System None
a Number of animals examined microscopically at the site and the number of animals with lesion
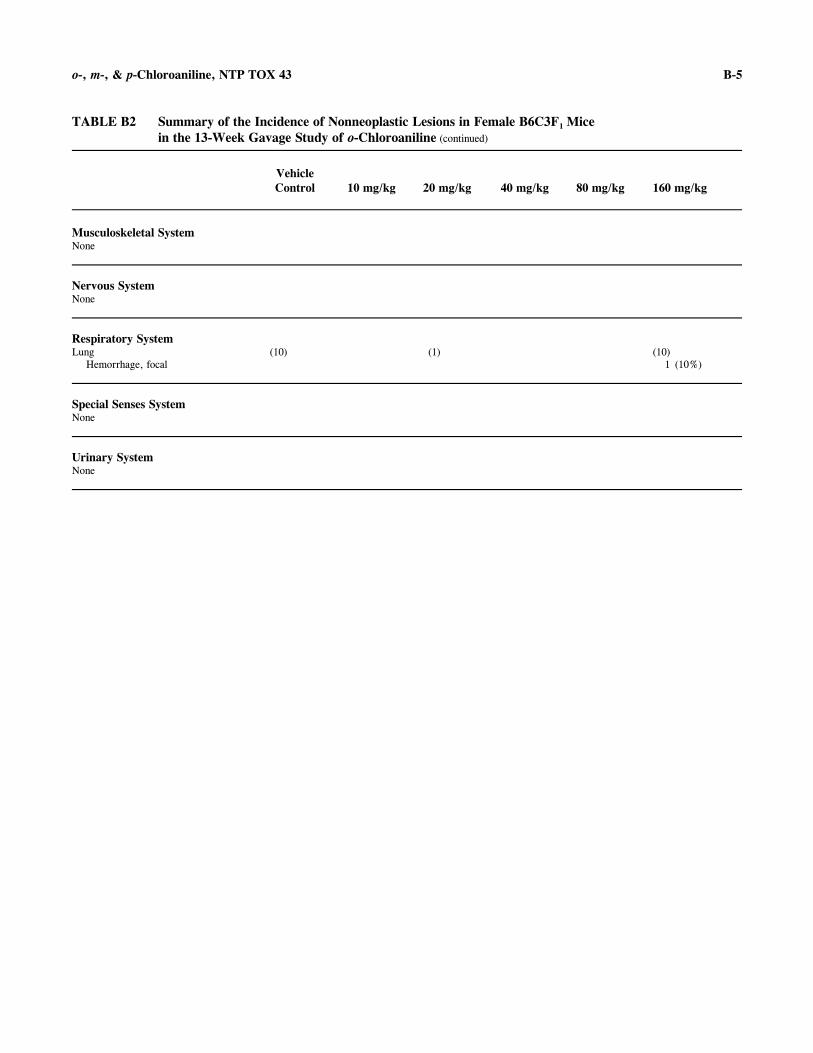
B-5 o-, m-, & p-Chloroaniline, NTP TOX 43
TABLE B2 Summary of the Incidence of Nonneoplastic Lesions in Female B6C3F Mice1
in the 13-Week Gavage Study of o-Chloroaniline (continued)
Vehicle Control 10 mg/kg 20 mg/kg 40 mg/kg 80 mg/kg 160 mg/kg
Musculoskeletal System None
Nervous System None
Respiratory System Lung (10) (1) (10)
Hemorrhage, focal 1 (10%)
Special Senses System None
Urinary System None

B-6 o-, m-, & p-Chloroaniline, NTP TOX 43
TABLE B3 Summary of the Incidence of Nonneoplastic Lesions in Male B6C3F Mice1
in the 13-Week Gavage Study of m-Chloroanilinea
Vehicle Control 10 mg/kg 20 mg/kg 40 mg/kg 80 mg/kg 160 mg/kg
Disposition Summary Animals initially in study Early deaths
Accidental deaths Survivors
Terminal sacrifice
Animals examined microscopically
10
1
9
10
10
10
10
10
3
7
10
10
10
10
10
10
10
10
10
10
Alimentary System Esophagus
Foreign bodyInflammation, suppurativePerforation
LiverHematopoietic cell proliferationKupffer cell, pigmentation, hemosiderin
(10)
1 (10%) 1 (10%)
(10)
(3) 1 (33%)
(3) (3)
3 (100%)
(10)
(10) 8 (80%)
9 (90%)
Cardiovascular System Heart
Inflammation, suppurativeMyocardium, degenerationPericardium, inflammation, suppurative
(10)
1 (10%)
(3) 2 (67%)
1 (33%)
(10)
1 (10%)
Endocrine System None
General Body System None
Genital System None
Hematopoietic System Bone marrow (10) (10) (10) (10) (10) (10)
Pigmentation, hemosiderin 10 (100%) 10 (100%) 10 (100%) Erythroid cell, hyperplasia 4 (40%)
Spleen (10) (10) (10) (10) (10) (10) Hematopoietic cell proliferation 3 (30%) 10 (100%) 10 (100%) 10 (100%) Pigmentation, hemosiderin 1 (10%) 4 (40%) 10 (100%) 10 (100%) 10 (100%)
a Number of animals examined microscopically at the site and the number of animals with lesion

B-7 o-, m-, & p-Chloroaniline, NTP TOX 43
TABLE B3 Summary of the Incidence of Nonneoplastic Lesions in Male B6C3F Mice1
in the 13-Week Gavage Study of m-Chloroaniline (continued)
Vehicle Control 10 mg/kg 20 mg/kg 40 mg/kg 80 mg/kg 160 mg/kg
Integumentary System None
Musculoskeletal System None
Nervous System None
Respiratory System Lung (10) (3) (10)
Foreign body 1 (10%) 1 (33%) Serosa, inflammation, suppurative 1 (10%) 3 (100%)
Special Senses System None
Urinary System None

B-8 o-, m-, & p-Chloroaniline, NTP TOX 43
TABLE B4 Summary of the Incidence of Nonneoplastic Lesions in Female B6C3F Mice1
in the 13-Week Gavage Study of m-Chloroanilinea
Vehicle Control 10 mg/kg 20 mg/kg 40 mg/kg 80 mg/kg 160 mg/kg
Disposition Summary Animals initially in study Early deaths
Accidental deaths Survivors
Terminal sacrifice
Animals examined microscopically
10
1
9
10
10
1
9
10
10
10
10
10
2
8
10
10
10
10
10
1
9
10
Alimentary System Esophagus
HemorrhageUlcer
LiverHematopoietic cell proliferationNecrosis, focalKupffer cell, pigmentation, hemosiderin
(10) 1 (10%)
(10)
(1)
(1)
(2)
1 (50%) (2) (9)
1 (11%)
9 (100%)
(10)
(10) 7 (70%) 1 (10%)
9 (90%)
Cardiovascular System Heart
Pericardium, inflammation, suppurative
(10) (1)
1 (100%)
(2)
1 (50%)
(10)
Endocrine System None
General Body System None
Genital System Ovary (1) (1) (2)
Cyst 1 (100%)
Hematopoietic System Bone marrow (10) (10) (10) (10) (10) (10)
Pigmentation, hemosiderin 4 (40%) 8 (80%) 7 (70%) 10 (100%) 9 (90%) Erythroid cell, hyperplasia 2 (20%) Myeloid cell, hyperplasia, diffuse 1 (10%)
Spleen (10) (10) (10) (10) (10) (10) Hematopoietic cell proliferation 2 (20%) 7 (70%) 7 (70%) 10 (100%) 9 (90%) Pigmentation, hemosiderin 9 (90%) 10 (100%) 8 (80%) 10 (100%) 9 (90%)
Thymus (10) (1) (2) (10) Atrophy 1 (50%)
a Number of animals examined microscopically at the site and the number of animals with lesion

B-9 o-, m-, & p-Chloroaniline, NTP TOX 43
TABLE B4 Summary of the Incidence of Nonneoplastic Lesions in Female B6C3F Mice1
in the 13-Week Gavage Study of m-Chloroaniline (continued)
Vehicle Control 10 mg/kg 20 mg/kg 40 mg/kg 80 mg/kg 160 mg/kg
Integumentary System None
Musculoskeletal System None
Nervous System None
Respiratory System Lung (10) (1) (2) (10)
Foreign body 2 (100%) 1 (10%) Hemorrhage 1 (10%) Serosa, inflammation, suppurative 1 (100%) 2 (100%) 1 (10%)
Special Senses System None
Urinary System Kidney (10) (1) (2) (10)
Hyperplasia, lymphoid 1 (10%) Infarct 1 (10%) Cortex, pigmentation, hemosiderin 6 (60%)

B-10 o-, m-, & p-Chloroaniline, NTP TOX 43

C-1
APPENDIX C ORGAN WEIGHTS AND
ORGAN-WEIGHT-TO-BODY-WEIGHT RATIOS
TABLE C1 Organ Weights and Organ-Weight-to-Body-Weight Ratios for F344/N Rats in the 13-Week Gavage Study of o-Chloroaniline . . . . . . . . . . . . . . . . . . . . . . . . . . . . . . . . C-2
TABLE C2 Organ Weights and Organ-Weight-to-Body-Weight Ratios for F344/N Rats in the 13-Week Gavage Study of m-Chloroaniline . . . . . . . . . . . . . . . . . . . . . . . . . . . . . . . . C-3
TABLE C3 Organ Weights and Organ-Weight-to-Body-Weight Ratios for B6C3F Mice1
in the 13-Week Gavage Study of o-Chloroaniline . . . . . . . . . . . . . . . . . . . . . . . . . . . . . . . . C-4 TABLE C4 Organ Weights and Organ-Weight-to-Body-Weight Ratios for B6C3F Mice1
in the 13-Week Gavage Study of m-Chloroaniline . . . . . . . . . . . . . . . . . . . . . . . . . . . . . . . . C-5

C-2 o-, m-, & p-Chloroaniline, NTP TOX 43
TABLE C1 Organ Weights and Organ-Weight-to-Body-Weight Ratios for F344/N Rats in the 13-Week Gavage Study of o-Chloroanilinea
Vehicle Control 10 mg/kg 20 mg/kg 40 mg/kg 80 mg/kg 160 mg/kg
MALE
n 10 10 10 9 9 10 Necropsy body wt 334 ± 3 328 ± 6 334 ± 7 329 ± 4 319 ± 5 304 ± 5**
Heart Absolute 0.973 ± 0.017 0.972 ± 0.026 1.045 ± 0.027 1.009 ± 0.016 1.024 ± 0.028 0.950 ± 0.013 Relative 2.91 ± 0.04 2.96 ± 0.05 3.14 ± 0.07* 3.07 ± 0.05* 3.21 ± 0.07** 3.13 ± 0.06**
Right kidney Absolute 1.129 ± 0.024 1.110 ± 0.027 1.131 ± 0.029 1.148 ± 0.018 1.157 ± 0.024 1.115 ± 0.015 Relative 3.38 ± 0.06 3.38 ± 0.05 3.39 ± 0.04 3.49 ± 0.04 3.63 ± 0.05** 3.67 ± 0.04**
Liver Absolute 12.186 ± 0.363 12.169 ± 0.409 12.524 ± 0.428 12.655 ± 0.293 12.772 ± 0.335 11.478 ± 0.226 Relative 36.48 ± 0.95 37.02 ± 0.81 37.51 ± 0.84 38.44 ± 0.62 40.05 ± 0.88* 37.71 ± 0.41*
Lungs Absolute 1.362 ± 0.046b 1.556 ± 0.061 1.550 ± 0.059 1.461 ± 0.055 1.390 ± 0.063 1.376 ± 0.045 Relative 4.08 ± 0.13b 4.74 ± 0.17* 4.65 ± 0.17* 4.44 ± 0.14 4.35 ± 0.17 4.52 ± 0.14
Spleen Absolute 0.684 ± 0.014 0.663 ± 0.012 0.681 ± 0.018 0.750 ± 0.013 0.861 ± 0.043** 1.104 ± 0.024** Relative 2.05 ± 0.04 2.02 ± 0.02 2.05 ± 0.05 2.28 ± 0.03* 2.70 ± 0.13** 3.63 ± 0.06**
Right testis Absolute 1.483 ± 0.013 1.468 ± 0.020 1.507 ± 0.027 1.514 ± 0.029 1.448 ± 0.038 1.461 ± 0.019 Relative 4.44 ± 0.03 4.49 ± 0.10 4.53 ± 0.09 4.61 ± 0.12 4.54 ± 0.10 4.81 ± 0.06**
Thymus Absolute 0.301 ± 0.015 0.318 ± 0.018 0.325 ± 0.012 0.319 ± 0.010 0.310 ± 0.011 0.300 ± 0.012 Relative 0.90 ± 0.04 0.97 ± 0.06 0.97 ± 0.03 0.97 ± 0.03 0.98 ± 0.04 0.99 ± 0.04
FEMALE
n 10 10 9 10 10 10 Necropsy body wt 183 ± 3 189 ± 3 190 ± 3 176 ± 3 178 ± 2 174 ± 2*
Heart Absolute 0.608 ± 0.014 0.638 ± 0.015 0.654 ± 0.009 0.619 ± 0.011 0.627 ± 0.011 0.641 ± 0.018 Relative 3.32 ± 0.09 3.38 ± 0.09 3.45 ± 0.05 3.51 ± 0.05 3.52 ± 0.05 3.69 ± 0.08**
Right kidney Absolute 0.640 ± 0.011 0.650 ± 0.011 0.657 ± 0.009 0.615 ± 0.010 0.623 ± 0.007 0.621 ± 0.010 Relative 3.49 ± 0.05 3.44 ± 0.05 3.47 ± 0.04 3.50 ± 0.07 3.49 ± 0.03 3.58 ± 0.05
Liver Absolute 6.058 ± 0.123 6.341 ± 0.178 6.373 ± 0.139 6.000 ± 0.141 6.111 ± 0.087 6.082 ± 0.111 Relative 33.06 ± 0.66 33.55 ± 0.77 33.57 ± 0.44 34.03 ± 0.50 34.29 ± 0.47 35.05 ± 0.42*
Lungs Absolute 1.024 ± 0.029 1.092 ± 0.045 1.088 ± 0.066 1.006 ± 0.040 1.019 ± 0.036 1.021 ± 0.040 Relative 5.60 ± 0.19 5.77 ± 0.21 5.76 ± 0.41 5.69 ± 0.17 5.70 ± 0.16 5.89 ± 0.22
Spleen Absolute 0.419 ± 0.009 0.432 ± 0.007 0.459 ± 0.010* 0.460 ± 0.010* 0.594 ± 0.013** 0.907 ± 0.018** Relative 2.28 ± 0.03 2.29 ± 0.02 2.42 ± 0.04 2.61 ± 0.05** 3.33 ± 0.06** 5.23 ± 0.09**
Thymus Absolute 0.235 ± 0.010 0.232 ± 0.009 0.237 ± 0.008 0.222 ± 0.007 0.218 ± 0.008 0.230 ± 0.007 Relative 1.28 ± 0.05 1.23 ± 0.05 1.25 ± 0.03 1.26 ± 0.03 1.22 ± 0.04 1.33 ± 0.05
* Significantly different (P#0.05) from the vehicle control group by Williams' or Dunnett's test ** Significantly different (P#0.01) from the vehicle control group by Williams' test a Organ weights (absolute weights) and body weights are given in grams; organ-weight-to-body-weight ratios (relative weights) are given as mg organ
weight/g body weight (mean ± standard error).b n˘9

C-3 o-, m-, & p-Chloroaniline, NTP TOX 43
TABLE C2 Organ Weights and Organ-Weight-to-Body-Weight Ratios for F344/N Rats in the 13-Week Gavage Study of m-Chloroaniline a
Vehicle Control 10 mg/kg 20 mg/kg 40 mg/kg 80 mg/kg 160 mg/kg
MALE
n 10 10 10 10 10 10 Necropsy body wt 326 ± 6 327 ± 8 317 ± 7 325 ± 6 319 ± 6 293 ± 6**
Heart Absolute 0.961 ± 0.025 1.010 ± 0.039 0.988 ± 0.039 0.989 ± 0.025 1.041 ± 0.031 1.034 ± 0.028 Relative 2.94 ± 0.06 3.08 ± 0.06 3.11 ± 0.08 3.04 ± 0.05 3.26 ± 0.07** 3.54 ± 0.09**
Right kidney Absolute 1.096 ± 0.031 1.114 ± 0.044 1.070 ± 0.031 1.115 ± 0.027 1.126 ± 0.031 1.076 ± 0.027 Relative 3.36 ± 0.07 3.40 ± 0.06 3.37 ± 0.04 3.43 ± 0.03 3.53 ± 0.06* 3.68 ± 0.05**
Liver Absolute 11.940 ± 0.359 11.790 ± 0.537 11.651 ± 0.405 11.973 ± 0.476 12.023 ± 0.338 10.785 ± 0.355 Relative 36.65 ± 1.13 35.90 ± 0.83 36.67 ± 0.62 36.72 ± 0.97 37.69 ± 0.62 36.80 ± 0.66
Lungs Absolute 1.573 ± 0.048 1.568 ± 0.062 1.447 ± 0.075 1.442 ± 0.059 1.480 ± 0.066 1.296 ± 0.068** Relative 4.83 ± 0.15 4.81 ± 0.19 4.55 ± 0.18 4.45 ± 0.20 4.63 ± 0.16 4.43 ± 0.21
Spleen Absolute 0.701 ± 0.030 0.788 ± 0.015 0.859 ± 0.011* 1.275 ± 0.024** 2.483 ± 0.068** 3.373 ± 0.098** Relative 2.15 ± 0.10 2.42 ± 0.04 2.72 ± 0.05** 3.93 ± 0.07** 7.78 ± 0.11** 11.52 ± 0.18**
Right testis Absolute 1.467 ± 0.031 1.455 ± 0.025 1.457 ± 0.030 1.435 ± 0.029 1.516 ± 0.018 1.363 ± 0.054 Relative 4.51 ± 0.11 4.46 ± 0.05 4.61 ± 0.07 4.41 ± 0.06 4.76 ± 0.06 4.68 ± 0.22
Thymus Absolute 0.282 ± 0.017 0.293 ± 0.013 0.260 ± 0.010 0.283 ± 0.011 0.321 ± 0.016 0.298 ± 0.019 Relative 0.86 ± 0.04 0.89 ± 0.03 0.82 ± 0.03 0.87 ± 0.03 1.01 ± 0.05* 1.02 ± 0.06**
FEMALE
n 10 10 10 10 10 9 Necropsy body wt 183 ± 3 185 ± 3 186 ± 3 183 ± 2 179 ± 3 185 ± 3
Heart Absolute 0.631 ± 0.014 0.634 ± 0.011 0.637 ± 0.014 0.660 ± 0.010 0.648 ± 0.014 0.728 ± 0.016** Relative 3.47 ± 0.09 3.42 ± 0.04 3.43 ± 0.08 3.60 ± 0.05 3.63 ± 0.07 3.95 ± 0.08**
Right kidney Absolute 0.629 ± 0.008 0.627 ± 0.010 0.642 ± 0.009 0.644 ± 0.009 0.645 ± 0.013 0.681 ± 0.012** Relative 3.45 ± 0.06 3.39 ± 0.05 3.45 ± 0.04 3.52 ± 0.05 3.62 ± 0.06* 3.69 ± 0.04**
Liver Absolute 5.810 ± 0.153 6.171 ± 0.093 6.091 ± 0.122 6.099 ± 0.109 6.479 ± 0.319* 7.311 ± 0.147** Relative 31.81 ± 0.50 33.31 ± 0.47 32.83 ± 0.77 33.28 ± 0.43 36.26 ± 1.58** 39.62 ± 0.60**
Lungs Absolute 1.207 ± 0.033 1.109 ± 0.044b 1.082 ± 0.034* 1.100 ± 0.036* 0.991 ± 0.043** 1.105 ± 0.041** Relative 6.63 ± 0.23 6.00 ± 0.25b 5.84 ± 0.22* 6.01 ± 0.21* 5.56 ± 0.24** 5.98 ± 0.18**
Spleen Absolute 0.451 ± 0.017 0.504 ± 0.008 0.603 ± 0.015** 0.885 ± 0.015** 1.614 ± 0.050** 2.349 ± 0.046** Relative 2.47 ± 0.07 2.72 ± 0.04 3.25 ± 0.06** 4.83 ± 0.09** 9.04 ± 0.23** 12.75 ± 0.28**
Thymus Absolute 0.208 ± 0.007 0.242 ± 0.010 0.227 ± 0.009 0.215 ± 0.008 0.235 ± 0.010 0.244 ± 0.012* Relative 1.14 ± 0.04 1.31 ± 0.05 1.22 ± 0.04 1.17 ± 0.04 1.32 ± 0.05* 1.32 ± 0.07*
* Significantly different (P#0.05) from the vehicle control group by Williams' test ** P#0.01 a Organ weights (absolute weights) and body weights are given in grams; organ-weight-to-body-weight ratios (relative weights) are given as mg organ
weight/g body weight (mean ± standard error).b n˘9

C-4 o-, m-, & p-Chloroaniline, NTP TOX 43
TABLE C3 Organ Weights and Organ-Weight-to-Body-Weight Ratios for B6C3F Mice1
in the 13-Week Gavage Study of o-Chloroanilinea
Vehicle Control 10 mg/kg 20 mg/kg 40 mg/kg 80 mg/kg 160 mg/kg
MALE
n 9 9 10 9 10 9 Necropsy body wt 36.1 ± 1.3 34.7 ± 1.0 35.6 ± 1.0 35.0 ± 0.4 35.4 ± 0.6 33.4 ± 1.1
Heart Absolute 0.166 ± 0.004 0.172 ± 0.006 0.168 ± 0.005 0.171 ± 0.005 0.179 ± 0.005 0.173 ± 0.004 Relative 4.61 ± 0.10 4.99 ± 0.23 4.75 ± 0.13 4.88 ± 0.11 5.06 ± 0.21 5.22 ± 0.12*
Right kidney Absolute 0.309 ± 0.008 0.306 ± 0.008 0.293 ± 0.007 0.292 ± 0.008 0.300 ± 0.007 0.290 ± 0.007 Relative 8.60 ± 0.19 8.86 ± 0.29 8.28 ± 0.23 8.32 ± 0.19 8.49 ± 0.23 8.72 ± 0.22
Liver Absolute 1.777 ± 0.049 1.694 ± 0.061 1.769 ± 0.035 1.721 ± 0.037 1.782 ± 0.029 1.663 ± 0.042 Relative 49.33 ± 0.80 48.78 ± 1.08 49.83 ± 0.52 49.12 ± 0.89 50.33 ± 0.71 49.93 ± 0.80
Lungs Absolute 0.199 ± 0.005 0.212 ± 0.006 0.208 ± 0.007 0.206 ± 0.006 0.207 ± 0.007 0.200 ± 0.006 Relative 5.54 ± 0.20 6.16 ± 0.27 5.92 ± 0.30 5.89 ± 0.20 5.84 ± 0.22 6.05 ± 0.31
Spleen Absolute 0.074 ± 0.003 0.077 ± 0.003 0.077 ± 0.001 0.084 ± 0.003 0.109 ± 0.005** 0.155 ± 0.005** Relative 2.06 ± 0.09 2.22 ± 0.09 2.18 ± 0.07 2.39 ± 0.07 3.09 ± 0.17** 4.67 ± 0.15**
Right testis Absolute 0.119 ± 0.002 0.119 ± 0.004 0.122 ± 0.003 0.122 ± 0.003 0.122 ± 0.002 0.125 ± 0.004 Relative 3.31 ± 0.11 3.45 ± 0.13 3.44 ± 0.09 3.48 ± 0.06 3.44 ± 0.08 3.76 ± 0.12**
Thymus Absolute 0.052 ± 0.004 0.051 ± 0.004 0.053 ± 0.002 0.044 ± 0.003 0.049 ± 0.002 0.050 ± 0.004 Relative 1.43 ± 0.10 1.46 ± 0.10 1.48 ± 0.06 1.26 ± 0.09 1.37 ± 0.06 1.51 ± 0.14
FEMALE
n 10 10 9 10 10 9 Necropsy body wt 28.7 ± 0.7 30.8 ± 1.2 30.7 ± 0.6 28.5 ± 0.7 30.2 ± 0.6 27.8 ± 0.6
Heart Absolute 0.138 ± 0.003 0.152 ± 0.004 0.149 ± 0.005 0.142 ± 0.002 0.147 ± 0.003 0.154 ± 0.005** Relative 4.81 ± 0.10 4.97 ± 0.17 4.86 ± 0.17 4.99 ± 0.09 4.89 ± 0.10 5.54 ± 0.14**
Right kidney Absolute 0.200 ± 0.005 0.201 ± 0.004 0.207 ± 0.003 0.193 ± 0.005 0.202 ± 0.002 0.203 ± 0.004 Relative 6.97 ± 0.13 6.57 ± 0.18 6.75 ± 0.14 6.79 ± 0.13 6.72 ± 0.15 7.32 ± 0.09
Liver Absolute 1.426 ± 0.053 1.581 ± 0.055 1.507 ± 0.032 1.406 ± 0.050 1.511 ± 0.040 1.457 ± 0.046 Relative 49.64 ± 1.27 51.51 ± 0.97 49.27 ± 1.35 49.21 ± 0.93 50.08 ± 1.17 52.42 ± 1.06
Lungs Absolute 0.198 ± 0.007 0.211 ± 0.010 0.211 ± 0.007 0.205 ± 0.009 0.208 ± 0.007 0.209 ± 0.008 Relative 6.91 ± 0.26 6.88 ± 0.26 6.93 ± 0.30 7.18 ± 0.22 6.91 ± 0.22 7.51 ± 0.23
Spleen Absolute 0.093 ± 0.004 0.102 ± 0.004 0.111 ± 0.007 0.106 ± 0.004 0.131 ± 0.006** 0.205 ± 0.009** Relative 3.27 ± 0.16 3.32 ± 0.11 3.66 ± 0.29 3.74 ± 0.14 4.33 ± 0.18** 7.36 ± 0.24**
Thymus Absolute 0.052 ± 0.002 0.059 ± 0.004 0.054 ± 0.001 0.053 ± 0.002 0.055 ± 0.002 0.051 ± 0.002 Relative 1.84 ± 0.10 1.91 ± 0.07 1.76 ± 0.04 1.87 ± 0.06 1.82 ± 0.06 1.85 ± 0.07
* Significantly different (P#0.05) from the vehicle control group by Williams' test ** P#0.01 a Organ weights (absolute weights) and body weights are given in grams; organ-weight-to-body-weight ratios (relative weights) are given as mg organ
weight/g body weight (mean ± standard error).

C-5 o-, m-, & p-Chloroaniline, NTP TOX 43
TABLE C4 Organ Weights and Organ-Weight-to-Body-Weight Ratios for B6C3F Mice1
in the 13-Week Gavage Study of m-Chloroaniline a
Vehicle Control 10 mg/kg 20 mg/kg 40 mg/kg 80 mg/kg 160 mg/kg
MALE
n 9 10 7 10 10 10 Necropsy body wt 36.2 ± 0.9 35.4 ± 1.3 33.8 ± 0.6 34.4 ± 0.4 35.1 ± 0.3 35.6 ± 1.0
Heart Absolute 0.187 ± 0.007 0.176 ± 0.008 0.181 ± 0.006 0.175 ± 0.003 0.189 ± 0.008 0.189 ± 0.006 Relative 5.20 ± 0.22 4.99 ± 0.24 5.34 ± 0.14 5.10 ± 0.09 5.40 ± 0.20 5.31 ± 0.14
Right kidney Absolute 0.301 ± 0.008 0.297 ± 0.007 0.292 ± 0.010 0.301 ± 0.006 0.299 ± 0.006 0.297 ± 0.008 Relative 8.33 ± 0.27 8.43 ± 0.17 8.63 ± 0.23 8.75 ± 0.17 8.52 ± 0.13 8.35 ± 0.20
Liver Absolute 1.834 ± 0.044 1.824 ± 0.056 1.755 ± 0.047 1.795 ± 0.028 1.782 ± 0.023 1.807 ± 0.052 Relative 50.81 ± 1.34 51.75 ± 1.53 51.87 ± 0.88 52.24 ± 0.98 50.82 ± 0.36 50.82 ± 0.83
Lungs Absolute 0.249 ± 0.014 0.234 ± 0.012 0.225 ± 0.011 0.217 ± 0.010 0.223 ± 0.010b 0.215 ± 0.007* Relative 6.90 ± 0.42 6.68 ± 0.43 6.68 ± 0.36 6.33 ± 0.30 6.31 ± 0.25b 6.08 ± 0.25
Spleen Absolute 0.081 ± 0.002 0.081 ± 0.002 0.088 ± 0.005 0.111 ± 0.003** 0.163 ± 0.003** 0.295 ± 0.012** Relative 2.27 ± 0.09 2.32 ± 0.09 2.60 ± 0.15 3.25 ± 0.11** 4.65 ± 0.07** 8.32 ± 0.39**
Right testis Absolute 0.120 ± 0.003 0.121 ± 0.004 0.123 ± 0.002 0.124 ± 0.003 0.122 ± 0.002 0.119 ± 0.003 Relative 3.34 ± 0.09 3.44 ± 0.14 3.64 ± 0.07 3.59 ± 0.06 3.48 ± 0.05 3.34 ± 0.08
Thymus Absolute 0.043 ± 0.002 0.042 ± 0.002 0.040 ± 0.003 0.048 ± 0.003 0.044 ± 0.002 0.044 ± 0.002 Relative 1.21 ± 0.06 1.18 ± 0.05 1.17 ± 0.07 1.40 ± 0.08 1.27 ± 0.06 1.24 ± 0.04
FEMALE
n 9 9 10 8 10 9 Necropsy body wt 28.4 ± 0.7 28.8 ± 0.7 28.9 ± 0.8 29.9 ± 1.2 28.1 ± 0.5 28.0 ± 0.7
Heart Absolute 0.142 ± 0.004 0.154 ± 0.008 0.152 ± 0.005 0.151 ± 0.005 0.147 ± 0.003 0.155 ± 0.004 Relative 5.04 ± 0.20 5.37 ± 0.31 5.28 ± 0.19 5.09 ± 0.17 5.23 ± 0.13 5.56 ± 0.18
Right kidney Absolute 0.212 ± 0.006 0.211 ± 0.008 0.215 ± 0.003 0.211 ± 0.006 0.209 ± 0.003 0.221 ± 0.006 Relative 7.50 ± 0.26 7.34 ± 0.18 7.49 ± 0.18 7.11 ± 0.23 7.47 ± 0.12 7.95 ± 0.27
Liver Absolute 1.483 ± 0.031 1.530 ± 0.043 1.533 ± 0.051 1.515 ± 0.061 1.479 ± 0.035 1.523 ± 0.027 Relative 52.36 ± 1.36 53.21 ± 0.96 53.10 ± 1.10 50.84 ± 1.04 52.64 ± 0.78 54.67 ± 1.44
Lungs Absolute 0.218 ± 0.007 0.247 ± 0.012 0.232 ± 0.012 0.226 ± 0.014 0.222 ± 0.010 0.212 ± 0.008 Relative 7.69 ± 0.26 8.58 ± 0.35 8.07 ± 0.44 7.61 ± 0.49 7.91 ± 0.34 7.61 ± 0.32
Spleen Absolute 0.094 ± 0.003 0.104 ± 0.005 0.116 ± 0.004* 0.138 ± 0.004** 0.193 ± 0.009** 0.282 ± 0.009** Relative 3.33 ± 0.15 3.63 ± 0.13 4.05 ± 0.14* 4.67 ± 0.21** 6.87 ± 0.29** 10.11 ± 0.22**
Thymus Absolute 0.048 ± 0.001 0.053 ± 0.004 0.051 ± 0.003 0.053 ± 0.003 0.047 ± 0.002 0.048 ± 0.001 Relative 1.69 ± 0.05 1.87 ± 0.14 1.76 ± 0.09 1.79 ± 0.10 1.69 ± 0.06 1.71 ± 0.04
* Significantly different (P#0.05) from the vehicle control group by Williams' test ** P#0.01 a Organ weights (absolute weights) and body weights are given in grams; organ-weight-to-body-weight ratios (relative weights) are given as mg organ
weight/g body weight (mean ± standard error).b n˘9

C-6 o-, m-, & p-Chloroaniline, NTP TOX 43

D-1
APPENDIX D HEMATOLOGY AND CLINICAL CHEMISTRY
RESULTS
TABLE D1 Hematology and Clinical Chemistry Data for F344/N Rats in the 13-Week Gavage Study of o-Chloroaniline . . . . . . . . . . . . . . . . . . . . . . . . . . . . . . . . D-2
TABLE D2 Hematology and Clinical Chemistry Data for F344/N Rats in the 13-Week Gavage Study of m-Chloroaniline . . . . . . . . . . . . . . . . . . . . . . . . . . . . . . . . D-6
TABLE D3 Hematology and Clinical Chemistry Data for B6C3F Mice1
in the 13-Week Gavage Study of o-Chloroaniline . . . . . . . . . . . . . . . . . . . . . . . . . . . . . . . . D-10 TABLE D4 Hematology and Clinical Chemistry Data for B6C3F Mice1
in the 13-Week Gavage Study of m-Chloroaniline . . . . . . . . . . . . . . . . . . . . . . . . . . . . . . . . D-12
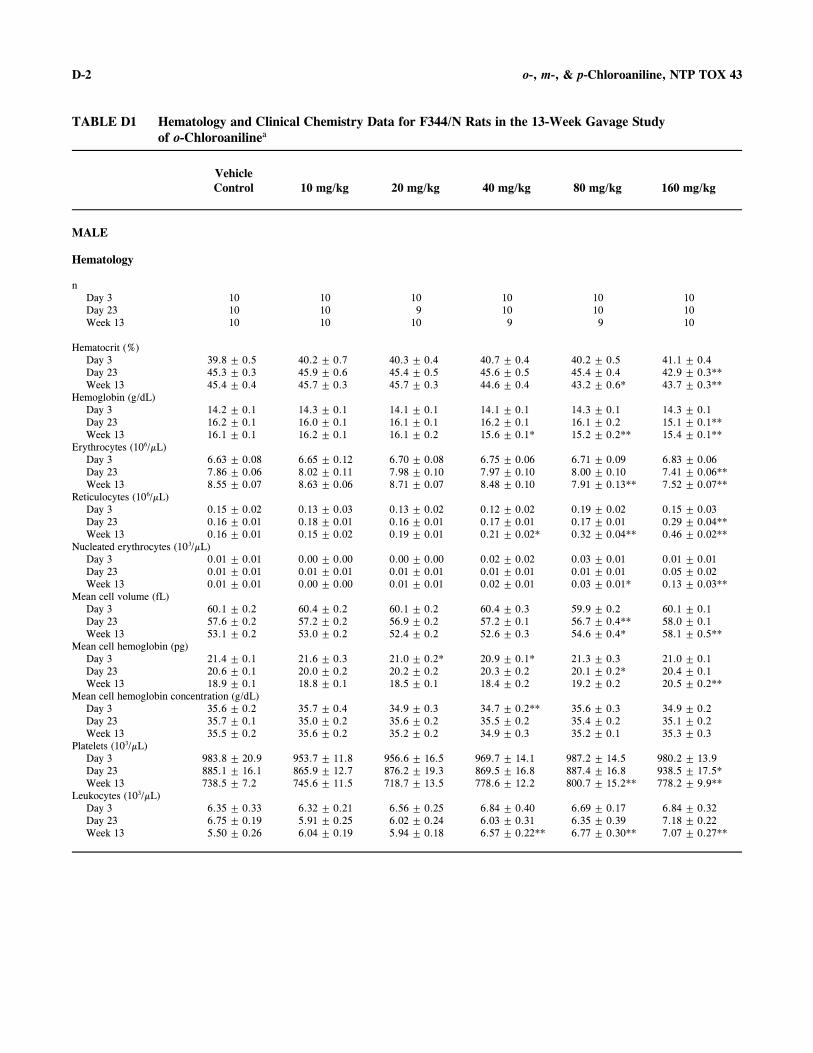
D-2 o-, m-, & p-Chloroaniline, NTP TOX 43
TABLE D1 Hematology and Clinical Chemistry Data for F344/N Rats in the 13-Week Gavage Study of o-Chloroanilinea
Vehicle Control 10 mg/kg 20 mg/kg 40 mg/kg 80 mg/kg 160 mg/kg
MALE
Hematology
n Day 3 10 10 10 10 10 10 Day 23 10 10 9 10 10 10 Week 13 10 10 10 9 9 10
Hematocrit (%) Day 3 39.8 ± 0.5 40.2 ± 0.7 40.3 ± 0.4 40.7 ± 0.4 40.2 ± 0.5 41.1 ± 0.4 Day 23 45.3 ± 0.3 45.9 ± 0.6 45.4 ± 0.5 45.6 ± 0.5 45.4 ± 0.4 42.9 ± 0.3** Week 13 45.4 ± 0.4 45.7 ± 0.3 45.7 ± 0.3 44.6 ± 0.4 43.2 ± 0.6* 43.7 ± 0.3**
Hemoglobin (g/dL) Day 3 14.2 ± 0.1 14.3 ± 0.1 14.1 ± 0.1 14.1 ± 0.1 14.3 ± 0.1 14.3 ± 0.1 Day 23 16.2 ± 0.1 16.0 ± 0.1 16.1 ± 0.1 16.2 ± 0.1 16.1 ± 0.2 15.1 ± 0.1** Week 13 16.1 ± 0.1 16.2 ± 0.1 16.1 ± 0.2 15.6 ± 0.1* 15.2 ± 0.2** 15.4 ± 0.1**
6Erythrocytes (10 /µL) Day 3 6.63 ± 0.08 6.65 ± 0.12 6.70 ± 0.08 6.75 ± 0.06 6.71 ± 0.09 6.83 ± 0.06 Day 23 7.86 ± 0.06 8.02 ± 0.11 7.98 ± 0.10 7.97 ± 0.10 8.00 ± 0.10 7.41 ± 0.06** Week 13 8.55 ± 0.07 8.63 ± 0.06 8.71 ± 0.07 8.48 ± 0.10 7.91 ± 0.13** 7.52 ± 0.07**
6Reticulocytes (10 /µL) Day 3 0.15 ± 0.02 0.13 ± 0.03 0.13 ± 0.02 0.12 ± 0.02 0.19 ± 0.02 0.15 ± 0.03 Day 23 0.16 ± 0.01 0.18 ± 0.01 0.16 ± 0.01 0.17 ± 0.01 0.17 ± 0.01 0.29 ± 0.04** Week 13 0.16 ± 0.01 0.15 ± 0.02 0.19 ± 0.01 0.21 ± 0.02* 0.32 ± 0.04** 0.46 ± 0.02**
Nucleated erythrocytes (10 /3 µL) Day 3 0.01 ± 0.01 0.00 ± 0.00 0.00 ± 0.00 0.02 ± 0.02 0.03 ± 0.01 0.01 ± 0.01 Day 23 0.01 ± 0.01 0.01 ± 0.01 0.01 ± 0.01 0.01 ± 0.01 0.01 ± 0.01 0.05 ± 0.02 Week 13 0.01 ± 0.01 0.00 ± 0.00 0.01 ± 0.01 0.02 ± 0.01 0.03 ± 0.01* 0.13 ± 0.03**
Mean cell volume (fL) Day 3 60.1 ± 0.2 60.4 ± 0.2 60.1 ± 0.2 60.4 ± 0.3 59.9 ± 0.2 60.1 ± 0.1 Day 23 57.6 ± 0.2 57.2 ± 0.2 56.9 ± 0.2 57.2 ± 0.1 56.7 ± 0.4** 58.0 ± 0.1 Week 13 53.1 ± 0.2 53.0 ± 0.2 52.4 ± 0.2 52.6 ± 0.3 54.6 ± 0.4* 58.1 ± 0.5**
Mean cell hemoglobin (pg) Day 3 21.4 ± 0.1 21.6 ± 0.3 21.0 ± 0.2* 20.9 ± 0.1* 21.3 ± 0.3 21.0 ± 0.1 Day 23 20.6 ± 0.1 20.0 ± 0.2 20.2 ± 0.2 20.3 ± 0.2 20.1 ± 0.2* 20.4 ± 0.1 Week 13 18.9 ± 0.1 18.8 ± 0.1 18.5 ± 0.1 18.4 ± 0.2 19.2 ± 0.2 20.5 ± 0.2**
Mean cell hemoglobin concentration (g/dL) Day 3 35.6 ± 0.2 35.7 ± 0.4 34.9 ± 0.3 34.7 ± 0.2** 35.6 ± 0.3 34.9 ± 0.2 Day 23 35.7 ± 0.1 35.0 ± 0.2 35.6 ± 0.2 35.5 ± 0.2 35.4 ± 0.2 35.1 ± 0.2 Week 13 35.5 ± 0.2 35.6 ± 0.2 35.2 ± 0.2 34.9 ± 0.3 35.2 ± 0.1 35.3 ± 0.3
3Platelets (10 /µL) Day 3 983.8 ± 20.9 953.7 ± 11.8 956.6 ± 16.5 969.7 ± 14.1 987.2 ± 14.5 980.2 ± 13.9 Day 23 885.1 ± 16.1 865.9 ± 12.7 876.2 ± 19.3 869.5 ± 16.8 887.4 ± 16.8 938.5 ± 17.5* Week 13 738.5 ± 7.2 745.6 ± 11.5 718.7 ± 13.5 778.6 ± 12.2 800.7 ± 15.2** 778.2 ± 9.9**
3Leukocytes (10 /µL) Day 3 6.35 ± 0.33 6.32 ± 0.21 6.56 ± 0.25 6.84 ± 0.40 6.69 ± 0.17 6.84 ± 0.32 Day 23 6.75 ± 0.19 5.91 ± 0.25 6.02 ± 0.24 6.03 ± 0.31 6.35 ± 0.39 7.18 ± 0.22 Week 13 5.50 ± 0.26 6.04 ± 0.19 5.94 ± 0.18 6.57 ± 0.22** 6.77 ± 0.30** 7.07 ± 0.27**
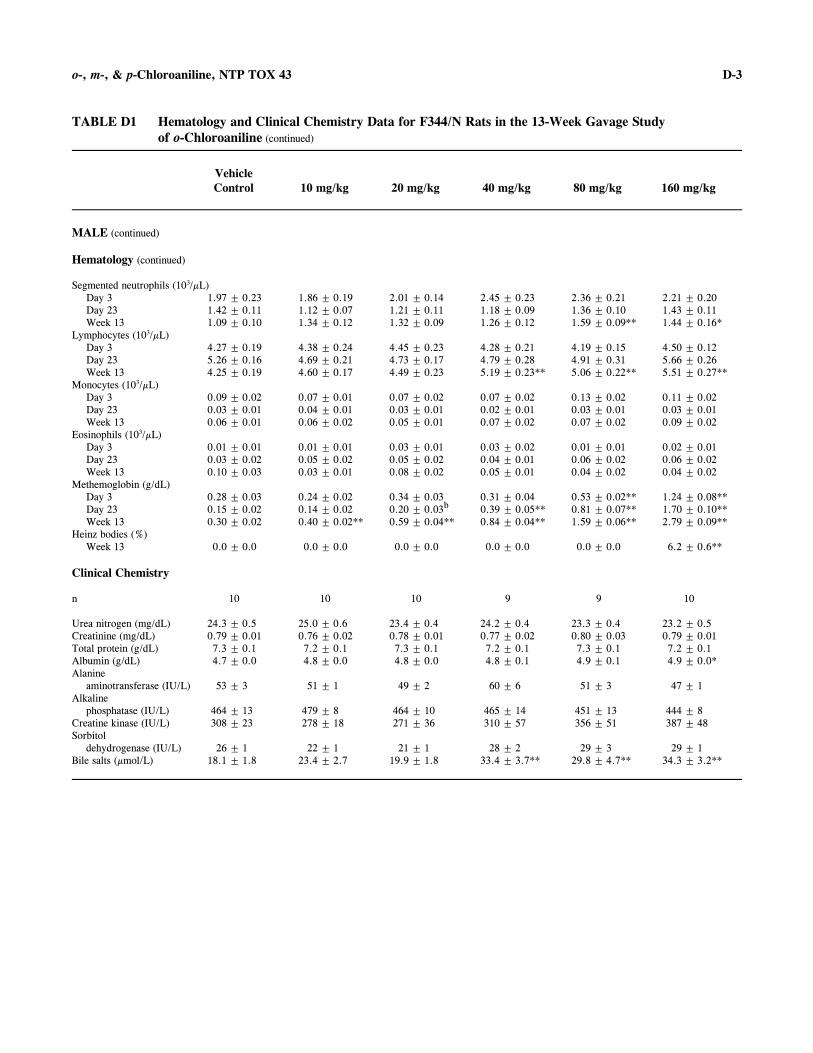
D-3 o-, m-, & p-Chloroaniline, NTP TOX 43
TABLE D1 Hematology and Clinical Chemistry Data for F344/N Rats in the 13-Week Gavage Study of o-Chloroaniline (continued)
Vehicle Control 10 mg/kg 20 mg/kg 40 mg/kg 80 mg/kg 160 mg/kg
MALE (continued)
Hematology (continued)
Segmented neutrophils (10 /µL)3
Day 3 1.97 ± 0.23 1.86 ± 0.19 2.01 ± 0.14 2.45 ± 0.23 2.36 ± 0.21 2.21 ± 0.20 Day 23 1.42 ± 0.11 1.12 ± 0.07 1.21 ± 0.11 1.18 ± 0.09 1.36 ± 0.10 1.43 ± 0.11 Week 13 1.09 ± 0.10 1.34 ± 0.12 1.32 ± 0.09 1.26 ± 0.12 1.59 ± 0.09** 1.44 ± 0.16*
Lymphocytes (10 /µL)3
Day 3 4.27 ± 0.19 4.38 ± 0.24 4.45 ± 0.23 4.28 ± 0.21 4.19 ± 0.15 4.50 ± 0.12 Day 23 5.26 ± 0.16 4.69 ± 0.21 4.73 ± 0.17 4.79 ± 0.28 4.91 ± 0.31 5.66 ± 0.26 Week 13 4.25 ± 0.19 4.60 ± 0.17 4.49 ± 0.23 5.19 ± 0.23** 5.06 ± 0.22** 5.51 ± 0.27**
Monocytes (10 /µL)3
Day 3 0.09 ± 0.02 0.07 ± 0.01 0.07 ± 0.02 0.07 ± 0.02 0.13 ± 0.02 0.11 ± 0.02 Day 23 0.03 ± 0.01 0.04 ± 0.01 0.03 ± 0.01 0.02 ± 0.01 0.03 ± 0.01 0.03 ± 0.01 Week 13 0.06 ± 0.01 0.06 ± 0.02 0.05 ± 0.01 0.07 ± 0.02 0.07 ± 0.02 0.09 ± 0.02
Eosinophils (10 /µL)3
Day 3 0.01 ± 0.01 0.01 ± 0.01 0.03 ± 0.01 0.03 ± 0.02 0.01 ± 0.01 0.02 ± 0.01 Day 23 0.03 ± 0.02 0.05 ± 0.02 0.05 ± 0.02 0.04 ± 0.01 0.06 ± 0.02 0.06 ± 0.02 Week 13 0.10 ± 0.03 0.03 ± 0.01 0.08 ± 0.02 0.05 ± 0.01 0.04 ± 0.02 0.04 ± 0.02
Methemoglobin (g/dL) Day 3 Day 23
0.28 ± 0.03 0.15 ± 0.02
0.24 ± 0.02 0.14 ± 0.02
0.34 ± 0.03 0.20 ± 0.03b
0.31 ± 0.04 0.39 ± 0.05**
0.53 ± 0.02** 0.81 ± 0.07**
1.24 ± 0.08** 1.70 ± 0.10**
Week 13 0.30 ± 0.02 0.40 ± 0.02** 0.59 ± 0.04** 0.84 ± 0.04** 1.59 ± 0.06** 2.79 ± 0.09** Heinz bodies (%)
Week 13 0.0 ± 0.0 0.0 ± 0.0 0.0 ± 0.0 0.0 ± 0.0 0.0 ± 0.0 6.2 ± 0.6**
Clinical Chemistry
n 10 10 10 9 9 10
Urea nitrogen (mg/dL) 24.3 ± 0.5 25.0 ± 0.6 23.4 ± 0.4 24.2 ± 0.4 23.3 ± 0.4 23.2 ± 0.5 Creatinine (mg/dL) 0.79 ± 0.01 0.76 ± 0.02 0.78 ± 0.01 0.77 ± 0.02 0.80 ± 0.03 0.79 ± 0.01 Total protein (g/dL) 7.3 ± 0.1 7.2 ± 0.1 7.3 ± 0.1 7.2 ± 0.1 7.3 ± 0.1 7.2 ± 0.1 Albumin (g/dL) 4.7 ± 0.0 4.8 ± 0.0 4.8 ± 0.0 4.8 ± 0.1 4.9 ± 0.1 4.9 ± 0.0* Alanine
aminotransferase (IU/L) 53 ± 3 51 ± 1 49 ± 2 60 ± 6 51 ± 3 47 ± 1 Alkaline
phosphatase (IU/L) 464 ± 13 479 ± 8 464 ± 10 465 ± 14 451 ± 13 444 ± 8 Creatine kinase (IU/L) 308 ± 23 278 ± 18 271 ± 36 310 ± 57 356 ± 51 387 ± 48 Sorbitol
dehydrogenase (IU/L) 26 ± 1 22 ± 1 21 ± 1 28 ± 2 29 ± 3 29 ± 1 Bile salts (µmol/L) 18.1 ± 1.8 23.4 ± 2.7 19.9 ± 1.8 33.4 ± 3.7** 29.8 ± 4.7** 34.3 ± 3.2**

D-4 o-, m-, & p-Chloroaniline, NTP TOX 43
TABLE D1 Hematology and Clinical Chemistry Data for F344/N Rats in the 13-Week Gavage Study of o-Chloroaniline (continued)
Vehicle Control 10 mg/kg 20 mg/kg 40 mg/kg 80 mg/kg 160 mg/kg
FEMALE
Hematology
n Day 3 10 10 10 10 10 10 Day 23 10 9 10 10 10 10 Week 13 10 10 9 10 10 10
Hematocrit (%) Day 3 41.9 ± 0.6 41.8 ± 0.4 42.8 ± 0.6 42.1 ± 0.5 43.2 ± 0.4 43.5 ± 0.5 Day 23 46.6 ± 0.6 45.9 ± 0.4 46.4 ± 0.3 45.7 ± 0.6 43.9 ± 0.5** 41.8 ± 0.3** Week 13 45.2 ± 0.4 45.1 ± 0.4 44.4 ± 0.4 44.2 ± 0.4 42.5 ± 0.4** 41.9 ± 0.3**
Hemoglobin (g/dL) Day 3 14.5 ± 0.2 14.6 ± 0.1 14.7 ± 0.2 14.6 ± 0.2 14.9 ± 0.1 14.9 ± 0.1 Day 23 16.3 ± 0.2 16.2 ± 0.1 16.4 ± 0.2 16.0 ± 0.2 15.0 ± 0.1** 14.6 ± 0.1** Week 13 15.7 ± 0.1 15.6 ± 0.1 15.2 ± 0.1* 15.0 ± 0.2** 14.3 ± 0.1** 14.6 ± 0.1**
Erythrocytes (10 /µL)6
Day 3 6.87 ± 0.11 6.86 ± 0.05 6.99 ± 0.10 6.87 ± 0.10 7.13 ± 0.10 7.23 ± 0.09* Day 23 7.74 ± 0.11 7.72 ± 0.05 7.79 ± 0.07 7.66 ± 0.10 7.27 ± 0.08** 6.57 ± 0.05** Week 13 7.78 ± 0.08 7.74 ± 0.05 7.53 ± 0.06** 7.34 ± 0.08** 6.82 ± 0.04** 6.41 ± 0.07**
Reticulocytes (10 /µL)6
Day 3 0.11 ± 0.01 0.11 ± 0.01 0.10 ± 0.01 0.10 ± 0.01 0.11 ± 0.01 0.11 ± 0.01 Day 23 0.15 ± 0.01 0.16 ± 0.01 0.17 ± 0.01 0.18 ± 0.02 0.27 ± 0.02** 0.48 ± 0.04** Week 13 0.13 ± 0.01 0.13 ± 0.01 0.18 ± 0.01** 0.19 ± 0.02** 0.34 ± 0.01** 0.47 ± 0.02**
Nucleated erythrocytes (10 /µL)3
Day 3 0.02 ± 0.01 0.00 ± 0.00 0.02 ± 0.01 0.03 ± 0.01 0.00 ± 0.00 0.01 ± 0.01 Day 23 0.01 ± 0.01 0.00 ± 0.00 0.01 ± 0.01 0.02 ± 0.01 0.08 ± 0.02** 0.21 ± 0.07** Week 13 0.03 ± 0.01 0.03 ± 0.01 0.06 ± 0.02 0.06 ± 0.02 0.12 ± 0.02** 0.34 ± 0.10**
Mean cell volume (fL) Day 3 61.1 ± 0.3 60.9 ± 0.3 61.2 ± 0.4 61.3 ± 0.4 60.6 ± 0.3 60.2 ± 0.3 Day 23 60.3 ± 0.3 59.5 ± 0.3 59.6 ± 0.4 59.7 ± 0.4 60.3 ± 0.2 63.7 ± 0.3** Week 13 58.1 ± 0.2 58.3 ± 0.3 59.0 ± 0.4 60.2 ± 0.2** 62.2 ± 0.3** 65.5 ± 0.2**
Mean cell hemoglobin (pg) Day 3 21.1 ± 0.1 21.4 ± 0.1 21.0 ± 0.1 21.3 ± 0.1 20.9 ± 0.2 20.6 ± 0.1* Day 23 21.1 ± 0.2 20.9 ± 0.2 21.0 ± 0.1 20.9 ± 0.1 20.7 ± 0.1 22.2 ± 0.1** Week 13 20.2 ± 0.1 20.2 ± 0.1 20.1 ± 0.1 20.5 ± 0.2 21.0 ± 0.1** 22.8 ± 0.2**
Mean cell hemoglobin concentration (g/dL) Day 3 34.5 ± 0.2 35.1 ± 0.3 34.4 ± 0.2 34.7 ± 0.1 34.4 ± 0.2 34.2 ± 0.2 Day 23 34.9 ± 0.2 35.2 ± 0.3 35.3 ± 0.2 35.1 ± 0.3 34.3 ± 0.2 34.9 ± 0.2 Week 13 34.7 ± 0.2 34.6 ± 0.2 34.2 ± 0.3 34.1 ± 0.2 33.7 ± 0.2* 34.8 ± 0.2
Platelets (10 /µL)3
Day 3 958.9 ± 16.8 941.5 ± 13.1 962.6 ± 14.9 938.2 ± 15.5 971.5 ± 19.7 991.7 ± 17.7 Day 23 887.3 ± 11.1 866.6 ± 16.4 847.0 ± 9.6 873.2 ± 13.2 957.8 ± 7.5** 930.7 ± 13.8* Week 13 721.5 ± 12.4 734.2 ± 13.7 769.6 ± 22.1** 803.1 ± 12.9** 862.2 ± 15.6** 801.2 ± 20.9**
Leukocytes (10 /µL)3
Day 3 6.75 ± 0.19 6.47 ± 0.28 6.88 ± 0.25 6.56 ± 0.38 6.59 ± 0.18 6.83 ± 0.29 Day 23 5.79 ± 0.24 5.39 ± 0.27 5.83 ± 0.16 5.75 ± 0.18 6.71 ± 0.22* 9.19 ± 0.63** Week 13 4.90 ± 0.22 5.20 ± 0.28 5.68 ± 0.20* 5.59 ± 0.35* 6.52 ± 0.38** 11.40 ± 1.23**

D-5 o-, m-, & p-Chloroaniline, NTP TOX 43
TABLE D1 Hematology and Clinical Chemistry Data for F344/N Rats in the 13-Week Gavage Study of o-Chloroaniline (continued)
Vehicle Control 10 mg/kg 20 mg/kg 40 mg/kg 80 mg/kg 160 mg/kg
FEMALE (continued)
Hematology (continued)
Segmented neutrophils (10 /µL)3
Day 3 1.35 ± 0.12 1.38 ± 0.19 1.34 ± 0.14 1.52 ± 0.18 1.38 ± 0.11 1.45 ± 0.17 Day 23 1.30 ± 0.13 1.19 ± 0.14 1.17 ± 0.07 0.94 ± 0.09 1.45 ± 0.11 1.65 ± 0.11 Week 13 1.13 ± 0.10 1.10 ± 0.09 1.07 ± 0.09 1.11 ± 0.08 1.50 ± 0.09* 2.37 ± 0.32**
Lymphocytes (10 /µL)3
Day 3 5.19 ± 0.16 4.98 ± 0.17 5.31 ± 0.15 4.93 ± 0.28 5.08 ± 0.21 5.24 ± 0.26 Day 23 4.29 ± 0.23 4.00 ± 0.23 4.43 ± 0.09 4.63 ± 0.18 5.02 ± 0.18* 7.29 ± 0.60** Week 13 3.64 ± 0.20 3.99 ± 0.21 4.50 ± 0.20** 4.39 ± 0.30** 4.89 ± 0.38** 8.84 ± 1.02**
Monocytes (10 /µL)3
Day 3 0.14 ± 0.02 0.06 ± 0.01 0.18 ± 0.03 0.09 ± 0.01 0.09 ± 0.02 0.12 ± 0.03 Day 23 0.16 ± 0.03 0.13 ± 0.03 0.16 ± 0.02 0.12 ± 0.02 0.16 ± 0.04 0.15 ± 0.03 Week 13 0.06 ± 0.02 0.04 ± 0.02 0.05 ± 0.02 0.06 ± 0.02 0.05 ± 0.02 0.12 ± 0.03
Eosinophils (10 /µL)3
Day 3 0.07 ± 0.02 0.05 ± 0.02 0.05 ± 0.02 0.03 ± 0.01* 0.03 ± 0.02* 0.01 ± 0.01** Day 23 0.05 ± 0.01 0.07 ± 0.01 0.10 ± 0.03 0.06 ± 0.01 0.08 ± 0.02 0.10 ± 0.04 Week 13 0.06 ± 0.02 0.07 ± 0.01 0.05 ± 0.01 0.04 ± 0.02 0.08 ± 0.02 0.06 ± 0.03
Methemoglobin (g/dL) Day 3 Day 23
0.19 ± 0.03 0.21 ± 0.03
0.24 ± 0.02 0.26 ± 0.03b
0.23 ± 0.03 0.47 ± 0.02**
0.46 ± 0.02** 0.94 ± 0.09**
1.11 ± 0.09** 1.69 ± 0.09**
1.92 ± 0.09** 2.46 ± 0.10**
Week 13 0.37 ± 0.04 0.54 ± 0.03** 0.83 ± 0.02** 1.53 ± 0.07** 2.35 ± 0.06** 2.80 ± 0.07** Heinz bodies (%)
Week 13 0.0 ± 0.0 0.0 ± 0.0 0.0 ± 0.0 0.0 ± 0.0 0.0 ± 0.0 10.7 ± 0.7**
Clinical Chemistry
n 10 10 9 10 10 10
Urea nitrogen (mg/dL) 22.6 ± 0.8 25.3 ± 0.4 24.7 ± 0.6 23.2 ± 0.7 22.0 ± 0.5 22.2 ± 0.8 Creatinine (mg/dL) 0.74 ± 0.02 0.77 ± 0.02 0.77 ± 0.02 0.78 ± 0.02 0.78 ± 0.02 0.77 ± 0.02 Total protein (g/dL) 7.1 ± 0.1 7.0 ± 0.1 7.3 ± 0.1 7.2 ± 0.1 7.1 ± 0.1 6.9 ± 0.1 Albumin (g/dL) 4.9 ± 0.1 4.9 ± 0.1 5.0 ± 0.1 4.9 ± 0.1 5.0 ± 0.1 4.9 ± 0.1 Alanine
aminotransferase (IU/L) 50 ± 3 53 ± 6 68 ± 10 60 ± 7 45 ± 2 42 ± 3 Alkaline
phosphatase (IU/L) 440 ± 38 409 ± 10 427 ± 6 435 ± 45 389 ± 9 378 ± 6* Creatine kinase (IU/L) 308 ± 35 243 ± 28 230 ± 17 321 ± 61 301 ± 33 274 ± 21 Sorbitol
dehydrogenase (IU/L) 22 ± 2 23 ± 2 31 ± 3* 31 ± 2** 30 ± 1** 28 ± 1** Bile salts (µmol/L) 35.5 ± 4.9 36.6 ± 3.3 38.1 ± 5.1 42.9 ± 5.7 51.4 ± 7.3 55.1 ± 5.9*
* Significantly different (P#0.05) from the vehicle control group by Dunn's or Shirley's test ** P#0.01 a Data are given as mean ± standard error. Statistical tests were performed on unrounded data. b n˘10

D-6 o-, m-, & p-Chloroaniline, NTP TOX 43
TABLE D2 Hematology and Clinical Chemistry Data for F344/N Rats in the 13-Week Gavage Study of m-Chloroanilinea
Vehicle Control 10 mg/kg 20 mg/kg 40 mg/kg 80 mg/kg 160 mg/kg
MALE
Hematology
n 10 10 10 10 10 10
Hematocrit (%) Day 3 42.5 ± 0.6 43.5 ± 0.7 44.6 ± 0.4 42.8 ± 0.4 42.5 ± 0.4 41.8 ± 0.5 Day 23 49.8 ± 1.4 46.0 ± 0.3 43.4 ± 0.2** 43.6 ± 0.3** 42.7 ± 0.5** 42.4 ± 0.4** Week 13 46.7 ± 0.8 46.0 ± 0.6 44.8 ± 0.4* 44.9 ± 0.9** 43.1 ± 0.5** 47.4 ± 1.0*
Hemoglobin (g/dL) Day 3 15.0 ± 0.2 15.1 ± 0.2 15.5 ± 0.2 14.7 ± 0.1 14.7 ± 0.1 14.6 ± 0.1 Day 23 17.6 ± 0.4 16.3 ± 0.1* 15.5 ± 0.1** 15.2 ± 0.1** 15.2 ± 0.2** 15.0 ± 0.1** Week 13 16.0 ± 0.3 15.8 ± 0.2 15.3 ± 0.1** 15.6 ± 0.3** 15.4 ± 0.1** 15.5 ± 0.3*
6Erythrocytes (10 /µL) Day 3 7.16 ± 0.11 7.39 ± 0.14 7.54 ± 0.07 7.24 ± 0.07 7.15 ± 0.08 6.94 ± 0.10 Day 23 8.81 ± 0.23 8.36 ± 0.07 7.84 ± 0.04** 7.53 ± 0.06** 6.73 ± 0.08** 5.52 ± 0.06** Week 13 8.89 ± 0.13 8.75 ± 0.11 8.33 ± 0.08** 7.79 ± 0.16** 6.62 ± 0.07** 5.83 ± 0.08**
6Reticulocytes (10 /µL) Day 3 0.29 ± 0.01 0.29 ± 0.02 0.30 ± 0.03 0.31 ± 0.03 0.37 ± 0.02* 0.40 ± 0.03* Day 23 0.16 ± 0.01 0.20 ± 0.01* 0.25 ± 0.02** 0.41 ± 0.03** 0.48 ± 0.03** 0.82 ± 0.06** Week 13 0.12 ± 0.01 0.18 ± 0.01** 0.21 ± 0.01** 0.36 ± 0.03** 0.57 ± 0.03** 1.85 ± 0.11**
Nucleated erythrocytes (10 /3 µL) Day 3 0.03 ± 0.01 0.01 ± 0.01 0.07 ± 0.04 0.04 ± 0.02 0.08 ± 0.03 0.26 ± 0.08** Day 23 0.01 ± 0.01 0.01 ± 0.01 0.03 ± 0.02 0.07 ± 0.03* 0.49 ± 0.15** 4.16 ± 0.32**b
Week 13 0.01 ± 0.01 0.01 ± 0.01 0.06 ± 0.02* 0.10 ± 0.03** 0.15 ± 0.04** 0.54 ± 0.07** Mean cell volume (fL)
Day 3 59.4 ± 0.3 58.8 ± 0.2 59.2 ± 0.2 59.1 ± 0.2 59.4 ± 0.2 60.3 ± 0.3 Day 23 56.5 ± 0.3 55.1 ± 0.1 55.4 ± 0.2 57.8 ± 0.1 63.4 ± 0.3** 76.9 ± 0.6** Week 13 52.5 ± 0.2 52.6 ± 0.2 53.8 ± 0.2** 57.6 ± 0.2** 65.2 ± 0.3** 81.3 ± 1.1**
Mean cell hemoglobin (pg) Day 3 20.9 ± 0.2 20.5 ± 0.2 20.5 ± 0.1 20.3 ± 0.2* 20.6 ± 0.1 21.0 ± 0.2 Day 23 19.9 ± 0.1 19.6 ± 0.1 19.8 ± 0.1 20.2 ± 0.2 22.7 ± 0.1** 27.1 ± 0.2** Week 13 18.0 ± 0.2 18.1 ± 0.1 18.4 ± 0.1 20.1 ± 0.1** 23.3 ± 0.2** 26.7 ± 0.3**
Mean cell hemoglobin concentration (g/dL) Day 3 35.3 ± 0.2 34.8 ± 0.3 34.7 ± 0.1* 34.3 ± 0.3** 34.6 ± 0.1** 34.8 ± 0.1* Day 23 35.3 ± 0.3 35.5 ± 0.2 35.8 ± 0.2 34.9 ± 0.2 35.7 ± 0.2 35.3 ± 0.2 Week 13 34.4 ± 0.2 34.3 ± 0.1 34.2 ± 0.2 34.9 ± 0.2 35.8 ± 0.2* 32.8 ± 0.3*
3Platelets (10 /µL) Day 3 932.3 ± 7.5 967.0 ± 17.2 959.7 ± 13.5 962.4 ± 12.1 1,003.3 ± 14.2** 1,139.3 ± 18.0** Day 23 817.0 ± 14.6 823.6 ± 14.4 871.2 ± 9.4 919.2 ± 15.3** 897.5 ± 17.0* 783.0 ± 12.1 Week 13 837.3 ± 80.7 833.9 ± 7.7 827.1 ± 13.5 784.1 ± 23.1 517.3 ± 8.5** 473.9 ± 10.5**
3Leukocytes (10 /µL) Day 3 6.61 ± 0.25 6.36 ± 0.32 8.08 ± 0.40* 6.88 ± 0.25 7.73 ± 0.33* 17.00 ± 0.91** Day 23 6.08 ± 0.31 6.58 ± 0.24 7.13 ± 0.23* 7.77 ± 0.42** 13.27 ± 0.57** 42.93 ± 1.70** Week 13 6.43 ± 0.99 6.95 ± 0.18 6.55 ± 0.29 6.28 ± 0.36 5.71 ± 0.42 5.94 ± 0.31

D-7 o-, m-, & p-Chloroaniline, NTP TOX 43
TABLE D2 Hematology and Clinical Chemistry Data for F344/N Rats in the 13-Week Gavage Study of m-Chloroaniline (continued)
Vehicle Control 10 mg/kg 20 mg/kg 40 mg/kg 80 mg/kg 160 mg/kg
MALE (continued)
Hematology (continued)
Segmented neutrophils (10 /µL)3
Day 3 1.58 ± 0.17 1.32 ± 0.15 1.84 ± 0.23 1.44 ± 0.12 1.73 ± 0.17 3.36 ± 0.50** Day 23 1.31 ± 0.11 1.31 ± 0.11 1.52 ± 0.13 1.69 ± 0.20 2.78 ± 0.10** 10.06 ± 0.84** Week 13 2.33 ± 0.77 1.91 ± 0.14 1.25 ± 0.13 1.50 ± 0.12 1.48 ± 0.21 1.79 ± 0.21
Lymphocytes (10 /µL)3
Day 3 4.98 ± 0.32 4.97 ± 0.25 6.14 ± 0.21** 5.34 ± 0.23 5.91 ± 0.33 13.34 ± 0.73** Day 23 4.61 ± 0.28 5.10 ± 0.20 5.36 ± 0.23 5.89 ± 0.30** 10.23 ± 0.62** 32.41 ± 1.26** Week 13 3.94 ± 0.28 4.94 ± 0.20** 5.21 ± 0.30** 4.63 ± 0.26 4.08 ± 0.25 4.08 ± 0.17
Monocytes (10 /µL)3
Day 3 0.05 ± 0.01 0.04 ± 0.02 0.05 ± 0.02 0.06 ± 0.02 0.05 ± 0.02 0.14 ± 0.02* Day 23 0.12 ± 0.03 0.13 ± 0.03 0.14 ± 0.03 0.16 ± 0.04 0.18 ± 0.05 0.33 ± 0.15 Week 13 0.07 ± 0.01 0.05 ± 0.02 0.06 ± 0.02 0.08 ± 0.02 0.10 ± 0.03 0.05 ± 0.02
Eosinophils (10 /µL)3
Day 3 0.00 ± 0.00 0.03 ± 0.01* 0.05 ± 0.02* 0.04 ± 0.03 0.04 ± 0.02 0.14 ± 0.05** Day 23 0.03 ± 0.01 0.05 ± 0.02 0.11 ± 0.03 0.03 ± 0.02 0.08 ± 0.03 0.13 ± 0.07 Week 13 0.08 ± 0.02 0.05 ± 0.01 0.03 ± 0.02 0.08 ± 0.03 0.06 ± 0.02 0.03 ± 0.01
Methemoglobin (g/dL) Day 3 0.39 ± 0.04 0.56 ± 0.05** 1.64 ± 0.15** 2.54 ± 0.17** 4.57 ± 0.26** 6.13 ± 0.09** Day 23 0.21 ± 0.03 0.80 ± 0.07** 1.70 ± 0.10** 3.12 ± 0.12** 4.79 ± 0.15** 5.11 ± 0.25** Week 13 0.31 ± 0.02 1.11 ± 0.06** 2.13 ± 0.06** 3.65 ± 0.19** 4.89 ± 0.20** 5.83 ± 0.18**
Heinz bodies (%) Week 13 0.0 ± 0.0 0.0 ± 0.0 0.0 ± 0.0 6.7 ± 0.9** 16.4 ± 1.1** 1.7 ± 0.6**
Clinical Chemistry
n 10 10 10 10 10 10
Urea nitrogen (mg/dL) 21.7 ± 0.7 21.9 ± 0.5 21.8 ± 0.5 21.1 ± 0.5 21.8 ± 0.4 21.7 ± 0.3 Creatinine (mg/dL) 0.69 ± 0.01 0.78 ± 0.02** 0.78 ± 0.01** 0.82 ± 0.01** 0.84 ± 0.02** 0.88 ± 0.01** Total protein (g/dL) 6.5 ± 0.3 6.9 ± 0.1 6.9 ± 0.1 6.8 ± 0.1 6.6 ± 0.1* 6.6 ± 0.0* Albumin (g/dL) 4.4 ± 0.2 4.8 ± 0.1 4.8 ± 0.0* 4.7 ± 0.0 4.7 ± 0.1 4.9 ± 0.0** Alanine
aminotransferase (IU/L) 52 ± 5 51 ± 3 45 ± 1* 46 ± 1* 45 ± 2* 40 ± 1** Alkaline
phosphatase (IU/L) 437 ± 30 442 ± 12 447 ± 13 416 ± 9* 438 ± 12 413 ± 13* Creatine kinase (IU/L) 401 ± 50 356 ± 33 394 ± 41 521 ± 52 396 ± 52 538 ± 39* Sorbitol
dehydrogenase (IU/L) 22 ± 1 30 ± 2** 29 ± 1** 33 ± 2** 41 ± 1** 43 ± 2** Bile salts (µmol/L) 11.1 ± 1.1 14.0 ± 1.8 13.4 ± 1.6 12.7 ± 1.0 16.1 ± 2.3* 28.1 ± 2.2**

D-8 o-, m-, & p-Chloroaniline, NTP TOX 43
TABLE D2 Hematology and Clinical Chemistry Data for F344/N Rats in the 13-Week Gavage Study of m-Chloroaniline (continued)
Vehicle Control 10 mg/kg 20 mg/kg 40 mg/kg 80 mg/kg 160 mg/kg
FEMALE
Hematology
n Day 3 10 10 10 10 10 10 Day 23 10 10 9 10 10 10 Week 13 10 10 10 10 10 9
Hematocrit (%) Day 3 44.8 ± 0.4 44.9 ± 0.6 44.7 ± 0.4 45.6 ± 0.4 43.6 ± 0.5 43.3 ± 0.5 Day 23 47.4 ± 0.4 46.3 ± 0.4 42.9 ± 0.5** 43.6 ± 0.5** 40.3 ± 0.5** 43.6 ± 0.5** Week 13 47.3 ± 0.7 45.3 ± 0.4* 45.0 ± 0.8* 43.5 ± 0.4** 42.0 ± 0.6** 44.6 ± 0.4**
Hemoglobin (g/dL) Day 3 15.6 ± 0.1 15.6 ± 0.2 15.4 ± 0.2 15.7 ± 0.2 14.9 ± 0.1** 15.4 ± 0.2* Day 23 16.3 ± 0.1 15.6 ± 0.1** 14.5 ± 0.1** 15.1 ± 0.1** 14.4 ± 0.1** 15.2 ± 0.1** Week 13 15.8 ± 0.2 15.3 ± 0.1 15.0 ± 0.3** 14.6 ± 0.2** 14.6 ± 0.2** 15.2 ± 0.1**
Erythrocytes (10 /µL)6
Day 3 7.27 ± 0.07 7.30 ± 0.08 7.30 ± 0.08 7.48 ± 0.09 7.06 ± 0.06 6.82 ± 0.07** Day 23 7.85 ± 0.07 7.69 ± 0.05 6.92 ± 0.07** 6.69 ± 0.07** 5.66 ± 0.05** 5.39 ± 0.09** Week 13 8.14 ± 0.11 7.63 ± 0.07** 7.40 ± 0.13** 6.71 ± 0.07** 5.85 ± 0.08** 5.40 ± 0.09**
Reticulocytes (10 /µL)6
Day 3 0.19 ± 0.01 0.20 ± 0.01 0.19 ± 0.01 0.20 ± 0.02 0.26 ± 0.02** 0.30 ± 0.02** Day 23 0.12 ± 0.01 0.15 ± 0.01* 0.34 ± 0.01** 0.38 ± 0.03** 0.68 ± 0.04** 1.12 ± 0.05** Week 13 0.10 ± 0.01 0.16 ± 0.01** 0.21 ± 0.02** 0.33 ± 0.03** 0.59 ± 0.04** 0.98 ± 0.08**
Nucleated erythrocytes (10 /µL)3
Day 3 0.02 ± 0.01 0.02 ± 0.01 0.03 ± 0.01 0.03 ± 0.02 0.06 ± 0.02 0.61 ± 0.20** Day 23 0.02 ± 0.01 0.01 ± 0.01 0.09 ± 0.03 0.20 ± 0.05** 1.57 ± 0.36** 1.35 ± 0.39** Week 13 0.01 ± 0.01 0.06 ± 0.03c 0.08 ± 0.03* 0.14 ± 0.04** 0.42 ± 0.10** 0.45 ± 0.19**
Mean cell volume (fL) Day 3 61.7 ± 0.3 61.6 ± 0.3 61.2 ± 0.3 61.0 ± 0.3 61.8 ± 0.3 63.5 ± 0.3** Day 23 60.4 ± 0.2 60.2 ± 0.3 62.0 ± 0.3** 65.2 ± 0.3** 71.3 ± 0.7** 81.1 ± 0.6** Week 13 58.2 ± 0.1 59.4 ± 0.1** 60.8 ± 0.2** 64.9 ± 0.2** 71.7 ± 0.3** 82.8 ± 0.8**
Mean cell hemoglobin (pg) Day 3 21.5 ± 0.1 21.4 ± 0.2 21.1 ± 0.1 21.0 ± 0.1* 21.1 ± 0.1 22.6 ± 0.1 Day 23 20.8 ± 0.1 20.3 ± 0.1 20.9 ± 0.1 22.6 ± 0.1** 25.4 ± 0.2** 28.3 ± 0.3** Week 13 19.4 ± 0.1 20.1 ± 0.2** 20.3 ± 0.2** 21.8 ± 0.1** 25.0 ± 0.2** 28.2 ± 0.3**
Mean cell hemoglobin concentration (g/dL) Day 3 34.9 ± 0.2 34.8 ± 0.3 34.5 ± 0.1 34.4 ± 0.2 34.1 ± 0.2 35.6 ± 0.2 Day 23 34.4 ± 0.2 33.7 ± 0.2 33.7 ± 0.2 34.6 ± 0.2 35.7 ± 0.5* 34.9 ± 0.2 Week 13 33.4 ± 0.2 33.9 ± 0.3 33.4 ± 0.2 33.6 ± 0.2 34.9 ± 0.2** 34.1 ± 0.2**
Platelets (10 /µL)3
Day 3 886.0 ± 13.7 876.8 ± 14.5 885.3 ± 19.9 928.4 ± 21.5 1,041.7 ± 20.3** 1,118.4 ± 14.0** Day 23 819.9 ± 14.3 844.1 ± 8.6 922.6 ± 9.9** 911.7 ± 18.3* 917.0 ± 10.9** 734.4 ± 9.0 Week 13 721.6 ± 28.5 810.7 ± 20.3 849.4 ± 24.0 805.6 ± 14.7 732.4 ± 70.8 575.8 ± 15.4*
Leukocytes (10 /µL)3
Day 3 Day 23 Week 13
7.56 ± 0.31 6.09 ± 0.26 5.58 ± 0.18
7.16 ± 0.23 6.57 ± 0.35 5.79 ± 0.49c
7.05 ± 0.57 7.29 ± 0.34* 6.15 ± 0.28
8.36 ± 0.41 8.87 ± 0.21** 7.22 ± 0.40**
11.88 ± 0.36** 26.77 ± 1.88**b
5.93 ± 0.42*b
34.22 ± 1.71** 39.18 ± 2.48** 7.94 ± 0.25**

D-9 o-, m-, & p-Chloroaniline, NTP TOX 43
TABLE D2 Hematology and Clinical Chemistry Data for F344/N Rats in the 13-Week Gavage Study of m-Chloroaniline (continued)
Vehicle Control 10 mg/kg 20 mg/kg 40 mg/kg 80 mg/kg 160 mg/kg
FEMALE (continued)
Hematology (continued)
Segmented neutrophils (10 /µL)3
Day 3 Day 23 Week 13
1.64 ± 0.17 1.28 ± 0.10 1.42 ± 0.16
1.48 ± 0.23 1.45 ± 0.11 1.68 ± 0.37c
1.58 ± 0.24 1.36 ± 0.14 1.33 ± 0.17
1.86 ± 0.23 1.53 ± 0.14 1.71 ± 0.19
2.93 ± 0.27** 4.85 ± 0.47**b
1.44 ± 0.12b
8.44 ± 0.85** 6.29 ± 0.63** 1.41 ± 0.11
Lymphocytes (10 /µL)3
Day 3 Day 23 Week 13
5.77 ± 0.22 4.70 ± 0.25 4.02 ± 0.17
5.57 ± 0.18 5.04 ± 0.30 3.98 ± 0.30c
5.39 ± 0.39 5.77 ± 0.31* 4.70 ± 0.15*
6.40 ± 0.30 7.20 ± 0.19** 5.38 ± 0.34**
8.78 ± 0.34** 21.49 ± 1.47**b
4.43 ± 0.35*b
25.11 ± 1.24** 32.35 ± 1.96** 6.46 ± 0.22**
Monocytes (10 /µL)3
Day 3 Day 23 Week 13
0.12 ± 0.03 0.06 ± 0.01 0.05 ± 0.01
0.08 ± 0.03 0.03 ± 0.01 0.07 ± 0.02c
0.05 ± 0.02 0.11 ± 0.03 0.06 ± 0.01
0.07 ± 0.03 0.08 ± 0.03 0.08 ± 0.02
0.06 ± 0.03 0.20 ± 0.08b
0.03 ± 0.02b
0.42 ± 0.14 0.20 ± 0.09 0.05 ± 0.02
Eosinophils (10 /µL)3
Day 3 Day 23 Week 13
0.03 ± 0.01 0.04 ± 0.02 0.09 ± 0.02
0.03 ± 0.01 0.06 ± 0.02 0.06 ± 0.02c
0.02 ± 0.01 0.05 ± 0.01 0.05 ± 0.02
0.04 ± 0.02 0.06 ± 0.02 0.05 ± 0.02
0.11 ± 0.03* 0.19 ± 0.09b
0.03 ± 0.01*b
0.17 ± 0.06 0.34 ± 0.10* 0.02 ± 0.01**
Methemoglobin (g/dL) Day 3 0.20 ± 0.04 0.62 ± 0.06** 1.94 ± 0.12** 3.95 ± 0.13** 6.09 ± 0.30** 7.32 ± 0.26** Day 23 0.30 ± 0.03 1.21 ± 0.09** 2.60 ± 0.11** 4.24 ± 0.13** 5.36 ± 0.13** 6.89 ± 0.16** Week 13 0.26 ± 0.02 1.54 ± 0.06** 2.95 ± 0.11** 4.72 ± 0.21** 5.68 ± 0.23** 6.56 ± 0.22**
Heinz bodies (%) Week 13 0.0 ± 0.0 0.0 ± 0.0 0.0 ± 0.0 3.3 ± 0.4** 10.0 ± 1.0** 13.5 ± 2.3**
Clinical Chemistry
n 10 10 10 10 10 9
Urea nitrogen (mg/dL) 23.0 ± 0.8 23.6 ± 0.7 23.2 ± 0.7 24.5 ± 0.8 23.2 ± 0.5 24.1 ± 0.5 Creatinine (mg/dL) 0.72 ± 0.01 0.79 ± 0.01** 0.78 ± 0.02** 0.86 ± 0.03** 0.82 ± 0.01** 0.83 ± 0.02** Total protein (g/dL) 7.1 ± 0.1 7.2 ± 0.1 6.8 ± 0.3 7.2 ± 0.1 6.8 ± 0.2 6.7 ± 0.1* Albumin (g/dL) 5.0 ± 0.0 5.2 ± 0.1 4.9 ± 0.2 5.2 ± 0.1 5.0 ± 0.1 5.0 ± 0.1 Alanine
aminotransferase (IU/L) 66 ± 7 53 ± 5 56 ± 10 52 ± 4 52 ± 5 39 ± 2** Alkaline
phosphatase (IU/L) 365 ± 13 374 ± 7 351 ± 25 351 ± 8 329 ± 13* 331 ± 13* Creatine kinase (IU/L) 292 ± 30 268 ± 24 344 ± 31 312 ± 29 342 ± 22 392 ± 37* Sorbitol
dehydrogenase (IU/L) 25 ± 2 32 ± 3* 36 ± 3** 40 ± 2** 41 ± 3** 40 ± 1** Bile salts (µmol/L) 25.8 ± 2.6 28.0 ± 3.0 27.6 ± 3.3 30.4 ± 3.6 38.5 ± 4.1* 47.5 ± 2.1**
* Significantly different (P#0.05) from the vehicle control group by Dunn's or Shirley's test ** P#0.01 a Data are given as mean ± standard error. Statistical tests were performed on unrounded data. b n˘9#
n˘8#c

D-10 o-, m-, & p-Chloroaniline, NTP TOX 43
TABLE D3 Hematology and Clinical Chemistry Data for B6C3F Mice in the 13-Week Gavage Study 1
of o-Chloroanilinea
Vehicle Control 10 mg/kg 20 mg/kg 40 mg/kg 80 mg/kg 160 mg/kg
MALE
Hematology
n 10 9 10 10 10 10
Hematocrit (%) 50.2 ± 0.5 51.1 ± 1.0 50.2 ± 0.7 48.2 ± 0.8 47.0 ± 0.7** 45.5 ± 0.7** Hemoglobin (g/dL) 16.6 ± 0.1 16.7 ± 0.3 16.6 ± 0.1 16.2 ± 0.2 16.1 ± 0.1 17.3 ± 0.3
6Erythrocytes (10 /µL) 10.10 ± 0.10 10.34 ± 0.21 10.16 ± 0.15 9.77 ± 0.16 9.37 ± 0.13** 9.10 ± 0.14** 6Reticulocytes (10 /µL) 0.24 ± 0.02 0.22 ± 0.02 0.28 ± 0.03 0.22 ± 0.02 0.38 ± 0.03** 0.65 ± 0.04**
Nucleated 3erythrocytes (10 /µL) 0.00 ± 0.00 0.00 ± 0.00 0.01 ± 0.01 0.00 ± 0.00 0.00 ± 0.00 0.00 ± 0.00
Mean cell volume (fL) 49.7 ± 0.1 49.4 ± 0.1 49.4 ± 0.3 49.3 ± 0.2 50.2 ± 0.2 50.0 ± 0.2 Mean cell
hemoglobin (pg) 16.5 ± 0.2 16.2 ± 0.2 16.3 ± 0.2 16.6 ± 0.1 17.2 ± 0.2* 19.0 ± 0.2** Mean cell hemoglobin
concentration (g/dL) 33.1 ± 0.4 32.8 ± 0.3 33.1 ± 0.3 33.7 ± 0.3 34.3 ± 0.3* 37.9 ± 0.4** 3Platelets (10 /µL) 1,092.3 ± 43.1 1,050.1 ± 29.1 1,050.2 ± 11.0 1,025.7 ± 22.4 1,041.6 ± 10.8 989.6 ± 30.6
3Leukocytes (10 /µL) 5.42 ± 0.22 5.33 ± 0.24 5.45 ± 0.24 5.52 ± 0.37 6.09 ± 0.58 7.23 ± 0.94 Segmented
3 bneutrophils (10 /µL) 1.46 ± 0.24 1.30 ± 0.11 1.61 ± 0.12 1.73 ± 0.20 1.80 ± 0.18 2.17 ± 0.49 3Lymphocytes (10 /µL) 3.80 ± 0.13 3.96 ± 0.21 3.79 ± 0.17 3.65 ± 0.24 3.52 ± 0.28 4.90 ± 0.65
3Monocytes (10 /µL) 0.00 ± 0.00 0.00 ± 0.00 0.01 ± 0.01 0.02 ± 0.01 0.01 ± 0.01 0.00 ± 0.00 3 bEosinophils (10 /µL) 0.16 ± 0.03 0.08 ± 0.03 0.04 ± 0.01* 0.13 ± 0.03 0.10 ± 0.02 0.16 ± 0.04
Methemoglobin (g/dL) 0.15 ± 0.02 0.24 ± 0.03* 0.27 ± 0.03** 0.44 ± 0.03** 0.79 ± 0.04**b 2.12 ± 0.32** Heinz bodies (%) 0.0 ± 0.0 0.0 ± 0.0 0.0 ± 0.0 0.0 ± 0.0 0.1 ± 0.1 6.4 ± 0.8**
Clinical Chemistry
n 9 9 10 9 10 9
Urea nitrogen (mg/dL) 45.1 ± 3.2 41.8 ± 3.5 39.4 ± 1.9 42.4 ± 2.9 41.2 ± 2.9 44.0 ± 2.7 Creatinine (mg/dL) 0.47 ± 0.02 0.44 ± 0.02 0.43 ± 0.02 0.42 ± 0.02 0.41 ± 0.02 0.43 ± 0.02 Total protein (g/dL) 4.9 ± 0.1 5.0 ± 0.1 4.9 ± 0.1 5.0 ± 0.1 4.9 ± 0.1 4.7 ± 0.1 Albumin (g/dL) 3.4 ± 0.1 3.3 ± 0.1 3.4 ± 0.0 3.3 ± 0.0 3.3 ± 0.1 3.2 ± 0.0* Alanine
aminotransferase (IU/L) 142 ± 13 167 ± 23 162 ± 18 163 ± 21 142 ± 15 136 ± 10 Alkaline
phosphatase (IU/L) 138 ± 5 137 ± 4 133 ± 4 130 ± 4 133 ± 4 133 ± 4 Creatine kinase (IU/L) 1,950 ± 586c 1,125 ± 318d 1,068 ± 192 1,193 ± 294 2,486 ± 406 1,811 ± 351 Sorbitol
cdehydrogenase (IU/L) 85 ± 2 84 ± 5 80 ± 4 78 ± 3 80 ± 4 79 ± 5 cBile salts (µmol/L) 8.7 ± 0.5 9.6 ± 1.3 7.6 ± 0.5 8.5 ± 0.3 10.4 ± 1.3 8.9 ± 1.2

D-11 o-, m-, & p-Chloroaniline, NTP TOX 43
TABLE D3 Hematology and Clinical Chemistry Data for B6C3F Mice in the 13-Week Gavage Study 1
of o-Chloroaniline (continued)
Vehicle Control 10 mg/kg 20 mg/kg 40 mg/kg 80 mg/kg 160 mg/kg
FEMALE
Hematology
n 10 10 9 10 10 9
Hematocrit (%) 47.7 ± 0.9 46.7 ± 0.6 46.5 ± 0.7 46.8 ± 0.5 45.4 ± 0.3* 44.4 ± 0.6** Hemoglobin (g/dL) 16.7 ± 0.3 16.2 ± 0.1 15.9 ± 0.1* 16.1 ± 0.1* 15.6 ± 0.1** 16.3 ± 0.2*
6Erythrocytes (10 /µL) 9.59 ± 0.21 9.46 ± 0.13 9.36 ± 0.11 9.45 ± 0.11 9.19 ± 0.07 8.80 ± 0.11** 6Reticulocytes (10 /µL) 0.29 ± 0.02 0.30 ± 0.03 0.31 ± 0.03 0.34 ± 0.02 0.38 ± 0.03 0.71 ± 0.06**
Nucleated 3erythrocytes (10 /µL) 0.00 ± 0.00 0.00 ± 0.00 0.00 ± 0.00 0.00 ± 0.00 0.00 ± 0.00 0.00 ± 0.00
Mean cell volume (fL) 49.7 ± 0.2 49.5 ± 0.2 49.7 ± 0.2 49.5 ± 0.2 49.4 ± 0.1 50.5 ± 0.3 Mean cell
hemoglobin (pg) 17.4 ± 0.2 17.2 ± 0.1 17.0 ± 0.1 17.1 ± 0.1 17.0 ± 0.1 18.6 ± 0.1* Mean cell hemoglobin
concentration (g/dL) 35.0 ± 0.2 34.7 ± 0.2 34.3 ± 0.3 34.5 ± 0.2 34.4 ± 0.1 36.8 ± 0.2 3Platelets (10 /µL) 965.7 ± 32.2 899.1 ± 20.7 951.1 ± 34.0 899.0 ± 16.1 933.3 ± 18.4 974.7 ± 20.5
3Leukocytes (10 /µL) 4.76 ± 0.26 4.87 ± 0.23 4.50 ± 0.38 4.31 ± 0.24 4.95 ± 0.23 7.31 ± 0.77** Segmented
3neutrophils (10 /µL) 1.17 ± 0.13 1.34 ± 0.16 1.38 ± 0.26 1.16 ± 0.18 1.39 ± 0.17 3.29 ± 0.68** 3Lymphocytes (10 /µL) 3.45 ± 0.21 3.44 ± 0.17 2.97 ± 0.15 3.06 ± 0.18 3.48 ± 0.21 3.89 ± 0.32
3Monocytes (10 /µL) 0.04 ± 0.02 0.02 ± 0.01 0.01 ± 0.01 0.01 ± 0.01 0.02 ± 0.02 0.02 ± 0.01 3Eosinophils (10 /µL) 0.11 ± 0.03 0.07 ± 0.02 0.14 ± 0.04 0.08 ± 0.01 0.06 ± 0.02 0.11 ± 0.02
Methemoglobin (g/dL) 0.14 ± 0.02 0.22 ± 0.02* 0.24 ± 0.02** 0.48 ± 0.03** 1.08 ± 0.13** 2.39 ± 0.16** Heinz bodies (%) 0.0 ± 0.0 0.0 ± 0.0 0.0 ± 0.0 0.0 ± 0.0 0.0 ± 0.0 6.4 ± 0.5**
Clinical Chemistry
n 10 10 8 10 10 9
Urea nitrogen (mg/dL) 33.9 ± 4.4b 29.2 ± 1.4 37.3 ± 3.3 37.2 ± 4.0 37.3 ± 2.1 33.1 ± 2.7 Creatinine (mg/dL) 0.44 ± 0.02b 0.41 ± 0.02 0.43 ± 0.02 0.44 ± 0.02 0.42 ± 0.01 0.42 ± 0.02 Total protein (g/dL) 5.1 ± 0.1 5.1 ± 0.1 4.9 ± 0.1 5.0 ± 0.1 4.8 ± 0.1* 4.8 ± 0.1* Albumin (g/dL) 3.7 ± 0.1b 3.7 ± 0.1 3.4 ± 0.1 3.6 ± 0.0 3.5 ± 0.1 3.5 ± 0.1* Alanine
aminotransferase (IU/L) 100 ± 4b 111 ± 14 123 ± 26 139 ± 16 104 ± 15 99 ± 10 Alkaline
phosphatase (IU/L) 206 ± 9 193 ± 7 191 ± 11b 203 ± 6 179 ± 6 188 ± 7 c b e c bCreatine kinase (IU/L) 553 ± 162 459 ± 133 307 ± 38 928 ± 250 667 ± 88 867 ± 187
Sorbitol dehydrogenase (IU/L) 57 ± 2 58 ± 1 57 ± 2b 66 ± 6 63 ± 2* 62 ± 3
Bile salts (µmol/L) 11.5 ± 0.3 11.1 ± 0.4b 11.8 ± 1.3b 11.9 ± 1.1 14.7 ± 1.3 11.3 ± 0.5
* Significantly different (P#0.05) from the vehicle control group by Dunn's or Shirley's test ** Significantly different (P#0.01) from the vehicle control group by Shirley's test a Data are given as mean ± standard error. Statistical tests were performed on unrounded data. b n˘9#
n˘8#d n˘6 e n˘4
c

D-12
10
o-, m-, & p-Chloroaniline, NTP TOX 43
TABLE D4 Hematology and Clinical Chemistry Data for B6C3F Mice in the 13-Week Gavage Study 1
of m-Chloroanilinea
Vehicle Control 10 mg/kg 20 mg/kg 40 mg/kg 80 mg/kg 160 mg/kg
MALE
n 9 10 7 10 10
Hematology
Hematocrit (%) 49.9 ± 0.6 49.2 ± 0.6 46.9 ± 0.3** 45.2 ± 0.3** 44.4 ± 0.7** 42.1 ± 0.5** Hemoglobin (g/dL) 16.8 ± 0.1 16.6 ± 0.1 15.8 ± 0.1* 15.8 ± 0.3** 16.3 ± 0.1 17.3 ± 0.2
6Erythrocytes (10 /µL) 10.24 ± 0.13 10.15 ± 0.12 9.57 ± 0.09** 9.18 ± 0.07** 9.08 ± 0.15** 8.52 ± 0.12** 6Reticulocytes (10 /µL) 0.20 ± 0.01 0.24 ± 0.02 0.20 ± 0.02 0.33 ± 0.04** 0.38 ± 0.03** 0.95 ± 0.08**
Nucleated 3erythrocytes (10 /µL) 0.00 ± 0.00 0.00 ± 0.00 0.00 ± 0.00 0.00 ± 0.00 0.00 ± 0.00 0.00 ± 0.00
Mean cell volume (fL) 48.7 ± 0.2 48.5 ± 0.2 49.0 ± 0.2 49.2 ± 0.2 48.9 ± 0.1 49.4 ± 0.4* Mean cell
hemoglobin (pg) 16.4 ± 0.1 16.4 ± 0.1 16.5 ± 0.1 17.2 ± 0.4* 18.0 ± 0.2** 20.3 ± 0.4** Mean cell hemoglobin
concentration (g/dL) 33.7 ± 0.2 33.7 ± 0.2 33.8 ± 0.2 34.9 ± 0.7* 36.7 ± 0.4** 41.1 ± 0.7** 3Platelets (10 /µL) 1,126 ± 27 1,062 ± 14 1,021 ± 11** 1,072 ± 26 1,050 ± 17 1,112 ± 19
3Leukocytes (10 /µL) 6.46 ± 0.52 5.14 ± 0.36 5.40 ± 0.67 6.65 ± 0.54 5.89 ± 0.26 7.36 ± 0.60 Segmented
3neutrophils (10 /µL) 1.56 ± 0.20 1.30 ± 0.19 1.34 ± 0.17 1.86 ± 0.38 1.11 ± 0.14 1.17 ± 0.20 3Lymphocytes (10 /µL) 4.73 ± 0.35 3.72 ± 0.30 3.95 ± 0.66 4.67 ± 0.29 4.67 ± 0.21 6.07 ± 0.48
3Monocytes (10 /µL) 0.00 ± 0.00 0.00 ± 0.00 0.00 ± 0.00 0.01 ± 0.01 0.01 ± 0.01 0.00 ± 0.00 3Eosinophils (10 /µL) 0.17 ± 0.04 0.11 ± 0.04 0.11 ± 0.03 0.11 ± 0.02 0.11 ± 0.03 0.12 ± 0.03
Methemoglobin (g/dL) 0.19 ± 0.03 0.28 ± 0.04 0.50 ± 0.08** 1.72 ± 0.27** 3.22 ± 0.39** 3.77 ± 0.09** Heinz bodies (%) 0.0 ± 0.0 0.0 ± 0.0 0.0 ± 0.0 1.4 ± 1.4 2.4 ± 0.7** 13.8 ± 3.5**
Clinical Chemistry
Urea nitrogen (mg/dL) 31.0 ± 1.6 28.3 ± 1.4 36.1 ± 4.3 29.0 ± 1.6 32.1 ± 1.8 32.7 ± 2.6 Creatinine (mg/dL) 0.40 ± 0.00 0.40 ± 0.00 0.43 ± 0.02* 0.42 ± 0.01 0.41 ± 0.01 0.43 ± 0.02 Total protein (g/dL) 5.0 ± 0.1 5.1 ± 0.1 5.1 ± 0.1 5.1 ± 0.1 5.0 ± 0.1 4.8 ± 0.1 Albumin (g/dL) 3.5 ± 0.1 3.6 ± 0.1 3.5 ± 0.1 3.5 ± 0.1 3.5 ± 0.0 3.4 ± 0.0* Alanine
aminotransferase (IU/L) 173 ± 31 153 ± 25 195 ± 32 189 ± 40 175 ± 40 166 ± 22 Alkaline
phosphatase (IU/L) 134 ± 3 128 ± 3 134 ± 7 129 ± 5 121 ± 3* 110 ± 2** Creatine kinase (IU/L) 528 ± 123 387 ± 85 398 ± 124b 392 ± 77 309 ± 53c 478 ± 120 Sorbitol
c c cdehydrogenase (IU/L) 67 ± 3 63 ± 3 68 ± 5 63 ± 2 74 ± 10 65 ± 3 Bile salts (µmol/L) 14.4 ± 1.1 14.9 ± 1.1 17.6 ± 2.3 14.0 ± 1.1 14.5 ± 1.4 14.1 ± 1.1

D-13 o-, m-, & p-Chloroaniline, NTP TOX 43
TABLE D4 Hematology and Clinical Chemistry Data for B6C3F Mice in the 13-Week Gavage Study 1
of m-Chloroaniline (continued)
Vehicle Control 10 mg/kg 20 mg/kg 40 mg/kg 80 mg/kg 160 mg/kg
FEMALE
n 9 9 10 8 10 9
Hematology
Hematocrit (%) 47.4 ± 0.4 48.3 ± 0.5 47.6 ± 0.4 45.9 ± 0.4* 43.9 ± 0.3** 44.0 ± 0.6** Hemoglobin (g/dL) 16.3 ± 0.1 16.4 ± 0.1 16.2 ± 0.1 15.7 ± 0.1 15.8 ± 0.2 16.8 ± 0.2
6Erythrocytes (10 /µL) 9.62 ± 0.10 9.89 ± 0.11 9.76 ± 0.12 9.38 ± 0.08 9.00 ± 0.06** 8.95 ± 0.13** 6Reticulocytes (10 /µL) 0.19 ± 0.02 0.24 ± 0.01 0.26 ± 0.01* 0.30 ± 0.02** 0.57 ± 0.03** 0.99 ± 0.11**
Nucleated 3erythrocytes (10 /µL) 0.00 ± 0.00 0.00 ± 0.00 0.00 ± 0.00 0.00 ± 0.00 0.00 ± 0.00 0.00 ± 0.00
Mean cell volume (fL) 49.2 ± 0.2 48.9 ± 0.1 48.8 ± 0.3 48.9 ± 0.2 48.7 ± 0.2 49.1 ± 0.4 Mean cell
hemoglobin (pg) 16.9 ± 0.1 16.6 ± 0.1 16.6 ± 0.2 16.8 ± 0.1 17.6 ± 0.2* 18.8 ± 0.2** Mean cell hemoglobin
concentration (g/dL) 34.3 ± 0.2 33.9 ± 0.1 34.0 ± 0.2 34.3 ± 0.1 36.0 ± 0.3** 38.3 ± 0.4** 3Platelets (10 /µL) 979.3 ± 17.7 928.6 ± 16.0 991.7 ± 15.8 983.0 ± 20.3 984.9 ± 25.9 997.4 ± 31.9
3Leukocytes (10 /µL) 4.53 ± 0.40 4.79 ± 0.32 5.04 ± 0.43 4.80 ± 0.18 5.17 ± 0.33 6.38 ± 0.53** Segmented
3neutrophils (10 /µL) 0.95 ± 0.24 1.37 ± 0.24 1.32 ± 0.24 1.18 ± 0.20 1.00 ± 0.11 1.46 ± 0.28 3Lymphocytes (10 /µL) 3.52 ± 0.28 3.38 ± 0.23 3.65 ± 0.30 3.57 ± 0.18 4.10 ± 0.35* 4.79 ± 0.39**
3Monocytes (10 /µL) 0.00 ± 0.00 0.00 ± 0.00 0.00 ± 0.00 0.00 ± 0.00 0.00 ± 0.00 0.02 ± 0.01* 3Eosinophils (10 /µL) 0.07 ± 0.02 0.04 ± 0.01 0.07 ± 0.02 0.06 ± 0.02 0.07 ± 0.02 0.11 ± 0.03
Methemoglobin (g/dL) 0.18 ± 0.03 0.30 ± 0.03* 0.60 ± 0.04** 1.86 ± 0.29** 3.62 ± 0.21** 4.60 ± 0.19** Heinz bodies (%) 0.0 ± 0.0 0.0 ± 0.0 0.0 ± 0.0 0.0 ± 0.0 1.8 ± 0.6** 5.4 ± 1.4**
Clinical Chemistry
Urea nitrogen (mg/dL) 25.8 ± 1.0 25.3 ± 2.1 27.7 ± 2.3 25.6 ± 1.7 27.8 ± 1.7 31.4 ± 1.2* Creatinine (mg/dL) 0.41 ± 0.01 0.42 ± 0.02 0.43 ± 0.02 0.44 ± 0.02 0.45 ± 0.02 0.50 ± 0.02** Total protein (g/dL) 5.0 ± 0.1 5.1 ± 0.1 5.0 ± 0.1 5.1 ± 0.1 4.9 ± 0.1 4.7 ± 0.1 Albumin (g/dL) 3.6 ± 0.1 3.7 ± 0.1 3.6 ± 0.1 3.8 ± 0.0 3.6 ± 0.1 3.5 ± 0.1 Alanine
aminotransferase (IU/L) 118 ± 15d 125 ± 23 111 ± 14 128 ± 21 123 ± 15 99 ± 10d
Alkaline phosphatase (IU/L) 204 ± 8 206 ± 10 196 ± 9 203 ± 5 197 ± 7 177 ± 5*
Creatine kinase (IU/L) 545 ± 110 600 ± 98 732 ± 140 434 ± 89 772 ± 188 422 ± 53 Sorbitol
dehydrogenase (IU/L) 57 ± 2d 69 ± 11 59 ± 5 58 ± 2 56 ± 2 65 ± 2d
Bile salts (µmol/L) 12.9 ± 1.1 12.6 ± 1.0 11.0 ± 0.8 10.9 ± 0.3 12.0 ± 1.0 14.2 ± 2.1
* Significantly different (P#0.05) from the vehicle control group by Dunn's or Shirley's test ** P#0.01 a Data are given as mean ± standard error. Statistical tests were performed on unrounded data. b n˘6#
n˘9#d n˘8
c

D-14 o-, m-, & p-Chloroaniline, NTP TOX 43

E-1
APPENDIX E REPRODUCTIVE TISSUE EVALUATIONS
AND ESTROUS CYCLE CHARACTERIZATION
TABLE E1
TABLE E2
TABLE E3
TABLE E4
TABLE E5
TABLE E6
TABLE E7
TABLE E8
Summary of Reproductive Tissue Evaluations in Male F344/N Rats in the 13-Week Gavage Study of o-Chloroaniline . . . . . . . . . . . . . . . . . . . . . . . . . . . . . . . . Summary of Estrous Cycle Characterization in Female F344/N Rats in the 13-Week Gavage Study of o-Chloroaniline . . . . . . . . . . . . . . . . . . . . . . . . . . . . . . . . Summary of Reproductive Tissue Evaluations in Male F344/N Rats in the 13-Week Gavage Study of m-Chloroaniline . . . . . . . . . . . . . . . . . . . . . . . . . . . . . . . . Summary of Estrous Cycle Characterization in Female F344/N Rats in the 13-Week Gavage Study of m-Chloroaniline . . . . . . . . . . . . . . . . . . . . . . . . . . . . . . . . Summary of Reproductive Tissue Evaluations in Male B6C3F Mice1
in the 13-Week Gavage Study of o-Chloroaniline . . . . . . . . . . . . . . . . . . . . . . . . . . . . . . . . Summary of Estrous Cycle Characterization in Female B6C3F Mice1
in the 13-Week Gavage Study of o-Chloroaniline . . . . . . . . . . . . . . . . . . . . . . . . . . . . . . . . Summary of Reproductive Tissue Evaluations in Male B6C3F Mice1
in the 13-Week Gavage Study of m-Chloroaniline . . . . . . . . . . . . . . . . . . . . . . . . . . . . . . . . Summary of Estrous Cycle Characterization in Female B6C3F Mice1
in the 13-Week Gavage Study of m-Chloroaniline . . . . . . . . . . . . . . . . . . . . . . . . . . . . . . . .
E-2
E-2
E-3
E-3
E-4
E-4
E-5
E-5

E-2 o-, m-, & p-Chloroaniline, NTP TOX 43
TABLE E1 Summary of Reproductive Tissue Evaluations in Male F344/N Rats in the 13-Week Gavage Study of o-Chloroanilinea
Vehicle Study Parameters Control 40 mg/kg 80 mg/kg 160 mg/kg
n 10 8 9 10
Weights (g) Necropsy body weight 334 ± 3 329 ± 4b 319 ± 5* 304 ± 5** Left epididymis 0.436 ± 0.005 0.441 ± 0.006 0.427 ± 0.008 0.422 ± 0.005 Left cauda epididymis 0.148 ± 0.003 0.150 ± 0.005 0.143 ± 0.003 0.139 ± 0.004 Left testis 1.56 ± 0.02 1.57 ± 0.01 1.49 ± 0.03 1.50 ± 0.01
Spermatid measurements Spermatid heads (10 /g testis)7 9.64 ± 0.26 10.14 ± 0.22 9.45 ± 0.29 10.09 ± 0.17 Spermatid heads (10 /testis)7 15.02 ± 0.46 15.97 ± 0.41 14.03 ± 0.27 15.15 ± 0.35 Spermatid count (mean/10 mL suspension)-4 75.10 ± 2.30 79.84 ± 2.03 70.17 ± 1.34 75.73 ± 1.74
Epididymal spermatozoal measurements Motility (%) 70.23 ± 2.79 72.31 ± 2.88b 71.71 ± 4.03 75.20 ± 1.99 Concentration (10 /g cauda epididymal tissue)6 965 ± 46 1,011 ± 32b 858 ± 38 945 ± 40
* Significantly different (P#0.05) from the vehicle control group by Shirley's test ** P#0.01 a Data are presented as mean ± standard error. Differences from the vehicle control group for left epididymal, cauda epididymal, and testis weights,
spermatid measurements, and epididymal spermatozoal measurements are not significant by Dunn's or Shirley's test. b n˘9
TABLE E2# Summary of Estrous Cycle Characterization in Female F344/N Rats in the 13-Week Gavage Study of o-Chloroanilinea
Vehicle Study Parameters Control 40 mg/kg 80 mg/kg 160 mg/kg
n 10 10 10 10
Necropsy body weight (g) 183 ± 3 176 ± 3 178 ± 2 174 ± 2** Estrous cycle length (days) 4.95 ± 0.14 4.80 ± 0.11 4.95 ± 0.05 4.90 ± 0.07 Estrous stages (% of cycle)
Diestrus 40.0 34.2 40.0 39.2 Proestrus 16.7 18.3 15.0 18.3 Estrus 23.3 25.0 26.7 20.8 Metestrus 20.0 22.5 18.3 21.7
** Significantly different (P#0.05) from the vehicle control group by Shirley's test a Necropsy body weight and estrous cycle length data are presented as mean ± standard error. Differences from the vehicle control group for estrous
cycle length are not significant by Dunn's test. By multivariate analysis of variance, dosed groups do not differ significantly from the vehicle control group in the relative length of time spent in the estrous stages.

E-3 o-, m-, & p-Chloroaniline, NTP TOX 43
TABLE E3 Summary of Reproductive Tissue Evaluations in Male F344/N Rats in the 13-Week Gavage Study of m-Chloroanilinea
Vehicle Study Parameters Control 40 mg/kg 80 mg/kg 160 mg/kg
n 10 9 10 10
Weights (g) Necropsy body weight 326 ± 6 323 ± 5 319 ± 6 293 ± 6** Left epididymis 0.423 ± 0.009 0.430 ± 0.007 0.437 ± 0.006 0.421 ± 0.004 Left cauda epididymis 0.141 ± 0.006 0.140 ± 0.003 0.151 ± 0.003 0.142 ± 0.003 Left testis 1.53 ± 0.03 1.50 ± 0.02 1.56 ± 0.02 1.50 ± 0.03
Spermatid measurements Spermatid heads (10 /g testis)7 9.20 ± 0.20 9.53 ± 0.30 9.28 ± 0.14 9.66 ± 0.17 Spermatid heads (10 /testis)7 14.02 ± 0.22 14.28 ± 0.38 14.50 ± 0.20 14.42 ± 0.24 Spermatid count (mean/10 mL suspension)-4 70.10 ± 1.09 71.39 ± 1.91 72.48 ± 1.00 72.10 ± 1.22
Epididymal spermatozoal measurements Motility (%) 67.56 ± 1.08 66.36 ± 1.53 65.06 ± 2.62 57.52 ± 3.43** Concentration (10 /g cauda epididymal tissue)6 980 ± 35 988 ± 66 1,018 ± 33 924 ± 30
** Significantly different (P#0.01) from the vehicle control group by Shirley's test a Data are presented as mean ± standard error. Differences from the vehicle control group for left epididymal, cauda epididymal, and testis weights,
spermatid measurements, and epididymal spermatozoal concentration are not significant by Dunn's test.
TABLE E4# Summary of Estrous Cycle Characterization in Female F344/N Rats in the 13-Week Gavage Study of m-Chloroanilinea
Vehicle Study Parameters Control 40 mg/kg 80 mg/kg 160 mg/kg
n 10 10 10 9
Necropsy body weight (g) 183 ± 3 183 ± 2 179 ± 3 185 ± 3 Estrous cycle length (days) 4.75 ± 0.11 4.95 ± 0.05 4.95 ± 0.05 4.89 ± 0.07 Estrous stages (% of cycle)
Diestrus 30.8 35.8 35.0 35.2 Proestrus 12.5 12.5 10.0 11.1 Estrus 35.8 32.5 32.5 32.4 Metestrus 20.8 19.2 22.5 21.3
a Necropsy body weight and estrous cycle length data are presented as mean ± standard error. Differences from the vehicle control group for necropsy body weight and estrous cycle length are not significant by Dunn's test. By multivariate analysis of variance, dosed groups do not differ significantly from the vehicle control group in the relative length of time spent in the estrous stages.

E-4 o-, m-, & p-Chloroaniline, NTP TOX 43
TABLE E5 Summary of Reproductive Tissue Evaluations in Male B6C3F Mice1
in the 13-Week Gavage Study of o-Chloroanilinea
Vehicle Study Parameters Control 40 mg/kg 80 mg/kg 160 mg/kg
n 9 9 10 9
Weights (g) Necropsy body weight 36.1 ± 1.3 35.0 ± 0.4 35.4 ± 0.6 33.4 ± 1.1 Left epididymis 0.041 ± 0.001 0.042 ± 0.001 0.040 ± 0.001 0.041 ± 0.001 Left cauda epididymis 0.013 ± 0.000 0.014 ± 0.000 0.012 ± 0.000 0.012 ± 0.000 Left testis 0.112 ± 0.002 0.114 ± 0.002 0.114 ± 0.002 0.118 ± 0.001*
Spermatid measurements 7Spermatid heads (10 /g testis) 21.58 ± 0.93 21.86 ± 0.69 20.69 ± 0.47 21.23 ± 0.38 7Spermatid heads (10 /testis) 2.42 ± 0.11 2.49 ± 0.07 2.36 ± 0.05 2.50 ± 0.05
Spermatid count (mean/10-4 mL suspension) 75.61 ± 3.41 77.69 ± 2.10 73.88 ± 1.58 78.25 ± 1.66
Epididymal spermatozoal measurements Motility (%) 62.26 ± 1.51 67.30 ± 1.16 60.04 ± 3.84 57.58 ± 2.56 Concentration
6 (10 /g cauda epididymal tissue) 1,371 ± 142 1,558 ± 127 1,557 ± 102 1,691 ± 187
* Significantly different (P#0.05) from the vehicle control group by Shirley's test a Data are presented as mean ± standard error. Differences from the vehicle control group for necropsy body weight, left epididymal and cauda
epididymal weights, spermatid measurements, and epididymal spermatozoal concentration are not significant by Dunn's or Shirley's test.
TABLE E6 Summary of Estrous Cycle Characterization in Female B6C3F Mice1
in the 13-Week Gavage Study of o-Chloroanilinea
Vehicle Study Parameters Control 40 mg/kg 80 mg/kg 160 mg/kg
n 10 10 10 10
Necropsy body weight (g) 28.7 ± 0.7 28.5 ± 0.7 30.2 ± 0.6 27.4 ± 0.6 Estrous cycle length (days) 4.10 ± 0.10 4.05 ± 0.05 4.35 ± 0.15 4.10 ± 0.07 Estrous stages (% of cycle)
Diestrus 32.5 27.5 28.3 31.0 Proestrus 23.3 25.0 23.3 23.9 Estrus 22.5 24.2 27.5 24.8 Metestrus 20.8 23.3 20.8 20.4 Uncertain diagnoses 0.8 0.0 0.0 0.0
a Necropsy body weight and estrous cycle length data are presented as mean ± standard error. Differences from the vehicle control group for necropsy body weight and estrous cycle length are not significant by Dunn's test. By multivariate analysis of variance, dosed groups do not differ significantly from the vehicle control group in the relative length of time spent in the estrous stages.

E-5 o-, m-, & p-Chloroaniline, NTP TOX 43
TABLE E7 Summary of Reproductive Tissue Evaluations in Male B6C3F Mice1
in the 13-Week Gavage Study of m-Chloroanilinea
Vehicle Study Parameters Control 40 mg/kg 80 mg/kg 160 mg/kg
n 9 10 10 10
Weights (g) Necropsy body weight 36.2 ± 0.9 34.4 ± 0.4 35.1 ± 0.3 35.6 ± 1.0 Left epididymis 0.043 ± 0.001 0.043 ± 0.001 0.043 ± 0.001 0.042 ± 0.001 Left cauda epididymis 0.014 ± 0.001 0.013 ± 0.001 0.014 ± 0.001 0.014 ± 0.000 Left testis 0.117 ± 0.002 0.117 ± 0.003 0.118 ± 0.002 0.116 ± 0.003
Spermatid measurements 7Spermatid heads (10 /g testis) 21.26 ± 0.48 20.68 ± 0.48 20.29 ± 0.42 21.03 ± 0.65 7Spermatid heads (10 /testis) 2.49 ± 0.06 2.40 ± 0.06 2.40 ± 0.07 2.43 ± 0.06
Spermatid count (mean/10-4 mL suspension) 77.89 ± 2.01 75.15 ± 1.78 75.05 ± 2.12 75.78 ± 1.90
Epididymal spermatozoal measurements Motility (%) 68.28 ± 0.96 68.85 ± 1.37 68.13 ± 1.72 67.44 ± 3.15 Concentration
6 (10 /g cauda epididymal tissue) 2,175 ± 195 2,110 ± 90 2,066 ± 128 2,035 ± 154
a Data are presented as mean ± standard error. Differences from the vehicle control group are not significant by Dunn's test.
TABLE E8 Summary of Estrous Cycle Characterization in Female B6C3F Mice1
in the 13-Week Gavage Study of m-Chloroanilinea
Vehicle Study Parameters Control 40 mg/kg 80 mg/kg 160 mg/kg
n 9 8 9 9
Necropsy body weight (g) 28.4 ± 0.7 29.9 ± 1.2 28.1 ± 0.5b 28.0 ± 0.7 Estrous cycle length (days) 4.28 ± 0.15 4.06 ± 0.06 4.22 ± 0.12c 4.17 ± 0.12 Estrous stages (% of cycle)
Diestrus 25.0 27.1 34.2 30.6 Proestrus 18.5 22.9 20.0 21.3 Estrus 32.4 28.1 25.0 25.0 Metestrus 24.1 21.9 20.8 23.1
a Necropsy body weight and estrous cycle length data are presented as mean ± standard error. Differences from the vehicle control group for necropsy body weight and estrous cycle length are not significant by Dunn's test. By multivariate analysis of variance, dosed groups do not differ significantly from the vehicle control group in the relative length of time spent in the estrous stages.
b n˘10#Estrous cycle longer than 12 days or unclear in 1 of 10 mice c

E-6 o-, m-, & p-Chloroaniline, NTP TOX 43

F-1
APPENDIX F GENETIC TOXICOLOGY
TABLE F1 Mutagenicity of o-Chloroaniline in Salmonella typhimurium . . . . . . . . . . . . . . . . . . . . . . . . . F-2#TABLE F2 Mutagenicity of m-Chloroaniline in Salmonella typhimurium . . . . . . . . . . . . . . . . . . . . . . . . F-5#TABLE F3 Induction of Trifluorothymidine Resistance in L5178Y Mouse Lymphoma Cells
by o-Chloroaniline . . . . . . . . . . . . . . . . . . . . . . . . . . . . . . . . . . . . . . . . . . . . . . . . . . . . . F-8#TABLE F4 Induction of Trifluorothymidine Resistance in L5178Y Mouse Lymphoma Cells
by m-Chloroaniline . . . . . . . . . . . . . . . . . . . . . . . . . . . . . . . . . . . . . . . . . . . . . . . . . . . . F-10#TABLE F5 Induction of Sister Chromatid Exchanges in Chinese Hamster Ovary Cells
by m-Chloroaniline . . . . . . . . . . . . . . . . . . . . . . . . . . . . . . . . . . . . . . . . . . . . . . . . . . . . F-13#TABLE F6 Induction of Chromosomal Aberrations in Chinese Hamster Ovary Cells
by m-Chloroaniline . . . . . . . . . . . . . . . . . . . . . . . . . . . . . . . . . . . . . . . . . . . . . . . . . . . . F-14#TABLE F7 Induction of Micronuclei in Bone Marrow Cells of F344/N Rats by o-Chloroaniline . . . . . . . . . F-15#TABLE F8 Induction of Micronuclei in Bone Marrow Cells of F344/N Rats by m-Chloroaniline . . . . . . . . F-15#TABLE F9 Induction of Micronuclei in Bone Marrow Cells of B6C3F Mice by o-Chloroaniline . . . . . . . . F-161#
TABLE F10 Induction of Micronuclei in Bone Marrow Cells of B6C3F Mice by m-Chloroaniline . . . . . . . . F-171#
TABLE F11 Frequency of Micronuclei in Peripheral Blood of B6C3F Mice1#
Treated with o-Chloroaniline for 13 Weeks . . . . . . . . . . . . . . . . . . . . . . . . . . . . . . . . . . . . F-18#TABLE F12 Frequency of Micronuclei in Peripheral Blood of B6C3F Mice1#
Treated with m-Chloroaniline for 13 Weeks . . . . . . . . . . . . . . . . . . . . . . . . . . . . . . . . . . . F-19#

F-2 o-, m-, & p-Chloroaniline, NTP TOX 43
aTABLE F1 Mutagenicity of o-Chloroaniline in Salmonella typhimurium
Revertants/plateb
Strain Dose
(µg/plate) -S9 +hamster S9
10% 30%
+rat S9
10% 30%
STUDY PERFORMED AT SRI INTERNATIONAL
TA100 0 10 33
100 333
1,000 3,333
124 ± 11.5 132 ± 5.5 128 ± 9.4 134 ± 1.7 127 ± 6.4 101 ± 10.7
105 ±
132 ± 112 ± 114 ± 103 ±
0 ±
4.0
4.7 8.8 8.3 6.5 0.0c
146 ± 125 ± 127 ± 148 ± 144 ± 130 ±
9.1 6.3 2.3 6.1 9.6 6.8
113 ±
125 ± 118 ± 135 ± 95 ± 0 ±
2.4
2.4 4.1 8.0 5.5 0.0c
149 ± 11.8 146 ± 3.8 165 ± 2.9 162 ± 5.2 159 ± 2.8 148 ± 9.4
Trial summary Positive control d
Negative 253 ± 30.8
Negative 921 ± 60.5
Negative 1,796 ± 24.3
Negative 501 ± 22.4
Negative 1,007 ± 26.8
TA1535 0 10 33
100 333
1,000 3,333
19 ± 18 ± 15 ± 22 ± 26 ± 25 ±
0.3 1.5 5.4 4.7 1.2 3.8
10 ±
10 ± 8 ± 4 ± 4 ± 0 ±
2.0
1.3 1.9 1.9 0.9 0.0c
8 ± 4 ±
11 ± 5 ± 4 ± 6 ±
2.3 1.2 1.3 1.5 0.9 0.9
13 ± 2.9
7 ± 0.3 5 ± 0.7 7 ± 2.7 6 ± 1.8 Toxic
36 ± 10.1 12 ± 2.0 10 ± 2.2 11 ± 3.2 7 ± 0.7 8 ± 0.9
Trial summary Positive control
Negative 236 ± 17.9
Negative 333 ± 47.0
Negative 511 ± 7.7
Negative 163 ± 26.2
Negative 289 ± 31.4
TA97 0 10 33
100 333
1,000 3,333
144 ± 14.6 179 ± 15.0 190 ± 11.9 187 ± 5.2 168 ± 4.7 79 ± 6.4
108 ± 3.6
127 ± 12.5 120 ± 6.1 118 ± 11.2 111 ± 7.0
0 ± 0.0c
213 ± 2.6 190 ± 6.0 203 ± 11.5 196 ± 11.7 191 ± 6.1 191 ± 8.3
121 ± 6.9
129 ± 16.5 117 ± 13.6 132 ± 2.7 119 ± 7.4
0 ± 0.0c
215 ± 19.8 230 ± 8.7 237 ± 5.8 212 ± 10.5 204 ± 6.1 154 ± 3.7
Trial summary Positive control
Negative 1,003 ± 26.4
Negative 923 ± 83.6
Negative 617 ± 45.0
Negative 414 ± 35.4
Negative 425 ± 5.7
TA98 0 10 33
100 333
1,000 3,333
15 ± 10 ± 15 ± 10 ± 9 ±
11 ±
2.8 2.4 1.5 1.5 2.0 1.5
26 ± 3.6
20 ± 2.5 24 ± 2.5 26 ± 5.0 31 ± 3.2 Toxic
23 ± 18 ± 25 ± 29 ± 21 ± 28 ±
1.7 0.9 1.9 5.8 2.0 1.7
24 ±
31 ± 26 ± 34 ± 34 ± 0 ±
2.3
5.0 8.2 2.2 3.8 0.0c
33 ± 29 ± 34 ± 33 ± 36 ± 30 ±
2.6 5.8 4.7 6.1 2.2 0.9
Trial summary Positive control
Negative 752 ± 21.6
Negative 763 ± 74.9
Negative 1,562 ± 64.7
Negative 163 ± 26.2
Negative 846 ± 25.2

F-3 o-, m-, & p-Chloroaniline, NTP TOX 43
TABLE F1 Mutagenicity of o-Chloroaniline in Salmonella typhimurium (continued)
Revertants/plate
Dose -S9 +hamster S9 +rat S9 Strain (µg/plate) 10% 30% 10% 30%
STUDY PERFORMED AT MICROBIOLOGICAL ASSOCIATES, INC.
TA100 0 92 ± 3.0 83 ± 2.0 116 ± 5.0 96 ± 2.8 102 ± 7.0 10 77 ± 5.5 74 ± 5.8 94 ± 1.2 33 86 ± 0.6 81 ± 3.5 113 ± 2.7 82 ± 8.7 127 ± 1.2
100 80 ± 3.8 79 ± 2.9 121 ± 6.7 82 ± 0.9 123 ± 4.7 333 80 ± 8.7 75 ± 3.5 116 ± 3.6 99 ± 5.8 121 ± 7.0
1,000 76 ± 5.5c 79 ± 8.4c 113 ± 7.3c 92 ± 4.3c 110 ± 6.1c
2,000 14 ± 13.7c 0 ± 0.0c
Trial summary Negative Negative Negative Negative Negative Positive control 343 ± 15.8 390 ± 5.8 537 ± 47.0 649 ± 11.9 498 ± 77.4
TA1535 0 18 ± 1.7 7 ± 1.5 8 ± 1.5 11 ± 0.7 12 ± 1.5 10 17 ± 2.0 10 ± 0.9 8 ± 1.5 33 14 ± 2.0 7 ± 1.8 8 ± 1.2 11 ± 0.6 9 ± 1.0
100 15 ± 1.9 9 ± 2.6 6 ± 1.2 10 ± 1.5 8 ± 0.9 333 14 ± 1.3 10 ± 0.3 10 ± 1.7 6 ± 0.6 4 ± 0.6
1,000 20 ± 1.5c 7 ± 0.9c 10 ± 0.9 11 ± 2.1c 8 ± 0.6 2,000 10 ± 0.9c Toxic
Trial summary Negative Negative Negative Negative Negative Positive control 253 ± 7.5 61 ± 3.0 53 ± 4.6 140 ± 2.5 104 ± 4.8
TA97 0 88 ± 3.0 97 ± 6.1 103 ± 1.2 121 ± 8.3 131 ± 2.9 10 80 ± 9.5 114 ± 7.4 115 ± 4.4 33 81 ± 5.3 103 ± 8.5 94 ± 4.4 105 ± 4.7 119 ± 1.2
100 86 ± 6.5 104 ± 7.6 66 e 111 ± 7.5 114 ± 15.9 333 93 ± 3.8 94 ± 7.3 123 ± 12.3 120 ± 5.6 129 ± 8.3
1,000 70 ± 2.1c 102 ± 6.4c 109 ± 4.1 96 ± 5.0c 115 ± 5.2c
2,000 95 ± 4.4c 55 ± 19.8c
Trial summary Negative Negative Negative Negative Negative Positive control 191 ± 4.4 459 ± 11.8 529 ± 40.3 1,139 ± 18.6 481 ± 5.2
TA98 0 12 ± 1.2 25 ± 3.5 59 ± 0.6 26 ± 2.1 50 ± 5.2 10 15 ± 1.5 27 ± 2.3 32 ± 3.0 33 12 ± 0.0 25 ± 1.5 59 ± 3.3 27 ± 0.9 56 ± 4.3
100 11 ± 2.8 25 ± 4.6 52 ± 5.0 28 ± 2.0 53 ± 3.8 333 12 ± 0.3 25 ± 3.2 56 ± 3.3 27 ± 0.0 53 ± 8.5
1,000 12 ± 0.3c 26 ± 1.7c 49 ± 6.3c 33 ± 1.9c 46 ± 3.9c
2,000 3 ± 0.5c 12 ± 5.8c
Trial summary Negative Negative Negative Negative Negative Positive control 167 ± 7.5 70 ± 5.0 140 ± 16.4 267 ± 4.9 133 ± 15.0

F-4
c
o-, m-, & p-Chloroaniline, NTP TOX 43
TABLE F1 Mutagenicity of o-Chloroaniline in Salmonella typhimurium (continued)
Dose Revertants/plate Strain (µg/plate) -S9# +10% hamster S9 +10% rat S9
STUDY PERFORMED AT MICROBIOLOGICAL ASSOCIATES (continued)
TA1537 0 5 ± 0.9 8 ± 1.5# 9 ± 0.6 33 8 ± 0.7 9 ± 3.5 7 ± 1.5
100 6 ± 1.0 6 ± 2.3 8 ± 0.7 333 5 ± 1.5 8 ± 1.5 8 ± 2.3
c1,000 4 ± 1.7 10 ± 2.3# 7 ± 0.9 c c c2,000 5 ± 1.5# 7 ± 0.7 4 ± 2.0
Trial summary Negative Negative Negative Positive control 71 ± 2.9 70 ± 6.7 51 ± 8.7
a The detailed protocol and the data from the SRI International study are presented in Zeiger et al. (1987); 0 µg/plate was the solvent control. b Revertants are presented as the mean ± standard error from three plates.
Slight toxicity d The positive controls in the absence of metabolic activation were sodium azide (TA100 and TA1535), 9-aminoacridine (TA97 and TA1537), and
4-nitro-o-phenylenediamine (TA98). The positive control for trials with metabolic activation with all strains was 2-aminoanthracene. e Due to contamination, only one of three plates was scorable.

F-5 o-, m-, & p-Chloroaniline, NTP TOX 43
aTABLE F2 Mutagenicity of m-Chloroaniline in Salmonella typhimurium
Dose Revertants/plateb
Strain (µg/plate) -S9 +10% hamster S9 +10% rat S9
STUDY PERFORMED AT CASE WESTERN RESERVE UNIVERSITY
TA100 0 85 ± 4.9 143 ± 8.8 186 ± 2.2 10 83 ± 1.5 183 ± 18.0 130 ± 5.2 33 72 ± 1.2 214 ± 6.4 139 ± 4.2
100 89 ± 4.5 190 ± 6.2 149 ± 7.5 333 87 ± 2.1 201 ± 15.0 181 ± 13.1
1,000 72 ± 2.8 156 ± 5.0 148 ± 5.5
Trial summary Negative Equivocal Negative cPositive control 1,137 ± 21.3 1,175 ± 177.2 2,784 ± 45.1
TA1535 0.0 5 ± 0.3 11 ± 1.2 18 ± 2.4 3.3 10 ± 2.3 17 ± 3.5 19 ± 5.2
10.0 5 ± 1.0 11 ± 2.6 10 ± 0.6 33.0 8 ± 2.1 15 ± 2.6 12 ± 1.0
100.0 5 ± 1.3 13 ± 2.3 19 ± 1.5 333.0 5 ± 0.7 10 ± 3.1 16 ± 2.2
Trial summary Negative Negative Negative Positive control 770 ± 67.0 175 ± 33.6 129 ± 14.8
TA1537 0.0 4 ± 0.7 11 ± 1.2 15 ± 2.5 3.3 3 ± 0.7 10 ± 0.7 6 ± 0.6
10.0 2 ± 0.3 12 ± 0.5 8 ± 1.9 33.0 2 ± 0.3 8 ± 1.2 6 ± 1.7
100.0 2 ± 0.7 6 ± 0.6 5 ± 0.6 333.0 1 ± 0.6 5 ± 1.2 7 ± 1.5
Trial summary Negative Negative Negative Positive control 303 ± 85.3 127 ± 7.2 261 ± 26.3
TA98 0.0 19 ± 0.9 27 ± 0.6 29 ± 1.7 1.0 29 ± 2.3 3.3 36 ± 4.2
10.0 21 ± 1.5 28 ± 2.1 46 ± 3.8 33.0 17 ± 1.9 33 ± 5.8 21 ± 3.5
100.0 20 ± 5.7 43 ± 2.0 23 ± 6.8 333.0 19 ± 2.3 32 ± 2.3 6 ± 2.2
1,000.0 19 ± 3.8 27 ± 3.8
Trial summary Negative Negative Negative Positive control 219 ± 8.6 764 ± 29.4 497 ± 51.3#

F-6 o-, m-, & p-Chloroaniline, NTP TOX 43
TABLE F2 Mutagenicity of m-Chloroaniline in Salmonella typhimurium (continued)
Revertants/plate
Dose -S9 +hamster S9 +rat S9 Strain (µg/plate) 10% 30% 10% 30%
STUDY PERFORMED AT MICROBIOLOGICAL ASSOCIATES, INC.
TA100 0 98 ± 4.4 94 ± 4.2 121 ± 2.4 112 ± 2.2 120 ± 5.5 33 94 ± 2.3 101 ± 3.8 110 ± 3.5 104 ± 7.2 139 ± 5.2
100 95 ± 3.8 103 ± 9.4 120 ± 9.5 101 ± 2.3 139 ± 10.0 333 98 ± 6.7 97 ± 7.1 130 ± 4.8 107 ± 2.3 127 ± 3.2
1,000 1,500 2,000
61 ± 7.9d
48 ± 21.2d 89 ± 3.3d
12 ± 10.0d 122 ±
100 ±
9.0
9.0d
103 ± 3.8d
Toxic 116 ±
74 ±
7.2
9.7d
Trial summary Negative Negative Negative Negative Negative Positive control 310 ± 6.0 409 ± 10.7 728 ± 9.0 570 ± 13.7 560 ± 58.0
TA1535 0 20 ± 3.0 10 ± 0.0 13 ± 1.9 10 ± 1.0 13 ± 0.9 33 15 ± 3.2 12 ± 1.5 11 ± 1.7 10 ± 1.8 9 ± 2.0
100 16 ± 0.9 8 ± 2.0 9 ± 1.5 10 ± 1.8 13 ± 1.8 333 14 ± 2.0 13 ± 2.3 9 ± 0.7 8 ± 0.7 8 ± 0.9
1,000 1,500 2,000
12 ± 15 ±
1.0d
5.0d 10 ± 4 ±
1.2 1.0d
13 ±
12 ±
0.9
2.5d
8 ± 1.8d
Toxic 7 ± 1.7
Toxic
Trial summary Negative Negative Negative Negative Negative Positive control 220 ± 12.0 59 ± 2.8 228 ± 53.1 145 ± 9.8 143 ± 0.3
TA97 0 80 ± 2.3 87 ± 3.4 162 ± 6.6 118 ± 3.8 158 ± 7.7 33 97 ± 5.0 114 ± 1.9 172 ± 12.1 118 ± 3.8 157 ± 9.5
100 100 ± 8.6 99 ± 4.0 184 ± 2.3 107 ± 4.5 151 ± 3.6 333 77 ± 6.4 107 ± 3.1 172 ± 12.7 111 ± 3.2 146 ± 5.3
1,000 1,500
72 ± 3.7d
Toxic 82 ± 77 ±
1.2d
9.0d 137 ± 7.8d 91 ± 3.5d
Toxic 130 ± 6.8d
2,000 Toxic Toxic
Trial summary Negative Negative Negative Negative Negative Positive control 223 ± 13.7 524 ± 10.0 553 ± 21.7 1,021 ± 5.2 471 ± 47.7
TA98 0 12 ± 1.2 21 ± 2.3 47 ± 0.7 25 ± 1.5 34 ± 3.8 33 17 ± 1.9 26 ± 2.1 41 ± 5.1 24 ± 1.5 36 ± 1.2
100 10 ± 1.3 27 ± 3.2 41 ± 2.9 24 ± 0.7 34 ± 2.9 333 10 ± 1.5 29 ± 5.0 40 ± 2.9 25 ± 2.4 38 ± 3.8
1,000 1,500 2,000
9 ± 1.7d
Toxic 29 ± 24 ±
1.8d
8.2d 42 ±
46 ±
3.7
1.5d
19 ± 9 ±
2.1d
3.2d 32 ± 4.2
25 ± 12.5d
Trial summary Negative Negative Negative Negative Negative Positive control 161 ± 2.2 83 ± 9.5 110 ± 8.4 245 ± 11.8 166 ± 11.3

F-7
c
o-, m-, & p-Chloroaniline, NTP TOX 43
TABLE F2 Mutagenicity of m-Chloroaniline in Salmonella typhimurium (continued)
Dose Revertants/plate Strain (µg/plate) -S9# +10% hamster S9 +10% rat S9
STUDY PERFORMED AT MICROBIOLOGICAL ASSOCIATES, INC. (continued)
TA1537 0 8 ± 0.9 13 ± 1.0 10 ± 2.0 33 11 ± 2.3 12 ± 0.9 6 ± 1.5
100 10 ± 1.3 9 ± 1.9 8 ± 0.3 333 7 ± 0.6 9 ± 1.5 8 ± 0.3
1,000# 7 ± 2.4 11 ± 1.5 9 ± 2.4 d d2,000 3 ± 2.5 10 ± 2.0# Toxic
Trial summary Negative Negative Negative Positive control 74 ± 3.5 120 ± 11.9 62 ± 2.6
a The detailed protocol and the data from the Case Western Reserve University study are presented in Zeiger et al. (1987); 0 µg/plate was the solvent control.
b Revertants are presented as the mean ± standard error from three plates. The positive controls in the absence of metabolic activation were sodium azide (TA100 and TA1535), 9-aminoacridine (TA97 and TA1537), and 4-nitro-o-phenylenediamine (TA98). The positive control for trials with metabolic activation with all strains was 2-aminoanthracene.
d Slight toxicity

F-8 o-, m-, & p-Chloroaniline, NTP TOX 43
TABLE F3 Induction of Trifluorothymidine Resistance in L5178Y Mouse Lymphoma Cells by o-Chloroanilinea
Compound Concentration (µg/mL)
Cloning Efficiency
(%)
Relative Total Growth
(%)
Mutant Count
Mutant Fraction b
Average Mutant Fractionc
-S9 Trial 1
Dimethylsulfoxide 119 107 103 111
126 86 99 89
191 160 163 179
53 50 53 54 52
Methyl methanesulfonate 15 39
42 19 19
378 382
322 306 314*
o-Chloroaniline 31.25 62.5
125
250 500
112 101 94
104 117 118 109 110
93 85 92 96 97 70 31 36
165 130 196 180 249 242 226 213
49 43 70 58 71 68 69 65
56
65
67
Trial 2 Dimethylsulfoxide
97 80 83 60
100 97
119 84
74 61 77 55
25 25 31 31 28
Methyl methanesulfonate 15 25
30 34 27
167 174
223 196 209*
o-Chloroaniline 25
50
100
200
400
89 78 77 94 71 69 71 78 58 71
83 93 76 95 86
106 70 71 22 25
89 70 65
104 60
105 92 79
100 94
33 30 28 37 28 51 43 34 58 44
32
32
40
38
51*

F-9 o-, m-, & p-Chloroaniline, NTP TOX 43
TABLE F3 Induction of Trifluorothymidine Resistance in L5178Y Mouse Lymphoma Cells by o-Chloroaniline (continued)
Cloning Relative Mutant Mutant Average Compound Concentration Efficiency Total Growth Count Fraction Mutant
(µg/mL) (%) (%) Fraction
+S9 Trial 1
Dimethylsulfoxide 91 97 239 88 86 114 187 73 64 89 246 127 63 100 256 136 106
Methylcholanthrene 2.5 34 16 407 395
39 15 462 393 394*
o-Chloroaniline 200 51 47 217 143
44 41 182 139 141 300 44 40 237 178
49 42 376 258 218* 400 57 40 551 320
58 38 519 300 310* 500 53 22 449 280
92 43 434 157 219* 600 71 24 445 209
86 39 425 166 187* 700 Lethal
Lethal
Trial 2 Dimethylsulfoxide
79 90 75 32 77 84 69 30 81 125 46 19 27
Methylcholanthrene 2.5 53 32 419 263
44 30 350 266 264*
o-Chloroaniline 300 70 43 146 69
74 37 132 59 64* 400 72 36 278 128
82 33 370 150 139* 500 75 23 599 268
67 30 421 210 239* 600 71 16 818 382
71 19 616 291 336* 700 69 8 482 233
76 8 531 233 233*
* Significant positive response (P#0.05) a Study was performed at Inveresk Research International. The experimental protocol and these data are presented in McGregor et al. (1991). All doses
were tested in triplicate; the average of the three tests is presented in the table. b 6Mutant fraction (MF) (frequency) is a ratio of the mutant count to the cloning efficiency, divided by 3 (to arrive at MF/10 cells treated). c Mean from three replicate plates of approximately 106 cells each

F-10 o-, m-, & p-Chloroaniline, NTP TOX 43
TABLE F4 Induction of Trifluorothymidine Resistance in L5178Y Mouse Lymphoma Cells by m-Chloroanilinea
Compound Concentration Cloning Efficiency
Relative Total Growth
Mutant Count
Mutant Fraction b
Average Mutant
(µg/mL) (%) (%) Fractionc
-S9 Trial 1
Dimethylsulfoxide 72 98 172 79 99 101 239 81 94 106 216 77 83 94 255 103 85
Methyl methanesulfonate 15 30 24 242 272
24 19 288 400 336*
m-Chloroaniline 100 70 85 165 79
61 85 179 98 88 200 76 60 213 94
77 70 213 92 93 300 23 26 139 200
36 35 216 200 200* 400 27 23 161 200
36 23 213 200 200* 500 35 10 211 200
29 9 176 200 200*
Trial 2 Dimethylsulfoxide
97 109 131 45 110 108 86 26 98 94 83 28 94 90 113 40 35
Methyl methanesulfonate 15 44 30 198 149
55 37 250 152 151*
m-Chloroaniline 160 113 76 142 42
83 62 72 29 35 240 93 41 121 43
90 56 136 50 47 320 84 25 145 57
73 31 122 55 56* 400 102 26 187 61
79 24 156 66 64* 480 86 10 226 87
84 10 222 88 88*

F-11 o-, m-, & p-Chloroaniline, NTP TOX 43
TABLE F4 Induction of Trifluorothymidine Resistance in L5178Y Mouse Lymphoma Cells by m-Chloroaniline (continued)
Cloning Relative Mutant Mutant Average Compound Concentration Efficiency Total Growth Count Fraction Mutant
(µg/mL) (%) (%) Fraction
-S9 (continued) Trial 3
Dimethylsulfoxide 102 90 42 14 107 107 88 27 94 109 44 16 92 93 79 29 21
Methyl methanesulfonate 15 42 31 117 93
41 26 120 97 95*
m-Chloroaniline 440 73 14 71 33
70 12 58 28 30 460 74 14 48 22
85 11 55 22 22 480 110 10 80 24
78 9 77 33 29 500 100 8 77 26
61 8 84 46 36 520 63 6 84 45
57 6 87 51 48*
+S9 Trial 1
Dimethylsulfoxide 108 115 145 45 92 117 85 31 90 84 110 41
104 83 146 47 41
Methylcholanthrene 2.5 56 35 544 322
50 31 591 391 357*
m-Chloroaniline 240 74 52 185 84
68 40 191 93 89* 320 56 35 123 73
56 28 150 90 82* 400 66 16 146 73
62 24 132 71 72* 480 56 16 149 89
102 11 269 88 88* 560 39 6 134 115
46 5 163 119 117*

F-12 o-, m-, & p-Chloroaniline, NTP TOX 43
TABLE F4 Induction of Trifluorothymidine Resistance in L5178Y Mouse Lymphoma Cells by m-Chloroaniline (continued)
Cloning Relative Mutant Mutant Average Compound Concentration Efficiency Total Growth Count Fraction Mutant
(µg/mL) (%) (%) Fraction
+S9 (continued) Trial 2
Dimethylsulfoxide 61 124 56 31 67 108 65 32 67 88 62 31 62 79 57 31 31
Methylcholanthrene 2.5 40 30 413 341
47 33 350 248 295*
m-Chloroaniline 160 66 98 76 38
79 85 106 45 42 240 66 74 60 30
51 47 71 46 38 320 66 60 77 39
60 45 82 45 42 400 71 40 122 57
79 38 153 65 61* 480 90 30 149 55
63 28 91 48 52* 560 66 21 131 67
73 20 145 67 67*
* Significant positive response (P#0.05) a Study was performed at Inveresk Research International. The experimental protocol is presented in McGregor et al. (1991). All doses were tested in
triplicate; the average of the three tests is presented in the table. b 6Mutant fraction (MF) (frequency) is a ratio of the mutant count to the cloning efficiency, divided by 3 (to arrive at MF/10 cells treated). c Mean from three replicate plates of approximately 106 cells each

F-13 o-, m-, & p-Chloroaniline, NTP TOX 43
TABLE F5 Induction of Sister Chromatid Exchanges in Chinese Hamster Ovary Cells by m-Chloroanilinea
Compound Dose (µg/mL)
Total Cells
No. of Chromo-somes
No. of SCEs
SCEs/ Chromo-some
SCEs/ Cell
Hrs in BrdU
Relative Change of SCEs/ Chromosome b
(%)
-S9 Summary: Positive
Dimethylsulfoxide 50 1,039 473 0.45 9.5 25.5
Mitomycin-C 0.001 0.010
50 5
1,024 99
673 236
0.65 2.38
13.5 47.2
25.5 25.5
44.37 423.64
m-Chloroaniline 80.0 89.4
100.0
50 50 50
1,017 1,029 1,031
580 632 651
0.57 0.61 0.63
11.6 12.6 13.0
32.8c
32.8c
32.8c
25.27* 34.91* 38.70*
P<0.001d
+S9 Trial 1 Summary: Equivocal
Dimethylsulfoxide 50 1,027 457 0.44 9.1 25.5
Cyclophosphamide 0.3 2.0
50 5
1,034 102
631 135
0.61 1.32
12.6 27.0
25.5 25.5
37.14 197.43
m-Chloroaniline 111 370
1,100
50 50 50
1,019 1,036 1,026
422 479 540
0.41 0.46 0.52
P˘0.001
8.4 9.6
10.8
25.5 25.5 25.5
!6.93 3.90
18.28
Trial 2 Summary: Weakly positive
Dimethylsulfoxide 50 1,018 491 0.48 9.8 25.5
Cyclophosphamide 0.3 2.0
50 5
1,029 104
616 132
0.59 1.26
12.3 26.4
25.5 25.5
24.12 163.16
m-Chloroaniline 198 402 600
50 50 50
1,027 1,023 1,020
523 554 617
0.50 0.54 0.60
10.5 11.1 12.3
25.5 25.5 25.5
5.59 12.28 25.42*
P<0.001
*#Positive ($20% increase over solvent control) a Study was performed at Litton Bionetics, Inc. A detailed description of the protocol is presented in Galloway et al. (1987). SCE ˘ sister chromatid
exchange; BrdU ˘ bromodeoxyuridine. b SCEs/chromosome in treated cells versus SCEs/chromosome in solvent control cells
Because m-chloroaniline induced a delay in the cell division cycle, harvest time was extended to maximize the proportion of second-division cells available for analysis.
d Significance of SCEs/chromosome tested by the linear regression trend test versus log of the dose
c
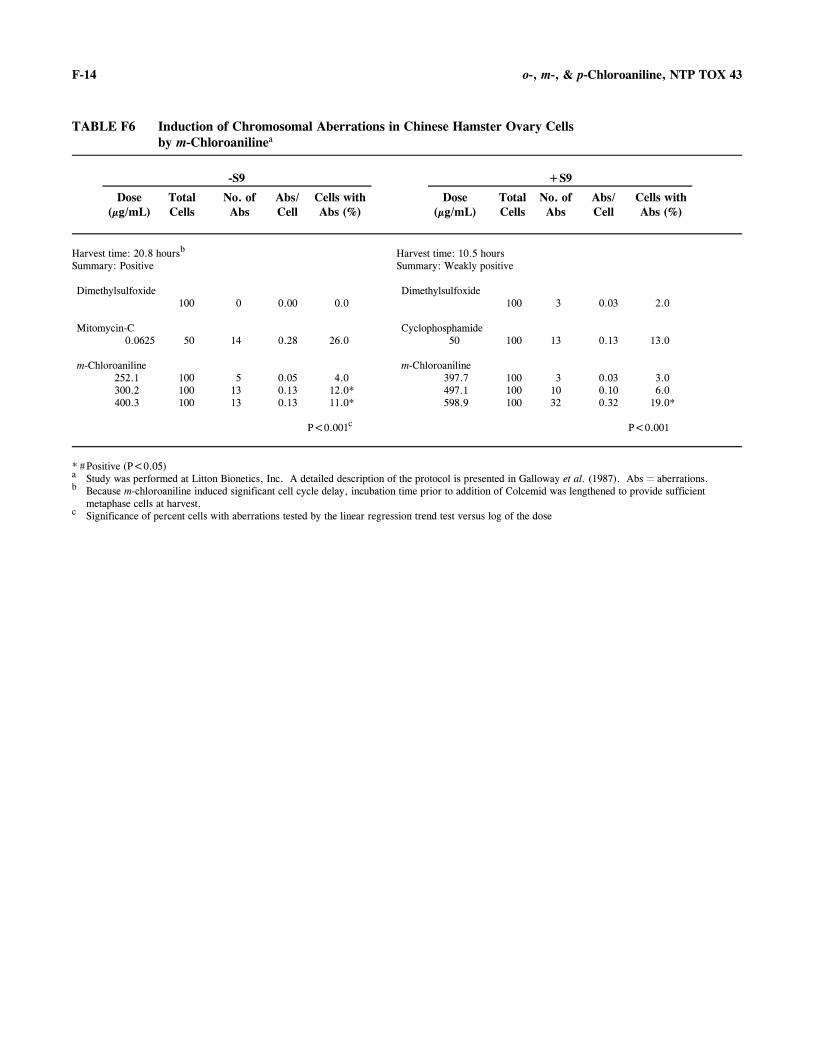
F-14
c
o-, m-, & p-Chloroaniline, NTP TOX 43
TABLE F6 Induction of Chromosomal Aberrations in Chinese Hamster Ovary Cells by m-Chloroanilinea
-S9 +S9
Dose (µg/mL)
Total Cells
No. of Abs
Abs/ Cell
Cells with Abs (%)
Dose (µg/mL)
Total Cells
No. of Abs
Abs/ Cell
Cells with Abs (%)
Harvest time: 20.8 hoursb
Summary: Positive Harvest time: 10.5 hours Summary: Weakly positive
Dimethylsulfoxide 100 0 0.00 0.0
Dimethylsulfoxide 100 3 0.03 2.0
Mitomycin-C 0.0625 50 14 0.28 26.0
Cyclophosphamide 50 100 13 0.13 13.0
m-Chloroaniline 252.1 300.2 400.3
100 100 100
5 13 13
0.05 0.13 0.13
4.0 12.0* 11.0*
m-Chloroaniline 397.7 497.1 598.9
100 100 100
3 10 32
0.03 0.10 0.32
3.0 6.0
19.0*
P<0.001c P<0.001
*#Positive (P<0.05) a Study was performed at Litton Bionetics, Inc. A detailed description of the protocol is presented in Galloway et al. (1987). Abs ˘ aberrations. b Because m-chloroaniline induced significant cell cycle delay, incubation time prior to addition of Colcemid was lengthened to provide sufficient
metaphase cells at harvest. Significance of percent cells with aberrations tested by the linear regression trend test versus log of the dose

F-15
c
o-, m-, & p-Chloroaniline, NTP TOX 43
aTABLE F7 Induction of Micronuclei in Bone Marrow Cells of F344/N Rats by o-Chloroaniline
Dose Micronucleated PCEs/1,000 PCEsb
(mg/kg)
Trial 1 Corn oil 1.50 ± 0.42
Cyclophosphamide 25 12.75 ± 1.30
o-Chloroaniline 200 1.60 ± 0.58 400 2.50 ± 0.61 550 4.00 ± 1.26
P˘0.007c
Trial 2 Corn oil 0.60 ± 0.37
Cyclophosphamide 25 13.60 ± 0.81
o-Chloroaniline 200 1.50 ± 0.35 400 2.38 ± 0.52 550 7.40 ± 3.70*
P<0.001
* Positive (P<0.008) a PCEs ˘ polychromatic erythrocytes. Data are presented as mean ± standard error for groups of five animals. b Two thousand polychromatic erythrocytes were scored per animal.
Significance of micronucleated PCEs/1,000 PCEs tested by a one-tailed trend test
aTABLE F8 Induction of Micronuclei in Bone Marrow Cells of F344/N Rats by m-Chloroaniline
Dose (mg/kg)
Micronucleated PCEs/1,000 PCEsb
Corn oil 1.5 ± 0.4
Cyclophosphamide 25 12.8 ± 1.3
m-Chloroaniline 25 100
1.5 ± 0.4 1.8 ± 0.6
P˘0.276c
a PCEs ˘ polychromatic erythrocytes. Data are presented as mean ± standard error for groups of five animals. b Two thousand polychromatic erythrocytes were scored per animal.
Significance of micronucleated PCEs/1,000 PCEs tested by a one-tailed trend test c
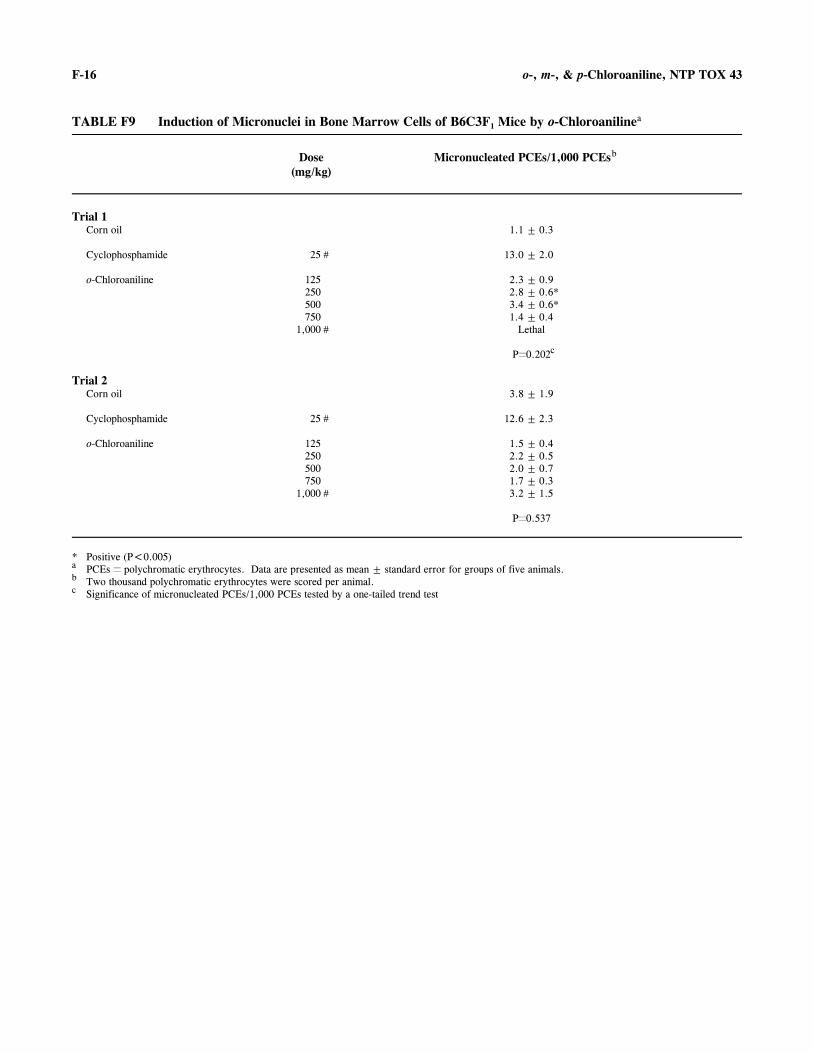
F-16
c
o-, m-, & p-Chloroaniline, NTP TOX 43
aTABLE F9 Induction of Micronuclei in Bone Marrow Cells of B6C3F Mice by o-Chloroaniline1
Dose Micronucleated PCEs/1,000 PCEsb
(mg/kg)
Trial 1 Corn oil 1.1 ± 0.3
Cyclophosphamide 25# 13.0 ± 2.0
o-Chloroaniline 125 2.3 ± 0.9 250 2.8 ± 0.6* 500 3.4 ± 0.6* 750 1.4 ± 0.4
1,000# Lethal
P˘0.202c
Trial 2 Corn oil 3.8 ± 1.9
Cyclophosphamide 25# 12.6 ± 2.3
o-Chloroaniline 125 1.5 ± 0.4 250 2.2 ± 0.5 500 2.0 ± 0.7 750 1.7 ± 0.3
1,000# 3.2 ± 1.5
P˘0.537
* Positive (P<0.005) a PCEs ˘ polychromatic erythrocytes. Data are presented as mean ± standard error for groups of five animals. b Two thousand polychromatic erythrocytes were scored per animal.
Significance of micronucleated PCEs/1,000 PCEs tested by a one-tailed trend test

F-17
c
o-, m-, & p-Chloroaniline, NTP TOX 43
aTABLE F10 Induction of Micronuclei in Bone Marrow Cells of B6C3F Mice by m-Chloroaniline1
Dose Micronucleated PCEs/1,000 PCEsb
(mg/kg)
Trial 1c
Corn oil 1.1 ± 0.3
Cyclophosphamide 25 13.0 ± 2.0
m-Chloroaniline 100 1.4 ± 0.4 200 1.0 ± 0.4 400 3.1 ± 0.7*
P<0.001d
Trial 2c
Corn oil 3.8 ± 1.9
Cyclophosphamide 25 12.6 ± 2.3
m-Chloroaniline 200 1.0 ± 0.4 400 2.4 ± 0.9 500 1.2 ± 0.3
P˘0.946
Trial 3e
Corn oil 1.2 ± 0.2
Cyclophosphamide 25 16.9 ± 3.3
m-Chloroaniline 100 2.3 ± 0.9 200 2.3 ± 0.3
P˘0.066
* Positive (P<0.008) a PCEs ˘ polychromatic erythrocytes. Data are presented as mean ± standard error for groups of five animals. b Two thousand polychromatic erythrocytes were scored per animal.
Bone marrow was sampled 24 hours after mice received a single intraperitoneal injection. d Significance of micronucleated PCEs/1,000 PCEs tested by a one-tailed trend test e Mice received three intraperitoneal injections at 24-hour intervals; bone marrow was sampled 24 hours after the third injection.

F-18
c
o-, m-, & p-Chloroaniline, NTP TOX 43
TABLE F11 Frequency of Micronuclei in Peripheral Blood of B6C3F Mice Treated with o-Chloroaniline1
for 13 Weeksa
Dose Micronucleated NCEs/1,000 NCEsb
(mg/kg)
Male 0
10 20 40 80
160
1.0 ± 0.2 1.1 ± 0.3 1.3 ± 0.2 1.6 ± 0.3 1.3 ± 0.3 0.7 ± 0.2
P<0.835c
Female 0
10 20 40 80
160
0.7 ± 0.3 1.2 ± 0.3 0.8 ± 0.1 0.9 ± 0.2 0.9 ± 0.2 0.8 ± 0.3
P˘0.597
a NCEs ˘ normochromatic erythrocytes. Data are presented as mean ± standard error for groups of five animals. b Two thousand normochromatic erythrocytes were scored per animal. Differences from the control group were not significant at P<0.005.
Significance of micronucleated NCEs/1,000 NCEs tested by a one-tailed trend test, significant at P<0.025.

F-19
c
o-, m-, & p-Chloroaniline, NTP TOX 43
TABLE F12 Frequency of Micronuclei in Peripheral Blood of B6C3F Mice Treated with m-Chloroaniline1
for 13 Weeksa
Dose Micronucleated NCEs/1,000 NCEsb
(mg/kg)
Male 0
10 20 40 80
160
0.9 ± 0.2 1.1 ± 0.1 1.4 ± 0.1 1.1 ± 0.2 1.0 ± 0.2 1.2 ± 0.3
P<0.422c
Female 0
10 20 40 80
160
0.6 ± 0.2 1.1 ± 0.3 1.0 ± 0.0 1.4 ± 0.2 1.0 ± 0.2 0.9 ± 0.2
P˘0.491
a NCEs ˘ normochromatic erythrocytes. Data are presented as mean ± standard error for groups of five animals. b Two thousand normochromatic erythrocytes were scored per animal. Differences from the control group were not significant at P<0.005.
Significance of micronucleated NCEs/1,000 NCEs tested by a one-tailed trend test, significant at P<0.025.

F-20 o-, m-, & p-Chloroaniline, NTP TOX 43


![4-Bromofluorobenzene [CAS No. 460-00-4] Review …...4-Bromofluorobenzene [CAS No. 460-00-4] Review of Toxicological Literature Prepared for National Toxicology Program (NTP) National](https://static.fdocuments.in/doc/165x107/5e914dd7e205906d4d102911/4-bromofluorobenzene-cas-no-460-00-4-review-4-bromofluorobenzene-cas-no.jpg)