NSL LTD Full Year Financial Statements and Dividend … · 2017-10-20 · FY 2015 FY 2014 S$’000...
24
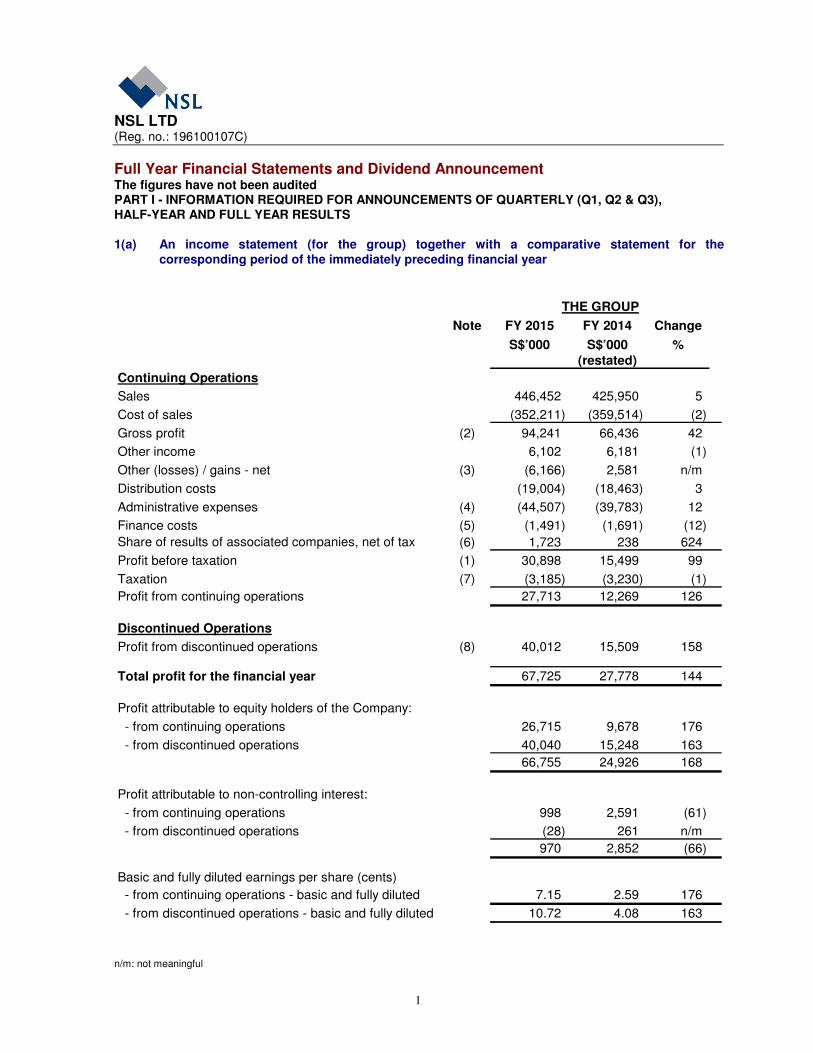
NSL LTD (Reg. no.: 196100107C) 1 Full Year Financial Statements and Dividend Announcement The figures have not been audited PART I - INFORMATION REQUIRED FOR ANNOUNCEMENTS OF QUARTERLY (Q1, Q2 & Q3), HALF-YEAR AND FULL YEAR RESULTS 1(a) An income statement (for the group) together with a comparative statement for the corresponding period of the immediately preceding financial year Note FY 2015 FY 2014 Change S$’000 S$’000 % (restated) Continuing Operations Sales 446,452 425,950 5 Cost of sales (352,211) (359,514) (2) Gross profit (2) 94,241 66,436 42 Other income 6,102 6,181 (1) Other (losses) / gains - net (3) (6,166) 2,581 n/m Distribution costs (19,004) (18,463) 3 Administrative expenses (4) (44,507) (39,783) 12 Finance costs (5) (1,491) (1,691) (12) Share of results of associated companies, net of tax (6) 1,723 238 624 Profit before taxation (1) 30,898 15,499 99 Taxation (7) (3,185) (3,230) (1) Profit from continuing operations 27,713 12,269 126 Discontinued Operations Profit from discontinued operations (8) 40,012 15,509 158 Total profit for the financial year 67,725 27,778 144 Profit attributable to equity holders of the Company: - from continuing operations 26,715 9,678 176 - from discontinued operations 40,040 15,248 163 66,755 24,926 168 Profit attributable to non-controlling interest: - from continuing operations 998 2,591 (61) - from discontinued operations (28) 261 n/m 970 2,852 (66) Basic and fully diluted earnings per share (cents) - from continuing operations - basic and fully diluted 7.15 2.59 176 - from discontinued operations - basic and fully diluted 10.72 4.08 163 THE GROUP n/m: not meaningful
Transcript of NSL LTD Full Year Financial Statements and Dividend … · 2017-10-20 · FY 2015 FY 2014 S$’000...
NSL LTD (Reg. no.: 196100107C)
1
Full Year Financial Statements and Dividend Announcement The figures have not been audited PART I - INFORMATION REQUIRED FOR ANNOUNCEMENTS OF QUARTERLY (Q1, Q2 & Q3), HALF-YEAR AND FULL YEAR RESULTS
1(a) An income statement (for the group) together with a comparative statement for the
corresponding period of the immediately preceding financial year
Note FY 2015 FY 2014 Change
S$’000 S$’000 %
(restated)
Continuing Operations
Sales 446,452 425,950 5
Cost of sales (352,211) (359,514) (2)
Gross profit (2) 94,241 66,436 42
Other income 6,102 6,181 (1)
Other (losses) / gains - net (3) (6,166) 2,581 n/m
Distribution costs (19,004) (18,463) 3
Administrative expenses (4) (44,507) (39,783) 12
Finance costs (5) (1,491) (1,691) (12)
Share of results of associated companies, net of tax (6) 1,723 238 624
Profit before taxation (1) 30,898 15,499 99
Taxation (7) (3,185) (3,230) (1)
Profit from continuing operations 27,713 12,269 126
Discontinued Operations
Profit from discontinued operations (8) 40,012 15,509 158
Total profit for the financial year 67,725 27,778 144
Profit attributable to equity holders of the Company:
- from continuing operations 26,715 9,678 176
- from discontinued operations 40,040 15,248 163
66,755 24,926 168
Profit attributable to non-controlling interest:
- from continuing operations 998 2,591 (61)
- from discontinued operations (28) 261 n/m
970 2,852 (66)
Basic and fully diluted earnings per share (cents)
- from continuing operations - basic and fully diluted 7.15 2.59 176
- from discontinued operations - basic and fully diluted 10.72 4.08 163
THE GROUP
n/m: not meaningful
NSL LTD (Reg. no.: 196100107C)
2
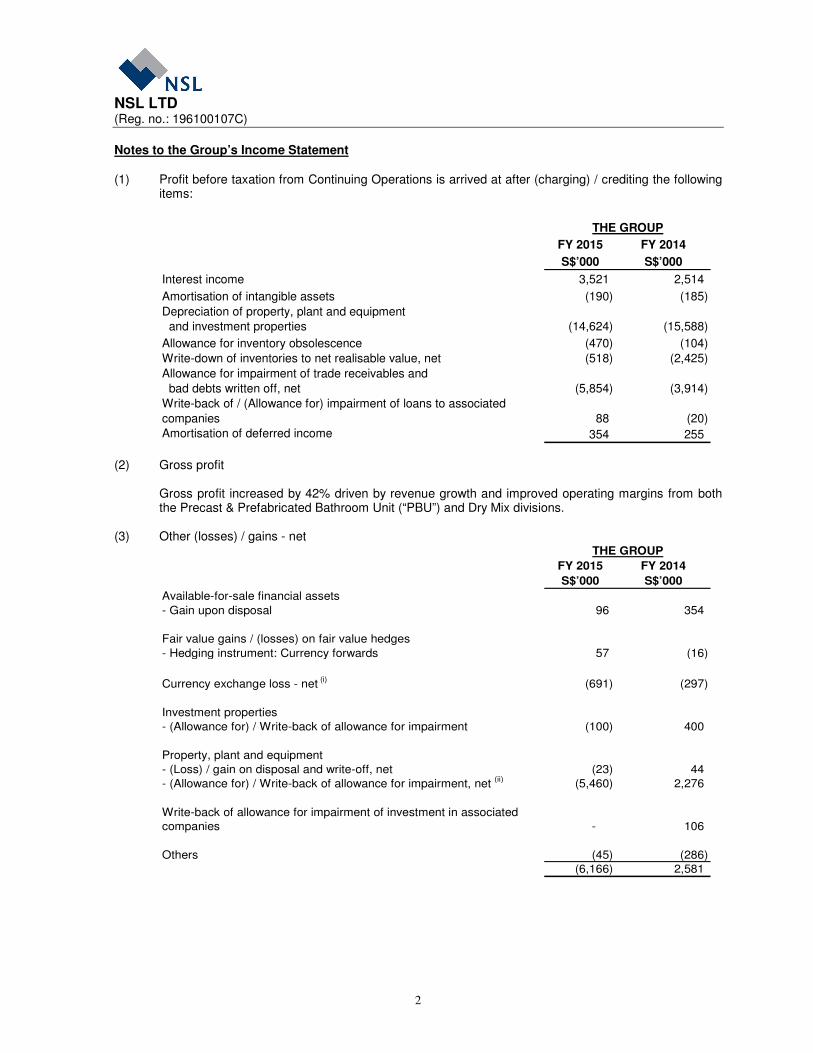
Notes to the Group’s Income Statement (1) Profit before taxation from Continuing Operations is arrived at after (charging) / crediting the following
items:
FY 2015 FY 2014
S$’000 S$’000
Interest income 3,521 2,514
Amortisation of intangible assets (190) (185)
Depreciation of property, plant and equipment
and investment properties (14,624) (15,588)
Allowance for inventory obsolescence (470) (104)
Write-down of inventories to net realisable value, net (518) (2,425)
Allowance for impairment of trade receivables and
bad debts written off, net (5,854) (3,914)
Write-back of / (Allowance for) impairment of loans to associated
companies 88 (20)
Amortisation of deferred income 354 255
THE GROUP
(2) Gross profit
Gross profit increased by 42% driven by revenue growth and improved operating margins from both the Precast & Prefabricated Bathroom Unit (“PBU”) and Dry Mix divisions.
(3) Other (losses) / gains - net
FY 2015 FY 2014
S$’000 S$’000
Available-for-sale financial assets
- Gain upon disposal 96 354
Fair value gains / (losses) on fair value hedges
- Hedging instrument: Currency forwards 57 (16)
Currency exchange loss - net (i) (691) (297)
Investment properties
- (Allowance for) / Write-back of allowance for impairment (100) 400
Property, plant and equipment
- (Loss) / gain on disposal and write-off, net (23) 44
- (Allowance for) / Write-back of allowance for impairment, net (ii) (5,460) 2,276
Write-back of allowance for impairment of investment in associated companies - 106
Others (45) (286) (6,166) 2,581
THE GROUP

NSL LTD (Reg. no.: 196100107C)
3
Notes to the Group’s Income Statement (continued)
(3) Other (losses) / gains - net (continued)
(i) Increase in foreign exchange losses was attributable to exchange losses recorded by Precast & PBU and Dry Mix divisions.
(ii) Allowance for impairment loss of S$5.5 mil in FY2015 arose from the impairment of property,
plant and equipment in the Precast & PBU and Environmental Services divisions. The write-back of S$2.3 mil in FY 2014 was for property, plant and equipment of Raffles Marina Ltd., classified under “Others” division.
(4) Administrative expenses
The increase in administrative expenses was due mainly to higher allowance for impairment of trade receivables disclosed under note (1).
(5) Finance costs
The decrease in finance costs was due to lower interest expense as a result of reduced bank borrowings.
(6) Share of results of associated companies, net of tax
The improvement in share of results of associated companies was attributable to share of profits of PEINER SMAG Lifting Technologies GmbH (“PSLT”) in FY2015 following the completion of the Merger on 29 April 2015. [Please refer to note 8(a)]
(7) Taxation
FY 2015 FY 2014
Continuing Operations S$’000 S$’000
Taxation charge for the financial period comprises:
- Current period taxation 3,261 2,990
- (Over) / under-provision in respect of prior years (76) 240
3,185 3,230
THE GROUP
The effective tax rate of the Group in FY 2015 was lower than the Singapore corporate tax rate due mainly to the utilization of tax losses carried forward by the Group’s Singapore Precast operation.

NSL LTD (Reg. no.: 196100107C)
4
Notes to the Group’s Income Statement (continued) (8) Profit from discontinued operations
An analysis of the results of discontinued operations (disposal group held for sale) is as follows:
FY 2015 FY 2014
S$’000 S$’000
(restated)
Sales 10,684 71,492
Net expenses (11,690) (65,345)
(Loss) / profit before taxation (1,006) 6,147
Taxation (127) (595)
(Loss) / profit from discontinued operations before exceptional items (1,133) 5,552
Exceptional Items:
- Gain on disposal of subsidiaries 41,145 9,957
Profit from discontinued operations* 40,012 15,509
THE GROUP
*Breakdown of Profit from discontinued operations
FY 2015 FY 2014
S$’000 S$’000
(restated)
Engineering operations (1,066) 4,283
Lime and limestones operations (67) 1,269
Exceptional gain / (loss) on disposal
- Lime business 27,250 -
- NSCT - 9,957
- NSE group 13,895 -
41,145 9,957
40,012 15,509
THE GROUP
a) On 5 December 2014, the Company and its direct wholly-owned subsidiary, NSL Engineering Holdings Pte. Ltd.
(“NSEH”) entered into agreement with Salzgitter Maschinenbau AG (“SMAG”) in relation to the merger of NSE’s RAM container spreader business with SMAG’s grab business as the world’s leading independent lifting device group in both bulk cargo and container handling. Under the agreement, NSEH will inject NSL Engineering Pte Ltd (“NSE”) into SMAG’s wholly-owned subsidiary, PEINER SMAG Lifting Technologies GmbH (“PSLT”) in exchange for 33.33% equity stake in PSLT, the new holding company of NSE Group, with SMAG holding the remaining 66.67% equity stake.(“The Merger” ) The NSE Group was a separate major line of business and was responsible for trading and management of spreader business. In accordance with FRS 105, Non-current Assets Held for Sale and Discontinued Operations, the NSE Group was disclosed as a discontinued operation and the carrying value of assets and liabilities of the NSE Group were classified as held for sale from 4Q-2014 and measured at the lower of carrying amount and fair value less costs to sell prior to their disposal.
Following the completion of the Merger on 29 April 2015, the 33.33% non-controlling equity stake in PSLT has been accounted for as an investment in associate as the Group has significant influence over PSLT and the share of financial results of PSLT has been accounted for based on the equity method under FRS 28 Investments in Associates and Joint Ventures.
NSL LTD (Reg. no.: 196100107C)
5
Notes to the Group’s Income Statement (continued) (8) Profit from discontinued operations (continued) b)(i) The divestment of lime business in Singapore and Malaysia was completed on 17 February 2015 for a cash
consideration of approximately S$42.9 mil. The gain on divestment of lime business in Singapore and Malaysia recognized in FY2015 was approximately S$26.8 mil, subject to finalization of the completion account’s adjustments.
Such lime and limestone business was a major line of business in Chemicals segment and was responsible with trading and management of lime and limestone business. In accordance with FRS 105, Non-current Assets Held for Sale and Discontinued Operations, the lime and limestone business in Chemicals segment was disclosed as a discontinued operation. Comparative operating results for the financial period ended 31 December 2014 have been restated accordingly.
b)(ii) During 3Q-2015, the Group disposed of its wholly-owned dormant subsidiary in the People’s Republic of China
(“PRC”), Chizhou NSL Minerals Co. Ltd (“CNM”), to a third party for net proceeds of approximately S$0.7 mil. The gain on divestment recognized in FY2015 was about S$0.4 mil. CNM holds quarry assets in the PRC.
c) In FY2013, the Group, through its wholly-owned subsidiary, NSL Chemicals Ltd (“NSC”), signed a share purchase agreement (the “Agreement”) to dispose of the entire issued and paid-up share capital of NSL Chemicals (Thailand) Pte Ltd (“NSCT”), which holds a 22.83% shareholding in Bangkok Synthetics Co., Ltd (“BST”) to SCG Chemicals Co., Ltd, (“SCG Chemicals”) for an initial cash consideration of S$311.2 mil and Contingent Consideration (as defined below).
In accordance with the Agreement, SCG Chemicals is obliged to pay NSC the insurance compensation (net of
tax) received by BST and its subsidiaries during the period between 1 October 2013 and 31 December 2017 (“Insurance Claim Proceeds”), pursuant to insurance claims made in relation to the fire incident on 5 May 2012. SCG Chemicals shall pay NSC an amount equivalent to NSCT’s previous proportionate share of BST (“Contingent Consideration”). Contingent Consideration totaling S$17.4 mil was received and recognized in financial year ended 31 December 2013 upon completion of the disposal. During the first quarter of 2014, NSC recognized an additional Contingent Consideration of approximately S$10.0 mil (net of tax), based on the Group’s share of insurance compensation (net of tax) received by BST and its subsidiaries. The amount constituted the final settlement of the Contingent Consideration under the Agreement.
Gains related to the disposal of NSCT and the share of operating performance of BST was presented separately
on the income statement as part of “discontinued operations”.
d) The details of assets and liabilities of the disposal group classified as held for sale for the Group are as follows:
31.12.15 31.12.14S$’000 S$’000
Assets
Inventories 9 20,368
Cash and bank balances 97 10,424
Receivables and prepayments 97 16,963 Property, plant and equipment 4,026 26,401
Intangible assets - 423 Deferred tax assets - 571
Associated company - 1 Other non-current assets - 18 Total assets 4,229 75,169
Liabilities
Short term borrowings - 1,887
Trade and other payables 517 14,775 Provision for other liabilities and charges - 2,454 Other current liabilities - 30
Long term borrowings - 309 Deferred tax liabilities 490 1,395 Total liabilities 1,007 20,850
THE GROUP

NSL LTD (Reg. no.: 196100107C)
6
Statement of Comprehensive Income for Financial Year ended 31 December 2015
FY 2015 FY 2014
S$’000 S$’000
Total profit for the year 67,725 27,778
Other comprehensive income:
Items that may be reclassified subsequently to profit or loss:
Exchange differences on translating foreign operations
- Losses arising during the year (4,989) (901)
Available-for-sale financial assets
- Gains / (losses) arising during the year 436 (582)
Income tax relating to components of other comprehensive income 14 37
Other comprehensive losses for the year, net of tax (4,539) (1,446)
Total comprehensive income for the year 63,186 26,332
Total comprehensive income attributable to:
Equity holders of the Company 62,600 23,719
Non-controlling interests 586 2,613
63,186 26,332
THE GROUP

NSL LTD (Reg. no.: 196100107C)
7
1(b)(i) A statement of financial position (for the issuer and group), together with a comparative statement as at the end of the immediately preceding financial year
31.12.15 31.12.14 31.12.15 31.12.14S$’000 S$’000 S$’000 S$’000
EquityShare capital 193,839 193,839 193,839 193,839
Reserves 366,598 332,811 267,715 225,785
Shareholders’ equity 560,437 526,650 461,554 419,624
Non-controlling interests 11,007 13,817 - -
Total equity 571,444 540,467 461,554 419,624
Current Assets
Inventories 48,138 59,121 - -
Receivables and prepayments 116,330 132,665 36,846 35,268
Tax recoverable 1,124 1,127 - -
Cash and bank balances 334,448 288,429 227,033 190,626
Other current assets 57 - - -
500,097 481,342 263,879 225,894 Assets of disposal group classified as held-for-sale (Note 8) 4,229 75,169 - -
504,326 556,511 263,879 225,894
Non-Current Assets
Property, plant and equipment 136,751 138,943 144 256
Investment properties 8,376 8,648 - -
Subsidiaries - - 85,232 85,232
Associated companies 52,692 6,107 - -
Long term receivables and prepayments 822 1,328 121,354 118,652
Available-for-sale financial assets 9,318 8,882 8,836 8,317
Intangible assets 9,306 9,439 - -
Deferred tax assets 5,290 3,347 - -
Other non-current assets 140 99 - -
222,695 176,793 215,566 212,457
Total Assets 727,021 733,304 479,445 438,351
Current Liabilities
Borrowings (18,407) (19,695) - -
Trade and other payables (116,058) (129,862) (17,803) (18,657) Tax
atioCurrent income tax liabilities (2,429) (3,157) (88) (33)
Deferred income (282) (337) - -
(137,176) (153,051) (17,891) (18,690)
Liabilities directly associated with disposal
group classified as held-for-sale (Note 8) (1,007) (20,850) - -
(138,183) (173,901) (17,891) (18,690)
Non-Current Liabilities
Provision for retirement benefits (2,519) (1,994) - -
Deferred tax liabilities (3,864) (3,840) - (37)
Borrowings (9,842) (11,728) - -
Deferred income (1,169) (1,374) - -
(17,394) (18,936) - (37)
Total Liabilities (155,577) (192,837) (17,891) (18,727)
Net Assets 571,444 540,467 461,554 419,624
THE GROUP THE COMPANY
NSL LTD (Reg. no.: 196100107C)
8
Explanatory notes on consolidated statement of financial position a) Inventories
The decrease in inventories was due mainly to delivery of completed precast components for the operation in Malaysia under the Precast & PBU division.
b) Receivables and Prepayments The decrease in receivables and prepayments was mainly the result of lower trade receivables from the Precast operation in Malaysia following the completion of a key project, as well as a decline in turnover of the Environmental Services division.
c) Investment in Associated Companies The increase in investment in associated companies was attributable to recognition of the Group’s 33.33% interest in PSLT following the merger of the Group’s container spreader business with Salzgitter Maschinenbau AG’s grab business on 29 April 2015.
d) Trade and other payables The decrease in trade and other payables was due mainly to the completion of a key project for our Precast operation in Malaysia.
e) Assets of disposal group classified as held-for-sale Liabilities directly associated with disposal group classified as held-for-sale The reductions were due to the completion of the disposal of the Group’s Lime and Engineering businesses on 17 February 2015 and 29 April 2015 respectively.
1(b)(ii) Aggregate amount of group’s borrowings and debt securities Amount repayable in one year or less, or on demand
As at 31 December 2015 As at 31 December 2014
Secured Unsecured Secured Unsecured
S$’000 S$’000 S$’000 S$’000
17,941 466 18,957* 738*
Amount repayable after one year
As at 31 December 2015 As at 31 December 2014
Secured Unsecured Secured Unsecured
S$’000 S$’000 S$’000 S$’000
9,842 - 11,728* -
* Amounts as at 31 December 2014 do not include secured borrowings of S$901,000 and unsecured
borrowings of S$986,000 repayable in one year or less, or on demand, and secured borrowings of S$309,000 repayable after one year, which have been classified as “liabilities directly associated with disposal group classified as held-for-sale”.
Details of any collateral Included in the Group’s property, plant and equipment are property, plant and equipment of subsidiaries of net book value of S$29,444,000 (31 December 2014: S$32,511,000) charged by way of debentures to banks for overdraft and term loan facilities granted.
NSL LTD (Reg. no.: 196100107C)
9
1(c) A statement of cash flows (for the group), together with a comparative statement for the corresponding period of the immediately preceding financial year
FY 2015 FY 2014
S$’000 S$’000(restated)
Cash Flows from Operating Activities
Profit from continuing operations 27,713 12,269
Profit from discontinued operations 40,012 15,509
Profit for the financial year 67,725 27,778
Adjustments for:
Taxation 3,312 3,825
Amortisation of intangible assets 246 423 Amortisation of deferred income (354) (255)
Depreciation of properties, plant and equipment and investment properties 15,518 19,029 Property, plant and equipment written off 38 221 Interest expense 1,526 1,877
Interest income (3,525) (2,597)Dividend income from available-for-sale financial assets (758) (1,895)
Allowance for impairment of loans to associated companies - 20 Allowance / (write-back of allowance) for impairment of property, plant and equipment 5,664 (2,276)
Allowance for impairment of intangible assets 170 - Write-back of allowance for impairment of investment in associated companies - (106)Allowance / (write-back of allowance) for impairment of an investment property 100 (400)
Gain on disposal of property, plant and equipment (net) (17) (169)Insurance compensation - (311)
Net gain on disposal of available-for-sale financial assets - (354)Provision for retirement benefits (net) 557 398
Share of results of associated companies, net of tax (1,723) (238)Professional fees related to divestments of subsidiaries - 1,022 Gain on disposal of subsidiaries (41,145) (9,957)
Exchange differences and other adjustments 3 342 Operating cash flows before working capital changes 47,337 36,377
Changes in working capital, net of effects from disposal of a subsidiary company:
Inventories 9,562 13,351 Receivables and prepayments 15,759 (5,976)Deferred income 107 39
Trade and other payables (14,130) 9,403 Cash generated from operations 58,635 53,194
Income tax paid (6,421) (6,073)
Retirement benefits paid (124) (165)Net cash generated from operating activities 52,090 46,956
Cash Flows from Investing Activities
Proceeds from disposal of property, plant and equipment 226 543
Proceeds from disposal of available-for-sale financial assets and other assets - 354 Net cash inflow from disposal of subsidiary companies 34,668 10,170
Professional fees related to divestments of subsidiaries - (1,022)Purchases of property, plant and equipment (21,786) (18,172)Purchases of intangible assets (144) (671)
Interest received 3,062 1,863 Dividends received from associated companies 1,629 -
Dividends received from available-for-sale financial assets 758 1,895 Net cash generated from / (used in) investing activities 18,413 (5,040)
The Group
NSL LTD (Reg. no.: 196100107C)
10
FY 2015 FY 2014
S$’000 S$’000(restated)
Cash Flows from Financing ActivitiesProceeds from borrowings 26,979 28,104
Repayment of borrowings (26,878) (37,380)
Finance leases and hire purchases (223) (1,754)
Interest paid (1,735) (1,797)
Bank deposits pledged (371) (548)
Dividends paid to shareholders (29,885) (186,779)
Dividends paid to non-controlling interests (741) (1,729)
Net cash used in financing activities (32,854) (201,883)
Net increase / (decrease) in cash and cash equivalents 37,649 (159,967)
Cash and cash equivalents at beginning of the year 295,038 455,666
Effects of exchange rate changes on cash and cash equivalents (1,416) (661)
Cash and cash equivalents at end of the year 331,271 295,038
Cash and cash equivalents at end of the year comprise:
- Cash and bank balances 334,448 288,429
- Cash classified as disposal group asset held for sale 97 10,424
- Less: bank deposits pledged (3,274) (2,903)
- Less: bank overdrafts - (912)
331,271 295,038
The Group
Disposal of subsidiaries
FY 2015 FY 2014
S$’000 S$’000
Carrying amounts of assets and liabilities disposed of
Cash and cash equivalents 8,237 - Trade and other receivables 16,199 -
Other current asset 22,265 - Property, plant and equipment 23,188 -
Other non-current assets 770 - Total assets 70,659 -
Trade and other payables (21,255) - Deferred income tax liabilities (794) -
Other non-current liabilities (7) - Total liabilities (22,056) -
Net assets derecognised 48,603 - Less: Non-controlling interests (2,655) -
Net assets disposed of 45,948 -
The aggregate cash inflows arising from the disposal of subsidiaries were:
Net assets disposed of 45,948 - - Reclassification of currency translation reserve 1,292 -
- Reclassification of revaluation reserve (220) - 47,020 -
Gain on disposal 41,145 9,957
Total sale consideration, net of transaction costs 88,165 9,957 Less: Investment in associate (45,338) - Less: Cash and cash equivalents in subsidiary disposed of (8,237) - (Less) / Add: Sale consideration (receivable) / received, net (107) 213 Add: Professional fees payable, net 185 -
Net cash inflow on disposal of subsidiaries 34,668 10,170
THE GROUP

NSL LTD (Reg. no.: 196100107C)
11
Analysis of consolidated statement of cash flows The Group generated S$52.1 mil of operating cash flow in FY 2015 as compared to S$47.0 mil in FY 2014. The higher operating cash flow was mainly attributable to higher profits from continuing operations. Net cash inflow generated from investing activities in FY 2015 was S$18.4 mil mainly from the cash inflow from disposal of the lime business, partly offset by purchase of property, plant and equipment. A total of S$32.9 mil (FY 2014: S$201.9 mil) was used in financing activities in FY 2015, mainly for the payment of FY2014 final and FY2015 interim dividends to shareholders. Overall, the Group recorded a net cash inflow of S$37.6 mil for FY 2015 as compared to cash outflow of S$160.0 mil in FY 2014, owing mainly to higher dividend payment of S$186.8 mil in FY 2014. Group cash and cash equivalent stood at S$331.3 mil as of 31 December 2015.
NSL LTD (Reg. no.: 196100107C)
12
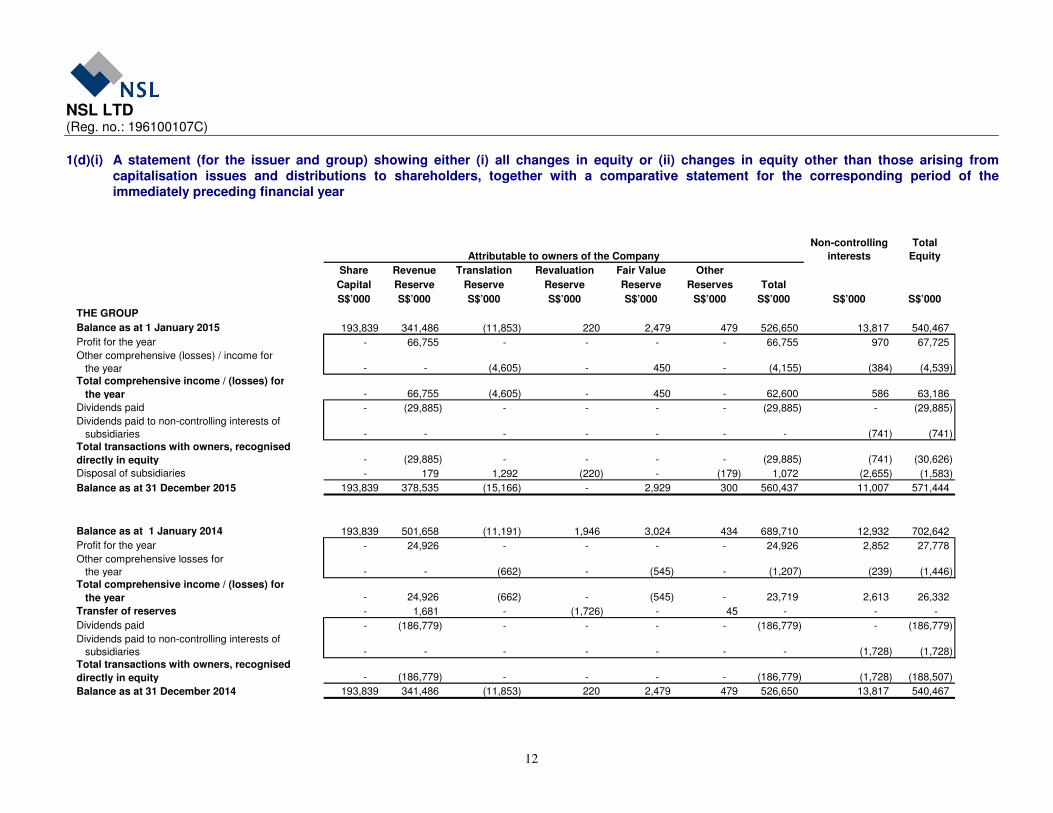
1(d)(i) A statement (for the issuer and group) showing either (i) all changes in equity or (ii) changes in equity other than those arising from capitalisation issues and distributions to shareholders, together with a comparative statement for the corresponding period of the immediately preceding financial year
Share Revenue Translation Revaluation Fair Value Other
Capital Reserve Reserve Reserve Reserve Reserves Total
S$’000 S$’000 S$’000 S$’000 S$’000 S$’000 S$’000 S$’000 S$’000
THE GROUP
Balance as at 1 January 2015 193,839 341,486 (11,853) 220 2,479 479 526,650 13,817 540,467
Profit for the year - 66,755 - - - - 66,755 970 67,725
Other comprehensive (losses) / income for
the year - - (4,605) - 450 - (4,155) (384) (4,539)
Total comprehensive income / (losses) for
the year - 66,755 (4,605) - 450 - 62,600 586 63,186
Dividends paid - (29,885) - - - - (29,885) - (29,885)
Dividends paid to non-controlling interests of
subsidiaries - - - - - - - (741) (741)
Total transactions with owners, recognised
directly in equity - (29,885) - - - - (29,885) (741) (30,626)
Disposal of subsidiaries - 179 1,292 (220) - (179) 1,072 (2,655) (1,583)
Balance as at 31 December 2015 193,839 378,535 (15,166) - 2,929 300 560,437 11,007 571,444
Attributable to owners of the Company
Non-controlling
interests
Total
Equity
Balance as at 1 January 2014 193,839 501,658 (11,191) 1,946 3,024 434 689,710 12,932 702,642
Profit for the year - 24,926 - - - - 24,926 2,852 27,778
Other comprehensive losses for the year - - (662) - (545) - (1,207) (239) (1,446)
Total comprehensive income / (losses) for
the year - 24,926 (662) - (545) - 23,719 2,613 26,332
Transfer of reserves - 1,681 - (1,726) - 45 - - -
Dividends paid - (186,779) - - - - (186,779) - (186,779)
Dividends paid to non-controlling interests of subsidiaries - - - - - - - (1,728) (1,728)
Total transactions with owners, recognised
directly in equity - (186,779) - - - - (186,779) (1,728) (188,507)
Balance as at 31 December 2014 193,839 341,486 (11,853) 220 2,479 479 526,650 13,817 540,467

NSL LTD (Reg. no.: 196100107C)
13
Share Revenue Fair Value
Capital Reserve Reserve Total
S$’000 S$’000 S$’000 S$’000
THE COMPANY
Balance as at 1 January 2015 193,839 223,696 2,089 419,624
Total comprehensive income for the year - 71,296 519 71,815
Dividends paid - (29,885) - (29,885)
Balance as at 31 December 2015 193,839 265,107 2,608 461,554
Balance as at 1 January 2014 193,839 373,646 2,656 570,141
Total comprehensive income for the year - 36,829 (567) 36,262
Dividends paid - (186,779) - (186,779)
Balance as at 31 December 2014 193,839 223,696 2,089 419,624 1(d)(ii) Details of any changes in the company's share capital arising from rights issue, bonus issue,
share buy-backs, exercise of share options or warrants, conversion of other issues of equity securities, issue of shares for cash or as consideration for acquisition or for any other purpose since the end of the previous period reported on. State also the number of shares that may be issued on conversion of all the outstanding convertibles, as well as the number of shares held as treasury shares, if any, against the total number of issued shares excluding treasury shares of the issuer, as at the end of the current financial period reported on and as at the end of the corresponding period of the immediately preceding financial year
There have been no changes to the issued share capital of the Company since 30 September 2015. There were no outstanding options as at 31 December 2015 (31 December 2014: Nil). The Company did not hold any treasury shares as at 31 December 2015 (31 December 2014: Nil). .
1(d)(iii) To show the total number of issued shares excluding treasury shares as at the end of the
current financial period and as at end of the immediately preceding year:-
31 December 2015 31 December 2014
Number of issued shares excluding treasury shares 373,558,237 373,558,237
1(d)(iv) A statement showing all sales, transfers, disposal, cancellation and/or use of treasury shares
as at end of the current financial period reported on.
There were no sales, transfer, disposal, cancellation and/or use of treasury shares as at 31 December 2015 (31 December 2014: Nil).
2. Whether the figures have been audited or reviewed, and in accordance with which auditing
standard or practice
The figures have not been audited or reviewed by the Group’s external auditors. 3. Where the figures have been audited or reviewed, the auditors’ report (including any
qualifications or emphasis of matter)
Not applicable.

NSL LTD (Reg. no.: 196100107C)
14
4. Whether the same accounting policies and methods of computation as in the issuer’s most
recently audited annual financial statements have been applied
The accounting policies and methods of computation applied by the Group are consistent with those used in its most recently audited financial statements, except for those disclosed under paragraph 5.
5. If there are any changes in the accounting policies and methods of computation, including any
required by an accounting standard, what has changed, as well as the reasons for, and the effect of, the change
The Group has applied the same accounting policies and method of computation in the financial statements for the current financial period compared with the audited financial statements for the year ended 31 December 2014. Below are the mandatory standards, amendments and interpretations to existing standards that have been published, and are relevant for the Group’s accounting periods beginning on or after 1 January 2015. FRS 103 - Business Combinations (effective for annual periods beginning on or after 1 July 2014). The standard is amended to clarify that an obligation to pay contingent consideration which meets the definition of a financial instrument is classified as a financial liability or as equity, on the basis of the definitions in FRS 32 Financial instruments: Presentation. The standard is further amended to clarify that all non-equity contingent consideration, both financial and non-financial, is measured at fair value at each reporting date, with changes in fair value recognised in profit and loss. The standard is also amended to clarify that FRS 103 does not apply to the accounting for the formation of any joint arrangement under FRS 111. The amendment also clarifies that the scope exemption only applies in the financial statements of the joint arrangement itself. The Group will apply this amendment for business combinations taking place on/after 1 January 2015. FRS 108 - Operating Segments (effective for annual periods beginning on or after 1 July 2014) The standard is amended to require disclosure of the judgements made by management in aggregating operating segments. This includes a description of the segments which have been aggregated and the economic indicators which have been assessed in determining that the aggregated segments share similar economic characteristics. The standard is further amended to require a reconciliation of segment assets to the entity’s assets when segment assets are reported. This amendment will not result in any changes to the Group’s accounting policies but will require more disclosures in the financial statements. The adoption of the above revised FRS did not have significant impact on the financial statements of the Group for the current financial period.
NSL LTD (Reg. no.: 196100107C)
15
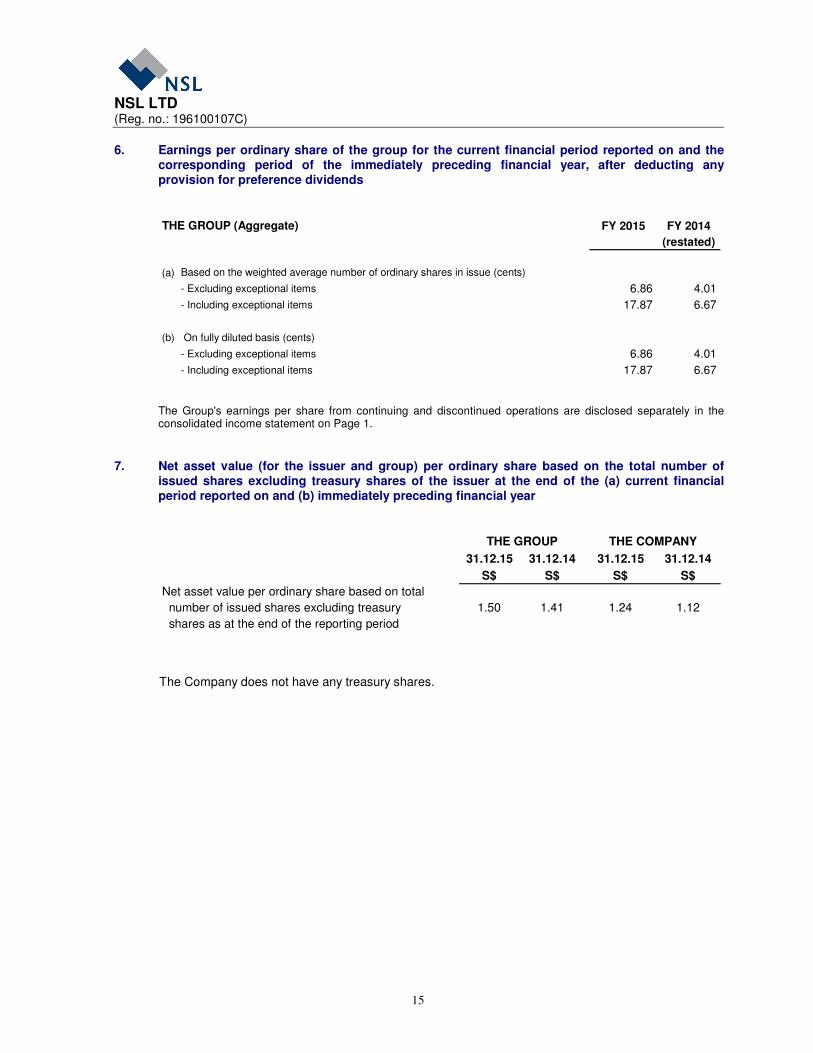
6. Earnings per ordinary share of the group for the current financial period reported on and the corresponding period of the immediately preceding financial year, after deducting any provision for preference dividends
FY 2015 FY 2014
(restated)
(a)
- Excluding exceptional items 6.86 4.01
- Including exceptional items 17.87 6.67
(b) On fully diluted basis (cents)
- Excluding exceptional items 6.86 4.01
- Including exceptional items 17.87 6.67
Based on the weighted average number of ordinary shares in issue (cents)
THE GROUP (Aggregate)
The Group's earnings per share from continuing and discontinued operations are disclosed separately in the consolidated income statement on Page 1.
7. Net asset value (for the issuer and group) per ordinary share based on the total number of
issued shares excluding treasury shares of the issuer at the end of the (a) current financial period reported on and (b) immediately preceding financial year
31.12.15 31.12.14 31.12.15 31.12.14
S$ S$ S$ S$
Net asset value per ordinary share based on total
number of issued shares excluding treasury
shares as at the end of the reporting period
1.50 1.41 1.24 1.12
THE GROUP THE COMPANY
The Company does not have any treasury shares.
NSL LTD (Reg. no.: 196100107C)
16
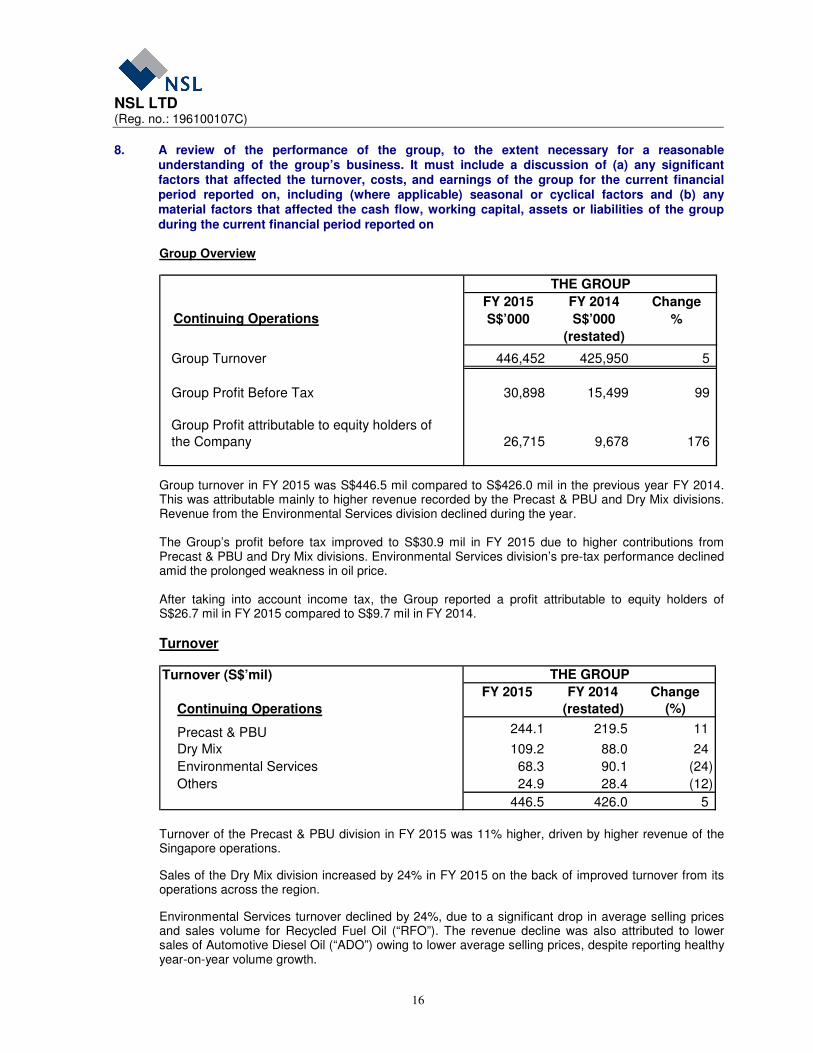
8. A review of the performance of the group, to the extent necessary for a reasonable understanding of the group’s business. It must include a discussion of (a) any significant factors that affected the turnover, costs, and earnings of the group for the current financial period reported on, including (where applicable) seasonal or cyclical factors and (b) any material factors that affected the cash flow, working capital, assets or liabilities of the group during the current financial period reported on
Group Overview
FY 2015 FY 2014 Change
Continuing Operations S$’000 S$’000 %
(restated)
Group Turnover 446,452 425,950 5
Group Profit Before Tax 30,898 15,499 99
Group Profit attributable to equity holders of
the Company 26,715 9,678 176
THE GROUP
Group turnover in FY 2015 was S$446.5 mil compared to S$426.0 mil in the previous year FY 2014. This was attributable mainly to higher revenue recorded by the Precast & PBU and Dry Mix divisions. Revenue from the Environmental Services division declined during the year. The Group’s profit before tax improved to S$30.9 mil in FY 2015 due to higher contributions from Precast & PBU and Dry Mix divisions. Environmental Services division’s pre-tax performance declined amid the prolonged weakness in oil price. After taking into account income tax, the Group reported a profit attributable to equity holders of S$26.7 mil in FY 2015 compared to S$9.7 mil in FY 2014.
Turnover
Turnover (S$’mil)
FY 2015 FY 2014 Change
Continuing Operations (restated) (%)
Precast & PBU 244.1 219.5 11
Dry Mix 109.2 88.0 24
Environmental Services 68.3 90.1 (24)
Others 24.9 28.4 (12)
446.5 426.0 5
THE GROUP
Turnover of the Precast & PBU division in FY 2015 was 11% higher, driven by higher revenue of the Singapore operations.
Sales of the Dry Mix division increased by 24% in FY 2015 on the back of improved turnover from its operations across the region.
Environmental Services turnover declined by 24%, due to a significant drop in average selling prices and sales volume for Recycled Fuel Oil (“RFO”). The revenue decline was also attributed to lower sales of Automotive Diesel Oil (“ADO”) owing to lower average selling prices, despite reporting healthy year-on-year volume growth.
NSL LTD (Reg. no.: 196100107C)
17
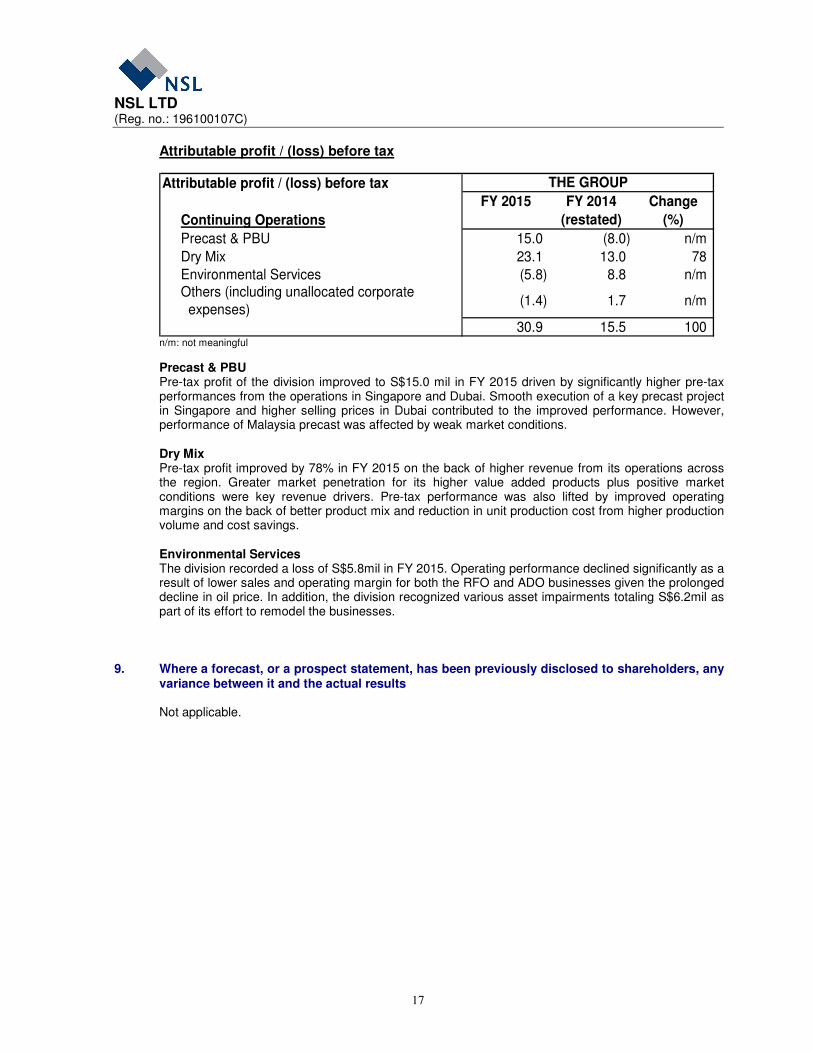
Attributable profit / (loss) before tax
Attributable profit / (loss) before tax
FY 2015 FY 2014 Change
Continuing Operations (restated) (%)
Precast & PBU 15.0 (8.0) n/m
Dry Mix 23.1 13.0 78
Environmental Services (5.8) 8.8 n/m Others (including unallocated corporate expenses)
(1.4) 1.7 n/m
30.9 15.5 100
THE GROUP
n/m: not meaningful
Precast & PBU Pre-tax profit of the division improved to S$15.0 mil in FY 2015 driven by significantly higher pre-tax performances from the operations in Singapore and Dubai. Smooth execution of a key precast project in Singapore and higher selling prices in Dubai contributed to the improved performance. However, performance of Malaysia precast was affected by weak market conditions. Dry Mix Pre-tax profit improved by 78% in FY 2015 on the back of higher revenue from its operations across the region. Greater market penetration for its higher value added products plus positive market conditions were key revenue drivers. Pre-tax performance was also lifted by improved operating margins on the back of better product mix and reduction in unit production cost from higher production volume and cost savings. Environmental Services The division recorded a loss of S$5.8mil in FY 2015. Operating performance declined significantly as a result of lower sales and operating margin for both the RFO and ADO businesses given the prolonged decline in oil price. In addition, the division recognized various asset impairments totaling S$6.2mil as part of its effort to remodel the businesses.
9. Where a forecast, or a prospect statement, has been previously disclosed to shareholders, any
variance between it and the actual results
Not applicable.
NSL LTD (Reg. no.: 196100107C)
18
10. A commentary at the date of the announcement of the significant trends and competitive conditions of the industry in which the group operates and any known factors or events that may affect the group in the next reporting period and the next 12 month
The Precast businesses particularly in Singapore and Malaysia are expected to face increased competition within a more subdued market while performance of Dubai Precast is expected to remain satisfactory underpinned by healthy order book. In the PBU business, Parmarine is expected to continue to contribute positively to the division’s overall results. Demand for Dry Mix products across the region is expected to remain satisfactory supported by firm demand. In the Environmental Services division, the RFO business will continue to face very difficult market conditions amidst the steep decline in oil price. The distribution business and waste management services are expected to remain subdued. The order book for PSLT remains satisfactory.
11. Dividend
(a) Current Financial Period Reported On Any interim / final dividend declared / recommended for the current financial period reported on? Yes
Name of Dividend Special interim FY2015 Final FY2015 Dividend Type Cash Cash Dividend amount per share S$0.03 per ordinary share S$0.05 per ordinary share
Tax Rate Exempt – one tier Exempt – one tier Date paid 26 May 2015 Refer to para 11(c)
(b) Corresponding Period of the Immediately Preceding Financial Year
Any dividend declared for the corresponding period of the immediately preceding financial year? Yes
Name of Dividend Final FY2014 Dividend Type Cash Dividend amount per share S$0.05 per ordinary
share Tax Rate Exempt – one tier Date paid 26 May 2015

NSL LTD (Reg. no.: 196100107C)
19
11. Dividend (continued)
(c) Date payable
Subject to the requisite approvals from shareholders at the annual general meeting (“AGM”) of the Company to be held on or about 29 April 2016, the final dividend of S$0.05 per ordinary share will be paid on or about 27 May 2016 or such other date to be determined by the Directors. (d) Books closure date
To be announced after the said AGM on or about 29 April 2016. 12. If no dividend has been declared/recommended, a statement to that effect
Not applicable. 13. If the Group has obtained a general mandate from shareholders for Interested Person
Transactions (“IPTs”), the aggregate value of such transactions as required under Rule 920(1)(a)(ii). If no IPT mandate has been obtained, a statement to that effect
The Group does not have a general mandate from shareholders for IPTs pursuant to Rule 920.

NSL LTD (Reg. no.: 196100107C)
20
PART II - ADDITIONAL INFORMATION REQUIRED FOR FULL YEAR ANNOUNCEMENT (This part is not applicable to Q1, Q2, Q3 or Half Year Results)
14. Segmented revenue and results for business or geographical segments (of the group) in the form presented in the issuer’s most recently audited annual financial statements, with comparative information for the immediately preceding year
Financial year ended 31 December 2015
Discontinued
Operations
S$’000 S$’000 S$’000 S$’000 S$’000 S$’000
Revenue
External sales 109,171 244,103 68,266 24,912 446,452 10,684
Inter-segment sales 150 2,774 1,380 1,930 6,234 558
Total revenue 109,321 246,877 69,646 26,842 452,686 11,242
Elimination (150) (2,774) (1,380) (1,930) (6,234) (558)
109,171 244,103 68,266 24,912 446,452 10,684
Profit before Taxation and
Exceptional Items23,163 14,932 (5,799) (1,398) 30,898 (1,006)
Exceptional items - - - - - 41,145
Profit before taxation 23,163 14,932 (5,799) (1,398) 30,898 40,139
Interest income 117 265 119 3,020 3,521 4
Interest expense (218) (1,085) (230) 42 (1,491) (35)
Depreciation (2,331) (6,328) (4,133) (1,832) (14,624) (894)
Amortisation - (190) - 354 164 (56)
- PSLT - - - 1,805 1,805 -
- Others (136) - - 54 (82) -
Total Assets 84,123 221,475 64,931 352,262 722,792 4,229
Total Liabilities 22,563 103,282 16,482 12,243 154,570 1,007
Investment in associated companies 645 1 - 52,046 52,692 -
Additions to:
- Property, plant and equipment 840 3,128 16,855 1,247 22,070 2,413
- Intangible assets - 90 - - 90 54
Share of results of associated
companies, net of tax
(204)
(Impairment) / reversal of
impairment of property, plant and equipment
- (3,336) (2,135) 11 (5,460)
Dry MixPrecast &
PBU
Environmental
ServicesOthers
Total for
Continuing
Operations

NSL LTD (Reg. no.: 196100107C)
21
Financial year ended 31 December 2014
Discontinued
Operations
S$’000 S$’000 S$’000 S$’000 S$’000 S$’000
Revenue
External sales 87,972 219,462 90,083 28,433 425,950 71,492
Inter-segment sales 1 2,042 1,480 1,457 4,980 378
Total revenue 87,973 221,504 91,563 29,890 430,930 71,870
Elimination (1) (2,042) (1,480) (1,457) (4,980) (378)
87,972 219,462 90,083 28,433 425,950 71,492
Profit before Taxation and
Exceptional Items13,013 (7,953) 8,788 1,651 15,499 6,147
Exceptional items - - - - - 9,957
Profit before taxation 13,013 (7,953) 8,788 1,651 15,499 16,104
Interest income 27 176 51 2,260 2,514 83
Interest expense (175) (1,475) (39) (2) (1,691) (186)
Depreciation (2,199) (8,496) (3,178) (1,715) (15,588) (3,441)
Amortisation - (185) - 255 70 (238)
Total Assets 64,498 227,529 70,505 295,603 658,135 75,169
Total Liabilities 20,175 122,107 16,135 13,570 171,987 20,850
Investment in associated companies - 1 - 6,106 6,107 1
Additions to:
- Property, plant and equipment 4,239 4,073 6,320 2,010 16,642 2,760
- Intangible assets - 399 - - 399 272
-
-
- 2,472 2,276
Share of results of associated
companies, net of tax(1) (3) - 242 238
Dry MixPrecast &
PBU
Environmental
ServicesOthers
Total for
Continuing
Operations
(Impairment) / reversal of impairment of property, plant and
equipment
- (196)
NSL LTD (Reg. no.: 196100107C)
22
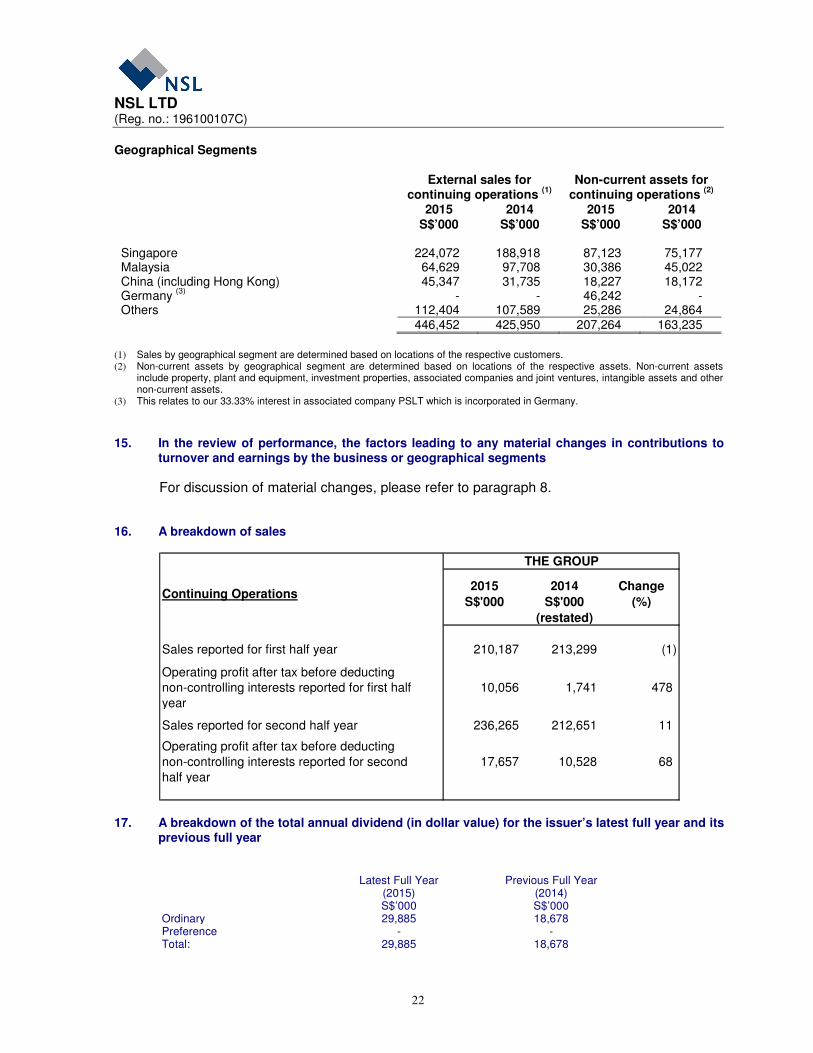
Geographical Segments External sales for
continuing operations (1)
Non-current assets for
continuing operations (2)
2015
S$’000 2014
S$’000 2015
S$’000 2014
S$’000 Singapore 224,072 188,918 87,123 75,177 Malaysia 64,629 97,708 30,386 45,022 China (including Hong Kong) 45,347 31,735 18,227 18,172 Germany
(3) - - 46,242 -
Others 112,404 107,589 25,286 24,864 446,452 425,950 207,264 163,235
(1) Sales by geographical segment are determined based on locations of the respective customers. (2) Non-current assets by geographical segment are determined based on locations of the respective assets. Non-current assets
include property, plant and equipment, investment properties, associated companies and joint ventures, intangible assets and other non-current assets.
(3) This relates to our 33.33% interest in associated company PSLT which is incorporated in Germany.
15. In the review of performance, the factors leading to any material changes in contributions to
turnover and earnings by the business or geographical segments
For discussion of material changes, please refer to paragraph 8. 16. A breakdown of sales
Continuing Operations2015
S$'000
2014
S$'000
Change
(%)
(restated)
Sales reported for first half year 210,187 213,299 (1)
Operating profit after tax before deducting non-controlling interests reported for first half
year
10,056 1,741 478
Sales reported for second half year 236,265 212,651 11
Operating profit after tax before deducting
non-controlling interests reported for second
half year
17,657 10,528 68
THE GROUP
17. A breakdown of the total annual dividend (in dollar value) for the issuer’s latest full year and its
previous full year
Latest Full Year (2015) S$’000
Previous Full Year (2014) S$’000
Ordinary 29,885 18,678 Preference - - Total: 29,885 18,678

NSL LTD (Reg. no.: 196100107C)
23
18. Disclosure of person occupying a managerial position in the issuer or any of its principal
subsidiaries who is a relative of a director or chief executive officer or substantial shareholder of the issuer pursuant to Rule 704(13) in the format below. If there are no such persons, the issuer must make an appropriate negative statement
Name Age Family relationship with any director and/or substantial shareholder
Current position and duties, and the year the position was held
Details of changes in duties and position held, if any, during the year
Ban Song Long
72 Cousin of Fu Kuo Chen David
Non-Executive Director 2003
None
Fu Kuo Chen David 55 Cousin of Ban Song Long and brother-in-law of Ong Beng Seng (see note below)
Non-Executive Director 2003
None
Note: Ong Beng Seng is deemed to be a substantial shareholder of NSL Ltd through 98 Holdings Pte Ltd, Excel Partners Pte Ltd, Excelfin Pte Ltd and Reef Investments Pte Ltd by virtue of the provisions under Section 7 of the Companies Act, Chapter 50.
BY ORDER OF THE BOARD LIM Su-Ling Company Secretary 25 February 2016

NSL LTD (Reg. no.: 196100107C)
24
This release may contain forward-looking statements which may be identified by phrases that the Company or Management or Directors “expects”, “believes” “anticipates” “foresees” or “forecasts”. These forward-looking statements, if any, are based on current expectations and assumptions that are subject to risks and uncertainties. Actual performance, outcome or financial results post the date of this release may differ materially from those expressed in this release. Some factors that may affect the actual performance of the NSL Ltd and its group of companies may include, without limitation, political, economic, geographical, climatic and social conditions in the countries where the NSL Ltd and its group of companies, its customers or its suppliers operate; armed conflict or the effects of terrorist activities or war, acts of God, tsunami, earthquake, natural disasters, floods, effects of global climatic change in any part of the world which may cause disruption in manufacture, supply (availability and costs) of raw or intermediate materials, power, water, fuel, crude oil, import, export, transportation network necessary for the acquisition and supply of goods and services or financial markets; currency fluctuations; fluctuations in the price of raw materials, power, water, fuel, crude oil or demand for natural rubber; volatility of financial markets; general industry conditions, interest rate trends, cost of borrowings and capital availability, intense competition from other companies and venues for the production, sale/distribution of goods and services of the NSL Ltd and its group of companies, changes in industry or market capacity or demands; obsolete inventory, market acceptance or rejection of new goods and services, continued market acceptance of existing goods and services of the NSL Ltd and its group of companies; risk of unanticipated increased costs of power, oil, fuel, crude oil or utilities to operate its various plants; continued ability of NSL Ltd and its group of companies to retain market size and competitiveness for its goods and services; the effect of changes to policies /regulations whether or not resulting in imposition or lifting of anti-dumping duties in countries which the NSL Ltd and its group of companies operate, industrial accident(s) in any facility(ies) of NSL Ltd and its group of companies and their effects; unavailability of insurance, adverse results on litigation or debt recovery, implementation of operating cost structure that is aligned with revenue growth; SARS, bird flu, killer pig disease and their effects; coup d’etat, civil unrest, civil uprisings, revolutions, demonstrations, protests in any part of the world where NSL Ltd and its group of companies operate; any factor which may cause revenues and income to fall short of anticipated levels; ability to develop manufacture and market products and services in a rapidly changing environment; management retention and succession; changes in operating expenses, including employee wages, benefits and training, and governmental and public policy changes. This statement only relates to information available as at the date of release and you are cautioned to seek professional advice from your stock broker, solicitor, accountant or other professional adviser if you are in any doubt as to the meaning of anything herein.


![Rigging & Lifting Handbook [NSL]](https://static.fdocuments.in/doc/165x107/55cf9d1d550346d033ac4bbc/rigging-lifting-handbook-nsl.jpg)