Novartis Annual Report 2016
274
Annual Report 2016
Transcript of Novartis Annual Report 2016

Annual Report2016

A cellular drama at the heart of a researcher’s family k page 38
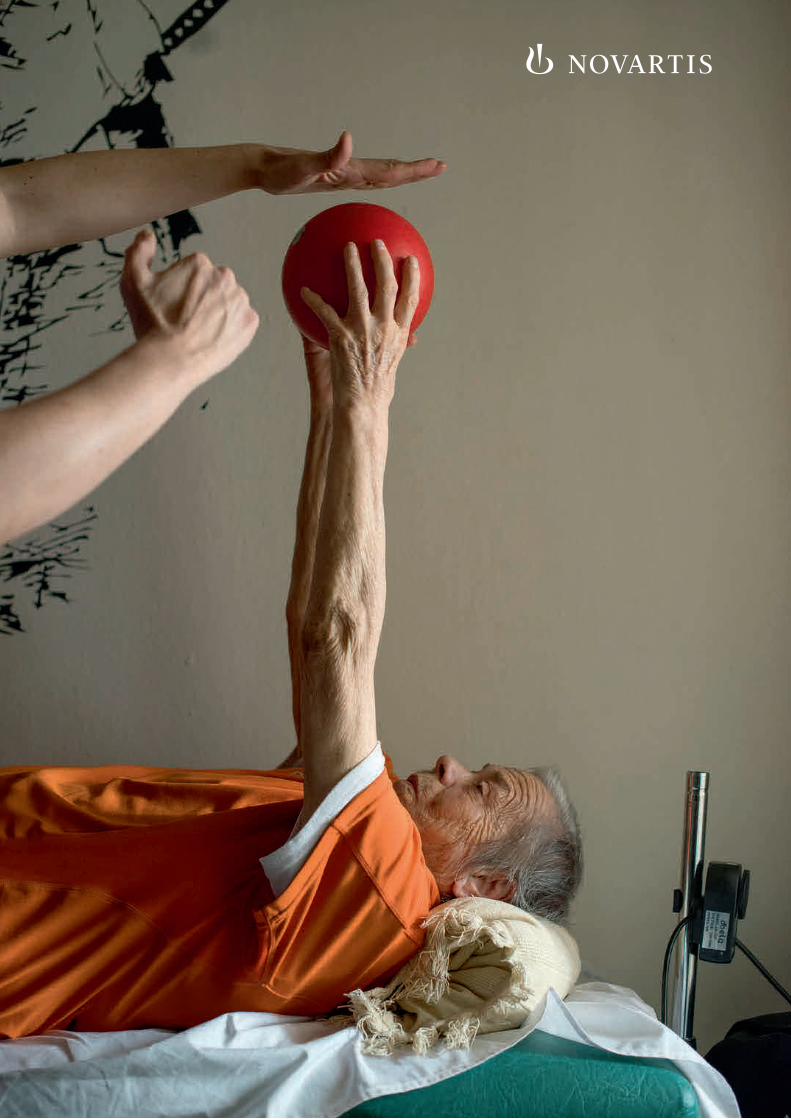
Helping Syrian refugees manage chronic diseases k page 58Cover image: Nurse Evelin Alvarado Fuentes drew blood from Maria
Magdelena Vasquez Lopez as part of a study of chronic obstructive pulmonary disease in rural Guatemala, where widespread use of wood fires for cooking contributes to respiratory disease.
Our missionOur mission is to discover new ways to improve and extend people’s lives. We use science-based innovation to address some of society’s most challenging healthcare issues. We discover and develop breakthrough treatments and find new ways to deliver them to as many people as possible. We also aim to provide a shareholder return that rewards those who invest their money, time and ideas in our company.
A fitness trainer strives to keep his mother’s mind limber k page 12
Fighting respiratory disease at the source k page 20
PHOTO ESSAYS

Novartis Annual Report 2016 | 1
ContentsCHAIRMAN’S LETTER 2CHIEF EXECUTIVE OFFICER’S LETTER 4KEY PERFORMANCE INDICATORS – CONSOLIDATED HIGHLIGHTS 62016 AT A GLANCE 8
STRATEGIC OVERVIEW Our environment 15Our strategy 17Our culture and values 18Our structure 19
PERFORMANCE Performance summary 23Innovative Medicines 32Sandoz 34Alcon 36
INNOVATIONInnovation 40Pipeline 52
CORPORATE RESPONSIBILITYCorporate responsibility strategy and governance 61Expanding access to healthcare 63Novartis access approaches: KPIs 2016 65Doing business responsibly 68
CORPORATE GOVERNANCELetter from the Chairman 76Summary of our corporate governance approach 79Our shares and our shareholders 80Our Board of Directors 86Our management 98Our independent external auditors 104Our corporate governance framework 105Further information 106
COMPENSATION REPORTCompensation Committee Chairman’s letter 1102016 Executive Committee compensation system 1162016 CEO compensation 1232017 Executive Committee compensation system 1362016 Board compensation system 1372016 Board compensation 138Compensation governance 141
FINANCIAL REPORTOperating and financial review 2016 146Novartis Group consolidated financial statements 178Financial statements of Novartis AG 255
OTHER INFORMATION Key dates for 2017, contact information and forward-looking statements 270
Coping with eye disease and fading vision late in life k page 74
A researcher seeks the roots of plants’ healing power k page 108
A groundskeeper tackles cancer in several ways k page 145

2 | Novartis Annual Report 2016
Chairman’s letter
Dear shareholder,
In 2016, Novartis continued to strengthen its business, accelerate innovation and further sharpen its organiza-tional structure. These steps are primarily designed to enhance our scientific and operating capabilities. They are also intended to help us address the medical and economic challenges of a rapidly aging global popula-tion, as well as improve our ability to develop important healthcare solutions and make them available to as many patients as possible around the world. We are confident that our strategy of using science-based innovation to deliver better health outcomes for patients will reinforce our market position and increase sales, profits and shareholder value in the long term.
Novartis continued to strengthen its business, accelerate innovation and further sharpen its organizational structure
Last year Novartis confronted several pressing issues, including the loss of US patent protection for our cancer therapy Gleevec, returning our eye care division to growth, and accelerating the uptake of our heart failure medicine Entresto. We were able to maintain our sales momentum despite these challenges, although we saw a decline in operating income.
Guided by a strong executive team with five new leaders, we launched new products, stepped up cross- divisional collaboration, and paved the way for future efficiency gains following the global integration of our technical and service functions.
As part of our efforts to accelerate collaboration across our organization, we are strengthening the con-nection between the Novartis Institutes for BioMedical Research and our newly formed Global Drug Develop-ment unit. These efforts are intended to expedite the transition of experimental therapies from our labs in Cambridge, Basel and Shanghai to the clinical setting, and broaden our industry-leading pipeline. Last year we received five breakthrough therapy designations from the US Food and Drug Administration in inflammatory diseases and oncology, including our investigational cancer compound LEE011 (ribociclib).
To stay at the forefront of medical science, we are also expanding our partnerships with leading academic and private research institutes, with the aim of advancing developments in emerging frontiers such as gene editing
Joerg Reinhardt

Novartis Annual Report 2016 | 3CHAIRMAN’S LETTER
and immuno-oncology. Partnerships are also vital for our activities in digital health, where we are working to improve evidence-based information about our products and to continue exploring pay-for-performance pricing models.
Improving access to healthcare in developing coun-tries is a priority for us, and we are playing our part in helping to achieve the United Nations Sustainable Devel- opment Goals. We focus on our longstanding work in the area of tropical diseases, where we advanced the devel-opment of our investigational malaria treatment KAF156. We have also made encouraging progress with our recently launched Novartis Access portfolio, which aims to help combat the rise of noncommunicable disea ses in lower-income countries.
We constantly evolve our corporate governance in an open dialogue with our stakeholders. In consultation with them, the Board of Directors has worked to further refine the compensation system and compliance framework of Novartis to position our company as a trusted global healthcare leader and strengthen our market position in 2017.
I thank you for the confidence you have placed in our company and am pleased to be able to propose a dividend increase of 2% to CHF 2.75 at the next Annual General Meeting.
Sincerely,
Joerg ReinhardtChairman of the Board of Directors
Our strategic approach
Our mission is to discover new ways to improve and extend people’s lives.
Our focus on scientific research and willingness to partner with global technology leaders aim to keep Novartis at the forefront of medical innovation, and support our efforts to create long-term value for our shareholders and society.
We strive to be a trusted global healthcare leader and cultivate a corporate culture of high ethical standards. We promote innovation, quality, collaboration, performance, courage and integrity, which we regard as essential values and behaviors in our interactions with patients, healthcare partners and society at large.
For further detail, see
k Our strategy page 17

4 | Novartis Annual Report 2016
the Novartis Oncology business unit, with its unique custo mer base, now reports directly to me, given its growing importance. We also consolidated all of our eye care drugs into the Novartis Pharmaceuticals business unit, and focused Alcon solely on surgical and vision care. In addition, we shifted some mature products from Novartis Pharmaceuticals to Sandoz, where they can benefit from our generics division’s expertise.
We continue to work hard to create the right culture in our company. The revised Novartis Values and Behaviors, introduced in 2015, are the foundation for our performance management and succession planning.
In the midst of these organizational changes, I’m proud that our teams delivered solid performance in 2016. Sales of USD 48.5 billion were in line with a year ago in constant currencies (cc) – a significant achieve-ment given the loss of US patent protection for Gleevec. Products launched recently helped fill the gap. They included Cosentyx, a treatment for psoriasis and other autoimmune disorders, which became a billion-dollar product; and Gilenya, our oral therapy for multiple sclerosis, which continued double-digit growth. Our heart failure medication Entresto continued to grow
Chief Executive Officer’s letter
Joseph Jimenez
Dear shareholder,
Recently, a heart failure patient named John wrote me a letter. He wanted to thank our company for making him feel like he had a new lease on life at the age of 54. He explained how quickly his diagnosis turned his life upside down, but he now hopes to be around for a long time thanks to Novartis.
Stories like John’s remind us of our mission, which is to discover new ways to improve and extend people’s lives. Last year our products touched nearly a billion people globally. This is incredible reach. But when you think that there are 6 billion people who haven’t had the benefit of a Novartis product, there’s still huge oppor-tunity to touch the lives of many more people.
This is why I am excited about the future of our company. Our focus on innovation will be especially important as the world’s population grows and ages, driving an increase in chronic illnesses like heart disease and cancer. This is where Novartis can have even greater impact, as we strive to use the power of science to address tough healthcare challenges.
However, the same factors that are driving increased demand for healthcare are also putting unprecedented pressure on healthcare systems around the world. The result is greater focus on cost control and increasing pressure on prices.
In an effort to build Novartis into a company that can thrive no matter what the future holds, we made significant changes in 2016 to create a more sustainable company. We are working to ensure we have the global scale and innovation power needed to remain competitive in a changing world.
In an effort to build Novartis into a company that can thrive no matter what the future holds, we made significant changes in 2016 to create a more sustainable company
Last year we reshaped Novartis from a group of loosely affiliated divisions into an integrated company, consoli-dating several functions. We created a Global Drug Development organization to better share expertise, ensure optimal resource allocation, and leverage new technology platforms across divisions. At the same time, we created a single drug manufacturing organization that can better optimize production capacity and utilization, while taking steps to lower our costs.
We also sharpened the focus of our business units. For example, within our Innovative Medicines Division,

Novartis Annual Report 2016 | 5CHIEF EXECUTIVE OFFICER’S LETTER
As we look ahead, we are excited about the future. We look forward to delivering further innovation that could change the practice of medicine for patients around the world.
We expect 2017 to be another challenging year as we continue to work through the Glivec patent expiration in Europe. But we also feel confident that we are positioned for a new phase of growth beginning in 2018.
I’d like to thank our employees for their dedication and you, our shareholders, for your continued confidence in the future of our company.
Sincerely,
Joseph Jimenez Chief Executive Officer
steadily, with approvals in more than 70 countries to date and solid progress with reimbursement around the world. We also saw strong performance for oncology products Tafinlar + Mekinist, a combination therapy for advanced melanoma, and Jakavi, for blood cancers.
One area where we fell short in 2016 was Alcon. We started the year with the ambition of returning the busi-ness to growth. While we were successful in returning the Vision Care segment to growth in the second half, the Surgical business is taking longer than expected and is preventing a positive growth rate for the overall Alcon Division. We will continue to diligently execute the growth plan in 2017.
Our core operating income of USD 13.0 billion declined 2% (cc), as we expected, reflecting generic competition and growth investments, partially offset by productivity initiatives.
We made further progress on expanding access to healthcare. In its first full year of operation, our Novartis Access program launched in three lower-income coun-tries, while laying the foundation for expansion to about 30 countries in a few years. Our efforts were reflected in the latest Access to Medicine Index, where we moved up one place to No. 3.
Our commitment to R&D continues to deliver results
Research and development (R&D) is at the core of our company and central to our strategy. The changes we are making to improve the efficiency and effectiveness of Novartis should free resources that will help us continue to make significant investments in innovation.
Our R&D teams made good progress in 2016. We had 16 approvals in major markets and 24 applications for marketing approval. We also received five breakthrough therapy designations from the US Food and Drug Administration.
We have a strong pipeline. We believe 12 of our compounds in development could become blockbusters. Among the most promising are LEE011 (ribociclib) in combination with letrozole for breast cancer patients with a specific genetic mutation; BAF312 (siponimod) for a type of multiple sclerosis with few effective treatment options; AMG 334 (erenumab) for chronic migraines; and RLX030 (serelaxin) for acute heart failure.
For further detail, see
k Innovation page 40

6 | Novartis Annual Report 2016
For further detail, see
k Our performance page 22k Our Financial Report page 146
1 This Annual Report includes non-IFRS financial measures such as core results, constant currencies and free cash flow. Novartis believes that investor understanding of the Group’s performance is enhanced by disclosing these non-IFRS measures. A definition of non-IFRS measures used by Novartis, and further details, including reconciliation tables, can be found starting on page 171.
2 Net income from discontinued operations and net income of the Group in 2015 include exceptional divestment gains. Continuing and discontinued operations are defined on page 154.
3 2016 weighted average number of shares outstanding: 2 378 million (2015: 2 403 million)
4 Dividend 2016: proposal to shareholders for approval at the Annual General Meeting on February 28, 2017
5 Payout ratio 2016 is calculated by converting into USD the proposed total gross dividend amount in CHF at the CHF-USD exchange rate of December 31, 2016, based on an estimated number of shares outstanding on dividend payment date, and dividing it by the USD consolidated net income from continuing operations and net income attributable to shareholders of Novartis AG in the Group’s 2016 consolidated financial statements.
Financial
Key figures1
(in USD millions, unless indicated otherwise) % Change
Constant
2016 2015 USD currencies
Net sales to third parties from continuing operations 48 518 49 414 – 2 0
Operating income from continuing operations 8 268 8 977 – 8 – 3
Return on net sales (%) 17.0 18.2
Net income from continuing operations 6 698 7 028 – 5 1
Net income from discontinued operations 2 10 766
Net income 2 6 698 17 794 – 62 – 59
Basic earnings per share3 (USD) from continuing operations 2.82 2.92 – 3 2
Basic earnings per share2,3 (USD) from discontinued operations 4.48
Total basic earnings per share2,3 (USD) 2.82 7.40 – 62 – 59
Core operating income from continuing operations 12 987 13 790 – 6 – 2
Core return on net sales (%) 26.8 27.9
Core net income from continuing operations 11 314 12 041 – 6 – 3
Core earnings per share3 (USD) from continuing operations 4.75 5.01 – 5 – 2
Free cash flow from continuing operations 9 455 9 259 2
Free cash flow 9 455 9 029 5
Share information 2016 2015 % Change
Share price at year-end (CHF) 74.10 86.80 – 15
ADR price at year-end (USD) 72.84 86.04 – 15
Dividend4 (CHF) 2.75 2.70 2
Payout ratio5 based on continuing operations (%) 96 92
Payout ratio5 (%) 96 36
Key performance indicators consolidated highlights

Novartis Annual Report 2016 | 7KEY PERFORMANCE INDICATORS CONSOLIDATED HIGHLIGHTS
Social8
Access 2016 2015
Total patients reached (millions) 965 972
Patients reached through access programs (millions) 52 66
People reached through training, health education and service delivery (millions) 17 12
People
Full-time equivalent positions / headcount 9 118 393 / 122 985 118 700 / 122 966
Turnover: % voluntary / % overall 7.4 / 12.2 7.3 / 13.5
Women in management: % of management10 / % of Board of Directors 42 / 25 41 / 27
Ethics
Misconduct cases reported / allegations substantiated 11 1 707 / 893 1 300 / 1 010
Health, safety and environment 12
Lost-time injury and illness rate (per 200 000 hours worked) 13 0.08 0.11
Greenhouse gas emissions, total Scope 1 and Scope 2 (1 000 t) 14 1 352.7 1 362.1
For further detail, see
k Innovation page 40k Social page 60 (corporate responsibility)
8 Continuing operations9 Headcount reflects the total number of associates in our payroll systems. Full-time
equivalent adjusts headcount for associates working less than 100%. All data as of December 31
10 Management defined locally11 The number of misconduct cases reported may change as matters may be reassessed
in the course of the case lifecycle. The number of substantiated allegations may change due to the fact that investigation reports with assessments are received on an ongoing basis, which potentially leads to a difference in numbers at a later stage. In 2016, the Business Practices Office (BPO) received a total of 3 595 complaints of alleged misconduct, of which 1 888 were deemed not to be related to misconduct and were delegated for review and action outside the BPO investigative process. The BPO initiated investigations of 1 707 reported cases related to misconduct; 893 were substantiated, including 401 that resulted in dismissals or resignations.
12 2016 environmental sustainability data published in the Annual Report are actual data for the period from January through September, and best estimates for the period from October through December. They will be updated with actual data in the first quarter of 2017. Significant deviations will be reported on our website and restated in next year’s Annual Report.
13 Data include Novartis associates and third-party personnel managed by Novartis associates.
14 Scope 1: combustion and process, and vehicles; Scope 2: purchased energy
Innovation
Key figures 1 2016 2015
Projects entering development pipeline 2,3 5 8
Ongoing Phase III programs 4 29 37
US FDA breakthrough therapy designations 5 5 0
Major submissions (US, EU, JP) 6 24 14
Major approvals (US, EU, JP) 6 16 20
New molecular entity (NME) approvals 7 3 6
1 Includes Innovative Medicines and Sandoz biosimilars only2 Includes programs entering confirmatory development, based on internal R&D
activities. First patient, first visit (FPFV) has occurred in post-proof-of-concept stage. Includes small molecules, biologics; new fixed-dose combinations of existing active pharmaceutical ingredients (APIs); and new target indications, defined as new disease or new line of treatment (e.g., first line vs. second line). Counted by indication and not compound
3 This number has been adjusted due to the revised definition of projects entering portfolio. In 2015, we reported it as 25.
4 Includes projects with FPFV in a Phase III study but not yet filed in the US, EU or Japan5 Number of breakthrough therapy designations by the US Food and Drug Administration
for therapies under development by Novartis6 Includes small molecules, biologics; new fixed-dose combinations of existing APIs; and
new target indications, defined as new disease or new line of treatment (e.g., first line vs. second line)
7 Includes NMEs such as small molecules, biologics; in the EU, new fixed-dose combinations of existing APIs

8 | Novartis Annual Report 2016
Our environment
Growing and aging populations worldwide are driving change in healthcare, presenting both new opportunities and new challenges for Novartis. The global population will increase by more than 1 billion people by 2030, predicts the United Nations, with most of that growth occurring in developing countries. People over age 60 are the fastest-growing population segment, expected to add 500 million people and reach 1.4 billion by 2030. This is driving an increase in chronic illnesses across the globe.
These factors contribute to increasing demand for healthcare worldwide, which is putting cost pressure on health systems. Governments and health insurers are increasingly searching for ways to keep spending in check. They are focusing on the value they receive, based on the benefits for patients and healthcare systems.
These developments validate our focus on innovation to produce significant medical advances, and global scale to further improve our efficiency and effectiveness.
Who we are
123 000 Employees worldwide (headcount)
155 Countries where Novartis products are available
48.5 bn Net sales (USD)
172.0 bn Market capitalization (USD) on Dec. 31, 2016
Novartis is a global healthcare company based in Basel, Switzerland, with a history going back more than 150 years. We provide healthcare solutions that address the evolving needs of patients and societies worldwide. Novartis products are available in about 155 countries and they reached nearly 1 billion people globally in 2016. About 123 000 people of 142 nationalities work at Novartis around the world.
For further detail, visit
k www.novartis.com/about-us
For further detail, see
k Our environment page 15
2016 at a glance
Growing and aging populations2010–2050 (in billions) and % of population over 60
2010 2020 2030 2040 2050
20%
15%
10%
6.93
8.50
7.76
9.16
9.72
PERCENTAGE OF POPULATION AGE 60 AND OVERTOTAL POPULATION
10
9
8
7
6
5
Source: United Nations

Novartis Annual Report 2016 | 92016 AT A GLANCE
Our structure
Integrated companyNovartis made organizational changes in 2016 aimed at reinforcing innovation and improving the efficiency and effectiveness of our operations. Novartis is now a more integrated company with a revised operating model. We created global functional organizations for drug development and manufacturing, combining units that were previously dedicated to individual divisions.
The Global Drug Development organization and Novartis Technical Operations join the Novartis Institutes for BioMedical Research and Novartis Business Services as global functional units that are better able to exploit the company’s scale, share best practices, and pursue excellence in their areas of expertise.
We adjusted the structure of Novartis divisions and business units, reinforcing their focus on our customers and on patients.
In our Innovative Medicines Division, we created two business units reporting to the CEO of Novartis: Novartis Oncology and Novartis Pharmaceuticals. This new struc ture reflects the increasing scale and importance of our Oncology business. We sharpened the focus of our Alcon Division on eye care devices, and shifted responsibility for ophthalmic pharmaceuticals to Novartis Pharmaceuticals. Our Sandoz Division remains dedicated to high-quality, more affordable generic medicines and biosimilars.
Functional organizations with global scaleOur global functional organizations help drive efficiency and promote functional excellence.
The Novartis Institutes for BioMedical Research (NIBR) is the innovation engine of Novartis, focused on dis covering new drugs that can change the practice of medicine.
The Global Drug Development (GDD) organization oversees the clinical development of new medicines discovered by our research teams and external partners.
Novartis Technical Operations (NTO) brings together all drug manufacturing at Novartis.
Novartis Business Services (NBS) consolidates sup-port services across the company.
For further detail, see
k Our strategy page 17k Our culture and values page 18k Our structure page 19k Global functions page 19
Our strategy
We believe Novartis is well prepared for a world with a growing, aging population and evolving healthcare needs. Our mission, vision and strategy support the creation of long-term value for our company, our shareholders and society.
Our mission is to discover new ways to improve and extend people’s lives. Our vision is to be a trusted leader in changing the practice of medicine. Our strategy is to use science-based innovation to deliver better patient outcomes in growing areas of healthcare.
We maintain strong investment in research and devel-opment focused on areas of unmet medical need.
Our mission is to discover new ways to improve and extend people’s lives. Our vision is to be a trusted leader in changing the practice of medicine
Our values
Strong values shape our culture and help us implement the Novartis strategy in line with our mission and vision. They describe the professional behavior we expect from employees: innovation, quality, collaboration, perfor-mance, courage and integrity.

10 | Novartis Annual Report 2016
Net income was USD 6.7 billion, down 5% in reported terms, but up 1% in constant currencies, due to higher income from associated companies. Earnings per share were USD 2.82 (–3%, +2% cc), up more than net income due to fewer outstanding shares. Free cash flow was USD 9.5 billion, up 2%, reflecting lower net investment in property, plant and equipment.
We also present core results,3 which exclude the impact of significant disposals, acquisitions, restructur-ings and other items. Core operating income was USD 13.0 billion (–6%, –2% cc). Core operating income mar-gin (cc) declined 0.7 percentage points, due to the Gleevec patent expiration and our investments in new product launches and the Alcon growth plan. Exchange rates had a further negative impact of 0.4 percentage points, resulting in a net decrease of 1.1 percentage points to 26.8% of net sales. Core net income was USD 11.3 billion (–6%, –3% cc). Core earnings per share were USD 4.75 (–5%, –2% cc).
Innovation
200 + Projects in clinical development
9.0 bn Research and development spend (USD)
Research and development activities produced 16 major approvals and 24 major submissions in 2016. We received US regulatory approval for Cosentyx to treat ankylosing spondylitis and psoriatic arthritis. We filed for approval
Performance highlights
Financial
48.5 bn Net sales (USD)
9.5 bn Total free cash flow (USD)
13.0 bn Core operating income (USD)
8.3 bn Operating income (USD)
6.7 bn Net income (USD)
Novartis had solid performance in 2016, supported by a 20% increase in sales of our growth products1 as we navigated the US patent expiration of our pioneering cancer drug Gleevec. This underscores our ability to refresh our product portfolio. Our Innovative Medicines and Sandoz Divisions performed well in a challenging environment. We were unsuccessful in returning our Alcon Division to growth, but the growth plan initiated in 2016 is starting to bear fruit.
Novartis net sales in 2016 were USD 48.5 billion, down 2% in reported terms, but flat in constant currencies (cc). Our growth products1 – including Gilenya, Cosentyx and several cancer treatments acquired in 2015 – contributed USD 17.1 billion, or 35% of net sales. Operating income in 2016 was USD 8.3 billion (–8%, –3% cc), down mainly due to patent expirations, and increased investments related to new product launches and the Alcon growth plan.
continued
1 “Growth products” are an indicator of the rejuvenation of the portfolio, and comprise products launched in a key market (EU, US, Japan) in 2011 or later, or products with exclusivity in key markets until at least 2020 (except Sandoz, which includes only products launched in the last 24 months). They include the acquisition effect of the GSK oncology assets.
2 In constant currencies and for continuing operations3 Core results are a non-IFRS measure. A definition of non-IFRS measures used by Novartis,
and further details, including reconciliation tables, can be found starting on page 171.
2016 at a glance
48 518 / 0%
2016 net sales from continuing operations by division(in USD millions, growth in % cc2 and divisional share of net sales)
INNOVATIVE MEDICINES 32 562 / 0%
67%
SANDOZ
21% 10 144 / 2%
5 812 / – 2%ALCON
12%
TOTAL

Novartis Annual Report 2016 | 112016 AT A GLANCE
populous region. The program uses smartphones and tablet computers to improve access to medicines and increase disease surveillance.
We improved the environmental footprint of our operations, reducing carbon emissions by 10 kilotons in 2016.
We continue our efforts to strengthen integrity and compliance across Novartis. We updated our Anti- Bribery Policy and launched a global online tool to handle conflicts of interest across the company. To ensure accountability of local country organizations, we include integrity and compliance in standard business reviews. We began using virtual meeting technology to supple-ment face-to-face meetings as we develop better, more inclusive ways of educating medical professionals about our products.
In 2016, Novartis was recognized in several corpo-rate responsibility rankings, including the Access to Medicine Index, where Novartis ranked No. 3, moving up one place versus 2014. And we received an A- rating and were recognized among category leaders in health-care in the 2016 CDP Climate Score.
For further detail, see
k Our performance page 22
Governance and compensation
We maintained our excellence in corporate governance in 2016. We refreshed the Board of Directors with new members, adding Elizabeth Doherty and Ton Buechner, and reinforcing our Board’s experience in the areas of accounting and management.
Key focus areas for our Board in 2016 included strategy, the culture of our company, our corporate responsibility programs, compliance and our compen-sation system.
In 2016, we continued to evaluate the effectiveness of our compensation programs to further align with our business strategy and shareholder interests. We also reported the results from the first cycle of our Long-Term Incentive plan introduced in 2014.
For further detail, see
k Governance page 76k Compensation page 110
in the US and EU for our Tafinlar + Mekinist combination to treat non-small cell lung cancer; for PKC412 (mido staurin) in combination with standard chemother-apy to treat acute myeloid leukemia; and for LEE011 (ribociclib) in combination with letrozole for the treatment of a particular type of breast cancer.
Novartis received five breakthrough therapy desig-nations from the US Food and Drug Administration in 2016.
Sandoz continued to lead in biosimilars with US approval for Erelzi (etanercept-szzs) to treat inflammatory diseases, although its launch has been delayed by litiga-tion. Our biosimilar Binocrit (epoetin alfa) was approved in the EU for a new route of administration. And our filings seeking marketing approval were accepted in the EU for biosimilars pegfilgrastim and rituximab.
Alcon received US regulatory approval for the CyPass Micro-Stent to treat glaucoma, and launched the NGENUITY 3D Visualization System for vitreoretinal surgery.
Social
52 m Patients reached through access programs
17 m People reached through health education programs
Novartis Access, our portfolio of medicines to fight key chronic diseases in lower-income countries, is offered to governments and public-sector customers at a price of USD 1 per treatment per month. Since launch, it has delivered more than 120 000 treatments to Kenya, Lebanon and Ethiopia, each providing a one-month supply of medicine. In September, we signed a memo-randum of understanding for the implementation of Novartis Access in Rwanda, and we expect the first product delivery in early 2017. To prepare for implemen-tation elsewhere, we filed for approval to sell Novartis Access drugs in 21 countries.
The Novartis Malaria Initiative achieved another mile-stone in 2016, having delivered more than 800 million treatments without profit since 2001. Novartis expanded its partnership with the Medicines for Malaria Venture to develop antimalarial compound KAF156. SMS for Life 2.0 launched in Kaduna State, Nigeria’s third most

12 | Novartis Annual Report 2016
It’s a precious getaway. Mr. García spends most of his waking hours caring for his 81-year-old mother, Antonina Hernández, who suffers from Alzheimer’s disease.
Mr. García, a fitness trainer, first noticed her decline four years ago. Every day on the phone she described eating identical meals. He checked her refrigerator and it was nearly empty. He saw that she was losing track of time and forgetting to eat. A neurologist soon diagnosed Alzheimer’s, a disease Ms. Hernández shares with an estimated 44 million others around the world.
In the early days, she could manage on her own, with steady prompts and visits from Mr. García, who lived next door. But two years ago, he saw that she needed help with the most basic tasks and so he moved into her two-bedroom apartment. He dropped most of the clients in his fitness classes and became a full-time caregiver.
Mr. García relentlessly consults the Internet for advice. The most important point, he says, is to build routines for his mother, to keep her engaged. “If I’m cooking, I have her peel the vegetables, and when I wash the dishes, she dries them,” he says. “It takes much more time than it would to do it myself.” But the activities keep her busy and distract her from the growing gaps in her memory, which can produce frustration, anger and despair.
He creates daily worksheets for her, and has her circle words or draw a wavering line through a maze. He also leads her in exercises. She mirrors her son’s movements, lifting small pink weights in each hand.
Ms. Hernández is vaguely aware of her situation. She struggles to remember basic words and is aware
and embarrassed that she forgets so much. She often hallucinates, returning in her mind to the farm where she grew up in the tiny town of Villatoro, northwest of Madrid. She worries if the chickens are fed, and even on sweltering summer days, she bundles up for the cold mountain nights of her childhood.
Like so many other caregivers, Mr. García feels terribly alone and vulnerable. “The worst part is the stress,” he says. He frets that his mother will slip out of the house when he’s not looking and get lost or suffer an accident. “You’re on alert for 24 hours,” he says.
The impact of this disease on people and society will likely increase, unless research now underway at Novartis and elsewhere yields a breakthrough in treatment options. As the world’s population ages, Alzheimer’s cases are projected to grow rapidly, reaching 65 million by 2030. This will require more caregivers, who may face increasing stress and their own medical problems. Some 40% of caregivers, according to the Alzheimer’s Association, report suffering from depression. And there are financial concerns, as many of them forfeit paying jobs to care for loved ones.
Indeed, this is one of Mr. García’s challenges. He scrapes together enough money to send his mother for a few hours every week to a therapeutic center run by the city. That frees him up to give a few fitness classes. He also makes some money by selling comic books on eBay. But for now, his full-time job is taking care of his mother. She stands by the sink with a dish towel and a far-away expression. She’s waiting, and it’s up to him to give her tomatoes to wash or bowls to dry.
For detail on Alzheimer’s research k page 49
A fitness trainer strives to keep his mother’s mind limberOn Friday nights, 41-year-old Juan Pedro García Hernández goes dancing. From a working-class suburb of Madrid, Spain, he takes the Metro downtown where a friend DJs. “I escape by dancing,” he says.
PHOTO ESSAY
1
4
2

Novartis Annual Report 2016 | 13PHOTO ESSAY
1 For Juan Pedro García Hernández, getting his mother out into their neighborhood in Madrid, Spain, is a daily routine.
2 Mr. García started to notice her memory lapses four years ago, and moved into her apartment to give full-time care two years later.
3 Mr. García leads his mother through regular exercises. They keep her engaged and raise her spirits.
4 Ms. Hernández and her son inspect the haircut he has just given her. As her disease progresses, she relies more on him for routine care.
3

14 | Novartis Annual Report 2016
Strong demographic and economic trends continue to transform societies worldwide and shape the future of healthcare. These trends are opening opportunities for Novartis, while at the same time raising new challenges.
Strategic overview
1 bn The expected increase in the global population by 2030, to a total of 8.5 billion people
500 m The expected increase in people over the age of 60 worldwide by 2030, to a total of 1.4 billion people
+ 46 % The rise in the average yearly number of US approvals for new molecules in the years 2012-2016, compared to 2007-2011
Our strategic framework
Our missionDiscover new ways to improve and extend people’s lives
Long-term value creation
Our visionBe a trusted leader in changing the practice of medicine
Our strategyScience-based innovationBetter patient outcomesIn growing areas of healthcare
Our valuesInnovationQualityCollaborationPerformanceCourageIntegrity
Our structureNovartis took significant further steps in a transformation begun three years ago, resulting in revisions to our structure and operating model.
k page 19
Our culture and valuesOur culture supports the success of the enterprise through clear values to guide our people in their work.
k page 18
k page 17

Novartis Annual Report 2016 | 15Strategic overviewour environment
Powerful trends in society and our industry continue to shape healthcare globally, and these trends seem in some cases to be accelerating. Medical innovation is racing ahead at a time when populations are grow-ing and graying, boosting demand for healthcare. the increasing cost of caring for people around the world is raising pressure on healthcare systems.
Golden age for medical researchInnovation in medical science is accelerating, driven by new therapeutic approaches. The number of new treat-ments underscores this trend. For instance, the average annual number of new drug molecules approved by the US Food and Drug Administration from 2012 through 2016 increased 46% compared to the prior five years.
Researchers are developing exciting new ways to treat diseases. Examples include gene editing and gene therapies, as well as RNA-based treatments that can intervene in how cells create specific proteins. Oncology is a particularly fast-evolving field and includes advances such as cell therapies to attack cancer cells, and vaccines that help people ward off the development of cancer in the first place.
The sophisticated new treatment approaches emerg-ing from this golden age of medical research offer society and patients new hope for tackling the many diseases that still lack effective treatments.
Digital technology is also playing an increasingly important role in healthcare. Remote monitoring of patients, advanced data analytics, and other digital applications are changing the way clinical trials are conducted, as well as the way patients are treated. Technology is also being used to augment the effective-ness of traditional medicines.
The sophisticated new treatment approaches emerging from this golden age of medical research offer society and patients new hope for tackling the many diseases that still lack effective treatments
This opens new possibilities for healthcare companies to further improve health outcomes for patients. It is also attracting technology companies to the healthcare industry. Their special skills make them potential partners for science-based companies like Novartis, which have skills they lack, such as deep clinical and regulatory expertise.
Growing and graying populationsThe world’s population continues to grow, with an addi-tional 1 billion people expected to join the human race by 2030, bringing the total number of inhabitants to about 8.5 billion, predicts the United Nations. Most of this population growth is expected to be in the developing world, where there continues to be tremendous unmet medical need. The world’s population also continues to age rapidly, with the number of people aged 60 or older expected to increase by more than 500 million by 2030, to 1.4 billion people.
At the same time, millions of people are migrating from rural areas to cities, sparking changes in lifestyle and diet that over time can affect their health. More than half the world’s population now lives in cities and towns, and this number is expected to grow to about 5 billion people by 2030.
These trends are fueling a global increase in chronic diseases such as diabetes and heart disease that may require patients to follow years or even decades of treat-ment. Cancer and cardiovascular diseases will cause half of all deaths worldwide by 2025, predicts the World Health Organization.
Rising pressure on healthcare costsThese factors are contributing to higher demand for healthcare worldwide and putting healthcare systems under increasing cost pressure. Healthcare costs glob-ally have risen at a rate of about 10% annually in recent years, according to Aon Hewitt, well above the general inflation rate. In many countries, overall spending on healthcare continues to grow as a proportion of total economic activity. The US spends the most, at 17% of all the goods and services produced in the country, accord-ing to the Organization for Economic Cooperation and Development.
Responding to the world’s rising healthcare needs represents a significant opportunity for healthcare com-panies such as Novartis in the coming years and decades. However, healthcare companies also have an important role to play in ensuring healthcare systems are sustain-able over the long haul.
Our environment

16 | Novartis Annual Report 2016
health outcomes in their price calculations. Elsewhere, the US Centers for Medicare & Medicaid Services is a year ahead of schedule in reaching its target of converting 50% of spending to quality-based payments that take into account both health outcomes and cost-effectiveness.
Novartis has also advocated a value-based approach as a way of improving efficiency in healthcare, and has agreed to be reimbursed for certain products based partly on health outcomes.
Novartis has also advocated a value-based approach as a way of improving efficiency in healthcare, and has agreed to be reimbursed for certain products based partly on health outcomes
Taken together, the evolving trends we see in society and the healthcare industry reinforce our conviction that our strategy of focusing on innovation and improved health outcomes for patients is the correct one to steer us through a shifting healthcare landscape. Our atten-tion remains on executing our strategy as effectively as possible.
The pressure on healthcare systems already has governments and health insurers looking for ways to slow the rise in spending, while still providing quality care for as many people as possible. In some cases, they are employing tough tactics, from limiting access to treat-ment and slowing the uptake of innovative new medi-cines, to shifting more of the cost to individual patients.
This trend means healthcare companies increasingly find themselves squeezed by conflicting demands to provide cost-effective treatments, while at the same time continuing to use the latest technology to pursue break-through medicines and devices. Rising costs have also helped fuel a heated public debate about the pharma-ceutical industry’s pricing practices and have prompted a heightened level of scrutiny.
Indeed, the possibility of political or regulatory action on drug prices has become a greater risk for the entire industry, including Novartis. Such action could take a variety of forms, from restrictions on price increases and mandates to provide broad access to treatments, to changes in intellectual property laws. For more on the risks Novartis faces and the steps we are taking to address them, please see page 167. One response to rising costs that is gaining momentum with governments, insurers and healthcare companies is to shift healthcare systems toward a focus on producing better health outcomes, rather than simply paying for pills and healthcare services.
For instance, the European Commission has sanc-tioned a value-based tendering approach for medical devices that allows companies to include measures of
Our environmentcontinued
Yuko Yoshikawa participates in daily morning exercises near her home in Tokyo, Japan. She
has been treated for age- related macular degeneration
for more than 10 years.

Novartis Annual Report 2016 | 17Strategic overviewour strategy
we have a consistent strategy that helps us navigate a world with a growing, aging population and evolving healthcare needs. our mission and vision complement our strategy, and together they support the creation of value over the long term for our company, our share-holders and society.
The Novartis mission, vision and strategy are all anchored in our company’s tradition of leadership in innovation. We believe our mission accurately describes why we exist as a company, while our vision expresses an ambitious aspiration to strive for. Along with our strategy, they effec-tively guide our path to the future.
Our mission is to discover new ways to improve and extend people’s lives Our vision is to be a trusted leader in changing the practice of medicine Our strategy is to use science-based innovation to deliver better patient outcomes in growing areas of healthcare
Our strategy has remained consistent. The trends we see in society and the healthcare industry convince us our direction is appropriate. Our strategy and its imple-mentation have been strongly endorsed in annual reviews by the Executive Committee of Novartis and the Board of Directors.
ScieNce-BaSeD iNNovatioN Innovation that produces breakthrough medicines and products will be more important than ever in the health-care industry in the coming years. We maintain strong investment in research and development to address unmet medical needs. Our product pipeline is fed by a research and development approach that uses the latest science to advance the most promising projects.
Our research strategy aims to increase collaboration across traditional scientific and organizational boundar-ies, and focus on powerful new technologies that have the potential to help produce therapeutic breakthroughs. We are organizing our early discovery efforts around chemical biology, a scientific approach that brings together experts from different fields, including biology, chemistry and computer science, to create new types of molecules and use them to probe biological systems.
In drug development, we pursue promising therapies where we can leverage the scale and expertise of Novartis to bring important treatments to patients globally.
Better PatieNt oUtcoMeSWe seek to develop medicines and products that can produce positive real-world outcomes for patients and healthcare providers. The benefits can range from im -pro ving the cost-effectiveness of high-quality care to prolonging lives. We are developing services and tech-nologies to augment the benefits of our core products, often in collaboration with healthcare providers and tech-nology companies.
growiNg areaS oF HeaLtHcareWe aim to develop innovative products in growing areas of healthcare where we can make a real difference. We focus on patented medicines, generic medicines and eye care – segments where we have the innovation power and global scale necessary to compete effectively. At the same time, we are expanding our presence in the emerging markets of Asia, Africa and Latin America, where populations are growing fastest and where demand for access to high-quality medicines and health-care is also likely to continue to increase.
For further detail, see
k Innovation page 40
Our strategy

18 | Novartis Annual Report 2016
talented, committed and responsible people from diverse backgrounds are essential for successfully implementing our strategy. we foster a company cul-ture that supports the success of the enterprise through clear values to guide our people in their work.
Our cultureWe continue to reinforce a company culture that supports our people as they face new challenges in a rapidly evolv-ing healthcare environment.
Our values define our culture and help us execute the Novartis strategy in line with our mission and vision. They describe the professional behavior we expect from our employees. We use six values to inform our recruitment activities, shape employee development programs, and help guide individual performance assessments and decisions about bonuses and other rewards. Compre-hensive training programs ensure our people are famil-iar with these values and know how to apply them in their jobs.
Our valuesiNNovatioNInnovation founded in strong science is at the heart of Novartis and key for our strategy and success. We nurture a culture of innovation by encouraging people to experiment and take smart risks. Our aim is to foster crea tive thinking that leads to practical solutions to healthcare and business challenges.
QUaLitYDelivering high quality is critical to ensuring a reliable supply of important medicines and earning the trust of our customers and society. Our focus on quality excel-lence includes continuously enhancing our standards, technology and training for our people.
coLLaBoratioNWe foster teamwork among our employees to swiftly and efficiently deliver innovative new products to patients and healthcare providers. This capitalizes on the diversity and creativity of our global staff.
PerForMaNcePeople at Novartis are known for their focus on deliver-ing results – and they often make extraordinary efforts to achieve their goals. We aim to reinforce that focus on personal and collective achievement, while maintaining high ethical standards.
coUrageWe want our associates to speak out, challenge conven-tional thinking, and stand up for their ideas. We also want them to have the courage to do the right thing in the face of resistance or moral dilemmas. They need the fortitude to take smart risks, even when the chance of failure is high.
iNtegritYHigh performance with integrity is fundamental to the way we operate at Novartis and is critical to maintaining the support of society and governments. Our Code of Conduct sets high ethical standards, and comprehen-sive training ensures our associates know how to apply these standards in their work. We also enforce our code, investigating allegations of wrongdoing and taking decisive corrective action when needed.
For further detail, see
k People page 27
Our culture and values
Jennifer Allport-Anderson, a cell biologist who leads a heart failure and in vivo pharmacology team at the Novartis Institutes for BioMedical Research (NIBR) in Cambridge, Massachusetts in the US, walks through one of NIBR’s new buildings.

Novartis Annual Report 2016 | 19Strategic overviewour structure
in 2016, Novartis took significant further steps in a trans-formation we began three years ago. the changes rep-resent a shift in our operating model – one that we believe enables us to more effectively implement our strategy and create long-term value. the company has been reshaped from a diverse group of largely independent divisions into a more focused, more integrated company that is better able to deliver innovative products, exploit global scale, and respond to new opportunities and risks.
Revised structureNovartis completed a series of organizational changes in 2016 aimed at reinforcing innovation and making the company more efficient and more nimble. We created two new global functional organizations – one for drug development and one for manufacturing – combining units that were previously dedicated to individual divi-sions. The Global Drug Development organization and Novartis Technical Operations join the Novartis Institutes for BioMedical Research and Novartis Business Services as global functional units that are better able to exploit the company’s scale, share best practices, and pursue excellence in their areas of expertise. The Head of Global Drug Development also joined the Executive Committee of Novartis, adding the new development organization’s insights to the company’s top leadership team.
We adjusted the structure of Novartis divisions and business units in 2016 to reinforce their focus on our customers and patients, as well as to speed decision- making. In our Innovative Medicines Division, we created two business units reporting to the CEO of Novartis: Novartis Oncology and Novartis Pharmaceuticals. The new structure reflects the scale and importance to Novartis of our Oncology business, which is one of the world’s biggest providers of cancer treatments, following
the acquisition of oncology products from GlaxoSmith-Kline in 2015. The Novartis Pharmaceuticals business unit focuses on patented treatments in the areas of cardio-metabolic, respiratory, neuroscience, ophthal-mology, and immunology and dermatology. Both units are represented on the Executive Committee of Novartis.
We sharpened the focus of our Alcon Division on eye care devices, and shifted responsibility for ophthalmic pharmaceuticals to Novartis Pharmaceuticals, where they can benefit from the scale and expertise of that business unit.
Our Sandoz Division remains dedicated to the fast- growing market for more affordable, high-quality generic medicines and biosimilars, which help health systems broaden access to treatment while managing their costs. During 2016, we shifted some established medicines from Novartis Pharmaceuticals to Sandoz, where there is a better fit with the portfolio.
Functional organizations with global scaleNovartiS iNStitUteS For BioMeDicaL reSearcHThe Novartis Institutes for BioMedical Research (NIBR), with more than 6 000 scientists, physicians and business professionals worldwide, is the innovation engine of Novartis. NIBR focuses on discovering new drugs that can change the practice of medicine.
gLoBaL DrUg DeveLoPMeNtThe Global Drug Development organization oversees the development of new medicines discovered by our research teams and external partners. Bringing to -gether drug development at Novartis facilitates regular evaluation of the new products in our pipeline, as well as optimum allocation of resources to the most promising projects. It also supports common standards and pro-cedures, and the broad adoption of best practices, all of which we believe will lead to greater efficiency and effec-tiveness.
NovartiS tecHNicaL oPeratioNSThe global Technical Operations unit brings together all drug manufacturing at Novartis. We expect this organi-zation to improve resource allocation, optimize capacity planning, and further improve quality.
NovartiS BUSiNeSS ServiceSNovartis Business Services (NBS) consolidates support services across Novartis divisions, helping drive effi-ciency, simplification, standardization and quality. NBS includes six service domains: financial reporting and accounting operations, human resources services, information technology, procurement, product lifecycle services, and real estate and facility management. Its role in generating productivity gains supports our con-tinued investment in research and development, and underpins our financial results.
Our structure
Innovative Medicines
Sandoz Alcon
Oncology business unit
Pharmaceuticals business unit
R & DCor
pora
te fu
nctions Business services
Manufacturing

20 | Novartis Annual Report 2016
That’s where Mr. Canuz comes in, with his supply of gas stoves and tanks of liquid propane. He’s the field coordinator for a pilot research program called NACER (“to be born” in Spanish). In San Lorenzo and nearby mountain villages, Mr. Canuz and his team have installed gas stoves in the homes of 50 pregnant women. The goal is to monitor air quality in their homes through the course of their pregnancies, and then to study the health and development of their babies.
This is a crucial challenge, one that extends far beyond Guatemala. More than 3 billion people around the world cook and heat their homes with open fires and simple stoves, according to the World Health Orga nization (WHO). This contributes to respiratory illness, including lung cancer, asthma and chronic obstructive pulmonary disease. The WHO estimates that these diseases kill as many as 2 million people every year.
Guatemala’s Department of Public Health dispatches young doctors to monitor pulmonary disease in rural villages like those around San Lorenzo. They administer common medicines and send more serious cases to hospitals. But they’re understaffed and many villagers continue to treat diseases with traditional remedies, including nearly 60 different plants. Studies indicate that some of them have antibacterial powers – but often not enough.
Fighting respiratory disease at the sourceWhen Guatemalan social worker Eduardo Canuz teaches rural women how to cook their tamales on a gas stove, he is taking on more than a thousand years of history. The Maya people of Guatemala’s highlands have been cooking over wood fires and bathing in wood-heated saunas, known as temazcales, since the dawn of their civilization. But the smoke is unhealthy and especially dangerous for women and children.
PHOTO ESSAY
1
2
3

Novartis Annual Report 2016 | 21PHOTO ESSAY
In Guatemalan health clinics, infants account for more than 60% of respiratory cases. However, coaxing their families away from stoves isn’t easy. First, there’s the challenge of establishing a distribution network for propane canisters so that the women can count on timely refills and at prices that compete with wood. The NACER team also struggles to open up space in small kitchens for the new equipment. And they must remind the women to wear small backpacks equipped with sensors to monitor the air and measure the particulates floating in it.
But perhaps the biggest challenge is cultural. Most of the people around San Lorenzo speak a Mayan language, Mam, and view the Spanishspeaking researchers as outsiders. And traditionalists – often husbands and mothersinlaw – tend to resist the new and cleaner technology. “It’s hard to convince people over 50,” Mr. Canuz says. “They want to keep burning wood.” To convince these diehards, NACER gives cooking classes and holds contests where people compete to make gascooked delicacies.
Lisa Thompson, coordinator of the doctoral program in global health services at the University of California, San Francisco, in the US, is running the pilot project around San Lorenzo. In the early 2000s, she led a preliminary effort to reduce smoke in villages by replacing open fires with woodburning stoves
called planchas. These stoves had chimneys, which routed some of the smoke out of the homes. Still, San Lorenzo and nearby villages remained polluted, with lots of smoke making its way into homes – and young lungs. So Ms. Thompson turned to gas.
The work, she says, doesn’t end when babies are born. Field workers pay home visits to check on the babies’ health, and new mothers are taught to look for early symptoms of pneumonia. If their babies are feverish and breathing fast, they’re urged to rush to a clinic for treatment.
In addition to installing stoves, the NACER team is working to discourage pregnant women from bathing in the temazcales. These steamy huts, where water is splashed on heated stones, have skyhigh levels of carbon monoxide (CO), which is especially dangerous for developing fetuses. Pregnant women often take a bath in the evening, right before going to bed. The combination of heat and CO induces sleep, Ms. Thompson says. “It’s a very hard thing to change.”
The San Lorenzo project is tiny, but the health risk of smoke inhalation is global. Ms. Thompson hopes that data from San Lorenzo, as well as lessons learned, will pave the way for a much larger effort featuring 3 200 pregnant women in Ghana, Rwanda, India and Peru.
For detail on respiratory disease research k page 47
1 Smoke from fires used for cooking and heating in Guatemala and much of the developing world contributes to respiratory illness, especially among infants.
2 Project manager Eduardo Canuz helps families in San Lorenzo and nearby villages replace wood fires with cleaner burning gas stoves.
3 Field worker Expedita Ramírez Marroquín fits a woman with a vest to monitor the levels of carbon monoxide she experiences during the day.
4 The hope is that cleaner household air, along with better care, will improve infant health.
5 A new gas stove attracts a crowd.
4 5

22 | Novartis Annual Report 2016
PerformanceNovartis delivered solid performance in 2016 while navigating the patent expiration of our biggest-selling drug. Growth products helped offset the impact of generic competition. Research and development continued to yield good results, with 16 major product approvals in 2016 and important advances in our pipeline. We also made progress with efforts to improve access to medicines worldwide.
48.5 bn Net sales (USD)
9.5 bn Free cash flow (USD)
6.7 bn Net income (USD)
1 This Annual Report includes non-IFRS financial measures such as core results, constant currencies and free cash flow. Novartis believes that investor understanding of the Group’s performance is enhanced by disclosing these non-IFRS measures. A definition of non-IFRS measures used by Novartis, and further details, including reconciliation tables, can be found starting on page 171.
2 Net income from discontinued operations and net income of the Group in 2015 include exceptional divestment gains. Continuing and discontinued operations are defined on page 154.3 2016 weighted average number of shares outstanding: 2 378 million (2015: 2 403 million)
Key figures1
(in USD millions, unless indicated otherwise) % Change
Constant
2016 2015 USD currencies
Net sales to third parties from continuing operations 48 518 49 414 – 2 0
Operating income from continuing operations 8 268 8 977 – 8 – 3
Return on net sales (%) 17.0 18.2
Net income from continuing operations 6 698 7 028 – 5 1
Net income from discontinued operations 2 10 766
Net income 2 6 698 17 794 – 62 – 59
Basic earnings per share3 (USD) from continuing operations 2.82 2.92 – 3 2
Basic earnings per share2,3 (USD) from discontinued operations 4.48
Total basic earnings per share2,3 (USD) 2.82 7.40 – 62 – 59
Core operating income from continuing operations 12 987 13 790 – 6 – 2
Core return on net sales (%) 26.8 27.9
Core net income from continuing operations 11 314 12 041 – 6 – 3
Core earnings per share3 (USD) from continuing operations 4.75 5.01 – 5 – 2
Free cash flow from continuing operations 9 455 9 259 2
Free cash flow 9 455 9 029 5

Novartis Annual Report 2016 | 23PerformancePerformance summary
Performance summaryFinancial performance
Novartis delivered solid results in 2016, countering much of the effects of the loss of US patent protection during the year for our pioneering leukemia drug, Gleevec. This underscores the strength of our pipeline and our ability in recent years to renew our product portfolio and control costs to manage through important patent expirations. Gleevec follows Diovan, which lost exclusivity in 2011 in the EU and in 2012 in the US.
Our Innovative Medicines and Sandoz Divisions performed well under challenging circumstances. We were not successful in returning Alcon to growth in 2016, although we have begun to see the first results from the growth plan implemented during the year.
Net sales for Novartis in 2016 were USD 48.5 billion, down 2% in reported terms, but flat measured in constant currencies (cc) to remove the impact of fluctuations in exchange rates. While volumes grew 6 percentage points, that was offset by the negative impacts of 4 per-centage points due to generic competition and 2 per-centage points from lower prices.
We continued to face headwinds in 2016 from cur-rency fluctuations, with the rising value of the dollar adversely affecting our reported sales and income. This continues a trend we have seen for several years, par-ticularly in 2015 when currency fluctuations had a neg-ative 10% impact on sales. To help investors assess the impact of exchange rates on our performance, we also indicate growth rates in constant currencies.
In 2016, our growth products2 contributed USD 17.1 bil-lion, or 35% of net sales. These include Gilenya for multi-ple sclerosis, up 14% (cc) to USD 3.1 billion; Cosentyx for psoriasis and two other immune-related illnesses, which reached blockbuster status with sales of USD 1.1 billion; Jakavi for blood cancer, up 45% to USD 581 million; and the combination cancer therapy Tafinlar + Mekinist, acquired from GSK during 2015 (USD 672 million).
Biopharmaceutical products from Sandoz also contin-ued to be a bright spot, rising 31% (cc) to USD 1.0 billion.
Sales of heart failure drug Entresto grew steadily during the year and totaled USD 170 million. We contin-ued to increase our investment in its launch, devoting additional resources during the year to educating doctors and patients about its benefits.
Operating income in 2016 was USD 8.3 billion (–8%, –3% cc), down mainly due to the effects of patent expirations and increased investments related to new product launches, including Entresto and Cosentyx, and the Alcon growth plan.
1 This Annual Report includes non-IFRS financial measures such as core results, constant currencies and free cash flow. Novartis believes that investor understanding of the Group’s performance is enhanced by disclosing these non-IFRS measures. A definition of non-IFRS measures used by Novartis, and further details, including reconciliation tables, can be found starting on page 171.
2 “Growth products” are an indicator of the rejuvenation of the portfolio, and comprise products launched in a key market (EU, US, Japan) in 2011 or later, or products with exclusivity in key markets until at least 2020 (except Sandoz, which includes only products launched in the last 24 months). They include the acquisition effect of the GSK oncology assets.
35
30
25
20
15
10
5
0
net sales, operating income, core operating income,1 research & development, marketing & sales from continuing operations as % of net sales
2013 2014 2015 2016
NET SALES (USD billion)
CORE OPERATING INCOME1
OPERATING INCOME
RESEARCH & DEVELOPMENT
MARKETING & SALES
(% of net sales) 51.1 51.9 52.2
49.4 48.5
2012
2016 net sales from continuing operations by geographical region(% of net sales and in USD millions)
eUroPe35%
17 079
UnITeD STaTeS
35%17 117
aSIa / afrIca / aUSTraLaSIa 10 441
22%
canaDa anD LaTIn amerIca 3 881
8%
ToTaL 48 518

24 | Novartis Annual Report 2016
ProductivityEfforts to improve productivity are delivering results. Novartis Business Services (NBS), our shared services organization, continued to leverage the global scale of Novartis to streamline and consolidate our operations. For example, we reduced the number of information technology applications we use, consolidated facilities services from more than 100 suppliers to just three, and initiated the standardization of infrastructure services at selected manufacturing sites, among other steps. In addition, NBS continued to optimize its footprint through selective offshoring to five global service centers.
NBS, as well as our newly created Global Drug De -velopment (GDD) organization and global Novartis Technical Operations (NTO) group, will continue to drive the pursuit of greater efficiency and effectiveness. We anticipate that the benefits of the new GDD and NTO organizations will yield more than USD 1 billion in annual cost savings by 2020.
Net income from continuing operations was USD 6.7 bil-lion, down 5% in reported terms, but up 1% in constant currencies, due to higher income from associated com-panies. Earnings per share from continuing operations were USD 2.82 (–3%, +2% cc), up more than net income due to a reduction in the average number of shares out-standing.
Free cash flow from continuing operations was USD 9.5 billion, up 2%, reflecting lower net investment in prop-erty, plant and equipment.
To help investors track our underlying performance, we also present our core results, which exclude the impact of disposals, acquisitions, restructurings and other significant items.
Core operating income was USD 13.0 billion (–6%, –2% cc). Our core operating income margin measured in constant currencies declined 0.7 percentage points, due to the Gleevec patent expiration and our investments in new product launches and the Alcon growth plan. Changing exchange rates had a further negative impact of 0.4 percentage points, resulting in a net decrease of 1.1 percentage points to 26.8% of net sales.
Core net income was USD 11.3 billion (–6%, –3% cc). Core earnings per share were USD 4.75 (–5%, –2% cc), declining less than core net income due to fewer out-standing shares.
Performance summarycontinued
In Brisbane, Australia, groundskeeper and skin cancer survivor Malcolm Caddies protects himself from the sun as he prepares the field for a rugby match at Suncorp Stadium.
2014
contribution of growth products1
(continuing operations net sales in USD millions, % of continuing operations net sales)
2012 2013
51 869 52 180 49 414 48 518
2015 2016
51 080
35%34%33%30% 33%
ESTABLISHED PRODUCTS GROWTH PRODUCTS (IN % OF
CONTINUING OPERATIONS NET SALES)
1 Since 2010, to demonstrate the rejuvenation of our portfolio, we have separately reported the net sales and growth rate of our newer products. During the years 2010 through 2012, these included products launched in 2007 or later (except for Sandoz products, which were included only if launched within the preceding one to two years). Beginning in 2013, we moved to a slightly different definition of “growth products,” which included products launched within the preceding five years, or products with exclusivity in key markets (EU, US, Japan) for at least the next four years (except for Sandoz products, which were included only if launched within the preceding 24 months).

Novartis Annual Report 2016 | 25PerformancePerformance summary
Ruxolitinib was designated a breakthrough therapy by the FDA for acute graft-versus-host disease (GVHD), a dangerous complication of stem cell transplants. Ruxolitinib, originally developed by Incyte Corporation, is marketed by Incyte Corporation as Jakafi® in the US and by Novartis as Jakavi outside the US to treat blood cancers myelofibrosis and polycythemia vera. We have now acquired rights to develop and commercialize this therapy for GVHD outside the US.
Novartis also made progress beyond targeted thera-pies for cancer. We reported pivotal clinical data on CTL019 – a personalized cell therapy developed in colla-boration with the University of Pennsylvania in the US – in pediatric and young adult patients with relapsed/refractory B-cell acute lymphoblastic leukemia, and we plan to file for marketing approval in early 2017. CTL019 harnesses the body’s immune system to fight cancer cells and is among the first personalized cell therapies for cancer to be developed in the world.
Immunology and dermatologyWe continue to build on the launch of Cosentyx, the first approved fully human monoclonal antibody that selec-tively binds to circulating interleukin-17A, which plays an important role in driving the body’s immune response in several disorders. In 2016, we received FDA approval for Cosentyx to treat patients with ankylosing spondylitis (AS) and psoriatic arthritis (PsA), which are both painful and debilitating inflammatory diseases that affect the joints and/or spine. The two new indications follow FDA and EU approvals in January 2015 for Cosentyx to treat moderate-to-severe plaque psoriasis, and European approval in November 2015 to treat AS and PsA.
Novartis also expanded the use of Ilaris, an inter-leukin-1 beta inhibitor. In 2016, the European Commission approved a license extension for Ilaris to treat patients with adult-onset Still’s disease, and the FDA approved the drug for three rare and distinct types of periodic fever syndromes, also known as hereditary periodic fevers. Earlier in the year, Ilaris was granted breakthrough therapy status and priority review by the FDA for each of the three periodic fever syndromes.
NeuroscienceWe reported positive clinical trial results for two import-ant molecules in our neuroscience pipeline: BAF312 (siponimod) and AMG 334 (erenumab). A Phase III study showed that BAF312 reduces the risk of disability pro-gression in patients with secondary progressive multiple sclerosis, a condition with few available treatment options. We also announced positive results for two Phase III studies of AMG 334 in episodic migraine prevention, and for a Phase II study of AMG 334 in chronic migraine prevention. In these studies, patients who received AMG 334 experienced fewer monthly migraine days than patients who received placebo.
Innovation performance
We made significant progress in research and develop-ment in 2016, with 16 major approvals in key markets and 24 major submissions. We also reported positive clinical data for key molecules, helping to bolster our broad pipe-line of products in development. We believe we have up to 12 drugs in our pipeline with the potential to become blockbusters.
We believe we have up to 12 drugs in our pipeline with the potential to become blockbusters
OncologySeveral targeted therapies designed to tackle abnormal-ities in cancer cells achieved significant milestones in 2016. We filed for regulatory approval in the US and EU to market LEE011 (ribociclib) in combination with letrozole for the treatment of a particular type of breast cancer. In a pivotal Phase III trial, LEE011 plus letrozole significantly extended progression-free survival over letrozole alone in postmenopausal women with hormone receptor-positive (HR+)/human epidermal growth factor receptor 2-negative (HER2-) advanced or metastatic breast cancer, which tends to be aggressive and difficult to treat. The study evaluated the combination as a first-line treatment. The US Food and Drug Administration (FDA) granted priority review for LEE011 plus letrozole after designating the combination a breakthrough ther-apy for the disease. Such designations are intended to expedite the development and review of potential new medicines that treat serious or life-threatening conditions.
We also filed to market targeted therapies in lung and blood cancer. We filed our ALK inhibitor Zykadia in the US and EU for a new indication as a first-line treatment for ALK+ non-small cell lung cancer. Approximately 2–7% of people with the disease have the ALK gene rearrange-ment. Our Tafinlar + Mekinist combination was filed in the US and EU with a new indication as a first-line treat-ment for non-small cell lung cancer patients with a BRAF V600 mutation. BRAF V600 mutations promote tumor growth. In addition, PKC412 (midostaurin) in combination with standard induction and consolidation chemother-apy was filed in the US and EU for adult patients with newly diagnosed acute myeloid leukemia (AML) with an FLT3 mutation. Like BRAF V600 mutations, FLT3 muta-tions promote tumor growth.

26 | Novartis Annual Report 2016
Biosimilars The FDA approved our biosimilar Erelzi (etanercept-szzs) to treat multiple inflammatory diseases. Erelzi is the second biosimilar from our Sandoz Division to be approved in the US under the new biosimilar pathway created in the Biologics Price Competition and Inno-vation Act of 2009. A confirmatory clinical safety and efficacy study demonstrated that Erelzi is equivalent to reference product Enbrel®. The biosimilar launch is pending litigation with Amgen, the manufacturer of Enbrel®.
Our biosimilar Binocrit (epoetin alfa) was approved in the EU for a new route of administration based on data from a study in pre-dialysis and dialysis patients with anemia associated with chronic kidney disease. We are currently evaluating options for an epoetin alfa filing in the US.
Filings were accepted in the EU in 2016 for our peg-filgrastim and rituximab biosimilars. In 2017, we plan to submit filings for adalimumab in the US and EU, rituximab in the US, and infliximab in the EU. We remain on track to launch five major biosimilars across both key geo-graphies by 2020, adding to the three Sandoz biosimilars already on the market worldwide.
Eye careIn 2016, we received EU approval for Lucentis (ranibi-zumab) – an anti-vascular endothelial growth factor agent – in a new indication. Originally approved for wet age-related macular degeneration, the drug can now be used to treat a wide range of conditions that share a common feature: the growth of abnormal blood vessels under the retina. The latest approval is for the treatment of visual impairment due to choroidal neovascularization associated with causes other than neovascular age- related macular degeneration or secondary pathologic myopia. Genentech has commercial rights to Lucentis in the US, and Novartis has exclusive rights in the rest of the world.
Our eye care division, Alcon, launched two new sur-gical technologies – the CyPass Micro-Stent and the NGENUITY 3D Visualization System – for the treatment of eye diseases. The CyPass Micro-Stent, approved by the FDA in July, is a minimally-invasive glaucoma surgery device that is implanted at the time of cataract surgery. It is designed to lower pressure in the eye and thereby help reduce the potential for tissue damage that’s characteristic of primary open-angle glaucoma. The NGENUITY 3D Visualization System is an imaging platform that helps vitreoretinal surgeons better visual-ize the delicate tissues at the back of the eye during surgery.
We also launched Dailies Total1 Multifocal and Air Optix plus HydraGlyde, contact lenses featuring new technologies.
Performance summarycontinued
Elsa Anderson and her classmates prepare for a choral performance in Rockport, Massachusetts in the US. Her mother, Jennifer Allport-Anderson, is a researcher at the Novartis Institutes for BioMedical Research (NIBR) in Cam-bridge, Massachusetts.

Novartis Annual Report 2016 | 27PerformancePerformance summary
Out of a total of 206 inspections in 2016, all but four (98%) were without major findings
The Group Quality function operates under single lead-ership within Novartis, built around teams responsible for quality within GDD, NTO and NBS, and for coordinating quality activities in the countries. New leadership positions were created, including Head of Quality for GDD, Head of Quality for NTO, and Head of Country Quality.
This integrated model enables the quality organiza-tion to simplify and standardize processes and systems, strengthening its partnership with other functions in the company. It also supports our long-standing commitment to quality improvement, offering new opportunities for sharing knowledge and best practices, and facilitating the exchange of skills and expertise.
The results of inspections by regulatory agencies in 2016 were consistent with the year before. Out of a total of 206 inspections, all but four (98%) were without major findings.
People
Our ability to effectively implement the Novartis strategy depends on the performance of our people. In 2016, we focused on introducing our company’s new operating model in a way that enables employees to respond to new opportunities and challenges. We also strengthened the company’s leadership team and made progress in developing our diverse pipeline of talented people.
Operations
In 2016, we centralized all drug manufacturing operations into a new organization with the aim of optimizing capacity planning and improving efficiency and effectiveness, further supporting our ability to implement the Novartis strategy. Novartis Technical Operations (NTO) includes about 28 000 employees and nearly 70 manufacturing sites supplying products worldwide.
The new unit has been organized by technology plat-forms to facilitate simplification, standardization and procurement savings. The technology platforms include Chemical Operations, Anti-Infectives, Aseptics, Bio-logics, Solids and External Supply Operations. They are supported by the Global Engineering and Supply Chain Management functions.
An early benefit of integration has been better resource allocation. The larger scale of NTO allows for more flexible capacity planning, and provides the oppor-tunity to further consolidate our supplier base and improve cost and performance. For instance, the Bio-logics platform, which was formed before the official launch of NTO, has used its experience in balancing manufacturing capacity and sharing knowledge across its network to respond to greater-than-expected demand for products such as Cosentyx.
Additionally, the new structure has made it easier to invest in future manufacturing technologies, such as innovative solutions in biologics.
Novartis also began a realignment of its quality orga-nization in 2016. We are creating an integrated, enter-prise-wide organization, replacing the prior divisional structure. This change, like others Novartis made last year, aims to maximize the benefits of the company’s global scale.
People performance indicators 1 2016 2015
Full-time equivalent positions / headcount 2 118 393 / 122 985 118 700 / 122 966
Turnover: % voluntary / % overall 7.4 / 12.2 7.3 / 13.5
Voluntary turnover of high performers (%) 3 5.8 5.5
Internal hires / external hires (%) 47.0 / 53.0 44.8 / 55.2
Women in management: % of management4 / % of Board of Directors 42 / 25 41 / 27
Associate nationalities / associate nationalities in management 4 142 / 109 145 / 109
Annual training hours per employee 27.8 27.3
1 Continuing operations2 Headcount reflects the total number of associates in our payroll systems. Full-time equivalent adjusts headcount for associates working less than 100%. All data as of December 313 We have refined the high-performer definition methodology to reflect the focus on Values and Behaviors, and have restated 2015 data.4 Management defined locally
28 | Novartis Annual Report 2016
The Board of Directors had a detailed review of suc-cession plans for the ECN and also received an update on our overall progress in the area of talent management.
Our five-year integrated talent and leadership strat-egy, introduced in 2015, guides the identification, assess-ment and development of high-potential employees. Some 74% of Novartis Top Leader positions (the com-pany’s 360 most senior executives) were filled internally in 2016, reflecting our commitment to developing tal-ented individuals within the organization and accelerat-ing their careers. To further strengthen succession plans for key leadership positions, we introduced assessment centers to identify and develop people with high poten-tial. In 2016, 48 people were enrolled.
In tandem, the strategy focuses on identifying tal-ented individuals outside the organization. This enables the proactive management of openings, and reduces the time necessary to fill senior positions.
The company is investing in data analytics to predict future workforce needs and help understand recruitment trends. Two pilots were conducted with NIBR in 2016. The first examined turnover data to identify people who were more or less likely to leave, and helped us to engage and retain key staff. The second addressed diversity, and identified ways to attract more female employees and help them progress further in the organization. We will scale up the use of data analytics tools in 2017.
The talent strategy also aims to increase manage-ment accountability for developing diverse teams and creating an inclusive work environment. Starting in 2016, the appraisal framework for all managers included a mandatory 20% objective measuring their people- related performance.
Reflecting this priority, we launched the Novartis Leadership Series in 2016 to improve the management capabilities of everyone leading a team of five or more people. These online training materials feature Novartis leaders and external experts sharing their experience and giving practical advice to help managers expand their knowledge and skills. The materials were used by 9 100 employees.
We made further progress in 2016 in diversifying our workforce. We achieved our initial aspiration of 25% female representation among Novartis Top Leaders. And we have 42% female representation in management. Measures we are taking include acquiring new talent, using focus group discussions to identify potential bar-riers to advancement, mentoring, and expanding leader-ship programs.
For example, we are expanding the Executive Female Leadership Program (EFLP) begun in the Pharmaceuticals Division in 2010. This year-long program offers intensive leadership experience for women, including coaching, workshops, and senior sponsorship and mentorship. Since inception, 147 female leaders have been involved
Organizational design and change managementIn 2016, Novartis implemented significant changes to the company structure. When our new structure went live on July 1, 38 000 employees – or about a third of the work-force – were realigned to new business organizations. We took significant steps to prepare for this transition for our employees and our business. Human resources professionals received tools to help them partner effec-tively with business managers. In addition, online train-ing courses guided managers and employees through the challenges they could encounter. More than 9 300 managers and staff have completed this training since it was introduced in 2014.
Throughout the year, we sought feedback from employees in a series of surveys, focus groups and inter-views. For example, a survey of leadership teams found that 84% of respondents understood the rationale behind the changes at Novartis.
Our new structure and operating model require employees to work in new ways, collaborating across organizational boundaries. The cultural shift is being driven by our senior leaders, 260 of whom met in Sep-tember to align on the future direction of the company, define roles and responsibilities, and discuss how the culture needed to evolve with an emphasis on collabo-ration. Following the meeting, participants received materials and workshop tools that enabled them to edu-cate and motivate their teams about the new operating model and to align their teams around strategic priori-ties. The rollout began in late 2016 and will extend into early 2017.
Our new structure and operating model require employees to work in new ways, collaborating across organizational boundaries
Reinforcing talent, capabilities and leadershipIn 2016, Novartis also made significant changes to its leadership team, including establishing new heads of the Novartis Institutes for BioMedical Research (NIBR), the Novartis Pharmaceuticals business unit and our Alcon Division, as well as a new Chief Ethics and Compliance Officer and Head of Litigation. In addition, the heads of GDD and the Novartis Oncology business unit became members of the Executive Committee of Novartis (ECN), in view of those organizations’ importance to the company’s future.
Performance summarycontinued

Novartis Annual Report 2016 | 29PerformancePerformance summary
Voluntary turnover of high performers was 5.8% – compared to 5.5% in 2015. Voluntary turnover of Novartis Top Leaders was 5.6%. The ECN analyzed the risk of these people leaving and initiated mitigation plans where appropriate.
Strengthening the Novartis cultureThe new Novartis structure and operating model have led to an even greater focus on the revised set of Novartis Values and Behaviors (V&Bs) introduced in 2015. These define the professional behavior we expect from our employees and highlight the need for collaboration, as well as innovation, quality, performance, courage and integrity. V&Bs are now incorporated into all people processes at Novartis, from recruitment to performance assessment. For more on our culture and values, see page 18. For more on doing business responsibly, see page 68.
Social performance
Expanding access to healthcare In 2016, we combined several of our innovative access programs into a single group under unified leadership. Novartis Access, the Novartis Malaria Initiative, and Group social business (which operates in four countries under the name Healthy Family) now belong to a new unit called Novartis Social Business, led by a single individual: the Global Head of Novartis Social Business. Each program uses innovative approaches and business models to increase the health and well-being of patients in lower-income countries. By combining them, we aim to better leverage experience, learning and synergies across the programs.
More than 120 000 Novartis Access treatments were delivered to Kenya, Lebanon and Ethiopia since launch
Novartis Access, which focuses on the affordability and availability of 15 on- and off-patent medicines addressing key noncommunicable diseases (NCDs), launched in Kenya in 2015. It is offered to governments and public- sector customers in low- and lower-middle-income coun-tries at a price of USD 1 per treatment per month. The first treatments were delivered to Kenya in February 2016. In total, more than 120 000 Novartis Access treatments were delivered to Kenya, Lebanon and Ethiopia since launch, each providing a one-month supply of medicine.
in the program. Of these, 74% have since been promoted or moved roles, with a 91% retention rate. The EFLP and similar programs in other parts of the company are being expanded in 2017 to cover the whole of Novartis.
We are also pursuing greater cultural diversity. We implemented Emerging Market Talent Boards in Asia and Latin America, which facilitated 37 senior-level moves of talented individuals to new roles in 2016. In addition, our 12-month Emerging Market Early Talent Program had 22 participants in 2016.
Novartis continues to be recognized for its efforts in diversity and inclusion. Novartis Pharmaceuticals Corporation placed second in the US on DiversityInc’s 2016 “Top 50 Companies for Diversity” list. Additionally, we ranked third in the Thomson Reuters global Diver-sity & Inclusion Index, and we were included in Working Mother’s 2016 “100 Best Companies” list in the US. Novartis also ranked No. 11 on a list of the most empathetic global companies that was published in the Harvard Business Review.
Staff turnover rose modestly in 2016. Voluntary turn-over of all staff was 7.4% in 2016 – versus 7.3% the prior year. That compares with an average 9.7% for the industry. However, we saw pockets of higher turnover in areas such as our global sales force and in some emerging markets with sharp competition for talent, including Thailand, Taiwan and China. Regular analysis has helped us better forecast groups at higher risk of leaving and enabled targeted retention efforts.
NIBR researcher Jennifer Allport-Anderson participates in a half-marathon in Ipswich, Massachusetts in the US.

30 | Novartis Annual Report 2016
currently eligible for GIPAP, and provide funding to The Max Foundation to support program operations.
In 2016, Sandoz further expanded New Life & New Hope, a program launched in 2015 in Ethiopia to improve maternal and child health and to reduce mortality asso-ciated with childbirth. The company supported a second wave of training for another 100 midwives in three new regions where the highest need to improve delivery skills was identified.
In 2016, our eye care division Alcon supported 646 medical missions, reaching more than 480 000 patients with eye conditions, and restoring sight for 58 000 patients through surgery. Through the US patient assis-tance program, Alcon also helped nearly 6 000 patients get the sight-saving medications they needed.
Doing business responsiblyIn late 2015, we launched our Vision 2030 on Environ-mental Sustainability, which is underpinned by a set of environmental sustainability targets in four areas: energy and climate, water and micropollutants, materials and waste, and environmental sustainability management. Throughout 2016, a cross-divisional team began to select major facility and infrastructure projects and measures necessary to achieve our 2020 goals, based on the savings as determined by our internal carbon price
In September, we signed a memorandum of understand-ing for the implementation of Novartis Access in Rwanda, and we expect the first product delivery in early 2017. We also signed a broad memorandum of understanding with the government of Vietnam, which covers NCD inter-ventions such as Novartis Access. At the same time, to prepare for implementation elsewhere, we filed 370 applications for marketing authorizations for Novartis Access drugs with health authorities in 21 countries.
In 2016, the Novartis Malaria Initiative achieved an other treatment milestone, having delivered more than 800 million treatments without profit – including more than 300 million dispersible pediatric treatments – mostly to the public sector of malaria-endemic countries since 2001. In December, we launched SMS for Life 2.0 in Kaduna State, Nigeria’s third most populous region, in collaboration with the Kaduna State Ministry of Health. The program aims to increase the availability of essential medicines and to improve care for patients across the region by using simple, available and affordable tech-nology.
In June, Novartis expanded its partnership with the Medicines for Malaria Venture (MMV) to develop next- generation antimalarial treatments. Novartis will lead the development of antimalarial compound KAF156 with sci-entific and financial support from MMV (in collaboration with the Bill & Melinda Gates Foundation).
The results of a small proof-of-concept study of our experimental antimalarial compound KAF156 were published in The New England Journal of Medicine in September, showing that KAF156 demonstrated activity against both vivax and falciparum malaria, including parasites resistant to today’s artemisinin-based thera-pies. KAF156 is currently entering Phase IIb clinical development.
Our Healthy Family programs, which are innovative business models to reach more patients in rural areas in the developing world, continued their expansion. In 2016, they reached more than 7.7 million people through health education sessions in India, Kenya, Vietnam and Indonesia. Nearly 610 000 people attended specific health camps.
Novartis Oncology Access – a patient assistance program in emerging countries for Glivec, Tasigna and Exjade (our treatments for certain cancers and blood disorders) – and the Glivec International Patient Assistance Program (GIPAP) together reached more than 80 000 patients worldwide in 2016. Given changes in the health-care environment since GIPAP was launched 14 years ago, starting in 2017, our longtime partner The Max Foun-dation will assume full responsibility for development and management of the program. Novartis Oncology will donate Glivec to The Max Foundation to supply patients
Performance summarycontinued
Researcher Edmund Ekuadzi, an expert on the medical properties of plants, examines a specimen gathered in his homeland of Ghana.

Novartis Annual Report 2016 | 31PerformancePerformance summary
Integrity and compliance trainingAll Novartis Group company associates are required to complete integrity and compliance training. The compli-ance e-training curriculum provides information to enable associates to make the right choices within their role and to perform with integrity.
In 2016, three courses were available: Code of Conduct, Social Media and Information Management. Three shorter and/or refresher courses were also deliv-ered: Adverse Events, Data Privacy and Anti-Bribery.
Cases of misconductWe take allegations of any inappropriate behavior very seriously, actively investigate them, and take appropriate disciplinary action. Associates can report suspected misconduct to the Business Practices Office (BPO) – an independent team that reports to the Group General Counsel. In 2016, the BPO initiated investigations of 1 707 reported cases related to misconduct; 893 were sub-stantiated, including 401 that resulted in dismissals or resignations.
We will continue to invest significant efforts to embed a culture of compliance throughout our organization. For instance, we are strengthening the Integrity & Compli-ance (I&C) function, which now has approximately 375 full-time-equivalent employees who are dedicated to integrity and compliance at the local, regional and global levels. Of these employees, 175 were added in the past three years.
RecognitionIn 2016, Novartis was recognized in several corporate responsibility rankings, including the Access to Medicine Index, where Novartis ranked No. 3, moving up one place versus 2014; Newsweek’s Green Rankings; Corporate Knights’ Global 100 Most Sustainable Corporations in the World Index; and the Dow Jones Sustainability World Index. Novartis also ranked as the second-highest pharmaceutical company in Fortune’s 2016 “World’s Most Admired Companies” list, and received an A- rating and recognition among category leaders in healthcare in the 2016 CDP Climate Score.
Novartis ranked No. 3 in the Access to Medicine Index, moving up one place versus 2014
of USD 100/tCO2e. We are identifying opportunities for contracting renewable wind and solar electricity as priority actions. At the same time, we found ways to improve our environmental footprint in our day-to-day operations, contributing to a reduction in carbon emis-sions of 10 kilotons in 2016.
Novartis has a number of initiatives to engage our associates, helping us to attract and develop talented people, strengthen our company’s culture, and support our ability to execute our strategy. In 2015, we put in place a corporate volunteering platform through which Novartis associates can register a potential corporate respon-sibility project idea or sign up to become a corporate volunteer. The program expanded significantly in 2016, launching in several markets including low- and middle- income countries. The scope of projects in the platform is broad and includes partnerships with global chari table organizations, remote and on-the-ground capability building, one-time and recurring pro bono services, and local efforts to support smaller-scale foundations and institutions.
Ethics To achieve our aspiration of being a trusted leader in changing the practice of medicine, we must act in ways that earn and maintain the trust of patients, governments and society. Operating ethically is simply the right thing to do and is fundamental to our success as a business.
Strengthening our culture of integrityTo continue to strengthen integrity and compliance across the company, we took a series of new steps in 2016. We updated and re-launched our Anti-Bribery Policy. We also launched a global online tool to handle actual, potential and perceived conflicts of interest transparently across the company. Additionally, we developed integrity case studies, inspired by real-life scenarios, for managers to use in discussions with their teams. To ensure accountability of local country orga ni-zations, our management includes integrity and compli-ance questions as part of standard business reviews.
One of our goals in 2016 was to find better and more inclusive ways to reach a broader cross-section of the medical community with information about our products. We began employing technology to supplement face- to-face meetings. For example, at meetings for the American Society of Clinical Oncology, the European School for Advanced Studies in Ophthalmology, and the American Society of Hematology, we used virtual conference plat-forms so that more doctors could access evidence-based data and product information without traveling to the venue.

32 | Novartis Annual Report 2016
In 2016, the Innovative medicines Division offset the effects of the US patent expiration of Gleevec with increased sales of growth products, measured in con-stant currencies. This was a significant achievement and underscores our ability to renew our product port-folio.
The Innovative Medicines Division includes the Novartis Oncology and Novartis Pharmaceuticals business units. Novartis Pharmaceuticals focuses on the franchises of Neuroscience, Ophthalmology, Immunology and Derma-tology, Respiratory, Cardio-Metabolic and Established Medicines. Novartis Oncology focuses on treatments for a variety of cancers and rare diseases.
Following changes to the divisional structure of Novartis in 2016, results for the Innovative Medicines Division include ophthalmic pharmaceuticals products transferred from Alcon. They also exclude some mature products that were transferred to Sandoz.
Performance
Innovative Medicines Division sales were USD 32.6 bil -lion, down 2% in reported terms, but in line with the prior year in constant currencies (cc). A 7% increase in vol-ume was offset by the impact of generic competition (–6 percentage points) and price declines (–1 percentage point).
Sales performance varied by geography. Sales in Europe were USD 11.2 billion, up 7% in constant curren-cies, and reached USD 8.1 billion in emerging growth markets, up 6% (cc). In the US, sales declined 8% (cc) to USD 10.9 billion, mainly due to generic competition for Gleevec following loss of patent protection there in February. And in Japan, sales declined 10% (cc), due to generic competition and divestments.
Growth products contributed USD 14.8 billion, up 24% in constant currencies. These products – which include Gilenya, Cosentyx, Entresto, Tasigna, Jakavi, and the combination of Tafinlar + Mekinist – represented 45% of net sales, compared to 37% in 2015.
Operating income was USD 7.4 billion (–5%, 0% cc). Core operating income, which excludes certain items,
was USD 10.4 billion (–5%, –1% cc). Core operating income margin decreased 0.2 percentage points, mainly due to launch investments for Entresto and Cosentyx, but partially offset by productivity improvements. Fluc-tuations in exchange rates had a further negative impact of 0.6 percentage points, resulting in a net decrease of 0.8 percentage points to 31.8% of net sales.
14.8 bn (USD) Sales of growth products such as Gilenya, Cosentyx, Entresto, Tasigna, Jakavi, and Tafinlar + Mekinist
Innovative Medicines
Key figures(in USD millions, unless indicated otherwise) % Change
2016 2015 1 USD cc 2
Net sales 32 562 33 345 – 2 0
Operating income 7 426 7 815 – 5 0
Return on net sales (%) 22.8 23.4
Core operating income 2 10 354 10 862 – 5 – 1
Core return on net sales (%) 31.8 32.6
Core Research & Development 2 7 112 7 502 5 4
As a % of net sales 21.8 22.5
Net operating assets 41 904 43 971 – 5
1 Restated to reflect the new divisional structures and product transfers between divisions, announced on January 27, 2016
2 Constant currencies (cc) and core results are non-IFRS measures. A definition of non-IFRS measures used by Novartis, and further details, including reconciliation tables, can be found starting on page 171.
Innovative medicines 2016 net sales by business unit and franchise(in USD millions and growth in % cc2)
noVarTIS oncoLoGY BUSIneSS UnIT 12 790 / – 2%
39%
19 772 / 1%
noVarTIS PHarmaceUTIcaLS BUSIneSS UnIT61%
5 463 / – 6%oPHTHaLmoLoGY
neUroScIence 3 677 / 2%
3 015 / 44%ImmUnoLoGY anD DermaToLoGY
1 521 / 15%reSPIraTorY
1 377 / 20%carDIo-meTaBoLIc
4 719 / – 15%eSTaBLISHeD meDIcIneS
ToTaL 32 562 / 0%

Novartis Annual Report 2016 | 33PerformanceInnovative medicines
Novartis Pharmaceuticals business unit
OphthalmologySales in Ophthalmology were USD 5.5 billion (–8%, –6% cc), primarily reflecting declines in Lucentis (–11%, –8% cc), which continues to see increasing competitive pressure in Japan and some European countries.
NeuroscienceNeuroscience sales were USD 3.7 billion (+1%, +2% cc), with increases for Gilenya (+12%, +14% cc) being offset by lower sales of Exelon and Exelon Patch (–39%, –39% cc), due to generic competition for Exelon Patch in the US and EU.
Immunology and DermatologySales in Immunology and Dermatology reached USD 3.0 billion (+41%, +44% cc). Sales of Cosentyx continued to accelerate, reaching USD 1.1 billion, versus USD 261 mil-lion in 2015. Gains for Ilaris (+20%, +22% cc) also helped offset declines in other products due to generic compe-tition.
RespiratoryRespiratory sales were USD 1.5 billion (+11%, +15% cc). Our portfolio of drugs for chronic obstructive pulmonary disease (COPD) – including Onbrez Breezhaler/Arcapta Neohaler, Seebri Breezhaler and Ultibro Breezhaler – achieved sales of USD 655 million (+14%, +16% cc). Sales of Xolair, the first biologic drug approved for moder-ate-to-severe allergic asthma, reached USD 835 million (+11%, +15% cc), including as a treatment for chronic hives.
Cardio-MetabolicSales for the franchise were USD 1.4 billion (+19%, +20% cc). Entresto – which has been launched in more than 30 countries and benefited from a strong endorsement in updated clinical practice guidelines in the US and EU – continued to grow steadily and sales reached USD 170 million, up from USD 21 million in 2015. Galvus sales were USD 1.2 billion (+5%, +6% cc).
Established MedicinesEstablished medicines such as Diovan (USD 1.1 billion, –13% cc) and Exforge (USD 926 million, –8% cc) contin-ued to see declines due to generic competition.
Novartis Oncology business unit
Oncology sales were USD 12.8 billion (–4%, –2% cc), nearly even with the prior year, despite declining sales of Gleevec/Glivec (–29%, –28% cc) due to generic com-petition in the US. That decline was largely offset by growth in other products. Products showing growth included the combination therapy Tafinlar + Mekinist (USD 672 million); Votrient (USD 729 million); Promacta/Revolade (USD 635 million); and Jakavi, up 45% (cc) to USD 581 million.
For further detail, see
k Condensed Financial Report at www.novartis.com/investors
2016 news highlights
In January, Novartis received FDA approval for Cosentyx for the treatment of ankylosing spondylitis and psoriatic arthritis.
In May, Entresto was given a Class I recommendation – the strongest endorsement – in updated clinical practice guidelines simultaneously released by the American College of Cardiology, the American Heart Association and the Heart Failure Society of America in the US, as well as the European Society of Cardiology.
In November, Novartis announced that the FDA granted priority review for LEE011 (ribociclib) as first-line treatment of postmenopausal women with HR+/HER2- advanced or metastatic breast cancer in combination with letrozole.

34 | Novartis Annual Report 2016
set by the negative 0.1 percentage-point impact of exchange rates, yielding a result of 20.4% of net sales.
Sandoz continued to build its portfolio of biopharma-ceuticals, which now represents a USD 1 billion-plus business, with roughly half of that coming from the US. In 2016, our biosimilar Erelzi (etanercept-szzs) was approved in the US to treat the same inflammatory dis-eases as the reference product, Amgen’s Enbrel®, with its launch pending litigation. In addition, our biosimilar Binocrit (epoetin alfa) was approved in the EU for a new route of administration. We are currently evaluating options for an epoetin alfa filing in the US. Filings were accepted in the EU for our pegfilgrastim and rituximab biosimilars.
2.1 bn (USD) Sandoz core operating income, supported by strong sales growth in key markets
Sandoz had solid performance in 2016, supported by continued growth in demand for its leading portfolio of generic and biopharmaceutical medicines. Sales increased in nearly every region, measured in constant currencies, contributing to higher earnings.
Sandoz makes an important contribution to the overall Novartis objective of expanding access to healthcare, offering approximately 1 000 high-quality, affordable medicines to patients and healthcare professionals worldwide. The division has three global franchises: Retail Generics, Biopharmaceuticals and Anti-Infectives. Sandoz results include some mature products trans-ferred from the Innovative Medicines Division during 2016.
Performance
Sandoz net sales in 2016 were USD 10.1 billion (+1%, +2% in constant currencies, or cc), with strong performance particularly in biopharmaceuticals (+31% cc). An 8 percentage- point increase in volume more than offset the negative 6 percentage-point effect of price erosion. Sales rose in Central and Eastern Europe (+7% cc), West-ern Europe (+3% cc), the US (+1% cc), Latin America (+11% cc), and the Middle East and Africa (+6% cc). Sales in Asia Pacific were comparable to the prior year (cc).
Operating income reached USD 1.4 billion, up 11% (+14% cc). Core operating income, which excludes cer-tain items, was USD 2.1 billion (+1%, +4% cc). Core oper-ating income margin in constant currencies increased 0.2 percentage points. However, that gain was partly off-
Sandoz
Key figures(in USD millions, unless indicated otherwise) % Change
2016 2015 1 USD cc 2
Net sales 10 144 10 070 1 2
Operating income 1 445 1 300 11 14
Return on net sales (%) 14.2 12.9
Core operating income 2 2 071 2 045 1 4
Core return on net sales (%) 20.4 20.3
Core Research & Development 2 804 781 – 3 – 4
As a % of net sales 7.9 7.8
Net operating assets 14 443 14 985 – 4
1 Restated to reflect the new divisional structures and product transfers between divisions, announced on January 27, 2016
2 Constant currencies (cc) and core results are non-IFRS measures. A definition of non-IFRS measures used by Novartis, and further details, including reconciliation tables, can be found starting on page 171.
Sandoz 2016 net sales by franchise(in USD millions and growth in % cc2)
ToTaL 10 144 / 2%
reTaIL GenerIcS 8 623 / 1%
85%1 002 / 31%BIoPHarmaceUTIcaLS
10%
519 / – 10%anTI-InfecTIVeS
(partner label/API)
5%

Novartis Annual Report 2016 | 35PerformanceSandoz
2016 news highlights
In May, Sandoz confirmed that the EMA had accepted our regulatory submission for rituximab, a biosimilar to Roche’s EU-licensed MabThera®, a monoclonal antibody used in oncology and autoimmune diseases.
In August, the FDA announced that it had approved Erelzi (etanercept-szzs) as the second Sandoz biosimilar in the US. Erelzi is a biosimilar to Amgen’s Enbrel®, which treats multiple inflammatory diseases.
In September, Sandoz confirmed that top-line results for a confirmatory clinical study showed that our biosimilar infliximab demonstrated equivalent efficacy to its reference product, Remicade®, used to treat autoimmune diseases. Sandoz announced in February that it had acquired rights from Pfizer to develop, commercialize and manufacture its biosimilar infliximab in the European Economic Area.
In September, Sandoz launched Sandoz HACk – short for Healthcare Access Challenge – a competition to generate, incubate and deliver innovative ideas with the potential to help solve global health problems. Winners will be announced in March 2017.
Retail GenericsSandoz markets active ingredients, intermediates and finished dosage forms of pharmaceuticals. The Retail Generics franchise includes products in the therapeutic areas of dermatology, respiratory, oncology, transplan-tation and ophthalmics, plus finished dosage forms of anti-infectives sold under the Sandoz name. Franchise sales reached USD 8.6 billion (+1% cc).
BiopharmaceuticalsSandoz markets protein- and other biotechnology-based products called biosimilars, as well as Glatopa, which treats a relapsing form of multiple sclerosis. Global sales of biopharmaceuticals grew 31% (cc) to USD 1.0 billion, benefiting from the US launches in 2015 of Glatopa and Zarxio, and the continued strong growth of other prod-ucts already on the market.
Anti-InfectivesSandoz sells pharmaceutical ingredients and intermediates (mainly antibiotics) under the Sandoz name and to third-party customers. Anti-infectives sold to third parties for sale under their own name were USD 519 million, down 10% (cc), because some low-margin products were discontin-ued and also due to a weak flu season in the first quarter of 2016. Total Anti-Infectives sales were USD 1.4 billion, down 2% (cc), and included sales of finished dosage forms sold under the Sandoz name of USD 860 million, up 4% (cc).
For further detail, see
k Condensed Financial Report at www.novartis.com/investors
Mustafa plays in his temporary home in Bireh, Lebanon, where he and his extended family have lived since their home was destroyed in Homs, Syria, four years ago. His grandmother has diabetes and receives treatment at a local Red Cross clinic.

36 | Novartis Annual Report 2016
Alcon net sales in 2016 were USD 5.8 billion (–3%, –2% in constant currencies, or cc). Operating loss was USD 132 million, compared to income of USD 281 million the year before.
Core operating income, which excludes certain items, was USD 850 million (–31%, –27% cc), mainly due to increased investment in research and development, as well as higher spending on sales and marketing – both activities that were part of the Alcon growth plan. Core operating income margin in constant currencies de -creased by 5.3 percentage points, and exchange rates added another 0.7 percentage points of negative impact, yielding a net decrease of 6 percentage points to 14.6% of net sales.
5.8 bn (USD) Alcon net sales
2016 was a transition year at alcon. The division con-centrated its focus on eye care devices, invested in research and development to expand its product port-folio, and introduced new systems and capabilities to strengthen relationships with customers. although we were unsuccessful in returning alcon to growth in 2016, our efforts are starting to bear fruit.
In a world with aging populations and growing needs for eye care, Alcon continues to enhance people’s quality of life by helping them see better. Alcon’s Surgical and Vision Care businesses together offer one of the world’s widest selections of eye care devices – from sophisti-cated equipment for delicate eye surgery, to a wide port-folio of advanced contact lenses.
Results for the division no longer include ophthalmic pharmaceuticals products, which were transferred during 2016 to the Innovative Medicines Division as part of a change in the structure of Novartis.
Performance
Alcon implemented a growth plan in 2016 with emphasis on three areas: accelerating innovation and sales, strengthening customer relationships, and improving operations. Alcon launched new products during the year, including the CyPass Micro-Stent to treat glaucoma, the NGENUITY 3D Visualization System for retinal surgery, and a multifocal version of its innovative Dailies Total1 contact lenses. Increased advertising and promotion for contact lenses helped return that segment to growth after several weak quarters.
Alcon
Key figures(in USD millions, unless indicated otherwise) % Change
2016 2015 1 USD cc 2
Net sales 5 812 5 999 – 3 – 2
Operating loss/income – 132 281 nm nm
Return on net sales (%) – 2.3 4.7
Core operating income 2 850 1 235 – 31 – 27
Core return on net sales (%) 14.6 20.6
Core Research & Development 2 486 455 – 7 – 7
As a % of net sales 8.4 7.6
Net operating assets 20 450 20 888 – 2
nm = not meaningful1 Restated to reflect the new divisional structures and product transfers between
divisions, announced on January 27, 20162 Constant currencies (cc) and core results are non-IFRS measures. A definition of
non-IFRS measures used by Novartis, and further details, including reconciliation tables, can be found starting on page 171.
alcon 2016 net sales by franchise(in USD millions and growth in % cc2)
ToTaL 5 812 / – 2%
SUrGIcaL 3 518 / – 3%
61%
2 294 / 0%VISIon care
39%

Novartis Annual Report 2016 | 37Performancealcon
2016 news highlights
In July, Alcon received FDA approval for Air Optix plus HydraGlyde, a silicone hydrogel contact lens featuring HydraGlyde Moisture Matrix technology for longer-lasting lens surface moisture.
In July, Alcon introduced Dailies Total1 Multifocal contact lenses, which provide seamless distant, intermediate and near vision, and the comfort of the Dailies Total1 water-gradient lens technology.
In September, Alcon launched the NGENUITY 3D Visualization System, a platform for vitreoretinal surgery. The system is designed to improve the surgeon experience through high-resolution 3D imaging of the back of the eye.
In October, Alcon launched the CyPass Micro-Stent, a surgical device to treat patients with glaucoma in conjunction with cataract surgery. Alcon announced its acquisition of Transcend Medical, which developed CyPass, in the first quarter of 2016 and received FDA approval for the device in July.
SurgicalSurgical sales declined 3% (cc) to USD 3.5 billion, mainly due to weaker performance of intraocular lenses, which faced competitive pressures, and slowing equipment sales (primarily LenSx for cataract surgery and Wavelight for refractive surgery, which have reached high pene-tration in their market segments). Those factors were partially offset by continued solid growth in sales of cat-aract disposable surgical supplies (4% cc). The Surgical business is making progress, improving service and supply levels in 2016 and laying the foundation for a return to growth.
Vision CareVision Care sales were flat in constant currencies at USD 2.3 billion. Growth in contact lenses offset a decline in contact lens care products. Increased advertising and promotion behind key brands helped return the contact lens segment to growth after several weak quarters. Dailies Total1, the first and only water-gradient lens, was the key driver.
For further detail, see
k Condensed Financial Report at www.novartis.com/investors
Yuko Yoshikawa, whose vision is affected by eye disease, shelters her eyes from the sun as she shops near her home in Tokyo, Japan.

38 | Novartis Annual Report 2016
A cellular drama at the heart of a researcher’s familyEarly in her research career, Jennifer Allport-Anderson lived human dramas on two vastly different scales. One was at home, with her husband and growing family, and the other was in the laboratory, where she studied the biology and behavior of our cells. At first, these two worlds didn’t appear to have much in common.
The cellular world, in many ways, provided more surprises. Ms. Allport-Anderson, a cell biologist who now leads a heart failure and in vivo pharmacology team at the Novartis Institutes for BioMedical Re-search (NIBR) in Cambridge, Massachusetts in the US, still describes cells as almost like people acting in sweeping dramas. “I tend to anthropomorphize,” she says. “I love to think of cells going about their business.”
Thirteen years ago, her two worlds started to merge as the cellular drama she was studying began to play out in her own family. It started in 2003, when her brother-in-law, Scott, barely in his 40s, suffered a massive heart attack.
A year later, Ms. Allport-Anderson joined NIBR to help discover new medicines for diseases such as heart failure. Their relevance to her life was acute and growing. Her mother-in-law fell into decline, eventually dying at age 77, most likely from heart arrhythmia or
PHOTO ESSAY
1

Novartis Annual Report 2016 | 39PHOTO ESSAY
1 Jennifer Allport-Anderson sees life dramas reflected in the cells she studies.
2 Her two daughters are on swimming teams, supporting good heart health. Here, 10-year-old Corinne heads to swim practice.
3 Over the last 15 years, some family members have suffered from cardio- vascular disease and diabetes, adding to the sense of urgency behind Ms. Allport- Anderson’s research.
4 Family health issues prompted Ms. Allport-Anderson to adopt an active lifestyle. Here she runs a half-marathon in Ipswich, Massachusetts in the US.
a stroke. And in 2005, her husband, Keith, was diag-nosed with hypertension and prediabetes.
This led to changes. Ms. Allport-Anderson and her husband both wanted to maximize the chances that their two daughters would grow up healthy and with healthy parents. He dieted and she focused on healthy, home-cooked family meals. She also started running. Within a couple of years, he had lost 125 pounds and she was running marathons. (She has run five to date.)
Ms. Allport-Anderson’s two worlds each offered their own response to cardiovascular disease. At home, it was exercise and diet. At work, it was carrying out early research for new treatments.
Heart failure is a complex disease, and the underlying cause can vary from person to person. Scientists – including Ms. Allport-Anderson and her team – are working to uncover the cellular mechanisms behind the disease and to identify new strategies for
treatment. Her group is particularly interested in exploring cell-signaling pathways that drive heart failure and finding ways to intervene.
On a spring evening, Ms. Allport-Anderson and her family gather at their home in suburban Boston to watch the Kentucky Derby horse race on TV. From Ms. Allport-Anderson’s perspective, the room might as well be a laboratory for coronary health. The adults seated around the TV are on medications for various illnesses, ranging from heart disease to diabetes.
But her two daughters appear poised to break the pattern. They’re both competitive swimmers. Ten-year-old Corinne is in near-constant motion and at one point does a few pushups in front of the TV, clapping her hands between each one. And that very morning, Ms. Allport-Anderson ran a half-marathon. Her strategy, after all, is to battle heart disease from every angle, and the key – from home to the laboratory – is to take action.
2
3
4

40 | Novartis Annual Report 2016
InnovationOur researchers are reimagining medicine, working to invent and develop treatments that could improve and extend people’s lives. In 2016, we updated our research strategy in response to changes in the world of biomedical research. We also aligned our research and development (R&D) activities to more rapidly and efficiently translate discoveries into better options for doctors and patients. Our teams made progress toward fighting devastating diseases ranging from breast cancer to multiple sclerosis to malaria.
9.0 bn Research and development spending in 2016, amounting to 18.6% of net sales (USD)
Updated research strategy
We updated our research strategy in an effort to ensure that we remain a discovery powerhouse. We are increasing collaboration across traditional scientific and organizational boundaries, and focusing on powerful new technologies.
k page 41
23 000 Scientists, physicians and business professionals working in research and development worldwide
Global Drug Development
In 2016, we created a Global Drug Development group to oversee clinical development of new medicines for all therapeutic areas, with the aim of improving our effectiveness and efficiency at delivering important new treatments to doctors and patients.
k page 42
200 + Projects in clinical development
Progress in key disease areas
We focus our R&D efforts on disease areas where there is still significant need for better treatment options and where we believe our skills may help bring new solutions.
k Oncology page 42k Cardiovascular page 46k Respiratory page 47k Immunology and
dermatology page 47k Neuroscience page 48k Eye care page 50k Biosimilars page 51k Infectious diseases page 51

Novartis Annual Report 2016 | 41InnovatIonDiscovery
Research and development remains the core of the Novartis strategy and a foundation of our future. We invested USD 9.0 billion on research and development for new drugs and medical devices in 2016, or 18.6% of net sales.
We also took significant steps aimed at further improving the effectiveness and efficiency of our research and development activities, which harness the talent of 23 000 scientists, physicians and business profession-als. We refreshed our research focus in response to a wave of scientific innovation that is opening new avenues to creating novel therapies. We formed a Global Drug Development (GDD) organization with representation on the Executive Committee of Novartis to gain economies of scale and facilitate optimum resource allocation to the most promising new drug candidates. And we moved to enhance collaboration between our research and development organizations in an effort to ensure that promising compounds coming out of the lab make it more quickly into clinical development, with large-scale testing in patients.
Our overall aim is to better leverage the scale of our organization to bring important new treatments to market faster and at a lower cost.
Our overall aim is to better leverage the scale of our organization to bring important new treatments to market faster and at a lower cost
To focus our resources, we completed a portfolio prior-itization exercise for projects in development, which led to the acceleration of certain projects and the termina-tion of others. For instance, we increased support for the development of a molecule in early-phase testing for fatty liver disease, a growing problem tied to the global obesity epidemic, as well as for a portfolio of biosimilars – biological medicines with comparable quality, safety and efficacy to existing products – that could improve access to important treatments. We’re concentrating on therapies we believe have the greatest potential to change the practice of medicine, with more than 200 projects in progress.
Discovery
The Novartis Institutes for BioMedical Research (NIBR) is the innovation engine of Novartis. In 2016, we updated our research strategy in an effort to ensure that we remain a discovery powerhouse. We are increasing col-laboration across traditional scientific and organizational boundaries, with a focus on powerful new technologies that have the potential to help produce therapeutic breakthroughs.
Researchers have used the standard tools of biology and chemistry to develop many successful treatments, and we’ll continue to employ them. But we recognize that these tools leave many drug targets – key proteins and nucleic acids known to play a role in disease – out of reach. We would like to hit these targets to fight disease, but they’ve dodged the conventional molecules in our arsenal. To address this challenge, we are blazing a new path: organizing our early discovery efforts around a scientific approach called chemical biology.
Chemical biology brings together experts from dif-ferent fields – including biology, chemistry and computer science – to create new types of molecules and use them to probe biological systems. Our teams are increasingly breaking down barriers between fields to make progress toward tackling difficult targets. For instance, one team includes biochemists, structural biologists and others, all working to invent molecules that could influence the cell’s own system for degrading proteins. The goal is to degrade particular proteins that we can’t approach with conventional molecules.
This approach to drug discovery requires research-ers to make connections across the company and beyond. We aim to strengthen ties to academic labs and biotechnology companies generating disruptive tools and technologies that may significantly accelerate our work.
To encourage collaboration, we’re recruiting a faculty of scholars, inviting some of the brightest minds in aca-demia to work in our labs. We’re making it easier for Novartis teams to share compounds with labs outside the company to help advance science more quickly. And we continue to form strategic alliances when appropriate. In 2016, for example, Novartis signed a deal with Xencor to access bispecific antibodies for immuno-oncology. These antibodies latch onto two targets instead of one to harness and direct the power of the immune system against cancer.
Our brand of chemical biology is directed at the dis-covery of potential therapies. When molecules are ready for testing in humans, we organize proof-of-concept studies enrolling small numbers of patients to make an early assessment of a drug’s safety and effectiveness.

42 | Novartis Annual Report 2016
trial results for BAF312 (siponimod) in secondary pro-gressive multiple sclerosis. We also look forward to reporting pivotal data on RLX030 (serelaxin), a potential treatment for heart failure, and on other key molecules, including biosimilars, in 2017.
Oncology
Although cancer death rates have decreased in some countries, the disease remains the world’s No. 2 killer. New cases are expected to rise as the global population grows and ages. In Europe, cancer recently passed car-diovascular disease as the No. 1 killer.
Novartis remains a leader in developing targeted therapies, which have improved the prognosis for cer-tain cancers. We currently have 17 such compounds – designed to exploit the genetic mutations of cancer cells – in confirmatory development. We’re also investing in a different approach: immunotherapy. A new wave of cancer treatments harnesses the immune system to fight the disease, and we’re growing a portfolio in this space, with 12 assets in clinical testing.
A new wave of cancer treatments harnesses the immune system to fight the disease, and we’re growing a portfolio in this space, with 12 assets in clinical testing
Existing immunotherapies work well in certain types of cancer. In an effort to help more patients, we’re explor-ing combinations of targeted therapies and immunothera-pies, drawing on our deep pipeline to accelerate this work. We’re concentrating on five tumor types: breast, lung, skin, blood and kidney. Beyond these tumor types, we are pursuing opportunities – including in rare diseases – as they arise. The goal is to find the right molecule, or combination of molecules, for each patient.
Breast cancerBreast cancer is the most common cancer in women and is responsible for more than 500 000 deaths world-wide per year. We have six compounds in development for the disease, with a focus on HR+ breast cancer. We’re testing these compounds in more than 25 combinations, which have the potential to prevent tumors from
Development
After a successful proof-of-concept study, our develop-ment team decides whether to begin larger clinical trials to test effectiveness and safety in additional patients. Development leaders attend key NIBR meetings so they’re familiar with projects headed their way, enabling them to act quickly. We pursue therapies where we can leverage the scale and expertise of Novartis develop-ment to bring important treatments to patients globally.
In 2016, we created a single GDD group to manage development for all of our therapeutic areas, advancing molecules ranging from checkpoint inhibitors for cancer to a peptide for heart failure to biosimilars for a variety of diseases. This work was previously conducted sepa-rately by several organizations within the company. By integrating our development organization, we aim to leverage our collective strength. We can now look at our entire mid-stage pipeline across our Innovative Medi-cines and Sandoz businesses to identify projects that hold the most promise and take steps to ensure they are properly resourced.
We are also rethinking how we execute clinical trials, seeking opportunities to improve and streamline our pro-cesses. We’re evaluating how we structure teams, design studies, select clinical sites, gather data and perform other tasks, sharing lessons learned across GDD. We’re also building world-class functions, including in clinical sciences, biostatistics and project management, by bringing together experts who were previously isolated in pockets of the company.
Digital technologies play a major role in our efforts. For example, they are helping us expand clinical trial access beyond patients who can easily visit conventional study sites. Through automated data capture and advanced analytics, we can perform certain procedures remotely, reducing the need for frequent in-person visits. Such technologies have the potential to make an import-ant contribution to improving the quality and efficiency of our clinical trial operations.
Our goal is to bring more innovative medicines to more patients more efficiently than any other drug development organization in the world. By assessing our operations and making adjustments, we can accelerate the delivery of innovation across our therapeutic areas.
In 2016, we saw significant progress in several areas, with important clinical trial readouts still on the horizon. Highlights include filing for regulatory approval for LEE011 (ribociclib) in hormone receptor-positive (HR+)/human epidermal growth factor receptor 2-negative (HER2-) advanced or metastatic breast cancer; gaining approval of the CyPass Micro-Stent, a minimally-invasive glaucoma surgery device; and achieving positive clinical
Innovationcontinued

Novartis Annual Report 2016 | 43InnovatIononcology
The FDA granted priority review for LEE011 (ribociclib) as first-line treatment of postmenopausal women with HR+/HER2- advanced or metastatic breast cancer in combination with letrozole
Phase III trials of the molecule are ongoing, including one evaluating LEE011 in combination with fulvestrant in men and postmenopausal women with HR+/HER2- advanced breast cancer, and another evaluating LEE011 in combination with endocrine therapy and goserelin in premenopausal women with HR+/HER2- advanced breast cancer.
Another molecule in late-phase development is BYL719 (alpelisib). It blocks the alpha version of a protein called phosphoinositide 3-kinase (PI3K), which is fre-quently mutated in HR+ breast cancer and is associated with resistance to endocrine therapy. New approaches are needed to prevent or delay resistance to existing agents. We are testing BYL719 in combination with fulvestrant in patients with HR+/HER2- advanced breast cancer in a Phase III trial.
becoming drug-resistant. While tumor cells can dodge a targeted therapy by acquiring new mutations, lab studies show that they struggle to evolve resistance when faced with more than one therapy at a time.
In November, we announced that the US Food and Drug Administration (FDA) granted priority review for LEE011 as first-line treatment of postmenopausal women with HR+/HER2- advanced or metastatic breast cancer in combination with letrozole. A priority review desig-nation requires the FDA to take action on an application within six months of its filing, compared to 10 months under standard review. We also announced in November that the European Medicines Agency has accepted the marketing authorization application for LEE011 plus letrozole for review in the same patient population.
LEE011 – which is taken orally, once per day – works by inhibiting cyclin-dependent kinase 4 and 6 (CDK4/6), proteins that can enable cancer cells to grow and divide too quickly when they’re over-activated. In a pivotal Phase III trial, LEE011 plus letrozole significantly extended progression-free survival over letrozole alone in postmenopausal women with HR+/HER2- advanced or metastatic breast cancer. The study evaluated the combination as a first-line treatment. Based primarily on the positive trial results, LEE011 plus letrozole was designated a breakthrough therapy by the FDA in August. According to the FDA, breakthrough therapy desig nation is intended to expedite the development and review of potential new medicines that treat seri-ous or life-threatening conditions.
Skin cancer survivor Malcolm Caddies, a groundskeeper at Suncorp Stadium in Brisbane, Australia, protects himself from the sun and encourages co-workers to do the same.

44 | Novartis Annual Report 2016
Finally, we presented data from early-phase trials for INC280 (capmatinib), an oral c-MET inhibitor that we licensed from Incyte Corporation. C-MET mutations can play a role in driving both the disease and drug resis-tance. INC280 demonstrated clinical activity as a single agent and in combination with Iressa® (gefitinib), Astra-Zeneca’s epidermal growth factor receptor (EGFR) inhibitor, in subsets of non-small cell lung cancer patients. It’s currently in Phase II trials.
MelanomaMetastatic melanoma is the most serious and life- threatening type of skin cancer and is associated with low survival rates. Following the 2015 approval of our Tafinlar + Mekinist combination for patients with a specific form of metastatic melanoma, we continue to study its effects in Phase III trials. In 2016, we reported that patients with BRAF V600 mutations who received the combination were significantly more likely to be alive at three years than patients who received Tafinlar alone.
We’re exploring additional combinations with the potential to improve outcomes for melanoma patients, based on detailed knowledge of the biology driving the disease. For instance, we’re testing Tafinlar + Mekinist in combination with Merck & Co.’s Keytruda® (pembroli-zumab) in patients with advanced melanoma in a Phase II study.
Blood cancerAcute myeloid leukemia (AML) has the lowest survival rate of all adult leukemias, with a treatment strategy that has remained unchanged for more than 25 years. In 2015, we reported the positive results of a Phase III study of PKC412 (midostaurin) in a form of AML, which enabled us to file in the US and EU. In AML patients with FLT3 mutations, which occur in one-third of patients, PKC412 significantly improved overall survival rates in newly diag-nosed adults when administered with standard induction and consolidation chemotherapy followed by mono-therapy for up to 12 months. PKC412 received FDA priority review for the treatment of this form of AML and advanced systemic mastocytosis, a rare disorder caused by the presence of too many mast cells (immune cells). The molecule was previously designated a breakthrough therapy by the FDA for this form of AML.
For some blood cancer patients, stem cell transplants offer the chance for a cure. Too often, however, the trans-planted stem cells recognize patient tissue as “foreign” and attack the tissue, resulting in a life-threatening complication known as graft-versus-host disease (GVHD). In 2016, ruxolitinib, a Janus kinase 1 and 2 (JAK1/2) inhibitor originally developed by Incyte Corpo-ration, was designated a breakthrough therapy by the
Lung cancerEach year, 1.8 million people are diagnosed with lung cancer, a leading cause of death in many countries. We are investigating potential therapies for non-small cell lung cancer, which accounts for approximately 85% of lung cancer cases. Although a particular mutation may be relatively rare in non-small cell lung tumors, it can still represent a significant therapeutic opportunity because there are so many patients with the disease.
In December, we submitted applications in the US and EU to market Zykadia (ceritinib) as a first-line treat-ment for anaplastic lymphoma kinase-positive (ALK+) non-small cell lung cancer, based on data from a Phase III clinical trial. In previously untreated patients, Zykadia, our ALK inhibitor, extended progression-free survival when compared with standard chemotherapy. Approxi-mately 2–7% of people with the disease have the ALK gene rearrangement. Zykadia is currently approved for use in patients whose disease has progressed after first-line therapy or who are intolerant to an existing therapy.
In addition to exploring the potential of Zykadia as a first-line treatment, we are investigating whether it can reduce brain metastases, a common and lethal compli-cation of non-small cell lung cancer.
In 2016, we also filed in the US and EU to market our Tafinlar (dabrafenib) + Mekinist (trametinib) combination as a first-line treatment in non-small cell lung cancer patients with a mutation in BRAF V600
In 2016, we also filed in the US and EU to market our Tafinlar (dabrafenib) + Mekinist (trametinib) combination as a first-line treatment in non-small cell lung cancer patients with a mutation in BRAF V600, which occurs in 1–2% of cases. A study demonstrated that our combina-tion slows tumor growth more than chemotherapy in patients with this aggressive form of the disease. Tafinlar and Mekinist are both targeted agents that block pro-teins – BRAF and MEK1/2, respectively – that are involved in cell growth and division.
Innovationcontinued
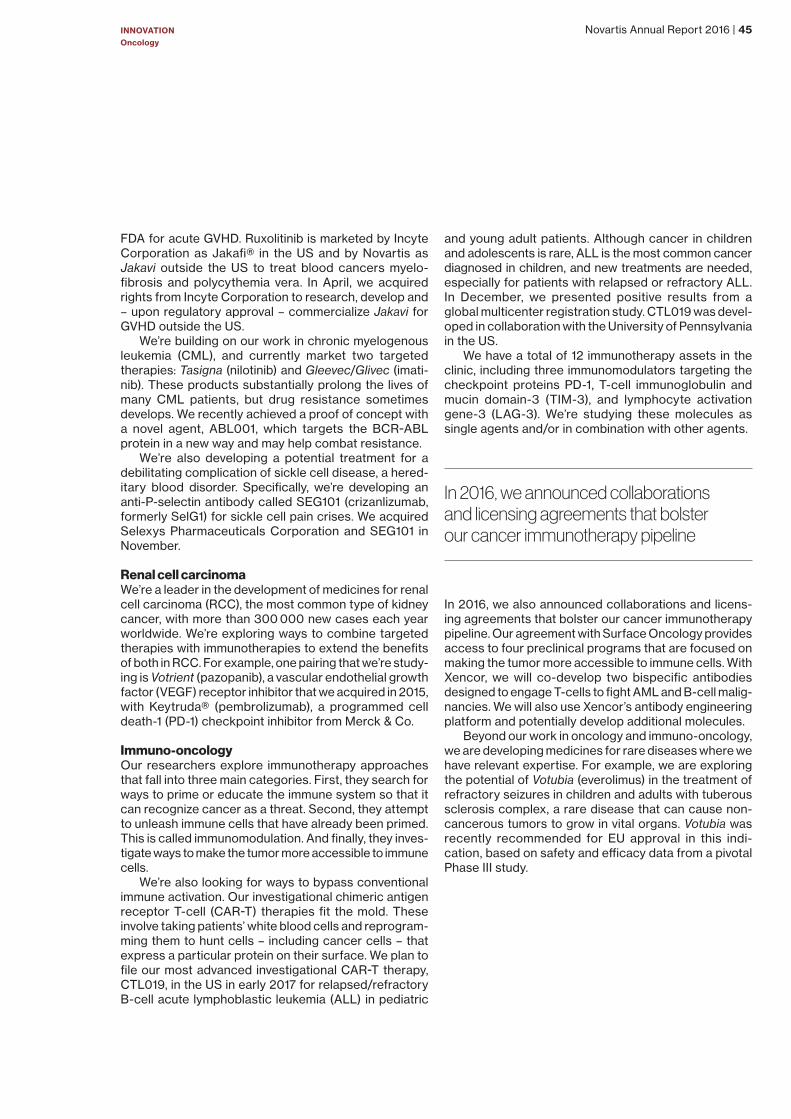
Novartis Annual Report 2016 | 45InnovatIononcology
and young adult patients. Although cancer in children and adolescents is rare, ALL is the most common cancer diagnosed in children, and new treatments are needed, especially for patients with relapsed or refractory ALL. In December, we presented positive results from a global multicenter registration study. CTL019 was devel-oped in collaboration with the University of Pennsyl vania in the US.
We have a total of 12 immunotherapy assets in the clinic, including three immunomodulators targeting the checkpoint proteins PD-1, T-cell immunoglobulin and mucin domain-3 (TIM-3), and lymphocyte activation gene-3 (LAG-3). We’re studying these molecules as single agents and/or in combination with other agents.
In 2016, we announced collaborations and licensing agreements that bolster our cancer immunotherapy pipeline
In 2016, we also announced collaborations and licens-ing agreements that bolster our cancer immunotherapy pipeline. Our agreement with Surface Oncology provides access to four preclinical programs that are focused on making the tumor more accessible to immune cells. With Xencor, we will co-develop two bispecific antibodies designed to engage T-cells to fight AML and B-cell malig-nancies. We will also use Xencor’s antibody engineering platform and potentially develop additional molecules.
Beyond our work in oncology and immuno-oncology, we are developing medicines for rare diseases where we have relevant expertise. For example, we are exploring the potential of Votubia (everolimus) in the treatment of refractory seizures in children and adults with tuberous sclerosis complex, a rare disease that can cause non- cancerous tumors to grow in vital organs. Votubia was recently recommended for EU approval in this indi-cation, based on safety and efficacy data from a pivotal Phase III study.
FDA for acute GVHD. Ruxolitinib is marketed by Incyte Corporation as Jakafi® in the US and by Novartis as Jakavi outside the US to treat blood cancers myelo-fibrosis and polycythemia vera. In April, we acquired rights from Incyte Corporation to research, develop and – upon regulatory approval – commercialize Jakavi for GVHD outside the US.
We’re building on our work in chronic myelogenous leukemia (CML), and currently market two targeted therapies: Tasigna (nilotinib) and Gleevec/Glivec (imati-nib). These products substantially prolong the lives of many CML patients, but drug resistance sometimes develops. We recently achieved a proof of concept with a novel agent, ABL001, which targets the BCR-ABL protein in a new way and may help combat resistance.
We’re also developing a potential treatment for a debilitating complication of sickle cell disease, a hered-itary blood disorder. Specifically, we’re developing an anti-P-selectin antibody called SEG101 (crizanlizumab, formerly SelG1) for sickle cell pain crises. We acquired Selexys Pharmaceuticals Corporation and SEG101 in November.
Renal cell carcinomaWe’re a leader in the development of medicines for renal cell carcinoma (RCC), the most common type of kidney cancer, with more than 300 000 new cases each year worldwide. We’re exploring ways to combine targeted therapies with immunotherapies to extend the benefits of both in RCC. For example, one pairing that we’re study-ing is Votrient (pazopanib), a vascular endothelial growth factor (VEGF) receptor inhibitor that we acquired in 2015, with Keytruda® (pembrolizumab), a programmed cell death-1 (PD-1) checkpoint inhibitor from Merck & Co.
Immuno-oncologyOur researchers explore immunotherapy approaches that fall into three main categories. First, they search for ways to prime or educate the immune system so that it can recognize cancer as a threat. Second, they attempt to unleash immune cells that have already been primed. This is called immunomodulation. And finally, they inves-tigate ways to make the tumor more accessible to immune cells.
We’re also looking for ways to bypass conventional immune activation. Our investigational chimeric antigen receptor T-cell (CAR-T) therapies fit the mold. These involve taking patients’ white blood cells and reprogram-ming them to hunt cells – including cancer cells – that express a particular protein on their surface. We plan to file our most advanced investigational CAR-T therapy, CTL019, in the US in early 2017 for relapsed/refractory B-cell acute lymphoblastic leukemia (ALL) in pediatric

46 | Novartis Annual Report 2016
RLX030 (serelaxin) is another compound that potentially holds promise in heart failure. RLX030 is a recombinant version of a human hormone that’s believed to help reduce stress on critical organs such as the heart and kidneys during pregnancy. Our Phase III RELAX-AHF-2 trial in patients hospitalized with acute heart failure is expected to report results in 2017. The trial is designed to determine if RLX030 reduces cardiovascular death and worsening of heart failure.
Our cardiovascular research isn’t limited to heart failure. After patients experience their first heart attack, they may be at increased risk of further cardiac problems due to vascular inflammation. We’re running a Phase III trial, called CANTOS, of ACZ885 (canakinumab) – a selective interleukin-1 beta inhibitor currently marketed for the treatment of auto-inflammatory diseases – in patients with a previous heart attack and a high degree of vascular inflammation. The study, expected to read out in 2017, is designed to determine if ACZ885 can reduce the risk of stroke, heart attack or death.
Major risk factors for cardiovascular disease include obesity, hypertension, diabetes and poor lipid profiles. We are exploring potential therapies to help patients reduce and control their cardiovascular risk. LIK066, designed to block key receptors (SGLT1 and SGLT2) in the kidney and intestine, achieved proof of concept in a small clinical trial of overweight and obese patients with and without blood sugar imbalances. Patients who received the compound showed improvement in multiple risk factors. For instance, they experienced significant weight loss and were better able to control their blood sugar. Phase II clinical studies are scheduled to begin in 2017.
Cardiovascular
Heart failure is a chronic condition that occurs when the heart is unable to pump enough blood to meet the needs of other organs in the body. It’s the leading cause of hos-pitalization for older adults, and it’s also a leading cause of death, with a mortality rate that is worse than many cancers. About 50% of patients with heart failure die within five years of diagnosis.
Following the 2015 approval of Entresto (sacubitril/valsartan) for patients with heart failure with reduced ejection fraction, we continue to explore its use for other indications. For example, we are testing the medicine in patients with heart failure with preserved ejection frac-tion, and in patients at high risk of heart failure after a heart attack.
Following the 2015 approval of Entresto for patients with heart failure with reduced ejection fraction, we continue to explore its use in other indications
Innovationcontinued
NIBR researcher Jennifer Allport-Anderson (left) speaks with a Novartis
colleague before running a half-marathon in Ipswich, Massachusetts in the US.

Novartis Annual Report 2016 | 47InnovatIonRespiratory
Immunology and dermatology
We continue to develop Cosentyx (secukinumab), an approved treatment for moderate-to-severe plaque psoriasis in adults. Psoriasis can significantly impact quality of life and even life expectancy. A recent global survey revealed that 84% of people with moderate-to- severe psoriasis suffer discrimination and humiliation.
In January 2016, our fully human monoclonal anti-body was approved by the FDA for use in adult patients with ankylosing spondylitis (AS) and psoriatic arthritis (PsA), conditions that can lead to irreversible joint and/or spinal bone damage. This follows approval by EU health authorities for AS and PsA in 2015. In June, we presented new scientific evidence in these indications, showing that up to 80% of AS patients and 84% of PsA patients treated with Cosentyx at two years had no radio-graphic progression in the spine or joints, respectively. In November, we reported that Cosentyx delivers sus-tained improvements in the signs and symptoms of PsA – including patient- reported pain – over three years. We’re also starting head-to-head studies in AS and PsA to determine if Cosentyx is more effective than another approved treatment for these diseases.
In December, we agreed to acquire Ziarco Group Ltd., a company focused on the development of novel treat-ments in dermatology. Ziarco’s lead investigational pro duct is ZPL389, a once-daily oral H4 receptor anta -gonist that recently showed promise in atopic dermatitis, also known as eczema. Eczema – a condition in which skin becomes inflamed, red and itchy – poses a signi-ficant burden on healthcare resources and patients’ quality of life.
Our interleukin-1 beta inhibitor Ilaris (canakinumab) was granted three simultaneous FDA approvals for the treatment of three rare and distinct periodic fever syndromes, expanding its use. These approvals were conducted under FDA priority review following break-through therapy designations received earlier in the year. Ilaris has been recommended for EU approval in the same new indications.
We are also exploring potential treatments for non-alcoholic steatohepatitis (NASH), which is an increas-ingly common disease due to the worldwide obesity epidemic. NASH is caused by the accumulation of fat in the liver. The fatty liver becomes inflamed and damaged, frequently resulting in scarring, or fibrosis. NASH is predicted to become the leading cause of liver trans-plantation by 2020. There are no approved therapies for the disease. We plan to test a farnesoid X receptor (FXR) agonist called LJN452 for NASH with liver fibrosis. The compound is now in a Phase II trial and recently re-ceived a fast track designation from the FDA. The pur-pose of fast track is to get important new drugs to the patient earlier.
Respiratory
Respiratory disease takes an immense toll on patients and society. More than 400 million people suffer from chronic obstructive pulmonary disease (COPD) or asthma, and the simple act of breathing can be a struggle for them. We are developing treatments that target both conditions.
Patients with COPD, a progressive disease caused mainly by smoking, experience symptoms ranging from coughing to chest tightness and difficulty breathing. In 2016, new data was published on QVA149, a combina-tion of two active substances that’s marketed as Ultibro Breezhaler. In a large clinical trial called FLAME, QVA149 helped patients manage their disease better than the standard treatment, Seretide® (fluticasone propionate/salmeterol xinafoate). Patients who received QVA149 reported fewer COPD exacerbations – attacks of breath-lessness and wheezing – than those who received Seretide®.
Asthma patients experience recurrent exacerbations that can be life-threatening. We are investigating the potential of QAW039 (fevipiprant) to reduce the fre-quency and duration of such attacks, particularly in patients with severe asthma. Our compound is designed to block the activity of T-helper type 2 (Th2) cells, which are thought to contribute to the disease by releasing signals that maintain eosinophilic airway inflammation. In a recent Phase II study, QAW039 reduced the num-ber of eosinophil cells in patients with persistent moderate-to-severe asthma. QAW039 is a small mole-cule taken as a pill, which is more convenient for patients than an inhaler or an injectable medication. Pivotal Phase III trials are underway in severe asthma.
QAW039 is a small molecule taken as a pill, which is more convenient for patients than an inhaler
In addition to focusing on COPD and asthma, we’re exploring treatments for respiratory illnesses such as cystic fibrosis (CF), a disease that’s well understood at a genetic level. Our scientists are targeting the CF trans-membrane conductance regulator (CFTR) protein that’s defective in patients, hoping to eventually improve and potentially extend their lives.

48 | Novartis Annual Report 2016
In a Phase III trial, BAF312 (siponimod) reduced the risk of disability progression in patients with secondary progressive multiple sclerosis
We also started two Phase III trials to test ofatumumab, a human monoclonal antibody targeting the CD20 protein on B-cells, in patients with relapsing MS. B-cell therapies have the potential to play an important role in treating the disease. Ofatumumab can be administered by subcutaneous injection.
Novartis is collaborating with Microsoft Research and university hospitals to develop a device called Assess MS that will enable physicians to quantitatively assess motor function in MS patients. The device records patient movement in three dimensions and employs machine learning for data analysis. If the prototype proves suc-cessful, the new tool is expected to streamline clinical trials in MS, support clinical neurologists in monitoring their patients, and bring expert assessments to currently underserved areas.
MigraineMore than 10% of the population worldwide suffers from migraine headaches, which have a profound impact on the ability to carry out everyday tasks. Severe head pain – which is often accompanied by nausea and sensitivity to light, sound and odors – makes it difficult for people to function.
AMG 334 (erenumab) is a fully human monoclonal antibody designed to block the calcitonin gene-related peptide (CGRP) receptor, which is believed to play a critical role in mediating the incapacitating pain of migraine. We are exploring its potential in collaboration with Amgen. In 2016, we announced positive results for a Phase II study of AMG 334 in chronic migraine pre-vention and for two Phase III studies of AMG 334 in episodic migraine prevention. In these studies, patients who received AMG 334 experienced fewer monthly migraine days than patients who received placebo. The safety profile of the molecule was comparable to pla-cebo in the trials.
In addition to developing AMG 334, Novartis is collaborating with Amgen to explore the therapeutic potential of a second monoclonal antibody called AMG 301. For both molecules, Novartis will have global co- development rights and commercial rights outside the US, Canada and Japan.
We also signed an exclusive option, collaboration and license agreement with Conatus Pharmaceuticals Inc. to jointly develop emricasan – an investigational, oral pan-caspase inhibitor – for the treatment of NASH with advanced fibrosis and cirrhosis. Regulatory approval is required to exercise the option.
Neuroscience
Brain disorders affect hundreds of millions of people worldwide and represent a major threat to public health. We’re discovering and developing therapies for a variety of mental and neurological diseases.
We’re also working to overcome obstacles to inno-vation in neuroscience. It’s always been difficult, for example, to access brain tissue from patients, so we’re investing in stem cell technology to convert patients’ skin cells – which are easy to harvest – into neurons. Our scientists are coaxing these neurons to self-organize and form structures that resemble those found in a human brain, providing a powerful tool for research.
Multiple sclerosisApproximately 2.3 million people worldwide are affected by multiple sclerosis (MS). In this disease, the patient’s immune system attacks the protective coating of nerve fibers, interfering with the transmission of electrical signals and causing symptoms ranging from fatigue to difficulty walking to memory issues. We are testing Gilenya (fingolimod) – a sphingosine 1-phosphate (S1P) receptor modulator approved for use in relapsing MS – in an important indication: pediatric MS. We are also test-ing other new experimental therapies, including one focused on patients with progressive forms of the disease for which there are limited treatment options.
In 2016, a Phase III study showed that BAF312 (siponimod) reduces the risk of disability progression in patients with secondary progressive multiple sclerosis (SPMS), a condition with few available treatments. The study, called EXPAND, included 1 651 people from 31 countries, and represents the largest randomized, controlled study of SPMS to date. BAF312 is a second- generation selective S1P1/5 receptor modulator.
Innovationcontinued

Novartis Annual Report 2016 | 49InnovatIonneuroscience
Alzheimer’s diseaseThere are approximately 47 million people worldwide with dementia, and Alzheimer’s disease is the most com-mon cause. We are collaborating on compounds designed to interfere with the amyloid cascade, a biological pro-cess that researchers believe may be responsible for the development of Alzheimer’s disease. Two experimental treatments, CNP520 and CAD106, are being adminis-tered in a trial to cognitively healthy adults who have a genetic risk of developing Alzheimer’s disease. CNP520 is an oral therapy being developed in collaboration with Amgen. CAD106 is an immunotherapy. We are working with the Banner Alzheimer’s Institute in the US, leader of the Alzheimer’s Prevention Initiative, to identify trial participants – through an innovative genetic screening program – and test the molecules.
Novartis is preparing to start two Phase II studies to assess the potential of EMA401 – a novel angiotensin II type 2 receptor (AT2R) antagonist – in peripheral neuropathic pain
Neuropathic painWhen nerve fibers are damaged, they can send incor-rect signals to the brain, producing a complex chronic pain state. Although the underlying cause of the nerve fiber damage varies among patients, the result is often the same: pain that makes it difficult to function and lead a normal life. Such neuropathic pain affects up to 7–8% of the adult population, and 40% of patients do not respond to existing treatments.
Novartis is preparing to start two Phase II studies to assess the potential of EMA401 – a novel angiotensin II type 2 receptor (AT2R) antagonist – in peripheral neu-ropathic pain. In the first study, EMA401 will be tested in patients with nerve damage caused by diabetes (diabetic neuropathy). In the second, the agent will be tested in patients with chronic nerve damage caused by shingles. EMA401 acts outside the blood brain barrier, so patients may avoid significant central nervous system side effects.
Antonina Hernández (left), who suffers from Alzheimer’s disease, shares a two-bed-room apartment in Madrid, Spain, with her son Juan Pedro García Hernández, a fitness trainer who is also her full-time caregiver.

50 | Novartis Annual Report 2016
in July, is part of a new class of treatments known as minimally-invasive glaucoma surgery. It is intended for adult patients with mild to moderate open-angle glau-coma who are also receiving cataract surgery. Implanted just below the surface of the eye, the CyPass Micro-Stent is designed to lower intraocular pressure by enhancing the natural drainage pathways of the eye.
For vitreoretinal surgeons, viewing the delicate struc-tures and tissue layers at the back of the eye is critical. To improve visualization during surgery, Alcon introduced the NGENUITY 3D Visualization System. It includes a high dynamic range camera that provides excellent res-olution, image depth, clarity and color contrast, with real-time images displayed on a 55 inch (140 cm) 3D monitor placed in the operating room. The NGENUITY 3D Visualization System also enables surgeons to oper-ate without having to bend or hunch over a traditional microscope, which may help minimize the back and neck issues that are common among ophthalmologists who have been operating for more than a decade.
Our CyPass Micro-Stent, approved by the FDA in July, is part of a new class of treatments known as minimally-invasive glaucoma surgery
Eye care
Approximately 285 million people around the world live with low vision and blindness. Many more rely on correc-tive lenses. Our broad eye care portfolio includes phar-maceuticals, surgical devices and platforms, intraocular lenses, contact lenses and lens care solutions that enhance quality of life by helping people see better.
Ophthalmic pharmaceuticalsRetinal diseases are the primary cause of blindness in industrialized countries and are growing more common in developing countries. Novartis has compounds in development for retinal diseases, with a focus on a form of age-related macular degeneration (AMD).
Patients with AMD lose vision as the center of the ret-ina, or macula, degenerates. In the wet form of the disease, abnormal blood vessels grow under the retina and leak, forming lesions. Our novel anti-VEGF agent RTH258 (brolucizumab) is being tested in wet AMD patients. RTH258 is a single chain antibody fragment that may be longer acting than approved treatments for AMD, poten-tially enabling patients to go longer between treatments. We expect to report the results of two Phase III trials in 2017.
We continue to develop Lucentis (ranibizumab), an anti-VEGF agent that was originally approved for wet AMD. In 2016, we received EU approval for the drug in a new indication. It can now be used to treat visual impair-ment due to choroidal neovascularization associated with causes other than wet AMD or secondary patho-logic myopia. Lucentis is the only treatment available for a wide range of conditions that share a common feature: the growth of abnormal blood vessels under the retina. Genentech has commercial rights to Lucentis in the US, and Novartis has exclusive rights in the rest of the world.
In addition to addressing retinal diseases, we recently entered a new therapy area. In December, we announced an agreement for the acquisition of Encore Vision Inc. and UNR844, a potential treatment for presbyopia, the age-related loss of near-distance vision. More than 80% of adults over the age of 45 develop presbyopia. Admin-istered as eye drops, UNR844 – a combination of lipoic acid and choline – recently showed promise in a proof-of-concept study.
We’re also exploring potential new therapies for glau-coma, dry eye and other ocular conditions.
SurgicalIn 2016, our eye care division, Alcon, launched new sur-gical technologies for the treatment of glaucoma and other diseases. Glaucoma – a leading cause of irrevers-ible blindness globally – is characterized by optic nerve damage, which is associated with elevated intraocular pressure. Our CyPass Micro-Stent, approved by the FDA
Innovationcontinued
Yuko Yoshikawa, who suffers from an eye disease that affects her vision, takes care while navigating the streets of Tokyo, Japan.

Novartis Annual Report 2016 | 51InnovatIonBiosimilars
Vision careAlcon develops and markets a variety of contact lenses designed for daily, weekly and monthly wear. In 2016, we launched Dailies Total1 Multifocal, the first water- gradient, daily disposable contact lenses for people with presbyopia, which typically develops as people age. In presbyopia, the eye loses its ability to focus up close, resulting in the need for bifocals or reading glasses. Dailies Total1 Multifocal lenses are designed to address both presbyopia and the end-of-day dryness and dis-comfort that many contact lens wearers experience after age 40.
We also launched Air Optix plus HydraGlyde for pa-tients in the monthly replacement contact lens segment. These silicone hydrogel contact lenses feature technol-ogy that surrounds the lens with a layer of moisture to help improve comfort for users.
Biosimilars
Sandoz is the pioneer and global leader in biosimilars, which are biological medicines with comparable quality, safety and efficacy to approved reference products. Patents are due to expire on a number of important biological medicines in the next few years, creating a singular opportunity for us to further expand access to these high-quality, life-enhancing treatments. Bio similars can generate significant savings for healthcare systems, freeing up resources for novel therapies. We plan to launch five major biosimilars in oncology and immunol-ogy in the EU and US by 2020, adding to the three Sandoz biosimilars already on the market worldwide.
Our biosimilar Erelzi (etanercept-szzs) was approved in the US to treat multiple inflammatory diseases
In 2016, our biosimilar Erelzi (etanercept-szzs) was approved in the US to treat multiple inflammatory diseases, all of the indications for which the reference product Enbrel® was approved. In addition, our biosimilar Binocrit (epoetin alfa) was approved in the EU for a new route of admin-istration based on data from a study in pre-dialysis and dialysis patients with anemia associated with chronic kidney disease. Filings were accepted for our pegfilgras-tim and rituximab molecules in the EU. We plan to build on this momentum in 2017 with additional biosimilar filings in key geographies.
Infectious diseases
Bacteria, viruses and other micro-organisms continue to wreak havoc on human health, despite major medical advances. Infectious diseases remain the leading cause of death in children and adolescents, and one of the lead-ing causes of death in adults. We’re working across the spectrum of these diseases.
We’re researching potential therapies for tropical diseases that can be devastating. Malaria alone kills approximately 430 000 people each year, most of them children. Patients often fail to complete a full course of treatment, and drug-resistant parasites are spreading in certain regions, so new drugs are needed. We have two compounds in Phase II development for the disease: KAF156 and KAE609.
In September, the results of a proof-of-concept study for KAF156 were published. Malaria parasites, including parasites resistant to the standard treatment, were observed to disappear rapidly from the blood of patients who received either multiple or single doses of the compound in an exploratory Phase II clinical trial. We will lead the development of KAF156 with scientific and financial support from the Medicines for Malaria Venture (in collaboration with the Bill & Melinda Gates Founda-tion). We are exploring ways to combine it with another agent in an effort to achieve a new treatment option for malaria, activity against drug-resistant parasites, and potentially a single-dose malaria cure. KAE609 contin-ues to be characterized for the role that it may play in the battle against the disease.
We also reported a new target for three neglected diseases: African sleeping sickness, leishmaniasis and Chagas disease. Clinically, these diseases – responsible for 50 000 deaths annually – seem quite distinct, but they’re all caused by parasites called kinetoplastids that belong to the same class of single-celled organisms. Working in lab models, our researchers demonstrated that it may be possible to treat all three diseases with a single class of compound that blocks cellular machinery known as the proteasome.
Drug-resistant bacteria are an emerging threat to public health. In 2016, we began a first-in-human clinical trial to test an injectable compound designed to kill drug-resistant gram-negative bacteria.

52 | Novartis Annual Report 2016
Major development projects Project/product Common name Mechanism of action
Oncology
ABL001 asciminib BCR-ABL inhibitor
PIM447 – Pan-PIM inhibitor
CTL019 tisagenlecleucel-T CD19-targeted chimeric antigen receptor T-cell immunotherapy
INC280 capmatinib c-MET inhibitor
BYL719 alpelisib PI3Kα inhibitor
Jakavi ruxolitinib JAK1/2 inhibitor
LCI699 osilodrostat Aldosterone synthase inhibitor
Promacta/Revolade eltrombopag Thrombopoietin receptor agonist
SEG101 crizanlizumab P-selectin inhibitor
Arzerra ofatumumab Anti-CD20 monoclonal antibody
LEE011 ribociclib CDK4/6 inhibitor
PKC412 midostaurin Signal transduction inhibitor
Signifor LAR pasireotide Somatostatin analogue
Tafinlar + Mekinist dabrafenib + trametinib BRAF inhibitor + MEK inhibitor
Zykadia ceritinib ALK inhibitor
Afinitor/Votubia everolimus mTOR inhibitor
Tasigna nilotinib BCR-ABL inhibitor
1 Filings that have received approval in either the US or EU but are awaiting approval in the other market2 Phase and planned filing dates refer to the lead indication in development.3 Non-steroidal aromatase inhibitor4 Submission pending acceptance by the FDA
novartis is consistently rated as having one of the industry’s most respected develop-ment pipelines, with more than 200 projects in clinical development, as of December 31, 2016.
Many of these projects, which include new molecular entities as well as additional indica-tions and different formulations for marketed products, are for potentially best-in-class or first-in-class medicines that could significantly advance treatment standards for patients world wide. This table provides an overview of selected projects in confirmatory development.
We use the traditional pipeline model as a platform (e.g., Phase I-III). However, we have tailored the process to be simpler, more flexi-ble and more efficient.
Glossary
Project/product Project refers to the Novartis reference code (combination of three letters and three numbers) used for projects in devel-opment. Product refers to the brand name for a marketed product.
Common name Official international non- proprietary name or generic name for an indi-vidual molecular entity as designated by the World Health Organization
Glossary continued on page 54
Pipeline

Novartis Annual Report 2016 | 53InnovatIonPipeline
Route of Planned Potential indication/disease area administration filing dates 1,2 PHaSE l PHaSE ll PHaSE lll SUBMISSIon
Chronic myeloid leukemia (CML), 3rd line Oral 2020 PHASE l
Hematologic tumors Oral ≥2021 PHASE l
Pediatric acute lymphoblastic leukemia [lead indication]; Intravenous infusion 2017 PHASE ll diffuse large B-cell lymphoma
Non-small cell lung cancer (NSCLC) [lead indication]; NSCLC (EGFRm) Oral 2018 PHASE ll
Hormone receptor-positive (HR+)/human epidermal growth Oral 2019 PHASE lll factor receptor 2-negative (HER2-) advanced breast cancer (postmenopausal women), 2nd line (+ fulvestrant)
Graft-versus-host disease [lead indication]; early myelofibrosis Oral 2019 PHASE lll
Cushing’s disease Oral 2018 PHASE lll
Severe aplastic anemia, 1st line Oral 2017 PHASE lll
Sickle cell disease Intravenous infusion 2020 PHASE lll
Refractory non-Hodgkin’s lymphoma Oral 2018 PHASE lll
HR+/HER2- advanced breast cancer (postmenopausal women), Oral US/EU registration SUBMISSION1st line (+ letrozole) [lead indication]; HR+/HER2- advanced breast cancer (postmenopausal women), 1st/2nd line (+ fulvestrant); HR+/HER2- advanced breast cancer (premenopausal women), 1st line (+ tamoxifen + goserelin or NSAI3 + goserelin); HR+/HER2- breast cancer (adjuvant)
Acute myeloid leukemia (AML) [lead indication]; Oral US/EU registration SUBMISSIONadvanced systemic mastocytosis; AML (FLT3 wild type)
Cushing’s disease Long-acting release/ US/EU registration4 SUBMISSION intramuscular injection
BRAF V600+ NSCLC [lead indication]; Oral US/EU registration SUBMISSIONBRAF V600+ melanoma (adjuvant); BRAF V600+ colorectal cancer
ALK+ advanced NSCLC (1st line, treatment naïve) Oral US/EU registration SUBMISSION[lead indication]; ALK+ NSCLC (brain metastases)
Tuberous sclerosis complex seizures Oral EU registration SUBMISSION US 2017
CML treatment-free remission Oral EU registration SUBMISSION US 2017

54 | Novartis Annual Report 2016
Major development projects Project/product Common name Mechanism of action
Cardiovascular and metabolism
LIK066 – SGLT1/2 inhibitor
ACZ885 canakinumab Anti-interleukin-1ß monoclonal antibody
Entresto valsartan, sacubitril Angiotensin receptor/neprilysin inhibitor (as sodium salt complex)
RLX030 serelaxin Recombinant form of human relaxin-2 hormone
Respiratory
QBW251 – CFTR potentiator
QMF149 indacaterol, mometasone Long-acting beta2-agonist and furoate (in fixed-dose inhaled corticosteroid combination)
QAW039 fevipiprant CRTH2 antagonist
QVM149 indacaterol, mometasone Long-acting beta2-agonist, furoate, glycopyrronium long-acting muscarinic antagonist bromide (in fixed-dose and inhaled corticosteroid combination)
Immunology and dermatology
CJM112 – Anti-interleukin-17 monoclonal antibody
QAW039 fevipiprant CRTH2 antagonist
LJN452 – FXR agonist
VAY736 – Anti-BAFF (B-cell-activating factor) monoclonal antibody
QGE031 ligelizumab High-affinity anti-IgE monoclonal antibody
Cosentyx secukinumab Anti-interleukin-17 monoclonal antibody
Ilaris canakinumab Anti-interleukin-1ß monoclonal antibody
Neuroscience
CAD106 amilomotide Beta-amyloid-protein therapy
CNP520 – BACE inhibitor
EMA401 – Angiotensin ll receptor antagonist
BYM338 bimagrumab Inhibitor of activin type II receptor
BAF312 siponimod Sphingosine-1-phosphate receptor modulator
FTY720 fingolimod Sphingosine-1-phosphate receptor modulator
AMG 334 erenumab Selective CGRP receptor antagonist
OMB157 ofatumumab Anti-CD20 monoclonal antibody
1 Filings that have received approval in either the US or EU but are awaiting approval in the other market2 Phase and planned filing dates refer to the lead indication in development.5 Ongoing discussions with health authorities to agree on next steps
Mechanism of action Specific biochemical interaction with a molecular target such as a receptor or enzyme, through which a drug sub-stance produces its pharmacological effect
Potential indication/indications Disease or condition for which a compound or marketed product is in development and is being studied as a potential therapy
Route of administration Path by which a me di- ci nal preparation is administered into the body, such as oral, subcutaneous or intravenous
Phase I First clinical trials of a new compound, generally performed in a small number of healthy human volunteers, to assess the clinical safety and tolerability, as well as metabolic and phar-macologic properties of the compound
Phase II Clinical studies with patients who have the target disease, with the aim of continuing the Phase I safety assessment in a larger group, assessing the efficacy of the drug in the patient population, and determining the appropriate doses for further evaluation
Phase III Large-scale clinical studies with several hundred to several thousand patients, which are conducted to establish the safety and efficacy of the drug in specific indications for regulatory approval. Phase III trials also may be used to compare a new drug against a cur-rent standard of care to evaluate the overall benefit-risk relationship of the new medicine.
Glossary continued on page 56
Pipelinecontinued

Novartis Annual Report 2016 | 55InnovatIonPipeline
Route of Planned Potential indication/disease area administration filing dates 1,2 PHaSE l PHaSE ll PHaSE lll SUBMISSIon
Weight loss Oral ≥2021 PHASE ll
Secondary prevention of cardiovascular events Subcutaneous injection 2017 PHASE lll
Chronic heart failure with preserved ejection fraction Oral 2019 PHASE lll [lead indication]; post-acute myocardial infarction
Acute heart failure Intravenous infusion 2017 PHASE lll
Cystic fibrosis Oral ≥2021 PHASE ll
Asthma Inhalation 2019 PHASE lll
Asthma Oral 2019 PHASE lll
Asthma Inhalation 2019 PHASE lll
Immune disorders Subcutaneous injection ≥2021 PHASE ll
Atopic dermatitis Oral ≥2021 PHASE ll
Non-alcoholic steatohepatitis Oral ≥2021 PHASE ll
Primary Sjoegren’s syndrome Subcutaneous injection ≥2021 PHASE ll
Chronic spontaneous urticaria; Subcutaneous injection 2020 PHASE ll chronic idiopathic urticaria
Non-radiographic axial spondyloarthritis [lead indication]; Subcutaneous injection 2018 PHASE llI psoriatic arthritis head-to-head study versus adalimumab; ankylosing spondylitis head-to-head study versus adalimumab
Periodic fever syndromes Subcutaneous injection US approved SUBMISSION EU registration
Alzheimer’s disease Intramuscular injection ≥2021 PHASE ll
Alzheimer’s disease Oral ≥2021 PHASE ll
Neuropathic pain Oral ≥2021 PHASE ll
Hip fracture; sarcopenia Intravenous infusion ≥2021 PHASE ll
Secondary progressive multiple sclerosis Oral 20195 PHASE lll
Pediatric multiple sclerosis Oral 2017 PHASE lll
Migraine Subcutaneous injection 2017 PHASE lll
Relapsing multiple sclerosis Subcutaneous injection 2019 PHASE lll

56 | Novartis Annual Report 2016
Pipeline
Major development projects Project/product Common name Mechanism of action
Infectious diseases
KAF156 – Imidazolopiperazines derivative
KAE609 cipargamin PfATP4 inhibitor
LAM320 clofazimine Mycobacterial DNA binding
Ophthalmology
RTH258 brolucizumab Anti-vascular endothelial growth factor (VEGF) single-chain antibody fragment
Lucentis ranibizumab Anti-VEGF monoclonal antibody fragment
Clareon Monofocal IOL – N/A
CyPass Micro-Stent – N/A
A02238 – N/A
A00717 – N/A
A01660 – N/A
AcrySof IQ PanOptix IOL – N/A
AcrySof IQ PanOptix – N/A Toric IOL
AcrySof IQ ReSTOR – N/A Toric 2.5 D IOL
Biosimilars
GP1111 infliximab TNF-α inhibitor
GP2017 adalimumab TNF-α inhibitor
HX575 epoetin alfa Erythropoiesis-stimulating agent
GP2013 rituximab Anti-CD20 monoclonal antibody
GP2015 etanercept TNF-α inhibitor
LA-EP2006 pegfilgrastim Pegylated granulocyte colony-stimulating factor
1 Filings that have received approval in either the US or EU but are awaiting approval in the other market2 Phase and planned filing dates refer to the lead indication in development.6 Resubmission to address FDA complete response letter
advanced development Medical device pro-ject for which a positive proof of concept has been established, and clinical and non-clinical studies are being conducted to establish the device’s safety, efficacy or performance. This is needed to address regulatory requirements for obtaining marketing authorization.
Submission Application for marketing appr o-val has already been submitted to one or both of the following regulatory agencies: the US Food and Drug Administration (FDA), the European Medicines Agency (EMA). Novartis has not yet received marketing authorization from both regulatory agencies. The application contains comprehensive data and information gathered during human clinical trials and ani-mal studies conducted through the various phases of drug development.
continued

Novartis Annual Report 2016 | 57InnovatIonPipeline
Route of Planned Potential indication/disease area administration filing dates 1,2 PHaSE l PHaSE ll PHaSE lll SUBMISSIon
Malaria Oral ≥2021 PHASE ll
Malaria Oral ≥2021 PHASE ll
Multi-drug resistant tuberculosis Oral 2018 PHASE lll
Neovascular age-related macular degeneration [lead indication]; Intravitreal injection 2018 PHASE lll diabetic macular edema
Retinopathy of prematurity Intravitreal injection 2018 PHASE lll
Next-generation IOL Cataract implant EU 2017 ADVANCED DEVELOPMENT US 2019
Micro-invasive glaucoma surgical device for implant during Glaucoma implant EU 2017 ADVANCED DEVELOPMENT cataract surgery
Mid-tier phacoemulsification device Cataract equipment US 2018 ADVANCED DEVELOPMENT EU 2018
Daily disposable line extension Vision care US 2018 ADVANCED DEVELOPMENT EU 2018
New daily disposable lens Vision care US 2018 ADVANCED DEVELOPMENT EU 2018
Trifocal IOL Cataract implant US 2019 ADVANCED DEVELOPMENT
Trifocal IOL for astigmatism Cataract implant US 2019 ADVANCED DEVELOPMENT
Multifocal IOL for astigmatism Cataract implant US SUBMISSION
Inflammatory bowel disease; rheumatoid arthritis; plaque psoriasis Intravenous EU 2017 PHASE III (same as originator)
Arthritides (rheumatoid arthritis, ankylosing spondylitis, psoriatic Subcutaneous 2017 PHASE lll arthritis); plaque psoriasis and others (same as originator)
Anemia in chronic kidney disease; chemotherapy-induced anemia Subcutaneous US 2017 PHASE lll and others (same as originator) and intravenous
Non-Hodgkin’s lymphoma; chronic lymphocytic leukemia; Intravenous EU registration SUBMISSIONrheumatoid arthritis; granulomatosis with polyangiitis; US 2017 microscopic polyangiitis (same as originator)
Arthritides (rheumatoid arthritis, ankylosing spondylitis, psoriatic Subcutaneous US approved SUBMISSIONarthritis); plaque psoriasis and others (same as originator) EU registration
Chemotherapy-induced neutropenia and others Subcutaneous EU registration SUBMISSION(same as originator) US 20186

58 | Novartis Annual Report 2016
Helping Syrian refugees manage chronic diseasesAmong the many Syrians uprooted by armed conflict are thousands of people with chronic conditions – such as diabetes and heart disease – whose treatment was disrupted when they fled.
Many have settled in Lebanon, where chronic diseases already place a major burden on the healthcare system, accounting for an estimated 85% of deaths. Now health facilities have been further stretched by the influx of people fleeing Syria, who have swelled the population by a third.
To help tackle this problem, Novartis last year began working with the International Committee of the Red Cross (ICRC) to support improved access to medicines and medical care for refugees in Lebanon.
The company is supplying medications for high blood pressure and diabetes through Novartis Access, an innovative business approach that offers medicines for chronic diseases to governments and public-sector customers in lower-income countries at a cost of USD 1 per treatment per month.
The situation in Lebanon is just one example of the growing challenges posed by chronic illnesses as populations age. These conditions account for 38 million deaths worldwide every year – 75% of them in
PHOTO ESSAY
1
2

Novartis Annual Report 2016 | 59PHOTO ESSAY
1 Syrian refugees ponder an uncertain future: Zakiya, one of the daughters of Hamid, with her son Waleed, age 10, in their makeshift home.
2 ICRC health workers visit the home of a refugee named Ziad in southern Lebanon.
3 ICRC patient Elham (center) with some of her children and their families after fleeing from Syria
4 Mohammad peers into a building used as a mosque by Syrian refugees.
low- and middle-income countries. Chronic diseases require early detection and sustained treatment, so migrant populations are particularly at risk.
Take 58-year-old Hamid and his wife Hamida, who farmed near the Syrian city of Homs until they were driven out by fierce fighting in 2012.
They now live in Lebanon with two daughters and two grandsons, who rely on casual work to pay for food and lodging. Health inevitably suffers in this hand-to-mouth existence, and Hamid, who has lived with diabetes for 20 years, found himself unable to pay for drugs that were free in Syria.
After six weeks without insulin, he lost so much weight that he was forced to seek help, and the local ICRC-supported clinic provided a lifeline by supplying drugs and regular checkups. His wife also received treatment after she was diagnosed with diabetes.
They were among more than 270 000 people who sought treatment at ICRC-supported healthcare facilities in 2016. The organization aims to provide diagnosis, treatment and follow-up for Syrian and underserved Palestinian refugees as well as Lebanese patients affected by chronic illnesses, to prevent long-term complications such as stroke or kidney disease.
The most deadly chronic condition worldwide is heart disease. The ICRC provides vital care for refugees such as Ziad, who suffers from high blood pressure and fled with his wife and children in 2014 when the Damascus suburb where they lived was badly damaged.
He now struggles to make a living as a laborer, and believes the trauma caused by the devastation of his homeland has worsened problems. “Sometimes it hurts me like a disease, seeing the news on television about Syria,” he says.
Gaining access to care is critical for survival for some refugees. Elham, the widowed matriarch of a large extended family, has both heart disease and diabetes – as do her brother and their cousin, Mohammad, who is an imam.
Elham’s open heart surgery was funded by the Office of the United Nations High Commissioner for Refugees, while Mohammad has also undergone a series of operations. All three family members rely on continued treatment provided by the ICRC.
While aid is vital, clearly peace and stability are key to a long-term solution to the difficulties faced by many refugees.
4
3

60 | Novartis Annual Report 2016
We focus our corporate responsibility work in two key areas: expanding access to healthcare and doing business responsibly. This combination of responsible business and making our medicines accessible is directly linked to our company mission, vision and strategy. We put access to healthcare at the heart of our business strategy, looking for new ways to deliver medicines to as many people as possible.
Corporate responsibility
52 m Patients reached through access programs
120 Pilots ongoing or completed to find new and improved ways to engage with healthcare professionals
120 000 The number of Novartis Access treatments delivered to Kenya, Lebanon and Ethiopia since launch, each providing a one-month supply of medicine
9 800 Doctors and other participants globally received access to webcasts of industry meetings in 2016, part of our efforts to do business differently
2/4 Novartis leads two of the four most advanced malaria development programs underway worldwide: KAF156 and KAE609
10 000 tns Net reduction in CO
2 emissions
Expanding access
Doing business responsibly

Novartis Annual Report 2016 | 61Corporate responsibilityCorporate responsibility strategy and governance
Corporate responsibility strategy and governance
We use our expertise and skills in two key areas, which are the focus of our corporate responsibility (CR) efforts: expanding access to healthcare and doing business responsibly. This combination of responsible business and making medicines accessible is an important element supporting our company mission, vision and strategy.
To help us achieve our goal of finding new ways to deliver breakthrough treatments to as many people as possible, our access efforts include an array of approaches such as innovative business models, equitable commer-cial models, zero-profit initiatives, patient assistance programs and strategic philanthropy.
Moreover, to help us become a trusted leader in changing the practice of medicine, we are taking steps to ensure our standards align with society’s increasingly high expectations for ethical behavior.
Corporate responsibility is embedded throughout our company. The Head of Corporate Responsibility reports directly to the CEO of Novartis, and our CR efforts are overseen by the Governance, Nomination and Corporate Responsibilities Committee of the Novartis Board of Directors. This commitment from senior management and the Board helps us make the strategic decisions nec-essary to successfully integrate CR into our business. The engagement and dedication of all our associates are essential to bring CR initiatives to life.
Taking action on what matters most
Our activities and how we carry them out have an impact beyond our business performance. In late 2016, we kicked off our second full CR materiality assessment to help us understand the CR issues that matter to key inter-nal and external stakeholders, as well as stakeholders’ needs and expectations. We began conducting inter-views – aiming to reach approximately 400 individuals worldwide – including executives across our company; customers; academics; and representatives of patient organizations, nongovernmental organizations, health institutions, and other groups considered important to the industry and our business.
We will use the findings, which will be available in 2017, to guide our strategy, track issues of concern, inform and prioritize our CR programs, establish meaningful metrics against which to measure our CR performance, and fur-ther integrate CR into our standard business processes. This assessment follows the first CR materiality analysis from 2013, which was refreshed in 2015.
In late 2016, we kicked off our second full CR materiality assessment to help us further integrate CR topics that matter into our standard business processes
Mountaha and her 4-year-old daughter Mona are among thousands of displaced people who have settled in Lebanon, where Novartis is working with the Red Cross to support treatment for chronic diseases among refugees.

62 | Novartis Annual Report 2016
Novartis contributes to achieving the UN Sustainable Development Goals
The United Nations Sustainable Development Goals urge countries to “leave no one behind.” The third development goal specifically focuses on ensuring healthy lives and promoting well-being for all people of all ages, while many others such as goal 1 (no poverty), goal 6 (clean water and sanitation), and goal 10 (reduced inequalities) are inextri-cably linked to health, either directly or indirectly.
As a leading healthcare company, ensuring good health and well-being (goal 3) is at the core of our busi-ness and is aligned with our mission to improve and extend people’s lives. Through our business operations and ongoing activities, we make essential contributions to goals 8, 9, 13 and 17.
Corporate responsibilitycontinued
Novartis employs 123 000 people worldwide. Our products are available in about 155 coun-tries, and they reached nearly 1 billion people in 2016. We are committed to providing decent employment and promoting a diverse and inclusive working environment.
Innovation is at the core of what we do. We use science-based innovation to discover and develop breakthrough treatments, and we pioneer sustainable business models to deliver them to as many people as possible. Our capability-building efforts focus on patient care, research and development, and business skills, aiming to improve health out-comes and strengthen healthcare systems.
Climate change threatens development and dispropor tionately burdens the poorest and most vulnerable, while posing clear health risks. We strive to reduce our carbon emissions and minimize our overall environmental footprint.
Ensuring good health and well-being is aligned with our mission.
Novartis seeks effective partnerships to deliver treatments and quality care to as many people as possible. We partner with governments and the public sector, nongovernmental organizations, local communities and health workers, and research and academic institutes.
Through our business operations and ongoing activities, we make essential contributions to goals 8, 9 and 13.
Partnerships are at the heart of everything we do.
Our mission is to improve and extend people’s lives. We pursue a combination of approaches to improve access to our medicines for underserved populations. We also work to improve disease diagnosis and management through disease awareness, training and education programs.

Novartis Annual Report 2016 | 63Corporate responsibilityexpanding access to healthcare
We plan to roll out Novartis Access in 30 countries in the coming years based on government and stakeholder demand. The Novartis Access team is currently in talks with governments and local stakeholders in more than 10 priority countries in sub-Saharan Africa, Southeast Asia, Central America, and Central and Eastern Europe.
Additionally, Novartis Access filed 370 submissions for marketing authorization with health authorities in 21 countries. As we are required to register each Novartis Access portfolio product in all relevant formulations and dosage forms, we have taken this step proactively to facil-itate the swift rollout of the program.
loCal partnersHips CritiCal to sUCCessOur experience thus far shows that most healthcare systems in lower-income countries are geared toward tackling infectious diseases and are ill-equipped to address the needs of patients with chronic illnesses. This cannot be solved by one organization alone, so we partner with organizations that can contribute their skills and capabilities. Our distribution partners include MEDS and the Kenya Red Cross. We are also working with Management Sciences for Health to assess the supply chains in public and faith-based healthcare facil-ities in Kenya and to identify risks that may be detrimen-tal to product integrity. In addition, we are teaming up with the Christian Health Association of Kenya, the Kenya Conference of Catholic Bishops, and the Kenya Red Cross to build capacity among healthcare workers to diagnose and manage chronic diseases in local facil-ities across the country.
HelpinG reFUGees in lebanonIn March, the International Committee of the Red Cross and Novartis Access launched a pilot to improve access to treatment for Syrian refugees in Lebanon – as well as for underserved Lebanese and Palestinian patients – suffering from type 2 diabetes and high blood pressure. Together, these two diseases account for more than 50% of deaths in Lebanon.
eXpanDinG tHe HealtHy FaMily proGraMsHealthy Family is an innovative business model that aims to reach more patients in rural areas in the developing world. In 2016, it continued its expansion to reach more than 7.7 million people through health education sessions in India, Kenya, Vietnam and Indonesia. Nearly 610 000 patients attended specific health camps. Healthy Family is profitable in India and on track to break even in Kenya in 2017.
Expanding access to healthcare
While significant progress has been made in tackling some of the world’s greatest healthcare challenges, bil-lions of people still lack adequate access to medicines. We are working on ways to reimagine access to health-care through programs that help patients worldwide get the medicines they need, when they need them, at prices they can afford.
Pioneering innovative social business models In late 2016, we marked the one-year anniversary of the launch of Novartis Access, our portfolio of medicines to fight key chronic diseases. This portfolio includes 15 on- and off-patent medicines addressing cardiovascular diseases, type 2 diabetes, breast cancer and respiratory illnesses. It is offered to governments and public-sector customers in low- and lower-middle-income countries at a price of USD 1 per treatment per month.
The first treatments were delivered to Kenya in February and distributed by our local partner, Mission for Essential Drugs and Supplies (MEDS). Kenya received a total of four shipments in 2016. In total, more than 120 000 Novartis Access treatments were delivered to Kenya, Lebanon and Ethiopia, each providing a one-month supply of medicine. In September, we signed a memorandum of understanding for the implementation of Novartis Access in Rwanda, and we expect the first product delivery in early 2017. We also signed a broad memorandum of understanding with the government of Vietnam, which also covers noncommunicable disease interventions such as Novartis Access.
30 Countries are targeted for the rollout of Novartis Access in the coming years

64 | Novartis Annual Report 2016
Corporate responsibilitycontinued
In November, Sandoz announced a new collabora-tion to increase access to medicines by donating up to USD 10 million of products annually to Americares – a health-focused relief and development organization that responds to people affected by poverty or disaster with life-changing health programs, medicine and medical supplies. The initial donation will include more than 25 Sandoz products to treat infections; cardiovascular, eye and skin conditions; and musculoskeletal pain.
In December, Sandoz signed a sub-licensing agree-ment with the Medicines Patent Pool to help produce much-needed hepatitis C treatments for developing countries. Specifically, Sandoz will manufacture daclat-asvir, a new direct-acting antiviral that – when used in combination with other treatments – is proven to cure multiple genotypes of the hepatitis C virus.
Patient assistance programsIn 2016, our worldwide patient assistance programs helped more than 130 000 people access medicines they could not afford due to financial hardship, lack of insurance, or inadequate reimbursement. One of our key programs is Novartis Oncology Access, or NOA. NOA is designed to improve access in countries that have challenging healthcare environments or very limited healthcare reimbursement systems. Today, NOA offers assistance to emerging nations in Asia, the Middle East, Central and Eastern Europe, Africa and Latin America. In addition to Glivec, NOA programs include patient access to Tasigna and Exjade. NOA and the Glivec International Patient Assistance Program (GIPAP) combined reached more than 80 000 patients around the world in 2016.
Given changes in the healthcare environment since GIPAP was launched 14 years ago, starting in 2017, our longtime partner The Max Foundation will assume full responsibility for development and management of the program. Novartis Oncology will donate Glivec to The Max Foundation to supply patients currently eligible for GIPAP, and provide funding to The Max Foundation to support program operations.
To improve the quality and impact of the Healthy Family activities, we reassessed and adjusted, where relevant, various program parameters. Specifically, we adjusted the disease area focus, simplified the referral process, capped the number and size of health camps to increase the quality and length of the consultations, and, in some cases, initiated agreements with new partners. As a result, the total number of patients reached in 2016 was smaller than in previous years.
Equitable commercial models in lower-income countriesOur access strategy framework was approved by the Access to Medicine Committee in 2015. This defines a set of tools to develop equitable pricing strategies for lower-income countries, according to the purchasing power of patients and payors. These strategies are sys-tematically applied to key innovative pharmaceutical products that address the disease priorities in countries. The goal is to maximize patient reach through sustainable commercial models, while minimizing the lag time between introduction in higher- and lower-income countries.
We are tracking the implementation of these efforts through a set of indicators that measure the number of patients with access to our products, as well as the price that patients actually pay for them. As affordability is also impacted by factors outside of our control – including markups, taxes, tariffs, etc. – our local teams use this data to engage with distribution partners in an effort to reduce markups on Novartis products before they reach patients.
Sandoz: generating new ideas to make access happenOur generics division, Sandoz, combines its broad port-folio of more than 1 000 off-patent medicines, covering all major therapeutic areas, with CR programs to improve access, medical information and medical capacity building.
In September, Sandoz launched the Sandoz HACk, short for Healthcare Access Challenge. This competi-tion aimed to generate novel solutions to key healthcare access challenges in local communities. Open to 18- to 35-year-olds from around the world, the Sandoz HACk received 150 submissions, from which six finalist entries were selected. After further refining ideas on the online OpenIDEO platform, three winners will be chosen in the first half of 2017. They will receive seed funding and support from mentors to help bring their ideas to life.

Novartis Annual Report 2016 | 65Corporate responsibilitynovartis access approaches: key performance indicators 2016
Novartis access approaches: key performance indicators 2016
1 Full-time equivalent positions and contractors2 Via training and service delivery and through health awareness activities3 The patient number was calculated based on treatments delivered and the following
elements: daily treatment doses, treatment duration, treatment adherence and potential treatment overlap (as it is common for chronic patients to take several drugs). The treatment adherence and treatment overlap factors are based on assumptions from developed markets and will be revisited when we gain additional insights from Novartis Access rollout countries.
4 Several strategic measures were implemented to improve the quality and impact of the program (capping number and size of health camps, etc).
5 Wholesale acquisition cost (WAC) plus logistics costs for some programs6 Integration of Alcon brands in the program as of August 2016 and a full-year impact of
GSK oncology medicines7 Data reflects January to July 2016; as of August 2016, the program transitioned to the
Novartis Patient Assistance Foundation Inc. (US).
8 Coartem was provided without profit for public sector use and to donor-funded programs in the private sector. The value of these shipments is calculated based on the average ex-factory price of non-donor-funded Coartem to private-sector purchasers in developing countries, minus payments received from the public sector and donor-funded customers in the private sector.
9 Increased availability of generic options on the market10 Retail value for surgical products11 Manufacturing, testing and FTE costs12 Some 2015 shipments shifted to 2016.13 Operating costs14 Programs at scale report the catchment of a population in the area where a program
has been implemented. Includes expanded nationwide catchment area of the population in 25 districts of Ghana
There is no one-size-fits-all solution for access to healthcare. We continue to pursue a combination of approaches – innovative business models that provide tailored and scalable solutions, equitable commercial models, high-quality generics, patient assis-tance programs, zero-profit models and drug donations, strategic philanthropy and emergency relief – to reach underserved patients.
Social business models Patients reached (thousands) FTEs1 People reached (thousands)2
2016 2015 2016 2015 2016 2015
Novartis Access 8.4 3 3.3 3 14 10
Healthy Family (in India, Kenya,
Vietnam and Indonesia) 609.6 4 981.2 495 519 7 756.4 7 621.4
total 618.0 984.5 509 529 7 756.4 7 621.4
Patient assistance programs Patients reached (thousands) Value USD (millions)5
2016 2015 2016 2015
Novartis Patient Assistance
Foundation Inc. (US) 45.4 42.6 1 115.0 6 707.0
Oncology/hematology
LMIC patient assistance 83.3 80.6 1 579.1 1 523.5
Alcon US patient assistance 5.8 7 7.8 9.7 7 13.2
total 134.5 131.0 2 703.8 2 243.7
Zero-profit model Patients reached (thousands) Value USD (millions)8
2016 2015 2016 2015
Malaria/Coartem 49 757.9 9 64 097.7 80.7 111.5
total 49 757.9 64 097.7 80.7 111.5
Donations Patients reached (thousands) Value USD (millions)5
2016 2015 2016 2015
Alcon medical missions 10 484.0 393.8 73.0 43.0
Leprosy (WHO) 290.0 304.5 4.4 5.6
Fascioliasis/Egaten 11 276.2 12 13.7 <1 <1
Medicine donations (emergency relief) 1.8 1.1
total 1 050.2 712.0 79.2 49.7
Health systems strengthening
Value USD (millions)13 FTEs1 People reached (thousands)2
2016 2015 2016 2015 2016 2015
Novartis Foundation 14.8 12.0 14 10 8 908.6 14 4 456.0
Novartis research capacity-building programs 3.5 5.5 6 6 1.0 1.0
total 18.3 17.5 20 16 8 909.6 4 457.0
Patients reached (thousands) Value USD (millions)5 8 13 FTEs1 People reached (thousands)2
2016 2015 2016 2015 2016 2015 2016 2015
Grand total 51 560.6 65 925.2 2 882.0 2 422.4 529 545 16 666.0 12 078.4

66 | Novartis Annual Report 2016
Alcon: driving access to state-of-the-art surgical eye care For years, Alcon has partnered with Orbis, which oper-ates a Flying Eye Hospital that provides hands-on training to local eye care specialists and treats patients in some of the world’s most underserved areas. Approximately 200 patients are treated during a typical Orbis program. In 2016, Orbis launched its third-generation Flying Eye Hospital, equipped with the latest technology. Alcon supported the aircraft with equipment, products, vo lun- teers and financial assistance. The new Flying Eye Hos-pital completed its maiden program in Shenyang, China, in September. During the three-week visit, the plane’s medical volunteers treated 124 patients and provided hands-on surgical training to 18 local doctors.
200 The number of patients treated during a typical Orbis Flying Eye Hospital program
Effective partnerships to strengthen healthcare systems While increased availability of high-quality, affordable me di cines is important, a holistic system approach is needed to improve quality of care. Strong health services and trained health workers are also critical. The Novartis Foundation is pioneering solutions beyond treatment by testing and validating innovative healthcare models that have a transformational impact on the health of the poorest populations.
In 2016, the Novartis Foundation, together with global nonprofit PATH, local partners and government agen-cies, launched an innovative blood pressure manage-ment program in Vietnam called Communities for Healthy Hearts. It is designed to improve the health of adults who have high blood pressure and are living in low-income households in four districts in Ho Chi Minh City, Vietnam’s largest urban area. The program strengthens treatment and referral services, partners with social enterprises to improve blood pressure screening, and leverages technology to help patients manage their disease.
Zero-profit models and product donations The Novartis Malaria Initiative recently achieved another treatment milestone: Since 2001, the initiative has deliv-ered, without profit, more than 800 million antimalarial treatments – including more than 300 million dispersible pediatric treatments – mostly to the public sector of malaria-endemic countries. In 2016, our malaria treat-ments delivered at zero profit reached approximately 50 million patients.
In 2016, Novartis celebrated a 30-year commitment to leprosy elimination. In total, since 2000, we have donated multidrug therapy to 6 million leprosy patients worldwide. The Novartis Foundation continues this legacy by consistently devising novel strategies to fully interrupt the transmission of the disease. At the 19th International Leprosy Congress in September, the foundation presented emerging evidence from the leprosy post-exposure prophylaxis (LPEP) program. LPEP evaluates the effect of providing preventative medicines to close contacts of newly diagnosed patients – such as family members or friends – to decrease the risk of transmission. Partway through the study, LPEP has already shown that its strategy of contact tracing and preventative therapy is feasible and efficient, meaning it could be integrated into routine practice in endemic countries in the future.
In 2016, Novartis celebrated a 30-year commitment to leprosy elimination. In total, since 2000, we have donated multidrug therapy to 6 million leprosy patients worldwide
Corporate responsibilitycontinued

Novartis Annual Report 2016 | 67Corporate responsibilityexpanding access to healthcare
In October, we announced that the Novartis Institute for Tropical Diseases (NITD) will move its operations and research programs from Singapore to Emeryville, California in the US, where it will be co-located with the infectious diseases research team of the Novartis Institutes for BioMedical Research (NIBR). This move will strengthen NITD for the future by enabling closer col-laboration with the NIBR infectious diseases research team and the San Francisco Bay Area life sciences community. NITD will remain an institute within the global research network of NIBR and continue to focus on the discovery of new medicines to combat malaria and other tropical diseases. The transition is expected to take place over the next 15 months.
Adaptive R&D is the modification of an existing drug to improve therapeutic efficacy, safety, and access to medicine, and – most importantly – to generate a positive health outcome. Most often, this work is done with a specific focus on poor and vulnerable patient groups. Our Established Medicines franchise manages a prod-uct portfolio of more than 90 mature brands spanning 11 therapeutic areas. It also systematically evaluates its portfolio and executes relevant adaptive R&D projects. In addition, our Center of Excellence for Emerging Markets collaborates closely with the global program teams across the Innovative Medicines Division to ensure that adaptive R&D considerations, especially formulations for specific age groups or geographies, are firmly embedded in the development plans for our new products.
Science-based innovation to address the needs of underserved populationsBacteria, viruses and other micro-organisms continue to wreak havoc on human health, despite major medical advances. Infectious diseases remain the leading cause of death in children and adolescents, and one of the leading causes of death in adults. We are continuing to research potential therapies for these neglected disea ses, which can be devastating, especially in developing countries.
In August, we reported on a new target for three neg-lec ted diseases: African sleeping sickness, leishmaniasis and Chagas disease. Working in lab models, our research-ers at the Genomics Institute of the Novartis Research Foundation demonstrated that it may be possible to treat all three diseases with a single class of compound that blocks cellular machinery known as the proteasome.
Novartis leads two of the four most advanced malaria development programs underway worldwide. Malaria still kills approximately 430 000 people each year, most of them children under 5 years old. In September, the results of a proof-of-concept study for one compound, KAF156, were published, and further development is ongoing. The second compound, KAE609, continues to be evaluated for the role it could play in the battle against the disease. Read more about our antimalarial research and develop-ment (R&D) efforts on page 51.
In a village near San Lorenzo, Guatemala, field worker Eduardo Canuz and nurse Evelin Alvarado Fuentes discuss the hazards of wood-burning stoves with Tomasa Carrete and her daughter Veronica Bulux.

68 | Novartis Annual Report 2016
Compliance has now become a regular agenda item of leadership meetings across the company. To ensure accountability of local country organizations, our manage-ment includes integrity and compliance questions as part of standard business reviews.
In addition, we continue to further embed our revised Values and Behaviors launched last year in all aspects of employees’ lives at Novartis – from recruitment and development to promotions, performance assessments and bonus awards.
Strengthening the Integrity & Compliance functionIn May, we introduced a new Chief Ethics and Compli-ance Officer who continues to report directly to the CEO. The new Chief Ethics and Compliance Officer is also Head of Litigation, reporting to the Group General Coun-sel of Novartis. By bringing the compliance and legal functions closer together, we can evaluate facts that are uncovered and intended for use in litigation cases to determine if additional compliance actions or policies are warranted. This helps us constantly improve our com-pliance activities.
Doing business responsibly
We recognize that achieving our business goals requires that we operate with high integrity, transparency and environmental sustainability. We must meet society’s increasing expectations in a way that builds and main-tains trust.
Continuing to build a culture of integrityIt takes significant effort to truly and deeply embed a cul-ture of integrity in a sustainable way across a large, com-plex and multinational organization. As a result, we do still uncover lapses. We take allegations of any inappropriate behavior very seriously, actively investigate them, and take appropriate disciplinary action. Associates can report suspected misconduct to the Business Practices Office (BPO) – an independent team that reports to the Group General Counsel.
In 2016, the BPO received a total of 3 595 complaints of alleged misconduct, of which 1 888 were deemed not to be related to misconduct and were delegated for review and action outside the BPO investigative process. The BPO initiated investigations of 1 707 reported cases related to misconduct; 893 were substantiated, including 401 that resulted in dismissals or resignations.
Following recent cases of misconduct, we have further increased our focus on ensuring that lessons learned are shared immediately and transparently throughout the global organization to identify other sim-ilar behaviors and enable intelligent risk mitigation. We continue to invest significant efforts to embed a culture of compliance throughout our organization.
Training and guiding associatesAll Novartis Group company associates are required to complete integrity and compliance training. In 2016, more than 110 000 employees completed the Code of Con-duct course.
Every year since 2012, global communications tool-kits have been rolled out to support the launch and updat-ing of policies and guidelines, and to reinforce ethical behavior among associates. These toolkits include a range of awareness-raising and educational materials such as posters, videos, letters to internal stakeholder groups, frequently asked questions and answers, train-ing presentations and case materials.
Additionally, our CEO chaired a webcast on global integrity and compliance to reinforce our commitment to embed responsible business practices across our organization and make leaders accountable. We also developed integrity case studies – inspired by real-life scenarios – for managers to use in discussions with their teams.
Corporate responsibilitycontinued
A total of 1 707 cases of misconduct were reported to the BPO, of which 893
were substantiated, including 401 that resulted in dismissals or resignations.
Misconduct cases1 per category
431eMployee relations
25%
98ConFliCt oF interest
6%
56inForMation proteCtion
3%
102QUality assUranCe
6%
112otHer
7%
researCH anD DeVelopMent 34
2%
46%FraUD 787
1 One case can fall under several categories, so the total is greater than 100% and
category figures total more than the stated number of cases. Investigation reports are received on an ongoing basis, which potentially leads to a reassessment of the allegation category and related figures.
32%540proFessional praCtiCes

Novartis Annual Report 2016 | 69Corporate responsibilityDoing business responsibly
One of our goals in 2016 was to find better and more inclusive ways to reach a broader cross-section of this community. Moreover, social expectations are rapidly changing, and educational and promotional practices that have been widely used by the industry must be re-evaluated.
We have 120 pilots for finding new and improved ways of engaging with healthcare professionals that are ongo-ing or completed. This includes employing technology to supplement face-to-face meetings and bring the experience of international congresses to the local level. For the prominent American Society of Clinical Oncology meeting in June, we used our new virtual conference platform Vivinda TV to deliver meeting content on- demand to more than 5 000 virtual delegates in 103 countries – a reach five times greater than in the past. And at the European School for Advanced Studies in Ophthalmology, we used Vivinda TV to provide almost 1 800 virtual delegates in 75 countries with online access to meeting content. This significantly exceeded the 600 ophthalmologists who would normally attend the meet-ing in person. Additionally, Novartis partnered with the
We also continue to strengthen the Integrity & Compli-ance (I&C) function, which now has approximately 375 full-time-equivalent employees who are dedicated to integ-rity and compliance at the local, regional and global levels. Of these employees, 175 were added in the past three years. Additionally, we developed and launched an inter-nal, web-based tool in January 2016 called the I&C Training Academy, which is designed to help I&C professionals further enhance their functional skills and competencies.
Furthermore, we took steps to strengthen integrity and compliance monitoring by hiring regional monitoring teams to perform in-country testing.
Changing how we interact with customersCompanies in the healthcare industry have an important responsibility to educate doctors, nurses and other clini-cians about how medicines and devices work. Practices such as sponsoring doctors to attend conferences, inviting clinicians to speak about products, and providing promotional aids have long been used by pharmaceutical companies to deliver information to the medical commu-nity about medicines and services in their portfolio.
Ethics and people key performance indicators 1 2016 2015
Full-time equivalent positions / headcount 2 118 393 / 122 985 118 700 / 122 966
Turnover: % voluntary / % overall 7.4 / 12.2 7.3 / 13.5
Voluntary turnover of high3 performers (%) 5.8 5.5
Internal hires / external hires (%) 47.0 / 53.0 44.8 / 55.2
Women in management: % of management4 / % of Board of Directors 42 / 25 41 / 27
Associate nationalities / associate nationalities in management 4 142 / 109 145 / 109
Annual training hours per employee 27.8 27.3
Lost-time injury and illness rate (per 200 000 hours worked) 5 0.08 0.11
Total recordable case rate (per 200 000 hours worked) 5, 6 0.29 0.40
Novartis associates trained and certified on Code of Conduct 7 110 774 110 638
Misconduct cases reported / allegations substantiated 8 1 707 / 893 1 300 / 1 010
Dismissals and resignations related to misconduct 9 401 577
Regulatory inspections without major findings (%) 98.1 98.4
Suppliers posing an elevated risk under responsible procurement 10 441 475
Suppliers with active follow-up 10, 11 147 249
Suppliers audited 10 76 100
1 Continuing operations 2 Headcount reflects the total number of associates in our payroll systems. Full-time equivalent adjusts headcount for associates working less than 100%. All data as of December 31 3 We have refined the high-performer definition methodology to reflect the focus on Values and Behaviors, and have restated 2015 data. 4 Management defined locally 5 Data include Novartis associates and third-party personnel managed by Novartis associates. 6 Includes all work-related injury and illness, whether leading to lost time or not 7 Active Novartis associates with email addresses, trained via e-learning 8 The number of misconduct cases reported may change as matters may be reassessed in the course of the case lifecycle. The number of substantiated allegations may change due
to the fact that investigation reports with assessments are received on an ongoing basis, which potentially leads to a difference in numbers at a later stage. In 2016, the Business Practices Office (BPO) received a total of 3 595 complaints of alleged misconduct, of which 1 888 were deemed not to be related to misconduct and were delegated for review and action outside the BPO investigative process. The BPO initiated investigations of 1 707 reported cases related to misconduct; 893 were substantiated, including 401 that resulted in dismissals or resignations.
9 The number of dismissals and resignations related to misconduct may change due to the fact that investigation reports are received and then reviewed for remedial actions on an ongoing basis, which potentially leads to a difference in numbers at a later stage.
10 Includes new suppliers and new products, services or sites from existing suppliers; potential risks include labor or human rights, HSE and animal welfare 11 Follow-up includes more information requested, audits or on-site assessments.

70 | Novartis Annual Report 2016
American Society of Hematology (ASH) to provide 3 000 healthcare professionals with virtual access to their annual congress via the ASH web portal.
Beginning 2017, our company will offer doctors sup-port to attend international medical conferences based on their active participation in the event (i.e., only if they are speakers or presenters of Novartis data, chairs of Novartis-sponsored sessions or faculty for post- congress education). Novartis will also only sponsor speakers to represent the company in clearly defined instances, such as when a new product becomes avail-able, a new indication is added to an existing product, or significant new clinical data is released.
We have 120 pilots for finding new and improved ways of engaging with healthcare professionals that are ongoing or completed
Increasing transparency around payments to customersAs of 2016, companies belonging to the European Federation of Pharmaceutical Industries and Associa-tions (EFPIA), including Novartis, publicly disclose pay-ments and other transfers of value to health profession-als and healthcare organizations for prescription phar maceuticals. Since June, we have made our dis-closure reports available on our global website. We will extend this disclosure to include all product segments in EFPIA countries where we have activities – even parts of our business that are not covered by the EFPIA code – and publish them on our global website in 2017.
In addition to the EFPIA code, we comply with similar transparency codes and regulations in the US, Japan and Australia.
Combatting counterfeit medicinesNovartis is continuing to work to tackle the problem of counterfeit drugs.
We established both an Anti-Counterfeiting Steering Committee and an Anti-Counterfeiting Working Group. The steering committee, made up of senior managers from across the company, is tasked with driving the strategic direction of our anti-counterfeiting approach worldwide. The working group develops and delivers the specific operational activities needed to implement the strategy.
Driving environmental sustainabilityIn late 2015, Novartis launched its Vision 2030 on Environmental Sustainability, which is underpinned by a set of environmental sustainability targets in four areas: energy and climate, water and micropollutants, materi-als and waste, and environmental sustainability man-agement. Throughout 2016, a cross-divisional team began to select major facility and infrastructure projects and measures necessary to achieve our 2020 goals, based on the savings as determined by our internal carbon price of USD 100/tCO2e. We are identifying opportunities for contracting renewable wind and solar electricity as priority actions.
At the same time, we found ways to improve our en-vironmental footprint in our day-to-day operations, con-tributing to a reduction in carbon emissions (Scope 1 and Scope 2) of 10 kilotons in 2016. For instance, at our facility in Grimsby in the UK, we implemented a new wastewater technology that uses microbubbles. This technology was first introduced at our plant in Rin gas-kiddy, Ireland, in 2015. There, it reduced electricity de-mand by 160 kilowatts per year and carbon emissions by 600 tons per year, without impacting the perfor-mance of the plant.
Corporate responsibilitycontinued
Ghanaian scientist Edmund Ekuadzi gathers plants used by traditional healers to analyze their medicinal effects.

Novartis Annual Report 2016 | 71Corporate responsibilityDoing business responsibly
Environmental sustainability key performance indicators 1, 2 2016 2015
Energy use (million gigajoules), on site and purchased 16.6 17.2
Water discharge (million m3) 16.2 17.2
Contact water use, excluding cooling water (million m3) 14.8 15.5
Emissions
Greenhouse gas (GHG) emissions, total Scope 1 and Scope 2 (1 000 t) 1 352.7 1 362.1
GHG emissions, Scope 1, combustion and processes on site (1 000 t) 396.6 396.8
GHG emissions, Scope 1, vehicles (1 000 t) 134.7 138.9
GHG emissions, Scope 2, purchased energy (1 000 t) 821.4 826.4
Halogenated volatile organic compounds (t) 50.7 66.4
Non-halogenated volatile organic compounds (t) 480.8 517.1
Operational waste
Hazardous waste not recycled (1 000 t) 60.2 57.6
Non-hazardous waste not recycled (1 000 t) 17.9 20.6
1 Continuing operations2 2016 environmental sustainability data published in the Annual Report are actual data for the period from January through September, and best estimates for the period from
October through December. They will be updated with actual data in the first quarter of 2017. Significant deviations will be reported on our website and restated in next year’s Annual Report.
We found ways to improve our environmental footprint in our day-to-day operations, contributing to a reduction in carbon emissions (Scope 1 and Scope 2) of 10 kilotons in 2016
Maintaining a responsible supply chainWe engage with an extensive network of suppliers world-wide, and their contributions are crucial to our success. Responsible procurement (RP) helps ensure our goods and services are ethically sourced by requiring the com-panies with which we do business to meet the standards of ethics, business integrity and environmental practice that we expect. Our RP practice is designed to provide a clear view of where potential issues exist or standards may be compromised, with speed and accuracy. It quickly filters out the approximately 95% of suppliers that pres-ent little or no ethical risk, enabling us to concentrate our efforts on the small number of suppliers where a signif-icant risk exists or where we can influence change.
In 2016, we conducted a materiality assessment to ensure that our current processes meet the recent heightened external interest, additional scrutiny and new regulations. One of the outcomes was the establishment of a cross-functional steering committee. This commit-tee has the accountability to expand our current RP program into a comprehensive third-party risk frame-work across Novartis.
In 2017, cross-functional workstreams formed under the steering committee will carry out an action plan to strengthen the policy, execution and monitoring aspects of the program to address additional third-party risks.
Expanding our corporate volunteering programNovartis has a number of initiatives to engage our asso-ciates, helping us to attract and develop talented people, strengthen our company’s culture, and support our ability to execute our strategy. In 2015, we put in place a corporate volunteering platform through which Novartis associates can register a potential corporate responsibility project idea or sign up to become a corporate volunteer. In 2016, the pro-gram expanded significantly, launching in several mar-kets, including low- and middle-income countries. The scope of projects in the platform is broad and includes partnerships with global charitable organizations, remote and on-the-ground capability building, one-time and recurring pro bono services, and local efforts to support smaller-scale foundations and institutions.

72 | Novartis Annual Report 2016
Novartis responsibilities
The Board of Directors of Novartis AG is responsible for both the subject matter and the criteria as well as for selection, preparation and presentation of the informa-tion in accordance with the criteria. This responsibility includes the design, implementation and maintenance of related internal control relevant to this reporting process that is free from material whether due to fraud and error.
Our responsibilities
Our responsibility is to form an independent opinion, based on our limited assurance procedures, on whether anything has come to our attention to indicate that the CR indicators are not stated, in all material respects, in accordance with the reporting criteria.
We planned and performed our procedures in accor-dance with the International Standard on Assurance Engagements (ISAE) 3000 (revised) “Assurance Engage-ments Other Than Audits or Reviews of Historical Finan-cial Information.” This standard requires that we plan and perform the assurance engagement to obtain limited assurance on the identified CR indicators.
A limited assurance engagement under ISAE 3000 (revised) is substantially less in scope than a reasonable assurance engagement in relation to both the risk assessment procedures, including an understanding of internal control, and the procedures performed in response to the assessed risks. Consequently, the nature, timing and extent of procedures for gathering sufficient appropriate evidence are deliberately limited relative to a reasonable assurance engagement and, therefore, less assurance is obtained with a limited assur-ance engagement than for a reasonable assurance engagement.
Our independence and quality control
We have complied with the independence and other eth-ical requirements of the Code of Ethics for Professional Accountants issued by the International Ethics Stan-dards Board for Accountants, which is founded on fun-damental principles of integrity, objectivity, professional competence and due care, confidentiality and profes-sional behavior.
To the Board of Directors of Novartis AG, Basel
We have been engaged to perform assurance proce-dures to provide limited assurance on the following aspects of the 2016 corporate responsibility (CR) report-ing of Novartis AG and its consolidated subsidiaries (Novartis Group) included in the Annual Report 2016.
Scope and subject matter
Our limited assurance engagement focused on the fol-lowing data and information disclosed in the consoli-dated CR reporting of Novartis Group for the year ended December 31, 2016:— The social key performance indicators on page 7, the
“Novartis access approaches: key performance indicators 2016” on page 65, the “Misconduct cases per category” on page 68, the “Ethics and people key performance indicators” on page 69 and the “Envi-ronmental sustainability key performance indicators” on page 71 (CR indicators)
— Reporting processes and related controls in relation to data aggregation of CR indicators
Criteria
The management reporting processes with respect to the CR reporting and CR indicators were assessed against Novartis Group internal policies and procedures, as set forth in the following:— Guideline on Corporate Responsibility Management
at Novartis and the Code of Conduct— Procedures by which the data for the CR indicators
reporting are gathered, collected and aggregated internally
Inherent limitations
The accuracy and completeness of CR indicators are subject to inherent limitations given their nature and methods for determining, calculating and estimating such data. Our Assurance Report should therefore be read in connection with Novartis Group guidelines, definitions and procedures on CR reporting.
independent assurance report on the novartis 2016 corporate responsibility reporting

Novartis Annual Report 2016 | 73independent assurance report on the novartis 2016 corporate responsibility reporting Corporate responsibility
We have not carried out any work on data other than out-lined in the scope and subject matter section as defined above. We believe that the evidence we have obtained is sufficient and appropriate to provide a basis for our assurance conclusions.
Limited assurance conclusion
Based on our work described in this report, nothing has come to our attention that causes us to believe that the data and information outlined in the scope and subject matter section (including the related controls) have not been prepared, in all material aspects, in accordance with Novartis Group internal policies and procedures.
PricewaterhouseCoopers AG
Bruno Rossi Raphael Rutishauser
Basel, January 24, 2017
Our firm applies International Standard on Quality Control 1 and accordingly maintains a comprehensive system of quality control including documented policies and procedures regarding compliance with ethical requirements, professional standards, and applicable legal and regulatory requirements.
Summary of work performed
Our assurance procedures included the following:— Reviewing the application of the Novartis Group inter-
nal CR reporting guidelines— Interviewing associates responsible for internal
reporting and data collection— Performing tests on a sample basis of evidence
supporting selected CR data concerning complete-ness, accuracy, adequacy and consistency
— Inspecting relevant documentation on a sample basis— Reviewing and assessing the management reporting
processes for CR reporting and consolidation, and their related controls

74 | Novartis Annual Report 2016
Coping with eye disease and fading vision late in lifeGroups of people doing communal exercises to keep fit are an everyday sight in Japan, but for one woman they are a very public way to show she is fighting back against a debilitating eye disease.
Yuko Yoshikawa feared she could no longer help organize the popular sessions, known as radio exercises, when she began suffering from age-related macular degeneration (AMD), which causes progressive loss of vision in the elderly. The disease results in gradual blurring of the eye’s central vision, making it harder to read and recognize faces, and often triggering depression and feelings of isolation.
She gained information and support from other patients, and is now working with them to spread the word through a group called AMD Tomonokai, which means “friends” in Japanese. Ms. Yoshikawa, now 65, was encouraged to maintain her involvement with the exercise classes, though she now wears dark glasses to protect her eyes against bright sunlight.
Through its newsletters, meetings and website, the group shares AMD patients’ experiences and
advises them on a range of practical matters, such as how to get the most out of medical consultations, find the best form of therapy, and manage the costs of healthcare. It also offers practical tips, like using a smartphone to read bus timetables by photographing the small print and enlarging it on the screen.
Above all, the group stresses the importance of social interaction and maintaining normal activities for as much as possible to counteract the psychological effects of the disease.
The challenges associated with AMD will likely grow as the world’s population ages. In Japan, which has the oldest average population of any country in the world, an estimated 700 000 people suffer from the disease. Worldwide, about 170 million people are affected, and this number is expected to increase to nearly 200 million by 2020.
PHOTO ESSAY
1
Novartis Annual Report 2016 | 75PHOTO ESSAY
There is no cure for AMD, though therapies such as Lucentis have been shown to improve symptoms in the more serious form of the disease, called wet AMD. And Novartis has ongoing work to develop alternative treatments.
Members of AMD Tomonokai find different ways to cope with the disease. Despite her deteriorating vision, Hiroko Ayabe, a 71-year-old retired teacher, continues to play an active role in family life by looking after her grandchildren every day until her daughter and son-in-law get home from work.
The group’s founder and head, Hideo Takahashi, sets a good example by cycling to a small inner-city farm where he and his wife, Chizuko, tend the vegetables they grow – his eyes also protected by dark glasses.
Mr. Takahashi, now 68 years old, discovered he had AMD seven years ago and experienced the same uncertainty and isolation as many other patients. However, after a lifetime in the pharmaceutical industry, he was more familiar with the world of healthcare and determined to put his knowledge to good use.
The group he established now has around 100 members and provides an important source of advice, as well as support and encouragement for patients. And like the plants he tends on his vegetable plot, Mr. Takahashi is confident that now that it has taken root, it will flourish and grow over time.
For detail on eye care research k page 50
1 Despite eyesight problems, Yuko Yoshikawa (center foreground) throws herself into the communal fitness sessions that are a feature of Japanese life.
2 Hideo Takahashi, founder and head of the AMD support group, with his wife Chizuko at their vegetable plot in Saitama, near Tokyo, Japan
3 Ms. Yoshikawa visits a historic shrine near her Tokyo home.
2
3

76 | Novartis Annual Report 2016
Corporate governanceContentsLetter from the Chairman 76
Summary of our corporate governance approach 79
Our shares and our shareholders 80
Our Board of Directors 86
Our management 98
Our independent external auditors 104
Our corporate governance framework 105
Further information 106
Dear shareholder,In 2016, we refreshed our Board with new members, focused on the new operating model of Novartis, and further strengthened our corporate governance.
The mandate of our Board
Our Board is accountable for stewardship, governance and oversight, and for setting the strategic direction to deliver sustainable value. We achieve this by setting a clear strategy for Novartis and through an effective governance.
Our Board is also responsible for appointing our CEO and the other Executive Committee members. We assert independent judgment and work closely with our Exec-utive Committee to ensure our strategy is properly imple-mented, our ethical standards are applied, and our per-formance is optimized.
Board composition
To be effective and independent, our Board must have the right composition, structure and processes, and a clear understanding of its role and responsibilities. Our Board meets these requirements.
Our Board is comprised of 12 non-executive, inde-pendent members with diverse education, experience, nationalities and interpersonal skills. This diversity was further strengthened when Ton Buechner and Liz Doherty joined in February 2016, reinforcing our Board’s expertise in finance and accounting, as well as in lead-ership and management. With this, we achieved a sub-stantial Board refreshment. Two-thirds of our Board members have a tenure of less than six years, balancing the benefits of continuity and experience with refresh-ment, without applying a mandatory term limit.

Novartis Annual Report 2016 | 77Corporate governanCeLetter from the Chairman
In line with committee succession plans, Liz joined our Audit and Compliance Committee (ACC), and was designated as Financial Expert. Subject to their re-elec-tion at the Annual General Meeting of Shareholders (AGM) 2017, Liz will take over the chairmanship of the ACC from Srikant Datar; Srikant will remain an ACC mem-ber, designated as second Financial Expert; and he will take over the chairmanship of the Risk Committee from Andreas von Planta, who has already taken over the chairmanship of the Governance, Nomination and Cor-porate Responsibilities Committee (GNCRC) from Pierre Landolt.
All Board members are non-executive and indepen-dent, as defined by our own rules and those of the Swiss Code of Best Practice for Corporate Governance. We have established processes to ensure our Board func-tions effectively, promoting efficient and balanced deci-sion-making, and enabling our Board to effectively fulfill its duties in the best interest of our shareholders, employ-ees and other stakeholders.
We emphasize training, performance evaluation and ongoing improvement of our Board and its members, as well as succession planning. To get an outside view on where we could improve further, we initiate a perfor-mance and effectiveness evaluation by an independent expert on a regular basis, with the most recent external review being completed during 2014.
The focus of our Board in 2016
The key areas that our Board focused on in 2016 were structural, cultural and leadership changes, as well as the corporate responsibility programs, compliance and the compensation system. We re-evaluate the strategic direction of Novartis each year and make necessary changes in line with our man-date to create sustainable value.
Last year, a key strategic topic for our Board was the continuing transformation of Novartis. This began in 2014 when we focused our company on our core businesses and created a more integrated organization to facilitate collaboration, drive efficiency, and support productivity gains. In 2016, in close cooperation with our Executive
Committee, we implemented additional structural changes aimed at positioning our company for future growth. They included creating Global Drug Develop-ment and manufacturing organizations to further enhance efficiency and effectiveness. As a result of these actions, in just over three years, Novartis has transformed from a strongly divisionalized organization to a more inte-grated, streamlined company focused on key segments and able to take advantage of its global scale. For details on our strategy and structure, please see pages 14 – 19. We also strengthened our focus on the corporate cul-ture of Novartis as defined by the Novartis Values and Behaviors.
The GNCRC also reviewed progress on Novartis Access, our portfolio of 15 on- and off-patent medicines offered to governments and public-sector customers in low- and lower-middle-income countries at a price of USD 1 per treatment per month, which completed its first year of implementation. The Novartis Malaria Initiative, the Healthy Family social business, and our corporate volunteering program were also reviewed. The GNCRC also reviewed Novartis’ performance in key sustainabil-ity ratings and discussed the potential for introducing more robust reporting on the social impact of our activ-ities. For further information on our corporate responsi-bility efforts, please see the Corporate Responsibility chapter, beginning on page 60, and our Corporate Responsibility Performance Report on the Novartis web-site: www.novartis.com/about-us/corporate-responsibility.
To meet the increasing expectations of patients and society in a way that makes us proud, we also took fur-ther steps in the compliance area. We enhanced our core compliance processes and strengthened our Integrity & Compliance function. Further, we evolved the way we work to increase access to evidence-based information about our products and services, with the aim of helping doctors deliver the best possible care for patients. We will continue to focus on further strengthening leaders’ accountability at all levels of the organization for com-pliance.
And, finally, we continued to refine our compensation system in line with best practice principles. For further information, please see our Compensation Report, beginning on page 110.

78 | Novartis Annual Report 2016
Role of the Chairman
As independent, non-executive Chairman, I am respon-sible for the leadership of the Board, ensuring its effec-tiveness in all aspects of its role. I also make sure we effectively collaborate with our CEO and the Executive Committee.
I ensure that our Board and its committees work effectively, setting the agenda, style and tone of Board discussions. I promote constructive challenge and debate, as well as effective decision-making, while ensur-ing that our performance is regularly evaluated and that our members are provided with appropriate support, education and advice.
In addition, I support, mentor and challenge our CEO, without interfering in the operational management of Novartis.
I am supported in my tasks by our Vice Chairman, Enrico Vanni, who would lead the Board if I were inca-pacitated.
Strengthened governance framework
During the last two years, we took steps to further strengthen our corporate governance, implementing the rules of the Ordinance against Excessive Compensation in Stock Exchange Listed Companies. We introduced annual elections of the Chairman of the Board, of all Board members, and of Compensation Committee mem-bers. We also introduced yearly binding shareholder votes on the aggregate compensation of our Board and Executive Committee, as well as a yearly non-binding shareholder vote on the Compensation Report.
Last year we also addressed the question of auditor rotation. We concluded that, at this stage, continuing with the yearly assessment of PwC’s objectivity, effectiveness and independence, and with the regular rotation of the audit partner in charge, is in the best interest of Novartis, its investors and other stakeholders.
Importance of shareholder engagement
Engagement with our shareholders is critical to our com-pany’s long-term success. Our Board is committed to continuous shareholder engagement. We strive to exchange views with our shareholders in an atmosphere of trust and respect that promotes a collaborative dia-logue, with views and positions expressed openly to enhance mutual understanding. As part of these efforts, based on a structured annual program, our governance specialists meet regularly with their peers from share-holder groups, and I personally meet with many of our shareholders, discussing strategy and governance. Our shareholder engagement meaningfully contributes to the continuing evolution of our governance framework.
Joerg reinhardtChairman of the Board of Directors

general Meeting of Shareholders
Approves operating and financial review, Novartis Group consolidated financial statements and financial statements of Novartis AG; decides appropriation of available earnings and dividend;
approves compensation of Board and Executive Committee; elects Board members, Chairman, Compensation Committee members, Independent Proxy and external auditors;
adopts Articles of Incorporation
external auditor
Provides opinion on compliance of Novartis Group consolidated
financial statements and the financial statements of
Novartis AG with applicable standards and
Swiss law, on compliance of the Compensation Report with applicable law, on effectiveness of internal control over financial reporting, and on the corporate
responsibility reporting of Novartis
Governance bodies
Sets strategic direction of Novartis, appoints and oversees key executives, approves major transactions and investments
Board of Directors
audit and Compliance Committee
Compensation Committee
research & Development
Committee
risk Committee
governance, nomi nation and
Corporate responsibilities
Committee
executive Committee
Responsible for operational management of Novartis
Novartis Annual Report 2016 | 79Corporate governanCeSummary of our corporate governance approach
Summary of our corporate governance approach
Leadership structure
Independent, non-executive Chairman and separate CEO
Board governance
StructureAll Board members are non-executive and independent, as defined by our rules. The Board has assigned respon-sibilities to five committees:— Audit and Compliance Committee— Compensation Committee— Governance, Nomination and Corporate Responsibil-
ities Committee— Research & Development Committee— Risk Committee
CompositionBoard members have diverse education, experience, nationalities and interpersonal skills. Their biographies (beginning on page 94) describe their specific qualifica-tions.
ProcessesThe Board’s processes significantly influence its effec-tiveness. The Board has implemented best practices for all such processes. Important elements include Board meeting agendas (to address all important topics), infor-mation submitted to the Board (to ensure the Board receives sufficient information from management to per-form its supervisory duty and to make decisions that are reserved for it), and boardroom behavior (to promote an efficient and balanced decision-making process).
Board and Executive Committee compensation
Information on Board and Executive Committee com-pensation is outlined in our Compensation Report, begin-ning on page 110.

80 | Novartis Annual Report 2016
Our shares and our shareholdersOur shares
Share capital of Novartis AGAs of December 31, 2016, the share capital of Novartis AG is CHF 1 313 557 410 fully paid-in and divided into 2 627 114 820 registered shares, each with a nominal value of CHF 0.50 (Novartis share). Novartis AG has neither authorized nor conditional capital. There are no preferential voting shares; all Novartis shares have equal voting rights. No participation certificates, non-voting equity securities (Genussscheine), or profit-sharing certificates have been issued.
Novartis shares are listed on the SIX Swiss Exchange (ISIN CH0012005267, symbol: NOVN), and on the New York Stock Exchange (NYSE) in the form of American depositary receipts (ADRs) representing Novartis Amer-ican depositary shares (ADSs) (ISIN US66987V1098, symbol: NVS).
The holder of an ADR has the rights enumerated in the deposit agreement (such as the right to give voting instructions and to receive dividends). The ADS depos-itary of Novartis AG – JPMorgan Chase Bank, New York – holding the Novartis shares underlying the ADRs is reg-istered as a shareholder in the Novartis Share Register. An ADR is not a Novartis share and an ADR holder is not a Novartis AG shareholder. ADR holders exercise their voting rights by instructing the depositary to exercise their voting rights. Each ADR represents one Novartis share.
Changes in share capitalDuring the last three years, the following changes were made to the share capital of Novartis AG:
In 2014, the share capital of Novartis AG did not change. In 2015, Novartis AG reduced its share capital by CHF 14.6 million (from CHF 1 353 096 500 to CHF 1 338 496 500) by canceling 29.2 million Novartis shares repurchased on the second trading line during 2013 and 2014. In 2016, Novartis AG reduced its share capital by CHF 24.9 million (from CHF 1 338 496 500 to CHF 1 313 557 410) by canceling 49.9 million Novartis shares repurchased on the second trading line during 2015.
Capital changes
Number of shares
Changes Changes
Year As of Jan 1 in shares As of Dec 31 in CHF
2014 2 706 193 000 2 706 193 000
2015 2 706 193 000 – 29 200 000 2 676 993 000 – 14 600 000
2016 2 676 993 000 – 49 878 180 2 627 114 820 – 24 939 090
A table with additional information on changes in the Novartis AG share capital can be found in Note 8 to the financial statements of Novartis AG.
Convertible or exchangeable securitiesNovartis AG has not issued convertible or exchangeable bonds, warrants, options or other securities granting rights to Novartis shares, other than options (and similar instruments such as stock appreciation rights) granted under or in connection with equity-based participation plans of Novartis associates. Novartis AG does not grant any new stock options under these plans.
Share repurchase programsAt the Annual General Meeting (AGM) in February 2008, shareholders approved the sixth share repurchase pro-gram authorizing the Board to repurchase Novartis shares up to a maximum of CHF 10 billion via a second trading line on the SIX Swiss Exchange. In 2008, a total of 6 million Novartis shares were repurchased at an aver-age price of CHF 49.42 per Novartis share, and canceled in 2009. In April 2008, the share repurchases were sus-pended in favor of debt repayment. In December 2010, the Board announced the reactivation of the share repur-chases. In 2011, 39 430 000 Novartis shares were repur-chased at an average price of CHF 52.81 per Novartis share, and canceled in 2012. In 2012, no Novartis shares were repurchased. In 2013, 2 160 000 Novartis shares were repurchased at an average price of CHF 70.58 per Novartis share. In 2014, 27 040 000 Novartis shares were repurchased at an average price of CHF 81.18 per Novartis share. In 2015, 29 200 000 Novartis shares repurchased in 2013 and 2014 were canceled. In the same year, 49 878 180 Novartis shares were repur-chased at an average price of CHF 93.24 per Novartis share, and canceled in 2016. With those repurchases, the sixth share repurchase program was completed.
At the AGM in February 2016, shareholders approved the seventh share repurchase program authorizing the Board to repurchase Novartis shares up to a maximum of CHF 10 billion. In 2016, a total of 10 270 000 Novartis shares were repurchased at an average price of CHF 74.67 per Novartis share.
Share developmentsSHare DeveLopMentS In 2016— Swiss-listed Novartis shares decreased 14.6% to
CHF 74.10— ADRs decreased 15.3% to USD 72.84

NOVARTIS
PEERS
MSCI WORLD MARKETS
MSCI WORLD PHARMA
Jan Feb Mar Apr May Jun Jul Aug Sept Oct Nov Dec
115
110
105
100
95
90
85
80
Novartis 2016 share price movement(based on USD amounts)
Source: Datastream; data are converted into US dollars and re-based to 100 at January 1, 2016. Currency fluctuations have an influence on the representation of the relative performance of Novartis vs. indices and peers.
800
700
600
500
400
300
200
100
0
Novartis 1996–2016 total shareholder return(based on USD amounts)
Source: Datastream; data are converted into US dollars and re-based to 100 at January 1, 1996. Currency fluctuations have an influence on the representation of the relative performance of Novartis vs. indices and peers.
NOVARTIS
PEERS
MSCI WORLD MARKETS
MSCI WORLD PHARMA
96 97 98 99 00 01 02 03 04 05 06 07 08 09 10 11 12 13 14 15 16
Novartis Annual Report 2016 | 81Corporate governanCeour shares and our shareholders
Novartis shares finished at CHF 74.10, a decrease of 14.6% from the 2015 year-end closing price of CHF 86.80. Novartis ADRs decreased in 2016 by 15.3% to USD 72.84 from USD 86.04. The Swiss Market Index (SMI), in com-parison, decreased by 6.8% in 2016, whereas the world pharmaceutical index (MSCI) decreased by 12.0% during the year. Total shareholder return for Novartis shares in 2016 was -11.4% in CHF and -13.8% in USD. The disap-pointing Alcon performance, the slow uptake of Entresto and the patent expiration of Gleevec in US weighed on our share price in 2016. Over a longer-term period, Novartis AG has consistently delivered a solid perfor-mance, providing a 8.7% compounded annual total shareholder return between January 1, 1996 and Decem-ber 31, 2016, exceeding the 8.4% compounded returns of its large pharmaceutical peers (see page 115; “bench-mark companies”), or the returns of 8.3% of the MSCI.
The market capitalization of Novartis AG based on the number of Novartis shares outstanding (excluding Novartis treasury shares) amounted to USD 172 billion as of December 31, 2016, compared to USD 208 billion as of December 31, 2015.
ContInUoUSLY rISIng DIvIDenD SInCe 1996The Board proposes a 2% increase in the dividend pay-ment for 2016 to CHF 2.75 per Novartis share (2015: CHF 2.70) for approval at the AGM on February 28, 2017. This represents the 20th consecutive increase in the div-idend paid per share since the creation of Novartis AG in December 1996, which reflects the successful execu-tion of the Group’s strategy as well as the performance of the Executive Committee and all Novartis associates. If the 2016 dividend proposal is approved by sharehold-ers, dividends to be paid out will total approximately USD 6.4 billion (2015: USD 6.5 billion). This will result in an expected payout ratio of 96% of net income from con-tinuing operations (2015: 92% and 36% of net income attributable to shareholders of Novartis AG). Based on the 2016 year-end share price of CHF 74.10, the dividend yield will be 3.7% (2015: 3.1%). The dividend payment date has been set for March 6, 2017.
DIreCt SHare pUrCHaSe pLanAs of June 20, 2016, Novartis no longer provides a Direct Share Purchase Plan. All participants were informed about the termination through a letter, which also included details about available options and the modalities of the closure.
Key Novartis share data
2016 2015 2014
Issued shares 2 627 114 820 2 676 993 000 2 706 193 000
Treasury shares 1 253 055 807 303 098 183 307 566 743
outstanding shares at December 31 2 374 059 013 2 373 894 817 2 398 626 257
Weighted average number of shares outstanding 2 378 474 555 2 402 806 352 2 425 782 324
1 Approximately 135 million treasury shares (2015: 137 million; 2014: 153 million) are held in entities that restrict their availability for use.

82 | Novartis Annual Report 2016
Per-share information1
2016 2015 2014
Basic earnings per share (USD) from continuing operations 2.82 2.92 4.39
Basic earnings per share (USD) from discontinued operations 4.48 – 0.18
Total basic earnings per share (USD) 2.82 7.40 4.21
Diluted earnings per share (USD) from continuing operations 2.80 2.88 4.31
Diluted earnings per share (USD) from discontinued operations 4.41 – 0.18
Total diluted earnings per share 2.80 7.29 4.13
Operating cash flow (USD) from continuing operations 4.82 5.03 5.73
Year-end equity for Novartis AG shareholders (USD) 31.52 32.46 29.50
Dividend (CHF) 2 2.75 2.70 2.60
1 Calculated on the weighted average number of shares outstanding, except year-end equity2 2016: proposal to shareholders for approval at the Annual General Meeting on February 28, 2017
Key ratios – December 31
2016 2015 2014
Price/earnings ratio 1 25.7 11.9 22.2
Price/earnings ratio from
continuing operations 1 25.7 30.1 21.3
Enterprise value/EBITDA
from continuing operations 13 16 15
Dividend yield (%) 1 3.7 3.1 2.8
1 Based on the Novartis share price at December 31 of each year
Key data on ADRs issued in the US
2016 2015 2014
Year-end ADR price (USD) 72.84 86.04 92.66
High 1 86.21 106.12 96.65
Low 1 67.59 83.96 78.20
Number of
ADRs outstanding 2 315 349 314 299 578 398 307 623 364
1 Based on the daily closing prices
2 The depositary, JPMorgan Chase Bank, holds one Novartis AG share for every ADR issued.
Share price (CHF)
2016 2015 2014
Year-end share price 74.10 86.80 92.35
High 1 86.45 102.30 93.80
Low 1 68.15 82.20 70.65
Year-end market
capitalization
(USD billions) 2 172.0 208.3 223.7
Year-end market
capitalization
(CHF billions) 2 175.9 206.1 221.5
1 Based on the daily closing prices2 Market capitalization is calculated based on the number of shares outstanding
(excluding treasury shares).
Our shareholders
Significant shareholdersAccording to the Novartis Share Register, as of Decem-ber 31, 2016, the following registered shareholders (including nominees and the ADS depositary) held more than 2% of the total share capital of Novartis AG, with the right to vote all these Novartis shares based on an exemption granted by the Board (see page 84):1
— Shareholders: Novartis Foundation for Employee Par-ticipation, with its registered office in Basel, holding 2.6%; Emasan AG, with its registered office in Basel, holding 3.4%; and UBS Fund Management (Switzer-land) AG, with its registered office in Basel, holding 2.1%
— Nominees: Chase Nominees Ltd., London, holding 8.5%; Nortrust Nominees, London, holding 3.9%; and The Bank of New York Mellon, New York, holding 4.4% through its nominees, The Bank of New York Mellon, Everett, holding 1.8%, and The Bank of New York Mel-lon, Brussels, holding 2.6%
— ADS depositary: JPMorgan Chase Bank, New York, holding 12.0%
According to a disclosure filed with Novartis AG, Norges Bank (Central Bank of Norway), Oslo, held 2.02% of the share capital of Novartis AG as of December 31, 2016.
According to disclosure notifications filed with Novartis AG and the SIX Swiss Exchange, each of the following shareholders held between 3% and 5% of the share capital of Novartis AG as of December 31, 2016:— Capital Group Companies Inc., Los Angeles— BlackRock Inc., New York
Disclosure notifications pertaining to shareholdings in Novartis AG that were filed with Novartis AG and the SIX Swiss Exchange are published on the latter’s electronic publication platform, and can be accessed via: www.six-exchange-regulation.com/en/home/publications/ significant-shareholders.html.
Cross shareholdingsNovartis AG has no cross shareholdings in excess of 5% of capital, or voting rights with any other company.
1 Excluding 4.5% of the share capital held as treasury shares by Novartis AG and its entities that restrict their availability for use

Novartis Annual Report 2016 | 83Corporate governanCeour shares and our shareholders
Distribution of Novartis shares The information in the following tables relates only to registered shareholders and does not include holders of unregistered shares. Also, the information provided in the tables below cannot be assumed to represent the entire Novartis AG investor base because nominees and JPMorgan Chase Bank, as ADS depositary, are regis-tered as shareholders for a large number of beneficial owners.
As of December 31, 2016, Novartis AG had approxi-mately 171 000 registered shareholders.
Number of shares held Number of
registered % of registered
As of December 31, 2016 shareholders share capital
1–100 25 153 0.06
101–1 000 103 217 1.66
1 001–10 000 38 138 4.03
10 001–100 000 3 427 3.40
100 001–1 000 000 481 5.47
1 000 001–5 000 000 71 5.53
5 000 001 or more 1 35 50.12
Total registered shareholders/shares 170 522 70.27
Unregistered shares 29.73
total 100.00
1 Including significant registered shareholders as listed above
Registered shareholders by type
As of December 31, 2016 Shareholders in % Shares in %
Individual shareholders 96.24 13.28
Legal entities 1 3.70 35.11
Nominees, fiduciaries
and ADS depositary 0.06 51.61
total 100.00 100.00
1 Excluding 4.5% of the share capital held as treasury shares by Novartis AG and its entities that restrict their availability for use
Registered shareholders by country
As of December 31, 2016 Shareholders in % Shares in %
Belgium 0.14 4.08
France 2.37 0.49
Germany 5.27 2.00
Japan 0.16 0.73
Switzerland 1 88.60 42.53
United Kingdom 0.47 23.43
United States 0.31 23.93
Other countries 2.68 2.81
total 100.00 100.00
Registered shares held by nominees are shown in the country where the company/affiliate entered in the Novartis Share Register as shareholder has its registered seat.1 Excluding 4.5% of the share capital held as treasury shares by Novartis AG and its
entities that restrict their availability for use
Shareholder rightsShareholders have the right to receive dividends, to vote and to execute all other rights as granted under Swiss law and the Articles of Incorporation.
rIgHt to vote Each Novartis share registered with the right to vote enti-tles the holder to one vote at General Meetings of Share-holders (General Meetings). Novartis shares can only be voted if they are registered with voting rights in the Novartis Share Register by the third business day before the General Meeting (for shareholder registration and voting restrictions, see page 84).
ADR holders may vote by instructing JPMorgan Chase Bank, the ADS depositary, to exercise the voting rights attached to the registered Novartis shares under-lying the ADRs. JPMorgan Chase Bank exercises the voting rights for registered Novartis shares underlying ADRs for which no voting instructions have been given by providing a discretionary proxy to an uninstructed independent designee. Such designee has to be a Novartis AG shareholder.
poWerS oF generaL MeetIngS oF SHareHoLDerSThe following powers are vested exclusively in the Gen-eral Meeting:— Adoption and amendment of the Articles of Incorpo-
ration— Election and removal of the Chairman of the Board,
Board and Compensation Committee members, the Independent Proxy and external auditors
— Approval of the management report (if required) and of the consolidated financial statements
— Approval of the financial statements of Novartis AG, and decision on the appropriation of available earn-ings shown on the balance sheet, including dividends
— Approval of the maximum aggregate amounts of com-pensation of the Board (for the period from an AGM until the next AGM) and of the Executive Committee (for the financial year following the AGM)
— Grant of discharge to Board and Executive Commit-tee members
— Decision of other matters that are reserved by law or by the Articles of Incorporation to the General Meet-ing of Shareholders
reSoLUtIonS anD eLeCtIonS at generaL MeetIngSThe General Meeting passes resolutions and elections with the absolute majority of the votes represented at the meeting. However, under the Articles of Incorpora-tion (www.novartis.com/ corporate-governance), the approval of two-thirds of the votes represented at the meeting is required for: — An alteration of the purpose of Novartis AG— The creation of shares with increased voting powers— An implementation of restrictions on the transfer of
registered shares, and the removal of such restric-tions

84 | Novartis Annual Report 2016
— An authorized or conditional increase of the share capital
— An increase of the share capital out of equity, by con-tribution in kind, for the purpose of an acquisition of property or the grant of special rights
— A restriction or suspension of rights or options to sub-scribe
— A change of location of the registered office of Novartis AG
— The dissolution of Novartis AG
In addition, the law provides for a qualified majority for other resolutions, such as a merger or spin-off.
otHer SHareHoLDer rIgHtSShareholders representing at least 10% of the Novartis share capital may request that an extraordinary General Meeting be convened. Shareholders representing Novartis shares with an aggregate nominal value of at least CHF 1 million may request that an item be included in a General Meeting agenda. Such requests must be made in writing at least 45 days before the meeting, specify the agenda item to be included, and contain the proposal on which the shareholder requests a vote.
Shareholders can vote their Novartis shares by them-selves or appoint another shareholder or the Indepen-dent Proxy to vote on their behalf. All shareholders (who are not yet registered on the online platform; see below) receive a General Meeting invitation letter with a proxy appointment form for the appointment of the Indepen-dent Proxy. On this form, shareholders can instruct the Independent Proxy to vote on alternative or additional motions related to the agenda items either (i) according to the motions of the Board for such alternative or addi-tional motions, or (ii) against such alternative or addi-tional motions. They can also abstain from voting.
Novartis AG offers shareholders the opportunity to use an online platform (the Sherpany Platform) to receive notices of future General Meetings exclusively by email and to electronically give their instructions to the Inde-pendent Proxy, grant powers of attorney to other share-holders, and order their admission cards online. The General Meeting registration form enables shareholders who are not yet registered on the Sherpany Platform to order detailed documents related to opening a Sherpany account. They may also do so by contacting the Novartis Share Registry. Shareholders can deactivate their online account at any time and again receive invitations in paper form.
Other rights associated with a registered Novartis share may only be exercised by the shareholder, its legal representative, another shareholder with the right to vote, the Independent Proxy, an usufructuary (a person who is not the owner of the share but who is entitled to exercise shareholder rights), or a nominee who is regis-tered in the Novartis Share Register.
Shareholder registrationOnly shareholders, usufructuaries or nominees regis-tered in the Novartis Share Register with voting rights may exercise their voting rights. To be registered with voting rights, a shareholder must declare that he or she acquired the shares in his or her own name and for his or her own account. According to the Articles of Incor-poration, the Board may register nominees with the right to vote. For restrictions on the registration of nominees, please see below.
The Articles of Incorporation provide that no share-holder shall be registered with the right to vote for more than 2% of the registered share capital. The Board may, upon request, grant an exemption from this restriction. Considerations include whether the shareholder sup-ports the Novartis goal of creating sustainable value and has a long-term investment horizon. In 2016, the Board approved an exemption requested by UBS Fund Man-agement (Switzerland) AG based on the fulfilment of the requirements as disclosed above. Further exemptions are in force for the registered significant shareholders listed on page 82 under Our Shareholders – Significant Shareholders, and for Norges Bank (Central Bank of Nor-way), Oslo, which as of December 31, 2016, was not reg-istered in the share register but according to disclosure notification filed with Novartis AG, held 2.02% of the share capital of Novartis AG.
The same registration and voting restrictions indi-rectly apply to holders of ADRs.
Given that shareholder representation at General Meetings traditionally has been rather low in Switzerland, Novartis AG considers registration restrictions neces-sary to prevent a minority shareholder from dominating a General Meeting.
The Articles of Incorporation provide that no nomi-nee shall be regis tered with the right to vote for more than 0.5% of the registered share capital. The Board may, upon request, grant an exemption from this restriction if the nominee discloses the names, addresses and num-ber of shares of the individuals for whose account it holds 0.5% or more of the registered share capital. Exemptions are in force for the nominees listed on page 82 under Our Shareholders – Significant Shareholders, and for the nominee Citi Bank, London, which in 2015 requested an exemption, but as of December 31, 2016, was not reg-istered in the Novartis Share Register.
The same restrictions indirectly apply to holders of ADRs.
Registration restrictions in the Articles of Incorpora-tion may only be removed through a resolution of the General Meeting, with approval of at least two-thirds of the votes represented at the meeting.
Shareholders, ADR holders, or nominees who are linked to each other or who act in concert to circumvent registration restrictions are treated as one person or nominee for the purposes of the restrictions on registra-tion.

Novartis Annual Report 2016 | 85Corporate governanCeour shares and our shareholders
No restrictions on trading of sharesNo restrictions are imposed on the transferability of Novartis shares. The registration of shareholders in the Novartis Share Register or in the ADR register kept by JPMorgan Chase Bank does not affect the tradability of Novartis shares or ADRs. Registered Novartis sharehold-ers or ADR holders may therefore purchase or sell their Novartis shares or ADRs at any time, including before a General Meeting, regardless of the record date. The record date serves only to determine the right to vote at a General Meeting.
Change-of-control provisionsno optIng Up, no optIng oUtAccording to the Swiss Federal Act on Financial Infra-structures, anyone who – directly, indirectly or acting in concert with third parties – acquires equity securities exceeding 33 1/3% of the voting rights of a company (whether or not such rights are exercisable) is required to make an offer to acquire all listed equity securities of that company. A company may raise this threshold up to 49% of the voting rights (“opting up”) or may, under cer-tain circumstances, waive the threshold (“opting out”). Novartis AG has not adopted any such measures.
CHange-oF-ControL CLaUSeSIn accordance with good corporate governance and the rules of the Ordinance against Excessive Compensation in Listed Companies, there are no change-of-control clauses and “golden parachute” agreements benefiting Board members, Executive Committee members, or other members of senior management. Furthermore, employment contracts with Executive Committee mem-bers do not contain notice periods or contract periods exceeding 12 months, or commissions for the acquisition or transfer of enterprises or severance payments.
General compensation provisionsnon-eXeCUtIve MeMBerS oF tHe BoarD oF DIreCtorSCompensation of non-executive members of the Board includes fixed compensation elements only. In particu-lar, non-executive members of the Board shall receive no company contributions to any pension plan, no per-formance-related elements, and no financial instruments (e.g., options).
MeMBerS oF tHe eXeCUtIve CoMMItteeThe members of the Executive Committee receive fixed and variable, performance-related compensation. Fixed compensation is comprised of the base salary and may include other elements and benefits such as contribu-tions to pension plans. Variable compensation may be structured into short-term and long-term compensation elements. Short-term variable compensation elements shall be governed by performance metrics that take into account the performance of Novartis and/or parts thereof, and/or individual targets. Achievements are gen-erally measured based on the one-year period to which the short-term compensation relates. The long-term compensation plans are based on performance metrics that take into account strategic objectives of Novartis (such as financial, innovation, shareholder return and/or other metrics). Achievements are generally measured based on a period of not less than three years.
aDDItIonaL aMoUntIf the maximum aggregate amount of compensation already approved by the General Meeting is not sufficient to cover the compensation of newly appointed or pro-moted Executive Committee members, Novartis may pay out compensation, in a total amount up to 40% of the total maximum aggregate amount last approved for the Executive Committee per compensation period, to newly appointed or promoted Executive Committee members.
For detailed information on the compensation of the Board and the Executive Committee, see the Compen-sation Report, beginning on page 110.

Composition of the Board of Directors and its committees (as per December 31, 2016)
Board of Directors
Chairman: J. Reinhardt vice Chairman: E. Vanni
N. Andrews D. Azar T. Buechner S. Datar E. Doherty
A. Fudge P. Landolt A. von Planta C. Sawyers W. Winters
audit and Compliance Committee
Compensation Committee
S. Datar (Chairman) D. Azar E. Doherty A. von Planta E. Vanni
E. Vanni (Chairman) S. Datar A. Fudge W. Winters
A. von Planta (Chairman) A. Fudge P. Landolt C. Sawyers E. Vanni
J. Reinhardt (Chairman) N. Andrews D. Azar C. Sawyers
A. von Planta (Chairman) N. Andrews S. Datar A. Fudge
governance, nominat ion and Corporate respons-ibilities Committee
research & Development Committee
risk Committee
86 | Novartis Annual Report 2016
Our Board of Directors
Election and term of office
Board members, the Chairman, and Compensation Com-mittee members are elected annually and individually by shareholders at the General Meeting. Board members whose term of office has expired are immediately eligi-ble for re-election.
The average tenure of Board members is seven years, with two-thirds of Board members having a tenure of less than six years. A Board member must retire after reach-
ing age 70. Under special circumstances, shareholders may grant an exemption from this rule and re-elect a Board member for additional terms of office. There is no mandatory term limit for Board members so as to not lose the value of the insight and knowledge of the com-pany’s operations and practices that long-serving Board members have developed.
First election Last election End ofName Nationality Year of birth at AGM at AGM current term
Joerg Reinhardt, Ph.D. D 1956 2013 2016 2017
Enrico Vanni, Ph.D. CH 1951 2011 2016 2017
Nancy C. Andrews, M.D., Ph.D. US 1958 2015 2016 2017
Dimitri Azar, M.D. US 1959 2012 2016 2017
Ton Buechner NLD 1965 2016 2016 2017
Srikant Datar, Ph.D. US 1953 2003 2016 2017
Elizabeth Doherty GB 1957 2016 2016 2017
Ann Fudge US 1951 2008 2016 2017
Pierre Landolt, Ph.D. CH 1947 1996 2016 2017
Andreas von Planta, Ph.D. CH 1955 2006 2016 2017
Charles L. Sawyers, M.D. US 1959 2013 2016 2017
William T. Winters GB/US 1961 2013 2016 2017

Background/experience
MEDICINE/HEALTHCARE/R&D
26 %
FINANCE/ACCOUNTING
21 %
MARKETING
5 %LAW
11 %
ENGINEERING/TECHNOLOGY
11 %
LEADERSHIP MANAGEMENT
26 %
Diversity
gender
FEMALE
25 %
MALE
75 %
age
55–60
42 %
>66
8 %
61–65
42 %
<55
8 %
tenure
3–6 Y
42 %
>9 Y
25 %
7–9 Y
8 %
<3 Y
25 %
DUTCH
8 %
GERMAN
8 %
SWISS
25 %
nationality
AMERICAN
42 %
BRITISH
17 %
Novartis Annual Report 2016 | 87Corporate governanCeour Board of Directors
Board profile
Board compositionThe composition of the Board must align with our status as a listed company as well as our business portfolio, geographic reach and culture. The Board must be diverse in all aspects. Knowledge and experience in the follow-ing fields must be represented on the Board: leadership and management; healthcare, life sciences and medi-cine; research and development; engineering and tech-nology; marketing; banking, finance and accounting; human resources; legal and public affairs; and risk man-agement.
Individual Board member profileBoard members should have the following personal qual-ities: — Interact with other Board members to build an effec-
tive and complementary Board— Establish trusting relationships — Apply independence of thought and judgment— Be challenging but supportive in the boardroom — Influence without creating conflict by applying a con-
structive, non-confrontational style— Listen well and offer advice based on sound judgment — Be able and willing to commit adequate time to Board
and committee responsibilities
— Be open to personal feedback and seek to be respon-sive
— Do not have existing board memberships or hold other positions that could lead to a permanent conflict of interest
— Understand and respect the boundaries of the role, leaving the operational management of the company to the CEO and his Executive Committee
Board members’ biographies (pages 94–97) highlight the specific qualifications that led the Board to conclude members are qualified to serve on the Board, which is diverse in terms of background, credentials, interests and skills.
Board diversity
The diversity of a board of directors is critical to its effec-tiveness. When the Governance, Nomination and Cor-porate Responsibilities Committee (GNCRC) of Novartis identifies new Board member candidates to be proposed to shareholders for election, the maintenance and improvement of the Board’s diversity is an important cri-terion. The Board’s aspiration is to have a diverse Board in all aspects. This includes nationality, gender, back-ground and experience, age, tenure, viewpoints, inter-ests, and technical and interpersonal skills.

88 | Novartis Annual Report 2016
Role of the Board and its committees
The Board is responsible for the overall direction and supervision of management, and holds the ultimate deci-sion-making authority for Novartis AG, with the excep-tion of decisions reserved for shareholders.
The Board has delegated certain responsibilities to five committees, as set out below. Responsibilities described with the terms “overseeing” or “reviewing” are
subject to final Board approval. The committees enable the Board to work in an efficient and effective manner, ensuring a thorough review and discussion of issues, while giving the Board more time for deliberation and decision-making. Moreover, committees ensure that only Board members who are independent oversee audit and compliance, governance and compensation – as only independent Board members are delegated in the respective committees.
Number of meetings held in 2016/approximate average duration (hrs) of Documents/Responsibilities Members each meeting/attendance Link
Board of Directors 11/7:00
The primary responsibilities of the Board of Directors include: Joerg reinhardt1 11 Articles of Incorporation — Setting the strategic direction of the Group Enrico Vanni 11 of Novartis AG — Appointing, overseeing and dismissing key executives, and planning
Nancy C. Andrews 11
their succession Dimitri Azar 11
Regulations of the — Approving major transactions and investments
Ton Buechner3 7
Board of Directors, — Determining the organizational structure and governance of the Group
Srikant Datar 11
its Committees and the — Determining and overseeing financial planning, accounting,
Elizabeth Doherty3 8
Executive Committee reporting and controlling
Ann Fudge 11
of Novartis AG — Approving annual financial statements and corresponding
Pierre Landolt 11
(Board regulations) financial results releases
Andreas von Planta 11
Charles L. Sawyers 9
www.novartis.com/
William T. Winters 10
corporate-governance
audit and Compliance Committee 7/3:00
The primary responsibilities of this committee include: Srikant Datar1,2 7 Charter of the Audit and — Supervising external auditors, and selecting and nominating Dimitri Azar 7 Compliance Committee external auditors for election by the meeting of shareholders
Elizabeth Doherty2,3 5
— Overseeing internal auditors Andreas von Planta 7
www.novartis.com/— Overseeing accounting policies, financial controls, and
Enrico Vanni 7
corporate-governance compliance with accounting and internal control standards
— Approving quarterly financial statements and financial results releases
— Overseeing internal control and compliance processes and procedures
— Overseeing compliance with laws, and external and internal regulations
The Audit and Compliance Committee has the authority to retain
external consultants and other advisors.
Compensation Committee 6/3:00
The primary responsibilities of this committee include: enrico vanni1 6 Charter of the — Designing, reviewing and recommending to the Board compensation Srikant Datar 6 Compensation policies and programs
Ann Fudge 6 Committee
— Advising the Board on the compensation of Board members William T. Winters 6
and the CEO
www.novartis.com/— Deciding on the compensation of Executive Committee members
corporate-governance— Preparing the Compensation Report and submitting it to the Board
for approval
The Compensation Committee has the authority to retain external
consultants and other advisors.
1 Chairman2 Audit Committee Financial Expert as defined by the US Securities and Exchange Commission3 As of AGM February 2016

Novartis Annual Report 2016 | 89Corporate governanCeour Board of Directors
Number of meetings held in 2016/approximate average duration (hrs) of Documents/Responsibilities Members each meeting/attendance Link
governance, nomination and Corporate responsibilities Committee 3/2:00
The primary responsibilities of this committee include: andreas von planta1 3 Charter of the — Designing, reviewing and recommending to the Board corporate Ann Fudge 3 Governance, Nomination governance principles
Pierre Landolt 3 and Corporate
— Identifying candidates for election as Board members Charles L. Sawyers 3
Responsibilities — Assessing existing Board members and recommending to the Board
Enrico Vanni 3
Committee whether they should stand for re-election
— Preparing and reviewing the succession plan for the CEO
www.novartis.com/— Developing and reviewing an onboarding program for new Board
corporate-governance members, and an ongoing education plan for existing Board members
— Reviewing on a regular basis the Articles of Incorporation, with a view
to reinforcing shareholder rights
— Reviewing on a regular basis the composition and size of the Board
and its committees — Reviewing annually the independence status of each Board member — Reviewing directorships and agreements of Board members for conflicts of interest, and dealing with conflicts of interest — Overseeing the company’s strategy and governance on corporate responsibility The Governance, Nomination and Corporate Responsibilities Committee has the authority to retain external consultants and other advisors.
research & Development Committee 4/8:00
The primary responsibilities of this committee include: Joerg reinhardt1 4 Charter of the — Monitoring research and development, and bringing recommendations Nancy C. Andrews 4 Research & Development to the Board
Dimitri Azar 4 Committee
— Assisting the Board with oversight and evaluation related to Charles L. Sawyers 4
research and development
www.novartis.com/— Informing the Board on a periodic basis about the research and
corporate-governance development strategy, the effectiveness and competitiveness of the
research and development function, emerging scientific trends and
activities critical to the success of research and development,
and the pipeline
— Advising the Board on scientific, technological, and research
and development matters
— Providing counsel and know-how to management in the area of research and development — Reviewing such other matters in relation to the company’s research and development as the committee may, in its own discretion, deem desirable in connection with its responsibilities The Research & Development Committee has the authority to retain external consultants and other advisors.
risk Committee 6/2:00
The primary responsibilities of this committee include: andreas von planta1 6 Charter of the — Ensuring that Novartis has implemented an appropriate and effective Nancy C. Andrews 5 Risk Committee risk management system and process
Srikant Datar 6
— Ensuring that all necessary steps are taken to foster a culture Ann Fudge 6
www.novartis.com/ of risk-adjusted decision-making without constraining reasonable
corporate-governance risk-taking and innovation
— Approving guidelines and reviewing policies and processes
— Reviewing with management, internal auditors and external auditors
the identification, prioritization and management of risks; the
accountabilities and roles of the functions involved in risk
management; the risk portfolio; and the related actions implemented
by management
The Risk Committee has the authority to retain external consultants and other advisors.
1 Chairman

90 | Novartis Annual Report 2016
The Novartis corporate culture and role of the Board
The corporate culture of Novartis is becoming a key focus of the Board. The Board works to ensure that the Novartis strategy, operating model and compensation system are aligned with Novartis’ Values and Behaviors, as endorsed by the Board and that the Novartis com-pensation system supports the desired corporate cul-ture of Novartis. The Board will also review a regular eval-uation of the corporate culture throughout Novartis.
Functioning of the Board
The Board takes decisions as a whole, supported by its five committees. Each committee has a written charter outlining its duties and responsibilities, and is led by a Board-elected Chairman.
The Board and its committees meet regularly through-out the year. The chairs set their meeting agendas. Any Board member may request a Board or committee meet-ing, and the inclusion of an agenda item. Before meet-ings, Board members receive materials to help them pre-pare the discussions and decision-making.
Chairman
Joerg Reinhardt has been the independent, non-execu-tive Chairman since August 1, 2013. He has both indus-try and Novartis experience, and meets the company’s independence criteria. As independent Chairman, he can lead the Board to represent the interests of all stake-holders, being accountable to them and creating sus-tainable value through effective governance, the right strategy, and delivery of the expected level of perfor-mance. The independent chairmanship also ensures an appropriate balance of power between the Board and the Executive Committee.
In this role, Mr. Reinhardt:— Provides leadership to the Board— Supports and mentors the CEO— Supported by the GNCRC, ensures effective succes-
sion plans for the Board and the Executive Committee — Ensures that the Board and its committees work
effectively— Sets the agenda, style and tone of Board discussions,
promoting constructive dialogue and effective deci-sion-making
— Supported by the GNCRC, ensures that all Board committees are properly established, composed and operated
— Ensures that the Board’s performance is annually evaluated
— Ensures onboarding programs for new Board mem-bers, and continuing education and specialization for all Board members
— Ensures effective communication with the company’s shareholders
— Promotes effective relationships and communication between Board and Executive Committee members
Vice Chairman
Enrico Vanni has been the independent, non-executive Vice Chairman since February 22, 2013.
In this role, Mr. Vanni:— Leads the Board in case and as long as the Chairman
is incapacitated— Chairs the sessions of independent Board members,
and leads independent Board members if and as long as the Chairman is not independent
— Leads the yearly session of the Board members eval-uating the performance of the Chairman, during which the Chairman is not present
Board meetings
The Board has meetings with Executive Committee members, as well as private meetings without them.
In 2016, there were 11 Board meetings. Because all Board members are independent, no separate meetings of the independent Board members were held in 2016.
Key activities of our Board and committees in 2016
In 2016, the Board addressed in its meetings among oth-ers the following key standard topics: strategy; Group targets; mergers and acquisitions, business develop-ment and licensing review; financial and business reviews; major projects; investments and transactions; gover-nance; and corporate culture. Topics addressed during private meetings included Board self-evaluation and the performance assessment of the Executive Committee members, as well as CEO and Executive Committee suc-cession planning.
In addition, in 2016 our Board and its committees focused on a number of special topics, including:
Board of Directors:Compliance; the Alcon turnaround; the creation of the new Innovative Medicines Division with two separate business units, Pharmaceuticals and Oncology; and the new operating model of Novartis
Audit and Compliance Committee:Specific accounting and compliance questions, compen-sation disclosure; and the legal and regulatory environ-ment concerning the rotation of external auditors

Novartis Annual Report 2016 | 91Corporate governanCeour Board of Directors
Compensation Committee:Novartis peer groups; potential risks within the compen-sation systems for executives and other associates, including the sales force; clawback and malus; and shareholder feedback from the corporate governance roadshow
Governance, Nomination and Corporate Responsibilities Committee:Shareholder feedback from our corporate governance roadshow; emerging corporate governance practices and whether to adopt them; succession planning for the Board, Board committees, and committee chairs; the search profile for and discussion of potential new Board members; and reviews of our corporate responsibility activities
Research & Development Committee:The Novartis portfolio of research and development proj-ects in oncology and dermatology; efforts to discover new drug discovery targets; high throughput screening for target and drug discovery; the long term strategy for NIBR after the appointment of new leadership; and incentives and compensation-related topics for the R&D organization
Risk Committee:The Novartis Integrity & Compliance organization, key business risks in the manufacturing organization; foreign exchange risk management; IT security; and risks poten-tially arising out of the compensation system
Honorary Chairmen
Dr. Alex Krauer and Dr. Daniel Vasella have been appointed Honorary Chairmen in recognition of their sig-nificant achievements on behalf of Novartis. They are not provided with Board documents and do not attend Board meetings.
Independence of Board members
The independence of Board members is a key corporate governance issue. An independent Board member is one who is independent of management and has no business or relationship that could materially interfere with the exercise of objective, unfettered and independent judg-ment. Only with a majority of Board members being inde-pendent can the Board fulfill its obligation to represent the interests of shareholders, being accountable to them and creating sustainable value through the effective gov-ernance of Novartis. Accordingly, Novartis established independence criteria based on international best prac-tice standards as outlined on the Novartis website:www.novartis.com/investors/governance-documents.shtml.
— The majority of Board members and any member of the Audit and Compliance Committee, the Compen-sation Committee, and the GNCRC must meet the company’s independence criteria. These include, inter alia, (i) a Board member not having received direct compensation of more than USD 120 000 per year from Novartis, except for dividends or Board compensation, within the last three years; (ii) a Board member not having been an employee of Novartis within the last three years; (iii) a family member not having been an executive officer of Novartis within the last three years; (iv) a Board member or family member not being employed by the external auditor of Novartis; (v) a Board member or family member not being a board member, employee or 10% shareholder of an enterprise that has made payments to, or received payments from, Novartis in excess of the greater of USD 1 million or 2% of that enterprise’s gross revenues. For members of the Audit and Com-pliance Committee and the Compensation Commit-tee, even stricter rules apply.
— In addition, Board members are bound by the Novartis Conflict of Interest Policy, which prevents a Board member’s potential personal interests from influenc-ing the decision-making of the Board.
— The GNCRC annually submits to the Board a proposal concerning the determination of the independence of each Board member. For this assessment, the com-mittee considers all relevant facts and circumstances of which it is aware – not only the explicit formal inde-pendence criteria. This includes an assessment of whether a Board member is truly independent, in character and judgment, from any member of senior management and from any of his/her current or for-mer colleagues.
— In its meeting on December 15, 2016, the Board deter-mined that all of its members are independent.
Relationship of non-executive Board members with Novartis
No Board member is or was a member of the manage-ment of Novartis AG or of any other Novartis Group com-pany in the last three financial years up to December 31, 2016. There are no significant business relationships of any Board member with Novartis AG or with any other Novartis Group company.
Mandates outside the Novartis Group
No Board member may hold more than 10 additional man-dates in other companies, of which no more than four shall be in other listed companies. Chairmanships of the boards of directors of other listed companies count as two mandates. Each of these mandates is subject to Board approval.

92 | Novartis Annual Report 2016
The following mandates are not subject to these lim-itations:a) Mandates in companies that are controlled by
Novartis AGb) Mandates that a Board member holds at the request
of Novartis AG or companies controlled by it. No Board member shall hold more than five such man-dates.
c) Mandates in associations, charitable organizations, foundations, trusts and employee welfare founda-tions. No Board member may hold more than 10 such mandates.
“Mandates” means those in the supreme governing body of a legal entity that is required to be registered in the commercial register or a comparable foreign register. Mandates in different legal entities that are under joint control are deemed one mandate.
The Board may issue regulations that determine addi-tional restrictions, taking into account the position of the respective member.
Loans and credits
No loans or credits shall be granted to members of the Board.
Board performance and effectiveness evaluation
ProcessThe Board conducts an annual review to evaluate its per-formance and that of individual committees and mem-bers. As part of this process, each Board member com-pletes a questionnaire on the performance and effectiveness of the Board and the Chairman, and on his/her committees, which lays the groundwork for a qualitative review led by the Chairman. The Chairman has discussions with each Board member, and then with the entire Board. Also, the Board, without its Chairman, discusses the performance of the Chairman. Further, the committee evaluations are discussed by the respective committees, and the results are debriefed to the Board. Any suggestion for improvement is recorded and actions are agreed upon.
Periodically, this process is conducted by an inde-pendent consultant. In 2014, an independent perfor-mance and effectiveness evaluation of the Board and its committees, including an individual Board member assessment, was conducted by the independent expert company Russell Reynolds Associates. In 2015 and 2016, the performance evaluation was conducted internally.
Content and resultsThe performance review examines the performance and effectiveness, and strengths and weaknesses, of indi-vidual Board members and of the full Board and each Board committee.
This review covers topics including Board composi-tion; purpose, scope and responsibilities; processes and governance of the Board and its committees; meetings and pre-reading material; team effectiveness; and lead-ership and culture.
The review also evaluates the ability and willingness of each Board member to commit adequate time and effort to his/her responsibilities as provided for in the charter of the GNCRC.
The results were discussed at the January 2017 meetings. It was concluded that the Board and its com-mittees operate effectively.
Information and control systems of the Board vis-à-vis management
Information on managementThe Board ensures that it receives sufficient information from the Executive Committee to perform its supervi-sory duty and to make decisions that are reserved for it. The Board obtains this information through several means:— The CEO informs the Board regularly about current
developments.— Executive Committee meeting minutes are made
available to the Board.— Meetings or teleconferences are held as required
between Board members and the CEO.— The Board regularly meets with all Executive Com-
mittee members.— The Board receives detailed, quarterly updates from
each Division Head.— By invitation, other members of management attend
Board meetings to report on areas of the business for which they are responsible.
— Board members are entitled to request information from Executive Committee members or any other Novartis associate, and they may visit any Novartis site.
Board committees Board committees regularly meet with management and, at times, outside consultants, to review the business, bet-ter understand applicable laws and policies affecting the Group, and support the Board and management in meet-ing the requirements and expectations of stakeholders and shareholders.
In particular, the Chief Financial Officer (CFO), the Group General Counsel, and representatives of the external auditors are invited to Audit and Compliance

Novartis Annual Report 2016 | 93Corporate governanCeour Board of Directors
Committee meetings. Additionally, the heads of Internal Audit, Financial Reporting & Accounting, Compliance and Quality, as well as the Head of the Global Business Practices Office, report on a regular basis to the Audit and Compliance Committee. This committee reviews financial reporting processes on behalf of the Board. For each quarterly and annual release of financial informa-tion, the Disclosure Review Committee is responsible for ensuring the accuracy and completeness of disclosures. The Disclosure Review Committee, which is a manage-ment committee, is chaired by the CFO and includes the CEO; the Group General Counsel; the heads of the divi-sions, Novartis Operations, and the Novartis Institutes for BioMedical Research (NIBR), as well as their finance heads; and the heads of the following corporate func-tions: Treasury, Tax, Financial Reporting & Accounting, Internal Audit and Investor Relations. The Audit and Compliance Committee reviews decisions made by the Disclosure Review Committee before the quarterly and annual releases are published.
The Risk Committee oversees the risk management system and processes, and also reviews the risk portfo-lio of the Group to ensure appropriate and professional risk management. For this purpose, the Group Risk Office and the risk owners of the divisions report on a regular basis to the Risk Committee. The Group General Counsel, the Head of Group Risk, the Head of Internal Audit, the Head of Ethics and Compliance, and other senior executives are invited to these meetings on a reg-ular basis.
Novartis management information system Novartis produces comprehensive, consolidated (unau-dited) financial statements on a monthly basis for the total Group and its operating divisions. These are typi-cally available within 10 days of the end of the month, and include the following:— Consolidated income statement of the month, quar-
ter-to-date and year-to-date in accordance with Inter-national Financial Reporting Standards (IFRS), as well as adjustments to arrive at core results, as defined by Novartis. The IFRS and core figures are compared to the prior-year period and targets in both USD and on a constant currency basis.
— Consolidated balance sheet as of the month-end in accordance with IFRS in USD
— Consolidated cash flow on a monthly, quarter-to-date and year-to-date basis in accordance with IFRS in USD
— Supplementary data on a monthly, quarterly and year-to-date basis such as free cash flow, gross and net debt, headcount, personnel costs, working capital, and earnings per share on a USD basis where appli-cable
Constant currencies, core results, free cash flow, net debt and related target figures are non-IFRS measures. An explanation of non-IFRS measures can be found on pages 171 – 175 of the operating and financial review 2016.This information is made available to Board members on a monthly basis. An analysis of key deviations from the prior year or target is also provided.
Two times per year, the Board also receives an out-look of the full-year results in accordance with IFRS and “core” (as defined by Novartis) along with related com-mentary prior to the release of the results.
On an annual basis, in the fourth quarter of the year, the Board receives and approves the operating and financial targets for the following year.
In the middle of the year, the Board also reviews and approves the strategic plan for the next five years, which includes a projected consolidated income statement in USD prepared in accordance with IFRS and “core.”
The Board does not have direct access to the com-pany’s financial and management reporting systems but can, at any time, request more detailed financial infor-mation on any aspect that is presented to it.
Internal auditThe Internal Audit function carries out operational and system audits in accordance with an audit plan approved by the Audit and Compliance Committee. This function helps organizational units accomplish objectives by pro-viding an independent approach to the evaluation, improvement and effectiveness of their internal control framework. It prepares reports on the audits it has per-formed, and reports actual or suspected irregularities to the Audit and Compliance Committee and to the CEO. The Audit and Compliance Committee regularly reviews the internal audit scope, audit plans and results.
Risk managementThe Group Risk Office is overseen by the Board’s inde-pendent Risk Committee. The Compensation Commit-tee works closely with the Risk Committee to ensure that the compensation system does not lead to excessive risk-taking by management (for details, see our Compen-sation Report, beginning on page 110).
Organizational and process measures have been designed to identify and mitigate risks at an early stage. Organizationally, the responsibility for risk assessment and management is allocated to the divisions, organiza-tional units, and functions, with specialized Corporate functions, such as Group Finance, Group Legal, Group Quality Assurance, Corporate Health, Safety and Envi-ronment, Business Continuity Management, Integrity and Compliance and the Business Practices Office, provid-ing support and controlling the effectiveness of the risk management in these respective areas.

94 | Novartis Annual Report 2016
enrico vanni, ph.D.Vice Chairman of the Board of Directors Swiss, age 65
Enrico Vanni, Ph.D., has been a member of the Board of Directors since 2011 and qualifies as an independent Non-Executive Director. He is Vice Chairman of the Board of Directors and Chairman of the Compen-sation Committee. He is also a member of the Audit and Compliance Committee and the Governance, Nomination and Corporate Responsibilities Committee.
Since his retirement as director of McKinsey & Company in 2007, Mr. Vanni has been an independent consultant. He is a board member of several companies in industries from healthcare to private banking – includ-ing Advanced Oncotherapy PLC in the United Kingdom, and non-listed companies such as Lombard Odier SA, Banque Privée BCP (Suisse) SA, Eclosion2, and Denzler & Partners SA, all based in Switzerland.
Mr. Vanni holds an engineering degree in chemistry from the Federal Polytechnic School of Lausanne, Switzerland; a doctorate in chemistry from the University of Lausanne; and a Master of Business Administration from INSEAD in Fontaineb-leau, France. He began his career as a research engineer at the International Business Machines Corp. (IBM) in California, United States, and joined McKinsey in Zurich in 1980. He managed the Geneva office for McKinsey from 1988 to 2004, and consulted for companies in the pharmaceutical, consumer and finance sectors. He led McKinsey’s European pharmaceutical practice and served as a member of the firm’s partner review committee prior to his retirement in 2007. As an independent consultant, Mr. Vanni has continued to support leaders of pharmaceutical and biotechnology companies on core strategic challenges facing the healthcare industry.
nancy C. andrews, M.D., ph.D.Member of the Board of Directors American, age 58
Nancy C. Andrews, M.D., Ph.D., has been a member of the Board of Directors since February 2015. She qualifies as an inde-pendent Non-Executive Director and is a member of the Research & Development Committee and the Risk Committee.
Dr. Andrews is dean of the Duke University School of Medicine and vice chancellor for academic affairs at Duke University in the United States. She is also a professor of pediatrics, pharmacology and cancer biology at Duke, and was elected as a fellow of the American Association for the Advancement of Science and to membership in the US National Academy of Sciences, the National Academy of Medicine, and the American Academy of Arts and Sciences. She is former president of the American Society for Clinical Investigation and serves on the council of the National Academy of Medicine, the board of directors of the American Academy of Arts and Sciences, and the Scientific Management Review Board of the US National Institutes of Health.
Dr. Andrews holds a doctorate in biology from the Massachusetts Institute of Technology, and a doctor of medicine from Harvard Medical School, both in the US. She completed her residency and fellowship trainings in pediatrics and hematology/oncology at Boston Children’s Hospital and the Dana-Farber Cancer Institute, also in the US, and served as an attending physician at Boston Children’s Hospital. Prior to joining Duke, Dr. Andrews was director of the Harvard/MIT M.D.-Ph.D. Program, and dean of basic sciences and graduate studies as well as professor of pediatrics at Harvard Medical School. From 1993 to 2006, she was a biomedical research investigator at the Howard Hughes Medical Institute in the US. Her research expertise is in iron homeostasis and mouse models of human diseases.
Board of Directors
Joerg reinhardt, ph.D.Chairman of the Board of Directors German, age 60
Joerg Reinhardt, Ph.D., has been Chairman of the Board of Directors since 2013. He is also Chairman of the Research & Develop-ment Committee and Chairman of the Board of Trustees of the Novartis Foundation.
Mr. Reinhardt previously was chairman of the board of management and the executive committee of Bayer HealthCare, Germany. Prior to that, he was Chief Operating Officer of Novartis from 2008 to 2010, and Head of the Vaccines and Diagnostics Division of Novartis from 2006 to 2008. He was also Chairman of the Board of the Genomics Institute of the Novartis Research Founda-tion in the United States from 2000 to 2010, a member of the supervisory board of MorphoSys AG in Germany from 2001 to 2004, and a member of the board of directors of Lonza Group AG in Switzerland from 2012 to 2013.
Mr. Reinhardt graduated with a doctorate in pharmaceutical sciences from Saarland University in Germany. He joined Sandoz Pharma Ltd. in 1982 and held various positions at Sandoz and later Novartis, including Head of Development.

Novartis Annual Report 2016 | 95Corporate governanCeour Board of Directors
ton BuechnerMember of the Board of Directors Dutch, age 51
Ton Buechner has been a member of the Board of Directors since February 23, 2016. He qualifies as an independent Non-Executive Director.
Since 2012, Mr. Buechner has served as chairman and CEO of the executive board of Dutch multinational AkzoNobel. Prior to joining AkzoNobel, he spent almost two decades at the Sulzer Corporation in Switzerland, where he was appointed divisional president in 2001 and served as president and CEO from 2007 to 2011. Mr. Buechner’s early career was spent in the oil and gas construction industry, and included roles at Allseas Engineering in the Nether-lands and at Aker Kvaerner in Singapore. He is a member of the supervisory board of Voith GmbH.
Mr. Buechner is an engineer by training. He received his master’s degree in civil engineering from Delft University of Technology in the Netherlands in 1988, specializing in offshore construction technology and coastal engineering. Mr. Buechner holds a Master of Business Administration from IMD business school in Lausanne, Switzerland.
Srikant Datar, ph.D.Member of the Board of Directors American, age 63
Srikant Datar, Ph.D., has been a member of the Board of Directors since 2003 and qualifies as an independent Non-Executive Director. He is Chairman of the Audit and Compliance Committee, and a member of the Risk Committee and the Compensation Committee. The Board of Directors has appointed him as Audit Committee Financial Expert.
Mr. Datar is the Arthur Lowes Dickinson professor of business administration, faculty chair of the Harvard Innovation Lab, and senior associate dean for university affairs at Harvard Business School in the United States. He is also a member of the boards of directors of ICF International Inc., Stryker Corp. and T-Mobile US, all in the US.
Mr. Datar graduated in 1973 with distinction in mathematics and economics from the University of Bombay in India. He is a chartered accountant, and holds two master’s degrees and a doctorate from Stanford University in the US. Mr. Datar has worked as an accountant and planner in industry, and as a professor at Carnegie Mellon University, Stanford University and Harvard University, all in the US. His research interests are in the areas of cost manage-ment, measurement of productivity, new product development, innovation, time-based competition, incentives and performance evaluation. He is the author of many scientific publications and has received several academic awards and honors. Mr. Datar has also advised and worked with numerous companies in research, development and training.
Dimitri azar, M.D.Member of the Board of Directors American, age 57
Dimitri Azar, M.D., has been a member of the Board of Directors since 2012. He qualifies as an independent Non-Executive Director and is a member of the Audit and Compliance Committee and the Research & Development Committee.
Dr. Azar is dean of the College of Medicine and professor of ophthalmology, bioengi-neering and pharmacology at the University of Illinois at Chicago in the United States, where he formerly was head of the Depart-ment of Ophthalmology and Visual Sciences. He is a member of the American Ophthalmo-logical Society, former president of the Chicago Ophthalmological Society, and pres-ident-elect of the Chicago Medical Society. Additionally, he is on the board of the Tear Film and Ocular Surface Society, the board of Verb Surgical, and the scientific advisory board of Verily.
Dr. Azar began his career at the American University of Beirut Medical Center in Lebanon, and completed his fellowship and residency training at the Massachusetts Eye and Ear Infirmary at Harvard Medical School in the US. His research on matrix metallopro-teinases in corneal wound healing and angiogenesis has been funded by the US National Institutes of Health since 1993. Dr. Azar practiced at the Wilmer Eye Institute at the Johns Hopkins Hospital School of Medicine in the US, and then returned to the Massachusetts Eye and Ear Infirmary as director of cornea and external disease. He became professor of ophthalmology with tenure at Harvard Medical School in 2003. Dr. Azar holds an Executive Master of Business Administration from the University of Chicago Booth School of Business in the US.

96 | Novartis Annual Report 2016
Board of Directors (continued)
ann FudgeMember of the Board of Directors American, age 65
Ann Fudge has been a member of the Board of Directors since 2008. She qualifies as an independent Non-Executive Director and is a member of the Risk Committee; the Compensation Committee; and the Gover-nance, Nomination and Corporate Responsi-bilities Committee.
Ms. Fudge is vice chairman and senior independent director of Unilever NV, London and Rotterdam. She is also chair of the United States Program Advisory Panel of the Bill & Melinda Gates Foundation, a director of Northrop Grumman Corporation in the US, and a trustee of Boston-based WGBH public media.
Ms. Fudge received her bachelor’s degree from Simmons College in the US and her Master of Business Administration from Harvard Business School, also in the US. She is former chairman and CEO of Young & Rubicam Brands, New York. Before that, she served as president of the Beverages, Desserts and Post Division of Kraft Foods Inc. in the US.
pierre Landolt, ph.D.Member of the Board of Directors Swiss, age 69
Pierre Landolt, Ph.D., has been a member of the Board of Directors since 1996. He qualifies as an independent Non-Executive Director and is a member of the Governance, Nomination and Corporate Responsibilities Committee.
Mr. Landolt is chairman of the Sandoz Family Foundation, overseeing its development in several investment fields. He is also chairman of the Swiss private bank Landolt & Cie SA. In Switzerland, he is chairman of Emasan AG and Vaucher Manufacture Fleurier SA, and vice chairman of Parmigiani Fleurier SA. Additionally, he is vice chairman of the Montreux Jazz Festival Foundation and a board member of Amazentis SA, Switzerland, and the Eneas Fund, Cayman Islands. In Brazil, Mr. Landolt is president of AxialPar Ltda. and Moco Agropecuaria Ltda., the Instituto Fazenda Tamanduá and the Instituto Estrela de Fomento ao Microcrédito.
Mr. Landolt graduated with a bachelor’s degree in law from the University of Paris-Assas. From 1974 to 1976, he worked for Sandoz Brazil. In 1977, he acquired an agricultural estate in the semi-arid Northeast Region of Brazil, and within several years he converted it into a model farm in organic and biodynamic production. Since 1997, Mr. Landolt has been associate and chairman of AxialPar Ltda., Brazil, an investment company focused on sustainable develop-ment. In 2000, he co-founded Eco-Carbone SAS, a company active in the design and development of carbon sequestration pro cesses. In 2007, he co-founded Amazentis SA, a startup company active in the convergence space of medication and nutrition. In 2011, Mr. Landolt received the title of Docteur des Sciences Économiques Honoris Causa from the University of Lausanne in Switzerland.
elizabeth (Liz) DohertyMember of the Board of Directors British, age 59
Elizabeth (Liz) Doherty has been a member of the Board of Directors since February 23, 2016. She qualifies as an independent Non-Executive Director and is a member of the Audit and Compliance Committee. The Board of Directors has appointed her as Audit Committee Financial Expert.
Ms. Doherty is a non-executive director and chairman of the audit committee of Dunelm Group PLC in the United Kingdom, and a member of the supervisory board and audit committee of Corbion NV in the Netherlands. She is a fellow of the Chartered Institute of Management Accountants, a non-executive board member of the UK Ministry of Justice, and a non-executive board member of Her Majesty’s Courts and Tribunals Service in the UK. She previously served as a non- executive director and audit committee member at Delhaize Group in Belgium and Nokia Corp. in Finland, and as a non-executive director at SABMiller PLC in the UK.
Ms. Doherty received her bachelor’s degree in liberal studies in science (physics) from the University of Manchester in the UK. She began her career as an auditor and has held senior finance and accounting roles at Unilever PLC and Tesco PLC. Additionally, she was chief financial officer of both Brambles Ltd. and Reckitt Benckiser Group PLC.

Novartis Annual Report 2016 | 97Corporate governanCeour Board of Directors
Charles L. Sawyers, M.D.Member of the Board of Directors American, age 57
Charles L. Sawyers, M.D., has been a member of the Board of Directors since 2013. He qualifies as an independent Non-Executive Director and is a member of the Research & Development Committee and the Governance, Nomination and Corporate Responsibilities Committee.
In the United States, Dr. Sawyers is chair of the Human Oncology and Pathogenesis Program at Memorial Sloan Kettering Cancer Center, professor of medicine and of cell and developmental biology at the Weill Cornell Graduate School of Medical Sciences, and an investigator at the Howard Hughes Medical Institute. He was appointed to US President Barack Obama’s National Cancer Advisory Board, and is former president of the American Association for Cancer Research and of the American Society for Clinical Investigation. He is also a member of the US National Academy of Sciences, the Institute of Medicine, and the scientific advisory board of Agios Pharmaceuticals Inc. in the US.
Dr. Sawyers received his doctor of medicine from the Johns Hopkins University School of Medicine in the US, and worked at the Jonsson Comprehensive Cancer Center at the University of California, Los Angeles for nearly 18 years before joining Memorial Sloan Kettering in 2006. An internationally acclaimed cancer researcher, he co-devel-oped the Novartis cancer drug Gleevec/Glivec and has received numerous honors and awards, including the Lasker-DeBakey Clinical Medical Research Award in 2009.
William t. WintersMember of the Board of Directors British/American, age 55
William T. Winters has been a member of the Board of Directors since 2013. He qualifies as an independent Non-Executive Director and is a member of the Compensation Committee.
Mr. Winters is CEO and a board member of Standard Chartered, based in London. He also serves on the board of Colgate University in the United States, and on the boards of the International Rescue Commit-tee, the Young Vic theater and the Print Room theater in the United Kingdom.
Mr. Winters received his bachelor’s degree from Colgate University and his Master of Business Administration from the Wharton School of the University of Pennsylvania in the US. He previously ran Renshaw Bay, an alternative asset management firm, and was co-CEO of JPMorgan’s investment bank from 2003 to 2010. He joined JPMorgan in 1983 and has held management roles across several market areas and in corporate finance. Additionally, he was a commissioner on the UK Independent Commission on Banking in 2010 and 2011, and was awarded the title of Commander of the Order of the British Empire in 2013.
Honorary Chairmen
alex Krauer, ph.D.Daniel vasella, M.D.
Corporate Secretary
Charlotte pamer-Wieser, ph.D.
andreas von planta, ph.D.Member of the Board of Directors Swiss, age 61
Andreas von Planta, Ph.D., has been a member of the Board of Directors since 2006. He qualifies as an independent Non-Executive Director and is Chairman of the Risk Committee and the Governance, Nomination and Corporate Responsibilities Committee. He is also a member of the Audit and Compliance Committee.
Mr. von Planta is a board member of Helvetia Holding AG in Switzerland, and also serves on the boards of various Swiss subsidiaries of foreign companies and other non-listed Swiss companies, including Burberry (Suisse) SA, Lenz & Staehelin AG, A.P. Moller Finance SA, HSBC Private Bank (Suisse) SA, Socotab Frana SA and Raymond Weil SA. Additionally, he is chairman of the regulatory board of the SIX Swiss Exchange AG.
Mr. von Planta holds a doctorate in law from the University of Basel in Switzerland, and a Master of Laws from Columbia Law School in the United States. He passed his bar examinations in Basel in 1982. Since 1983, he has lived in Geneva and worked for the law firm Lenz & Staehelin, where he became a partner in 1988. His areas of specialization include corporate law, corporate governance, corporate finance, company reorganizations, and mergers and acquisitions.

Composition of the Executive Committee
Steven BaertHuman Resources
Joseph JimenezChief Executive Officer
James BradnerBiomedical Research
vasant narasimhanGlobal Drug Development
Felix r. ehratGeneral Counsel
Harry KirschChief Financial Officer
andré WyssNovartis Operations
paul HudsonInnovative Medicines:
Pharmaceuticals
Bruno StriginiInnovative Medicines:
Oncology
F. Michael BallAlcon
richard FrancisSandoz
98 | Novartis Annual Report 2016
Our management
Executive Committee composition
The Executive Committee is headed by the CEO. Its members are appointed by the Board.
There are no contracts between Novartis and third parties whereby Novartis would delegate any business management tasks to such third parties.
Executive Committee role and functioning
The Board has delegated to the Executive Committee overall responsibility for and oversight of the operational management of Novartis. This includes:— Developing policies and strategic plans for Board
approval, and implementing those approved— Submitting to the Board and its committees proposed
changes in management positions of material signif-icance, investments, financial measures, acquisitions and divestments, contracts of material significance, and targets – and implementing those approved
— Preparing and submitting quarterly and annual reports to the Board and its committees
— Informing the Board of all matters of fundamental sig-nificance to the businesses
— Recruiting, appointing and promoting senior management
— Ensuring the efficient operation of the Group and the achievement of optimal results
— Promoting an active internal and external communications policy
— Dealing with any other matters delegated by the Board
The Executive Committee is supported by a sub-com-mittee: The Disclosure Committee (members are the CEO, CFO and Group General Counsel) determines whether an event constitutes information that is material to the Group, determines the appropriate disclosure and update of such information, and reviews media releases concerning such information.
CEO
In addition to other Board-assigned duties, the CEO leads the Executive Committee, building and maintain-ing an effective executive team. With the support of the Executive Committee, the CEO:— Is responsible for the operational management of
Novartis— Develops strategy proposals to be recommended to
the Board, and ensures that approved strategies are implemented
— Plans human resourcing to ensure that Novartis has the capabilities and means to achieve its plans, and that robust management succession and manage-ment development plans are in place and presented to the Board
— Develops an organizational structure, and establishes processes and systems to ensure the efficient orga-nization of resources
— Ensures that financial results, business strategies and, when appropriate, targets and milestones are communicated to the investment community – and generally develops and promotes effective commu-nication with shareholders and other stakeholders
— Ensures that the business performance is consistent with business principles, as well as with high legal and ethical standards, and that the culture of Novartis is consistent with the Novartis Values and Behaviors
— Leads the Innovative Medicines Division — Develops processes and structures to ensure that
capital investment proposals are reviewed thor-oughly, that associated risks are identified, and that appropriate steps are taken to manage these risks
— Develops and maintains an effective framework of internal controls over risk in relation to all business activities of the company
— Ensures that the flow of information to the Board is accurate, timely and clear

Novartis Annual Report 2016 | 99Corporate governanCeour management
Mandates outside the Novartis Group
No Executive Committee member may hold more than six additional mandates in other companies, of which no more than two additional mandates shall be in other listed companies. Each of these mandates is subject to Board approval. Executive Committee members are not allowed to hold chairmanships of the boards of directors of other listed companies.
The following mandates are not subject to these lim-itations:a) Mandates in companies that are controlled by
Novartis AGb) Mandates that an Executive Committee member
holds at the request of Novartis AG or companies controlled by it. No Executive Committee member shall hold more than five such mandates.
c) Mandates in associations, charitable organizations, foundations, trusts and employee welfare founda-tions. No Executive Committee member may hold more than 10 such mandates.
“Mandates” means those in the supreme governing body of a legal entity that is required to be registered in the commercial register or a comparable foreign register. Mandates in different legal entities that are under joint control are deemed one mandate.
The Board may issue regulations that determine addi-tional restrictions, taking into account the position of the respective member.
Loans and credits
No loans or credits shall be granted to members of the Executive Committee.

100 | Novartis Annual Report 2016
Joseph JimenezChief Executive Officer of Novartis American, age 57
Joseph Jimenez has been Chief Executive Officer (CEO) of Novartis since 2010.
Mr. Jimenez previously held the position of Division Head, Novartis Pharmaceuticals. He joined Novartis in 2007 as Division Head, Novartis Consumer Health. Before that, he served as president and CEO of the North American and European businesses for the H.J. Heinz Company. He also served on the board of directors of Colgate-Palmolive Co. from 2009 to 2015, and of AstraZeneca PLC from 2002 to 2007.
Mr. Jimenez is a member of the board of directors of General Motors Co. He gradu ated in 1982 with a bachelor’s degree from Stanford University and in 1984 with a Master of Business Administration from the University of California, Berkeley, both in the United States.
Steven BaertHead of Human Resources of Novartis Belgian, age 42
Steven Baert has been Head of Human Resources (CHRO) of Novartis since 2014. He is a member of the Executive Committee of Novartis.
Mr. Baert joined Novartis in 2006 as Head of Human Resources Global Functions in Switzerland. He has held several other senior HR roles, including Head of Human Resources for Emerging Growth Markets, and Global Head, Human Resources, Oncology. Mr. Baert also served as Head of Human Resources, United States and Canada, for Novartis Pharmaceuticals Corporation. Prior to joining Novartis, he held HR positions at Bristol-Myers Squibb Co. and Unilever.
Mr. Baert represents Novartis on the board of the GSK Consumer Healthcare joint venture. He holds a Master of Business Administration from the Vlerick Business School in Belgium and a Master of Laws from the Katholieke Universiteit Leuven, also in Belgium. Additionally, he has a Bachelor of Laws from the Katholieke Universiteit Brussels.
Executive Committee
F. Michael (Mike) BallCEO, Alcon American, age 61
F. Michael (Mike) Ball was appointed CEO of Alcon on February 1, 2016. He is a member of the Executive Committee of Novartis.
Mr. Ball previously served as CEO of Hospira from 2011 to 2015. At Hospira, a world leader in injectable pharmaceuticals and infusion devices, he successfully turned the company around and grew it by focusing on product and quality improvements, and expanding its global footprint. Prior to Hospira, Mr. Ball held a number of senior leadership positions at Allergan, beginning in 1995. He served as president from 2006 to 2011 after having led the strategy and execution of global commercial activities for a wide range of businesses, including eye care pharmaceuti-cals, over-the-counter products and surgical devices. Before joining Allergan, Mr. Ball held roles of increasing responsibility in marketing and sales at Syntex Corporation and Eli Lilly. He began his career in the healthcare industry in 1981.
Mr. Ball holds a Bachelor of Science and a Master of Business Administration from Queen’s University in Canada.

Novartis Annual Report 2016 | 101Corporate governanCeour management
Felix r. ehrat, ph.D.Group General Counsel of Novartis Swiss, age 59
Felix R. Ehrat, Ph.D., has been Group General Counsel of Novartis since 2011. He is a member of the Executive Committee of Novartis.
Mr. Ehrat is a leading practitioner of corporate, banking, and mergers and acquisitions law, as well as an expert in corporate governance and arbitration. He started his career as an associate at Bär & Karrer Ltd. in Zurich in 1987, became partner in 1992, and advanced to senior partner (2003 to 2011) and executive chairman of the board (2007 to 2011). Mr. Ehrat is chairman of Globalance Bank AG in Switzerland, and chairman of SwissHoldings (the federation of industrial and service groups in Switzerland). He is a board member of Geberit AG and Avenir Suisse (a think tank for economic and social issues), and previously served as chairman and board member of several listed and non-listed companies.
Mr. Ehrat was admitted to the Zurich bar in 1985 and received his doctorate in law from the University of Zurich in Switzerland in 1990. He received his Master of Laws from McGeorge School of Law in the United States in 1986. Some of his past member-ships include the International Bar Associa-tion, where he was co-chair of the Corporate and M&A Law Committee from 2007 to 2008, and Association Internationale des Jeunes Avocats, where he was president from 1998 to 1999.
James (Jay) Bradner, M.D.President of the Novartis Institutes for BioMedical Research (NIBR) American, age 44
James (Jay) Bradner, M.D., joined Novartis on January 1, 2016 and became President of the Novartis Institutes for BioMedical Research (NIBR) on March 1, 2016. He is a member of the Executive Committee of Novartis.
Prior to joining Novartis, Dr. Bradner was on the faculty of Harvard Medical School in the Department of Medical Oncology at the Dana-Farber Cancer Institute in the United States. He was also associate director of the Center for the Science of Therapeutics at the Broad Institute of MIT and Harvard. Dr. Bradner is a co-founder of five biotechnology companies and has co-authored more than 150 scientific publications and 30 US patent applications.
Dr. Bradner is a graduate of Harvard University and the University of Chicago Medical School in the US. He completed his residency in medicine at Brigham and Women’s Hospital and his fellowship in medical oncology and hematology at the Dana-Farber Cancer Institute. He has been honored with many awards and was elected into the American Society for Clinical Investigation in 2011 and the Alpha Omega Alpha Honor Medical Society in 2013.
richard FrancisCEO, Sandoz British, age 48
Richard Francis has been CEO of Sandoz since 2014. He is a member of the Executive Committee of Novartis.
Mr. Francis joined Novartis from Biogen Idec, where he held global and country leadership positions during his 13-year career with the company. Most recently, he was senior vice president of the company’s United States commercial organization. From 1998 to 2001, he was at Sanofi in the United Kingdom, and held various marketing roles across the company’s urology, analgesics and cardio-vascular products. He has also held sales and marketing positions at Lorex Synthélabo and Wyeth.
Mr. Francis received a Bachelor of Arts in economics from Manchester Metropolitan University in the UK.

102 | Novartis Annual Report 2016
paul HudsonCEO, Novartis Pharmaceuticals British, age 49
Paul Hudson has been CEO of Novartis Pharmaceuticals since July 1, 2016. He is a member of the Executive Committee of Novartis.
Mr. Hudson joined Novartis from AstraZen-eca, where he most recently was president, AstraZeneca United States and executive vice president, North America. He also served as representative director and president of AstraZeneca K.K. in Japan; as president of AstraZeneca’s business in Spain; and as vice president and primary care director, United Kingdom. Before AstraZeneca, Mr. Hudson held roles of increasing responsibility at Schering-Plough, including leading biologics global marketing. He began his career in sales and marketing roles at GlaxoSmithKline UK and Sanofi- Synthélabo UK.
Mr. Hudson holds a degree in economics from Manchester Metropolitan University in the UK and a diploma in marketing from the Chartered Institute of Marketing, also in the UK.
Harry KirschChief Financial Officer of Novartis German, age 51
Harry Kirsch has been Chief Financial Officer (CFO) of Novartis since 2013. He is a member of the Executive Committee of Novartis.
Mr. Kirsch joined Novartis in 2003 and, prior to his current position, served as CFO of the company’s Pharmaceuticals Division. Under his leadership, the division’s core operating income margin increased, in constant curren-cies, every quarter of 2011 and 2012 despite patent expirations. At Novartis, he also served as CFO of Pharma Europe, and as Head of Business Planning & Analysis and Financial Operations for the Pharmaceuticals Division. Mr. Kirsch joined Novartis from Procter & Gamble (P&G) in the United States, where he was CFO of P&G’s global pharma-ceutical business. Prior to that, he held finance positions in various categories of P&G’s consumer goods business, technical operations, and Global Business Services organization.
Mr. Kirsch represents Novartis on the board of the GSK Consumer Healthcare joint venture. He holds a diploma degree in industrial engineering and economics from the University of Karlsruhe in Germany.
Executive Committee (continued)
vasant (vas) narasimhan, M.D. Global Head of Drug Development and Chief Medical Officer for Novartis American, age 40
Vasant (Vas) Narasimhan, M.D., has been Global Head of Drug Development and Chief Medical Officer for Novartis since February 1, 2016. He is a member of the Executive Committee of Novartis.
Dr. Narasimhan joined Novartis in 2005 and has held numerous leadership positions in development and commercial functions. His most recent role was Global Head of Development for Novartis Pharmaceuticals, overseeing the entire general medicines pipeline. He previously served as Global Head of the Sandoz Biopharmaceuticals and Oncology Injectables business unit, overseeing the division’s biosimilars pipeline, and as Global Head of Development for Novartis Vaccines. Dr. Narasimhan has also held commercial and strategic roles at Novartis, including North America Region Head for Novartis Vaccines, and United States Country President for Novartis Vaccines and Diagnostics. Before joining Novartis, he worked at McKinsey & Company.
Dr. Narasimhan received his medical degree from Harvard Medical School in the US and obtained a master’s degree in public policy from Harvard’s John F. Kennedy School of Government. He received his bachelor’s degree in biological sciences from the University of Chicago, also in the US. He is an elected member of the US National Academy of Medicine.

Novartis Annual Report 2016 | 103Corporate governanCeour management
Bruno StriginiCEO, Novartis Oncology French, age 55
Bruno Strigini has been CEO of Novartis Oncology since July 1, 2016. He is a member of the Executive Committee of Novartis.
Mr. Strigini joined Novartis in 2014 as President of Oncology. Prior to Novartis, he was president of MSD for Europe and Canada (Merck & Co. in the United States and Canada). He previously worked at Schering-Plough, UCB Celltech and SmithKline Beecham, and his roles included president of international operations, president of Japan and Asia-Pacific, head of global marketing and business development, and managing director positions.
Mr. Strigini holds a Master of Business Administration from IMD business school in Switzerland, a doctorate in pharmacy from the University of Montpellier in France, and a master’s degree in microbiology from Heriot-Watt University in the United Kingdom. He is an elected member of the French National Academy of Pharmacy, and in 2014, he was awarded a doctor honoris causa from Universidad Internacional Menéndez Pelayo in Spain.
andré WyssPresident of Novartis Operations and Country President for Switzerland Swiss, age 49
André Wyss has been President of Novartis Operations since February 1, 2016, and is responsible for manufacturing, shared services and public affairs. He is also Country President for Switzerland and a member of the Executive Committee of Novartis.
Mr. Wyss joined Novartis in 1984 as a chemistry apprentice in manufacturing. Before being appointed President of Novartis Operations, he served as Head of Novartis Business Services, building and implement-ing a shared services organization across Novartis. Prior to that, he held several other leadership positions, including US Country Head and President of Novartis Pharmaceu-ticals Corporation; Head of the Pharmaceu-ticals Division for the AMAC region (Asia- Pacific, Middle East and African countries); Group Emerging Markets Head; and Country President and Head of Pharmaceuticals, Greece.
Mr. Wyss received a graduate degree in economics from the School of Economics and Business Administration (HWV) in Switzerland in 1995. He is a member of the board of economiesuisse.
Secretary
Bruno Heynen

104 | Novartis Annual Report 2016
Our independent external auditorsDuration of the mandate and terms of office of the auditors
Based on a recommendation by the Audit and Compli-ance Committee, the Board nominates an independent auditor for election at the AGM. Pricewaterhouse-Coopers (PwC) assumed its existing auditing mandate for Novartis in 1996. Bruno Rossi, auditor in charge, began serving in his role in 2013, and Stephen Johnson, global relationship partner, began serving in his role in 2014. PwC ensures that these partners are rotated at least every five years.
Information to the Board and the Audit and Compliance Committee
PwC is responsible for providing an opinion on whether the consolidated financial statements comply with IFRS and Swiss law, and whether the separate parent com-pany financial statements of Novartis AG comply with Swiss law. Additionally, PwC is responsible for opining on the effectiveness of internal control over financial reporting, on the Compensation Report and on the cor-porate responsibility reporting of Novartis.
The Audit and Compliance Committee, acting on behalf of the Board, is responsible for overseeing the activities of PwC. In 2016, this committee held 7 meet-ings. PwC was invited to 6 of these meetings to attend during the discussion of agenda items that dealt with accounting, financial reporting or auditing matters and any other matters relevant to its audit.
On an annual basis, PwC provides the Audit and Compliance Committee with written disclosures required by the US Public Company Accounting Oversight Board, and the committee and PwC discuss PwC’s indepen-dence from Novartis.
The Audit and Compliance Committee recommended to the Board to approve the audited consolidated finan-cial statements and the separate parent company finan-cial statements of Novartis AG for the year ended Decem-ber 31, 2016. The Board proposed the acceptance of these financial statements for approval by the sharehold-ers at the next AGM.
The Audit and Compliance Committee regularly eval-uates the performance of PwC, and once a year deter-mines whether PwC should be proposed to the share-holders for election. Also once a year, the auditor in charge and the global relationship partner report to the Board on PwC’s activities during the current year and on the audit plan for the coming year. They also answer any questions or concerns that Board members have about the performance of PwC, or about the work it has con-ducted or is planning to conduct.
To assess the performance of PwC, the Audit and Compliance Committee holds private meetings with the CFO and the Head of Internal Audit and, if necessary, obtains an independent external assessment. Criteria
applied for the performance assessment of PwC include an evaluation of its technical and operational compe-tence; its independence and objectivity; the sufficiency of the resources it has employed; its focus on areas of significant risk to Novartis; its willingness to probe and challenge; its ability to provide effective, practical rec-ommendations; and the openness and effectiveness of its communications and coordination with the Audit and Compliance Committee, the Internal Audit function, and management.
Approval of audit and non-audit services
The Audit and Compliance Committee approves a bud-get for audit services, whether recurring or non-recur-ring in nature, and for audit-related services not associ-ated with internal control over financial reporting. PwC reports quarterly to the Audit and Compliance Commit-tee regarding the extent of services provided in accor-dance with the applicable pre-approval, and the fees for services performed to date. The Audit and Compliance Committee individually approves all audit-related ser-vices associated with internal control over financial reporting, tax services and other services prior to the start of work.
Audit and additional fees
PwC charged the following fees for professional services rendered for the 12-month periods ended December 31, 2016 and December 31, 2015:
2016 20151
USD million USD million
Audit services 26.7 25.9
Audit-related services 2.9 1.1
Tax services 0.7 0.0
Other services 1.3 0.7
total 31.6 27.7
1 Amounts for 2015 have been reclassified in line with the new 2016 classification criteria to allow comparison with 2016 amounts.
Audit services include work performed to issue opinions on consolidated financial statements and parent com-pany financial statements of Novartis AG, to issue opin-ions relating to the effectiveness of the Group’s internal control over financial reporting, and to issue reports on local statutory financial statements. Also included are audit services that generally can only be provided by the statutory auditor, such as the audit of the Compensation Report, audits of non-recurring transactions, audits of the adoption of new accounting policies, audits of infor-mation systems and the related control environment, reviews of quarterly financial results, as well as proce-dures required to issue consents and comfort letters.

Novartis Annual Report 2016 | 105Corporate governanCeour corporate governance framework
Audit-related services include other assurance ser-vices provided by the independent auditor but not restricted to those that can only be provided by the stat-utory auditor. They include services such as audits of pension and other employee benefit plans, contract audits of third-party arrangements, corporate responsi-bility assurance, and other audit-related services.
Tax services represent tax compliance, assistance with historical tax matters, and other tax-related ser-vices.
Other services include procedures related to corpo-rate integrity agreements, training in the finance area, benchmarking studies, and license fees for use of accounting and other reporting guidance databases.
Our corporate governance frameworkLaws and regulations
Novartis AG is subject to the laws of Switzerland, in par-ticular Swiss company and securities laws, and to the securities laws of the US as applicable to foreign private issuers of securities.
In addition, Novartis AG is subject to the rules of the SIX Swiss Exchange, including the Directive on Informa-tion Relating to Corporate Governance.
Novartis AG is also subject to the rules of the NYSE as applicable to foreign private issuers of securities. The NYSE requires Novartis AG to describe any material ways in which its corporate governance differs from that of domestic US companies listed on the exchange. These differences are:— Novartis AG shareholders do not receive written
reports directly from Board committees.— External auditors are appointed by shareholders at
the AGM, as opposed to being appointed by the Audit and Compliance Committee.
— While shareholders cannot vote on all equity compen-sation plans, they are entitled to hold separate, yearly binding shareholder votes on Board and Executive Committee compensation.
— The Board has set up a separate Risk Committee that is responsible for business risk oversight, as opposed to delegating this responsibility to the Audit and Com-pliance Committee.
— The full Board is responsible for overseeing the performance evaluation of the Board and Executive Committee.
— The full Board is responsible for setting objectives relevant to the CEO’s compensation and for evaluat-ing his performance.
Swiss Code of Best Practice for Corporate Governance
Novartis applies the Swiss Code of Best Practice for Corporate Governance.
Novartis corporate governance standards
Novartis has incorporated the aforementioned corporate governance standards described above into the Articles of Incorporation and the Regulations of the Board of Directors, its Committees and the Executive Committee of Novartis AG (www.novartis.com/corporate-gover-nance).
The GNCRC regularly reviews these standards and principles, taking into account best practices, and rec-ommends improvements to the corporate governance framework for consideration by the full Board.
Additional corporate governance information can be found on the Novartis website: www.novartis.com/cor-porate-governance.
Printed copies of the Novartis Articles of Incorpora-tion, regulations of the Board, and charters of Board committees can be obtained by writing to: Novartis AG, Attn: Corporate Secretary, Lichtstrasse 35, CH-4056 Basel, Switzerland.

106 | Novartis Annual Report 2016
Further informationGroup structure of Novartis
Novartis AG and Group companiesUnder Swiss company law, Novartis AG is organized as a corporation that has issued shares of common stock to investors. The registered office of Novartis AG is Licht-strasse 35, CH-4056 Basel, Switzerland.
Business operations are conducted through Novartis Group companies. Novartis AG, a holding company, owns or controls directly or indirectly all entities worldwide belonging to the Novartis Group. Except as described below, the shares of these companies are not publicly traded. The principal Novartis subsidiaries and associ-ated companies are listed in Note 32 to the Group’s con-solidated financial statements.
DivisionsThe businesses of Novartis are divided on a worldwide basis into three operating divisions: Innovative Medi-cines, with the two business units Novartis Pharmaceu-ticals and Novartis Oncology; Sandoz (generics); and Alcon (eye care). These businesses are supported by a number of global organizations including NIBR, which focuses on discovering new drugs; the Global Drug Development organization, which oversees the clinical development of new medicines; and Novartis Operations, which includes Novartis Technical Operations (the global manufacturing organization) and Novartis Business Ser-vices (which consolidates support services across Novartis).
Majority holdings in publicly-traded Group companiesThe Novartis Group owns 73.4% of Novartis India Ltd., with its registered office in Mumbai, India, and listed on the Bombay Stock Exchange (ISIN INE234A01025, sym-bol: HCBA). The total market value of the 26.6% free float of Novartis India Ltd. was USD 74.2 million at December 31, 2016, using the quoted market share price at year-end. Applying this share price to all the shares of the company, the market capitalization of the whole com-pany was USD 279.0 million, and that of the shares owned by Novartis was USD 204.8 million.
Significant minority shareholding owned by the Novartis Group The Novartis Group owns 33.3% of the bearer shares of Roche Holding AG, with its registered office in Basel, Switzerland, and listed on the SIX Swiss Exchange (ISIN CH0012032113, symbol: RO). The market value of the Group’s interest in Roche Holding AG, as of December 31, 2016, was USD 12.4 billion. The total market value of Roche Holding AG was USD 197.1 billion. Novartis does not exercise control over Roche Holding AG, which is independently governed, managed and operated.
The Novartis Group owns a 36.5% share of a joint venture created by GlaxoSmithKline PLC (GSK) and Novartis, which combined the Novartis OTC and GSK
Consumer Healthcare businesses. Novartis holds four of the 11 seats on the joint venture’s board. Furthermore, Novartis has certain minority rights and exit rights, includ-ing a put option that is exercisable as of March 2, 2018.
Political contributions
Novartis makes political contributions to support the political dialogue on issues of relevance to the company.
Political contributions made by Novartis are not intended to give rise to any obligations of the party receiving it, or with the expectation of a direct or imme-diate return for Novartis. Such contributions are fully compliant with applicable laws, regulations and industry codes. Novartis only makes political contributions in countries where such contributions from corporations are considered to reflect good corporate citizenship. Moreover, Novartis only makes modest political contri-butions so as to not create any dependency from the political parties receiving these contributions.
In 2016 Novartis issued a guideline on Responsible Lobbying, describing the overarching principles of trans-parency in lobbying activities. For more information on responsible lobbying see the public policy and advocacy section of the Novartis website (https://www.novartis.com/about-us/corporate-responsibility/doing-business- responsibly/public-policy-advocacy).
In 2016, Novartis made political contributions total-ing approximately USD 1.0 million, thereof approximately USD 620 000 in Switzerland, USD 250 000 in the US, USD 110 000 in Australia and USD 10 000 in the UK. In addition, in the US, a political action committee estab-lished by Novartis used funds received from Novartis employees (but not from the company) to make political contributions totaling approximately USD 240 000.
In Switzerland, Novartis supports political parties that have a political agenda and hold positions that support the strategic interests of Novartis, its shareholders and other stakeholders. Swiss political parties are completely privately financed, and the contributions of companies are a crucial part thereof. This private financing of par-ties is a deeply-rooted trait of the Swiss political culture, and contributing to that system is an important element of being a good corporate citizen.
Shareholder relations
The CEO, with the CFO and Investor Relations team, sup-ported by the Chairman, are responsible for ensuring effective communication with shareholders to keep them informed of the company’s strategy, prospects, business operations and governance. Through communication, the Board also learns about and addresses sharehold-ers’ expectations and concerns.

Novartis Annual Report 2016 | 107Corporate governanCeFurther information
Novartis communicates with its shareholders through the AGM, meetings with groups of shareholders and indi-vidual shareholders, and written and electronic commu-nications.
At the AGM, the Chairman, CEO and other Executive Committee members, as well as representatives of the external auditors, are present and can answer share-holders’ questions. Other meetings with shareholders may be attended by the Chairman, CEO, CFO, Executive Committee members, and other members of senior man-agement.
Topics discussed with shareholders may include strategy, business performance and corporate gover-nance, while fully respecting all applicable laws and stock exchange rules.
Information for our stakeholders
Introduction Novartis is committed to open and transparent communication with shareholders, financial analysts, customers, suppliers and other stakeholders. Novartis aims to disseminate material developments in its busi-nesses in a broad and timely manner that complies with the rules of the SIX Swiss Exchange and the NYSE.
CommunicationsNovartis publishes this Annual Report to provide infor-mation on the Group’s results and operations. In addi-tion, Novartis prepares an annual report on Form 20-F that is filed with the US Securities and Exchange Com-mission (SEC). Novartis discloses quarterly financial results in accordance with IFRS, and issues press releases from time to time regarding business develop-ments.
Novartis furnishes press releases relating to financial results and material events to the SEC via Form 6-K. An archive containing recent Annual Reports, annual reports on Form 20-F, quarterly results releases, and all related materials – including presentations and conference call webcasts – is on the Novartis website at www.novartis.com/investors.
Novartis also publishes a consolidated Corporate Responsibility Performance Report, available on the Novartis website at www.novartis.com/about-us/corpo-rate-responsibility, which details progress and demon-strates the company’s commitment to be a leader in cor-porate responsibility. This report reflects the best-in-class reporting standard, the Global Reporting Initiative’s G4 guidelines, and fulfills the company’s reporting require-ment as a signatory of the UN Global Compact.
Information contained in reports and releases issued by Novartis is only correct and accurate at the time of release. Novartis does not update past releases to reflect subsequent events, and advises against relying on them for current information.
Investor Relations programAn Investor Relations team manages the Group’s inter-actions with the international financial community. Sev-eral events are held each year to provide institutional investors and analysts with various opportunities to learn more about Novartis.
Investor Relations is based at the Group’s headquar-ters in Basel. Part of the team is located in the US to coordinate interaction with US investors. Information is available on the Novartis website: www.novartis.com/investors. Investors are also welcome to subscribe to a free email service on this site.
Website information
Topic Information
Share capital Articles of Incorporation of Novartis AG www.novartis.com/corporate-governance Novartis key share data www.novartis.com/key-share-data
Shareholder rights Articles of Incorporation of Novartis AG www.novartis.com/corporate-governance Investor Relations information www.novartis.com/investors
Board regulations Board regulations www.novartis.com/corporate-governance
executive Committee Executive Committee www.novartis.com/executive-committee
novartis code for senior financial officers Novartis Code of Ethical Conduct for CEO and Senior Financial Officers www.novartis.com/corporate-governance
additional information Novartis Investor Relations www.novartis.com/investors

108 | Novartis Annual Report 2016
A researcher seeks the roots of plants’ healing powerDeep in a forest in the West African country of Ghana, two men are searching for plants that they hope could ultimately provide a cure for some of the world’s deadliest diseases.
One of these men is an expert on traditional healing, drawing on centuries of inherited knowledge about the medicinal qualities of certain roots and leaves. The other, Edmund Ekuadzi, is a university researcher who has dedicated his life to uncovering the science behind this ancient wisdom.
Mr. Ekuadzi, who grew up in the Ghanaian capital Accra, is an expert in the field of pharmacognosy, or the study of medicines derived from plants and other natural sources. Plants have yielded countless medicines over the years. Examples include willows, which were the original source of aspirin; poppies, which provided the painkiller morphine; and cinchona trees, which have long been used to make the antimalarial drug quinine.
For Mr. Ekuadzi, the first challenge is to win the trust of traditional herbalists – who sometimes
regard science as a threat to their livelihoods – and persuade them to identify the plants they use to treat a range of ailments. He then analyzes samples in his laboratory at Kwame Nkrumah University of Science and Technology in Kumasi, Ghana.
For example, he conducted the first scientific investigation of a shrub in the buckthorn family known as saawawa, widely used in West Africa as a cure all for everything from cuts and burns to snake bites and jaundice. The study isolated a number of compounds that are responsible for the plant’s antibacterial and antiinflammatory properties.
This research provides a benchmark to assess the quality of herbal medicines that are extracted from the plants. “These medicines are important for the people of Ghana, where we are struggling to provide healthcare for all,” he says.
1 Edmund Ekuadzi supervises an exam in pharmacognosy, the study of medicines derived from plants.
2 Mr. Ekuadzi at Kwame Nkrumah University of Science and Technology, where he teaches and does research
3 Discussing the search for medicinal plants with his colleagues 4 Back in the laboratory, Mr. Ekuadzi checks the equipment
used to analyze plant samples.5 Visiting the rainforest with Clifford Osafo Asare, an herbalist
PHOTO ESSAY
2
1

Novartis Annual Report 2016 | 109PHOTO ESSAY
But there is also the tantalizing prospect that one day he may discover a compound that is new to science and capable of transforming the practice of medicine.
Such a breakthrough occurred in the 1970s, when researchers studied a plant that for thousands of years had been known to Chinese herbalists for its antimalarial properties. Artemisinin now forms the basis of combination therapies such as Coartem from Novartis, which are the firstline treatment for malaria worldwide.
Mr. Ekuadzi received support from Novartis when he completed an internship in 2012 through the company’s Next Generation Scientist Program. It is designed to develop the scientific and medical capabilities of postgraduate students and physicians
from emerging countries, providing skills that will benefit them and their communities when they return home.
Mr. Ekuadzi, now 31, is one of more than 100 scientists from 21 countries who have taken part in the program, which helped him refine his use of techniques such as mass spectrometry. This enables him to analyze a plant’s molecular structure and isolate the compounds that have therapeutic effects.
He now applies these skills at the university in Ghana where he teaches pharmacognosy and works as assistant laboratory manager, while continuing to analyze the native plants that have been used to treat people in Ghana for generations and that may one day benefit patients much farther afield.
5
43

110 | Novartis Annual Report 2016
Compensation ReportContentsCompensation Committee Chairman’s letter 110
Compensation at a glance 112
Executive Committee compensation philosophy and principles 114
2016 Executive Committee compensation system 116
Executive Committee performance management process 121
2016 CEO compensation 123
CEO and other Executive Committee members’ 2014–2016 Long Term Incentive plans vesting 127
CEO and other Executive Committee members’ compensation at grant value 129
2017 Executive Committee compensation system 136
2016 Board compensation system 137
2016 Board compensation 138
Compensation governance 141
Report of the statutory auditor on the Compensation Report of Novartis AG 143
Dear shareholder,As Chairman of the Compensation Committee of the Board of Directors, I am pleased to share with you the 2016 Compensation Report of Novartis AG.
Our strategy at Novartis is to use science-based innova-tion to deliver better outcomes for patients in growing areas of healthcare. Our executive compensation system is aligned with our success in implementing that strategy, as well as with the interests of our shareholders.
We introduced our new compensation system in 2014 with a combination of performance-related incentives, including a short-term Annual Incentive and two new Long-Term Incentive plans with three-year perfor-mance-periods. For the first time in 2016, the three-year performance-period for the two Long-Term Incentive plans has concluded.
In the interests of shareholders and proxy advisors, while remaining compliant with the Ordinance against Excessive Compensation in Listed Companies, the Com-pensation Committee has worked to further enhance, on a voluntary basis, our compensation disclosures. Addi-tional information has been provided on the process for setting compensation targets for the Executive Commit-tee, and the payout outcomes affecting realized com-pensation of the CEO. We believe this is a meaningful way to illustrate the alignment of the Compensation Committee’s decisions on CEO pay for performance with our shareholders’ interests.
Engagement with shareholders
The Compensation Committee would like to acknowl-edge the strong shareholder support at the 2016 Annual General Meeting (AGM) for all compensation-related resolutions, and express appreciation for the opportu-nity to meet many of our shareholders during 2016 to discuss various compensation topics.
Based on their feedback, in 2016 the Compensation Committee continued to evaluate the effectiveness of our compensation programs and concluded that they are well aligned with our strategic objectives and business prior-ities. However, with the evolution of the healthcare indus-try both in Europe and the US, as well as the emergence of large US biotechnology companies, the Compensation Committee has introduced a revised global healthcare peer group for performance-periods starting in 2017. This revised peer group will be used as the primary bench-mark for determining the compensation opportunities of the CEO and other key executives, and for evaluating rel-ative Total Shareholder Return (TSR) performance and ranking under the LTRPP. Further detail is provided on page 136.
In 2016, to strengthen integrity and compliance across the company and in line with the expectations of our shareholders, the Compensation Committee held a joint meeting with the Risk Committee focused on doing

Novartis Annual Report 2016 | 111Compensation RepoRtCompensation Committee Chairman’s letter
business responsibly. The Committees endorsed new policies, systems and governance, including sales force compensation, to support the highest ethical conduct at all levels of the organization. While it will take time for the organization to truly embed our Values and Behaviors, the Board believes that these changes support our culture of delivering high performance with integrity and long-term sustainable value to shareholders.
2016 company performance
Novartis delivered in most of its key priority areas despite a challenging year. The company achieved solid finan-cials absorbing US Gleevec loss of exclusivity. Operation-ally, in constant currencies, the company was slightly below its sales target, met its free cash flow target, and was below its net income target. Innovative Medicines delivered strong performance, Sandoz’s was solid, out-performed peers and gained market share, while Alcon negatively impacted consolidated results.
Novartis achieved several breakthrough innovations and drove the growth products including the successful launch of Cosentyx and the steady growth of Entresto following positive treatment guidelines in the US and Europe. Significant changes to the company structure were implemented effective from July 1, 2016 to improve effectiveness by increasing the scale of the key func-tions, while at the same time lowering costs. Important progress has also been made in embedding a culture of integrity. Compliance failures mainly related to legacy issues.
2016 CEO realized compensation
The Compensation Committee focused on the CEO’s performance compared to his financial and strategic objectives, our Values and Behaviors, and the overall per-formance of Novartis. The Compensation Committee used its judgment and support from an independent external compensation advisor to make decisions about individual compensation elements, variable compensa-tion payouts (which can vary between 0%–200% of the target) and total compensation. Compensation Commit-tee members also considered a variety of qualitative fac-tors, including the business environment in which 2016 results were achieved.— The CEO was awarded a 2016 Annual Incentive of
CHF 2 835 010, representing 90% of target, based on a combination of our company’s performance and his own performance. Half of the Annual Incentive is delivered in cash, and the remainder in restricted share units with a three-year vesting period.
— The three-year performance-period for the two new Long-Term Incentive plans introduced in 2014
was completed in 2016. For the first – our Long-Term Performance Plan (LTPP) – following the assessment of performance against the three-year Novartis Cash Value Added (NCVA) and Group innovation targets, the Compensation Committee approved a payout of 112% of target for the CEO. For the second – our Long-Term Relative Performance Plan (LTRPP) – following the assessment of the Novartis three-year TSR against the Novartis global healthcare peer group, the Compensation Committee noted that Novartis ranked 10th out of 13 companies. Considering our TSR was flat in USD, and was up +15% in CHF, over the three-year performance-period 2014–2016, the Compen-sation Committee approved a payout of 20% of target.
In light of the above, 2016 CEO realized total compen-sation was CHF 10 556 685 including his fixed compen-sation, his 2016 Annual Incentive, and the vesting of his LTPP and LTRPP awards for the performance-period 2014–2016. The total LTPP and LTRPP payout was CHF 5 392 347 including CHF 528 346 of dividend equivalents accrued over the three-year performance- period.
2017 AGM
We will continue to exchange views with our sharehold-ers in an atmosphere of trust and respect that promotes a collaborative dialogue. Shareholder engagement is critical to our long-term success, and the Compensation Committee is committed to continue meeting with our shareholders. In line with our Articles of Incorporation, shareholders will be asked to approve the total maximum amount of Board compensation from the 2017 AGM to the 2018 AGM, the Executive Committee compensation for financial year 2018, and to endorse this Compensa-tion Report in an advisory vote.
On behalf of Novartis and the Compensation Commit-tee, I would like to thank you for your continued support and feedback, which I consider extremely valuable in driving improvements in our compensation systems and practices. I invite you to send your comments to me at the following email address: [email protected]. Respectfully,
Enrico Vanni, Ph.D.Chairman of the Compensation Committee

112 | Novartis Annual Report 2016
Compensation at a glanceexecutive Committee compensation
Executive Committee compensation system (pages 116–120)
Fixed compensation and benefits Variable compensation
annual base pension and annual incentive Long-term Long-term Relative compensation other benefits performance plan performance plan (Ltpp) (LtRpp)
purpose Reflects Establishes a level of Rewards performance Rewards long-term Rewards relative total associates’ security for associates against key short-term shareholder value shareholder return responsibilities, and their dependents targets, and Values and creation and long-term job characteristics, tailored to local Behaviors innovation experience market practices and skill sets and regulations
performance period n/a n/a 1 year 3 years 3 years
performance n/a n/a Based on a payout Based on: Based on Novartis’ measures matrix made up of: — 75% Novartis Cash relative total — Individual Balanced Value Added shareholder return Scorecard, including — 25% divisional vs. our peer financial targets and long-term group of global individual objectives innovation healthcare companies1 — Assessed Values milestones and Behaviors
Delivery (at the end Cash Country-specific 50% cash Equity Equity of the performance 50% deferred equity2 (includes dividend (includes dividend period for variable (3-year holding of equivalents) equivalents) compensation) restricted shares/ total variable restricted share units) compensation
Ceo variable n/a n/a Target: 150% Target: 200% Target: 125% 4 Target: 475% opportunity3
other executive n/a n/a Target: 90–120% Target: 140–190% Target: 30–80% Target: 260%–390% Committee members’ variable opportunity3
1 For the performance period 2016-2018, the companies in our global healthcare peer group consist of Abbott, AbbVie, Amgen, AstraZeneca, Bristol-Myers Squibb, Eli Lilly & Co., GlaxoSmithKline, Johnson & Johnson, Merck & Co., Pfizer, Roche and Sanofi.
2 Executive Committee members may elect to receive more of their Annual Incentive in equity instead of cash. 3 The shown information represents the variable compensation opportunity as a percentage of annual base compensation. The payout range for each element is 0–200% of target. 4 Effective from the performance-period 2016-18 (previously 100%).
2016 CEO realized compensation (pages 124–126)The following table provides a summary of the 2016 CEO realized compensation in relation to the performance periods ended December 31, 2016. We believe reporting realized compensation provides a meaningful way to transparently illustrate the alignment between the Compensation Com-mittee’s decisions on CEO pay for performance and shareholders’ interests. In addition, this complements the disclosures required by the Ordi-nance against Excessive Compensation in Listed Companies (pages 129–135). The CEO realized compensation includes the payouts, based on actual performance assessed, from the two Long-Term Incentive plans newly introduced in 2014 following the conclusion of their first three-year performance-period 2014–2016.
2016 fixed compensation and benefits Variable compensation
annual base pension and 2016 annual Long-term Long-term Relative total realized compensation other benefits incentive performance plan performance plan compensation (Ltpp) 2014–20161 (LtRpp) 2014–20161
Joseph Jimenez (CEO) 2 093 417 235 911 2 2 835 010 4 950 334 442 013 10 556 685
1 The shown amounts represent the underlying share value of the total number of shares vested (including dividend equivalents) to the CEO for the LTPP and LTRPP performance-period 2014-2016.
2 Includes an amount of CHF 4 336 for mandatory employer contributions for the CEO paid by Novartis to Swiss governmental social security systems. This amount is out of total employer contributions of CHF 1 144 673, and provides a right to the maximum future insured government pension benefit.
2017 Executive Committee compensation system (page 136)The Executive Committee compensation system will remain unchanged in 2017 with the exception of a revised global healthcare peer group and corresponding LTRPP payout matrix.

Novartis Annual Report 2016 | 113Compensation RepoRtCompensation at a glance
(CHF) Annual fee
Chairman of the Board 3 800 000
Board membership 300 000
Vice Chairman 50 000
Chairman of the Audit and Compliance Committee 120 000
Chairman of the following committees:
— Compensation Committee
— Governance, Nomination and Corporate Responsibilities Committee
— Research & Development Committee
— Risk Committee 60 000
Membership of the Audit and Compliance Committee 60 000
Membership of the following committees:
— Compensation Committee
— Governance, Nomination and Corporate Responsibilities Committee
— Research & Development Committee
— Risk Committee 30 000
(CHF) Cash Equity Other benefits 1 total
Chairman
Dr. Joerg Reinhardt 2 1 900 000 1 900 000 4 336 3 804 336
Other Board members
active on December 31, 2016 1 625 000 2 540 000 12 147 4 177 147
Other Board members
who stepped down at the 2016 AGM 27 500 27 500 579 55 579
total 3 552 500 4 467 500 17 062 8 037 062 3
2016 Board compensation (pages 138–140)amounts earned for financial year 2016
1 Includes an amount of CHF 17 062 for mandatory employer contributions for all Board members paid by Novartis to Swiss governmental social security systems. This amount is out of total employer contributions of CHF 387 308, and provides a right to the maximum future insured government pension benefit for the Board member.
2 The Chairman of the Board also received payment for the loss of other entitlements at his previous employer totaling EUR 2 665 051, staggered in three installments from 2014 to 2016. In January 2016, the Chairman of the Board received the third and final installment. No additional committee fees for chairing the Research & Development Committee were delivered to the Chairman of the Board.
3 Please see page 139 for a reconciliation between the amount reported in this table and the amount approved by shareholders at the 2016 AGM to be used to compensate Board members for the period from the 2016 AGM to the 2017 AGM. The amount paid is within the maximum amount approved by shareholders.
executive Committee compensation risk management principles
— Rigorous performance management process— Balanced mix of short-term and long-term
variable compensation elements — Matrix approach to performance evaluation
under the Annual Incentive, including an individual Balanced Scorecard and assessed Values and Behaviors
— Performance-based Long-Term Incentives only, with three-year overlapping cycles
— All variable compensation is capped at 200% of target
— Contractual notice period of 12 months— Post-contractual non-compete limited to
a maximum of 12 months (annual base compensation and Annual Incentive of the prior year only)
— No severance payments or change-of-control clauses
— Clawback principles apply to all elements of variable compensation
— Share ownership requirements; no hedging or pledging of Novartis share ownership position
Compensation governance
Governance and risk management (pages 141–142)
Board compensation
2016 Board compensation system (page 137)Delivery: 50% cash/50% equity (up to 100% equity at the option of each Board member)
2017 Board compensation systemThe Board compensation system will remain unchanged in 2017.
Decision on Decision making authority
Compensation of Chairman and other Board members Board of Directors
Compensation of CEO Board of Directors
Compensation of other Executive Committee members Compensation Committee

114 | Novartis Annual Report 2016
Executive Committee compensation philosophy and principlesNovartis compensation philosophy
Our compensation philosophy aims to ensure that the Executive Committee is rewarded according to its suc-cess in implementing the company strategy and to its contribution to company performance. The Executive Committee compensation system is designed in line with the following key elements:
Alignment with company strategy
The Novartis strategy is to use science-based innova-tion to deliver better patient outcomes. We aim to lead in growing areas of healthcare focusing on innovative pharmaceuticals and oncology medicines, generics and biosimilars, and eye care. To align the compensation sys-tem with this strategy, and to ensure that Novartis is a high-performing organization over the long term, the
Board of Directors determines specific, measurable and time-bound performance metrics for both the short-term Annual Incentive and the Long-Term Incentive plans. The targets include financial metrics such as sales, profit and cash flow, as well as non-financial metrics in areas such as quality, talent, integrity and reputation, which are rein-forced by our Values and Behaviors. The CEO and the other Executive Committee members are compensated according to the extent to which the targets are achieved.
Executive Committee compensation benchmarking
To attract and retain key talent, it is important for us to offer competitive compensation opportunities.
The Compensation Committee reviews the compet-itiveness of the compensation of the CEO and Executive Committee members on a regular basis. For this pur-pose, the Compensation Committee uses benchmark data from publicly available sources, as well as reputa-ble market data providers where appropriate. All data is reviewed and evaluated by the Compensation Commit-tee’s independent advisor, who also provides indepen-dent research and advice regarding the compensation of the CEO and the other Executive Committee mem-bers.
While benchmarking information regarding executive pay is considered by the Compensation Committee, any decisions on compensation are ultimately based on the specific business needs of Novartis and on the execu-tive’s experience, skill sets and performance.
Executives meeting their objectives are generally awarded target compensation in line with the market median benchmark for comparable roles within a peer group of global competitors in the healthcare industry. Our peer group is made up of companies that are simi-lar in size to Novartis and that also have similar business models and needs for talent and skills. In the event of under- or over-performance by an executive, the actual compensation may be lower or higher than the bench-mark median.
shareholder alignment
pay for performance
Balanced rewards to create sustainable value
Business ethics
Competitive compensation
A significant part of our incentives are equity-based. Also, the LTRPP rewards on the basis of relative total shareholder return.
The Values and Behaviors are an integral part of our compensation system.
Compensation competitive to relevant benchmarks ensures we are able to attract and retain the most talented global Executive Committee members.
Mix of targets are based on financial metrics, innovation, individual objectives, Values and Behaviors, and performance vs. competitors.
Variable compensation is tied directly to the achievement of strategic company targets.

Novartis Annual Report 2016 | 115Compensation RepoRtexecutive Committee compensation philosophy and principles
The Compensation Committee considers the global healthcare peer group the most relevant benchmark given the fierce competition within the pharmaceutical and biotechnology industries for top executive talent with deep expertise and competences. The composition of the peer group accurately reflects the competitive land-scape of Novartis. Although Novartis is headquartered in Switzerland, more than a third of sales come from the US market and the US will remain a significant recruit-ment talent pool for the company (e.g., all current Exec-utive Committee members have extensive experience with the US). In addition to providing a benchmark for compensation, the global healthcare peer group is used to evaluate relative total shareholder return (TSR) per-formance and ranking under the Long-Term Relative Per-formance Plan (LTRPP), as a reference point for pay and performance alignment as well as for compensation plan design and practices.
The Compensation Committee reviews the companies in our global healthcare peer group annually and consid-ers adjustments over time in line with the evolution of the competitive environment in the healthcare industry.
Following the latest review, the Compensation Com-mittee approved changes to the global healthcare peer group for 2017 onwards, which are reflected on page 136.
The Compensation Committee also uses a cross-in-dustry peer group of European-headquartered multi national companies as an additional reference point to assess regional pay practices and trends. These com-panies were selected on the basis of comparability in size, scale, global scope of operations, and economic influences to Novartis. This European cross-industry peer group is comprised of five global companies focus-ing exclusively on healthcare – AstraZeneca, GlaxoSmith-Kline, Novo Nordisk, Roche and Sanofi – and 10 compa-nies selected from the STOXX® All Europe 100 Index representing all sectors (excluding financial services, energy and utilities, apparel, media, and real estate investment trusts): Anheuser-Busch, Bayer, BMW, Daim-ler, Danone, Heineken, L’Oréal, Merck KgaA, Nestlé and Unilever.
Novartis comparison to peer group medianAgainst the global healthcare peer group, Novartis is among the largest in key dimensions including market capitalization, sales and operating income. The table below compares our market capitalization, sales and operating income to the median market capitalization, sales and operating income for our global healthcare peer group.
Median of global healthcare (USD billions) Novartis peer group for 2016 3
Market capitalization 1 172.0 103.0
Net sales 2 48.5 30.8
Operating income 2 8.3 7.0
1 Market capitalization at December 31, 2016 is calculated based on the number of shares outstanding (excluding treasury shares).
2 Continuing operations3 Data source: Bloomberg database; most recently disclosed (as of January 18, 2017) trailing 12-month net sales and operating income.
Global healthcare peer group for 20161
Abbott AbbVie Amgen
AstraZeneca Bristol-Myers Squibb Eli Lilly & Co.
GlaxoSmithKline Johnson & Johnson Merck & Co.
Pfizer Roche Sanofi
1 This global healthcare peer group is used as the basis for the TSR comparator group featured in the LTRPP for the performance periods 2014-2016, 2015-2017 and 2016-2018.

116 | Novartis Annual Report 2016
2016 Executive Committee compensation systemThe 2016 Executive Committee compensation system consists of the following components:
Fixed compensation and benefits
Annual base compensationThe level of annual base compensation reflects each associate’s key responsibilities, job characteristics, experience and skill sets. It is paid in cash, typically monthly.
Annual base compensation is reviewed regularly, and any increase reflects merit based on performance, as well as market movements.
Pension and other benefitsThe primary purpose of pension and insurance plans is to establish a level of security for associates and their dependents with respect to age, health, disability and death. The level and scope of pension and insurance benefits provided are country- specific, influenced by local market practices and regulations.
Company policy is to change from defined benefit pension plans to defined contribution pension plans. All major pension plans have now been aligned with this pol-icy as far as reasonably practicable. Please also see Note 25 to the Group’s audited consolidated financial state-ments (page 226).
Novartis may provide other benefits in a specific country – such as a company car, and tax and financial planning services – according to local market practices and regulations. Executive Committee members who have been transferred on an international assignment also receive benefits (such as tax equalization) in line with the company’s international assignment policies.
Variable compensation
Annual IncentiveFor the Annual Incentive of the CEO and other Execu-tive Committee members, a target incentive is defined as a percentage of annual base compensation at the beginning of each performance year. The target incen-tive is 150% of annual base compensation for the CEO, and ranges from 90% to 120% for the other Executive Committee members. It is delivered half in cash and half in equity deferred for three years.
The formula for the target Annual Incentive is out-lined below.
Annual Incentive formula
peRFoRmanCe measUResThe Annual Incentive payout is based on a matrix made up of two elements: a balanced scorecard and our Val-ues and Behaviors, which are described in more detail below.
BALANCED SCORECARD
The first element used to determine the payout of the Annual Incentive is a balanced scorecard within which Group, divisional or unit targets are weighted 60%, and individual objectives are weighted 40%. For more details on the target-setting and performance management pro-cess, please refer to pages 121–122.
Variable compensationFixed compensation and benefits
annual incentiveannual base compensation
pension and other benefits
Long-term performance plan (Ltpp)
Long-term Relative performance plan (LtRpp)
Annual base compensation
Target incentive % =x target annual
incentive value

Novartis Annual Report 2016 | 117Compensation RepoRt2016 executive Committee compensation system
GROUP, DIVISIONAL AND UNIT TARGETS
Within the Group, divisional and unit targets, each mea-sure is weighted individually. The CEO and corporate function heads share the same Group financial targets (further described below). In place of the Group targets, division and business unit heads have targets that include divisional or business unit sales, operating income, free cash flow as a percentage of sales, and market share of peers. Organizational unit heads have financial and non-financial targets specific to their organization. The Board of Directors sets the Group, divisional and unit tar-gets at the start of each performance year in constant currencies, where applicable, and evaluates achieve-ment against these targets at the end of that year.
INDIVIDUAL OBJECTIVES
Individual objectives differ for each Executive Commit-tee member depending on their responsibilities, and may include additional financial and non-financial targets. Examples of additional financial targets are implemen-tation of growth, productivity and development initiatives. Non-financial targets may include leadership as well as people and talent management, workforce diversity, quality, social initiatives such as access to medicines, and ethical business practices.
By way of illustration, the balanced scorecard mea-sures used for the CEO in 2016 are set out in the table below.
2016 balanced scorecard measures used for the CEO
performance measures Weight Breakdown of performance measures
Group financial 60% Group net salestargets Corporate net result Group net income Group free cash flow as % of sales
CEO 40% Additional financial targets (e.g., EPS)individual Innovation and growthobjectives Cross-divisional synergies High-performing organization
overall total 100%
OUR VALUES AND BEHAVIORS
The second element used to determine the payout of the Annual Incentive ensures that the performance of all Novartis associates, including Executive Committee
members, is achieved in line with our Values and Behav-iors. Associates are held accountable to demonstrate innovation, quality, collaboration, performance, courage and integrity. All Novartis associates are expected to live up to these on a daily basis, and to align and energize other associates to do the same. Detailed descriptors are used to assess performance against our Values and Behaviors.
peRFoRmanCe eVaLUation anD paYoUt DeteRminationFollowing a thorough review of the two elements that compose the Annual Incentive – performance against the balanced scorecard objectives and an assessment against our Values and Behaviors – a rating from 1 to 3 is assigned to each.
The following payout matrix shows how the Annual Incentive performance factor is derived using a combina-tion of performance against the balanced scorecard and demonstration of our Values and Behaviors. The Board of Directors for the CEO, and the Compensation Committee for the other Executive Committee members, determine the final payout factor, taking into account the ranges shown. Payouts are capped at 200% of target.
2016 Annual Incentive payout matrix
The payout matrix for the Annual Incentive equally rec-ognizes performance against the objectives in the bal-anced scorecard and demonstration of our Values and Behaviors.
% payout
performance vs. Balanced scorecard
exceeding expectations
meeting expectations
partially meeting expectations
3
2
1
60 – 90%
0 – 70%
0%
1
partially meeting expectations
Values and Behaviors assessment
130 – 160%
90 – 120%
0 – 70%
2
meeting expectations
170 – 200%
130 – 160%
60 – 90%
3
exceeding expectations

118 | Novartis Annual Report 2016
FoRm anD DeLiVeRY oF tHe aWaRDThe Annual Incentive is paid 50% in cash in the first quar-ter of the year following the performance-period, and 50% in Novartis restricted shares or restricted share units (RSUs) that are deferred and vest after three years. Each restricted share is entitled to voting rights and pay-ment of dividends during the vesting period. Each RSU is equivalent in value to one Novartis share but does not carry any dividend, dividend equivalent or voting rights. Following the vesting period, settlement of RSUs is made in unrestricted Novartis shares or American Depositary Receipts (ADRs).
If a participant leaves Novartis due to voluntary res-ignation or misconduct, unvested restricted shares and RSUs are forfeited. The Board of Directors and the Com-pensation Committee retain accountability for ensuring that the plan rules are applied correctly, and for deter-mining whether a different treatment should apply in exceptional circumstances. This is necessary to ensure that the treatment of any award in the event of cessation of employment is appropriate.
Executives may choose to receive all or part of the cash portion of their Annual Incentive in Novartis shares or ADRs (US only) that will not be subject to forfeiture conditions. In the US, awards may also be delivered in cash under the US-deferred compensation plan.
Long-Term Incentive plansNovartis operates two Long-Term Incentive plans (the Long-Term Performance Plan and the Long-Term Rela-tive Performance Plan) for the Executive Committee members, which are granted under the same plan rules, differing only with respect to the performance conditions applied.
GRant oF LonG-teRm inCentiVe pLansAt the beginning of every performance-period, Execu-tive Committee members are granted a target number of performance share units (PSUs) under each of the Long-Term Incentive plans according to the following formula:
VestinG oF LonG-teRm inCentiVe pLansAt the end of the three-year performance-period, the Compensation Committee adjusts the number of PSUs realized based on actual performance.
Long-Term Incentive plans payout formula
The performance factor can range from 0% to 200% of target. Each realized PSU is converted into one Novartis share at the vesting date. PSUs do not carry voting rights, but do accrue dividend equivalents that are reinvested in additional PSUs and delivered at vesting to the extent that performance conditions have been met. In the US, awards may also be delivered in cash under the US-de-ferred compensation plan.
If a participant leaves Novartis due to voluntary res-ignation or termination by the company for misconduct, none of the awards vest. When a member is terminated by the company for reasons other than performance or conduct, the award vests on a pro-rata basis for time spent with the company during the performance-period. In such a case, the award will vest on the regular vesting date (no acceleration), will be subject to performance should an evaluation be possible, and will also be sub-ject to other conditions such as observing the conditions of a non-compete agreement. Executives leaving Novartis due to approved retirement, including approved early retirement, death or disability, will receive full vest-ing of their award on the normal vesting date (accelera-tion will only apply in the case of death). The award will be subject to performance, should an evaluation be pos-sible, and will also be subject to other conditions such as observing the conditions of a non-compete agree-ment. Further details can be found in Note 26 to the Group’s audited consolidated financial statements (page 229).
The Board of Directors and the Compensation Com-mittee retain accountability for ensuring that the plan rules are applied correctly, and for determining whether different treatment should apply in exceptional circum-stances. This is necessary to ensure that the treatment of any award in the event of cessation of employment is appropriate.
=/
=xstep 1 Annual base compensation
Target incentive % Grant value
step 2 Grant value Share price target number of psUs
Target number of PSUs
Performance factor =x
Realized psUs
+ dividend
equivalents

Novartis Annual Report 2016 | 119Compensation RepoRt2016 executive Committee compensation system
LonG-teRm peRFoRmanCe pLan (Ltpp)This is the first of the two Long-Term Incentive plans.
OVERVIEW
The LTPP, as described below, was granted for the first time to the CEO and other Executive Committee mem-bers in 2014, and the first payout under this plan for per-formance-period 2014–2016 is disclosed on page 127. The LTPP target incentive is 200% of annual base com-pensation for the CEO, and ranges from 140% to 190% for the other Executive Committee members.
PERFORMANCE MEASURES
Awards under the LTPP are based on three-year performance objectives and split as follows:
FINANCIAL MEASURE (NOVARTIS CASH VALUE ADDED): 75% OF LTPP
The Novartis Cash Value Added (NCVA) is a metric that incentivizes sales growth and margin improvement as well as asset efficiency. A summary of the calculation is below.
Calculation formula for NCVA
The NCVA targets are determined considering expected growth rates in sales, operating income, and return from invested capital (under foreseen economic circum-stances).
At the end of the performance-period, the NCVA per-formance factor is calculated using results in constant currencies. The NCVA performance factor is based on a 1:3 payout curve, where a 1% deviation in realization versus target leads to a 3% change in payout (for exam-ple, a realization of 105% leads to a payout factor of 115%). Accordingly, if performance over the three-year vesting period falls below 67% of target, no payout is made for this portion of the LTPP. If performance over the three-year vesting period is above 133% of target, payout for this portion of the LTPP is capped at 200% of target.
The calculated performance realization is adjusted for unplanned major events during the performance-pe-riod (e.g., significant merger and acquisition transac-tions).
INNOVATION MEASURE: 25% OF LTPP
Innovation is a key element of the Novartis strategy. Divi-sional and unit innovation targets are set at the begin-ning of the performance-period, comprised of up to 10 target milestones that represent the most important research and development project milestones for each division and unit. These milestones are chosen because of the expected future impact to Novartis in terms of potential revenue, or due to their qualitative potential impact to science, medicine, and the treatment or care of patients.
A payout matrix has been established for this metric that allows a 0–150% payout for the achievement of tar-get milestones. A 150–200% payout may be awarded for extraordinary additional achievement. The CEO and cor-porate function heads receive the weighted average of divisional and unit innovation payouts.
The Research & Development Committee assists the Board of Directors and the Compensation Committee in setting the innovation targets and reviewing achieve-ments at the end of the performance-period.
measure
Ceo, corporate function and certain organizational unit heads
Commercial division and unit heads, and head of research unit
Novartis Cash Value Added
Up to 10 key innovation milestones
100% divisional/unit performance
Weighted average of divisional/unit
performance
75% financial 25% innovation
100% Group
in constant currencies
operating income
– Capital charge (based on WACC1) on gross operational assets
= nCVa2
1 WACC = weighted average cost of capital2 NCVA = (cash flow return on investment % – WACC1) x gross operational assets
+ Amortization, impairments and adjusting for gains/losses from non-operating financial assets
– Taxes

120 | Novartis Annual Report 2016
LonG-teRm ReLatiVe peRFoRmanCe pLan (LtRpp)This is the second of the two Long-Term Incentive plans.
OVERVIEW
The LTRPP was granted for the first time to the CEO and other Executive Committee members in 2014, and the first payout under this plan for performance-period 2014–2016 is disclosed on page 128. As of 2016, the tar-get incentive is 125% of annual base compensation for the CEO (a 25 percentage-point increase from 2015), and ranges from 30% to 80% for the other Executive Committee members.
PERFORMANCE MEASURE
The LTRPP is based on the achievement of long-term relative TSR versus the global healthcare peer group over rolling three-year performance-periods. TSR is cal-culated in USD as share price growth plus dividends over the three-year performance-period. The calculation is based on Bloomberg standard published TSR data, which is publicly available.
The peer group for the 2016–2018 performance-pe-riod is the same as for benchmarking the compensation of the CEO and other Executive Committee members and is comprised of: Abbott, AbbVie, Amgen, AstraZen-eca, Bristol-Myers Squibb, Eli Lilly & Co., GlaxoSmith-Kline, Johnson & Johnson, Merck & Co., Pfizer, Roche and Sanofi.
At the end of the performance-period, all companies are ranked in order of highest to lowest TSR, and the position in the peer group determines the payout range as follows:
LTRPP payout matrix
position in peer group payout range
Positions 1–3 160–200%
Positions 4–6 100–140%
Positions 7–10 20–80%
Positions 11–13 0%
The Compensation Committee uses its discretion to determine the payout factor within the ranges shown, and takes into consideration factors such as absolute TSR, overall economic conditions, currency fluctuations and other unforeseeable situations. The Compensation Committee believes that the LTRPP payout matrix is aligned with the company’s pay-for-performance princi-ple, including a very significant reduction in the actual payout relative to target payout if the company’s TSR is below the median of the peer group. The LTRPP payout matrix is aligned with practices at the companies in our global healthcare peer group.
Target disclosureTo allow shareholders to assess the link between com-pany performance and compensation, Novartis is com-mitted to disclosing in the Compensation Report the tar-gets of our compensation programs at the end of each performance-period – including judgment used in assessing actual performance versus targets. In line with this principle, the targets and achievements of the CEO for the 2016 Annual Incentive, the LTPP and the LTRPP for the performance-period 2014–2016 can be found on pages 124–126.
This approach is proposed to our shareholders given that disclosing our short- and long-term targets under our compensation programs before the end of the rele-vant performance-period would give substantial insight into the company’s confidential, forward-looking strate-gies, and could therefore place the company and its shareholders at a competitive disadvantage.

Novartis Annual Report 2016 | 121Compensation RepoRtexecutive Committee performance management process
Executive Committee performance management processTo foster a high-performance culture, the company applies a uniform performance management process worldwide based on quantitative and qualitative criteria, including our Values and Behaviors. Novartis associates, including the CEO and other Executive Committee mem-bers, are subject to a formal three-step process.
CEO objective setting
This section describes the objective-setting process to determine the stretch targets of our Annual Incentive plan and the LTPP. No objective setting is required for the LTRPP.
INDIVIDUAL TARGETS OF THE CEO ANNUAL INCENTIVE
The CEO discusses his individual objectives for the com-ing year directly with the Chairman of the Board of Direc-tors prior to the start of the performance-period. The Chairman reviews the CEO’s individual objectives before they are discussed and approved by the Board of Direc-tors. The agreed individual objectives are also part of the CEO’s balanced scorecard and laid out as Novartis pri-orities for the coming year.
GROUP FINANCIAL TARGETS OF THE CEO ANNUAL INCENTIVE AND LTPP
The Board of Directors and the Compensation Commit-tee use a rigorous process to establish Group financial targets for the Annual Incentive and the LTPP. The objec-tive-setting process for Group financial targets begins with bottom-up input from our commercial and organi-zational divisions and units by country and brands. The bottom-up input process takes into account both inter-nal and external market and regulatory factors, such as new product launches, patent expiries, pricing pressures, changes in the healthcare environment, investments in capital expenditure, and resource allocation decisions. The Group financial targets support our ambition to be a leader in the healthcare industry without encouraging unnecessary or excessive risk taking, while being fully in line with Group compliance, conduct and accounting standards.
The financial targets are reviewed and challenged at the country, regional and Group levels as well as by the Executive Committee before they are proposed in December – prior to the start of the performance-period – to the Board of Directors.
The Board of Directors reviews and assesses the proposed financial targets in detail to ensure that they
are set at levels that are sufficiently and appropriately challenging. This review takes into account a variety of relevant information including internal business plans, external market consensus, strategic choices to be made by the company, and industry expectations for the com-panies of our global healthcare peer group. Following this thorough review by the Board of Directors, the final objectives are approved early in the year and incorpo-rated into the CEO Annual Incentive balanced scorecard and the LTPP.
INNOVATION TARGETS OF LTPP
Each year, the divisions and units evaluate their long-term strategic plans to develop recommendations for innovation targets that are focused on challenging mile-stones of critical importance to the long-term success of the business, and that should be the best- or first-in-class development projects that can significantly advance treatment outcomes for patients worldwide. These targets are presented by the Global Head of Drug Development and Chief Medical Officer for Novartis as well as the President of the Novartis Institutes for Bio-Medical Research (NIBR) at a joint meeting of the Research & Development Committee and the Compen-sation Committee. Both Committees review, discuss and challenge the targets before they are finalized and approved by the Board of Directors. The innovation tar-gets of the LTPP are largely aligned with the major devel-opment projects outlined in the pipeline schedule of the Annual Report (see page 52).
CEO performance evaluation
The Board of Directors periodically assesses Group business performance, as well as the CEO’s progress against his objectives and incentive plan targets. At the mid-year performance review, the performance of the CEO is reviewed by the Chairman of the Board of Direc-tors.
For the year-end review, the CEO prepares and pres-ents to the Chairman of the Board of Directors, and later to the full Board of Directors, the actual results against the previously agreed-upon objectives, taking into account the financial results as well as an assessment against our Values and Behaviors. At the year-end review, the Board of Directors discusses the performance of the CEO without him being present. The Board of Directors evaluates the degree to which the set objectives have been achieved and – to the extent possible – compares these results with peer industry companies, taking into account general economic and financial criteria as well as industry developments. The Board of Directors later shares its assessment with the CEO.
objective setting performance evaluation
Compensation determination

122 | Novartis Annual Report 2016
CEO compensation determination
As part of the review of CEO compensation, the Com-pensation Committee considers a competitive analysis of CEO target compensation prepared by its indepen-dent advisor and, based on competitive factors as well as individual and company performance, determines any recommendations for changes to target compensation for the coming year.
At its January meeting, following a recommendation from the Compensation Committee, the Board of Direc-tors approves the CEO’s variable compensation for the prior performance-periods and the target compensation for the coming year. This meeting takes place without the CEO being present. The Board of Directors later shares its decisions with the CEO.
Performance management process for the other Executive Committee members (excluding the CEO)
The other Executive Committee members propose the financial and non-financial targets for their division or unit for review, challenge and approval by the CEO and, subsequently (as previously described), by the Board of Directors and Compensation Committee. In addition, each Executive Committee member agrees on individ-ual objectives with the CEO, who also reviews each mem-ber’s performance at mid-year and year-end.
Following the year-end evaluation, the CEO meets with the Chairman of the Board of Directors, who reviews the performance of each Executive Committee member. Subsequently, the CEO presents and discusses at the Board of Directors meeting the recommended perfor-mance rating for each Executive Committee member.
Shortly after year-end, the CEO proposes a payout for the Annual Incentive for each Executive Committee member based on the performance ratings and corre-sponding to the payout matrix. The Compensation Com-mittee discusses each member’s performance with the CEO and approves the Annual Incentive payouts for the prior year as well as any changes to target compensa-tion for the coming year. The Compensation Committee informs the Board of Directors of its final decisions, and the CEO later shares these decisions with each Execu-tive Committee member.
Assessment of Values and Behaviors at Novartis
Values and Behaviors have been an integral part of the company’s compensation system since its foundation. In 2015, to reinforce the culture of the company, Novartis rolled out six new Values and Behaviors – which are inno-vation, quality, collaboration, performance, courage and integrity.
What we value observed behaviors
innovation
Experiment — Experiment and encourage others to do soand deliver — Take smart risks that benefit patientssolutions and customers — Deliver new solutions with speed and simplicity
Quality
Take pride — Look for better ways to do thingsin doing ordinary — Do not compromise on quality and safety;things extra- strive for excellenceordinarily well — Always work on your strengths and weaknesses
Collaboration
Champion — Champion working together high-performing in high-performing teamsteams with — Know yourself and your impact on othersdiversity — Welcome diversity and inclusion of styles,and inclusion ideas and perspectives
performance
Prioritize — Show passion to achieve goals; go the extra mileand make — Put team results before your own success;things happen acknowledge the contributions of otherswith urgency — Prioritize, make decisions, and make things happen with urgency
Courage
Speak up, and — Speak up and challenge the normgive and — Acknowledge when things do not work; learnreceive feedback — Give and accept constructive feedback
integrity
Advocate — Operate with high ethical standardsand apply — Be humble and caring, and show trust,high ethical respect and empathy to othersstandards — Live by the Code of Conduct every day even when facing resistance or difficulties
These values are embedded in all aspects of employees’ lives at Novartis, including recruitment, development and promotions; performance assessments through 360-degree evaluations and organizational employee surveys; and Annual Incentive awards; to measure indi-vidual and organizational performance against our val-ues. As part of the Annual Incentive award process, train-ing programs and toolkits were established to evaluate behavior related to the six new values. They are one of the elements used to assess associates’ performance.
In 2015 and again in 2016, we further improved the framework for measuring individual performance against our values, ensuring that fair, objective assessments can be made in a uniform way across all levels of the organi-zation. The assessment is part of a rigorous manage-ment process review in which observed Values and Behaviors are evaluated based on globally-defined prin-ciples. The assessment initially takes place during a dis-cussion between associates and line managers, followed by a calibration and validation at multiple levels of the organization to allow for a fair, consistent, objective and transparent evaluation. During the calibration sessions, line managers share the proposed ratings of their direct reports with management peers to ensure all apply a common framework, and they seek input and feedback on observed behaviors.
The Values and Behaviors assessments for the CEO and other Executive Committee members are made and calibrated by the Board of Directors.

Novartis Annual Report 2016 | 123Compensation RepoRt2016 Ceo compensation
2016 CEO compensationThis section provides information on the CEO target compensation followed by the 2016 CEO realized compensa-tion on a voluntary basis.
1. 2016 CEO target compensation
Following a competitive analysis of the CEO’s compen-sation and an evaluation of the CEO’s performance in 2015, the Compensation Committee approved an increase in the CEO’s target compensation effective for 2016. The target compensation is the amount that the CEO is eligible to receive if there is 100% achievement of all short-term and long-term targets for the respec-tive performance-periods, excluding any dividend equiv-alents and share price movement.
Among other things, the Compensation Committee considered that the CEO’s target compensation had not been increased in three years and that his compensa-tion was falling further below the median level of our global healthcare peer group. In recognition of this, the Compensation Committee approved:— An increase in annual base compensation from
CHF 2 060 500 to CHF 2 100 000 with effect from March 1, 2016
— A 25 percentage-point increase in CEO LTRPP target from 100% to 125% of annual base compensation as from the 2016–2018 performance-period to increase the competitiveness of the CEO’s target total com-pensation versus peers through the incentive vehicle most aligned to shareholders’ interests
In 2016, at target value, the CEO’s compensation included Annual Incentive at 150%, LTPP at 200% and LTRPP at 125% of annual base compensation. The payout range for all of these plans can vary between 0%–200% of the target. Therefore the total target compensation for the CEO is CHF 12 075 000 and can range from a minimum of CHF 2 100 000 to a maximum of CHF 22 050 000 (excluding pension and other benefits, any share price movements and any accrued dividend equivalents), based on the extent to which financial and strategic objectives for payout of short-term Annual Incentive and Long-Term Incentive plans are achieved. As a result, the 2016 CEO’s compensation at target was comprised of 19% fixed compensation (i.e. annual base compensation, pension and other benefits), 26% Annual Incentive, and 55% Long-Term Incentives.

124 | Novartis Annual Report 2016
2. 2016 CEO realized compensation
This section provides a detailed summary and break-down by component of the total realized compensation of the CEO in relation to the performance-periods ended December 31, 2016. This includes, for the first time, reporting of CEO realized total compensation in a single table.
To give context to the 2016 CEO realized compen-sation, within this section, we include details of the CEO’s achievements against his balanced scorecard targets along with the achievements under the LTPP (NCVA and Group Innovation) and LTRPP for the performance-pe-riod 2014–2016.
Reporting compensation at realized value in this way provides enhanced transparency to shareholders of the CEO’s compensation. We also consider that this approach is an important method of demonstrating the alignment between the Compensation Committee’s decisions on CEO pay for performance and sharehold-ers’ interests.
2016 CEO realized total compensation breakdownThe Compensation Committee believes it is critical to assess performance against a mix of targets (both short-term and long-term) for compensation-related purposes to reflect the full operational performance of the orga-nization and to ensure that results are delivered with high integrity and long-term financial sustainability. The Com-pensation Committee uses its judgment when determin-ing final compensation outcomes and any discretionary adjustments, positive or negative.
The CEO’s 2016 realized total compensation was CHF 10 556 685. This amount is comprised of 2016 annual base compensation, pension and other benefits, Annual Incentive and, for the 2014–2016 perfor-mance-period, the vesting of his LTPP and LTRPP awards including accrued dividend equivalents.
A detailed breakdown by component of the 2016 CEO realized compensation is set out below.
annUaL Base CompensationThe CEO annual base compensation paid in 2016 was CHF 2 093 417 (representing a 1.6% increase from 2015).
pension anD otHeR BeneFitsThe CEO received pension benefits of CHF 160 283 and other benefits of CHF 75 628 during 2016.
annUaL inCentiVeGiven the 2016 CEO balanced scorecard and assessed Values and Behaviors, the Annual Incentive award was CHF 2 835 010.
Following the performance evaluation of the CEO by the Board of Directors, the Compensation Committee thoroughly reviewed the assessment against the previ-ously agreed objectives as set out in the 2016 CEO bal-anced scorecard (see following page).
In reaching its recommendation to the Board of Direc-tors on the CEO’s 2016 Annual Incentive payout factor of 90% (which was subsequently approved by the Board of Directors), the Compensation Committee recognized that overall he met expectations, was successful in achieving significant milestones in innovation, and that Novartis met its free cash flow target while it was slightly below its sales target in a year of absorbing Gleevec US LOE. Group net income was below target mainly due to Alcon performance.
Among the major achievements in 2016 were Cosen-tyx reaching blockbuster status, Gilenya delivering dou-ble digit growth, Sandoz biopharmaceuticals reaching USD 1 billion of sales, and Entresto receiving positive treatment guidelines in the US and Europe.

Novartis Annual Report 2016 | 125Compensation RepoRt2016 Ceo compensation
2016 Ceo BaLanCeD sCoReCaRDThe Annual Incentive performance is measured in constant currencies to reflect the operational performance that can be influenced.
As a result of the CEO’s achievements as described above, a payout factor of 90% was approved for the CEO and the value of his 2016 Annual Incentive award was determined as follows:
Annual base x Target incentive x Performance factor = Final award compensation1 % of annual % of target CHF thousands CHF thousands base compensation
2016 Annual Incentive 2 100 x 150% x 90% = 2 835 2
1 As per plan rules, the Annual Incentive is calculated based on the annual base compensation effective March 1, 20162 50% of the Annual Incentive is paid in cash and the other 50% as 19 867 RSUs, which have a three-year vesting period.
performance metrics for continuing operations target1 achievement vs. target (weight) (in constant currencies)
Group
financial
targets
(60%)
Group net sales (30%) | USD 49 540 m | Slightly below
Corporate net result2 (20%) | USD –1 675 m | Slightly above
Group net income (30%) | USD 7 203 m | Below
Group free cash flow as % of sales (20%) | 18.8% | At target
achievement of Group financial targets slightly below
individual
objectives
(40%)
additional financial targets for continuing operations BelowIn constant currencies, core operating income and EPS were below target. Core EPS was slightly below. Divisional share of peers (Innovative Medicines and Sandoz) were ahead of target while Alcon was behind.
innovation and growth | ExceededThe company continued to strengthen its pipeline, with the NIBR unit producing 13 new Proof of Concepts (above target). In total, Novartis secured 14 approvals in Innovative Medicines, as well as 15 major submissions. Progress was made with the biosimilars pipeline at Sandoz, with the FDA approval of Etanercept and filing of Rituximab with the EMA. LEE011 (ribociclib) achieved FDA breakthrough therapy designation. Growth Products contributed USD 17.1 billion or 35% of net sales, up 20% (USD) over the prior year. Cosentyx was ahead of target, and reached blockbuster status. Entresto continued to grow steadily following positive treatment guidelines in the US and Europe.
Cross-divisional synergies | At targetIn January 2016, Novartis announced plans to further focus its divisions to better leverage our development and marketing capabilities. Novartis Business Services (NBS) continued to leverage the global scale of Novartis to streamline and consolidate operations. Novartis Technical Opera-tions completed the organizational integration including a more efficient utilization of functional capabilities and resources. Novartis completed the creation of its new Global Drug Development (GDD) organization to further streamline drug development. A total of 38 000 associates rea-ligned to new business organizations with effect from July 1, 2016 with minimal business dis-ruption. All these actions will increase the productivity of the company and provide a solid foun-dation for the future growth and profitability of Novartis.
High-performing organization (e.g., quality, talent) | At targetNovartis continues to proactively drive compliance, reliable product quality and sustainable effi-ciency as part of the quality strategy. Compliance issues which were uncovered and remediated mainly related to legacy failures. A total of 206 global health authority inspections were com-pleted in 2016, 26 of which were conducted by the FDA. All but 4 out of 206 inspections were deemed good or acceptable. Corrective and preventative actions to address all observations have been defined and are being implemented. In 2016, Novartis combined several innovative Access programs into a single portfolio under unified leadership. The Group was successful in filing approximately three quarters of its Novartis Top Leader roles (the company’s 360 most senior executives) internally. Women in management increased to 42% and Novartis continues to be recognized in the market for its efforts in diversity and inclusion. Our Values and Behaviors continued to progress in employee pulse surveys and have been embedded in all aspects of associates’ lives at Novartis and significant progress has been made in embedding a culture of integrity in a sustainable way.
achievement of individual objectives at target1 The target was set using July 2015 forward currency exchange rates.2 Includes corporate cost, income from associated companies, net financial income and income taxes.

126 | Novartis Annual Report 2016
oUtCome oF tHe Ltpp peRFoRmanCe-peRioD 2014–2016The LTPP payout for the CEO for performance-period 2014–2016 is CHF 4 950 334, including CHF 485 037 of dividend equivalents. The LTPP payout factor for the CEO was 112% based on the outcome of the performance objectives below.
oUtCome oF tHe LtRpp peRFoRmanCe-peRioD 2014–2016
The LTRPP payout for the CEO for performance-period 2014–2016 is CHF 442 013, including CHF 43 309 of div-idend equivalents. The LTRPP payout factor applicable to the CEO was 20% based on Novartis TSR rank position, in USD, being 10th in the comparator group of 13 healthcare companies (Novartis and 12 other companies).
In USD our TSR was flat for the three-year period 2014–2016 while in CHF TSR was up +15%. In reaching its decision on the payout factor, the Compensation Committee exercised its discretion within the boundaries of the LTRPP payout matrix (see page 120) and decided that the minimum of the payout range should apply.
2016 CEO realized total compensation tableThe following table is newly introduced to aid shareholders’ understanding of 2016 realized total compensation of the CEO. It reports, the aggregate fixed and variable compensation in the year, including the LTPP and the LTRPP payouts for performance-period 2014–2016 following their respective completed performance assessments.
Equity relating to the 2016 Annual Incentive is disclosed using the underlying value of Novartis shares on the date of grant, while the realized value for the LTPP and LTRPP payouts (including dividend equivalents) is calcu-lated using the share price on the date of vest. In both cases the applicable date is January 17, 2017 and the share price was CHF 71.35 per Novartis share.
2016 base 2016 pension 2016 Annual Incentive Realized LTPP Realized LTRPP Other 2016 Total realized
compensation benefits 2014–2016 period 2014–2016 period compensation compensation
Equity Shares Shares
Cash Cash (value at (value at (value at
Currency (amount) Amount 1 (amount) grant date) 2 vesting date) 3 vesting date) 3 Amount 4 Amount 5
Joseph Jimenez (CEO) CHF 2 093 417 160 283 1 417 500 1 417 510 4 950 334 442 013 75 628 10 556 685
1 Includes service costs of pension and post-retirement healthcare benefits accumulated in 2016, in accordance with IAS19. It also includes an amount of CHF 4 336 for mandatory employer contributions for the CEO paid by Novartis to Swiss governmental social security systems. This amount is out of total employer contributions of CHF 1 144 673, and provides a right to the maximum future insured government pension benefit.
2 The portion of the Annual Incentive delivered in RSUs is rounded up to the nearest share.3 For the performance-period 2014-2016, the accrued dividend equivalent amounts were CHF 485 037 and CHF 43 309 respectively for the LTPP and the LTRPP.4 Includes any other perquisites and benefits in kind.5 All amounts are before deduction of the employee’s social security contribution and income tax due by the CEO.
2015 CEO realized compensation It should be noted that a direct year over year comparison to the 2016 realized compensation is not possible given the changes made in 2014 to our Long-Term Incentive plans from the Old LTPP (OLTPP) to the LTPP and LTRPP, and the fact that OLTPP awards did not accrue dividend equivalents.
However, using the 2016 methodology for reporting realized compensation, the CEO’s 2015 realized total com-pensation is calculated as CHF 10 911 330 (with no dividend equivalents accrued, per the OLTPP rules), including CHF 5 496 351 OLTPP payout for the performance-period 2013–2015.
measure Weight targets and achievements
novartis
Cash Value
added
(nCVa)
75% Over the three-year performance period, 2014 to 2016, Novartis performed 4.4% ahead of the USD 10.1 billion NCVA target in constant currencies. This was mainly due to over achievements in the beginning of the performance-period driven by stronger than anticipated performance of Gleevec and the successful launch of Cosentyx. NCVA was negatively impacted by Alcon underperformance at the end of the cycle. Overall this corresponded to a payout of 113% following the application of the 1:3 payout curve. In arriving at the NCVA performance score, the Compensation Committee excluded, as a major item, the favorable impact from lower cost of capital.
Group
innovation 25% Novartis delivered strong innovation performance over the period 2014–2016 despite usual attrition rates inherent to
pharmaceutical drug development. The majority of innovation targets were achieved by our divisions and units many of which will have a significant positive impact for both the company and patient outcomes. The company successfully achieved major innovation milestones, including Entresto (approved in the US and the EU), Cosentyx (approved for AS and PsA in EU and in the US) and submissions of biosimilar etanercept and pegfilgrastim. Zarxio (filgrastim) was the first biosimilar approved in the US under the BPCIA pathway. Based on the evaluation performed by the R&D Committee, the Board of Directors approved, in line with a recommendation from the Compensation Committee, a payout factor for group innovation of 107% applicable to the CEO. This corresponds to the weighted average of divisional and unit innovation payouts.

Novartis Annual Report 2016 | 127Compensation RepoRtCeo and other executive Committee members’ 2014–2016 Long-term incentive plans vesting
CEO and other Executive Committee members’ 2014–2016 Long-Term Incentive plans vestingOverviewIn this section, the tables reconcile the target values at grant date with the total value of shares delivered to the CEO and other Executive Committee members (includ-ing dividend equivalents) following the vesting of the first performance-period 2014–2016 for the LTPP and the LTRPP respectively. Details of the LTPP and the LTRPP can be found on pages 118–120.
We recognize the importance to our shareholders of being able to easily reconcile the payout of our Long-
Term Incentive plans against the original amounts granted. It allows an assessment of pay for performance decisions by the Compensation Committee.
The Long-Term Incentive plans’ payout outcomes for the other Executive Compensation members is deter-mined using an approach closely aligned to the method-ology used for the CEO described on page 126. For the LTPP, the NCVA measure applies to the other Executive Committee members as it does for the CEO. However, the innovation measure is specific to the performance of the respective division or unit. To determine the LTRPP payout, the same principles apply as for the CEO.
Payout schedule for the LTPP performance-period 2014–20161
PSUs at grant
Shares delivered at vesting
Dividend Total shares
PSUs Performance shares Dividend equivalent shares delivered at vesting
(target value Payout factor Performance shares delivered at vesting equivalent shares delivered at vesting (value at
PSUs at grant date) for LTPP delivered at vesting (value at vesting date) delivered at vesting (value at vesting date) vesting date)
(target number) (CHF)2 (% of target) (number) (CHF)3 (number)4 (CHF) (CHF)
Joseph Jimenez (CEO) 55 878 4 121 003 112% 62 583 4 465 297 6 798 485 037 4 950 334
Other 7 members of the Executive
Committee who were active members
on December 31, 2016 5 75 962 5 602 506 107%–114% 84 539 6 030 352 9 080 647 739 6 678 091
subtotal 131 840 9 723 509 147 122 10 495 649 15 878 1 132 776 11 628 425
Other 3 members of the Executive
Committee members who stepped
down during 2016 72 699 5 366 905 106%–115% 81 651 5 799 375 9 150 649 864 6 449 239
total 204 539 15 090 414 228 773 16 295 024 25 028 1 782 640 18 077 664
1 For those who joined the Executive Committee in the course of the performance-period 2014-2016, the information disclosed reflects the pro-rata LTPP 2014-2016 payout attributable to the period they were a member of the Executive Committee. Includes 3 039 target PSUs granted to Vasant Narasimhan under the OLTPP for the performance-period 2014-2016. The payout factor for the OLTPP 2014-2016 is 113% of target.
2 The shown amounts represent the underlying share value of the target number of PSUs granted to each Executive Committee member for the performance-period 2014-2016 based on the closing share price on the grant date (January 22, 2014) of CHF 73.75 per Novartis share and USD 80.79 per ADR.
3 The shown amounts represent the underlying share value of the target number of PSUs vested for the performance-period 2014-2016 based on the closing share price on the vesting date (January 17, 2017) of CHF 71.35 per Novartis share and USD 71.99 per ADR.
4 Dividend equivalent shares are calculated on the dividend each member of the Executive Committee would have received based on the actual number of shares delivered at the end of the performance-period 2014-2016. At vesting, the dividend equivalents are credited in shares or ADRs.
5 Excludes F. Michael Ball, James Bradner and Paul Hudson, who joined the Executive Committee in 2016 and have not participated in the LTPP for the performance-period 2014-2016
For the CEO and other Executive Committee members, including those who stepped down during the year, the combined impact of the performance factor and share price movements over the performance-period to deter-mine the value of performance shares delivered at vesting, compared to the target value at grant date, was CHF 1.2 million excluding dividend equivalents. Of that amount, the impact of the share price movement over the perfor-mance-period was CHF –583 548.

128 | Novartis Annual Report 2016
Payout schedule for the LTRPP performance-period 2014–20161
PSUs at grant
Shares delivered at vesting
Performance shares Dividend Total shares
PSUs delivered at vesting Dividend equivalent shares delivered at vesting
(target value Payout factor Performance shares (value at equivalent shares delivered at vesting (value at
PSUs at grant date) for LTRPP delivered at vesting vesting date) delivered at vesting (value at vesting date) vesting date)
(target number) (CHF)2 (% of target) (number) (CHF)3 (number)4 (CHF) (CHF)
Joseph Jimenez (CEO) 27 939 2 060 501 20% 5 588 398 704 607 43 309 442 013
Other 6 members of the Executive
Committee who were active members
on December 31, 2016 5 20 043 1 478 226 20% 4 008 285 926 435 31 033 316 959
subtotal 47 982 3 538 727 9 596 684 630 1 042 74 342 758 972
Other 3 members of the Executive
Committee members who stepped
down during 2016 30 042 2 218 214 20% 6 008 426 414 677 48 048 474 462
total 78 024 5 756 941 15 604 1 111 044 1 719 122 390 1 233 434
1 For those who joined the Executive Committee in the course of the performance-period 2014-2016, the information disclosed reflects the pro-rata LTRPP 2014-2016 payout attributable to the period they were a member of the Executive Committee.
2 The shown amounts represent the underlying share value of the target number of PSUs granted to each Executive Committee member for the performance-period 2014-2016 based on the closing share price on the grant date (January 22, 2014) of CHF 73.75 per Novartis share and USD 80.79 per ADR.
3 The shown amounts represent the underlying share value of the target number of PSUs vested for the performance-period 2014-2016 based on the closing share price on the vesting date (January 17, 2017) of CHF 71.35 per Novartis share and USD 71.99 per ADR.
4 Dividend equivalent shares are calculated on the dividend each member of the Executive Committee would have received based on the actual number of shares delivered at the end of the performance-period 2014-2016. At vesting, the dividend equivalents are credited in shares or ADRs.
5 Excludes F. Michael Ball, James Bradner, Paul Hudson and Vasant Narasimhan, who joined the Executive Committee in 2016 and have not participated in the LTRPP for the performance-period 2014-2016
For the CEO and other Executive Committee members, including those who stepped down during the year, the combined impact of the performance factor and share price movements over the performance-period to deter-mine the value of performance shares delivered at vesting, compared to the target value at grant date, was CHF –4.6 million excluding dividend equivalents. Of that amount, the impact of the share price movement over the performance-period was CHF –40 285.

Novartis Annual Report 2016 | 129Compensation RepoRtCeo and other executive Committee members’ compensation at grant value
CEO and other Executive Committee members’ compensation at grant valueIn accordance with the Ordinance against Excessive Compensation in Listed Companies in Switzerland we continue to disclose, in this section, total compensation at grant value for the CEO and other Executive Commit-tee members.
In 2016, Novartis implemented organizational changes to pursue its growth and innovation strategy with the following appointments to the Executive Com-mittee:— Effective February 1, 2016, F. Michael Ball was appointed
CEO of Alcon following the departure of Jeff George. In line with the company’s priorities for 2016, Mr. Ball received a one-off performance- based Long-Term Incentive award linked to Alcon-specific growth tar-gets over a three-year period to further incentivize him to return the division to growth, accelerate inno-vation and sales, strengthen customer relationships, and improve basic operations.
— Also effective February 1, 2016, Dr. Vasant Narasim-han was appointed Global Head of Drug Development and Chief Medical Officer to lead our drive to improve resource allocation and standards in drug develop-ment across divisions and business units.
— On March 1, 2016, as previously announced in the 2015 Compensation Report, Dr. James Bradner became President of NIBR when Dr. Mark Fishman retired. Prior to joining Novartis, Dr. Bradner was on the fac-ulty of Harvard Medical School in the Department of Medical Oncology at the Dana-Farber Cancer Insti-tute in the US. Dr. Bradner also advised and served on the boards of several scientific companies he founded, and served on the supervisory board of another com-pany. As previously disclosed, in reaching the terms of the offer for Dr. Bradner, the Board of Directors rec-ognized the need to make up compensation that he forfeited by joining Novartis.
— On July 1, 2016, Novartis created two separate busi-ness units, Novartis Pharmaceuticals and Novartis Oncology, which together form the Innovative Medi-cines Division. As part of this reorganization, Bruno Strigini was appointed CEO of Novartis Oncology, and Paul Hudson was appointed CEO of Novartis Phar-maceuticals. Prior to joining Novartis, Mr. Hudson served as an executive at another company. In reach-ing the terms of the offer for Mr. Hudson, the Board of Directors recognized the need to make up com-pensation that he forfeited by joining Novartis. With these changes, David Epstein, former Division Head of Novartis Pharmaceuticals, stepped down from the Executive Committee on June 30, 2016. In accor-dance with the terms of his retirement agreement as well as his employment contract, Mr. Epstein will leave the company in July 2017 after the expiry of his con-tractual 12-month notice period.
The tables below disclose for the CEO and the other Executive Compensation members the fixed compen-sation (e.g., base compensation and pension benefits), variable compensation (e.g., the cash portion of the 2016 Annual Incentive and the granted share based compen-sation of the 2016 Annual Incentive, and the LTPP and LTRPP for the performance-period 2016–2018), plus other compensation. Other 2016 compensation includes the full amount of compensation for lost entitlements from former employers either paid in cash or granted in equity in the year.
PSUs awarded under the Long-Term Incentive plans are reported at target value on the respective grant dates (i.e. assuming the PSUs will vest at 100% achievement and excluding any dividend equivalents that may be accrued during the performance-period). The actual pay-out outcomes for the PSUs will be assessed after the relevant performance-periods complete, with a payout range of 0–200% of the target value.

130 | Novartis Annual Report 2016
CEO and other Executive Committee members’ compensation at grant value for financial year 2016
Fixed compensation and Variable compensation
pension benefits
Actual compensation paid or granted for 2016 Long-Term Incentive
2016 grants at target
2016 base 2016 pension 2016 Annual Incentive LTPP LTRPP Other 2016 Total
compensation benefits 2016–2018 period 2016–2018 period compensation compensation
Equity PSUs PSUs
Cash Cash (value at (target value (target value
Currency (amount) Amount 1 (amount) grant date) 2 at grant date) 3 at grant date) 3 Amount 4 Amount 5
executive Committee members active on December 31, 2016 6
Joseph Jimenez
(CEO) CHF 2 093 417 160 283 1 417 500 1 417 510 4 200 031 2 625 079 75 628 11 989 448
Steven Baert CHF 721 667 147 442 554 730 554 746 1 050 048 350 042 139 159 3 517 834
F. Michael Ball
(from February 1, 2016) 7 USD 1 012 308 60 574 553 574 553 603 1 742 284 762 269 4 040 748 8 725 360
James Bradner
(from March 1, 2016) 8 USD 888 462 58 859 579 393 579 448 1 687 473 794 195 1 155 169 5 742 999
Felix R. Ehrat CHF 915 833 148 122 202 400 809 680 1 564 033 552 002 14 852 4 206 922
Richard Francis CHF 786 667 188 738 520 000 520 070 1 280 062 480 033 1 116 054 4 891 624
Paul Hudson
(from July 1, 2016) 9 CHF 475 000 108 818 288 945 288 968 0 0 3 090 313 4 252 044
Harry Kirsch CHF 1 025 000 141 510 736 450 736 475 1 751 009 824 018 51 361 5 265 823
Vasant Narasimhan
(from February 1, 2016) CHF 764 993 157 348 537 531 537 551 1 093 245 364 468 102 868 3 558 004
Bruno Strigini
(from July 1, 2016) CHF 445 000 109 057 211 863 211 910 1 074 442 268 670 45 696 2 366 638
André Wyss CHF 830 834 146 289 0 1 275 025 1 360 001 425 040 95 595 4 132 784
subtotal 10 CHF 9 931 091 1 425 275 5 585 643 7 468 241 16 751 942 7 422 814 9 850 656 58 435 662
executive Committee members who stepped down during 2016 11
David Epstein
(until June 30, 2016) 12 USD 699 767 290 385 428 400 428 412 1 285 264 642 632 4 529 809 8 304 669
Mark C. Fishman
(until February 29, 2016) 13 USD 175 154 107 706 195 000 0 0 0 126 454 604 314
Jeff George
(until January 31, 2016) 14 USD 80 000 18 558 44 000 43 986 0 0 2 996 905 3 183 449
subtotal 10 CHF 940 809 410 492 657 537 465 417 1 266 270 633 135 7 540 067 11 913 726
total 10 CHF 10 871 900 1 835 767 6 243 180 7 933 658 18 018 212 8 055 949 17 390 723 70 349 389
See page 131 for 2015 compensation figures 1 Includes service costs of pension and post-retirement healthcare benefits accumulated in 2016, in accordance with IAS19. It also includes an amount of CHF 75 216 for mandatory employer contributions for all
Executive Committee members paid by Novartis to governmental social security systems. This amount is out of total employer contributions of CHF 3 263 989, and provides a right to the maximum future insured government pension benefit for the Executive Committee member.
2 The portion of the Annual Incentive delivered in equity is rounded up to the nearest share based on the closing share price on the grant date (January 17, 2017) of CHF 71.35 per Novartis share and USD 71.99 per ADR.
3 The shown amounts represent the underlying share value of the target number of PSUs granted to Executive Committee members for the performance-period 2016-2018 based on the closing share price on the grant date (January 20, 2016) of CHF 79.70 per Novartis share and USD 80.49 per ADR. For F. Michael Ball, who joined Novartis on February 1, 2016, the target PSUs were granted on February 1, 2016, at the closing share price of the same date (USD 77.27 per ADR).
4 Includes any other perquisites, benefits in kind, and international assignment benefits as per the global mobility policy (e.g., housing, international health insurance, children’s school fees, tax equalization). Tax equalization benefits included for David Epstein, Richard Francis and Jeff George are USD 478 904, CHF 862 101 and USD 961 519, respectively.
5 All amounts are before deduction of the social security contribution and income tax due by the Executive Committee member. 6 For those members who joined the Executive Committee in 2016, the information under the columns “Base compensation,” “Pension benefits” and “Annual Incentive” includes their pro-rata compensation from
the date they joined the Executive Committee to December 31, 2016. The information under “LTPP” and “LTRPP” reflects their pro-rata compensation at target for the period to December 31, 2018. 7 F. Michael Ball received 50 000 target PSUs, mainly subject to the achievement of Alcon’s sales and core operating income growth targets, as well as successful launches of new products and solving critical
supply issues. The total target value at grant date was USD 3.9 million. The 50 000 target PSUs are subject to performance conditions assessed annually in three tranches of 16 667, 16 667 and 16 666 for the calendar years 2016, 2017 and 2018, respectively. The PSUs vest on February 1, 2019, provided the relevant performance conditions are met and he remains employed with Novartis on that date. Subject to the extent to which the performance conditions are fulfilled, between 0% and 200% of the target PSUs may vest. The full value of the target PSUs is included under the column “Other 2016 compensation.”
8 James Bradner received 3 607 RSUs for lost entitlements in connection with his former supervisory board mandate, with a total value at grant date of USD 309 300. The vesting of the RSUs will be staggered based on the original vesting period of the lost entitlements, in January 2018 and January 2020, provided that he remains employed with Novartis on the respective vesting dates. In addition, Dr. Bradner received as compensation for lost entitlements at one of his former scientific companies a cash payment of USD 844 250. Both awards, made in 2016, are included in full under the column “Other 2016 compensation” and were previously disclosed in the 2015 Annual Report.
9 Paul Hudson received a cash payment of CHF 191 300 in July 2016. In addition, he received 2 992 RSUs and 31 510 target PSUs, with total target value at grant date of CHF 2.8 million. These amounts are for lost entitlements at his former employer. The vesting of the RSUs will be staggered based on the original vesting period of the lost entitlements, between March 2017 and March 2019. The vesting of the target PSUs will be subject to the achievement of performance conditions under the Novartis LTPP, and staggered based on the original vesting period of the lost entitlements, between March 2017 and December 2023. Both awards will vest provided he remains employed with Novartis on the respective vesting dates. The full value of the cash payment and the awards is included under the column “Other 2016 compensation.”
10 Amounts in USD for Mr. Ball, Dr. Bradner, Mr. Epstein, Mark C. Fishman and Mr. George were converted at a rate of CHF 1.00 = USD 1.015, which is the same average exchange rate used in the Group’s 2016 consolidated financial statements.
11 For those members who left the Executive Committee in 2016, the information under the columns “Base compensation,” “Pension benefits,” “Annual Incentive,” “LTPP” and “LTRPP” reflects the pro-rata compensation during 2016 for the period they were an Executive Committee member. The information under the column “Other 2016 compensation” includes, inter alia, their pro-rata compensation from the date they stepped down from the Executive Committee to December 31, 2016.
12 Mr. Epstein stepped down from the Executive Committee on June 30, 2016. In accordance with the contractual notice period of his employment agreement, he will leave the company in July 2017. Until the end of the notice period, he will receive further contractual compensation that includes the base salary, pension and other benefits, and the vesting of his incentive awards under the approved early retirement conditions of the Novartis plan rules.
13 Dr. Fishman stepped down from the Executive Committee on February 29, 2016 and retired from Novartis. Until the retirement date, he received further contractual compensation that included base salary, pension and other benefits, and the vesting of his incentive awards in accordance with the terms of the Novartis plan rules. As of March 1, 2016, Dr. Fishman provided certain consulting services to Novartis for which he is compensated for a period of up to two years until February 28, 2018. The fees for these services are capped at USD 250 000 p.a. and are in line with those for other scientists who provide consultancy services to the NIBR organization. In 2016, no payments were made in relation to such services.
14 Mr. George stepped down from the Executive Committee on January 31, 2016. In accordance with the contractual notice period of his employment agreement, he will leave the company in January 2017. Until the end of the notice period, he will receive further contractual compensation that includes the base salary, pension and other benefits, and the vesting of his incentive awards in accordance with the terms of the Novartis plan rules. Mr. George was not granted LTPP and LTRPP awards for the performance-period 2016-2018. In accordance with the applicable plan rules, the LTPP and LTRPP awards for the performance-period 2015-2017 will be eligible to vest on the normal vesting date pro-rata based on the number of months of Novartis employment during the performance-period. The vesting of these awards is subject to performance conditions assessed at the end of the period.

Novartis Annual Report 2016 | 131Compensation RepoRtCeo and other executive Committee members’ compensation at grant value
CEO and other Executive Committee members’ compensation at grant value for financial year 20151 (comparative information)
Fixed compensation and Variable compensation
pension benefits
Actual compensation paid or granted for 2015 Long-Term Incentive
2015 grants at target
2015 base 2015 pension 2015 Annual Incentive LTPP LTRPP Other 2015 Total
compensation benefits 2015–2017 period 2015–2017 period compensation compensation
Equity PSUs PSUs
Cash Cash (value at (target value (target value
Currency (amount) Amount 2 (amount) grant date) 3 at grant date) 4 at grant date) 4 Amount 5 Amount 6
executive Committee members active on December 31, 2015
Joseph Jimenez
(CEO) CHF 2 060 500 175 289 1 545 375 1 545 383 4 121 054 2 060 527 88 432 11 596 560
Steven Baert CHF 653 333 158 099 543 900 543 953 960 048 256 030 94 716 3 210 079
Felix R. Ehrat CHF 892 500 153 054 648 875 648 917 1 521 517 447 565 12 669 4 325 097
David Epstein USD 1 400 000 362 819 1 428 000 1 428 054 2 520 001 1 260 050 569 737 8 968 661
Mark C. Fishman 7 USD 990 000 248 910 861 300 861 323 1 881 089 891 021 129 825 5 863 468
Richard Francis CHF 716 667 193 635 599 400 599 424 1 080 054 360 018 954 170 4 503 368
Jeff George USD 956 539 200 946 158 400 158 404 1 536 056 576 009 1 260 286 4 846 640
Harry Kirsch CHF 950 000 160 431 757 625 757 628 1 480 074 647 575 51 476 4 804 809
André Wyss CHF 735 000 127 237 0 1 176 053 1 102 513 294 083 83 688 3 518 574
subtotal 8 CHF 9 225 826 1 749 163
6 448 733
7 624 994
15 974 055
6 687 990
3 169 620
50 880 381
executive Committee members who stepped down during 2015
Brian McNamara
(until March 1, 2015) 9 USD 131 154 69 008 115 100 0 58 361 11 751 40 670 426 044
Andrin Oswald
(until March 1, 2015) 9 CHF 138 333 27 634 136 500 0 64 580 13 899 283 236 664 182
subtotal 8 CHF 264 443 93 988
247 173
0
120 696
25 198
322 342
1 073 840
total 8 CHF 9 490 269 1 843 151
6 695 906
7 624 994
16 094 751
6 713 188
3 491 962
51 954 221
As published in the 2015 Compensation Report, with the exception of the tabular format 1 Does not include reimbursement for travel and other necessary business expenses incurred by Executive Committee members in the performance of their services, as these amounts are not considered
compensation 2 Includes service costs of pension and post-retirement healthcare benefits accumulated in 2015, in accordance with IAS19. It also includes an amount of CHF 58 757 for mandatory employer contributions paid
by Novartis to governmental social security systems. This amount is out of total employer contributions of CHF 3 457 097, and provides a right to the maximum future insured government pension benefit for the Executive Committee member.
3 The portion of the Annual Incentive delivered in shares is rounded up to the nearest share based on the closing share price on the grant date (January 20, 2016). The closing share price on this date was CHF 79.70 per Novartis share and USD 80.49 per ADR.
4 The shown amounts in these columns represent the underlying share value of the target number of PSUs granted to each Executive Committee member for the performance cycle 2015-2017 based on the closing share price on the grant date (January 21, 2015). The closing share price on this date was CHF 84.75 per Novartis share and USD 98.75 per ADR.
5 Includes any other perquisites, benefits in kind and international assignment benefits as per global mobility policy (e.g., housing, international health insurance, children’s school fees, tax equalization). Tax equalization benefits included for David Epstein, Richard Francis, Jeff George and Andrin Oswald are USD 305 867, CHF 739 086, USD 1 153 361 and CHF 249 728, respectively.
6 All amounts are before deduction of social security contribution and income tax due by the Executive Committee member. 7 Mark C. Fishman, President of NIBR and Executive Committee member, will step down from the Executive Committee on February 29, 2016 and retire from Novartis. He will receive further contractual
compensation that includes the base salary, pension and other benefits (pro-rata until February 29, 2016) and the vesting of his incentive awards in accordance with the terms of the Novartis plan rules. As of March 1, 2016, Dr. Fishman will provide certain consulting services to Novartis for which he will be compensated for a period of up to two years until February 28, 2018. The fees for these services are capped at USD 250 000 p.a. and are in line with those paid to other scientists who provide consultancy services to the NIBR organization.
8 Amounts in USD for Mr. Epstein, Dr. Fishman, Mr. George and Mr. McNamara were converted at a rate of CHF 1.00 = USD 1.040, which is the same average exchange rate used in the Group’s 2015 consolidated financial statements.
9 Brian McNamara (Division Head of Novartis OTC) and Andrin Oswald (Division Head of Novartis Vaccines) transitioned to the GlaxoSmithKline (GSK) group on March 2, 2015 following the completion of the Novartis OTC and Vaccines transactions with GSK. The information disclosed under columns “LTPP” and “LTRPP” in the table above reflects their pro-rata compensation at target. Following their transition to GSK, and in accordance with the applicable plan rules, the LTPP and LTRPP awards for the performance-period 2015-2017 (as well as for those granted for the performance-period 2014-2016) will be eligible to vest on the normal vesting date and on a pro-rata basis based on the number of months worked with Novartis during the performance-period. The vesting of these awards is subject to performance conditions assessed at the end of the performance-period.

132 | Novartis Annual Report 2016
Number of equity instruments awarded at grant value to the CEO and other Executive Committee members for financial year 20161
The table below provides the number of equity instruments awarded to the CEO and other Executive Committee members for financial year 2016, and the awards for 2015 are on the next page for comparison purposes.
Variable compensation
2016 Annual
LTPP
LTRPP
Other
Incentive
2016–2018 period
2016–2018 period
Equity PSUs PSUs Equity/PSUs
(number) 2 (target number) 3 (target number) 3 (number)
executive Committee members active on December 31, 2016
Joseph Jimenez (CEO) 19 867 52 698 32 937 0
Steven Baert 7 775 13 175 4 392 0
F. Michael Ball (from February 1, 2016) 7 690 22 548 9 865 50 000
James Bradner (from March 1, 2016) 8 049 20 965 9 867 3 607
Felix R. Ehrat 11 348 19 624 6 926 0
Richard Francis 7 289 16 061 6 023 0
Paul Hudson (from July 1, 2016) 4 4 050 0 0 34 502
Harry Kirsch 10 322 21 970 10 339 0
Vasant Narasimhan (from February 1, 2016) 7 534 13 717 4 573 0
Bruno Strigini (from July 1, 2016) 2 970 13 549 3 388 0
André Wyss 17 870 17 064 5 333 0
subtotal 104 764 211 371 93 643 88 109
executive Committee members who stepped down during 2016
David Epstein (until June 30, 2016) 5 951 15 968 7 984 29 902
Mark C. Fishman (until February 29, 2016) 4 0 0 0 0
Jeff George (until January 31, 2016) 4 611 0 0 6 724
subtotal 6 562 15 968 7 984 36 626
total 111 326 227 339 101 627 124 735
See next page for 2015 compensation figures1 The values of the awards are reported in the table “CEO and other Executive Committee member’s compensation at grant value for financial year 2016” on page 130.2 Vested shares, restricted shares and/or RSUs granted under the Annual Incentive for performance-period 20163 Target number of PSUs granted under the LTPP and LTRPP as applicable for the performance-period 2016-20184 Paul Hudson, Mark C. Fishman and Jeff George were not granted LTPP and LTRPP awards for the performance-period 2016-2018.

Novartis Annual Report 2016 | 133Compensation RepoRtCeo and other executive Committee members’ compensation at grant value
Number of equity instruments awarded at grant value to the CEO and other Executive Committee members for financial year 20151 (comparative information)
Variable compensation
2015 Annual
LTPP
LTRPP
Incentive
2015–2017 period
2015–2017 period
Equity PSUs PSUs
(number) 2 (target number) 3 (target number) 3
executive Committee members active on December 31, 2015
Joseph Jimenez (CEO) 19 390 48 626 24 313
Steven Baert 6 825 11 328 3 021
Felix R. Ehrat 8 142 17 953 5 281
David Epstein 17 742 25 519 12 760
Mark C. Fishman 10 701 19 049 9 023
Richard Francis 7 521 12 744 4 248
Jeff George 1 968 15 555 5 833
Harry Kirsch 9 506 17 464 7 641
André Wyss 14 756 13 009 3 470
subtotal 96 551 181 247 75 590
executive Committee members who stepped down during 2015
Brian McNamara (until March 1, 2015) 4 0 591 119
Andrin Oswald (until March 1, 2015) 4 0 762 164
subtotal 0 1 353 283
total 96 551 182 600 75 873
As published in the 2015 Compensation Report, with the exception of the tabular format1 The values of the awards included in this table are reported in the table “CEO and other Executive Committee members’ compensation at grant value for financial year 2015.”2 Vested shares, restricted shares and/or RSUs granted under the Annual Incentive for performance-period 20153 Target number of PSUs granted under the LTPP and LTRPP as applicable for the performance-period 2015-20174 Target number of PSUs granted under the LTPP and LTRPP is reported on a pro-rata basis. See footnote 9 of the table “CEO and other Executive Committee members’
compensation at grant value for financial year 2015.”
CEO and other Executive Committee members’ base compensation and variable compensation mix for financial year 20161
Base Variable
compensation compensation 2
Joseph Jimenez (CEO) 17.8% 82.2%
Steven Baert 22.3% 77.7%
F. Michael Ball 21.9% 78.1%
James Bradner 19.6% 80.4%
Felix R. Ehrat 22.6% 77.4%
Richard Francis 21.9% 78.1%
Paul Hudson 45.1% 54.9%
Harry Kirsch 20.2% 79.8%
Vasant Narasimhan 23.2% 76.8%
Bruno Strigini 20.1% 79.9%
André Wyss 21.4% 78.6%
total 21.1% 78.9%
1 Excludes pension and other benefits. Also excludes David Epstein, Mark C. Fishman and Jeff George, who stepped down from the Executive Committee during 2016
2 See the table “CEO and other Executive Committee members’ compensation at grant value for financial year 2016” on page 130 with regard to the disclosure principles of variable compensation.

134 | Novartis Annual Report 2016
Additional informationThis part provides additional disclosures, including information about the shareholdings of the CEO and the other Executive Committee members, collectively referred to in this section as Executive Committee members.
Share ownership requirements for Executive Committee membersExecutive Committee members are required to own at least a minimum multiple of their annual base compen-sation in Novartis shares, RSUs or share options within five years of hire or promotion, as set out in the table below.
In the event of a substantial rise or drop in the share price, the Board of Directors may, at its discretion, amend that time period accordingly.
Function ownership level
CEO 5 x base compensation
Other Executive Committee members 3 x base compensation
The determination of equity amounts against the share ownership requirements is defined to include vested and unvested Novartis shares or ADRs, as well as RSUs acquired under our compensation plans. However, unvested matching shares granted under the Leveraged Share Savings Plan (LSSP), the Employee Share Own-ership Plan (ESOP), and any unvested PSUs are excluded. The determination also includes other shares as well as
vested options of Novartis shares or ADRs that are owned directly or indirectly by “persons closely linked” to an Executive Committee member. The Compensation Committee reviews compliance with the share owner-ship guideline on an annual basis.
As at December 31, 2016, all members who have served at least five years on the Executive Committee have met or exceeded their personal Novartis share own-ership requirements.
Shares, ADRs, equity rights and share options owned by Executive Committee membersThe following table shows the total number of shares, ADRs, and other equity rights owned by Executive Com-mittee members and “persons closely linked” to them as at December 31, 2016.
As at December 31, 2016, no members of the Exec-utive Committee together with “persons closely linked” to them owned 1% or more of the outstanding shares (or ADRs) of Novartis. As at the same date, no members of the Executive Committee held any share options to pur-chase Novartis shares, with the exception of André Wyss who held 373 000.
Shares, ADRs and other equity rights owned by Executive Committee members1
Vested shares Unvested shares total at
and ADRs and other equity rights 2 December 31, 2016
Joseph Jimenez (CEO) 347 278 273 930 621 208
Steven Baert 11 111 50 827 61 938
F. Michael Ball 0 49 081 49 081
James Bradner 0 14 479 14 479
Felix R. Ehrat 137 290 122 196 259 486
Richard Francis 22 424 49 550 71 974
Paul Hudson 0 24 027 24 027
Harry Kirsch 47 437 108 686 156 123
Vas Narasimhan 7 271 79 703 86 974
Bruno Strigini 4 310 92 383 96 693
André Wyss 61 475 92 875 154 350
total 3 638 596 957 737 1 596 333
1 Includes holdings of “persons closely linked” to Executive Committee members (see definition on page 135)2 Includes restricted shares, RSUs and target number of PSUs. Matching shares under the ESOP and LSSP, and target number of PSUs are disclosed pro-rata to December 31, unless
the award qualified for full vesting under the relevant plan rules. Awards under all other incentive plans are disclosed in full.3 David Epstein, Mark C. Fishman and Jeff George stepped down from the Executive Committee in 2016. At the time they stepped down from the Executive Committee, Mr. Epstein
owned 116 027 vested shares, and 250 225 unvested shares and other equity rights; Dr. Fishman owned 117 792 vested shares, and 83 311 unvested shares and other equity rights; and Mr. George owned 144 368 vested shares, 141 396 vested share options, and 74 189 unvested shares and other equity rights.

Novartis Annual Report 2016 | 135Compensation RepoRtCeo and other executive Committee members’ compensation at grant value
Other payments to Executive Committee membersDuring 2016, no other payments or waivers of claims other than those set out in the tables (including their foot-notes) contained in this Compensation Report were made to Executive Committee members or to “persons closely linked” to them.
Payments to former Executive Committee membersUnder the former Executive Committee members’ con-tracts and in line with the company’s Long-Term Incen-tive plan rules, payments were made to five former mem-bers of the Executive Committee totaling CHF 5 243 670. The payments related to the vesting of Long-Term Incen-tives for the 2014–2016 performance-period based on actual performance outcomes plus any dividend equiv-alents. In addition, in line with the company’s policies, a total amount of CHF 87 780 was paid by the company for tax, financial services and tax equalization provided to two former Executive Committee members. With the exception of the above amounts, during 2016, no other payments (or waivers of claims) were made to former Executive Committee members or to “persons closely linked” to them.
Loans to Executive Committee membersNo loans were granted to current or former Executive Committee members or to “persons closely linked” to them in 2016. In addition, no such loans were outstand-ing as of December 31, 2016.
Persons closely linked“Persons closely linked” are (i) their spouse, (ii) their chil-dren below age 18, (iii) any legal entities that they own or otherwise control, and (iv) any legal or natural person who is acting as their fiduciary.
Note 27 to the Group’s audited consolidated financial statementsThe total expense for the year for the compensation awarded to Executive Committee and Board members using International Financial Reporting Standards (IFRS) measurement rules is presented in the Financial Report in Note 27 on page 233 to the Group’s audited consoli-dated financial statements.
Award and delivery of equity to Novartis associatesDuring 2016, 13.1 million unvested restricted shares (or ADRs), RSUs and target PSUs were granted, and 10.4 million Novartis vested shares (or ADRs) were delivered to Novartis associates under various equity-based par-ticipation plans. Current unvested equity instruments (restricted shares, RSUs and target PSUs) – as well as outstanding equity options held by associates – repre-sent 2.2% of issued shares. Novartis delivers treasury shares to associates to fulfill these obligations, and aims to offset the dilutive impact from its equity-based partic-ipation plans.

136 | Novartis Annual Report 2016
2017 Executive Committee compensation systemThe Compensation Committee has evaluated the Exec-utive Committee compensation system and has decided that it will remain largely unchanged in 2017, with the exception of the revised LTRPP payout matrix to reflect the new global healthcare peer group effective from per-formance-periods starting in 2017, as described below. The Compensation Committee believes that the compen-sation system is operating as intended, supports the com-pany’s strategy, and is aligned with market and best prac-tices.
Global healthcare peer group for 2017
With effect from performance-periods starting in 2017, our global healthcare peer group will consist of 15 global pharmaceutical and biotechnology companies, factoring the following changes:— Removed Abbott Laboratories, as this company’s
core business is primarily in medical devices and nutrition
— Added Celgene, Biogen, Gilead and Novo Nordisk, reflecting the evolution of the healthcare industry and the emergence of large and global biotechnology companies with which we directly compete for exec-utive talent
In accordance with the above global healthcare peer group, a new LTRPP payout matrix for performance-pe-riods 2017–2019 has been developed, which can be found below.
LTRPP payout matrix for performance-period 2017–2019
position in peer group payout range
Positions 1–4 160–200%
Positions 5–8 100–150%
Positions 9–12 20–80%
Positions 13–16 0%
Global healthcare peer group for 2017
Biogen Bristol-Myers Squibb Celgene
AbbVie Amgen AstraZeneca
Pfizer Roche Sanofi
Eli Lilly & Co. Gilead Sciences GlaxoSmithKline
Johnson & Johnson Merck & Co. Novo Nordisk

Novartis Annual Report 2016 | 137Compensation RepoRt2016 Board compensation system
2016 Board compensation systemBoard compensation philosophy and benchmarking
The Board of Directors sets compensation for its mem-bers at a level that allows for the attraction and retention of high-caliber individuals with global experience, includ-ing a mix of Swiss and international members. Board members do not receive variable compensation, under-scoring their focus on corporate strategy, supervision and governance.
The Board of Directors sets the level of compensa-tion for its Chairman and the other members to be in line with relevant benchmark companies, which include other large Swiss-headquartered multinational companies: ABB, Credit Suisse, LafargeHolcim, Nestlé, Roche, Syn-genta and UBS. This peer group has been chosen for Board compensation due to the comparability of Swiss legal requirements, including broad personal and indi-vidual liabilities under Swiss law (and new criminal liabil-ity under the Swiss rules regarding compensation of Board and Executive Committee members related to the Ordinance against Excessive Compensation in Listed Companies), and under US law (due to the company’s secondary listing on the New York Stock Exchange).
The Board of Directors reviews the compensation of its members, including the Chairman, each year based on a proposal by the Compensation Committee and on advice from its independent advisor, including relevant benchmarking information.
Compensation of the Chairman of the Board of Directors
As Chairman, Dr. Joerg Reinhardt receives total annual compensation valued at CHF 3.8 million. The total com-pensation is comprised equally of cash and shares, as follows:— Cash compensation: CHF 1.9 million per year— Share compensation: annual value equal to CHF 1.9
million of unrestricted Novartis shares
Dr. Reinhardt also received compensation for lost enti-tlements at his former employer, with a total value of EUR 2.6 million, as reported in previous Compensation Reports. Payments were staggered based on the vesting period at his former employer during the period 2014–2016, provided that he remained in office as Chairman at the respective due dates. On January 31, 2016, he received the final installment of EUR 1 045 800 in cash.
For 2016, the Chairman voluntarily waived the increase in compensation to which he is contractually entitled, which is an amount not lower than the average annual compensation increase awarded to associates based in Switzerland (1% for 2016). For the year 2017, the Chairman will also voluntarily waive this increase.
Compensation of the other Board members
The annual fee rates for Board membership and addi-tional functions are included in the table below. These were approved by the Board of Directors with effect from the 2014 AGM, and align our aggregate Board compen-sation with the current levels of other large Swiss com-panies.
2016 Board member annual fee rates Annual fee (CHF)
Chairman of the Board 3 800 000
Board membership 300 000
Vice Chairman 50 000
Chairman of the Audit and Compliance Committee 120 000
Chairman of the following committees:
— Compensation Committee
— Governance, Nomination and
Corporate Responsibilities Committee
— Research & Development Committee
— Risk Committee 60 000
Membership of the Audit and Compliance Committee 60 000
Membership of the following committees:
— Compensation Committee
— Governance, Nomination and
Corporate Responsibilities Committee
— Research & Development Committee
— Risk Committee 30 000
In addition, the following policies apply regarding Board compensation:— 50% of compensation is delivered in cash, paid on a
quarterly basis in arrears. Board members may choose to receive more of their compensation in shares instead of cash.
— At least 50% of compensation is delivered in shares in two installments: one six months after the AGM and one 12 months after the AGM.
— Board members bear the full cost of their employee social security contributions, if any, and do not receive share options or pension benefits.
The Board compensation system will remain unchanged in 2017.

138 | Novartis Annual Report 2016
2016 Board compensationBoard member compensation tables
The following tables disclose the 2016 Board member compensation and prior-year comparative information. Board compensation is reported as the amount earned in the financial year.
Board member compensation earned for financial year 2016 Governance,
Nomination
Audit and and Corporate Research & Cash Shares Other Total
Board Vice Compliance Compensation Responsibilities Development Risk Shares (CHF) (CHF) (CHF) (CHF)
membership Chairman Committee Committee Committee Committee Committee (number) 1 (A) (B) (C) 2 (A)+(B)+(C) 3
Board members active on December 31, 2016
Joerg Reinhardt 4 Chair Chair 25 020 1 900 000 1 900 000 4 336 3 804 336
Enrico Vanni • • • Chair • 5 • 6 3 291 250 000 250 000 4 336 504 336
Nancy Andrews • • • 5 2 265 177 500 177 500 – 355 000
Dimitri Azar • • • 2 567 195 000 195 000 – 390 000
Ton Buechner
(from February 24, 2016) • 1 864 – 250 000 – 250 000
Srikant Datar • Chair • • 3 159 240 000 240 000 – 480 000
Elizabeth Doherty
(from February 24, 2016) • • 1 118 150 000 150 000 – 300 000
Ann Fudge • • • • 2 567 195 000 195 000 – 390 000
Pierre Landolt 7 • • 8 4 553 – 335 000 3 475 338 475
Andreas von Planta • • Chair 5 Chair 3 055 237 500 237 500 4 336 479 336
Charles L. Sawyers • • • 2 369 180 000 180 000 – 360 000
William T. Winters • • 4 344 – 330 000 – 330 000
subtotal 56 172 3 525 000 4 440 000 16 483 7 981 483
Board members who stepped down at the 2016 aGm
Verena A. Briner
(until February 23, 2016) • • 1 147 27 500 27 500 579 55 579
subtotal 1 147 27 500 27 500 579 55 579
total 57 319 3 552 500 4 467 500 17 062 8 037 062
See next page for 2015 compensation figures 1 The shown amounts represent the gross number of shares delivered to each Board member in 2016 for the respective Board member’s service period. The number of shares
reported in this column represent: (i) the second and final equity installment delivered in February 2016 for the services from the 2015 AGM to the 2016 AGM, and (ii) the first of two equity installments delivered in August 2016 for the services from the 2016 AGM to the 2017 AGM. The second and final equity installment for the services from the 2016 AGM to the 2017 AGM will take place in February 2017.
2 Includes an amount of CHF 17 062 for mandatory employer contributions for all Board members paid by Novartis to Swiss governmental social security systems. This amount is out of total employer contributions of CHF 387 308, and provides a right to the maximum future insured government pension benefit for the Board member.
3 All amounts are before deduction of the social security contribution and income tax due by the Board member. 4 Does not include EUR 1 045 800 paid to Joerg Reinhardt on January 31, 2016 for lost entitlements at his former employer. This amount is the third and final of three installments
totaling EUR 2 665 051, which compensates him for lost entitlements at his former employer. The lost entitlements of EUR 2 665 051 were included in full on page 124 of the 2014 Compensation Report. No additional committee fees for chairing the Research & Development Committee were delivered to Dr. Reinhardt.
5 From February 24, 2016 6 Until February 23, 2016 7 According to Pierre Landolt, the Sandoz Family Foundation is the economic beneficiary of the compensation. 8 Until February 23, 2016, Chair of the Governance, Nomination and Corporate Responsibilities Committee

Novartis Annual Report 2016 | 139Compensation RepoRt2016 Board compensation
Board member compensation earned for financial year 20151 (comparative information) Governance,
Nomination
Audit and and Corporate Research & Cash Shares Other Total
Board Vice Compliance Compensation Responsibilities Development Risk Shares (CHF) (CHF) (CHF) (CHF)
membership Chairman Committee Committee Committee Committee Committee (number) 2 (A) (B) (C) 3 (A)+(B)+(C) 4
Board members active on December 31, 2015
Joerg Reinhardt 5 Chair Chair 19 397 1 900 000 1 900 000 29 197 3 829 197
Enrico Vanni • • • Chair • 2 552 250 000 250 000 4 357 504 357
Nancy Andrews
(from February 27, 2015) • • 812 137 500 137 500 – 275 000
Dimitri Azar • • • 2 712 172 250 217 750 – 390 000
Verena A. Briner • • 1 684 165 000 165 000 4 357 334 357
Srikant Datar • Chair • • 2 450 240 000 240 000 – 480 000
Ann Fudge • • • • 1 990 195 000 195 000 – 390 000
Pierre Landolt 6 • Chair 3 674 – 360 000 3 492 363 492
Andreas von Planta • • • Chair 2 296 225 000 225 000 4 357 454 357
Charles L. Sawyers • • 7 • 1 757 177 500 177 500 – 355 000
William T. Winters • • 7 3 210 – 325 000 – 325 000
subtotal 42 534 3 462 250 4 192 750 45 760 7 700 760
Board members who stepped down at the 2015 aGm
Ulrich Lehner
(until February 26, 2015) • • • • • 1 242 39 167 39 167 582 78 916
subtotal 1 242 39 167 39 167 582 78 916
total 43 776 3 501 417 4 231 917 46 342 7 779 676
As published in the 2015 Compensation Report, with the exception of the tabular format 1 Does not include reimbursement for travel and other necessary business expenses incurred by Board members in the performance of their services, as these are not considered
compensation 2 The shown amounts represent the gross number of shares delivered to each Board member in 2015 for the respective Board member’s service period. The number of shares
reported in this column represent: (i) the second and final equity installment delivered in February 2015 for the services from the 2014 AGM to the 2015 AGM, and (ii) the first of two equity installments delivered in August 2015 for the services from the 2015 AGM to the 2016 AGM. The second and final equity installment for the services from the 2015 AGM to the 2016 AGM will take place in February 2016.
3 Includes an amount of CHF 21 502 for mandatory employer contributions paid by Novartis to Swiss governmental social security systems. This amount is out of total employer contributions of CHF 429 806, and provides a right to the maximum future insured government pension benefit for the Board member.
4 All amounts are before the deduction of the social security contribution and income tax due by the Board member. 5 Does not include EUR 871 251 paid to Joerg Reinhardt on January 31, 2015 for lost entitlements at his former employer. This amount is the second of three installments totaling EUR
2 665 051, which compensates him for lost entitlements at his previous employer that were due to him on joining Novartis. The third and last installment of EUR 1 045 800 will be delivered on January 31, 2016, provided that he remains in office as our Chairman at the due dates. The lost entitlements of EUR 2 665 051 were included in full in the 2013 Board compensation table on page 124 of the 2014 Compensation Report based on our disclosure policy to report compensation for lost entitlements in full in the year the member of the Board or Executive Committee joined Novartis.
6 According to Pierre Landolt, the Sandoz Family Foundation is the economic beneficiary of the compensation. 7 From February 27, 2015
Reconciliation between the reported Board compensation and the amount approved by shareholders at the AGM Compensation
to be earned for
Compensation the period from
Compensation earned for the period January 1 to the Total
earned for the from January 1 to the AGM (2 months) in compensation Amount within the
respective AGM (2 months) of the year following earned from Amount approved by amount approved by
financial year the financial year the financial year AGM to AGM shareholders at the shareholders at the
(CHF) (A) 1 (B) (C) (A)-(B)+(C) respective AGM respective AGM
January 1, 2016 January 1, 2017 2016 aGm
2016 to 2016 aGm to 2017 aGm 2 to 2017 aGm 2016 aGm 2016 aGm
Joerg Reinhardt 3 804 336 633 334 633 334 3 804 336 3 805 000 Yes
Other Board members 4 232 726 653 334 713 334 4 292 726 4 355 000 Yes
total 8 037 062 1 286 668 1 346 668 8 097 062 8 160 000 Yes
January 1, 2015 January 1, 2016 2015 AGM
2015 to 2015 AGM to 2016 AGM to 2016 AGM 2015 AGM 2015 AGM
Joerg Reinhardt 3 829 197 658 174 633 334 3 804 357 3 805 000 Yes
Other Board members 3 950 479 667 250 653 334 3 936 563 3 940 000 Yes
total 7 779 676 1 325 424 1 286 668 7 740 920 7 745 000 Yes
1 See previous page for 2016 Board member compensation. 2 To be confirmed and reported in the 2017 Compensation Report

140 | Novartis Annual Report 2016
Loans to Board membersNo loans were granted to current or former members of the Board of Directors or to “persons closely linked” to them during 2016. In addition, no such loans were out-standing as of December 31, 2016.
Other payments to Board membersDuring 2016, no payments (or waivers of claims) other than those set out in the Board member compensation table (including its footnotes) on page 138 were made to current members of the Board of Directors or to “per-sons closely linked” to them.
Payments to former Board membersDuring 2016, no payments (or waivers of claims) were made to former Board members or to “persons closely linked” to them, except for the following amounts:— Dr. William R. Brody and Dr. Rolf M. Zinkernagel, who
stepped down from the Board of Directors at the 2014 AGM, received delegated Board membership fees for their work on the Boards of the Novartis Institute for Tropical Diseases (Dr. Zinkernagel) and the Genom-ics Institute of the Novartis Research Foundation (Dr. Brody and Dr. Zinkernagel). During 2016, an amount of CHF 25 000 and CHF 50 000 was paid to Dr. Brody and Dr. Zinkernagel, respectively, for their work on these Boards. No further payments related to these Board memberships will be made to Dr. Brody and Dr. Zinkernagel, as their respective mandates have ended.
— The payments reported in Note 27 to the Group’s audited consolidated financial statements (page 233)
Share ownership requirements for Board membersThe Chairman is required to own a minimum of 30 000 Novartis shares, and other members of the Board of Directors are required to own at least 4 000 Novartis shares within three years after joining the Board of Direc-tors, to ensure their interests are aligned with sharehold-ers’. Board members are prohibited from hedging or pledging their ownership positions in Novartis shares that are part of their guideline share ownership require-ment, and are required to hold these shares for 12 months after retiring from the Board of Directors. As at Decem-ber 31, 2016, all members of the Board of Directors who have served at least three years on the Board, as well as former members who stepped down from the Board at the 2016 AGM, have complied with the share ownership requirements.
Shares, ADRs and share options owned by Board membersThe total number of vested Novartis shares and ADRs owned by members of the Board of Directors and “per-sons closely linked” to them as of December 31, 2016 is shown in the table below.
As of December 31, 2016, no members of the Board of Directors together with “persons closely linked” to them owned 1% or more of the outstanding shares (or ADRs) of Novartis. As of the same date, no members of the Board of Directors held any share options to purchase Novartis shares.
Shares and ADRs owned by Board members1
Number of shares 2
at December 31, 2016
Joerg Reinhardt 497 762
Enrico Vanni 17 853
Nancy Andrews 2 308
Dimitri Azar 11 217
Ton Buechner 1 398
Srikant Datar 34 998
Elizabeth Doherty 839
Ann Fudge 17 530
Pierre Landolt 3 58 061
Andreas von Planta 127 740
Charles L. Sawyers 6 029
William T. Winters 9 257
total 4 784 992
1 Includes holdings of “persons closely linked” to Board members (see definition on page 135)
2 Each share provides entitlement to one vote.3 According to Pierre Landolt, the Sandoz Family Foundation is the economic beneficiary of the shares.
4 Verena A. Briner stepped down from the Board of Directors on February 23, 2016. On February 23, 2016, Dr. Briner owned 7 507 shares.

Novartis Annual Report 2016 | 141Compensation RepoRtCompensation governance
Compensation governanceLegal framework
The Swiss Code of Obligations and the Corporate Gov-ernance Guidelines of the SIX Swiss Exchange require listed companies to disclose certain information about the compensation of Board and Executive Committee members, their equity participation in the Group, and loans made to them. This Annual Report fulfills that requirement. In addition, the Annual Report is in line with the principles of the Swiss Code of Best Practice for Corporate Governance of the Swiss Business Federa-tion (economiesuisse).
Compensation decision-making authorities
Authority for decisions related to compensation is gov-erned by the Articles of Incorporation, Board regulations and the Compensation Committee Charter, which are all published on the company website: www.novartis.com/corporate-governance.
The Compensation Committee serves as the super-visory and governing body for compensation policies and plans within Novartis, and has overall responsibility for determining, reviewing and proposing compensation pol-icies and plans for approval by the Board of Directors in line with the Compensation Committee Charter. A sum-mary of discussions and conclusions of each committee meeting is delivered to the full Board of Directors. A sum-mary of the compensation decision-making authorities is set out below.
Compensation authorization levels within the parameters set by the shareholders’ meeting
Decision on Decision making authority
Compensation of Chairman and Board of Directorsother Board members
Compensation of CEO Board of Directors
Compensation of other Executive Compensation CommitteeCommittee members
Committee member independence
The Compensation Committee is composed exclusively of members of the Board of Directors who meet the inde-pendence criteria set forth in the Board regulations. From the 2016 AGM, the Compensation Committee had the following four members: Ann Fudge, Srikant Datar, Enrico Vanni and William Winters. Mr. Vanni has served as mem-ber since 2011 and as Chair since 2012.
Role of the Compensation Committee’s independent advisor
The Compensation Committee retained Frederic W. Cook & Co. Inc. as its independent external compensa-tion advisor for 2016. The advisor was hired directly by the Compensation Committee in 2011, and the Compen-sation Committee has been fully satisfied with the per-formance and independence of the advisor since its engagement. Frederic W. Cook & Co. Inc. is independent of management and does not perform any other consult-ing work for Novartis. In determining whether or not to renew the engagement with the advisor, the Compensa-tion Committee evaluates, at least annually, the quality of the consulting service, the independence of the advi-sor, and the benefits of rotating advisors.
Compensation Committee meetings held in 2016
In 2016, the Compensation Committee held six formal meetings, and two additional joint meetings with the Research & Development Committee to review and endorse for approval by the Board of Directors the inno-vation targets and achievements of our LTPP. It also held one additional joint meeting with the Risk Committee to review risk within the compensation systems for execu-tives and other associates, including the sales force. The Compensation Committee conducted a performance self-evaluation and a review of its charter in 2016, as it does every year.

142 | Novartis Annual Report 2016
Compensation governance and risk management
The Compensation Committee, with support from its independent advisor, reviews market trends in compen-sation and changes in corporate governance rules. Together with the Risk Committee, it also reviews the Novartis compensation systems to ensure that they do not encourage inappropriate or excessive risk taking, and instead encourage behaviors that support sustain-able value creation.
A summary of the risk management principles is out-lined below.
Risk management principles
Executive Committee employment contracts provide for a notice period of up to 12 months and contain no change-of-control clauses or severance provisions (e.g., agree-ments concerning special notice periods, longer-term contracts, “golden parachutes,” waiver of lock-up peri-ods for equities and bonds, shorter vesting periods, and additional contributions to occupational pension schemes).
Malus and clawbackAny incentive compensation paid to Executive Commit-tee members is subject to malus and clawback rules. This means that the Board of Directors for the CEO, or the Compensation Committee for the other Executive Committee members, may decide – subject to applica-ble law – to not pay any unpaid or unvested incentive compensation (malus), or to seek to recover incentive compensation that has been paid in the past (clawback), where the payout has been proven to conflict with inter-nal management standards, including company and accounting policies, or violate laws. This principle applies to both the short-term Annual Incentive and the Long-Term Incentive plans. In 2016, the Compensation Com-mittee did not exercise malus or clawback for current or former Executive Committee members.
— Rigorous performance management process, with approval of targets and evaluation of performance for the Ceo by the Board of Directors
— Balanced mix of short-term and long-term variable compensation elements
— Balanced scorecard approach to performance evaluation under the annual incentive, including Values and Behaviors
— Clawback principles
— performance-vesting Long-term incentives only, with three-year overlapping cycles
— Variable compensation is capped at 200% of target
— Contractual notice period of 12 months
— post-contractual non-compete limited to a maximum of 12 months (annual base compensation and annual incentive of the prior year only)
— no severance payments or change-of-control clauses
— share ownership requirements; no hedging or pledging of novartis share ownership position by Board and executive Committee members

Novartis Annual Report 2016 | 143Compensation RepoRtReport of the statutory auditor on the Compensation Report of novartis aG
Report of the statutory auditor on the Compensation Report of Novartis AG
To the General Meeting of Novartis AG, Basel
We have audited the 2016 CEO target compensation on page 123, the 2016 CEO realized compensation on page 124, the outcome of the LTRPP performance-period 2014–2016, 2016 CEO realized total compensation table and 2015 CEO realized compensation on page 126, the CEO and other Executive Committee members’ 2014–2016 Long Term Incentive plans vesting on pages 127–128, the CEO and other Executive Committee members’ compensation at grant value on pages 129–135 and the 2016 Board Compensation on pages 138–140 of the accompanying Compensation Report of Novartis AG for the year ended December 31, 2016.
Board of Directors’ responsibilityThe Board of Directors is responsible for the prepara-tion and overall fair presentation of the Compensation Report in accordance with Swiss law and the Ordinance against Excessive Compensation in Listed Companies (Ordinance). The Board of Directors is also responsible for designing the compensation system and defining indi-vidual compensation packages.
Auditor’s responsibilityOur responsibility is to express an opinion on the accom-panying Compensation Report. We conducted our audit in accordance with Swiss Auditing Standards. These standards require that we comply with ethical require-ments, and plan and perform the audit to obtain reason-able assurance about whether the Compensation Report complies with Swiss law and articles 14–16 of the Ordi-nance.
An audit involves performing procedures to obtain audit evidence on the disclosures made in the Compensation
Report with regard to compensation, loans and credits in accordance with articles 14–16 of the Ordinance. The procedures selected depend on the auditor’s judgment, including the assessment of the risks of material mis-statements in the Compensation Report, whether due to fraud or error. This audit also includes evaluating the rea-sonableness of the methods applied to value compo-nents of compensation, as well as assessing the overall presentation of the Compensation Report. We believe that the audit evidence we have obtained is sufficient and appropriate to provide a basis for our opinion.
OpinionIn our opinion, the Compensation Report of Novartis AG for the year ended December 31, 2016 complies with Swiss law and articles 14–16 of the Ordinance.
PricewaterhouseCoopers AG
Bruno Rossi stephen JohnsonAudit expert Global relationship Auditor in charge partner
Basel, January 24, 2017

144 | Novartis Annual Report 2016
1 His work as a stadium groundskeeper in Brisbane, Australia, exposed Malcolm Caddies to heavy doses of sunlight.
2 Mr. Caddies spends the morning with his family. 3 Mr. Caddies is an evangelist for Australia’s
SunSmart campaign, which promotes using sunscreen, wearing a hat, and staying under cover when the sun is strongest.
4 Australia still has high rates of skin cancer, but the SunSmart campaign may be having an impact.
1
2

Novartis Annual Report 2016 | 145Photo Essay
A groundskeeper tackles cancer in several waysMalcolm Caddies’ medical odyssey began like so many others’ around the world: with the discovery of a lump. It was under his left arm, and it was sizeable – about three centimeters. He hurried to the doctor in his hometown of Brisbane, Australia. She did some tests and came back with grim news. He had melanoma, a cancer of skin pigment. “She told me to get my affairs in order,” Mr. Caddies recalls, “that I was probably going to die.”
Australia and New Zealand have the highest rates of skin cancer in the world. And for 47-year-old Mr. Caddies, the head groundskeeper at Brisbane’s SunCorp Stadium, it has always been an occupational hazard. He works in Brisbane’s abundant sunshine, with its exceptionally high rates of ultraviolet (UV) light, and has long understood the risks, wearing sunscreen and a hat, avoiding the midday sun, and routinely going to doctors for skin checks. “You’re always having things cut out,” he says.
But his big malignant tumor signaled something much more dire. Mr. Caddies’ oldest son, then 17, searched “metastatic melanoma” on Google, and came away shaken. Meanwhile, Mr. Caddies and his wife shielded their two younger boys from the news.
Yet when Mr. Caddies went to the Melanoma Center in Brisbane, the first thing the doctor told him was to “forget everything” he’d been told about the disease. While the tumor was large, it was not a death sentence. Indeed, tests showed that the cancer had not spread far. Doctors removed the tumor and two lymph nodes, and found that only one of them was affected. That was a promising sign.
When doctors later inspected Mr. Caddies’ history, they found another report of melanoma six years
earlier. The fact that Mr. Caddies’ case was a re-currence qualified him to participate in a clinical trial. Since completing the treatment, he has had hospital checks every month as well as CT scans every three months. So far, he has no further symptoms. He says he now monitors the UV index as he tries to avoid unnecessary exposure. When he does venture out into the sun, he wears a wide-brim hat and the strongest sunscreen.
His mission now is to spread the word about mela-noma and to encourage fellow citizens, colleagues, and especially his children to lower their risk. The goal, part of a national drive in Australia, is to be “sunsmart.” That means adopting a “no hat, no play” philosophy, applying plenty of sunscreen, and staying inside or in the shade, when possible, during the high-UV hours around noon.
While melanoma rates in Australia remain stub-bornly high with 13 300 new cases diagnosed every year, there’s a ray of good news: Rates for Australians under 40 appear to be dropping. That in dicates that sunsmart lessons from Mr. Caddies and thousands of other survivors may be sinking in.
For detail on cancer research k page 42
Photo Essay
3 4

146 | Novartis Annual Report 2016
Financial ReportContentsFINANCIAL REPORT
Operating and financial review 2016 146
Results of operations 147
Factors affecting comparability of year-on-year results of operations 153
Free cash flow 155
Liquidity, cash flow and capital resources 156
Contractual obligations 158
Effects of currency fluctuations 158
Condensed consolidated balance sheets 160
Critical accounting policies and estimates 162
Factors affecting results of operations 167
Non-IFRS measures as defined by Novartis 171
Summary of quarterly and Group financial data 176
Novartis Group consolidated financial statements 178
Notes to the Novartis Group consolidated financial statements 183
Report of Novartis management on internal control over financial reporting 248
Report of the statutory auditor on the consolidated financial statements of Novartis AG 249
Financial statements of Novartis AG 255
Notes to the financial statements of Novartis AG 257
Appropriation of available earnings of Novartis AG as per balance sheet and declaration of dividend 265
Report of the statutory auditor on the financial statements of Novartis AG 266
Operating and financial review 2016This operating and financial review should be read together with the Group’s consolidated financial state-ments in this Annual Report, which have been prepared in accordance with International Financial Reporting Standards (IFRS) as published by the International Accounting Standards Board, and with the sections on performance and innovation on pages 22 to 57 of this Annual Report.
On January 27, 2016, Novartis announced plans to further focus our divisions, integrating businesses that share therapeutic areas to better leverage our develop-ment and marketing capabilities. These plans included the transfer of the Ophthalmic Pharmaceuticals fran-chise from the Alcon Division to the Innovative Medicines Division (formerly named the Pharmaceuticals Division), and the transfer of selected mature products from the Innovative Medicines Division to the Sandoz Division. Operationally, these transfers were completed as of April 1, 2016. The centralization of manufacturing and the inte-gration of some drug development functions, also announced on January 27, 2016, were operationally com-pleted as of July 1, 2016.
In compliance with IFRS, Novartis updated its current and prior years segment financials to reflect these trans-fers, to aid comparability of year-on-year results. As a result, all comparisons of divisional results from 2016 to 2015 reflect the new divisional structure.
In 2015, Novartis completed a series of portfolio transformation transactions, including the acquisition of oncology assets from GlaxoSmithKline plc (GSK) and a 36.5% interest in GSK Consumer Healthcare Holdings Ltd., and the divestment of its Vaccines and Animal Health businesses. To reflect these transactions, Novartis reported the Group’s financial results for all years presented as “continuing operations” and “discon-tinued operations.”
Unless otherwise noted, the comments in this oper-ating and financial review refer to continuing operations, which include the businesses of the Innovative Medi-cines, Sandoz and Alcon Divisions; Corporate activities; and, starting March 2, 2015, the results from the new oncology assets acquired from GSK and the 36.5% inter-est in the GSK Consumer Healthcare joint venture (the latter reported as investment in associated companies). We also provide information on discontinued operations and total Group performance. For further details on con-tinuing and discontinued operations see pages 152 and 154 and Note 30 to the Group consolidated financial statements.

Novartis Annual Report 2016 | 147FINANCIAL REPORTOperating and financial review 2016
Risk overview
Our financial results are affected to varying degrees by external factors. Loss of market exclusivity and the intro-duction of branded and generic competitors could sig-nificantly erode sales of our innovative products. Our ability to grow depends on the success of our research and development efforts to replenish our pipeline, as well as on the commercial acceptance of our products in mar-ket. Increased pricing pressure could impact our ability to generate returns and invest for the future.
We have a significant global compliance program in place, but any failure to comply with local laws could lead to substantial liabilities. There are strict regulatory requirements surrounding our manufacturing processes, which introduce a greater chance for disruptions and lia-bilities. With products sold in approximately 155 coun-tries, our ability to hedge against foreign exchange fluc-tuations could have a significant effect on our reported results. We also depend on critical information technol-ogy systems to support our business processes.
For more detail on these trends and how they could impact our results, see details starting on page 167.
Results of operationsIn evaluating the Group’s performance, we consider not only the IFRS results, but also certain non-IFRS mea-sures, including core results and constant currency results. These measures assist us in evaluating our ongo-ing performance from year to year and we believe this additional information is useful to investors in under-standing the performance of our business.
The Group’s core results – including core operating income, core net income and core earnings per share – exclude fully the amortization and impairment charges of intangible assets, excluding software, and certain acquisition related items. The following items that exceed a threshold of USD 25 million are also excluded: integra-tion and divestment related income and expenses, divestment gains and losses, restructuring charges/releases, legal related items, impairments of property, plant and equipment and financial assets, as well as income and expense items that management deems exceptional and that are or are expected to accumulate within the year to be over a USD 25 million threshold. A reconciliation between IFRS results and core results is shown on pages 173-175.
We present information about our net sales and other key figures relating to operating and net income in con-stant currencies (cc). We calculate constant currency net sales and operating income by applying the prior-year average exchange rates to current financial data expressed in local currencies in order to estimate an elim-ination of the impact of foreign exchange rate movements.
The core results, constant currencies and other non-IFRS measures are explained in more detail starting on page 171 and are not intended to be substitutes for the equivalent measures of financial performance prepared in accordance with IFRS. These measures may differ from similarly titled non-IFRS measures of other compa-nies.
Group overview
Novartis delivered solid financial performance in 2016, driven by our continued success with growth products including Cosentyx and Gilenya, which helped offset the effects of generic competition of approximately USD 2.4 billion, mainly driven by the loss of patent protection in the US for the pioneering leukemia drug, Gleevec. As a result, our net sales to third parties from continuing oper-ations of USD 48.5 billion (–2%, 0% cc) were broadly in line with the prior year. Currencies negatively impacted the results driven by the strengthening of the US dollar on average versus the British pound and major emerg-ing market currencies, which was partially offset by the strengthening of the Japanese yen.
Operating income was USD 8.3 billion (–8%, –3% cc), a decrease from USD 9.0 billion in 2015 mainly due to the loss of exclusivity on Gleevec, as investments related to new product launches and the Alcon growth plan were partially offset by resource allocation and productivity programs. Operating income margin was 17.0% of net sales.
Net income from continuing operations was USD 6.7 billion (–5%, +1% cc) with the increase of 1% in constant currencies compared to the decline in operating income due to higher income from associated companies, mainly from the investment in GSK Consumer Healthcare Hold-ings Ltd. The current year includes USD 0.3 billion (2015: USD 0.4 billion) exceptional charges related to Venezu-ela. For more information see page 159.
Basic earnings per share from continuing operations increased 2% in constant currencies (–3%, +2% cc) to USD 2.82, up more than net income in constant curren-cies due to a reduction in the average number of shares outstanding.
Free cash flow from continuing operations increased 2% to USD 9.5 billion, mainly driven by lower net invest-ments in property, plant and equipment.
For the total Group, net income amounted to USD 6.7 billion in 2016 compared to USD 17.8 billion in 2015. The prior year benefitted from the USD 10.8 billion net income from discontinued operations, which included USD 12.7 billion of exceptional pre-tax divestment gains and the operational results of the divested businesses until the respective dates of completion of the transactions. For more information on discontinued operations please see pages 152 and 154 and Note 30 to the Novartis Group consolidated financial statements.
Basic earnings per share decreased to USD 2.82 from USD 7.40 in the prior year.
Free cash flow for the total Group amounted to USD 9.5 billion in 2016 compared to USD 9.0 billion in 2015. The prior year included a negative free cash flow of approximately USD 0.3 billion from discontinued oper-ations.

148 | Novartis Annual Report 2016
Key figures
Change in
Change constant
Year ended Year ended in USD currencies
(USD millions unless indicated otherwise) Dec 31, 2016 Dec 31, 2015 % %
Net sales to third parties from continuing operations 48 518 49 414 – 2 0
Sales to discontinued operations 26 nm nm
Net sales from continuing operations 48 518 49 440 – 2 0
Other revenues 918 947 – 3 – 3
Cost of goods sold – 17 520 – 17 404 – 1 – 2
Gross profit from continuing operations 31 916 32 983 – 3 – 1
Marketing & Sales – 11 998 – 11 772 – 2 – 4
Research & Development – 9 039 – 8 935 – 1 – 2
General & Administration – 2 194 – 2 475 11 8
Other income 1 927 2 049 – 6 – 5
Other expense – 2 344 – 2 873 18 17
Operating income from continuing operations 8 268 8 977 – 8 – 3
Return on net sales (%) 17.0 18.2
Income from associated companies 703 266 164 164
Interest expense – 707 – 655 – 8 – 10
Other financial income and expense – 447 – 454 2 58
Income before taxes from continuing operations 7 817 8 134 – 4 2
Taxes – 1 119 – 1 106 – 1 – 13
Net income from continuing operations 6 698 7 028 – 5 1
Net income from discontinued operations 10 766 nm nm
Net income 6 698 17 794 – 62 – 59
Attributable to:
Shareholders of Novartis AG 6 712 17 783 – 62 – 59
Non-controlling interests – 14 11 nm nm
Basic earnings per share (USD) from continuing operations 2.82 2.92 – 3 2
Basic earnings per share (USD) from discontinued operations 4.48 nm nm
Total basic earnings per share (USD) 2.82 7.40 – 62 – 59
Free cash flow from continuing operations 9 455 9 259 2
Free cash flow 9 455 9 029 5
nm = not meaningful
Net sales by segment
The following table provides an overview of net sales to third parties by segment:
Change in
Change constant
Year ended Year ended in USD currencies
(USD millions) Dec 31, 2016 Dec 31, 2015 % %
Innovative Medicines1, 2 32 562 33 345 – 2 0
Sandoz2 10 144 10 070 1 2
Alcon2 5 812 5 999 – 3 – 2
Net sales to third parties from continuing operations 48 518 49 414 – 2 0
1 Formerly named the Pharmaceuticals Division2 Restated to reflect the new divisional structures and product transfers between divisions, announced on January 27, 2016
Additional comments on the changes in the net sales by division can be found starting on page 22.

Novartis Annual Report 2016 | 149FINANCIAL REPORTOperating and financial review 2016
Operating income from continuing operations
The following table provides an overview of operating income by segment:
Change in
Change constant
Year ended % of Year ended % of in USD currencies
(USD millions) Dec 31, 2016 net sales Dec 31, 2015 net sales % %
Innovative Medicines1, 2 7 426 22.8 7 815 23.4 – 5 0
Sandoz2 1 445 14.2 1 300 12.9 11 14
Alcon2 – 132 – 2.3 281 4.7 nm nm
Corporate – 471 – 419 – 12 – 25
Operating income from continuing operations 8 268 17.0 8 977 18.2 – 8 – 3
nm = not meaningful1 Formerly named the Pharmaceuticals Division2 Restated to reflect the new divisional structures and product transfers between divisions, announced on January 27, 2016
Operating income was USD 8.3 billion (–8%, –3% cc), a decrease from USD 9.0 billion in 2015 mainly due to the loss of exclusivity on Gleevec, as investments related to new product launches and the Alcon growth plan were partially offset by resource allocation and productivity programs. The negative currency impact of 5% was due to the strong USD on average versus the British pound and major emerging market currencies, partially offset by the strengthening of the Japanese yen. Operating income margin in constant currencies decreased 0.7 per-centage points; currency had a negative impact of 0.5 percentage points resulting in a decrease of 1.2 percent-age points to 17.0% of net sales.
Additional comments on the changes in operating income by division can be found starting on page 22.
Corporate income and expense, which includes the cost of Group management and central services, amounted to a net expense of USD 471 million (–12%, –25% cc) in 2016 compared to a net expense of USD 419 million in the prior year. The increase was mainly due to lower royalty and other income as well as costs related to the execution of the initiatives announced on January 27, 2016, to further focus the divisions, centralize man-ufacturing and integrate drug development functions. These factors more than offset the reduction in General & Administration expenses in 2016.
Core operating income key figures1
Change in
Change constant
Year ended Year ended in USD currencies
(USD millions unless indicated otherwise) Dec 31, 2016 Dec 31, 2015 % %
Core gross profit from continuing operations 35 806 36 900 – 3 – 1
Marketing & Sales – 11 991 – 11 729 – 2 – 4
Research & Development – 8 402 – 8 738 4 3
General & Administration – 2 120 – 2 389 11 8
Other income 753 823 – 9 – 7
Other expense – 1 059 – 1 077 2 – 1
Core operating income from continuing operations 12 987 13 790 – 6 – 2
As % of net sales 26.8 27.9
1 An explanation of non-IFRS measures and reconciliation tables can be found starting on page 171.
The adjustments made to operating income to arrive at core operating income from continuing operations amounted to USD 4.7 billion (2015: USD 4.8 billion) broadly in line with the prior year.
Excluding these items, core operating income from continuing operations decreased 6% (–2% cc) to USD 13.0 billion. Core operating income margin in con-stant currencies decreased 0.7 percentage points mainly
due to the loss of exclusivity on Gleevec, as investments related to new product launches and the Alcon growth plan were partially offset by resource allocation and pro-ductivity programs. Currency had a negative impact of 0.4 percentage points, resulting in a margin of 26.8% of net sales, compared to 27.9% in 2015. Additional com-ments on the changes in the core operating income by division can be found starting on page 22.

150 | Novartis Annual Report 2016
The following table provides an overview of core operating income by segment:
Change in
Change constant
Year ended % of Year ended % of in USD currencies
(USD millions) Dec 31, 2016 net sales Dec 31, 2015 net sales % %
Innovative Medicines1, 2 10 354 31.8 10 862 32.6 – 5 – 1
Sandoz2 2 071 20.4 2 045 20.3 1 4
Alcon2 850 14.6 1 235 20.6 – 31 – 27
Corporate – 288 – 352 18 4
Core operating income from continuing operations 12 987 26.8 13 790 27.9 – 6 – 2
1 Formerly named the Pharmaceuticals Division2 Restated to reflect the new divisional structures and product transfers between divisions, announced on January 27, 2016
Research and development of Innovative Medicines Division
The following table provides an overview of the reported and core research and development expense of the Inno-vative Medicines Division:
Change in
Change constant
Year ended Year ended in USD currencies
(USD millions unless indicated otherwise) Dec 31, 2016 Dec 31, 2015 1 % %
Research and Exploratory Development – 2 645 – 2 739 3 2
Confirmatory Development – 5 064 – 4 946 – 2 – 4
Total Innovative Medicines Division Research and Development expense – 7 709 – 7 685 0 – 2
As % of Innovative Medicines net sales to third parties 23.7 23.0
Core Research and Exploratory Development2 – 2 543 – 2 663 5 3
Core Confirmatory Development2 – 4 569 – 4 839 6 4
Total Core Innovative Medicines Division Research and Development expense – 7 112 – 7 502 5 4
As % of Innovative Medicines net sales to third parties 21.8 22.5
1 Restated to reflect the new divisional structures and product transfers between divisions, announced on January 27, 2016
2 Core excludes impairments, amortization and certain other items.
Innovative Medicines Division Research and Exploratory Development expense amounted to USD 2.6 billion in 2016, a decrease of 3% (+2% cc) compared to 2015 as a result of continued productivity efforts. Confirmatory Develop ment expense increased by 2% (–4% cc) to USD 5.1 billion compared to USD 4.9 billion in 2015, mainly driven by the impairment of intangible assets.
Core Research and Exploratory Development expense in the Innovative Medicines Division as percent of sales decreased by 0.8 percentage points in constant currencies as a result of continued productivity efforts and synergies from acquired Oncology assets. This decrease was partially offset by negative currency move-ments of 0.1 percentage points, resulting in a net decrease of 0.7 percentage points to 21.8% of net sales.

Novartis Annual Report 2016 | 151FINANCIAL REPORTOperating and financial review 2016
Non-operating income and expense
The following table provides an overview of non-operating income and expense:
Change in
Change constant
Year ended Year ended in USD currencies
(USD millions unless indicated otherwise) Dec 31, 2016 Dec 31, 2015 % %
Operating income from continuing operations 8 268 8 977 – 8 – 3
Income from associated companies 703 266 164 164
Interest expense – 707 – 655 – 8 – 10
Other financial income and expense – 447 – 454 2 58
Income before taxes from continuing operations 7 817 8 134 – 4 2
Taxes – 1 119 – 1 106 – 1 – 13
Net income from continuing operations 6 698 7 028 – 5 1
Net income from discontinued operations 10 766 nm nm
Net income 6 698 17 794 – 62 – 59
Basic EPS (USD) from continuing operations 2.82 2.92 – 3 2
Basic EPS (USD) from discontinued operations 4.48 nm nm
Total basic EPS (USD) 2.82 7.40 – 62 – 59
nm = not meaningful
Income from associated companies increased to USD 703 million, compared to USD 266 million in the prior year.
The increase was mainly due to income recognized from our investment in GSK Consumer Healthcare Hold-ings Ltd. of USD 234 million compared to a loss of USD 79 million recognized in the prior year, in which the income from operations was more than offset by integration charges and an additional expense from the final pur-chase price allocation for the investment in GSK. The 2016 income contribution from GSK Consumer Health-care Holdings Ltd. includes a negative adjustment recorded in the second quarter upon the issuance of 2015 actual results.
In addition, in 2016, we recognized an income of USD 464 million from our investment in Roche, which reflected our estimated share of income for 2016 of USD 532 million partly offset by the adjustment for 2015 actual results. The higher contribution from Roche in 2016 was mainly due to a smaller adjustment recognized upon publication of 2015 actual results by Roche com-pared to the adjustment recorded in the prior year upon publication of the 2014 actual results.
Interest expense from continuing operations increased to USD 707 million from USD 655 million in the prior year due to higher outstanding debt.
Other financial income and expense amounted to an expense of USD 447 million compared to USD 454 mil-lion in the prior-year, mainly on account of an exceptional charge of USD 305 million (2015: USD 410 million) related to Venezuela due to foreign exchange losses on intra-group payables as well as higher currency losses recog-nized in 2016.
The tax rate from continuing operations increased to 14.3% from 13.6% in the prior year, mainly as a result of a change in profit mix to jurisdictions with higher tax rates.
Net income from continuing operations was USD 6.7 billion (–5%, +1% cc) with the increase of 1% in constant currencies compared to the decline in operating income due to higher income from associated companies, mainly from the investment in GSK Consumer Healthcare Hold-ings Ltd. The current year includes USD 0.3 billion (2015: USD 0.4 billion) exceptional charges related to Venezu-ela. For more information see page 159.
Basic earnings per share from continuing operations was USD 2.82 per share (–3%, +2% cc), up more than net income due to a reduction in the average number of shares outstanding.

152 | Novartis Annual Report 2016
Core non-operating income and expense
The following table provides an overview of core non-operating income and expense:
Change in
Change constant
Year ended Year ended in USD currencies
(USD millions unless indicated otherwise) Dec 31, 2016 Dec 31, 2015 % %
Core operating income from continuing operations 12 987 13 790 – 6 – 2
Income from associated companies 1 134 981 16 16
Interest expense – 707 – 655 – 8 – 10
Other financial income and expense – 99 – 24 nm nm
Core income before taxes from continuing operations 13 315 14 092 – 6 – 2
Taxes – 2 001 – 2 051 2 – 2
Core net income from continuing operations 11 314 12 041 – 6 – 3
Core net loss from discontinued operations – 256 nm nm
Core net income 11 314 11 785 – 4 – 1
Core basic EPS (USD) from continuing operations 4.75 5.01 – 5 – 2
Core basic EPS (USD) from discontinued operations – 0.11 nm nm
Core basic EPS (USD) 4.75 4.90 – 3 0
nm = not meaningful
Core income from associated companies increased to USD 1.1 billion from USD 981 million in the prior-year period. The increase was due to a higher contribution from GSK Consumer Healthcare Holdings Ltd., which accounted for USD 369 million in 2016 compared to USD 213 million in prior-year period.
Core other financial income and expense, which excludes the exceptional charges of USD 0.3 billion (2015: USD 0.4 billion) related to Venezuela amounted to a net expense of USD 99 million, compared to USD 24 million in 2015.
The core tax rate from continuing operations (core tax as a percentage of core pre-tax income) increased to 15.0% from 14.6% in the prior year. This increase is mainly a result of a change in core profit mix to jurisdic-tions with higher tax rates.
Core net income from continuing operations was USD 11.3 billion (–6%, –3% cc) and decreased 3% in con-stant currencies, broadly in line with core operating income.
Core basic EPS from continuing operations was USD 4.75 (–5%, –2% cc), down less than core net income due to a reduction in the number of shares outstanding.
Discontinued operations
Year ended
(USD millions unless indicated otherwise) Dec 31, 2015
Net sales to third parties from discontinued operations 601
Operating income from discontinued operations 12 477
Net income from discontinued operations 10 766
Attributable to:
Shareholders of Novartis AG 10 758
Non-controlling interests 8
Basic earnings per share (USD) from discontinued operations 4.48
Free cash flow from discontinued operations – 230
As all transactions of the portfolio transformation were completed during 2015, there are no results from discon-tinued operations reported in the 2016 consolidated income statement. In 2015, results for discontinued oper-ations include the operational results from the Vaccines influenza business, prior to its divestment to CSL Lim-ited on July 31, 2015, as well as results from the Vaccines non-influenza business and OTC until March 2, 2015.
Operational results from the Animal Health business, which was divested on January 1, 2015 include only the divestment gain.
Discontinued operations in 2015 also include the exceptional pre-tax gains of USD 12.7 billion from the divestment of Animal Health (USD 4.6 billion), and the transactions with GSK (USD 2.8 billion for the Vaccines non-influenza business and USD 5.9 billion arising from

Novartis Annual Report 2016 | 153FINANCIAL REPORTOperating and financial review 2016
the contribution of Novartis OTC into the GSK Consumer Healthcare joint venture). In addition, the GSK transac-tions resulted in USD 0.6 billion of additional transac-tion-related costs that were expensed.
Net income from discontinued operations in the prior year amounted to USD 10.8 billion. For more information on discontinued operations please see pages 152 and 154, and Note 30 to the Novartis Group consolidated financial statements.
Total Group
For the total Group, net income amounted to USD 6.7 billion compared to USD 17.8 billion in 2015. The decrease was mainly due to the exceptional divestment gains included in the net income from the discontinued oper-ations of the prior year.
Basic earnings per share decreased to USD 2.82 from USD 7.40.
Factors affecting comparability of year-on-year results of operationsThe comparability of the year-on-year results of our operations for the total Group can be significantly affected by acquisitions and divestments. The transac-tions of significance during 2016 and 2015 are mentioned below.
Significant transactions in 2016
ALCON – ACQUISITION OF TRANSCEND MEDICAL, INC.On February 17, 2016, Alcon entered into an agreement to acquire Transcend Medical, Inc. (Transcend), a pri-vately-held, US-based company focused on developing minimally-invasive surgical devices to treat glaucoma. The transaction closed on March 23, 2016, and the fair value of the total purchase consideration was USD 332 million. Results of operations since the date of acquisi-tion were not material.
INNOVATIVE MEDICINES – ACQUISITION OF SELEXYS PHARMACEUTICALS CORPORATION
On November 18, 2016, Novartis acquired Selexys Phar-maceuticals Corporation (Selexys), a privately-held, US-based company specializing in development of ther-apeutics in certain hematologic and inflammatory disor-ders, following receipt of results of the SUSTAIN study. The fair value of the total purchase consideration for acquiring the 81% stake Novartis did not already own amounted to USD 268 million. Results of operations since the date of acquisition were not material.
Significant transactions in 2015
Portfolio transformation transactionsIn 2015, Novartis completed a series of portfolio trans-formation transactions as follows:
TRANSACTION WITH ELI LILLY AND COMPANYOn January 1, 2015, Novartis closed its transaction with Eli Lilly and Company, USA (Lilly) announced in April 2014, to divest its Animal Health business for USD 5.4 billion in cash. This resulted in a pre-tax gain of USD 4.6 billion, which is recorded in operating income from dis-continued operations.
TRANSACTIONS WITH GLAXOSMITHKLINE PLCOn March 2, 2015, Novartis closed its transactions with GlaxoSmithKline plc, Great Britain (GSK) announced in April 2014, with the following consequences:
INNOVATIVE MEDICINES – ACQUISITION OF GSK ONCOLOGY PRODUCTS
Novartis acquired GSK’s oncology products and certain related assets for an aggregate cash consideration of USD 16.0 billion. In 2015, from the date of acquisition the business generated net sales of USD 1.8 billion. Manage-ment estimates that sales for the entire year 2015 would have amounted to USD 2.1 billion had the oncology prod-ucts been acquired at the beginning of the 2015 report-ing period. The 2015 net results from operations on a reported basis since the acquisition date were not mate-rial, mainly due to amortization of intangible assets.
VACCINES – DIVESTMENT
Novartis divested its Vaccines business (excluding its Vaccines influenza business) to GSK for up to USD 7.1 billion plus royalties. The USD 7.1 billion consists of USD 5.25 billion paid at closing and up to USD 1.8 billion in future milestone payments. The fair value of the con-tingent future milestones and royalties as at the acqui-sition date is USD 1.0 billion, resulting in a fair value of consideration received of USD 6.25 billion. Included in this amount is a USD 450 million milestone payment received in late March 2015. The sale of this business resulted in a pre-tax gain of USD 2.8 billion, which is recorded in operating income from discontinued opera-tions.
CONSUMER HEALTH – COMBINATION OF NOVARTIS OTC WITH GSK CONSUMER HEALTHCARE
Novartis and GSK agreed to create a combined con-sumer healthcare business through the combination of Novartis OTC and GSK Consumer Healthcare busi-nesses. On March 2, 2015, a new entity, GlaxoSmithKline Consumer Healthcare Holdings Ltd. (GSK Consumer Healthcare) was formed via the contribution of business from both Novartis and GSK. Novartis has a 36.5% inter-est in the newly created entity. Based on estimates of fair value exchanged, an investment in associated com-pany of USD 7.6 billion was recorded. The resulting pre-tax gain, net of transaction related costs, of USD 5.9 bil-lion is recorded in operating income from discontinued

154 | Novartis Annual Report 2016
operations. The investment is accounted for using the equity method of accounting using estimated results for the last quarter of the year.
ADDITIONAL GSK RELATED COSTS
The GSK transaction resulted in USD 0.6 billion of addi-tional transaction-related costs that were expensed, thereof USD 0.3 billion paid in 2015.
TRANSACTION WITH CSLOn October 26, 2014, Novartis entered into an agree-ment with CSL to sell its Vaccines influenza business to CSL for USD 275 million. The transaction with CSL was completed on July 31, 2015, resulting in a partial reversal of the impairment recorded in 2014 in the amount of USD 0.1 billion, which is included in operating income from discontinued operations.
Other significant transactions in 2015INNOVATIVE MEDICINES – ACQUISITION OF SPINIFEX PHARMACEUTICALS, INC.
On June 29, 2015, the Innovative Medicines Division acquired Spinifex Pharmaceuticals, Inc. (Spinifex), a US and Australia based, privately held development stage company, focused on developing a peripheral approach to treat neuropathic pain. The transaction closed on July 24, 2015, and the fair value of the total purchase consid-eration was USD 312 million. The 2015 results of opera-tions since the date of acquisition were not material.
INNOVATIVE MEDICINES – ACQUISITION OF ADMUNE THERAPEUTICS LLC
On October 16, 2015, the Innovative Medicines Division acquired Admune Therapeutics LLC (Admune), a US-based, privately held company, broadening the Novartis pipeline of cancer immunotherapies. The fair value of the total purchase consideration amounted to USD 258 million. The 2015 results of operations since the date of acquisition were not material.
For further details on significant transactions in 2016 and 2015, see Note 2 to the Group consolidated financial statements.
Classification as continuing operations and discontinued operations
Following the April 22, 2014 announcement of the port-folio transformation transactions with Lilly and GSK, as described above, Novartis reported the Group’s finan-cial statements for the current and prior years as “con-tinuing operations” and “discontinued operations”.
Continuing operations comprise the businesses of the Innovative Medicines, Sandoz and Alcon Divisions as well as the continuing Corporate activities. Continuing operations also include the results from oncology assets acquired from GSK and the estimated results from the 36.5% interest in GSK Consumer Healthcare Holdings Ltd. for the period from March 2, 2015 (the latter reported as part of income from associated companies).
Discontinued operations included in 2015 the oper-ational results from the Vaccines influenza business, prior to its divestment to CSL Limited on July 31, 2015, as well as results from the Vaccines non-influenza busi-ness and OTC business until March 2, 2015. Operational results from the Animal Health business, which was divested on January 1, 2015, include only the divestment gain.
Discontinued operations in 2015 also included the exceptional pre-tax gain of USD 12.7 billion from the divestment of Animal Health (USD 4.6 billion) and from the transactions with GSK (USD 2.8 billion from the Vac-cines non-influenza business and USD 5.9 billion arising from the contribution of Novartis OTC into GSK Con-sumer Healthcare Holdings Ltd.). In addition the GSK transactions resulted in USD 0.6 billion of additional transaction-related costs, which were expensed and reported in Corporate discontinued operations.
Excluded from discontinued operations are certain intellectual property rights and related other revenues of the Vaccines Division, which are retained by Novartis and are now reported under Corporate activities.
As required by IFRS, results of the discontinued oper-ations excluded any further depreciation and amortiza-tion related to discontinued operations from the date of the portfolio transformation announcement of April 22, 2014.

Novartis Annual Report 2016 | 155FINANCIAL REPORTOperating and financial review 2016
Free cash flowNovartis defines free cash flow as cash flow from operating activities and cash flow associated with the purchase or sale of property, plant and equipment, intangible, other non-current and financial assets, excluding marketable securities. Cash flows in connection with the acquisition or divestment of subsidiaries, associated companies and non-controlling interests in subsidiaries are not taken into account to determine free cash flow. The free cash flow measure, which is a non-IFRS measure, is discussed more on page 172. The following is a summary of the free cash flow:
(USD millions) 2016 2015 Change
Operating income from continuing operations 8 268 8 977 – 709
Reversal of non-cash items
Depreciation, amortization and impairments 6 175 5 575 600
Change in provisions and other non-current liabilities 956 1 642 – 686
Other – 264 – 96 – 168
Operating income adjusted for non-cash items 15 135 16 098 – 963
Interest and other financial receipts 942 1 180 – 238
Interest and other financial payments – 878 – 669 – 209
Taxes paid – 2 111 – 2 454 343
Payments out of provisions and other net cash movements in non-current liabilities – 1 536 – 1 207 – 329
Change in inventory and trade receivables less trade payables – 1 051 – 617 – 434
Change in other net current assets and other operating cash flow items 974 – 246 1 220
Cash flows from operating activities from continuing operations 11 475 12 085 – 610
Purchase of property, plant & equipment – 1 862 – 2 367 505
Proceeds from sales of property, plant & equipment 161 237 – 76
Purchase of intangible assets – 1 017 – 1 138 121
Proceeds from sales of intangible assets 847 621 226
Purchase of financial assets – 247 – 264 17
Proceeds from sales of financial assets 247 166 81
Purchase of other non-current assets – 149 – 82 – 67
Proceeds from sales of other non-current assets 1 – 1
Free cash flow from continuing operations 9 455 9 259 196
Free cash flow from discontinued operations – 230 230
Free cash flow 9 455 9 029 426
In 2016, free cash flow from continuing operations amounted to USD 9.5 billion (+2 % USD) compared to USD 9.3 billion in 2015. The increase of USD 0.2 billion was mainly driven by lower net investments in property, plant and equipment.
Free cash flow for the total Group amounted to USD 9.5 billion in 2016 compared to USD 9.0 billion in 2015. The prior year included a negative free cash flow of approximately USD 0.3 billion from discontinued oper-ations.

156 | Novartis Annual Report 2016
Liquidity, cash flow and capital resourcesThe following table summarizes the Group’s cash flow:
(USD millions) 2016 2015 Change
Cash flows from operating activities from continuing operations 11 475 12 085 – 610
Cash flows used in investing activities from continuing operations – 2 693 – 19 666 16 973
Cash flows used in/from operating and investing activities from discontinued operations – 748 8 694 – 9 442
Cash flows used in financing activities – 5 314 – 9 176 3 862
Effect of exchange rate changes on cash and cash equivalents – 387 – 286 – 101
Net change in cash and cash equivalents 2 333 – 8 349 10 682
Change in marketable securities, commodities, time deposits and derivative financial instruments – 3 – 66 63
Change in current and non-current financial debts and derivative financial instruments – 1 871 – 1 520 – 351
Change in net debt 459 – 9 935 10 394
Net debt at January 1 – 16 484 – 6 549 – 9 935
Net debt at December 31 – 16 025 – 16 484 459
Cash flows from operating activities from continuing operations amounted to USD 11.5 billion, compared to USD 12.1 billion in 2015. The decrease of USD 0.6 billion was driven by lower operating income adjusted for non-cash items, lower hedging results and higher payments out of provisions, partially offset by dividends received from GSK Consumer Healthcare Holdings Ltd., lower cash outflows for taxes paid and net current assets and other operating cash flow items.
Cash flows used in investing activities from continu-ing operations amounted to USD 2.7 billion in 2016. This amount includes cash outflows of USD 1.9 billion for the purchase of property, plant and equipment, USD 1.4 bil-lion for intangible, financial and other non-current assets, and USD 0.8 billion for acquisitions and divestments of businesses, net (including the Transcend Medical, Inc. and Selexys Pharmaceuticals Corporation acquisitions). This was offset by cash inflows of USD 1.3 billion of pro-ceeds from the sale of non-current assets and USD 0.1 billion net proceeds from sales of marketable securities and commodities. In 2015, cash flows used in investing activities from continuing operations amounted to USD 19.7 billion, primarily due to the acquisition of the GSK oncology assets for USD 16.0 billion.
Cash flows used in investing activities from discon-tinued operations amounted to USD 0.7 billion in 2016 due to portfolio transformation transactions payments, including capital gains taxes. In 2015, the cash flows from investing activities from discontinued operations of USD 8.9 billion were mainly driven by net proceeds from the portfolio transformation divestments.
The cash flows used in financing activities amounted to USD 5.3 billion, compared to USD 9.2 billion in 2015. The 2016 amount includes cash outflows of USD 6.5 bil-lion for the dividend payment and USD 0.9 billion for trea-sury share transactions, net. The net inflow from current and non-current financial debts of USD 2.1 billion was due to the increase in short-term borrowings of USD 1.8 billion and the issuance of two euro denominated bonds for total proceeds of USD 1.9 billion, partially offset by the repayment at maturity of a euro denominated bond of USD 1.7 billion.
The 2015 amount included mainly a cash outflow of USD 6.6 billion for the dividend payment and USD 4.5 billion for treasury share transactions, net, partially off-set by a net inflow from financial debts of USD 2.0 bil-lion.
Group net debt
Group net debt consists of:
(USD millions) 2016 2015 Change
Current financial debts
and derivative financial
instruments – 5 905 – 5 604 – 301
Non-current financial debts – 17 897 – 16 327 – 1 570
Total financial debt – 23 802 – 21 931 – 1 871
Less liquidity
Cash and cash equivalents 7 007 4 674 2 333
Marketable securities,
commodities, time deposits
and derivative financial
instruments 770 773 – 3
Total liquidity 7 777 5 447 2 330
Net debt at December 31 – 16 025 – 16 484 459
Total non-current and current financial debt, including derivatives, amounted to USD 23.8 billion at December 31, 2016, compared to USD 21.9 billion at December 31, 2015.
Non-current financial debt increased by USD 1.6 bil-lion to USD 17.9 billion at December 31, 2016, mainly due to the issuance of two euro denominated bonds for a total amount of USD 2.0 billion.
Current financial debt increased by USD 0.3 billion to USD 5.9 billion at December 31, 2016, from USD 5.6 billion at December 31, 2015, mainly due to higher short-term borrowings partially offset by a repayment at matu-rity of a euro denominated bond of USD 1.7 billion. Over-all current financial debt consists of the current portion of non-current debt of USD 0.2 billion and other short-term borrowings (including derivatives and commercial

Novartis Annual Report 2016 | 157FINANCIAL REPORTOperating and financial review 2016
paper) of USD 5.7 billion. Group net debt decreased to USD 16.0 billion at the end of 2016 from USD 16.5 billion at the end of 2015.
Novartis has two US commercial paper programs under which it can issue up to USD 9.0 billion in the aggregate of unsecured commercial paper notes. Novartis also has a Japanese commercial paper program under which it can issue up to JPY 150 billion (approxi-mately USD 1.3 billion) of unsecured commercial paper notes. Commercial paper notes totaling USD 3.2 billion under these three programs were outstanding as per December 31, 2016. Novartis further has a committed credit facility of USD 6.0 billion, entered into on Septem-ber 23, 2015. This credit facility is provided by a syndi-cate of banks and is intended to be used as a backstop
for the US commercial paper programs. It matures in September 2020 and was undrawn as per December 31, 2016.
The long-term credit rating for the company contin-ues to be double-A (Moody’s Aa3; Standard & Poor’s AA–; Fitch AA).
We are not aware of significant demands to change our level of liquidity needed to support our normal busi-ness activities. We make use of various borrowing facil-ities provided by several financial institutions. We also successfully issued various bonds in previous years (including 2015 and 2016) and raised funds through our commercial paper programs. In addition, reverse repur-chasing agreements are contracted and Novartis has entered into credit support agreements with various banks for derivative transactions.
An overview of our current financial debt and related interest rates is set forth below:
Average Average Average Maximum
interest rate balance interest rate balance
December 31 at year end during the year during the year during the year
USD millions % USD millions % USD millions
2016
Interest-bearing accounts of associates payable on demand 1 601 0.50 1 694 0.50 1 763
Bank and other financial debt 836 8.56 1 066 6.71 1 369
Commercial paper 3 174 0.68 4 788 0.45 6 989
Current portion of non-current financial debt 178 na 881 na 1 719
Fair value of derivative financial instruments 116 na 93 na 192
Total current financial debt 5 905 8 522 12 032
2015
Interest-bearing accounts of associates payable on demand 1 645 0.62 1 720 0.59 1 803
Bank and other financial debt 1 185 5.98 1 280 5.54 2 785
Commercial paper 1 085 0.62 3 545 0.19 5 686
Current portion of non-current financial debt 1 659 na 1 916 na 3 044
Fair value of derivative financial instruments 30 na 79 na 188
Total current financial debt 5 604 8 540 13 506
na = not applicable or available
Interest bearing accounts of associates payable on demand relate to employee deposits in CHF from the com-pensation of associates employed by Swiss entities (December 31, 2016 interest rate: 0.5%). Other bank and financial debt refer to usual lending and overdraft facilities.
The maturity schedule of our net debt can be found in Note 29 to the consolidated financial statements on page 242.
The following table provides a breakdown of liquidity and financial debt by currency:
Liquidity and financial debt by currency (as of December 31)
Financial Financial
Liquidity Liquidity debt in % debt in %
in % 2016 1 in % 2015 1 2016 2 2015 2
USD 77 50 66 64
EUR 9 16 13 14
CHF 5 13 13 14
JPY 1 5 5
Other 9 20 3 3
100 100 100 100
1 Liquidity includes cash and cash equivalents, marketable securities, commodities and time deposits.
2 Financial debt includes non-current and current financial debt.

158 | Novartis Annual Report 2016
Contractual obligationsThe following table summarizes the Group’s contractual obligations and other commercial commitments, as well as the effect these obligations and commitments are expected to have on the Group’s liquidity and cash flow in future periods:
Payments due by period
Less than After
(USD millions) Total 1 year 2–3 years 4–5 years 5 years
Non-current financial debt, including current portion 18 075 178 3 513 1 628 12 756
Operating leases 2 897 262 324 186 2 125
Unfunded pensions and other post-employment benefit plans 2 242 117 244 256 1 625
Research & Development
Potential milestone commitments 4 175 385 854 2 283 653
Purchase commitments
Property, plant & equipment 223 200 23
Total contractual cash obligations 27 612 1 142 4 958 4 353 17 159
The Group intends to fund the R&D and purchase commitments with internally generated resources.
On December 16, 2016 Novartis entered into an agreement to acquire Ziarco Goup Limited, a privately held company focused on the development of novel treatments in dermatology. The transaction closed on January 20, 2017. The total consideration of USD 420 million consists of an initial cash payment of USD 325 million before purchase price adjustments and prelimi-nary present value of contingent consideration of USD 95 million.
On December 20, 2016 Novartis entered into a defin-itive agreement for the acquisition of Encore Vision, Inc, a privately held company focused on the development of a novel treatment in presbyopia. The transaction closed on January 20, 2017. The total consideration of USD 465 mil-lion consists of an initial cash payment of USD 375 million before purchase price adjustments and preliminary pres-ent value of contingent consideration of USD 90 million.
For further details on the above two transactions see Note 2 to the Group consolidated financial statements.
Effects of currency fluctuationsWe transact our business in many currencies other than the US dollar, our reporting currency.
The following provides an overview of net sales and operating expenses for our continuing operations based on IFRS values for 2016 and 2015 for currencies most important to the Group:
2016 2015
Operating Operating
Net sales expenses Net sales expenses
Currency % % % %
US dollar (USD) 38 43 40 42
Euro (EUR) 26 23 24 23
Swiss franc (CHF) 2 15 2 13
Japanese yen (JPY) 7 5 6 4
Chinese yuan (CNY) 4 3 4 3
British pound (GBP) 3 2 3 3
Canadian dollar (CAD) 3 1 3 1
Brazilian real (BRL) 2 1 2 2
Australian dollar (AUD) 2 1 2 1
Russian ruble (RUB) 1 1 1 1
Other currencies 12 5 13 7
Operating expenses in the above table include cost of goods sold, Marketing & Sales, Research & Development, General & Administration, Other income and Other expense.
We prepare our consolidated financial statements in US dollars. As a result, fluctuations in the exchange rates between the US dollar and other currencies can have a
significant effect on both the Group’s results of operations as well as on the reported value of our assets, liabilities and cash flows. This in turn may significantly affect reported earnings (both positively and negatively) and the comparability of period-to-period results of operations.
For purposes of our consolidated balance sheets, we translate assets and liabilities denominated in other cur-rencies into US dollars at the prevailing market exchange rates as of the relevant balance sheet date. For purposes of the Group’s consolidated income and cash flow state-ments, revenue, expense and cash flow items in local currencies are translated into US dollars at average exchange rates prevailing during the relevant period. As a result, even if the amounts or values of these items remain unchanged in the respective local currency, changes in exchange rates have an impact on the amounts or values of these items in our consolidated financial statements.
Because our expenditures in Swiss francs are sig-nificantly higher than our revenues in Swiss francs, vol-atility in the value of the Swiss franc can have a signifi-cant impact on the reported value of our earnings, assets and liabilities, and the timing and extent of such volatility can be difficult to predict. In addition, there is a risk that certain countries could take steps that could significantly impact the value of their currencies.
There is also a risk that certain countries could devalue their currency. If this occurs, then it could impact the effec-tive prices we would be able to charge for our products and also have an adverse impact on both our consolidated

Novartis Annual Report 2016 | 159FINANCIAL REPORTOperating and financial review 2016
income statement and balance sheet. The Group is exposed to a potential adverse devaluation risk on its inter-company funding and total investment in certain subsid-iaries operating in countries with exchange controls.
The most significant country in this respect is Vene-zuela, where the Group has incurred significant foreign exchange losses in 2016 and 2015.
Subsidiaries whose functional currencies have expe-rienced a cumulative inflation rate of more than 100% over the past three years apply the rules of IAS 29 “Finan-cial Reporting in Hyperinflationary Economies.” Gains and losses incurred upon adjusting the carrying amounts of non-monetary assets and liabilities for inflation are recognized in the income statement. The subsidiaries in Venezuela restate non-monetary items in the balance sheet in line with the requirements of IAS 29.
The Group’s subsidiaries in Venezuela are experienc-ing a significant reduction in approvals for remittance of US dollars outside the country at the exchange rate avail-able for imports of specific goods and services of national priority, including medicines and medical sup-plies. As a result, in November 2016, the Group changed the exchange rate applied to translate the financial state-ments of its Venezuelan subsidiaries from VEF 11 per USD to the floating rate of DICOM (Sistema de Divisa Complementaria) which was VEF 658 per USD as of November 1, 2016. A corresponding USD 0.3 billion reval-
uation loss on the outstanding intercompany balances was recognized in the fourth quarter of 2016. Due to reserves against the intercompany balances, the net out-standing intercompany payable balance of Venezuela subsidiaries was reduced to an insignificant amount as at December 31, 2016.
The Group has an equivalent of approximately USD 2 million of cash in Venezuela in local currency (VEF), which is subject to loss of purchase power due to high inflation in the country.
The Group manages its global currency exposure by engaging in hedging transactions where management deems appropriate, after taking into account the natural hedging afforded by our global business activity. For 2016, we entered into various contracts that change in value with movements in foreign exchange rates to pre-serve the value of assets, commitments and expected transactions. We use forward contracts and foreign cur-rency options to hedge. For more information on how these transactions affect our consolidated financial statements and on how foreign exchange rate exposure is managed, see Notes 1, 5, 16 and 29 to the Group’s con-solidated financial statements.
The following table sets forth the foreign exchange rates of the US dollar against key currencies used for foreign currency translation when preparing the Group’s consolidated financial statements:
Average for year Year-end
USD per unit 2016 2015 Change in % 2016 2015 Change in %
AUD 0.744 0.753 – 1 0.722 0.731 – 1
BRL 0.288 0.305 – 6 0.307 0.253 21
CAD 0.755 0.784 – 4 0.741 0.721 3
CHF 1.015 1.040 – 2 0.978 1.011 – 3
CNY 0.151 0.159 – 5 0.144 0.154 – 6
EUR 1.107 1.110 0 1.051 1.093 – 4
GBP 1.355 1.529 – 11 1.227 1.483 – 17
JPY (100) 0.922 0.826 12 0.854 0.831 3
RUB (100) 1.498 1.649 – 9 1.648 1.362 21
The following table provides a summary of the currency impact on key Group figures due to their conversion into USD, the Group’s reporting currency, of the financial data from entities reporting in non-US dollars. Constant cur-rency (cc) calculations apply the exchange rates of the prior year to the current year financial data for entities reporting in non-US dollars.
Currency impact on key figures
Change in Percentage Change in Percentage
constant Change in point currency constant Change in point currency
currencies % USD % impact currencies % USD % impact
2016 2016 2016 2015 2015 2015
Net sales from continuing operations 0 – 2 – 2 5 – 5 – 10
Operating income from continuing operations – 3 – 8 – 5 – 2 – 19 – 17
Net income from continuing operations 1 – 5 – 6 – 18 – 34 – 16
Core operating income from continuing operations – 2 – 6 – 4 10 – 5 – 15
Core net income from continuing operations – 3 – 6 – 3 9 – 5 – 14
For additional information on the effects of currency fluctuations, see Note 29 to the Group’s consolidated finan-cial statements.

160 | Novartis Annual Report 2016
Condensed consolidated balance sheets(USD millions) Dec 31, 2016 Dec 31, 2015 Change
Assets
Property, plant & equipment 15 641 15 982 – 341
Goodwill 30 980 31 174 – 194
Intangible assets other than goodwill 31 340 34 217 – 2 877
Financial and other non-current assets 27 232 27 338 – 106
Total non-current assets 105 193 108 711 – 3 518
Inventories 6 255 6 226 29
Trade receivables 8 202 8 180 22
Other current assets 2 697 2 992 – 295
Cash, marketable securities, commodities, time deposits
and derivative financial instruments 7 777 5 447 2 330
Total current assets 24 931 22 845 2 086
Total assets 130 124 131 556 – 1 432
Equity and liabilities
Total equity 74 891 77 122 – 2 231
Financial debts 17 897 16 327 1 570
Other non-current liabilities 15 127 14 399 728
Total non-current liabilities 33 024 30 726 2 298
Trade payables 4 873 5 668 – 795
Financial debts and derivatives 5 905 5 604 301
Other current liabilities 11 431 12 436 – 1 005
Total current liabilities 22 209 23 708 – 1 499
Total liabilities 55 233 54 434 799
Total equity and liabilities 130 124 131 556 – 1 432
Total non-current assets of USD 105.2 billion at Decem-ber 31, 2016 decreased by USD 3.5 billion compared to December 31, 2015.
Intangible assets other than goodwill decreased by USD 2.9 billion, mainly due to amortization and impair-ment charges totaling USD 4.5 billion, and unfavorable currency translation adjustments of USD 0.5 billion, par-tially offset by the impact of business combinations and additions totaling USD 2.1 billion. Property, plant and equipment decreased by 0.3 billion, mainly due to depre-ciation of USD 1.5 billion and unfavorable currency trans-lation adjustments of USD 0.5 billion, partially offset by additions of USD 1.8 billion.
Goodwill decreased by USD 0.2 billion to USD 31.0 billion, mainly on account of currency translation adjust-ments.
Financial and other non-current assets decreased by USD 0.1 billion to USD 27.2 billion. This includes: invest-ments in associated companies, which decreased by USD 1.0 billion to USD 14.3 billion, mainly on account of currency translation adjustments; deferred tax assets, which increased by USD 1.1 billion to USD 10.0 billion, mainly on intangible assets, inventories and pension obli-gations, and financial assets and other non-current assets which decreased by USD 0.2 billion to USD 2.9 billion.
Total current assets increased by USD 2.1 billion to USD 24.9 billion at December 31, 2016, mainly due to an increase in cash and cash equivalents, marketable secu-
rities, commodities and derivatives of USD 2.3 billion, par-tially offset by a decrease in other current assets of USD 0.3 billon. Inventories and trade receivables were broadly in line with the prior year.
Based on our current incurred loss provisioning approach, we consider that our doubtful debt provisions are adequate. However, we intend to continue to moni-tor the level of trade receivables in Greece, Italy, Portu-gal, Spain, Brazil, Russia and Saudi Arabia. Should there be a substantial deterioration in our economic exposure with respect to those countries, we may increase our level of provisions by moving to an expected loss provi-sioning approach or may change the terms of trade on which we operate.
The majority of the outstanding trade receivables from these closely monitored countries are due directly from local governments or from government-funded enti-ties except for Russia, which are due from private enti-ties. The gross trade receivables from these countries at December 31, 2016 amount to USD 1.5 billion (2015: USD 1.6 billion), of which USD 82 million are past due for more than one year (2015: USD 80 million) and for which provisions of USD 62 million have been recorded (2015: USD 56 million). At December 31, 2016, amounts past due for more than one year are not significant in any of these countries.
The following table provides an overview of our aging analysis of our trade receivables as of December 31, 2016 and 2015:

Novartis Annual Report 2016 | 161FINANCIAL REPORTOperating and financial review 2016
(USD millions) 2016 2015
Not overdue 7 386 7 318
Past due for not more than one month 262 265
Past due for more than one month
but less than three months 223 255
Past due for more than three months
but less than six months 185 193
Past due for more than six months
but less than one year 145 156
Past due for more than one year 163 135
Provisions for doubtful trade receivables – 162 – 142
Total trade receivables, net 8 202 8 180
There is also a risk that certain countries could devalue their currency. Currency exposures are described in more detail in paragraph “Effects of currency fluctuation” on page 158.
Trade payables and other current liabilities decreased by USD 1.8 billion to USD 16.3 billion, compared to USD 18.1 billion at December 31, 2015, due to a decrease in other current liabilities of USD 1.0 billion and a decrease in trade payables of USD 0.8 billion.
Current income tax liabilities decreased by USD 0.1 billion to USD 1.6 billion. While there is some uncertainty about the final taxes to be assessed in our major coun-tries, we believe that our estimated amounts for current income tax liabilities, including any amounts related to any uncertain tax positions, are appropriate based on currently known facts and circumstances.
In our key countries, Switzerland and the US, assess-ments have been agreed by the tax authorities up to 2014 in Switzerland and in the US up to 2012, with the excep-tion of one open US position related to the 2007 and one for the 2010 tax filings.
Other non-current liabilities amounted to USD 15.1 bil-lion at December 31, 2016, compared to USD 14.4 billion at December 31, 2015. The increase of USD 0.7 billion was primarily due to an increase in the pension liability of USD 0.5 billion, mainly resulting from a decrease in the actuarial discount rates used to calculate the pres-ent value of the benefit obligation and an increase in deferred tax liability of USD 0.3 billion.
Other non-current liabilities include deferred tax lia-bilities of USD 6.7 billion, provisions and other non-cur-rent liabilities of USD 8.5 billion.
Novartis believes that its total provisions are ade-quate based upon currently available information. How-ever, given the inherent difficulties in estimating liabilities in this area, Novartis may incur additional costs beyond the amounts provided. Management believes that such additional amounts, if any, would not be material to the Group’s financial condition but could be material to the results of operations or cash flows in a given period.
The Group’s equity decreased by USD 2.2 billion to USD 74.9 billion at December 31, 2016, compared to USD 77.1 billion at December 31, 2015. The decrease was mainly on account of unfavorable currency translation differences of USD 2.4 billion and net actuarial losses from defined benefit plans of USD 0.5 billion, partially offset by the Novartis share of other comprehensive income recognized by associated companies of USD 0.7 billion . The USD 6.5 billion dividend payment was offset by the net income of USD 6.7 billion.
The Group’s liquidity amounted to USD 7.8 billion at December 31, 2016 compared to USD 5.4 billion at December 31, 2015, and net debt decreased to USD 16.0 billion at December 31, 2016 compared to USD 16.5 bil-lion at December 31, 2015. The debt/equity ratio increased to 0.32:1 at December 31, 2016 compared to 0.28:1 at December 31, 2015.
Summary of equity movements attributable to Novartis AG shareholders
Number of outstanding shares (in millions) Issued share capital and reserves attributable to Novartis AG shareholders
2016 2015 Change
2016 2015 Change USD millions USD millions USD millions
Balance at beginning of year 2 373.9 2 398.6 – 24.7 77 046 70 766 6 280
Shares acquired to be held in Group Treasury – 9.6 9.6 – 897 897
Shares acquired to be canceled – 10.3 – 49.9 39.6 – 784 – 4 805 4 021
Other share purchases – 2.6 – 4.1 1.5 – 208 – 417 209
Exercise of options and employee transactions 4.1 27.0 – 22.9 214 1 592 – 1 378
Equity-based compensation 9.0 11.9 – 2.9 664 815 – 151
Decrease of treasury share repurchase
obligation under a share buyback trading plan 658 – 658
Dividends – 6 475 – 6 643 168
Net income of the year attributable to shareholders
of Novartis AG 6 712 17 783 – 11 071
Impact of change in ownership of consolidated entities – 7 – 7
Other comprehensive income attributable to shareholders
of Novartis AG – 2 330 – 1 806 – 524
Balance at end of year 2 374.1 2 373.9 0.2 74 832 77 046 – 2 214

162 | Novartis Annual Report 2016
During 2016, 13.1 million treasury shares were delivered as a result of options being exercised and physical share deliveries related to equity-based participation plans (2015: 38.9 million shares). Novartis repurchased 10.3 million shares on the SIX Swiss Exchange second trad-ing line under the CHF 10 billion share buyback approved at the Annual General Meeting (AGM) in 2016, to offset the dilutive impact from equity-based participation plans (2015: 49.9 million shares under the USD 5 billion share
buyback announced in November 2013, which was com-pleted in November 2015). In addition, 2.6 million shares were acquired from employees, which were previously granted to them under the respective programs (2015: 4.1 million). No shares were repurchased on the SIX Swiss Exchange first trading line in 2016 (2015: 9.6 million). With these transactions, the total number of shares outstand-ing was increased by 0.2 million shares in 2016 (2015: reduction of 24.7 million shares).
Critical accounting policies and estimatesOur significant accounting policies are set out in Note 1 to the Group’s consolidated financial statements, which are prepared in accordance with International Financial Reporting Standards (IFRS) as issued by the Interna-tional Accounting Standards Board (IASB).
Given the uncertainties inherent in our business activ-ities, we must make certain estimates and assumptions that require difficult, subjective and complex judgments. Because of uncertainties inherent in such judgments, actual outcomes and results may differ from our assump-tions and estimates, which could materially affect the Group’s consolidated financial statements. Application of the following accounting policies requires certain assumptions and estimates that have the potential for the most significant impact on our consolidated financial statements.
Deductions from revenues
As is typical in the pharmaceutical industry, our gross sales are subject to various deductions which are pri-marily composed of rebates and discounts to retail cus-tomers, government agencies, wholesalers, health insur-ance companies and managed healthcare organizations. These deductions represent estimates of the related obligations, requiring the use of judgement when esti-mating the effect of these sales deductions on gross sales for a reporting period. These adjustments are deducted from gross sales to arrive at net sales.
The following summarizes the nature of some of these deductions and how the deduction is estimated. After recording these, net sales represent our best esti-mate of the cash that we expect to ultimately collect. The US market has the most complex arrangements related to revenue deductions.
United States specific healthcare plans and program rebatesThe United States Medicaid Drug Rebate Program is administered by State governments using State and Fed-eral funds to provide assistance to certain vulnerable and needy individuals and families. Calculating the rebates to be paid related to this program involves inter-preting relevant regulations, which are subject to chal-lenge or change in interpretative guidance by govern-ment authorities. Provisions for estimating Medicaid rebates are calculated using a combination of historical
experience, product and population growth, product pricing and the mix of contracts and specific terms in the individual State agreements.
The United States Federal Medicare Program, which funds healthcare benefits to individuals age 65 or older and certain disabilities, provides prescription drug ben-efits under Part D section of the program. This benefit is provided and administrated through private prescrip-tion drug plans. Provisions for estimating Medicare Part D rebates are calculated based on the terms of indi-vidual plan agreements, product sales and population growth, product pricing and the mix of contracts.
We offer rebates to key managed healthcare and pri-vate plans in an effort to sustain and increase sales of our products. These programs provide a rebate after the plans have demonstrated they have met all terms and conditions set forth in their contract with us. These rebates are estimated based on the terms of individual agreements, historical experience, product pricing, and projected product growth rates.
These provisions are adjusted based on established processes and experiences from filing data with individ-ual states and plans. There is often a time lag of several months between us recording the revenue deductions and our final accounting for them.
Non-United States specific healthcare plans and program rebatesIn certain countries other than the US, we provide rebates to governments and other entities. These rebates are often mandated by laws or government regulations.
In several countries, especially in Europe and Austra-lia, we enter into innovative pay-for- performance arrange-ments with certain healthcare providers. Under these agreements, we may be required to make refunds to the healthcare providers or to provide additional medicines free of charge if anticipated treatment outcomes do not meet predefined targets. Potential refunds and the deliv-ery of additional medicines at no cost are estimated and recorded as a deduction of revenue at the time the related revenues are recorded. Estimates are based on historical experience and clinical data. In cases where historical experience and clinical data are not sufficient for a reliable estimation of the outcome, revenue recog-nition would be deferred until such history would be avail-able. In addition, we offer global patient assistance pro-grams.
There is often a time lag of several months between us recording the revenue deductions and our final accounting for them.

Novartis Annual Report 2016 | 163FINANCIAL REPORTOperating and financial review 2016
Non-healthcare plans and program rebates, returns and other deductionsWe offer rebates to purchasing organizations and other direct and indirect customers to sustain and increase market share for our products. Since rebates are con-tractually agreed upon, the related provisions are esti-mated based on the terms of the individual agreements, historical experience, and projected product growth rates.
Charge-backs occur where our subsidiaries have arrangements with indirect customers to sell products at prices that are lower than the price charged to whole-salers. A charge-back represents the difference between the invoice price to the wholesaler and the indirect cus-tomer’s contract price. We account for vendor charge-backs by reducing revenue for the estimate of charge-backs attributable to a sale transaction. Provisions for estimated charge-backs are calculated using a combi-nation of factors such as historical experience, product growth rates, payments, product pricing, level of inven-tory in the distribution channel, the terms of individual agreements and our estimate of the claims processing time lag.
When we sell a product providing a customer the right to return it, we record a provision for estimated sales returns based on our sales return policy and historical return rates. Other factors considered include actual product recalls, expected marketplace changes, the remaining shelf life of the product, and the expected entry of generic products. In 2016, sales returns amounted to approximately 1% of gross product sales. If sufficient experience is not available, sales are only recorded based on evidence of product consumption or when the right of return has expired.
We enter into distribution service agreements with major wholesalers, which provide a financial disincentive for the wholesalers to purchase product quantities in
excess of current customer demand. Where possible, we adjust shipping patterns for our products to maintain wholesalers’ inventory levels consistent with underlying patient demand.
We offer cash discounts to customers to encourage prompt payment. Cash discounts are estimated and accrued at the time of invoicing and are deducted from revenue.
Following a decrease in the price of a product, we generally grant customers a “shelf stock adjustment” for their existing inventory for the relevant product. Provi-sions for shelf stock adjustments, which are primarily relevant within the Sandoz Division, are determined at the time of the price decline or at the point of sale, if the impact of a price decline on the products sold can be reasonably estimated based on the customer’s inventory levels of the relevant product.
Other sales discounts, such as consumer coupons and co-pay discount cards, are offered in some markets. The estimated amounts of these discounts are recorded at the time of sale, or when the coupons are issued, and are estimated utilizing historical experience and the spe-cific terms for each program. If a discount for a proba-ble future transaction is offered as part of a sales trans-action then an appropriate portion of revenue is deferred to cover this estimated obligation.
We adjust provisions for revenue deductions period-ically to reflect actual experience. To evaluate the ade-quacy of provision balances, we use internal and exter-nal estimates of the inventory in transit, the level of inventory in the distribution and retail channels actual claims data received and the time lag for processing rebate claims. External data sources include reports from wholesalers and third-party market data purchased by Novartis.
The following table shows the worldwide extent of our revenue deductions provisions and related payment expe-riences for the Innovative Medicines, Sandoz and Alcon Divisions:
Provisions for deductions from revenue
Income statement charge
Effect of Change in
Revenue currency provisions Revenue
deductions translation offset against deductions
provisions at and business Payments/ Adjustments gross trade provisions at
(USD millions) January 1 combinations utilizations of prior years Current year receivables December 31
2016
US-specific healthcare plans and program rebates 1 165 – 3 203 7 3 492 1 461
Non-US-specific healthcare plans and program rebates 1 024 – 31 – 1 844 – 26 1 883 14 1 020
Non-healthcare plans and program-related rebates,
returns and other deductions 1 601 – 19 – 11 142 – 117 11 383 – 4 1 702
Total continuing operations 2016 3 790 – 50 – 16 189 – 136 16 758 10 4 183
2015
US-specific healthcare plans and program rebates 1 097 – 2 823 – 90 2 981 1 165
Non-US-specific healthcare plans and program rebates 1 015 – 109 – 1 716 – 3 1 846 – 9 1 024
Non-healthcare plans and program-related
rebates, returns and other deductions 1 421 – 69 – 10 679 – 124 10 993 59 1 601
Total continuing operations 2015 3 533 – 178 – 15 218 – 217 15 820 50 3 790

164 | Novartis Annual Report 2016
The table below shows the gross to net sales reconciliation for our Innovative Medicines Division:
Gross to net sales reconciliation
Income statement charge
Charged directly
Charged through without being
revenue deduction recorded in revenue
provisions deduction provisions Total In % of
USD millions USD millions USD millions gross sales
2016
Innovative Medicines gross sales subject to deductions 42 630 100.0
US-specific healthcare plans and program rebates – 3 051 – 3 051 – 7.2
Non-US-specific healthcare plans and program rebates – 1 352 – 885 – 2 237 – 5.2
Non-healthcare plans and program-related rebates, returns and other deductions – 2 736 – 2 044 – 4 780 – 11.2
Total Innovative Medicines gross to net sales adjustments – 7 139 – 2 929 – 10 068 – 23.6
Innovative Medicines net sales 2016 32 562 76.4
20151
Innovative Medicines gross sales subject to deductions 42 460 100.0
US-specific healthcare plans and program rebates – 2 533 – 2 533 – 6.0
Non-US-specific healthcare plans and program rebates – 1 238 – 762 – 2 000 – 4.7
Non-healthcare plans and program-related rebates, returns and other deductions – 2 831 – 1 751 – 4 582 – 10.8
Total Innovative Medicines gross to net sales adjustments – 6 602 – 2 513 – 9 115 – 21.5
Innovative Medicines net sales 2015 33 345 78.5
1 Restated to reflect the new divisional structures and product transfers between divisions, announced on January 27, 2016.
Surgical equipment revenue
Surgical equipment is often sold together with other products and services under a single contract. The total consideration is allocated to the separate elements based on their relative fair values. Revenue is recognized once the recognition criteria have been met for each ele-ment of the contract.
For surgical equipment, in addition to cash and instal-ment sales, revenue is recognized under finance and operating lease arrangements. Arrangements in which Novartis transfers substantially all the risks and rewards incidental to ownership to the customer are treated as finance lease arrangements. Revenue from finance lease arrangements is recognized at amounts equal to the fair values of the equipment, which approximate the present values of the minimum lease payments under the arrange-ments. As interest rates embedded in lease arrange-ments are approximately market rates, revenue under finance lease arrangements is comparable to revenue for outright sales. Finance income for arrangements in excess of twelve months is deferred and subsequently recognized based on a pattern that approximates the use of the effective interest method and recorded in “Other income”. Operating lease revenue for equipment rentals is recognized on a straight-line basis over the lease term.
Impairment of goodwill, intangible assets and property, plant and equipment
We review long-lived intangible assets and property, plant and equipment for impairment whenever events or changes in circumstance indicate that the asset’s bal-ance sheet carrying amount may not be recoverable. Goodwill, the Alcon brand-name and other currently not amortized intangible assets are reviewed for impairment at least annually.
An asset is generally considered impaired when its balance sheet carrying amount exceeds its estimated recoverable amount, which is defined as the higher of its fair value less costs of disposal and its value in use. Usu-ally, Novartis adopts the fair value less costs of disposal method for its impairment evaluation. In most cases no directly observable market inputs are available to mea-sure the fair value less costs of disposal. Therefore, an estimate of fair value less costs of disposal is derived indirectly and is based on net present value techniques utilizing post-tax cash flows and discount rates. In the limited cases where the value in use method is applied, net present value techniques are utilized using pre-tax cash flows and discount rates.
Fair value reflects estimates of assumptions that mar-ket participants would be expected to use when pricing the asset and for this purpose management considers the range of economic conditions that are expected to

Novartis Annual Report 2016 | 165FINANCIAL REPORTOperating and financial review 2016
exist over the remaining useful life of the asset. The esti-mates used in calculating net present values are highly sensitive, and depend on assumptions specific to the nature of the Group’s activities with regard to:— amount and timing of projected future cash flows;— future tax rates;— behavior of competitors (launch of competing products,
marketing initiatives, etc.); and— appropriate discount rate.
Due to the above factors and those further described in Note 1, actual cash flows and values could vary signifi-cantly from forecasted future cash flows and related val-ues derived using discounting techniques.
The recoverable amount of the grouping of cash gen-erating units to which goodwill and indefinite life intan-gible assets are allocated is based on fair value less costs of disposal. The valuations are derived from applying dis-counted future cash flows based on key assumptions, including the terminal growth rate and discount rate. For additional information see Note 11 starting on page 207.
In 2016, intangible asset impairment charges for con-tinuing operations of USD 591 million were recognized, of which USD 522 million were recorded in the Innova-tive Medicines Division and USD 65 million in the Sandoz Division and USD 4 million in the Alcon Division.
In 2015, intangible asset impairment charges of con-tinuing operations amounted to USD 206 million (USD 178 million in the Innovative Medicines Division and USD 27 million in the Sandoz Division and USD 1 million in the Alcon Division).
In 2016, there was no reversal of prior year impair-ment charges (2015: USD 40 million).
Goodwill and other intangible assets represent a sig-nificant part of our consolidated balance sheet, primar-ily due to acquisitions. Although no significant additional impairments are currently anticipated, impairment eval-uation could lead to material impairment charges in the future. For more information, see Note 11 to the Group’s consolidated financial statements.
Additionally, net impairment charges for property, plant and equipment from continuing operations during 2016 amounted to USD 102 million (2015: USD 80 mil-lion).
Trade receivables
Trade receivables are initially recognized at their invoiced amounts including any related sales taxes less adjust-ments for estimated revenue deductions such as rebates, charge backs and cash discounts.
Provisions for doubtful trade receivables are estab-lished once there is an indication that it is likely that a loss will be incurred. These provisions represent the dif-ference between the trade receivable’s carrying amount in the consolidated balance sheet and the estimated net collectible amount. Significant financial difficulties of a customer, such as probability of bankruptcy, financial reorganization, default or delinquency in payments are considered indicators that recovery of the trade receiv-
able is doubtful. Trade receivable balances include sales to drug wholesalers, retailers, private health systems, government agencies, managed care providers, phar-macy benefit managers and government-supported healthcare systems. Novartis continues to monitor sov-ereign debt issues and economic conditions in Greece, Italy, Portugal, Spain and other countries, and evaluates trade receivables in these countries for potential collec-tion risks. Substantially all of the trade receivables over-due from such countries are due directly from local gov-ernments or from government-funded entities. Deteriorating credit and economic conditions and other factors in these countries have resulted in, and may con-tinue to result in an increase in the average length of time that it takes to collect these trade receivables and may require Novartis to re-evaluate the collectability of these trade receivables in future periods.
Contingent consideration
In a business combination or divestment of a business, it is necessary to recognize contingent future payments to previous or from new owners representing contrac-tually defined potential amounts as a liability or asset. Usually for Novartis these are linked to milestone or roy-alty payments related to certain assets and are recog-nized as a financial liability or asset at their fair value which is then re-measured at each subsequent report-ing date. These estimations typically depend on factors such as technical milestones or market performance and are adjusted for the probability of their likelihood of payment and if material, appropriately discounted to reflect the impact of time. Changes in the fair value of contingent consideration liabilities are recognized in the consolidated income statement in “Cost of goods sold” for currently marketed products and in “Research & Development” for In-Process Research and Develop-ment (IPR&D). Changes in contingent consideration assets are recognized in “”Other revenue”, Other income” or “Other expense”, depending on its nature. The effect of unwinding the discount over time is recognized in “Interest expense” in the consolidated income statement. Novartis does not recognize contingent consideration associated with asset purchases outside of a business combination that are conditional upon future events which are within its control until such time as there is an unconditional obligation. If the contingent consideration is outside the control of Novartis, a liability is recognized once it becomes probable that the contingent consider-ation will become due. In both cases, if appropriate, a corresponding asset is recorded.
Impairment of associated companies accounted for at equity
Novartis considers investments in associated compa-nies for impairment evaluation whenever indicators are noted for example when there is a quoted share price indicating a fair value less than the per-share balance sheet carrying value for the investment.

166 | Novartis Annual Report 2016
“Marketable securities” are financial assets recorded in Corporate and consisting principally of quoted equity and quoted debt securities as well as fund investments which are principally traded in liquid markets. Marketable securities that are held for long-term strategic purposes and typically recorded in the Divisions are classified as non-current financial assets. They include equity secu-rities and fund investments.
Retirement and other post-employment benefit plans
We sponsor pension and other post-employment bene-fit plans in various forms that cover a significant portion of our current and former associates. For post-employ-ment plans with defined benefit obligations, we are required to make significant assumptions and estimates about future events in calculating the expense and the present value of the liability related to these plans. These include assumptions about the interest rates we apply to estimate future defined benefit obligations and net periodic pension expense as well as rates of future pen-sion increases. In addition, our actuarial consultants pro-vide our management with historical statistical informa-tion such as withdrawal and mortality rates in connection with these estimates.
Assumptions and estimates used by the Group may differ materially from the actual results we experience due to changing market and economic conditions, higher or lower withdrawal rates, and longer or shorter life spans of participants among other factors. For example, in 2016, a decrease in the interest rate we apply in deter-mining the present value of the defined benefit obliga-tions of one quarter of one percent would have increased our year-end defined benefit pension obligation for plans in Switzerland, US, UK, Germany and Japan, which rep-resent 95% of the Group total defined benefit pension obligation, by approximately USD 0.8 billion. Similarly, if the 2016 interest rate had been one quarter of one per-centage point lower than actually assumed, net periodic pension cost for pension plans in these countries, which represent about 92% of the Group’s total net periodic pension cost for pension plans, would have increased by approximately USD 27 million. Depending on events, such differences could have a material effect on our total equity. For more information on obligations under retire-ment and other post-employment benefit plans and underlying actuarial assumptions, see Note 25 to the Group’s consolidated financial statements.
Provisions and Contingencies
A number of Group companies are involved in various government investigations and legal proceedings (intel-lectual property, sales and marketing practices, product liability, commercial, employment and wrongful dis-charge, environmental claims, etc.) arising out of the nor-mal conduct of their businesses. For more information, see Note 20 and Note 28 in the Group’s consolidated financial statements.
We record provisions for legal proceedings when it is probable that a liability has been incurred and the amount can be reliably estimated. These provisions are adjusted periodically as assessments change or addi-tional information becomes available. For significant product liability cases the provision is actuarially deter-mined based on factors such as past experience, amount and number of claims reported, and estimates of claims incurred but not yet reported.
Provisions are recorded for environmental remedia-tion costs when expenditure on remedial work is proba-ble and the cost can be reliably estimated. Remediation costs are provided for under “Non-current liabilities” in the Group’s consolidated balance sheet.
Provisions relating to estimated future expenditure for liabilities do not usually reflect any insurance or other claims or recoveries, since these are only recognized as assets when the amount is reasonably estimable and collection is virtually certain.
Research & Development
Internal Research & Development costs are fully charged to the consolidated income statement in the period in which they are incurred. We consider that regulatory and other uncertainties inherent in the development of new products preclude the capitalization of internal develop-ment expenses as an intangible asset usually until mar-keting approval from the regulatory authority is obtained in a relevant major market, such as for the US, the EU, Switzerland or Japan.
Healthcare contributions
In many countries our subsidiaries are required to make contributions to the countries’ healthcare costs as part of programs other than the ones mentioned above under deductions from revenues. The amounts to be paid depend on various criteria such as the subsidiary’s mar-ket share or sales volume compared to certain targets. Considerable judgment is required in estimating these contributions as not all data is available when the estimates need to be made.
The largest of these healthcare contributions relates to the US Healthcare Reform fee, which was introduced in 2011. This fee is an annual levy to be paid by US phar-maceutical companies, including various Novartis sub-sidiaries, based on each company’s qualifying sales as a percentage of the prior year’s government-funded pro-gram sales. This pharmaceutical fee levy is recognized in “Other expense”.
On July 25, 2014, the US Department of the Treasury and the US Internal Revenue Service issued final guid-ance on this pharmaceutical fee levy which stipulated that instead of a liability being estimated and recognized immediately with the first qualifying sale in the following fee year, as had been industry practice, the levy is owed in the year in which the sales occur.

Novartis Annual Report 2016 | 167FINANCIAL REPORTOperating and financial review 2016
As a result of this final guidance, in 2014, “Other expense” includes the recurring non-tax deductible annual expense of approximately USD 200 million for the 2014 pharmaceutical fee levy, as well as the non-tax deductible expense of USD 204 million for the 2013 phar-maceutical fee levy. USD 204 million of this charge has been considered as an additional exceptional charge in 2014 since it results from the change in timing of recog-nition of the pharmaceutical fee levy as required by the final guidance.
In addition, effective 2013, the US government also implemented a medical device sales tax which is levied on the Alcon Division’s US sales of products which are considered surgical devices under the law. This medical device tax is initially included in the cost of inventory as, for Alcon, the tax is usually levied on intercompany sales. It is expensed as cost of goods sold when the inventory is sold to third parties.
Taxes
We prepare and file our tax returns based on an inter-pretation of tax laws and regulations, and record esti-mates based on these judgments and interpretations. Our tax returns are subject to examination by the com-petent taxing authorities, which may result in an assess-ment being made requiring payments of additional tax, interest or penalties. Since Novartis uses its intellectual
property globally to deliver goods and services, the transfer prices within the Group as well as arrangements between subsidiaries to finance research & development and other activities may be challenged by the national tax authorities in any of the jurisdictions in which Novartis operates. Therefore, inherent uncertainties exist in our estimates of our tax positions, but we believe that our estimated amounts for current and deferred tax assets or liabilities, including any amounts related to any uncer-tain tax positions, are appropriate based on currently known facts and circumstances.
New accounting pronouncements
See Note 1 to the Group’s consolidated financial state-ments.
Internal control over financial reporting
The Group’s management has assessed the effective-ness of internal control over financial reporting. The Group’s independent statutory auditor also issued an opinion on the effectiveness of internal control over financial reporting. Both the Group’s management and its external auditors concluded that the Group main-tained, in all material respects, effective internal control over financial reporting as of December 31, 2016.
Factors affecting results of operationsWe believe that our strategy, which is anchored in our company’s tradition of leadership in innovation, positions us well to take advantage of trends shaping the future of the industry. These trends range from advances in sci-ence and technology that are opening new frontiers for research and development (R&D), to the growing and graying of populations that are boosting demand for chronic disease treatments (see page 15).
At the same time, these trends contribute to certain risks and uncertainties in our operations. Some of them are inherent to the industry, and others are specific to Novartis. Anticipating and managing these risks can influ-ence our ability to deliver strong financial performance and meet the needs of patients, healthcare providers, payors, regulators and shareholders.
Approach to risk management
The Risk Committee of the Board ensures the Group has implemented an appropriate and effective risk manage-ment system and process. It reviews with management and internal audit the identification, prioritization and management of the risks, the accountabilities and roles of the functions involved with risk management, the risk portfolio and the related actions implemented by man-agement. The Risk Committee informs the Board of Directors on a periodic basis.
The Group Risk Office coordinates and aligns the risk management processes, and reports to the Risk Com-mittee on a regular basis on risk assessment and risk management. Organizational and process measures have been designed to identify and mitigate risks at an early stage. Organizationally, the responsibility for risk assessment and management is allocated to the divi-sions, organizational units, and functions, with special-ized Corporate functions, such as Group Finance, Group Legal, Group Quality Assurance, Corporate Health, Safety and Environment, Business Continuity Manage-ment, Integrity and Compliance and the Business Prac-tices Office, providing support and controlling the effec-tiveness of the risk management in these respective areas.
Financial risk management is described in more detail in Note 29 to the Group consolidated financial state-ments.
Risk factors
Loss of exclusivity for patented productsPharmaceutical companies routinely face generic com-petition when their products lose patent or other intel-lectual property protection, and Novartis is no exception. Major products of our Innovative Medicines and Alcon Divisions, as well as certain products of our Sandoz Divi-sion, are protected by patent or other intellectual prop-

168 | Novartis Annual Report 2016
erty rights – allowing us to exclusively market those prod-ucts. The loss of exclusivity has had, and will continue to have, an adverse effect on our results. In 2016, the impact of generic competition on our net sales amounted to USD 2.4 billion.
Some of our best-selling products have started to, or are expected to, face considerable competition due to the expiration of patent or other intellectual property pro-tection. For example, we faced generic competition for Gleevec/Glivec in the US, Japan and certain EU coun-tries for most of 2016. In the remaining EU countries, cer-tain of our Glivec intellectual property rights expired in December 2016, and generic competition there has begun. Looking forward, certain intellectual property protecting Afinitor and Gilenya will expire in 2018, 2019 and 2020. In addition, some of the patents protecting these products are being challenged in the US, raising the possibility of an earlier entry of generic competition.
To counter the impact of patent expirations, we con-tinuously invest in R&D to rejuvenate our portfolio. For example, in 2016, we invested 18.6% of total net sales in R&D. One measure of the output of our efforts is the per-formance of our growth products – products launched in a key market (EU, US, Japan) in 2011 or later, or prod-ucts with exclusivity in key markets until at least 2020 (except Sandoz, which includes only products launched in the last 24 months). These products accounted for 35% of total net sales in 2016, up 20% (USD) from the previous year.
Ability to deliver new productsOur ability to maintain and grow our business – and to replace revenue and income lost to generic and other competition – depends in part on the success of our R&D activities in identifying and developing new treatments that address unmet medical needs, are accepted by patients and physicians, and are reimbursed by payors.
Developing new healthcare products and bringing them to market is a costly, lengthy and uncertain pro-cess. R&D for a new product in our Innovative Medicines Division can take 15 years or more, from discovery to commercial launch. With time limits on intellectual prop-erty protections, the longer it takes to develop a prod-uct, the less time we may have to recoup our costs. During each stage of development, there is a significant risk that we will encounter obstacles. They may cause a delay or add substantial expense, limit the potential for commercial success, or force us to abandon a product in which we have invested substantial amounts of time and money.
In addition, as healthcare costs continue to rise, gov-ernments and payors around the world are increasingly focused on health outcomes, rewarding new products that represent truly breakthrough innovation versus those that offer an incremental benefit over other prod-ucts in the same therapeutic class. This has led to requests for more clinical trial data, for the inclusion of more patients in clinical trials, and for more detailed anal-yses of the trials. As a result, the already lengthy and expensive process of obtaining regulatory approvals and reimbursement for pharmaceutical products has become even more challenging.
Our Sandoz Division faces similar challenges, partic-ularly in the development of biosimilars. While Sandoz was a pioneer in introducing biosimilars to the European market in 2006, and was the first company to win approval for a biosimilar under the new regulatory path-way in the US in 2015, many countries still lack fully devel-oped regulatory frameworks for the development and approval of biosimilars. Further delays in establishing regulatory frameworks, or any other difficulties that may arise in the development or marketing of biosimilars, could put at risk the significant investments that Sandoz has made, and will continue to make, in this area.
Our Alcon Division faces medical device develop-ment and approval processes that are often similarly dif-ficult. As part of its growth plan, Alcon is taking steps to accelerate innovation. It has started to see the results of its efforts, with the approval and launch in 2016 of two new intraocular lenses, PanOptix and UltraSert, as well as a multifocal version of Dailies Total1. But there is no certainty that Alcon will continue to be successful in these efforts, and if it is not, there could be a material adverse effect on the success of the Alcon Division, and on the Group as a whole.
In spite of our significant investments, there can be no guarantee that our R&D activities will produce com-mercially viable new products that will enable us to grow our business and replace revenue and income lost to competition.
Commercial success of key growth productsOur ability to grow depends not only on our pipeline deliv-ery, but also on our commercial success, particularly with respect to our growth products, which we consider to be an indicator of our ability to renew our portfolio. The commercial success of these products could be impacted at any time by a number of factors, including new com-petitors, changes in doctors’ prescribing habits, pricing pressure, manufacturing issues, or loss of intellectual property protection. In addition, our revenue could be significantly impacted by the timing and rate of commer-cial acceptance of key new products.
All of our businesses face intense competition from new products and scientific advances from competitors. Physicians, patients and payors may choose competitor products instead of ours if they perceive them to be bet-ter in terms of efficacy, safety, cost or convenience. In our Oncology business, for example, Afinitor saw sales decline in 2016 due to new treatment options in advanced breast cancer and renal cell carcinoma in the US. Sales increases for Afinitor in other indications, such as neu-roendocrine tumors of gastrointestinal or lung origin, were unable to compensate.
Our Alcon Division also faced significant competitive pressure in 2016. Alcon is implementing a growth plan to counteract this pressure, including steps such as accelerating innovation and increasing investments in new product launches. While we are starting to see signs of progress, such as contact lens market share gains in certain European countries where we started investing in direct-to-consumer advertising, there is no certainty that our actions and investments will be sufficient to off-set competition and return the division to growth. Should

Novartis Annual Report 2016 | 169FINANCIAL REPORTOperating and financial review 2016
our efforts fail to accomplish their goals, or fail to do so in a timely manner, it could have a material adverse impact on our business, financial condition, or results of operations beyond the near term, as well.
Pricing and reimbursementAround the world, governments and payors continue to struggle with rising healthcare costs as aging popula-tions contribute to increased prevalence of chronic dis-eases. There have also been examples, particularly in the US, of significant controversies about prices for phar-maceuticals that some members of the public have con-sidered excessive. These factors have intensified the pressures we face regarding the prices we charge for our drugs, and on our ability to establish satisfactory rates of reimbursement for our products by govern-ments, insurers and other payors.
We expect scrutiny to continue in 2017 and following years as governments and insurers around the world strive to reduce healthcare costs through steps such as restricting access to higher priced new medicines, increasing coinsurance or copays owed by patients for medicines, increasing the use of generics, and imposing price cuts. In this environment, we believe it is more important than ever to demonstrate the value that true innovation brings to the healthcare system.
To manage these pressures, we are investing in real-world data and analytics to provide additional evidence of the health benefits of our products, exploring new technologies and patient management services, and partnering with payors to develop and scale out-comes-based commercial models. For example, we are working with customers on flexible pricing approaches where we are fully compensated only if a drug succeeds in meeting certain performance targets.
Business practicesIn recent years, there has been a trend of increasing gov-ernment investigations and litigation against companies operating in our industry, including in the US and other countries. We are obligated to comply with the laws of all countries in which we operate, as well as any new requirements that may be imposed upon us. But beyond legal requirements, we strive to meet evolving public expectations for ethical behavior. We have a significant global compliance program in place, and devote substan-tial time and resources to ensure that our business is conducted in a legal and publicly acceptable manner. Despite our efforts, any failure to comply with the law could lead to substantial liabilities that may not be cov-ered by insurance and could affect our business and rep-utation.
Governments and regulatory authorities worldwide are also increasingly challenging practices previously considered to be legal and compliant. For example, spon-soring doctors to attend medical conferences has long been used by pharmaceutical companies to help raise awareness of the latest advances in medicine. One of our goals in 2016 was to find better and more inclusive ways to reach a broader cross-section of this commu-nity. We have therefore started to employ technology to supplement face-to-face meetings and bring the expe-rience of international congresses to the local level.
Responding to these challenges and new regulations is costly. Investigations and litigation may affect our rep-utation, create a risk of potential exclusion from govern-ment reimbursement programs in the US and other coun-tries, potentially large damage payments and agreements intended to regulate company behavior. This is why we continued to strengthen the Integrity & Compliance (I&C) function in 2016. The function now has 375 employees, 175 of whom were added in the last three years.
We also introduced a new Chief Ethics and Compli-ance Officer, reporting directly to the CEO, in 2016. The new Chief Ethics and Compliance Officer is also Head of Litigation, reporting to the Group General Counsel of Novartis. By bringing the I&C and Legal functions closer together, we can evaluate facts that are at issue in law-suits to determine if additional compliance actions or policies are warranted. We expect this will help us con-stantly improve our compliance activities.
Supply continuityThe production of pharmaceutical products and medi-cal devices can be highly complex, and any manufactur-ing issue compromising supply or quality could have seri-ous consequences for the health of patients. For this reason, there are strict regulatory requirements sur-rounding our manufacturing processes, which introduce a greater chance for disruptions and liabilities. For exam-ple, government authorities monitor our manufacturing facilities, and if they fail to meet requirements, there is a risk that they could be shut down. Disturbances in our supply chain could lead to product shortages, lost reve-nue and litigation.
Beyond regulatory requirements, many of our prod-ucts involve technically sophisticated manufacturing pro-cesses or require specialized raw materials. For exam-ple, biologic products – produced from living plant or animal micro-organisms – comprise a significant portion of our product portfolio. For biologic products, slight deviations in the production process could lead to pro-duction failures or recalls. Our portfolio also includes a number of sterile products, such as oncology treatments, which are technically complex to manufacture and require strict environmental controls. There is a greater chance of production failures and supply interruptions for such products.
Given the complexity of our manufacturing pro-cesses, we have worked for several years to adopt a sin-gle high-quality standard across the company. We believe these efforts are having an impact. The results of inspections by regulatory agencies in 2016 were con-sistent with the year before. Out of a total of 206 inspec-tions, all but four (98%) were without major findings. Novartis took a further step in 2016 in our ongoing com-mitment to improvement, realigning our quality organi-zation into a single, enterprise-wide group under one leader.
Foreign exchange fluctuationsChanges in exchange rates between the US dollar, our reporting currency, and other currencies can have a sig-nificant effect on our reported sales, costs and earnings, as well as on the reported value of our assets, liabilities and cash flows.

170 | Novartis Annual Report 2016
For example, because our expenditures in Swiss francs are significantly higher than our revenue in Swiss francs, volatility in the value of the Swiss franc can have a significant impact on our reported results, and the tim-ing and extent of such volatility can be difficult to predict.
There is also a risk that certain countries could take steps that could significantly impact the value of their currencies, such as withdrawing from trade agreements or common currencies. In addition, countries may expe-rience periods of high inflation. This could lead them to devalue their currencies or set exchange controls, as Venezuela has done. Ongoing conditions in Venezuela and other such countries could lead to further devalua-tions, which could result in significant additional finan-cial losses to the Group in the future.
To mitigate the risk posed by foreign exchange fluc-tuations, we engage in hedging transactions where man-agement deems appropriate, after taking into account the natural hedging afforded by our global business activ-ity.
Intangible assets and goodwillWe carry a significant amount of goodwill and other intangible assets on our consolidated balance sheet, pri-marily due to acquisitions. As a result, we may incur sig-nificant impairment charges if the fair value of intangible assets and groupings of cash generating units contain-ing goodwill would be less than their carrying value on the Group’s consolidated balance sheet at any point in time.
We regularly review our long-lived intangible and tan-gible assets for impairment. In 2016, for example, we recorded intangible asset impairment charges of USD 591 million. Impairment testing may lead to addi-tional impairment charges in the future. Any significant impairment charges could have a material adverse effect on our results of operations and financial condition.
TaxOur worldwide operations are taxed under laws in the jurisdictions in which we operate. However, the inte-grated nature of our worldwide operations can produce conflicting claims from revenue authorities as to the determination of profits to be taxed in individual coun-tries. The majority of the jurisdictions in which we oper-ate have double tax treaties with other foreign jurisdic-tions, which provide a framework for mitigating the incidence of double taxation on our revenues and capi-tal gains.
But in recent years, tax authorities around the world have become more rigid in exercising any discretion they may have. As part of this, the Organization for Economic Co-operation and Development (OECD) has proposed a number of tax law changes under its Base Erosion and Profit Shifting (BEPS) Action Plans to address issues of transparency, coherence and substance.
At the same time, the European Commission is final-izing the Anti Tax Avoidance Directive and continues to expand the application of the fiscal state aid policy and the respective investigation on tax ruling practices. These tax reform initiatives on the OECD and European levels also need local country implementation, including in our home country of Switzerland, which may result in significant changes to established tax principles and could lead to an increased risk of international tax dis-putes.
Although we have taken steps to be in compliance with the evolving OECD and European tax initiatives, and will continue to do so, significant uncertainties remain as to the outcome of the Swiss and other countries’ tax reform efforts. Such efforts, including with respect to tax base or rate, transfer pricing, intercompany divi-dends, cross border transactions, controlled corpora-tions, and limitations on tax relief allowed on the interest on intercompany debt, could require us to adapt our tax structure, increase our effective tax rate and adversely affect our financial results.
IT security, data integrity & data privacyOur business is heavily dependent on critical, complex and interdependent information technology (IT) systems, including Internet-based systems, to support business processes.
The size and complexity of our IT systems, and – in some instances – their age, make them potentially vul-nerable to external and internal security breaches, break-downs, malicious intrusions, malware, misplaced and lost data, programming and human errors, and other similar events. Although we have devoted and continue to devote significant resources and management attention to the protection of our data and information technology, like many companies, we have experienced such events and expect to continue to experience them in the future. We believe that the data security breaches we have experi-enced to date have not resulted in significant disruptions to our operations, and will not have a significant adverse effect on our current or future results of operations. How-ever, we may not be able to prevent breakdowns or breaches in our systems that could have a material adverse effect on our business, financial condition, results of operation, or reputation.
In addition, our use of information technologies, including the Internet, social media, mobile technologies, and technology-based medical devices – as well as other routine business operations – sometimes involves gath-ering personal information (including sensitive personal information) regarding our patients, vendors, customers, employees, collaborators and others. Breaches of our systems or other failures to protect such information could expose the personal information of third parties to unauthorized persons. Such information breaches could result in significant potential liability and reputational harm.

Novartis Annual Report 2016 | 171FINANCIAL REPORTOperating and financial review 2016
Non-IFRS measures as defined by NovartisNovartis uses certain non-IFRS metrics when measur-ing performance, especially when measuring current year results against prior periods, including core results, constant currencies, free cash flow and net debt.
Despite the use of these measures by management in setting goals and measuring the Group’s performance, these are non-IFRS measures that have no standardized meaning prescribed by IFRS. As a result, such measures have limits in their usefulness to investors.
Because of their non-standardized definitions, the non-IFRS measures (unlike IFRS measures) may not be comparable to the calculation of similar measures of other companies. These non-IFRS measures are pre-sented solely to permit investors to more fully understand how the Group’s management assesses underlying per-formance. These non-IFRS measures are not, and should not be viewed as, a substitute for IFRS measures.
As an internal measure of Group performance, these non-IFRS measures have limitations, and the Group’s performance management process is not solely restricted to these metrics.
Core results
The Group’s core results – including core operating income, core net income and core earnings per share – exclude fully the amortization and impairment charges of intangible assets, excluding software, and certain acquisition related items. The following items that exceed a threshold of USD 25 million are also excluded: integra-tion and divestment related income and expenses, divestment gains and losses, restructuring charges/releases, legal related items, impairments of property, plant and equipment and financial assets, as well as income and expense items that management deems exceptional and that are or are expected to accumulate within the year to be over a USD 25 million threshold.
Novartis believes that investor understanding of the Group’s performance is enhanced by disclosing core measures of performance because, as they exclude items that can vary significantly from year to year, the core measures enable better comparison of business performance across years. For this same reason, Novartis uses these core measures in addition to IFRS and other measures as important factors in assessing the Group’s performance.
The following are examples of how these core mea-sures are utilized:— In addition to monthly reports containing financial
information prepared under IFRS, senior manage-ment receives a monthly analysis incorporating these core measures.
— Annual budgets are prepared for both IFRS and core measures.
A limitation of the core measures is that they provide a view of the Group’s operations without including all events during a period, such as the effects of an acqui-sition, divestments, or amortization/impairment of pur-chased intangible assets and restructurings.
Constant currencies
Changes in the relative values of non-US currencies to the US dollar can affect the Group’s financial results and financial position. To provide additional information that may be useful to investors, including changes in sales volume, we present information about our net sales and various values relating to operating and net income that are adjusted for such foreign currency effects.
Constant currency calculations have the goal of elim-inating two exchange rate effects so that an estimate can be made of underlying changes in the consolidated income statement excluding the impact of fluctuations in exchange rates:— The impact of translating the income statements of
consolidated entities from their non-USD functional currencies to USD
— The impact of exchange rate movements on the major transactions of consolidated entities performed in currencies other than their functional currency.
We calculate constant currency measures by translating the current year’s foreign currency values for sales and other income statement items into USD, using the aver-age exchange rates from the prior year and comparing them to the prior year values in USD.
We use these constant currency measures in evalu-ating the Group’s performance, as they may assist us in evaluating our ongoing performance from year to year. However, in performing our evaluation, we also consider equivalent measures of performance that are not affected by changes in the relative value of currencies.
Growth rate calculation
For ease of understanding, Novartis uses a sign conven-tion for its growth rates such that a reduction in operat-ing expenses or losses compared to the prior year is shown as a positive growth.

172 | Novartis Annual Report 2016
Free cash flow
Novartis defines free cash flow as cash flow from oper-ating activities and cash flow associated with the pur-chase or sale of property, plant and equipment, and intangible, other non-current and financial assets, excluding marketable securities. Cash flows in connec-tion with the acquisition or divestment of subsidiaries, associated companies and non-controlling interests in subsidiaries are not taken into account to determine free cash flow.
Free cash flow is presented as additional information because Novartis considers it to be a useful indicator of the Group’s ability to operate without reliance on addi-tional borrowing or use of existing cash. Free cash flow is a measure of the net cash generated that is available for debt repayment, investment in strategic opportuni-ties and for returning to shareholders. Free cash flow is not intended to be a substitute measure for cash flow from operating activities as determined under IFRS.
Net debt
Novartis defines net debt as current and non-current financial debt less cash and cash equivalents, current investments and derivative financial instruments. Net debt is presented as additional information because management believes it is a useful supplemental indica-tor of the Group’s ability to pay dividends, to meet finan-cial commitments and to invest in new strategic oppor-tunities, including strengthening its balance sheet.
Novartis Cash Value Added
The Novartis Cash Value Added (NCVA) is a metric that is based on what the company assesses to be its cash flow return less a capital charge on gross operating assets. NCVA is used as the primary internal financial measure for determining payouts under the new Long-Term Performance Plan (LTPP) introduced in 2014. More information on NCVA is presented as part of the Com-pensation Report on page 119.
Additional information
EBITDANovartis defines earnings before interest, tax, depreci-ation and amortization (EBITDA) as operating income from continuing operations excluding depreciation of property, plant and equipment (including any related impairment charges) and amortization of intangible assets (including any related impairment charges).
(USD millions) 2016 2015 Change
Operating income
from continuing operations 8 268 8 977 – 709
Depreciation of property,
plant & equipment 1 489 1 470 19
Amortization of intangible
assets 3 861 3 755 106
Impairments of property,
plant & equipment, and
intangible assets 693 246 447
EBITDA
from continuing operations 14 311 14 448 – 137
Enterprise valueEnterprise value represents the total amount that share-holders and debt holders have invested in Novartis, less the Group’s liquidity.
(USD millions
unless indicated otherwise) Dec 31, 2016 Dec 31, 2015 Change
Market capitalization 172 048 208 321 – 36 273
Non-controlling interests 59 76 – 17
Financial debts and
derivatives 23 802 21 931 1 871
Liquidity – 7 777 – 5 447 – 2 330
Enterprise value 188 132 224 881 – 36 749
Enterprise value/EBITDA 13 16

Novartis Annual Report 2016 | 173FINANCIAL REPORTOperating and financial review 2016
2016 and 2015 reconciliation from IFRS results to core results
Innovative Medicines1 Sandoz Alcon Corporate Total Group
2016 2015 2 2016 2015 2 2016 2015 2 2016 2015 2016 2015
(USD millions unless indicated otherwise) restated restated restated
IFRS operating income
from continuing operations 7 426 7 815 1 445 1 300 – 132 281 – 471 – 419 8 268 8 977
Amortization of intangible assets 2 440 2 367 460 447 901 895 3 801 3 709
Impairments
Intangible assets 522 138 65 27 4 1 591 166
Property, plant & equipment
related to the Group-wide
rationalization of manufacturing sites 1 6 – 7 83 – 6 89
Other property, plant & equipment 76 – 45 8 14 1 21 84 – 9
Financial assets 18 32 99 91 117 123
Total impairment charges 617 131 66 124 4 2 99 112 786 369
Acquisition or divestment related items
- Income – 68 – 22 – 1 – 229 – 260 – 297 – 283
- Expense 41 214 1 223 250 264 465
Total acquisition or divestment
related items, net – 27 192 0 – 6 – 10 – 33 182
Other items
Divestment gains – 608 – 626 – 6 – 48 – 54 – 662 – 680
Restructuring items
- Income – 41 – 30 – 23 – 4 – 4 – 5 – 5 – 73 – 39
- Expense 418 422 123 121 33 29 65 57 639 629
Legal-related items
- Income – 99 – 99
- Expense 205 578 40 4 – 30 205 592
Additional income – 61 – 119 – 2 – 13 – 5 – 22 – 68 – 96 – 194
Additional expense 84 132 6 15 61 33 100 65 251 245
Total other items – 102 357 100 174 77 57 90 – 35 165 553
Total adjustments 2 928 3 047 626 745 982 954 183 67 4 719 4 813
Core operating income
from continuing operations 10 354 10 862 2 071 2 045 850 1 235 – 288 – 352 12 987 13 790
As % of net sales 31.8 32.6 20.4 20.3 14.6 20.6 26.8 27.9
Income from associated companies 6 2 697 264 703 266
Core adjustments to income
from associated companies, net of tax 431 715 431 715
Interest expense – 707 – 655
Other financial income and expense 3 – 99 – 24
Taxes (adjusted for above items) – 2 001 – 2 051
Core net income
from continuing operations 11 314 12 041
Core net loss
from discontinued operations 4 – 256
Core net income 11 314 11 785
Core net income
attributable to shareholders 11 307 11 774
Core basic EPS from
continuing operations (USD) 5 4.75 5.01
Core basic EPS from
discontinued operations (USD) 5 – 0.11
Total core basic EPS (USD) 5 4.75 4.90
1 Formerly named the Pharmaceuticals Division2 Restated to reflect the new divisional structures and product transfers between divisions, announced on January 27, 2016.3 Adjusted for charges of USD 0.3 billion related mainly to Venezuela subsidiaries (2015: USD 0.4 billion)4 For details on 2015 discontinued operations reconciliation from IFRS to core net income, please refer to page 175.5 Earnings per share (EPS) is calculated on the amount of net income attributable to shareholders of Novartis AG.

174 | Novartis Annual Report 2016
2016 and 2015 reconciliation from Group IFRS results to Group core results
Acquisition or
divestment
related items,
including
Amortization restructuring
of intangible and integration Other
2016 (USD millions unless indicated otherwise) IFRS results assets 1 Impairments 2 charges 3 items 4 Core results
Gross profit from continuing operations 31 916 3 758 96 36 35 806
Operating income from continuing operations 8 268 3 801 786 – 33 165 12 987
Income before taxes from continuing operations 7 817 4 097 786 – 33 648 13 315
Taxes from continuing operations 5 – 1 119 – 2 001
Net income from continuing operations 6 698 11 314
Net income 6 698 11 314
Basic EPS from continuing operations (USD) 6 2.82 4.75
Total basic EPS (USD) 6 2.82 4.75
The following are adjustments to arrive at core gross profit from continuing operations
Other revenues 918 – 50 868
Cost of goods sold – 17 520 3 758 96 86 – 13 580
The following are adjustments to arrive at core operating income from continuing operations
Marketing & Sales – 11 998 7 – 11 991
Research & Development – 9 039 43 495 99 – 8 402
General & Administration – 2 194 74 – 2 120
Other income 1 927 – 10 – 297 – 867 753
Other expense – 2 344 205 264 816 – 1 059
The following are adjustments to arrive at core income before taxes from continuing operations
Income from associated companies 703 296 135 1 134
Other financial income and expense – 447 348 – 99
1 Amortization of intangible assets: Cost of goods sold includes recurring amortization of acquired rights to in-market products and other production-related intangible assets; Research & Development includes the recurring amortization of acquired rights for technology platforms; Income from associated companies includes USD 296 million for the Novartis share of the estimated Roche core items.
2 Impairments: Cost of goods sold and Research & Development include impairment charges related to intangible assets; Other income includes impairment reversals of property, plant and equipment; Other expense includes impairment charges related to property, plant and equipment, and financial assets.
3 Acquisition or divestment related items, including restructuring and integration charges: Other income and Other expense include transitional service-fee income and expenses, and other items related to the portfolio transformation; Other income also includes a gain from the revaluation of a previously held financial investment in a newly acquired company.
4 Other items: Other revenues include an early release of deferred income associated with a collaboration agreement; Cost of goods sold, Other income and Other expense include net restructuring and other charges related to the Group-wide rationalization of manufacturing sites; Research & Development, Marketing & Sales, Other income and Other expense include other restructuring income and charges; Cost of goods sold and Research & Development include adjustments of contingent considerations; General & Administration, Other income and Other expense include items related to setup costs for Novartis Business Services; Other income and Other expense also include legal settlements and changes in provisions; Other income also includes gains from product divestments, other income related to the portfolio transformation and a gain related to the sale of real estate; Other expense also includes a charge as a result of a pension plan amendment, a charge for an indirect tax settlement and other costs; Income from associated companies includes USD 135 million for the Novartis share of the estimated GSK Consumer Healthcare Holdings Ltd. core items; Other financial income and expense relates mainly to devaluation losses in Venezuela.
5 Taxes on the adjustments between IFRS and core results take into account, for each individual item included in the adjustment, the tax rate that will finally be applicable to the item based on the jurisdiction where the adjustment will finally have a tax impact. Generally, this results in amortization and impairment of intangible assets and acquisition-related restructuring and integration items having a full tax impact. There is usually a tax impact on other items, although this is not always the case for items arising from legal settlements in certain jurisdictions. Adjustments related to income from associated companies are recorded net of any related tax effect. Due to these factors and the differing effective tax rates in the various jurisdictions, the tax on the total adjustments for continuing operations of USD 5.5 billion to arrive at the core results before tax amounts to USD 882 million. The average tax rate on the adjustments for continuing operations is 16.0% since the estimated full-year tax charge has been applied to the pre-tax income of the period.
6 Earnings per share (EPS) is calculated on the amount of net income attributable to shareholders of Novartis AG.

Novartis Annual Report 2016 | 175FINANCIAL REPORTOperating and financial review 2016
Acquisition or
divestment
related items,
including
Amortization restructuring
of intangible and integration Other
2015 (USD millions unless indicated otherwise) IFRS results assets 1 Impairments 2 charges 3 items 4 Core results
Gross profit from continuing operations 32 983 3 666 126 125 36 900
Operating income from continuing operations 8 977 3 709 369 182 553 13 790
Income before taxes from continuing operations 8 134 4 132 369 182 1 275 14 092
Taxes from continuing operations 5 – 1 106 – 2 051
Net income from continuing operations 7 028 12 041
Income before taxes from discontinued operations 6 12 479 – 83 – 12 627 8 – 223
Taxes from discontinued operations – 1 713 – 33
Net income/loss from discontinued operations 10 766 – 256
Net income 17 794 11 785
Basic EPS from continuing operations (USD) 7 2.92 5.01
Basic EPS from discontinued operations (USD) 7 4.48 – 0.11
Total basic EPS (USD) 7 7.40 4.90
The following are adjustments to arrive at core gross profit from continuing operations
Other revenues 947 – 28 919
Cost of goods sold – 17 404 3 666 126 153 – 13 459
The following are adjustments to arrive at core operating income from continuing operations
Marketing & Sales – 11 772 43 – 11 729
Research & Development – 8 935 43 40 114 – 8 738
General & Administration – 2 475 86 – 2 389
Other income 2 049 – 56 – 283 – 887 823
Other expense – 2 873 259 465 1 072 – 1 077
The following are adjustments to arrive at core income before taxes from continuing operations
Income from associated companies 266 423 292 981
Other financial income and expense – 454 430 – 24
1 Amortization of intangible assets: Cost of goods sold includes recurring amortization of acquired rights to in-market products and other production-related intangible assets; Research & Development includes the recurring amortization of acquired rights for technology platforms; Income from associated companies includes USD 423 million for the Novartis share of the estimated Roche core items.
2 Impairments: Cost of goods sold, Research & Development and Other expense consist principally of net impairment charges or reversals related to intangible assets, property, plant and equipment, and financial assets; Other income includes a reversal of an impairment related to property, plant and equipment.
3 Acquisition or divestment related items, including restructuring and integration charges: Other income and Other expense include items related to the portfolio transformation.4 Other items: Other revenues and Other income include additional gains from product divestments; Cost of goods sold and Other expense include charges for the Group-wide
rationalization of manufacturing sites; Cost of goods sold also includes an inventory write-off; Marketing & Sales, Research & Development and Other expense include other restructuring charges; Research & Development also includes expenses related to product acquisitions; General & Administration includes charges for transforming IT and finance processes and expenses related to setup costs for Novartis Business Services; Other income also includes a gain of USD 110 million from a Swiss pension plan amendment and items related to portfolio transformation; Other expense also includes legal settlement provisions; Income from associated companies includes USD 292 million for the Novartis share of the estimated OTC joint venture core items; Other financial income and expense relates mainly to devaluation losses in Venezuela.
5 Taxes on the adjustments between IFRS and core results take into account, for each individual item included in the adjustment, the tax rate that will finally be applicable to the item based on the jurisdiction where the adjustment will finally have a tax impact. Generally, this results in amortization and impairment of intangible assets and acquisition-related restructuring and integration items having a full tax impact. There is usually a tax impact on other items, although this is not always the case for items arising from legal settlements in certain jurisdictions. Adjustments related to income from associated companies are recorded net of any related tax effect. Due to these factors and the differing effective tax rates in the various jurisdictions, the tax on the total adjustments for continuing operations of USD 6.0 billion to arrive at the core results before tax amounts to USD 945 million. The average tax rate on the adjustments for continuing operations is 15.9%.
6 Core adjustments on net income before tax of discontinued operations include gains from the divestment of Animal Health (USD 4.6 billion) and from the transactions with GSK (USD 2.8 billion for the non-influenza Vaccines business and USD 5.9 billion resulting from the contribution of the former Novartis OTC Division into the GSK Consumer Healthcare joint venture in exchange for 36.5% interest in this newly created entity), as well as additional transaction-related expenses of USD 0.6 billion and other portfolio transformation-related costs.
7 Earnings per share (EPS) is calculated on the amount of net income attributable to shareholders of Novartis AG.

176 | Novartis Annual Report 2016
Summary of quarterly and Group financial dataSummary of quarterly financial data for 2016 and 2015
(USD millions unless indicated otherwise) Q1 Q2 Q3 Q4 2016 Q1 Q2 Q3 Q4 2015
Net sales to third parties
from continuing operations 11 600 12 470 12 126 12 322 48 518 11 935 12 694 12 265 12 520 49 414
Sales to discontinued operations 26 26
Net sales from continuing operations 11 600 12 470 12 126 12 322 48 518 11 961 12 694 12 265 12 520 49 440
Other revenues 210 209 215 284 918 241 202 220 284 947
Cost of goods sold – 4 212 – 4 451 – 4 368 – 4 489 – 17 520 – 3 980 – 4 487 – 4 388 – 4 549 – 17 404
Gross profit 7 598 8 228 7 973 8 117 31 916 8 222 8 409 8 097 8 255 32 983
Marketing & Sales – 2 741 – 3 067 – 2 944 – 3 246 – 11 998 – 2 691 – 3 016 – 2 890 – 3 175 – 11 772
Research & Development – 2 041 – 2 190 – 2 224 – 2 584 – 9 039 – 2 067 – 2 206 – 2 190 – 2 472 – 8 935
General & Administration – 564 – 582 – 456 – 592 – 2 194 – 591 – 601 – 573 – 710 – 2 475
Other income 777 239 530 381 1 927 414 357 682 596 2 049
Other expense – 578 – 535 – 610 – 621 – 2 344 – 502 – 662 – 892 – 817 – 2 873
Operating income
from continuing operations 2 451 2 093 2 269 1 455 8 268 2 785 2 281 2 234 1 677 8 977
Income from associated companies 127 203 217 156 703 15 121 120 10 266
Interest expense – 185 – 180 – 174 – 168 – 707 – 179 – 164 – 154 – 158 – 655
Other financial income and expense – 41 – 3 – 38 – 365 – 447 57 – 82 – 31 – 398 – 454
Income before taxes
from continuing operations 2 352 2 113 2 274 1 078 7 817 2 678 2 156 2 169 1 131 8 134
Taxes – 341 – 307 – 329 – 142 – 1 119 – 372 – 300 – 357 – 77 – 1 106
Net income
from continuing operations 2 011 1 806 1 945 936 6 698 2 306 1 856 1 812 1 054 7 028
Net income/loss
from discontinued operations 10 699 – 18 83 2 10 766
Net income 2 011 1 806 1 945 936 6 698 13 005 1 838 1 895 1 056 17 794
Attributable to:
Shareholders of Novartis AG 2 011 1 804 1 940 957 6 712 13 005 1 836 1 888 1 054 17 783
Non-controlling interests 2 5 – 21 – 14 – 2 7 2 11
Basic earnings per share (USD)
from continuing operations 0.85 0.76 0.81 0.40 2.82 0.96 0.77 0.75 0.44 2.92
Basic earnings per share (USD)
from discontinued operations 4.44 – 0.01 0.04 0.00 4.48
Total basic earnings per share (USD) 0.85 0.76 0.81 0.40 2.82 5.40 0.76 0.79 0.44 7.40
Net sales to third parties by segment
Innovative Medicines1, 2 7 729 8 387 8 173 8 273 32 562 7 960 8 633 8 254 8 498 33 345
Sandoz2 2 445 2 577 2 517 2 605 10 144 2 444 2 530 2 542 2 554 10 070
Alcon2 1 426 1 506 1 436 1 444 5 812 1 531 1 531 1 469 1 468 5 999
Net sales to third parties
from continuing operations 11 600 12 470 12 126 12 322 48 518 11 935 12 694 12 265 12 520 49 414
Operating income by segment
Innovative Medicines1, 2 2 180 1 866 2 020 1 360 7 426 2 450 1 994 1 872 1 499 7 815
Sandoz2 346 380 354 365 1 445 340 281 388 291 1 300
Alcon2 31 7 – 50 – 120 – 132 141 54 57 29 281
Corporate – 106 – 160 – 55 – 150 – 471 – 146 – 48 – 83 – 142 – 419
Operating income
from continuing operations 2 451 2 093 2 269 1 455 8 268 2 785 2 281 2 234 1 677 8 977
Core operating income
from continuing operations 3 261 3 332 3 381 3 013 12 987 3 651 3 593 3 489 3 057 13 790
Core net income
from continuing operations 2 788 2 930 2 938 2 658 11 314 3 199 3 074 3 061 2 707 12 041
Core basic earnings per share (USD)
from continuing operations 1.17 1.23 1.23 1.12 4.75 1.33 1.27 1.27 1.14 5.01
1 Formerly named the Pharmaceuticals Division2 Restated to reflect the new divisional structures and product transfers between divisions, announced on January 27, 2016

Novartis Annual Report 2016 | 177FINANCIAL REPORTSummary of quarterly and Group financial data
Summary of Group financial data 2012–2016
(USD millions unless indicated otherwise) 2016 2015 2014 2013 2012
Net sales to third parties from continuing operations 48 518 49 414 52 180 51 869 51 080
Change relative to preceding year % – 1.8 – 5.3 0.6 1.5 – 1.7
Innovative Medicines net sales1, 2 32 562 33 345 34 828 34 953 34 466
Change relative to preceding year % – 2.3 – 4.3 – 0.4 1.4 – 0.5
Sandoz net sales2 10 144 10 070 10 736 10 528 10 408
Change relative to preceding year % 0.7 – 6.2 2.0 1.2 – 7.8
Alcon net sales2 5 812 5 999 6 616 6 388 6 206
Change relative to preceding year % – 3.1 – 9.3 3.6 2.9 3.3
Operating income from continuing operations 8 268 8 977 11 089 10 983 11 507
Change relative to preceding year % – 7.9 – 19.0 1.0 – 4.6 11.8
As % of net sales % 17.0 18.2 21.3 21.2 22.5
As % of average equity % 10.9 12.1 15.3 15.3 17.0
As % of average net operating assets % 9.0 10.5 13.8 13.4 14.2
Net income from continuing operations 6 698 7 028 10 727 9 309 9 530
Change relative to preceding year % – 4.7 – 34.5 15.2 – 2.3 9.7
As % of net sales % 13.8 14.2 20.6 17.9 18.7
As % of average equity % 8.8 9.5 14.8 13.0 14.1
Net income/loss from discontinued operations 10 766 – 447 – 17 – 147
Net income 6 698 17 794 10 280 9 292 9 383
As % of average equity % 8.8 24.1 14.1 12.9 13.9
Dividends of Novartis AG3 6 445 6 475 6 643 6 810 6 100
As % of net income from continuing operations4 % 96 92 62 74 65
As % of net income4 % 96 36 65 74 66
Cash flows from operating activities from continuing operations 11 475 12 085 13 898 12 617 13 810
Change relative to preceding year % – 5.0 – 13.0 10.2 – 8.6 1.4
As % of net sales % 23.7 24.5 26.6 24.3 27.0
Cash flows from operating activities 11 475 11 879 13 897 13 174 14 194
Free cash flow from continuing operations 9 455 9 259 10 934 9 521 11 251
Change relative to preceding year % 2.1 – 15.3 14.8 – 15.4 – 6.3
As % of net sales % 19.5 18.7 21.0 18.4 22.0
Free cash flow 9 455 9 029 10 762 9 945 11 383
Purchase of property, plant & equipment5 1 862 2 367 2 624 2 903 2 458
Change relative to preceding year % – 21.3 – 9.8 – 9.6 18.1 28.5
As % of net sales % 3.8 4.8 5.0 5.6 4.8
Depreciation of property, plant & equipment5 1 489 1 470 1 586 1 554 1 517
As % of net sales % 3.1 3.0 3.0 3.0 3.0
Core Research & Development5 8 402 8 738 8 723 8 885 8 396
As % of net sales % 17.3 17.7 16.7 17.1 16.4
Core Innovative Medicines Division Research & Development1, 2 7 112 7 502 7 432 7 611 7 156
As % of Innovative Medicines Division net sales % 21.8 22.5 21.3 21.8 20.8
Total assets 130 124 131 556 125 387 126 254 124 191
Liquidity 7 777 5 447 13 862 9 222 8 119
Equity 74 891 77 122 70 844 74 472 69 263
Debt/equity ratio 0.32:1 0.28:1 0.29:1 0.24:1 0.28:1
Current ratio 1.12:1 0.96:1 1.39:1 1.16:1 1.16:1
Net operating assets 90 916 93 606 77 393 83 268 80 870
Change relative to preceding year % – 2.9 20.9 – 7.1 3.0 – 0.3
As % of net sales % 187.4 189.4 148.3 160.5 158.3
Personnel costs5, 6 13 681 13 540 14 569 13 760 13 127
As % of net sales % 28.2 27.4 27.9 26.5 25.7
Full-time equivalent associates at year-end5, 6 118 393 118 700 117 809 119 362 112 461
Net sales per full-time equivalent associate (average)3 USD 409 274 417 861 440 020 447 488 460 867 1 Formerly named the Pharmaceuticals Division 2 Restated to reflect the new divisional structures and product transfers between divisions, announced on January 27, 2016 3 2016 dividend proposal for shareholder approval at the Annual General Meeting on February 28, 2017.
In all years, this figure reflects only amounts paid to third-party shareholders of Novartis AG.4 Based on net income attributable to the shareholders of Novartis AG5 Continuing operations6 Own employeesnm = not meaningful

178 | Novartis Annual Report 2016
Novartis Group consolidated financial statementsConsolidated income statements(For the years ended December 31, 2016, 2015 and 2014)
(USD millions unless indicated otherwise) Note 2016 2015 2014
Net sales to third parties from continuing operations 3 48 518 49 414 52 180
Sales to discontinued segments 26 239
Net sales from continuing operations 3 48 518 49 440 52 419
Other revenues 918 947 1 215
Cost of goods sold – 17 520 – 17 404 – 17 345
Gross profit from continuing operations 31 916 32 983 36 289
Marketing & Sales – 11 998 – 11 772 – 12 377
Research & Development – 9 039 – 8 935 – 9 086
General & Administration – 2 194 – 2 475 – 2 616
Other income 1 927 2 049 1 391
Other expense – 2 344 – 2 873 – 2 512
Operating income from continuing operations 3 8 268 8 977 11 089
Income from associated companies 4 703 266 1 918
Interest expense 5 – 707 – 655 – 704
Other financial income and expense 5 – 447 – 454 – 31
Income before taxes from continuing operations 7 817 8 134 12 272
Taxes 6 – 1 119 – 1 106 – 1 545
Net income from continuing operations 6 698 7 028 10 727
Net income/loss from discontinued operations 30 10 766 – 447
Net income 6 698 17 794 10 280
Attributable to:
Shareholders of Novartis AG 6 712 17 783 10 210
Non-controlling interests – 14 11 70
Basic earnings per share (USD) from continuing operations 2.82 2.92 4.39
Basic earnings per share (USD) from discontinued operations 4.48 – 0.18
Total basic earnings per share (USD) 7 2.82 7.40 4.21
Diluted earnings per share (USD) from continuing operations 2.80 2.88 4.31
Diluted earnings per share (USD) from discontinued operations 4.41 – 0.18
Total diluted earnings per share (USD) 7 2.80 7.29 4.13
The accompanying Notes form an integral part of the consolidated financial statements.

Novartis Annual Report 2016 | 179FINaNcIal RepORTNovartis Group consolidated financial statements
Consolidated statements of comprehensive income(For the years ended December 31, 2016, 2015 and 2014)
(USD millions) Note 2016 2015 2014
Net income 6 698 17 794 10 280
Other comprehensive income to be eventually recycled into the consolidated income statement:
Fair value adjustments on marketable securities, net of taxes 8.1 – 113 28 89
Fair value adjustments on deferred cash flow hedges, net of taxes 8.1 15 20 21
Total fair value adjustments on financial instruments, net of taxes 8.1 – 98 48 110
Novartis share of other comprehensive income
recognized by associated companies, net of taxes 671 – 48 – 5
Currency translation effects 8.2 – 2 391 – 1 662 – 2 220
Total of items to eventually recycle – 1 818 – 1 662 – 2 115
Other comprehensive income never to be recycled into the consolidated income statement:
Actuarial losses from defined benefit plans, net of taxes 8.3 – 515 – 147 – 822
Total comprehensive income 4 365 15 985 7 343
Attributable to:
Shareholders of Novartis AG 4 382 15 977 7 274
Continuing operations 4 382 5 238 7 820
Discontinued operations 10 739 – 546
Non-controlling interests – 17 8 69
The accompanying Notes form an integral part of the consolidated financial statements.

180 | Novartis Annual Report 2016
Consolidated statements of changes in equity(For the years ended December 31, 2016, 2015 and 2014)
Issued share
capital and
reserves
attributable Non-
Share Treasury Retained Total value to Novartis controlling Total
(USD millions) Note capital shares earnings adjustments shareholders interests equity
Total equity at January 1, 2014 1 001 – 89 73 065 366 74 343 129 74 472
Net income 10 210 10 210 70 10 280
Other comprehensive income 8 – 5 – 2 931 – 2 936 – 1 – 2 937
Total comprehensive income 10 205 – 2 931 7 274 69 7 343
Dividends 9.1 – 6 810 – 6 810 – 6 810
Purchase of treasury shares 9.2 – 43 – 6 883 – 6 926 – 6 926
Exercise of options and employee transactions 9.4 23 2 377 2 400 2 400
Equity-based compensation 9.5 6 1 137 1 143 1 143
Increase of treasury share repurchase
obligation under a share buyback trading plan 9.7 – 658 – 658 – 658
Changes in non-controlling interests 9.8 – 120 – 120
Total of other equity movements – 14 – 10 837 – 10 851 – 120 – 10 971
Total equity at December 31, 2014 1 001 – 103 72 433 – 2 565 70 766 78 70 844
Net income 17 783 17 783 11 17 794
Other comprehensive income 8 – 48 – 1 758 – 1 806 – 3 – 1 809
Total comprehensive income 17 735 – 1 758 15 977 8 15 985
Dividends 9.1 – 6 643 – 6 643 – 6 643
Purchase of treasury shares 9.2 – 33 – 6 086 – 6 119 – 6 119
Reduction of share capital 9.3 – 10 15 – 5
Exercise of options and employee transactions 9.4 14 1 578 1 592 1 592
Equity-based compensation 9.5 6 809 815 815
Decrease of treasury share repurchase
obligation under a share buyback trading plan 9.7 658 658 658
Changes in non-controlling interests 9.8 – 10 – 10
Fair value adjustments related to divestments 8 – 100 100
Total of other equity movements – 10 2 – 9 789 100 – 9 697 – 10 – 9 707
Total equity at December 31, 2015 991 – 101 80 379 – 4 223 77 046 76 77 122
Net income 6 712 6 712 – 14 6 698
Other comprehensive income 8 671 – 3 001 – 2 330 – 3 – 2 333
Total comprehensive income 7 383 – 3 001 4 382 – 17 4 365
Dividends 9.1 – 6 475 – 6 475 – 6 475
Purchase of treasury shares 9.2 – 7 – 985 – 992 – 992
Reduction of share capital 9.3 – 19 25 – 6
Exercise of options and employee transactions 9.4 2 212 214 214
Equity-based compensation 9.5 5 659 664 664
Impact of change in ownership of consolidated entities 9.6 – 7 – 7 – 7
Fair value adjustments related to divestments 8 – 12 12
Total of other equity movements – 19 25 – 6 614 12 – 6 596 – 6 596
Total equity at December 31, 2016 972 – 76 81 148 – 7 212 74 832 59 74 891
The accompanying Notes form an integral part of the consolidated financial statements.

Novartis Annual Report 2016 | 181FINaNcIal RepORTNovartis Group consolidated financial statements
Consolidated balance sheets(At December 31, 2016 and 2015)
(USD millions) Note 2016 2015
assets
Non-current assets
Property, plant & equipment 10 15 641 15 982
Goodwill 11 30 980 31 174
Intangible assets other than goodwill 11 31 340 34 217
Investments in associated companies 4 14 304 15 314
Deferred tax assets 12 10 034 8 957
Financial assets 13 2 196 2 466
Other non-current assets 13 698 601
Total non-current assets 105 193 108 711
current assets
Inventories 14 6 255 6 226
Trade receivables 15 8 202 8 180
Marketable securities, commodities, time deposits and derivative financial instruments 16 770 773
Cash and cash equivalents 16 7 007 4 674
Other current assets 17 2 697 2 992
Total current assets 24 931 22 845
Total assets 130 124 131 556
equity and liabilities
equity
Share capital 18 972 991
Treasury shares 18 – 76 – 101
Reserves 73 936 76 156
Issued share capital and reserves attributable to Novartis aG shareholders 74 832 77 046
Non-controlling interests 59 76
Total equity 74 891 77 122
liabilities
Non-current liabilities
Financial debts 19 17 897 16 327
Deferred tax liabilities 12 6 657 6 355
Provisions and other non-current liabilities 20 8 470 8 044
Total non-current liabilities 33 024 30 726
current liabilities
Trade payables 4 873 5 668
Financial debts and derivative financial instruments 21 5 905 5 604
Current income tax liabilities 1 603 1 717
Provisions and other current liabilities 22 9 828 10 719
Total current liabilities 22 209 23 708
Total liabilities 55 233 54 434
Total equity and liabilities 130 124 131 556
The accompanying Notes form an integral part of the consolidated financial statements.

182 | Novartis Annual Report 2016
Consolidated cash flow statements(For the years ended December 31, 2016, 2015 and 2014)
(USD millions) Note 2016 2015 2014
Net income from continuing operations 6 698 7 028 10 727
Reversal of non-cash items 23.1 8 437 9 070 6 725
Dividends received from associated companies and others 899 432 479
Interest received 43 34 35
Interest paid – 723 – 646 – 668
Other financial receipts 714 553
Other financial payments – 155 – 23 – 24
Taxes paid 1 – 2 111 – 2 454 – 2 179
cash flows before working capital and provision changes from continuing operations 13 088 14 155 15 648
Payments out of provisions and other net cash movements in non-current liabilities – 1 536 – 1 207 – 1 125
Change in net current assets and other operating cash flow items 23.2 – 77 – 863 – 625
cash flows from operating activities from continuing operations 11 475 12 085 13 898
Cash flows used in operating activities from discontinued operations 1 – 188 – 1
Total cash flows from operating activities 11 475 11 897 13 897
Purchase of property, plant & equipment – 1 862 – 2 367 – 2 624
Proceeds from sales of property, plant & equipment 161 237 60
Purchase of intangible assets – 1 017 – 1 138 – 780
Proceeds from sales of intangible assets 847 621 246
Purchase of financial assets – 247 – 264 – 239
Proceeds from sales of financial assets 247 166 431
Purchase of other non-current assets – 149 – 82 – 60
Proceeds from sales of other non-current assets 1 2
Divestments of interests in associated companies 1 370
Acquisitions and divestments of businesses, net 23.3 – 765 – 16 507 – 331
Purchase of marketable securities and commodities – 530 – 595 – 169
Proceeds from sales of marketable securities and commodities 622 262 2 086
cash flows used in investing activities from continuing operations – 2 693 – 19 666 – 8
Cash flows used in/from investing activities from discontinued operations 1 23.4 – 748 8 882 889
Total cash flows used in/from investing activities – 3 441 – 10 784 881
Dividends paid to shareholders of Novartis AG – 6 475 – 6 643 – 6 810
Acquisition of treasury shares – 1 109 – 6 071 – 6 915
Proceeds from exercise options and other treasury share transactions 214 1 581 2 400
Increase in non-current financial debts 1 935 4 596 6 024
Repayment of non-current financial debts – 1 696 – 3 086 – 2 599
Change in current financial debts 1 816 451 – 107
Impact of change in ownership of consolidated entities – 6
Dividends paid to non-controlling interests and other financing cash flows 7 – 4 – 140
cash flows used in financing activities – 5 314 – 9 176 – 8 147
Effect of exchange rate changes on cash and cash equivalents – 387 – 286 – 295
Net change in cash and cash equivalents 2 333 – 8 349 6 336
Cash and cash equivalents at January 1 4 674 13 023 6 687
cash and cash equivalents at December 31 7 007 4 674 13 023
The accompanying Notes form an integral part of the consolidated financial statements.
1 In 2016, the total net tax payment amounted to USD 2 299 million, of which USD 188 million was included in the cash flows used in investing activities from discontinued operations. In 2015, the total net tax payment amounted to USD 3 325 million, of which a refund of USD 94 million was included in the cash flows used in operating activities from discontinued operations, and a USD 965 million payment in the cash flows from investing activities of discontinued operations. In 2014, the total net tax payment amounted to USD 2 645 million, of which USD 7 million was included in the cash flows used in operating activities from discontinued operations, and a USD 459 million payment in the cash flows from investing activities from discontinued operations.

Novartis Annual Report 2016 | 183FINaNcIal RepORTNotes to the Novartis Group consolidated financial statements
Notes to the Novartis Group consolidated financial statements1. Significant accounting policiesThe Novartis Group (Novartis or Group) is a multinational group of companies specializing in the research, devel-opment, manufacturing and marketing of a broad range of healthcare products led by innovative pharmaceuti-cals and also including eye care products and cost sav-ing generic pharmaceuticals. It is head quartered in Basel, Switzerland.
The consolidated financial statements of the Group are prepared in accordance with International Financial Reporting Standards (IFRS) as issued by the Interna-tional Accounting Standards Board (IASB). They are pre-pared in accordance with the historical cost convention except for items that are required to be accounted for at fair value.
The Group’s financial year-end is December 31 which is also the annual closing date of the individual entities’ financial statements incorporated into the Group’s con-solidated financial statements.
The preparation of financial statements requires management to make certain estimates and assump-tions, either at the balance sheet date or during the year that affect the reported amounts of assets and liabilities, including any contingent amounts, as well as of revenues and expenses. Actual outcomes and results could differ from those estimates and assumptions.
Listed below are accounting policies of significance to Novartis or, in cases where IFRS provides alternatives, the option adopted by Novartis.
Scope of consolidation
The consolidated financial statements include all enti-ties, including structured entities, over which Novartis AG, Basel, Switzerland, directly or indirectly has control (generally as a result of owning more than 50% of the entity’s voting interest). Consolidated entities are also referred to as “subsidiaries”.
In cases where Novartis does not fully own a subsid-iary it has elected to value any remaining outstanding non-controlling interest at the time of acquiring control of the subsidiary at its proportionate share of the fair value of the net identified assets.
The contribution of a business to an associate or joint venture is accounted for by applying the option under IFRS that permits the accounting for the retained inter-est of the business contributed at its net book value at the time of the contribution.
Investments in associated companies (generally defined as investments in entities in which Novartis holds between 20% and 50% of voting shares or over which it
otherwise has significant influence) and joint ventures are accounted for using the equity method except for selected venture fund investments for which the Group has elected to apply the method of fair value through the consolidated income statement.
Foreign currencies
The consolidated financial statements of Novartis are presented in US dollars (USD). The functional currency of subsidiaries is generally the local currency of the respective entity. The functional currency used for the reporting of certain Swiss and foreign finance entities is USD instead of their respective local currencies. This reflects the fact that the cash flows and transactions of these entities are primarily denominated in these curren-cies.
For subsidiaries not operating in hyperinflationary economies, the subsidiary’s results, financial position and cash flows that do not have USD as their functional currency are translated into USD using the following exchange rates:— income, expense and cash flows using for each month
the average exchange rate with the US dollar values for each month being aggregated during the year.
— balance sheets using year-end exchange rates.— resulting exchange rate differences are recognized
in other comprehensive income.
The only hyperinflationary economy applicable to Novartis is Venezuela. The financial statements of the major subsidiaries in this country are first adjusted for the effect of inflation with any gain or loss on the net monetary position recorded in the related functional lines in the consolidated income statement and then trans-lated into USD.
Acquisition of assets
Acquired assets are initially recognized on the balance sheet at cost if they meet the criteria for capitalization. If acquired as part of a business combination, the fair value of identified assets represents the cost for these assets. If separately acquired, the cost of the asset includes the purchase price and any directly attributable costs for bringing the asset into the condition to operate as intended. Expected costs for obligations to disman-tle and remove property, plant and equipment when it is no longer used are included in their cost.

184 | Novartis Annual Report 2016
Property, plant and equipment
Property, plant and equipment are depreciated on a straight-line basis in the consolidated income statement over their estimated useful lives. Leasehold land is depre-ciated over the period of its lease whereas freehold land is not depreciated. The related depreciation expense is included in the costs of the functions using the asset.
Property, plant and equipment are assessed for impairment whenever there is an indication that the bal-ance sheet carrying amount may not be recoverable using cash flow projections for the useful life.
The following table shows the respective useful lives for property, plant and equipment:
Useful life
Buildings 20 to 40 years
Machinery and other equipment
Machinery and equipment 7 to 20 years
Furniture and vehicles 5 to 10 years
Computer hardware 3 to 7 years
Government grants obtained for construction activities, including any related equipment, are deducted from the gross acquisition cost to arrive at the balance sheet car-rying value of the related assets.
Goodwill and intangible assets
GoodwillGoodwill arises in a business combination and is the excess of the consideration transferred to acquire a busi-ness over the underlying fair value of the net identified assets acquired. It is allocated to groups of cash gener-ating units (CGUs) which are usually represented by the reported segments. Goodwill is tested for impairment annually at the CGU level and any impairment charges are recorded under “Other Expense” in the consolidated income statement.
Intangible assets available-for-useNovartis has the following classes of available-for-use intangible assets: Currently marketed products; Market-ing know-how; Technologies; Other intangible assets (including computer software) and the Alcon brand name.
Currently marketed products represent the compos-ite value of acquired intellectual property, patents, and distribution rights and product trade names.
Marketing know-how represents the value attribut-able to the expertise acquired for marketing and distrib-uting Alcon surgical equipment.
Technologies represent identified and separable acquired know-how used in the research, development and production processes.
Significant investments in internally developed and acquired computer software are capitalized and included in the “Other” category and amortized once available for use.
The Alcon brand name is shown separately as it is the only Novartis intangible asset that is available for use with an indefinite useful life. Novartis considers that it is appropriate that the Alcon brand name has an indefinite life since Alcon-branded products have a history of strong revenue and cash flow performance, and Novartis has the intent and ability to support the brand with spend-ing to maintain its value for the foreseeable future.
Except for the Alcon brand name, intangible assets available for use are amortized over their estimated use-ful lives on a straight-line basis and evaluated for poten-tial impairment whenever facts and circumstances indi-cate that their carrying value may not be recoverable. The Alcon brand name is not amortized, but evaluated for potential impairment annually.
The following table shows the respective useful lives for available-for-use intangible assets and the location in the consolidated income statement in which the respective amortization and any potential impairment charge is recognized:
Income statement location
for amortization and
Useful life impairment charges
Currently marketed products 5 to 20 years “Cost of goods sold”
Marketing know-how 25 years “Cost of goods sold”
Technologies 10 to 20 years “Cost of goods sold”
or “Research
and Development”
Other (including 3 to 7 years In the respective
computer software) functional expense
Alcon brand name Not amortized, Not applicable
indefinite useful life
Intangible assets not yet available-for-useAcquired research and development intangible assets, which are still under development and have accordingly not yet obtained marketing approval, are recognized as In-Process Research & Development (IPR&D).
IPR&D is not amortized, but evaluated for potential impairment on an annual basis or when facts and circum-stances warrant. Any impairment charge is recorded in the consolidated income statement under “Research & Development”. Once a project included in IPR&D has been successfully developed it is transferred to the “Cur-rently marketed product” category.

Novartis Annual Report 2016 | 185FINaNcIal RepORTNotes to the Novartis Group consolidated financial statements
Impairment of goodwill and intangible assets
An asset is considered impaired when its balance sheet carrying amount exceeds its estimated recoverable amount, which is defined as the higher of its fair value less costs of disposal and its value in use. Usually, Novartis applies the fair value less costs of disposal method for its impairment assessment. In most cases no directly observable market inputs are available to mea-sure the fair value less costs of disposal. Therefore, an estimate is derived indirectly and is based on net pres-ent value techniques utilizing post-tax cash flows and discount rates. In the limited cases where the value in use method would be applied, net present value tech-niques would be applied using pre-tax cash flows and discount rates.
Fair value less costs of disposal reflects estimates of assumptions that market participants would be expected to use when pricing the asset or CGUs, and for this pur-pose management considers the range of economic conditions that are expected to exist over the remaining useful life of the asset.
The estimates used in calculating the net present val-ues are highly sensitive and depend on assumptions spe-cific to the nature of the Group’s activities with regard to:— amount and timing of projected future cash flows;— outcome of R&D activities (compound efficacy, results
of clinical trials, etc.);— amount and timing of projected costs to develop
IPR&D into commercially viable products;— probability of obtaining regulatory approval;— long-term sales forecasts for periods of up to 20 years;— sales erosion rates after the end of patent or other
intellectual property rights protection and timing of the entry of generic competition;
— selected tax rate;— behavior of competitors (launch of competing prod-
ucts, marketing initiatives, etc.); and— selected discount rate.
Generally, for intangible assets with a definite useful life Novartis uses cash flow projections for the whole useful life of these assets. For goodwill and the Alcon brand name, Novartis generally utilizes cash flow projections for a five-year period based on management forecasts, with a terminal value based on cash flow projections usu-ally in line with inflation rates for later periods. Probabil-ity-weighted scenarios are typically used.
Discount rates used consider the Group’s estimated weighted average cost of capital adjusted for specific country and currency risks associated with cash flow projections to approximate the weighted average cost of capital of a comparable market participant.
Due to the above factors, actual cash flows and val-ues could vary significantly from forecasted future cash flows and related values derived using discounting tech-niques.
Impairment of associated companies accounted for at equity
Novartis considers investments in associated compa-nies for impairment evaluation whenever objective evi-dence indicates the net investment may be impaired, including when a quoted share price indicates a fair value less than the per-share balance sheet carrying value for the investment.
If the recoverable amount of the investment is esti-mated to be lower than the balance sheet carrying amount an impairment charge is recognized for the dif-ference in the consolidated income statement under “Income from associated companies”.
Cash and cash equivalents, marketable securities, commodities, derivative financial instruments and non-current financial assets
Cash and cash equivalents include highly liquid invest-ments with original maturities of three months or less which are readily convertible to known amounts of cash. Bank overdrafts are usually presented within current financial debts on the consolidated balance sheet except in cases where a right of offset has been agreed with a bank which then allows for presentation on a net basis.
Marketable securities are financial assets consisting principally of equity and debt securities as well as fund investments. Marketable securities held for short-term non-strategic purposes are principally traded in liquid markets and are classified as marketable securities on the consolidated balance sheet. Marketable securities held for long-term strategic purposes are classified as non-current financial assets on the consolidated balance sheet.
Marketable securities are initially recorded at fair value on their trade date which is different from the set-tlement date when the transaction is ultimately effected. Quoted securities are re-measured at each reporting date to fair value based on current market prices. If the market for a financial asset is not active or no market is available, fair values are established using valuation tech-niques. Apart from discounted cash flow analysis and other pricing models, for the majority of investments in what is known as the “Level 3” hierarchy, the valuation is based on the acquisition cost as the best approxima-tion of the fair value of the investee. This is adjusted for a higher or lower valuation in connection with a partial disposal, a new round of financing and for the investee’s performance below or above expectations. The fair value of investments in “Level 3” is reviewed regularly for a possible diminution in value.
The Group has classified all its equity and quoted debt securities as well as fund investments as available-for-sale, as they are not acquired to generate profit from short-term fluctuations in price. Unrealized gains, except exchange gains related to quoted debt instruments, are recorded as a fair value adjustment in the consolidated statement of comprehensive income. They are recog-nized in the consolidated income statement when the

186 | Novartis Annual Report 2016
financial asset is sold, at which time the gain is trans-ferred either to “Other financial income and expense”, for the marketable securities held for short-term non-stra-tegic purposes, or to “Other income”, for all other equity securities and fund investments. Exchange gains related to quoted debt instruments are immediately recognized in the consolidated income statement under “Other financial income and expense”.
A security is assessed for impairment when its mar-ket value at the balance sheet date is less than initial cost reduced by any previously recognized impairment. Impairments on equity securities, quoted debt securities and fund investments, and exchange rate losses on quoted debt securities in a foreign currency which are held for short-term non-strategic purposes are recorded in “Other financial income and expense”. Impairments are recorded for all other equity securities and other fund investments in “Other expense” in the consolidated income statement.
Commodities include gold bullion or coins which are valued at the lower of cost or fair value using current market prices. The changes in fair value below cost are immediately recorded in “Other financial income and expense”.
Other non-current financial assets including loans are carried at amortized cost, which reflects the time value of money, less any allowances for uncollectable amounts. Impairments and exchange rate gains and losses on other non-current financial assets, including loans, as well as interest income using the effective inter-est rate method, are immediately recorded in “Other income” or “Other expense” in the consolidated income statement.
Derivative financial instruments are initially recog-nized in the balance sheet at fair value and are re-mea-sured to their current fair value at the end of each sub-sequent reporting period. The valuation of a forward exchange rate contract is based on the discounted cash flow model, using interest curves and spot rates at the reporting date as observable inputs.
Options are valued based on a modified Black-Scholes model using volatility and exercise prices as major observable inputs.
The Group utilizes derivative financial instruments for the purpose of hedging to reduce the volatility in the Group’s performance due to the exposure to various types of business risks. The Group, therefore, enters into certain derivative financial instruments which provide effective economic hedges. The risk reduction is obtained because the derivative’s value or cash flows are expected, wholly or partly, to move inversely to the hedged item and, therefore, offset changes in the value or cash flows of the hedged item. The overall hedging strategy is aim-ing to mitigate the currency and interest exposure risk of positions which are contractually agreed and to par-tially hedge the exposure risk of selected anticipated
transactions. However, the Group generally does not hedge the translation risk related to its foreign invest-ments.
Not all of the financial impact of derivative financial instruments can be matched with the financial impact of the economically hedged item. A prerequisite for obtain-ing this accounting-hedge relationship is extensive doc-umentation on inception and proving on a regular basis that the economic hedge is effective for accounting pur-poses. Changes in the fair value of any derivative instru-ments that do not qualify for cash flow hedge account-ing are recognized immediately in “Other financial income and expense” in the consolidated income statement.
Inventories
Inventory is valued at acquisition or production cost determined on a first-in first-out basis. This value is used for the “Cost of goods sold” in the consolidated income statement. Unsalable inventory is fully written off in the consolidated income statement under “Cost of goods sold”.
Trade receivables
Trade receivables are initially recognized at their invoiced amounts including any related sales taxes less adjust-ments for estimated revenue deductions such as rebates, chargebacks and cash discounts.
Provisions for doubtful trade receivables are estab-lished once there is an indication that it is likely that a loss will be incurred. These provisions represent the dif-ference between the trade receivable’s carrying amount in the consolidated balance sheet and the estimated net collectible amount. Significant financial difficulties of a customer, such as probability of bankruptcy, financial reorganization, default or delinquency in payments are considered indicators that recovery of the trade receiv-able is doubtful. Charges for doubtful trade receivables are recognized in the consolidated income statement within “Marketing & Sales” expenses.
Legal and environmental liabilities
Novartis and its subsidiaries are subject to contingen-cies arising in the ordinary course of business such as patent litigation, environmental remediation liabilities and other product-related litigation, commercial litigation, and governmental investigations and proceedings. Pro-visions are recorded where a reliable estimate can be made of the probable outcome of legal or other disputes against the subsidiary.

Novartis Annual Report 2016 | 187FINaNcIal RepORTNotes to the Novartis Group consolidated financial statements
Contingent consideration
In a business combination or divestment of a business, it is necessary to recognize contingent future payments to previous or from new owners representing contrac-tually defined potential amounts as a liability or asset. Usually for Novartis, these are linked to milestone or roy-alty payments related to certain assets and are recog-nized as a financial liability or asset at their fair value which is then re-measured at each subsequent report-ing date. These estimations typically depend on factors such as technical milestones or market performance and are adjusted for the probability of their likelihood of payment and if material, appropriately discounted to reflect the impact of time.
Changes in the fair value of contingent consideration liabilities in subsequent periods are recognized in the consolidated income statement in “Cost of goods sold” for currently marketed products and in “Research & Development” for IPR&D. Changes in contingent consid-eration assets are recognized in “Other revenue”, “Other income” or “Other expense”, depending on its nature. The effect of unwinding the discount over time is recog-nized in “Interest expense” in the consolidated income statement.
Novartis does not recognize contingent consider-ation associated with asset purchases outside of a busi-ness combination that are conditional upon future events which are within its control until such time as there is an unconditional obligation. If the contingent consideration is outside the control of Novartis, a liability is recognized once it becomes probable that the contingent consider-ation will become due. In both cases, if appropriate, a corresponding asset is recorded.
Defined benefit pension plans and other post-employment benefits
The liability in respect of defined benefit pension plans and other post-employment benefits is the defined ben-efit obligation calculated annually by independent actu-aries using the projected unit credit method. The current service cost for such post- employment benefit plans is included in the personnel expenses of the various func-tions where the associates are employed, while the net interest on the net defined benefit liability or asset is recognized as “Other expense” or “Other income”.
Treasury shares
Treasury shares are initially recorded at fair value on their trade date which is different from the settlement date when the transaction is ultimately effected. Treasury shares are deducted from consolidated equity at their nominal value of CHF 0.50 per share. Differences between the nominal amount and the transaction price on purchases or sales of treasury shares with third par-ties, or the value of services received for the shares allo-
cated to associates as part of share-based compensa-tion arrangements, are recorded in “Retained earnings” in the consolidated statement of changes in equity.
Revenue recognition
RevenueRevenue is recognized on the sale of Novartis Group products and services and recorded as “Net sales” in the consolidated income statement when there is per-suasive evidence that a sales arrangement exists, title and risks and rewards for the products are transferred to the customer, the price is determinable and collect-ability is reasonably assured. When contracts contain customer acceptance provisions, sales are recognized upon the satisfaction of acceptance criteria. If products are stockpiled at the request of the customer, revenue is only recognized once the products have been inspected and accepted by the customer and there is no right of return or replenishment on product expiry.
Surgical equipment may be sold together with other products and services under a single contract. The total consideration is allocated to the separate elements based on their relative fair values. Revenue is recognized once the recognition criteria have been met for each ele-ment of the contract.
For surgical equipment, in addition to cash and instal-ment sales, revenue is recognized under finance and operating lease arrangements. Arrangements in which Novartis transfers substantially all the risks and rewards incidental to ownership to the customer are treated as finance lease arrangements. Revenue from finance lease arrangements is recognized at amounts equal to the fair values of the equipment, which approximate the present values of the minimum lease payments under the arrange-ments. As interest rates embedded in lease arrange-ments are approximately market rates, revenue under finance lease arrangements is comparable to revenue for outright sales. Finance income for arrangements in excess of twelve months is deferred and subsequently recognized based on a pattern that approximates the use of the effective interest method and recorded in “Other income”. Operating lease revenue for equipment rentals is recognized on a straight-line basis over the lease term.
Provisions for rebates and discounts granted to gov-ernment agencies, wholesalers, retail pharmacies, man-aged healthcare organizations and other customers are recorded as a deduction from revenue at the time the related revenues are recorded or when the incentives are offered. They are calculated on the basis of histori-cal experience and the specific terms in the individual agreements. Provisions for refunds granted to health-care providers under innovative pay-for-performance agreements are recorded as a revenue deduction at the time the related sales are recorded. They are calculated on the basis of historical experience and clinical data available for the product as well as the specific terms in the individual agreements. In cases where historical

188 | Novartis Annual Report 2016
experience and clinical data are not sufficient for a reli-able estimation of the outcome, revenue recognition is deferred until such history is available.
Cash discounts are offered to customers to encour-age prompt payment and are recorded as revenue deductions. Following a decrease in the price of a prod-uct, we generally grant customers a “shelf stock adjust-ment” for a customer’s existing inventory for the involved product. Provisions for shelf stock adjustments, which are primarily relevant within the Sandoz Division, are determined at the time of the price decline or at the point of sale, if the impact of a price decline on the products sold can be reasonably estimated based on the custom-er’s inventory levels of the relevant product. When there is historical experience of Novartis agreeing to customer returns and Novartis can reasonably estimate expected future returns, a provision is recorded for estimated sales returns. In doing so the estimated rate of return is applied, determined based on historical experience of customer returns and considering any other relevant factors. This is applied to the amounts invoiced also considering the amount of returned products to be destroyed versus products that can be placed back in inventory for resale. Where shipments are made on a re-sale or return basis, without sufficient historical experience for estimating sales returns, revenue is only recorded when there is evidence of consumption or when the right of return has expired.
Provisions for revenue deductions are adjusted to actual amounts as rebates, discounts and returns are processed. The provision represents estimates of the related obligations, requiring the use of judgment when estimating the effect of these sales deductions.
Other revenue“Other revenue” includes royalty income and revenue from activities such as manufacturing services or other services rendered to the extent such revenue is not recorded under net sales.
Research & Development
Internal Research & Development (R&D) costs are fully charged to “Research & Development” in the consoli-dated income statement in the period in which they are incurred. The Group considers that regulatory and other uncertainties inherent in the development of new prod-ucts preclude the capitalization of internal development expenses as an intangible asset until marketing approval from a regulatory authority is obtained in a major market such as the United States, the European Union, Switzer-land or Japan.
Payments made to third parties in compensation for subcontracted R&D, such as contract research and development organizations, that is deemed not to trans-fer intellectual property to Novartis are expensed as internal R&D expenses in the period in which they are incurred. Such payments are only capitalized if they meet the criteria for recognition of an internally generated
intangible asset, usually when marketing approval has been achieved from a regulatory authority in a major mar-ket.
Payments made to third parties in order to in-license or acquire intellectual property rights, compounds and products, including initial upfront and subsequent mile-stone payments, are capitalized as are payments for other assets, such as technologies to be used in R&D activities. If additional payments are made to the origi-nator company to continue to perform R&D activities, an evaluation is made as to the nature of the payments. Such additional payments will be expensed if they are deemed to be compensation for subcontracted R&D services not resulting in an additional transfer of intellectual property rights to Novartis. Such additional payments will be cap-italized if they are deemed to be compensation for the transfer to Novartis of additional intellectual property developed at the risk of the originator company. Subse-quent internal R&D costs in relation to IPR&D and other assets are expensed since the technical feasibility of the internal R&D activity can only be demonstrated by the receipt of marketing approval for a related product from a regulatory authority in a major market.
Costs for post-approval studies performed to sup-port the continued registration of a marketed product are recognized as marketing expenses. Costs for activ-ities that are required by regulatory authorities as a con-dition for obtaining marketing approval are capitalized and recognized as currently marketed product.
Inventory produced ahead of regulatory approval is provisioned against and the charge is included in “Other expense” in the consolidated income statement, as its ultimate use cannot be assured. If this inventory can be subsequently sold, the provision is released to “Other income” in the consolidated income statement either on approval by the appropriate regulatory authority or, exceptionally in Europe, on recommendation by the Committee for Medicinal Products for Human Use (CHMP), if approval is virtually certain.
Share-based compensation
Vested Novartis shares and American Depositary Receipts (ADRs) which are granted as compensation are valued at their market value on the grant date and are immediately expensed in the consolidated income state-ment.
The fair values of unvested restricted shares, restricted share units (RSUs) and performance share units (PSUs) in Novartis shares and ADRs granted to associates as compensation are recognized as an expense over the related vesting period. The expense recorded in the consolidated income statement is included in the personnel expenses of the various func-tions where the associates are employed.
Unvested restricted shares, restricted ADRs and RSUs are only conditional on the provision of services by the plan participant during the vesting period. They are valued using their fair value on the grant date. As

Novartis Annual Report 2016 | 189FINaNcIal RepORTNotes to the Novartis Group consolidated financial statements
RSUs do not entitle the holder to dividends the fair value is based on the Novartis share price at the grant date adjusted for the net present value of the dividends expected to be paid during the holding period. The fair value of these grants, after making adjustment for assumptions related to their forfeiture during the vest-ing period, are expensed on a straight-line basis over the respective vesting period.
PSUs require the plan participant to not only provide services during the vesting period but they are also sub-ject to certain performance criteria being achieved during the vesting period. PSUs granted under plans defined as “Long-Term Performance Plans” are subject to performance criteria based on Novartis internal per-formance metrics. The expense is determined taking into account assumptions concerning performance during the period against targets and expected forfeitures due to plan participants not meeting their service conditions. These assumptions are periodically adjusted. Any change in estimates for past services are recorded immediately as an expense or income in the consolidated income statement and amounts for future periods are expensed over the remaining vesting period. As a result, at the end of the vesting period, the total charge during the whole vesting period represents the amount which will finally vest. The number of equity instruments that finally vest is determined at the vesting date.
PSUs granted under the Long-Term Relative Perfor-mance Plan (LTRPP) are not only conditional on the pro-vision of services by the plan participant during the vest-ing period but are also conditional on the Total Shareholder Return (TSR) performance of Novartis rel-ative to a specific peer group of companies over the vest-ing period. These performance conditions are based on variables which can be observed in the market. IFRS requires that these observations are taken into account in determining the fair value of these PSUs at the date of grant. Novartis has determined the fair value of these PSUs at the date of grant using a “Monte Carlo” simula-tion model. The total fair value of this grant is expensed on a straight-line basis over the vesting period. Adjust-ments to the number of equity instruments granted are only made if a plan participant does not fulfill the service conditions.
If a plan participant leaves Novartis, for reasons other than retirement, disability or death, then unvested restricted shares, restricted ADRs, RSUs and related share options and PSUs are forfeited, unless determined otherwise by the provision of the plan rules or by the Compensation Committee, for example, in connection with a reorganization or divestment.
Measuring the fair values of PSUs granted under the LTRPP, requires an estimation of the probability of uncer-tain future events and various other factors used in the valuation models. The Monte Carlo simulation used for determining the fair value of the PSUs related to the LTRPP requires as input parameters the probability of factors related to uncertain future events; the term of the award; grant price of underlying shares or ADRs; expected volatilities; expected correlation matrix of the underlying equity instruments with those of the peer group of companies and the risk free interest rate.
Government grants
Grants from governments or similar organizations are recognized at their fair value when there is a reasonable assurance that the grant will be received and the Group will comply with all attached conditions.
Government grants related to income are deferred and recognized in the consolidated income statement over the period necessary to match them with the related costs which they are intended to compensate.
The accounting policy for property, plant and equip-ment describes the treatment of any related grants.
Restructuring charges
Restructuring provisions are recognized for the direct expenditures arising from the restructuring, where the plans are sufficiently detailed and where appropriate communication to those affected has been made.
Charges to increase restructuring provisions are included in “Other expense” in the consolidated income statements. Corresponding releases are recorded in “Other income” in the consolidated income statement.
Taxes
Taxes on income are provided in the same periods as the revenues and expenses to which they relate and include any interest and penalties incurred during the period. Deferred taxes are determined using the com-prehensive liability method and are calculated on the temporary differences that arise between the tax base of an asset or liability and its carrying value in the bal-ance sheet prepared for consolidation purposes, except for those temporary differences related to investments in subsidiaries and associated companies, where the tim-ing of their reversal can be controlled and it is probable that the difference will not reverse in the foreseeable future. Since generally the retained earnings are rein-vested, withholding or other taxes on eventual distribu-tion of a subsidiary’s retained earnings are only taken into account when a dividend has been planned.
The estimated amounts for current and deferred tax assets or liabilities, including any amounts related to any uncertain tax positions, are based on currently known facts and circumstances. Tax returns are based on an interpretation of tax laws and regulations and reflect esti-mates based on these judgments and interpretations. The tax returns are subject to examination by the com-petent taxing authorities which may result in an assess-ment being made requiring payments of additional tax, interest or penalties. Inherent uncertainties exist in the estimates of the tax positions.
Non-current assets held for sale
Non-current assets are classified as assets held for sale when their carrying amount is to be recovered principally through a sale transaction and a sale is considered highly

190 | Novartis Annual Report 2016
probable. They are stated at the lower of carrying amount and fair value less costs of disposal. Assets held for sale, included within a disposal group or included within dis-continued operations are not depreciated or amortized.
Status of adoption of significant new or amended IFRS standards or interpretations
The adoption of new or amended standards and inter-pretations which are effective for the financial year beginning on January 1, 2016 did not have a material impact on the Group’s consolidated financial statements.
The following new IFRS standards will, based on a Novartis analysis, be of significance to the Group, but have not yet been early adopted:— IFRS 9 Financial Instruments will substantially change
the classification and measurement of financial instru-ments; will require impairments to be based on a for-ward-looking model; will change the approach to hedging financial exposures and related documenta-tion and also the recognition of certain fair value changes. However, the Group does not expect IFRS 9 to have a significant impact on its consolidated financial statements and will implement the new stan-dard on January 1, 2018.
— IFRS 15 Revenue from contracts with customers amends revenue recognition requirements and estab-lishes principles for reporting information about the nature, amount, timing and uncertainty of revenue and cash flows arising from contracts with customers. The standard replaces IAS 18 Revenue and IAS 11 Con-struction contracts and related interpretations. How-ever, the Group does not expect IFRS 15 to have a significant impact on its consolidated financial state-ments and will implement the new standard on Jan-uary 1, 2018.
— IFRS 16 Leases substantially changes the financial statements as the majority of leases will become on-balance sheet liabilities with corresponding right of use assets on the balance sheet. The standard replaces IAS 17 Leases and is effective January 1, 2019. The current operating lease commitments of USD 2.9 billion as of December 31, 2016 and disclosed in Note 28 provide, subject to the provision of the standard, an indicator of the impact of the implemen-tation of IFRS 16 on the Group’s consolidated balance sheet.
There are no other IFRS standards or interpretations which are not yet effective which would be expected to have a material impact on the Group.
2. Significant transactionsSignificant transactions in 2016
alcON – acQUISITION OF TRaNSceND MeDIcal, INc.On February 17, 2016, Alcon entered into an agreement to acquire Transcend Medical, Inc. (Transcend), a pri-vately-held, US-based company focused on developing minimally-invasive surgical devices to treat glaucoma. The transaction closed on March 23, 2016, and the fair value of the total purchase consideration was USD 332 million. The amount consisted of an initial cash payment of USD 240 million and the net present value of the con-tingent consideration of USD 92 million due to the Tran-scend shareholders, which they are eligible to receive upon achievement of specified development and com-mercialization milestones. The purchase price allocation resulted in net identifiable assets of USD 294 million and goodwill of USD 38 million. Results of operations since the date of acquisition were not material.
INNOVaTIVe MeDIcINeS – acQUISITION OF SeleXYS pHaRMaceUTIcalS cORpORaTION
On November 18, 2016, Novartis acquired Selexys Phar-maceuticals Corporation (Selexys), a privately held, US-based company specializing in development of ther-apeutics in certain hematologic and inflammatory disor-ders following receipt of results of the SUSTAIN study. The previously held interest of 19% is adjusted to its fair value of USD 64 million through the consolidated income statement at acquisition date. This re-measurement resulted in a gain of USD 53 million.
The fair value of the total purchase consideration for acquiring the 81% stake Novartis did not already own amounted to USD 268 million. The amount consisted of an initial cash payment of USD 194 million and the net present value of the contingent consideration of USD 74 million due to the Selexys shareholders, which they are eligible to receive upon achievement of specified devel-opment and commercialization milestones. The pur-chase price allocation resulted in net identifiable assets of USD 332 million. No goodwill was recognized. Results of operations since the date of acquisition were not mate-rial.
Significant transactions entered into in 2016 and closed in January 2017INNOVaTIVe MeDIcINeS – acQUISITION OF ZIaRcO GROUp lIMITeD
On December 16, 2016, Novartis entered into an agree-ment to acquire Ziarco Group Limited, a privately held company focused on the development of novel treat-ments in dermatology. This acquisition will add a once daily oral H4 receptor antagonist in development for atopic dermatitis (AD), commonly known as eczema, to complement the Novartis dermatology portfolio and pipeline. The transaction closed on January 20, 2017, and the preliminary fair value of the total purchase con-sideration was USD 420 million before ordinary purchase price adjustments. The amount consisted of an initial cash payment of USD 325 million before ordinary pur-chase price adjustments and the preliminary net pres-

Novartis Annual Report 2016 | 191FINaNcIal RepORTNotes to the Novartis Group consolidated financial statements
ent value of the contingent consideration of USD 95 mil-lion, due to the Ziarco shareholders, which they are eligible to receive upon achievement of specified devel-opment milestones. The preliminary purchase price allo-cation resulted in net identifiable assets of USD 382 mil-lion and goodwill of USD 38 million.
INNOVaTIVe MeDIcINeS – acQUISITION OF eNcORe VISION, INc.
On December 20, 2016, Novartis entered into a defini-tive agreement for the acquisition of Encore Vision, Inc., a privately-held company in Fort Worth, Texas, USA, focused on the development of a novel treatment in pres-byopia. The transaction closed on January 20, 2017, and the preliminary fair value of the total purchase consider-ation was USD 465 million before ordinary purchase price adjustments. The amount consisted of an initial cash payment of USD 375 million before ordinary pur-chase price adjustments and the preliminary net pres-ent value of the contingent consideration of USD 90 mil-lion, due to the Encore shareholders, which they are eligible to receive upon achievement of specified devel-opment and commercialization milestones. The prelimi-nary purchase price allocation resulted in net identifiable assets of USD 374 million and goodwill of USD 91 million.
Significant transactions in 2015
Portfolio transformation transactionsTRaNSacTION WITH elI lIllY aND cOMpaNYOn January 1, 2015, Novartis closed its transaction with Eli Lilly and Company, USA (Lilly) announced in April 2014 to divest its Animal Health business for USD 5.4 billion in cash. This resulted in a pre-tax gain of USD 4.6 billion, which is recorded in operating income from discontin-ued operations.
TRaNSacTIONS WITH GlaXOSMITHKlINe plcOn March 2, 2015, Novartis closed its transactions with GlaxoSmithKline plc, Great Britain (GSK) announced in April 2014, with the following consequences:
INNOVATIVE MEDICINES – ACQUISITION OF GSK ONCOLOGY PRODUCTS
Novartis acquired GSK’s oncology products and certain related assets for an aggregate cash consideration of USD 16.0 billion. Up to USD 1.5 billion of this cash con-sideration at the acquisition date is contingent on cer-tain development milestones. The fair value of this poten-tially refundable consideration as at the acquisition date is USD 0.1 billion. In addition, under the terms of the agreement, Novartis is granted a right of first negotiation over the co-development or commercialization of GSK’s current and future oncology R&D pipeline, excluding oncology vaccines. The right of first negotiation is for a period of 12.5 years from the acquisition closing date. The purchase price allocation of the fair value of the con-sideration of USD 15.9 billion resulted in net identified assets of USD 13.5 billion and goodwill of USD 2.4 bil-lion. In 2015, from the date of the acquisition the busi-ness generated net sales of USD 1.8 billion. Management estimates net sales for the entire year 2015 would have amounted to USD 2.1 billion had the oncology products
been acquired at the beginning of the 2015 reporting period. The 2015 net results from operations on a reported basis since the acquisition date were not mate-rial.
VACCINES – DIVESTMENT
Novartis divested its Vaccines business (excluding its Vaccines influenza business) to GSK for up to USD 7.1 billion plus royalties. The USD 7.1 billion consists of USD 5.25 billion paid at closing and up to USD 1.8 billion in future milestone payments. The fair value of the con-tingent future milestones and royalties as at the acqui-sition date is USD 1.0 billion, resulting in a fair value of consideration received of USD 6.25 billion. Included in this amount is a USD 450 million milestone payment received in late March 2015. The sale of this business resulted in a pre-tax gain of USD 2.8 billion, which is recorded in operating income from discontinued opera-tions.
Novartis’s Vaccines influenza business was excluded from the GSK Vaccines business acquisition. However, GSK entered into a future option arrangement with Novartis in relation to the Vaccines influenza business, pursuant to which Novartis could have unilaterally required GSK to acquire the entire or certain parts of its Vaccines influenza business for consideration of up to USD 250 million (the Influenza Put Option) if the divest-ment to CSL Limited, Australia (CSL), discussed below, had not been completed. The option period was 18 months from the closing date of the GSK transaction, but terminated with the sale of the Vaccines influenza business to CSL on July 31, 2015. Novartis paid GSK a fee of USD 5 million in consideration for the grant of the Influenza Put Option.
CONSUMER HEALTH – COMBINATION OF NOVARTIS OTC WITH GSK CONSUMER HEALTHCARE
Novartis and GSK agreed to create a combined con-sumer healthcare business through the combination between Novartis OTC and GSK Consumer Healthcare businesses. On March 2, 2015, a new entity, GlaxoSmith-Kline Consumer Healthcare Holdings Ltd. (GSK Con-sumer Healthcare) was formed via contribution of busi-nesses from both Novartis and GSK. Novartis has a 36.5% interest in the newly created entity. Novartis has valued the contribution of 63.5% of its OTC Division in exchange for 36.5% of the GSK Consumer Healthcare business at fair value. Based on the estimates of fair val-ues exchanged, an investment in an associated company of USD 7.6 billion was recorded. The resulting pre-tax gain, net of transaction related costs, of USD 5.9 billion is recorded in operating income from discontinued oper-ations.
Novartis has four of eleven seats on the GSK Con-sumer Healthcare Board of Directors. Furthermore, Novartis has customary minority rights and also exit rights at a pre-defined, market based pricing mechanism.
The investment is accounted for using the equity method of accounting using estimated results for the last quarter of the year. Any differences between this esti-mate and actual results, when available, will be adjusted in the Group’s consolidated financial statements in the following year.

192 | Novartis Annual Report 2016
ADDITIONAL GSK RELATED COSTS
The GSK transaction resulted in USD 0.6 billion of addi-tional transaction-related costs that were expensed, thereof USD 0.3 billion paid in 2015.
TRaNSacTION WITH cSlOn October 26, 2014, Novartis entered into an agree-ment with CSL to sell its Vaccines influenza business to CSL for USD 275 million. Entering into the separate divestment agreement with CSL resulted in the Vaccines influenza business being classified as a separate dis-posal group consisting of a group of cash generating units within the Vaccines Division, requiring the perfor-mance of a separate valuation of the Vaccines influenza business net assets. This triggered the recognition of an exceptional impairment charge in 2014 of USD 1.1 billion as the estimated net book value of the Vaccines influ-enza business net assets was above the USD 275 mil-lion consideration. The transaction with CSL was com-pleted on July 31, 2015, resulting in a partial reversal of the impairment recorded in 2014 in the amount of USD 0.1 billion, which is included in operating income from dis-continued operations.
Other significant transactions in 2015INNOVaTIVe MeDIcINeS – acQUISITION OF SpINIFeX pHaRMaceUTIcalS, INc.
On June 29, 2015, Novartis entered into an agreement to acquire Spinifex Pharmaceuticals, Inc. (Spinifex), a US and Australia based, privately held development stage company, focused on developing a peripheral approach to treat neuropathic pain. The transaction closed on July 24, 2015, and the fair value of the total purchase consid-eration was USD 312 million. The amount consisted of an initial cash payment of USD 196 million and the net present value of the contingent consideration of USD 116 million due to previous Spinifex shareholders, which they are eligible to receive upon achievement of specified development and commercialization milestones. The purchase price allocation resulted in net identifiable assets of USD 263 million and goodwill of USD 49 mil-lion. The 2015 results of operations since the date of acquisition were not material.
INNOVaTIVe MeDIcINeS – acQUISITION OF aDMUNe THeRapeUTIcS llc
On October 16, 2015, Novartis entered into an agreement to acquire Admune Therapeutics LLC (Admune), a US-based, privately held company, broadening Novartis’ pipeline of cancer immunotherapies. The fair value of the total purchase consideration amounted to USD 258 mil-lion. This amount consists of an initial cash payment of USD 140 million and the net present value of the contin-gent consideration of USD 118 million due to Admune’s previous owners, which they are eligible to receive upon the achievement of specified development and commer-cialization milestones. The purchase price allocation resulted in net identifiable assets of USD 258 million. No goodwill was recognized. The 2015 results of operations since the date of acquisition were not material.
Significant transactions in 2014
VaccINeS – DIVeSTMeNT OF BlOOD TRaNSFUSION DIaGNOSTIcS UNIT
On January 9, 2014, Novartis completed the divestment of its blood transfusion diagnostics unit announced on November 11, 2013 to the Spanish company Grifols S.A., for USD 1.7 billion in cash. The pre-tax gain on this trans-action was USD 0.9 billion and was recorded in operat-ing income from discontinued operations.
INNOVaTIVe MeDIcINeS – acQUISITION OF cOSTIM pHaRMaceUTIcalS, INc.
On February 17, 2014, Novartis acquired all of the out-standing shares of CoStim Pharmaceuticals, Inc., a Cam-bridge, Massachusetts, US-based, privately held bio-technology company focused on harnessing the immune system to eliminate immune-blocking signals from can-cer, for a total purchase consideration of USD 248 mil-lion (at fair value excluding cash acquired). This amount consists of an initial cash payment and the net present value of contingent consideration of USD 153 million due to previous CoStim shareholders, which they are eligible to receive upon the achievement of specified develop-ment and commercialization milestones. The purchase price allocation resulted in net identified assets of USD 152 million (excluding cash acquired) and goodwill of USD 96 million. The 2014 results of operations since the acquisition were not material.
INNOVaTIVe MeDIcINeS – DIVeSTMeNT OF IDeNIX pHaRMaceUTIcalS, INc. (IDeNIX) SHaReHOlDING
On August 5, 2014, Merck & Co., USA completed a ten-der offer for Idenix. As a result, Novartis divested its 22% shareholding in Idenix and realized a gain of approxi-mately USD 0.8 billion which was recorded in income from associated companies.
alcON – acQUISITION OF WaVeTec VISION SYSTeMS, INc. (WaVeTec)
On October 16, 2014, Alcon acquired all of the outstand-ing shares of WaveTec, a privately held company, for USD 350 million in cash. The purchase price allocation resulted in net identified assets of USD 180 million and goodwill of USD 170 million. The 2014 results of opera-tions since the date of acquisition were not material.
cORpORaTe – DIVeSTMeNT OF lTS lOHMaNN THeRapIe-SYSTeMe aG (lTS) SHaReHOlDING
On November 5, 2014, Novartis divested its 43% share-holding in LTS and realized a gain of approximately USD 0.4 billion which was recorded in income from asso-ciated companies.

Novartis Annual Report 2016 | 193FINaNcIal RepORTNotes to the Novartis Group consolidated financial statements
3. Segmentation of key figures 2016, 2015 and 2014
The businesses of Novartis are divided operationally on a worldwide basis into three identified reporting seg-ments, Innovative Medicines, Sandoz and Alcon. In addi-tion, we separately report Corporate activities.
Reporting segments are presented in a manner con-sistent with the internal reporting to the chief operating decision maker which is the Executive Committee of Novartis. The reporting segments are managed sepa-rately because they each research, develop, manufac-ture, distribute, and sell distinct products that require dif-fering marketing strategies.
The Executive Committee of Novartis is responsible for allocating resources and assessing the performance of the reporting segments.
Following the internal reorganization announced on Jan-uary 27, 2016, the reporting segments and their financial results have been adapted to reflect in all years pre-sented the transfers of:— Alcon Ophthalmic Pharmaceuticals business fran-
chise from the Alcon Division to the Innovative Med-icines Division, the products of which will continue to be marketed with the Alcon brand name.
— Selected mature products from the Innovative Medi-cines Division to the Retail Generics business fran-chise of the Sandoz Division.
— The Alcon brand name intangible asset from the Alcon Division to Corporate as it is used to market the prod-ucts of Alcon Division and products within the Oph-thalmology business franchise of the Innovative Med-icines Division.
The consolidated financial statement disclosures by seg-ment have been restated to reflect the above mentioned internal reorganization. Accordingly, the net assets, including a proportionate share of goodwill, and the income and expenses related to the activities transferred have been reallocated to the respective reporting seg-ment in all periods presented in this financial report.
Innovative Medicines – formerly named the ‘Pharma-ceuticals Division’ – researches, develops, manufactures, distributes and sells patented prescription medicines. The Innovative Medicines Division is organized into two global business units: Novartis Oncology business unit, which consists of the global business franchises Oncol-ogy and Novartis Pharmaceuticals business unit, which consists of the global business franchises Ophthalmol-ogy, Neuroscience, Immunology and Dermatology, Respiratory, Cardio-Metabolic and Established Medi-cines.
Sandoz develops, manufactures, distributes and sells prescription medicines, as well as pharmaceutical active substances, which are not protected by valid and enforce-
able third-party patents. The Sandoz Division is orga-nized globally in three business franchises: Retail Gener-ics, Anti-Infectives and Biopharmaceuticals. In Retail Generics, Sandoz develops, manufactures and markets active ingredients and finished dosage forms of pharma-ceuticals to third parties. Retail Generics includes the areas of dermatology, respiratory, oncology and ophthal-mics, as well as cardiovascular, metabolism, central ner-vous system, pain, gastrointestinal and hormonal thera-pies. Finished dosage form anti-infectives sold to third parties are also part of Retail Generics. In Anti-Infectives, Sandoz manufactures active pharmaceutical ingredients and intermediates – mainly antibiotics – for internal use by Retail Generics and for sale to third party customers. In Biopharmaceuticals, Sandoz develops, manufactures and markets protein- or other biotechnology-based products known as biosimilars, and provides biotechnol-ogy manufacturing services to other companies.
Alcon researches, discovers, develops, manufac-tures, distributes and sells eye care products. The Alcon Division is the global leader in eye care, with product offerings in eye care devices and vision care. The Alcon Division is organized globally in two global business fran-chises as follows: In Surgical, Alcon develops, manufac-tures, distributes and sells ophthalmic surgical equip-ment, instruments, disposable products and intraocular lenses. In Vision Care, Alcon develops, manufactures, distributes and sells contact lenses and lens care prod-ucts.
Income and expenses relating to Corporate include the costs of the Group headquarters and those of cor-porate coordination functions in major countries. In addi-tion, Corporate includes other items of income and expense that are not attributable to specific segments, such as certain revenues from intellectual property rights, certain expenses related to post-employment benefits, environmental remediation liabilities, charitable activities, donations and sponsorships. Usually, no allo-cation of Corporate items is made to the segments. As a result, Corporate assets and liabilities principally con-sist of net liquidity (cash and cash equivalents, market-able securities less financial debts), investments in asso-ciated companies and current and deferred taxes and non-segment specific environmental remediation and post-employment benefit liabilities. Corporate also includes the Alcon brand name intangible asset as it is used to market the products of Alcon Division and prod-ucts within the Ophthalmology business franchise of the Innovative Medicines Division.

194 | Novartis Annual Report 2016
Our divisions are supported by the Novartis Institutes for BioMedical Research, Novartis Business Services, Global Drug Development and Novartis Technical Oper-ations organizations.— The Novartis Institutes for BioMedical Research
(NIBR) conducts research activities of the Innovative Medicines Division.
— Novartis Business Services (NBS) started operations in January 2015 as a shared services organization providing business support services across the Group such as information technology, real estate and facility services, procurement, product lifecycle ser-vices, human resources and financial reporting and accounting operations.
— Global Drug Development organization started oper-ations in July 2016 to oversee all drug development activities for our Innovative Medicines Division and the biosimilars portfolio of our Sandoz division.
— Novartis Technical Operations organization started operations in July 2016, in order to centralize man-agement of our manufacturing operations across our Innovative Medicines and Sandoz divisions.
Following the Portfolio Transformation transactions in 2015, described in Note 2, Novartis has separated the Group’s reported financial data into “continuing” operations and “discontinued” operations:
Continuing operations comprise:— Innovative Medicines: Innovative patent-protected
prescription medicines— Sandoz: Generic and biosimilar pharmaceuticals — Alcon: Eye care devices and vision care — Corporate activities
Discontinued operations comprise:— Vaccines: Preventive human vaccines and the blood
transfusion diagnostics unit. Excluded are certain intellectual property rights and related other revenues of the Vaccines Division which are now reported under Corporate activities.
— Consumer Health: OTC (over-the-counter medicines) and Animal Health. These two divisions were man-aged separately. However, neither was material enough to the Group to be disclosed separately as a reporting segment.
— Corporate: certain transactional and other expenses related to the portfolio transformation.
The accounting policies mentioned in Note 1 are used in the reporting of segment results. Inter-segmental sales are made at amounts which are considered to approxi-mate arm’s length transactions. The Executive Commit-tee of Novartis evaluates segmental performance and allocates resources among the segments based on a number of measures including net sales, operating income and net operating assets. Segment net operat-ing assets consist primarily of property, plant and equip-ment, intangible assets, goodwill, inventories and trade and other operating receivables less operating liabilities.

Novartis Annual Report 2016 | 195FINaNcIal RepORTNotes to the Novartis Group consolidated financial statements
Segmentation – Consolidated income statements
Innovative Medicines1 Sandoz Alcon Corporate Group (including eliminations)
2015 2015 2015 2015
(USD millions) 2016 restated 2 2016 restated 2 2016 restated 2 2016 restated 2 2016 2015
Net sales to third parties from
continuing operations 32 562 33 345 10 144 10 070 5 812 5 999 48 518 49 414
Sales to other segments 624 518 104 128 – 728 – 620 26
Net sales from continuing operations 33 186 33 863 10 248 10 198 5 812 5 999 – 728 – 620 48 518 49 440
Other revenues 815 792 37 25 4 23 62 107 918 947
Cost of goods sold – 9 331 – 9 204 – 5 971 – 5 844 – 3 092 – 3 145 874 789 – 17 520 – 17 404
Gross profit from continuing operations 24 670 25 451 4 314 4 379 2 724 2 877 208 276 31 916 32 983
Marketing & Sales – 8 435 – 8 430 – 1 681 – 1 679 – 1 882 – 1 663 – 11 998 – 11 772
Research & Development – 7 709 – 7 685 – 814 – 782 – 516 – 468 – 9 039 – 8 935
General & Administration – 978 – 1 031 – 300 – 346 – 410 – 450 – 506 – 648 – 2 194 – 2 475
Other income 1 091 1 149 185 109 48 54 603 737 1 927 2 049
Other expense – 1 213 – 1 639 – 259 – 381 – 96 – 69 – 776 – 784 – 2 344 – 2 873
Operating income from
continuing operations 7 426 7 815 1 445 1 300 – 132 281 – 471 – 419 8 268 8 977
Income from associated companies 6 2 697 264 703 266
Interest expense – 707 – 655
Other financial income and expense – 447 – 454
Income before taxes from
continuing operations 7 817 8 134
Taxes – 1 119 – 1 106
Net income from continuing operations 6 698 7 028
Net income from discontinued
operations 10 766
Net income 6 698 17 794
Attributable to:
Shareholders of Novartis AG 6 712 17 783
Non-controlling interests – 14 11
Included in net income from
continuing operations are:
Interest income 43 33
Depreciation of property,
plant & equipment – 883 – 839 – 260 – 277 – 229 – 237 – 117 – 117 – 1 489 – 1 470
Amortization of intangible assets – 2 470 – 2 384 – 450 – 450 – 929 – 912 – 12 – 9 – 3 861 – 3 755
Impairment charges on property,
plant & equipment, net – 93 39 – 2 – 97 – 5 – 1 – 2 – 21 – 102 – 80
Impairment charges on intangible
assets, net – 522 – 138 – 65 – 27 – 4 – 1 – 591 – 166
Impairment charges and fair value
gains on financial assets, net – 55 – 32 – 77 – 72 – 132 – 104
Additions to restructuring provisions – 236 – 232 – 46 – 93 – 36 – 25 – 25 – 49 – 343 – 399
Equity-based compensation of
Novartis equity plans – 582 – 620 – 47 – 53 – 53 – 66 – 164 – 164 – 846 – 903
1 Formerly named the Pharmaceuticals Division2 Restated to reflect the new divisional structures and product transfers between divisions, announced on January 27, 2016

196 | Novartis Annual Report 2016
Innovative Medicines1 Sandoz Alcon Corporate Group (including eliminations)
2015 2014 2015 2014 2015 2014 2015 2014
(USD millions) restated 2 restated 2 restated 2 restated 2 restated 2 restated 2 restated 2 restated 2 2015 2014
Net sales to third parties from
continuing operations 33 345 34 828 10 070 10 736 5 999 6 616 49 414 52 180
Sales to other segments 518 698 128 287 – 620 – 746 26 239
Net sales from continuing operations 33 863 35 526 10 198 11 023 5 999 6 616 – 620 – 746 49 440 52 419
Other revenues 792 631 25 12 23 32 107 540 947 1 215
Cost of goods sold – 9 204 – 8 724 – 5 844 – 6 293 – 3 145 – 3 204 789 876 – 17 404 – 17 345
Gross profit from continuing operations 25 451 27 433 4 379 4 742 2 877 3 444 276 670 32 983 36 289
Marketing & Sales – 8 430 – 8 809 – 1 679 – 1 871 – 1 663 – 1 697 – 11 772 – 12 377
Research & Development – 7 685 – 7 787 – 782 – 833 – 468 – 466 – 8 935 – 9 086
General & Administration – 1 031 – 1 114 – 346 – 376 – 450 – 508 – 648 – 618 – 2 475 – 2 616
Other income 1 149 737 109 97 54 76 737 481 2 049 1 391
Other expense – 1 639 – 1 634 – 381 – 189 – 69 – 89 – 784 – 600 – 2 873 – 2 512
Operating income from
continuing operations 7 815 8 826 1 300 1 570 281 760 – 419 – 67 8 977 11 089
Income from associated companies 812 2 4 264 1 102 266 1 918
Interest expense – 655 – 704
Other financial income and expense – 454 – 31
Income before taxes from
continuing operations 8 134 12 272
Taxes – 1 106 – 1 545
Net income from continuing operations 7 028 10 727
Net income/loss from discontinued operations 10 766 – 447
Net income 17 794 10 280
Attributable to:
Shareholders of Novartis AG 17 783 10 210
Non-controlling interests 11 70
Included in net income from
continuing operations are:
Interest income 33 33
Depreciation of property,
plant & equipment – 839 – 902 – 277 – 317 – 237 – 261 – 117 – 106 – 1 470 – 1 586
Amortization of intangible assets – 2 384 – 1 416 – 450 – 448 – 912 – 906 – 9 – 5 – 3 755 – 2 775
Impairment charges on property,
plant & equipment, net 39 – 15 – 97 – 7 – 1 1 – 21 – 23 – 80 – 44
Impairment charges on intangible
assets, net – 138 – 238 – 27 – 39 – 1 – 166 – 277
Impairment charges and fair value
gains on financial assets, net – 32 – 20 – 1 – 72 – 48 – 104 – 69
Additions to restructuring provisions – 232 – 464 – 93 – 4 – 25 – 33 – 49 – 3 – 399 – 504
Equity-based compensation of
Novartis and Alcon equity plans – 620 – 705 – 53 – 51 – 66 – 72 – 164 – 179 – 903 – 1 007
1 Formerly named the Pharmaceuticals Division2 Restated to reflect the new divisional structures and product transfers between divisions, announced on January 27, 2016

Novartis Annual Report 2016 | 197FINaNcIal RepORTNotes to the Novartis Group consolidated financial statements
Segmentation – Consolidated balance sheets
Innovative Medicines1 Sandoz Alcon Corporate Group (including eliminations)
2015 2015 2015 2015
(USD millions) 2016 restated 2 2016 restated 2 2016 restated 2 2016 restated 2 2016 2015
Total assets 51 911 54 769 17 611 18 530 22 970 23 291 37 632 34 966 130 124 131 556
Total liabilities – 10 007 – 10 798 – 3 168 – 3 545 – 2 520 – 2 403 – 39 538 – 37 688 – 55 233 – 54 434
Total equity 74 891 77 122
Net debt 16 025 16 484
Net operating assets 41 904 43 971 14 443 14 985 20 450 20 888 90 916 93 606
Included in assets and liabilities are:
Total property, plant & equipment 10 410 10 464 2 374 2 788 2 163 2 025 694 705 15 641 15 982
Additions to property,
plant & equipment 3 996 1 380 316 421 396 494 127 224 1 835 2 519
Total goodwill and intangible assets 31 630 33 783 10 774 11 253 16 914 17 343 3 002 3 012 62 320 65 391
Additions to goodwill and
intangible assets 3 865 996 45 44 63 108 5 11 978 1 159
Total investment in associated
companies 16 8 18 15 14 270 15 291 14 304 15 314
Additions to investment in associated
companies 3 4 5 37 57 41 62
Cash and cash equivalents,
marketable securities, commodities,
time deposits and derivative
financial instruments 7 777 5 447 7 777 5 447
Financial debts and derivative
financial instruments 23 802 21 931 23 802 21 931
Current income tax and deferred
tax liabilities 8 260 8 072 8 260 8 072
1 Formerly named the Pharmaceuticals Division2 Restated to reflect the new divisional structures and product transfers between divisions, announced on January 27, 20163 Excluding impact of business combinations
The following table shows countries that accounted for more than 5% of at least one of the respective Group totals and regional information for net sales for the years ended December 31, 2016, 2015 and 2014 and for selected non-current assets for the years ended December 31, 2016 and 2015:
Net sales1 Total of selected non-current assets2
(USD millions) 2016 % 2015 % 2014 % 2016 % 2015 %
country
Switzerland 830 2 774 2 658 1 44 413 48 47 054 49
United States 17 117 35 18 079 37 17 337 33 28 484 31 28 677 30
United Kingdom 1 182 2 1 277 3 1 379 3 6 892 7 7 769 8
Germany 3 634 7 3 262 7 3 742 7 2 733 3 2 908 3
France 2 390 5 2 269 5 2 638 5 199 188
Japan 3 267 7 3 163 6 3 781 7 145 142
Other 20 098 42 20 590 40 22 645 44 9 399 11 9 949 10
Group 48 518 100 49 414 100 52 180 100 92 265 100 96 687 100
Region
Europe 17 079 35 16 472 33 18 690 36 59 879 65 63 681 66
Americas 20 998 43 22 414 45 22 218 43 29 831 32 30 375 31
Asia/Africa/Australasia 10 441 22 10 528 22 11 272 21 2 555 3 2 631 3
Group 48 518 100 49 414 100 52 180 100 92 265 100 96 687 100
1 Net sales from operations by location of third-party customer2 Total of property, plant and equipment; goodwill; intangible assets; and investment in associated companies

198 | Novartis Annual Report 2016
The Group’s largest, second and third largest customer accounts for approximately 16%, 12% and 6% of net sales, respectively (2015: 14%, 11% and 5%; 2014: 12%, 11% and 5% respectively). No other customer accounted for 5% or more of net sales, in any year.
The highest amounts of trade receivables outstand-ing were for these same three customers. They amounted to 14%, 9% and 6%, respectively, of the trade receivables at December 31, 2016 (2015: 13%, 9% and 6% respec-tively).
Innovative Medicines1 net sales by business franchise
2015 Change 2014 Change
2016 restated (2015 restated (2014
USD USD to 2016) USD to 2015)
millions millions 2 USD % millions 2 USD %
Oncology
Gleevec/Glivec 3 323 4 658 – 29 4 746 – 2
Tasigna 1 739 1 632 7 1 529 7
Subtotal Bcr-abl
portfolio 5 062 6 290 – 20 6 275 0
Sandostatin 1 646 1 630 1 1 650 – 1
Afinitor/Votubia 1 516 1 607 – 6 1 575 2
Exjade/Jadenu 956 917 4 926 – 1
Votrient 729 565 nm 0 nm
Tafinlar/Mekinist 672 453 nm 0 nm
Promacta/Revolade 635 402 nm 0 nm
Jakavi 581 410 42 279 47
Zykadia 91 79 15 31 155
Other 902 951 – 5 918 4
Total Oncology
business unit 12 790 13 304 – 4 11 654 14
Ophthalmology
Lucentis 1 835 2 060 – 11 2 441 – 16
Travoprost Group 619 631 – 2 734 – 14
Systane Group 377 380 – 1 378 1
Topical Olopatadine Group 335 457 – 27 515 – 11
Other 2 297 2 395 – 4 2 647 – 10
Total Ophthalmology 5 463 5 923 – 8 6 715 – 12
Neuroscience
Gilenya 3 109 2 776 12 2 477 12
Exelon/Exelon Patch 444 728 – 39 1 009 – 28
Other 124 141 – 12 243 – 42
Total Neuroscience 3 677 3 645 1 3 729 – 2
Immunology and Dermatology
Cosentyx 1 128 261 nm 0 nm
Neoral/Sandimmun(e) 515 570 – 10 684 – 17
Zortress/Certican 398 335 19 327 2
Myfortic 383 441 – 13 543 – 19
Ilaris 283 236 20 199 19
Other 172 160 8 173 – 8
Subtotal Immunology
and Dermatology,
excluding everolimus
stent drug 2 879 2 003 44 1 926 4
Everolimus stent drug 136 134 1 205 – 35
Total Immunology
and Dermatology 3 015 2 137 41 2 131 0
2015 Change 2014 Change
2016 restated (2015 restated (2014
USD USD to 2016) USD to 2015)
millions millions 2 USD % millions 2 USD %
Respiratory
Ultibro Breezhaler 363 260 40 118 120
Seebri Breezhaler 149 150 – 1 146 3
Onbrez Breezhaler/
Arcapta Neohaler 143 166 – 14 220 – 25
Subtotal cOpD3 portfolio 655 576 14 484 19
Xolair 4 835 755 11 777 – 3
Other 31 37 – 16 39 – 5
Total Respiratory 1 521 1 368 11 1 300 5
cardio-Metabolic
Galvus 1 193 1 140 5 1 224 – 7
Entresto 170 21 nm 0 nm
Other 14 0 nm 8 nm
Total cardio-Metabolic 1 377 1 161 19 1 232 – 6
established Medicines
Diovan/Co-Diovan 1 073 1 284 – 16 2 345 – 45
Exforge 926 1 047 – 12 1 396 – 25
Voltaren/Cataflam 525 558 – 6 632 – 12
Ritalin/Focalin 282 365 – 23 492 – 26
Other 1 913 2 553 – 25 3 202 – 20
Total established
Medicines 4 719 5 807 – 19 8 067 – 28
Total pharmaceutical
business unit 19 772 20 041 – 1 23 174 – 14
Total division
net sales 32 562 33 345 – 2 34 828 – 4
1 Formerly named the Pharmaceuticals Division2 Restated to reflect the new divisional structures and product transfers between
divisions, announced on January 27, 20163 Chronic obstructive pulmonary disease4 Net sales reflect Xolair sales for all indications (e.g., including Xolair SAA and Xolair
CSU, which is managed by the Immunology and Dermatology franchise)nm = not meaningful
The product portfolio of other segments is widely spread in 2016, 2015 and 2014.

Novartis Annual Report 2016 | 199FINaNcIal RepORTNotes to the Novartis Group consolidated financial statements
4. associated companies Net income statement effect Other comprehensive income effect Total comprehensive income effect
(USD millions) 2016 2015 2014 2016 2015 2014 2016 2015 2014
Roche Holding AG, Switzerland 464 343 599 – 39 – 149 – 51 425 194 548
GlaxoSmithKline Consumer
Healthcare Holdings Ltd., UK 234 – 79 710 – 4 944 – 83
Idenix Pharmaceuticals Inc., US 812 812
LTS Lohmann Therapie-Systeme AG,
Germany 436 436
Others 5 2 71 20 5 2 91
associated companies
related to continuing operations 703 266 1 918 671 – 153 – 31 1 374 113 1 887
Novartis has significant investments in Roche Holding AG, Basel (Roche) and in GlaxoSmithKline Consumer Healthcare Holdings Ltd, Brentford, Middlesex, UK as well as certain other smaller investments which are accounted for as associated companies.
Balance sheet value
December 31, December 31,
(USD millions) 2016 2015
Roche Holding AG, Switzerland 7 644 7 919
GlaxoSmithKline Consumer
Healthcare Holdings Ltd., UK 6 448 7 194
Others 212 201
Total 14 304 15 314
Roche Holding AG
The Group’s holding in Roche voting shares was 33.3% at December 31, 2016, 2015 and 2014. This investment represents approximately 6.3% of Roche’s total out-standing voting and non-voting equity instruments at December 31, 2016, 2015 and 2014.
Since full-year 2016 financial data for Roche is not available when Novartis produces its consolidated finan-cial results, a survey of analyst estimates is used to esti-mate the Group’s share of Roche’s net income. Any dif-ferences between these estimates and actual results will be adjusted in the Group’s 2017 consolidated financial statements when available.
The following tables show summarized financial infor-mation of Roche, including current values of fair value adjustments made at the time of the acquisition of the shares, for the year ended December 31, 2015 and for the six months ended June 30, 2016 (since full year 2016 data is not yet available):
Non-current Current Non-current
(CHF billions) Current assets assets liabilities liabilities
December 31, 2015 28.2 63.7 23.8 28.7
June 30, 2016 26.6 62.6 24.5 29.0
Other Total
comprehen- comprehen-
(CHF billions) Revenue Net income sive income sive income
December 31, 2015 48.1 6.8 – 0.8 6.0
June 30, 2016 25.0 4.3 – 0.5 3.8
A purchase price allocation was performed on the basis of publicly available information at the time of acquisition of the investment. The December 31, 2016 balance sheet value allocation is as follows:
December 31,
(USD millions) 2016
Novartis share of Roche’s estimated net assets 2 200
Novartis share of re-appraised intangible assets 824
Implicit Novartis goodwill 2 785
current value of share in net identifiable assets
and goodwill 5 809
Accumulated equity accounting adjustments
and translation effects less dividends received 1 835
Balance sheet value 7 644
The identified intangible assets principally relate to the value of currently marketed products and are amortized on a straight-line basis over their estimated average use-ful life of 20 years.
In 2016, dividends received from Roche in relation to the distribution of its 2015 net income amounted to USD 433 million (2015: USD 429 million in relation with the distribution of its 2014 net income).
The consolidated income statement effects from applying Novartis accounting principles for this invest-ment in 2016, 2015 and 2014 are as follows:
(USD millions) 2016 2015 2014
Novartis share of Roche’s
estimated current-year
consolidated net income 678 650 813
Prior-year adjustment – 68 – 157 – 56
Amortization of fair value
adjustments relating to
intangible assets, net of taxes
of USD 42 million (2015: USD 41
million; 2014: USD 45 million) – 146 – 150 – 158
Net income effect 464 343 599

200 | Novartis Annual Report 2016
The publicly quoted market value of the Novartis inter-est in Roche (SIX symbol: RO) at December 31, 2016, was USD 12.4 billion (2015: USD 14.9 billion).
GlaxoSmithKline Consumer Healthcare Holdings Ltd.
On March 2, 2015, Novartis closed its transactions with GlaxoSmithKline plc, Great Britain (GSK) announced in April 2014. As part of these transactions, Novartis and GSK agreed to create a combined consumer healthcare business through a combination between Novartis OTC and GSK Consumer Healthcare. On March 2, 2015, a new entity GlaxoSmithKline Consumer Healthcare Hold-ings Ltd (GSK Consumer Healthcare) was formed via the contribution of businesses from both Novartis and GSK.
At December 31, 2016 and 2015, Novartis has a 36.5% interest in GSK Consumer Healthcare and four of eleven seats on the GSK Consumer Healthcare Board of Direc-tors. Furthermore, Novartis has customary minority rights and also exit rights at a pre-defined, market-based pricing mechanism.
Novartis has valued the contribution of 63.5% of its OTC Division in exchange for 36.5% of the GSK Con-sumer Healthcare business at fair value. Based on the estimates of fair values exchanged, an investment in associated company of USD 7.6 billion was recorded on March 2, 2015.
The December 31, 2016 balance sheet value alloca-tion is as follows:
December 31,
(USD millions) 2016
Novartis share of GSK Consumer Healthcare’s estimated
net assets 1 502
Novartis share of re-appraised intangible assets 3 517
Implicit Novartis goodwill 1 606
current value of share in net identifiable assets
and goodwill 6 625
Accumulated equity accounting adjustments
and translation effects less dividends received – 177
Balance sheet value 6 448
The identified intangible assets principally relate to the value of the indefinite life GSK Consumer Healthcare intangible assets. The identified intangible assets with a definite life are amortized on a straight-line basis over their estimated average useful life of 20 years.
The following tables show summarized financial infor-mation of GSK Consumer Healthcare, including current values of fair value adjustments made at the time of acquisition, for the ten-month period ended December
31, 2015, and for the nine months ended September 30, 2016 (interim unaudited), since full year 2016 data is not yet available:
Non-current Current Non-current
(GBP billions) Current assets assets liabilities liabilities
December 31, 2015 3.8 19.5 2.8 1.8
September 30, 2016 4.2 21.2 3.0 2.1
Other Total
comprehen- comprehen-
(GBP billions) Revenue Net income sive income sive income
December 31, 2015 4.6 0.0 0.0 0.0
September 30, 2016 4.7 0.5 2.1 2.6
Since full-year 2016 financial data for GSK Consumer Healthcare is not available when Novartis produces its consolidated financial results, a projection of the latest internal management reporting is used to estimate the Group’s share of GSK Consumer Healthcare’s net result for the year. Any differences between this estimate and actual results will be adjusted in the Group’s 2017 con-solidated financial statements when available.
In 2016, dividends received from GSK Consumer Healthcare amounted to USD 463 million (2015: nil).
The consolidated income statement effects from applying Novartis accounting principles for this invest-ment in 2016 and 2015 are as follows:
(USD millions) 2016 2015
Novartis share of GSK Consumer Healthcare’s
estimated current-year consolidated net income 268 – 17
Prior-year adjustment – 22
Amortization of fair value adjustments
relating to intangible assets and inventory,
net of taxes of USD 2 million
(2015: USD 18 million) – 12 – 62
Net income effect 234 – 79
Other associated companies
During 2014, the shareholdings of 22% in Idenix Phar-maceuticals, Inc. and 43% in LTS Lohmann Thera-pie-Systeme AG were sold, realizing gains of USD 812 million and USD 421 million, respectively. Others include a gain of USD 64 million recorded on investments in asso-ciated companies held by the Novartis Venture Funds, which are accounted at fair value from January 1, 2014 onwards, consistent with other investments held by these Funds.

Novartis Annual Report 2016 | 201FINaNcIal RepORTNotes to the Novartis Group consolidated financial statements
5. Interest expense and other financial income and expenseInterest expense
(USD millions) 2016 2015 2014
Interest expense – 709 – 669 – 701
Income/(expense) arising from
discounting long-term liabilities 2 14 – 3
Total interest expense – 707 – 655 – 704
Other financial income and expense
(USD millions) 2016 2015 2014
Interest income 43 33 33
Dividend income 1 1 1
Net capital losses on
available-for-sale securities – 1 – 8 – 2
Income on forward contracts
and options 1 1
Impairment of commodities
and available-for-sale securities, net 7 – 132
Other financial expense – 20 – 23 – 25
Monetary loss from hyperinflation
accounting – 72 – 61
Currency result, net – 477 – 254 22
Total other financial income
and expense – 447 – 454 – 31
6. Taxes
Income before taxes
(USD millions) 2016 2015 2014
Switzerland 3 110 5 765 5 245
Foreign 4 707 2 369 7 027
Income before taxes
from continuing operations 7 817 8 134 12 272
Income/(loss) before taxes
from discontinued operations 12 479 – 351
Total income before taxes 7 817 20 613 11 921
Current and deferred income tax expense
(USD millions) 2016 2015 2014
Switzerland – 709 – 317 – 661
Foreign – 1 418 – 1 333 – 1 952
current income tax expense
from continuing operations – 2 127 – 1 650 – 2 613
Switzerland 765 – 68 309
Foreign 243 612 759
Deferred tax income
from continuing operations 1 008 544 1 068
Income tax expense
from continuing operations – 1 119 – 1 106 – 1 545
Income tax expense
from discontinued operations – 1 713 – 96
Total income tax expense – 1 119 – 2 819 – 1 641
Analysis of tax rateThe main elements contributing to the difference between the Group’s overall applicable tax rate (which can change each year since it is calculated as the weighted average tax rate based on pre-tax income of each subsidiary) and the effective tax rate are:
(As a percentage) 2016 2015 2014
Applicable tax rate 13.2 12.4 11.7
Effect of disallowed expenditures 3.5 3.5 2.9
Effect of utilization of tax losses
brought forward from prior periods – 0.2 – 0.2 – 0.3
Effect of income taxed at reduced rates – 0.2 – 0.3 – 0.6
Effect of tax credits and allowances – 2.8 – 2.7 – 1.8
Effect of tax rate change on opening balance 0.2 – 0.5
Effect of write-off of deferred tax assets 0.5
Effect of write down and reversal of
write-down of investments in subsidiaries – 1.0 – 0.9 0.9
Effect of tax benefits expiring in 2017 – 0.5 – 0.4 – 0.8
Effect of non-deductible losses in
Venezuela 1.3 1.2
Effect of prior year items 0.2 1.0 0.8
Effect of other items 1 0.1 0.5 – 0.2
effective tax rate
for continuing operations 14.3 13.6 12.6
Effective tax rate
for discontinued operations 13.7 – 27.4
effective tax rate 14.3 13.7 13.8
1 Other items in 2016 (+0.1%) include one-time impacts for the deferred tax effects on the net assets of certain subsidiaries resulting from the change in their tax status (-6.2%), the changes in uncertain tax positions (+5.1%) and other items (+1.2%).

202 | Novartis Annual Report 2016
Novartis has a substantial business presence in many countries and is therefore subject to different income and expense items that are non-taxable (permanent dif-ferences) or taxed at different rates in those tax jurisdic-tions. This results in a difference between our applicable tax rate and effective tax rate, as shown in the table above.
The utilization of tax-loss carry-forwards lowered the tax charge by USD 18 million in 2016 and by USD 15 mil-lion and USD 34 million in 2015 and 2014, respectively.
7. earnings per share 2016 2015 2014
Net income/loss attributable to shareholders of Novartis aG
(USD millions)
– Continuing operations 6 712 7 025 10 654
– Discontinued operations 10 758 – 444
– Total 6 712 17 783 10 210
Number of shares (in millions)
Weighted average number of shares outstanding used in basic earnings per share 2 378 2 403 2 426
Adjustment for vesting of restricted shares, restricted share units and dilutive shares from options 22 35 44
Weighted average number of shares in diluted earnings per share 2 400 2 438 2 470
Basic earnings per share (USD)
– Continuing operations 2.82 2.92 4.39
– Discontinued operations 4.48 – 0.18
– Total 2.82 7.40 4.21
Diluted earnings per share (USD)
– Continuing operations 2.80 2.88 4.31
– Discontinued operations 4.41 – 0.18
– Total 2.80 7.29 4.13
Basic earnings per share (EPS) is calculated by dividing net income attributable to shareholders of Novartis AG by the weighted average number of shares outstanding in a reporting period. This calculation excludes the aver-age number of issued shares purchased by the Group and held as treasury shares.
For diluted EPS, the weighted average number of shares outstanding is adjusted to assume the vesting of all restricted shares, restricted share units and the conversion of all potentially dilutive shares arising from options on Novartis shares that have been issued.
No options were excluded from the calculation of diluted EPS in 2014, 2015, or 2016 as all options were dilutive in all years.

Novartis Annual Report 2016 | 203FINaNcIal RepORTNotes to the Novartis Group consolidated financial statements
8. changes in consolidated statements of comprehensive incomeThe consolidated statements of comprehensive income include the Group’s net income for the year as well as all other valuation adjustments recorded in the Group’s con-solidated balance sheet but which under IFRS are not recorded in the consolidated income statement. These
include fair value adjustments to financial instruments, actuarial gains or losses on defined benefit pension and other post-employment plans and currency translation effects, net of tax.
The following table summarizes these value adjustments and currency translation effects attributable to Novartis shareholders:
Fair value Fair value Actuarial Cumulative
adjustments adjustments on losses currency
on marketable deferred cash from defined translation Total value
(USD millions) securities flow hedges benefit plans effects adjustments
Value adjustments at January 1, 2014 344 – 59 – 4 544 4 625 366
Fair value adjustments on financial instruments 89 21 110
Net actuarial losses from defined benefit plans 1 – 822 – 822
Currency translation effects 2 – 2 219 – 2 219
Total value adjustments in 2014 89 21 – 822 – 2 219 – 2 931
Value adjustments at December 31, 2014 433 – 38 – 5 366 2 406 – 2 565
Fair value adjustments on financial instruments 28 20 48
Net actuarial losses from defined benefit plans 1 – 147 – 147
Currency translation effects 2 – 1 659 – 1 659
Total value adjustments in 2015 28 20 – 147 – 1 659 – 1 758
Fair value adjustments related to divestments 100 100
Value adjustments at December 31, 2015 461 – 18 – 5 413 747 – 4 223
Fair value adjustments on financial instruments – 113 15 – 98
Net actuarial losses from defined benefit plans – 514 – 514
Currency translation effects – 2 389 – 2 389
Total value adjustments in 2016 – 113 15 – 514 – 2 389 – 3 001
Fair value adjustments related to divestments 12 12
Value adjustments at December 31, 2016 348 – 3 – 5 915 – 1 642 – 7 212
1 Net actuarial gains of USD 10 million in 2015 and net actuarial losses of USD 65 million in 2014 were attributable to discontinued operations up to the respective divestment dates2 Currency translation losses of USD 29 million in 2015 and USD 37 million in 2014 were attributable to discontinued operations up to the respective divestment dates
8.1) The 2016, 2015 and 2014 changes in the fair value of financial instruments were as follows:
Fair value Fair value
adjustments adjustments on
on marketable deferred cash
(USD millions) securities flow hedges Total
Fair value adjustments at January 1, 2016 461 – 18 443
Changes in fair value:
– Available-for-sale marketable securities 1 1
– Available-for-sale financial investments – 87 – 87
Realized net gains transferred to the consolidated income statement:
– Marketable securities sold – 1 – 1
– Other financial assets sold – 154 – 154
Amortized net losses on cash flow hedges transferred to the consolidated income statement 16 16
Impaired financial assets transferred to the consolidated income statement 131 131
Deferred tax on above items – 3 – 1 – 4
Fair value adjustments during the year – 113 15 – 98
Fair value adjustments at December 31, 2016 348 – 3 345

204 | Novartis Annual Report 2016
Fair value Fair value
adjustments adjustments on
on marketable deferred cash
(USD millions) securities flow hedges Total
Fair value adjustments at January 1, 2015 433 – 38 395
Changes in fair value:
– Available-for-sale marketable securities – 130 – 130
– Available-for-sale financial investments 80 80
– Associated companies’ movements in comprehensive income – 8 – 8
Realized net gains transferred to the consolidated income statement:
– Marketable securities sold – 1 – 1
– Other financial assets sold – 103 – 103
Amortized net losses on cash flow hedges transferred to the consolidated income statement 21 21
Impaired financial assets transferred to the consolidated income statement 194 194
Deferred tax on above items – 4 – 1 – 5
Fair value adjustments during the year 28 20 48
Fair value adjustments at December 31, 2015 461 – 18 443
Fair value Fair value
adjustments adjustments on
on marketable deferred cash
(USD millions) securities flow hedges Total
Fair value adjustments at January 1, 2014 344 – 59 285
Changes in fair value:
– Available-for-sale marketable securities – 3 – 3
– Available-for-sale financial investments 91 91
– Associated companies’ movements in comprehensive income 5 5
Realized net gains transferred to the consolidated income statement:
– Marketable securities sold – 4 – 4
– Other financial assets sold – 81 – 81
Amortized net losses on cash flow hedges transferred to the consolidated income statement 23 23
Impaired financial assets transferred to the consolidated income statement 87 87
Deferred tax on above items – 6 – 2 – 8
Fair value adjustments during the year 89 21 110
Fair value adjustments at December 31, 2014 433 – 38 395
8.2) In 2015, cumulative currency translation losses of USD 10 million have been recycled through the income state-ment as a result of the divestments of subsidiaries. No currency translation losses have been recycled through income statement in 2016 and 2014.
8.3) Remeasurements from defined benefit plans arise as follows:
(USD millions) 2016 2015 2014
Defined benefit pension plans before tax – 667 – 252 – 999
Other post-employment benefit plans before tax 12 168 – 235
Taxation on above items 140 – 63 412
Total after tax – 515 – 147 – 822
Attributable to:
Shareholders of Novartis AG – 514 – 147 – 822
Non-controlling interests – 1

Novartis Annual Report 2016 | 205FINaNcIal RepORTNotes to the Novartis Group consolidated financial statements
9. changes in consolidated equity
9.1) A dividend of CHF 2.70 per share was approved at the 2016 Annual General Meeting (AGM) for the year ended December 31, 2015, resulting in a total dividend payment of USD 6.5 billion in 2016 (2015: the CHF 2.60 per share dividend amounted to USD 6.6 billion, 2014: the CHF 2.45 per share dividend amounted to USD 6.8 billion). The amount available for distribution as a divi-dend to shareholders is based on the available distrib-utable retained earnings of Novartis AG determined in accordance with the legal provisions of the Swiss Code of Obligations.
9.2) During 2016, 12.9 million shares were purchased for USD 1.0 billion (2015: 63.6 million shares for USD 6.1 bil-lion, 2014: 79.2 million shares for USD 6.9 billion). These share purchases comprise of 10.3 million shares, which were repurchased for USD 0.8 billion on the SIX Swiss Exchange second trading line under the CHF 10 billion share buyback approved by the shareholders at the Annual General Meeting (AGM) in 2016, to offset the dilu-tive impact from equity-based participation plans (2015, 49.9 million shares for USD 4.8 billion, and in 2014, 27.0 million shares for USD 2.4 billion repurchased on the SIX Swiss Exchange second trading line under the USD 5 billion share buyback announced in November 2013, which was completed in November 2015). Furthermore, 2.6 million shares were acquired for USD 0.2 billion from employees which were previously granted to them under the respective programs (2015: 4.1 million shares for USD 0.4 billion, 2014: 5.4 million shares for USD 0.5 bil-lion). In 2016 no shares were repurchased on the SIX Swiss Exchange first trading line (2015: 9.6 million shares were repurchased for USD 0.9 billion, 2014: 46.8 million shares for USD 4.1 billion).
9.3) In 2016, Novartis reduced its share capital by can-celling a total of 49.9 million shares which were repur-chased during 2015 on the SIX Swiss Exchange second trading line. In 2015, 29.2 million shares were cancelled which were repurchased during 2013 and 2014. In 2014 no shares were cancelled.
9.4) 4.1 million shares were delivered as a result of options being exercised related to equity-based participation plans and the delivery of treasury shares, which contrib-
uted USD 0.2 billion (2015: 27.0 million shares for USD 1.6 billion, 2014: 41.4 million shares for USD 2.4 billion). The average share price of the shares delivered was signifi-cantly below market price reflecting the strike price of the options exercised.
9.5) Equity-settled share-based compensation is expensed in the consolidated income statement in accordance with the vesting period of the share-based compensation plans. The value for the shares and options granted is credited to consolidated equity over the respective vesting period. In 2016, 9.0 million shares were transferred to associates as part of equity-settled compensation (2015: 11.9 million shares, 2014: 10.3 mil-lion shares). In addition, tax benefits arising from tax deductible amounts exceeding the expense recognized in the income statement are credited to equity.
9.6) During 2016, interests in subsidiaries were acquired. The reduction in equity of USD 7 million rep-resents the excess of the amount paid to non-controlling interest over their carrying value and equity allocation to non-controlling interest due to change in ownership per-centage (2015: nil, 2014: nil).
9.7) In 2014, Novartis entered into an irrevocable, non-dis-cretionary arrangement with a bank to repurchase Novartis own shares on the second trading line under its USD 5 billion share buyback as well as to mitigate dilu-tion from equity-based participation plans. The commit-ment under this arrangement amounted to USD 658 mil-lion as of December 31, 2014, reflecting the expected purchases by the bank under such trading plan over a rolling 90 days period. In 2015, this trading plan was fully executed and expired. As a result, there is no contingent liability related to this plan as of December 31, 2015 and December 31, 2016.
9.8) Changes in non-controlling interests in subsidiaries resulted in a reduction in consolidated equity of USD 10 million in 2015 and USD 120 million in 2014. No change to non-controlling interests in subsidiaries in 2016.

206 | Novartis Annual Report 2016
10. property, plant & equipment
The following table summarizes the movements of property, plant and equipment during 2016:
Machinery
Construction & other
(USD millions) Land Buildings in progress equipment Total
Cost
January 1, 2016 688 12 857 2 810 15 093 31 448
Reclassifications 1 4 630 – 1 226 592
Additions 24 176 1 226 409 1 835
Disposals and derecognitions 2 – 8 – 178 – 19 – 656 – 861
Currency translation effects – 21 – 372 – 111 – 622 – 1 126
December 31, 2016 687 13 113 2 680 14 816 31 296
Accumulated depreciation
January 1, 2016 – 40 – 5 188 – 7 – 10 231 – 15 466
Depreciation charge – 3 – 530 – 956 – 1 489
Accumulated depreciation on disposals and derecognitions 2 5 157 1 630 793
Impairment charge – 3 – 47 – 11 – 61 – 122
Reversal of impairment charge 6 1 13 20
Currency translation effects 1 166 1 441 609
December 31, 2016 – 40 – 5 436 – 15 – 10 164 – 15 655
Net book value at December 31, 2016 647 7 677 2 665 4 652 15 641
Net book value of property, plant & equipment under finance lease contracts 81
commitments for purchases of property, plant & equipment 223
1 Reclassifications between various asset categories due to completion of plant and other equipment under construction2 Derecognition of assets that are no longer used and are not considered to have a significant disposal value or other alternative use
Borrowing costs on new additions to property, plant and equipment eligible for capitalization have been capitalized and amounted to USD 9 million in 2016 (2015: USD 21 million, 2014: USD 20 million). The capitalization rate used to determine the amount of borrowing costs eligible for capitalization is 25% (2015: 25%, 2014: 25%) and the interest rate used is 4% (2015: 4%, 2014: 4%).
The following table summarizes the movements of property, plant and equipment during 2015:
Machinery
Construction & other
(USD millions) Land Buildings in progress equipment Total
Cost
January 1, 2015 744 11 312 3 985 15 387 31 428
Reclassifications 1 12 1 833 – 2 601 756
Additions 4 408 1 665 442 2 519
Disposals and derecognitions 2 – 41 – 332 – 59 – 704 – 1 136
Currency translation effects – 31 – 364 – 180 – 788 – 1 363
December 31, 2015 688 12 857 2 810 15 093 31 448
Accumulated depreciation
January 1, 2015 – 30 – 5 093 – 37 – 10 285 – 15 445
Depreciation charge – 3 – 462 – 1 005 – 1 470
Accumulated depreciation on disposals and derecognitions 2 2 246 32 594 874
Impairment charge – 12 – 37 – 4 – 82 – 135
Reversal of impairment charge 9 46 55
Currency translation effects 3 149 2 501 655
December 31, 2015 – 40 – 5 188 – 7 – 10 231 – 15 466
Net book value at December 31, 2015 648 7 669 2 803 4 862 15 982
Net book value of property, plant & equipment under finance lease contracts 85
commitments for purchases of property, plant & equipment 359
1 Reclassifications between various asset categories due to completion of plant and other equipment under construction2 Derecognition of assets that are no longer used and are not considered to have a significant disposal value or other alternative use

Novartis Annual Report 2016 | 207FINaNcIal RepORTNotes to the Novartis Group consolidated financial statements
11. Goodwill and intangible assets
The following table summarizes the movements of goodwill and intangible assets in 2016:
Goodwill Intangible Assets other than Goodwill
Acquired Currently Other
research & Alcon marketed Marketing intangible
(USD millions) Total development brand name Technologies products know-how assets Total
Cost
January 1, 2016 31 585 4 119 2 980 6 563 33 385 5 960 1 341 54 348
Impact of business combinations 56 690 451 1 141
Reclassifications 1 – 158 6 152
Additions 599 223 156 978
Disposals and derecognitions 2 – 23 – 464 – 130 – 617
Currency translation effects – 260 – 77 – 15 – 594 – 27 – 713
December 31, 2016 31 381 5 150 2 980 6 548 33 007 5 960 1 492 55 137
Accumulated amortization
January 1, 2016 – 411 – 650 – 3 070 – 14 221 – 1 192 – 998 – 20 131
Reclassifications 225 – 225
Amortization charge – 576 – 2 926 – 238 – 121 – 3 861
Accumulated impairments on disposals
and derecognitions2 22 390 123 535
Impairment charge – 490 – 96 – 5 – 591
Currency translation effects 10 7 9 215 20 251
December 31, 2016 – 401 – 886 – 3 637 – 16 863 – 1 430 – 981 – 23 797
Net book value at December 31, 2016 30 980 4 264 2 980 2 911 16 144 4 530 511 31 340
1 Reclassifications between various asset categories as a result of product launches of acquired In-Process Research & Development and completion of software development.2 Derecognitions of assets that are no longer used or being developed and are not considered to have a significant disposal value or other alternative use.
The following table summarizes the allocation of the net book values of goodwill and intangible assets by report-ing segment at December 31, 2016:
Goodwill Intangible Assets other than Goodwill
Acquired Currently Other
research & Alcon marketed Marketing intangible
(USD millions) Total development brand name Technologies products know-how assets Total
Innovative Medicines 15 010 3 512 11 12 821 276 16 620
Sandoz 7 669 613 563 1 904 25 3 105
Alcon 8 293 139 2 337 1 419 4 530 196 8 621
Corporate 8 2 980 14 2 994
Net book value at December 31, 2016 30 980 4 264 2 980 2 911 16 144 4 530 511 31 340
The Innovative Medicines, Sandoz and Alcon divisions’ cash generating units, to which goodwill are allocated, each comprise a group of smaller cash generating units. The valuation method of the recoverable amount of the cash generating units, to which goodwill is allocated, is based on the fair value less costs of disposal.
The Alcon brand name is a Corporate asset with an indefinite life. The intangible asset is allocated to Corpo-rate as it is used to market the Alcon-branded products of both the Alcon Division and the Ophthalmology busi-ness franchise of the Innovative Medicines Division. Net sales of these products together are the grouping of cash generating units, which is used to determine the recoverable amount. The valuation method is based on the fair value less costs of disposal.
The following assumptions are used in the calcula-tions:
Innovative
(As a percentage) Medicines Sandoz Alcon Corporate
Terminal growth rate 1.5 2.0 3.0 2.5
Discount rate (post-tax) 6.5 6.5 6.5 6.5
The Alcon terminal growth rate assumption of 3% is higher than the expected inflation rate of the medical device industry, and more specifically the ophthalmic sub-segment of the industry. The growth rates are expected to exceed such long-term inflation rate, due to the impact of the demographic trend of the aging popu-lation to which Alcon’s products are prescribed is grow-ing faster than the general population.
The discount rates for all Divisions consider the Group’s weighted average cost of capital, adjusted to approximate the weighted average cost of capital of a comparable market participant.

208 | Novartis Annual Report 2016
The fair value less costs of disposal, for all groupings of cash generating units containing goodwill or indefinite life intangible assets, is reviewed for the impact of rea-sonably possible changes in key assumptions. In partic-ular we considered an increase in the discount rate, a decrease in the terminal growth rate and certain nega-tive impacts on the forecasted cash flows. These rea-sonably possible changes in key assumptions did not indicate an impairment.
Note 1, Significant accounting policies – Impairment of goodwill and intangible assets, provides additional dis-closures on how the Group performs goodwill and intan-gible asset impairment testing.
In 2016, intangible asset impairment charges for continuing operations amounted to USD 591 million (USD 522 million in the Innovative Medicines Division, USD 65 million in the Sandoz Division and USD 4 mil-lion in the Alcon Division).
In 2015, intangible asset impairment charges in con-tinuing operations amounted to USD 206 million (USD 178 million in the Innovative Medicines Division and USD 27 million in the Sandoz Division and USD 1 million in the Alcon Division).
In 2016, there was no reversal of prior year impair-ment charges (2015: USD 40 million).
The following table summarizes the movements of goodwill and intangible assets in 2015:
Goodwill Intangible Assets other than Goodwill
Acquired Currently Other
research & Alcon marketed Marketing intangible
(USD millions) Total development brand name Technologies products know-how assets Total
Cost
January 1, 2015 29 737 2 843 2 980 6 658 20 916 5 960 1 251 40 608
Impact of business combinations 2 438 730 12 970 15 13 715
Reclassifications 1 – 36 5 31
Additions 881 217 61 1 159
Disposals and derecognitions 2 – 294 – 26 – 4 – 324
Currency translation effects – 590 – 5 – 95 – 697 – 13 – 810
December 31, 2015 31 585 4 119 2 980 6 563 33 385 5 960 1 341 54 348
Accumulated amortization
January 1, 2015 – 426 – 685 – 2 539 – 11 684 – 954 – 914 – 16 776
Amortization charge – 580 – 2 848 – 238 – 89 – 3 755
Accumulated impairments on disposals
and derecognitions,2 reclassifications 68 241 4 313
Impairment charge – 33 – 164 – 9 – 206
Reversal of impairment charge 40 40
Currency translation effects 15 49 194 10 253
December 31, 2015 – 411 – 650 – 3 070 – 14 221 – 1 192 – 998 – 20 131
Net book value at December 31, 2015 31 174 3 469 2 980 3 493 19 164 4 768 343 34 217
1 Reclassifications between various asset categories as a result of product launches of acquired In-Process Research & Development and completion of software development.2 Derecognitions of assets that are no longer used or being developed and are not considered to have a significant disposal value or other alternative use.
The following table summarizes the allocation of the net book values of goodwill and intangible assets by report-ing segment at December 31, 2015:
Goodwill1 Intangible Assets other than Goodwill1
Acquired Currently Other
research & Alcon marketed Marketing intangible
(USD millions) Total development brand name Technologies products know-how assets Total
Innovative Medicines 15 110 2 770 13 15 698 192 18 673
Sandoz 7 802 490 631 2 308 22 3 451
Alcon 8 255 202 2 849 1 158 4 768 111 9 088
Corporate 7 7 2 980 18 3 005
Net book value at December 31, 2015 31 174 3 469 2 980 3 493 19 164 4 768 343 34 217
1 Restated to reflect the new divisional structures and product transfers between divisions, announced on January 27, 2016

Novartis Annual Report 2016 | 209FINaNcIal RepORTNotes to the Novartis Group consolidated financial statements
12. Deferred tax assets and liabilities
Pensions and
Property, other benefit Tax loss Other assets,
plant & Intangible obligations carry- provisions
(USD millions) equipment assets of associates Inventories forwards and accruals Total
Gross deferred tax assets at January 1, 2016 216 611 1 730 3 821 62 2 866 9 306
Gross deferred tax liabilities at January 1, 2016 – 639 – 3 962 – 401 – 565 – 5 – 1 132 – 6 704
Net deferred tax balance at January 1, 2016 – 423 – 3 351 1 329 3 256 57 1 734 2 602
at January 1, 2016 – 423 – 3 351 1 329 3 256 57 1 734 2 602
Credited/(charged) to income – 13 1 057 53 373 55 – 517 1 008
Charged to equity – 44 – 44
Credited/(charged) to other comprehensive income 140 – 2 138
Impact of business combinations 4 – 400 23 37 – 336
Other movements 27 6 – 41 20 11 – 14 9
Net deferred tax balance at December 31, 2016 – 405 – 2 688 1 481 3 649 146 1 194 3 377
Gross deferred tax assets at December 31, 2016 224 1 331 1 839 4 160 146 2 597 10 297
Gross deferred tax liabilities at December 31, 2016 – 629 – 4 019 – 358 – 511 – 1 403 – 6 920
Net deferred tax balance at December 31, 2016 – 405 – 2 688 1 481 3 649 146 1 194 3 377
After offsetting USD 263 million of deferred tax assets and liabilities within the same tax jurisdiction the balance amounts to:
Deferred tax assets at December 31, 2016 10 034
Deferred tax liabilities at December 31, 2016 – 6 657
Net deferred tax balance at December 31, 2016 3 377
Gross deferred tax assets at January 1, 2015 268 214 1 749 3 470 85 2 587 8 373
Gross deferred tax liabilities at January 1, 2015 – 639 – 4 242 – 410 – 578 – 3 – 606 – 6 478
Net deferred tax balance at January 1, 2015 – 371 – 4 028 1 339 2 892 82 1 981 1 895
At January 1, 2015 – 371 – 4 028 1 339 2 892 82 1 981 1 895
Credited/(charged) to income – 57 296 83 376 – 22 – 132 544
Charged to equity – 216 – 216
(Charged)/credited to other comprehensive income – 63 29 – 34
Impact of business combinations 390 – 13 377
Other movements 5 – 9 – 30 – 12 – 3 85 36
Net deferred tax balance at December 31, 2015 – 423 – 3 351 1 329 3 256 57 1 734 2 602
Gross deferred tax assets at December 31, 2015 216 611 1 730 3 821 62 2 866 9 306
Gross deferred tax liabilities at
December 31, 2015 – 639 – 3 962 – 401 – 565 – 5 – 1 132 – 6 704
Net deferred tax balance at December 31, 2015 – 423 – 3 351 1 329 3 256 57 1 734 2 602
After offsetting USD 349 million of deferred tax assets and liabilities within the same tax jurisdiction the balance amounts to:
Deferred tax assets at December 31, 2015 8 957
Deferred tax liabilities at December 31, 2015 – 6 355
Net deferred tax balance at December 31, 2015 2 602

210 | Novartis Annual Report 2016
Deferred tax assets of USD 4.8 billion (2015: USD 3.9 billion) and deferred tax liabilities of USD 5.9 billion (2015: USD 5.8 billion) are expected to have an impact on cur-rent taxes payable after more than twelve months.
At December 31, 2016, unremitted earnings of USD 63 billion (2015: USD 65 billion) have been retained by con-solidated entities for reinvestment. Therefore, no provi-sion is made for income taxes that would be payable upon the distribution of these earnings. If these earnings were remitted, an income tax charge could result based on the tax statutes currently in effect.
(USD millions) 2016 2015
Temporary differences on which no
deferred tax has been provided as they
are permanent in nature related to:
– Investments in subsidiaries 2 358 2 644
– Goodwill from acquisitions – 28 189 – 28 202
The gross value of tax-loss carry-forwards that have, or have not, been capitalized as deferred tax assets, with their expiry dates is as follows:
(USD millions) Not capitalized Capitalized 2016 total
One year 21 12 33
Two years 30 5 35
Three years 50 5 55
Four years 75 3 78
Five years 73 25 98
More than five years 405 1 913 2 318
Total 654 1 963 2 617
In 2016, USD 19 million (2015: USD 13 million, 2014: USD 14 million) of tax-loss carry-forwards expired.
(USD millions) Not capitalized Capitalized 2015 total
One year 22 39 61
Two years 80 25 105
Three years 37 6 43
Four years 54 7 61
Five years 222 222
More than five years 465 712 1 177
Total 880 789 1 669
Deferred tax assets related to taxable losses of relevant Group entities are recognized to the extent it is consid-ered probable that future taxable profits will be available against which such losses can be utilized in the foresee-able future.
13. Financial and other non-current assets
Financial assets
(USD millions) 2016 2015
Available-for-sale long-term
financial investments 1 096 1 263
Long-term receivables from customers 231 317
Minimum lease payments
from finance lease agreements 147 216
Contingent consideration receivables 1 586 550
Long-term loans, advances
and security deposits 136 120
Total financial assets 2 196 2 466
1 Note 29 provides additional disclosures related to contingent consideration.
Other non-current assets
(USD millions) 2016 2015
Deferred compensation plans 451 409
Prepaid post-employment benefit plans 47 36
Other non-current assets 200 156
Total other non-current assets 698 601

Novartis Annual Report 2016 | 211FINaNcIal RepORTNotes to the Novartis Group consolidated financial statements
Minimum finance lease payments
The following table shows the receivables of the gross investments in finance leases and the net present value of the minimum lease payments, as well as unearned finance income, related to surgical equipment lease arrange-ments. The finance income is recorded in “Other income”.
2016
Total Unearned
future interest Present
(USD millions) payments income value Provision Net book value
Not later than one year 1 91 – 5 86 – 2 84
Between one and five years 182 – 16 166 – 37 129
Later than five years 63 – 4 59 – 41 18
Total 336 – 25 311 – 80 231
1 The current portion of the minimum lease payments is recorded in trade receivables or other current assets (to the extent not yet invoiced).
2015
Total Unearned
future interest Present
(USD millions) payments income value Provision Net book value
Not later than one year 1 89 – 6 83 – 1 82
Between one and five years 221 – 17 204 – 10 194
Later than five years 61 – 5 56 – 34 22
Total 371 – 28 343 – 45 298
1 The current portion of the minimum lease payments is recorded in trade receivables or other current assets (to the extent not yet invoiced).
14. Inventories(USD millions) 2016 2015
Raw material, consumables 705 658
Work in progress 2 700 2 905
Finished products 2 850 2 663
Total inventories 6 255 6 226
The amount of inventory recognized as an expense in “Cost of goods sold” in the consolidated income state-ments during 2016 amounted to USD 10.3 billion (2015: USD 10.5 billion, 2014: USD 11.6 billion).
The group recognized inventory provisions amount-ing to USD 283 million (2015: USD 356 million, 2014: USD 1.1 billion) and reversed inventory provisions amount-ing to USD 67 million (2015: USD 148 million, 2014: USD 379 million).
The reversals mainly result from the release of prod-ucts initially requiring additional quality control inspec-tions and from the reassessment of inventory values manufactured prior to regulatory approval but for which approval was subsequently received.

212 | Novartis Annual Report 2016
15. Trade receivables
(USD millions) 2016 2015
Total gross trade receivables 8 364 8 322
Provisions for doubtful trade receivables – 162 – 142
Total trade receivables, net 8 202 8 180
The following table summarizes the movement in the provision for doubtful trade receivables:
(USD millions) 2016 2015 2014
January 1 – 142 – 156 – 195
Provisions for doubtful
trade receivables related to
discontinued operations 15
Provisions for doubtful
trade receivables charged
to the consolidated
income statement – 76 – 68 – 92
Utilization or reversal
of provisions for doubtful
trade receivables 54 71 101
Currency translation effects 2 11 15
December 31 – 162 – 142 – 156
The following sets forth the trade receivables that are not overdue as specified in the payment terms and con-ditions established with Novartis customers as well as an analysis of overdue amounts and related provisions for doubtful trade receivables:
(USD millions) 2016 2015
Not overdue 7 386 7 318
Past due for not more than one month 262 265
Past due for more than one month
but less than three months 223 255
Past due for more than three months
but less than six months 185 193
Past due for more than six months
but less than one year 145 156
Past due for more than one year 163 135
Provisions for doubtful trade receivables – 162 – 142
Total trade receivables, net 8 202 8 180
Trade receivable balances include sales to drug whole-salers, retailers, private health systems, government agencies, managed care providers, pharmacy benefit managers and government-supported healthcare sys-tems. Novartis continues to monitor sovereign debt issues and economic conditions in Greece, Italy, Portu-gal, Spain, Brazil, Russia and Saudi Arabia and evaluates trade receivables in these countries for potential collec-tion risks. The majority of the outstanding trade receiv-ables from these closely monitored countries are due directly from local governments or from govern-ment-funded entities except for Russia, which are due from private entities. Deteriorating credit and economic conditions and other factors in these closely monitored countries have resulted in, and may continue to result in an increase in the average length of time that it takes to collect these trade receivables and may require Novartis to re-evaluate the collectability of these trade receiv-ables in future periods.
The gross trade receivables from these closely mon-itored countries at December 31, 2016 amount to USD 1.5 billion (2015: USD 1.6 billion), of which USD 82 million are past due for more than one year (2015: USD 80 million) and for which provisions of USD 62 million have been recorded (2015: USD 56 million). At December 31, 2016 amounts past due for more than one year are not signif-icant in any of these countries on a standalone basis.
Trade receivables include amounts denominated in the following major currencies:
(USD millions) 2016 2015
US dollar (USD) 3 432 3 311
Euro (EUR) 1 366 1 536
Japanese yen (JPY) 567 740
Chinese yuan (CNY) 264 244
British pound (GBP) 160 187
Swiss franc (CHF) 135 124
Other currencies 2 278 2 038
Total trade receivables, net 8 202 8 180

Novartis Annual Report 2016 | 213FINaNcIal RepORTNotes to the Novartis Group consolidated financial statements
16. Marketable securities, commodities, time deposits, derivative financial instruments and cash and cash equivalentsMarketable securities, commodities, time deposits and derivative financial instruments
(USD millions) 2016 2015
Debt securities 306 339
Equity securities 6
Fund investments 31 33
Total available-for-sale marketable securities 337 378
Commodities 94 86
Time deposits with original maturity
more than 90 days 108 164
Derivative financial instruments 230 143
Accrued interest on debt securities and time deposits 1 2
Total marketable securities, commodities, time deposits and derivative financial instruments 770 773
At December 31, 2016 all debt securities are denominated in USD except for USD 12 million in EUR (2015: USD 22 million) and USD 10 million in JPY (2015: nil).
Cash and cash equivalents
(USD millions) 2016 2015
Current accounts 1 912 3 074
Time deposits and short-term investments with original maturity less than 90 days 5 095 1 600
Total cash and cash equivalents 7 007 4 674
17. Other current assets
(USD millions) 2016 2015
VAT receivable 521 609
Withholding tax recoverable 282 97
Income tax receivables 156 171
Prepaid expenses
– Third parties 692 617
– Associated companies 5 4
Receivables from associated companies 7 31
Other receivables and current assets 1 034 1 463
Total other current assets 2 697 2 992

214 | Novartis Annual Report 2016
18. Details of share capital and share movements
The following table shows the movement in the share capital:
Movement Movement Movement
(USD millions) Jan 1, 2014 in year Dec 31, 2014 in year Dec 31, 2015 in year Dec 31, 2016
Share capital 1 001 1 001 – 10 991 – 19 972
Treasury shares – 89 – 14 – 103 2 – 101 25 – 76
Outstanding share capital 912 – 14 898 – 8 890 6 896
The following table shows the movement in the shares:
Movement Movement Movement
(Number of shares) 1 Jan 1, 2014 in year Dec 31, 2014 in year Dec 31, 2015 in year Dec 31, 2016
Total Novartis shares 2 706 193 000 2 706 193 000 – 29 200 000 2 676 993 000 – 49 878 180 2 627 114 820
Total treasury shares – 280 108 692 – 27 458 051 – 307 566 743 4 468 560 – 303 098 183 50 042 376 – 253 055 807
Total outstanding shares 2 426 084 308 – 27 458 051 2 398 626 257 – 24 731 440 2 373 894 817 164 196 2 374 059 013
1 All shares are voting shares, which are registered, authorized, issued and fully paid
In 2016, Novartis reduced its share capital by cancelling a total of 49.9 million shares which were repurchased during 2015 on the SIX Swiss Exchange second trading line.
During 2016, 13.1 million treasury shares were deliv-ered as a result of options being exercised and physical share deliveries related to equity-based participation plans (2015: 38.9 million shares, 2014: 51.7 million shares). Novartis repurchased 10.3 million shares on the SIX Swiss Exchange second trading line under the CHF 10 billion share buyback approved at the Annual General Meeting (AGM) in 2016, to offset the dilutive impact from equity-based participation plans (in 2015 49.9 million shares and in 2014 27.0 million shares under the USD 5 billion share buyback announced in November 2013,
which was completed in November 2015). In addition, 2.6 million shares were acquired from employees, which were previously granted to them under the respective programs (2015: 4.1 million, 2014: 5.4 million). No shares were repurchased on the SIX Swiss Exchange first trad-ing line in 2016 (2015: 9.6 million, 2014: 46.8 million). With these transactions, the total number of shares outstand-ing was increased by 0.2 million shares in 2016 (2015: reduction of 24.7 million shares; 2014: reduction of 27.5 million shares). At December 31, 2016, the market maker held 10 million written call options, originally issued as part of the share-based compensation for associates that have not yet been exercised. The weighted average exercise price of these options is USD 62.40 and they have contractual lives of 10 years.

Novartis Annual Report 2016 | 215FINaNcIal RepORTNotes to the Novartis Group consolidated financial statements
19. Non-current financial debt
(USD millions) 2016 2015
Straight bonds 17 285 17 193
Liabilities to banks and other financial institutions 1 708 706
Finance lease obligations 82 87
Total, including current portion of non-current financial debt 18 075 17 986
Less current portion of non-current financial debt – 178 – 1 659
Total non-current financial debts 17 897 16 327
Straight bonds
5.125% USD 3 000 million bond 2009/2019 of Novartis Securities Investment Ltd., Hamilton, Bermuda,
issued at 99.822% 2 995 2 993
4.25% EUR 1 500 million bond 2009/2016 of Novartis Finance S.A., Luxembourg, Luxembourg, issued at 99.757% 1 639
4.4% USD 1 000 million bond 2010/2020 of Novartis Capital Corporation, New York, United States, issued at 99.237% 996 994
2.4% USD 1 500 million bond 2012/2022 of Novartis Capital Corporation, New York, United States, issued at 99.225% 1 490 1 488
3.7% USD 500 million bond 2012/2042 of Novartis Capital Corporation, New York, United States, issued at 98.325% 489 488
3.4% USD 2 150 million bond 2014/2024 of Novartis Capital Corporation, New York, United States, issued at 99.287% 2 132 2 130
4.4% USD 1 850 million bond 2014/2044 of Novartis Capital Corporation, New York, United States, issued at 99.196% 1 823 1 823
0.75% EUR 600 million bond 2014/2021 of Novartis Finance S.A., Luxembourg, Luxembourg, issued at 99.134% 625 650
1.625% EUR 600 million bond 2014/2026 of Novartis Finance S.A., Luxembourg, Luxembourg, issued at 99.697% 627 652
0.25% CHF 500 million bond 2015/2025 of Novartis AG, Basel, Switzerland, issued at 100.64% 491 507
0.625% CHF 550 million bond 2015/2029 of Novartis AG, Basel, Switzerland, issued at 100.502% 539 557
1.050% CHF 325 million bond 2015/2035 of Novartis AG, Basel, Switzerland, issued at 100.479% 318 329
3.0% USD 1 750 million bond 2015/2025 of Novartis Capital Corporation, New York, United States, issued at 99.010% 1 728 1 726
4.0% USD 1 250 million bond 2015/2045 of Novartis Capital Corporation, New York, United States, issued at 98.029% 1 217 1 217
0.125% EUR 1 250 million bond 2016/2023 of Novartis Finance S.A., Luxembourg, Luxembourg, issued at 99.127% 1 299
0.625% EUR 500 million bond 2016/2028 of Novartis Finance S.A., Luxembourg, Luxembourg, issued at 98.48% 516
Total straight bonds 17 285 17 193
1 Average interest rate 0.4% (2015: 0.7%)
The following tables provide a breakdown of total non-current financial debt, including current portion by maturity and currency:
Breakdown by maturity:
(USD millions) 2016 2015
2016 1 659
2017 178 170
2018 345 335
2019 3 168 3 161
2020 1 000 998
2021 628 658
After 2021 12 756 11 005
Total 18 075 17 986
Breakdown by currency:
(USD millions) 2016 2015
USD 12 952 12 946
EUR 3 092 2 981
JPY 683 665
CHF 1 348 1 393
Others 1
Total 18 075 17 986
The following table shows the comparison of balance sheet and fair value of total non-current financial debt, including current portion:
2016 2016 2015 2015
(USD millions) Balance sheet Fair values Balance sheet Fair values
Straight bonds 17 285 17 943 17 193 17 770
Others 790 790 793 793
Total 18 075 18 733 17 986 18 563
The fair values of straight bonds are determined by quoted market prices. Other financial debts are recorded at notional amounts which are a reasonable approxima-tion of the fair values.
The following table shows the collateralized non-cur-rent financial debt and pledged assets:
(USD millions) 2016 2015
Total amount of collateralized
non-current financial debts 7
Total net book value of property,
plant & equipment pledged as
collateral for non-current financial debts 94 112

216 | Novartis Annual Report 2016
The Group’s collateralized non-current financial debt consists of loan facilities at usual market conditions.
The percentage of fixed rate financial debt to total financial debt was 76% at December 31, 2016, and 82% at December 31, 2015.
Financial debts, including current financial debts, contain only general default covenants. The Group is in compliance with these covenants.
The average interest rate on total financial debt in 2016 was 2.8% (2015: 2.9%).
20. provisions and other non-current liabilities(USD millions) 2016 2015
Accrued liability for employee benefits:
Defined benefit pension plans 1 4 490 3 952
Other long-term employee benefits
and deferred compensation 545 507
Other post-employment benefits 1 1 005 960
Environmental remediation provisions 708 791
Provisions for product liabilities,
governmental investigations
and other legal matters 264 451
Contingent consideration 2 840 712
Other non-current liabilities 618 671
Total provisions and
other non-current liabilities 8 470 8 044
1 Note 25 provides additional disclosures related to post-employment benefits.2 Note 29 provides additional disclosures related to contingent consideration.
Novartis believes that its total provisions are adequate based upon currently available information. However, given the inherent difficulties in estimating liabilities in this area, Novartis may incur additional costs beyond the amounts provided. Management believes that such addi-tional amounts, if any, would not be material to the Group’s financial condition but could be material to the results of operations or cash flows in a given period.
Environmental remediation provisions
The material components of the environmental remedi-ation provisions consist of costs to sufficiently clean and refurbish contaminated sites to the extent necessary, and to treat, and where necessary, continue surveillance at sites where the environmental remediation exposure is less significant. The provision recorded at December 31, 2016, totals USD 0.8 billion (2015: USD 0.9 billion), of which USD 65 million (2015: USD 80 million) is current.
A substantial portion of the environmental remedia-tion provisions relate to the remediation of Basel regional landfills in the adjacent border areas in Switzerland, Ger-many and France. The provisions are re-assessed on a yearly basis and are adjusted as necessary.
In the United States, Novartis has been named under federal legislation (the Comprehensive Environmental Response, Compensation and Liability Act of 1980, as
amended) as a potentially responsible party (PRP) in respect of certain sites. Novartis actively participates in, or monitors, the clean-up activities at the sites in which it is a PRP. The provision takes into consideration the number of other PRPs at each site, and the identity and financial position of such parties in light of the joint and several nature of the liability.
The following table shows the movements in the envi-ronmental liability provisions during 2016, 2015 and 2014:
(USD millions) 2016 2015 2014
January 1 871 923 1 061
Cash payments – 75 – 52 – 33
Releases – 5 – 6
Additions 1 6 2
Currency translation effects – 24 – 1 – 101
December 31 773 871 923
Less current provision – 65 – 80 – 95
Non-current environmental
remediation provisions
at December 31 708 791 828
The expected timing of the related cash outflows as of December 31, 2016, is currently projected as follows:
Expected
(USD millions) cash outflows
Due within two years 127
Due later than two years, but within five years 76
Due later than five years, but within ten years 427
Due after ten years 143
Total environmental remediation liability provisions 773
Provisions for product liabilities, governmental investigations and other legal matters
Novartis has established provisions for certain product liabilities, governmental investigations and other legal matters, where a potential cash outflow is probable and Novartis can make a reliable estimate of the amount of the outflow. These provisions represent the Group’s cur-rent best estimate of the total financial effect for the mat-ters described below and for other less significant mat-

Novartis Annual Report 2016 | 217FINaNcIal RepORTNotes to the Novartis Group consolidated financial statements
ters. Potential cash outflows reflected in a provision may be fully or partially off-set by insurance in certain circum-stances.
Novartis has not established provisions for potential damage awards for certain additional legal claims against its subsidiaries if Novartis currently believes that a pay-ment is either not probable or cannot be reliably esti-mated. In total, these not-provisioned-for matters include fewer than 500 individual product liability cases and cer-tain other legal matters. Plaintiffs’ alleged claims in these matters, which Novartis does not believe to be entirely remote but which do not fulfill the conditions for the establishment of provisions, currently aggregate to, according to Novartis’ current best belief, approximately USD 1.5 billion. In addition, in some of these matters there are claims for punitive or multiple (treble) damages, civil penalties and disgorgement of profits that in Novartis’ view are either wholly or partially unspecified or wholly or partially unquantifiable at present; the Group believes that information about these amounts claimed by plain-tiffs generally is not meaningful for purposes of deter-mining a reliable estimate of a loss that is probable or more than remote.
A number of other legal matters are in such early stages or the issues presented are such that the Group has not made any provisions since it cannot currently estimate either a potential outcome or the amount of any potential losses. For these reasons, among others, the Group generally is unable to make a reliable estimate of possible loss with respect to such cases. It is therefore not practicable to provide information about the poten-tial financial impact of those cases.
There might also be cases for which the Group was able to make a reliable estimate of the possible loss or the range of possible loss, but the Group believes that publication of such information on a case-by-case basis would seriously prejudice the Group’s position in ongo-ing legal proceedings or in any related settlement dis-cussions. Accordingly, in such cases, information has been disclosed with respect to the nature of the contin-gency, but no disclosure is provided as to an estimate of the possible loss or range of possible loss.
Note 28 contains additional information on contin-gencies.
Summary of significant legal proceedings
The following is a summary of significant legal proceed-ings to which Novartis or its subsidiaries are a party or were a party and that concluded in 2016.
Investigations and related litigationsSOUTHeRN DISTRIcT OF NeW YORK (S.D.N.Y.) MaRKeTING pRacTIceS INVeSTIGaTION aND lITIGaTION
In April 2013, the US government filed a civil complaint in intervention to an individual qui tam action against Novartis Pharmaceuticals Corporation (NPC) in the United States District Court (USDC) for the S.D.N.Y. involving several of NPC’s cardiovascular medications. The suit is related to a previously disclosed 2011 inves-tigation of the United States Attorney’s Office (USAO)
for the S.D.N.Y. relating to marketing practices, including the remuneration of healthcare providers, in connection with three NPC products (Lotrel, Starlix and Valturna). The complaint, as subsequently amended, asserts fed-eral False Claims Act and common law claims with respect to speaker programs and other promotional activities for certain NPC cardiovascular medications allegedly serving as mechanisms to provide kickbacks to healthcare professionals (HCPs). It seeks unspecified damages, which according to the complaint are “sub-stantial”, including treble damages and maximum civil penalties per claim, as well as disgorgement of Novartis profits from the alleged unlawful conduct. In August 2013, New York State filed a civil complaint in interven-tion asserting similar claims. Neither government com-plaint in intervention adopted the individual relator’s claims with respect to off-label promotion of Valturna, which were subsequently dismissed with prejudice by the court. The individual relator continues to litigate the kickback claims on behalf of other states and municipal-ities. NPC vigorously contests the S.D.N.Y., New York State and individual claims, both as to alleged liability and amount of damages and penalties.
S.D.N.Y. / WeSTeRN DISTRIcT OF NeW YORK HealTHcaRe FRaUD INVeSTIGaTION
In 2011, Alcon Laboratories, Inc. (ALI) received a sub-poena from the United States Department of Health & Human Services relating to an investigation into allega-tions of healthcare fraud. The subpoena requests the production of documents relating to marketing practices, including the remuneration of healthcare providers, in connection with certain ALI products (Vigamox, Neva-nac, Omnipred, Econopred; surgical equipment). ALI is cooperating with this investigation.
S.D.N.Y. GILENYA MaRKeTING pRacTIceS INVeSTIGaTIONIn 2013, NPC received a civil investigative demand from the USAO for the S.D.N.Y. requesting the production of documents and information relating to marketing prac-tices for Gilenya, including the remuneration of health-care providers in connection therewith. NPC is cooper-ating with this investigation.
NeW YORK STaTe pRIcING pOlIcY INVeSTIGaTIONIn November 2014, ALI received a civil subpoena from the New York state attorney general relating to an inves-tigation into a unilateral pricing policy program. ALI is cooperating with this investigation.
eaSTeRN DISTRIcT OF peNNSYlVaNIa (e.D. pa.) GeNeRIc pRIcING aNTITRUST INVeSTIGaTION, aNTITRUST claSS acTIONS
In March 2016, Sandoz Inc. received a subpoena from the Antitrust Division of the US Department of Justice (DoJ) requesting documents related to the marketing and pricing of generic pharmaceutical products sold by Sandoz Inc. and its subsidiaries, including Fougera Phar-maceuticals, Inc. (Fougera), and related communications with competitors. Sandoz Inc. is cooperating with this investigation which it believes to be part of a broader inquiry into industry practice.

218 | Novartis Annual Report 2016
Since September 2016, Sandoz Inc., Fougera, Lek Pharmaceuticals d.d., Novartis AG (NAG), and Novartis International AG (NIAG) have been sued alongside other generic pharmaceutical companies in more than 25 puta-tive class actions in the S.D.N.Y. and E.D. Pa. alleging that defendants engaged in anti-competitive conduct with regard to the sales of various generic drugs, asserting violations of federal and state antitrust laws as well as consumer protection laws. The claims are being vigor-ously contested.
DISTRIcT OF MaSSacHUSeTTS (D. MaSS.) cHaRITaBle FOUNDaTION INVeSTIGaTION
In May 2016, NPC received a subpoena from the USAO for the D. Mass. requesting documents related to NPC’s support of 501(c)(3) organizations that provide co-pay-ment assistance to Medicare patients who are pre-scribed Novartis medicines, as well as related to pricing strategies related to Gleevec. NPC is cooperating with this investigation which it believes to be part of a broader inquiry into industry practices.
LUCENTIS/aVaSTIN® MaTTeRS IN ITalY aND FRaNceIn 2013, the Italian Competition Authority (ICA) opened an investigation to assess whether Novartis Farma S.p.A., NAG, F. Hoffmann-La Roche AG, Genentech Inc. and Roche S.p.A. colluded to artificially preserve the market positions of Avastin® and Lucentis. In March 2014, the ICA imposed a fine equivalent to USD 125 million on NAG and Novartis Farma S.p.A. and a fine on F. Hoffmann-La Roche AG and Roche S.p.A. equivalent to USD 122 mil-lion. As required by Italian law, Novartis paid the ICA fine, subject to the right to later claim recoupment. Novartis is appealing against the fines before the Consiglio di Stato (CdS) which has referred five legal questions to the European Court of Justice (ECJ) for a preliminary ruling. The ECJ’s judgment is pending. Novartis is also appealing at the CdS the decision of the Tribunale amministrativo regionale del Lazio which has upheld a decision by the Italian Medicines Agency to include Avas-tin® in a list of drugs to be reimbursed off-label for age-re-lated macular degeneration (AMD). The CdS has referred four legal questions to the ECJ for a preliminary ruling. The ECJ’s judgment is pending. In the second quarter of 2014, the Italian Ministry of Health indicated in a letter that it intended to seek a total equivalent of approxi-mately USD 1.2 billion in damages from Novartis and Roche entities based on the above allegations, and in the first quarter of 2015 the Lombardia region sent a pay-ment request equivalent to approximately USD 61 mil-lion.
In 2014, the French Competition Authority opened an investigation against Novartis Groupe France with respect to the French market for anti-vascular endothe-lial growth factor (VEGF) products indicated for the treat-ment of wet AMD. Novartis’ appeal against the Authori-ty’s inspection was rejected by the Supreme Court in 2016. Also in France, Novartis’ appeal is pending against a temporary recommendation of use and reimbursement of off-label Avastin® for neovascular AMD by hospital ophthalmologists, in force since September 2015.
Novartis’ appeal against the decree on which the recom-mendation is based was rejected by the Administrative Supreme Court in 2016. In both Italy and France, Novartis believes that allowing the widespread off-label use and reimbursement of Avastin®, despite the presence of avail-able licensed alternatives, would result in a breach of applicable regulations. Novartis continues to vigorously contest all claims in Italy and France.
JapaN INVeSTIGaTIONIn December 2015, trial started against a former Novartis Pharma K.K. (NPKK) employee, and also NPKK under the dual liability concept in Japanese law, over allega-tions brought by the Tokyo District Public Prosecutor Office in two counts for alleged manipulation of data in sub-analysis publications of the Kyoto Heart Study regarding valsartan. The charges against NPKK are sub-ject to a maximum total fine of JPY 4 million.
SOUTH KORea INVeSTIGaTIONIn Q1 2016, the Seoul Western District Prosecutor initi-ated a criminal investigation into, among other things, allegations that Novartis Korea utilized medical journals to provide inappropriate economic benefits to HCPs. In September 2016, a criminal trial began concerning the Prosecutor’s allegations that Novartis Korea utilized medical journals to provide inappropriate economic ben-efits to HCPs. Separately, upon request by the Prosecu-tor’s office, the Korea Fair Trade Commission is investi-gating whether sponsorships by Novartis Korea of HCPs to overseas academic conferences constitute a violation of fair trade laws. In addition, the Ministry of Food and Drug Safety and the Ministry of Health and Welfare are also reviewing the matter and are evaluating administra-tive sanctions on Novartis Korea.
GReece INVeSTIGaTIONNovartis is investigating allegations of potentially inap-propriate economic benefits in Greece to HCPs and oth-ers. Information has been provided to the Greek author-ities by Novartis (Hellas) S.A.C.I. related to these allegations. Novartis is also responding to document requests from the US Securities and Exchange Commis-sion (SEC) and DoJ in connection with such allegations and is cooperating with their investigation.
Antitrust class actionsSOlODYN®
Since the third quarter of 2013, seventeen putative class action complaints and three other complaints have been filed against manufacturers of the brand drug Solodyn® and its generic equivalent, including Sandoz Inc. The cases have been consolidated and transferred for pre-trial purposes to the federal district court in Mass. The plaintiffs purport to represent direct and indirect pur-chasers of Solodyn® branded products and assert vio-lations of federal and state antitrust laws, including alle-gations in connection with separate settlements by Medicis with each of the other defendants, including San-doz Inc., of patent litigation relating to Solodyn®. Sandoz is vigorously contesting the claims.

Novartis Annual Report 2016 | 219FINaNcIal RepORTNotes to the Novartis Group consolidated financial statements
cONTacT leNSeSSince March 2015, more than 50 putative class action complaints have been filed in several courts across the US naming contact-lens manufacturers, including ALI, and alleging violations of federal antitrust law as well as state antitrust, consumer protection and unfair compe-tition laws of various states in connection with the sale of contact lenses. The cases have been consolidated in the Middle District of Florida by the Judicial Panel on Multidistrict Litigation and the claims are being vigor-ously contested.
GLEEVEC
Since June 2015, NPC, Novartis Corporation (NC) and NAG have been sued in five putative antitrust class action complaints alleging that Novartis unlawfully obtained delayed generic entry of Gleevec. The initial complaint seeking to prevent Novartis from enforcing the agree-ment with Sun Pharmaceuticals was dismissed in the first quarter of 2016. Plaintiffs have filed a consolidated amended complaint in the D. Mass. seeking damages on behalf of all indirect purchasers of Gleevec in 24 differ-ent states based on alleged violations of the respective state antitrust laws. In November 2016, a similar class action complaint was filed in the same court on behalf of direct purchasers of Gleevec. The claims are being vigorously contested.
eNOXapaRINIn October 2015, Sandoz and Momenta Pharmaceuticals were sued in a putative antitrust class action in federal court in Tennessee alleging that Momenta and Sandoz engaged in anticompetitive conduct with regard to sales of enoxaparin, and the same allegations were made by Amphastar in a lawsuit filed in federal court in California and subsequently moved to federal court in Mass. (San-doz, Momenta Pharmaceuticals and Amphastar are cur-rently engaged in patent litigation concerning enoxapa-rin in federal court in Mass.). The claims are being vigorously contested.
Other mattersaVeRaGe WHOleSale pRIce (aWp) lITIGaTIONLawsuits have been brought, the latest in February 2016, by various US state governmental entities and private parties against various pharmaceutical companies, including certain Sandoz entities and NPC, alleging that they fraudulently overstated the AWP that is or has been used by payors, including state Medicaid agencies, to calculate reimbursements to healthcare providers. In 2016, the Mississippi Supreme Court denied Sandoz’ motion for reconsideration of its decision which had upheld the USD 30 million Chancery Court verdict against Sandoz. NPC remains a defendant in an action brought by the state of Illinois and in a putative class action brought by private payors in New Jersey, and San-doz is a defendant in an individual and a putative class action in Pennsylvania. The claims are being vigorously contested.
RECLAST/ACLASTA pRODUcT lIaBIlITY lITIGaTIONNPC is a defendant in 22 US product liability actions involving Reclast and alleging atypical femur fracture injuries and osteonecrosis of the jaw, most of which are in New Jersey state or federal court coordinated with claims against other bisphosphonate manufacturers. After the Saskatchewan and Alberta putative class actions were discontinued by plaintiffs in 2016 and 2017, one Canadian putative class action brought against numerous bisphosphonate manufacturers including NPC, Novartis Pharmaceuticals Canada Inc. and NIAG remains pending in Quebec. All claims are being vigor-ously contested.
ORIel lITIGaTIONIn October 2013, Shareholder Representative Services LLC filed a complaint in New York State Court against Sandoz Inc., two affiliates and two former officers of San-doz AG asserting various common law and statutory con-tract, fraud and negligent misrepresentation claims aris-ing out of Sandoz Inc.’s purchase of Oriel Therapeutics, Inc. In March 2015, the court dismissed all parties and claims but for a breach of contract claim against Sandoz Inc. Sandoz Inc. continues to vigorously contest the claim.
eYe DROp pRODUcTS cONSUMeR claSS acTIONSSince November 2012, six putative consumer fraud class action litigations were commenced against Alcon (and in four of those cases, Sandoz) in federal courts in the Southern Districts of Illinois and Florida and the Districts of Missouri, Mass. and New Jersey (D.N.J.). They claim that Alcon’s, Sandoz’s and many other manufacturer defendants’ eye drop products for glaucoma were deceptively designed so that the drop dosage is more than necessary to be absorbed in the eye or there is too much solution in each bottle for the course of one-month’s treatment, leading to wastage and higher costs to patient consumers. Three cases remain pending against Alcon (and two against Sandoz) at the US Court of Appeals for the Third and Sixth Circuits and in the D. Mass. and D.N.J. Novartis is vigorously contesting the claims.
Concluded legal mattersNORTHeRN DISTRIcT OF TeXaS (NDTX) INVeSTIGaTIONIn 2016, Alcon achieved civil settlements with the US Office of Foreign Assets Control (OFAC) and with the US Department of Commerce’s Bureau of Industry and Security to pay a total of USD 9.4 million in civil mone-tary penalties. The settlements relate to the sale and export of medical end-use surgical and pharmaceutical products that were licensable and in fact had been pre-viously and subsequently licensed by OFAC for Alcon. The USAO for the NDTX has advised Alcon that it has closed its investigation without taking action.
cHINa INVeSTIGaTIONSAfter reports of Chinese government investigations of other pharmaceutical companies for alleged improper use of certain China-based travel agencies to reward healthcare providers, Novartis commenced an internal

220 | Novartis Annual Report 2016
investigation in 2013 concerning its local affiliates’ rela-tionships with China-based travel agencies (and other vendors). In March 2016, NAG achieved a civil settlement with the SEC to pay USD 25 million to settle charges that it violated the internal controls and books-and-records provisions of the Foreign Corrupt Practices Act, without admitting or denying the findings. Novartis also agreed for two years to report to the SEC on the status of its remediation and anti-corruption compliance.
ITalY MF59 INVeSTIGaTIONIn May 2014, the public prosecutor of Siena had initiated a criminal investigation with respect to allegations that the transfer price of the adjuvant MF59 was unlawfully marked up. The investigation concerned whether the Focetria vaccine sold to the government was over-priced and whether the Italian Ministry of Health paid an inflated amount in a dispute settlement relating to the supply of Focetria during the 2009 pandemic. Having found no ele-ments to sustain the charges at trial, in 2016 the Judicial Authority of Siena issued a decree of dismissal of the investigation.
MeTOclOpRaMIDe pRODUcT lIaBIlITY lITIGaTIONSandoz is a defendant, along with numerous brand and generic manufacturers of Reglan® (metoclopramide), in 376 product liability actions in the state courts in Penn-sylvania and California claiming that the use of metoclo-pramide caused personal injuries including tardive dys-kinesia. All cases are in the process of being resolved through voluntary dismissal or settlement, the payment of which is not material to Novartis.
TEKTURNA/RASILEZ/VALTURNA pRODUcT lIaBIlITY lITIGaTION
NPC and certain other Novartis affiliates had been defen-dants in 12 individual lawsuits pending in the USDC for the D.N.J., and one in Alberta, Canada, claiming that treatment with Tekturna, Rasilez and/or Valturna caused renal failure, kidney disease or stroke. In 2016, the D.N.J. cases have been resolved through settlement, the pay-ment of which was not material to Novartis. The remain-ing Alberta case is being vigorously contested, but is not material to Novartis.
EQUA aRBITRaTIONIn 2013, Sanofi K.K. had commenced an arbitration against NPKK relating to the termination of a co-promo-tion agreement in Japan of Equa (Galvus), which is used to treat type 2 diabetes. The matter was concluded in 2016.
QUI TAM acTIONSNPC was a defendant in a relator’s qui tam action in the USDC for the E.D. Pa. asserting federal and state False Claims Act claims relating to certain alleged marketing practices involving Elidel®. The federal government and several states had declined to intervene in the relator’s action. In 2016, NPC settled this matter with the relator, the federal government and eight states for an amount not material to Novartis.
In 2006, 2010 and 2012, qui tam complaints were filed in D. Mass. asserting various federal False Claims Act and state claims relating to certain alleged improper mar-keting practices involving Xolair against various Novartis, Genentech and Roche entities. In 2011, the US and var-ious state governments declined to intervene in the rela-tors’ actions, and closed their investigations. In June 2014, the relator in the 2010 action voluntarily dismissed his complaint with prejudice; the US and various states subsequently consented to the dismissal. In the second quarter of 2016, the Court of Appeals affirmed a deci-sion by the USDC for the D. Mass. which had dismissed with prejudice all federal claims in connection with alleged improper marketing practices asserted by the relators; the Court of Appeals remanded relators’ state claims to the district court for dismissal without preju-dice. Two similar complaints were filed in October 2016 in state courts in New York and Mass. Novartis contin-ues to vigorously contest the claims, but they are not material to Novartis.
eMplOYMeNT acTIONIn March 2015, ALI and NC had been sued in an individ-ual and collective action filed in the S.D.N.Y. The claims had asserted inter alia gender discrimination, pay dis-crimination and retaliation at Alcon. In 2016, the parties have finalized a class settlement and settlements for the individual plaintiffs for amounts that were not material to Novartis.
Summary of product liability, governmental investigations and other legal matters provision movements
(USD millions) 2016 2015 2014
January 1 1 194 849 924
Provisions related to
discontinued operations – 37
Cash payments – 811 – 256 – 454
Releases of provisions – 239 – 223 – 135
Additions to provisions 243 832 549
Currency translation effects 8 – 8 2
December 31 395 1 194 849
Less current portion – 131 – 743 – 328
Non-current product
liabilities, governmental
investigations and other
legal matters provisions
at December 31 264 451 521
Novartis believes that its total provisions for investiga-tions, product liability, arbitration and other legal matters are adequate based upon currently available information. However, given the inherent difficulties in estimating lia-bilities, there can be no assurance that additional liabil-ities and costs will not be incurred beyond the amounts provided.

Novartis Annual Report 2016 | 221FINaNcIal RepORTNotes to the Novartis Group consolidated financial statements
21. current financial debt and derivative financial instruments(USD millions) 2016 2015
Interest-bearing accounts of associates
payable on demand 1 601 1 645
Bank and other financial debt 836 1 185
Commercial paper 3 174 1 085
Current portion of non-current
financial debt 178 1 659
Fair value of derivative financial
instruments 116 30
Total current financial debt and
derivative financial instruments 5 905 5 604
The consolidated balance sheet amounts of current financial debt, other than the current portion of non-cur-rent financial debt, approximate the estimated fair value due to the short-term nature of these instruments.
The weighted average interest rate on the bank and other current financial debt (including employee depos-its from the compensation of associates employed by Swiss entities) was 3.0% in 2016 and 2.7% in 2015.
Details on commercial papers are provided in Note 29 – Liquidity risk.
22. provisions and other current liabilities
(USD millions) 2016 2015
Taxes other than income taxes 547 551
Restructuring provisions 222 260
Accrued expenses for goods and services received but not invoiced 880 1 124
Accruals for royalties 550 550
Provisions for deductions from revenue 4 183 3 790
Accruals for compensation and benefits including social security 1 993 1 932
Environmental remediation liabilities 65 80
Deferred income 287 385
Provisions for product liabilities, governmental investigations and other legal matters 1 131 743
Accrued share-based payments 199 209
Contingent considerations 2 49 78
Other payables 722 1 017
Total provisions and other current liabilities 9 828 10 719
1 Note 20 provides additional disclosures related to legal provisions2 Note 29 provides additional disclosures related to contingent consideration
Provisions are based upon management’s best estimate and adjusted for actual experience. Such adjustments to the historic estimates have not been material.

222 | Novartis Annual Report 2016
Provisions for deductions from revenue
The following table shows the movement of the provi-sions for deductions from revenue:
(USD millions) 2016 2015 2014
January 1 3 790 3 533 4 182
Provisions related to
discontinued operations – 234
Impact of business combinations 3
Additions 16 622 15 603 14 119
Payments/utilizations – 16 189 – 15 218 – 13 907
Changes in offset against
gross trade receivables 10 50 – 420
Currency translation effects – 50 – 181 – 207
December 31 4 183 3 790 3 533
Restructuring provisions movements
(USD millions) 2016 2015 2014
January 1 260 333 174
Provisions related to
discontinued operations – 4
Additions 343 399 504
Cash payments – 260 – 435 – 295
Releases – 66 – 36 – 52
Transfers – 76
Currency translation effects 21 – 1 6
December 31 222 260 333
In 2016, additions to provisions of USD 343 million were mainly related to the following reorganizations:— The Innovative Medicines division Pharmaceuticals
business unit, realigned its operations to improve its operating agility, to focus resources on key growth drivers. Furthermore, research is realigning and focusing its operations resulting in redundancies from the consolidation of certain research teams and the outsourcing of certain activities to qualified third party vendors.
— Alcon division launched several initiatives to improve its efficiencies resulting in redundancies, as it realigns its operations to focus on its surgical and vision care business franchises after the transfer of its ophthal-mic pharmaceuticals business to Innovative Medi-cines division.
— Sandoz division launched an initiative to reallocate resources to priority, high growth and higher profit-ability countries.
— Various groupwide initiatives to simplify organiza-tional structure, including consolidation of manufac-turing sites and support services.
In 2015, additions to provisions of USD 399 million were mainly related to the following reorganizations:— Innovative Medicines division implemented a restruc-
turing program targeted at efficiency gains in the busi-ness franchises, other than in Oncology. It also initi-ated initiatives related to the integration of the oncology business acquired from GSK.
— Alcon division extended its initiative started in the prior year to realize productivity opportunities.
— Various groupwide initiatives to simplify the organiza-tional structure, mainly related to the manufacturing footprint and support services.
In 2014, additions to provisions of USD 504 million were mainly related to the following reorganizations:— Innovative Medicines division initiatives in drug devel-
opment targeted at establishing an organizational model for its activities that allows for greater focus on high priority programs in specialty medicines, more flexibility to adapt to changes in the portfolio, and which strengthens operational excellence. Further-more Innovative Medicines implemented a program targeted at increasing operational leverage.
— Alcon division established an initiative to realize pro-ductivity opportunities.
— Various groupwide initiatives to simplify organiza-tional structure, including consolidation of manufac-turing sites and support services.

Novartis Annual Report 2016 | 223FINaNcIal RepORTNotes to the Novartis Group consolidated financial statements
23. Details to the consolidated cash flow statements
23.1) Adjustments for non-cash items from continuing operations
(USD millions) 2016 2015 2014
Taxes 1 119 1 106 1 545
Depreciation, amortization and impairments on:
Property, plant & equipment 1 591 1 550 1 630
Intangible assets 4 452 3 921 3 052
Financial assets 1 132 104 69
Income from associated companies – 703 – 266 – 1 918
Gains on disposal of property, plant & equipment, intangible, financial and other non-current assets, net – 935 – 869 – 622
Equity-settled compensation expense 671 773 744
Change in provisions and other non-current liabilities 956 1 642 1 490
Net financial expense 1 154 1 109 735
Total 8 437 9 070 6 725
1 Including unrealized fair value gains
23.2) Cash flows from changes in working capital and other operating items included in operating cash flow from continuing operations
(USD millions) 2016 2015 2014
(Increase) in inventories – 235 – 482 – 506
(Increase) in trade receivables – 229 – 513 – 367
(Decrease)/Increase in trade payables – 587 378 142
Change in other net current assets and other operating cash flow items 974 – 246 106
Total – 77 – 863 – 625

224 | Novartis Annual Report 2016
23.3) Cash flows arising from acquisitions and divestments of businesses
The following is a summary of the cash flow impact of acquisitions and divestments. The most significant trans-actions are described in Note 2.
2016 2016 2015 2015 2014 2014
(USD millions) acquisitions Divestments Acquisitions Divestments Acquisitions Divestments
Property, plant & equipment 1 000 145
Currently marketed products – 451 – 12 970 646 – 234 91
(Acquired)/divested research & development – 690 – 730 13 – 248
Technologies 113
Other intangible assets – 15 86
Financial and other assets including deferred tax assets 1 – 39 – 555 40 – 53 7
Inventories – 4 893 – 1 87
Trade receivables and other current assets – 1 – 3 529 – 3 159
Cash and cash equivalents – 1 – 25 311 – 2
Current and non-current financial debts – 601
Trade payables and other liabilities including deferred tax liabilities 372 212 – 841 186 – 50
Net identifiable assets (acquired) or divested – 814 – 14 086 2 189 – 355 439
Currency translation effects 98 – 3
Acquired/(divested) liquidity 1 25 – 479 2
Fair value of previously held equity interests 64
Subtotal – 749 – 14 061 1 808 – 353 436
Refinancing of intercompany financial debt, net 578
Goodwill 1 – 56 – 2 438 1 042 – 131 267
Divestment gain 7 401 876
Taxes paid and other portfolio transformation related cash flows – 748 – 1 337 – 566
Receivables and payables contingent consideration, net 2 84 – 8 – 519 153
Other payments and deferred consideration, net – 44
(Deferred)/prepaid portion of sales price 3 – 49 47
Net cash flows – 765 – 748 – 16 507 8 924 – 331 1 060
Of which:
Net cash flows used in/from discontinued operations – 748 8 924 1 060
Net cash flows used in continuing operations – 765 – 16 507 – 331
1 2014 Acquisitions include an adjustment regarding a previous acquisition to deferred tax assets of USD 21 million and goodwill of USD 135 million.2 The contingent consideration of the 2016 Transcend Medical, Inc. acquisition amounted to USD 92 million. Of this amount, USD 60 million has been paid in 2016.3 Divestments include USD 49 million proceeds for the divestment of the Animal Health business received in 2014.
Notes 2 and 24 provide further information regarding acquisitions and divestments of businesses. All acquisitions were for cash.
23.4) Cash flows from discontinued operations
(USD millions) 2016 2015 2014
cash flows used in operating activities – 188 – 1
Purchase of property, plant & equipment – 41 – 223
Proceeds from sales of property, plant & equipment 1 4
Purchase of intangible assets – 18
Proceeds from sales of intangible assets 79
Purchase of financial and other non-current assets, net – 2 – 13
Divestments of businesses 1 – 748 8 924 1 060
cash flows used in/from investing activities – 748 8 882 889
Total net cash flows used in/from discontinued operations – 748 8 694 888
1 2016 includes mainly payments for capital gains taxes and other payments related to the portfolio transformation transaction. 2015 includes proceeds of USD 10 925 million reduced by USD 2 001 million, for payments of capital gains taxes, transaction-related costs and purchase price adjustments. 2014 includes the net proceeds related to the divestment of the blood transfusion diagnostics unit.

Novartis Annual Report 2016 | 225FINaNcIal RepORTNotes to the Novartis Group consolidated financial statements
24. acquisitions of businesses
Fair value of assets and liabilities arising from acquisitions
(USD millions) 2016 2015 2014
Currently marketed products 451 12 970 234
Acquired research & development 690 730 248
Other intangible assets 15
Deferred tax assets 1 39 555 53
Inventories 4 1
Trade receivables and other current assets 1 3 3
Cash and cash equivalents 1 25 2
Payables and other liabilities including deferred tax liabilities – 372 – 212 – 186
Net identifiable assets acquired 814 14 086 355
Acquired liquidity – 1 – 25 – 2
Goodwill 1 56 2 438 131
Net assets recognized as a result of business combinations 869 16 499 484
1 2014 Acquisitions include an adjustment regarding a previous acquisition to deferred tax assets of USD 21 million and goodwill of USD 135 million.
Note 2 details significant acquisition of businesses, which in 2016 were Transcend and Selexys, in 2015, were the GSK Oncology products, Spinifex and Admune and in 2014 CoStim and WaveTech. The goodwill arising out of these acquisitions is attributable to buyer specific syn-
ergies, assembled workforce and to the accounting for deferred tax liabilities on the acquired assets. Goodwill of USD 18 million from 2016 and of USD 2.4 billion from 2015 is tax deductible.

226 | Novartis Annual Report 2016
25. post-employment benefits for associates
Defined benefit plans
In addition to the legally required social security schemes, the Group has numerous independent pension and other post-employment benefit plans. In most cases, these plans are externally funded in entities that are legally separate from the Group. For certain Group companies, however, no independent plan assets exist for the pen-sion and other post-employment benefit obligations of associates. In these cases the related unfunded liability is included in the balance sheet. The defined benefit obli-gations (DBOs) of all major pension and other post-em-ployment benefit plans are reappraised annually by inde-pendent actuaries. Plan assets are recognized at fair value. The major plans are based in Switzerland, the United States, the United Kingdom, Germany and Japan, which represent 95% of the Group’s total DBO for pen-sion plans. Details of the plans in the two most signifi-cant countries of Switzerland and the US are provided below.
Swiss-based pension plans represent the most sig-nificant portion of the Group’s total DBO and plan assets. For the active insured members born on or after Janu-ary 1, 1956, or having joined the plans after December 31, 2010, the benefits are partially linked to the contribu-tions paid into the plan. Certain features of Swiss pen-sion plans required by law preclude the plans being cat-egorized as defined contribution plans. These factors include a minimum interest guarantee on retirement sav-ings accounts, a pre-determined factor for converting the accumulated savings account balance into a pension and embedded death and disability benefits.
All benefits granted under Swiss-based pension plans are vested, and Swiss legislation prescribes that the employer has to contribute a fixed percentage of an associate’s pay to an external pension fund. Additional employer contributions may be required whenever the plan’s statutory funding ratio falls below a certain level. The associate also contributes to the plan. The pension plans are run by separate legal entities, each governed by a Board of Trustees, which, for the principal plans, consists of representatives nominated by Novartis and the active insured associates. The Boards of Trustees are responsible for the plan design and asset investment strategy.
In June 2015, the Board of Trustees of the Novartis Swiss Pension Fund agreed to adjust the annuity con-version rate at retirement with effect from January 1, 2016. This amendment did not have an impact on exist-ing members receiving benefits or on plan members born before January 1, 1956. This amendment resulted in a net pre-tax curtailment gain of USD 110 million (CHF 103 million) recognized in the 2015 financial statements.
The US pension plans represent the second largest component of the Group’s total DBO and plan assets. The principal plans (Qualified Plans) are funded, whereas plans providing additional benefits for executives (Res-toration Plans) are unfunded. Employer contributions are required for Qualified Plans whenever the statutory fund-ing ratio falls below a certain level. Furthermore, associ-ates in the US are covered under other post-employment benefit plans and post-retirement medical plans.

Novartis Annual Report 2016 | 227FINaNcIal RepORTNotes to the Novartis Group consolidated financial statements
The following tables are a summary of the funded and unfunded defined benefit obligation for pension and other post- employment benefit plans of associates at December 31, 2016 and 2015:
Pension plans Other post-employment benefit plans
(USD millions) 2016 2015 2016 2015
Benefit obligation at January 1 23 402 24 178 1 132 1 253
Current service cost 437 451 35 32
Interest cost 390 399 48 46
Past service costs and settlements – 73 – 138
Administrative expenses 29 23
Remeasurement losses/(gains) arising from changes in financial assumptions 1 299 – 16 46 – 34
Remeasurement (gains) arising from changes in demographic assumptions – 7 – 41 – 26 – 30
Experience-related remeasurement losses/(gains) 117 56 – 33 – 110
Currency translation effects – 896 – 358 7 – 14
Benefit payments – 1 250 – 1 406 – 51 – 50
Contributions of associates 207 223
Effect of acquisitions, divestments or transfers – 41 31 39
Benefit obligation at December 31 23 614 23 402 1 158 1 132
Fair value of plan assets at January 1 19 536 20 434 172 199
Interest income 293 300 6 6
Return on plan assets excluding interest income 742 – 286 – 1 – 6
Currency translation effects – 757 – 223
Novartis Group contributions 542 494 27 23
Contributions of associates 207 223
Settlements – 77 – 3
Benefit payments – 1 250 – 1 406 – 51 – 50
Effect of acquisitions, divestments or transfers – 11 3
Fair value of plan assets at December 31 19 225 19 536 153 172
Funded status – 4 389 – 3 866 – 1 005 – 960
limitation on recognition of fund surplus at January 1 – 50 – 58
Change in limitation on recognition of fund surplus (incl. exchange rate differences) 12
Interest income on limitation of fund surplus – 4 – 4
limitation on recognition of fund surplus at December 31 – 54 – 50
Net liability in the balance sheet at December 31 – 4 443 – 3 916 – 1 005 – 960
The reconciliation of the net liability from January 1 to December 31 is as follows:
Pension plans Other post-employment benefit plans
(USD millions) 2016 2015 2016 2015
Net liability at January 1 – 3 916 – 3 802 – 960 – 1 054
Current service cost – 437 – 451 – 35 – 32
Net interest expense – 101 – 103 – 42 – 40
Administrative expenses – 29 – 23
Past service costs and settlements – 4 135
Remeasurements – 667 – 285 12 168
Currency translation effects 139 135 – 7 14
Novartis Group contributions 542 494 27 23
Effect of acquisitions, divestments or transfers 30 – 28 – 39
Change in limitation on recognition of fund surplus 12
Net liability at December 31 – 4 443 – 3 916 – 1 005 – 960
amounts recognized in the consolidated balance sheet
Prepaid benefit cost 47 36
Accrued benefit liability – 4 490 – 3 952 – 1 005 – 960

228 | Novartis Annual Report 2016
The following table shows a breakdown of the DBO for pension plans by geography and type of member and the breakdown of plan assets into the geographical locations in which they are held:
2016 2015
Rest of Rest of
(USD millions) Switzerland United States the world Total Switzerland United States the world Total
Benefit obligation at December 31 15 436 3 783 4 395 23 614 15 453 3 783 4 166 23 402
Thereof unfunded 739 497 1 236 736 466 1 202
By type of member
Active 6 426 891 1 460 8 777 6 196 990 1 392 8 578
Deferred pensioners 831 1 515 2 346 909 1 489 2 398
Pensioners 9 010 2 061 1 420 12 491 9 257 1 884 1 285 12 426
Fair value of plan assets at December 31 13 958 2 282 2 985 19 225 14 347 2 358 2 831 19 536
Funded status – 1 478 – 1 501 – 1 410 – 4 389 – 1 106 – 1 425 – 1 335 – 3 866
The following table shows the principal weighted average actuarial assumptions used for calculating defined ben-efit plans and other post- employment benefits of associates:
Pension plans Other post-employment benefit plans
2016 2015 2014 2016 2015 2014
Weighted average assumptions used to determine
benefit obligations at December 31
Discount rate 1.4% 1.8% 1.8% 4.2% 4.4% 3.8%
Expected rate of pension increase 0.4% 0.4% 0.4%
Expected rate of salary increase 2.2% 2.9% 3.2%
Interest on savings account 0.5% 0.8% 0.9%
Current average life expectancy
for a 65-year-old male/female 22/24 years 21/24 years 21/24 years 21/23 years 21/23 years 22/24 years
Changes in the aforementioned actuarial assumptions can result in significant volatility in the accounting for the Group’s pension plans in the consolidated financial state-ments. This can result in substantial changes in the Group’s other comprehensive income, long-term liabili-ties and prepaid pension assets.
The DBO is significantly impacted by assumptions regarding the rate that is used to discount the actuari-ally determined post-employment benefit liability. This rate is based on yields of high-quality corporate bonds in the country of the plan. Decreasing corporate bond yields decrease the discount rate, so that the DBO increases and the funded status decreases.
In Switzerland, an increase in the DBO due to lower discount rates is slightly offset by lower future benefits expected to be paid on the associate’s savings account where the assumption on interest accrued changes in line with the discount rate.
The impact of decreasing interest rates on a plan’s assets is more difficult to predict. A significant part of the plan assets is invested in bonds. Bond values usually rise when interest rates decrease and may therefore par-tially compensate for the decrease in the funded status. Furthermore, pension assets also include significant holdings of equity instruments. Share prices tend to rise when interest rates decrease and therefore often coun-teract the negative impact of the rising defined benefit obligation on the funded status (although the correlation of interest rates with equities is not as strong as with bonds, especially in the short term).
The expected rate for pension increases significantly affects the DBO of most plans in Switzerland, Germany and the United Kingdom. Such pension increases also decrease the funded status, although there is no strong correlation between the value of the plan assets and pension/inflation increases.
Assumptions regarding life expectancy significantly impact the DBO. An increase in longevity increases the DBO. There is no offsetting impact from the plan assets, as no longevity bonds or swaps are held by the pension funds. Generational mortality tables are used where this data is available.
The following table shows the sensitivity of the defined benefit pension obligation to the principal actu-arial assumptions for the major plans in Switzerland, the United States, the United Kingdom, Germany and Japan on an aggregated basis:
Change in 2016 year-end
(USD millions) defined benefit pension obligation
25 basis point increase in discount rate – 767
25 basis point decrease in discount rate 814
1 year increase in life expectancy 830
25 basis point increase in rate of pension increase 524
25 basis point decrease in rate of pension increase – 130
25 basis point increase of interest on savings account 65
25 basis point decrease of interest on savings account – 64
25 basis point increase in rate of salary increase 69
25 basis point decrease in rate of salary increase – 72

Novartis Annual Report 2016 | 229FINaNcIal RepORTNotes to the Novartis Group consolidated financial statements
The healthcare cost trend rate assumptions used for other post- employment benefits are as follows:
2016 2015 2014
Healthcare cost trend rate
assumed for next year 7.0% 7.5% 7.0%
Rate to which the cost trend
rate is assumed to decline 5.0% 5.0% 5.0%
Year that the rate reaches
the ultimate trend rate 2022 2022 2021
The following table shows the weighted average plan asset allocation of funded defined benefit pension plans at December 31, 2016 and 2015:
Pension plans
Long-term
(as a percentage) target 2016 2015
Equity securities 15–40 31 34
Debt securities 20–60 35 35
Real estate 5–20 15 14
Alternative investments 0–20 15 14
Cash and other investments 0–15 4 3
Total 100 100
Cash and most of the equity and debt securities have a quoted market price in an active market. Real estate and alternative investments, which include hedge fund and private equity investments, usually do not have a quoted market price.
The strategic allocation of assets of the different pen-sion plans is determined with the objective of achieving an investment return that, together with the contributions paid by the Group and its associates, is sufficient to main-tain reasonable control over the various funding risks of the plans. Based upon the market and economic envi-ronments, actual asset allocations may temporarily be permitted to deviate from policy targets. The asset allo-cation currently includes investments in shares of
Novartis AG, which, at December 31, 2016 totaled 11 mil-lion shares with a market value of USD 0.8 billion (2015: 11 million shares with a market value of USD 1.0 billion). The weighted average duration of the defined benefit obligation is 14.5 years (2015: 14.1 years).
The Group’s ordinary contribution to the various pen-sion plans is based on the rules of each plan. Additional contributions are made whenever this is required by stat-ute or law (i.e., usually when statutory funding levels fall below pre-determined thresholds). The only significant plans that are foreseen to require additional funding are those in the United Kingdom.
The expected future cash flows in respect of pension and other post-employment benefit plans at December 31, 2016, were as follows:
Other post-
employment
(USD millions) Pension plans benefit plans
Novartis Group contributions
2017 (estimated) 434 62
expected future benefit payments
2017 1 262 63
2018 1 209 65
2019 1 208 67
2020 1 208 69
2021 1 198 70
2022–2026 5 882 361
Defined contribution plans
In many subsidiaries associates are covered by defined contribution plans. Contributions charged to the 2016 consolidated income statement for the defined contri-bution plans were USD 338 million (2015: USD 359 mil-lion; 2014: USD 348 million). The 2015 and 2014 amount excludes USD 1 million and USD 14 million, respectively, related to discontinued operations.
26. equity-based participation plans for associatesThe expense related to all equity-based participation plans in the 2016 consolidated income statement was USD 846 million (2015: USD 968 million; 2014: USD 1.1 billion), resulting in total liabilities arising from equi-ty-based payment transactions of USD 199 million (2015: USD 209 million; 2014: USD 277 million, of which USD 248 million was recognized in continuing operations). In 2015 and 2014, out of the total expense an amount of USD 903 million and USD 1.0 billion was recognized in continuing operations and USD 65 million and USD 124 million was recognized in discontinued operations.
Equity-based participation plans can be separated into the following plans:
Annual Incentive
The Annual Incentive of the Novartis Group CEO and the other Executive Committee members is paid 50% in cash in February or March of the year following the perfor-mance period, and 50% in Novartis restricted shares or Restricted Share Units (RSUs) that are granted in Janu-ary of the year following the performance period, deferred and restricted for three years. In 2016, this Annual Incentive was extended to Novartis Top Leaders (NTLs). The payout will be 70% in cash and 30% in Novartis restricted shares or RSUs. Each restricted share is entitled to voting rights and payment of dividends

230 | Novartis Annual Report 2016
during the vesting period. Each RSU is equivalent to one Novartis share and is converted into one share at the vesting date. RSUs do not carry any dividend, dividend equivalent or voting rights. The executives may elect to also receive their cash incentive partially or fully in shares or share units that will not be subject to vesting condi-tions. In 2016, 396 executives participate in the plan.
Share savings plans
A number of associates in certain countries as well as certain key executives worldwide are encouraged to invest their Annual Incentive, and in the United Kingdom also their salary, in a share savings plan. Under the share savings plan, participants may elect to receive their Annual Incentive fully or partially in Novartis shares in lieu of cash. As a reward for their participation in the share savings plan, at no additional cost to the partici-pant, Novartis matches their investments in shares after a holding period of three or five years.
Novartis currently has three share savings plans:— Worldwide, 35 key executives were invited to partic-
ipate in the Leveraged Share Savings Plan (LSSP) based on their performance in 2015. At the partici-pant’s election, the Annual Incentive is awarded partly or entirely in shares. The elected number of shares was delivered in 2016 and is subject to a holding period of five years. At the end of the holding period, Novartis will match the invested shares at a ratio of 1-to-1 (i.e. one share awarded for each invested share). In the US both the LSSP award and the correspond-ing match are cash settled.
— In Switzerland, the Employee Share Ownership Plan (ESOP) was available to 12 253 associates in 2015. ESOP participants may choose to receive their Annual Incentive (i) 100% in shares, (ii) 50% in shares and 50% in cash or (iii) 100% in cash. After expiration of a three-year holding period for Novartis shares invested under the ESOP, each participant will receive one matching share for every two Novartis shares invested. A total of 6 173 associates chose to receive shares under the ESOP for their performance in 2015 and the invested shares were delivered in 2016.
— In the United Kingdom, 1 540 associates can invest up to 5% of their monthly salary in shares (up to a maximum of GBP 125) and also may be invited to invest all or part of their net Annual Incentive in shares. Two invested shares are matched with one share with a holding period of three years. During 2016, 1 227 participants elected to participate in this plan.
Following the introduction of the new compensation pro-grams in 2014, the Novartis Group CEO and the other Executive Committee members are no longer eligible to participate in the share savings plans. From the 2016 performance period onwards, the NTLs are also no lon-ger eligible to participate in these share savings plans.
Associates may only participate in one of these plans in any given year.
Novartis Equity Plan “Select”
The Equity Plan “Select” is a global equity incentive plan under which eligible associates, including Executive Committee members up to performance year 2013 and NTLs up to performance year 2015, may annually be awarded a grant subject to a three year vesting period. No awards are granted for performance ratings below a certain threshold.
The Equity Plan “Select” currently allows its partici-pants in Switzerland to choose the form of their equity compensation in restricted shares or restricted share units (RSUs). In all other jurisdictions, RSUs are typically granted. Until 2013, participants could also choose to receive part or the entire grant in the form of tradable share options.
Tradable share options expire on their 10th anniver-sary from the grant date. Each tradable share option enti-tles the holder to purchase after vesting (and before the 10th anniversary from the grant date) one Novartis share at a stated exercise price that equals the closing market price of the underlying share at the grant date.
Options under Novartis Equity Plan “Select” outside North AmericaThe following table shows the activity associated with the share options during the period. The weighted aver-age prices in the table below are translated from Swiss Francs into USD at historical rates.
2016 2015
Weighted Weighted
average average
Options exercise Options exercise
(millions) price (USD) (millions) price (USD)
Options outstanding
at January 1 11.7 59.9 16.1 59.2
Sold or exercised – 2.2 61.8 – 4.1 56.7
Forfeited or expired – 0.3 66.0
Outstanding at December 31 9.5 59.4 11.7 59.9
exercisable at December 31 9.5 59.4 7.4 56.4
All share options were granted at an exercise price which was equal to the closing market price of the Group’s shares at the grant date. The weighted average share price at the dates of sale was USD 75.2.
The following table summarizes information about share options outstanding at December 31, 2016:
Options outstanding
Average Weighted
Number remaining average
Range of outstanding contractual exercise
exercise prices (USD) (millions) life (years) price (USD)
45–49 0.7 2.0 46.7
50–54 1.2 3.0 54.4
55–59 4.2 3.2 57.7
65–70 3.4 6.0 66.0
Total 9.5 4.1 59.4

Novartis Annual Report 2016 | 231FINaNcIal RepORTNotes to the Novartis Group consolidated financial statements
Options under Novartis equity plan “Select” for North AmericaThe following table shows the activity associated with the American Depositary Receipts (ADR) options during the period:
2016 2015
Weighted Weighted
ADR average ADR average
options exercise options exercise
(millions) price (USD) (millions) price (USD)
Options outstanding
at January 1 31.9 60.2 44.4 59.6
Sold or exercised – 6.0 61.7 – 11.8 57.8
Forfeited or expired – 0.7 63.3
Outstanding at December 31 25.9 59.9 31.9 60.2
exercisable at December 31 25.9 59.9 19.2 56.3
All ADR options were granted at an exercise price which was equal to the closing market price of the ADRs at the grant date. The weighted average ADR price at the dates of sale or exercise was USD 77.7.
The following table summarizes information about ADR options outstanding at December 31, 2016:
ADR options outstanding
Average Weighted
Number remaining average
Range of outstanding contractual exercise
exercise prices (USD) (millions) life (years) price (USD)
45–49 2.1 2.0 46.4
50–54 2.5 3.0 53.7
55–59 11.0 4.0 58.0
65–69 10.3 6.0 66.1
Total 25.9 4.5 59.9
Long-Term Performance Plans
In 2014, a new Long-Term Performance Plan (LTPP) was introduced for the Novartis Group CEO and other key executives designed to not only drive long-term share-holder value, but also innovation. From 2015 onwards, this LTPP was extended to all NTLs.
The rewards of the LTPP are based on three-year performance objectives focused on financial and inno-vation measures. The financial measure is Novartis Cash Value Added (NCVA). The weighting of this measure is 75%. The NCVA target is approved by the Board of Direc-tors.
The innovation measure is based on an holistic approach under which divisional innovation targets are set at the beginning of the cycle, comprised of up to ten target milestones that represent the most important research and development project milestones for each division. At the end of the performance period, the Research & Development Committee assists the Board of Directors and the Compensation Committee in eval-uating performance against the innovation targets at the end of the cycle. The weighting of this measure is 25%.
Until 2014 (2013 for the Novartis Group CEO and other key executives), the OLTPP was available. The rewards are based on rolling three year performance objectives focused on the Novartis Economic Value Added (NVA). The NVA is calculated based on Group operating income and income from associated compa-nies adjusted for interest, taxes and cost of capital charge. The performance realization of a plan cycle is obtained right after the end of the third plan year by add-ing together the annual NVA realizations of all plan years of the plan cycle. The performance ratio for a plan cycle is obtained by dividing the performance realization for the plan cycle with the performance target for the plan cycle, expressing the result as a percentage. The OLTPP only allows a payout if the actual NVA exceeds prede-termined target thresholds. The payout is capped at 200% of target.
Under the LTPP and OLTPP, participants are granted a target number of Performance Share Units (PSUs) at the beginning of every performance period, which are converted into Novartis shares after the performance period. PSUs granted under the LTPP do not carry vot-ing rights, but do carry dividend equivalents that are rein-vested in additional PSUs and paid at vesting to the extent that performance conditions have been met. PSUs granted under the OLTPP do not carry any dividend, div-idend equivalent or voting rights.
At the end of the three-year performance period, the Compensation Committee adjusts the target number of PSUs earned based on actual performance. PSUs are converted into unrestricted Novartis shares without an additional vesting period.
In 2016, 375 key executives received PSU grants under LTPP. No PSUs were granted in 2016 and 2015 under the OLTPP.
Long-Term Relative Performance Plan
The Long-Term Relative Performance Plan (LTRPP) was introduced in 2014, and is an equity plan for the Novartis Group CEO and other key executives. From 2016 onwards, NTLs are also participating in this plan. For the 2016 grant the target incentive is 125% of base compen-sation for the Novartis Group CEO and ranges from 30% to 80% for other Executive Committee members. It is capped at 200% of target. LTRPP is based on the achievement of long-term Group Total Shareholder Return (TSR) versus our peer group of 12 companies in the healthcare industry over rolling three-year perfor-mance periods. TSR is calculated in USD as share price growth plus dividends over the three-year performance period. The calculation will be based on Bloomberg stan-dard published TSR data, which is publicly available. The position in the peer group determines the payout range.
In 2016, 366 executives received PSU grants under the LTRPP.

232 | Novartis Annual Report 2016
Other share awards
Selected associates, excluding the Executive Commit-tee members, may exceptionally receive Special Share Awards of restricted shares or RSUs. These Special Share Awards provide an opportunity to reward out-standing achievements or exceptional performance and aim at retaining key contributors. They are based on a formal internal selection process, in which the individual performance of each candidate is thoroughly assessed at several management levels. Special Share Awards generally have a five-year vesting period. In exceptional
circumstances, Special Share Awards may be rewarded to attract special expertise and new talents into the organization. These grants are consistent with market practice and Novartis’ philosophy to attract, retain and motivate best-in-class talents around the world.
Worldwide, 532 associates at different levels in the organization were awarded restricted shares and RSUs in 2016.
In addition, in 2016, Board members received unrestricted shares as part of their regular compensa-tion.
Summary of non-vested share movements
The table below provides a summary of non-vested share movements (restricted shares, RSUs and PSUs) for all plans:
2016 2015
Weighted Weighted average average Number fair value at Fair value at Number fair value at Fair value at of shares grante date in grante date in of shares grante date in grante date in in millions USD USD millions in millions USD USD millions
Non-vested shares at January 1 20.1 87.1 1 751 24.2 70.4 1 703
Granted
– Annual incentive 0.1 73.8 7 0.1 96.6 10
– Share savings plans 4.4 78.1 344 5.0 89.6 448
– Select North America 4.8 72.4 348 3.9 98.8 385
– Select outside North America 1.6 74.4 119 1.7 96.7 165
– Long-Term Performance Plan 1.2 79.2 95 0.7 81.0 57
– Long-Term Relative Performance Plan 0.3 58.5 18 0.1 55.8 6
– Other share awards 0.7 65.8 46 0.9 95.1 86
Vested – 10.4 68.8 – 716 – 14.4 67.3 – 969
Forfeited – 1.8 73.1 – 132 – 2.1 66.7 – 140
Non-vested shares at December 31 21.0 89.5 1 880 20.1 87.1 1 751
Alcon, Inc., equity plans granted to associates prior to the merger
At the completion of the merger of Alcon, Inc., into Novartis on April 8, 2011, all awards outstanding under the Alcon equity plans were converted into awards based upon Novartis shares with a conversion factor of 3.0727 as defined in the Merger Agreement. The plans are fully vested.Share options entitle the recipient to purchase Novartis shares at the closing market price of the former Alcon, Inc., share on the day of grant divided by the conversion factor.
Share-settled appreciation rights (SSAR) entitle the participant to receive, in the form of Novartis shares, the difference between the values of the former Alcon, Inc., share at the date of grant, converted into Novartis shares using the conversion factor, and the Novartis share price at the date of exercise.
The following table shows the activity associated with the converted Novartis share options and SSARs during 2016 and 2015:
Weighted Weighted
Number average Number of average
of options exercise SSARs exercise
(millions) price (USD) (millions) price (USD)
Outstanding at
January 1, 2015 0.7 30.1 2.4 35.6
Exercised – 0.5 27.4 – 0.6 32.5
Outstanding at
December 31, 2015 0.2 36.8 1.8 36.6
exercisable at
December 31, 2015 0.2 36.8 1.8 36.6
Outstanding at
January 1, 2016 0.2 36.8 1.8 36.6
Exercised – 0.1 37.6 – 0.4 38.9
Outstanding at
December 31, 2016 0.1 36.0 1.4 35.9
exercisable at
December 31, 2016 0.1 36.0 1.4 35.9

Novartis Annual Report 2016 | 233FINaNcIal RepORTNotes to the Novartis Group consolidated financial statements
27. Transactions with related parties
Genentech/Roche
Novartis has two agreements with Genentech, Inc., USA, a subsidiary of Roche Holding AG which is indirectly included in the consolidated financial statements using equity accounting since Novartis holds 33.3% of the out-standing voting shares of Roche.
LUCENTISNovartis has licensed the exclusive rights to develop and market Lucentis outside the United States for indications related to diseases of the eye. As part of this agreement, Novartis paid Genentech/Roche an initial milestone and shared the cost for the subsequent development by mak-ing additional milestone payments upon the achievement of certain clinical development points and product approval. Novartis also pays royalties on the net sales of Lucentis products outside the United States. In 2016, Lucentis sales of USD 1.8 billion (2015: USD 2.1 billion, 2014: USD 2.4 billion) have been recognized by Novartis.
XOLAIRIn February 2004, Novartis Pharma AG, Genentech, Inc., and Tanox, Inc., finalized a three-party collaboration to govern the development and commercialization of cer-
tain anti-IgE antibodies including Xolair and TNX-901. Under this agreement, all three parties co-developed Xolair. On August 2, 2007, Genentech, Inc. completed the acquisition of Tanox, Inc. and has taken over its rights and obligations. Novartis and Genentech/Roche are co-promoting Xolair in the United States where Genen-tech/Roche records all sales. Novartis records sales outside of the United States.
Novartis markets Xolair and records all sales and related costs outside the United States as well as co-pro-motion costs in the United States. Genentech/Roche and Novartis share the resulting profits from sales in the United States, Europe and other countries, according to agreed profit-sharing percentages. In 2016, Novartis rec-ognized total sales of Xolair of USD 835 million (2015: USD 755 million, 2014: USD 777 million) including sales to them for the United States market.
The net expense for royalties, cost sharing and profit sharing arising out of the Lucentis and Xolair agreements with Genentech/Roche totaled USD 217 million in 2016 (2015: USD 309 million, 2014: USD 536 million).
Furthermore, Novartis has several patent license, supply and distribution agreements with Roche.
Executive Officers and Non-Executive Directors Compensation
During 2016, there were 14 Executive Committee members (“Executive Officers”), including those who stepped down during the year (11 members in 2015 and 14 members in 2014 also including those who stepped down).
The total compensation for members of the Executive Committee and the 13 Non-Executive Directors (12 in 2015, 14 in 2014) using the Group’s accounting policies for equity-based compensation and pension benefits was as follows:
Executive Officers Non-Executive Directors Total
(USD millions) 2016 2015 2014 2016 2015 2014 2016 2015 2014
Benefits other than
equity-based compensation 20.8 17.1 18.3 4.0 4.7 6.2 24.8 21.8 24.5
Post-employment benefits 2.2 1.9 2.1 0.1 2.2 1.9 2.2
Equity-based compensation 46.2 52.9 81.7 4.6 4.4 4.9 50.8 57.3 86.6
Total 69.2 71.9 102.1 8.6 9.1 11.2 77.8 81.0 113.3
During 2016, there was a decrease in the IFRS compen-sation expense for Executive Officers compared to 2015. This was mainly due to lower equity-based compensa-tion expense attributable to lower performance factors, which was partially offset by higher benefits other than equity-based compensation resulting from the increase in the number of Executive Officers.
During 2015, there was a decrease in the IFRS com-pensation expense for Executive Officers compared to 2014 mainly due to the decrease in number of Executive Officers.
The annual incentive award, which is fully included in equity- based compensation even when paid out in cash, is granted in January in the year following the reporting period.
The disclosures required by the Swiss Code of Obli-gations and in accordance with the Swiss Ordinance against Excessive Compensation in Stock Exchange Listed Companies on Board and Executive compensa-tion are shown in the Compensation Report.

234 | Novartis Annual Report 2016
Transactions with former members of the Board of DirectorsDuring 2016, 2015 and 2014, the following payments (or waivers of claims) were made to former Board members or to “persons closely” linked to them:
Prof. Dr. William R. Brody and Prof. Dr. Rolf M. Zinker-nagel, who stepped down from the Board of Directors at the 2014 AGM, received delegated Board membership fees for their work on the Boards of the Novartis Insti-tute for Tropical Diseases (Prof. Dr. Zinkernagel) and the Genomics Institute of the Novartis Research Foundation (Prof. Dr. Brody and Prof. Dr. Zinkernagel). During 2016, an amount of CHF 25 000 (2015: CHF 100 000) and CHF 50 000 (2015: CHF 200 000) was paid to Prof. Dr. Brody and Prof. Dr. Zinkernagel, respectively, for their work on these Boards. No further payments related to these Board memberships will be made, as their respec-tive mandates have ended.
Dr. Alex Krauer, Honorary Chairman, is entitled to an amount of CHF 60 000 for annual periods from one AGM to the next. This amount was fixed in 1998 upon his departure from the Board in 1999, and has not been revised since that date. An amount of CHF 60 000 was paid to Dr. Krauer during 2016 and 2015. Due to a change in the timing of payments, an amount of CHF 45 000 was paid to Dr. Krauer, during 2014.
In 2016, Dr. Daniel Vasella, Honorary Chairman, received the contractual minimum compensation of USD 250 000 (2015: USD 250 000, 2014: USD 363 552) under an agreement which became effective on Novem-
ber 1, 2013 and ended in 2016. Under this agreement, Dr. Vasella is compensated at a rate of USD 25 000 per day, with an annual guaranteed minimum fee of USD 250 000. This amount is in line with compensation practices at other large companies when retired Chairmen or CEOs were retained in consulting agreements after leaving the board of directors.
In 2014, Dr. Vasella acquired an asset from a consol-idated entity at fair value and exercised an option to acquire, at a future date, real estate in Risch, Zug, Swit-zerland. The real estate transaction closed in 2015 and Dr. Vasella acquired the Group assets from a consoli-dated entity for an arm’s length transaction price deter-mined on the basis of two independent external assess-ments.
Transactions with an Executive Officer prior to start of employmentAs announced on September 24, 2015, Dr. James E. Bradner succeeded Dr. Mark Fishman as President of the Novartis Institutes for BioMedical Research (NIBR) and member of the ECN with effect from March 1, 2016. In 2015, a subsidiary acquired Dr. Bradner’s 10 million shares (7% interest) in a non-material entity for USD 10 million. The arm’s length transaction price was deter-mined based on the most recent round of financing of this entity.
The above disclosures related to Dr. Vasella and Dr. Brad-ner are made on a voluntary basis.
28. commitments and contingenciesLeasing commitments
The Group has entered into various fixed term opera-tional leases, mainly for cars and real estate. As of December 31, 2016 the Group’s commitments with respect to these leases, including estimated payment dates, were as follows:
(USD millions) 2016
2017 262
2018 192
2019 132
2020 104
2021 82
Thereafter 2 125
Total 2 897
expense of current year 335
Research & Development commitments
The Group has entered into long-term research agree-ments with various institutions which provide for poten-tial milestone payments by Novartis that may be capital-ized. As of December 31, 2016 the Group’s commitments to make payments under those agreements, and their estimated timing, were as follows:
(USD millions) 2016
2017 385
2018 465
2019 389
2020 771
2021 1 512
Thereafter 653
Total 4 175

Novartis Annual Report 2016 | 235FINaNcIal RepORTNotes to the Novartis Group consolidated financial statements
Other commitments
The Novartis Group entered into various purchase com-mitments for services and materials as well as for equip-ment in the ordinary course of business. These commit-ments are generally entered into at current market prices and reflect normal business operations.
Contingencies
Group companies have to observe the laws, government orders and regulations of the country in which they operate.
A number of Novartis companies are, and will likely continue to be, subject to various legal proceedings and investigations that arise from time to time, including pro-ceedings regarding product liability, sales and market-ing practices, commercial disputes, employment, and wrongful discharge, antitrust, securities, health and safety, environmental, tax, international trade, privacy, and intellectual property matters. As a result, the Group may become subject to substantial liabilities that may not be covered by insurance and could affect our busi-ness, financial position and reputation. While Novartis does not believe that any of these legal proceedings will have a material adverse effect on its financial position, litigation is inherently unpredictable and large judgments sometimes occur. As a consequence, Novartis may in the future incur judgments or enter into settlements of claims that could have a material adverse effect on its results of operations or cash flow.
Governments and regulatory authorities around the world have been stepping up their compliance and law enforcement activities in recent years in key areas, including marketing practices, pricing, corruption, trade restrictions, embargo legislation, insider trading, anti-trust, cyber security and data privacy. Further, when one government or regulatory authority undertakes an inves-tigation, it is not uncommon for other governments or regulators to undertake investigations regarding the same or similar matters. Responding to such investiga-tions is costly and requires an increasing amount of man-agement’s time and attention. In addition, such investi-gations may affect our reputation, create a risk of potential exclusion from government reimbursement programs in the US and other countries, and may lead to (or arise from) litigation. These factors have contrib-uted to decisions by Novartis and other co mpanies in the
healthcare industry, when deemed in their interest, to enter into settlement agreements with governmental authorities around the world prior to any formal decision by the authorities or a court. Those government settlements have involved and may continue to involve, in current gov-ernment investigations and proceedings, large cash pay-ments, sometimes in the hundreds of millions of dollars or more, including the potential repayment of amounts allegedly obtained improperly and other penalties, including treble damages. In addition, settlements of gov-ernment healthcare fraud cases often require compa-nies to enter into corporate integrity agreements, which are intended to regulate company behavior for a period of years. Our affiliate Novartis Pharmaceuticals Corpo-ration is a party to such an agreement, which will expire in 2020. Also, matters underlying governmental investi-gations and settlements may be the subject of separate private litigation.
While provisions have been made for probable losses, which management deems to be reasonable or appro-priate, there are uncertainties connected with these estimates.
Note 20 contains additional information on these matters.
A number of Group companies are involved in legal proceedings concerning intellectual property rights. The inherent unpredictability of such proceedings means that there can be no assurances as to their ultimate out-come. A negative result in any such proceeding could potentially adversely affect the ability of certain Novartis companies to sell their products or require the payment of substantial damages or royalties.
In the opinion of management, however, the outcome of these actions will not materially affect the Group’s financial position but could be material to the results of operations or cash flow in a given period.
The Group’s potential environmental remediation lia-bility is assessed based on a risk assessment and inves-tigation of the various sites identified by the Group as at risk for environmental remediation exposure. The Group’s future remediation expenses are affected by a number of uncertainties. These uncertainties include, but are not limited to, the method and extent of remediation, the per-centage of material attributable to the Group at the reme-diation sites relative to that attributable to other parties, and the financial capabilities of the other potentially responsible parties.
Note 20 contains additional information on environ-mental liabilities.

236 | Novartis Annual Report 2016
29. Financial instruments – additional disclosures
(USD millions) Note 2016 1 2015 1
cash and cash equivalents 16 7 007 4 674
Financial assets – measured at fair value through other comprehensive income
Available-for-sale marketable securities
Debt securities 16 306 339
Equity securities 16 6
Fund investments 16 31 33
Total available-for-sale marketable securities 337 378
Available-for-sale long-term financial investments
Equity securities 13 989 1 173
Fund investments 13 107 90
Contingent consideration receivables 13 586 550
Total available-for-sale long-term financial investments 1 682 1 813
Total financial assets – measured at fair value through other comprehensive income 2 019 2 191
Financial assets – measured at amortized costs
Trade receivables and other current assets (excluding pre-payments) 15/17 10 202 10 551
Accrued interest on debt securities and time deposits 16 1 2
Time deposits with original maturity more than 90 days 16 108 164
Long-term loans and receivables from customers and finance lease, advances, security deposits 13 514 653
Total financial assets – measured at amortized costs 10 825 11 370
Financial assets – measured at fair value through the consolidated income statement
Associated companies at fair value through profit and loss 188 181
Derivative financial instruments 16 230 143
Total financial assets – measured at fair value through the consolidated income statement 418 324
Total financial assets 20 269 18 559
Financial liabilities – measured at amortized costs
Current financial debt
Interest-bearing accounts of associates payable on demand 21 1 601 1 645
Bank and other financial debt 21 836 1 185
Commercial paper 21 3 174 1 085
Current portion of non-current debt 21 178 1 659
Total current financial debt 5 789 5 574
Non-current financial debt
Straight bonds 19 17 285 17 193
Liabilities to banks and other financial institutions 19 708 706
Finance lease obligations 19 82 87
Current portion of non-current debt 19 – 178 – 1 659
Total non-current financial debt 17 897 16 327
Trade payables 4 873 5 668
Total financial liabilities – measured at amortized costs 28 559 27 569
Financial liabilities – measured at fair value through the consolidated income statement
Contingent consideration (see Note 20/22) and other financial liabilities 1 018 1 105
Derivative financial instruments 21 116 30
Total financial liabilities – measured at fair value through the consolidated income statement 1 134 1 135
Total financial liabilities 29 693 28 704
1 Except for straight bonds (see Note 19), the carrying amount is a reasonable approximation of fair value.

Novartis Annual Report 2016 | 237FINaNcIal RepORTNotes to the Novartis Group consolidated financial statements
Derivative financial instruments
The following tables show the contract or underlying principal amounts and fair values of derivative financial instruments analyzed by type of contract at Decem-ber 31, 2016 and 2015. Contract or underlying principal
amounts indicate the gross volume of business outstand-ing at the consolidated balance sheet date and do not represent amounts at risk. The fair values are determined by reference to market prices or standard pricing mod-els that use observable market inputs at December 31, 2016 and 2015.
Contract or underlying Positive fair values Negative fair values principal amount
(USD millions) 2016 2015 2016 2015 2016 2015
currency-related instruments
Forward foreign exchange rate contracts 8 220 8 795 230 142 – 116 – 30
Over-the-Counter currency options 459 1
Total of currency-related instruments 8 220 9 254 230 143 – 116 – 30
Total derivative financial instruments included in
marketable securities and in current financial debts 8 220 9 254 230 143 – 116 – 30
The following table shows by currency contract or underlying principal amount the derivative financial instruments at December 31, 2016 and 2015:
2016
(USD millions) EUR USD JPY Other Total
currency-related instruments
Forward foreign exchange rate contracts 3 623 3 427 43 1 127 8 220
Total derivative financial instruments 3 623 3 427 43 1 127 8 220
2015
(USD millions) EUR USD JPY Other Total
currency-related instruments
Forward foreign exchange rate contracts 2 828 4 713 42 1 212 8 795
Over-the-Counter currency options 459 459
Total of currency-related instruments 3 287 4 713 42 1 212 9 254
Total derivative financial instruments 3 287 4 713 42 1 212 9 254
Derivative financial instruments effective for hedge accounting purposesAt the end of 2016 and 2015, there were no open hedg-ing instruments for anticipated transactions.
Fair value by hierarchy
As required by IFRS, financial assets and liabilities recorded at fair value in the consolidated financial state-ments are categorized based upon the level of judgment associated with the inputs used to measure their fair value. There are three hierarchical levels, based on an increasing amount of subjectivity associated with the inputs to derive fair valuation for these assets and liabil-ities, which are as follows:
The assets carried at Level 1 fair value are equity and debt securities listed in active markets.
The assets generally included in Level 2 fair value hierarchy are foreign exchange and interest rate deriva-tives and certain debt securities. Foreign exchange and interest rate derivatives are valued using corroborated market data. The liabilities generally included in this fair value hierarchy consist of foreign exchange and interest rate derivatives.
Level 3 inputs are unobservable for the asset or lia-bility. The assets generally included in Level 3 fair value hierarchy are various investments in hedge funds and unquoted equity security investments. Contingent con-sideration carried at fair value is included in this cate-gory.

238 | Novartis Annual Report 2016
2016
Valued at
(USD millions) Level 1 Level 2 Level 3 amortized cost Total
Financial assets
Debt securities 284 22 306
Fund investments 31 31
Total available-for-sale marketable securities 315 22 337
Time deposits with original maturity more than 90 days 108 108
Derivative financial instruments 230 230
Accrued interest on debt securities 1 1
Total marketable securities, time deposits and derivative financial instruments 315 252 109 676
Available-for-sale financial investments 513 476 989
Fund investments 107 107
Contingent consideration receivables 586 586
Long-term loans and receivables from customers
and finance lease, advances, security deposits 514 514
Financial investments and long-term loans 513 1 169 514 2 196
associated companies at fair value through profit and loss 188 188
Financial liabilities
Contingent consideration payables – 889 – 889
Other financial liabilities – 129 – 129
Derivative financial instruments – 116 – 116
Total financial liabilities at fair value – 116 – 1 018 – 1 134
2015
Valued at
(USD millions) Level 1 Level 2 Level 3 amortized cost Total
Financial assets
Debt securities 316 23 339
Equity securities 6 6
Fund investments 29 4 33
Total available-for-sale marketable securities 351 23 4 378
Time deposits with original maturity more than 90 days 164 164
Derivative financial instruments 143 143
Accrued interest on debt securities 2 2
Total marketable securities, time deposits and derivative financial instruments 351 166 4 166 687
Available-for-sale financial investments 700 473 1 173
Fund investments 90 90
Contingent consideration receivables 550 550
Long-term loans and receivables from customers
and finance lease, advances, security deposits 653 653
Financial investments and long-term loans 700 1 113 653 2 466
associated companies at fair value through profit and loss 181 181
Financial liabilities
Contingent consideration payables – 790 – 790
Other financial liabilities – 315 – 315
Derivative financial instruments – 30 – 30
Total financial liabilities at fair value – 30 – 1 105 – 1 135
The analysis above includes all financial instruments including those measured at amortized cost or at cost.

Novartis Annual Report 2016 | 239FINaNcIal RepORTNotes to the Novartis Group consolidated financial statements
The change in carrying values associated with Level 3 financial instruments using significant unobservable inputs during the year ended December 31 are set forth below:
2016
Associated Available-
companies at for-sale Contingent Contingent Other
fair value through Fund financial consideration consideration financial
(USD millions) profit and loss investments investments receivables payables liabilities
January 1 181 94 473 550 – 790 – 315
Fair value gains and other adjustments,
including from divestments recognized
in the consolidated income statement 26 1 51 3
Fair value losses (including impairments and
amortizations) and other adjustments recognized
in the consolidated income statement – 28 – 1 – 24 – 156
Fair value adjustments recognized in the consolidated statement
of comprehensive income 14 – 8
Purchases 41 5 122 – 172
Cash receipts and payments – 15 229 183
Disposals – 3 – 5 – 18
Reclassification – 29 – 70
December 31 188 107 476 586 – 889 – 129
Total of fair value gains and losses recognized
in the consolidated income statement for assets
and liabilities held at December 31, 2016 – 2 – 1 – 23 51 – 156 3
2015
Associated Available-
companies at for-sale Contingent Contingent Other
fair value through Fund financial consideration consideration financial
(USD millions) profit and loss investments investments receivables payables liabilities
January 1 168 77 332 – 756
Impact of business combinations 75
Fair value gains and other adjustments,
including from divestments recognized
in the consolidated income statement 9 7 41 1 000
Fair value losses (including impairments and
amortizations) and other adjustments recognized
in the consolidated income statement – 25 – 1 – 35 – 75 – 57 – 587
Fair value adjustments recognized in the consolidated statement
of comprehensive income 17 22
Purchases 62 24 142 – 255
Cash receipts and payments – 450 278 272
Disposals – 15 – 56
At equity investments reclassified due to loss
of significant influence 18
Reclassification – 33 – 15 9
December 31 181 94 473 550 – 790 – 315
Total of fair value gains and losses recognized
in the consolidated income statement for assets
and liabilities held at December 31, 2015 – 16 6 6 925 – 57 – 587

240 | Novartis Annual Report 2016
During 2016, there were several individually non-signifi-cant transfers of available-for-sale financial investments from level 3 to level 1 for USD 75 million mainly due to Ini-tial Public Offerings of the invested companies. No sig-nificant transfers from one level to the other occurred during the 2015 reporting period.
Realized gains and losses associated with Level 3 available-for-sale marketable securities are recorded in the consolidated income statement under “Other finan-cial income and expense” and realized gains and losses associated with Level 3 available-for-sale financial investments are recorded in the consolidated income statement under “Other income” or “Other expense”, respectively.
If the pricing parameters for the Level 3 input were to change for associated companies at fair value through profit and loss, equity securities, fund investments and for available-for-sale financial investments by 10% pos-itively or negatively, this would change the amounts recorded in the consolidated statement of comprehen-sive income by USD 77 million.
For the determination of the fair value of a contingent consideration various unobservable inputs are used. A change in these inputs might result in a significantly higher or lower fair value measurement. The significance and usage of these inputs may vary among the existing contingent considerations due to differences in the trig-gering events for payments or in the nature of the asset the contingent consideration relates to. Among others, the inputs used are the probability of success, sales fore-cast and assumptions regarding the discount rate, tim-ing and different scenarios of triggering events. The inputs are interrelated. If the most significant parameters for the Level 3 input were to change by 10% positively or negatively, or where the probability of success (POS) is the most significant input parameter 10% were added or deducted from the applied probability of success, for contingent consideration payables, other financial liabil-ities and contingent consideration receivables, this would change the amounts recorded in the consolidated income statement by USD 207 million and USD 182 mil-lion, respectively.
Nature and extent of risks arising from financial instruments
Market riskNovartis is exposed to market risk, primarily related to foreign currency exchange rates, interest rates and the market value of the investments of liquid funds. The Group actively monitors and seeks to reduce, where it deems it appropriate to do so, fluctuations in these expo-sures. It is the Group’s policy and practice to enter into a variety of derivative financial instruments to manage the volatility of these exposures and to enhance the yield on the investment of liquid funds. It does not enter into any financial transactions containing a risk that cannot be quantified at the time the transaction is concluded. In addition, it does not sell short assets it does not have, or does not know it will have, in the future. The Group only
sells existing assets or enters into transactions and future transactions (in the case of anticipatory hedges) that it confidently expects it will have in the future, based on past experience. In the case of liquid funds, the Group writes call options on assets it has, or writes put options on positions it wants to acquire and has the liquidity to acquire. The Group expects that any loss in value for these instruments generally would be offset by increases in the value of the underlying transactions.
Foreign currency exchange rate riskThe Group uses the USD as its reporting currency. As a result, the Group is exposed to foreign currency exchange movements, primarily in European, Japanese and emerg-ing market currencies. Fluctuations in the exchange rates between the US dollar and other currencies can have a significant effect on both the Group’s results of opera-tions, including reported sales and earnings, as well as on the reported value of our assets, liabilities and cash flows. This, in turn, may significantly affect the compa-rability of period-to-period results of operations.
Because our expenditures in Swiss francs are sig-nificantly higher than our revenues in Swiss francs, vol-atility in the value of the Swiss franc can have a signifi-cant impact on the reported value of our earnings, assets and liabilities, and the timing and extent of such volatility can be difficult to predict. In addition, there is a risk that certain countries could take other steps which could sig-nificantly impact the value of their currencies.
The Group is exposed to a potential adverse devalu-ation risk on its intercompany funding and total invest-ment in certain subsidiaries operating in countries with exchange controls. The most significant country in this respect is Venezuela, where the Group is exposed to potential devaluation losses in the income statement on its total intercompany balances with its subsidiaries in Venezuela.
The Group’s subsidiaries in Venezuela are experienc-ing a significant reduction in approvals for remittance of US dollars outside the country at the exchange rate avail-able for imports of specific goods and services of national priority, including medicines and medical sup-plies. As a result, in November 2016, the Group changed the exchange rate applied to translate the financial state-ments of its Venezuelan subsidiaries from VEF 11 per USD to the floating rate of DICOM (Sistema de Divisa Complementaria) which was VEF 658 per USD as of November 1, 2016. A corresponding USD 0.3 billion reval-uation loss on the outstanding intercompany balances was recognized in the fourth quarter of 2016. Due to the reserves against the intercompany balances, the net out-standing intercompany payable balance of Venezuela subsidiaries was reduced to an insignificant amount as per December 31, 2016.
The Group has an equivalent of approximately USD 2 million of cash in Venezuela local currency (VEF), which is subject to loss of purchase power due to high inflation in the country.
The Group manages its currency exposure by engag-ing in hedging transactions where management deems appropriate. Novartis may enter into various contracts

Novartis Annual Report 2016 | 241FINaNcIal RepORTNotes to the Novartis Group consolidated financial statements
that reflect the changes in the value of foreign currency exchange rates to preserve the value of assets, commit-ments and anticipated transactions. Novartis also uses forward contracts and foreign currency option contracts to hedge.
Net investments in subsidiaries in foreign countries are long-term investments. Their fair value changes through movements of foreign currency exchange rates. The Group only hedges the net investments in foreign subsidiaries in exceptional cases.
Commodity price riskThe Group has only a very limited exposure to price risk related to anticipated purchases of certain commodities used as raw materials by the Group’s businesses. A change in those prices may alter the gross margin of a specific business, but generally by not more than 10% of the margin and thus below the Group’s risk management tolerance levels. Accordingly, the Group does not enter into significant commodity futures, forward and option contracts to manage fluctuations in prices of anticipated purchases.
Interest rate riskThe Group addresses its net exposure to interest rate risk mainly through the ratio of its fixed rate financial debt to variable rate financial debt contained in its total finan-cial debt portfolio. To manage this mix, Novartis may enter into interest rate swap agreements, in which it exchanges periodic payments based on a notional amount and agreed upon fixed and variable interest rates.
Equity riskThe Group may purchase equities as investments of its liquid funds. As a policy, it limits its holdings in an unre-lated company to less than 5% of its liquid funds. Poten-tial investments are thoroughly analyzed. Call options are written on equities that the Group owns, and put options are written on equities which the Group wants to buy and for which cash is available.
Credit riskCredit risks arise from the possibility that customers may not be able to settle their obligations as agreed. To man-age this risk, the Group periodically assesses the finan-cial reliability of customers, taking into account their financial position, past experience and other factors. Individual risk limits are set accordingly.
The Group’s largest customer accounted for approx-imately 16% of net sales, and the second and third larg-est customers accounted for 12% and 6% of net sales, respectively (2015: 14%, 11% and 5%, respectively). No other customer accounted for 5% or more of net sales in either year.
The highest amounts of trade receivables outstand-ing were for these same three customers. They amounted to 14%, 9% and 6%, respectively, of the Group’s trade
receivables at December 31, 2016 (2015: 13%, 9% and 6% respectively). There is no other significant concen-tration of credit risk.
Counterparty riskCounterparty risk encompasses issuer risk on market-able securities and money market instruments, credit risk on cash, time deposits and derivatives as well as set-tlement risk for different instruments. Issuer risk is reduced by only buying securities which are at least A- rated. Counterparty credit risk and settlement risk are reduced by a policy of entering into transactions with counterparties (banks or financial institutions) that fea-ture a strong credit rating. Exposure to these risks is closely monitored and kept within predetermined param-eters. The limits are regularly assessed and determined based upon credit analysis including financial statement and capital adequacy ratio reviews. In addition, reverse repurchasing agreements are contracted and Novartis has entered into credit support agreements with various banks for derivative transactions.
The Group’s cash and cash equivalents are held with major regulated financial institutions, the three largest ones hold approximately 16.5%, 6.9% and 6.7%, respec-tively (2015: 21.8%, 9.6% and 8.6%, respectively).
The Group does not expect any losses from non-per-formance by these counterparties and does not have any significant grouping of exposures to financial sector or country risk.
Liquidity riskLiquidity risk is defined as the risk that the Group could not be able to settle or meet its obligations on time or at a reasonable price. Group Treasury is responsible for liquidity, funding and settlement management. In addi-tion, liquidity and funding risks, and related processes and policies, are overseen by management. Novartis manages its liquidity risk on a consolidated basis accord-ing to business needs, tax, capital or regulatory consid-erations, if applicable, through numerous sources of financing in order to maintain flexibility. Management monitors the Group’s net debt or liquidity position through rolling forecasts on the basis of expected cash flows.
Novartis has two US commercial paper programs under which it can issue up to USD 9.0 billion in the aggregate of unsecured commercial paper notes. Novartis also has a Japanese commercial paper program under which it can issue up to JPY 150 billion (approxi-mately USD 1.3 billion) of unsecured commercial paper notes. Commercial paper notes totaling USD 3.2 billion under these three programs were outstanding as per December 31, 2016 (2015: USD 1.1 billion). Novartis fur-ther has a committed credit facility of USD 6.0 billion, entered into on September 23, 2015. This credit facility is provided by a syndicate of banks and is intended to be used as a backstop for the US commercial paper pro-grams. It matures in September 2020 and was undrawn as per December 31, 2016 and December 31, 2015.

242 | Novartis Annual Report 2016
The following table sets forth how management monitors net debt or liquidity based on details of the remaining contractual maturities of current financial assets and liabilities excluding trade receivables and payables as well as contingent considerations at December 31, 2016 and December 31, 2015:
2016
Due later than Due later than Due later than
one month three months one year
Due within but less than but less than but less than Due after
(USD millions) one month three months one year five years five years Total
current assets
Marketable securities and time deposits 32 126 110 124 53 445
Commodities 94 94
Derivative financial instruments and accrued interest 38 102 91 231
Cash and cash equivalents 5 907 1 100 7 007
Total current financial assets 5 977 1 328 201 124 147 7 777
Non-current liabilities
Financial debt – 5 141 – 12 756 – 17 897
Financial debt – undiscounted – 5 155 – 12 901 – 18 056
Total non-current financial debt – 5 141 – 12 756 – 17 897
current liabilities
Financial debt – 5 099 – 250 – 440 – 5 789
Financial debt – undiscounted – 5 099 – 250 – 440 – 5 789
Derivative financial instruments – 15 – 72 – 29 – 116
Total current financial debt – 5 114 – 322 – 469 – 5 905
Net debt 863 1 006 – 268 – 5 017 – 12 609 – 16 025
2015
Due later than Due later than Due later than
one month three months one year
Due within but less than but less than but less than Due after
(USD millions) one month three months one year five years five years Total
current assets
Marketable securities and time deposits 22 11 200 247 62 542
Commodities 86 86
Derivative financial instruments and accrued interest 40 67 38 145
Cash and cash equivalents 4 674 4 674
Total current financial assets 4 736 78 238 247 148 5 447
Non-current liabilities
Financial debt – 4 664 – 11 663 – 16 327
Financial debt – undiscounted – 4 676 – 11 797 – 16 473
Total non-current financial debt – 4 664 – 11 663 – 16 327
current liabilities
Financial debt – 3 258 – 289 – 2 027 – 5 574
Financial debt – undiscounted – 3 258 – 289 – 2 028 – 5 575
Derivative financial instruments – 8 – 20 – 2 – 30
Total current financial debt – 3 266 – 309 – 2 029 – 5 604
Net debt 1 470 – 231 – 1 791 – 4 417 – 11 515 – 16 484
The consolidated balance sheet amounts of financial liabilities included in the above analysis are not materially dif-ferent to the contractual amounts due on maturity. The positive and negative fair values on derivative financial instru-ments represent the net contractual amounts to be exchanged at maturity.

Novartis Annual Report 2016 | 243FINaNcIal RepORTNotes to the Novartis Group consolidated financial statements
The Group’s contractual undiscounted potential cash flows from derivative financial instruments to be settled on a gross basis are as follows:
2016
Due later than Due later than
one month three months
Due within but less than but less than
(USD millions) one month three months one year Total
Derivative financial instruments and accrued interest on derivative
financial instruments
Potential outflows in various currencies – from financial derivative liabilities – 1 087 – 1 246 – 2 027 – 4 360
Potential inflows in various currencies – from financial derivative assets 1 109 1 287 2 051 4 447
2015
Due later than Due later than
one month three months
Due within but less than but less than
(USD millions) one month three months one year Total
Derivative financial instruments and accrued interest on derivative
financial instruments
Potential outflows in various currencies – from financial derivative liabilities – 1 418 – 2 800 – 1 602 – 5 820
Potential inflows in various currencies – from financial derivative assets 1 448 2 819 1 601 5 868
Other contractual liabilities which are not part of management’s monitoring of the net debt or liquidity consist of the following items:
2016
Due later than Due later than Due later than
one month three months one year
but less than but less than but less than Due after
(USD millions) three months one year five years five years Total
Contractual interest on non-current liabilities – 104 – 433 – 1 694 – 4 015 – 6 246
Trade payables – 4 873 – 4 873
2015
Due later than Due later than Due later than
one month three months one year
but less than but less than but less than Due after
(USD millions) three months one year five years five years Total
Contractual interest on non-current liabilities – 104 – 499 – 1 878 – 4 332 – 6 813
Trade payables and commitment for repurchase of own shares (see Note 22) – 5 668 – 5 668
Capital risk management
Novartis strives to maintain a strong credit rating. In man-aging its capital, Novartis focuses on maintaining a strong balance sheet. Moody’s rated the Group as Aa3 for long-term maturities and as P-1 for short-term matur-ities and Standard & Poor’s had a rating of AA- for long-term and A-1+ for short-term maturities. Fitch had a long-term rating of AA and a short-term rating of F1+.
The debt/equity ratio increased to 0.32:1 at Decem-ber 31, 2016, compared to 0.28:1 at the beginning of the year.
Value at risk
The Group uses a value at risk (VAR) computation to esti-mate the potential ten-day loss in the fair value of its financial instruments.
A ten-day period is used because of an assumption that not all positions could be undone in one day given the size of the positions. Apart from contingent consid-eration, finance lease obligations, and long-term loans and receivables, advances and security deposits the VAR computation includes all financial assets and finan-cial liabilities as set forth above in this Note. Trade pay-ables and receivables are considered only to the extent they comprise a foreign currency exposure. In addition, commodities are included in the computation.
The VAR estimates are made assuming normal mar-ket conditions, using a 95% confidence interval. The Group uses a “Delta Normal” model to determine the observed inter-relationships between movements in interest rates, stock markets and various currencies. These inter-relationships are determined by observing interest rate, stock market movements and forward for-eign currency rate movements over a sixty-day period for the calculation of VAR amounts.

244 | Novartis Annual Report 2016
The estimated potential ten-day loss in pre-tax income from the Group’s foreign currency instruments, the estimated potential ten-day loss of its equity hold-ings, and the estimated potential ten-day loss in fair value of its interest rate sensitive instruments (primarily finan-cial debt and investments of liquid funds under normal market conditions) as calculated in the VAR model are the following:
(USD millions) 2016 2015
All financial instruments 541 387
Analyzed by components:
Instruments sensitive to foreign
currency exchange rates 222 224
Instruments sensitive to equity
market movements 26 50
Instruments sensitive to interest rates 328 353
The average, high, and low VAR amounts are as follows:
2016
(USD millions) Average High Low
All financial instruments 402 541 316
Analyzed by components:
Instruments sensitive to foreign
currency exchange rates 203 245 147
Instruments sensitive to equity
market movements 50 99 26
Instruments sensitive to
interest rates 308 407 234
2015
(USD millions) Average High Low
All financial instruments 337 387 237
Analyzed by components:
Instruments sensitive to foreign
currency exchange rates 313 418 173
Instruments sensitive to equity
market movements 55 111 33
Instruments sensitive to
interest rates 294 380 251
The VAR computation is a risk analysis tool designed to statistically estimate the maximum potential ten day loss from adverse movements in foreign currency exchange rates, equity prices and interest rates under normal mar-ket conditions. The computation does not purport to rep-resent actual losses in fair value on earnings to be incurred by the Group, nor does it consider the effect of favorable changes in market rates. The Group cannot predict actual future movements in such market rates and it does not claim that these VAR results are indica-tive of future movements in such market rates or are rep-resentative of any actual impact that future changes in market rates may have on the Group’s future results of operations or financial position.
In addition to these VAR analyses, the Group uses stress testing techniques that aim to reflect a worst case scenario on the marketable securities which are moni-tored by Group Treasury. For these calculations, the Group uses the six-month period with the worst perfor-mance observed over the past twenty years in each cat-egory. For 2016 and 2015, the worst case loss scenario was calculated as follows:
(USD millions) 2016 2015
All financial instruments 6 12
Analyzed by components:
Instruments sensitive to foreign
currency exchange rates 1
Instruments sensitive to equity
market movements 4
Instruments sensitive to
interest rates 6 7
In the Group’s risk analysis, Novartis considered this worst case scenario acceptable as it could reduce income, but would not endanger the solvency or invest-ment grade credit standing of the Group.

Novartis Annual Report 2016 | 245FINaNcIal RepORTNotes to the Novartis Group consolidated financial statements
30. Discontinued operations
Discontinued operations consolidated income statement segmentation
Vaccines Consumer Health1 Corporate Total (including eliminations) discontinued operations
(USD millions) 2015 2014 2015 2014 2015 2014 2015 2014
Net sales to third parties of
discontinued operations 145 1 537 456 4 279 601 5 816
Sales to continuing segments 18 65 1 13 19 78
Net sales of
discontinued operations 163 1 602 457 4 292 620 5 894
Other revenues 18 32 5 33 23 65
Cost of goods sold – 192 – 1 336 – 184 – 1 737 – 376 – 3 073
Gross profit of
discontinued operations – 11 298 278 2 588 267 2 886
Marketing & Sales – 57 – 280 – 187 – 1 532 – 244 – 1 812
Research & Development – 151 – 545 – 30 – 312 – 181 – 857
General & Administration – 26 – 118 – 32 – 313 – 58 – 431
Other income 2 870 905 10 558 99 – 8 3 13 420 1 007
Other expense – 57 – 812 – 14 – 60 – 656 – 274 – 727 – 1 146
Operating income/loss of
discontinued operations 2 568 – 552 10 573 470 – 664 – 271 12 477 – 353
Income from associated
companies 2 2 2 2
Income/loss before taxes of
discontinued operations 12 479 – 351
Taxes – 1 713 – 96
Net income/loss of discontinued operations 10 766 – 447
1 Consumer Health is the aggregation of the OTC and Animal Health divisions.
The following are included in net income from discontinued operations:
(USD millions) 2015 2014
Depreciation of property, plant & equipment – 66
Amortization of intangible assets – 77
Impairment charges on property, plant & equipment, net 83 – 736
Impairment charges on intangible assets, net – 405
Additions to restructuring provisions – 1 – 14
Equity-based compensation of Novartis equity plans – 65 – 124
31. events subsequent to the December 31, 2016 consolidated balance sheet dateSignificant transactions closed in January 2017For significant transactions entered into in 2016 and closed in January 2017, see Note 2.
Dividend proposal for 2016 and approval of the Group’s 2016 consolidated financial statementsOn January 24, 2017, the Novartis AG Board of Direc-tors proposed the acceptance of the 2016 consoli-dated financial statements of the Novartis Group for
approval by the Annual General Meeting on February 28, 2017. Furthermore, also on January 24, 2017, the Board proposed a dividend of CHF 2.75 per share to be approved at the Annual General Meeting on Febru-ary 28, 2017. If approved, total dividend payments would amount to approximately USD 6.4 billion (2015: USD 6.6 billion) using the CHF/USD December 31, 2016 exchange rate.

246 | Novartis Annual Report 2016
32. principal Group subsidiaries and associated companiesThe following table lists the principal subsidiaries controlled by Novartis and associated companies in which Novartis is deemed to have significant influence. The equity interest percentage shown in the table also represents the share in voting rights in those entities, except where explicitly noted.
Share/paid-in Equity
As at December 31, 2016 capital 1 interest %
algeria
Société par actions SANDOZ, Algiers DZD 650.0 m 100
argentina
Novartis Argentina S.A., Buenos Aires ARS 906.1 m 100
Alcon Laboratorios S.A., Buenos Aires ARS 83.9 m 100
australia
Novartis Australia Pty Ltd, North Ryde, NSW AUD 2.2 100
Novartis Pharmaceuticals Australia
Pty Ltd, North Ryde, NSW AUD 3.8 m 100
Alcon Laboratories (Australia) Pty
Ltd, Frenchs Forest, NSW AUD 2.6 m 100
Sandoz Pty Ltd, North Ryde, NSW AUD 11.6 m 100
austria
Novartis Austria GmbH, Vienna EUR 1.0 m 100
Novartis Pharma GmbH, Vienna EUR 1.1 m 100
Alcon Ophthalmika GmbH, Vienna EUR 36 336 100
Sandoz GmbH, Kundl EUR 32.7 m 100
EBEWE Pharma Ges.m.b.H Nfg. KG, Unterach am Attersee EUR 1.0 m 100
Bangladesh
Novartis (Bangladesh) Limited, Gazipur BDT 162.5 m 60
Belgium
N.V. Novartis Pharma S.A., Vilvoorde EUR 7.1 m 100
S.A. Alcon-Couvreur N.V., Puurs EUR 360.6 m 100
N.V. Alcon S.A., Vilvoorde EUR 141 856 100
N.V. Sandoz S.A., Vilvoorde EUR 19.2 m 100
Bermuda
Triangle International
Reinsurance Limited, Hamilton CHF 1.0 m 100
Novartis Securities Investment
Limited, Hamilton CHF 30 000 100
Novartis BioVentures Ltd., Hamilton USD 12 000 100
Trinity River Insurance Co Limited, Hamilton USD 370 000 100
Novartis Investment Limited, Hamilton USD 30 000 100
Novartis Pharmaceutical Proprietary
Ltd., Hamilton CHF 100 000 100
Brazil
Novartis Biociências S.A., São Paulo BRL 265.0 m 100
Sandoz do Brasil Indústria
Farmacêutica Ltda., Cambé, PR BRL 190.0 m 100
canada
Novartis Pharmaceuticals Canada
Inc., Dorval, Quebec CAD 0 2 100
Alcon Canada Inc., Mississauga, Ontario CAD 0 2 100
CIBA Vision Canada Inc., Mississauga, Ontario CAD 1 100
Sandoz Canada Inc., Boucherville, Quebec CAD 76.8 m 100
chile
Novartis Chile S.A., Santiago de Chile CLP 2.0 bn 100
Alcon Laboratorios Chile Ltd., Santiago de Chile CLP 2.0 bn 100
china
Beijing Novartis Pharma Co., Ltd., Beijing USD 30.0 m 100
Novartis Pharmaceuticals (HK)
Limited, Hong Kong HKD 200 100
China Novartis Institutes for
BioMedical Research Co., Ltd., Shanghai USD 320.0 m 100
Suzhou Novartis Pharma Technology
Co., Ltd., Changshu USD 103.4 m 100
Shanghai Novartis Trading Ltd., Shanghai USD 3.2 m 100
Alcon Hong Kong Limited, Hong Kong HKD 77 000 100
Alcon (China) Ophthalmic Product
Co., Ltd., Beijing USD 2.2 m 100
Sandoz (China) Pharmaceutical Co.,
Ltd., Zhongshan USD 36.5 m 100
colombia
Novartis de Colombia S.A., Santafé de Bogotá COP 7.9 bn 100
Laboratorios Alcon de Colombia S.A., Santafé de Bogotá COP 20.9 m 100
croatia
Sandoz d.o.o., Zagreb HRK 25.6 m 100
czech Republic
Novartis s.r.o., Prague CZK 51.5 m 100
Alcon Pharmaceuticals (Czech
Republic) s.r.o., Prague CZK 31.0 m 100
Sandoz s.r.o., Prague CZK 44.7 m 100
Share/paid-in Equity
As at December 31, 2016 capital 1 interest %
Denmark
Novartis Healthcare A/S, Copenhagen DKK 14.0 m 100
Alcon Nordic A/S, Copenhagen DKK 0.5 m 100
Sandoz A/S, Copenhagen DKK 10.0 m 100
ecuador
Novartis Ecuador S.A., Quito USD 4.0 m 100
egypt
Novartis Pharma S.A.E., Cairo EGP 193.8 m 99.77
Sandoz Egypt Pharma S.A.E., New Cairo City EGP 250 000 100
Finland
Novartis Finland Oy, Espoo EUR 459 000 100
France
Novartis Groupe France S.A., Rueil-Malmaison EUR 103.0 m 100
Novartis Pharma S.A.S., Rueil-Malmaison EUR 43.4 m 100
Laboratoires Alcon S.A.S., Rueil-Malmaison EUR 12.9 m 100
Sandoz S.A.S., Levallois-Perret EUR 5.4 m 100
Germany
Novartis Deutschland GmbH, Wehr EUR 155.5 m 100
Novartis Pharma GmbH, Nuremberg EUR 25.6 m 100
Novartis Pharma Produktions GmbH, Wehr EUR 2.0 m 100
Alcon Pharma GmbH, Freiburg im Breisgau EUR 512 000 100
WaveLight GmbH, Erlangen EUR 6.6 m 100
CIBA Vision GmbH, Grosswallstadt EUR 15.4 m 100
Sandoz International GmbH, Holzkirchen EUR 100 000 100
1 A Pharma GmbH, Oberhaching EUR 26 000 100
Salutas Pharma GmbH, Barleben EUR 42.1 m 100
HEXAL AG, Holzkirchen EUR 93.7 m 100
Aeropharm GmbH, Rudolstadt EUR 26 000 100
Novartis Business Services GmbH, Wehr EUR 25 000 100
Gibraltar
Novista Insurance Limited, Gibraltar City CHF 130.0 m 100
Greece
Novartis (Hellas) S.A.C.I., Metamorphosis / Athens EUR 23.4 m 100
Alcon Laboratories Hellas-
Commercial and Industrial S.A., Maroussi, Athens EUR 5.7 m 100
Hungary
Novartis Hungary Healthcare
Limited Liability Company, Budapest HUF 545.6 m 100
Sandoz Hungary Limited Liability
Company, Budapest HUF 883.0 m 100
India
Novartis India Limited, Mumbai INR 140.7 m 73.4
Novartis Healthcare Private Limited, Mumbai INR 60.0 m 100
Alcon Laboratories (India) Private
Limited, Bangalore INR 1.1 bn 100
Sandoz Private Limited, Mumbai INR 32.0 m 100
Indonesia
PT. Novartis Indonesia, Jakarta IDR 7.7 bn 100
PT. CIBA Vision Batam, Batam IDR 11.9 bn 100
Ireland
Novartis Ireland Limited, Dublin EUR 25 000 100
Novartis Ringaskiddy Limited, Ringaskiddy, County Cork EUR 2.0 m 100
Alcon Laboratories Ireland Limited, Cork City EUR 541 251 100
Israel
Novartis Israel Ltd., Petach Tikva ILS 1 000 100
Optonol Ltd., Neve-Ilan ILS 454 252 100
Italy
Novartis Farma S.p.A., Origgio EUR 18.2 m 100
Alcon Italia S.p.A., Milan EUR 3.7 m 100
Sandoz S.p.A., Origgio EUR 1.7 m 100
Sandoz Industrial Products S.p.A., Rovereto EUR 2.6 m 100
Japan
Novartis Holding Japan K.K., Tokyo JPY 10.0 m 100
Novartis Pharma K.K., Tokyo JPY 6.0 bn 100
Alcon Japan Ltd., Tokyo JPY 500.0 m 100
Sandoz K.K., Tokyo JPY 100.0 m 100
luxembourg
Novartis Investments S.à r.l., Luxembourg-Ville USD 100.0 m 100
Novartis Finance S.A., Luxembourg-Ville USD 100 000 100
Malaysia
Novartis Corporation
(Malaysia) Sdn. Bhd., Kuala Lumpur MYR 3.3 m 100
Alcon Laboratories (Malaysia) Sdn.
Bhd., Petaling Jaya MYR 1.0 m 100
CIBA Vision Johor Sdn. Bhd., Kuala Lumpur MYR 10.0 m 100

Novartis Annual Report 2016 | 247FINaNcIal RepORTNotes to the Novartis Group consolidated financial statements
Share/paid-in Equity
As at December 31, 2016 capital 1 interest %
Mexico
Novartis Farmacéutica, S.A. de C.V., Mexico City MXN 205.0 m 100
Alcon Laboratorios, S.A. de C.V., Mexico City MXN 5.9 m 100
Sandoz, S.A. de C.V., Mexico City MXN 468.2 m 100
Morocco
Novartis Pharma Maroc SA, Casablanca MAD 80.0 m 100
Netherlands
Novartis Netherlands B.V., Arnhem EUR 1.4 m 100
Novartis Pharma B.V., Arnhem EUR 4.5 m 100
Alcon Nederland B.V., Arnhem EUR 18 151 100
Sandoz B.V., Almere EUR 907 560 100
New Zealand
Novartis New Zealand Ltd, Auckland NZD 820 000 100
Norway
Novartis Norge AS, Oslo NOK 1.5 m 100
pakistan
Novartis Pharma (Pakistan) Limited, Karachi PKR 3.9 bn 99.99
panama
Novartis Pharma (Logistics), Inc., Panama City USD 10 000 100
Alcon Centroamerica S.A., Panama City PAB 1 000 100
philippines
Novartis Healthcare Philippines,
Inc., Manila PHP 298.8 m 100
Alcon Laboratories (Philippines),
Inc., Manila PHP 16.5 m 100
Sandoz Philippines Corporation, Manila PHP 30.0 m 100
poland
Novartis Poland Sp. z o.o., Warszawa PLN 44.2 m 100
Alcon Polska Sp. z o.o., Warszawa PLN 750 000 100
Sandoz Polska Sp. z o.o., Warszawa PLN 25.6 m 100
Lek S.A., Strykow PLN 11.4 m 100
portugal
Novartis Portugal SGPS Lda., Porto Salvo EUR 500 000 100
Novartis Farma – Produtos
Farmacêuticos S.A, Porto Salvo EUR 2.4 m 100
Alcon Portugal-Produtos e
Equipamentos Oftalmológicos Lda., Porto Salvo EUR 4.5 m 100
Sandoz Farmacêutica Lda., Porto Salvo EUR 499 900 100
Romania
Novartis Pharma Services Romania
S.R.L., Bucharest RON 3.0 m 100
Alcon Romania S.R.L., Bucharest RON 10.8 m 100
Sandoz S.R.L., Targu-Mures RON 105.2 m 100
Russian Federation
Novartis Pharma LLC, Moscow RUB 20.0 m 100
Alcon Farmacevtika LLC, Moscow RUB 44.1 m 100
ZAO Sandoz, Moscow RUB 57.4 m 100
Novartis Neva LLC, St. Petersburg RUB 1.3 bn 100
Saudi arabia
Saudi Pharmaceutical Distribution
Co. Ltd., Riyadh SAR 26.8 m 75
Singapore
Novartis (Singapore) Pte Ltd., Singapore Country SGD 100 000 100
Novartis Singapore Pharmaceutical
Manufacturing Pte Ltd, Singapore Country SGD 45.0 m 100
Novartis Asia Pacific
Pharmaceuticals Pte Ltd, Singapore Country SGD 39.0 m 100
Novartis Institute for Tropical
Diseases Pte Ltd, Singapore Country SGD 2 004 100
Alcon Singapore Manufacturing Pte
Ltd, Singapore Country SGD 101 000 100
CIBA Vision Asian Manufacturing and
Logistics Pte Ltd., Singapore Country SGD 1.0 m 100
Alcon Pte Ltd, Singapore Country SGD 164 000 100
Slovakia
Novartis Slovakia s.r.o., Bratislava EUR 2.0 m 100
Slovenia
Lek Pharmaceuticals d.d., Ljubljana EUR 48.4 m 100
Sandoz Pharmaceuticals d.d., Ljubljana EUR 1.5 m 100
South africa
Novartis South Africa (Pty) Ltd, Midrand ZAR 86.3 m 100
Alcon Laboratories (South Africa)
(Pty) Ltd., Midrand ZAR 201 820 100
Sandoz South Africa (Pty) Ltd, Kempton Park ZAR 3.0 m 100
South Korea
Novartis Korea Ltd., Seoul KRW 24.5 bn 98.55
Alcon Korea Ltd., Seoul KRW 33.8 bn 100
Sandoz Korea Ltd., Seoul KRW 17.8 bn 100
Spain
Novartis Farmacéutica S.A., Barcelona EUR 63.0 m 100
Alcon Cusi S.A., El Masnou / Barcelona EUR 11.6 m 100
Sandoz Farmacéutica S.A., Aravaca / Madrid EUR 270 450 100
Sandoz Industrial Products S.A.,
Les Franqueses del Vallés / Barcelona EUR 9.3 m 100
Abadia Retuerta S.A., Sardón de Duero / Valladolid EUR 6.0 m 100
Share/paid-in Equity
As at December 31, 2016 capital 1 interest %
Sweden
Novartis Sverige AB, Täby / Stockholm SEK 5.0 m 100
Switzerland
Novartis International AG, Basel CHF 10.0 m 100
Novartis Holding AG, Basel CHF 100.2 m 100
Novartis International Pharmaceutical AG, Basel CHF 100 000 100
Novartis Research Foundation, Basel CHF 29.3 m 100
Novartis Foundation for Management
Development, Basel CHF 100 000 100
Novartis Foundation for Employee Participation,
Basel CHF 100 000 100
Novartis Sanierungsstiftung, Basel CHF 2.0 m 100
Novartis Pharma AG, Basel CHF 350.0 m 100
Novartis Pharma Services AG, Basel CHF 20.0 m 100
Novartis Pharma Schweizerhalle AG, Muttenz CHF 18.9 m 100
Novartis Pharma Stein AG, Stein CHF 251 000 100
Novartis Pharma Schweiz AG, Risch CHF 5.0 m 100
Alcon Switzerland SA, Risch CHF 100 000 100
Alcon Pharmaceuticals Ltd., Fribourg CHF 200 000 100
ESBATech, a Novartis company GmbH, Schlieren CHF 14.0 m 100
Sandoz AG, Basel CHF 5.0 m 100
Sandoz Pharmaceuticals AG, Risch CHF 100 000 100
Roche Holding AG, Basel CHF 160.0 m 33/6 3
Taiwan
Novartis (Taiwan) Co., Ltd., Taipei TWD 170.0 m 100
Thailand
Novartis (Thailand) Limited, Bangkok THB 302.0 m 100
Alcon Laboratories (Thailand)
Limited, Bangkok THB 228.1 m 100
Turkey
Novartis Saglik, Gida ve Tarim
Ürünleri Sanayi ve Ticaret A.S., Istanbul TRY 98.0 m 100
Alcon Laboratuvarlari Ticaret A.S., Istanbul TRY 25.2 m 100
Sandoz Ilaç Sanayi ve Ticaret A.S., Istanbul TRY 165.2 m 99.99
Sandoz Syntek Ilaç Hammaddeleri
Sanayi ve Ticaret A.S., Tuzla – Istanbul TRY 46.0 m 100
Sandoz Grup Saglik Ürünleri
Ilaçlari Sanayi ve Ticaret A.S., Gebze – Kocaeli TRY 50.0 m 100
United arab emirates
Novartis Middle East FZE, Dubai AED 7.0 m 100
United Kingdom
Novartis UK Limited, Frimley/Camberley GBP 25.5 m 100
Novartis Pharmaceuticals UK Limited, Frimley/Camberley GBP 5.4 m 100
Novartis Grimsby Limited, Frimley/Camberley GBP 250.0 m 100
Alcon Eye Care UK Limited, Frimley/Camberley GBP 550 000 100
Sandoz Limited, Frimley/Camberley GBP 2.0 m 100
Glaxosmithkline Consumer Healthcare
Holdings Limited, Brentford, Middlesex GBP 100 000 36.5
United States of america
Novartis Corporation, East Hanover, NJ USD 72.2 m 100
Novartis Finance Corporation, New York, NY USD 1 000 100
Novartis Capital Corporation, New York, NY USD 1 100
Novartis Pharmaceuticals
Corporation, East Hanover, NJ USD 5.2 m 100
Novartis Institutes for BioMedical
Research, Inc., Cambridge, MA USD 1 100
Novartis Institute for Functional
Genomics, Inc., San Diego, CA USD 21 000 100
Genoptix, Inc., Carlsbad, CA USD 1 100
Alcon Laboratories Holding Corporation, Fort Worth, TX USD 10 100
Alcon Laboratories, Inc., Fort Worth, TX USD 1 000 100
Alcon Refractivehorizons, LLC, Fort Worth, TX USD 10 100
Alcon Research, Ltd., Fort Worth, TX USD 12.5 100
Alcon Lensx, Inc., Aliso Viejo, CA USD 100 100
Sandoz Inc., Princeton, NJ USD 25 000 100
Fougera Pharmaceuticals Inc., Melville, NY USD 1 100
Eon Labs, Inc., Princeton, NJ USD 1 100
Novartis Vaccines and Diagnostics,
Inc., Cambridge, MA USD 3 100
Novartis Services, Inc., East Hanover, NJ USD 1 100
Venezuela Novartis de Venezuela, S.A., Caracas VEF 1.4 m 100
Alcon Pharmaceutical, C.A., Caracas VEF 5.5 m 100
In addition, the Group is represented by subsidiaries and associated companies in the following countries: Bosnia/Herzegovina, Bulgaria, Dominican Republic, Guatemala, the Former Yugoslav Republic of Macedonia, Nigeria, Peru, Puerto Rico, Ukraine and Uruguay.
1 Share/paid-in capital may not reflect the taxable share/paid-in capital amount and does not include any paid-in surplus.
2 Shares without par value3 Approximately 33% of voting shares; approximately 6% of total net income and
equity attributable to Novartism = million; bn = billion

248 | Novartis Annual Report 2016
Report of Novartis management on internal control over financial reporting
The Board of Directors and management of the Group are responsible for establishing and maintaining ade-quate internal control over financial reporting. The Novartis Group’s internal control system was designed to provide reasonable assurance to the Novartis Group’s management and Board of Directors regarding the reli-ability of financial reporting and the preparation and fair presentation of its published consolidated financial statements.
All internal control systems, no matter how well designed, have inherent limitations. Therefore, even those systems determined to be effective may not prevent or detect misstatements and can provide only reasonable assur-ance with respect to financial statement preparation and presentation. Also, projections of any evaluation of effec-tiveness to future periods are subject to the risk that con-trols may become inadequate because of changes in conditions or that the degree of compliance with the pol-icies or procedures may deteriorate.
Novartis Group management assessed the effectiveness of the Group’s internal control over financial reporting as of December 31, 2016. In making this assessment, it used the criteria established in Internal Control – Inte-grated Framework(2013) issued by the Committee of Sponsoring Organizations of the Treadway Commission (COSO). Based on its assessment, management has concluded that, as of December 31, 2016, the Novartis Group’s internal control over financial reporting was effective based on those criteria.
PricewaterhouseCoopers AG, Switzerland, an indepen-dent registered public accounting firm, has issued an opinion on the existence and effec tiveness of the Group’s internal control over financial reporting which is included in this financial report on the pages 249 and 254 respec-tively.
Joseph Jimenez Harry KirschChief Executive Officer Chief Financial Officer
Basel, January 24, 2017

Novartis Annual Report 2016 | 249FINaNcIal RepORTReport of the statutory auditor on the consolidated financial statements of Novartis aG
Report of the statutory auditor on the consolidated financial statements of Novartis AG
To the general meeting of Novartis AG, Basel
Opinion
We have audited the consolidated financial statements of Novartis AG and its consolidated subsidiaries (“Novartis Group”), which comprise the consolidated income statements, consolidated statements of compre-hensive income, consolidated statements of changes in equity, consolidated balance sheets and consolidated cash flow statements and notes (pages 178 to 247) for the year ended December 31, 2016.
In our opinion the consolidated financial statements give a true and fair view of the consolidated financial position of the Group as at December 31, 2016, and its consolidated financial performance and its consolidated cash flows for the year then ended in accordance with International Financial Reporting Standards (IFRS) as issued by the International Accounting Standards Board and comply with Swiss law.
Basis for opinion
We conducted our audit in accordance with Swiss law, Swiss Auditing Standards and International Standards on Auditing (ISAs). Our responsibilities under those pro-visions and standards are further described in the Audi-tor’s responsibilities for the audit of the consolidated financial statements section of our report.
We are independent of the Group in accordance with the provisions of Swiss law and the requirements of the Swiss audit profession, as well as the IESBA Code of Ethics for Professional Accountants, and we have ful-filled our other ethical responsibilities in accordance with these requirements.
We believe that the audit evidence we have obtained is sufficient and appropriate to provide a basis for our opinion.
Our audit approach
Overview— Overall Group materiality: USD 400 million which rep-
resents 5% of income before taxes from continuing operations, rounded.
— We concluded full scope audit work at the Group’s three operating divisions and at 28 reporting entities, including reporting entities of the Corporate Division, in 13 countries
— Our audit scope addressed over 67% of the Group’s net sales and 79% of Group’s total assets
— In addition, specified procedures were performed on a further 14 reporting entities in 11 countries repre-senting a further 4% of the Group’s net sales and 6% of the Group’s total assets
As key audit matters, the following areas of focus have been identified:— Carrying value of goodwill following group reorganization— Carrying value of intangible assets other than goodwill— Governmental investigations and litigations — Rebates, discounts, allowances and returns
Audit scopeWe designed our audit by determining materiality and assessing the risks of material misstatement in the con-solidated financial statements. In particular, we consid-ered where subjective judgements were made; for exam-ple, in respect of significant accounting estimates that involved making assumptions and considering future events that are inherently uncertain. As in all of our audits, we also addressed the risk of management override of internal controls, including among other matters consid-eration of whether there was evidence of bias that rep-resented a risk of material misstatement due to fraud.
How we tailored the audit scope We tailored the scope of our audit in order to perform sufficient work to enable us to provide an opinion on the financial statements as a whole, taking into account the structure of the Group, the accounting processes and controls, and the industry in which the Group operates.
The Group financial statements are a consolidation of over 300 reporting entities. We identified 28 reporting entities that, in our view, required an audit of their com-plete financial information due to their size or risk charac-teristics. We worked very closely with and received full scope reporting from the divisional audit teams for Inno-vative Medicines, Alcon and Sandoz, in Switzerland, the United States of America and Germany, respectively. Spe-cific procedures were also carried out at a further 14 reporting entities to give appropriate coverage of mate-rial balances. None of the reporting entities excluded from our Group audit scope individually contributed more than 5% to net sales or total assets. Further specific audit pro-cedures over group functions (including taxation, treasury, post-retirement benefits and litigation) and the Group con-solidation were executed directly by the Group audit team.
In order to exercise the appropriate direction and supervision over the work of the divisional and reporting entity auditors, the Group engagement team performed selected site visits, audit working paper reviews and con-ference calls with the divisional and reporting entity audi-tors and attended selected clearance meetings with divi-sional auditors. In addition, we hosted a planning workshop in May 2016 for audit Partners and Managers responsible for divisional and reporting entities.
MaterialityThe scope of our audit was influenced by our applica-tion of materiality. Our audit opinion aims to provide rea-sonable assurance that the consolidated financial state-

250 | Novartis Annual Report 2016
ments are free from material misstatement. Misstatements may arise due to fraud or error. They are considered material if individually or in aggregate, they could rea-sonably be expected to influence the economic deci-sions of users taken on the basis of the consolidated financial statements.
Based on our professional judgement, we determined certain quantitative thresholds for materiality, including the overall group materiality for the consolidated finan-cial statements as a whole, as listed below. These, together with qualitative considerations, helped us to determine the scope of our audit and the nature, timing and extent of our audit procedures and to evaluate the effect of misstatements, if any, both individually and in aggregate on the consolidated financial statements as a whole.
Overall group materialityUSD 400 million
How we determined it5% of income before taxes from continuing operations, rounded
Rationale for the materiality benchmark appliedWe chose income before taxes as the measure because, in our view, it is the measure against which the perfor-mance of the Group is most commonly assessed and is a generally accepted benchmark.
We agreed with the Audit and Compliance Committee that we would report to them misstatements identified during our audit above USD 20 million as well as any mis-statements below that amount which, in our view, war-ranted reporting for qualitative reasons.
Key Audit Matters
Key audit matters are those matters that, in our professional judgment, were of most significance in our audit of the consolidated financial statements of the current period. These matters were addressed in the context of our audit of the consolidated financial statements as a whole, and in forming our opinion thereon, and we do not provide a separate opinion on these matters.
Key audit matter
carrying value of goodwill following group reorgani-zationThe Group has goodwill of USD 31.0 billion at December 31, 2016.
In January 2016 the Group announced changes to the divisional structure with the former Pharmaceuticals Division becoming the Innovative Medicines Division and undertook the reorganization described in more detail in Note 3 on page 193 of the annual report (Segmentation of key figures 2016, 2015 and 2014).
Following the reorganization, management updated its assessment of the groups of cash generating units (CGUs) used as a basis for assessing goodwill and real-located the goodwill amongst CGUs based on the rela-tive fair values of the individual businesses.
The assessment of the carrying value of the goodwill balances is dependent on the estimation of future cash flows. In particular, those assessments and judgments made to support the carrying value of the goodwill allo-cated to the Alcon Division were critical, given the 2016 underlying results of Alcon.
Refer to Note 1 Significant accounting policies (pages 184 to 185) and Note 11 Goodwill and intangible assets (pages 207 to 208).
How our audit addressed the key audit matter
We assessed and tested the design and operating effec-tiveness of the Group’s controls over the assessment of the carrying value of goodwill and concluded that these operate effectively.
In relation to the reorganization we assessed the aggregation of CGUs through review of the relevant doc-uments of the Executive Committee of Novartis (ECN) confirming that it is the lowest level at which manage-ment monitors goodwill for internal purposes and that no grouping of CGUs for goodwill impairment testing purposes is larger than any of the Group’s operating seg-ments.
With respect to the reallocation of goodwill relating to the Ophthalmic Pharmaceuticals franchise, we tested the respective models determining the relative fair values of the businesses and the related goodwill focusing on the reason-ableness of the key assumptions, including revenue and prof-itability growth, the success of new product launches, ter-minal values and discount rates, by challenging management to substantiate its assumptions and comparing them to the relevant industry and economic forecasts.
We tested, with the support of our valuation special-ists, the carrying value of the goodwill allocated to Alcon as at December 31, 2016 focusing on the reasonable-ness of the cash flows growth rate after the forecast period assumption of 3%, given that this rate is above both the growth rate achieved by Alcon recently and the rate of inflation in key markets at the end of 2016. We also challenged management to substantiate its key assumptions in the cash flow projections during the fore-cast period and its intention and ability to execute their strategic initiatives and evaluated the reasonableness of the discount rate applied to those future cash flows.
We assessed management’s sensitivity analysis around key estimates to quantify the downside changes in assumptions that could result in an impairment and the disclosures included in Note 11 Goodwill and intan-gible assets (pages 207 to 208) of the annual report.
As a result of our procedures, as discussed with the Audit and Compliance Committee, we determined that the con-clusions reached by management with regard to the carry-ing value of goodwill were reasonable and supportable.

Novartis Annual Report 2016 | 251FINaNcIal RepORTReport of the statutory auditor on the consolidated financial statements of Novartis aG
Key audit matter
carrying value of intangible assets other than good-willThe Group has intangible assets other than goodwill totaling USD 31.3 billion at December 31, 2016, compris-ing research and development acquired, currently mar-keted products, marketing know-how, technologies, the Alcon brand name and other intangible assets. The Group recognized specific impairments of intangible assets other than goodwill of USD 591 million during the year.
The assessment of the carrying values of intangible assets is dependent on future cash flows and if these are below initial expectations there is a risk that the assets will be impaired. The reviews of carrying values performed by the Group contain a number of significant judgements and estimates such as scientific success, revenue growth, the success of new product launches, profit margins and discount rates.
The carrying value assessments of the following intangible assets includes the most significant risk and highest level of judgement:— The Alcon brand name is an indefinite life corporate
asset and not subject to amortization.— Certain currently marketed products which have per-
formed below management’s expectation or were, in our view, at a greater risk of impairment.
— Products in development, as the assessment of their carrying value is challenging due to management being required to make judgements both as to the probability of scientific success and regulatory approval of the developments across indications, as well as the probability of commercial success of the subsequent product launches.
Refer to Note 1 Significant accounting policies (pages 184 to 185) and Note 11 Goodwill and intangible assets (pages 207 to 208).
How our audit addressed the key audit matter
We assessed and tested the design and operating effec-tiveness of the Group’s controls over the assessment of the carrying value of intangible asset other than good-will and concluded that these operate effectively, spe-cifically in respect to the identification of impairment trig-gering events.
We obtained the Group’s carrying value calculations and assessed the key assumptions. For the Alcon brand name and the currently marketed products these assumptions specifically included pricing, market size and share and competition assumptions.
In addition, for the assessment of the Alcon brand name we challenged the indefinite life designation of the asset considering the performance of the business in 2016 and the internal reorganization described in Note 3 on page 193 of the annual report (Segmentation of key figures 2016, 2015 and 2014). We discussed with the Audit and Compliance Committee and management their judgements and conclusion on the indefinite life desig-nation of the Alcon brand name as well as their strategic initiatives.
For selected currently marketed products and prod-ucts in development, with the support of our valuation specialists, we considered third party sources to chal-lenge expected future revenues due to actions by com-petitors or due to changes in relevant markets.
Furthermore, for products in development we also considered key scientific developments. We performed our own sensitivity analysis around these key estimates to ascertain the extent of change in those assumptions that either individually or collectively would be required for the intangible assets tested to be impaired.
As a result of our procedures we did not propose any adjustments to the amount of impairment recognized in 2016. For those intangible assets where management determined that no impairment was required, we found that the assessments made by management were based upon reasonable assumptions, consistently applied.
Key audit matter
Governmental investigations and litigationsThe pharmaceuticals industry is heavily regulated which increases inherent litigation risk.
The Group is subject to various government investi-gations, of which the most significant are disclosed in Note 20 Provisions and other non-current liabilities.
We specifically assessed the investigations and related litigations in the US given their significance and the inherent uncertainty of outcomes.
Refer to Note 1 Significant accounting policies on page 186 and Note 20 Provisions and other non-current liabilities (pages 216 to 220).
How our audit addressed the key audit matter
We assessed and tested the design and operating effec-tiveness of the Group’s controls over the completeness, assessment for recognition, measurement and disclo-sures of provisions for governmental investigations and other legal matters and concluded that these operate effectively.
We evaluated management’s judgments in connec-tion with the investigations and related litigations in the US, read the respective court filings and minutes of Board of Directors and management meetings and inquired with the Audit and Compliance Committee, man-agement, internal and external legal counsel.
We concluded that the judgements made by manage-ment were in accordance with the accounting policies described in Note 1.

252 | Novartis Annual Report 2016
Key audit matter
Rebates, discounts, allowances and returnsThe Group distributes its products in many cases through wholesale distributors, however the ultimate net selling prices are determined based on the contractual arrange-ments that the Group has with the ultimate patient’s insurer or other payment program.
The initial revenue recognition, usually upon shipment to the distributor requires an estimate of the net selling price taking into consideration rebates and discounts as well as sales returns. The estimate depends on contract terms and regulation, as well as forecasts of sales vol-umes by sales channel. The dispensing of the product to the patient and the final determination of the selling price may be several months later.
We focused our testing on the accruals for both rebates and discounts together with sales returns rec-ognized at the year end because, specifically for Medic-aid and Medicare or equivalent programs in the US, the estimation processes involve large volumes of data, require significant judgement and can be at risk of man-agement bias.
The provision reported as of December 31, 2016 for revenue deductions amounted to USD 4.2 billion.
Refer to Note 22 Provisions and other current liabil-ities (pages 221 and 222).
How our audit addressed the key audit matter
We performed procedures to assess the design and operating effectiveness of the controls related to the recording of rebates, discounts and sales returns and the estimation of related period end reserves.
We obtained management’s calculations for the respective estimates and performed one or more of the following procedures on each of them: developed an independent expectation of the reserve and/or tested management’s estimation process to assess the reason-ableness of the recorded reserve balances, performed retrospective reviews and assessed subsequent events. We also performed testing of credits issued and pay-ments made throughout the year, reviewed related con-tracts and independently confirmed sales terms with sig-nificant customers and inventory levels with the largest wholesalers.
We did not identify any material differences between our independent expectations and the accruals and we found the judgements made by management to be rea-sonable.
Other information in the annual report
The Board of Directors is responsible for the other infor-mation in the annual report. The other information com-prises all information included in the annual report, but does not include the consolidated financial statements, the stand-alone financial statements of Novartis AG and our auditor’s reports thereon. Our opinion on the con-solidated financial statements does not cover the other information in the annual report and we do not express any form of assurance conclusion thereon.
In connection with our audit of the consolidated finan-cial statements, our responsibility is to read the other information in the annual report and, in doing so, con-sider whether the other information is materially incon-sistent with the consolidated financial statements or our knowledge obtained in the audit, or otherwise appears to be materially misstated. If, based on the work we have performed, we conclude that there is a material misstate-ment of this other information, we are required to report that fact.
We have nothing to report in this regard.
Responsibilities of the Board of Directors for the consolidated financial statements
The Board of Directors is responsible for the prepara-tion of the consolidated financial statements that give a true and fair view in accordance with International Finan-cial Reporting Standards and the provision of Swiss law,
and for such internal control as the Board of Directors determines is necessary to enable the preparation of consolidated financial statements that are free from material misstatement, whether due to fraud or error.
In preparing the consolidated financial statements, the Board of Directors is responsible for assessing the Group’s ability to continue as a going concern, disclos-ing, as applicable, matters related to going concern and using the going concern basis of accounting unless the Board of Directors either intends to liquidate the Group or to cease operations, or has no realistic alternative but to do so.
Auditor’s responsibilities for the audit of the consolidated financial statements
Our objectives are to obtain reasonable assurance about whether the consolidated financial statements as a whole are free from material misstatement, whether due to fraud or error, and to issue an auditor’s report that includes our opinion. Reasonable assurance is a high level of assurance, but is not a guarantee that an audit conducted in accordance with Swiss law, ISAs and Swiss Auditing Standards will always detect a material mis-statement when it exists. Misstatements can arise from fraud or error and are considered material if, individually or in the aggregate, they could reasonably be expected to influence the economic decisions of users taken on the basis of these consolidated financial statements.

Novartis Annual Report 2016 | 253FINaNcIal RepORTReport of the statutory auditor on the consolidated financial statements of Novartis aG
As part of an audit in accordance with Swiss law, ISAs and Swiss Auditing Standards, we exercise professional judgment and maintain professional skepticism through-out the audit. We also:— Identify and assess the risks of material misstatement
of the consolidated financial statements, whether due to fraud or error, design and perform audit procedures responsive to those risks, and obtain audit evidence that is sufficient and appropriate to provide a basis for our opinion. The risk of not detecting a material misstatement resulting from fraud is higher than for one resulting from error, as fraud may involve collu-sion, forgery, intentional omissions, misrepresenta-tions, or the override of internal control.
— Obtain an understanding of internal control relevant to the audit in order to design audit procedures that are appropriate in the circumstances.
— Evaluate the appropriateness of accounting policies used and the reasonableness of accounting esti-mates and related disclosures made.
— Conclude on the appropriateness of Board of Direc-tors’ use of the going concern basis of accounting and, based on the audit evidence obtained, whether a material uncertainty exists related to events or con-ditions that may cast significant doubt on the Group’s ability to continue as a going concern. If we conclude that a material uncertainty exists, we are required to draw attention in our auditor’s report to the related disclosures in the consolidated financial statements or, if such disclosures are inadequate, to modify our opinion. Our conclusions are based on the audit evi-dence obtained up to the date of our auditor’s report. However, future events or conditions may cause the Group to cease to continue as a going concern.
— Evaluate the overall presentation, structure and con-tent of the consolidated financial statements, includ-ing the disclosures, and whether the consolidated financial statements represent the underlying trans-actions and events in a manner that achieves fair pre-sentation.
— Obtain sufficient appropriate audit evidence regard-ing the financial information of the entities or business activities within the Group to express an opinion on the consolidated financial statements. We are respon-sible for the direction, supervision and performance of the group audit. We remain solely responsible for our audit opinion.
We communicate with the Board of Directors or its rel-evant committee regarding, among other matters, the planned scope and timing of the audit and significant audit findings, including any significant deficiencies in internal control that we identify during our audit.
We also provide the Board of Directors or its relevant committee with a statement that we have complied with relevant ethical requirements regarding independence, and to communicate with them all relationships and other matters that may reasonably be thought to bear on our independence, and where applicable, related safe-guards.
From the matters communicated with the Board of Directors or its relevant committee, we determine those matters that were of most significance in the audit of the consolidated financial statements of the current period and are therefore the key audit matters. We describe these matters in our auditor’s report unless law or regu-lation precludes public disclosure about the matter or when, in extremely rare circumstances, we determine that a matter should not be communicated in our report because the adverse consequences of doing so would reasonably be expected to outweigh the public interest benefits of such communication.
Report on other legal and statutory requirements
In accordance with article 728a paragraph 1 item 3 CO and Swiss Auditing Standard 890, we confirm that an internal control system exists which has been designed for the preparation of consolidated financial statements according to the instructions of the Board of Directors.
We recommend that the consolidated financial state-ments submitted to you be approved.
PricewaterhouseCoopers AG
Bruno Rossi Stephen JohnsonAudit expert Global relationshipAuditor in charge partner
Basel, January 24, 2017
The report set out on pages 249 to 253 is included in accordance with the requirements of Swiss Law and does not form part of the Novartis AG Annual Report pursuant to section 13 or 15(d) of the securities exchange act of 1934 as filed with the US Securities and Exchange Commission (SEC) on Form 20-F. The report of the Independent Registered Public Accounting Firm as included in the Form 20-F is reprinted for information purposes on page 254.

254 | Novartis Annual Report 2016
Report of Independent Registered Public Accounting Firm
To the Shareholders and Board of Directors of Novartis AG, Basel
In our opinion, the accompanying consolidated balance sheets and the related consolidated income statements, consolidated statements of comprehensive income, con-solidated statements of changes in equity, consolidated cash flow statements and notes (as referred to in item 18 of this Form 20-F) present fairly, in all material respects, the financial position of Novartis AG and its consolidated subsidiaries (Group or Company) at December 31, 2016 and December 31, 2015, and the results of its operations and its cash flows for each of the three years in the period ended December 31, 2016 in conformity with International Financial Reporting Stan-dards (IFRS) as issued by the International Accounting Standards Board. Also in our opinion, the Company maintained, in all material respects, effective internal control over financial reporting as of December 31, 2016, based on criteria established in Internal Control – Inte-grated Framework (2013) issued by the Committee of Sponsoring Organizations of the Treadway Commission (COSO).
The Novartis’ Board of Directors and management of the Group are responsible for these financial statements, for maintaining effective internal control over financial reporting and for its assessment of the effectiveness of internal control over financial reporting, included in the “Report of Novartis Management on Internal Control Over Financial Reporting” in item 15(b) of this Form 20-F. Our responsibility is to express opinions on these financial statements and on the Company’s internal control over financial reporting based on our integrated audits. We conducted our audits in accordance with the standards of the Public Company Accounting Oversight Board of the United States of America. Those standards require that we plan and perform the audits to obtain reasonable assurance about whether the financial statements are free of material misstatement and whether effective internal control over financial reporting was maintained in all material respects. Our audits of the financial state-ments included examining, on a test basis, evidence sup-porting the amounts and disclosures in the financial statements, assessing the accounting principles used and significant estimates made by management, and evaluating the overall financial statement presentation. Our audit of internal control over financial reporting included obtaining an understanding of internal control over financial reporting, assessing the risk that a mate-rial weakness exists, and testing and evaluating the
design and operating effectiveness of internal control based on the assessed risk. Our audits also included performing such other procedures as we considered necessary in the circumstances. We believe that our audits provide a reasonable basis for our opinions.
A company’s internal control over financial reporting is a process designed to provide reasonable assurance regarding the reliability of financial reporting and the preparation of financial statements for external purposes in accordance with IFRS. A company’s internal control over financial reporting includes those policies and pro-cedures that (i) pertain to the maintenance of records that, in reasonable detail, accurately and fairly reflect the transactions and dispositions of the assets of the com-pany; (ii) provide reasonable assurance that transactions are recorded as necessary to permit preparation of financial statements in accordance with IFRS, and that receipts and expenditures of the company are being made only in accordance with authorizations of manage-ment and directors of the company; and (iii) provide rea-sonable assurance regarding prevention or timely detec-tion of unauthorized acquisition, use, or disposition of the company’s assets that could have a material effect on the financial statements.
Because of its inherent limitations, internal control over financial reporting may not prevent or detect mis-statements. Also, projections of any evaluation of effec-tiveness to future periods are subject to the risk that con-trols may become inadequate because of changes in conditions, or that the degree of compliance with the policies or procedures may deteriorate.
PricewaterhouseCoopers AG
Bruno Rossi Stephen JohnsonAudit expert Global relationshipAuditor in charge partner
Basel, January 24, 2017
The report of the Independent Registered Public Accounting Firm set out above is reprinted for information purposes only and is a copy of the report included in the Novartis AG Annual Report pursuant to section 13 or 15(d) of the securities exchange act of 1934 as filed with the US Securities and Exchange Commission (SEC), on Form 20-F. The report does not form part of the reporting to the general meeting as required by Swiss Law.

Novartis Annual Report 2016 | 255Financial RepoRtFinancial statements of novartis aG
Financial statements of Novartis AGincome statements (For the years ended December 31, 2016 and 2015)(CHF millions) Note 2016 2015
Income from investment in Group subsidiaries 7 291 6 168
License income 1 445 1 098
Gain from disposal of intangibles assets 495 558
Other income 11 8
Total income 9 242 7 832
Amortization of goodwill and other intangible assets 3 – 1 140 – 1 143
Administrative expenses – 26 – 27
Other expenses – 4 – 31
Total expenses – 1 170 – 1 201
operating income 8 072 6 631
Financial income 4 440 562
Financial expenses 4 – 194 – 253
income before extraordinary income and taxes 8 318 6 940
Extraordinary income, net 5 1 422
Extraordinary expenses, net 5 – 56
income before taxes 8 318 8 306
Direct taxes – 177 – 265
net income of the year 8 141 8 041
The accompanying Notes form an integral part of these financial statements.

256 | Novartis Annual Report 2016
Balance sheets (At December 31, 2016 and 2015) (CHF millions) Note 2016 2015
assets
current assets
Cash and cash equivalents 3 103
Receivables
Group subsidiaries 4 163 3 318
Third parties 24 159
total current assets 4 190 3 580
non-current assets
Financial assets
Group subsidiaries 14 978 15 884
Third parties
Investments 6
Group subsidiaries 12 630 10 996
Third parties 0 0
Goodwill and other intangible assets 3 15 507 16 647
total non-current assets 43 115 43 527
total assets 47 305 47 107
liabilities and equity
current liabilities
Other current liabilities
Group subsidiaries 48 77
Third parties 8 118
Accrued expenses 185 378
Deferred income 19 55
total current liabilities 260 628
non-current liabilities
Interest-bearing non-current liabilities
Bonds 7 1 378 1 378
Non-current provisions 502 505
total non-current liabilities 1 880 1 883
equity
Share capital 8 1 314 1 338
legal capital reserves – capital contribution reserve 198 198
General reserve 320 320
Reserve for treasury shares held by subsidiaries 9 3 417 4 009
total legal retained earnings 3 737 4 329
Free reserves 10 30 527 34 560
Retained earnings 2 040 806
Net income of the year 8 141 8 041
Retained earnings available for distribution at the end of the year 10 181 8 847
total unappropriated earnings 40 708 43 407
treasury shares held by novartis aG 9 – 792 – 4 676
total equity 45 165 44 596
total liabilities and equity 47 305 47 107
The accompanying Notes form an integral part of these financial statements.

Novartis Annual Report 2016 | 257Financial RepoRtnotes to the financial statements of novartis aG
Notes to the financial statements of Novartis AG1. introductionThe financial statements of Novartis AG, with its regis-tered office in Basel, comply with the requirements of the Swiss accounting legislation of the Swiss Code of Conduct.
Novartis AG is presenting consolidated financial statements according to IFRS. As a result, these finan-cial statements and notes do not include additional dis-closures, cash flow statements or a management report.
2. accounting policiesFinancial income and expenses
Current assets and current liabilities denominated in for-eign currencies are converted at year-end exchange rates. Realized exchange gains and losses, and all unre-alized exchange losses arising from these as well as those from business transactions are recorded net as financial income or financial expenses.
Derivative financial instruments
Derivative financial instruments are used for hedging pur-poses. These instruments are valued at fair value. When different accounting policies apply for the hedged item and the derivative financial instrument, hedge account-ing is applied through measuring the hedged item together with the derivative financial instrument.
Financial assets
Financial assets are valued at acquisition cost less adjustments for foreign currency losses and any other impairment of value.
Investments
Investments are initially recognized at cost. Investments in Novartis Group subsidiaries are assessed annually and in case of an impairment adjusted to their recoverable amount within their category.
Goodwill and other intangible assets
Goodwill and other intangible assets are capitalized and amortized over a period of between five and 20 years. Goodwill and other intangible assets are reviewed for impairment on a yearly basis. If necessary, an impairment loss is recognized.
Bonds
Bonds are valued at nominal value. Any bond premium is accrued over the duration of the bond so that at matu-rity the balance sheet amount will equal the amount that is due to be paid.
Provisions
Provisions are made to cover general business risks of the Group.

258 | Novartis Annual Report 2016
3. Goodwill and other intangible asset movements
(CHF millions) 2016 2015
Goodwill
Gross cost 1 22 350 22 350
Accumulated amortization
January 1 – 5 703 – 4 560
Amortization charges – 1 140 – 1 143
December 31 – 6 843 – 5 703
net book value at December 31 15 507 16 647
other intangible assets
Cost
January 1 11 255
Additions
Disposal as a result of the Novartis OTC divestment to GSK – 244
December 31 11 11
Accumulated amortization
January 1 – 11 – 120
Amortization charges – 3
Disposal as a result of the Novartis OTC divestment to GSK 112
December 31 – 11 – 11
net book value at December 31 0 0
Goodwill and other intangible assets
net book value at December 31 15 507 16 647
1 There was no change to cost value of Goodwill during 2016 and 2015.
4. Financial income and expenses 2016 2015
(CHF millions) Income Expenses Income Expenses
Interest 440 – 134 562 – 176
Foreign exchange – 58 – 74
Others – 2 – 3
total 440 – 194 562 – 253
5. extraordinary income and expenses, netIn 2015, a net divestment gain of CHF 1 422 million due to the Novartis Animal Health divestment to Eli Lilly and Company, USA, and an extraordinary expense related to prior year direct taxes of CHF 56 million, were recorded.

Novartis Annual Report 2016 | 259Financial RepoRtnotes to the financial statements of novartis aG
6. investments
The principal direct and indirect subsidiaries and other holdings of Novartis AG are shown in Note 32 to the Group’s consolidated financial statements.
7. BondsStraight bonds(CHF millions) 2016 2015
0.250% CHF 500 million bond 2015/2025 of Novartis AG, Basel, Switzerland, issued at 100.64% 502 502
0.625% CHF 550 million bond 2015/2029 of Novartis AG, Basel, Switzerland, issued at 100.502% 551 551
1.050% CHF 325 million bond 2015/2035 of Novartis AG, Basel, Switzerland, issued at 100.479% 325 325
total straight bonds 1 378 1 378
Breakdowns by maturity(CHF millions) 2016 2015
After 2021 1 378 1 378
total 1 378 1 378
comparison of balance sheet and fair value 2016 2016 2015 2015
(CHF millions) Balance sheet Fair values Balance sheet Fair values
Straight bonds 1 378 1 407 1 378 1 356
total 1 378 1 407 1 378 1 356
On June 26, 2008, Novartis AG issued a CHF 800 mil-lion bond bearing interest at 3.625% per annum. The bond was repaid on June 26, 2015. On February 13, 2015, Novartis AG issued three new bonds of CHF 500 million
(bearing interest at 0.25% per annum), CHF 550 million (bearing interest at 0.625% per annum), and CHF 325 million (bearing interest at 1.050% per annum).

260 | Novartis Annual Report 2016
8. Share capital
2016 2015
Number Share capital Number Share capital
of shares CHF millions of shares CHF millions
January 1 2 676 993 000 1 338.5 2 706 193 000 1 353.1
Number of shares canceled/capital reduced during the period – 49 878 180 – 24.9 – 29 200 000 – 14.6
December 31 2 627 114 820 1 313.6 2 676 993 000 1 338.5
The Novartis AG share capital consists of registered shares with a nominal value of CHF 0.50 each.
The total share capital decreased from CHF 1 338.5 million at December 31, 2015, to CHF 1 313.6 million at December 31, 2016, due to a share capital reduction as a result of the cancellation of 49.9 million repurchased shares with a nominal value of CHF 24.9 million. The can-cellation was approved at the Annual General Meeting of February 23, 2016, and became effective on April 28, 2016. During 2015, the total share capital decreased from CHF 1 353.1 million at December 31, 2014, to CHF 1 338.5 million at December 31, 2015, due to a share capital reduction as a result of the cancellation of 29.2 million
repurchased shares with a nominal value of CHF 14.6 million. The cancellation was approved at the Annual General Meeting of February 27, 2015, and became effective on May 6, 2015.
In 2014, Novartis entered into an irrevocable, non-dis-cretionary arrangement with a bank to repurchase its own shares on the second trading line under its USD 5 billion share buyback as well as to mitigate dilution from employee participation programs. In 2015, this trading plan was fully executed and expired. As a result, there is no contingent liability related to this plan as of Decem-ber 31, 2015 and December 31, 2016.

Novartis Annual Report 2016 | 261Financial RepoRtnotes to the financial statements of novartis aG
9. Reserve for treasury shares
2016 2015
Reserve for Reserve for
treasury shares treasury shares
Number held by subsidiaries Number held by subsidiaries
of shares CHF millions of shares CHF millions
treasury shares held by subsidiaries 1
January 1 65 176 383 4 009 73 564 212 4 522
Number of shares purchased/sold; reserves transferred – 8 328 580 – 592 – 8 387 829 – 513
December 31 56 847 803 3 417 65 176 383 4 009
1 Excluding foundations
2016 2015
Reserve for Reserve for
treasury shares treasury shares
Number held by Novartis AG Number held by Novartis AG
of shares CHF millions of shares CHF millions
treasury shares held by novartis aG
January 1 101 185 638 4 676 80 507 458 2 373
Number of shares purchased/canceled; reserves transferred – 39 608 180 – 3 884 20 678 180 2 303
December 31 61 577 458 792 101 185 638 4 676
2016 2015
Total reserve for Total reserve for
Number of treasury shares Number treasury shares
shares CHF millions of shares CHF millions
total treasury shares 1
January 1 166 362 021 8 685 154 071 670 6 895
Total number of shares purchased/sold or canceled;
reserves transferred – 47 936 760 – 4 476 12 290 351 1 790
December 31 118 425 261 4 209 166 362 021 8 685
1 Excluding foundations
Novartis AG has met the legal requirements for legal reserves under Articles 659 et. seq. and 663b.10 SCO for the treasury shares.
Treasury share purchases during 2016 totaled 12.9 million (2015: 63.6 million), with an average purchase price of CHF 75 (2015: CHF 93). Treasury share sales totaled 4.1 million (2015: 27.0 million), with an average sale price of CHF 56 (2015: CHF 56), and share-based compensation transactions totaled 8.8 million shares (2015: 11.3 million shares).
The number of treasury shares held by the company and its subsidiaries meet the definitions and require-ments of Article 659b SCO. At December 31, 2016, trea-sury shares held by Novartis AG and its subsidiaries totaled 118 425 261. As per the dividend payment date, Novartis AG and its subsidiaries are expected to hold 108 579 219 shares. These shares are non-divi-dend-bearing shares. It should be noted that within the Novartis Group’s IFRS consolidated financial statements, some entities are included in the consolidation scope – mainly foundations, which do not qualify as subsidiaries in the sense of Article 659b SCO.

262 | Novartis Annual Report 2016
10. Free reserves
(CHF millions) 2016 2015
January 1 34 560 36 380
Reduction due to cancellation of treasury shares (CHF 4 651 million / CHF 2 348 million of repurchased shares
less their nominal value of CHF 25 million / CHF 15 million) – 4 626 – 2333
Transfer from reserve for treasury shares 593 513
December 31 30 527 34 560
11. contingent liabilities(CHF millions) Dec 31, 2016 Dec 31, 2015
Guarantees in favor of subsidiaries to cover capital and interest of bonds, credit facilities and commercial paper programs –
total maximum amount CHF 39 369 million (2015: CHF 38 445 million) 19 708 16 850
Other guarantees in favor of subsidiaries, associated companies and others –
total maximum amount CHF 4 155 million (2015: CHF 2 707 million) 2 253 1 672
total contingent liabilities 21 961 18 522
Novartis AG is part of the Swiss Novartis value added tax (VAT) group and is therefore jointly liable for existing and future VAT claims from the Swiss Federal Tax Administration.
12. Registration, voting restrictions and major shareholdersThe company’s Articles of Incorporation state that no person or entity shall be registered with the right to vote for more than 2% of the share capital as set forth in the Commercial Register. In particular cases, the Board of Directors may allow exemptions from the limitation for registration in the share register.
According to the share register, shareholders own-ing 2% or more of the Company’s capital at December 31, excluding treasury shares held by Novartis AG and its subsidiaries that restrict their availability for use, are as follows:
% Holding of % Holding of
share capital share capital
Dec 31, 2016 Dec 31, 2015
Novartis Foundation for Employee
Participation, Basel 2.6 2.6
Emasan AG, Basel 3.4 3.3
UBS Fund Management
(Switzerland) AG, Basel 2.1 1.8
Furthermore, there are the following other significant share holders:
Shareholders registered as nominees:— Chase Nominees Ltd., London, holds 8.5% (2015: 8.8%).— Nortrust Nominees, London, holds 3.9% (2015: 3.2%).— The Bank of New York Mellon, New York, holds 4.4%
(2015: 4.6%) through its nominees The Bank of New York Mellon, Everett, with a holding of 1.8% (2015: 1.7%) and The Bank of New York Mellon, Brussels, with a hold-ing of 2.6% (2015: 2.9%).
Shareholder acting as American Depositary Share (ADS) depo sitary:— JPMorgan Chase Bank, New York, holds 12.0% (2015:
11.2%).
Shareholder disclosed through a notification filed with Novartis AG:— Norges Bank (Central Bank of Norway), Oslo, holds
2.02%.
Shareholders disclosed through notifications filed with Novartis AG and the SIX Swiss Exchange:— Capital Group Companies, Inc., Los Angeles, holds
between 3% and 5%.— BlackRock, Inc., New York, holds between 3% and 5%.

Novartis Annual Report 2016 | 263Financial RepoRtnotes to the financial statements of novartis aG
13. equity instrument disclosures for the Board of Directors and executive committee membersShare ownership requirements for Board membersThe Chairman is required to own a minimum of 30 000 Novartis shares, and other members of the Board of Directors are required to own at least 4 000 Novartis shares within three years after joining the Board of Direc-tors, to ensure alignment of their interests with share-holders. Board members are prohibited from hedging or pledging their ownership positions in Novartis shares that are part of their guideline share ownership require-ment, and are required to hold these shares for 12 months after retiring from the Board of Directors. As at Decem-ber 31, 2016, all members of the Board of Directors who have served at least three years on the Board of Direc-tors have complied with the share ownership guidelines.
Shares, ADRs and share options owned by Board membersThe total number of vested Novartis shares and ADRs owned by members of the Board of Directors and “per-sons closely linked”1 to them as at December 31, 2016 is shown in the table below.
As at December 31, 2016, no members of the Board of Directors together with “persons closely linked”1 to them owned 1% or more of the outstanding shares (or ADRs) of Novartis. As at the same date, no members of the Board of Directors held any share options to pur-chase Novartis shares.
Shares and ADRs owned by Board members1
Number of shares 2
at At
December 31, December 31,
2016 2015
Joerg Reinhardt 497 762 480 404
Enrico Vanni 17 853 15 566
Nancy Andrews 2 308 609
Dimitri Azar 11 217 9 292
Ton Buechner (from February 24, 2016) 1 398 NA
Srikant Datar 34 998 32 629
Elizabeth Doherty (from February 24, 2016) 839 NA
Ann Fudge 17 530 15 605
Pierre Landolt 3 58 061 54 866
Andreas von Planta 127 740 124 868
Charles L. Sawyers 6 029 4 252
William T. Winters 9 257 5 998
total 4 784 992 744 089
NA – Not applicable.1 Includes holdings of “persons closely linked” to Board members (see definition in this
Note 13)2 Each share provides entitlement to one vote.3 According to Pierre Landolt, the Sandoz Family Foundation is the economic
beneficiary of the shares.4 Verena A. Briner stepped down from the Board of Directors on February 23, 2016. On
February 23, 2016, Dr. Briner owned 7 507 shares.
Share ownership requirements for Executive Committee membersExecutive Committee members are required to own at least a minimum multiple of their annual base compen-sation in Novartis shares, Restricted Stock Units (RSUs) or share options within five years of hire or promotion, as set out in the table below.
In the event of a substantial rise or drop in the share price, the Board of Directors may, at its discretion, amend that time period accordingly.
Function Ownership level
CEO 5 x base compensation
Other Executive Committee members 3 x base compensation
The determination of equity amounts against the share ownership requirements is defined to include vested and unvested Novartis shares or ADRs, as well as RSUs acquired under the compensation plans. However, unvested matching shares granted under the Leveraged Share Savings Plan (LSSP), the Employee Share Own-ership Plan (ESOP), and any unvested Performance Share Units (PSUs) are excluded. The determination also includes other shares as well as vested options of Novartis shares or ADRs that are owned directly or indi-rectly by “persons closely linked”1 to an Executive Com-mittee member. The Compensation Committee reviews compliance with the share ownership guideline on an annual basis.
As at December 31, 2016, all members who have served at least five years on the Executive Committee have met or exceeded their personal Novartis share own-ership requirements.
Shares, aDRs, equity rights and share options owned by executive committee membersThe following table shows the total number of shares, ADRs, and other equity rights owned by Executive Com-mittee members and “persons closely linked”1 to them as at December 31, 2016.
As at December 31, 2016, no Executive Committee members together with “persons closely linked” to them owned 1% or more of the outstanding shares (or ADRs) of Novartis. As at the same date, no member of the Exec-utive Committee held any share options to purchase Novartis shares, with the exception of André Wyss who held 373 000.
1 “Persons closely linked” are (i) their spouse, (ii) their children below age 18, (iii) any legal entities that they own or otherwise control, and (iv) any legal or natural person who is act-ing as their fiduciary.
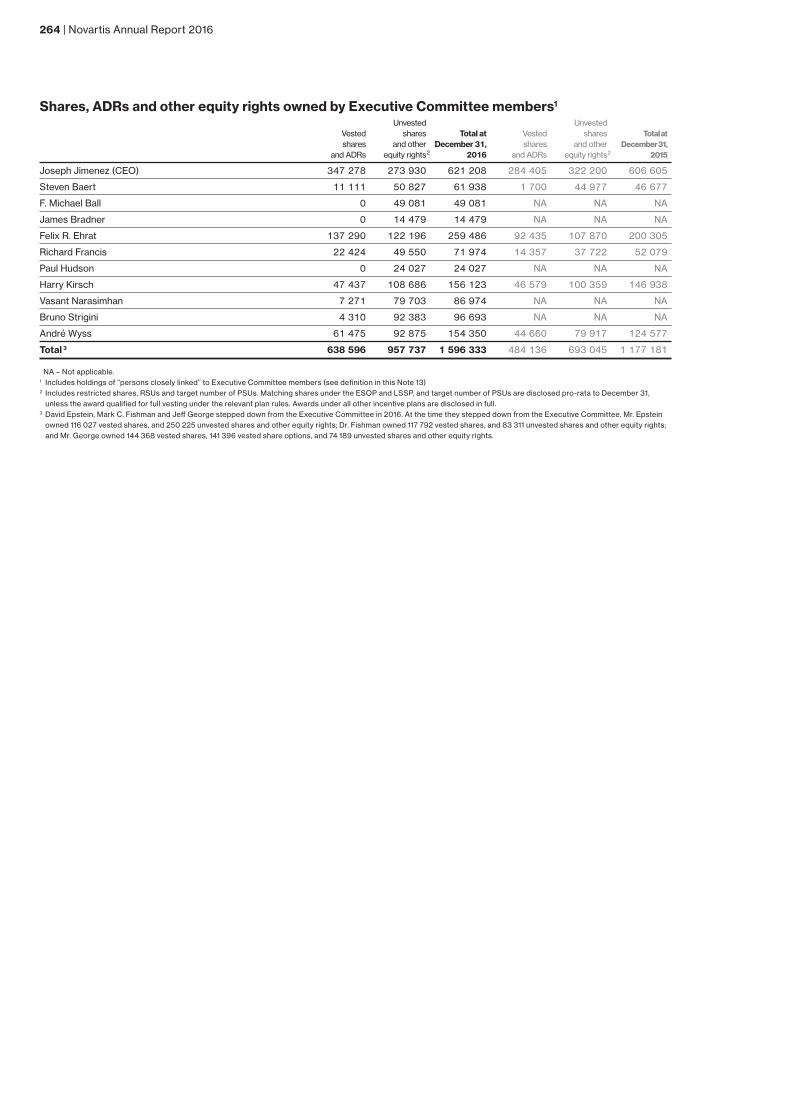
264 | Novartis Annual Report 2016
Shares, aDRs and other equity rights owned by executive committee members1
Unvested Unvested
Vested shares total at Vested shares Total at
shares and other December 31, shares and other December 31,
and ADRs equity rights 2 2016 and ADRs equity rights 2 2015
Joseph Jimenez (CEO) 347 278 273 930 621 208 284 405 322 200 606 605
Steven Baert 11 111 50 827 61 938 1 700 44 977 46 677
F. Michael Ball 0 49 081 49 081 NA NA NA
James Bradner 0 14 479 14 479 NA NA NA
Felix R. Ehrat 137 290 122 196 259 486 92 435 107 870 200 305
Richard Francis 22 424 49 550 71 974 14 357 37 722 52 079
Paul Hudson 0 24 027 24 027 NA NA NA
Harry Kirsch 47 437 108 686 156 123 46 579 100 359 146 938
Vasant Narasimhan 7 271 79 703 86 974 NA NA NA
Bruno Strigini 4 310 92 383 96 693 NA NA NA
André Wyss 61 475 92 875 154 350 44 660 79 917 124 577
total 3 638 596 957 737 1 596 333 484 136 693 045 1 177 181
NA – Not applicable.1 Includes holdings of “persons closely linked” to Executive Committee members (see definition in this Note 13)2 Includes restricted shares, RSUs and target number of PSUs. Matching shares under the ESOP and LSSP, and target number of PSUs are disclosed pro-rata to December 31,
unless the award qualified for full vesting under the relevant plan rules. Awards under all other incentive plans are disclosed in full.3 David Epstein, Mark C. Fishman and Jeff George stepped down from the Executive Committee in 2016. At the time they stepped down from the Executive Committee, Mr. Epstein
owned 116 027 vested shares, and 250 225 unvested shares and other equity rights; Dr. Fishman owned 117 792 vested shares, and 83 311 unvested shares and other equity rights; and Mr. George owned 144 368 vested shares, 141 396 vested share options, and 74 189 unvested shares and other equity rights.

Novartis Annual Report 2016 | 265Financial RepoRtappropriation of available earnings of novartis aG as per balance sheet and declaration of dividend
Appropriation of available earnings of Novartis AG as per balance sheet and declaration of dividend
(CHF) 2016 2015
available unappropriated earnings
Balance brought forward 2 039 915 695 805 551 128
Net income of the year 8 140 581 612 8 040 648 710
total available earnings at the disposal of the annual General Meeting 10 180 497 307 8 846 199 838
appropriation proposed by the Board of Directors
Payment of a gross dividend (before taxes and duties) of CHF 2.75 (2015: CHF 2.70) on 2 518 535 601
(2015: 2 520 845 979) dividend-bearing shares1 with a nominal value of CHF 0.50 each – 6 925 972 903 – 6 806 284 143
Balance to be carried forward 3 254 524 404 2 039 915 695
1 No dividend will be declared on treasury shares held by Novartis AG, and certain treasury shares held by other Group companies.
Assuming that this proposal by the Board of Directors is approved by the Annual General Meeting of shareholders, payment of the dividend will be made as from March 6, 2017. The last trading day with entitlement to receive the dividend is March 1, 2017. As from March 2, 2017 the shares will be traded ex-dividend.

266 | Novartis Annual Report 2016
Report of the statutory auditor on the financial statements of novartis aG
To the General Meeting of Novartis AG, Basel
Opinion
As statutory auditor, we have audited the financial state-ments of Novartis AG which comprise the balance sheet as at December 31, 2016 and the income statement and notes (pages 255 to 264) for the year then ended.
In our opinion the accompanying financial statements as at December 31, 2016 comply with Swiss law and the company’s articles of incorporation.
Basis for opinion
We conducted our audit in accordance with Swiss law and Swiss Auditing Standards. Our responsibilities under those provisions and standards are further described in the Auditor’s responsibilities for the audit of the financial statements section of our report.
We are independent of the entity in accordance with the provisions of Swiss law and the requirements of the Swiss audit profession and we have fulfilled our other ethical responsibilities in accordance with these require-ments.
We believe that the audit evidence we have obtained is sufficient and appropriate to provide a basis for our opinion.
Our audit approach
Audit scopeWe designed our audit by determining materiality and assessing the risks of material misstatement in the finan-cial statements. In particular, we considered where sub-jective judgements were made; for example, in respect of significant accounting estimates that involved making assumptions and considering future events that are inherently uncertain. As in all of our audits, we also addressed the risk of management override of internal controls, including among other matters, consideration of whether there was evidence of bias that represented a risk of material misstatement due to fraud.
MaterialityThe scope of our audit was influenced by our applica-tion of materiality. Our audit opinion aims to provide rea-sonable assurance that the financial statements are free from material misstatement. Misstatements may arise due to fraud or error. They are considered material if indi-
vidually or in aggregate, they could reasonably be expected to influence the economic decisions of users taken on the basis of the financial statements.
Based on our professional judgement, we determined certain quantitative thresholds for materiality, including the overall materiality for the financial statements as a whole as listed below. These, together with qualitative considerations, helped us to determine the scope of our audit and the nature, timing and extent of our audit pro-cedures and to evaluate the effect of misstatements, both individually and in aggregate on the financial state-ments as a whole.— Overall materiality: CHF 400 million— How we determined it: 5% of income before taxes,
rounded— Rationale for the materiality benchmark applied: We
chose income before taxes as the measure because, in our view, it is the measure against which the per-formance of the entity is most commonly assessed and is a generally accepted benchmark.
We agreed with the Audit Committee that we would report to them misstatements identified during our audit above CHF 20 million as well as any misstatements below that amount which, in our view, warranted reporting for qualitative reasons.
Key Audit Matters
Key audit matters are those matters that, in our profes-sional judgment, were of most significance in our audit of the financial statements of the current period. We have determined that there are no such matters to report.
Responsibilities of the Board of Directors for the financial statements
The Board of Directors is responsible for the prepara-tion of the financial statements in accordance with the provisions of Swiss law and the company’s articles of incorporation, and for such internal control as the Board of Directors determines is necessary to enable the preparation of financial statements that are free from material misstatement, whether due to fraud or error.
In preparing the financial statements, the Board of Directors is responsible for assessing the entity’s ability to continue as a going concern, disclosing, as applica-ble, matters related to going concern and using the going concern basis of accounting unless the Board of Direc-tors either intends to liquidate the entity or to cease oper-ations, or has no realistic alternative but to do so.

Novartis Annual Report 2016 | 267Financial RepoRtReport of the statutory auditor on the financial statements of novartis aG
Auditor’s responsibilities for the audit of the financial statements
Our objectives are to obtain reasonable assurance about whether the financial statements as a whole are free from material misstatement, whether due to fraud or error, and to issue an auditor’s report that includes our opinion. Reasonable assurance is a high level of assurance, but is not a guarantee that an audit conducted in accordance with Swiss law and Swiss Auditing Standards will always detect a material misstatement when it exists. Misstate-ments can arise from fraud or error and are considered material if, individually or in the aggregate, they could reasonably be expected to influence the economic deci-sions of users taken on the basis of these financial state-ments.
As part of an audit in accordance with Swiss law and Swiss Auditing Standards, we exercise professional judgment and maintain professional scepticism through-out the audit. We also:— Identify and assess the risks of material misstatement
of the financial statements, whether due to fraud or error, design and perform audit procedures respon-sive to those risks, and obtain audit evidence that is sufficient and appropriate to provide a basis for our opinion. The risk of not detecting a material misstate-ment resulting from fraud is higher than for one result-ing from error, as fraud may involve collusion, forgery, intentional omissions, misrepresentations, or the override of internal control.
— Obtain an understanding of internal control relevant to the audit in order to design audit procedures that are appropriate in the circumstances, but not for the purpose of expressing an opinion on the effective-ness of the entity’s internal control.
— Evaluate the appropriateness of accounting policies used and the reasonableness of accounting esti-mates and related disclosures made.
— Conclude on the appropriateness of the Board of Directors’ use of the going concern basis of account-ing and, based on the audit evidence obtained, whether a material uncertainty exists related to events or conditions that may cast significant doubt on the entity’s ability to continue as a going concern. If we conclude that a material uncertainty exists, we are required to draw attention in our auditor’s report to the related disclosures in the financial statements or, if such disclosures are inadequate, to modify our opin-ion. Our conclusions are based on the audit evidence obtained up to the date of our auditor’s report. How-ever, future events or conditions may cause the entity to cease to continue as a going concern.
We communicate with the Board of Directors or its rel-evant committee regarding, among other matters, the planned scope and timing of the audit and significant audit findings, including any significant deficiencies in internal control that we identify during our audit.
We also provide the Board of Directors or its relevant committee with a statement that we have complied with relevant ethical requirements regarding independence, and to communicate with them all relationships and other matters that may reasonably be thought to bear on our independence, and where applicable, related safe-guards.
From the matters communicated with the Board of Directors or its relevant committee, we determine those matters that were of most significance in the audit of the financial statements of the current period and are there-fore the key audit matters. We describe these matters in our auditor’s report unless law or regulation precludes public disclosure about the matter or when, in extremely rare circumstances, we determine that a matter should not be communicated in our report because the adverse consequences of doing so would reasonably be expected to outweigh the public interest benefits of such commu-nication.
Report on other legal and regulatory requirements
In accordance with article 728a paragraph 1 item 3 CO and Swiss Auditing Standard 890, we confirm that an internal control system exists, which has been designed for the preparation of financial statements according to the instructions of the Board of Directors.
We further confirm that the proposed appropriation of available earnings complies with Swiss law and the company’s articles of incorporation. We recommend that the financial statements submitted to you be approved.
PricewaterhouseCoopers AG
Bruno Rossi Stephen JohnsonAudit expert Global relationshipAuditor in charge partner
Basel, January 24, 2017

268 | Novartis Annual Report 2016
Other informationEach year, Novartis commissions a photographer to portray a unique, personal and artistic perspective of healthcare around the world. Depicting the diversity of patients, medical professionals, researchers and caregivers, the photographs demonstrate the complex realities of global healthcare. We are grateful to Andrea Bruce and to those who shared their experiences for the Annual Report 2016.

Novartis Annual Report 2016 | 269Other infOrmatiOnOther information
Andrea Bruce
Andrea Bruce is a documentary photographer who brings attention to people living in the aftermath of war. She concentrates on the social issues that are sometimes ignored and often ignited in war’s wake.
Ms. Bruce started working in Iraq in 2003, fol-lowing the intricacies and obstacles of the con-flict experienced by Iraqis and the US military. For more than 10 years, she has chronicled the world’s most troubled areas, focusing on Iraq and Afghanistan. Currently she is a member and co-owner of the photo agency NOOR.
For eight years, she worked as a staff photo-grapher for The Washington Post and later as part of the VII Network (2010-2011). At The Post, she originated and authored a weekly column called “Unseen Iraq.” She also worked at The Concord Monitor and The St. Peters-burg Times after graduating from the Univer-sity of North Carolina at Chapel Hill in the US in 1995.
Her awards include top honors from the White House News Photographers Association (WHNPA), where she has been named Photo-grapher of the Year four times; several awards from the International Pictures of the Year con-test; and the prestigious John Faber Award from the Overseas Press Club in New York. She received the WHNPA grant in 2010 for her work in Ingushetia, and she was a 2011 reci-pient of the Alicia Patterson Foundation Fellow-ship. In 2012, she was the recipient of the first Chris Hondros Fund Award for the “commit-ment, willingness and sacrifice shown in her work.” The World Press Photo awarded her 2nd prize in the category “Daily Life,” singles, for the image “Soldier’s Funeral” in 2014.
In 2016, Ms. Bruce finished Harvard’s Nieman Fellowship for journalists, and she is currently based in Cambridge, Massachusetts in the US.
Aurelia Mendez Pablo has blood drawn as part of research in Guatemala aimed at reducing the health impact of smoke from cooking fires.

270 | Novartis Annual Report 2016
Key dates for 2017
Anticipated reporting dates
Annual General Meeting february 28, 2017
First quarter 2017 results april 25, 2017
Novartis investor event in Boston, USA may 30-31, 2017
Second quarter and first half 2017 results July 18, 2017
Third quarter and first nine months 2017 results October 24, 2017
Contact informationFor further information regarding Novartis, please contact Novartis International AG CH-4002 Basel, Switzerland.
General information
Tel: +41 61 324 11 11 Fax: +41 61 324 80 01
Investor relations
Tel: +41 61 324 79 44 Fax: +41 61 324 84 44Email: [email protected]
Share registry
Tel: +41 61 324 72 04 Fax: +41 61 324 32 44Email: [email protected]
Media relations
Tel: +41 61 324 22 00Fax: +41 61 324 90 90Email: [email protected]
Further detail
www.novartis.comwww.novartis.com/annualreport2016www.novartis.com/order2016annualreport
All product names printed in italics in this Annual Report are trademarks owned by or licensed to the Novartis Group.
The use of the registered trademark ® in combination with products in normal script indicates third-party brands.
The business policy of Novartis takes into account the OECD’s Guidelines for Multinational Enterprises, with their recommen-dations on the disclosure of information.
Our Annual Report is published in English; a German translation is also available.
Publisher: Novartis International AG, Basel, Switzerland Design: phorbis communications, Basel, Switzerland Production: Management Digital Data AG, Lenzburg, Switzerlandmanagement Photography: Thomas Stöckli, Zürich, Switzerland Printer: Neidhart + Schön Group, Zürich, Switzerland
© Novartis AG, 2017
forward-looking statementsThese materials contain forward-looking statements that can be identified by words such as “potential,” “expected,” “will,” “planned,” “pipeline,” “outlook,” or similar terms, or by express or implied discussions regarding potential new products, potential new indications for existing products, or regarding potential future revenues from any such products; potential shareholder returns or credit ratings; or regarding the potential financial or other impact on Novartis or any of our divisions of the significant reorganizations of recent years, including the creation of the Pharmaceuticals and Oncology business units to form the Innovative Medicines Division, the creation of the Global Drug Development organization and Novartis Operations (including Novartis Technical Operations and Novartis Business Services), the transfer of the Ophthalmic Pharmaceuticals products of our Alcon Division to the Innovative Medicines Division, the transfer of selected mature, non-promoted pharmaceutical products from the Innovative Medicines Division to the Sandoz Division, and the transactions with GSK, Lilly or CSL; or regarding potential future sales or earnings of the Novartis Group or any of its divisions; or by discussions of strategy, plans, expectations or intentions. You should not place undue reliance on these statements. Such forward looking statements are based on the current beliefs and expectations of management regarding future events, and are subject to significant known and unknown risks and uncertainties. Should one or more of these risks or uncertainties materialize, or should underlying assumptions prove incorrect, actual results may vary materially from those set forth in the forward looking statements. There can be no guarantee that any new products will be approved for sale in any market, or that any new indications will be approved for any existing products in any market, or that any approvals which are obtained will be obtained at any particular time, or that any such products will achieve any particular revenue levels. Nor can there be any guarantee that Novartis will be able to realize any of the potential strategic benefits, synergies or opportunities as a result of the significant reorganizations of recent years, including the creation of the Pharmaceuticals and Oncology business units to form the Innovative Medicines Division, the creation of the Global Drug Development organization and Novartis Operations (including Novartis Technical Operations and Novartis Business Services), the transfer of the Ophthalmic Pharmaceuticals products of our Alcon Division to the Innovative Medicines Division, the transfer of selected mature, non-pro-moted pharmaceutical products from the Innovative Medicines Division to the Sandoz Division, and the transactions with GSK, Lilly or CSL. Neither can there be any guarantee that shareholders will achieve any particular level of shareholder returns. Nor can there be any guarantee that the Group, or any of its divisions, will be commercially successful in the future, or achieve any particular credit rating or financial results. In particular, management’s expectations could be affected by, among other things: regulatory actions or delays or government regulation generally; the potential that the strategic benefits, synergies or opportunities expected from the significant reorganizations of recent years, including the creation of the Pharmaceuticals and Oncology business units to form the Innovative Medicines Division, the creation of the Global Drug Development organization and Novartis Operations (including Novartis Technical Operations and Novartis Business Services), the transfer of the Ophthalmic Pharmaceuticals products of our Alcon Division to the Innovative Medicines Division, the transfer of selected mature, non-promoted pharmaceutical products from the Innovative Medicines Division to the Sandoz Division, and the transactions with GSK, Lilly or CSL may not be realized or may take longer to realize than expected; the inherent uncertainties involved in predicting shareholder returns or credit ratings; the uncertainties inherent in the research and development of new healthcare products, including clinical trial results and additional analysis of existing clinical data; our ability to obtain or maintain proprietary intellectual property protection, including the ultimate extent of the impact on Novartis of the loss of patent protection and exclusivity on key products which commenced in prior years and will continue this year; safety, quality or manufacturing issues; global trends toward health care cost containment, including ongoing pricing and reimbursement pressures, such as from increased publicity on pharmaceuticals pricing, including in certain large markets; uncertainties regarding actual or potential legal proceedings, including, among others, actual or potential product liability litigation, litigation and investigations regarding sales and marketing practices, intellectual property disputes and government investigations generally; general economic and industry conditions, including uncertainties regarding the effects of the persistently weak economic and financial environment in many countries; uncertainties regarding future global exchange rates; uncertainties regarding future demand for our products; and uncertainties regarding potential significant breaches of data security or disruptions of our information technology systems; and other risks and factors referred to in Novartis AG’s current Form 20-F on file with the US Securities and Exchange Commission. Novartis is providing the information in these materials as of this date and does not undertake any obligation to update any forward-looking statements as a result of new information, future events or otherwise.
Photo on the rightField worker Expedita Ramírez Marroquín works with women in rural Guatemala, focusing on diet, prenatal health and household characteristics. She also assists with a program around the town of San Lorenzo aimed at reducing the health impact of smoke from cooking fires, which contributes to respiratory illness. Back coverAntonina Hernández, who suffers from Alzheimer’s, exercises four days a week under the guidance of her son, Juan Pedro García Hernández, who is also her full-time caregiver.