Nonlinear coupled dynamic response of offshore Spar ... · PDF fileNonlinear coupled dynamic...
35
Nonlinear coupled dynamic response of offshore Spar platforms under regular sea waves A.K. Agarwal, A.K. Jain Department of Civil Engineering, Indian Institute of Technology, Hauz Khas, New Delhi 110016, India Received 12 September 2001; accepted 3 January 2002 Abstract Oil and gas exploration of large reservoirs in deep water has accelerated the need to explore structures suitable for these depths, which operate more economically in deep water. A Spar platform is one such compliant offshore floating structure used for deep water applications for the drilling, production, processing, storage and offloading of ocean deposits. The Spar is modeled as a rigid body with 6 degrees-of-freedom, connected to the sea floor by multi- component catenary mooring lines, which are attached to the Spar at the fairleads. The response-dependent stiffness matrix consists of three parts: (a) the hydrostatics provide restor- ing force in heave, roll and pitch; (b) the mooring lines provide the restoring force which are represented here by nonlinear horizontal; and (c) vertical springs. An unidirectional regular wave model is used for computing the incident wave kinematics by Airy's wave theory and force by Morison's equation. The response analysis is performed in time domain to solve the dynamic behavior of a moored Spar platform as an integrated system using the iterative incremental Newmark's Beta approach. Numerical studies are conducted for several regular Keywords: Wave structure interaction; Offshore structural dynamics; Spar platform; Multicomponent catenary mooring with horizontal and vertical spring
Transcript of Nonlinear coupled dynamic response of offshore Spar ... · PDF fileNonlinear coupled dynamic...
Nonlinear coupled dynamic response ofoffshore Spar platforms under regular sea
waves
A.K. Agarwal, A.K. JainDepartment of Civil Engineering, Indian Institute of Technology, Hauz Khas, New Delhi 110016, India
Received 12 September 2001; accepted 3 January 2002
Abstract
Oil and gas exploration of large reservoirs in deep water has accelerated the need to explorestructures suitable for these depths, which operate more economically in deep water. A Sparplatform is one such compliant offshore floating structure used for deep water applications forthe drilling, production, processing, storage and offloading of ocean deposits. The Spar ismodeled as a rigid body with 6 degrees-of-freedom, connected to the sea floor by multi-component catenary mooring lines, which are attached to the Spar at the fairleads. Theresponse-dependent stiffness matrix consists of three parts: (a) the hydrostatics provide restor-ing force in heave, roll and pitch; (b) the mooring lines provide the restoring force which arerepresented here by nonlinear horizontal; and (c) vertical springs. An unidirectional regularwave model is used for computing the incident wave kinematics by Airy's wave theory andforce by Morison's equation. The response analysis is performed in time domain to solve thedynamic behavior of a moored Spar platform as an integrated system using the iterativeincremental Newmark's Beta approach. Numerical studies are conducted for several regular
Keywords: Wave structure interaction; Offshore structural dynamics; Spar platform; Multicomponentcatenary mooring with horizontal and vertical spring
518 A.K. Agarwal, A.K. Jain/Ocean Engineering 30 (2003) 517-551
1. Introduction
As offshore oil and gas exploration is pushed into deeper and deeper water, manyinnovative floating offshore structures are being proposed for cost savings. To reducewave induced motion, the natural frequency of these newly proposed offshore struc-tures are designed to be far away from the peak frequency of the force power spectra.Spar platforms being one such compliant offshore floating structure used for deepwater applications for the drilling, production, processing, storage and offloading ofocean deposits. It is being considered the next generation of deep water offshorestructures by many oil companies. It consists of a vertical cylinder, which floatsvertically in the water. The structure floats so deep in the water that the wave actionat the surface is dampened by the counter balance effect of the structure weight. Finlike structures called strakes, attached in a helical fashion around the exterior of thecylinder, act to break the water flow against the structure, further enhancing thestability. Station keeping is provided by lateral, multicomponent catenary anchorlines attached to the hull near its center of pitch for low dynamic loading. Theanalysis, design and operation of Spar platform turn out to be a difficult job, primarilybecause of the uncertainties associated with the specification of the environmentalloads. The role of various nonlinearities has been a topic of significant interest inthe area of numerical Spar response prediction. In deep water, minor changes in somedesign parameters may have sensitive effects on the buoy behavior and therefore, onits operational characteristics. The present generation of Spar has the following fea-tures.
1. It can be operated at depths of upto 3000 m from full drilling and production toproduction only.
2. It can have large range of topside payloads.3. Rigid steel production risers are supported in the center well by separate buoy-
ancy cans.4. It is always stable because the center of buoyancy (CB) is above the center of
gravity (CG).5. It has favorable motions compared to other floating structures.6. It can have steel or concrete hull.7. It has minimum hull-deck interface.8. Oil can be stored at low marginal cost.9. It has sea keeping characteristics superior to all other mobile drilling units.10It can be used as a mobile drilling rig.11.The mooring system is easy to install, operate and relocate.12.The risers, which normally take a breathing in the wave zone from high waves
on semi-submersible, drilling units would be protected inside the Spar. Sea motioninside the Spar's center well would be minimal.
The concept of Spar as an offshore structure is not new. Spar buoy type of struc-tures have been built before. For example, a floating instrument platform (FLIP) wasbuilt in 1961 to perform oceanographic research (Fisher and Spiess, 1963), the Brent
A.K. Agarwal, A.K. Jain / Ocean Engineering 30 (2003) 517-551 519
Spar was built by Royal Dutch Shell as a storage and offloading platform in theNorth sea at intermediate water depth (Bax and de Werk, 1974, Van Santen and deWerk, 1976, Glanville et al., 1997). The use of Spar platforms as a production plat-form is relatively recent (Converse and Bridges, 1997).
Lowd et al. (1971) discussed the design and model basin test results with respectto a floating and portable production processing facility, which will improve theinitial cash flow pattern from certain marine fields, if interim production facilities,storage and a sales outlet can be devised quickly. The semi-submerged productionunit was a Spar buoy combining the stability, portability and minimum size of avertical cylindrical vessel with the utility of a complete production processing unitmounted therein. The unit design provides transport to the location on the deck ofpresently available vessels and for launching procedures on the final location positionwithout derrick barge assistance.
Triantafyllou et al. (1982) used extensible catenary equations to derive the force-excursion relationships of the mooring line at the guy attachment point.
Dutta (1984) used a catenary equation to solve the multicomponent mooring sys-tem for guyed towers taking into account the line extensibility. The inherent nonlin-ear equation is solved using the secant method for fast convergence. Differentrelationships for the different cases of clump weights lying on the sea bed or lift upwere reported and it was assumed that the initial lengths of guy line and anchor lineare inclusive of elongation due to the initial line tension. The study was carried forlumped and distributed clump weights, and it was concluded that less excursion andmore cable force at the attachment point with lumped clump weights leads to anunderestimation of the fundamental period that may lead to an overestimation of thestructural response for higher periods.
Verma (1990) has presented the mathematical formulations for a multicomponentmooring line using both a small strain elastic catenary approach and the finite elementmethod. The parametric study related to the properties of various cable componentsand the sloping sea bed are carried out in the case of clump-mooring line undergoingsmall strains. In the finite element method, an efficient solution procedure is proposedin which the compatible starting configuration is chosen in a straightforward andsimple manner. The effects of discretization on the results are investigated. A flexiblemooring line constituting expansive rope and steel wire rope is analyzed by both thefinite element and catenary approach in order to understand the limitations of theelastic catenary approach in the analysis of deeper-water mooring systems.
Glanville et al. (1991) gave the details of the concept, construction and installationof the Spar platform. He concluded that the Spar platform allows flexibility in selec-tion of well systems and drilling strategies, including early production or predrill-ing programs.
D'Souza et al. (1992) presented important design considerations for deepwatermooring systems for permanently moored floating platforms.
Mekha et al. (1995) modeled the Spar platform with 3 degrees-of-freedom, i.e.surge, heave and pitch. The inertia forces were calculated using a constant inertiacoefficient, Cm, as in the standard Morison's equation or using a frequency dependentCm coefficient based on the diffraction theory. The drag forces were computed using

520 A.K. Agarwal, A.K. Jain / Ocean Engineering 30 (2003) 517-551
the nonlinear terms of Morison's equation in both cases. The analysis was performedin the time domain. The result showed that using frequency dependent or constantinertia coefficient, Cm, produces similar results since most of the wave energy isconcentrated over the range of frequencies where the value of Cm is 2.0 for the Sparsize used in the literature.
Mekha et al. (1996) used the same model (Mekha et al., 1995) with the frequencydependent, Cm, coefficient based on diffraction theory. Different nonlinear modifi-cations to Morison's equation were induced to account any diffraction effects. Theresults obtained for a variety of sea state conditions were compared to the experi-mental data.
Halkyard (1996) reviewed the status of several Spar platform concepts emphasiz-ing the design aspect of these platforms.
Cao and Zhang (1996) discussed an efficient methodology to predict slow driftresponse of slack moored slender offshore structures due to ocean waves using ahybrid wave model. The hybrid wave model considers the wave interactions in anirregular wave field up to second order of wave steepness and is able to accuratelypredict incident wave kinematics, including the contributions from nonlinear differ-ence frequency interactions. A unique feature of this approach is that a measuredwave elevation time series can be used as input and the structure responses to meas-ured incident waves can be deterministically obtained.
Ran and Kim (1996) studied the nonlinear response characteristics of atethered/moored Spar platform in regular and irregular waves. A time-domaincoupled nonlinear motion analysis computer program was developed to solve boththe static and dynamic behaviors of a moored compliant platform as an integratedsystem. In particular, an efficient global-coordinate based dynamic finite elementprogram was developed to simulate the nonlinear tether/mooring responses. Usingthis program, the coupled dynamic analysis results are obtained and they are com-pared with uncoupled analysis results to see the effects of tethers and mooring lineson hull motions and vice versa.
Ran et al. (1996) studied the response characteristics of a large slack-moored float-ing Spar in regular waves, bichromatic waves and unidirectional irregular waves withor without sheared currents by experimental and numerical methods. It was observedthat the low-frequency surge and pitch responses were in general greater than thewave-frequency response, and the slowly varying responses were appreciablyreduced in the presence of currents. The total response amplitudes were found to bepractically acceptable in the survival condition characterized by a 100-year storm sea.
Jha et al. (1997) compared the analytically predicted motions of a floating Sparbuoy platform with the results of wave tank experiments considering, surge and pitchmotions only. Base-case predictions combine nonlinear diffraction loads and a linear,multi-degree-of-freedom model of the Spar stiffness and damping characteristics,refined models and the effect of wave-drift damping, and of viscous forces as well.Consistent choices of damping and wave input were considered in some detail.
Fischer and Gopalkrishnan (1998) presented the importance of heave character-istics of Spar platforms that have been gleaned from wave basin model tests, numeri-
A.K. Agarwal, A.K. Jain / Ocean Engineering 30 (2003) 517-551 521
cal simulations and combination of the two. The heave performance of small Spars,e.g. mini Spars has been examined and found to be potentially problematic.
Chitrapu et al. (1998) studied the nonlinear response of a Spar platform underdifferent environmental conditions such as regular, bi-chromatic, random waves andcurrent using a time domain simulation model. The model can consider several non-linear effects. Hydrodynamic forces and moments were computed using the Mori-son's equation. It appears that Morison's equation combined with accurate predictionof wave particle kinematics and force calculations in the displaced position of theplatform give reliable prediction of platform response both in the wave-frequencyand low-frequency ranges.
Ran et al. (1999) discussed the nonlinear coupled response of a moored spar inrandom waves with and without co-linear current in both time and frequency domain.The first and second order wave forces, added mass, radiation damping and wavedrift damping were calculated from a hydrodynamic software package calledWINTCOL. The total wave force time series (or spectra) were then generated in thetime (or frequency) domain based on a two-term volterra series method. The mooringdynamics were solved using the software package WINPOST, that is based on a gen-eralized coordinate based FEM. The mooring lines were attached to the platformthrough linear and rotational springs and dampers. Various boundary conditions canbe modeled using proper spring and damping values. In the time domain analysis,the nonlinear drag forces on the hull and mooring lines were applied at the instan-taneous position. In the frequency domain analysis, nonlinear drag forces were stoch-astically linearized and solutions were obtained by an iterative procedure.
Datta et al. (1999) described recent comparisons of numerical predictions ofmotions and loads to typical truss Spar model test results. The purpose of this com-parison was to calibrate hydrodynamic coefficients which, were to be used for thedesign of a new truss Spar platform for Amoco.
Chitrapu et al. (1999) discussed the motion response of a large diameter Sparplatform in long crested and random directional waves and current using a time-domain simulation model. Several nonlinearities such as free surface force calcu-lation, displaced position force computation, nonlinearities in the equations of motionand the effect of wave-current interaction were considered in determining the motionresponse. The effect of wave directionality on the predicted surge and pitch responseof the Spar platform has been studied. It was seen that both wave-current interactionand directional spread of wave energy have significant effect on the predictedresponse.
Chen et al. (1999) presented two existing numerical schemes, which were dynami-cally linked to compute the nonlinear response of a slacked moored slender body tosteep irregular ocean waves. The combined program known as COUPLE, allows forthe nonlinear wave force estimated at the instantaneous position of the body and thedynamic interactions between the mooring system and body. The motions of a slackmoored Spar and tensions in its mooring lines using the program COUPLE are pre-dicted and compared with the corresponding laboratory measurements and predic-tions based on the static mooring system. The comparisons indicate that COUPLE isreliable and accurate in simulating the dynamic interactions between a mooring sys-
522 A.K. Agarwal, A.K. Jain / Ocean Engineering 30 (2003) 517-551
tem and a slender-body structure. Current laboratory test simulates a slack mooringsystem by taut mooring lines and springs. This kind of simulation may not trulymodel the dynamic effect of mooring system on a moored structure in the real sea.Hence, the numerical simulation based on COUPLE can be a suitable tool to compen-sate these laboratory tests, especially in deep water.
Kim et al. (2001) numerically carried out the nonlinear hull/mooring coupleddynamic analysis of a truss Spar in waves with collinear steady winds and currentsin time domain and the results were compared with 1:61 scale experiments as wellas uncoupled analysis. The numerical results showed that dynamic effects were veryimportant for the present mooring design. The motion and tension spectra ofuncoupled analysis with a linear massless spring or nonlinear massless spring werealso compared with those obtained from fully coupled analysis to assess the impor-tance of hull/mooring coupling and mooring-line damping.
2. Structural model
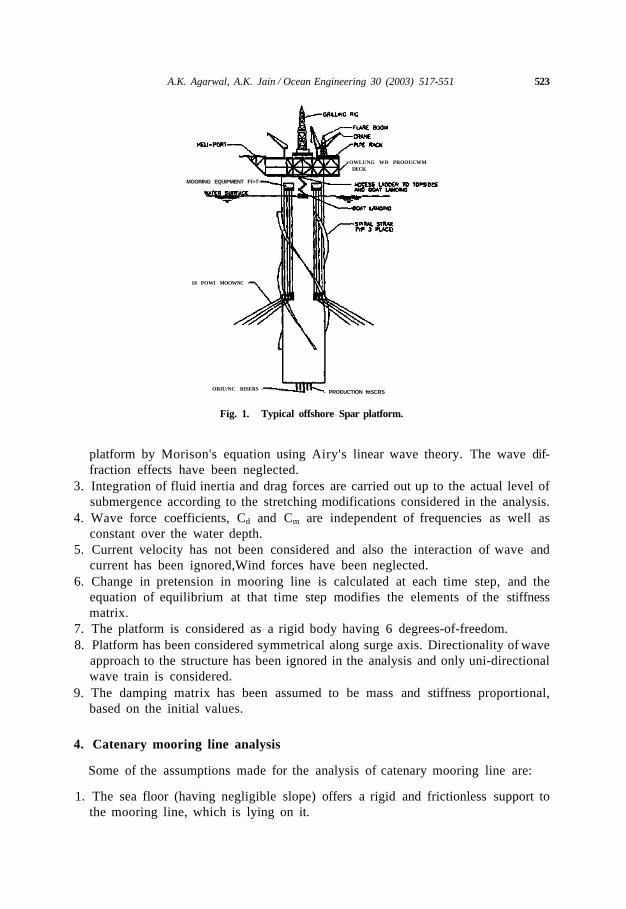
The Spar is modeled as a rigid cylinder with 6 degrees-of-freedom (i.e. threedisplacement degrees-of-freedom, i.e. surge, sway and heave along the X, Y and Zaxes and three rotational degrees-of-freedom, i.e. roll, pitch and yaw about the X, Yand Z axes) at its CG. The Spar is assumed to be closed at its keel. The stabilityand stiffness is provided by a number of the mooring lines attached near the CG forlow dynamic positioning of the Spar platforms. When the platform deflects the move-ment will take place in a plane of symmetry of the mooring system, the resultanthorizontal force will also occur in this plane and the behavior of the mooring willbe two-dimensional. It is the force and displacement (excursion) at this attachmentpoint that is of fundamental importance for the overall analysis of the platforms. Itis assumed that the Spar is connected to the sea floor by four multi componentcatenary mooring lines placed perpendicular to each other, which are attached to theSpar at the fairleads. The development of Spar platform model for dynamic analysisinvolves the formulation of a nonlinear stiffness matrix considering mooring linetension fluctuations due to variable buoyancy and other nonlinearities. The modelconsiders the coupled behavior of a Spar platform for various degrees-of-freedom.Fig. 1. shows a typical offshore Spar platform.
3. Assumptions and structural idealization
The platform and the mooring lines are treated as a single system and the analysisis carried out for the 6 degrees-of-freedom under the environmental loads. The fol-lowing assumptions have been made in the analysis:
1. Initial pretension in all mooring lines is equal. However, total pretension changeswith the motion of the Spar Platform.
2. Wave forces are estimated at the instantaneous equilibrium position of the Spar
A.K. Agarwal, A.K. Jain / Ocean Engineering 30 (2003) 517-551 523
rOWLUNG WD PROOUCWMDECK
MOORING EQUIPMENT Fl>T-
18 POWl MOOWNC •
ORIU/NC RISERS -- PRODUCTION fttSCRS
Fig. 1. Typical offshore Spar platform.
platform by Morison's equation using Airy's linear wave theory. The wave dif-fraction effects have been neglected.
3. Integration of fluid inertia and drag forces are carried out up to the actual level ofsubmergence according to the stretching modifications considered in the analysis.
4. Wave force coefficients, Cd and Cm are independent of frequencies as well asconstant over the water depth.
5. Current velocity has not been considered and also the interaction of wave andcurrent has been ignored,Wind forces have been neglected.
6. Change in pretension in mooring line is calculated at each time step, and theequation of equilibrium at that time step modifies the elements of the stiffnessmatrix.
7. The platform is considered as a rigid body having 6 degrees-of-freedom.8. Platform has been considered symmetrical along surge axis. Directionality of wave
approach to the structure has been ignored in the analysis and only uni-directionalwave train is considered.
9. The damping matrix has been assumed to be mass and stiffness proportional,based on the initial values.
4. Catenary mooring line analysis
Some of the assumptions made for the analysis of catenary mooring line are:
1. The sea floor (having negligible slope) offers a rigid and frictionless support tothe mooring line, which is lying on it.
524 A.K. Agarwal, A.K. Jain / Ocean Engineering 30 (2003) 517-551
2. All the components of the mooring line move very slowly inside the water, so thatthe generated drag forces on the line due to the motion can be treated as negligible.
3. The change in the line geometry and thereby in the line force due to direct fluidloading caused from waves and /or currents is insignificant.
4. Initial length of the mooring line and anchor line is inclusive of elongation dueto the initial line force.
5. The clump weight segment is inextensible.6. Anchor point does not move in any direction.7. Both horizontal and vertical excursion of the catenary mooring line is considered.
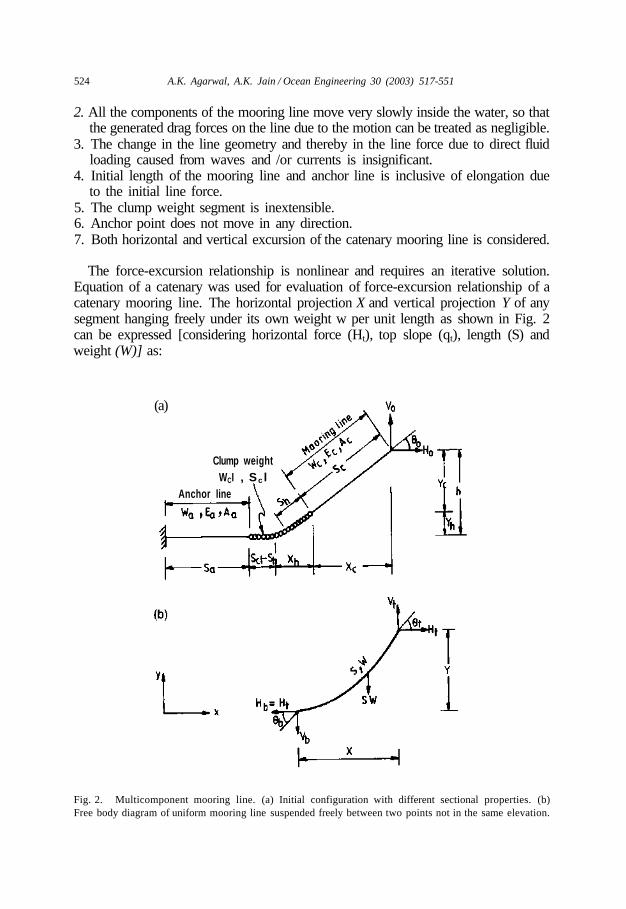
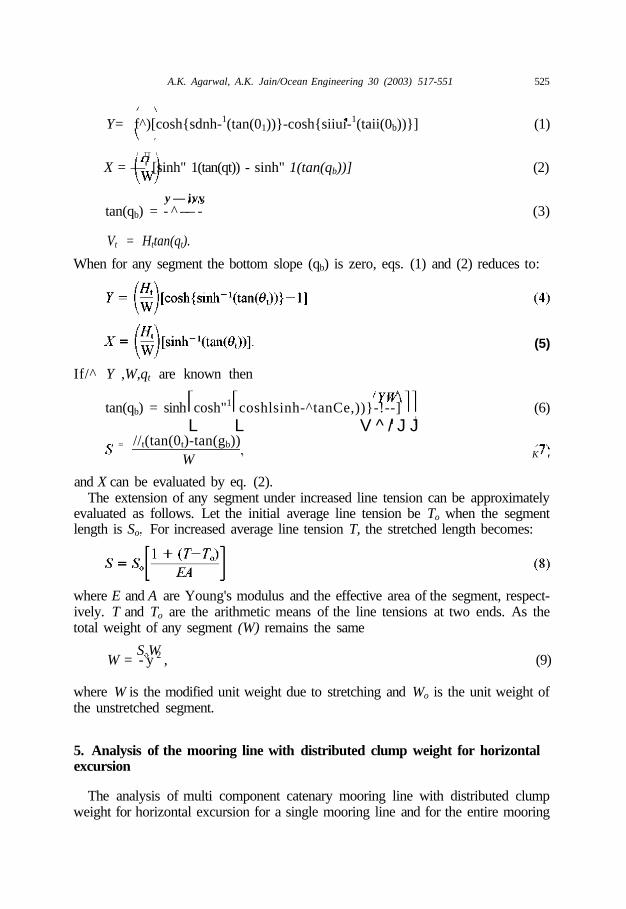
The force-excursion relationship is nonlinear and requires an iterative solution.Equation of a catenary was used for evaluation of force-excursion relationship of acatenary mooring line. The horizontal projection X and vertical projection Y of anysegment hanging freely under its own weight w per unit length as shown in Fig. 2can be expressed [considering horizontal force (Ht), top slope (qt), length (S) andweight (W)] as:
(a)
Clump weightWCI , S c l
Anchor line
Fig. 2. Multicomponent mooring line. (a) Initial configuration with different sectional properties. (b)Free body diagram of uniform mooring line suspended freely between two points not in the same elevation.
A.K. Agarwal, A.K. Jain/Ocean Engineering 30 (2003) 517-551 525
Y= f^)[cosh{sdnh-1(tan(01))}-cosh{siiui-1(taii(0b))}] (1)
/ TT \
X = —' [sinh" 1(tan(qt)) - sinh" 1(tan(qb))] (2)
y — ivvtan(qb) = - ^ — - (3)
Vt = Httan(qt).
When for any segment the bottom slope (qb) is zero, eqs. (1) and (2) reduces to:
(5)
If/^ Y ,W,qt are known then
tan(qb) = sinh cosh"1 coshlsinh-^tanCe,))}-!--] (6)L L V ^ / J J
= //t(tan(0t)-tan(gb))W K '
and X can be evaluated by eq. (2).The extension of any segment under increased line tension can be approximately
evaluated as follows. Let the initial average line tension be To when the segmentlength is So. For increased average line tension T, the stretched length becomes:
where E and A are Young's modulus and the effective area of the segment, respect-ively. T and To are the arithmetic means of the line tensions at two ends. As thetotal weight of any segment (W) remains the same
S WW = - y 2 , (9)
where W is the modified unit weight due to stretching and Wo is the unit weight ofthe unstretched segment.
5. Analysis of the mooring line with distributed clump weight for horizontalexcursion
The analysis of multi component catenary mooring line with distributed clumpweight for horizontal excursion for a single mooring line and for the entire mooring
526 A.K. Agarwal, A.K. Jain / Ocean Engineering 30 (2003) 517-551
system has been given in Agarwal and Jain (2002). The force-excursion relationshipfor vertical excursion is given here.
6. Analysis of the mooring line with distributed clump weight for verticalexcursion
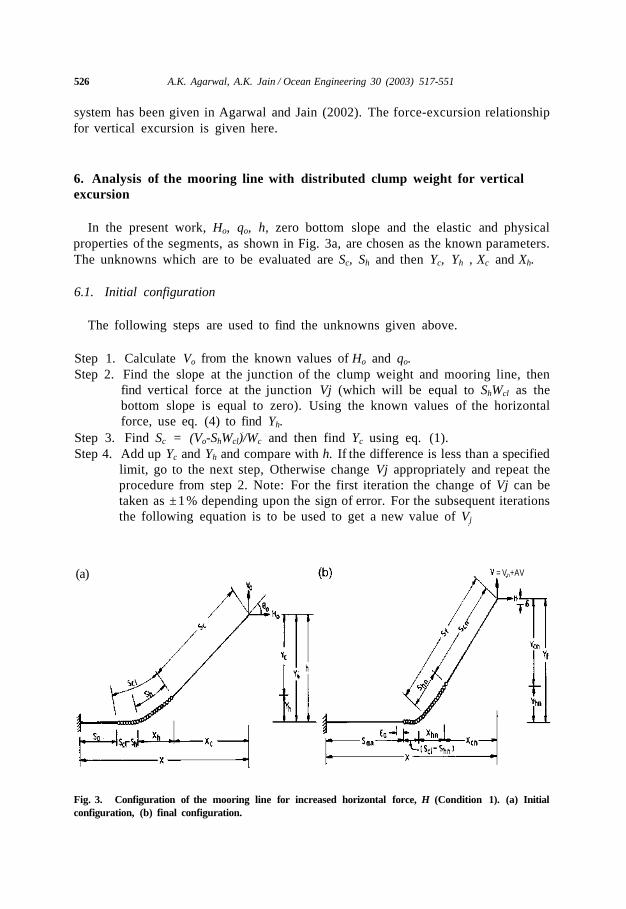
In the present work, Ho, qo, h, zero bottom slope and the elastic and physicalproperties of the segments, as shown in Fig. 3a, are chosen as the known parameters.The unknowns which are to be evaluated are Sc, Sh and then Yc, Yh , Xc and Xh.
6.1. Initial configuration
The following steps are used to find the unknowns given above.
Step 1. Calculate Vo from the known values of Ho and qo.Step 2. Find the slope at the junction of the clump weight and mooring line, then
find vertical force at the junction Vj (which will be equal to ShWcl as thebottom slope is equal to zero). Using the known values of the horizontalforce, use eq. (4) to find Yh.
Step 3. Find Sc = (Vo-ShWcl)/Wc and then find Yc using eq. (1).Step 4. Add up Yc and Yh and compare with h. If the difference is less than a specified
limit, go to the next step, Otherwise change Vj appropriately and repeat theprocedure from step 2. Note: For the first iteration the change of Vj can betaken as ±1% depending upon the sign of error. For the subsequent iterationsthe following equation is to be used to get a new value of Vj
(a) = Vn+AV
Fig. 3. Configuration of the mooring line for increased horizontal force, H (Condition 1). (a) Initialconfiguration, (b) final configuration.
A.K. Agarwal, A.K. Jain / Ocean Engineering 30 (2003) 517-551 527
(10)
where k is the number of the last iteration, (Vj)k is the vertical force at thejunction of the mooring line and clump weight and ek is the differencebetween the vertical projection of the hanging length of the mooring linecalculated in the kth iteration and the mooring level (h).
Step 5. Find Xc and Xh from eqs. (2) and (5), respectively.Step 6. Find initial total hanging length Si = Sc + Sh and its horizontal projection
Xi = Xc + Xh.
7. Evaluation of force-excursion (vertical) relationship for a single mooringline
The vertical force (Vo) is changed which allows direct checking of the conditionregarding the lifting off of the clump weight. The corresponding horizontal force isfound iteratively, ending with the determination of a new configuration includingthe excursion of the attachment point. The procedures for the two alternative statesof lifting-off of the clump weight are given below. Note that Wc = Sc Wc being theweight of the mooring line and Wcl = SclWcl is the total weight of the clump weight.Find the initial tension in the mooring line.
7.1. Condition 1 (when V<WC + Wcl)
Step 1. Increase Vo by AV [Fig. 3(b)].Step 2. Find the vertical and horizontal force at the junction of the clump weight
and mooring line. Find the new average line tension T in the mooring line.Step 3. Find the stretched length of the mooring line Scn and hence modified Wc
using eqs. (8) and (9), respectively.Step 4. Find the horizontal projections of the mooring line (Xcn) and clump weight
(Xhn) with the help of eqs. (2) and (5), respectively.Step 5. Find the elastic stretch of anchor line ea,
where Ea is Young's modulus of the anchor line, Aa is the effective area ofthe anchor line, Ho is the initial horizontal force at the top, H is the finalhorizontal force at the top, and Sa is the length of the anchor line.
Step 6. Add up {Xcn + Xhn + (S^—S^) + San} and compare it with initial configur-ation of the total horizontal projection X. If the difference e is less thantolerable limit (1 cm) go to the next step. Otherwise, change H appropriatelyand repeat the procedure from step 2.
Step 7. Find the new hanging length of the clump weight Shn from the zero bottom

528 A.K. Agarwal, A.K. Jain / Ocean Engineering 30 (2003) 517-551
slope condition and add it with the stretched mooring line length Scn to getthe new length Sf.
Step 8. Find Ycn and Yhn from eqs. (1) and (4), respectively, and add them to getthe vertical projection Yf.
Step 9. Evaluate vertical excursion (d)
S=Yf-Y1 (12)
where Yi is the initial vertical projection of the mooring line, Yf is the finalstretched vertical projection of the mooring line.
Step 10. Repeat steps 1-9 for the increased values of Vo till V = W c + Wcl.
7.2. Condition 2 (when V > Wc + Wcl)
Step 1. Increase Vo' by AF[Fig. 4(b)].Step 2. Find the vertical and horizontal force at the junction of the clump weight
and mooring line. For the value of (V = Fo ' + V) find the vertical force,Va at the junction of the anchor line and the clump weight as shown in Fig.4(c). Find the new average line tension in the mooring line and the anchorline and hence the modified Wc and Wa [considering the system configurationwhen the clump weight is just lifted as shown in Fig. 4(a) as the initial con-figuration].
Step 3. Find the hanging length of anchor line Sah using eq. (7) with qb = 0. Addup Scn and Scl to get Sf (which includes the mooring line stretch).
Step 4. Find Xcn and Xcln using eq. (2) and Xah from eq. (5).Step 5. Find the elastic stretch of anchor line ea '
Fig. 4. Configuration of the mooring line for increased horizontal force, H (Condition 2). (a) Configur-ation when the far end of the clump just lifts off. (b) Final configuration. (c) Free body diagram of theanchor line.
529A.K. Agarwal, A.K. Jain / Ocean Engineering 30 (2003) 517-551
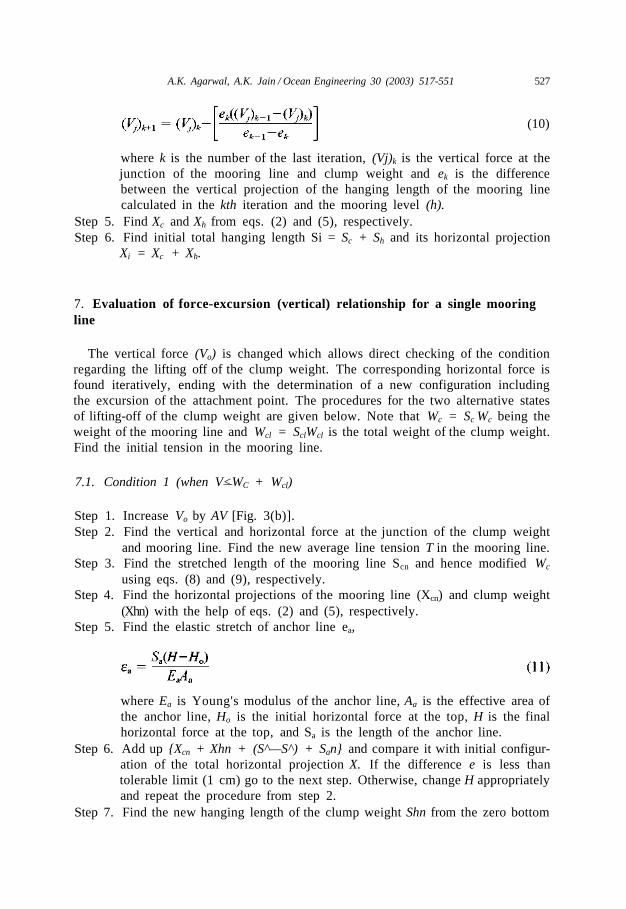
£ a ' = ' T7 A " (13)
where H’ = {H + iiH2 + Va2) }/2, Va = V- Wo- Wcl, Ho is the initial hori-zontal force when V = W c + Wcl, H'is the increased horizontal force dueto increased vertical force at the top, and Wc and Wcl are the total weightsof the mooring line and clump weight, respectively.
Step 6. Add up {Xcn + Xcln + Xah + (Sm—S^)} and compare it with initial con-figuration of the total horizontal projection X. If the difference e is less thantolerable limit (1 cm) go to the next step. Otherwise, change H appropriatelyand repeat the procedure from step 2.
Step 7. Find Ycn and Ycln using eq. (1) and Yah from eq. (4). Add them to get thevertical projection Yf.
Step 8. Find the excursion from
S=Yt-YC (14)
where Yi is the initial stretched vertical projection when the clump weightjust lift's off andYf is the final stretched vertical projection after the liftingof the clump weight.
Step 9. Repeat steps 1-8 for increasing values of Vo’, till the tension equals thepermissible value (approximately half of the breaking strength of the moor-ing line material). In the above Sah and Yah are found by treating the anchorline as a freely hanging mooring line and making use of the modified unitweight for the stretched segment. If Sah is found more than the total (stretch)anchor line length calculate (tan(qb) = {Va—W^)IH, Wa being the totalweight of anchor line) and recalculate Sah. Yah is evaluated using eq. (1).
The behavior of the mooring system will be planer if the tower excursion takesplace in a plane of symmetry of the mooring system. For an excursion of d at theattachment point the resultant horizontal force is given by
H(d) = 2 H/Sjlcosfr-Oj) (15)
where p is the total number of the mooring lines, (qj) is the angle between the jthmooring line and the direction of excursion. dj is the excursion for the jth mooringline and (HJ(DJ)) is the associated horizontal force, with dj = d. The resultant verticalforce at the mooring attachment point will be
V{8)= 2 Vj(dj). (16)
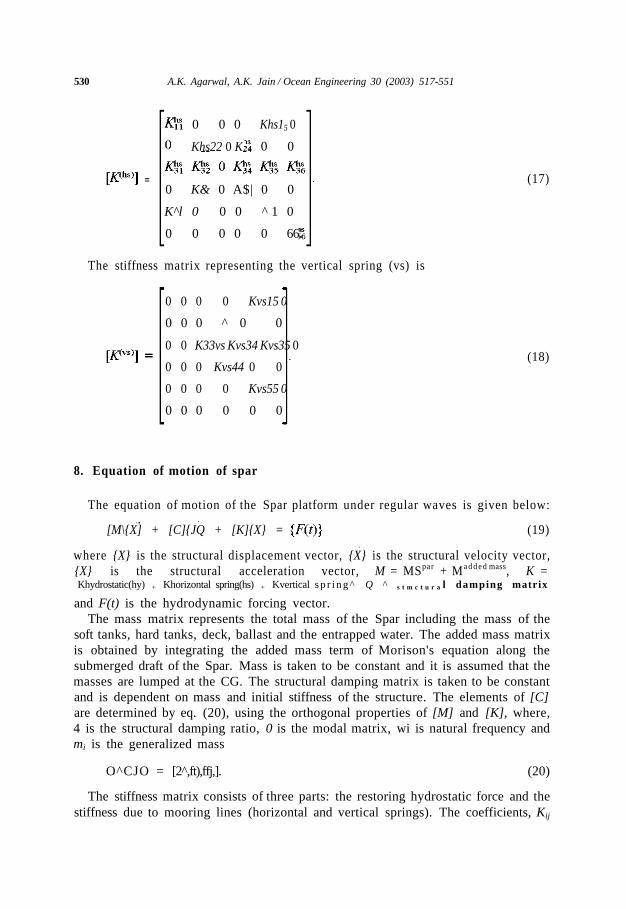
In this study the mooring line is modeled as a nonlinear horizontal and verticalspring located at the fairleads along the Spar center with no hydrodynamic forcesapplied on them. The stiffness matrix representing the horizontal spring (hs) isgiven below
530 A.K. Agarwal, A.K. Jain / Ocean Engineering 30 (2003) 517-551
=
0 0 0
Khs22 0 K
Khs15 0
0 0
0 K& 0 A$| 0 0
K^l 0 0 0 ^ 1 0
0 0 0 0 0 66
(17)
The stiffness matrix representing the vertical spring (vs) is
0 0 0 0 Kvs15 0
0 0 0 ^ 0 0
0 0 K33vs Kvs34 Kvs35 0
0 0 0 Kvs44 0 0
0 0 0 0 Kvs55 0
0 0 0 0 0 0
(18)
8. Equation of motion of spar
The equation of motion of the Spar platform under regular waves is given below:
[M\{X] + [C]{JQ + [K]{X} = (19)
where {X} is the structural displacement vector, {X} is the structural velocity vector,{X} is the structural acceleration vector, M = MSpar + M a d d e d mass, K =Khydrostatic(hy) + Khorizontal spring(hs) + Kvertical s p r i n g ^ Q ^ s t m c t u r a l damping matrix
and F(t) is the hydrodynamic forcing vector.The mass matrix represents the total mass of the Spar including the mass of the
soft tanks, hard tanks, deck, ballast and the entrapped water. The added mass matrixis obtained by integrating the added mass term of Morison's equation along thesubmerged draft of the Spar. Mass is taken to be constant and it is assumed that themasses are lumped at the CG. The structural damping matrix is taken to be constantand is dependent on mass and initial stiffness of the structure. The elements of [C]are determined by eq. (20), using the orthogonal properties of [M] and [K], where,4 is the structural damping ratio, 0 is the modal matrix, wi is natural frequency andmi is the generalized mass
O^CJO = [2 ,̂ft),ffj,]. (20)
The stiffness matrix consists of three parts: the restoring hydrostatic force and thestiffness due to mooring lines (horizontal and vertical springs). The coefficients, Kij
A.K. Agarwal, A.K. Jain / Ocean Engineering 30 (2003) 517-551 531
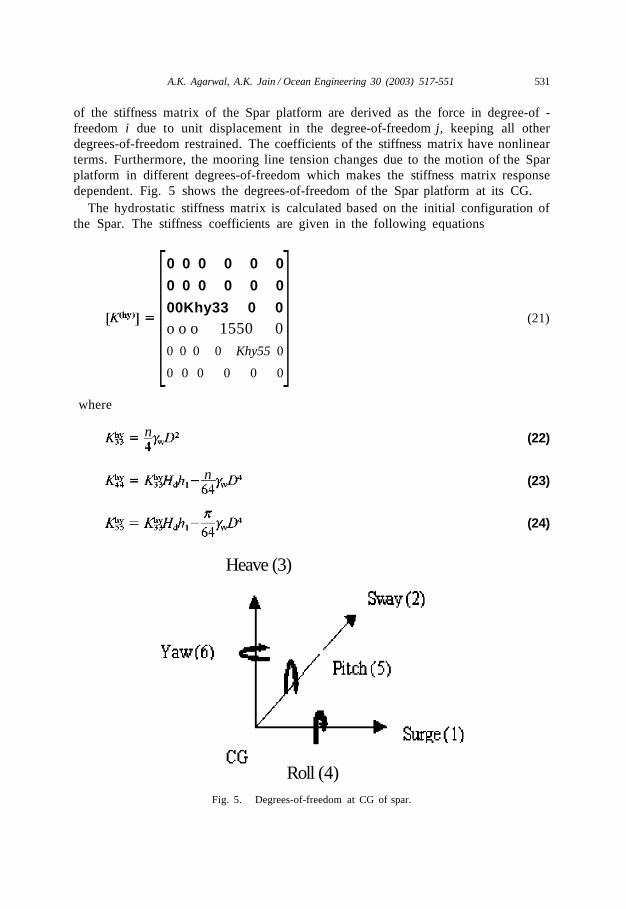
of the stiffness matrix of the Spar platform are derived as the force in degree-of -freedom i due to unit displacement in the degree-of-freedom j, keeping all otherdegrees-of-freedom restrained. The coefficients of the stiffness matrix have nonlinearterms. Furthermore, the mooring line tension changes due to the motion of the Sparplatform in different degrees-of-freedom which makes the stiffness matrix responsedependent. Fig. 5 shows the degrees-of-freedom of the Spar platform at its CG.
The hydrostatic stiffness matrix is calculated based on the initial configuration ofthe Spar. The stiffness coefficients are given in the following equations
0 0 0 0 0 0
0 0 0 0 0 0
00Khy33 0 0o o o 1550 00 0 0 0 Khy55 0
0 0 0 0 0 0
(21)
where
n
n
(22)
(23)
(24)
Heave (3)
Roll (4)Fig. 5. Degrees-of-freedom at CG of spar.
532 A.K. Agarwal, A.K. Jain/Ocean Engineering 30 (2003) 517-551
and h1 = Sch—Scg, D is the diameter of the Spar, Scg, Sc b are the distance from thekeel of the Spar to its CG and CB, respectively, Hd is the draft of the Spar, and gw
is the weight density of water.
9. Hydrodynamic forcing vector
Ocean surface waves refer generally to the moving succession of irregular humpsand hollows of the ocean surface. They are generated primarily by the drag of thewind on the water surface and hence are the greatest at any offshore site, when stormconditions exist there. For analyzing the offshore structures, it is customary to ana-lyze the effects of the surface waves on the structures either by use of a single designwave chosen to represent the extreme storm conditions in the area of interest or byusing the statistical representation of waves during extreme conditions. In either case,it is necessary to relate the surface wave data to the water velocity, acceleration andpressure beneath the waves. An unidirectional wave modal is used for computingthe incident wave kinematics. The kinematics of the water particles has been calcu-lated by Airy's wave theory. The sea surface elevation, η(x,t)is given as
h(x,t) = 1 H cos(Ax- wt). (25)
The horizontal and vertical water particle velocities are given as
coHcos\i(ky) r i , xu = "^—. , cos(kx-wt) (26)
2 sinh(kh)wHsinh(ky) .
v = o • ,ni,sm(kx-cot) (27)
2 sinh(kh)
where k and w denotes the wave number and the wave frequency, respectively.
k = 2P /L
and
co = 2P/P
where P is the wave period, x is the displacement of Spar, t is the time instant atwhich the water particle kinematics are evaluated, L is the wave length, H is thewave height, and h is the water depth.
The acceleration of the water particle in horizontal and vertical directions aregiven as
&>//cosh(£y) . ri , x
a = ——. ;;;sin(fo-firf) (28)2 sinh(kh)
* = —w • uni[cos(kx-wt) (29)2 sinh(kh)
A.K. Agarwal, A.K. Jain / Ocean Engineering 30 (2003) 517-551 533
where y is the height of the point of evaluation of water particle kinematics.A simplified alternative proposed in this study is to predict the response of a deep-
drafted offshore structure based on the slender body approximation, that is, withoutexplicitly considering the diffraction and radiation potential due to the presence ofthe structure. For typical deep-water offshore structures such as Spar, the ratio ofthe structure dimension to spectrum-peak wave length is small. Hence, it is assumedthat the wave field is virtually undisturbed by the structure and that the Morison'sequation is adequate to calculate the wave exiting forces. The wave loads on a struc-ture are computed by integrating forces along the free surface centreline from thebottom to the instant free surface at the displaced position. The added mass is basedon the initial configuration of the Spar and is added to the mass matrix. The inertiaforce (FI) and added mass force (FAM) per unit of length are given by
(30)
f (31)
where rw is the mass density of the fluid, D is the diameter of Spar, Cm is the inertiacoefficient, X is the acceleration of Spar, and u is the acceleration of the fluid.
The drag force (FD), which includes the relative motion between the structure andthe wave, per unit of length is given by
FD = l-PwCAD(u-X)\u-X\ (32)
where Cd is the drag coefficient, u is the velocity of the fluid, and X is the velocityof Spar.
10. Solution of the equation of motion
In the time domain using the numerical integration technique, incorporating allthe time dependent nonlinearities, stiffness coefficient depends on change of themooring line tension with time, added mass from Morison's equation, evaluation ofwave forces at the instantaneous displaced position of the structure, the response ofSpar can be evaluated. Wave loading constitutes the primary loading on offshorestructures. The dynamic behavior of these structures is, therefore, of design interest.When the dynamic response predominates, the behavior under wave loading becomesnonlinear because the drag component of the wave load, according to Morison'sequation, varies with the square of the velocity of the water particle relative to thestructure and at each time step, the force vector is updated to take into account thechange in the mooring line tension. The equation of motion has been solved by aniterative procedure using unconditionally stable Newmark's Beta method. The algor-ithm based on Newmark's method for solving the equation of motion is given below.
534 A.K. Agarwal, A.K. Jain/Ocean Engineering 30 (2003) 517-551
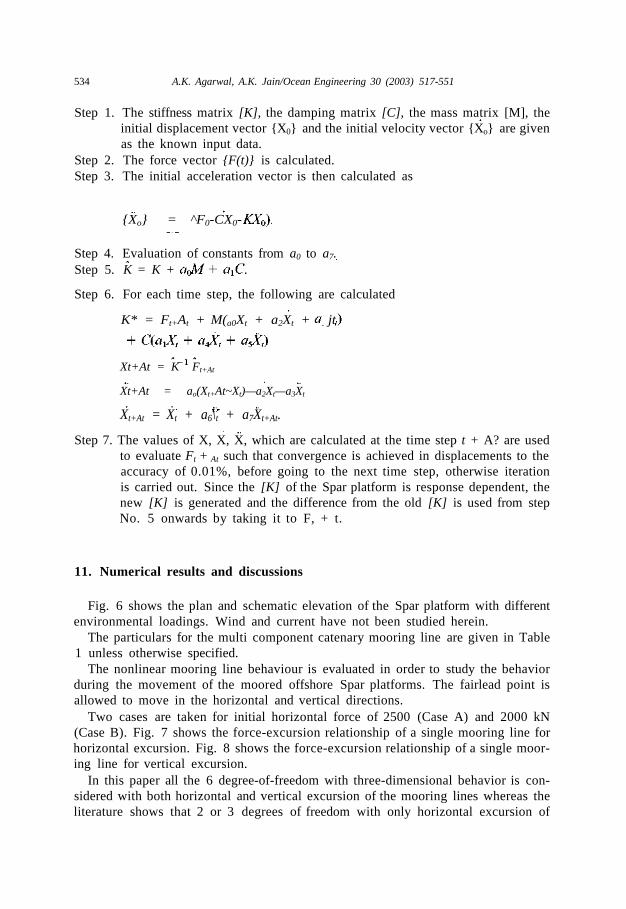
Step 1. The stiffness matrix [K], the damping matrix [C], the mass matrix [M], theinitial displacement vector {X0} and the initial velocity vector {Xo} are givenas the known input data.
Step 2. The force vector {F(t)} is calculated.Step 3. The initial acceleration vector is then calculated as
{Xo} = ^F0-CX0-
Step 4. Evaluation of constants from a0 to a7.Step 5. K = K +
Step 6. For each time step, the following are calculated
K* = Ft+At + M(a0Xt + a2Xt + jt
Xt+At = K Ft+At
Xt+At = ao(Xt+At~Xt)—a2Xt—a3Xt
Xt+At = Xt + a6\t + a7Xt+At.
Step 7. The values of X, X, X, which are calculated at the time step t + A? are usedto evaluate Ft + At such that convergence is achieved in displacements to theaccuracy of 0.01%, before going to the next time step, otherwise iterationis carried out. Since the [K] of the Spar platform is response dependent, thenew [K] is generated and the difference from the old [K] is used from stepNo. 5 onwards by taking it to F, + t.
11. Numerical results and discussions
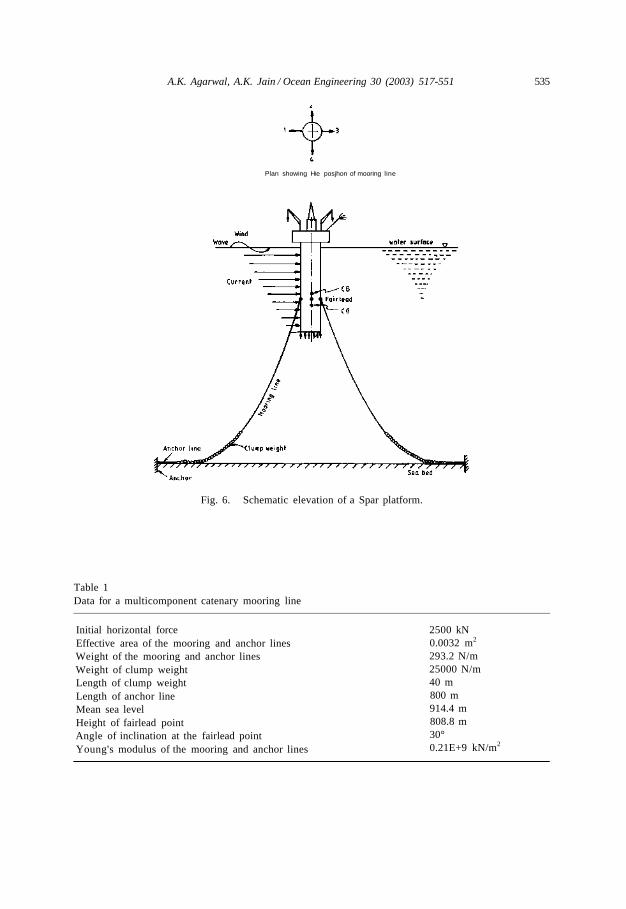
Fig. 6 shows the plan and schematic elevation of the Spar platform with differentenvironmental loadings. Wind and current have not been studied herein.
The particulars for the multi component catenary mooring line are given in Table1 unless otherwise specified.
The nonlinear mooring line behaviour is evaluated in order to study the behaviorduring the movement of the moored offshore Spar platforms. The fairlead point isallowed to move in the horizontal and vertical directions.
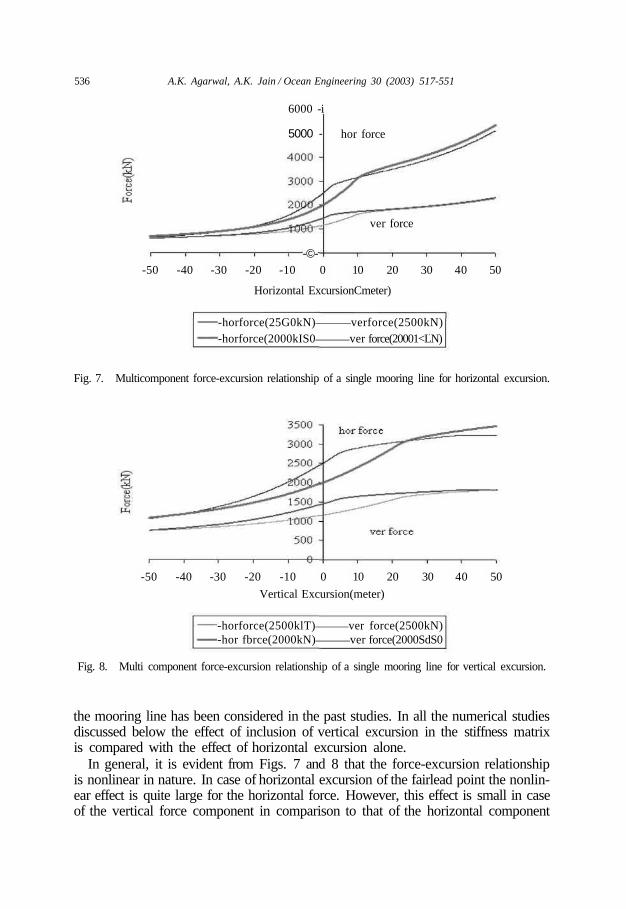
Two cases are taken for initial horizontal force of 2500 (Case A) and 2000 kN(Case B). Fig. 7 shows the force-excursion relationship of a single mooring line forhorizontal excursion. Fig. 8 shows the force-excursion relationship of a single moor-ing line for vertical excursion.
In this paper all the 6 degree-of-freedom with three-dimensional behavior is con-sidered with both horizontal and vertical excursion of the mooring lines whereas theliterature shows that 2 or 3 degrees of freedom with only horizontal excursion of
A.K. Agarwal, A.K. Jain / Ocean Engineering 30 (2003) 517-551 535
Plan showing Hie posjhon of mooring line
Fig. 6. Schematic elevation of a Spar platform.
Table 1Data for a multicomponent catenary mooring line
Initial horizontal forceEffective area of the mooring and anchor linesWeight of the mooring and anchor linesWeight of clump weightLength of clump weightLength of anchor lineMean sea levelHeight of fairlead pointAngle of inclination at the fairlead pointYoung's modulus of the mooring and anchor lines
2500 kN0.0032 m2
293.2 N/m25000 N/m40 m800 m914.4 m808.8 m30°0.21E+9 kN/m2
536 A.K. Agarwal, A.K. Jain / Ocean Engineering 30 (2003) 517-551
6000 -i
5000 -
-©-
hor force
ver force
-50 -40 -30 -20 -10 0 10 20 30 40 50
Horizontal ExcursionCmeter)
-horforce(25G0kN) verforce(2500kN)-horforce(2000kIS0 ver force(20001<LN)
Fig. 7. Multicomponent force-excursion relationship of a single mooring line for horizontal excursion.
-50 -40 -30 -20 -10 0 10 20 30 40 50
Vertical Excursion(meter)
-horforce(2500klT) ver force(2500kN)-hor fbrce(2000kN) ver force(2000SdS0
Fig. 8. Multi component force-excursion relationship of a single mooring line for vertical excursion.
the mooring line has been considered in the past studies. In all the numerical studiesdiscussed below the effect of inclusion of vertical excursion in the stiffness matrixis compared with the effect of horizontal excursion alone.
In general, it is evident from Figs. 7 and 8 that the force-excursion relationshipis nonlinear in nature. In case of horizontal excursion of the fairlead point the nonlin-ear effect is quite large for the horizontal force. However, this effect is small in caseof the vertical force component in comparison to that of the horizontal component

A.K. Agarwal, A.K. Jain / Ocean Engineering 30 (2003) 517-551 537
of the mooring force. When, the slope of the force-excursion curve has its peakvalue, around the zero displacement position of the attachment point, the mooringlines resistance to the movements of the floating structure is maximum and the moor-ing system behaves in the stiff mode. Increase in initial horizontal force at the attach-ment point makes the system taut as it decreases the length of the mooring line. Thehorizontal and vertical force-excursion relation of a single mooring line is greatlyinfluenced by the initial horizontal force, inclination at the fairlead point and its levelfrom the sea floor and also to some extent by the submerged unit weight of theclump weight.
From Fig. 7, it is observed that for positive horizontal excursion the horizontaland vertical forces at the fairlead point increases with the increase in the value ofinitial horizontal force but for initial horizontal force of 2500 kN its slope decreasesafter the excursion increases from 12 m in comparison to 2000 kN. The differencein the force is small for vertical force after 12 m for both the cases. Similarly fornegative horizontal excursion the horizontal and vertical force decreases when theinitial horizontal force decreases from 2500 to 2000 kN. The difference in the hori-zontal and vertical forces is small after —13 m.
From Fig. 8, it is observed that for positive vertical excursion the horizontal andvertical forces at the fairlead point increases with the increase in the value of initialhorizontal force but for initial horizontal force of 2500 kN its slope decreases afterthe excursion increases from 24 m in comparison to 2000 kN. The difference in theforce is small for vertical force after 40 m for both the cases. Similarly for negativevertical excursion the horizontal and vertical force decreases when the initial horizon-tal force decreases from 2500 to 2000 kN. The difference in the horizontal andvertical forces is small after —38 m.
The Spar platform dimensions and wave data are given in Table 2.
11.1. Effect of initial horizontal force
Two cases are taken for the initial horizontal force: (A) 2500 kN and (B) 2000kN for coupled stiffness matrix considering horizontal excursion of the mooring line
Table 2Dimensions of the Spar platform and wave data
Weight of the structure 2.6xlO6 kNHeight of the Spar 216.4 mRadius of the Spar 20.26 mDistance of CG to buoyancy 6.67 mDistance of CG from keel 92.4 mDistance of CG to fairleads 0.2 mStructural damping ratio 0.10,0.05 and 0.03Wave period 12.5 sWave height 7 mDrag coefficient (Cd) 1.0 and 0.0Inertia coefficient (Cm) 2.0 and1 .8
538 A.K. Agarwal, A.K. Jain / Ocean Engineering 30 (2003) 517-551
Table 3Natural time period for a Spar platform with different initial horizontal force (s)
Time Instant
Response at t = 0
Steady state response
Response at t = 0
Steady state response
Case
ABABCDCD
Surge
215.43254.60392.23360.41215.43254.60386.80355.60
Sway
215.43254.60215.43254.60215.43254.60209.25251.09
Heave
28.0428.0439.7939.794.204.69
43.5143.54
Roll
50.8450.8450.8450.8450.7750.8050.7750.80
Pitch
50.8450.8450.8450.8450.7750.8050.7750.80
Yaw
102.97115.13102.97115.13102.97115.13102.97115.13
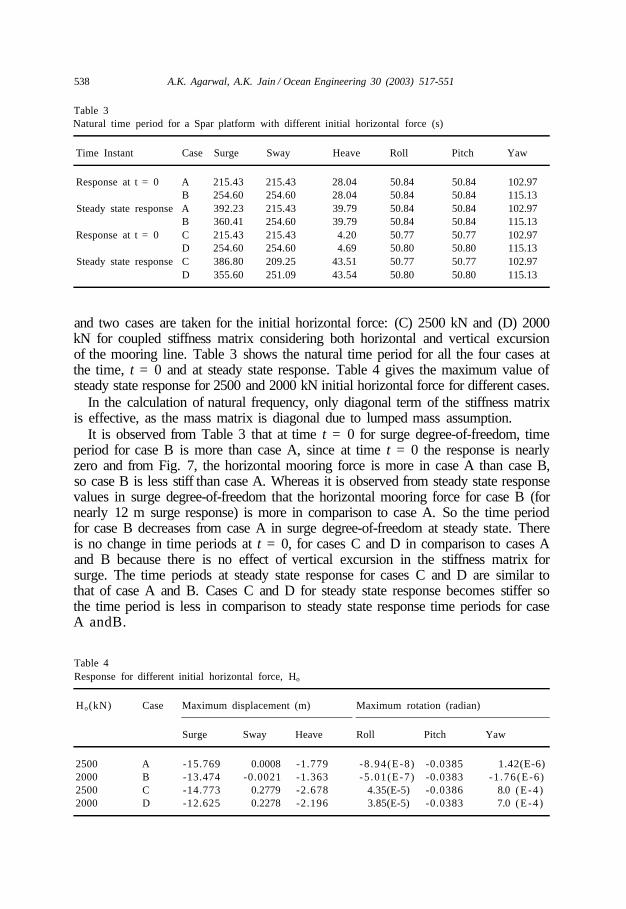
and two cases are taken for the initial horizontal force: (C) 2500 kN and (D) 2000kN for coupled stiffness matrix considering both horizontal and vertical excursionof the mooring line. Table 3 shows the natural time period for all the four cases atthe time, t = 0 and at steady state response. Table 4 gives the maximum value ofsteady state response for 2500 and 2000 kN initial horizontal force for different cases.
In the calculation of natural frequency, only diagonal term of the stiffness matrixis effective, as the mass matrix is diagonal due to lumped mass assumption.
It is observed from Table 3 that at time t = 0 for surge degree-of-freedom, timeperiod for case B is more than case A, since at time t = 0 the response is nearlyzero and from Fig. 7, the horizontal mooring force is more in case A than case B,so case B is less stiff than case A. Whereas it is observed from steady state responsevalues in surge degree-of-freedom that the horizontal mooring force for case B (fornearly 12 m surge response) is more in comparison to case A. So the time periodfor case B decreases from case A in surge degree-of-freedom at steady state. Thereis no change in time periods at t = 0, for cases C and D in comparison to cases Aand B because there is no effect of vertical excursion in the stiffness matrix forsurge. The time periods at steady state response for cases C and D are similar tothat of case A and B. Cases C and D for steady state response becomes stiffer sothe time period is less in comparison to steady state response time periods for caseA andB.
Table 4Response for different initial horizontal force, Ho
Ho(kN)
2500200025002000
Case
ABCD
Maximum
Surge
-15.769-13.474-14.773-12.625
displacement
Sway
0.0008-0.0021
0.27790.2278
(m)
Heave
-1.779-1.363-2.678-2.196
Maximum rotation (radian)
Roll Pitch
-8 .94(E-8) -0.0385-5 .01(E-7) -0.0383
4.35(E-5) -0.03863.85(E-5) -0.0383
Yaw
1.42(E-6)-1 .76(E-6)
8.0 ( E - 4 )7.0 ( E - 4 )
A.K. Agarwal, A.K. Jain / Ocean Engineering 30 (2003) 517-551 539
For sway degree-of-freedom at time t = 0 it is observed that time period for caseB is more than case A, since at time t = 0, the response is nearly zero and fromFig. 7, the horizontal mooring force is more in case A than case B, so case B isless stiff than case A. There is no change in the time periods for cases A and B atsteady state response, because an unidirectional wave train is considered and nearlyzero response occur in sway degree-of-freedom. There is no change in time periodsat t = 0, for cases C and D because there is no effect of vertical excursion in thestiffness matrix for sway. There is a little change in time periods at steady stateresponse for cases C and D, because considering vertical excursion there is a smalldisplacement in sway direction, which makes the system stiffer, so the time periodreduces in comparison to at time t = 0.
For heave degree-of-freedom only hydrostatic force influences the stiffness matrixfor cases A and B and as there is no change in the hydrostatic force so there is nochange in the time period for both the cases A and B. The time period increases incases A and B for the steady state response, because mass is increased by addedmass, which makes the system more flexible in heave degree-of-freedom. Whereas,considering both horizontal and vertical excursion the stiffness matrix is modifiedby an additional component, which makes the system stiffer, so the time perioddecreases for cases C and D, when t = 0. At steady state response for cases C andD time period increases due to added mass, similar to cases A and B and also dueto negative excursion in heave direction stiffness reduces in comparison to cases Aand B, so the time period is greater in comparison to cases A and B.
For roll and pitch degree-of-freedom for cases A and B, it is observed that thereis very little change in mooring stiffness because of unidirectional wave train nearlyzero response in roll and little change in response of pitch degree-of-freedom isachieved. Whereas for cases C and D at time t = 0, additional component in thestiffness matrix makes it stiffer, so the time period is less in comparison with casesA and B. There is no change in the time period at the steady state response, becausean unidirectional wave train is considered resulting in nearly zero response in rolland little change in response in the pitch degree-of-freedom.
For the yaw degree-of-freedom at time t = 0 it is observed that the time periodfor case B is more than case A, since at t = 0, the response is nearly zero and fromFig. 7, the horizontal mooring force is more in case A than in case B, so case B isless stiff than case A. There is no change in the time periods at the steady stateresponse, because an unidirectional wave train is considered and a nearly zeroresponse occurs in the yaw degree-of-freedom. There is no change in time periodat t = 0 for cases C and D in comparison to cases A and B because there is noeffect of vertical excursion in the stiffness matrix for yaw. Steady state response forcases C and D is similar to that of cases A and B.
Table 4 shows that there is a decrease of 14.5% in surge, a decrease of 23.4% inheave and a decrease of 0.5% in pitch responses when case B is considered in com-parison to case A. Similarly, there is a decrease of 14.5% in surge, a decrease of18% in heave and a decrease of 0.78% in pitch responses when case D is consideredin comparison to case C. For the pitch degree-of-freedom it is observed that there
540 A.K. Agarwal, A.K. Jain/Ocean Engineering 30 (2003) 517-551
is very slight difference between cases A and C. A reduction in initial horizontalforce decreases surge and heave responses significantly.
From Table 4 it is also seen that there is a decrease of 6.32% in surge, an increaseof 50.51% in heave and an increase of 0.26% in pitch response, when case C iscompared to case A. Similarly there is a decrease of 6.30% in surge and increaseof 61.12% in heave response, when case D is compared to case B. There is nochange for pitch response when case D is compared to case B. Inclusion of verticalspring in the stiffness matrix reduces the stiffness component in sway, heave, roll,pitch and yaw direction and makes it less stiff, so the displacement is more in casesC and D in comparison to cases A and B. Whereas the stiffness component in surgedirection get enhanced and makes it stiffer, so the displacement in surge directionis less in cases C and D in comparison to cases A and B. Considering verticalexcursion in mooring line affects surge and heave response significantly when casesA and C and cases B and D is compared. From Table 4 it is also seen that consideringhorizontal excursion of the mooring line there is no sway, roll and yaw responses,whereas when both horizontal and vertical excursions are considered there is slightsway response in addition to surge, heave and pitch.
With having a lower mooring system stiffness in cases B and D, the structure ismore flexible and gives lower dynamic amplification of the response, although thestatic contribution of response being higher for lower stiffness of the structure. CasesA and C, on the other hand, gives higher response as the structure is stiff and pro-duces comparatively more dynamic amplification of the static response which islower than cases B and D. This is due to the nonlinear behavior of the cable force.The difference in the cable forces for cases B and D is more than the difference inthe cable forces for cases A and C. So for lower initial horizontal force it becomestiffer in comparison to higher initial horizontal force. This indicates that the betterperformance of Spar platforms can be achieved with lower stiffness of mooringsystem. It is necessary to understand the correct nonlinear behavior of the mooringlines as it directly effects the Spar response.
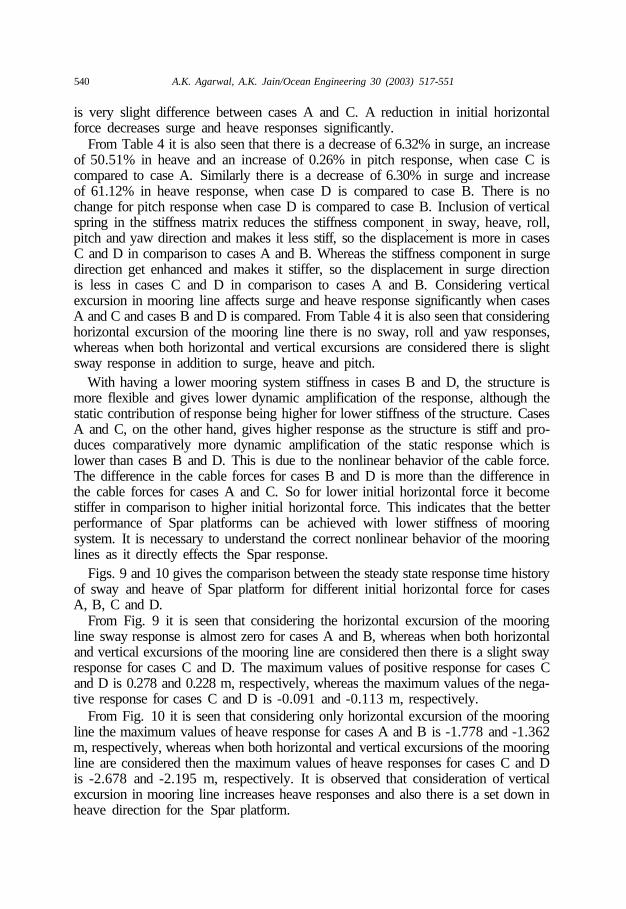
Figs. 9 and 10 gives the comparison between the steady state response time historyof sway and heave of Spar platform for different initial horizontal force for casesA, B, C and D.
From Fig. 9 it is seen that considering the horizontal excursion of the mooringline sway response is almost zero for cases A and B, whereas when both horizontaland vertical excursions of the mooring line are considered then there is a slight swayresponse for cases C and D. The maximum values of positive response for cases Cand D is 0.278 and 0.228 m, respectively, whereas the maximum values of the nega-tive response for cases C and D is -0.091 and -0.113 m, respectively.
From Fig. 10 it is seen that considering only horizontal excursion of the mooringline the maximum values of heave response for cases A and B is -1.778 and -1.362m, respectively, whereas when both horizontal and vertical excursions of the mooringline are considered then the maximum values of heave responses for cases C and Dis -2.678 and -2.195 m, respectively. It is observed that consideration of verticalexcursion in mooring line increases heave responses and also there is a set down inheave direction for the Spar platform.
A.K. Agarwal, A.K. Jain / Ocean Engineering 30 (2003) 517-551 541
493.8 2495 2496.3 2497.5 2498.8 2500
2500kN(hor) - -2500kN(ver) —
Fig. 9. Steady state time history of sway response.
time (sec)
-124S7.5 2488.75 2490 2491.25 2492.5 2493.75 2495 2496.25 2497.5 2498.75 2500
-1.5 -
-2.5 -
-3 J
• • - - •
A A
• - 2500kN(hor) - - a - - 2000kN(hor)— 2500kN(ver) — ± — 2000kN(ver)
Fig. 10. Steady state time history of heave response.
542 A.K. Agarwal, A.K. Jain/Ocean Engineering 30 (2003) 517-551
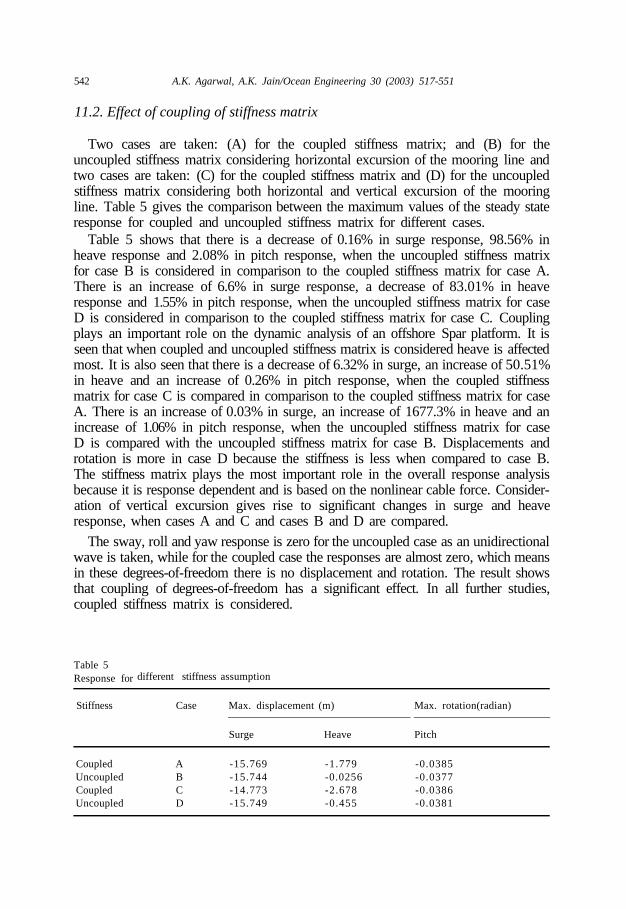
11.2. Effect of coupling of stiffness matrix
Two cases are taken: (A) for the coupled stiffness matrix; and (B) for theuncoupled stiffness matrix considering horizontal excursion of the mooring line andtwo cases are taken: (C) for the coupled stiffness matrix and (D) for the uncoupledstiffness matrix considering both horizontal and vertical excursion of the mooringline. Table 5 gives the comparison between the maximum values of the steady stateresponse for coupled and uncoupled stiffness matrix for different cases.
Table 5 shows that there is a decrease of 0.16% in surge response, 98.56% inheave response and 2.08% in pitch response, when the uncoupled stiffness matrixfor case B is considered in comparison to the coupled stiffness matrix for case A.There is an increase of 6.6% in surge response, a decrease of 83.01% in heaveresponse and 1.55% in pitch response, when the uncoupled stiffness matrix for caseD is considered in comparison to the coupled stiffness matrix for case C. Couplingplays an important role on the dynamic analysis of an offshore Spar platform. It isseen that when coupled and uncoupled stiffness matrix is considered heave is affectedmost. It is also seen that there is a decrease of 6.32% in surge, an increase of 50.51%in heave and an increase of 0.26% in pitch response, when the coupled stiffnessmatrix for case C is compared in comparison to the coupled stiffness matrix for caseA. There is an increase of 0.03% in surge, an increase of 1677.3% in heave and anincrease of 1.06% in pitch response, when the uncoupled stiffness matrix for caseD is compared with the uncoupled stiffness matrix for case B. Displacements androtation is more in case D because the stiffness is less when compared to case B.The stiffness matrix plays the most important role in the overall response analysisbecause it is response dependent and is based on the nonlinear cable force. Consider-ation of vertical excursion gives rise to significant changes in surge and heaveresponse, when cases A and C and cases B and D are compared.
The sway, roll and yaw response is zero for the uncoupled case as an unidirectionalwave is taken, while for the coupled case the responses are almost zero, which meansin these degrees-of-freedom there is no displacement and rotation. The result showsthat coupling of degrees-of-freedom has a significant effect. In all further studies,coupled stiffness matrix is considered.
Table 5Response for
Stiffness
CoupledUncoupledCoupledUncoupled
different stiffness
Case
ABCD
assumption
Max. displacement
Surge
-15.769-15.744-14.773-15.749
(m)
Heave
-1.779-0.0256-2.678-0.455
Max. rotation(radian)
Pitch
-0.0385-0.0377-0.0386-0.0381

A.K. Agarwal, A.K. Jain / Ocean Engineering 30 (2003) 517-551 543
Fig. 11 gives the comparison between the steady state response time history ofheave of the Spar platform for different coupled and uncoupled stiffness matricesfor cases A, B, C and D.
From Fig. 11 it is seen that considering horizontal excursion of the mooring linefor the uncoupled stiffness matrix for case B the heave response is almost zero. Forthe coupled case A the maximum value of the heave response is -1.779 m, whereaswhen both horizontal and vertical excursions of the mooring line are considered thenthere is a slight increase in displacement for uncoupled case D and the maximumvalue of the heave response is -0.455 m. The maximum value of the heave responsefor coupled case C is -2.678 m. It is observed that consideration of vertical excursionin the mooring line increases heave responses and there is a set down in the heavedirection for the Spar platform.
11.3. Effect of structural damping
Three cases are taken for a damping ratio of 10% (case A), 5% (case B) and 3%(case C) considering horizontal excursion of the mooring line and three cases aretaken for structural damping ratio of 10% (case D), 5% (case E) and 3% (case F)considering both horizontal and vertical excursion of the mooring line. Table 6 givesthe response for 10, 5 and 3% structural damping ratios for different cases.
Table 6 shows that when only the horizontal excursion of the mooring line isconsidered there is no change in the surge and pitch response when 5% structuraldamping in case B is compared to 10% structural damping in case A. There is a
0.5 -,
-0.5
24$7.5 2488.75 2490 2491.25 2492.5 2493.75 2495 2496.25 2497.5 2498.75 2500
g
I -1.5 ]
-2 -
-2.5 i
-3 J
time (sec)
-• W-
-•--•--•-
• coupkd(hor)» coupled(ver)
- - uncoupled(hor)— uncoupled(ver)
Fig. 11. Steady state time history of heave response.

544 A.K. Agarwal, A.K. Jain/Ocean Engineering 30 (2003) 517-551
Table 6Response for different
Structural damping
10531053
structural
Case
ABCDEF
damping ratios
Maximum
Surge
-15.769-15.769-15.733-13.144-14.773-15.392
displacement (m)
Heave
-1.710-1.779-1.845-2.734-2.678-2.662
Maximum rotation(radian)
Pitch
-0.0385-0.0385-0.0386-0.0386-0.0386-0.0387
decrease of 0.23% in surge, an increase of 0.26% in pitch response when 3% struc-tural damping in case C is compared to 10% structural damping in case A. Thereis increases of 4.04%, 7.89% in heave response when cases B, C are compared tocase A, respectively. Whereas, when both horizontal and vertical excursions of themooring line are considered for cases D, E and F it is observed that there is increasesof 12.39%, 17.10% in surge, decreases of 2.04%, 2.63% in heave when cases E andF are compared with case D, respectively. There is no change in pitch response forcases D and E, whereas there is a decrease of 0.26% in pitch response when caseF is compared to case D. It is observed that for a higher structural damping ratiothere is no effect in surge and pitch response when only horizontal excursion of themooring line is considered, whereas a reduction in structural damping affects heaveresponses significantly when cases A, B and C are compared. Whereas it affectssurge response significantly when cases D, E and F are compared.
It is also seen that there is decreases of 16.64, 6.32 and 2.16% in surge response,increases of 59.88, 50.53 and 44.28% in heave response, and increases of 0.26, 0.26and 0.26% in pitch response, when case D is compared to case A, case E is comparedto case B, and case F is compared to case C, respectively. Consideration of verticalexcursion gives rise to significant changes in surge and heave response, when casesA and D, cases B and E and cases C and F are compared.
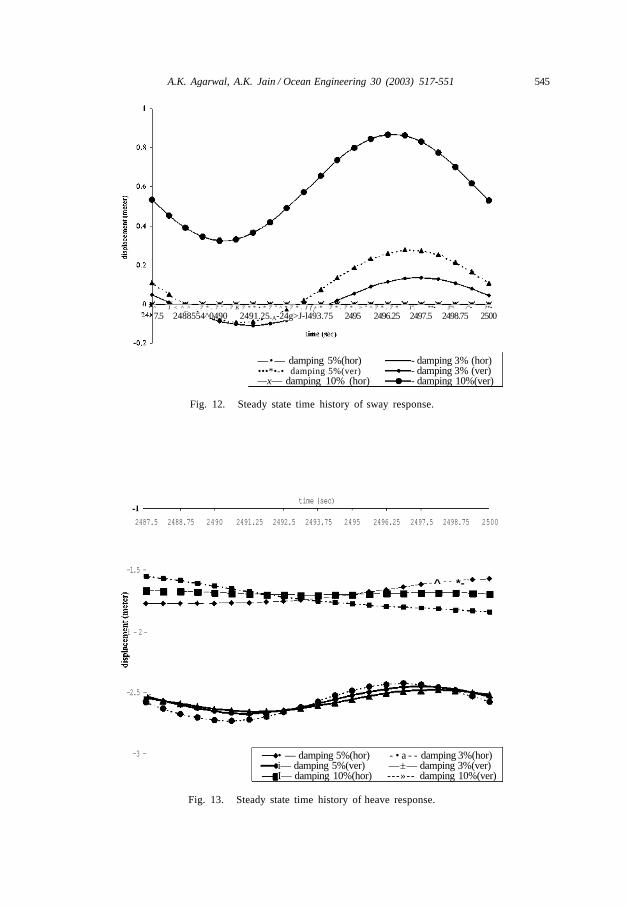
Figs. 12 and 13 gives the comparison between the steady state response timehistory of sway and heave of the Spar platform for different structural damping ratiofor cases A, B, C and D.
From Fig. 12 it is seen that considering horizontal excursion of the mooring linesway response is almost zero for cases A, B and C, whereas when both horizontaland vertical excursion of the mooring line is considered then there is a slight swayresponse for cases D, E and F. The maximum values of positive response for casesD, E and F are 0.866, 0.277 and 0.135 m, whereas the maximum value of negativeresponse for cases E and F are -0.091 and -0.107 m.
From Fig. 13 it is seen that considering only horizontal excursion of the mooringline the maximum values of heave response is -1.710, -1.779 and -1.845 m for casesA, B and C, whereas when both horizontal and vertical excursions of the mooring
A.K. Agarwal, A.K. Jain / Ocean Engineering 30 (2003) 517-551 545
^ J < ^ ^ 7 * . 7 " . 7 K 7 * * • * 7 " ^ * 7 * . J f r * 7 * . 7 * . > " ^ 7 * . 7 * I". **• J"̂ /"• ?*•
7.5 2488554^0490 2491.25.A-24g>J-l493.75 2495 2496.25 2497.5 2498.75 2500
—•— damping 5%(hor)•••*•-• damping 5%(ver)—x— damping 10% (hor)
- damping 3% (hor)- damping 3% (ver)- damping 10%(ver)
Fig. 12. Steady state time history of sway response.
time (sec)
2487.5 2488.75 2490 2491.25 2492.5 2493.75 2495 2496.25 2497.5 2498.75 2500
-1.5 -
^ *-
i - 2 -
-2.5 -.
-3 - • — damping 5%(hor) - • a - - damping 3%(hor)i— damping 5%(ver) —±— damping 3%(ver)I— damping 10%(hor) ---»-- damping 10%(ver)
Fig. 13. Steady state time history of heave response.
546 A.K. Agarwal, A.K. Jain/Ocean Engineering 30 (2003) 517-551
line is considered then the maximum values of heave responses for cases D, E andF is -2.734, -2.678 and -2.662 m. There is not much difference in heave responsefor cases D, E and F. It is observed that consideration of vertical excursion in moor-ing line increases heave responses and there is also a set down in the heave directionfor the Spar platform.
11.4. Effect of inertia coefficient Cm
Two cases are taken when Cm is equal to 2 (case A) and 1.8 (case B) consideringthe horizontal excursion of the mooring line and two cases are taken for when Cm
is equal to 2 (case C) and 1.8 (case D) considering both the horizontal and verticalexcursion of the mooring line. Surge force, heave force and pitch moment reduceswhen Cm reduces from 2 to 1.8 while calculating the force using Morison's equation.Table 7 gives the response for Cm equal to 2 and 1.8 for different cases.
Table 7 shows that there is a decrease of 15.79% in surge, a decrease of 7.25%in heave and a decrease of 10.38% in pitch response when Cm is equal to 1.8 (caseB) is considered in comparison to Cm equal to 2 (case A). There is a decrease of15.93% in surge, increase of 0.41% in heave and decrease of 10.36% in pitchresponse when Cm is equal to 1.8 (case D) is considered in comparison to Cm equalto 2 (case C). Reduction in inertia coefficient affects the surge, heave and pitchresponse. It is seen that there is a decrease of 6.32% in surge, an increase of 50.51%in heave and an increase of 0.26% in pitch response, when case C is compared tocase A. Similarly there is a decrease of 6.47% in surge, an increase of 62.96% inheave and an increase of 0.29% in pitch response, when case D is compared to caseB. Consideration of vertical excursion gives rise to significant changes in surge andheave response, when cases A and C and cases B and D are compared.
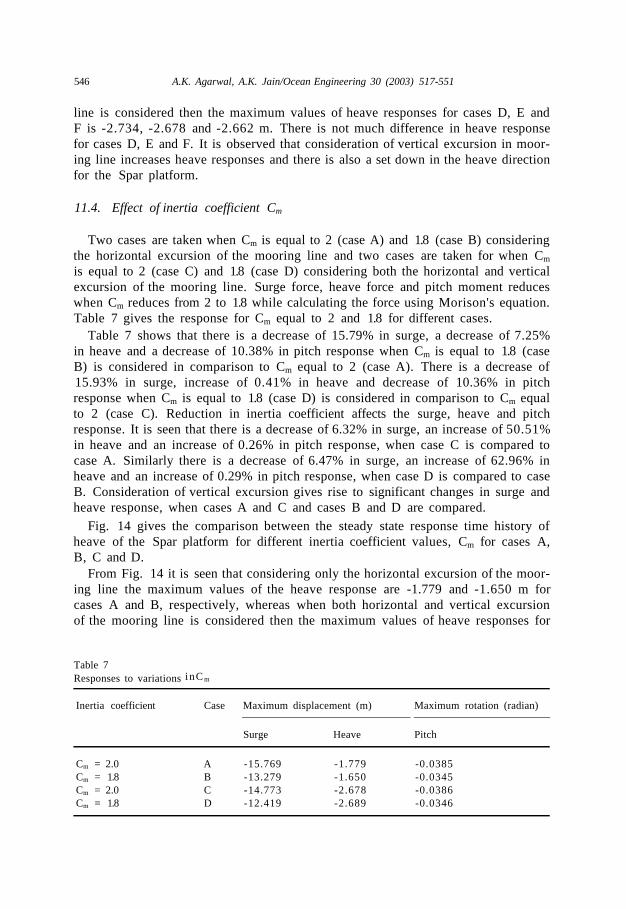
Fig. 14 gives the comparison between the steady state response time history ofheave of the Spar platform for different inertia coefficient values, Cm for cases A,B, C and D.
From Fig. 14 it is seen that considering only the horizontal excursion of the moor-ing line the maximum values of the heave response are -1.779 and -1.650 m forcases A and B, respectively, whereas when both horizontal and vertical excursionof the mooring line is considered then the maximum values of heave responses for
Table 7Responses to variations
Inertia coefficient
Cm = 2.0Cm = 1.8Cm = 2.0Cm = 1.8
inC m
Case
ABCD
Maximum
Surge
-15.769-13.279-14.773-12.419
displacement (m)
Heave
-1.779-1.650-2.678-2.689
Maximum rotation (radian)
Pitch
-0.0385-0.0345-0.0386-0.0346
-1
A.K. Agarwal, A.K. Jain/Ocean Engineering 30 (2003) 517-551 547
time (sec)
2487.5 2488.8 2490 2491.3 2492.5 2493.8 2495 2496.3 2497.5 2498.8 2500
-3 • - Cm=2.0(hor) -•••-Cm=1.8(hor)
i—Cm=2.0(ver) A Cm=1.8(ver)
Fig. 14. Steady state time history of heave response.
cases C and D are -2.678 and -2.689 m, respectively. There is not much differencein heave response for cases C and D. It is observed that consideration of verticalexcursion in the mooring line increases heave responses and also there is a set downin heave direction for the Spar platform.
11.5. Effect of drag coefficient Cd
Two cases are taken for Cd equal to 1 (case A) and 0 (case B) considering horizon-tal excursion of the mooring line and two cases are taken for Cd equal to 1 (caseC) and 0 (case D) considering both horizontal and vertical excursion of the mooringline. Surge and heave force reduces as the total force decreases when drag coefficientis zero while, calculating force using Morison's equation. Table 8 gives the responsefor Cd equal to 1 and 0 for different cases.
Table 8Responses to variations
Drag coefficient
C d = lQ = oCd= 1Q = o
in Cd
Case
ABCD
Maximum
Surge
-15.769-11.910-14.773-15.485
displacement (m)
Heave
-1.779-1.667-2.678-2.676
Maximum rotation (radian)
Pitch
-0.0385-0.0387-0.0386-0.0391
548 A.K. Agarwal, A.K. Jain / Ocean Engineering 30 (2003) 517-551
Table 8 shows that there is a decrease of 24.47% in surge, a decrease of 6.30%in heave and an increase of 0.52% in pitch response when Cd equal to 0 (case B)is considered in comparison to Cd equal to 1 (case A). There is a increase of 4.82%in surge, a decrease of 0.07% in heave and an increase of 1.29% in pitch responsewhen Cd equal to 0 (case D) is considered in comparison to Cd equal to 1(caseC). Reduction in drag coefficient affects surge and heave response more when onlyhorizontal excursion is considered. It is also seen that there is a decrease of 6.32%in surge, an increase of 50.51% in heave and an increase of 0.26% in pitch response,when case C is compared to case A. There is an increase of 30.01% in surge, anincrease of 60.52% in heave and an increase of 1.03% in pitch response, when caseD is compared to case B. Consideration of vertical excursion gives rise to significantchanges in surge and heave response, when cases A and C and cases B and Dare compared.
Although the Spar exhibits an inertia dominated force regime, the influence of thedrag coefficient is appreciable in surge response but not in the heave response.
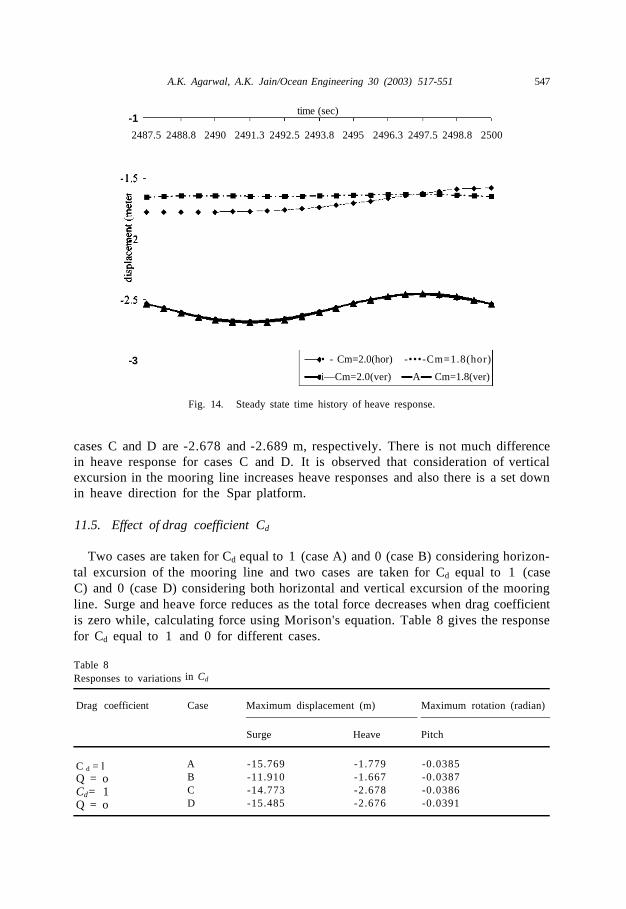
Fig. 15 gives the comparison between the steady state response time history ofheave of the Spar platform for different drag coefficient values, Cd, for cases A, B,C and D.
From Fig. 15 it is seen that when considering only horizontal excursion of themooring line the maximum values of heave response is —1.779 and -1.667 m forcases A and B, respectively, whereas when both horizontal and vertical excursionsof the mooring line is considered then the maximum values of heave responses forcases C and D is -2.678 and -2.676 m, respectively. There is not much difference
-ltime (sec)
24* 7.5 2488.8 2490 2491.3 2492.5 2493.8 2495 2496.3 2497.5 2498.8 2500
-1.5 -
fi-2-
-2.5 -,
-3 J
.-»-*•*-»-*•-»--»•*•••* * :* T *
-Cd=1.0(hor) ---Cd=1.0(ver) —
-Cd=0.0(hor)— Cd=0.0(ver)
Fig. 15. Steady state time history of heave response.
A.K. Agarwal, A.K. Jain/Ocean Engineering 30 (2003) 517-551 549
in heave response for cases C and D. It is observed that consideration of verticalexcursion in the mooring line increases heave responses and there is also a set downin heave direction for the Spar platform.
12. Conclusions
Based on the numerical study conducted on the Spar platform, the following con-clusions can be drawn:
1. Modeling the nonlinear force-excursion (horizontal and vertical) relationship ofthe mooring lines with different slopes (stiffness) gives the reasonably accuratebehavior of Spar responses, whereas modeling the force-excursion (horizontal andvertical) relationship of the mooring line with multilinear segments can result inunrealistic Spar responses.
2. Inclusion of vertical spring plays an important role on the dynamic behavior ofSpar response. Also it is seen from the study that neither drag coefficient, inertiacoefficient and structural damping ratio variations affects the heave response,whereas these parameters do influence the response, when only horizontal excur-sion is considered.
3. Considering the effect of vertical excursion of the mooring lines, the heave naturalperiod of the spar is decreased, which makes spar's natural period in heavedegrees-of-freedom nearer to the frequently occurring wave periods.
4. The horizontal force-excursion relation of a single mooring line depends mainlyon the initial horizontal force. Reducing the initial horizontal force in the mooringline, lowers the Spar response. It is necessary to understand the correct nonlinearbehavior of the mooring lines as it directly effects the Spar response.
5. The coupling of the stiffness matrix of the Spar platform play an important rolein the dynamic behavior of offshore Spar platforms as the response is significantlyaffected by considering the coupled stiffness matrix.
6. The influence of structural damping is very minimal on the overall response ofthe Spar platform for higher structural damping ratios when only horizontal excur-sion of the mooring line is considered, whereas it is considerable for lower struc-tural damping ratios when horizontal excursion of the mooring line and whenboth horizontal and vertical excursions of the mooring line is considered.
7. It is necessary to evaluate the proper value of Cm so that wave force can beproperly estimated as it has significant effect on the response of the Spar platform.
8. The effect of Cd is important as drag force affects the total force although theSpar is a large diameter structure and is relatively inertia dominated.
References
Agarwal, A.K., Jain, A.K., 2002. Dynamic behavior of offshore spar platforms under regular sea waves.International Journal of Ocean Engineering, USA 30 (4), 487-516.
550 A.K. Agarwal, A.K. Jain / Ocean Engineering 30 (2003) 517-551
Bax, J.D., de Werk, K.J.C., 1974. A floating storage unit designed specially for the Severest EnvironmentalConditions. Society of Petroleum Engineers (SPE paper 4853).
Cao, P., Zhang, J., 1996.Slow motion response of compliant offshore structures. In: Proceedings of theSixth International Offshore and Polar Engineering Conference, vol. 1, pp. 296—303.
Chen, X.H., Zheng, J., Ma, W., 1999. Coupled time-domain analysis of the response of a spar and itsmooring system. In: Proceedings of the Ninth International Offshore and Polar Engineering Confer-ence, vol. 1, pp. 293-300.
Chitrapu, A.S., Saha, S., Salpekar, V.Y., 1998. Time domain simulation of spar platform response inrandom waves and current. In: 17th International Conference on Offshore Mechanics and Arctic Engin-eering (OMAE98-0380), pp. 1-8.
Chitrapu, A.S., Saha, S., Salpekar, V.Y., 1999. Motion response of spar platform in directional wavesand current. In: 18th International Conference on Offshore Mechanics and Arctic Engineering(OMAE99/OFT-4237), pp. 1-9.
Converse, R., Bridges, R., 1997. Putting Spar technology to the test. Offshore Technology Feb, pp. 8-12.Datta, I., Prislin, I., Halkyard, J.E., Greiner, W.L., Bhat, S., Perryman, S., Beynat, P.A., 1999. Comparison
of truss spar model test results with numerical predictions. In: 18th International Conference on Off-shore Mechanics and Arctic Engineering (OMAE99/OFT-4231), pp. 1-14.
D'Souza, R., Dove, P.G.S., Hervey, D.G., Hardin, D.J., 1992. The design and installation of efficientdeepwater permanent moorings. Marine Technology 29 (1), 25-35.
Dutta, A., 1984. Dynamic behavior of offshore guyed tower. PhD. Dissertation, Indian Institute of Tech-nology, New Delhi, India.
Fisher, F.H., Spiess, F.N., 1963. Flip floating instrument platform. Journal of the Acoustical Society ofAmerica 35 (10), 1633-1644.
Fischer, F J., Gopalkrishnan, R., 1998. Some observations on the heave behavior of spar platforms. Journalof Offshore Mechanics and Arctic Engineering 120, pp. 221-225.
Glanville, R.S., Paulling, J.R., Halkyard, J.E., Lehtinen,T.J., 1991. Analysis of the spar floating drillingproduction and storage structure. In: Offshore Technology Conference (OTC-6701), pp. 57—68.
Glanville, R.S., Halkyard, J.E., Davies, R.L., Frimm, F., 1997. Neptune project: spar history and designconsiderations. In: Offshore Technology Conference (OTC-8382), Houston, TX.
Halkyard, J.E., 1996. Status of spar platforms for deepwater production systems. In: Proceedings of theSixth International Offshore and Polar Engineering Conference, vol. 1, pp. 262—272.
Jha, A. K., de Jong, P.R., Winterstein, S.R., 1997. Motion of spar buoy in random seas: comparingpredictions and model test results. In: Proceedings of the Behaviour of Offshore Structures, pp.333-347.
Kim, M.H., Ran, Z., Zheng, W., 2001. Hull/mooring coupled dynamic analysis of a truss spar in timedomain. International Journal of Offshore and Polar Engineering 11, pp. 42-54.
Lowd, J.D., Hill, E.C., Matzer, R.F., 1971. Use of a spar buoy designed for interim production processing.In: Offshore Technology Conference (OTC-1333), pp. 97-104.
Mekha, B.B., Johnson, C.P., Roesset, J.M., 1995. Nonlinear response of a spar in deep water: differenthydrodynamic and structural models. In: Proceedings of the Fifth International Offshore and PolarEngineering Conference, vol. 3, pp. 462^169.
Mekha, B.B., Weggel, D.C., Johnson, C.P., Roesset, J.M., 1996. Effect of second order diffraction forceson the global response of spars. In: Proceedings of the Sixth International Offshore and Polar Engineer-ing Conference, vol. 1, pp. 273—280.
Ran, Z., Kim, M.H., 1996. Nonlinear coupled response of a tethered spar platform in waves. In: Proceed-ings of the Sixth International Offshore and Polar Engineering Conference, vol. 1, pp. 281-288.
Ran, Z., Kim, M.H., Niedzwecki, J.M., Johnson, R.P., 1996. Response of a spar platform in randomwaves and currents (experiment vs. theory). International Journal of Offshore and Polar Engineering6, 27-34.
Ran, Z., Kim, M.H., Zheng, W., 1999. Coupled dynamic analysis of a moored spar in random wavesand currents (time-domain vs. frequency-domain analysis). Journal of Offshore Mechanics and ArcticEngineering, 121, pp. 194-200.
Triantafyllou, M.S., Kardomateas, G., Bliek, A., 1982. The statics and dynamics of the mooring lines of

A.K. Agarwal, A.K. Jain / Ocean Engineering 30 (2003) 517-551 551
a guyed tower for design applications. In: Proceedings of the Behaviour of Offshore Structures, vol.1, pp.546-561.
Van Santen, J.A., de Werk, K., 1976. On the typical qualities of spar type structures for initial or perma-nent field development. In: Offshore Technology Conference (OTC-2716), pp. 1105-1118.
Verma, J., 1990. Dynamic behaviour of floating production platform. PhD. Dissertation, Indian Instituteof Technology, New Delhi, India.