NON-INTRUSIVE EFFICIENCY ESTIMATION OF INDUCTION …
222
NON-INTRUSIVE EFFICIENCY ESTIMATION OF INDUCTION MACHINES by Barbara Linda Herndler A thesis submitted to the Department of Electrical Engineering, University of Cape Town, in fulfilment of the requirements for the degree of MSc Electrical Engineering University of Cape Town October 2010
Transcript of NON-INTRUSIVE EFFICIENCY ESTIMATION OF INDUCTION …

NON-INTRUSIVE EFFICIENCY ESTIMATION
OF INDUCTION MACHINES
by
Barbara Linda Herndler
A thesis submitted to the Department of Electrical Engineering, University of
Cape Town, in fulfilment of the requirements for the degree of
MSc Electrical Engineering
University of Cape Town
October 2010

Non-Intrusive Efficiency Estimation of Induction Machines ii
DECLARATION
This dissertation is submitted to the Department of Electrical Engineering, University of
Cape Town, in complete fulfilment of the requirements for the degree of Master of Science
in Electrical Engineering. It has not been submitted before for any degree or examination at
this or any other university. I know the meaning of plagiarism and declare that all the work
in the document, save for that which is properly acknowledged, is my own.
Signed: ___________________________ Date: ___________________

Non-Intrusive Efficiency Estimation of Induction Machines iii
To Mom and Dad
Thank you for your endless love and support. Your encouragement and belief in me has been motivating and
inspirational. Know that I look up to you as a friend and a mentor.

Non-Intrusive Efficiency Estimation of Induction Machines iv
ACKNOWLEDGEMENTS
My sincere thanks and gratitude extends to my supervisor, Dr P. Barendse for all his
encouragement an inspiration. His patients and sincerity has made him a highly admirable
mentor to me. I also thank my co-supervisor, Dr M.A Kahn, for all his words of guidance and
support throughout this thesis.
To Mr C. Wozniak and Mr P. Titus, your continuous and valued support in the Machines
Laboratory is indispensible
I would like to thank the administration staff of the Electrical Engineering Department at
the University of Cape Town for their outstanding kindness and goodwill. This includes Mrs
K. van Wyk, Mrs N. Moodley and Mrs M. Joubert.
To Mrs A Kahn, I am indebted to you for taking the time to read over my thesis.
I am also grateful for the support received from my friends and colleagues in the AMES
research group. To Mr A. Van Wyk, I thank you for your willingness to provide assistance,
despite having your own stresses. Your practical knowledge in the labs has been truly
invaluable. To Mr W.J Gitonga, you have brought much light and laughter even during the
difficult times-your positive attitude towards life and its challenges is truly inspirational.
To Mr and Mrs Jagau, you have shown nothing but compassion and acceptance towards me.
I am grateful to have spent the past year getting to know you. To Mr E. Anyang, I thank you
for your generosity and support. Your selfless actions have showed me that I could always
count on you. To Dr. R. Okou, you were always there when I needed advice. Your honesty
and integrity is admirable to those who are privileged to work with you. To Mr H. Lu and
Mr. J de LeBat, I thank you for your assistance and time spent in the laboratory. Your
continuous support and enthusiasm is very encouraging.

Non-Intrusive Efficiency Estimation of Induction Machines v
To my beloved friends who have stood by me during the time I have spent at UCT, I am
honoured and privileged to have met you. To Miss D Babu, you have been the best friend
anyone could ask for. You have never stopped believing in me and my capabilities and your
honesty and humbleness is both enduring and commendable. To Miss C. Hofmeyer, I thank
you for your continuous support and encouragement; you too have been my pillar of
strength during the darkest times. To Mr. G Apsey, I am grateful to have a friend of such a
high calibre. You are a true gentleman who can bring laughter and joy to those around you.
To Mr D Clough, thank you for being supportive, your kind and gentle mannerism to others
is admirable. To Mr R. Pott, thank you for being the friend that you are. We have shared
many wonderful moments together. You are a truly remarkable gentleman. To Mr. T.
Edimu, thank you for your cheerful disposition, you have a brought much light by helping
me get perspective when times were tough. To Mr W. Sikwete, I thank you for being there
when I need help. Your kind and gentle nature is wonderful. To Mr. M. Truyens, I thank you
for continuously being there for me. You have brought much joy into my life and without
you this would not be possible. Your words of motivation and inspiration have allowed me
to get through many of the challenges I had to face. You are an amazing person and I am
honoured to have you in my life.
Lastly, I would like to thank the EEDSM Hub bursary for their financial assistance. I thank
you for providing me with the opportunity to continue my studies.

Non-Intrusive Efficiency Estimation of Induction Machines vi
SYNOPSIS
Background
Determining the efficiency of an in-service motor poses a challenging task. Many of the
testing standards require the motor to be decoupled from its load, or require the use of
highly specialised equipment which, unlike under laboratory conditions, is often
unavailable. In order to assess the efficiency of an induction machine, it is subjected to
numerous testing procedures established by recognised international testing standards.
These procedures are considered to be time consuming, manually intensive and disruptive
to the machine’s operation. Thus, these tests cannot be implemented practically under
industrial applications. Additionally, the efficiency of the machine quoted after the
conduction of these laboratory tests often does not reflect the motor’s efficiency under
operating conditions. As an example, during laboratory testing, the supply conditions are
not polluted with degrees of harmonic distortion and unbalances as in the case out in
industry, which further affects the motor’s efficiency.
Aims and objectives
This thesis aims to address the aforementioned concerns by implementing a non-intrusive
efficiency estimation technique that is applicable to induction motors in industry.
Approach/Methodology
Many non-intrusive efficiency estimation techniques, with varying degrees of accuracy and
intrusion, have been developed. The air gap torque method was identified as the most
accurate of these methods; however it is considered to be highly intrusive due to the
measurements of stator resistance, rotor speed and no load losses. The non-intrusive air
gap torque (NAGT) method measures only the motor terminal quantities and combines
various estimation techniques to determine these parameters in a non-intrusive manner.

Non-Intrusive Efficiency Estimation of Induction Machines vii
The stator winding resistance (Rs) is estimated by employing a DC signal injection based
topology. The rotor speed estimation is determined by incorporating a vibration spectrum
analysis technique. The no load loss components are estimated empirically as a percentage
of rated input power. The stray load losses are determined according to an assigned
allowance relative to its size as defined by the IEC Std 34-2-1.
Based on the aforementioned estimation techniques, efficiency tests are conducted on
three motors with ratings of 7.5kW, 11kW and 15kW. Each of these motors are four-pole,
380/400V, 50Hz and are totally enclosed fan cooled (TEFC) squirrel cage induction motors.
Additionally, the machines are connected in a delta configuration. Efficiency tests according
to the IEC Std 34-2-1 segregation of losses and direct methods are also performed and
serve as the premise for which the results attained from the NAGT method can be
compared. Additionally, the performance of the NAGT method during unbalanced supply
voltage conditions is also considered.
An error analysis is conducted to quantify the effects of instrumentation errors in
parameter measurements on the efficiency value of the motor. To achieve this, the worst
case error estimation (WCEE) and realistic error estimation (REE) techniques are applied
Results The stator resistance estimation results indicate an over estimate in comparison to the
expected resistance values. Additionally, the percentage error between these values is not
consistent over the entire loading range. The percentage errors for the 7.5kW, 11kW and
15kW are within 2.15%, 2.51% and 3.57% respectively.
For the case of the speed estimation technique, the results prove to be successful in
comparison to the measured values. Accuracy levels within 0.16% are attainable for all
three motors tested. The rotational frequency components, from which the speeds are
obtained, are dominant and easily detectable over the entire load range making speed
estimation highly dependable.

Non-Intrusive Efficiency Estimation of Induction Machines viii
The estimated no load losses prove to be an under estimate for the 11kW and 15kW
motors. In contrast, an over estimate is indicated for the 7.5kW motor. For the case of stray
load loss estimation, the estimated values show a constant overestimate in SLLs over the
load range in comparison with the values attained from the IEC Std 34-2-1. This is due to
the estimated values being constant over the load range and not load dependant as
reflected by the results obtained in the IEC Std 34-2-1. An improved method of SLL
estimation indicates values which are load dependant and follows a similar trend as the IEC
Std 34-2-1. This efficiency of the NAGT method showed an improvement when
incorporating these SLLs.
The efficiency results using the NAGT method generally showed an underestimate in
comparison to the IEC Std 34-2-1 and direct methods. In particular, the deviations in
efficiencies at the lower loading points are larger than at the higher loading range. This
discrepancy is attributed to the overestimation of stray load losses.
The effect of magnitude voltage unbalance reflects a decrease in efficiency with an increase
in voltage unbalance. This is due to the increase in motor losses and hence increase in the
motor’s operating temperature. The efficiency results using the NAGT method consistently
indicate lower values of efficiency for each of the unbalanced cases in comparison to the
direct method hence further validating the method.
The error analysis indicates that the uncertainties due to instrumental errors are larger for
the NAGT method in comparison to the values obtained for the IEC Std 34-2-1. The effects
of introducing stricter tolerances in instrumentation accuracies show an improvement in
errors associated with the NAGT method. Additionally, the uncertainties according to the
WCEE and REE technique show a variation according to the loading condition of the
machine.

Non-Intrusive Efficiency Estimation of Induction Machines ix
Conclusions This thesis presents a means of determining the efficiency of an induction machine, non-
intrusively, by using the NAGT method. The NAGT method combines various non-intrusive
methods to estimate various parameters that are traditionally measured in a highly
intrusive manner. The stator winding resistance is estimated non-intrusively by injecting
DC components into the stator windings of the machine and can achieve accuracies of
within 3.57%. The rotor speed estimation using vibration spectrum analysis presents an
effective and reliable technique that can estimate the rotor speed (within 0.16%) without
degrading at low load conditions. The estimation of no load and stray load losses is
achieved using empirical values related to the size of the motor. In general, the estimation
of these losses is an overestimate and its effect is to reduce the estimated efficiency values.
Therefore, the efficiency values obtained using the NAGT method are lower than the values
attained using the IEC Std 34-2-1 and direct methods. Additionally, the NAGT method can
effectively be used to estimate the efficiency of an induction machine during unbalanced
supply conditions. The measurement uncertainty due to instrumental errors is associated
with the accuracy of the instrument, the influence of the measured parameters, the
methodology of the efficiency test and the load of the machine. The uncertainty of the
NAGT method is higher in comparison to the uncertainties associated with the IEC Std 34-
2-1 and direct methods.
Recommendations Improvements to the NAGT method can be made by considering the estimated parameters
individually. The rotor speed estimation technique can be improved by incorporating a
peak detection algorithm, such that the rotor speed can be detected online. Improved
methods of SLL estimation should be incorporated so that the SLLs are load dependant and
more reflective of the values attained in the IEC Std 34-2-1. The NAGT method acquires
parameters such as voltages and currents of which are used in many condition monitoring
techniques. Therefore, the NAGT method can be implemented in conjunction with these
techniques in order to develop a multipurpose device.

Non-Intrusive Efficiency Estimation of Induction Machines x
TABLE OF CONTENTS
1.1 Background ............................................................................................................................ 2
1.2 Problem Statement .............................................................................................................. 2
1.3 Key Questions ........................................................................................................................ 3
1.4 Aims and Objectives ............................................................................................................ 4
1.5 Scope and Limitations ........................................................................................................ 4
1.6 Outline of Thesis ................................................................................................................... 5
2.1 Introduction ........................................................................................................................... 8
2.2 Definition of Efficiency .................................................................................................... 11
2.3 Factors Affecting Motor Efficiency ............................................................................. 12
2.4 International Motor Efficiency Testing Standards ............................................... 26
2.5 Concluding Remarks ........................................................................................................ 36
3.1 Introduction ........................................................................................................................ 38
3.2 The Nameplate Method .................................................................................................. 38
3.3 The Slip Method ................................................................................................................. 39
3.4 The Current Method ......................................................................................................... 39
3.5 The Equivalent Circuit Method .................................................................................... 40
3.6 The Segregated Loss Method ........................................................................................ 41
3.7 Torque Methods ................................................................................................................ 42
3.8 Alternative Methods ........................................................................................................ 44
DECLARATION .................................................................................................................... II
ACKNOWLEDGEMENTS ...................................................................................................... IV
SYNOPSIS ........................................................................................................................... VI
TABLE OF CONTENTS ......................................................................................................... X
LIST OF FIGURES ..............................................................................................................XIII
LIST OF TABLES ............................................................................................................... XVI
LIST OF SYMBOLS ......................................................................................................... XVIII
NOMENCLATURE .............................................................................................................. XXI
CHAPTER ONE: INTRODUCTION ........................................................................................ 1
CHAPTER TWO: EFFICIENCY OF INDUCTION MACHINES .................................................. 7
CHAPTER THREE: OVERVIEW OF EFFICIENCY ESTIMATION TECHNIQUES ................... 37
Non-Intrusive Efficiency Estimation of Induction Machines xi
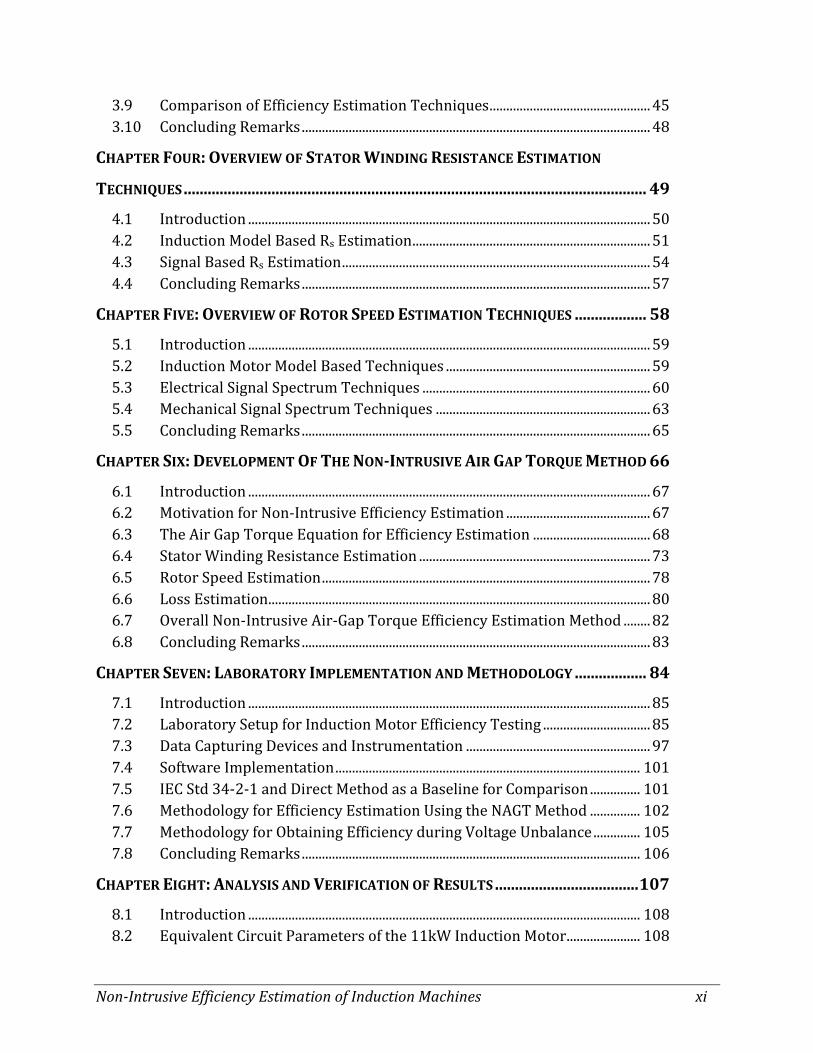
3.9 Comparison of Efficiency Estimation Techniques ................................................ 45
3.10 Concluding Remarks ........................................................................................................ 48
4.1 Introduction ........................................................................................................................ 50
4.2 Induction Model Based Rs Estimation ....................................................................... 51
4.3 Signal Based Rs Estimation ............................................................................................ 54
4.4 Concluding Remarks ........................................................................................................ 57
5.1 Introduction ........................................................................................................................ 59
5.2 Induction Motor Model Based Techniques ............................................................. 59
5.3 Electrical Signal Spectrum Techniques .................................................................... 60
5.4 Mechanical Signal Spectrum Techniques ................................................................ 63
5.5 Concluding Remarks ........................................................................................................ 65
6.1 Introduction ........................................................................................................................ 67
6.2 Motivation for Non-Intrusive Efficiency Estimation ........................................... 67
6.3 The Air Gap Torque Equation for Efficiency Estimation ................................... 68
6.4 Stator Winding Resistance Estimation ..................................................................... 73
6.5 Rotor Speed Estimation .................................................................................................. 78
6.6 Loss Estimation .................................................................................................................. 80
6.7 Overall Non-Intrusive Air-Gap Torque Efficiency Estimation Method ........ 82
6.8 Concluding Remarks ........................................................................................................ 83
7.1 Introduction ........................................................................................................................ 85
7.2 Laboratory Setup for Induction Motor Efficiency Testing ................................ 85
7.3 Data Capturing Devices and Instrumentation ....................................................... 97
7.4 Software Implementation ........................................................................................... 101
7.5 IEC Std 34-2-1 and Direct Method as a Baseline for Comparison ............... 101
7.6 Methodology for Efficiency Estimation Using the NAGT Method ............... 102
7.7 Methodology for Obtaining Efficiency during Voltage Unbalance .............. 105
7.8 Concluding Remarks ..................................................................................................... 106
8.1 Introduction ..................................................................................................................... 108
8.2 Equivalent Circuit Parameters of the 11kW Induction Motor ...................... 108
CHAPTER FOUR: OVERVIEW OF STATOR WINDING RESISTANCE ESTIMATION
TECHNIQUES .................................................................................................................... 49
CHAPTER FIVE: OVERVIEW OF ROTOR SPEED ESTIMATION TECHNIQUES .................. 58
CHAPTER SIX: DEVELOPMENT OF THE NON-INTRUSIVE AIR GAP TORQUE METHOD 66
CHAPTER SEVEN: LABORATORY IMPLEMENTATION AND METHODOLOGY .................. 84
CHAPTER EIGHT: ANALYSIS AND VERIFICATION OF RESULTS .................................... 107

Non-Intrusive Efficiency Estimation of Induction Machines xii
8.3 Stator Resistance Estimation ..................................................................................... 110
8.4 Speed Estimation ........................................................................................................... 115
8.5 No Load Loss Estimation ............................................................................................. 121
8.6 Stray Load Losses........................................................................................................... 127
8.7 Non-Intrusive Efficiency Estimation ...................................................................... 132
8.8 Effects of Voltage Unbalance on Motor Efficiency ............................................. 141
8.9 Discussion of Results .................................................................................................... 146
8.10 Concluding Remarks ..................................................................................................... 147
9.1 Introduction ..................................................................................................................... 150
9.2 Definition of Basic Terms and Concepts ............................................................... 150
9.3 Sources of Experimental Errors ............................................................................... 152
9.4 Methodology for Error Analysis on Experimental Data .................................. 158
9.5 Results and Discussion ................................................................................................ 160
9.6 Concluding Remarks ..................................................................................................... 175
10.1 Conclusions ...................................................................................................................... 178
10.2 Recommendations on Further Research .............................................................. 186
A.1 MATLAB Simulink model of DC signal injection circuit for Rs estimation 196
A.2 Labview models used for the NAGT method ....................................................... 197
A.3 MATLAB Simulink models used for the NAGT method ................................... 198
A.4 Influence coefficients .................................................................................................... 199
A.5 FFT code ............................................................................................................................ 201
CHAPTER NINE: ERROR ANALYSIS OF EFFICIENCY DETERMINATION ........................ 149
CHAPTER TEN: CONCLUSIONS AND RECOMMENDATIONS ........................................... 177
REFERENCES .................................................................................................................. 189
APPENDIX ...................................................................................................................... 195

Non-Intrusive Efficiency Estimation of Induction Machines xiii
LIST OF FIGURES
Figure 2.1: Construction of (a) the stator and (b) squirrel cage rotor [1] ........................ 9
Figure 2.2: Diagram showing the rotating magnetic fields [1] ........................................... 10
Figure 2.3: Power flow through a typical induction motor [7] .......................................... 13
Figure 2.4: Overview of polluted voltage supply conditions............................................... 16
Figure 2.5: Example of voltage variation .................................................................................... 17
Figure 2.6: Example of voltage magnitude and phase unbalance ..................................... 18
Figure 2.7: Sequence equivalent circuits for an induction machine [15] ....................... 20
Figure 2.8: Efficiency curve showing maximum efficiency [18] ........................................ 23
Figure 2.9: Assigned allowance for additional load loss [24] ............................................. 35
Figure 3.1: Example of a typical nameplate on an induction machine ............................ 38
Figure 3.2: Comparison of accuracy and intrusion of efficiency estimation methods46
Figure 6.1: Steady state DC equivalent circuit for star and delta connections [43] ... 74
Figure 6.2: Forward and reverse current path through a MOSFET [43] ........................ 74
Figure 6.3: Equivalent circuit with MOSFET on (a) and off (b) .......................................... 75
Figure 6.4: Example of vibration output signal and its corresponding FFT.................. 79
Figure 6.5: Overall NAGT procedure for efficiency estimation .......................................... 82
Figure 7.1: Test rig with dynamometer coupled to an induction motor ........................ 85
Figure 7.2: Motor and dynamometer shafts with alignment clock ................................... 86
Figure 7.3: Dynamometer torque arm with weights .............................................................. 88
Figure 7.4: Load cell and digital torque display ....................................................................... 89
Figure 7.5: Additional load resistors ............................................................................................ 89
Figure 7.6: DC injection circuit setup for stator winding resistance estimation ......... 90
Figure 7.7: Experimental circuitry for resistance estimation ............................................. 91
Figure 7.8: Internal circuitry of the accelerometer device .................................................. 94
Figure 7.9: Front and side view of the accelerometer device ............................................. 94
Non-Intrusive Efficiency Estimation of Induction Machines xiv
Figure 7.10: Accelerometer device placed on an induction machine .............................. 95
Figure 7.11: Variac configuration for implementing voltage unbalance ........................ 96
Figure 7.12: Yokogawa WT1600 Power Analyser................................................................... 97
Figure 7.13: Thermocouple placement on stator end windings ........................................ 98
Figure 7.14: TC-08 Pico logger with thermocouples .............................................................. 98
Figure 7.15: Proximity sensor placed over shaft coupling .................................................. 99
Figure 8.1: Equivalent circuit parameters of the 11kW induction machine .............. 109
Figure 8.2: Waveforms of VRext and Ia during injection mode .......................................... 110
Figure 8.3: Vibration signal and frequency spectrum under rated conditions ......... 115
Figure 8.4: Variation of rotational frequency (Fr) with load ............................................ 116
Figure 8.5: Differences in frequency resolution for speed detection ........................... 119
Figure 8.6: Core and friction and windage losses for the 11kW motor ....................... 121
Figure: 8.7: Total no load losses for the 11kW motor......................................................... 122
Figure 8.8: Core and friction and windage losses for the 15kW motor ....................... 122
Figure 8.9: Total no load losses for the 15kW motor .......................................................... 123
Figure 8.10: Core and friction and windage losses for the 7.5 kW motor................... 124
Figure 8.11: Total no load losses for the 7.5 kW motor ..................................................... 124
Figure 8.12: Loss distribution for each motor at rated condition .................................. 125
Figure 8.13: Simplified equivalent circuit of an induction machine ............................. 126
Figure 8.14: Stray load loss results for the 11kW motor ................................................... 128
Figure 8.15: Stray load loss results for the 15kW motor ................................................... 128
Figure 8.16: Stray load loss results for the7.5 kW motor .................................................. 129
Figure 8.17: Repeatability of the 11kW motor results ....................................................... 133
Figure 8.18: Repeatability of the 15kW motor results ....................................................... 133
Figure 8.19: Repeatability of the 7.5kW motor results ...................................................... 133
Figure 8.20: Efficiency results for the 11kW motor ............................................................ 134
Figure 8.21: Efficiency results for the 15kW motor ............................................................ 135
Figure 8.22: Efficiency results for the 7.5 kW motor .......................................................... 136
Figure 8.23: Corrected stray load loss ...................................................................................... 139

Non-Intrusive Efficiency Estimation of Induction Machines xv
Figure 8.24: Stray load loss variation with load ................................................................... 140
Figure 8.25: Efficiency obtained using improved SLL estimation ................................. 140
Figure 8.26: Motor supply voltages and currents during unbalanced conditions ... 142
Figure 8.27: Overall unbalanced efficiency curves for the 11 kW motor .................... 143
Figure 8.28: Efficiency results for the 11 kW motor under unbalanced conditions 143
Figure 8.29: Overall unbalanced efficiency curves for the 15 kW motor .................... 144
Figure 8.30: Efficiency results for the 15 kW motor under unbalanced conditions 144
Figure 8.31: Overall efficiency curves for the 7.5 kW motor ........................................... 145
Figure 8.32: Efficiency results for the 7.5kW motor under unbalanced conditions 145
Figure 9.1: Motor testing procedure [79] ................................................................................ 155
Figure 9.2: Overall error analysis procedure ......................................................................... 159
Figure 9.3:Variation of instrument errors with load for the WCEE technique
for the 11kW motor.................................................................................................... 167
Figure 9.4: Variation of instrument errors with load for the REE technique
for the 11kW motor.................................................................................................... 168
Figure 9.5:Variation of instrument errors with load for the WCEE technique
for the 15kW motor .................................................................................................. 171
Figure 9.6:Variation of instrument errors with load for the REE technique
for the 15kW motor.................................................................................................... 171
Figure 9.7:Variation of instrument errors with load for the WCEE technique
for the 7.5 kW motor ................................................................................................. 174
Figure 9.8:Variation of instrument errors with load for the REE technique
for the 7.5kW motor................................................................................................... 174
Figure A.1:Simulated model of the stator resistance estimation technique .............. 196
Figure A.2: Labview model ............................................................................................................ 197
Figure A.3: MATLAB Simulink Model ........................................................................................ 198
Figure A.4: Influecnce Coefficients for the 11kW motor at rated load ......................... 200
Non-Intrusive Efficiency Estimation of Induction Machines xvi
LIST OF TABLES
Table 2.1 Types of loss and losses distribution in an induction machine ...................... 13
Table 2.2 Global motor efficiency testing standards .............................................................. 26
Table 2.3 Required tolerances for supply conditions ............................................................ 29
Table 2.4 Required instrumentation accuracy ......................................................................... 29
Table 2.5 Required test procedures .............................................................................................. 30
Table 2.6 Requirements for loss determination ...................................................................... 31
Table 2.7 Assumed values for stray load loss in IEEE Std 112 ........................................... 34
Table 2.8 Equations of stray load loss for the IEC Std 34 2-1 ............................................. 35
Table 3.1 Required tests and measurements for various efficiency estimation
techniques ..................................................................................................................................... 47
Table 8.1 Results obtained from the no load test ................................................................. 108
Table 8.2 Results obtained from the locked rotor test ....................................................... 109
Table 8.3 Estimated stator resistance results for the 11kW motor .............................. 112
Table 8.4 Estimated stator resistance results for the 15kW motor .............................. 112
Table 8.5 Estimated stator resistance results for the 7.5kW motor ............................. 113
Table 8.6 Speed estimation results for the 11kW motor ................................................... 117
Table 8.7 Speed estimation results for the 15kW motor ................................................... 117
Table 8.8 Speed estimation results for the 7.5kW motor .................................................. 118
Table 8.9 Maximum variation of core loss over load range .............................................. 127
Table 8.10 Comparison of estimated SLLs between different motor sizes ................ 131
Table 8.11 Efficiency results of the 11kW motor ................................................................. 135
Table 8.12 Efficiency results of the 15kW motor ................................................................. 136
Table 8.13 Efficiency results of the 7.5kW motor ................................................................ 137
Table 9.1 Instrumental error for the 11kW motor using the IEC Std 34-2-1 ............ 161
Table 9.2 Instrumental error for the 11kW motor using the direct method ............. 162
Table 9.3 Instrumental error for the 11kW motor using the NAGT method ............. 163

Non-Intrusive Efficiency Estimation of Induction Machines xvii
Table 9.4 Overall WCEE and REE results for each method ............................................... 164
Table 9.5 Effects of IEC Std 34-2-1 relative instrumental errors on the NAGT
method ......................................................................................................................................... 165
Table 9.6 Variation of WCEE and REE with load for the 11kW motor ......................... 166
Table 9.7 Comparison of influence coefficients at 100% and 25% load ..................... 166
Table 9.8 Instrumental error for the 15kW motor using the IEC Std 34-2-1 ............ 169
Table 9.9 Instrumental error for the 15kW motor using the direct method ............. 169
Table 9.10 Instrumental error for the 15kW motor using the NAGT method .......... 170
Table 9.11 Variation of WCEE and REE with load for the 15kW motor ...................... 170
Table 9.12 Instrumental error for the 7.5kW motor using the IEC Std 34-2-1 ......... 172
Table 9.13 Instrumental error for the 7.5kW motor using the direct method ......... 172
Table 9.14 Instrumental error for the 7.5 kW motor using the NAGT method ........ 173
Table 9.15 Variation of WCEE and REE with load for the 7.5kW motor ..................... 173

Non-Intrusive Efficiency Estimation of Induction Machines xviii
LIST OF SYMBOLS
Estimated value
At True value
distance
Rotational frequency
Fundamental supply frequency
Force
9.796 m/s2 is the gravitational force for Cape Town
Positive and negative referred rotor current
DC current in phase A
, Instantaneous line currents
Current in direct and quadrature reference frame
Rotor current along the direct and quadrature axis in the stationary reference frame
,
Stator current along the direct and quadrature axis in the stationary reference frame
Offset current
Rated line current
Is Stator current
Rotor current
Is Stator current
Ix Influence coefficient
Lm Magnetising inductance
Mass
234.5 for 100% IACS conductivity copper
Temperature correction factor
Rotor speed (rpm)
Synchronous speed (rpm)
Input power

Non-Intrusive Efficiency Estimation of Induction Machines xix
Rated output power
Core loss
Rotor copper loss
Stator copper loss
Electrical power
Friction and windage loss
Input power
Mechanical power
No load power
Output power
Stray load loss
Number of poles
P Pole pairs
Pag Air gap power
Phase resistance
Rext External resistor
Positive and negative referred rotor resistance
Stator winding line to line resistance
Stator winding phase resistance
Cable resistance
Line to Line Resistance
Rotor resistance
Stator winding resistance
Slip
Air gap torque
Electromagnetic torque
Mechanical torque
Tshaft Shaft Torque in N.m
, Phase voltages
, , Three phase line voltage

Non-Intrusive Efficiency Estimation of Induction Machines xx
Average voltage
DC voltage
Stator voltage along direct and quadrature axis
Negative sequence voltage
Offset voltage
VRef Reference voltage
Vth Threshold voltage
Xm Magnetizing reactance
Positive sequence voltage
Xs Stator winding reactance
Efficiency
Inlet coolant temperature
Winding temperature
Total flux linkage vector
,
,
Flux linkage of phase a, b and c
Rotor speed (rad/s)
Synchronous speed (rad/s)
Absolute measurement error
h Human error
i Instrumental error
m Methodological error
Relative Relative error
Π System parameter
Power factor angle

Non-Intrusive Efficiency Estimation of Induction Machines xxi
NOMENCLATURE
ANN Artificial neural network
AS/NZ Australia and New Zealand Standards
BOV Balanced over voltages
BUV Balanced under voltage
CSA Canadian Standards Association
ESKOM Electricity Supply Commission
FFT Fast Fourier Transform
IEC International Electromechanical Commission
IEEE Institute of Electrical and Electronics Engineers
JEC Japanese Electrotechnical Commisison
LVUR Line Voltage Unbalance Ratio
MEE Maximum error estimation
MEM Maximum entropy method
MMF Magneto-motive force
MOSFET Metal-Oxide Semiconductor Field Effect Transistor
MRAS Mutual model reference adaptive system
NAGT Non-intrusive Air Gap Torque
NEMA National Electric Manufactures Association
Op-amp Operational amplifier
ORNL Oak Ridge National Laboratory
PVUR Phase Voltage Unbalance Ratio
PWM Pulse width modulation
REE Realistic error estimation
RMS Root mean square
SANS South African National Standards
SLL Stray load loss
THD Total harmonic distortion
UBOV Unbalanced over voltage
UBUV Unbalanced under voltage
VUF Voltage unbalance factor
WCEE Worst case error estimation

CHAPTER ONE 1 INTRODUCTION
This thesis aims to investigate, develop and implement a non-intrusive efficiency estimation
technique that can be applied to induction machines that are installed in industry. The effects
of supply unbalances on the efficiency estimation technique will also be investigated. The
results obtained will be compared with the IEC Std 34-2-1.

Chapter One: Introduction
Non-Intrusive Efficiency Estimation of Induction Machines 2
1.1 Background
It is well known that induction motors dominate the field of electromechanical conversion.
The endeavour to conserve energy is ever increasing and research is currently being
conducted to investigate possible methods to improve machine efficiency. Not only is this
applicable in the global market, but it is also highly topical in a South African context. There
is no accurate means of measuring the efficiency of the motor while it is operating in
industry. Adopted strategies are most commonly done under laboratory conditions with
the use of expensive torque transducers. Therefore, there is a need to determine the
efficiency and loading of motors in industrial applications. Preferably, this should be
conducted in a non-intrusive manner so that the operation of the machine is not affected
and the down time minimized. Not only does this reduce the financial implications
associated with down time but also helps in prolonging the life span of the machine.
Determining the efficiency of a motor on the jobsite poses as a challenging task since many
of the testing standards require the motor to be decoupled from its load, or require the use
of highly specialised equipment, of which is often unavailable unlike under laboratory
conditions. The need for efficiency estimation becomes prominent when feasibility studies
of replacement or repair procedures are conducted. Once the motor has been repaired or
rewound, the need to quantify the effects of these procedures on the motor’s efficiency may
arise. Additionally, it may be necessary to determine whether the motor is operating within
the efficiency range specified by the manufacturer such that its maximum capability can be
achieved.
1.2 Problem Statement
In order to assess the efficiency of an induction machine, the machine is subjected to
numerous testing procedures which have been established by recognised testing
standards. These tests require the use of expensive equipment and that the machine is
decoupled from its load. These procedures are considered to be time consuming, manually

Chapter One: Introduction
Non-Intrusive Efficiency Estimation of Induction Machines 3
intensive and disruptive to the machine’s operation. Thus, these tests cannot be
implemented practically under industrial applications. Additionally, the efficiency of the
machine quoted after the conduction of these laboratory tests often does not reflect the
motors capability under operating conditions. During laboratory testing, the supply
conditions are not polluted with degrees of harmonic distortion and unbalance of which
has an effect on the motor’s efficiency. This does not realistically reflect the conditions met
in industry applications and thus the motor does not deliver at the efficiency levels as
specified by the manufacturer.
Many non-intrusive efficiency estimation techniques, with varying degrees of accuracy and
intrusion, have been developed. Some of these methods require information from the
motors nameplate. This becomes problematic when machine’s nameplate data is no longer
visible or if the machine has been rewound.
Therefore, there is a need to address the above issues by implementing a non-intrusive
efficiency estimation technique that is applicable to any induction motor under any load
condition.
1.3 Key Questions
The research presented in this thesis focuses on the investigation and implementation of a
non-intrusive efficiency estimation method for induction machines
In this regard, several research questions have been formulated: Can the efficiency of induction machines be estimated non-intrusively by measuring the
instantaneous line voltages and currents?
What is the impact of individual parameter estimation on the overall motor efficiency?
Does the estimation method perform under all load conditions?
Is the estimation method applicable to a range of motor sizes?
How does the method perform under unbalanced supply conditions?

Chapter One: Introduction
Non-Intrusive Efficiency Estimation of Induction Machines 4
Can we adopt these techniques in the relevant industrial applications suitable in a South
African context?
1.4 Aims and Objectives
The aims and objectives of the thesis are to:
Provide a relevant literature review on efficiency testing of induction motors
Investigate and select an appropriate non-intrusive efficiency estimation technique
Develop and implement the technique experimentally on an induction machine.
Provide the relevant analysis and discussion of the experimental results obtained
Investigate the impact of voltage unbalance on the proposed technique
Conduct the associated error analysis and asses its impact on motor efficiency
Draw conclusions based on the analysis of the experimental results
Make recommendations on future work to be conducted
1.5 Scope and Limitations
The experiments and simulations conducted in this thesis are limited to efficiency
estimation of induction machines and does not include (although may be applicable to)
other motor types.
All the motors tested in this thesis include the 7.5kW, 11kW and 15kW motors available in
the Machines Laboratory at the University of Cape Town (UCT). All motors are line
connected, are 380V/400V, 50 Hz, 4 pole machines connected in a delta configuration.
The performances of the techniques implemented are limited to steady state conditions.
The investigation of the impact of voltage unbalance is restricted to magnitude voltage
unbalances in accordance to the NEMA definition.

Chapter One: Introduction
Non-Intrusive Efficiency Estimation of Induction Machines 5
1.6 Outline of Thesis
The remainder of this thesis is structured as follows:
Chapter two introduces the basic structure and operation of an induction machine and
provides a definition of motor efficiency. The various factors affecting the efficiency of a
machine are also presented. In particular, a background to voltage unbalance conditions is
provided in order to provide a foundation so that the performance of efficiency estimation
under unbalanced conditions can be addressed. Furthermore, a discussion of existing
international motor efficiency testing standards and their differences are identified.
Chapter three provides an overview of existing efficiency estimation techniques available
in literature. A detailed comparison between these techniques based on their relevant
testing and measurement requirements are presented. Furthermore, this chapter presents
an estimation technique which allows for motor efficiency to be determined non-
intrusively by measuring the instantaneous line voltages and currents. The technique is
elaborated in Chapter six where the non-intrusive air gap torque method is developed.
Chapter four offers a literature review of different stator winding resistance estimation
techniques. Furthermore, the advantages and disadvantages the estimation methods are
presented.
Chapter five contains an overview of rotor speed estimation techniques. The advantages
and disadvantages, in terms of accuracy and intrusion, of these methods are also indicated.
Chapter six shows the development of the non-intrusive air gap torque method for
efficiency determination of induction machines. The chapter provides motivation in terms
of the need and relevance of non-intrusive efficiency estimation in a South African context.
Furthermore, a detailed theory development of the candidate topologies of stator
resistance and rotor speed estimation techniques chosen for this thesis is provided.

Chapter One: Introduction
Non-Intrusive Efficiency Estimation of Induction Machines 6
Chapter seven contains a description of the experimental setup and methodology of the
laboratory experiments conducted. The chapter describes the design and implementation
of the circuitry required for stator resistance and rotor speed estimation. The motor testing
procedure is extended to a range of motor sizes, namely 7.5kw, 11kW and 15kW. This
allows for the investigation as to whether the motor efficiency estimation technique is
applicable to a wide range of motor sizes.
Chapter eight presents the results and analysis of the experiments conducted. The
performance of the various estimation techniques adopted and their impact on the overall
motor efficiency is investigated. The performance of the developed non-intrusive air gap
torque method is compared to the results obtained from the IEC Std 34-2-1 and direct
methods. In doing so, the performance of non-intrusive air gap torque method can be
compared across a wide range of load conditions. Lastly, performance of the non-intrusive
air gap torque method during unbalanced supply conditions is presented.
Chapter nine offers an error analysis of the experimental results. The focus of this chapter
is aimed at the effects of instrumentation errors on the acquired motor efficiencies.
Chapter ten provides the concluding remarks based on the analysis conducted in chapters
eight and nine. This chapter also acknowledges the proposed recommendations for future
work.

CHAPTER TWO
2 EFFICIENCY OF INDUCTION
MACHINES
This chapter introduces the basic structure and operation of an induction machine. A
definition of motor efficiency in terms of the direct and indirect method is provided. The
various factors affecting the efficiency of a machine are outlined and possible solutions to
avoid the negative impacts of these factors are offered. Furthermore, a discussion of existing
international motor efficiency testing standards provides a foundation for the comparison of
the IEEE Std 112 and IEC Std 34-2-1. The differences in terms of power quality,
instrumentation tolerances and testing methodologies are subsequently identified.

Chapter Two: Efficiency of Induction Machines
Non-Intrusive Efficiency Estimation of Induction Machines 8
2.1 Introduction
Induction machines have provided industry with the ability to convert energy from
electrical to mechanical form. With the reputation for being the workhorses of industry,
due to their robust nature, induction machines have become the most popular choice of
motor. These machines provide the driving force to various equipments such as conveyors,
fans and pumps and are necessary for numerous processes in production and
manufacturing plants. Induction machines, therefore, play a vital role in industry and
subsequently maintaining the economic status of a country. Every effort should be made to
preserve the machine at their optimal capabilities in order to obtain the desired maximum
output with minimum input.
2.1.1 The Basic Structure of an Induction Machine
The basic structure of the induction machine consists of a stationary stator, an air gap and
rotating rotor. The stator forms the magnetic core of the machine and is composed of
laminations made from high-grade sheet steel [1] which are stacked together to form the
metal frame. This part of the machine is stationary during operation, hence the name
stator. The laminations consist of numerous slots around its inner perimeter in which the
phase windings of the machine are inserted.
For the case of a three-phase machine, the stator windings are evenly distributed at 120
electrical degrees around the stator core and are connected to the three-phase supply.
Distributed winding configurations, as opposed to concentrated winding configurations,
allow for a more efficient use of iron and have the benefit of obtaining a high quality
magneto-motive force (mmf) waveform [1]. The machine can then be configured
accordingly to form a star or delta connection depending on the application of the machine.

Chapter Two: Efficiency of Induction Machines
Non-Intrusive Efficiency Estimation of Induction Machines 9
A uniform air gap separates the stator from the rotating rotor and is designed to be as small
as possible. This allows for a minimised path of reluctance and provides for maximum flux
densities to be established within the core of the machine.
The rotor iron core is constructed in a cylindrical form with integrated slots into which the
rotor windings can be inserted. The induction motor can be configured to produce two
main types, namely the wound and squirrel-cage type. The squirrel cage design is
constructed by shorting the end windings with aluminium or copper end rings. This
construction is considered to be simpler, more rigid and more cost effective [1]. Figure 2.1
shows the basic structure of an induction machine.
a
Stator
Air gap
Rotor
a’
c’
c
b’
b
Rotor bars
End rings
(a) (b)
Figure 2.1: Construction of (a) the stator and (b) squirrel cage rotor [1]
2.1.2 Principles of Operation
The stator windings of the induction machine are connected to a supply from which an
alternating current is supplied to the stator windings. Current flowing in the stator
windings creates a sinusoidal mmf which is cantered along the axis of the windings [1].
Space vectors along the phase axes of the machine can represent this mmf, with its
magnitude dependant on the instantaneous value of the current flowing through the phase
Chapter Two: Efficiency of Induction Machines
Non-Intrusive Efficiency Estimation of Induction Machines 10
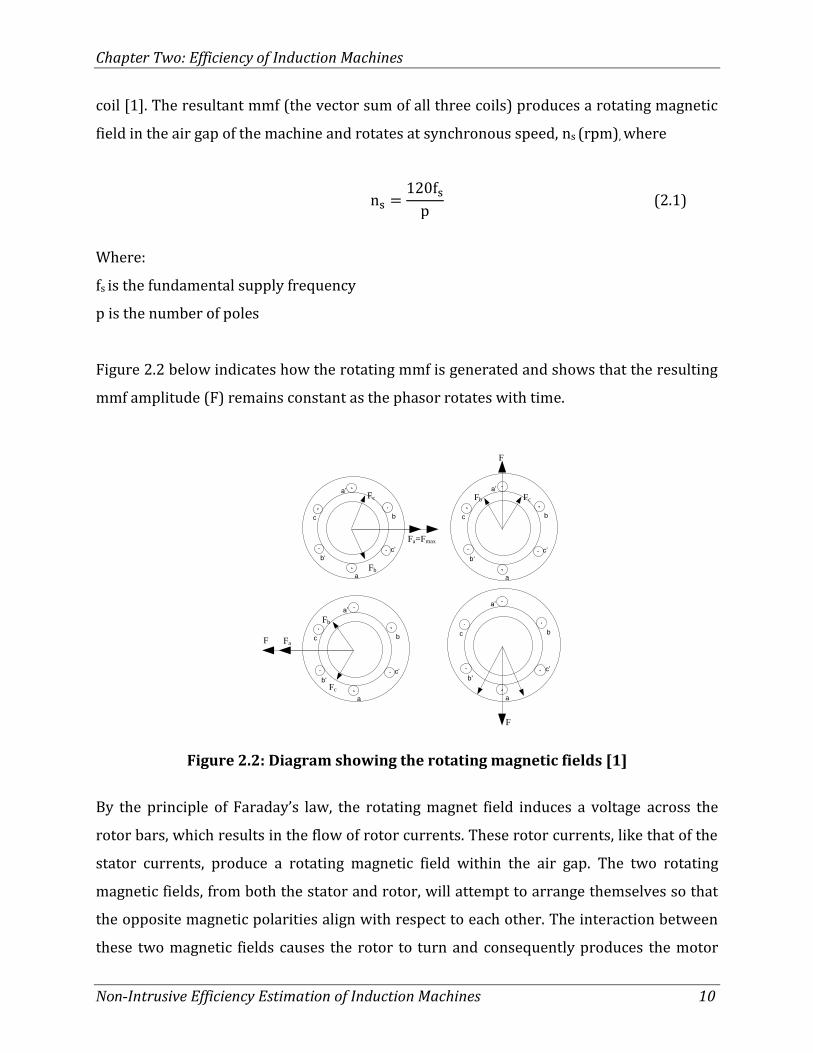
coil [1]. The resultant mmf (the vector sum of all three coils) produces a rotating magnetic
field in the air gap of the machine and rotates at synchronous speed, ns (rpm), where
(2.1)
Where:
fs is the fundamental supply frequency
p is the number of poles
Figure 2.2 below indicates how the rotating mmf is generated and shows that the resulting
mmf amplitude (F) remains constant as the phasor rotates with time.
F
FcFb
a’
b
c’
a
b‘
c
Fc
Fb
Fa=Fmax
a’
b
c’
a
b‘
c
Fc
Fb
FaF
a’
b
c’
a
b‘
c
F
a’
b
c’
a
b‘
c
Figure 2.2: Diagram showing the rotating magnetic fields [1]
By the principle of Faraday’s law, the rotating magnet field induces a voltage across the
rotor bars, which results in the flow of rotor currents. These rotor currents, like that of the
stator currents, produce a rotating magnetic field within the air gap. The two rotating
magnetic fields, from both the stator and rotor, will attempt to arrange themselves so that
the opposite magnetic polarities align with respect to each other. The interaction between
these two magnetic fields causes the rotor to turn and consequently produces the motor

Chapter Two: Efficiency of Induction Machines
Non-Intrusive Efficiency Estimation of Induction Machines 11
torque when coupled with a load. The difference in synchronous speed (ns) and rotor speed
(nr) is known as the slip [1]and is defined by
(2.2)
Depending on the machine design and operating parameters, the machine prediction of
performance characteristics ensures the motor adequately matches its application. When
the machine is coupled to a load, a mechanical torque and power is developed. In order to
achieve the maximum output power, the maximum efficiency of the machine should be
achieved and maintained. The subsequent sections will describe motor efficiency and the
factors affecting it in more detail.
2.2 Definition of Efficiency
Efficiency of an induction motor represents the effectiveness of the machine in converting
electrical power at its input to the mechanical power at its shaft (or output) [2]. The
efficiency of a machine can be calculated using the direct method as shown in equation 2.3
(2.3)
In other words, the efficiency is described as the ratio of mechanical output power to
electrical input power.
An ideal motor would represent 100% efficiency; however, in reality a motor’s efficiency is
succumbed to the effects of losses, which is mostly dissipated as heat. When these losses
are accounted for, the efficiency of the machine can be calculated indirectly according to
equation 2.4 [3], [4] , [5]
(2.4)

Chapter Two: Efficiency of Induction Machines
Non-Intrusive Efficiency Estimation of Induction Machines 12
The sum of these losses associated with the machine is the difference between the input
(electrical) and the output (mechanical). The sum of the five losses of a typical induction
motor can be expressed according to equation 2.5,
(2.5)
Where:
PCu,stator is the stator copper loss
PCu,rotor is the rotor copper loss
PCore is the core loss
PFW is the friction and windage loss
PSLL is the stray load loss
The origin and effects of these losses on the motor efficiency will further be described in
the next section.
2.3 Factors Affecting Motor Efficiency
Many factors can affect the efficiency of a machine. These factors should be closely
monitored and maintained within suitable levels such that the efficiency of the machine is
represented realistically.
2.3.1 Induction Motor Losses
The losses associated with an induction machine are the main determining factors when
calculating the efficiency of a machine. Thus, it is vital that they are taken into account as
accurately as possible. The losses of a machine can be broadly categorised into load
dependant losses and load independent losses [6]. These losses are dependent on both the
size and speed of the motor.
Table 2.1 shows the type of losses and loss distribution for a typical 4-pole induction
machine [3], [6].

Chapter Two: Efficiency of Induction Machines
Non-Intrusive Efficiency Estimation of Induction Machines 13
Table 2.1 Types of loss and losses distribution in an induction machine
Type of loss % of total loss Load dependent/
independent
Stator Losses 25-40 Dependent
Rotor Losses 15-25 Dependent
Core Losses 15-20 Independent
Stray Load Losses 10-15 Dependent
Friction and Windage 5-15 Independent
As the above losses are accounted for, the power flowing through the machine decreases
and consequently reduces the overall efficiency of the machine. Figure 2.3 shows the power
flow through a typical machine in motor mode indicating losses developed under typical
operating conditions.
Figure 2.3: Power flow through a typical induction motor [7]
As depicted, in order to obtain a maximum output shaft power, it is necessary to reduce the
amount of losses dissipated during the power flow process. The following subsections will
describe each loss component, and how they can be reduced
Stator Stray Load Loss PSLL, Stator
Core Loss PCore
Stator Copper Loss
PCu,Stator
Rotor Copper Loss
PCu, Rotor
Rotor Stray Load Loss PSLL, Rotor
Friction and Windage Loss
PFW
Shaft Power (Mechanical)
POutput
Input Power (Electrical)
PInput
Stator Rotor
Developed Mechanical Power
PM=Tagr
Air Gap Power Pag=Tagsyn

Chapter Two: Efficiency of Induction Machines
Non-Intrusive Efficiency Estimation of Induction Machines 14
Stator Winding Resistance Losses
Stator winding resistance losses are the copper losses associated with the stator windings
of the electric machine [3], [8]. The stator losses are dependent on the value of resistance
(which is a function of conductor material, length, and cross-sectional area) and the
amount of current flowing in the stator winding. The stator resistance loss per phase can be
calculated by
(2.6)
Where:
Is is the stator current
Rs is the stator resistance
Stator winding resistance losses can be reduced by increasing the volume of copper wire in
the stator, through improved stator slot design and/or by using thinner insulation [3].
Rotor Winding Resistance Losses Rotor winding resistance losses are the copper losses in the rotor conductive bars. The
rotor resistance losses, per phase, is calculated according to
(2.7)
Where:
Ir is the rotor current
Rr is the rotor resistance
These losses can be reduced by increasing the size of the rotor conducting bars and end
rings in order to increase the cross-sectional area and thereby decreasing the conductor
resistance and its associated losses [3], [9].

Chapter Two: Efficiency of Induction Machines
Non-Intrusive Efficiency Estimation of Induction Machines 15
Core Losses These losses constitute hysteresis and eddy current losses in the iron laminations of the
machine. Hysteresis losses are attributes of the flux of the motor and supply frequency [4].
Hysteresis losses can be reduced by improving the permeability of the steel, extending the
length of the core, or using thinner laminations [3], [9], [10]. Eddy-current losses results
from rapid changes of flux density within the core. [1]. Theses losses can be reduced by
making use of thinner laminations in the core [1] or by using a core material which has
high resistivity [1].
Friction and Windage Losses These losses are due to the sources of friction and air movement in the motor and are
considered to be appreciable in large high speed or totally enclosed fan-cooled motors, [3],
[9], [10]. These losses are considered to be constant from no load to full load and hence are
not load dependent. No load losses are obtained under no load conditions by performing a
no load test. These losses can be reduced by lowering the friction between the bearings and
improving the fan design to allow for better air flow [3], [9].
Stray Load Losses Stray load losses are considered to be the most misunderstood area of losses due to their
complexity to measure and quantify [4]. These losses cannot be measured directly and
constitute all the losses not included above. Stray load losses are expressed as follows [4]
(2.8)
The causes of stray load losses are a result of the following:
Fundamental and high frequency losses in the structure of the machine
Space harmonics associated with the stator and rotor and leakage flux associated with the
end windings [4]
Losses due to the active iron and other metal parts other than conductors [11]

Chapter Two: Efficiency of Induction Machines
Non-Intrusive Efficiency Estimation of Induction Machines 16
Eddy-current losses in stator (primary) or rotor (secondary) winding conductors caused
by current dependent flux pulsation [11]
2.3.2 Power Supply Quality
The quality of the input power is another aspect which affects the performance of a motor.
The voltage and frequency of the supply are required to be within specified tolerances for
the motor to perform adequately [6]. Traditionally the nameplate efficiency is defined
under perfectly sinusoidal and balanced supply conditions, which can be obtained under
laboratory conditions. The rated nameplate efficiency values, therefore, may not be
obtainable under more realistic non-perfect conditions which are characteristic of industry
supply [10].
The supply quality suffers, with varying degrees of severity, from various defects such as
voltage variation, unbalances and harmonics. Figure 2.4 shows an overview of the type of
polluted conditions associated with a voltage supply.
Figure 2.4: Overview of polluted voltage supply conditions
Voltage Supply Conditions
Voltage Variation
Under Voltage
Over Voltage
Voltage Unbalance
Magnitude Unbalance
Under Voltage
Over Voltage
Phase Unbalance
Harmonics Voltage Flicker

Chapter Two: Efficiency of Induction Machines
Non-Intrusive Efficiency Estimation of Induction Machines 17
From the above diagram, one can see that there are numerous ways in which a voltage
supply can be polluted. These effects are often reflected in the mains supply in varying
degrees and combinations. The following sections will describe each defect in more detail.
Voltage Variation
Voltage variation is the variation of voltage magnitudes [12]. Under this condition, the
supply remains balanced, yet can be described as under-voltage or over-voltage relative to
the rated voltage. Balanced under-voltage (BUV) describes the case where all three-phase
voltages are equally lower in magnitude than the rated value [12]. Alternatively, balanced
over-voltages (BOV) occurs in the case where all three phases are equally higher in
magnitude than the rated value [12]. Figure 2.5 shows an example of over-voltage and
under-voltage conditions.
Figure 2.5: Example of voltage variation
It should be noted that this 25% deviation of rated voltage indicated in each case is not
realistically expected but is depicted here merely for demonstration purposes.
Voltage Unbalance Voltage unbalance describes the non-equality of voltage magnitudes and/or phase angles
between all three phases at any given point in time [12]. The magnitude balance and
unbalance can be further categorised in terms of over-voltage and under-voltage
conditions. Unbalanced under-voltage (UBUV) describes the condition where each of the
phases are not equal in magnitude and that the resulting positive sequence voltage is less
0 0.01 0.02 0.03 0.04-700
-500
-300
-100
100
300
500
700
Time (s)
Voltage (
V)
Balanced Rated Voltages
0 0.01 0.02 0.03 0.04-700
-500
-300
-100
100
300
500
700
Time (s)
Balanced Over Voltages
0 0.01 0.02 0.03 0.04-700
-500
-300
-100
100
300
500
700
Time (s)
Balanced Under Voltages

Chapter Two: Efficiency of Induction Machines
Non-Intrusive Efficiency Estimation of Induction Machines 18
than rated [12]. In contrast unbalanced over-voltage (UBOV) is the case where each of the
phases are not equal in magnitude and that the resulting positive sequence voltage is
higher than rated [12]. Figure 2.6 shows an example of voltage magnitude and phase
unbalances. Again, the cases shown here are extreme cases and are merely for
demonstration purposes.
Figure 2.6: Example of voltage magnitude and phase unbalance
Voltage unbalance can be defined using the Line Voltage Unbalance Ratio (LVUR) [13]. In
this case, only the voltage magnitudes are accounted for and the phase angles are
neglected, making it a quick and simple method to calculate the percentage unbalance. This
definition has been adopted by National Electric Manufactures Association (NEMA) and is
described by [13], [14], [15]
(2.9)
Where:
Alternatively, the Phase Voltage Unbalance Ratio (PVUR) can be used, where the phase
voltages are used instead of the line voltages. This definition has been adopted by the
Institute of Electrical and Electronics Engineers (IEEE). [13], [14], [15]
0 0.01 0.02 0.03 0.04-700
-500
-300
-100
100
300
500
700
Time (s)
Voltage (
V)
Balanced Rated Voltages
0 0.01 0.02 0.03 0.04-700
-500
-300
-100
100
300
500
700
Time (s)
Unbalanced Voltages
0 0.02 0.04-700
-500
-300
-100
100
300
500
700
Time (s)
Phase Unbalance
(2.10)

Chapter Two: Efficiency of Induction Machines
Non-Intrusive Efficiency Estimation of Induction Machines 19
(2.11)
Where:
(2.12)
On the other hand, the International Electrotechnical Commission (IEC) or ‘true’ definition
of voltage unbalance is defined by acquiring the ratio of negative sequence voltage to
positive sequence voltage. This is also known as the percentage voltage unbalance factor
[12], [13], and is calculated by
(2.13)
The positive and negative sequence voltage components are obtained by resolving three-
phase unbalanced line voltages into two balanced symmetrical components [13], [15].
These are calculated according to
(2.14)
(2.15)
Where
Considerations of voltage unbalance often lead to induction motor analysis using an
appropriate set of balanced positive and negative sequence equivalent circuits. The
positive sequence equivalent circuit is considered to represent the normal operating
condition of the machine. The negative sequence equivalent circuit can be considered to
represent the effects of the unbalanced condition and sets up a reverse rotating field such

Chapter Two: Efficiency of Induction Machines
Non-Intrusive Efficiency Estimation of Induction Machines 20
that the negative sequence slip is 2-s. Figure 2.7 shows the equivalent set of positive and
negative sequence circuits of an induction machine.
Figure 2.7: Sequence equivalent circuits for an induction machine [15]
Based on Figure 2.7, the negative and positive currents can be obtained by observing that
they are a function of their sequence voltages, the machine parameters and the motor slip.
The effect of voltage unbalance (i.e. the negative sequence component) on the power and
torque of the machine is to produce less than expected output conditions. When accounting
for the positive and negative sequence components, the mechanical power and torque is
calculated by [13], [15]
(2.16)
(2.17)
The above equations show that the negative sequence rotor currents cause a decrease in
the output power and hence the overall output torque of the machine. Therefore, the
overall effect of this decreased power has a direct effect of decreasing the motor’s
efficiency.
Since the resultant torque is reduced, the motor will be forced to operate at higher slip
values if it is required to meet the expected full load torque demand [14]. This causes an
Rs jX’rp
R’rp /sVp
jXs
jXm
Rs jX’rn
R’rp /(2-s)Vn
jXs
jXm
Chapter Two: Efficiency of Induction Machines
Non-Intrusive Efficiency Estimation of Induction Machines 21
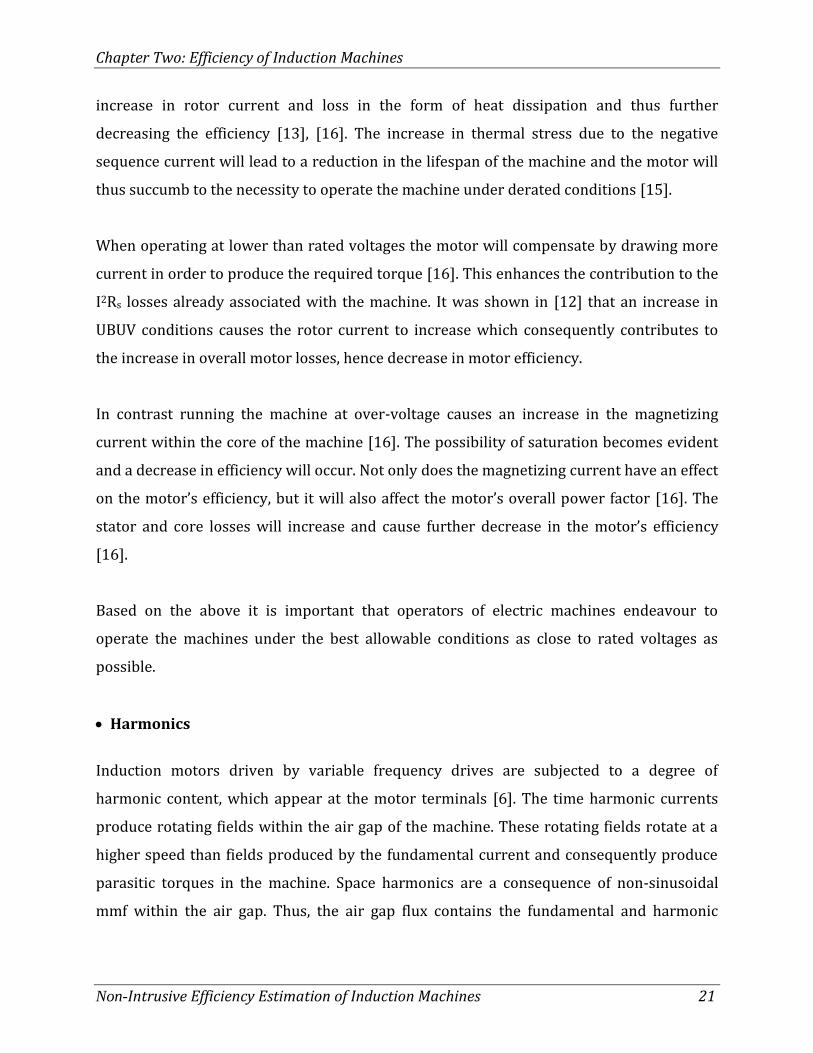
increase in rotor current and loss in the form of heat dissipation and thus further
decreasing the efficiency [13], [16]. The increase in thermal stress due to the negative
sequence current will lead to a reduction in the lifespan of the machine and the motor will
thus succumb to the necessity to operate the machine under derated conditions [15].
When operating at lower than rated voltages the motor will compensate by drawing more
current in order to produce the required torque [16]. This enhances the contribution to the
I2Rs losses already associated with the machine. It was shown in [12] that an increase in
UBUV conditions causes the rotor current to increase which consequently contributes to
the increase in overall motor losses, hence decrease in motor efficiency.
In contrast running the machine at over-voltage causes an increase in the magnetizing
current within the core of the machine [16]. The possibility of saturation becomes evident
and a decrease in efficiency will occur. Not only does the magnetizing current have an effect
on the motor’s efficiency, but it will also affect the motor’s overall power factor [16]. The
stator and core losses will increase and cause further decrease in the motor’s efficiency
[16].
Based on the above it is important that operators of electric machines endeavour to
operate the machines under the best allowable conditions as close to rated voltages as
possible.
Harmonics
Induction motors driven by variable frequency drives are subjected to a degree of
harmonic content, which appear at the motor terminals [6]. The time harmonic currents
produce rotating fields within the air gap of the machine. These rotating fields rotate at a
higher speed than fields produced by the fundamental current and consequently produce
parasitic torques in the machine. Space harmonics are a consequence of non-sinusoidal
mmf within the air gap. Thus, the air gap flux contains the fundamental and harmonic
Chapter Two: Efficiency of Induction Machines
Non-Intrusive Efficiency Estimation of Induction Machines 22
components of flux [1]. These space harmonics contribute to parasitic torques in the
machine.
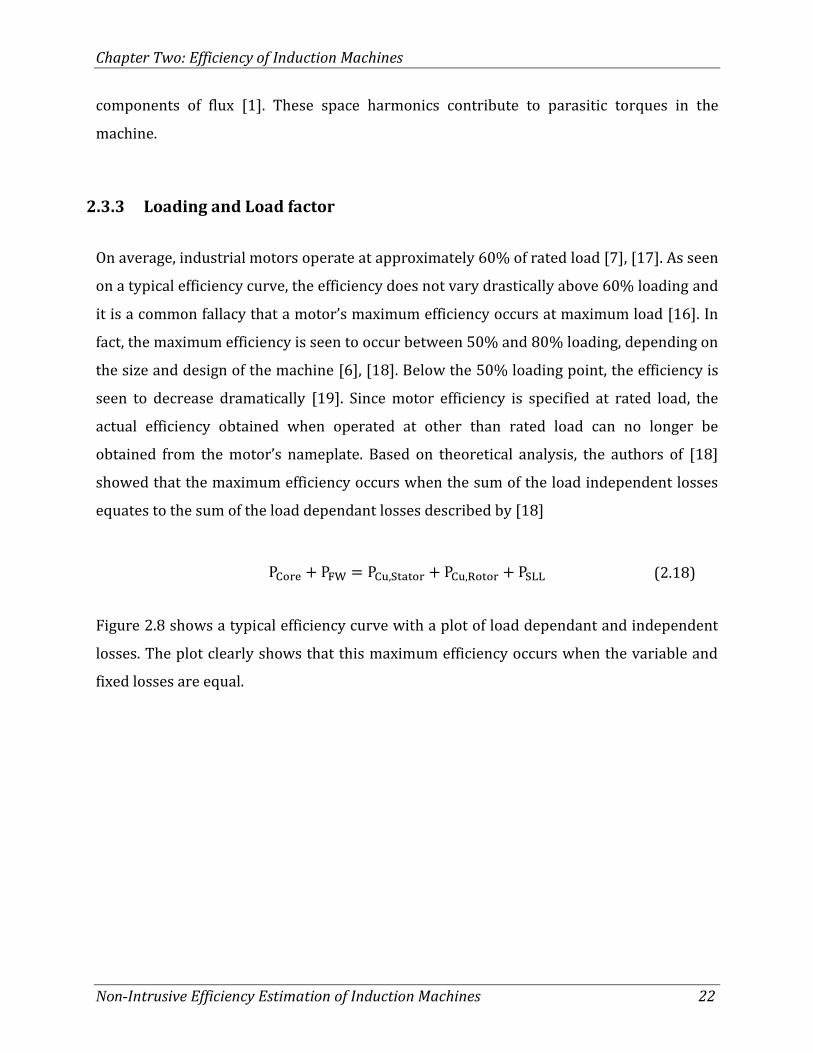
2.3.3 Loading and Load factor
On average, industrial motors operate at approximately 60% of rated load [7], [17]. As seen
on a typical efficiency curve, the efficiency does not vary drastically above 60% loading and
it is a common fallacy that a motor’s maximum efficiency occurs at maximum load [16]. In
fact, the maximum efficiency is seen to occur between 50% and 80% loading, depending on
the size and design of the machine [6], [18]. Below the 50% loading point, the efficiency is
seen to decrease dramatically [19]. Since motor efficiency is specified at rated load, the
actual efficiency obtained when operated at other than rated load can no longer be
obtained from the motor’s nameplate. Based on theoretical analysis, the authors of [18]
showed that the maximum efficiency occurs when the sum of the load independent losses
equates to the sum of the load dependant losses described by [18]
(2.18)
Figure 2.8 shows a typical efficiency curve with a plot of load dependant and independent
losses. The plot clearly shows that this maximum efficiency occurs when the variable and
fixed losses are equal.

Chapter Two: Efficiency of Induction Machines
Non-Intrusive Efficiency Estimation of Induction Machines 23
Figure 2.8: Efficiency curve showing maximum efficiency [18]
It is possible to modify the point of maximum efficiency by redefining the point of
intersection. This can be achieved by either decreasing the load dependent losses or
increasing the load independent losses [18].
Under- Loaded Conditions One of the most common factors contributing to lower than expected motor efficiency is
attributed to under-loading [10]. An under-loaded motor is characterized by a significant
efficiency drop at low values of load, as seen on a typical efficiency load curve. The effects
of under-loaded conditions are often seen as a consequence of under utilization of the
equipment. This often occurs in cases where a motor rating is selected on the basis that it
may be required to perform under full load capacity of which occurs on the rare occasion
such as peak conditions, resulting in under-loaded operations for most of its operating
lifespan [10]. Another reason contributing to under loaded conditions is the choice of an
oversized motor required for the application. This often occurs when the user desires that
the output power be maintained at the desired level, despite abnormally low input voltages
[10]. Therefore, when a motor is run under reduced load conditions it has the following
advantages [18].
20 30 40 50 60 70 80 90 100 110 120 130 140 150 1600
500
1000
1500
2000
2500
3000
3500
4000
Load [%]
Po
wer
Lo
ss [
W]
20 40 60 80 100 120 140 16070
72
74
76
78
80
82
84
86
88
90
Eff
icie
ncy
[%
]
Efficiency
Variable LossesFixed Losses

Chapter Two: Efficiency of Induction Machines
Non-Intrusive Efficiency Estimation of Induction Machines 24
a) Accommodates load fluctuations and voltage imbalance
b) Contains the capacity for a safety margin, when meeting the requirements, when the
mechanical load is uncertain.
c) Provide the ability for increasing future loads
Although maximum efficiency occurs below rated load, it is important that the correct
loading factor be selected such that the compromise between maximum load and efficiency
is achieved. Process demands require that maximum process output is obtained for as long
as possible in order for industry to be profitable. Therefore, engineers should be aware of
this and should select the most appropriate motor required for the application.
Over-Loaded Conditions Over-loaded motors contribute negatively to the efficiency of a motor since the increase in
losses cause the machine to increase in temperature. Thus, this decreases the overall motor
efficiency and decreases the life span of the machine.
Considerations of under-loading and over-loading of motors have provided engineers with
an area of investigation and operators should ensure that the correct loading be sustained
such that the motor operates at an acceptable efficiency level and that the loading
conditions is not harmful to the machine. This should be achieved by not compromising the
need to maintain the turnout required by industry.
2.3.4 Condition Monitoring and Maintenance
Condition monitoring and diagnostics are very important and can provide improvement
when it comes to reliability, availability and maintainability of a system [17]. Machine
misalignment, physical looseness and other imbalances can have an impact on the
machines efficiency as well as its lifespan. Improper lubrication can cause increased
friction resulting in increased losses. Unwanted vibrations may exist if the machine is not
properly mounted or correctly aligned, which also decreases the efficiency. The effects of

Chapter Two: Efficiency of Induction Machines
Non-Intrusive Efficiency Estimation of Induction Machines 25
neglecting regular maintenance of motors lead to an increase in losses, unnecessary
breakdown and eventually malfunction. Sufficient lubrication and ensuring that ventilation
ducts remain unblocked assist in ensuring that losses remain at a minimum. The
installation of fans or other cooling methods will assist in the dissipation of excess heat and
reduction of excessive losses and thus improving the efficiency.
Not only is this good practice in ensuring optimal efficiency of the motor, it will also
prolong the life span of the machine. The running time of an induction machine often has a
direct effect on the efficiency of the machine. Longer running times are associated with
lower efficiencies. This is expected since worn out machines, due to age, often contain more
losses. However, if sufficient maintenance procedures are practiced, the effects of motor
aging will not drastically contribute to the deterioration of motor performance [10].
2.3.5 Effects of Motor Repair and Rewind
In industry, it is common practice to rewind damaged motors [10]. The objective is to
return the motor to its original state. However, this is a challenging procedure which often
results in a drop in efficiency [10]. Therefore, the decision to repair a machine should also
account for the type of procedures adopted by a rewind company. Rewinding procedures
have been known to reflect changes in winding and slot design, the choice of winding
material, insulation performance and operating temperature [10]. These factors are
characterised by changes in loss contribution emitted by the machine [10], [18], [20]. Due
to the impacts of motor rewind on the type of losses associated with the machine, the
overall efficiency is also affected. A case study performed in [18] and [21] showed an
overall decrease in efficiency after a set of motors had been rewound. It should be noted
that in special cases, when the motor is rewound under controlled conditions, an increase
in motor efficiency can be achieved.

Chapter Two: Efficiency of Induction Machines
Non-Intrusive Efficiency Estimation of Induction Machines 26
2.4 International Motor Efficiency Testing Standards
Several standards for testing the efficiency of electrical machines exist worldwide. Each of
these standards contains their own testing procedures and requirements. Table 2.2 shows
an outline of existing motor efficiency testing standards that exist globally.
Table 2.2 Global motor efficiency testing standards
Standard Description Year
IEEE Std 112 Standard Test Procedure for Polyphase Induction Motors
and Generators 2004
IEC 60034-2-1 Part 2
Standard methods for determining losses and efficiency from tests (excluding machines for traction vehicles)
2007
SANS 60034 Part 2-1
Methods for determining losses and efficiency of rotating electrical machinery from tests (excluding machines for
traction vehicles)’ 2008
JEC-2137 Japanese Electrotechnical Commisison 2000
AS/NZ 1359.5 Three-phase cage induction motors -High efficiency and minimum energy performance standards requirements
2004
CSA 390 Energy Efficiency Test methods for Three-Phase Induction 1999
2.4.1 Overview of Existing Standards
A great deal of research is continuously being conducted to identify and compare motor
efficiency testing standards. The following reviews highlight the main perspectives that
have already been established.
a) P G Cummings et al, (1981) [8]
The authors provided a basic overview of the basic efficiency estimation methods. They
proceeded to provide a detailed description of the tests methods involved in the IEEE Std
112 (1977), IEC Std 34-2 and JEC Std 37 in order to compare them. The authors
Chapter Two: Efficiency of Induction Machines
Non-Intrusive Efficiency Estimation of Induction Machines 27
concluded that the IEEE 112 method is the most rigorous method when it comes to
determining efficiency.
b) B Renier et al, (1999) [4]
The aim of this paper was to compare the similarities and differences between IEEE Std
112 and IEC Std 34. The paper stated that the three most important standards that exist
are the IEEE Std 112 (1996), the IEC Std 34-2 and the JEC Std 37, since other national
standards are seen to be harmonized with either one of them. The authors identified that
the main difference between the standard is the way in which the stray load loss is
determined. The author conducted efficiency tests and concluded that the IEC Std 34 and
JEC Std 37 provide over estimations of efficiency compared to that of the IEEE Std 112.
This is due to the fact the IEC Std 34 estimates a fixed value of stray load loss (0.5% of
rated input power) while the JEC Std 37 completely neglects them.
c) A.T. de Almeida et al, (2002) [11]
The authors state that the two main methods that exist globally are the IEEE Std 112 and
the IEC Std 34-2. Since the IEC Std 34-2 was under review due to inaccuracies in stray
load loss determination, the authors also compared the proposed IEC 61972
methodology. The team then conducted experiments comparing the IEEE Std 112 and IEC
Std 34-2. The authors concluded that the IEC Std 34-2 was not an accurate method for
efficiency determination due to the estimation of stray load losses. It was then stated that
the new IEC Std 61972 standard would assist in improving the standard in terms of
motor efficiency testing.
d) A. Boglietti et al, (2004) [5]
The most important international standards declared by the authors are the IEEE Std 112,
the IEC Std 34-2 and the JEC Std 37. The aim of the study was to compare the
measurement procedures and experimental results obtained for the determination of
efficiency. The authors concluded that the IEEE Std 112 is the most suitable standard for
stray load loss measurements and efficiency determination.

Chapter Two: Efficiency of Induction Machines
Non-Intrusive Efficiency Estimation of Induction Machines 28
e) W. Cao, (2009) [22]
The author constructively compares the differences between the IEEE Std 112 and the
new IEC Std 34-2-1. The paper investigates factors such as instrumentation accuracies
and methodologies established by the two standards. Upon the conduction of laboratory
test outlined by the standard, the author concluded that the efficiency values obtained by
the new IEC Std 34-2-1 are similar to its IEEE Std 112 counterpart.
In summary, the three most important standards that exist globally are the IEEE Std 112
[23], the IEC Std 34-2 (-1) [24] and the JEC Std 37 standards, while other existing standards
resemble either the IEEE Std 112 or the IEC Std 34-2. The main difference between various
testing standards is evident in the way in which the losses are determined, in particular the
stray load losses. Due to the different strategies associated with the testing procedures, the
efficiencies obtained for a given motor may differ significantly. Comparison of standards
IEEE Std 112 and IEC Std 34-2-1 is discussed further below.
2.4.2 A Detailed Comparison between the IEEE Std 112 and IEC Std 34-2-1
For the purpose of this thesis only the IEEE Std 112 and IEC Std 34-2-1 will be reviewed
since these methods are well established. The IEC Std 34-2-1 was adopted in South Africa
in 2008 as the SANS 34-2-1 [25] and therefore is applicable in a South African context. The
following section will outline some of the similarities and differences between the two
standards.
Supply Conditions During laboratory testing, it is imperative that supply conditions are maintained within
tolerances as stated by the standards. Table 2.3 outlines the required tolerances set by the
IEEE Std 112 and IEC Std 34-2-1 standards.

Chapter Two: Efficiency of Induction Machines
Non-Intrusive Efficiency Estimation of Induction Machines 29
Table 2.3 Required tolerances for supply conditions
Parameter [%]
IEEE Std 112 (2004)
IEC Std 34-2-1 (2007)
Maximum THD 5 5
Maximum Voltage Unbalance 0.5 0.5
Frequency Deviation ±0.1 ±0.3
The tolerances of the supply conditions are identical for each of the standards with the
exception of the supply frequency deviation. This reduces the level of discrepancies when
comparing efficiency results obtained from testing.
Instrumentation Accuracies The accuracy of the instrumentation used in efficiency testing is an important aspect to
consider when testing the efficiency value of a machine. Table 2.4 shows the respective
requirements of full-scale instrumentation accuracies for each of the standards.
Table 2.4 Required instrumentation accuracy
Parameter [%]
IEEE Std 112 (2004)
IEC Std 34-2-1 (2007)
Instrument Transformer ±0.3 ±0.3
Power ±0.2 ±0.2
Voltage ±0.2 ±0.2
Current ±0.2 ±0.2
Torque ±0.2 ±0.2
Speed (rpm) ±1 ±1
Frequency ±0.1 ±0.1
Resistance ±0.2 ±0.2
Temperature (˚C) ±1 ±1
As shown above, the new IEC Std 34-2-1 defines the same instrument accuracies as the
IEEE Std 112. This is an improvement to the old IEC Std 34-2 [22] whose accuracy range is
greater.

Chapter Two: Efficiency of Induction Machines
Non-Intrusive Efficiency Estimation of Induction Machines 30
Test Procedures
Based on the definition of efficiency (direct or indirect), the test procedures may differ
within each of the standards. For comparison purposes, reference is made to the method
with separation of losses (indirect method) since it is widely used [22]. Table 2.5 shows the
required test procedures for each of the standards.
Table 2.5 Required test procedures
Parameter IEEE Std 112
(2004) IEC Std 34-2-1
(2007)
Cold Resistance and Temperature
Temperature Test at Rated Load
Rated Resistance and Temperature
Load Test
No Load Test
Stabilization of No Load Losses Optional
As shown above, the two standards are similar, except for the requirement of the initial
cold resistance temperature. The IEEE Std 112 uses these measurements as a reference to
which resistances can be corrected according to the recorded temperature during testing.
The IEC Std 34-2-1 does not require the cold resistance and temperature measurement but
alternatively uses the temperatures and resistances obtained during a load test. The
techniques for stator winding correction for temperature will be further discussed in the
subsequent section.
Loss Determination
As mentioned before the main differences between established international standards are
the way in which the losses are accounted for. Table 2.6 shows the specific requirements of
each standard in order to determine each of the losses associated with the machine [22],
[23], [24].

Chapter Two: Efficiency of Induction Machines
Non-Intrusive Efficiency Estimation of Induction Machines 31
Table 2.6 Requirements for loss determination
Parameter IEEE 112 (2004)
IEC 34-2-1 (2007)
Temperature correction of resistances
Installed temperature sensor
(optional) Segregation of losses
Core loss with voltage drop compensation
Stray load loss using linear regression
(correlation factor)
(0.9)
(0.95)
Torque meter correction Dynamometer
correction
Output power correction As shown, there are numerous discrepancies in the procedures required for loss
determination. A more detailed description of these differences is provided below.
a) Stator winding resistances and temperature correction The IEEE Std 112 requires that the stator winding cold resistance be measured prior to the
performance of any heat run test. The cold winding resistance measurement is then used as
a basis when applying temperature correction. The cold winding resistance is then used to
calculate the resistance of the winding at any load, provided that the temperature is
measured at each load. Equation 2.19 shows how the temperature correction is catered for
[23]
(2.19)
Where:
R1 is the known value of winding resistance, in ohms, at temperature t1

Chapter Two: Efficiency of Induction Machines
Non-Intrusive Efficiency Estimation of Induction Machines 32
T1 is the temperature, in °C, of winding when resistance Ra1 was measured,
T2 is the temperature, in °C, to which the resistance is to be corrected
R2 is the winding resistance, in ohms, corrected to the temperature t2
k1 is 234.5 for 100% IACS conductivity copper
The IEC Std 34-2-1 does not require that internal temperature sensors be installed. Instead,
the standard requires that the winding resistance be measured before the highest load and
after the lowest loading point. The resistance for rated and higher loads shall be the value
obtained before the highest load reading, while the resistance for less than rated load shall
be determined by linear extrapolation using the two readings taken before the test for the
highest load and after the lowest reading for 25% load [24]. This method has the advantage
that it does not require internal temperature sensors to be installed and thereby the test
can be applied to a wider range of motors (ie those without thermocouples) [22]
However, in the case of installed thermocouple, the IEC Std 34-2-1 follows a similar
procedure in obtaining resistance values to that of the IEEE Std 112.
b) Core loss voltage compensation The IEEE Std 112 and IEC Std 34-2-1 follow similar procedures when it comes to the
determining the friction and windage loss independently from the core losses during the no
load test. The IEEE Std 112 determines the core loss at each test voltage by subtracting the
friction and windage loss and stator losses from the input power. A plot of voltage versus
core loss is then obtained to find the value of core loss at any voltage value [23]. Ideally, the
core loss obtained is constant and independent of the load.
The IEC Std 34-2-1, on the other hand, obtains the core losses by accounting for the stator
resistive voltage drop at each loading point. A curve of voltage verses core loss power
(Pcore= PInput-PFW) is then plotted. The core losses at any loading point is then obtained from
the curve at voltage Ur using equation 2.20 which accounts for the stator resistance voltage
drop.

Chapter Two: Efficiency of Induction Machines
Non-Intrusive Efficiency Estimation of Induction Machines 33
(2.20)
Where :
V is the rated line voltage (V)
I is the rated line current (A)
RLL is the line to line resistance (Ω)
is the power factor angle
The IEC Std 34-2-1 reflects a more precise value of core loss than the IEEE 112 due to the
resistive voltage compensation [14].
c) Stray load losses In the case of the IEEE Std 112, the stray load losses at different loads are obtained by
subtracting the output power and all the losses accounted for from the input power, as
shown in equation 2.8. In order to correct these values and reduce the influence of
measurement error [4], the stray load losses are smoothed, using linear regression
techniques, by expressing the stray load loss as
(2.21)
Where:
A is the slope
TShaft is the shaft torque in N.m
B is the intercept with the zero torque line
A correlation factor is used to determine whether the results are satisfactory. A good
measurement is seen to have a correlation of higher than 0.9. [23]. The corrected value of
stray load loss used for efficiency calculations is then obtained by shifting the line to pass
through the origin and calculated as

Chapter Two: Efficiency of Induction Machines
Non-Intrusive Efficiency Estimation of Induction Machines 34
(2.22)
Traditionally the IEC Std 34-2 computed the stray-load loss by quantifying them to a fixed
value of 0.5% of the full load power [14]. The new IEC Std 34-2-1 has revised this method
due to its questionable accuracy. The new method follows the same procedure as the IEEE
Std 112 when calculating the stray-load loss, however requires a higher correlation factor
of 0.95 in order for the results to be useable.
In situations where it is not feasible to determine the stray load loss directly, it is possible
to estimate the value of stray load loss. According to the IEEE Std 112, the stray load loss
can also be estimated relative to the size of the machine. Table 2.7 shows the assumed
values of stray load loss at rated load as a percentage of rated output power [23].
Table 2.7 Assumed values for stray load loss in IEEE Std 112 [23]
Machine rating Stray-load loss percent of
rated output power
0-90 kW 1.8% 91-375 kW 1.5%
376-1850 kW 1.2% >1851 kW 0.9%
For other than rated load conditions, the stray load loss can be assumed to be proportional
to the square of the rotor current and can be calculated at any desired load using [23]
(2.23)
The rotor current can be obtained according to
(2.24)

Chapter Two: Efficiency of Induction Machines
Non-Intrusive Efficiency Estimation of Induction Machines 35
In the case of the IEC Std 34-2-1, the stray-load losses can be estimated by relating a fixed
amount from a predefined curve based on the power rating of the machine [24]. The curve
can be seen in Figure 2.9 and the governing equations for the graph are shown in Table 2.8
where P1 is the input power and P2 is the rated output power. The relevant equations
defining the above curve are shown in Table 2.8.
Figure 2.9: Assigned allowance for additional load loss [24]
Table 2.8 Equations of stray load loss for the IEC Std 34 2-1
Machine rating Equation
P2<1 kW PSLL=P1 0.025 1kW <P2<10 000kW PSLL=P1 [0.025-0.005log10(P2/1kW)
P2>10 000 kW PSLL = P10.005
Based on the above, the difference between the IEEE Std 112 and the IEC Std 34-2-1 is that
the former estimates the stray load loss as a function of output power, while the latter
estimates the stray load loss as a function of the input power.

Chapter Two: Efficiency of Induction Machines
Non-Intrusive Efficiency Estimation of Induction Machines 36
2.5 Concluding Remarks
This chapter has provided an introduction to induction machines and its efficiency. The
basic structure of the induction machine and its principles of operations were provided.
Furthermore, a definition of motor efficiency using the direct and indirect method was
outlined and the differences between the techniques were established. The various factors
affecting the resulting efficiency were described in detail. Measures to reduce the
implications of the factors in order to improve efficiency values were mentioned.
Investigation of international efficiency testing standards were identified and showed that
the most important standards are the IEEE Std 112, IEC Std 34-2 and JEC Std 37. Moreover
a comparison between the IEEE Std 112 and IEC Std 34-2-1 in terms of supply tolerances,
instrumentation errors and methodologies were performed. It was concluded that the IEEE
Std 112 and IEC Std 34-2-1 are comparable and therefore efficiencies obtained by either
method will be in close proximity to each other. In South Africa, the IEC Std 34-2-1 was
adopted as the SANS 60034-2-1 in 2008. Therefore, this standard has been approved and is
currently established in the motor testing industry. Therefore, the IEC Std 60034-2-1/SANS
60034-2-1 standard shall provide a baseline for comparison of efficiency values for the
remainder of this thesis.

CHAPTER THREE 3 OVERVIEW OF EFFICIENCY
ESTIMATION TECHNIQUES
This chapter provides an overview of existing efficiency estimation techniques. Each of these
techniques is critically reviewed in terms of accuracy and level of intrusion. Furthermore, a
comparison is made between each of the techniques in terms of tests and measurements
required in order to obtain the overall efficiency of a machine. Motivation for the Non-
Intrusive Air Gap Torque Method as a candidate for industrial application is also provided.

Chapter Three: Overview of Efficiency Estimation Techniques
Non-Intrusive Efficiency Estimation of Induction Machines 38
3.1 Introduction
Over the years there has been much research and development of various techniques and
procedures that allow for the efficiency of induction machines to be estimated. These
methods differ from accuracy, levels of intrusiveness, costs, labour intensity and overall
complexity. The following sections will provide an overview of the various existing
efficiency estimation methods.
3.2 The Nameplate Method
The name plate method, as the name describes, makes use of the information on the
machine’s nameplate in order to estimate the efficiency of the motor and assumes that the
efficiency of the motor is constant and equal to the nameplate value [26]. The main
advantage of this method is that it is considered to be the least intrusive of all the efficiency
estimation methods [26] since it merely requires access to the motor’s nameplate. Figure
3.1 shows an example of a typical name plate of an induction machine.
Figure 3.1: Example of a typical nameplate on an induction machine
Despite the low intrusiveness, there are three main areas of concern which put the method
at a disadvantage when it comes to accuracy. These include 1) discrepancies in the adopted
testing standards when nameplating the efficiency, 2) the nameplate data is no longer

Chapter Three: Overview of Efficiency Estimation Techniques
Non-Intrusive Efficiency Estimation of Induction Machines 39
applicable to rewound motors and 3), the effect of supply conditions on actual operating
efficiency does not reflect the condition in which the motor was stamped [26].
3.3 The Slip Method The slip method makes use of the motor speed measurement and is considered to be a
simple method to implement. The simplest version of this method exploits the fact that the
percentage of load is presumed to be proportional to the ratio of the measured slip to the
full-load slip. Alternatively, the input power can easily be measured and the ratio of
measured slip to rated slip is multiplied by the ratio of powers as described by [17], [26].
(3.1)
The method has a relatively low intrusion level if the speed is measured using an optical
tachometer and the input power is measured non-intrusively [26]. Although this method
provides an improvement to the nameplate method, it is not considered to be accurate.
Since NEMA allows the motor speed to deviate by 20% of nameplate speed, the resulting
efficiency value will also deflect by 20% and thus propose inaccurate efficiency values [26].
Another error associated with this method is that the slip ratio represents the percentage
of load when in fact efficiency is not equal to the percentage of loading [17]. The authors of
[17] explored modifications to the standard slip methods, namely The Ontario Hydro
Modified Slip Method and, The Upper Bound Slip Method.
3.4 The Current Method
The current method makes use of current measurements and nameplate values to estimate
efficiency. It presumes that the percentage of load is closely proportional to the percentage
of the ratio of measured current to full load current [17], [26], and that the efficiency can be
described by

Chapter Three: Overview of Efficiency Estimation Techniques
Non-Intrusive Efficiency Estimation of Induction Machines 40
(3.2)
This method does provide an improved accuracy when compared to the slip method,
however, it is still dependant on nameplate values. It should also be noted that the current-
load curve is slightly non-linear in reality [17] and this makes the proportionality concept
somewhat distorted. The main advantage of the current method is its ease in
implementation and the use of clamp on current probes provides this method with a low
level of intrusion [17].
An adaptation to the standard current method calculates the efficiency by taking into
account the no load current and is calculated according to [17]
(3.3)
This technique is, however, highly intrusive since the no load current is required, requiring
the motor to be decoupled from its load in order to conduct a no load test. In [26] it is
suggested that the average of the two approaches in equation 3.2 and 3.3 be calculated in
order to obtain a more accurate result. In addition, NEMA states the current should not
vary by more than 10% of the nameplate current [17]. This, as with the slip method, causes
a deviation of the acquired efficiency value, making this method unreliable when a high
level of accuracy is desired.
3.5 The Equivalent Circuit Method
The equivalent circuit model can be used to calculate the efficiency of an induction
machine. The IEEE Std 112 F/F1 are the standard equivalent circuit methods. Method F is
considered as too intrusive and not very user friendly due to its requirement for a no load,
impedance and reverse rotation test [23]. Method F1 is similar to method F, except that it
Chapter Three: Overview of Efficiency Estimation Techniques
Non-Intrusive Efficiency Estimation of Induction Machines 41
does not require a reverse rotation test and that the stray load losses are determined by
assumed values relating to the size of the machine as shown in section 2.4.2.
The Ontario Hydro Simplified Method F1 provides an alternative by eliminating the need for
variable voltage. The method further incorporates the magnetising branch elements to be
connected in series instead of the original parallel connection to allow for simplification
purposes [17]. An additional resistance is added to the rotor circuit and accounts for the
stray load losses which is mostly dependent on the rotor current. This method still requires
a no load test and full load test at rated voltage [17].
The Nameplate Equivalent Circuit Method (ORMEL96) makes use of nameplate data and the
value of resistance to determine the equivalent circuit of a machine. A parasitic resistance
is inserted into the rotor equivalent circuit to account for the stray load loss [17].
Researchers from the Oak Ridge National Laboratory (ORNL) have developed a set of
algorithms to determine the equivalent circuit parameters from the nameplate data [27].
The accuracy of this method is, therefore, determined by the accuracy of the nameplate
data. Issues relating to the accuracy of the nameplate data were discussed in section 3.2.
Other modified methods include the Rockwell Motor Efficiency Wizard Method, the Locked
Rotor Method, and the Standstill Frequency Response Method, [17]. These methods are still
considered to be highly intrusive.
3.6 The Segregated Loss Method
The segregated loss method is considered to be the most straight forward method of
efficiency estimation [17]. The method makes use of estimating the magnitudes of each loss
component contributing to the power loss of the motor. The method further sums these
loss components and subtracts the total from the input power to achieve an estimated
output power.

Chapter Three: Overview of Efficiency Estimation Techniques
Non-Intrusive Efficiency Estimation of Induction Machines 42
The IEEE Standard 112 Method E/E1 is the standard segregated loss method. In order to
determine the relevant losses, the method requires a variable load and variable voltage
power supply. Also, it requires that a no load test be performed to obtain the constant
losses. In order to account of the stray-load losses, the method uses the assumptions based
on the percentage of rated output power according to the size of the machine. Once all the
data is obtained from the above tests, the method uses a set of algorithms to calculate the
individual loss components. Due to the nature of the tests required for this method, it is
considered as intrusive and too disruptive for industrial applications hence only applicable
to laboratory testing [17], [26].
The Ontario Hydro Modified Method extends the standard method by assuming the
combined windage, friction and copper losses to be 3.5-4.2% of the rated input power, [17].
This technique allows for an alternative to performing the tedious task of no load testing.
The stray load losses are estimated as with method E1. Further simplification is achieved
by assuming a value of 0.8 for rated power factor and stator resistance estimation by using
the motor current to predict temperature rise [17]. Thus, the only other required
parameters are the input power and rotor speed. This method can be used as an in-service
efficiency estimator due to its low intrusive and high accuracy attributes.
3.7 Torque Methods The torque methods are considered to be the most direct of all the efficiency determination
methods. The two main torque methods consist of the Air Gap Torque method and the
Shaft Torque method. These are outlined below.
3.7.1 The Air Gap Torque Method
The air gap torque method makes use of the product of air gap torque and rotor speed as
the air gap mechanical power to calculate the efficiency [26]. The air gap torque is
calculated by using instantaneous measurements of the line voltage and current waveforms
to obtain a set of integral equations as shown by [7], [17], [26].

Chapter Three: Overview of Efficiency Estimation Techniques
Non-Intrusive Efficiency Estimation of Induction Machines 43
(3.4)
Where:
p is the number of poles
ia, ib, ic are the line currents
Vab, Vca are the line voltages
Rs is the stator resistance.
The efficiency is calculated by observing that the air gap power equates to the product of
the air gap torque and speed. After the subtraction of the friction and windage and the
stray load losses, the output power is obtained. The efficiency is therefore calculated by
[17], [26]
(3.5)
It was noted that there is a discrepancy in the efficiency equation when using the air gap
torque method. The authors of [7], [17], [26], and [28], do not explicitly account for the
core loss and calculate the efficiency using equation 3.5. In publications [27], [29] and [30],
the core loss is accounted for after the air gap torque is acquired as shown in equation 3.6.
This will be further discussed in subsequent sections.
(3.6)
A notable feature of the air gap torque method is that it takes into account the negative
rotating torque that occurs due to supply unbalances. This is of great significance since the
voltage supply in industry is always polluted [17]. The air gap torque method uses the air
gap torque power as its initial point for loss subtraction. This resultant air gap torque has
already accounted for both the negative and positive sequence torques because it

Chapter Three: Overview of Efficiency Estimation Techniques
Non-Intrusive Efficiency Estimation of Induction Machines 44
recognizes the sign difference between them [27]. A more detailed investigation of the
effects for unbalanced conditions is provided in [27].
The air gap torque method is considered to be accurate, [17], [26]; however, its pitfall lies
in its need to conduct a no load test to determine the no load losses. Also, stator resistance
and speed measurements make this method undesirable for field applications.
The Non-intrusive Air Gap Torque method (NAGT) is an adaptation to the original air gap
torque method. Since the major disadvantage of the air gap torque method is its high level
of intrusion, the authors of [7] have designed an online non-intrusive way to estimate
efficiency. The stator resistance is estimated using a DC injection method, the rotor speed is
obtained from current spectral analysis associated with rotor slot harmonics and the losses
are accounted for using empirical values.
3.7.2 The Shaft Torque Method
The shaft torque method measures the shaft torque and speed directly in order to
determine the output shaft power [17] The shaft torque method is the most
straightforward method but is highly intrusive due to the need for direct access to the shaft
[17], [26] and the need to couple the machine to a dynamometer. According to IEEE Std
112 method B, methods using dynamometers should not be implemented in field
conditions [23]. The use of costly torque sensors also makes this method undesirable for
field applications [17].
3.8 Alternative Methods
There are many other methods that exist regarding the estimation of motor efficiency.
These methods will not be discussed in detail but are listed in this thesis for the purpose of
completeness.

Chapter Three: Overview of Efficiency Estimation Techniques
Non-Intrusive Efficiency Estimation of Induction Machines 45
Genetic Algorithms
Statistical Methods
Dedicated Instruments
3.9 Comparison of Efficiency Estimation Techniques
The efficiency estimation techniques discussed in the former sections, each has its own set
of advantages and disadvantages. In general the main areas of concern are the level of
intrusion (determined by the type and measurements of testing) and the accuracy. A
comparision of these factors for each type of estimation technique is outlined below.
3.9.1 Accuracy Vs Intrusion
As discussed in the former sections, there is a trade-off between the level of accuracy and
the amount of intrusion that each of the methods offer. As shown in Figure 3.2 the level of
intrusion increases as the level of accuracy increases.

Chapter Three: Overview of Efficiency Estimation Techniques
Non-Intrusive Efficiency Estimation of Induction Machines 46
Figure 3.2: Comparison of accuracy and intrusion of efficiency estimation methods
The intrusion levels are dictated by the type of tests and data measurements required to
acquire the motor’s efficiency. The tests required by each of the above methods are
outlined in the next section.
3.9.2 Required Tests and Measurements
The required measurements for the efficiency estimation techniques determine the level of
intrusion and how tedious the method will be. The accuracy of the equipment used to
obtain these measurements will also have a direct impact on the accuracy of the method
and therefore it is imperative that test equipment meets the required accuracy levels.
Based on the preceding sections, Table 3.1 depicts the required tests and data
measurements necessary for each efficiency estimation method [17].
The Shaft Torque Method
The Air Gap Torque Method
The Segregrated Loss Method
The Equivalent Circuit Method
The Current Method
The Slip Method
The Nameplate Method

Chapter Three: Overview of Efficiency Estimation Techniques
Table 3.1 Required tests and measurements for various efficiency estimation techniques
Method No load test Rated load
test Variable supply
Stator resistance
Speed Torque Nameplate data
Standard Nameplate Method
Standard Slip Method
Ontario Hydro Modified Slip Method
Upper Bound Slip Method
Standard Current Method
Adapted Current Method
Equivalent Circuit Method- IEEE 112 F1
Ontario Hydro Simplified Method F1
Segregated Loss Method- IEEE 112 E1
The Ontario Hydro Modified Method E1
Air Gap Torque Method
Non Intrusive Air Gap Torque Method
(Uses empirical values)
(Estimated)
(Estimated)
Shaft Torque Method

Chapter Three: Overview of Efficiency Estimation Techniques
Non-Intrusive Efficiency Estimation of Induction Machines 48
3.10 Concluding Remarks
This chapter provided an overview of existing efficiency estimation techniques. The main
attributes of each method were introduced and possible alternative modified methods
were included. The comparison of each of these methods showed that there is a trade-off
between accuracy and level of intrusion depending on the required test. In this regard, the
nameplate method is considered the least accurate and intrusive, while the shaft torque
method is the most accurate but contains a high level of intrusion. In the case of onsite
implementations of these methods, the user should ensure that each of the advantages and
disadvantages are considered before execution.
Based on the investigation of each of the techniques, the Non Intrusive Air Gap Torque
Method provides a good trade-off between non-intrusiveness and accuracy in estimating
the efficiency of motors while they are in operation. Due to the need to acquire parameters
such as the stator resistance, speed, no load and stray load losses non-intrusively, the
method still contains sources of inaccuracies. The remainder of this thesis will, therefore,
investigate various methods for determining these parameters as accurately as possible,
with the aim of estimating the efficiency of a machine under field conditions.

CHAPTER FOUR 4 OVERVIEW OF STATOR WINDING
RESISTANCE ESTIMATION
TECHNIQUES
This chapter provides an overview of existing stator winding resistance estimation techniques.
The estimation techniques are categorised under model based estimation and signal based
estimation methods. Furthermore the advantages and disadvantages of each of the estimation
methods are discussed.

Chapter Four: Stator Winding Resistance Estimation Techniques
Non-Intrusive Efficiency Estimation of Induction Machines 50
4.1 Introduction
The stator winding resistance of an induction machine is a highly sought after machine
parameter since it is required in many motor efficiency estimation methods. In particular,
the effects of resistance measurements have a great impact on the machine’s operating
characteristics. The accuracy of measuring this parameter is critically important when
determining the stator winding losses and during thermal modelling applications where
the stator resistance can be used to detect high temperatures.
The stator winding resistance of an induction machine is traditionally determined by
performing an unpowered test. This primarily involves shutting down the machine and
waiting until standstill before the resistance is measured using an ohmmeter or
galvanometer. This procedure is often unacceptable in the field since it is highly intrusive.
Also, the stator resistance is only measured at a particular temperature (usually under
rated load conditions whereby it is obtained from a temperature test run). This is not a
realistic determination since stator resistance is highly dependent on temperature. It is
possible to perform temperature correction methods however; this relies on the
installation of costly thermocouples.
Based on the above, researchers have investigated and developed various stator resistance
estimation methods. These methods are predominantly used for the improvement of field
orientated drives or in sensorless speed control applications where the shaft speed is
desired at low speeds [31]. This is due to the requirement of stator resistance (Rs) in the
induction motor model, upon which these methods are based. More recently, Rs estimation
techniques have been developed in motor thermal monitoring and protection applications.
High temperature readings of stator winding allow for the detection of insulation
degradation and stator winding faults, both of which contribute negatively to the lifespan
of the machine. This provides an alternative to expensive and intrusive thermocouple
installations. There are two main approaches for Rs estimation, namely induction machine
model-based Rs estimation and signal-based Rs estimation. These are discussed below.

Chapter Four: Stator Winding Resistance Estimation Techniques
Non-Intrusive Efficiency Estimation of Induction Machines 51
4.2 Induction Model Based Rs Estimation
4.2.1 Field Orientated Controlled Drive Applications
Direct torque control of induction machines use the stator resistance in order to obtain the
estimation of the stator flux developed within the machine. The variation of stator winding
resistance will thus affect the value of stator flux, especially at low speeds, and thus needs
to be estimated as accurately as possible.
A proportional-integral (PI) and fuzzy logic resistance estimation scheme was investigated
in [32]. The estimation of Rs is based on the changes in the current vectors, since the stator
current is affected by resistance changes [32]. The authors concluded that the fuzzy logic
based resistance estimator was more robust and performed better than its PI counterpart,
especially at low operating speeds.
In [33] an algorithm was developed to estimate the stator winding resistance using the
stator voltages and currents. The application for the algorithm is aimed at on-line
determination of leakage reactance and stator resistance of induction machines which are
connected to a vector controlled drive. It was observed that a high level of accuracy for
determining Rs is required since the stator flux is highly dependent on it. Also, the effects of
temperature make it essential that the value of Rs be measured and updated during
machine operation.
A mutual model reference adaptive system (MRAS) for field orientation control of
induction machines was proposed in [34]. The method allows for the reference and
adjustable model to be interchanged accordingly such that either the rotor speed or stator
resistance can be determined. After being validated both by simulation and by
experimentation, it was shown that the stator resistance of an induction machine can be
usefully obtained with a rapid algorithm response time.
Another MRAS approach for the real time identification of induction motor stator and rotor
resistance was explored in [35]. The proposed schemes were verified by simulations. The

Chapter Four: Stator Winding Resistance Estimation Techniques
Non-Intrusive Efficiency Estimation of Induction Machines 52
authors concluded that the systems only provide satisfactory results in the case of
persistent excitation. The need to conduct sensitivity analysis of these parameters and to
verify the stator and rotor identifiers experimentally on the estimation techniques was
identified.
4.2.2 Sensorless Speed Control Applications
Speed control of an induction machine requires the accurate estimation of the fluxes within
the machine. This estimate is obtained from the motor’s circuit parameters and therefore is
dependent on the stator resistance.
In [36], the authors explored the effects of stator variations on motor speed control
applications and developed a scheme to estimate Rs based on the induction motor model
under steady state conditions. The method is based on evaluating the reactive power,
obtaining the stator and rotor fluxes and calculating the developed torque in order to
obtain Rs. An investigation into the sensitivity of Rs due to uncertainties in inductive
parameters was also performed.
In [37], the authors attempted to adopt a two-time scale approach to the stator winding
estimation process such that an adaptive online tuning algorithm can be implemented. The
aim was to establish a reliable algorithm that can be applied to all loading conditions and
operating speeds. A full order state observer of the stator resistance and its error
estimation were developed. The two observers were analysed according to the assumption
that each system contains two subsystems, of which accounts for its own dynamics, one
being faster than the other. The authors concluded that an accurate and reliable estimation
of Rs can be obtained.
An online stator and rotor resistance identification method without rotational transducers
was investigated in [38]. The Rs identification algorithm is based on the power flow in the
air gap. The method uses the values of the calculated load torque obtained from

Chapter Four: Stator Winding Resistance Estimation Techniques
Non-Intrusive Efficiency Estimation of Induction Machines 53
measurable quantities of stator current, angular velocity and reactive power. Due to the
need to determine the sign value of the load torque, the true value of Rs can only be
obtained once the correct sign value is obtained. A DC flux injection procedure and filter
design method (to avoid differentiation) was implemented. Experimental results proved
that the technique can accurately estimate the value of Rs at any load when the machine is
operating under steady state conditions.
4.2.3 Thermal Monitoring Applications
A fuzzy logic based stator resistance estimator is presented in [39]. The authors proposed a
fuzzy logic algorithm that estimates the stator winding temperature based on the stator
current and frequency. Based on the simulation and experimental performance of the logic
estimator, the authors concluded that the stator winding resistance can be estimated
accurately with excellent performance when calibrated with a thermistor network
embedded in the machine.
In [40], the authors proposed a two-stage stator and rotor resistance estimation technique.
The rotor resistance and flux linkages are estimated using MRAS techniques. The authors
concluded that this method provides an accurate means of stator winding resistance
estimation at high speeds provided that the accuracy of rotor resistance and rotor flux
linkages is unquestionable. In particular the value of Lm largely affected the accuracy of Rs
at high speeds.
4.2.4 Advantages and Disadvantages of Induction Model Based Rs Estimation
The induction model based Rs estimation techniques provide a non-invasive method to
estimate the stator resistance. However, the pitfall of these methods is accuracy. According
to the research done by the authors of [31], obtaining accurate measures of Rs at speeds
other than low speeds deemed challenging. Although the observation has been considered
empirically, the phenomenon has yet to be fully explained.

Chapter Four: Stator Winding Resistance Estimation Techniques
Non-Intrusive Efficiency Estimation of Induction Machines 54
During high speed operations Rs is usually considered to be negligibly small when
compared to the equivalent input impedance of the machine. Hence, as stated in [31],
errors in terminal measurements drastically affect the accuracy of Rs as it will be highly
sensitive to these errors. At low speed the method is appropriate although it depends on
the determination of the other parameters.
Many of these estimation methods rely on the prior knowledge of parameters such as self,
mutual and magnetizing inductance. Although these parameters can be determined from
the nameplate data or obtained experimentally, there exist inherent errors. For instance,
the nameplate data may no longer apply if the machine has been rewound. The conduction
of necessary experiments in order to obtain these inductances makes the method highly
intrusive. The accuracy of Rs is dependent on these parameters and therefore if they
contain errors, the value of Rs will consequently also be inaccurate. Also, one could argue
that if one needs to conduct experiments to obtain the inductance values, one might as well
conduct experiments to obtain Rs with a somewhat more direct and less tedious approach.
It was also shown that the accuracy of Rs is sensitive to parameter variation. Thus,
parameters are expected to be constant throughout operation if the Rs estimation
technique is to be applied.
4.3 Signal Based Rs Estimation
Signal based Rs estimation techniques provide a more direct approach to Rs determination.
In general these approaches often require additional circuitry or control operations in
order to inject DC components into the stator windings of the machine.
In [41], the concept of DC bias injection in order to estimate Rs was introduced. The authors
used an online approach by adding a DC bias to the reference signals, thereafter filtering
the result to obtain the DC components. The value of Rs was then obtained via a regression
model using a least squares algorithm.

Chapter Four: Stator Winding Resistance Estimation Techniques
Non-Intrusive Efficiency Estimation of Induction Machines 55
In [42] the stator winding resistance was also estimated using a least squares minimization
problem. The technique was applied to an AC drive connected system which contained an
accessible neutral connection to which a central tap of a capacitor bank was connected
[42]. The machine is supplied with a symmetrical three-phase voltage supply and a zero
sequence component was simultaneously added. The stator winding resistance was
obtained by applying a least squares algorithm to the data obtained during the addition of a
zero sequence voltage.
In [43] a controlled DC bias signal injection circuit was developed to intermittently inject a
DC signal into the stator winding of a motor. This was achieved by connecting a circuit,
consisting of a power MOSFET connected in parallel with a resistor, between the source
and terminals in one phase of the machine. By measuring the DC voltage and current, the
value of Rs can be obtained. It was concluded that this technique provided an accurate
means of Rs estimation of line connected machines.
In [44], the stator resistance is determined to allow for thermal monitoring of the stator
winding of a machine. The estimation of Rs and Rr is based on the terminal measurement of
voltage and currents and the equivalent circuit of the machine. The estimation process
involves the injection of two signals of different voltage and frequency. After experimental
validation the approach proved to be feasible. This method, however, is not applicable to
line connected machines and thus contains a degree of limitation as a generic Rs estimation
technique.
A superposition technique was used in [45] which incorporated a modified double-bridge
circuit by switching in a DC supply into the stator windings. Tests involving an inverter
supply with a six step control and pulse width modulation (PWM) were also investigated.
Based on the experimental results, there exists a large degree of inaccuracies and thus did
not prove satisfactory.

Chapter Four: Stator Winding Resistance Estimation Techniques
Non-Intrusive Efficiency Estimation of Induction Machines 56
4.3.1 Advantages and Disadvantages of Signal Based Rs Estimation
The main advantage of signal based Rs estimation schemes is the accuracy level associated
with the technique. Additionally, these methods are independent of motor parameters and
are not affected by the inherent motor asymmetry. The use of zero sequence components is
highly advantageous since it does not contribute to the generation of electromagnetic
torque and therefore does not affect the operating conditions of the machine [42].
Unfortunately, this method requires an easily accessible neutral point to connect the
capacitor. This requirement is not viable under plant conditions, especially for delta
connected motors.
In most cases signal injection based methods do not require the prior knowledge of any
other machine parameters. This contributes to the low level of intrusion contained by these
methods. The only degree of intrusion that exists is found in the installation of the circuitry.
This can be achieved during maintenance or scheduled downtime. Once the circuit has
been installed the method can be considered as having a low level of intrusion [7].
DC injection circuits do however, contain some pitfalls. Due to the additional signal
injection, a degree of unbalance within the machine is seen to exist. Also, the additional DC
components contribute to levels of torque pulsations as a result of the interaction between
the stator and rotor flux components [7], [43]. These torque pulsation may have a negative
effect on the driven load if it exceeds the tolerable amount. Additional circuitry also
contributes to increased power dissipation, which needs to be accounted for.

Chapter Four: Stator Winding Resistance Estimation Techniques
Non-Intrusive Efficiency Estimation of Induction Machines 57
4.4 Concluding Remarks
This chapter summarized the existing stator winding resistance estimation techniques.
These techniques were categorised into model based and signal estimation methods. The
advantages and disadvantages associated with each of these categories were presented. In
general, the model based estimation methods are dependent on the parameter of the
machine and the accuracy of these methods is often compromised if these parameters are
not accurately obtained. Signal based resistance estimation schemes, on the other hand, are
considered to be more accurate, however their level of intrusion is jeopardized.
The signal based Rs estimation technique as proposed in [43] was selected as the candidate
method for this thesis. This technique was chosen due to its application to line connected
machines. Furthermore, the expected accuracy levels of this method are considered to be
high relative to the other proposed methods. Additionally, the circuitry implementation is
simple and the components readily available. Despite the intrusive nature of the
installation process, it is only a once off procedure and thereafter the technique is
considered to be non intrusive. This issues relating to negative effects of torque pulsations,
power dissipation and unbalances will be addressed.

CHAPTER FIVE 5 OVERVIEW OF ROTOR SPEED
ESTIMATION TECHNIQUES
This chapter provides an overview of different rotor speed estimation techniques. The
majority of these techniques are based on various applications of model based methods or
alternatively using analysis of electrical signal spectrums. In contrast, the use of mechanical
signal spectrum techniques is also presented.

Chapter Five: Overview of Rotor Speed Estimation Techniques
Non-Intrusive Efficiency Estimation of Induction Machines 59
5.1 Introduction
The rotor speed of an induction machine is required in the efficiency determination of
induction machines. Traditionally the use of shaft mounted speed encoders and highly
advanced tachometers have proven to be costly and are highly intrusive to install. Also, in
many cases access to the motor shaft is not feasible and thus hand-held optical tachometers
cannot be used. Over the years, much research has been done to develop a technique for
which the rotor speed can be estimated over a larger range of frequencies and load
operating conditions. In most cases, sensorless speed estimation techniques have been
developed to focus on field orientated control applications with inverter driven machines.
Many of the techniques reviewed here use electrical signal spectrum techniques. However;
the use of mechanical signals is also discussed. The following sections outline a few of the
more common sensorless speed estimation technique.
5.2 Induction Motor Model Based Techniques
A model reference adaptive system (MRAS) for a speed sensor-less control of an induction
machine is proposed in [46] and [47]. It was stated that estimating rotor speed using rotor
flux becomes difficult at the low speed ranges. Also if the motor parameters are set
incorrectly or are affected by variations such as temperature, incorrect speed values will be
obtained. To overcome this, the authors of [46] developed a set of observers that identified
the stator resistance simultaneously with the rotor speed.
In [47] a mutual MRAS based on two models allows for the models to be interchangeable in
order to identify both the stator resistance and rotor speed for a field orientated control
application. The authors of [47] noted that the stator leakage inductance also has an affect
on the performance of speed identification. Based on the developed mutual MRAS system
the need for integration and stator inductance was removed and allowed for a wider range
of speed detection.
More recently, a comparison of the conventional and AI-based MRAS motor speed
estimation techniques was presented in [48]. Based on simulation results the authors

Chapter Five: Overview of Rotor Speed Estimation Techniques
Non-Intrusive Efficiency Estimation of Induction Machines 60
verified and concluded that the AI-MRAS technique is more accurate and robust when
incorporating simultaneous online stator resistance estimation than the conventional
MRAS system
Another method to address the resistance variation issue is proposed in [49] which
incorporates an algorithm in which the rotor resistance is estimated on-line using a least
squares method obtained during a speed transient, while the stator resistance is estimated
using the instantaneous reactive power. In [50] the authors devised a speed equation from
an equivalent circuit by taking the dot and cross product of the rotor flux and current.
Model based speed estimation using the MRAS have proven to be successful speed
estimators, however it is known to fail under low speed operations. The methods are
known to be parameter dependent and are affected by parameter variation. Also, the
machine’s parameters are not always easily obtainable, especially in cases where the
nameplate is not visible or the motor has been rewound. On the other hand, the method
does not suffer from high intrusion levels and this is advantageous to its application.
5.3 Electrical Signal Spectrum Techniques The speed of an induction machine can be determined by using the motors’ input electrical
quantities, namely voltages and currents. A few of these techniques are outlined in the
subsequent sub-sections.
5.3.1 Rotor Slot and Eccentricity Fault Frequency Harmonics
Induction motors are constructed to contain slots on the stator and rotor core to allow for
the insertion of windings. These slots are known to produce slot harmonics in the air gap
flux which further induce slot harmonic voltages within the stator windings [51]. Based on
the above, the authors of [51]and [52] employed an algorithm for speed detection of
induction motors under variable frequency drive applications. The speed detection process
utilizes the rotor slot harmonic voltage by employing sampling, subtraction, filtering and
zero crossing techniques.

Chapter Five: Overview of Rotor Speed Estimation Techniques
Non-Intrusive Efficiency Estimation of Induction Machines 61
In [53] the authors focused on a similar approach to the existing rotor slot harmonic
techniques mentioned above and incorporated Fast Fourier Transform (FFT) processing.
However, the rotor slot harmonics are obtained from the induced currents instead of the
induced voltages since it was observed that voltage degradation becomes prominent at low
speed. The paper addresses the limitations of speed detection at low frequency and light
load conditions by ensuring that a high frequency resolution for the FFT is used. The
method requires measurements of only the stator current in order to predict, amongst
many things, the rotor speed. The authors claimed an error of 15 rpm when comparing the
developed technique with that of the measured speed using an opto-electrical sensor.
An overview of various spectral estimation techniques on rotor slot harmonics is presented
in [54]. The authors verified and compared the techniques both by simulation and
laboratory implementation. The authors concluded that a maximum entropy method
(MEM) proved to be most successful especially at the higher ranges of operation speed
whereas, the FFT approach is more suitable under low speed conditions where longer sets
of data can easily be obtained. In [55] the authors also investigated numerous spectrum
estimation techniques and outlined their advantages and disadvantages. The investigation
was to establish which technique provided maximum accuracy with minimum sampling
time. It was concluded that parametric spectrum methods provided the highest accuracy
with minimum sampling time.
Rotor slot harmonic techniques provide an improvement on the MRAS type method since
they are not affected by parameter variation and perform better at lower speed ranges.
However, the pitfall lies in the algorithm’s dependency on parameters and requires that the
number of rotor slots be predetermined.
In [56], however, the authors developed an algorithm to detect the speed of an induction
machine using the current harmonic spectrum. The algorithm incorporates the detection of
the number of slot via an initialization procedure using eccentricity harmonics and merely
requires the number of poles to be depicted by the user. The speed detection algorithm
then employs various signal processing techniques in order to obtain the speed related
frequency from one of the stator currents.

Chapter Five: Overview of Rotor Speed Estimation Techniques
Non-Intrusive Efficiency Estimation of Induction Machines 62
A speed estimation equation based on broken rotor bar fault detection was developed in
[57]. The proposed algorithm utilizes the motor’s stator current signal and applies an FFT
to obtain the frequency spectrum. After searching for a harmonic component with the
largest amplitude within a defined interval the speed can be obtained. However, the
method requires that the number of rotor bars of the motor be known.
Despite the improvement suggested above, speed detection using rotor slot harmonics is a
highly tedious task that involves high level signal processing and computation. One
advantage is that these methods are generally non intrusive since they only require either
voltage or current signals to be captured. This is easily obtainable at the motor’s terminals
or control centre.
5.3.2 Additional Carrier-Signal Injection
In [58] the rotor speed and position of an AC machine is detected by injecting a high
frequency signal into the machine. The technique makes use of the rotor’s magnetic
saliency when a high frequency voltage signal is superimposed upon the fundamental input
voltage.
Another high frequency signal injection method is proposed in [59]. The method employs
the use of this high frequency carrier signal and their sideband frequencies (due to rotor
eccentricities) to establish a frequency component that is related to the motor speed. In
[60] a combination of signal injection and rotor slot harmonic detection technique is
proposed. An additional carrier signal voltage is added to the excitation voltage. The carrier
signal current which contains the spatial information is then analysed by obtaining the
rotor slot harmonics.
The signal injection procedures discussed above are aimed at inverter driven induction
machines. Thus, this injection of the carrier signal can be easily implemented without any

Chapter Five: Overview of Rotor Speed Estimation Techniques
Non-Intrusive Efficiency Estimation of Induction Machines 63
additional circuitry. In contrast, if the machine is line connected, additional signal injection
circuitry is required. This can be a costly and highly intrusive procedure.
5.3.3 Neural Network Techniques
An artificial neural network (ANN) approach to obtain the motor speed from its dynamic
equations is presented in [61]. It was explained that the effects of singularity produces a
speed signal that contained a high degree of ripple. This was overcome by applying a
portioned approached by separating the numerator and the denominator of the speed
equation. This allows for the ANN algorithm to be ‘trained’ to recognise these values
independently and calculate the speed accordingly.
More recently, in [62], a neural network approach was investigated in order to extract the
rotor speed by applying a wavelet technique to the stator current of a motor. The authors
adopted a ‘training off-line estimating on-line’ approach and incorporated a dynamic
gradient learning algorithm. After implementation, the authors recorded an average error
within ±5 rpm of the actual speed and indicated high precision in steady state operation
and good dynamic tracking during transients.
5.3.4 Kalman Filters
A unique speed estimation using extended Kalman filters is proposed in [63]. The
algorithm imports voltages and currents and calculates the output estimated speed via
numerous state estimation processes. The authors produced a Matlab/Simulink model to
implement the technique. Furthermore, optimising the extended Kalman filter was
investigated using a genetic algorithm.
5.4 Mechanical Signal Spectrum Techniques
The analysis of the mechanical vibration spectrum is prominently used for fault detection
purposes. Misalignment, bearing faults and motor eccentricities can be detected by
observing the relevant frequency components of the vibration spectrum. In particular, the

Chapter Five: Overview of Rotor Speed Estimation Techniques
Non-Intrusive Efficiency Estimation of Induction Machines 64
mechanical imbalance of the rotating parts associated with the machine causes low
frequency harmonics in the vibration signature spectrum. The largest harmonic in this low
frequency range is primarily associated with the rotational frequency of the machine and
hence can be translated into speed.
An overview of various rotor speed estimation techniques, including vibration analysis, is
provided in [64]. The authors verified these methods experimentally on two induction
machines. It was concluded that the performance of these techniques show a high degree of
accuracy, with the vibration and flux signature analysis being the most favourable. In [65] a
non-intrusive load and efficiency evaluation is presented. In particular, the paper discusses
the use of vibration signature as a means to determine the rotor speed.
A speed estimation technique using piezo-electric sensors is proposed in [66]. The
technique exploits the vibration harmonics due to electromechanical torque and radial
force pulsations. The vibration signal is processed through various filters, a zero crossing
detector and a moving average filter. The authors verified the technique experimentally
and the results showed a correlation between the actual and estimated speed.
The main advantages associated with vibration signature spectrum is that, because a
machine will always contain manufacturing imperfections, an inherent eccentricity will
always be present ensuring that speed detection is guaranteed. The accuracy of the
detection is therefore dependent on the instrumentation used and the signal processing
methodologies used. Vibration analysis can be implemented on any induction machine; in
particular those which are line-connected.

Chapter Five: Overview of Rotor Speed Estimation Techniques
Non-Intrusive Efficiency Estimation of Induction Machines 65
5.5 Concluding Remarks
This chapter investigated the various speed detection methods proposed in literature. Most
of the speed detection schemes available are based on the electrical signal spectrum.
Despite their non intrusiveness, these methods are often associated with high level signal
processing. Additionally, the reliability of these methods was seen to degrade at the lower
speed ranges. Mechanical signal spectrum techniques however, incorporate the motor’s
inevitable vibration as a means for rotor speed detection. These methods are non-intrusive,
easy to implement and are accurate for the entire speed range.
Based on the above, the candidate method chosen for the estimation of rotor speed
incorporates the use of the mechanical vibration spectrum. This method can be attributed
to low intrusion levels in comparison to the other methods. Additionally the speed
detection process can be easily implemented by simple signal processing FFT techniques.
As shown in [64] the proposed technique shows a straightforward, reliable and accurate
means of rotor speed estimation.

CHAPTER SIX 6 DEVELOPMENT OF THE NON-
INTRUSIVE AIR GAP TORQUE
METHOD
This chapter presents the development of the Non-Intrusive Air Gap Torque Method for
efficiency estimation. Candidate methods for stator winding resistance and rotor speed
estimation are presented. The derivation of the air gap torque equation is provided and
discussions around its contribution to the efficiency estimation equation are given.
Furthermore, the relevant empirical methods of no load and stray load loss estimation are
discussed. Combining the aforementioned estimated components, the overall non-intrusive air
gap torque efficiency estimation process is established.

Chapter Six Development of the Non-Intrusive Air Gap Torque Method
Non-Intrusive Efficiency Estimation of Induction Machines 67
6.1 Introduction
The development of the non intrusive air gap torque method (NAGT) incorporates the
choice of various non-intrusive estimation techniques. This includes stator resistance, rotor
speed, stray load loss and no load loss estimation. In order for these techniques to be
implemented, it is necessary to develop the relevant theory in more detail so that their
topologies can be combined to establish an overall efficiency estimation method. The
following sections provide a detailed description of the chosen estimation techniques and
indicate how the overall NAGT method is established.
6.2 Motivation for Non-Intrusive Efficiency Estimation
The main reason for efficiency determination lies in the ability to identify whether the
machine is operating in such a way as to maximize production output with minimum input
resources. The motor may be worn or out of date, thus analysis of the motor efficiency will
assist in the decision to either replace or repair the existing motor [67]. Efficiency
measurement provides industry with the ability to perform energy audits of its plants in
order to assist with cost analysis [67], [68]. Another reason to be able to measure efficiency
exists in the event of receiving a rewound machine [67].
Traditionally the efficiency of a motor is measured in a laboratory using advanced
instrumentation that is accurate, precisely calibrated and the use of dynamometers. Under
laboratory conditions, the efficiency is obtained under balanced, rated voltage and stable
load. These tests are highly intrusive because they require a no load test, reduced voltage
and unpowered stator resistance measurements [69]. These factors are often undesirable
in the field environment due to cost and difficulty in implementation and thus they can only
be conducted during plant outages or maintenance procedures.
The induction machine out in the field is subjected to many non-ideal conditions. For
instance, the power supply could be polluted since it is not perfectly balanced or contains a
certain degree of harmonics [26]. These factors affect the efficiency of the machine and
thus it may not meet the ratings proposed by the manufacturers.

Chapter Six Development of the Non-Intrusive Air Gap Torque Method
Non-Intrusive Efficiency Estimation of Induction Machines 68
The need for in-service efficiency estimators has become mandatory in many industrial
applications. The main requirement of these methods are to avoid the use of high cost
equipment and to reduce the amount of intrusion while still maintaining a high level of
accuracy [17].
6.3 The Air Gap Torque Equation for Efficiency Estimation
The development of the air gap torque method is required for the understanding of the
relevant equations that need to be applied in order to use the NAGT method as a means for
efficiency estimation. The derivations of these equations are outlined below.
6.3.1 The Air Gap Torque Equation
In the development of the air-gap torque equation, the following assumptions are made
[28], [70],
The three-phase leakage reactances are linear and identical
The negative sequence winding spatial components (excluding the time harmonics) are
negligible
The instantaneous magnetic unbalances for three-phases are ignored
The effects of the DC components of the flux linkages are neglected.
The air gap torque equation is derived in more detail in [70]. Based on these assumptions,
the air gap torque equation can be expressed as
(6.1)
The term ia(c-b) represents the torque producing component of the phase a winding. The
phase a current interacts with the air gap flux that is perpendicular to the magnetic axis of
the winding. Similarly, the second and third term represent the torques produced by phase
b and phase c respectively.

Chapter Six Development of the Non-Intrusive Air Gap Torque Method
Non-Intrusive Efficiency Estimation of Induction Machines 69
The air gap torque equation can also be viewed in terms of stator voltage equations.
The voltage developed in each of the three-phase windings can be expressed as follows
[70].
(6.2)
Where:
a, b ,c are the flux linkage of phase a, b and c
ia, ib, ic are the phase currents
r is the phase resistance
Solving for the flux linkages in terms of integrals, equation 6.2 can be expressed as the
integral of the input voltage less the stator copper voltage drop.
(6.3)
Equation 6.3 can then be substituted into the air gap torque equation in equation 6.1 and
simplified to obtain the air gap torque equation in terms of three phase line voltages and
currents as shown in equation 6.4.
(6.4)
Where:
p is the number of poles
ia, ib are the line currents
vca, vab are the line voltages
Rs is half the line to line resistance
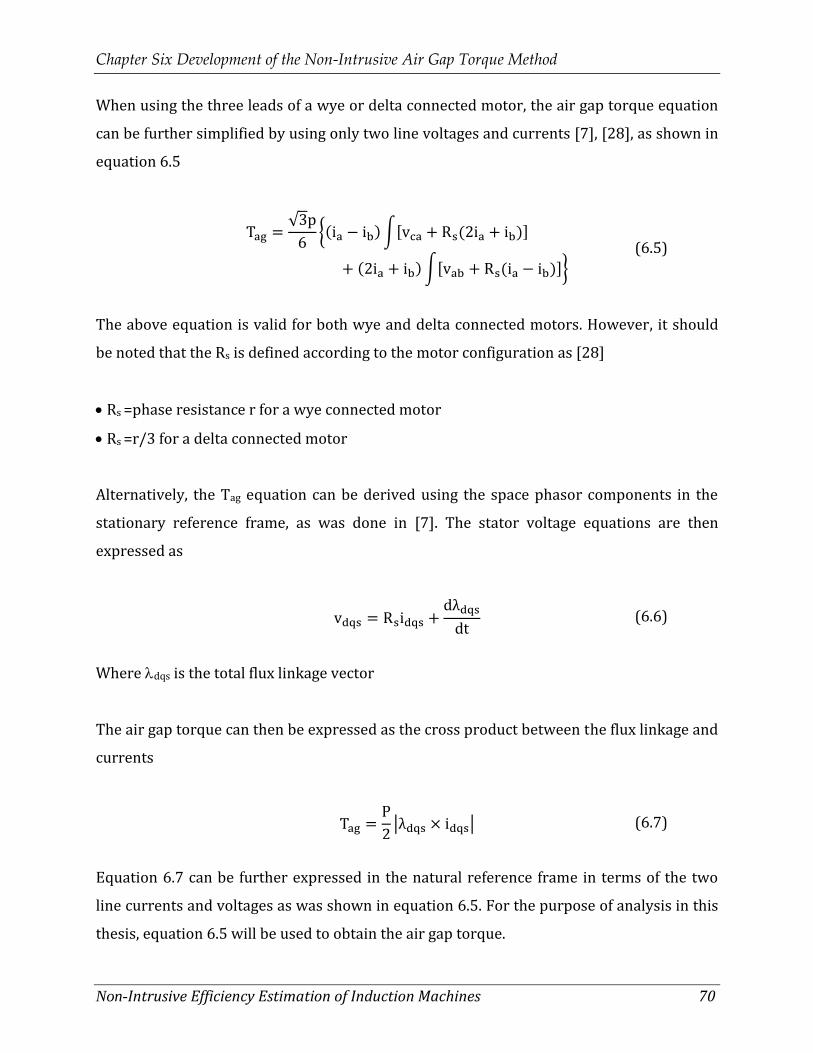
Chapter Six Development of the Non-Intrusive Air Gap Torque Method
Non-Intrusive Efficiency Estimation of Induction Machines 70
When using the three leads of a wye or delta connected motor, the air gap torque equation
can be further simplified by using only two line voltages and currents [7], [28], as shown in
equation 6.5
(6.5)
The above equation is valid for both wye and delta connected motors. However, it should
be noted that the Rs is defined according to the motor configuration as [28]
Rs =phase resistance r for a wye connected motor
Rs =r/3 for a delta connected motor
Alternatively, the Tag equation can be derived using the space phasor components in the
stationary reference frame, as was done in [7]. The stator voltage equations are then
expressed as
(6.6)
Where dqs is the total flux linkage vector
The air gap torque can then be expressed as the cross product between the flux linkage and
currents
(6.7)
Equation 6.7 can be further expressed in the natural reference frame in terms of the two
line currents and voltages as was shown in equation 6.5. For the purpose of analysis in this
thesis, equation 6.5 will be used to obtain the air gap torque.

Chapter Six Development of the Non-Intrusive Air Gap Torque Method
Non-Intrusive Efficiency Estimation of Induction Machines 71
The numerical evaluation of the flux linkage integrals in the air gap torque equation can be
computed using traditional integration methods. If the time increments between data
points is sufficiently small, i.e. high sampling rate, a simple trapezoidal integration method
can be used [7]. Other methods, such as Simpson’s rule or Gauss’s rule can also be used for
higher accuracy.
Due to the initial value problem and drift associated with integration, an offset DC
component in the flux linkage component is created. To rectify this, it is necessary to
implement a filtering technique which obtains the moving average of the flux linkage terms.
Obtaining the moving average for a number of cycles, it can be subtracted, thereby
removing the DC offset in the air gap flux component [7].
6.3.2 The Input Power Equation
The input power can be determined from the instantaneous input voltages and currents.
The input power can be expressed as the summation of the products of the instantaneous
phase voltages and currents as shown in equation 6.8.
(6.8)
When using only two leads of the three-phase motor, the two wattmeter method of
measuring input power may be used, as shown in equation 6.9
(6.9)
The average of the instantaneous power is used when determining the efficiency of the
machine. This is to reduce the effect of the ripples associated with the energy stored in the
windings [7], [28].

Chapter Six Development of the Non-Intrusive Air Gap Torque Method
Non-Intrusive Efficiency Estimation of Induction Machines 72
6.3.3 The Efficiency Equation
The output shaft power can be calculated from the product of the shaft speed and the shaft
torque. In the case of the air gap torque method, the air gap torque is the starting point of
subtraction. Thus the output shaft torque is the air gap torque less the mechanical and the
rotor stray load loss. Therefore, the efficiency can be calculated as [7], [27],
(6.10)
As mentioned in Chapter 3, there is a discrepancy in the literature when calculating the
efficiency using the air gap torque equation. In order to resolve the issue, the following
discussions are made.
When observing the power flow through an induction machine (figure 2.3), the air gap
power represents the power transferred across the airgap from the stator to the rotor of
the machine. Thus, this transferred power can be seen as the power that remains after the
stator winding losses and core losses have been accounted for. The air gap torque
associated with this air gap power should, therefore, account for the stator winding copper
loss and the core loss.
The air gap torque equation and its derivation show that the stator copper loss is
accounted for (in the integral terms), however the core loss is not. It is evident that the
derivations have either neglected the core loss component or alternatively lumped it
together with the friction and windage loss.
Further investigation of this dilemma was conducted by simulating the air gap torque
equation in MATLAB simulink (see Appendix). The case for ideal voltage and current
waveforms for an 11kW motor under rated conditions was implemented. Simultaneously,
the input power and the stator resistance loss component were calculated. Based on the
simulation results, it appears that the air gap power (Pag = Tags) closely resembles that of
the input power less the stator copper loss.
Chapter Six Development of the Non-Intrusive Air Gap Torque Method
Non-Intrusive Efficiency Estimation of Induction Machines 73
It is evident that the air gap torque component does not account for core loss and therefore
would need to be included in the final efficiency equation as shown in equation 6.11 [27],
[29] and [30].
(6.11)
As discussed in Chapter 3, the major disadvantage of the air gap torque method is that it
requires measurements of stator resistance, rotor speed and no load losses. The following
sections will describe how these parameters can be addressed in such a way that the
overall method can be made to be non-intrusive, with a reasonably high degree of accuracy.
6.4 Stator Winding Resistance Estimation
The stator winding resistance estimation technique chosen for this thesis is based on the
DC signal injection technique proposed in [43]. This technique was chosen based on its
high accuracy and ease of implementation. Since this thesis focuses on line connected
induction machines, additional circuitry is needed to inject the DC bias into the stator
winding. The following sections describe the chosen DC bias injection topology in more
detail.
6.4.1 Basic Circuit Topology
The basic structure of the topology makes use of an n-channel power MOSFET and an
external resistor. The external resistor (Rext) is connected across the drain and source of
the MOSFET. These components are connected in parallel and are connected between the
source and motor terminals of a single phase of the machine. Figure 6.1 shows the MOSFET
and Rext configuration when connected in line with a motor.

Chapter Six Development of the Non-Intrusive Air Gap Torque Method
Non-Intrusive Efficiency Estimation of Induction Machines 74
Figure 6.1: Steady state DC equivalent circuit for star and delta connections [43]
The MOSFET is a voltage controlled switching device. To turn the device ‘on’, the gate-
source voltage is set to a value below the threshold, (Vth) and the stator current is passed
through the induced channel. When the MOSFET is turned ‘off’, the stator current is passed
through the Rext. The internal parasitic diode provides a path for the reverse current during
this ‘off’ condition. This is shown more explicitly in Figure 6.2.
S G
D
Rext
+
Vdr
-
n+
n-
n+
p
Forward current
Reverse current
id=ias
Figure 6.2: Forward and reverse current path through a MOSFET [43]

Chapter Six Development of the Non-Intrusive Air Gap Torque Method
Non-Intrusive Efficiency Estimation of Induction Machines 75
6.4.2 Circuit Operation for Rs Estimation
The basic principle of operation of the circuitry required for estimation Rs is to inject a DC
bias. The DC bias is created by turning the MOSFET on during the positive half cycle of
stator current (ia>0), and off during the negative half cycle (ia<0). As a result of this on-off
switching, an asymmetrical resistance is created during each cycle (see Figure 6.3) and
causes an asymmetrical voltage drop across the circuit. This results in a DC voltage
component and consequently an injection of DC current into the motor windings.
Figure 6.3: Equivalent circuit with MOSFET on (a) and off (b)
Based on the DC components obtained, the value of Rs can be estimated using the principle
of Ohm’s law. A simplistic update rule for resistance determination is shown by equation
6.12
(6.12)
Equation 6.12, however, needs to take into account the type of motor configuration. In [43],
the update rule for Rs is derived under the assumption the machine is star connected. For
the purpose of this thesis, the update rule for Rs estimation was adapted accordingly, such
that this method could be applied to the delta connected machines. The derivation makes
use of line voltages and currents, since these are easily accessible from the motor control
centre. It should also be noted that the source impedance is assumed to be negligible and
that the stator windings in each phase are approximately equal. The case for star and delta
connected motors is based on Figure 6.1.
RextD S
Ia
Rext
D
Ia
S
Rds,on
(a) (b)

Chapter Six Development of the Non-Intrusive Air Gap Torque Method
Non-Intrusive Efficiency Estimation of Induction Machines 76
Star Connection
Assuming Ras=Rbs=Rcs=Rs and negligible source resistance
(6.13)
Delta Connection
Assuming Rab=Rbc=Rca=Rs and negligible source resistance
(6.14)
Based on equations 6.13 and 6.14, the values of Rs can be determined. In order to improve
the accuracy of Rs estimation, it is necessary to remove any DC offsets that may inherently
be contained prior to the estimation of Rs. These offset components are incorporated to
eliminate the effects of the DC components inherent in the mains supply and
instrumentation. Additionally, the effects of cable resistance need to be catered for [43].
Taking this into account, the amended equation used for calculating Rs is
(6.15)
In [43], it was shown that the accuracy of Rs increases with an increase in DC bias injection.
An increase in the DC bias injection can be achieved by increasing the value of Rext. The
effects of increasing Rext increases in the asymmetrical resistance during the ‘on’ and ‘off’
switching of the MOSFET. This, consequently, creates an increase in voltage asymmetry and
larger DC current component. Despite the advantage of increased accuracy for Rs
estimation, the increase in DC bias also contributes negatively to increased torque
pulsations and additional power dissipation. This will be further discussed in the
subsequent section.

Chapter Six Development of the Non-Intrusive Air Gap Torque Method
Non-Intrusive Efficiency Estimation of Induction Machines 77
6.4.3 Torque Pulsations and Power Dissipation
One of the main concerns surrounding DC signal injected Rs estimators is the level of
torque pulsations and power dissipation associated with the additional circuitry and its
connections.
Due to the signal injection of Idc, the interaction between the flux linkage and the rotor
causes a -r current component to be induced in the rotor. The effects of the interactions
between the AC and DC current components are seen to produce a distortion in the
electromagnetic torque, as derived in [43] in the stationary reference frame. The
electromagnetic torque is shown by
(6.16)
Considering each of the terms in the electromagnetic torque equation, the first term is the
torque without the DC injection, the second term being the braking torque and, lastly, the
third term is the pulsating torque.
The power loss associated with the DC injection circuit needs to be considered for the
design of circuit parameters and ratings of a heatsink. The average power dissipation of the
DC injection circuit can be seen during both the MOSFET ‘on’ and ‘off’ mode in equation
6.17 and 6.18 respectively [43]
(6.17)
(6.18)

Chapter Six Development of the Non-Intrusive Air Gap Torque Method
Non-Intrusive Efficiency Estimation of Induction Machines 78
As can be seen, the power loss due to the DC injection circuit is a function of Rext, Rds,on, Ia,dc
and the peak of ias..
Additionally, the effect of the DC injection current component contributes to the stator
copper loss in the windings of the machine and thus needs to be accounted for. The
additional power contribution to the total power for a star and delta connected motor is
shown in equation 6.19 and 6.20 respectively.
(6.19)
(6.20)
Considering the torque and power equations, it can be seen that they are highly dependent
on the level of injected DC current, Idc. Due to the negative impact, the level of torque and
power dissipation should be accounted for when designing the dc injection circuit. The
level of Idc can be controlled by the choice Rext, therefore, as stated in [43] the value of Rext
should be chosen to ensure that the levels of torque pulsation and power dissipation are
within tolerable ranges.
This method is considered to be intrusive, however once the required circuitry is installed,
it can be thought of as non-intrusive. The installation process can be performed during
motor installation or during a scheduled maintenance outage [7]. This makes the resistance
estimator a dedicated device and not of a portable nature.
6.5 Rotor Speed Estimation
The method for speed estimation required for efficiency estimation is attained using
vibration spectrum analysis. This method was chosen on the basis that it provides a simple,
non intrusive and accurate means of rotor speed estimation. As indicated in [64], vibration
analysis shows a strong signal for a wide range of loading conditions.
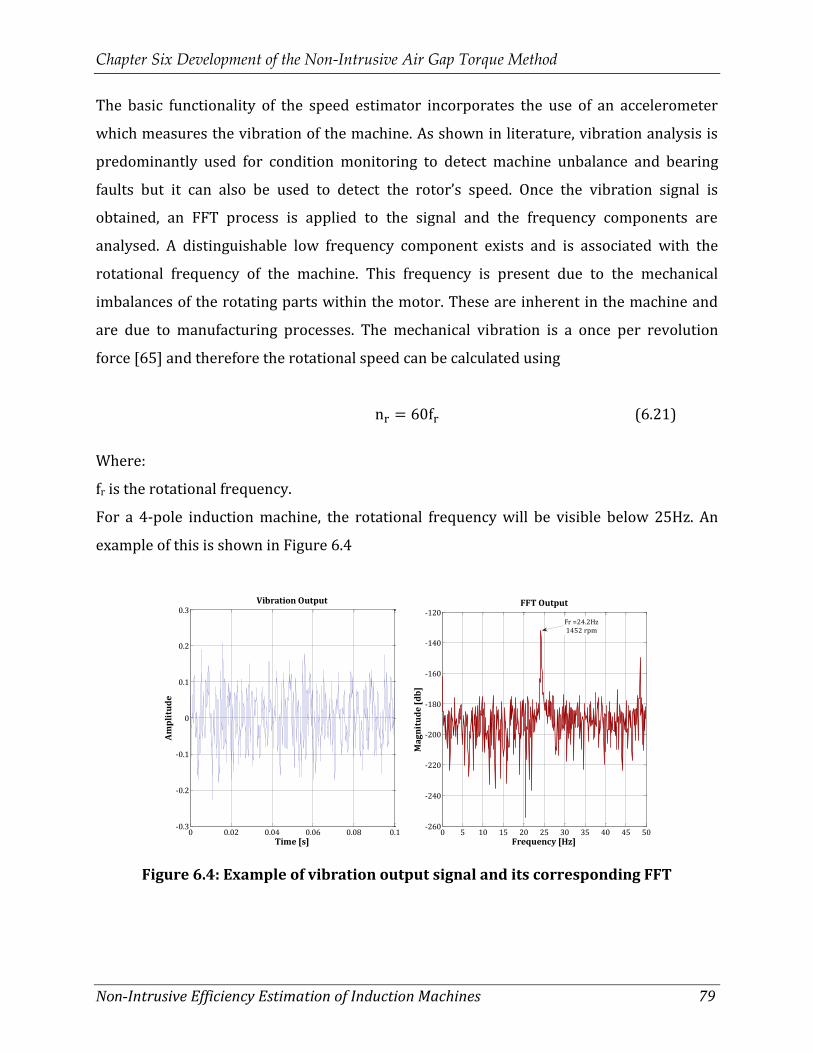
Chapter Six Development of the Non-Intrusive Air Gap Torque Method
Non-Intrusive Efficiency Estimation of Induction Machines 79
The basic functionality of the speed estimator incorporates the use of an accelerometer
which measures the vibration of the machine. As shown in literature, vibration analysis is
predominantly used for condition monitoring to detect machine unbalance and bearing
faults but it can also be used to detect the rotor’s speed. Once the vibration signal is
obtained, an FFT process is applied to the signal and the frequency components are
analysed. A distinguishable low frequency component exists and is associated with the
rotational frequency of the machine. This frequency is present due to the mechanical
imbalances of the rotating parts within the motor. These are inherent in the machine and
are due to manufacturing processes. The mechanical vibration is a once per revolution
force [65] and therefore the rotational speed can be calculated using
(6.21)
Where:
fr is the rotational frequency.
For a 4-pole induction machine, the rotational frequency will be visible below 25Hz. An
example of this is shown in Figure 6.4
Figure 6.4: Example of vibration output signal and its corresponding FFT
0 5 10 15 20 25 30 35 40 45 50-260
-240
-220
-200
-180
-160
-140
-120FFT Output
Frequency [Hz]
Ma
gn
itu
de
[d
b]
0 0.02 0.04 0.06 0.08 0.1-0.3
-0.2
-0.1
0
0.1
0.2
0.3Vibration Output
Time [s]
Am
pli
tud
e
Fr =24.2Hz1452 rpm

Chapter Six Development of the Non-Intrusive Air Gap Torque Method
Non-Intrusive Efficiency Estimation of Induction Machines 80
As shown, the rotational frequency is easily detectable and clearly shows that the
frequency component can be translated into the rotor speed.
6.6 Loss Estimation
6.6.1 No Load Losses
The no load losses consist of the friction and windage loss and the core loss and are
considered to be constant and load independent. Typically, the no-load losses are obtained
by conducting a no load test which requires the motor to be decoupled from its load and a
variable supply connected to its terminals. This is highly intrusive and difficult to perform
under field conditions when the machine is operating.
It can be argued that a no load test can also be performed before installation (for newly
acquired motors) or during scheduled maintenance downtime. However, to avoid the
interruption of already installed machines, it is required that no-load losses are estimated
according to statistical methods. The combined value for the friction and windage and core
losses can be assumed to be a fixed value of input rated power as suggested by the Ontario
Hydro Modified Method E (OHME) [28]. Initially, a factor of 3.5% was proposed but was
further revised for motors less than 50 hp (approx. 40kW). The refinement was based on
the same ratio used by the IEEE Std 112 for which the stray load losses can be estimated.
The improved empirical factor for no load loss estimation was adjusted to 4.2% of rated
input power [3]. Therefore the no load losses are calculated according to
(6.22)
Where:
k =3.5-4.2%
Additionally, 1.2% of the input power is due to the contribution of friction and windage
loss [28].

Chapter Six Development of the Non-Intrusive Air Gap Torque Method
Non-Intrusive Efficiency Estimation of Induction Machines 81
For the purpose of this thesis, a value of 3.5% of rated input power will be used to obtain
the no load losses as done in [7].
6.6.2 Stray Load Loss
The stray load losses are yet another component of the NAGT which needs to be calculated
empirically. As discussed in Chapter 2, the IEEE Std 112 and IEC Std 34-2-1 allow for the
stray load losses to be determined according to a fixed percentage of the rated output
power or according to a predefined curve. For the purpose of this thesis the IEC Std 34-2-1
method for assigned values will be used. The general equation, based on the predefined
curve for the range of motors tested (1kW<P2<10000kW) can be calculated according to
[24]
(6.23)
Where:
P1 is the input power
P2 is the rated output power
The equation depicted above is used to determine the stray load loss at rated load. At other
than rated loads, the standard assumes the value of stray load loss to vary with the square
of the rotor current (stator current minus the no load current). Since the NAGT method
aims to reduce the intrusion levels associated with efficiency testing, the no load test is to
be avoided and the no load current cannot be obtained. For the purpose of this thesis, the
stray load loss values obtained at rated conditions (according to equation 6.23) will be
used in the NAGT method for all load conditions.

Chapter Six Development of the Non-Intrusive Air Gap Torque Method
Non-Intrusive Efficiency Estimation of Induction Machines 82
6.7 Overall Non-Intrusive Air-Gap Torque Efficiency Estimation Method
Based on the above sections, the overall NAGT method can be combined as shown in Figure
6.5.
Figure 6.5: Overall NAGT procedure for efficiency estimation
Stator Resistance Estimation
(DC Signal Injection)
Voltage and Current
Air Gap Torque
(Eqn. 6.5)
Rotor Speed Estimation
(Vibration Spectrum)
Developed Mechanical Power
No Load Losses
(Eqn. 6.22)
Loss Estimation
Stray Load Losses
(Eqn. 6.23)
Output Shaft Power
Efficiency
(Eqn. 6.11)
Input Power
(Eqn. 6.9)

Chapter Six Development of the Non-Intrusive Air Gap Torque Method
Non-Intrusive Efficiency Estimation of Induction Machines 83
6.8 Concluding Remarks
This chapter presented the development of the NAGT method for efficiency estimation. A
detailed derivation of the air gap torque equation and it application to the NAGT method
was discussed. In particular, the investigation of the discrepancies in literature of whether
the core loss component is included in the equation was conducted. It was concluded that
the core loss component is not included in this equation and therefore needs to be catered
for in the overall efficiency equation.
The theory development of the candidate methods for stator resistance and rotor speed
estimation was also presented. Since the stator resistance estimation theory was based on
star connected machines, the derivation of the relevant equations for its application to
delta connected motors was performed. The theory development of the rotor speed
estimation process provided an indication to the manner in which the rotor speed can be
detected. The empirical calculations of the no load loss and stray load loss estimation were
also presented.
Based on the above, the relevant theory was combined and an overall NAGT method for
efficiency determination was established.

CHAPTER SEVEN 7 LABORATORY IMPLEMENTATION
AND METHODOLOGY
This chapter provides the laboratory implementation and methodology of the tests performed
in this thesis. A description of the circuitry design and its required setup for stator resistance
and rotor speed estimation is discussed. Furthermore, the instrumentation and measuring
devices and the relevant software implementation are suggested.

Chapter Seven: Laboratory Implementation and Methodology
Non-Intrusive Efficiency Estimation of Induction Machines 85
7.1 Introduction
The implementation and conduction of the experimental procedures forms the basic
foundation for which a hypothesis can be tested. The conduction of an experiment requires
that a defined methodological procedure and apparatus setup be followed to ensure
adequate structure, accuracy and safety.
7.2 Laboratory Setup for Induction Motor Efficiency Testing
The experiments conducted in this thesis took place in the machines laboratory at the
University of Cape Town (UCT). The laboratory is equipped with a dedicated test bed for
testing motors and contains sufficient measurement devices necessary for motor efficiency
testing. Figure 7.1 shows an example of an induction motor coupled to a dynamometer
situated on the motor test bed.
Figure 7.1: Test rig with dynamometer coupled to an induction motor
7.2.1 Specifications of Squirrel-Cage Induction Motors Tested
The motors considered for this thesis are the standard type motors with output power
ratings of 7.5kW, 11kW and 15kW. Each of these motors are four-pole, 380/400V, 50Hz

Chapter Seven: Laboratory Implementation and Methodology
Non-Intrusive Efficiency Estimation of Induction Machines 86
and are totally enclosed fan cooled (TEFC) machines. The machines are connected in a delta
configuration.
7.2.2 Motor Under Test (MUT) Setup
Various motor testing setup procedures need to be considered before the relevant tests can
be conducted. The motor setup procedures will be discussed in more detail in the
subsequent sections
Machine Alignment
In order to conduct the relevant efficiency testing it is required that each motor is set up
correctly to ensure the accuracy of the results obtained. Since the motor is coupled to a
dynamometer, adequate care was taken to ensure that the motor shaft was precisely
aligned. This was done to minimize the effects of vibration and motor eccentricities which
negatively impact the efficiency by increasing the total losses of the motor. To ensure
eminent alignment the motors were aligned using an alignment clock such that the centres
of the motor and dynamometer shafts deviated by no more than 1mm. Figure 2.7 shows the
alignment clock attached to the coupling of the induction machine.
Figure 7.2: Motor and dynamometer shafts with alignment clock

Chapter Seven: Laboratory Implementation and Methodology
Non-Intrusive Efficiency Estimation of Induction Machines 87
Furthermore, the motors were securely fastened to a set of base plates during the
alignment process in order to keep the motor in place and further reduce the effects of
vibration.
Machine Loading and Torque Calibration
The induction motor was loaded using a separately excited DC machine operating as a
generator (dynamometer) allowed for the motor to be loaded. The torque was controlled
by adjusting the armature current, since torque is proportional to armature current. The
reaction torque is then measured and displayed on a digital display via a torque transducer.
For accurate loading measurements, it was necessary to calibrate torque transducer. This
was accomplished by attaching known weights to the torque arm and adjusting the
amplification factor such that the display shows the expected torque. The expected torque
was calculated using equation 7.1
(7.1)
Where
m -is the mass of the weights applied
g = 9.796 m/s2 is the gravitational force for Cape Town
d-is the distance of the torque arm
Figure 7.3 shows the dynamometer torque arm along with the weights that are used during
the calibration process.

Chapter Seven: Laboratory Implementation and Methodology
Non-Intrusive Efficiency Estimation of Induction Machines 88
Figure 7.3: Dynamometer torque arm with weights
The calibration processes is a repetitive process that is required to ensure that linearity
and hysteresis effects are resolved. This was done by loading and unloading the calibration
arm with the calibration weights over the entire loading range and adjusting the
amplification factor accordingly.
Load Cell
A H3 200kg H961700 load cell from Load Cell Services [71] was configured in a manner
whereby a force exerted on the motor’s shaft can be converted into an electrical signal. The
signal is fed into the digital display once the amplification factor is set during the
calibration process (see section 7.2.2). The load cell has an accuracy of 0.02% of nominal
range. The load cell and its corresponding torque display is shown in Figure 7.4.

Chapter Seven: Laboratory Implementation and Methodology
Non-Intrusive Efficiency Estimation of Induction Machines 89
Figure 7.4: Load cell and digital torque display
Additional load resistors
Additional load resistors, as shown in Figure 7.5, were used in instances where additional
loading from dynamometer was required. In particular, the additional load resistors
become mandatory at the higher loading conditions for the 11kW and 15kW motors. It
should be noted that due to the limitation in the rating of the dynamometer and additional
loading resistors, only values of up to 125% of rated load can be achieved when testing the
15kW machine.
Figure 7.5: Additional load resistors

Chapter Seven: Laboratory Implementation and Methodology
Non-Intrusive Efficiency Estimation of Induction Machines 90
Motor Supply
The voltage supply to the motor was attained using the mains supply from South Africa’s
power producer, ESKOM. The voltage unbalance and total harmonic distortion (THD) was
monitored to ensure that it remained within tolerances set by the IEC Std 34-2-1 standard.
The mains supply was chosen since ESKOM’s conditions will reflect the supply to the
majority of motors out in industry, therefore the effectiveness of the NAGT method can be
tested under similar conditions.
7.2.3 Stator Resistance Estimation Circuit Setup
The resistance estimation circuit is based on the DC signal injection concept proposed in
[43]. However, some adaptations have been made and will be discussed below. A schematic
of the implemented circuitry is given in Figure 7.6.
Figure 7.6: DC injection circuit setup for stator winding resistance estimation
The actual experimental circuitry was designed, built and tested in the laboratory. The
choice of circuit components, its configuration and adaptation will be further discussed in
the following sections. The experimental circuit implementation is shown in Figure 7.7.
LM 311
Comparator Circuit
Mosfet Driver
Induction Motor
C
B
ALEM
Module
Su
pp
ly
S1
S2
vDC

Chapter Seven: Laboratory Implementation and Methodology
Non-Intrusive Efficiency Estimation of Induction Machines 91
Figure 7.7: Experimental circuitry for resistance estimation
Comparator Circuit
The comparator circuit consists of a LM311 voltage comparator [72] with the reference
(VRef) set to the positive input (pin 2). The voltage output of the current LEM module (Vin) is
then set to the negative input (pin 3). Thus, when the stator current is on its positive cycle
Vin>VRef and the output of the op-amp (pin 7) is low (OV) and the MOSFET is turned off.
When the stator current is on its negative cycle, Vin<VRef and the op-amp output is high
(15V), tuning the MOSFET on. A pull-up resistor was incorporated into the design to ensure
that a ‘high’ signal is fully ‘high’ (15V). Hysteresis resistors were also included into the
circuit to ensure that the effects of switching oscillations and the effects of noise are
eliminated.
MOSFET Driver
A Semikron SKHI 21A Hybrid dual MOSFET Driver [73] is inserted between the comparator
circuit and the MOSFET. Its advantages include built-in galvanic isolation so the secondary
output side of the chip is separate from the primary input side.
LEM Module
External Resistor (Rext)
Differential probe
Comparator circuit
MOSFET driver
Power MOSFET
NI Data acquisition device

Chapter Seven: Laboratory Implementation and Methodology
Non-Intrusive Efficiency Estimation of Induction Machines 92
Power MOSFET
The power MOSFET chosen for this thesis is the IRFP064N HEXFET® Power MOSFET [74].
The MOSFET is rated at VDSS =55V, RDS(ON)=0.008Ω , ID =100A and PD=200W. The MOSFET
was placed on a heat sink to ensure adequate dissipation of heat.
External Resistance (Rext)
An external resistor bank, consisting of four 1Ω, 50W resistors, is connected in parallel with
the MOSFET. The resistor bank contains additional wiring which allows for the resistors to
be configured in parallel or in series combinations. For the purpose of this thesis, two
resistors are connected in parallel, providing a Rext of 0.5Ω. The value of 0.5Ω was chosen to
be as large as possible, to improve accuracy when estimating Rs (as discussed in Chapter 6)
but with the consideration of the power ratings of the resistors. In the case of the larger
motors (15kW), higher stator current values flow through Rext and by connecting two
resistors in parallel, the resistors are able to share the current, thus not drastically
exceeding the power rating. The resistance estimation circuit is not used for long periods of
time, thus the resistors are able to tolerate these high currents. Additionally, the resistors
are placed on a heat sink with an external fan so that they can be kept cool during
operation. The value of Rext= 0.5Ω was used in all cases of motor testing for comparison
purposes. A differential voltage probe is connected across Rext to measure the voltage
across it.
Switching Modes
The circuit design consists of two modes, normal mode and injection mode. To differentiate
between the two modes, two switches are incorporated into the circuit design. In [43] the
resistance estimation circuitry was connected continuously in one phase of the motor. The
additional circuitry causes power dissipation, torque distortion and possible unbalanced
motor winding conditions. As shown in [43] power dissipation occurs in both normal (to a
lesser degree) and injection mode whereby it increases with increased loading conditions.
Although the overall power dissipation was low, the torque pulsations may be

Chapter Seven: Laboratory Implementation and Methodology
Non-Intrusive Efficiency Estimation of Induction Machines 93
unacceptable in some applications. Thus, a suitable value of Rext needs to be chosen to
ensure a reasonable trade off between Rs accuracy and torque pulsations.
For the purpose of this thesis, the effects of power dissipation and torque pulsations during
efficiency estimation were avoided. This was achieved by incorporating the use of two
switches. The additional circuitry is switched in only when the stator resistance estimation
is required. Thereafter, the additional circuitry is switched out so that its negative effects
do not influence the remainder of the efficiency testing procedure. Additionally it can be
argued that in order to do the relevant torque pulsation calculations (if the circuitry is not
switched out), the motors magnetising inductance, rotor resistance and rotor inductance
need to be known. To obtain these parameters the relevant blocked rotor, no load etc tests
need to be performed. Since the thesis focuses on non intrusiveness, these tests are to be
avoided.
To cater for the high current values of the larger machines, circuit breakers were used as
switches. The current ratings for each of these breakers are 125 A and 100A.
7.2.4 Accelerometer Setup for Speed Detection
To detect speed using a vibration analysis, an accelerometer was built. Due to its
availability, an ADXL202E dual axis accelerometer IC chip from Analog Devices [75] was
used. The chip was soldered onto a circuit board along with a 0.1µF decoupling capacitor
and a 5V voltage regulator.
For the purpose of this thesis, only single axis readings were used. In order to use the
analog output of the chip, the output of XFilt pin is exploited. The advantage of this method is
that the entire bandwidth range of 5kHz is available. Additionally, a 0.001µF filter capacitor
was connected to the output of the XFilt pin for filtering. Figure 7.8 shows the internal
components of the accelerometer device.

Chapter Seven: Laboratory Implementation and Methodology
Non-Intrusive Efficiency Estimation of Induction Machines 94
Figure 7.8: Internal circuitry of the accelerometer device
The entire circuit was encased inside a plastic box from which the signal is obtained from
using a BNC connector. Strong magnets were affixed to the box so that it may be attached to
the motor and held in any axial or radial position. A 9V battery may be used to power the
device, making it portable. The external construction of the device is shown in Figure 7.9.
Figure 7.9: Front and side view of the accelerometer device
After completion of the design and construction of the accelerometer device, it was tested
on an induction machine. Figure 7.10 shows the accelerometer placed on an induction
machine during the test.
Voltage Regulator
Decoupling capacitor
Accelerometer IC chip
Filter capacitor

Chapter Seven: Laboratory Implementation and Methodology
Non-Intrusive Efficiency Estimation of Induction Machines 95
Figure 7.10: Accelerometer device placed on an induction machine
7.2.5 Voltage Unbalance Setup
In order to induce voltage unbalance, a three-phase variac connected to three single phase
variacs were used. This allowed for individual voltage control in each of the three phases.
The three phase variac is rated at 64A and is used to supply the motors up to 150% of its
full load current. A schematic of the variac setup is shown in Figure 7.11. The individual
single phase variacs were configured by connecting the brush voltage (G1) to the winding
of the larger variac (G2) to allow for full control of the voltage output.

Chapter Seven: Laboratory Implementation and Methodology
Non-Intrusive Efficiency Estimation of Induction Machines 96
Vout
V1
G1
G2
Vl-n
V2
Vl-n -V1
Vout
V1
G1
G2
V2
Vl-n -V1
Vout
V1
G1
G2
V2
Vl-n -V1
Vl-n
Vl-n
L1
L2
L3
N
R
S
T
Figure 7.11: Variac configuration for implementing voltage unbalance
For the purpose of this thesis, only voltage magnitude unbalance (no phase unbalance) was
considered. The voltage magnitude unbalance conditions were calculated according to the
NEMA definition (section 2.3.3). The single phase variacs were adjusted to create 380V
average voltage conditions with 0%, 2.5% and 5% unbalance.
It should be noted that a generator was used to generate the voltage supply. This was used
in order to obtain voltage conditions greater than Eskom’s mains supply. This is necessary
when creating voltage unbalances where an individual line voltage is required to exceed
Eskom’s supply voltage while maintaining an overall average nominal voltage of 380V.

Chapter Seven: Laboratory Implementation and Methodology
Non-Intrusive Efficiency Estimation of Induction Machines 97
7.3 Data Capturing Devices and Instrumentation
The following sections will discuss the relevant data capturing devices.
7.3.1 Yokogawa WT1600 Power Analyser
A calibrated Yokogawa WT1600 Power Analyser was used to obtain the rms voltage,
current, power, speed and torque measurements. The device allows for the data to be
captured and stored during each test. The analyser was configured to a 3A3V wiring
connection. The update rate was set to 1 second. The analyser has an accuracy of 0.1%.This
is in accordance with the specifications set by the IEC Std 34-2-1.
Figure 7.12: Yokogawa WT1600 Power Analyser
7.3.2 Pico-technology Thermocouple Data Logger
To measure the effective temperature of the machine, three K-type thermocouples were
installed on the drive-end side (opposite to the cooling fan) of the stator windings of each
machine. The position of the thermocouples embedded in a motor is shown in Figure 7.13.
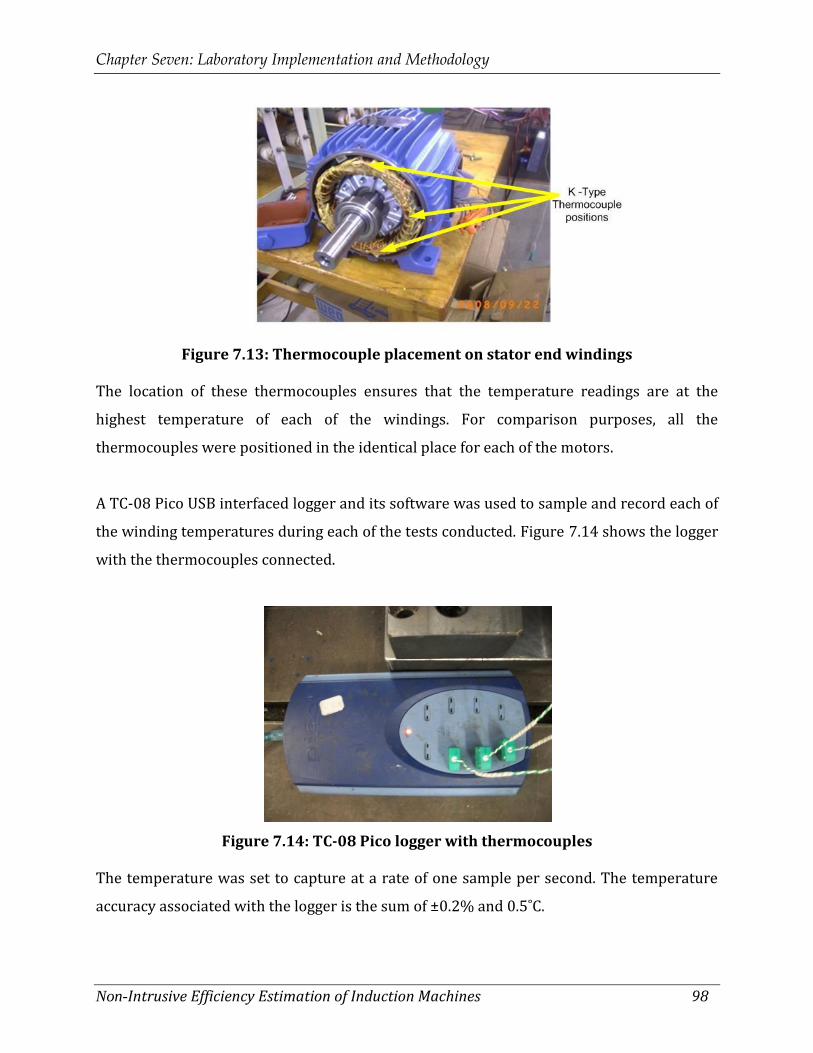
Chapter Seven: Laboratory Implementation and Methodology
Non-Intrusive Efficiency Estimation of Induction Machines 98
Figure 7.13: Thermocouple placement on stator end windings
The location of these thermocouples ensures that the temperature readings are at the
highest temperature of each of the windings. For comparison purposes, all the
thermocouples were positioned in the identical place for each of the motors.
A TC-08 Pico USB interfaced logger and its software was used to sample and record each of
the winding temperatures during each of the tests conducted. Figure 7.14 shows the logger
with the thermocouples connected.
Figure 7.14: TC-08 Pico logger with thermocouples
The temperature was set to capture at a rate of one sample per second. The temperature
accuracy associated with the logger is the sum of ±0.2% and 0.5˚C.

Chapter Seven: Laboratory Implementation and Methodology
Non-Intrusive Efficiency Estimation of Induction Machines 99
7.3.3 Stator Winding Resistance Measurement
To determine the hot and cold stator winding resistance required for the IEC 34-2-1
standard an HP 3401A Digital Multimeter [76] was used. The multimeter was configured to
measure the resistance using the four wire method. An advantage of this method is its
accuracy. This is achieved since the four wire method compensates for the resistance
associated with the measurement wires. The measurement accuracy of the multimeter is ±
0.0030% of reading + 0.0030% of range.
7.3.4 Proximity Speed Sensor
In order to compare the speed results obtained from the accelerometer device, the speed
was also measured using an inductive proximity sensor. This is mounted approximately
2mm from the shaft coupling between the motor and the DC machine.
Figure 7.15: Proximity sensor placed over shaft coupling
The proximity sensor sends a pulse to the power analyser every time a change in
inductance is detected. The coupling contains 30 metal teeth which cause a set of pulse
signals to be triggered each time one of the teeth passes the sensor. Thus, one revolution
equates to 30 pulses. An amplification factor is also necessary to ensure that the correct
speed values are obtained. The speed obtained from the proximity sensor was calibrated
Chapter Seven: Laboratory Implementation and Methodology
Non-Intrusive Efficiency Estimation of Induction Machines 100
according to a hand-held photo digital tachometer (DT-2236) from Lutron Electronic. This
tachometer has a resolution of approximately 1rpm and an accuracy of 0.05%.
An advantage of using the proximity sensor, as apposed to a hand-held tachometer, is that
the signal can be captured and recorded automatically during a test.
7.3.5 LEM Current Transducer
Three LEM modules (one per phase) were used to measure the stator currents of the
machine. These devices are known for their high precision, good linearity, low thermal
drift, galvanic isolation and robustness. The LA 55-P [77] modules were chosen to cater for
the high currents (36A rms at 125% of rated load) of the 15kW machine. They are
connected with a 1:1000 conversion ratio and operated in the 50 A rms current range. The
devices were supplied with ±15V from an external voltage supply and provides an accuracy
of ±0.65%.
7.3.6 Differential Voltage Probes
Tektronix P5200 High Voltage Differential Probes were used to measure the terminal
voltages of the motor. The range was set to an attenuation ratio of 1/500 to accommodate
voltage ranges of 380/400V. The accuracy range of these probes is ±3%.
7.3.7 National Instruments Data Acquisition Device
An NI 9215 data acquisition device was used to capture the instantaneous voltage, current
and speed signals. The device consists of two 4-channel, ±10V, 16-Bit Simultaneous Analog
Input Modules embedded in a NI CompactDAQ chassis. The data captured using the device
is then transferred to a personal computer.
The device was calibrated by adjusting all voltage and current measurements to match
closely to that of the power analyser. This was done to account for the resistance tolerances
of the measurement resistors in the LEM components. The calibration procedure was

Chapter Seven: Laboratory Implementation and Methodology
Non-Intrusive Efficiency Estimation of Induction Machines 101
achieved by a repetitive process of adjusting the gain (due to the turns ratio and
measurement resistance) of the LEM modules.
7.4 Software Implementation
The simulations and calculations for this thesis were conducted in Matlab ® 2009 and NI
Labview environments. A diagram of the Labview and Matlab Simulink models are
provided in the Appendix.
7.5 IEC Std 34-2-1 and Direct Method as a Baseline for Comparison
The IEC Std 34-2-1 is the standard used in South Africa. This standard was officially
approved by the South African Bureau of Standards (SABS) in 2008 [25]. This standard
therefore forms the premise for which the results obtained from the NAGT method can be
compared.
The procedures for efficiency testing of induction machines were followed according to the
segregated loss method. Tests required for this procedure include rated load temperature
test, variable load test and the no load test [24].
The method for which stator resistance values can be obtained was outlined in section
2.4.2. Since the motors available for testing already contained installed thermocouples, an
alternative method which uses the temperature and resistance at rated conditions was
employed. The value of rated resistance and temperature is obtained from a rated
temperature test and is used as the known resistance and known temperature values.
Using these values, the resistance at any other temperature (as measured using
thermocouples) is obtained using equation 2.19.
The direct method incorporated was simply the ratio of output power (the product of the
measured shaft torque and speed) to the input power.

Chapter Seven: Laboratory Implementation and Methodology
Non-Intrusive Efficiency Estimation of Induction Machines 102
7.6 Methodology for Efficiency Estimation Using the NAGT Method
It should be noted that the NAGT is developed to determine the efficiency of a machine,
while in operation, at a specific operating point. For the purpose of this thesis, an efficiency
curve obtained over a wide range of loads (25%-150% of rated load) for each of the
machines. This allows for the investigation into the NAGT method over a wide range of
loading conditions whereby meaningful comparisons can be made the IEC Std 34-2-1. The
procedure for the NAGT method in this thesis follows as closely as possible to the
procedures outlined by the standard. Measurements for the NAGT and IEC Std 34-2-1
methods are taken simultaneously such that the motor and supply conditions reflected in
the results are identical This allows for the reduction of methodological errors when
comparing the efficiencies obtained from measured and estimated results. However, there
are a few discrepancies which will be identified below.
The suggested procedure for the NAGT method is outlined below.
1. Run the machine until its rated temperature is achieved
Before an efficiency test is to be conducted, the machine should be run hot, until the
stator winding temperature is within 5˚C of its rated temperature (obtained from a
rated thermal test). It takes approximately 3 hours from start up for the machine
temperature to stabilise. This is within accordance to the IEC Std 34-2-1.
In field applications, however, the motor is presumed to be running and already
stabilised at its operating temperature prior to efficiency determination, and
therefore this step is not required.
2. Estimate the stator winding resistance using the additional circuitry
For the NAGT method additional circuitry is required to determine the stator
winding resistance non-intrusively. The procedure for resistance estimation is
described below

Chapter Seven: Laboratory Implementation and Methodology
Non-Intrusive Efficiency Estimation of Induction Machines 103
Initially, it is necessary to determine the DC offset inherent in the mains supply such
that compensations for these values can be made. This can be achieved by observing
the DC offsets for a few cycles and an average of these values can be obtained.
Thereafter, the resistance estimation circuit is switched in for a duration long
enough to determine the values of the DC injected signals. Using these values, the
estimated stator winding resistance can be calculated using equation 6.15. This
process is repeated for each loading condition following a similar sequence to that
of the IEC Std 34-2-1, which starts at the highest loading point and proceeds, in
equal successions, to the lowest loading condition. During the efficiency testing, the
standard requires that the measurements, at each successive loading point, are
taken as quickly, and close to rated temperature, as possible in order to reduce the
effects of changes in temperature. This means that the temperatures, and hence
resistance values, are not stabilised at each load.
Under field conditions the estimation process is slightly different as the efficiency is
only measured once i.e. at the machine’s operating condition. It is assumed that the
machine has been running under this condition for a long period of time, and
suggests that the machine temperatures (and hence resistances) are stabilised.
3. Determine the air gap torque, input power and rotor speed
At each loading condition, obtain the instantaneous voltage and current signals
using the NI 9125 device. The measurements are fed into an NI LabView model and
the air gap torque is calculated according to equation 6.5. Simultaneously, the input
power is calculated according to equation 6.9.
The sample rate was set to 10kHz. This provides high precision when sampling the
required voltage and current signal. The increased sample rate also supports the
accuracy of the dt increments in the integration process.
The speed obtained from the vibration signal of the accelerometer is also captured
simultaneously with the voltage and currents. However, since the speed requires a

Chapter Seven: Laboratory Implementation and Methodology
Non-Intrusive Efficiency Estimation of Induction Machines 104
FFT procedure, the length of the signal data becomes important. In order to obtain a
sufficient resolution to determine the rotational frequency (fr<30 Hz for a 4 pole
machine), it was necessary to set the capture time to at least 10 seconds (100k
samples). This provides a frequency resolution of 0.1 Hz
According to the standard, allowing a ten second capture time between each
successive loading point is considered too long, especially at over rated conditions.
However, if sufficiently accurate speed results are to be obtained this cannot be
avoided. Since the measurements recorded for both the NAGT and IEC Std 34-2-1
are captured simultaneously, the effects of the lengthier capture time will be
reflected in both efficiency curves. Under field conditions, however, this would not
be problematic. Since only one load condition i.e. the operating condition, is being
observed. Thus, lengthier acquisition times may be attained if the machine is
running under steady state conditions.
4. Use empirical estimation to obtain the no load and stray load losses
The combined no load losses are then calculated empirically at 3.5% of rated input
power. The stray load losses are estimated according to equation 6.23.
5. Determine the motor’s efficiency
After completion of the above steps, the efficiency of the motor at each loading point
is obtained using equation 6.11.
6. Compare results with IEC Std 34-2-1 standard and direct method
The results obtained from the NAGT method are then compared to the results
obtained from the IEC Std 34-2-1. The results are then analysed and discussed.
Conclusions are drawn based on these results and recommendations are then
proposed.

Chapter Seven: Laboratory Implementation and Methodology
Non-Intrusive Efficiency Estimation of Induction Machines 105
7.7 Methodology for Obtaining Efficiency during Voltage Unbalance
Traditionally, motor efficiency testing is conducted in laboratory conditions where the
supply conditions can be monitored and adjusted to ensure that they are within
specifications set by the motor testing standard. Due to these restrictions, the original test
procedure is no longer applicable during unbalanced conditions. Therefore, in order to
investigate the effect of voltage unbalance on the motor efficiency an appropriate test
procedure needs to be defined.
There are two main areas of concern that become apparent during unbalanced conditions
and these need to be clarified before the efficiency test can be performed. Firstly, the rated
temperature of the machine is unknown. During unbalanced supply conditions, the motor
cannot be left to stabilise as the increased temperatures associated with voltage unbalance
may cause the motor to burn out or be permanently damaged. Secondly, since the IEC Std
34-2-1 is no longer applicable during unbalance conditions, the individual loss components
cannot be calculated accordingly.
Therefore, in order to maintain some degree of conformity, the efficiency test will initially
be conducted at the rated temperature established during balanced operation. The direct
method (Pout/Pin) is to calculate the motor efficiency since it avoids the calculations of the
individual loss components. The values obtained from this method forms the premise to
which efficiency values obtained using the NAGT method can be compared.
The unbalanced conditions were implemented by adjusting the voltage from the individual
single phase variacs (see Figure 7.11) such that the degree of required voltage unbalances
is attained. The unbalance cases considered for this thesis were 2.5% and 5% voltage
unbalance with an average nominal voltage of 380V and calculated according to the NEMA
definition. The NEMA definition was adopted in this case because of its simplicity to
calculate and implement.

Chapter Seven: Laboratory Implementation and Methodology
Non-Intrusive Efficiency Estimation of Induction Machines 106
7.8 Concluding Remarks
This chapter presented the laboratory setup and instrumentation required for motor
efficiency testing. A detailed description of the motor installation, alignment, and
calibration processes was provided. Furthermore, the chapter presented the design and
implementation of the stator resistance estimation circuit and accelerometer device.
Additionally, a detailed methodological procedure of how the experiments were conducted
is also provided.

CHAPTER EIGHT 8 ANALYSIS AND VERIFICATION
OF RESULTS
The results of the laboratory experiments are presented in this chapter. Initially, the
development of the equivalent circuit for the 11kW machine is presented. Thereafter, the
results for the stator resistance, rotor speed and loss estimation is provided. Based on these
results, the final efficiency values are shown and a comparative analysis performed. The
results of efficiency during unbalanced conditions are also presented.

Chapter Eight Analysis and Verification of Results
Non-Intrusive Efficiency Estimation of Induction Machines 108
8.1 Introduction
The subsequent sections will present the results of the experimental tests conducted. The
focus of the experiments is aimed at the 11kW motor, however similar tests were
performed on the 7.5kW and 15kW motors and serve to validate and/or compare whether
the suggested estimation methods are applicable for different motor sizes.
8.2 Equivalent Circuit Parameters of the 11kW Induction Motor The machine parameters were determined to develop a model in MATLAB Simulink. This
model served to characterise the performance of the motor under ideal supply conditions.
8.2.1 No Load Test
The no load test was performed by applying rated voltage to the stator windings while
decoupling the rotor from any mechanical load. The test provides information about the
exciting current and rotational losses of the machine [1]. The results obtained from the no
load test can be seen in Table 8.1. The rated conditions (blue) are used to obtain the
equivalent circuit parameters while all the data is used to obtain the no load losses
required to determine the motor’s efficiency.
Table 8.1 Results obtained from the no load test
Voltage [V]
Current [A]
Pinput
[W] Pno load loss
[W] PFW
[W] PCore
[W]
450.93 16.97 1504.75 1162.56 80.29 1082.27
424.68 13.71 1090.78 867.11 80.29 786.82
381.01 9.81 659.72 545.26 80.29 464.97
292.10 6.17 341.27 295.98 80.29 215.69
188.45 3.87 183.86 166.08 80.29 85.79
86.08 1.94 105.60 101.13 80.29 20.84

Chapter Eight Analysis and Verification of Results
Non-Intrusive Efficiency Estimation of Induction Machines 109
8.2.2 Locked Rotor Test
The blocked rotor test was performed by locking the rotor into a stationary position and
applying rated current to the stator windings. This test provides information regarding the
leakage impedances of the machine [1]. The results for the locked rotor test are shown in
Table 8.2.
Table 8.2 Results obtained from the locked rotor test
Voltage [V]
Current [A]
Pinput
[W]
89.95 22.26 1557.01
8.2.3 Developed Equivalent Circuit
Based on the no load and locked rotor tests described in the previous sections, the
equivalent circuit parameters for the induction machine can be obtained. The calculations
involve an iterative process in which the values converge to a fixed value. A per phase
equivalent circuit with its parameters is shown in Figure 8.1.
Figure 8.1: Equivalent circuit parameters of the 11kW induction machine
Rr(1-s)
s
Rs= 1.3W jXr= 3.87W
Vs
IsjXs =2.59W
jXm=65.05WRfe=866.06W
Rr=1.7WIr

Chapter Eight Analysis and Verification of Results
Non-Intrusive Efficiency Estimation of Induction Machines 110
8.3 Stator Resistance Estimation
The proposed procedure for stator winding estimation was validated by both simulation
and laboratory experimentation. The following graphs show a comparison of the simulated
(see Appendix X) and experimental results of the 11kW motor obtained under rated load
conditions with the external resistance (Rext) set to 0.5Ω. As described in Chapter 6, the
effect of the resistance estimation circuit is to inject DC components into the stator winding
of the machine. The asymmetrical resistance obtained from the on-off switching effect of
the MOSFET (in parallel with Rext ) is evident and is clearly shown by the corresponding
asymmetrical voltage drop. The asymmetrical voltage waveform measured across Rext and
its effect on the stator current, Ia, is shown in Figure 8.2. The resulting DC components
created by the injection are also indicated.
Figure 8.2: Waveforms of VRext and Ia during injection mode
As shown in the above figure, the experimental results obtained follow the same trends
obtained from the simulation. The DC components injected into the stator winding are used
to calculate the stator winding resistance according to equation 6.15. For completeness, the
cable resistance was also accounted for and was measured to be 0.06Ω.For the purpose of
0 0.01 0.02 0.03 0.04 0.05-5
0
5
10
15
Experimental Results
Vo
lta
ge
[V
]
Vdc
0 0.01 0.02 0.03 0.04 0.05-50
-40-30-20-10
01020304050
Time [s]
Ia [
A]
Ia,dc
0 0.01 0.02 0.03 0.04 0.05-5
0
5
10
15
Vo
lta
ge
[V
]
Simulated Results
Vdc
0 0.01 0.02 0.03 0.04 0.05-50-40-30-20-10
01020304050
Time [s]
Ia [
A]
Ia,dc
Chapter Eight Analysis and Verification of Results
Non-Intrusive Efficiency Estimation of Induction Machines 111
this thesis, the resistance values obtained from the estimation procedure are further
corrected to a reference temperature of 25˚C according to equation 8.1 [24].
(8.1)
Where
k is the temperature correction factor
c is the inlet coolant temperature
w is the winding temperature
This was done to allow for a more meaningful comparison of losses obtained according to
the IEC Std 34-2-1. The efficiencies obtained from this standard are quoted at a reference
value of 25˚C; therefore efficiencies quoted from the NAGT method should also be referred
to this temperature if a direct comparison is to be made.
The resulting measured and estimated resistance values for each motor at the respective
loads are shown below. Also indicated, are the average voltage and current offset values
obtained during normal (non injection) mode.
8.3.1 11kW Motor Results
The average resistance results obtained for the 11kW motor is shown in Table 8.3.

Chapter Eight Analysis and Verification of Results
Non-Intrusive Efficiency Estimation of Induction Machines 112
Table 8.3 Estimated stator resistance results for the 11kW motor
Load [%]
Vdc,offset [V]
Idc,offset [A]
Estimated Rs [Ω]
Expected Rs [Ω]
Relative Error [%]
150 0.540 -0.100 1.359 1.326 2.453
125 0.673 -0.108 1.405 1.363 3.063
100 0.494 -0.097 1.416 1.367 3.574
75 0.571 -0.097 1.379 1.348 2.272
50 0.596 -0.096 1.345 1.319 2.026
25 0.598 -0.092 1.347 1.304 3.319
As can be seen, the estimated resistance deviates from the expected results with a
maximum of 0.049Ω (3.57% error) at 100% load and a minimum of 0.027Ω (2.03% error)
at 50% load. In all loading cases the estimated Rs values are over estimated in comparison
to the expected values.
8.3.2 15kW Motor Results
For the case of the 15kW motor, the estimated and expected the stator resistance values
can be seen in Table 8.4.
Table 8.4 Estimated stator resistance results for the 15kW motor
Load [%]
Vdc,offset
[V] Idc,offset
[A] Estimated Rs
[Ω] Expected Rs
[Ω] Relative Error
[%]
125 0.893 -0.144 0.936 0.930 0.688
100 0.847 -0.154 0.948 0.925 2.506
75 0.992 -0.125 0.929 0.917 1.324
50 0.815 -0.121 0.923 0.910 1.416
25 0.803 -0.116 0.910 0.895 1.616
As seen above, the estimated Rs values show an over estimate in comparison to the
expected Rs values. The maximum and minimum deviations are 0.023Ω (2.51% error) and
0.006Ω (0.68% error) and occur at 100% and 125% load respectively.
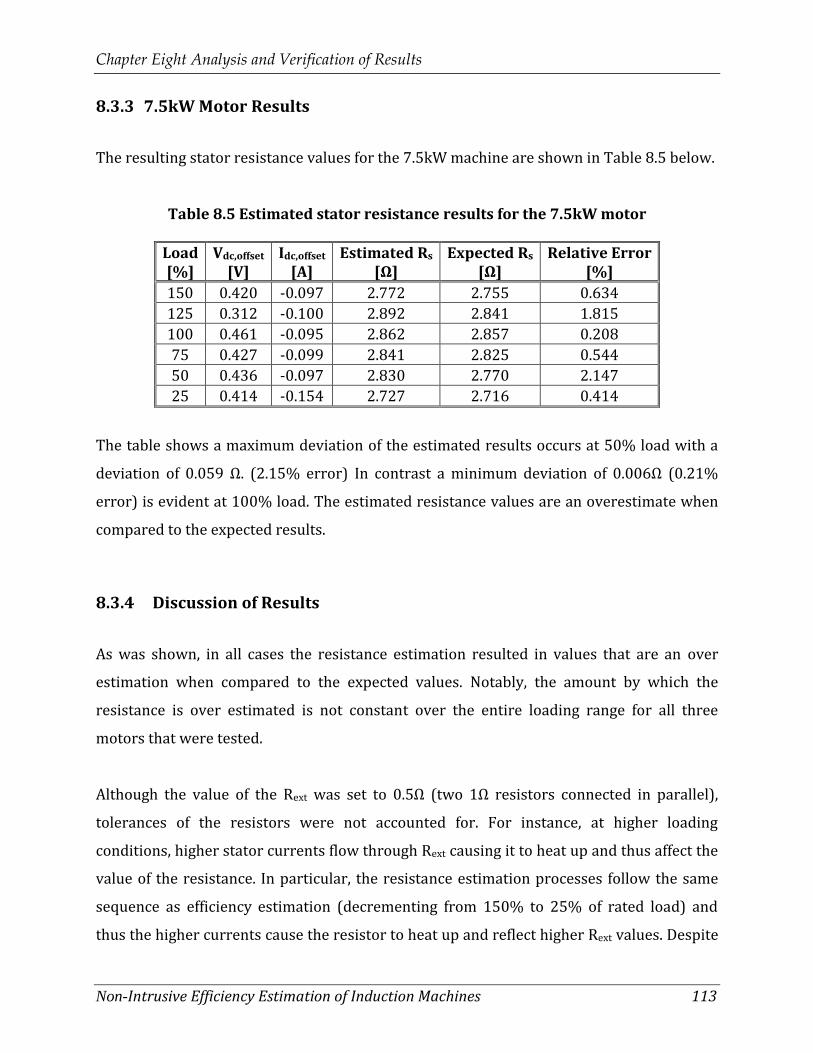
Chapter Eight Analysis and Verification of Results
Non-Intrusive Efficiency Estimation of Induction Machines 113
8.3.3 7.5kW Motor Results
The resulting stator resistance values for the 7.5kW machine are shown in Table 8.5 below.
Table 8.5 Estimated stator resistance results for the 7.5kW motor
Load [%]
Vdc,offset
[V] Idc,offset
[A] Estimated Rs
[Ω] Expected Rs
[Ω] Relative Error
[%]
150 0.420 -0.097 2.772 2.755 0.634
125 0.312 -0.100 2.892 2.841 1.815
100 0.461 -0.095 2.862 2.857 0.208
75 0.427 -0.099 2.841 2.825 0.544
50 0.436 -0.097 2.830 2.770 2.147
25 0.414 -0.154 2.727 2.716 0.414
The table shows a maximum deviation of the estimated results occurs at 50% load with a
deviation of 0.059 Ω. (2.15% error) In contrast a minimum deviation of 0.006Ω (0.21%
error) is evident at 100% load. The estimated resistance values are an overestimate when
compared to the expected results.
8.3.4 Discussion of Results
As was shown, in all cases the resistance estimation resulted in values that are an over
estimation when compared to the expected values. Notably, the amount by which the
resistance is over estimated is not constant over the entire loading range for all three
motors that were tested.
Although the value of the Rext was set to 0.5Ω (two 1Ω resistors connected in parallel),
tolerances of the resistors were not accounted for. For instance, at higher loading
conditions, higher stator currents flow through Rext causing it to heat up and thus affect the
value of the resistance. In particular, the resistance estimation processes follow the same
sequence as efficiency estimation (decrementing from 150% to 25% of rated load) and
thus the higher currents cause the resistor to heat up and reflect higher Rext values. Despite
Chapter Eight Analysis and Verification of Results
Non-Intrusive Efficiency Estimation of Induction Machines 114
the fact that Rext is placed on a resistor bank with a fan, the resistors still reach high
temperatures. Therefore, the effects of the higher currents heating up the resistors will
consequently impact the resistor value during lower loading conditions. Additionally, the
length of time the injection circuit is ‘switched’ is also a contributing factor to the heating of
the resistor.
Another point to consider is that the stator winding temperature has not stabilized at each
loading condition. This is not feasible since it takes a long time for the temperature to settle
at a loading point (approximately. three hours) and during over loaded conditions, this may
cause the motor to overheat and fail. The results indicate that the estimated Rs values
follow closely with changes in loading conditions (and hence changes in temperature). For
the case of all three motors, the resistance values are higher around the rated loading
points for both the measured and expected resistances. This can be attributed to the
methodology of the tests conducted. The IEC Std 34-2-1 requires that the sequence for
which the load test is conducted, occur from the higher loading condition down to the
lowest condition. Initially the machine is run until its rated hot stator winding temperature
is stabilised. Thereafter, the machines load is increased to the highest loading point within
a short period of time. Thereafter, the machine is left to run at this loading condition long
enough for sufficient data to be captured. Due to the nature of the NAGT method, the
required length of time between each consecutive load was 10 seconds. The effect of this at
the higher load is to increase the stator winding temperatures. Thus, even when the
succeeding loading point is set, the effects of the increased temperature is still apparent
and the stator winding resistance measured at this temperature indicate higher values.
This conforms to the results obtained in [43] where the authors investigated the effects of
Rs estimation during abnormal cooling conditions. The authors showed that the Rs
estimation trends followed closely to the changes in temperature. It is assumed, however,
that in industrial applications the machine is running at its stabilized operating
temperature and therefore at its stabilized stator winding resistance.

Chapter Eight Analysis and Verification of Results
Non-Intrusive Efficiency Estimation of Induction Machines 115
8.4 Speed Estimation
The speed estimation process requires the FFT of the vibration signal obtained from the
accelerometer device. Based on the relevant literature, a frequency component related to
the rotational frequency of the machine becomes prominent in the lower frequency range
(below 30Hz) for a 4 pole machine. The voltage output of the accelerometer device (with
the DC offset removed) and its FFT for the 11 kW motor, at rated condition, is shown in
Figure 8.3.
Figure 8.3: Vibration signal and frequency spectrum under rated conditions
As shown in Figure 8.3, the rotational frequency component is very dominant at 24.2Hz,
which is below 30Hz. This makes using the vibration spectrum a simple method to use in
situations where the motor speed is to be detected non-intrusively.
8.4.1 Speed Detection with Variation in Load
The changes in frequency of the rotational component are clearly depicted with variation of
load and hence, the rotor speed. As the loading increases, so the frequency component
shifts leftward to a lower frequency position i.e. lower frequency indicates a lower speed.
0 5 10 15 20 25 30 35 40 45 50-260
-240
-220
-200
-180
-160
-140
-120FFT Output
Frequency [Hz]
Ma
gn
itu
de
[d
b]
0 0.02 0.04 0.06 0.08 0.1-0.3
-0.2
-0.1
0
0.1
0.2
0.3Vibration Output
Time [s]
Am
pli
tud
e
Fr =24.2Hz1452 rpm

Chapter Eight Analysis and Verification of Results
Non-Intrusive Efficiency Estimation of Induction Machines 116
This variation of rotational frequency with changes in loading conditions is shown in Figure
8.4.
Figure 8.4: Variation of rotational frequency (Fr) with load
As shown above, the amplitude of the frequency component is not affected by the changes
in speed and still remains dominant in the lower frequency ranges. Thus, the ability to
detect this component is not affected by load (hence speed) and is detectable over the
entire load/speed range.
The rotational frequencies and corresponding speed estimations for each of the motors at
various loads will be shown in the subsequent sections. The accuracy of the estimated
speeds will be assessed according to the measured speeds obtained from the proximity
speed sensor and power analyser.
20 21 22 23 24 25 26 27 28 29 30-260
-240
-220
-200
-180
-160
-140
-120
-100
Frequency [Hz]
Ma
gn
itu
de
[d
b]
50% load
100% load150% load
Fr=24.71482 rpm
Fr=24.21452 rpm
Fr=23.61416 rpm

Chapter Eight Analysis and Verification of Results
Non-Intrusive Efficiency Estimation of Induction Machines 117
8.4.2 11kW Motor Results
The rotational frequency and corresponding estimated speed for the 11kW motor is shown
in Table 8.6 below.
Table 8.6 Speed estimation results for the 11kW motor
Load [%]
Frot
[Hz] Estimated Speed
[rpm] Measured Speed
[rpm] Relative Error
[%]
150 23.6 1416 1417.2 -0.085
125 23.9 1434 1435.8 -0.125
100 24.2 1452 1449.8 0.152
75 24.4 1464 1465.7 -0.116
50 24.7 1482 1481.2 0.054
25 24.8 1488 1490.3 -0.154
As can be seen, the estimated speed values are closely related to the measured speed
values. The maximum deviation of estimated speed is 2.3rpm (0.15% error) which occurs
at 25% load while a minimum deviation of 0.8rpm (0.05% error) occurs at 50% load.
8.4.3 15kW Motor Results
The estimated and measured speed results, for the 15kW motor, is shown in Table 8.7
below.
Table 8.7 Speed estimation results for the 15kW motor
Load [%]
Frot
[Hz] Estimated Speed
[rpm] Measured Speed
[rpm] Relative Error
[%]
125 23.8 1428 1429.0 -0.069
100 24.1 1446 1446.1 -0.008
75 24.4 1464 1462.4 0.107
50 24.6 1476 1476.3 -0.023
25 24.8 1488 1490.4 -0.162
As shown above, the deviation of estimated speed from measured speed ranges between
0.12rpm (0.008% error) and 2.42rpm (0.16% error).

Chapter Eight Analysis and Verification of Results
Non-Intrusive Efficiency Estimation of Induction Machines 118
8.4.4 7.5 kW Motor Results
The corresponding estimated and measured speed results for the 7.5kW motor is indicated
in Table 8.8.
Table 8.8 Speed estimation results for the 7.5kW motor
Load [%]
Frot
[Hz] Estimated Speed
[rpm] Measured Speed
[rpm] Relative Error
[%]
150 23.6 1416 1415.2 0.058
125 23.9 1434 1432.3 0.117
100 24.1 1446 1448.1 -0.145
75 24.4 1464 1462.4 0.113
50 24.6 1476 1476.6 -0.039
25 24.8 1488 1489.8 -0.123
Based on the above, the estimated speed results are within 0.6rpm (0.038% error) and
2.1rpm (0.145% error) when compared to the measured speed results.
8.4.5 The Effects of Frequency Resolution on Speed Detection
As mentioned in Chapter 6, in order to obtain an efficiency curve, it is required to conduct
the experiment as quickly as possible. This causes a limitation on the length of data
captured at any given load point. In this thesis, a sample length of 10 seconds at each
loading point was used. With the sampling rate set at 10 kHz, the accuracy of the rotational
frequency is limited to a frequency resolution of 0.1 Hz. This translates to a possible (not
definite) deviation of ±6 rpm when calculating the rotor speed. For comparison purposes,
capturing the vibration data for 60 seconds will provide an improved frequency resolution
of 0.0166 Hz. This resolution translates to a possible deviation of ±1 rpm. Figure 8.5 shows
the difference the vibration spectrum for an 11 kW motor operating at rated load. The case
for a frequency resolution of 0.1 Hz (10 seconds) and 0.0166 Hz (60 seconds) is provided.

Chapter Eight Analysis and Verification of Results
Non-Intrusive Efficiency Estimation of Induction Machines 119
Figure 8.5: Differences in frequency resolution for speed detection
For the case above the difference in speed is 1.8rpm and shows the effect of frequency
resolution in determining the accuracy of the speed.
Despite the fact that it is possible to obtain discrepancies of up to ±6 rpm using a frequency
resolution of 0.1Hz, this was not the case for results obtained during testing.
8.4.6 Discussion of Results
Based on the results obtained in the previous sections, the resulting estimated speed shows
a close relation to the expected measured results.
It is clearly evident that the rotational frequency is highly proportional to the speed and is
indicated by the changes in frequency for each of the loading conditions. Notably, the
accuracy of the speed results obtained using the vibration spectrum is not affected by the
load. This has a significant advantage over other detection methods discussed in literature
for which the accuracy of speed detection degrades at low speed operations.
The vibration signals provided conclusive results for all three motors, and hence the
accelerometer device can be used for a range of motor sizes. The corresponding rotational
frequencies range from 23.6 Hz to 24.8 Hz over the load range for each of the motors. This
23.8 23.9 24 24.1 24.2 24.3 24.4 24.5 24.6-260
-240
-220
-200
-180
-160
-140
-120Frequency Resolution: 0.1 Hz
Frequency [Hz]
Ma
gn
itu
de
[d
b]
23.8 23.9 24 24.1 24.2 24.3 24.4 24.5 24.6-260
-240
-220
-200
-180
-160
-140
-120Frequency Resolution: 0.0166 Hz
Frequency [Hz]
Fr=24.2 Hz1452 rpm
Fr =24.23 Hz1453.8 rpm

Chapter Eight Analysis and Verification of Results
Non-Intrusive Efficiency Estimation of Induction Machines 120
is expected since all three motors are 4 pole machines and their corresponding operating
speed ranges will be the same.
It should be noted that the results shown above are only indicative of a vibration spectrum
obtained in the X-axis (radial) direction. Additionally, the accelerometer was placed on the
top position of the machine (Figure 7.10). The accelerometer was placed in the same
position for each of the tests conducted to ensure consistency when comparing results.
Thus, no investigation of the effects of accelerometer position and orientation was
conducted. Thus, possible improvements in speed estimation may alternatively be
obtained.

Chapter Eight Analysis and Verification of Results
Non-Intrusive Efficiency Estimation of Induction Machines 121
8.5 No Load Loss Estimation
The no load losses are the constant, load independent losses associated with the motor. The
IEC Std 34-2-1 calculated values are obtained from the conduction of a no load test and
provide a basis for which the empirically estimated values can be compared. As described
in Chapter 6, the estimated no load loss amounts to 3.5% of input power at rated load.
Furthermore, the estimated friction and windage loss is assumed to be 1.2% of the rated
output power. The experimental and estimated results for each of the motors are shown in
the succeeding sections.
8.5.1 11kW Motor Results
The corresponding estimated and calculated no load losses for the 11 kW motor are shown
in Figure 8.6 below.
Figure 8.6: Core and friction and windage losses for the 11kW motor Considering the core loss, the calculated values exceed the estimated values by
approximately 150W at 25% load down to 40W at 150% load. In the case of the friction
and windage loss, the estimated loss is greater than the actual values obtained, indicating
an over estimate of approximately 52W.
20 40 60 80 100 120 140 160300
320
340
360
380
400
420
440
460
480Core Loss
Load [%]
Pco
re [
W]
IEC Std 34-2-1
Estimated
20 40 60 80 100 120 140 16070
80
90
100
110
120
130
140
150
160Friction and Windage Loss
Load [%]
Pfw
[W
]
IEC Std 34-2-1
Estimated

Chapter Eight Analysis and Verification of Results
Non-Intrusive Efficiency Estimation of Induction Machines 122
The combined estimated and calculated no load loss results are shown in Figure: 8.7 below.
Figure: 8.7: Total no load losses for the 11kW motor
Based on the graph, the total measured no load loss values are greater than its estimated
counterpart for loading conditions from 25% to 138% of rated load. After the intersection
of the curves at 138% load (approx. 455W), the estimated values exceed the calculated
values.
8.5.2 15kW Motor Results
The core and friction and windage loss for the 15kW motor is shown in Figure 8.8.
Figure 8.8: Core and friction and windage losses for the 15kW motor
20 40 60 80 100 120 140 160440
460
480
500
520
540
560Total No Load Losses
Load [%]
PN
LL
[W
]
IEC Std 34-2-1
Estimated
0 10 20 30 40 50 60 70 80 90 100110120130140300
350
400
450
500
550
600
650
700
750
800Core Loss
Load [%]
Pco
re [
W]
IEC Std 34-2-1
Estimated
0 10 20 30 40 50 60 70 80 90 1001101201301400
25
50
75
100
125
150
175
200
225
250Friction and Windage Loss
Load [%]
Pfw
[W
]
IEC Std 34-2-1
Estimated

Chapter Eight Analysis and Verification of Results
Non-Intrusive Efficiency Estimation of Induction Machines 123
The overall estimated core loss values show an underestimate in comparison to that of the
calculated values. Considering the extreme cases, the calculated values exceed the
estimated values by approximately 300W at 25% load and 185W at 150% load.
Considering the friction and windage losses, the estimated values exceed the actual
calculated values by approximately 120W.
Taking into account the total combined no load losses, the resulting estimated and
calculated results are shown in Figure 8.9.
Figure 8.9: Total no load losses for the 15kW motor
As can be seen, the overall calculated no load loss values are higher than that of the
estimated values, indicating that the overall estimation of no load losses is, in fact, an
underestimate. Although the graphs do not intersect, as only values up to 125% load are
indicated, it is expected that an interception will occur at higher ranges of loading by
following the trend of the plots and extrapolation procedures.
8.5.3 7.5kW Motor Results
The results of the core loss and friction and windage loss for the 7.5kW motor is provided
in Figure 8.10.
20 30 40 50 60 70 80 90 100 110 120 130 140600
620
640
660
680
700
720
740
760
780
800Total No Load Losses
Load [%]
Pn
ll [
W]
IEC Std 34-2-1
Estimated

Chapter Eight Analysis and Verification of Results
Non-Intrusive Efficiency Estimation of Induction Machines 124
Figure 8.10: Core and friction and windage losses for the 7.5 kW motor
Considering the core loss component, the estimated results show an under estimated for
the lower load operating points. The calculated results equal the estimated values at
approximately 34% of rated load. Thereafter, the estimated results show an over estimate
in comparison to the calculated results.
In the case of the friction and windage loss, the estimated results are over estimated by
approximately 53 W. The total combined no load loss is shown in Figure 8.11 below
Figure 8.11: Total no load losses for the 7.5 kW motor
20 30 40 50 60 70 80 90100110120130140150160140
160
180
200
220
240
260Core Loss
Load [%]
Pco
re [
W]
IEC Std 34-2-1
Estimated
20 30 40 50 60 70 80 901001101201301401501600
10
20
30
40
50
60
70
80
90
100
110
120Friction and Windage Loss
Load [%]
Pfw
[W
]
IEC Std 34-2-1
Estimated
20 30 40 50 60 70 80 90 100 110 120 130 140 150 160150
175
200
225
250
275
300
325
350Total No Load Losses
Load [%]
Pn
ll [
W]
IEC Std 34-2-1
Estimated

Chapter Eight Analysis and Verification of Results
Non-Intrusive Efficiency Estimation of Induction Machines 125
The overall combined estimated no load losses display an over estimate in comparison to
the calculated values for the entire loading range. The degree of over estimation increases
with an increase in load.
8.5.4 Discussion of Results
Based on the results provided, there is a general under estimation of core losses with an
over estimation in friction and windage loss. Considering the total combination of the no
load losses, the estimated values show an under estimate for the larger 11kW and 15kW
motors. In contrast the estimated values display an over estimate in no load values for the
7.5kW motor. Consideration of this 7.5kW motor and observations of its core loss
component, the estimated value amounts to an over estimate in comparison to the values
obtained from the IEC Std 34-2-1. This applies to the load range above 30%. In addition,
estimated friction and windage loss is also an over estimate. Consequently, the total no load
loss represents the combination of these components and thus the over estimate in
empirical values is emphasised. Additionally, the over estimate and under estimate
conditions of the total no load loss estimation for each of the motors can be explained by
considering the distribution of loss components. The total percentage of losses relative to
the input power for the IEC Std 34-2-1 calculated results for each motor at rated load, is
shown in Figure 8.12.
Figure 8.12: Loss distribution for each motor at rated condition
85.99%
5.7%
2.91%
3.11%
1.62%0.62%
11 kW
86.64%
5.01%
3.1%
3.6%
1.1%0.38%
15 kW
85.62%
7.3%
3.07%
2.02%
1.533%0.42%
7.5 kW
Output Power Stator Copper Loss Core Loss Rotor copper Loss Stray Load Loss Friction and Windage Loss

Chapter Eight Analysis and Verification of Results
Non-Intrusive Efficiency Estimation of Induction Machines 126
As depicted, the combined friction and windage loss and core loss for the 11kW and 15kW
motors, amounts to 3.73% and 3.98% of rated input power respectively. Consequently, the
empirically estimate of 3.5% of input power indicates an under estimate. For the 7.5kW
motor however, the total no load loss contribution is 2.44% of input power. This is a lower
value than the empirical 3.5% of input power and therefore, the empirical values provide
on over estimate of no load losses. This suggests the questionability of the estimation of no
load loss for smaller sized motors.
In general, the no load losses are considered to be constant, load independent losses. Based
on the results shown in the previous section, it is evident that the IEC Std 34-2-1 calculated
core losses are not constant over the load range, but rather decreases with an increase in
load. As mentioned in Chapter 2, the IEC Std 34-2-1 compensates for the resistive voltage
drop across the stator winding using equation 2.20, effectively relating the core loss to the
induced stator voltage, Ur, which decreases with an increase in load. This can further be
explained by considering, the simplified equivalent circuit model of an induction machine
shown in Figure 8.13 where Ur is the voltage that appears across the machine’s core.
Figure 8.13: Simplified equivalent circuit of an induction machine
As the load increases, so the value of the stator resistive voltage drop increases due to the
increase in stator current. As a consequence, the value of Ur decreases with this increase in
load. This shows that the core loss obtained at lower loads is higher than that obtained at
the higher loading conditions. The variation in core loss over the load range suggests that it
is load dependant, i.e. not load independent as expected. For investigation purposes, the
maximum variation of core loss for each motor over the load range is shown in Table 8.9.
IsRs
Vs
Is
jXmRfe
Ur

Chapter Eight Analysis and Verification of Results
Non-Intrusive Efficiency Estimation of Induction Machines 127
Table 8.9 Maximum variation of core loss over load range
Load [%]
Core Loss [W]
15kW 11kW 7.5kW
150/125 % 720 470 225
25 % 620 360 160
Max. Variation 100 110 65
As shown, the variation in maximum and minimum core loss is 100W, 110W and 65W for
the 15kW, 11kW and 7.5kW motors respectively.
8.6 Stray Load Losses
The stray load losses (SLL) account for the remaining losses in the machine. As mentioned
in Chapter 2, SLLs, according to the IEC Std 34-2-1, is calculated by subtracting the output
power and all the losses accounted for from the input power. These values are then
smoothed using a linear regression technique as a function of the square of the torque. The
estimated stray load loss components, as described in Chapter 6, are obtained using an
assignment allowance based on a curve that relates the input power to the output power at
rated load conditions. The estimated and calculated stray load loss components for each of
the motors are shown in the following sections.
8.6.1 11kW Motor Results
The corresponding estimated and calculated SLL values for the 11kW machine are shown
in Figure 8.14.

Chapter Eight Analysis and Verification of Results
Non-Intrusive Efficiency Estimation of Induction Machines 128
Figure 8.14: Stray load loss results for the 11kW motor
Observations of the above show that the estimated values are an over estimate up to 115%
load and constant at 255.21W. This value of SLL represents 1.979% of input power at rated
conditions. Thereafter, the calculated values exceed the estimated values. The calculated
values follow a parabolic curve which ranges from approximately 10W at 25% load to
445W at 150% load.
8.6.2 15kW Motor Results
The SLLs for the 15kW is displayed in Figure 8.15 below.
Figure 8.15: Stray load loss results for the 15kW motor
20 30 40 50 60 70 80 90 100 110 120 130 140 150 1600
50
100
150
200
250
300
350
400
450
Load [%]
Str
ay
Lo
ad
Lo
ss [
W]
IEC Std 34-2-1
Estimated
20 30 40 50 60 70 80 90 100 110 120 130 1400
50
100
150
200
250
300
350
Load [%]
Str
ay
Lo
ad
Lo
ss [
W]
IEC Std 34-2-1
Estimated

Chapter Eight Analysis and Verification of Results
Non-Intrusive Efficiency Estimation of Induction Machines 129
Based on the above, the estimated values of 327.94W present an over estimate in relation
to the calculated values. This value represents 1.911% of the input power at rated
conditions. The calculated values vary from 10W to 300W over the load range. An
interception of the two plots is expected at higher loading conditions, as can be seen if the
corresponding curves are extrapolated.
8.6.3 7.5kW Motor Results
Figure 8.16 below represents the estimated and calculated SLL values
Figure 8.16: Stray load loss results for the7.5 kW motor
The plots above indicate an over estimation of SLL for loading ranges up to 115%. With the
estimated SLL equating to 184.79W, the calculated values vary from approximately 10 W to
310W over the loading range. The 184.79W estimated SLL reflects 2.06 % of rated input
power under rated conditions.
8.6.4 Discussion of Results
Considering the results shown in the previous sections, the estimated SLL exceed the
measured values for loads ranging up to approximately 120% of rated load. The
discrepancies of the estimated results lie with the governing equation (equation 6.23) used
to obtain the SLLs at rated load. For other than rated loading condition the standard states
20 30 40 50 60 70 80 90 100 110 120 130 140 150 1600
50
100
150
200
250
300
350
Load [%]
Str
ay
Lo
ad
Lo
ss [
W]
IEC Std 34-2-1
Estimated

Chapter Eight Analysis and Verification of Results
Non-Intrusive Efficiency Estimation of Induction Machines 130
that the stray load loss varies with the square of the rotor current. This rotor current is
obtained by
(8.2)
Where:
Is is the stator current
INo Load is the no load current
For the NAGT method, it is required that the no load test be avoided in order to eliminate
the high intrusion associated with the no load test procedure. Thus, equation 8.2 cannot be
used to obtain the SLL values at other than rated load conditions. Since the NAGT method
provides an estimation of efficiency, the estimated stray load loss obtained at rated
conditions is used for all other loading conditions. Therefore, the estimated SLL values do
not vary with load (i.e. load independent), whereas the calculated values do (i.e. load
dependant).
Additionally, the over estimation of SLL at rated conditions is as expected since the IEC Std
34-2-1 states that the assigned allowances represents an upper envelope of a large number
of measured values, hence resulting in larger than expected SLL values. The effect of this
over estimation (i.e. higher SLL values) is to decrease the overall output power and hence
the efficiency of the machine.
The estimated SLL is dependant on both the input power and rated output power of the
motor. A comparison of estimated SLL values between different motor sizes at 100% load
is provided in Table 8.10 below.

Chapter Eight Analysis and Verification of Results
Non-Intrusive Efficiency Estimation of Induction Machines 131
Table 8.10 Comparison of estimated SLLs between different motor sizes
Motor Size [kW]
PInput
[W] SLLrated
[W] % of PInput
[%]
15 17152 327.94 1.911
11 12894 255.21 1.979
7.5 8959 184.79 2.062
As can be seen, the amount of power contributing to SLL varies according to the size of the
machine. Although, larger motors are associated with higher SLL values, smaller motors
contribute a larger percentage of their associated input power to SLLs.

Chapter Eight Analysis and Verification of Results
Non-Intrusive Efficiency Estimation of Induction Machines 132
8.7 Non-Intrusive Efficiency Estimation
The following section shows the efficiency results for the overall NAGT method. For
comparison purposes the IEC Standard 34-2-1 and the direct method (Pout/Pin) results are
also included. The percentage voltage unbalance and total harmonic distortion (THD) are
also depicted to provide an indication of the supply conditions at which the efficiency
values are quoted.
8.7.1 Repeatability of Tests and Averaged Results
The repeatability of a test can be described as the variation of test results when
experiments are performed under similar conditions. These conditions include identical
methodology, operator, and instrumentation. In order to convey the consistency of the
results obtained in this thesis, each test conducted was repeated three times and an
average value was obtained. To obtain the average, it is necessary that the results for each
of the three tests are set to the exact same loading condition. This is a challenging task,
since the exact values of loading cannot be obtained when using manual loading control. To
overcome this, the efficiencies obtained during each test are plotted against the actual
loading condition. This can be obtained by the ratio of the measured torque to the
machine’s rated torque as shown by
(8.3)
The efficiency is then plotted against the load at six different loading points ranging from
25% to 150% of rated load. A polynomial curve of n-1 data points is fitted to these values
and the equation of the curve is then obtained. The curve represents the efficiency values
as a function of the load, allowing for the efficiency to be obtained at any loading point. The
efficiencies for each of the tests are then plotted using its unique governing equation for
exact loading conditions (eg at exactly 100%) and the average of the tests is obtained. The
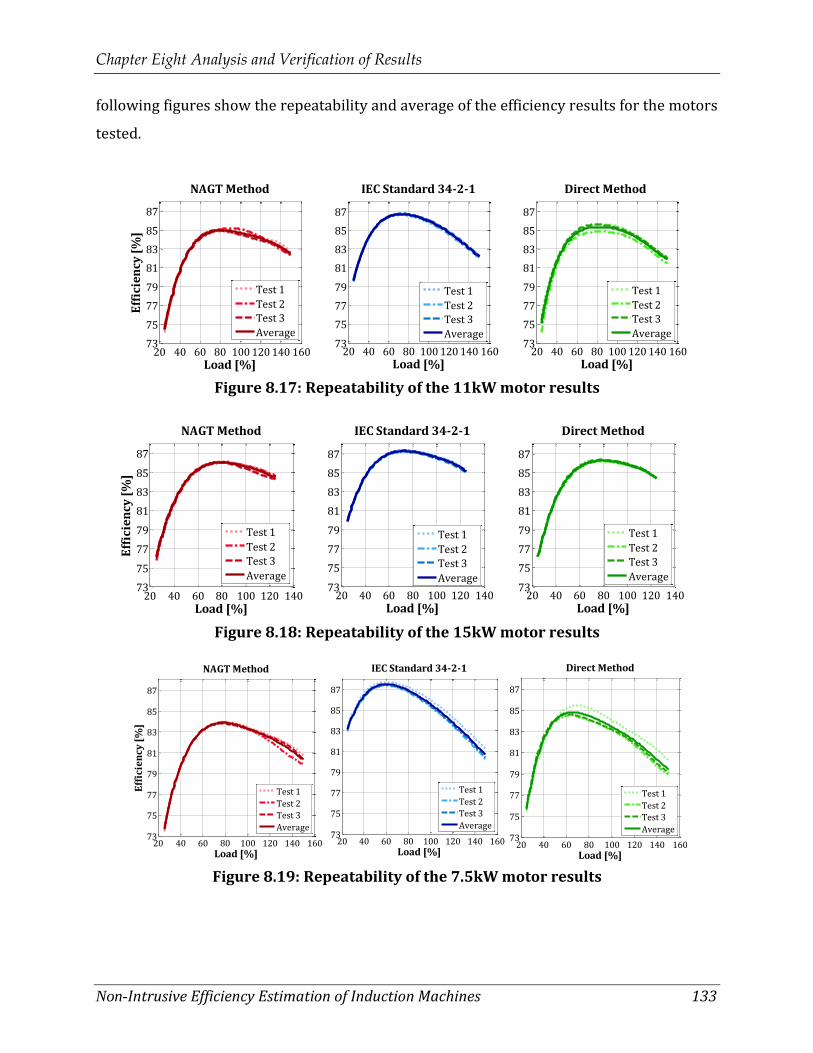
Chapter Eight Analysis and Verification of Results
Non-Intrusive Efficiency Estimation of Induction Machines 133
following figures show the repeatability and average of the efficiency results for the motors
tested.
Figure 8.17: Repeatability of the 11kW motor results
Figure 8.18: Repeatability of the 15kW motor results
Figure 8.19: Repeatability of the 7.5kW motor results
20 40 60 80 100 120 140 16073
75
77
79
81
83
85
87
NAGT Method
Load [%]
Eff
icie
ncy
[%
]
Test 1
Test 2Test 3
Average
20 40 60 80 100 120 140 16073
75
77
79
81
83
85
87
IEC Standard 34-2-1
Load [%]
Test 1
Test 2Test 3
Average
20 40 60 80 100 120 140 16073
75
77
79
81
83
85
87
Direct Method
Load [%]
Test 1
Test 2Test 3
Average
20 40 60 80 100 120 14073
75
77
79
81
83
85
87
NAGT Method
Load [%]
Eff
icie
ncy
[%
]
Test 1
Test 2Test 3
Average
20 40 60 80 100 120 14073
75
77
79
81
83
85
87
IEC Standard 34-2-1
Load [%]
Test 1
Test 2Test 3
Average
20 40 60 80 100 120 14073
75
77
79
81
83
85
87
Direct Method
Load [%]
Test 1
Test 2Test 3
Average
20 40 60 80 100 120 140 16073
75
77
79
81
83
85
87
NAGT Method
Load [%]
Eff
icie
ncy
[%
]
Test 1
Test 2Test 3
Average
20 40 60 80 100 120 140 16073
75
77
79
81
83
85
87
IEC Standard 34-2-1
Load [%]
Test 1
Test 2Test 3
Average
20 40 60 80 100 120 140 16073
75
77
79
81
83
85
87
Direct Method
Load [%]
Test 1
Test 2Test 3
Average

Chapter Eight Analysis and Verification of Results
Non-Intrusive Efficiency Estimation of Induction Machines 134
As can be seen, the results show that there is a consistent trend when comparing tests 1,
test 2 and test 3. This is evident in all three of the motors tested. For the remainder of this
thesis, only the average values of the efficiency tests will be considered.
8.7.2 11kW Motor Results
The average efficiency results for the 11kW motor is shown in Figure 8.20 below. The
efficiencies quoted here are obtained under 0.43% voltage unbalance and a THD of 2.33%,
which is within the limits of the IEC Std 34-2-1 for conducting the efficiency test.
Figure 8.20: Efficiency results for the 11kW motor
Observing the above graph, one can see that the efficiency curves follow the same general
trend for each of the three methods. Considering the IEC Std 34-2-1 method as the baseline
for comparison, the NAGT and direct method efficiencies are lower over the entire loading
range. The maximum efficiency values for the IEC Std 34-2-1, the direct method and the
NAGT method are 86.70%, 85.36% and 84.99% and occur at 73%, 82% and 81% of rated
load respectively. The actual efficiency values obtained at the six loading points are
provided in Table 8.11.
20 30 40 50 60 70 80 90 100 110 120 130 140 150 16073
75
77
79
81
83
85
87
Load [%]
Eff
icie
ncy
[%
]
IEC Std 34-2-1
Direct MethodNAGT Method

Chapter Eight Analysis and Verification of Results
Non-Intrusive Efficiency Estimation of Induction Machines 135
Table 8.11 Efficiency results of the 11kW motor
Load [%]
IEC Std 34-2-1
[%]
Direct [%]
NAGT [%]
150 82.228 80.1054 82.484 125 84.378 84.0122 83.955 100 85.987 85.4470 84.716 75 86.695 85.7173 84.943 50 85.688 83.8005 82.947 25 79.658 75.4474 74.445
Based on the table, the efficiency results of the NAGT method deviates from the IEC Std 34-
2-1 results by a maximum of 5.12% at 25% load and a minimum of 0.256% at 150% load.
In comparison to the direct method, the NAGT efficiency results are within 2.3% efficiency.
8.7.3 15kW Motor Results
The average efficiency results for the 15kW motor are shown in Figure 8.21. Due to
limitations in the loading for the 15kW machine, only values of up to 125% of rated load
were obtained. The supply conditions contained 0.251% unbalance and 2.66% THD
.
Figure 8.21: Efficiency results for the 15kW motor
The curves indicated in the above figure show that the NAGT efficiency values obtained are
lower when compared to the IEC Std 34-2-1 and direct method results. Incidentally, the
NAGT results are closely related to the values obtained using the direct method. Despite
20 30 40 50 60 70 80 90 100 110 120 130 14073
75
77
79
81
83
85
87
Load [%]
Eff
icie
ncy
[%
]
IEC Std 34-2-1
Direct MethodNAGT Method

Chapter Eight Analysis and Verification of Results
Non-Intrusive Efficiency Estimation of Induction Machines 136
this, all three curves show a similar trend in results, with the maximum efficiencies of
87.26%, 86.25% and 86.06% occurring at 73%, 79% and 79% of rated load respectively.
The actual efficiency values for the five loading points are shown in Table 8.12.
Table 8.12 Efficiency results of the 15kW motor
Load [%]
IEC 34-2-1 [%]
Direct [%]
NAGT [%]
125 85.1596 84.3797 84.4600 100 86.6329 85.8678 85.6369 75 87.2535 86.2253 86.0358 50 86.1832 84.3995 84.0834 25 79.8703 76.1495 76.0493
The NAGT efficiency results, in relation to the IEC 34-2-1, show a maximum deviation of
3.82 % at 25% load and a minimum deviation of 0.699 % at 125% load. When comparing
the NAGT results with the results obtained from the direct method, the efficiencies are
within 0.3 % efficiency over the entire loading range.
8.7.4 7.5kW Motor Results
The efficiency results for the 7.5kW motor are shown in Figure 8.22. The supply conditions
for which these efficiency results were obtained were 0.43% voltage unbalance and 2.5%
THD.
Figure 8.22: Efficiency results for the 7.5 kW motor
20 30 40 50 60 70 80 90 100 110 120 130 140 150 16073
75
77
79
81
83
85
87
Load [%]
Eff
icie
ncy
[%
]
IEC Std 34-2-1
Direct MethodNAGT Method

Chapter Eight Analysis and Verification of Results
Non-Intrusive Efficiency Estimation of Induction Machines 137
The curves above show the IEC Std 34-2-1 representing higher efficiency values, followed
by the direct method and the NAGT method. The maximum efficiency for each of the
methods can be seen in decreasing order at 87.53%, 84.82% and 83.87% at 60%, 65% and
78% loading respectively. A more detailed comparison of efficiency results obtained is
provided in Table 8.13 below.
Table 8.13 Efficiency results of the 7.5kW motor
Load [%]
IEC 34-2-1 [%]
Direct [%]
NAGT [%]
150 80.6710 79.4300 80.316 125 83.3465 81.7300 82.159 100 85.5880 83.4720 83.359 75 87.1616 84.6466 83.861 50 87.2936 84.0685 81.933 25 83.1653 75.6638 73.663
Notably, there is a large discrepancy between the curves, especially at the lower loading
ranges. In comparison, the NAGT efficiencies diverge from the IEC Std 34-2-1 values by 9.5
% and 0.36% at 25% and 150% loading respectively. Alternatively, the NAGT efficiency
values are within 2.135% of the values obtained by the direct method.
8.7.5 Discussion of Results
For each of the tests performed on a specific motor, the results indicate consistency relative
to each other. This strong correlation indicates that the test procedures are highly
repeatable. Additionally, the supply (voltage unbalance and THD) conditions for each of the
tests conducted were all within accordance of the IEC Std 34-2-1 standard. This shows that
Eskom’s mains supply can be used for motor efficiency testing since it falls within the
specifications of the standard.
Consideration of the air gap torque equation and its relation to the core loss showed that
there is a need to cater for the core loss component in the efficiency equation. This suggests
that the air gap power calculated using the air gap torque equation is merely the input

Chapter Eight Analysis and Verification of Results
Non-Intrusive Efficiency Estimation of Induction Machines 138
power less the stator copper loss which coincides with the theory and lays to rest the
uncertainty identified in the literature. In this case, the calculations using the air gap torque
equation can be avoided. Since similar results can be obtained by merely calculating the
input power from the motor’s stator voltages and current (equation 6.9) and subtracting
the stator copper loss. This indicates a simpler and less computationally tedious procedure.
The efficiency results obtained from the NAGT method consistently shows the lowest
efficiency values for the case of all three motors under test. It is difficult to identify which
component is the main contributing factor to the deviations in efficiency, due to the sources
of error in estimating the various parameters. Another aspect to consider is that the
efficiency values show higher deviations at the lower load ranges. Based on this
observation, further investigation into the deviations of the efficiency results over the load
range was conducted.
This was done by applying the NAGT methodology to the IEC Std 34-2-1 calculated results
and comparing the efficiencies to the original IEC Std 34-2-1 results. The effects of
individual estimated components on the overall efficiency were observed by introducing
the estimated components independently of the others. For example, to investigate the
effects of estimated rotor speed on the efficiency, the estimated rotor speed values were
used while using the IEC Std 34-2-1 calculated results for the remaining components i.e.
stator resistance, no load loss and stray load loss. This was repeated for the each of the
measured stator resistance, no load loss and stray load loss components which were
compared to the original efficiencies of the IEC Std 34-2-1. Based on this, it was observed
that the effects of stray load loss contributed most significantly to deviations in efficiency,
i.e. approximately 10 % at 25 % load.
Considering the discussion made in section 6.6.2 and section 8.5.4, the estimated stray load
loss is obtained at rated load (equation 6.23) and the value obtained is applied for all
loading ranges. Consequently, the stay load losses are not load dependant which
transgresses the load dependant values seen in the IEC Std 34-2-1 results. In order to
improve the estimated stray load loss results, a linear regression technique similar to that

Chapter Eight Analysis and Verification of Results
Non-Intrusive Efficiency Estimation of Induction Machines 139
of the IEC Std 34-2-1 was applied. This process involves expressing the stray load loss as a
function of the square of the torque for each load. The corrected stray load loss is then
obtained by shifting the linear curve to go through the origin while maintaining the slope of
the curve. Since the empirically estimated stray load loss is obtained at rated conditions, a
straight line passing through this point and the origin gives the ‘improved’ values for stray
load loss estimation.
The corrected stray load loss components for the IEC Std 34-2-1, the estimated (equation
6.23) and the ‘improved’ estimate is shown in Figure 8.23. The subsequent results for the
11 kW motor is reflected for the remainder of this investigation.
Figure 8.23: Corrected stray load loss
As can be seen, the gradient of the ‘improved’ SLLs is steeper than the IEC Std 34-2-1
indicating that higher stray load loss values will be obtained. Based on this, the stray load
losses can be obtained for a range of load conditions as shown in Figure 8.24.
0 2000 4000 6000 8000 10000 120000
100
200
300
400
500
600
Torque squared [Nm2]
Co
rre
ct S
tra
y L
oa
d L
oss
[W
]
IEC Std 34-2-1
Estimated
Improved
Rated Load
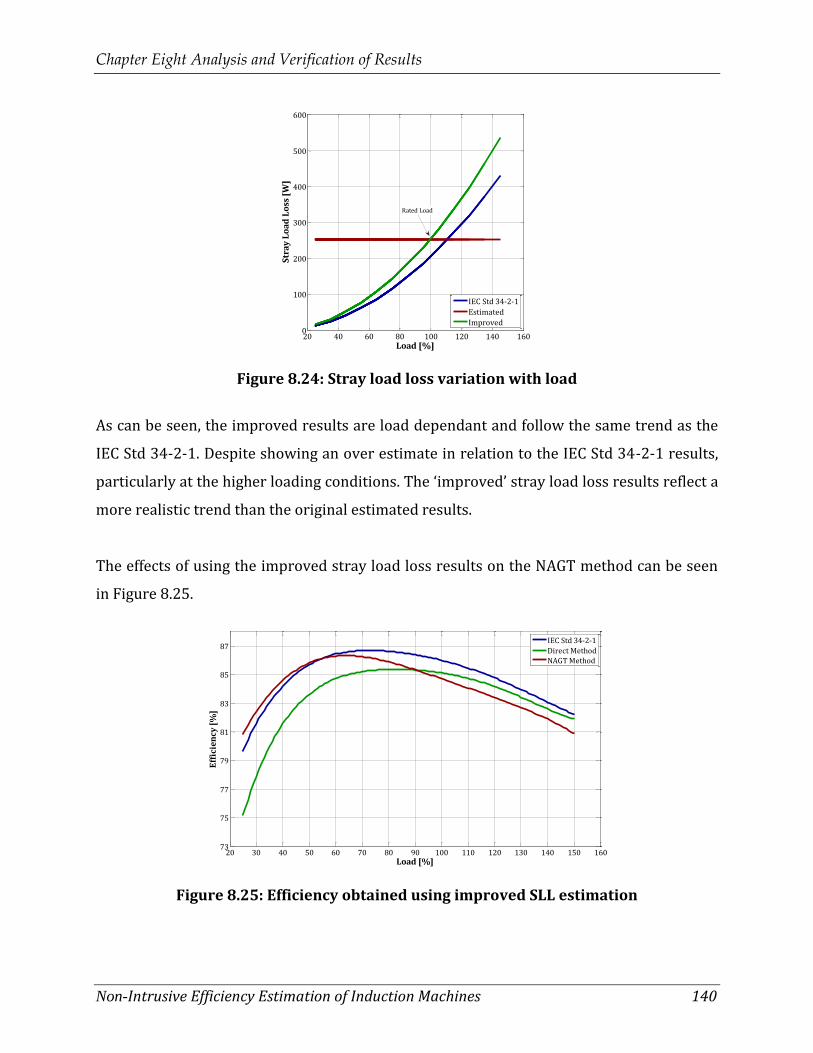
Chapter Eight Analysis and Verification of Results
Non-Intrusive Efficiency Estimation of Induction Machines 140
Figure 8.24: Stray load loss variation with load
As can be seen, the improved results are load dependant and follow the same trend as the
IEC Std 34-2-1. Despite showing an over estimate in relation to the IEC Std 34-2-1 results,
particularly at the higher loading conditions. The ‘improved’ stray load loss results reflect a
more realistic trend than the original estimated results.
The effects of using the improved stray load loss results on the NAGT method can be seen
in Figure 8.25.
Figure 8.25: Efficiency obtained using improved SLL estimation
20 40 60 80 100 120 140 1600
100
200
300
400
500
600
Load [%]
Str
ay
Lo
ad
Lo
ss [
W]
IEC Std 34-2-1
Estimated
Improved
Rated Load
20 30 40 50 60 70 80 90 100 110 120 130 140 150 16073
75
77
79
81
83
85
87
Load [%]
Eff
icie
ncy
[%
]
IEC Std 34-2-1
Direct MethodNAGT Method

Chapter Eight Analysis and Verification of Results
Non-Intrusive Efficiency Estimation of Induction Machines 141
As can be seen, the NAGT method efficiencies show an improvement in the lower load
ranges in relation to the IEC Std 34-2-1. However, the deviations at the higher loading
range have increased. This is due to the over estimate of the improved stray load loss
values at higher loads. Overall, the new NAGT efficiencies are within 2% of the IEC Std 34-
2-1 which is an improvement to the original NAGT efficiencies.
8.8 Effects of Voltage Unbalance on Motor Efficiency
The efficiency results of the NAGT and direct method under unbalanced conditions is
presented in the following subsections. As mentioned in Chapter 7, there is not standard
procedure for the calculation of efficiency under unbalanced supply conditions. In
particular, complications arise when calculating the individual loss components. Therefore
the direct method will be used to which the NAGT results can be compared. The
investigation of voltage supply unbalances is limited to the case of magnitude unbalance
with nominal (380V) average voltage. The case of 2.5 % and 5% voltage unbalance defined
according to the NEMA definition is presented.
8.8.1 Unbalanced Supply Conditions
The experimental supply voltages and currents obtained from the generator during
unbalanced conditions are shown in Figure 8.26. Only the case for the 11 kW under rated
load is represented and is merely for demonstration purposes.

Chapter Eight Analysis and Verification of Results
Non-Intrusive Efficiency Estimation of Induction Machines 142
Figure 8.26: Motor supply voltages and currents during unbalanced conditions
The effects of voltage unbalance can be clearly seen by the corresponding unbalanced
currents. During 0% voltage unbalanced conditions, each of the line voltages and currents
are equal in magnitude with amplitudes 580.23 V and 34.6 A respectively. As the severity of
magnitude unbalance increases, so the magnitude of the corresponding voltages and
currents changes. For the case above, the variac combination caused the voltage and
current magnitudes of phase A (red) and phase C (blue) to increase while the magnitude of
phase B (yellow) decreased with increasing unbalanced conditions.
The efficiency for each of the motors tested during unbalanced conditions is presented in
the following sections
8.8.2 11kW Motor Results
The air gap torque values and their corresponding NAGT efficiencies are shown in Figure
8.27.
0 0.01 0.02 0.03 0.04-600
-400
-200
0
200
400
600
0% Unbalance
Time [s]
Vo
lta
ge
[V
]
0 0.01 0.02 0.03 0.04-50-40-30-20-10
01020304050
Time [s]
Cu
rre
nt
[A]
0 0.01 0.02 0.03 0.04-600
-400
-200
0
200
400
600
2.5% Unbalance
Time [s]
Vo
lta
ge
[V
]
0 0.01 0.02 0.03 0.04-50-40-30-20-10
01020304050
Time [s]
Cu
rre
nt
[A]
0 0.01 0.02 0.03 0.04-600
-400
-200
0
200
400
600
5% Unbalance
Time [s]
Vo
lta
ge
[V
]
0 0.01 0.02 0.03 0.04-50-40-30-20-10
01020304050
Time [s]
Cu
rre
nt
[A]

Chapter Eight Analysis and Verification of Results
Non-Intrusive Efficiency Estimation of Induction Machines 143
Figure 8.27: Overall unbalanced efficiency curves for the 11 kW motor
As expected, the unbalance efficiency values for both the NAGT and the direct method show
a decrease with an increase in voltage unbalance.
A more explicit comparison of the NAGT and direct method efficiencies for each of the
unbalance cases are shown in Figure 8.28
Figure 8.28: Efficiency results for the 11 kW motor under unbalanced conditions
For all unbalanced cases, the NAGT efficiencies are lower than the direct method values.
The efficiency curves follow the same trend for each of the unbalance cases. As with the
results shown in the previous section, the deviation of the NAGT results is higher at the
lower loading points.
20 40 60 80 100 120 140 16065
676971737577
7981
83858789
NAGT Method
Load [%]
Eff
icie
ncy
[%
]
0% UB
2.5% UB
5% UB
20 40 60 80 100 120 140 1600
10
20
30
40
50
60
70
80
90
100
110
120Air Gap Torque
Load [%]
Ta
g [
Nm
]
0% UB
2.5% UB
5% UB
20 40 60 80 100 120 140 16065
67
6971
7375
7779
81
83
8587
89
Direct Method
Load [%]
Eff
icie
ncy
[%
]
0% UB
2.5% UB
5% UB
20 40 60 80 100 120 140 160656769717375
77798183858789
0% Unbalance
Load [%]
Eff
icie
ncy
[%
]
Direct
NAGT
20 40 60 80 100 120 140 16065676971
737577798183858789
2.5% Unbalance
Load [%]
Eff
icie
ncy
[%
]
Direct
NAGT
20 40 60 80 100 120 140 16065
676971
73
75777981
83858789
5% Unbalance
Load [%]
Eff
icie
ncy
[%
]
Direct
NAGT

Chapter Eight Analysis and Verification of Results
Non-Intrusive Efficiency Estimation of Induction Machines 144
8.8.3 15kW Motor Results
The unbalanced efficiency results for the 15 kW motor is shown in Figure 8.29 below.
Figure 8.29: Overall unbalanced efficiency curves for the 15 kW motor
The efficiency values for both the NAGT and direct method are as expected and decrease
with an increase in voltage unbalance.
The individual cases for each of the unbalanced conditions are shown in Figure 8.30 below.
Figure 8.30: Efficiency results for the 15 kW motor under unbalanced conditions
As shown, the NAGT efficiency values represent lower efficiency values when compared to
the values obtained from the direct method. The estimated NAGT efficiencies do however
follow the same trend as the direct method. Similarly, the maximum deviation occurs at the
lower loading range.
20 40 60 80 100 120 1406567
6971
73
757779
8183
85
8789
NAGT Method
Load [%]
Eff
icie
ncy
[%
]
0% UB
2.5% UB
5% UB
20 40 60 80 100 120 1400
102030405060708090
100110120130140
Air Gap Torque
Load [%]
Ta
g [
Nm
]
0% UB
2.5% UB
5% UB
20 40 60 80 100 120 1406567
6971
737577
7981
83
8587
89
Direct Method
Load [%]E
ffic
ien
cy [
%]
0% UB
2.5% UB
5% UB
20 40 60 80 100 120 14065
6769
717375
7779
8183
858789
0% Unbalance
Load [%]
Eff
icie
ncy
[%
]
Direct
NAGT
20 40 60 80 100 120 14065
676971
7375
77
798183
858789
2.5% Unbalance
Load [%]
Eff
icie
ncy
[%
]
Direct
NAGT
20 40 60 80 100 120 1406567
6971
7375
77
7981
838587
89
5% Unbalance
Load [%]
Eff
icie
ncy
[%
]
Direct
NAGT

Chapter Eight Analysis and Verification of Results
Non-Intrusive Efficiency Estimation of Induction Machines 145
8.8.4 7.5kW Motor Results
The air gap torque values and the resulting efficiencies for each of the unbalanced
conditions is displayed in Figure 8.31.
Figure 8.31: Overall efficiency curves for the 7.5 kW motor
The efficiency results are as expected and show a decrease in values with an increase in
voltage unbalance for both the NAGT and direct methods. A representation of the
differences in the acquired results for each of the unbalanced conditions for the NAGT and
direct method is shown in Figure 8.32 below.
Figure 8.32: Efficiency results for the 7.5kW motor under unbalanced conditions
20 40 60 80 100 120 140 16065
6769
717375
7779
8183
858789
NAGT Method
Load [%]
Eff
icie
ncy
[%
]
0% UB
2.5% UB
5% UB
20 40 60 80 100 120 140 1600
10
20
30
40
50
60
70
80
90
100Air Gap Torque
Load [%]
Ta
g [
Nm
]
0% UB
2.5% UB
5% UB
20 40 60 80 100 120 140 16065
6769
71
7375
7779
81
8385
87
89
Direct Method
Load [%]
Eff
icie
ncy
[%
]
0% UB
2.5% UB
5% UB
20 40 60 80 100 120 140 16065676971
737577
798183
858789
0% Unbalance
Load [%]
Eff
icie
ncy
[%
]
Direct
NAGT
20 40 60 80 100 120 140 1606567
697173
7577
79
818385
8789
2.5% Unbalance
Load [%]
Eff
icie
ncy
[%
]
Direct
NAGT
20 40 60 80 100 120 140 16065
6769
717375
77
79
8183
858789
5% Unbalance
Load [%]
Eff
icie
ncy
[%
]
Direct
NAGT

Chapter Eight Analysis and Verification of Results
Non-Intrusive Efficiency Estimation of Induction Machines 146
The NAGT efficiency results show lower values in comparison to the direct method
efficiencies. Although the results show the same trend in each of the above cases, there is a
large discrepancy in the actual efficiency values i.e. more that 5% difference between the
two methods, particularly at the lower load range.
8.9 Discussion of Results
As expected, the effects of supply unbalance have a negative impact on the motor’s
efficiency. The results presented in the above sections showed that an increase in the
degree of supply unbalance further decreases the motors efficiency. The unbalanced
condition causes further losses within the motor and therefore increases the operating
temperature. This is evident in the increase in stator winding temperatures and therefore
stator copper loss as the motor draws more current.
The results for the NAGT shows that it can be used to determine the motor’s efficiency
during unbalanced conditions. The results consistently showed lower efficiency values for
all tested machines in comparison to the direct method efficiencies. This is also the case for
efficiency values obtained under balanced conditions and therefore suggests that the NAGT
method consistently underestimates the machine’s efficiency in relation to the direct
method. This is indicative of the advantage of the air gap torque method above other
methods in that it accounts for the effects of the negative torque associated with the
unbalanced conditions.

Chapter Eight Analysis and Verification of Results
Non-Intrusive Efficiency Estimation of Induction Machines 147
8.10 Concluding Remarks
In this chapter, the experimental results are presented and discussed. In particular a
detailed analysis of the individual estimated parameters for the NAGT method and their
performance is assessed.
The stator resistance estimation results showed an over estimate in comparison to the
expected resistance values. Additionally, the percentage error between these values is not
consistent over the entire loading range and this variation is also extended across different
motor sizes. The stator resistance values, did however vary with load and hence
temperature.
For the case of the speed estimation technique, the results proved to be successful in
comparison to the measured values with accuracy within 0.16% for all three motors. The
rotational frequency components, from which the speeds can be obtained, were dominant
and easily detectable over the entire load range making speed estimation highly
dependable. Due to the required signal processing (FFT) techniques, the effects of
frequency resolution was also investigated. The results indicated that higher accuracy
levels for speed estimation can be achieved by increasing the acquisition time.
The estimated no load losses proved to be an under estimate for the 11kW and 15kW
motors. On the other hand, an over estimate was indicated for the 7.5kW motor. This led to
the investigation of the individual loss contribution in relation to the input power.
Furthermore, the effects of the variation of the IEC Std 34-2-1 calculated core losses with
load were explored. It was seen that the variation of core loss is due to the effects of stator
voltage drop compensation which is unique to the IEC Std 34-2-1.
The comparison between the IEC Std 34-2-1 calculated results and estimated values of
SLLs were also presented. In general the estimated values show a constant overestimate in
SLL over the loading range.

Chapter Eight Analysis and Verification of Results
Non-Intrusive Efficiency Estimation of Induction Machines 148
Based on the above, the efficiency estimation based on the NAGT method was obtained.
These values were compared to the efficiencies obtained using the IEC Std 34-2-1 and
direct method and were, for the most case, lower in magnitude. In particular, the deviations
in efficiencies at the lower loading points were substantially larger than at the higher
loading range. To address this issue, the effects of the SLL estimation on the NAGT
efficiencies were investigated and subsequently lead to the development of an ‘improved’
estimation technique. The SLLs obtained from this improved technique differs from the
original estimated values in that it provides SLLs that are load dependant. The SLL results
obtained from this ‘improved’ method reflects the values obtained from the IEC Std 34-2-1
more closely despite being an over estimate. The introduction of the ‘improved’ SLL results,
showed an improvement in the NAGT efficiencies to within 2% relative to the IEC Std 34-2-
1 results.
Lastly the effect of magnitude voltage unbalance on the NAGT method was investigated. It
was observed that a decrease in efficiency is related to an increase in voltage unbalance.
This is attributed to the increase in motor losses and hence increases in the operating
temperature. The efficiency results obtained using the NAGT method indicated lower
values for each of the unbalanced cases in comparison to the direct method.

CHAPTER NINE 9 ERROR ANALYSIS OF EFFICIENCY
DETERMINATION
This chapter investigates the accuracy of measured and estimated efficiency results. In
particular the effects of instrumental errors associated with experimental testing are
investigated. To accomplish this, the worst case error estimation (WCEE) and realistic error
estimation (REE) techniques are incorporated. Based on this, the effects of errors associated
with individual parameters on the overall motor efficiency are explored.

Chapter Nine: Error Analysis of Efficiency Determination
Non-Intrusive Efficiency Estimation of Induction Machines 150
9.1 Introduction
When quoting the results of any experimental procedure, there is often a question around
the credibility of the values stated. In general, the conduction of an experimental
investigation requires amongst other things, a test bed with the relevant measuring
devices, a methodological test procedure and experienced personal to carry out the study.
Due to the nature of these aspects, the results obtained often contain a certain degree of
uncertainties and it is important that these uncertainties are accounted for if the outcome
is to be creditable. The following sections will provide detailed analysis of the errors
associated with the motor efficiency testing process.
9.2 Definition of Basic Terms and Concepts
The process of measuring involves the determination of these measurable quantities with
the aid of measuring devices or instrumentation [78]. The measurement process is often
outlined by a set procedure or methodology according to a specific standard.
A measuring instrument is regarded as a highly specialized piece of equipment used to
detect the value of the measurable quantity. These instruments should be regularly
calibrated. This is done to avoid the effects of drifting and to ensure a reliable level of
accuracy defined by the accuracy class.
The term measurable quantities can be used to describe the physical quantities that are
measured during an experiment, for example voltage, current, resistance etc. These
measured quantities can also be referred to as the measurand [78].
The true value of the meaurand is considered to be the values obtained from the
experiment that would ideally represent the measurable quantity with 0 % error. It should
be noted that in practice the true value of a measurand is unknown. Alternatively, if the
true value was known there would be no need for measurement [78]. Thus, the ‘true’
values are denoted by the measured (IEC Std 34-2-1) or estimated (NAGT method) values
obtained from the conducted experiment. Due to the nature of these methods, i.e. the

Chapter Nine: Error Analysis of Efficiency Determination
Non-Intrusive Efficiency Estimation of Induction Machines 151
required personnel and the instrumentation used, the values obtained contain unavoidable
degrees of inaccuracies.
The inaccuracy of a measurement represents the degree of deviation or imperfections of
the true value in relation to the measurand. This inaccuracy is attributed to the
measurement uncertainty or measurement error associated with the experiment.
The term uncertainty (in terms of measurement) can be regarded as the interval within
which the true value is expected to lie with a given probability [78]. In contrast, the error
(of measurement) is merely the deviation of the measured or estimated value from the true
value of the measurand. The measurement error can be expressed in absolute or relative
form, as shown in equation 9.1 and 9.2 respectively [78].
(2.25)
(2.26)
Where:
Absolute is the absolute error
is the estimated value
At is the true value
Relative is the relative error
With reference to the absolute error, it is expressed in the same unit as the measured
quantity and its value can take the form of a positive or negative value. In contrast, the
relative error is represented as a ratio of the true value and is expressed as a percentage
[78].
The following sections will discuss the different sources of experimental error with its
focus on efficiency determination.

Chapter Nine: Error Analysis of Efficiency Determination
Non-Intrusive Efficiency Estimation of Induction Machines 152
9.3 Sources of Experimental Errors
The conduction of an experiment is generally associated with three sources of errors.
These include methodological errors, human errors and instrumentation errors, which may
be expressed as
(2.27)
Where:
Absolute is the absolute measurement error
m is the methodological error
h is the human error
i is the instrumental error.
All three of the above sources of error are contributing factors in induction motor efficiency
testing. The following section will describe these errors in more detail.
9.3.1 Methodological Error
As the name applies, the methodological errors are a consequence of the errors in the
testing procedure or methodology. In terms of motor loss and efficiency measurements, the
methodological errors are due to the routine of the measurement method conducted. These
experimental tests are usually performed by following a set method, according to an
accepted standard or established procedure. As mentioned in Chapter 2, there are many
established motor efficiency standards that exist globally and their major differences in
testing procedures were highlighted. Due to these discrepancies, the efficiency results
quoted from these standards will show slight differences despite the tests being conducted
on the same motor. This indicates that the methodology of efficiency testing each contains
its own set of associated methodological errors. One solution to avoid these discrepancies
is to adopt a single worldwide motor testing efficiency testing procedure.

Chapter Nine: Error Analysis of Efficiency Determination
Non-Intrusive Efficiency Estimation of Induction Machines 153
Many of the motor testing standards are based on the equivalent circuit model of the
machine. These models also contain their own level of assumptions and simplifications
[79]. Since the efficiency calculations are based on the relationship between the
components depicted in the model, they too will contain errors. For example, considering
the separation of loss method in IEC Std 34-2-1, the stray load loss component is not
accounted for in the equivalent circuit model [79]. In contrast the other four loss
components (stator copper loss, rotor copper loss, core loss and friction and windage loss)
are modelled by a set of resistive and inductive components. The standard, therefore,
assumes a value of stray load loss to be the loss remaining after the subtraction of the
output power and other loss components from the input power (see equation 2.8).
Additionally, the level of intrusion of the applied method is linked to the amount of errors
(and hence accuracy) associated with the methodology [80]. As mentioned in Chapter 3,
there is a trade off between the accuracy and level of intrusion when it comes to efficiency
estimation techniques. In an attempt to make the efficiency estimation techniques less
intrusive, more assumptions are made, which introduces a greater degree of error.
9.3.2 Human Error
Human errors are a consequence of errors associated with inaccurate readings, incorrect
calculations and misuse of instrumentation. Despite this, even the most experienced
operator cannot avoid the inevitable errors due to the nature of being human. Additionally,
no two operators are identical, and hence the results obtained by these two operators will
differ, even if the same methodological procedure is followed. The individual judgement of
the operator plays a role in determining sufficient machine operating stability, load
condition, the time taken between subsequent readings, and adequate experimental setup,
all of which contributes to the final errors in efficiency values.
The interpretation and understanding of a given testing standard or procedure is also a
contributing factor to human errors. This is particularly evident in cases where there are
ambiguities in the test procedure. For example, the IEC Std 34-2-1 does not define a

Chapter Nine: Error Analysis of Efficiency Determination
Non-Intrusive Efficiency Estimation of Induction Machines 154
preferred position for temperature sensors [81]. Consequently the position of the
temperature sensors will lead to different temperature reading of which affects the
calculation of stator copper losses and the overall efficiency.
9.3.3 Instrumentation Error
Instrumentation errors are considered to be the main contributing factor to the errors in
measurement [80]. In terms of efficiency determination, the effects of instrumentation
errors have an influence on the measurement of voltage, current, speed, torque and stator
winding resistance. Errors in these measurements, consequently contribute to the
inaccuracies of loss determination and overall motor efficiency.
The instrumentation error can be calculated using error evaluation techniques. The three
most common techniques include the following [80]
Maximum Error Estimation (MEE)
Worst Case Error Estimation (WCEE)
Realistic Error Estimation (REE)
For the purpose of this thesis, emphasis will be placed on instrumental error, since these
are considered to be the largest contributor to errors associated with measurement.
Additionally, the effects of these errors can be calculated and subsequently reduced by
incorporating the choice of more accurate instruments. In contrast, the methodological and
human errors cannot easily be quantified by empirical equations and it can be assumed
that the operator is highly experienced and follows the methodological procedure as
strictly as possible. Therefore, the effects of human and methodological errors are minimal
and will not be considered.
A more detailed discussion of these error estimation techniques in terms of
instrumentation error will be provided in the following sections.

Chapter Nine: Error Analysis of Efficiency Determination
Non-Intrusive Efficiency Estimation of Induction Machines 155
9.3.4 Error Estimation Techniques for Instrumental Error
The motor testing system can be represented by a set of variable inputs and its associated
output, as shown in Figure 9.1 [79].
The relationship between the input variables and the output can be represented by a
transfer function which reflects the methodology or test procedure upon the motor under
test. This transfer function is considered to be highly complex, non linear and is often
difficult to model [79].
The errors in instrumentation used to measure the input variables (or measurands) can be
determined by the techniques presented below.
9.3.5 Maximum Error Estimation (MEE)
The maximum error estimation (MEE) technique accounts for the most extreme case of
estimation error associated with the measurement system. In this case, the maximum
measurement error is seen to occur in addition to the maximum uncertainties of all the
instrumentation used in testing [80]. The maximum error can be represented by
(2.28)
Input Variable
Voltage
Current
Torque
Speed
Etc
Motor Test System
Output Variable
Stator Losses
Rotor Losses
No Load Losses
Stray Load Losses
Efficiency
Figure 9.1: Motor testing procedure [79]

Chapter Nine: Error Analysis of Efficiency Determination
Non-Intrusive Efficiency Estimation of Induction Machines 156
Where:
is the relative error in efficiency
Poutput is the relative error in output power
Pinput is the relative error in input power
The assumption that the maximum errors will occur simultaneously is not a realistic
reflection of the errors associated with the measurement system at any given time. This
method therefore provides an over estimate of the errors associated in with the system.
9.3.6 Worst Case Error Estimation (WCEE)
The worst case error estimation (WCEE) technique also assumes the extreme case of
maximum measurement error occurring simultaneously with the maximum errors in the
instrumentation. However, this technique differentiates itself from the MEE technique by
accounting for each of the individual sources of errors independently [80].
The absolute and relative error calculations were presented in equations 9.1 and 9.2.
Considering these equations and Figure 9.1, the effects of small perturbations placed on the
input variables in relation to the output can be expressed mathematically using a Taylor
series [80]. For practical purposes, only the first term in the Taylor series is considered
with the assumption that the resulting output, (y) has a linear relation to the effective
perturbations of the input variables (x) [78], [80]. This is valid if the perturbations of the
input variable are small. The resulting error in output can be written in simplified form as
[80]
(2.29)

Chapter Nine: Error Analysis of Efficiency Determination
Non-Intrusive Efficiency Estimation of Induction Machines 157
Where:
y, is the absolute errors in the output
Π is the system parameter
xi,t is the true value of the input parameter
zi,t is the true value to the additive noise
x,i , is the absolute errors in the input
z,i, is the absolute errors in the additive noise
The contribution of each individual input component in the measurement system and its
impact upon the output variable can be expressed as [80]
(2.30)
An influence coefficient can be used to indicate the sensitivity of the contribution of errors
in the input variable upon the final output variable. The influence coefficient can be
expressed as [80]
(2.31)
The influence coefficient of the noise contribution, zj can be expressed as
(2.32)
Based on the above, the maximum relative error can be determined by equation 9.9 [80]
(2.33)

Chapter Nine: Error Analysis of Efficiency Determination
Non-Intrusive Efficiency Estimation of Induction Machines 158
Due to the separation of the effects of each of the error sources, this method simplifies the
error analysis procedure. Additionally, the influence coefficient provides an indication of
the impact of the error source on the final measurement result. This method, however is
still considered to be an over estimate of the measurement uncertainty due to the
assumption of the probabilities of the errors occurring equally and simultaneously [79],
[80], [81]. An improvement to the WCEE technique is proposed in the next section.
9.3.7 Realistic Error Estimation (REE)
Observing that the MEE and WCEE techniques provide an unrealistic over estimation of the
effects errors associated with the input variables, the realistic error estimation (REE)
technique is introduced. The general derivation of the governing equation for the REE is
similar to that of the WCEE technique and is therefore not presented. The resulting
absolute and relative error in the output variable can be expressed in equation 9.10 [80].
(2.34)
Based on the above, the effects of the individual instrumentation errors are discriminately
accounted for in relation to its associated influence coefficient by quadrature addition [81].
Thus, the overall measurement error is a more realistic reflection of the errors that occur in
measurement systems.
9.4 Methodology for Error Analysis on Experimental Data
Since the MEE is considered to be an extreme over estimation and the least likely to occur
in practice, it is not included in the analysis. Therefore, the results for the error analysis
techniques presented here will consist of the WCEE and REE methods.

Chapter Nine: Error Analysis of Efficiency Determination
Non-Intrusive Efficiency Estimation of Induction Machines 159
Obtain data from experiment
Inject perturbations on the selected variable
Determine the relative deviation in efficiency
Determine the influence coefficient of the variable
Calculate the relative error using WCEE and
REE techniques
Error analysis
The experimental data obtained from the laboratory experiments were fed into a MATLAB
motor efficiency determination program and the relative WCEE and REE errors were
obtained. Figure 9.2 shows the overall error analysis determination procedure.
In complex systems, such as motor testing, it is difficult to obtain the expressions of the
derivatives found in equation 9.7 [80]. Therefore, to determine the influence coefficients of
each input variable (voltage, current etc), small perturbations were injected onto of the
collected data. It is assumed that variables such as voltage, current, torque, speed and
resistance, contain small errors [80] and hence perturbations of -5% to +5% were
implemented. For the case of the no load loss and stray load loss component used in the
NAGT, they are assumed to have large errors and perturbations ranging from -100% to
+100% were used [80]. The relative deviations in the efficiency were recorded for each
perturbation and the corresponding influence coefficient was obtained by finding their
ratio as shown in equation 9.7. As mentioned, the changes in the output efficiency are
assumed to be linearly related to the small changes in the input variable. Therefore, a
Matlab Code
Figure 9.2: Overall error analysis procedure

Chapter Nine: Error Analysis of Efficiency Determination
Non-Intrusive Efficiency Estimation of Induction Machines 160
straight line regression implemented to determine the relationship of the aforementioned
changes. The gradient of the straight line equation represents the influence coefficient.
Once the influence coefficients were obtained, the relative errors for the WCEE and REE
estimation techniques were calculated using equations 9.10 and 9.12 respectively. By
multiplying the influence coefficient with the relative error in instrumentation, the relative
significance of the input variable can be obtained. This permits the use of a ranking system
in which these variable can be placed with respect to each other.
The error analysis process was applied to each of the motors tested and the results are
presented in the following section.
9.5 Results and Discussion
The error analysis of the experimental results is presented in the following sections. The
analysis was performed on the test results obtained from each of the test methods, namely
the IEC Std 34-2-1, the direct and the NAGT methods.
The various instruments used in this thesis were presented in Chapter 7. As indicated their
accuracy levels fall within the limits set by the IEC Std 34-2-1. However, for the purpose of
error analysis conducted in this thesis, the maximum tolerances of relative errors set by
the standard is used in order to reflect the worst case instrument error associated with the
IEC Std 34-2-1 and direct methods. The maximum relative instrumentation tolerances set
by the IEC Std 34-2-1 were presented in Chapter 2. In contrast, the relative instrumentation
errors for the NAGT method take into account the stator resistance estimation circuit, the
accelerometer, the current LEM modules and the voltage probes. The relative instrument
errors associated with stator resistance circuit and accelerometer represents the worst
case error obtained between the estimated and measured results of all three motors.
Similarly, the relative errors used for the no load and stray load loss components were
obtained by the worst case error found between the calculated and estimated values.

Chapter Nine: Error Analysis of Efficiency Determination
Non-Intrusive Efficiency Estimation of Induction Machines 161
The influence coefficient for all the variables of the 11kW motor at rated load is shown in
the Appendix. The corresponding results for the 15kW and 7.5kW motors show similar
trends and are therefore omitted.
9.5.1 11kW Motor Results
The sources of error and their corresponding influence coefficients for the IEC Std 34-2-1
applied to the 11kW motor under rated conditions is shown in Table 9.1. Based on the
aforementioned error analysis techniques, the relative WCEE and REE errors are also
presented.
Table 9.1 Instrumental error for the 11kW motor using the IEC Std 34-2-1
Error Source Relative
Error [%]
Absolute Influence Coefficient
WCEE [%]
REE [%]
Rank
Shaft Torque ±0.2 0.521 ±0.10420 ±0.0108576 1
Input Power ±0.2 0.460 ±0.09200 ±0.0084640 2
Rotor Speed ±0.05 1.013 ±0.05065 ±0.0025654 3
Input Current ±0.2 0.005 ±0.00100 ±0.0000010 4
Stator Resistance
±0.2 0.004 ±0.00080 ±0.0000006 5
Input Voltage ±0.2 0.003 ±0.00060 ±0.0000004 6
Total
±0.249 ±0.148
According to the relative WCEE and REE results, the source of error can be ranked in
relation to each other. As depicted, the major source of error contribution is due to the
errors associated with the shaft torque. In contrast, the input voltage is the least
contributing error source in the overall efficiency measurement system. However,
considering, the influence coefficients, it can be seen that the rotor speed is by far the most
influential component in efficiency determination. Despite this, it is only ranked in third
place in terms of percentage error in terms of the WCEE and REE technique. This is due to
the multiplication process contained within the WCEE and REE techniques. Therefore, due

Chapter Nine: Error Analysis of Efficiency Determination
Non-Intrusive Efficiency Estimation of Induction Machines 162
to the higher accuracy levels of the tachometer, its multiplicative effect on the influence
coefficient causes its contribution to the WCEE and REE values to be reduced.
The overall errors obtained from the contributions of all the error sources are ±0.249% for
the WCEE technique and ±0.148% for the REE technique. As expected the REE represents
smaller tolerances of error and hence reflects errors associated with the measurement
process more realistically.
The direct method only requires the measurement of shaft torque, rotor speed and input
power to calculate the motor’s efficiency. The instrumental error for the direct method is
indicated in Table 9.2 below.
Table 9.2 Instrumental error for the 11kW motor using the direct method
Error Source Relative
Error [%]
Absolute Influence
Coefficient
WCEE [%]
REE [%]
Rank
Input Power ±0.2 1.001 ±0.2 ±0.04 1
Shaft Torque ±0.2 1 ±0.2 ±0.04 2
Rotor Speed ±0.05 1 ±0.05 ±0.003 3
Total
±0.450 ±0.287
According to the results shown above, the influence coefficients show that the
contributions of each measurand are equal. Furthermore, it indicated that a 1% error in the
measurand proportionally translates to a 1% error in efficiency. This can be explained by
considering that the efficiency is equal to the ratio of the product of torque and speed to the
input power, where each variable is measured independently of each other. For example, a
small error injected onto the torque measurement is proportional to the error in efficiency
with a proportionality constant equal to the ratio of rotor speed and input power. Since the
changes in torque do not affect other variables, the proportionality constant remains
unchanged irrespective of the perturbations placed on the torque measurement. This
concept can also be applied to the other parameters. The overall WCEE and REE errors are
±0.450% and ±0.287% respectively.
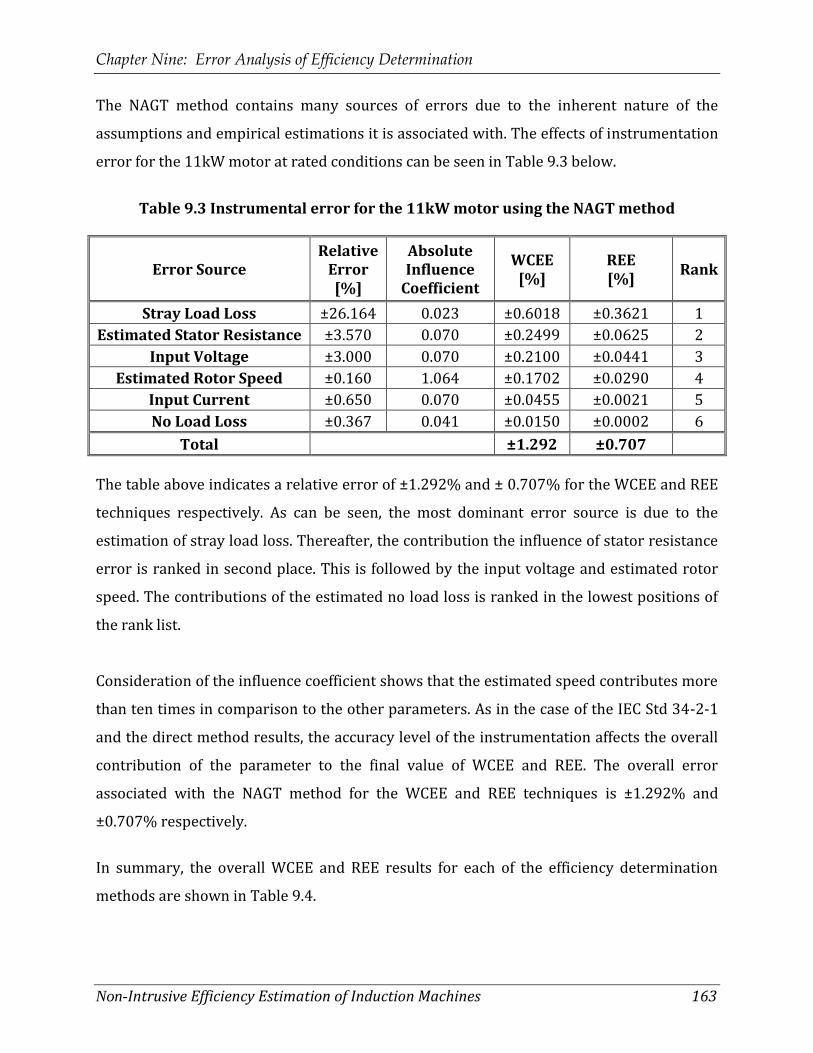
Chapter Nine: Error Analysis of Efficiency Determination
Non-Intrusive Efficiency Estimation of Induction Machines 163
The NAGT method contains many sources of errors due to the inherent nature of the
assumptions and empirical estimations it is associated with. The effects of instrumentation
error for the 11kW motor at rated conditions can be seen in Table 9.3 below.
Table 9.3 Instrumental error for the 11kW motor using the NAGT method
Error Source Relative
Error [%]
Absolute Influence
Coefficient
WCEE [%]
REE [%]
Rank
Stray Load Loss ±26.164 0.023 ±0.6018 ±0.3621 1
Estimated Stator Resistance ±3.570 0.070 ±0.2499 ±0.0625 2
Input Voltage ±3.000 0.070 ±0.2100 ±0.0441 3
Estimated Rotor Speed ±0.160 1.064 ±0.1702 ±0.0290 4
Input Current ±0.650 0.070 ±0.0455 ±0.0021 5
No Load Loss ±0.367 0.041 ±0.0150 ±0.0002 6
Total
±1.292 ±0.707
The table above indicates a relative error of ±1.292% and ± 0.707% for the WCEE and REE
techniques respectively. As can be seen, the most dominant error source is due to the
estimation of stray load loss. Thereafter, the contribution the influence of stator resistance
error is ranked in second place. This is followed by the input voltage and estimated rotor
speed. The contributions of the estimated no load loss is ranked in the lowest positions of
the rank list.
Consideration of the influence coefficient shows that the estimated speed contributes more
than ten times in comparison to the other parameters. As in the case of the IEC Std 34-2-1
and the direct method results, the accuracy level of the instrumentation affects the overall
contribution of the parameter to the final value of WCEE and REE. The overall error
associated with the NAGT method for the WCEE and REE techniques is ±1.292% and
±0.707% respectively.
In summary, the overall WCEE and REE results for each of the efficiency determination
methods are shown in Table 9.4.

Chapter Nine: Error Analysis of Efficiency Determination
Non-Intrusive Efficiency Estimation of Induction Machines 164
Table 9.4 Overall WCEE and REE results for each method
WCEE
[%] REE [%]
IEC Std 34-2-1 ±0.249 ±0.148
Direct Method ±0.450 ±0.287
NAGT Method ±1.292 ±0.707
Based on the above, the NAGT method contains a higher degree of instrumentation errors
i.e. approximately 5.2 times more than the IEC Std 34-2-1. Since the IEC Std 34-2-1 indirect
method is considered to be highly intrusive, it suggests that a compromise between
accuracy and intrusiveness is inevitable when selecting a test procedure for determining
efficiency.
Comparison of results between the IEC Std 34-2-1 and the direct method indicates that the
manner in which the efficiency is calculated contributes to the value of WCEE and REE.
Despite the fact the same instruments were used in each method (and hence same
instrument tolerances), the WCEE and REE values were higher for the direct method in
comparison to the IEC Std 34-2-1 values. This was further emphasised by the contribution
of errors associated with each measurable parameter, which is affected by the influence
coefficients. In the direct method efficiency equation, the influence of errors in the
measurable parameters (torque, speed and input power) have the same contributing effect
on the overall efficiency due to the linear relationship between the parameter and the
efficiency producing similar influence coefficients. This is not the case for the IEC Std 34-2-
1 as the governing separation of loss equation reflects a more complicated relationship
between the individual measurable parameters and the overall efficiency. The lower values
of WCEE and REE for the IEC Std 34-2-1 further emphasises that the method for efficiency
determination is more accurate than that of the direct method.
Additionally, the choice of instrumentation plays a vital role in its contribution to the
overall WCEE and REE results. Since the relative instrumentation error has a multiplicative
effect on the influence coefficient, special attention should be given to the parameters with

Chapter Nine: Error Analysis of Efficiency Determination
Non-Intrusive Efficiency Estimation of Induction Machines 165
larger influence coefficients. In particular, investing in instruments with higher accuracy
levels used to measure speed, torque and input power will significantly reduce the overall
WCEE and REE results.
To validate the above, the requirement for instrumentation accuracies for the respective
parameters, in accordance with the IEC Std 34-2-1, was placed on the NAGT method. The
results at rated loading conditions are shown in Table 9.5.
Table 9.5 Effects of IEC Std 34-2-1 relative instrumental errors on the NAGT method
Error Source Relative
Error [%]
Absolute Influence
Coefficient
WCEE [%]
REE [%]
Rank
Stray Load Loss ±26.164 0.023 ±0.6018 ±0.3621 1
Estimated Stator Resistance ±0.2 0.070 ±0.0140 ±0.0002 4
Input Voltage ±0.2 0.070 ±0.0140 ±0.0002 4
Estimated Rotor Speed ±0.05 1.064 ±0.0532 ±0.0028 2
Input Current ±0.2 0.070 ±0.0140 ±0.0002 3
No Load Loss ±0.367 0.041 ±0.0150 ±0.0002 2
Total
±0.7120 ±0.6048
As expected, the effects of introducing lower tolerances on the relative instrument errors,
reduce the WCEE and REE values. For the case above, the WCEE and REE values were
improved to ±0.712% and ±0.6% respectively. Despite the improvement the instrument
errors associated with the NAGT method are still higher than those obtained from the IEC
Std 34-2-1 due to the estimated SLL and no load loss components
Further investigation of the effect of loading on the values of WCEE and REE was
conducted. The results showing the variation of WCEE and REE with load for each of the
methods for the 11kW motor is depicted in Table 9.6.

Chapter Nine: Error Analysis of Efficiency Determination
Non-Intrusive Efficiency Estimation of Induction Machines 166
Table 9.6 Variation of WCEE and REE with load for the 11kW motor
IEC Std 34-2-1 Direct Method NAGT Method
Load [%]
WCEE [%]
REE [%]
WCEE [%]
REE [%]
WCEE [%]
REE [%]
150 ±0.3644 ±0.2275 ±0.4502 ±0.2874 ±1.5250 ±0.7990
125 ±0.3051 ±0.1860 ±0.4502 ±0.2874 ±1.3795 ±0.7351
100 ±0.2493 ±0.1479 ±0.4502 ±0.2874 ±1.2925 ±0.7071
75 ±0.1915 ±0.1108 ±0.4502 ±0.2874 ±1.1443 ±0.6537
50 ±0.1827 ±0.1189 ±0.4502 ±0.2874 ±1.1136 ±0.6431
25 ±0.1052 ±0.0631 ±0.4502 ±0.2874 ±1.1786 ±0.6595
For the case of the IEC Std 34-2-1 and the NAGT, the WCEE and REE errors show a decrease
in values with a decrease in load. Since the instrumentation is the same for each load, the
variation indicates that the influence coefficients vary according to the load. This is due to
the progressive increase in magnitude of power, current, resistance and torque associated
with the increase in load. In contrast, there is no variation of the WCEE and REE results
with load for the direct method. This can be attributed to the linearity and proportionality
of the changes in efficiency with torque, speed or input power, as previously mentioned.
In order to validate this, a comparison of the absolute influence coefficients for the 100%
and 25% loading conditions was performed. The respective coefficient values are shown in
Table 9.7.
Table 9.7 Comparison of influence coefficients at 100% and 25% load
Error Source
Absolute Influence Coefficient
100 % Load 25 % Load
Shaft Torque 0.521 0.124
Input Power 0.460 0.128
Rotor Speed 1.013 1.04
Input Current 0.005 0.007
Stator Resistance 0.004 0.0001
Input Voltage 0.003 0.007
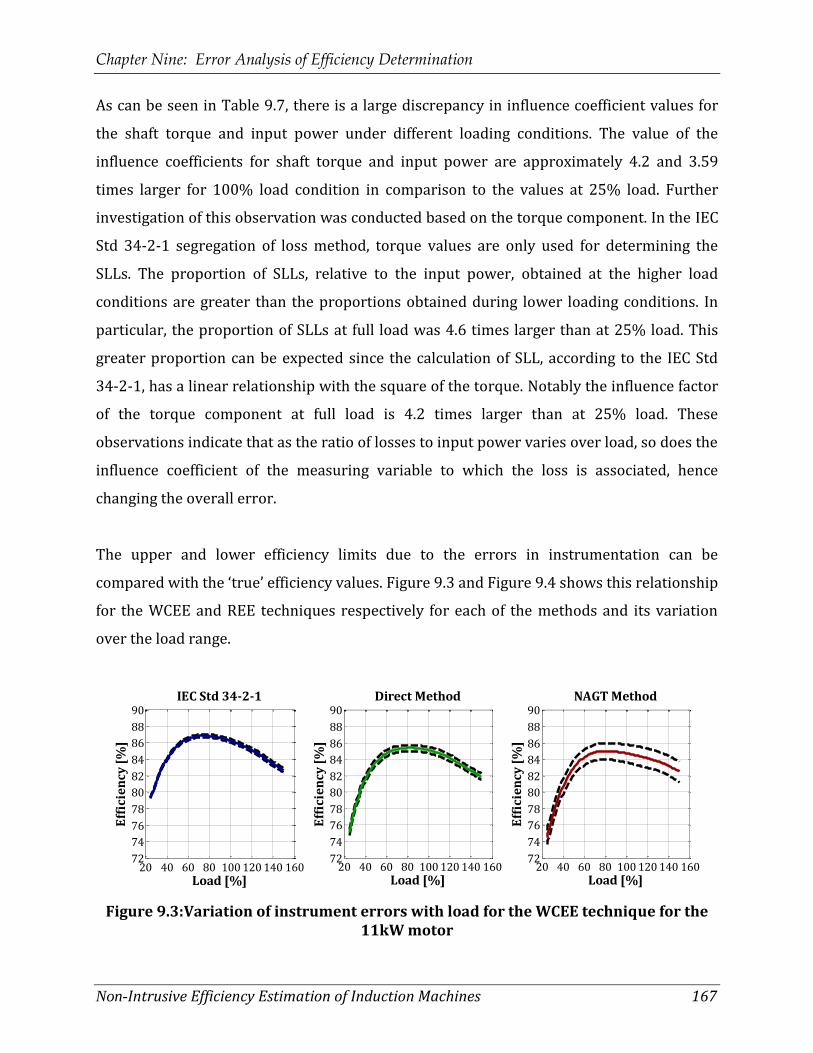
Chapter Nine: Error Analysis of Efficiency Determination
Non-Intrusive Efficiency Estimation of Induction Machines 167
As can be seen in Table 9.7, there is a large discrepancy in influence coefficient values for
the shaft torque and input power under different loading conditions. The value of the
influence coefficients for shaft torque and input power are approximately 4.2 and 3.59
times larger for 100% load condition in comparison to the values at 25% load. Further
investigation of this observation was conducted based on the torque component. In the IEC
Std 34-2-1 segregation of loss method, torque values are only used for determining the
SLLs. The proportion of SLLs, relative to the input power, obtained at the higher load
conditions are greater than the proportions obtained during lower loading conditions. In
particular, the proportion of SLLs at full load was 4.6 times larger than at 25% load. This
greater proportion can be expected since the calculation of SLL, according to the IEC Std
34-2-1, has a linear relationship with the square of the torque. Notably the influence factor
of the torque component at full load is 4.2 times larger than at 25% load. These
observations indicate that as the ratio of losses to input power varies over load, so does the
influence coefficient of the measuring variable to which the loss is associated, hence
changing the overall error.
The upper and lower efficiency limits due to the errors in instrumentation can be
compared with the ‘true’ efficiency values. Figure 9.3 and Figure 9.4 shows this relationship
for the WCEE and REE techniques respectively for each of the methods and its variation
over the load range.
Figure 9.3:Variation of instrument errors with load for the WCEE technique for the
11kW motor
20 40 60 80 100 120 140 16072
74
76
78
80
82
84
86
88
90IEC Std 34-2-1
Load [%]
Eff
icie
ncy
[%
]
20 40 60 80 100 120 140 16072
74
76
78
80
82
84
86
88
90Direct Method
Load [%]
Eff
icie
ncy
[%
]
20 40 60 80 100 120 140 16072
74
76
78
80
82
84
86
88
90NAGT Method
Load [%]
Eff
icie
ncy
[%
]

Chapter Nine: Error Analysis of Efficiency Determination
Non-Intrusive Efficiency Estimation of Induction Machines 168
Figure 9.4: Variation of instrument errors with load for the REE technique for the
11kW motor
As shown, the possible errors in determining the efficiency at the 25 % load are relatively
small. However, at the higher loading points the relative errors becomes larger. For the
case of the WCEE technique, the maximum possible interval in which the efficiency lies, at
150 % load, is 0.72%, 0.9% and 3.05% for the IEC Std 34-2-1, the direct method and the
NAGT method respectively. For the case of the REE technique, the uncertainty of each of the
methods at 150% load is 0.44%, 0.574% and 1.598% respectively. As expected, the values
for the REE technique are lower than those obtained from the WCEE since the REE values
represent a more realistic indication of the errors associated with instrumentation.
The error analysis discussed above was conducted on a set of data obtained for the 15kW
and 7.5kW motor and is presented in the following sections for completeness.
9.5.2 15kW Motor Results
The sources of error and their corresponding influence coefficients for the IEC Std 34-2-1
applied to the 15kW motor under rated conditions is shown in Table 9.8. The relative
WCEE and REE errors are also presented.
20 40 60 80 100 120 140 16072
74
76
78
80
82
84
86
88
90IEC Std 34-2-1
% Load [%]
Eff
icie
ncy
[%
]
20 40 60 80 100 120 140 16072
74
76
78
80
82
84
86
88
90Direct Method
Load [%]E
ffic
ien
cy [
%]
20 40 60 80 100 120 140 16072
74
76
78
80
82
84
86
88
90NAGT Method
Load [%]
Eff
icie
ncy
[%
]

Chapter Nine: Error Analysis of Efficiency Determination
Non-Intrusive Efficiency Estimation of Induction Machines 169
Table 9.8 Instrumental error for the 15kW motor using the IEC Std 34-2-1
Error Source Relative
Error [%]
Absolute Influence
Coefficient
WCEE [%]
REE [%]
Rank
Shaft Torque ±0.2 0.620 ±0.1239681 ±0.0153681 1
Input Power ±0.2 0.562 ±0.1124450 ±0.0126439 2
Rotor Speed ±0.05 1.008 ±0.0504234 ±0.0025425 3
Input Voltage ±0.2 0.002 ±0.0004214 ±0.0000002 4
Stator Resistance
±0.2 0.002 ±0.0003969 ±0.0000002 5
Input Current ±0.2 0.002 ±0.0003728 ±0.0000001 6
Total
±0.288 ±0.175
Based on the above, the ranking of the individual parameter is similar to that indicated for
the 11kW motor, however values are for the WCEE and REE are higher.
The impact of instrumental errors on the direct method for the 15kW motor is presented in
Table 9.9 below.
Table 9.9 Instrumental error for the 15kW motor using the direct method
Error Source Relative
Error [%]
Absolute Influence
Coefficient
WCEE [%]
REE [%]
Rank
Input Power ±0.2 1.002 ±0.2 ±0.040 1
Shaft Torque ±0.2 1.000 ±0.2 ±0.040 2
Rotor Speed ±0.05 1.000 ±0.05 ±0.003 3
Total
±0.450 ±0.287
The results reflected above are identical to the 11kW and indicate that the errors
associated with measurement, when using the direct method, is not dependant on the size
of the motor. This can be attributed to the same linear relationship between the efficiency
and individual error in parameters.
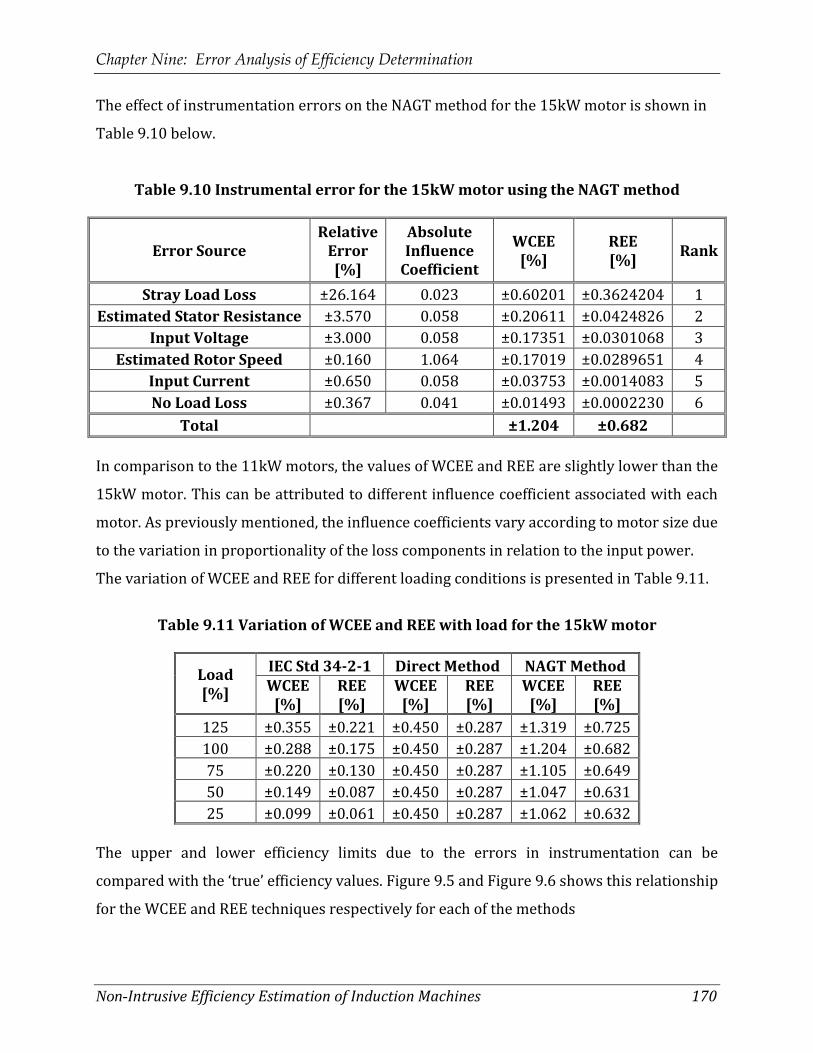
Chapter Nine: Error Analysis of Efficiency Determination
Non-Intrusive Efficiency Estimation of Induction Machines 170
The effect of instrumentation errors on the NAGT method for the 15kW motor is shown in
Table 9.10 below.
Table 9.10 Instrumental error for the 15kW motor using the NAGT method
Error Source Relative
Error [%]
Absolute Influence
Coefficient
WCEE [%]
REE [%]
Rank
Stray Load Loss ±26.164 0.023 ±0.60201 ±0.3624204 1
Estimated Stator Resistance ±3.570 0.058 ±0.20611 ±0.0424826 2
Input Voltage ±3.000 0.058 ±0.17351 ±0.0301068 3
Estimated Rotor Speed ±0.160 1.064 ±0.17019 ±0.0289651 4
Input Current ±0.650 0.058 ±0.03753 ±0.0014083 5
No Load Loss ±0.367 0.041 ±0.01493 ±0.0002230 6
Total
±1.204 ±0.682
In comparison to the 11kW motors, the values of WCEE and REE are slightly lower than the
15kW motor. This can be attributed to different influence coefficient associated with each
motor. As previously mentioned, the influence coefficients vary according to motor size due
to the variation in proportionality of the loss components in relation to the input power.
The variation of WCEE and REE for different loading conditions is presented in Table 9.11.
Table 9.11 Variation of WCEE and REE with load for the 15kW motor
Load [%]
IEC Std 34-2-1 Direct Method NAGT Method WCEE
[%] REE [%]
WCEE [%]
REE [%]
WCEE [%]
REE [%]
125 ±0.355 ±0.221 ±0.450 ±0.287 ±1.319 ±0.725
100 ±0.288 ±0.175 ±0.450 ±0.287 ±1.204 ±0.682
75 ±0.220 ±0.130 ±0.450 ±0.287 ±1.105 ±0.649
50 ±0.149 ±0.087 ±0.450 ±0.287 ±1.047 ±0.631
25 ±0.099 ±0.061 ±0.450 ±0.287 ±1.062 ±0.632
The upper and lower efficiency limits due to the errors in instrumentation can be
compared with the ‘true’ efficiency values. Figure 9.5 and Figure 9.6 shows this relationship
for the WCEE and REE techniques respectively for each of the methods

Chapter Nine: Error Analysis of Efficiency Determination
Non-Intrusive Efficiency Estimation of Induction Machines 171
Figure 9.5:Variation of instrument errors with load for the WCEE technique for the
15kW motor
Figure 9.6:Variation of instrument errors with load for the REE technique for the
15kW motor
The results shown above show similar trends to that of the 11kW motor. For the WCEE, the
For the case of the WCEE technique, the possible interval in which the ‘true’ efficiency lies
at 125 % load is 0.71%, 0.9% and 2.638 % for the IEC Std 34-2-1, the direct method and the
NAGT method respectively. For the case of the REE technique, the uncertainty of each of the
methods at 125% load is 0.44%, 0.574% and 1.45% respectively.
9.5.3 7.5kW Motor Results
The results for the instrument error of the 7.5kW motor for the IEC Std 34-2-1 is shown in
Table 9.12
0 20 40 60 80 100 120 14072
74
76
78
80
82
84
86
88
90IEC Std 34-2-1
Load [%]
Eff
icie
ncy
[%
]
0 20 40 60 80 100 120 14072
74
76
78
80
82
84
86
88
90Direct Method
Load [%]E
ffic
ien
cy [
%]
0 20 40 60 80 100 120 14072
74
76
78
80
82
84
86
88
90NAGT Method
Load [%]
Eff
icie
ncy
[%
]
0 20 40 60 80 100 120 14072
74
76
78
80
82
84
86
88
90IEC Std 34-2-1
% Load [%]
Eff
icie
ncy
[%
]
0 20 40 60 80 100 120 14072
74
76
78
80
82
84
86
88
90Direct Method
Load [%]
Eff
icie
ncy
[%
]
0 20 40 60 80 100 120 14072
74
76
78
80
82
84
86
88
90NAGT Method
Load [%]
Eff
icie
ncy
[%
]

Chapter Nine: Error Analysis of Efficiency Determination
Non-Intrusive Efficiency Estimation of Induction Machines 172
Table 9.12 Instrumental error for the 7.5kW motor using the IEC Std 34-2-1
Error Source Relative
Error [%]
Absolute Influence
Coefficient
WCEE [%]
REE [%]
Rank
Shaft Torque ±0.2 0.515 ±0.1029566 ±0.0106001 1
Input Power ±0.2 0.475 ±0.0950040 ±0.0090258 2
Rotor Speed ±0.05 1.012 ±0.0505845 ±0.0025588 3
Input Current ±0.2 0.007 ±0.0014058 ±0.0000020 4
Stator Resistance ±0.2 0.006 ±0.0011134 ±0.0000012 5
Input Voltage ±0.2 0.004 ±0.0008216 ±0.0000007 6
Total ±0.252 ±0.149
The results depicted above show similar trends to that seen in the 11kW results. However,
the overall WCEE and REE are slightly higher.
The instrumental error for the 7.5 W motor for the case of the direct method is presented
in Table 9.13.
Table 9.13 Instrumental error for the 7.5kW motor using the direct method
Error Source Relative
Error [%]
Absolute Influence
Coefficient
WCEE [%]
REE [%]
Rank
Input Power ±0.20 1.002 ±0.2 ±0.0401 1
Shaft Torque ±0.20 1.000 ±0.2 ±0.0400 2
Rotor Speed ±0.05 1.000 ±0.05 ±0.0025 3
Total
±0.450 ±0.287
As expected, the final values of WCEE and REE are identical to the values obtained for the
11kW and 15kW for reasons previously mentioned.
The instrument errors for the 7.5kW motor for the NAGT method is shown in Table 9.14
below.

Chapter Nine: Error Analysis of Efficiency Determination
Non-Intrusive Efficiency Estimation of Induction Machines 173
Table 9.14 Instrumental error for the 7.5 kW motor using the NAGT method
Error Source Relative
Error [%]
Absolute Influence
Coefficient
WCEE [%]
REE [%]
Rank
Stray Load Loss ±26.16 0.024 ±0.61652 ±0.3800917 1
Estimated Stator Resistance ±3.57 0.084 ±0.30059 ±0.0903524 2
Input Voltage ±3.00 0.084 ±0.25304 ±0.0640315 3
Estimated Rotor Speed ±0.16 1.065 ±0.17044 ±0.0290487 4
Input Current ±0.65 0.084 ±0.05473 ±0.0029952 5
No Load Loss ±0.37 0.042 ±0.01529 ±0.0002338 6
Total
±1.41 ±0.753
As can be see, the relative WCEE and REE values for the NAGT method is 1.41% and
0.753%. Respectively
The variation of WCEE and REE with load for the 7.5 kW motor is presented below.
Table 9.15 Variation of WCEE and REE with load for the 7.5kW motor
Load [%]
IEC Std 34-2-1 Direct Method NAGT Method
WCEE REE WCEE REE WCEE REE
150 ±0.3644 ±0.2273 ±0.4504 ±0.2875 ±1.7488 ±0.8989
125 ±0.3067 ±0.1867 ±0.4504 ±0.2875 ±1.5855 ±0.8251
100 ±0.2519 ±0.1490 ±0.4504 ±0.2875 ±1.4106 ±0.7528
75 ±0.1977 ±0.1135 ±0.4504 ±0.2875 ±1.2762 ±0.7013
50 ±0.1366 ±0.0787 ±0.4504 ±0.2875 ±1.1935 ±0.6728
25 ±0.0889 ±0.0576 ±0.4504 ±0.2875 ±1.2072 ±0.6754
Based on the above WCEE and REE values the upper and lower bounds of errors in
efficiency can be seen in Figure 9.7 and Figure 9.8 below.

Chapter Nine: Error Analysis of Efficiency Determination
Non-Intrusive Efficiency Estimation of Induction Machines 174
Figure 9.7:Variation of instrument errors with load for the WCEE technique for the 7.5 kW motor
Figure 9.8:Variation of instrument errors with load for the REE technique for the 7.5kW motor
The maximum range in which the ‘true’ efficiency can exist occurs at 150% and is 0.72%,
0.9% and 3.49% for the IEC Std 34-2-1, the direct method and the NAGT method
respectively using the WCEE technique. For the case of REE, the maximum interval in
which efficiency can be seen at 150% load is 0.44%, 0.57% and 1.79% respectively.
0 20 40 60 80 10012014016072
74
76
78
80
82
84
86
88
90IEC Std 34-2-1
Load [%]
Eff
icie
ncy
[%
]
0 20 40 60 80 10012014016072
74
76
78
80
82
84
86
88
90Direct Method
Load [%]
Eff
icie
ncy
[%
]
0 20 40 60 80 10012014016072
74
76
78
80
82
84
86
88
90NAGT Method
Load [%]
Eff
icie
ncy
[%
]
0 20 40 60 80 10012014016072
74
76
78
80
82
84
86
88
90IEC Std 34-2-1
% Load [%]
Eff
icie
ncy
[%
]
0 20 40 60 80 10012014016072
74
76
78
80
82
84
86
88
90Direct Method
Load [%]
Eff
icie
ncy
[%
]
0 20 40 60 80 10012014016072
74
76
78
80
82
84
86
88
90NAGT Method
Load [%]
Eff
icie
ncy
[%
]

Chapter Nine: Error Analysis of Efficiency Determination
Non-Intrusive Efficiency Estimation of Induction Machines 175
9.6 Concluding Remarks
This chapter presented the error analysis of efficiency determination for the IEC Std 34-2-
1, the direct method and the NAGT method on the 11kW, 15kW and 7.5kW motors.
The focus of the error analysis was aimed at investigating the effects of instrumentation
errors in parameter measurements on the efficiency value of the motor. In order to conduct
this investigation, WCEE and REE techniques were employed. These techniques are
advantageous in that they cater for the effects of errors in individual parameters
independently of each other. This is achieved by the inclusion of an influence coefficient.
The error associated with the REE technique is smaller than that of the WCEE and provides
a more realistic representation of the errors associated with measured data based on the
effects of instrument errors.
The results presented confirm that the IEC Std 34-2-1 method is more accurate than the
direct and NAGT methods. The IEC Std 34-2-1 method is the most intrusive (due to the
requirements of no load and variable load test) yet provides the highest accuracy. This
emphasises the trade off between accuracy and level of intrusion when considering
efficiency testing procedures.
For the case of the 11kW motor at rated load, the associated WCEE and REE errors of the
IEC Std 34-2-1 and NAGT method were summarised in Table 9.4. As shown, the
uncertainties of the NAGT method are approximately five times higher than the IEC Std 34-
2-1. Since the purpose of efficiency estimation is merely to provide an indication of the
operating efficiency, a ±0.7% uncertainty does not significantly impact the operator’s
judgment of the status of the machine. For example, if the true value of a motor’s efficiency
is 80%, an uncertainty of ±0.7% indicates that the machine is between 80.85% and 79.15%
efficient. This variance is, therefore, small enough to make a reasonable deduction whether
the machine operating with an appropriate efficiency level. Therefore, decisions as to

Chapter Nine: Error Analysis of Efficiency Determination
Non-Intrusive Efficiency Estimation of Induction Machines 176
whether to replace or repair the machine is not drastically affected by the uncertainty of
0.7% but rather the efficiency range the machine is operating in.
However, the effects of tolerance on instrumentation play an important role in the overall
WCEE and REE. This was demonstrated by the improvement in WCEE and REE values
when incorporating the stricter instrument tolerance, according to the IEC Std 34-2-1, on
the parameters used in the NAGT method. This emphasises the importance of accurate and
calibrated in efficiency testing. Therefore, special attention in instrumentation should be
given to parameters showing higher influence coefficients in order to reduce the overall
WCEE and REE values.
Lastly, it was observed that the WCEE and REE values vary with changes in load. This was
attributed the disparity of the influence coefficients with varying load conditions. This was
due to the variation of the loss distribution, in relation to the input power over the loading
range. Based on this it was established that the values of WCEE and REE become larger
with an increase in load. Additionally, the values of WCEE and REE for the IEC Std 34-2-1
and the NAGT method showed variation in relation to the size of the motors.

CHAPTER TEN 10 CONCLUSIONS AND
RECOMMENDATIONS
This chapter present the conclusion and recommendations based on the experimental results
and work carried out in this thesis.

Chapter Ten: Conclusions and Recommendations
Non-Intrusive Efficiency Estimation of Induction Machines 178
10.1 Conclusions
This thesis has proposed a non-intrusive efficiency estimation method for induction
machines. The main focus was based on the investigation, implementation and analysis of
the NAGT method. This method is based on the air gap torque method however it combines
various non-intrusive methods to estimate the parameters that are traditionally measured
in a highly intrusive manner. This includes the stator winding resistance, rotor speed, no
load and stray load losses.
Efficiency tests were conducted on three different motors with power ratings of 7.5kW,
11kW and 15kW in the Machine’s Laboratory at the University of Cape Town. The test
conducted followed the methodology based on the IEC Std 34-2-1, the direct method and
the proposed NAGT method.
Based on the results and error analysis of the experiments presented, the following
conclusions can be made.
10.1.1 Stator Winding Resistance Estimation
The stator winding resistance of an induction machine is traditionally determined by
performing an unpowered test which involves shutting down the machine and ensuring the
rotor is at standstill measuring the stator winding resistance. This method is considered to
be highly intrusive and hence unsatisfactory for the NAGT method. Therefore, a low
intrusive means for stator winding resistance determination was required.
The stator resistance estimation technique adopted for this thesis was based on a DC signal
injection technique proposed in [43]. The technique is based upon the asymmetrical
resistance created by the ‘on’-‘off’ switching of a MOSFET connected in parallel to an
external resistor. The DC voltage and current components associated with this switching
was used to calculate the stator winding resistance. In order to make the resistance

Chapter Ten: Conclusions and Recommendations
Non-Intrusive Efficiency Estimation of Induction Machines 179
estimation as accurate as possible, compensation for the DC offset components associated
with the mains supply and the cable resistance was made before the final value of stator
resistance was obtained.
The above method, however, is associated with the increase in stator unbalance, additional
power loss and torque pulsations. In order to avoid this during efficiency testing, the use of
two switches allowed for the circuit to be switched in only when the estimation of
resistance is requires, thereafter the additional circuitry was bypassed. This eliminated the
negative impact of unbalance, torque pulsations and additional power loss during
efficiency testing.
Based on the implementation and tests conducted, it can be concluded that the stator
winding resistance can be estimated using DC signal injection. The results for stator
resistance estimation obtained from experimentation proved to be an over estimate for the
case of all three motors tested. The accuracy of the estimated resistance was within 3.57%
in relation to the expected resistance values. The impact of this stator winding resistance
estimation on motor efficiency, using the NAGT method, is to affect the value of air gap
torque obtained using equation 6.5. An overestimation of Rs was shown to decrease the air
gap torque value and vice versa. This subsequently affects the overall efficiency value
obtained using equation 6.11. Therefore, it can be concluded that the accuracy of the signal
injection circuit needs to be improved in order to attain an accurate efficiency estimation
value.
In terms of field applications, the installation of the resistance estimation circuit can be
considered as intrusive. However, once the circuit has been installed it can thereafter be
regarded as non-intrusive. To avoid any disruption to the motor during operation, the
circuit can be installed simultaneously with scheduled maintenance procedures. This does,
however, suggest that the resistance estimation circuit is not portable but rather a
dedicated device.

Chapter Ten: Conclusions and Recommendations
Non-Intrusive Efficiency Estimation of Induction Machines 180
10.1.2 Rotor Speed Estimation
The shaft rotor speed is yet another parameter required for many motor efficiency
determination methods. Traditionally, the rotor speed is obtained by the use of shaft
mounted speed encoders or highly advanced tachometers. These instruments require
direct access to the motor’s shaft yet, in many field applications, the motor’s shaft may not
be easily accessible. Therefore, the NAGT method required that the rotor speed is detected
in a non-intrusive manner.
To achieve this, the rotor speed was detected by exploitation of the inevitable mechanical
vibration associated with a motor in operation. The process of speed detection
incorporated the use of an accelerometer to measure the motor’s vibration therefore
applying a signal processing technique (FFT) to the acquired signal. Observing the
frequency spectrum in the range of 0-30Hz, the rotational frequency components were
detected. This frequency component was then translated to rotational speed.
Based on the results provided, it can be concluded that the rotor speed can be detected in a
non-intrusive manner with a high level of accuracy (within 0.16%.). The rotational
frequency component proved to be the most dominant component in the low frequency
range which made its detection unquestionable. This was evident under all loading
conditions. Therefore, it can be concluded that the rotor speed can be estimated non-
intrusively, reliably and accurately using machine vibration spectrum analysis. The high
accuracy levels attained using the vibration spectrum analysis suggest that it does not
significantly degrade the value of efficiency obtained using the NAGT method.
Due to the use of spectrum analysis techniques, the frequency resolution plays an
important role in the accuracy of speed diction. As was shown, by increasing the sample
time, the frequency resolution can be improved from 0.1Hz (10 seconds) to 0.0167Hz (60
seconds). In terms of speed, a 0.1Hz frequency resolution translates to speed detection of
within ±6rpm whereas a 0.0167Hz resolution translates to speed detection within ±1rpm.
In this thesis the data capturing time was limited to a maximum of 10 seconds due to the

Chapter Ten: Conclusions and Recommendations
Non-Intrusive Efficiency Estimation of Induction Machines 181
requirements contained in the methodology. Fortunately, this did not impede the accuracy
of the speed detection results as all the results indicated are within 2.42 rpm relative to the
measured speed.
The speed estimation technique can easily be implemented in field applications. The
requirements for speed detection only require access to the outer casing of the motor, an
accelerometer and sufficient software to perform the FFT. These requirements can easily
be fulfilled both effortlessly and cost effectively.
10.1.3 Loss Estimation
The NAGT method employs empirical calculations in order to determine the no load losses.
This eliminates the need to conduct a no-load test which requires that the motors load be
removed and that a variable voltage supply be readily available. The total no load loss
contribution was empirically estimated to be 3.5% of the rated input power. For the case of
the 11kW and 15kW motors this proved to be an underestimation, in relation to the
expected values over most of the loading range. In contrast, for the case of the 7.5kW motor
it proved to be an overestimate. It was shown that this discrepancy was due to the relative
loss distribution, in relation to the input power, which differs according to motor size. The
impact of the no load loss estimation affects the overall efficiency. An over estimate in loss
translates to an underestimate in overall efficiency estimation, while an under-estimate
translates to higher efficiency values. Therefore, it can be concluded that no load loss
estimation should be estimated as accurately as possible in order to obtain an accurate
estimate of efficiency.
In terms of SLL estimation, an assigned allowance according to the IEC Std 34-2-1 can be
used to estimate the SLLs at rated conditions. For the purpose of this thesis the value
obtained at rated conditions was employed over the entire loading range. By doing so,
these estimated values are not load dependant, which is not the case presented in reality.
This proved to be an over estimate in SLLs for the most part of the loading range for all
three motors tested. It can therefore be concluded that this is an insufficient means of SLL

Chapter Ten: Conclusions and Recommendations
Non-Intrusive Efficiency Estimation of Induction Machines 182
estimation. The effects of this over estimate in SLLs are to reduce the overall estimated
efficiency values. This suggests that the motor is perceived to be operating at a lower
efficiency value, which, in reality may not be the case.
To rectify this, an improved SLL estimation technique was suggested. The improved
estimation technique incorporated a linear regression technique to the plot of SLL against
the square of the torque. This process provides a straight line passing through the origin
and the value of SLL obtained empirically at rated conditions. Based on this, the ‘improved’
values of SLLs can be obtained at any load condition. Therefore, a more realistic approach
to SLL estimation can be achieved since the SLL values are now load dependant. Despite
remaining an overestimate in comparison to the of the IEC Std 34-2-1 values this method of
SLL is superior than using a fixed value for all load conditions.
10.1.4 Non-Intrusive Efficiency Estimation
Initially the air gap torque equation used in NAGT method was questioned, due to the
discrepancies in literature, as to whether it accounts for the core loss component. This
investigation was resolved by simulation and it was concluded that the air gap torque
equation does not account for the core loss component and therefore it needs to be
included in the final efficiency equation. This indicates that the air gap power, as defined by
the air gap torque equation, is merely the input power less the stator copper loss. This
suggests that the computation of the air gap torque can be avoided by simply calculating
the air gap power i.e. input power (using instantaneous currents and voltages) and
subtracting the stator resistance loss (obtained by using stator winding resistance
estimation).
It can be concluded that the air gap torque method can be used to determine the efficiency
of a motor non-intrusively by measuring the line voltages and currents and adopting non-
intrusive stator winding resistance and rotor speed estimation techniques. This is referred
to as the non-intrusive air gap torque (NAGT) method. Furthermore, the values of no load

Chapter Ten: Conclusions and Recommendations
Non-Intrusive Efficiency Estimation of Induction Machines 183
and stray load losses can be calculated empirically. However, in general, the efficiencies
obtained from the NAGT method were lower than that obtained using the IEC Std 34-2-1
and direct method. In particular, the deviations in efficiencies at the lower loading points
were substantially larger than at the higher loading range indicating that the performance
of the method degrades at lower load conditions. This discrepancy was investigated by
introducing the values of the estimated components independently of the others. Based on
this, it was concluded that the effect of SLL estimation was the main contributor to the
deviation in efficiency, particularly at the lower loading points. An ‘improved’ estimation of
SLL was implemented to examine its effect on efficiency. This showed improvements in
efficiencies to within 2% of the values obtained from the IEC Std 34-2-1. Based on the
above it can be concluded that the NAGT method can be used to determine the efficiency
under any load condition. However, if the accuracy is to be improved, revisions of the
accuracy of the stator resistance, rotor speed and loss estimation need to be conducted.
The efficiency trends of the NAGT method showed lower efficiency values in relation to the
IEC Std 34-2-1 and direct method results for all three of the motors tested. This suggests
that the NAGT method can be applied to a wide range of induction motors and is not
restricted by the motor’s size.
The air gap torque method can be used in field applications, to determine the efficiency of
an induction machine non-intrusively. Furthermore, the technique is easily implemented in
industrial applications and its purpose is relevant in a South African context. Under these
conditions however, the efficiency is obtained at one point, i.e. the operating point.
Additionally, the load of the machine, at this operating point, remains unknown and
therefore there is no indication of where along the motor’s efficiency curve the motor is
operating. For example, the machine could be operating with a high efficiency but under
low load conditions. Therefore, in order to make the NAGT estimation more accurate, the
load condition must also be known. To resolve this, the value of current can be used to
provide an indication of the loading conditions. Since the stator current is related to the
loading of the machine, it can be compared to the rated current (obtained from the motor’s
nameplate) in order to provide an indication of whether the machine is operating above or
below rated load

Chapter Ten: Conclusions and Recommendations
Non-Intrusive Efficiency Estimation of Induction Machines 184
10.1.5 Effects of Voltage Unbalance on Motor Efficiency
The effects of magnitude voltage unbalance on the efficiency and its detection using the
NAGT was investigated. Based on the results presented, it can be concluded that the effect
of voltage unbalance is to reduce the overall motor efficiency. This can be attributed to the
increase in the machine’s operating temperature associated with the increase in motor
losses.
The results for the NAGT showed that its technique can be used to determine the motor’s
efficiency during unbalanced conditions since it also varied in accordance to the direct
method with changes in unbalanced conditions. The results consistently showed lower
efficiency values for all tested machines in comparison to the direct method efficiencies.
This is also the case for efficiency values obtained under balanced conditions and therefore
suggests that the NAGT method consistently underestimates the machine’s efficiency in
relation to the direct method.
10.1.6 Error Analysis
The effects of instrumentation errors are known to be the major contributor to sources of
errors in the measurement system. This prompted the investigation of the effects of
instrument errors on the quoted efficiency of a motor. The techniques used for this analysis
was the WCEE and REE techniques. These techniques incorporate the use of an influence
coefficient so that the contribution of error due to a parameter is individually assessed.
These influence coefficients provide an indication of the degree of contribution an
individual parameter has to the overall accuracy of the measurement system.
The results presented indicate that the IEC Std 34-2-1 method is the most accurate in
comparison to the direct and NAGT methods. However, due to the fact that this method is
the most intrusive of them all, it can be concluded that there is a trade off between accuracy
and intrusion, as to be expected.

Chapter Ten: Conclusions and Recommendations
Non-Intrusive Efficiency Estimation of Induction Machines 185
Additionally, the choice of instrumentation is considered to have a major contribution to
the overall WCEE and REE tolerances. In particular, the effect of introducing lower
tolerances in instrumentation of the NAGT method was to significantly improve the
accuracy levels of the WCEE and REE values. Therefore it can be concluded that it is
necessary to employ instrumentation with lower tolerances if accuracy is to be improved.
In particular, it can be suggested that parameters containing higher influence coefficients,
should be given special attention.
It was also concluded that the associated WCEE and REE values varied according to
changes in the machine’s loading conditions. This was attributed to the variation of
influence coefficient with load, since the instrumentation and its respective relative errors
remain unchanged. Furthermore, it can be concluded that the changes in magnitude of the
influence coefficient is associated with the level of loss distribution in relation to the input
power.

Chapter Ten: Conclusions and Recommendations
Non-Intrusive Efficiency Estimation of Induction Machines 186
10.2 Recommendations on Further Research
Based on the above conclusions, the following recommendations can be made.
10.2.1 Stator Winding Resistance Estimation
As previously mentioned, the stator resistance showed over estimated values in relation to
the expected values. In order to improve this, it is suggested that a higher resistance value
for Rext should be employed. As stated in [43], the choice of Rext is dependant on the
tolerable levels of torque pulsations. Since, in this thesis, the effects of torque pulsations
were eliminated during efficiency testing, it stands to reason that a higher value of Rext can
be used. Further investigation should therefore be conducted in order to validate whether
an improved stator winding resistance estimate can be achieved. This should be applied for
all the motors tested
In addition, the stator resistance estimation circuit should be implemented in all three
phases. If the same circuit components are used in each line, the effects of unbalance due to
the circuitry can be reduced. Furthermore, the stator winding resistance can be measured
in all three phases and an average stator winding resistance be obtained.
10.2.2 Rotor Speed Estimation
The speed detection process in this thesis incorporates the use of signal processing
techniques in order to obtain the required rotation frequency component required for
speed estimation. This was done by post processing only once the required data was
captured.
The methodology used in this thesis can be improved by allowing for an online means of
speed detection. This can be achieved by employing a frequency detection algorithm
applied to the vibration spectrum, whereby the rotational frequency component is
identified. Since the rotational frequency component is dominant and easily detectable at

Chapter Ten: Conclusions and Recommendations
Non-Intrusive Efficiency Estimation of Induction Machines 187
the low frequency range (<30Hz), a peak detection algorithm will indicate the largest
frequency component within this frequency range. Thereafter, the frequency component
can be translated into speed and an online speed estimation topology can be established.
One disadvantage of the speed estimation technique is that it requires a minimum data
acquisition time of 10 seconds in order to achieve sufficient frequency resolution to ensure
successful speed estimation. Considering the high accuracy levels of the estimated speed
values obtained using the accelerometer, they can be considered as approximately equal to
the measured values obtained using the tachometer. Therefore, under laboratory
conditions, the use of the tachometer readings can be used in place of the estimated speed
when using the NAGT method. This is to avoid the 10 second delay in data acquisition
between two successive loading points when conducting an efficiency test
10.2.3 Loss Estimation
As already mentioned, the improvement of the loss estimation technique should be
employed in order to determine the associated loss more accurately in order to achieve an
improved means of efficiency estimation
In particular, an improved method of SLL estimation was suggested however further
investigation into this should be conducted.
10.2.4 Non-Intrusive Efficiency Estimation
Since many of the parameters required for efficiency estimation in the NAGT method i.e.
voltage, current, speed and resistance are also required for condition monitoring, a
combination of an efficiency estimation and condition monitoring techniques can be
employed. This allows for a multipurpose device that is relevant for motors installed in
industry.
In this thesis the trapezoidal method was used to calculate the flux linkage integrals in the
air gap torque equation. Due to the high sampling rate (10kHz), the accuracy level of the

Chapter Ten: Conclusions and Recommendations
Non-Intrusive Efficiency Estimation of Induction Machines 188
trapezoidal deemed sufficient. However, more accurate integration methods, such as
Simpsons Rule or Gauss’ Rule, should be investigated.
10.2.5 Effects of Voltage Unbalance on Motor Efficiency
In reality, the voltage supply is polluted with voltage unbalance and harmonics with
varying degrees and combinations. In this thesis, only the effects of voltage magnitude
unbalance were investigated. Since this is not a true reflection of the supply conditions
obtained in industry, the effects of other polluted conditions should be reviewed. This
includes voltage phase unbalance, voltage variation, magnitude over/under voltage
unbalance and harmonics. The success of the NAGT method under these conditions can
then be considered
10.2.6 Error Analysis
The main focus of error analysis was aimed at instrument errors. However, other sources
of error are known to exist, namely methodological errors and human errors. Therefore, in
order to obtain a true reflection of the total error contained in efficiency tested, all sources
of errors need to be accounted for.
Additionally, other statistical methods such standard deviation, sample mean, variance and
probability distribution should also be incorporated into the error analysis process.

References
Non-Intrusive Efficiency Estimation of Induction Machines 189
1 REFERENCES
[1] P.C Sen, Principles of Electric Machines and Power Electronics, 2nd ed.: John Wiley and
Sons, Inc., 1997.
[2] H. M. Mzungu, A. B, Sebitosi, M. A Khan, "Comparison of Standards for Determining
Losses and Efficiency of Three-Phase Induction Motors," in IEEE PES Power Africa, July
2007.
[3] E. Romero, L.F. Mantilla S. Corino, "How the Efficiency of an Induction Machine is
Measured?," in International Conference on Renewable Energy and Power Quality
(ICREPQ), 2008.
[4] B. Reiner, K.Hameyer, R, Belmans, "Comparison of Standards for Determining
Efficiency of Three Phase Induction Motors," IEEE Trans. Energy Conversion, vol. 14,
no. 3, pp. 512-517, September 1999.
[5] A. Boglietti, A. Cavagnino, M. Lazzari, M. Pastorelli, "International Standards for the
Induction Motor Efficiency Evaluation: A Critical Analysis of the Stray-Load Loss
Determination," IEEE Trans. on Industry Applications, vol. 40, no. 5, pp. 1294-1301,
September/October 2004.
[6] Electrical Apparatus Service Association. Understanding Energy Efficient Motors.
[Online].
https://smtp.cpuaid.com/easa/resources/cgis/displayitem.cgi?category=2&name=Promotio
nal+Material&Item=5
[7] B. Lu, T. Habetler, R. Harley, "A Nonintrusive and In-service Motor Efficiency
Estimation Method Using Air-Gap Torque With Considerations of Condtion Monitoring,"
IEEE Trans. Industry Applications, vol. 44, no. 6, pp. 1666-1674, November/ December
2008.
[8] P.G. Cummings, W.D Bowers, W.J. Martiny, "Induction Motor Efficiency Test Methods,"
IEEE Trans. on Industry Application, vol. IA-17, no. 3, pp. 235-272, May/June 1981.
[9] Reliance. AC Motor Efficiency- A guide to Energy Savings-Part 3. [Online]..
http://www.reliance.com/prodserv/motgen/b7087_5/b7087_5_3.htm
[10] Bureau of Energy Efficiency. Electric Motors. [Online].
http://www.energymanagertraining.com/GuideBooks/3Ch2.pdf
[11] A.T.de Almeida, F.J.T.E Ferreira, J.F Busch, P,Angers, "Comparative Analysis of IEEE
112-B and IEC 34-2 Efficiency Testing Standards Using Stray Load Losses in Low-
Voltage Three-Phase Cage Induction Motors," IEEE Trans. on Industry Application, vol.
38, no. 2, pp. 608-614, March/April 2002.
[12] P. Giridhar Kini, R.C. Bansal, R.S Aithal, "Impact of Voltage Unbalance on the
Performance of Three-Phase Induction Motor," South Pacific Journal of Natural Science,
vol. 24, pp. 45-50, 2006.
[13] K.V Vamsi Krishna, "Effects of Unbalanced Voltage on Induction Motor Current and its
Operation Performance," Lecon Systems,.
[14] R. Belmans, W. Deprez, O. Gol, "Increasing Induction Motor Drives Efficiency:
Understanding the Pitfalls," in Electotechnical Institute, Warsaw, 2005, pp. 7-25.

References
Non-Intrusive Efficiency Estimation of Induction Machines 190
[15] M. Manyage, "EEE4099F Course Notes-Voltage Unbalance," University of Cape Town,
2008.
[16] A. Bonnett, "Understanding Efficiency in Squirrel Cage Induction Motors," IEEE Trans.
Industry Application, vol. IA-16, no. 4, pp. 476-483, July/August 1980.
[17] B. Lu, T.G Habetler, R.G Harley, "A Survey of Efficiency-Estimation Methods for In-
Service Induction Motors," IEEE Trans. on Industry Applications, vol. 42, no. 4, pp. 924-
933, July/August 2006.
[18] W.Cao, K. Bradley, "Assessing the Impacts of Rewind and Repeated Rewinds on
Induction Motors: Is an Opportunity for Re-Designing the Machine Being Wasted?,"
IEEE Trans. Industry Application, vol. 42, no. 4, pp. 958-964, July/ August 2006.
[19] Motor Challenge Fact Sheet. Determining Electric Motor Load and Efficiency. [Online].
http://www1.eere.energy.gov/industry/bestpractices/pdfs/10097517.pdf
[20] J. Custodio. (2007) Pump-Zone. [Online]. http://www.pump-zone.com/motors/motors/the-
impact-of-rewinding-on-motor-efficiency.html
[21] B. Gibbon A. Bonnett, "The Result Are In: Motor Repair's Impact on Efficiency,"
Electrical Apparatus Service Assosiation, 2002.
[22] Cao, W., "Comparison of IEEE 112 and New IEC Standard 60034-2-1," IEEE Trans. on
Energy Conversion, vol. 24, no. 3, pp. 802-808, 2009.
[23] IEEE Standard 112, IEEE Standard Test Procedure for Polyphase Induction Motors and
Generators, 2004.
[24] IEC 60034-2-1, Rotating Electrical Meachines-Part 2-1, 2007, Standard method for
determining losses and efficiency from tests (excluding machines for traction vehicles).
[25] SABS-South African Bureau of Standards. (2010) List of Published Standards. [Online].
hhttps://www.sabs.co.za/Business_Units/Standards_SA/Controls/Published_Standards/PS
61.PDF
[26] J.S Hsu, J.D Kueck, M.Olszewski, D.A Casada, P.J Otaduy, L.M Tolbert, "Comparision
of Induction Motor Field Efficiency Evaluation Methods," IEEE Trans. on Industry
Applications, vol. 34, no. 1, pp. 117-125, January/February 1998.
[27] J.S Hsu, P.L Sorenson, "Field Assessment of Induction Motor Efficiency Through Air-
Gap Torque," Oak Ridge National Laboratory, Tennessee, Conf-960111--3 1995.
[28] J.D Kueck, M. Olszewski, D.A Casada, J.Hsu, P.J Otaduy, L.M. Tolbert, "Assessment of
Methods for Estimating Motor Efficiency and Load Under Field Conditions," Oak Ridge
National Laboratory, 1996.
[29] J.D Kueck, "Development of a method for estimating motor efficiency and analysing
motor condition," in Pulp and Paper Industry Technical Conference, Portland, 1998, pp.
67-72.
[30] R. Castillon, J. Oslinger, J Pakacios, "In-Field Induction Motor Efficiency Determination
Methods in the Scope of Efficiency-Based Maintenance," Energy Research Group Gien
and Energy Research Convergia, Columbia,.
[31] S.B. Lee, T.G Habetler, R.G Harley, D.J. Gritter, "An Evaluation of Model-Based Stator
Resistance Estimation for Induction Motor Stator Winding Temperature Monitoring,"
IEEE Trans. on Energy Conversion, vol. 17, no. 1, pp. 7-15, March 2002.
[32] S. Mir, M. Elbuluk, D. Zinger, "PI and Fuzzy Estimators for Tuning the Stator Resistance

References
Non-Intrusive Efficiency Estimation of Induction Machines 191
in Direct Torque Control of Induction Machines," IEEE Trans. on Power Electronics, vol.
13, no. 2, pp. 279-287, March 1998.
[33] E. Akin, H.B Ertan, M.Y Uctug, "A Method for Stator Resistance Measurement Suitable
for Vector Control," in International Conference on Industrial Electonics, Control and
Instrumentation, IECON, 1994, pp. 2122-2126.
[34] L. Zhen, L. Xu, "Sensorless Field Orientation Control of Induction Machines Based on a
Mutual MRAS Scheme," IEEE Trans. On Industrial Electronics, vol. 45, no. 5, pp. 824-
831, October 1998.
[35] A.V Pavlov, A.T. Zaremba, "Real-time Rotor and Stator Resistances Estimation of an
Induction Motor," Department od Mechanical Engineering, Eidenhoven University of
Technology, 2001.
[36] L.Umanand, S.R Bhat, "Online Estimation of Stator Resistance of an Induction Motor for
Speed Control Applications," in IEE Proceedings-Electric Power Applications, 1995, pp.
97-103.
[37] G. Guide, H. Umida, "A Novel Stator Resistance Estimation Method for Speed-Sensorless
Induction Motor Drives," IEEE Trans. on Industry Application, vol. 36, no. 6, pp. 1619-
1627, November/December 2000.
[38] I.Ha, S.Lee, "An Online Identification Method for Both Stator and Rotor Resistances of
Induction Motors Without Rotational Transducers," IEEE Trans. on Industrial
Electronics, vol. 47, no. 4, pp. 842-853, August 2000.
[39] B. Bose, N. Patel, "Quasi-Fuzzy Estimation of Stator Resistance of Induction Motor,"
IEEE Trans. on Power Electronics, vol. 13, no. 3, pp. 401-409, May 1998.
[40] S.Lee, T.G Habetler, R.G Harley, D.J. Gritterr, "A Stator and Rotor Resistance Estimation
Technique for Conductor Temperature Monitoring," in IEEE Industry Application
Conference, 2000, pp. 381-387.
[41] L. de Souza Ribeiro, C.B Jacobina, A.M.N Lima, "Linear Parameter Estimation for
Induction Machines Considering the Operating Conditions," IEEE Trans. on Power
Electronics, vol. 14, no. 1, pp. 62-73, January 1999.
[42] C.B Jacobina, J. Filho, A.M.N Lima, "On-line Estimation of Stator Resistance of
Induction Machines Based on Zero-Sequence Model," IEEE Trans. on Power Electronics,
vol. 15, no. 1, pp. 346-353, March 2000.
[43] S.B Lee, T.G Habetler, "An Online Stator Winding Resistance Estimation Technique for
Temperature Monitoring of Line-connected Induction Machines," IEEE Trans. on
Industry Application, vol. 39, no. 3, pp. 685-694, May/June 2003.
[44] Y. Wu, H. Gau, "Induction Motor Stator and Rotor Winding Temperature Estimation
Using Signal Injection Method," in IEEE Internaltional Conference on Electric Machines
and Drives, 2005, pp. 615-621.
[45] M. Stiebler, Y. Plotkin, "Superposition Methods for On-line Determination of A.C
Machine Winding Resistance," in International Symposium on Power Electronics,
Electrical Drives, Automation and Motion (SPEEDAM), 2006, pp. 960-963.
[46] G. Yang, T. Chin, "Adaptive Speed Identification Scheme for Vector Controlled Speed
Sensor-less Inverter-Induction Motor Drive," in IEEE Industry Applications Society
Annual Meeting, 1991, pp. 404-408.

References
Non-Intrusive Efficiency Estimation of Induction Machines 192
[47] Li Zhen, L. Xu, "Sensorless Field Orientation Control of Induction Machines Based on
Mutual MRAS Scheme," IEEE Trans. on Industrial Electronics, vol. 45, no. 5, pp. 824-
831, October 1998.
[48] C. Yang, J.W. Finch, "A Comparison of Induction Motor Speed Estimation using
Conventional MRAS and AI-Based MRAS with a Dynamic Reference Model," in
Proceedings of the World Congress on Enginneering, vol. I, London, 2008.
[49] K. Akatsu, A. Kawanura, "Sensorless Speed Estimation of Induction Motor Based on the
Secondary and Primary Resistance On-line Identification Without Any Additional Signal
Injection," in IEEE Power Electronics Specialists Conference, PESC, 1998, pp. 1575-
1580.
[50] B. Hovingh, W.W.L Keerthipala, W.Y Yan, "Sensorless Speed Estimation of an Induction
Motor in a Field Orientated Control System," School of Electrical and Computer
Engineering, Curtin University of Technology,.
[51] M. Ishida, K. Iwata, "A New Slip Frequency Detector of an Induction Motor Utilizing
Rotor Slot Harmonics," IEEE Trans. on Industry Applications, vol. IA-20, no. 3, pp. 575-
582, May/June 1984.
[52] M. Ishida, K. Iwata, "Steady-State Characteristice of a Torque and Speed Control System
of an Induction Motor Utilizing Rotor Slot Harmonics for Slip Frequency Sensing," IEEE
Trans. on Power Electronics, vol. PE-2, no. 3, pp. 257-263, July 1987.
[53] A. Ferrah, K.J. Bradley, G.M Asher, "An FFT-Based Novel Approach to Noninvasive
Speed Measurements in Induction Motor Drives," IEEE Trans. on Instrumentation and
Measurement, vol. 41, no. 6, pp. 797-802, December 1992.
[54] A. Ferrah, K.J Bradley, G.M Asher, M.S Woolfson, "An Investigation into Speed
Measurement of Induction Motor Drives Using Rotor Slot Harmonics and Spectral
Estimation Techniques," in International Conference on Electric Machines and Drives,
1993, pp. 185-189.
[55] K.D Hurst, T.G Habetler, "A Comparision of Spectrum Estimation Techniques for
Sensorless Speed Detection in Induction Machines," IEEE Trans. on Industry
Applications, vol. 33, no. 4, pp. 898-905, July/August 1997.
[56] K.D Hurst, T.G Habetler, "Sensorless Speed Measurement Using Current Harmonic
Spectral Estimation in Induction Machine Drives," IEEE Trans. on Power Electronics,
vol. 11, no. 1, pp. 66-73, January 1996.
[57] A. Bandiabdellah, N. Benouzza, D. Toumi, "Cage Motor Faults Detection Algorithm
Using Speed Estimation and Current Analysis," Acta Electotechnica et Informatica, vol.
7, no. 2, 2007.
[58] P.L Jansen, R.D Lorenz, "Transducerless Position and Velocity Estimation in Induction
and Salient AC Machines," IEEE Trans. on Industry Applications, vol. 31, no. 2, pp. 240-
247, March/April 1995.
[59] J.W Dixon, J.N Rivarola, "Induction Motor Speed Estimator and Synchronous Motor
Speed Position Estimator Based on a Fixed Carrier Frequency Signal," IEEE Trans. on
Industrial Electronics, vol. 43, no. 4, pp. 505-509, August 1996.
[60] G. Rata, M. Rata, I. Graur, D. Milici, "Induction Motor Speed Estimator Using Rotor Slot
Harmonics," Advances in Electrical and Computer Engineering, vol. 9, no. 1, 2009.

References
Non-Intrusive Efficiency Estimation of Induction Machines 193
[61] P. Mehrotra, J. Quaicoe, R. Venkatesan, "Induction Motor Speed Estimation Using
Artificial Neural Networks," in Conference on Electrical and Computer Engineering,
Canada, 1996, pp. 607-610.
[62] J. Yang, L.Wang, D. Xu, B. Xue, "Sensorless Speed Estimation for Line-connected
Induction Motor Based on Recurrent Multilayer Neural Networks," in Proceedings of the
IEEE International Conference on Automation and Logistics, 2007, pp. 2013-2018.
[63] K. L. Shi, T.F. Chan, Y.K. Wong, S.L Ho, "Speed Estimation of an Induction Motor Drive
Using an Optimizer Extended Kalman Filter," IEEE Trans. on Industrial Electronics, vol.
49, no. 1, pp. 124-133, February 2002.
[64] R. Supangat, N. Ertugrul, W. Soong, D.A Gray, C. Hansen, J. Grieger, "Estimation of the
Number of Rotor Slots and Rotor Speed in Induction Motors Using Current, Flux or
Vibration Signature Analysis," in Australasian Universities Power Engineering
Conference (AUPEC'06), Melbourne, 2006.
[65] H. Zhang, K. Bradley, P. Zanchetta, "A None-intrusive Load and Efficiency Evaluation
Method for In-Service Motors Using Vibratration Tests with an Accelerometer," in IEEE
Industrial Applications Society Annual Meeting, 2008, pp. 1-6.
[66] D. Wu, S.D Pekarek, "Using Mechanical Vibration to Estimate Rotor Speed in Induction
Motor Drives," in IEEE Power Electronics Specialist Conference, PESC, 2007, pp. 2412-
2417.
[67] T. Phumiphak, C. Chat-uthai, "Effective Estimation of Induction Motor Field Efficiency
Based on On-site Measurements," Electrical Power Department, Mahanakorn University
of Technology, Bangkok,.
[68] T.M Thomas. (2008, December) Motor Condition Monitoring: Efficiency Does Matter.
[Online]. www.controlengeurope.com/article.aspx?articleID=21440
[69] E.B. Agamloh, A.K. Wallace, A. von Jouanne, K. J. Anderson, J.A Rooks, "Assesment of
Nonintrusive Motor Efficiency Estimators," IEEE Trans. on Industry Applications, vol.
41, no. 1, pp. 127-133, January/February 2005.
[70] J.S Hsu, H.H Woodson, W.F. Weldon, "Possible Errors in Measurement of Air-Gap
Torque Pulsations of Induction Motors," IEEE Trans. Energy Conversion, vol. 7, no. 1,
pp. 202-208, March 1992.
[71] H3 200kg H961700 Load Cell Datasheet. Load Cell Services. [Online].
http://www.loadcell.co.za
[72] LM311 Voltage Comparator Datasheet. [Online].
http://www.national.com/ds/LM/LM111.pdf
[73] SKHI 21A MOSFET Driver Datasheet. [Online].. http://www.scut-
co.com/maindoc/techtrade/Pdevice/driver/documents/datasheets/semidriver/SKHI22A.pdf
[74] IRFP064N MOSFET Datasheet. MOSFET datasheet. [Online].
http://www.irf.com/product-info/datasheets/data/irfp064n.pdf
[75] ADLX202E Accelerometer Datasheet. [Online]. http://pdf1.alldatasheet.com/datasheet-
pdf/view/48922/AD/ADXL202E.html
[76] Aligent/HP Multimeter 4401A Manual. [Online].
http://www.hirstbrook.com/eelab/hp%2034401A%20manual.pdf
[77] LEM LA 55-P Datasheet. [Online].
References
Non-Intrusive Efficiency Estimation of Induction Machines 194
http://www.datasheetcatalog.org/datasheets2/70/70473_2.pdf
[78] S. B Rabinovich, Measurement Errors and Uncertainties: Theory and Practice, 3rd ed.
New York, USA: NY: Springer Science and Media Inc, 2005.
[79] W. Cao, K. J Bradley, H.Zhang, I. French, "Experimental Uncertainty in Estimation of the
Losses and Efficiency of Induction Motors," , 2006.
[80] B. Lu, W. Cao, T.G Habetler, "Error Analysis of Motor-Efficiency Estimation and
Measurement ," , 2007.
[81] W. Coa, "Assesment of Induction Machine Efficiency with Comments on the New
Standard IEC 60034-2-1," in IEEE International Conference on Electrical Machines,
2008.

A APPENDIX

Appendix
Non-Intrusive Efficiency Estimation of Induction Machines 196
A.1 MATLAB Simulink model of DC signal injection circuit for Rs estimation
Figure A.1:Simulated model of the stator resistance estimation technique

Appendix
Non-Intrusive Efficiency Estimation of Induction Machines 197
A.2 Labview models used for the NAGT method
Figure A.2: Labview model

Appendix
Non-Intrusive Efficiency Estimation of Induction Machines 198
A.3 MATLAB Simulink models used for the NAGT method
Figure A.3: MATLAB Simulink Model

Appendix
Non-Intrusive Efficiency Estimation of Induction Machines 199
A.4 Influence coefficients
-5 -4 -3 -2 -1 0 1 2 3 4 5-0.02
-0.01
0
0.01
0.02
0.03IEC Std 34-2-1
Error in Voltage [%]
Err
or
in E
ffic
ien
cy [
%]
-5 -4 -3 -2 -1 0 1 2 3 4 5-1
-0.5
0
0.5
1Direct Method
Error in Voltage [%]E
rro
r in
Eff
icie
ncy
[%
]-5 -4 -3 -2 -1 0 1 2 3 4 5
-0.4
-0.2
0
0.2
0.4NAGT Method
Error in Voltage [%]
Err
or
in E
ffic
ien
cy [
%]
y=-0.003x y=0x y=0.07x-0.0001
-5 -4 -3 -2 -1 0 1 2 3 4 5-0.03
-0.02
-0.01
0
0.01
0.02
0.03IEC Std 34-2-1
Error in Current [%]
Err
or
in E
ffic
ien
cy [
%]
-5 -4 -3 -2 -1 0 1 2 3 4 5-1
-0.5
0
0.5
1Direct Method
Error in Current [%]
Err
or
in E
ffic
ien
cy [
%]
-5 -4 -3 -2 -1 0 1 2 3 4 5-0.4
-0.2
0
0.2
0.4NAGT Method
Error in Current [%]
Err
or
in E
ffic
ien
cy [
%]y=0.005x y=0x y=-0.07x
-5 -4 -3 -2 -1 0 1 2 3 4 5-3
-2
-1
0
1
2
3IEC Std 34-2-1
Error in Torque [%]
Err
or
in E
ffic
ien
cy [
%]
-5 -4 -3 -2 -1 0 1 2 3 4 5-6
-4
-2
0
2
4
6Direct Method
Error in Torque [%]
Err
or
in E
ffic
ien
cy [
%]
-5 -4 -3 -2 -1 0 1 2 3 4 5-1
-0.5
0
0.5
1NAGT Method
Error in Torque [%]
Err
or
in E
ffic
ien
cy [
%]y=0.521x y=x y=0x
-5 -4 -3 -2 -1 0 1 2 3 4 5-6
-4
-2
0
2
4
6IEC Std 34-2-1
Error in Speed [%]
Err
or
in E
ffic
ien
cy [
%]
-5 -4 -3 -2 -1 0 1 2 3 4 5-6
-4
-2
0
2
4
6Direct Method
Error in Speed [%]
Err
or
in E
ffic
ien
cy [
%]
-5 -4 -3 -2 -1 0 1 2 3 4 5-6
-4
-2
0
2
4
6NAGT Method
Error in Speed [%]
Err
or
in E
ffic
ien
cy [
%]y=1.013x y=x y=1.064x

Appendix
Non-Intrusive Efficiency Estimation of Induction Machines 200
Figure A.4: Influecnce Coefficients for the 11kW motor at rated load
-5 -4 -3 -2 -1 0 1 2 3 4 5-0.03
-0.02
-0.01
0
0.01
0.02
0.03IEC Std 34-2-1
Error in Resistance [%]
Err
or
in E
ffic
ien
cy [
%]
-5 -4 -3 -2 -1 0 1 2 3 4 5-1
-0.5
0
0.5
1Direct Method
Error in Resistance [%]
Err
or
in E
ffic
ien
cy [
%]
-5 -4 -3 -2 -1 0 1 2 3 4 5-0.4
-0.2
0
0.2
0.4NAGT Method
Error in Resistance [%]
Err
or
in E
ffic
ien
cy [
%]y=0.004x y=0x y=-0.07x
-5 -4 -3 -2 -1 0 1 2 3 4 5-3
-2
-1
0
1
2
3IEC Std 34-2-1
Error in Input Power [%]
Err
or
in E
ffic
ien
cy [
%]
-5 -4 -3 -2 -1 0 1 2 3 4 5-6
-4
-2
0
2
4
6Direct Method
Error in Input Power [%]
Err
or
in E
ffic
ien
cy [
%]
-5 -4 -3 -2 -1 0 1 2 3 4 5-1
-0.5
0
0.5
1NAGT Method
Error in Input Power [%]E
rro
r in
Eff
icie
ncy
[%
]y=-0.46x y=-1.001x y=0x
-100-75 -50 -25 0 25 50 75 100-1
-0.5
0
0.5
1IEC Std 34-2-1
Error in Stray Load Loss [%]
Err
or
in E
ffic
ien
cy [
%]
-100-75 -50 -25 0 25 50 75 100-1
-0.5
0
0.5
1Direct Method
Error in Stray Load Loss [%]
Err
or
in E
ffic
ien
cy [
%]
-100-75 -50 -25 0 25 50 75 100-3
-2
-1
0
1
2
3NAGT Method
Error in Stray Load Loss [%]
Err
or
in E
ffic
ien
cy [
%]y=0x y=0x y=-0.023x
-100-75 -50 -25 0 25 50 75 100-1
-0.5
0
0.5
1IEC Std 34-2-1
Error in No Load Loss [%]
Err
or
in E
ffic
ien
cy [
%]
-100-75 -50 -25 0 25 50 75 100-1
-0.5
0
0.5
1Direct Method
Error in No Load Loss [%]
Err
or
in E
ffic
ien
cy [
%]
-100-75 -50 -25 0 25 50 75 100-5
0
5NAGT Method
Error in No Load Loss [%]
Err
or
in E
ffic
ien
cy [
%]
y=0xy=0x y=-0.041x

Appendix
Non-Intrusive Efficiency Estimation of Induction Machines 201
A.5 FFT code %Sample fft code to calculate PSD % Written by: Henry Liu 2010 %Adapted by: Barbara Herndler clc
sampling_rate = 10000;%input('Sampling frequency (fs): '); sample_time =60;%input('Sampling duration (s): ');
%This value acts as a multiplier to determine the number of datapoints been
ffted. upper_frequency = 100;%input('Upper frequency limit (Hz): '); lower_frequency = 0;%input('Lower frequency limit (Hz): '); number_of_samples = sample_time*sampling_rate;
Speed
%Vibration data imported from file
y=Speed(1:100000)-mean(Speed(1:10000));
%Remove dc offset
fft_current = fft(y,number_of_samples)/number_of_samples; PSD = 20*log10(fft_current.* conj(fft_current)./(2*pi));
%PSD = f(w)f*(w)/2pi. 20log10 is to put the fft in db scale. Power_spectrum_normalised = (PSD);%./max(PSD);
%normalise the data by dividing everything by the highest value Freq_axis = (sampling_rate).*(linspace(0,1,number_of_samples/2+1))./2;
%define the x-axis - /2 so only half of the spectrum shows one_hz = 1/(sampling_rate/number_of_samples);
%sampling_rate/number_of_samples = freq resolution. upper_limit = floor(one_hz*upper_frequency);
if lower_frequency == 0 lower_limit = 1; else lower_limit = floor(one_hz*lower_frequency); end
%plot graph figure(2) plot(Freq_axis(lower_limit:upper_limit),Power_spectrum_normalised(lower_limit
:upper_limit),'r'); xlabel('frequency[Hz]') ylabel('magnitude[dB]') grid