Losses estimation in induction motors using infrared ... · Losses estimation in induction motors...
8
Losses estimation in induction motors using infrared thermography techniques Edson da Costa Bortoni, Roberto Akira Yamachita, João M C Guimarães, Mateus C. de Castro Santos Centre of Excelence in Energy Efficiency – Excen Federal Univeristy of Itajubá - Unifei Abstract This work aims at estimating the losses of a three-phase induction motor using the thermography techniques, which assumes that all the losses of the motor are dissipated as heat. The proposed technique is compared to the traditional method of losses segregation with direct measurement of the electric and mechanical power. Results statistically treated are also presented. Introduction Three-phase induction motors are the most used machines in the industry due, among other reasons, to their high reliability and efficiency. Such equipment constitutes as a great potential of energy conservation because of the large number of installed units and due to the inefficient application. Therefore, it is very common to find the so-called oversized motors, i.e., motors driving loads much smaller than its rated capacity, resulting in low operational efficiency and power factor [1]. Induction motors are very important loads in Brazil as long as they responsible for about 25% of gross consumption. Figure 1 (a) shows the share of industrial sector consumption in Brazil, while figure 1 (b) shows the percentage of industrial consumption regarding to motor force. (a) (b) Figure 1 – Consumption distribution in Brazil and in the industry. Basically, the induction motor is an electromechanical energy converter that based on electromagnetic principles, converts electrical energy into mechanical energy. Unfortunately this conversion is not complete due to the inevitable losses that occur in the machine during this conversion process. Such losses can be grouped as follows: stator and rotor losses, iron losses, stray load losses and losses due to friction and windage [2]. Stator and rotor losses result from the passage of electric current through their windings (I²R). Iron losses consist of hysteresis and eddy current losses. The hysteresis loss results from the constant reorientation of the magnetic field on the package of silicon-steel sheets and the eddy current losses are basically I²R losses due to the induced current within the magnetic material. Friction and windage occur due to friction in the bearings of the machine and the aerodynamic drag caused by the irregular geometry of the rotor and the fan itself installed at the shaft end. Stray load or dispersion includes all losses not previously classified. Figure 3 shows the average distribution of losses in a motor operating at rated conditions. 43% 28% 13% 16% Industry Residential Public and Rural Commercial 55% 6% 19% 18% 2% Motors Refrigeration Electrochemical Processes Heating Lighting More Info at Open Access Database www.ndt.net/?id=17642
Transcript of Losses estimation in induction motors using infrared ... · Losses estimation in induction motors...
Losses estimation in induction motors using infrared thermography techniques
Edson da Costa Bortoni, Roberto Akira Yamachita, João M C Guimarães, Mateus C. de Castro Santos
Centre of Excelence in Energy Efficiency – Excen Federal Univeristy of Itajubá - Unifei
Abstract
This work aims at estimating the losses of a three-phase induction motor using the thermography techniques, which assumes that all the losses of the motor are dissipated as heat. The proposed technique is compared to the traditional method of losses segregation with direct measurement of the electric and mechanical power. Results statistically treated are also presented. Introduction
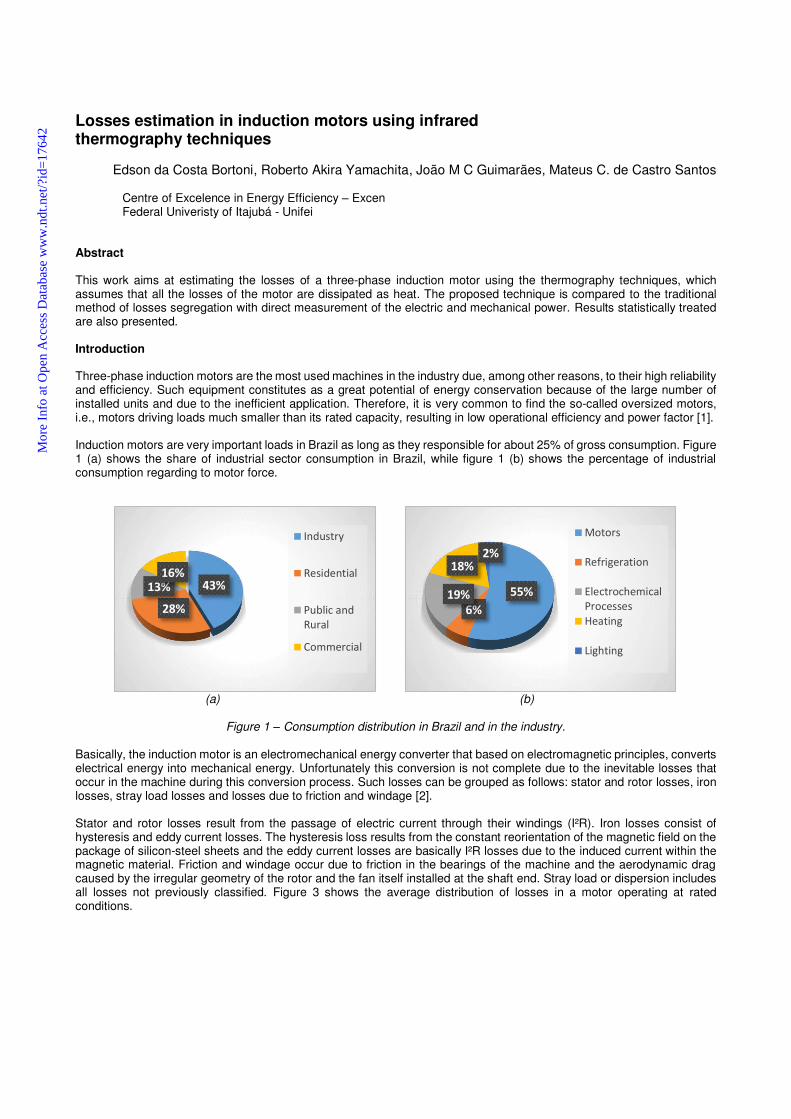
Three-phase induction motors are the most used machines in the industry due, among other reasons, to their high reliability and efficiency. Such equipment constitutes as a great potential of energy conservation because of the large number of installed units and due to the inefficient application. Therefore, it is very common to find the so-called oversized motors, i.e., motors driving loads much smaller than its rated capacity, resulting in low operational efficiency and power factor [1]. Induction motors are very important loads in Brazil as long as they responsible for about 25% of gross consumption. Figure 1 (a) shows the share of industrial sector consumption in Brazil, while figure 1 (b) shows the percentage of industrial consumption regarding to motor force.
(a) (b)
Figure 1 – Consumption distribution in Brazil and in the industry.
Basically, the induction motor is an electromechanical energy converter that based on electromagnetic principles, converts electrical energy into mechanical energy. Unfortunately this conversion is not complete due to the inevitable losses that occur in the machine during this conversion process. Such losses can be grouped as follows: stator and rotor losses, iron losses, stray load losses and losses due to friction and windage [2]. Stator and rotor losses result from the passage of electric current through their windings (I²R). Iron losses consist of hysteresis and eddy current losses. The hysteresis loss results from the constant reorientation of the magnetic field on the package of silicon-steel sheets and the eddy current losses are basically I²R losses due to the induced current within the magnetic material. Friction and windage occur due to friction in the bearings of the machine and the aerodynamic drag caused by the irregular geometry of the rotor and the fan itself installed at the shaft end. Stray load or dispersion includes all losses not previously classified. Figure 3 shows the average distribution of losses in a motor operating at rated conditions.
43%
28%
13%
16%
Industry
Residential
Public and
Rural
Commercial
55%
6%
19%
18%
2%
Motors
Refrigeration
Electrochemical
Processes
Heating
Lighting
Mor
e In
fo a
t Ope
n A
cces
s D
atab
ase
ww
w.n
dt.n
et/?
id=
1764
2
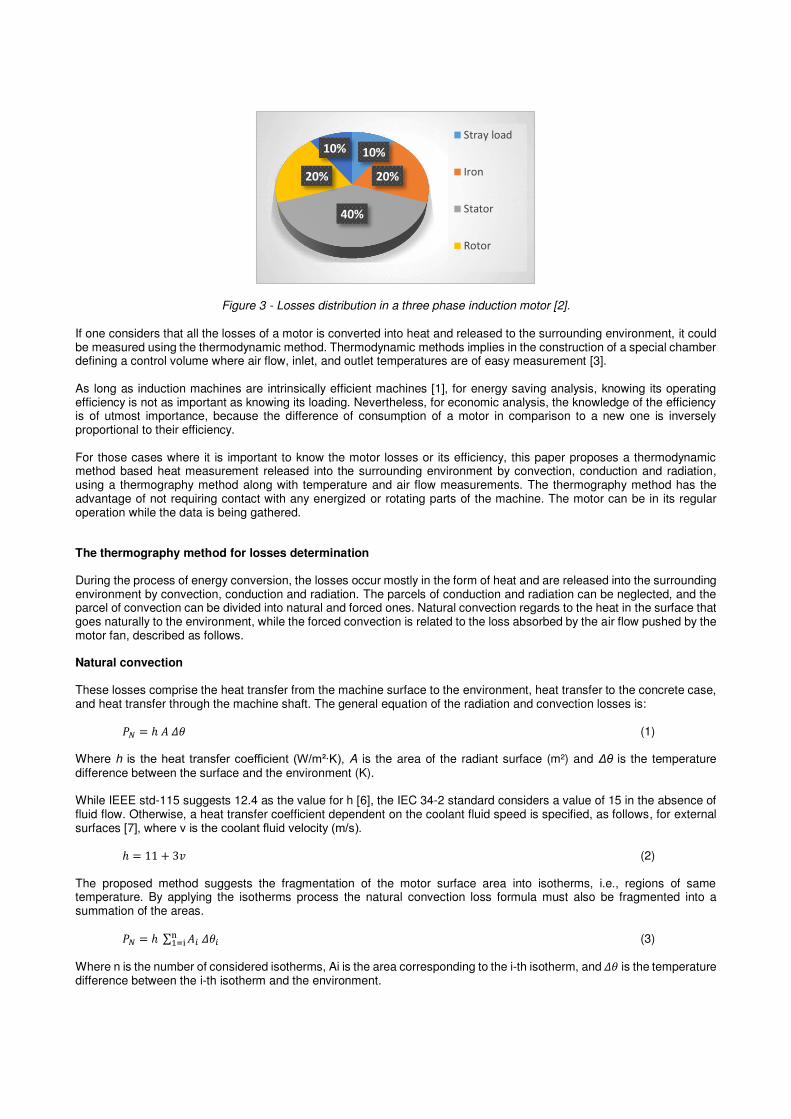
Figure 3 - Losses distribution in a three phase induction motor [2]. If one considers that all the losses of a motor is converted into heat and released to the surrounding environment, it could be measured using the thermodynamic method. Thermodynamic methods implies in the construction of a special chamber defining a control volume where air flow, inlet, and outlet temperatures are of easy measurement [3]. As long as induction machines are intrinsically efficient machines [1], for energy saving analysis, knowing its operating efficiency is not as important as knowing its loading. Nevertheless, for economic analysis, the knowledge of the efficiency is of utmost importance, because the difference of consumption of a motor in comparison to a new one is inversely proportional to their efficiency. For those cases where it is important to know the motor losses or its efficiency, this paper proposes a thermodynamic method based heat measurement released into the surrounding environment by convection, conduction and radiation, using a thermography method along with temperature and air flow measurements. The thermography method has the advantage of not requiring contact with any energized or rotating parts of the machine. The motor can be in its regular operation while the data is being gathered.
The thermography method for losses determination
During the process of energy conversion, the losses occur mostly in the form of heat and are released into the surrounding environment by convection, conduction and radiation. The parcels of conduction and radiation can be neglected, and the parcel of convection can be divided into natural and forced ones. Natural convection regards to the heat in the surface that goes naturally to the environment, while the forced convection is related to the loss absorbed by the air flow pushed by the motor fan, described as follows. Natural convection
These losses comprise the heat transfer from the machine surface to the environment, heat transfer to the concrete case, and heat transfer through the machine shaft. The general equation of the radiation and convection losses is: 鶏� = ℎ � �� (1) Where h is the heat transfer coefficient (W/m²∙K), A is the area of the radiant surface (m²) and Δθ is the temperature difference between the surface and the environment (K). While IEEE std-115 suggests 12.4 as the value for h [6], the IEC 34-2 standard considers a value of 15 in the absence of fluid flow. Otherwise, a heat transfer coefficient dependent on the coolant fluid speed is specified, as follows, for external surfaces [7], where ν is the coolant fluid velocity (m/s). ℎ = 11 + 3� (2) The proposed method suggests the fragmentation of the motor surface area into isotherms, i.e., regions of same temperature. By applying the isotherms process the natural convection loss formula must also be fragmented into a summation of the areas. 鶏� = ℎ ∑ �沈 ��沈n怠=i (3) Where n is the number of considered isotherms, Ai is the area corresponding to the i-th isotherm, and �� is the temperature difference between the i-th isotherm and the environment.
10%
20%
40%
20%
10%
Stray load
Iron
Stator
Rotor
Forced convection
Forced convection is a heat transfer type in which fluid movement is due to an external force. In electric motors, it has a great importance due to the fan fixed at the end of the shaft that blows air in the axial direction. The machine losses absorbed by the coolant fluids can be determined using: 鶏� = � � 芸 �� (4) Where Q is the air flow (m³/s), ρ is the specific mass of air (kg/m³), c is the specific heat of the air (kJ/kg∙K) and �� is the coolant fluid temperature difference between the inlet and outlet. Thermal image processing
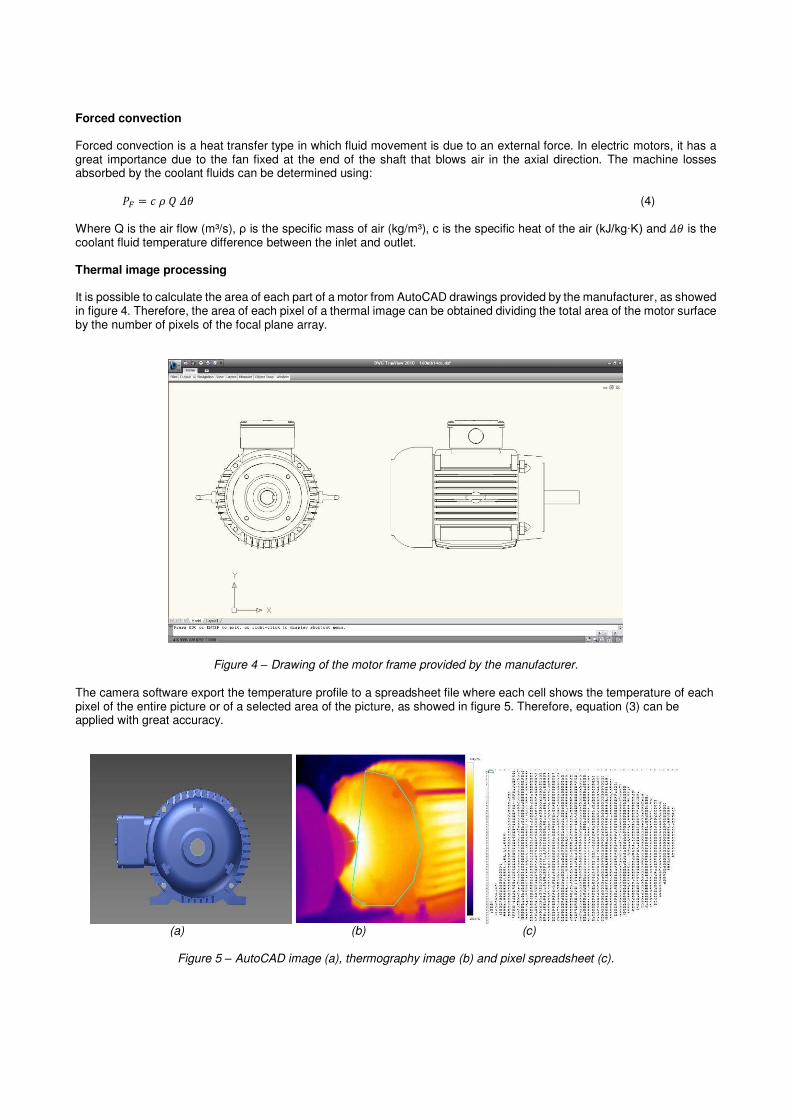
It is possible to calculate the area of each part of a motor from AutoCAD drawings provided by the manufacturer, as showed in figure 4. Therefore, the area of each pixel of a thermal image can be obtained dividing the total area of the motor surface by the number of pixels of the focal plane array.
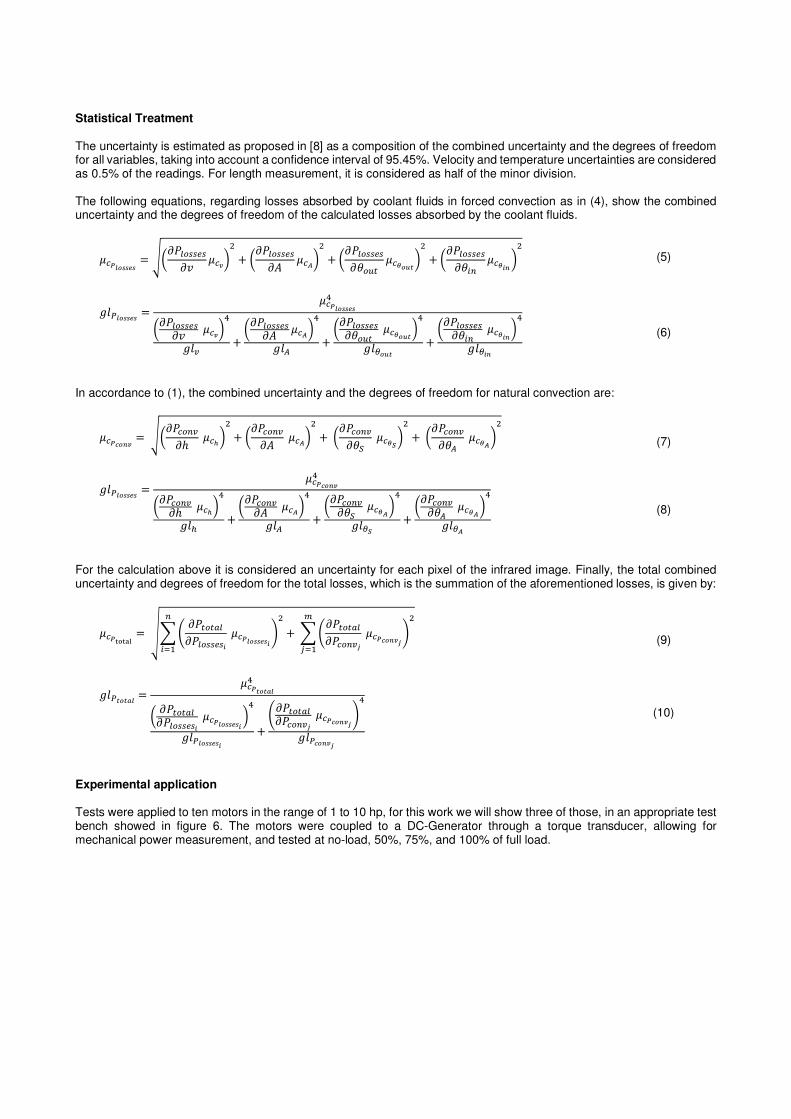
Figure 4 – Drawing of the motor frame provided by the manufacturer. The camera software export the temperature profile to a spreadsheet file where each cell shows the temperature of each pixel of the entire picture or of a selected area of the picture, as showed in figure 5. Therefore, equation (3) can be applied with great accuracy.
(a) (b) (c)
Figure 5 – AutoCAD image (a), thermography image (b) and pixel spreadsheet (c).
Statistical Treatment The uncertainty is estimated as proposed in [8] as a composition of the combined uncertainty and the degrees of freedom for all variables, taking into account a confidence interval of 95.45%. Velocity and temperature uncertainties are considered as 0.5% of the readings. For length measurement, it is considered as half of the minor division. The following equations, regarding losses absorbed by coolant fluids in forced convection as in (4), show the combined uncertainty and the degrees of freedom of the calculated losses absorbed by the coolant fluids. ����任濡濡�濡 = √(�鶏鎮墜鎚鎚�鎚�� ��寧)態 + (�鶏鎮墜鎚鎚�鎚�� ���)態 + (�鶏鎮墜鎚鎚�鎚��墜通痛 ���任祢禰 )態 + (�鶏鎮墜鎚鎚�鎚��沈津 ���日韮 )態
(5)
����任濡濡�濡 = ����任濡濡�濡4(�鶏鎮墜鎚鎚�鎚�� ��寧)4��塚 + (�鶏鎮墜鎚鎚�鎚�� ���)4��� + (�鶏鎮墜鎚鎚�鎚��墜通痛 ���任祢禰 )4���任祢禰 + (�鶏鎮墜鎚鎚�鎚��沈津 ���日韮 )4���日韮
(6)
In accordance to (1), the combined uncertainty and the degrees of freedom for natural convection are: ����任韮寧 = √(�鶏�墜津塚�ℎ ��ℎ )態 + (�鶏�墜津塚�� ���)態 + (�鶏�墜津塚��� ���� )態 + (�鶏�墜津塚��� ���� )態
(7)
����任濡濡�濡 = ����任韮寧4(�鶏�墜津塚�ℎ ��ℎ)4��ℎ + (�鶏�墜津塚�� ���)4��� + (�鶏�墜津塚��� ���� )4���� + (�鶏�墜津塚��� ���� )4����
(8)
For the calculation above it is considered an uncertainty for each pixel of the infrared image. Finally, the total combined uncertainty and degrees of freedom for the total losses, which is the summation of the aforementioned losses, is given by:
���total = √∑ 峭 �鶏痛墜痛�鎮�鶏鎮墜鎚鎚�鎚日 ����任濡濡�濡日 嶌態津沈=怠 + ∑ 峭�鶏痛墜痛�鎮�鶏�墜津塚乳 ����任韮寧乳 嶌態陳
珍=怠
(9)
���禰任禰�� = ���禰任禰��4( �鶏痛墜痛�鎮�鶏鎮墜鎚鎚�鎚日 ����任濡濡�濡日 )4
����任濡濡�濡日 + 峭�鶏痛墜痛�鎮�鶏�墜津塚乳 ����任韮寧乳 嶌4����任韮寧乳
(10)
Experimental application Tests were applied to ten motors in the range of 1 to 10 hp, for this work we will show three of those, in an appropriate test bench showed in figure 6. The motors were coupled to a DC-Generator through a torque transducer, allowing for mechanical power measurement, and tested at no-load, 50%, 75%, and 100% of full load.
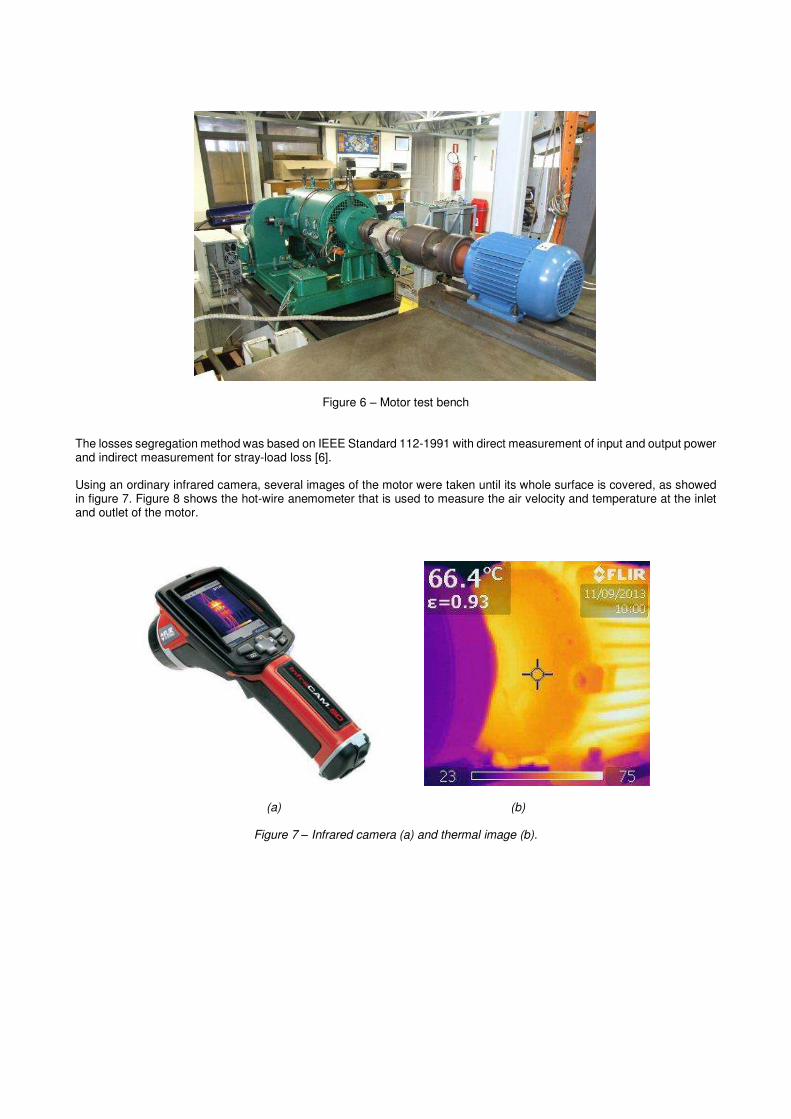
Figure 6 – Motor test bench The losses segregation method was based on IEEE Standard 112-1991 with direct measurement of input and output power and indirect measurement for stray-load loss [6]. Using an ordinary infrared camera, several images of the motor were taken until its whole surface is covered, as showed in figure 7. Figure 8 shows the hot-wire anemometer that is used to measure the air velocity and temperature at the inlet and outlet of the motor.
(a) (b)
Figure 7 – Infrared camera (a) and thermal image (b).

(a) (b)
Figure 8 – Anemometer (a) and air current profile in a motor (b).
For the thermography image process analysis, isotherms with 2°C steps were determine to produce a best accuracy. Tables 1 to 3 present the obtained results. Calculations were made according to IEC 34-2 [7]. All calculations are presented assuming errors of type A and B, with a 95.45% confidence interval, and taking into account Student distributions.
Table 1 – Results summary – 1 HP Motor, 80.5% Efficiency, 0.78 Power factor, 4 pole, 60 Hz, 220 V
Losses Segregation 100 % load 75 % load 50 % load
Stator (W) 57.5 ± 4.9 62.7 ± 3.6 39.3 ± 3.6
Rotor (W) 25.7 ± 1.3 14.5 ± 1.0 7.4 ± 1.0
Iron (W) 71.8 ± 4.1 71.8 ± 4.1 71.8 ± 4.1
Friction and Windage (W) 10.4 ± 4.8 10.4 ± 4.8 10.4 ± 4.8
Stray-Load (W) 35.8 ± 10.2 20.7 ± 5.9 9.5 ± 5.9
Total losses (W) 201.1 ± 12.5 160.1 ± 10.8 138.3 ± 9.6
Efficiency (%) 79.0 ± 1.3 77.9 ± 1.2 72.6 ± 1.3
Thermography 100 % load 75 % load 50 % load
Natural Convection (W) 90.4 ± 7.4 75.2 ± 5.7 62.8 ± 4.9
Forced Convection (W) 82.2 ± 16.7 60.0 ± 9.3 46.9 ± 11.1
Total losses (W) 172.6 ± 18.0 135.2 ± 14.6 109.7 ± 14.5
Efficiency (%) 82.0 ± 1.9 81.4 ± 1.3 78.2 ± 2.3

Table 2 – Results summary – 5 HP Motor, 85.0% Efficiency, 0.81 Power factor, 4 pole, 60 Hz, 220 V
Losses Segregation 100 % load 75 % load 50 % load
Stator (W) 295.5 ± 15.6 187.94 ± 9.9 120.9 ± 9.9
Rotor (W) 160.1 ± 6.4 90.22 ± 4.7 40.6 ± 4.7
Iron (W) 283.5 ± 13.6 283.5 ± 13.6 283.5 ± 13.6
Friction and Windage (W) 13.6 ± 4.8 13.6 ± 4.8 13.6 ± 4.8
Stray-Load (W) 53.5 ± 21.4 29.1 ± 11.6 12.8 ± 11.6
Total losses (W) 806.2 ± 33.3 604.3 ± 25.5 471.4 ± 22.3
Efficiency (%) 81.9 ± 0.8 81.6 ± 0.8 78.9 ± 0.9
Thermography 100 % load 75 % load 50 % load
Natural Convection (W) 327.9 ± 51.2 266.5 ± 8.8 198.8 ± 5.5
Forced Convection (W) 406.9 ± 65.7 336.9 ± 63.4 239.9 ± 78.0
Total losses (W) 734.8 ± 79.2 603.4 ± 63.9 438.7 ± 78.2
Efficiency (%) 83.5 ± 1.8 81.6 ± 2.0 80.4 ± 3.5
Table 3 – Results summary – 7.5 HP Motor, 89.5% Efficiency, 0.81 Power factor, 4 pole, 60 Hz, 220 V
Losses Segregation 100 % load 75 % load 50 % load
Stator (W) 296.2 ± 9.7 168.2 ± 8.8 111.5 ± 8.8
Rotor (W) 263.9 ± 13.7 164.1 ± 6.8 61.3 ± 6.8
Iron (W) 215.6 ± 6.2 215.6 ± 6.2 215.6 ± 6.2
Friction and Windage (W) 28.3 ± 4.8 28.3 ± 4.8 28.3 ± 4.8
Stray-Load (W) 138.1 ± 35.2 73.7 ± 18.8 30.3 ± 18.8
Total losses (W) 942.1 ± 39.6 649.8 ± 22.8 447.2 ± 12.5
Efficiency (%) 85.7 ± 0.6 86.4 ± 0.5 85.9 ± 0.4
Thermography 100 % load 75 % load 50 % load
Natural Convection (W) 467.9 ± 57.8 394.5 ± 10.6 294.1 ± 8.7
Forced Convection (W) 301.4 ± 39.9 232.5 ± 26.2 192.0 ± 31.3
Total losses (W) 769.3 ± 68.0 627.1 ± 28.2 486.1 ± 32.4
Efficiency (%) 88.3 ± 1.0 86.9 ± 0.6 84.7 ± 1.0
Conclusions
The work presented a thermodynamic methodology to estimate the total loss of a motor employing a thermography technique, which allows its application in field, without interfering in the process that the motor is involved, rather than applying standard methods and expensive equipment in laboratory. The methodology employs an image processing technique that divides a thermal image in several isotherms, calculating the natural convection in each one. The forced convection is obtained using a thermo-anemometer sensor that measures the air flow and its temperatures at motor’s inlet and outlet. Comparing the results of the proposed methodology with the standard ones, it was found that there is a very good agreement when considering the errors imposed by each methodology.
References
[1] E.C. Bortoni, Are my motors oversized? Energy Conversion and Management, Vol. 50(9), sep 2008, pp 2282-2287.
[2] J. Haddad, E.C. Bortoni, R. A. Yamachita, et al., Conservação de energia: eficiência energética de equipamentos e instalações, Editora Novo Mundo, 2006.
[3] K. J. Bradley, W. Cao, and J. Arellano-Padilla. Evaluation of stray load loss in inductionmotors with a comparison of input–output and calorimetric methods. IEEE Trans. Energy Conversion, vol. 21, no. 3, Sep. 2006, pp. 682–689.
[4] M.J. Picazo-Rodenas, R. Royo, J. Antonino-Daviu, J. Roger-Folch. Energy balance and heating curves of electric motors based on Infrared Thermography. IEEE International Symposium on Industrial Electronics (ISIE), pp. 591-596, 2011.
[5] M. Narrol and W. Stiver. Quantitative Thermography for Electric Motor Efficiency Diagnosis. School of Engineering University of Guelph, Guelph CANADA. 2011.
[6] IEEE 112. Test Procedure for Polyphase Induction Motors and Generators. Piscataway, NJ, USA.
[7] IEC 34-2. Rotating electrical machines. Part 2: Methods for determining losses and efficiency of rotating electrical machinery from tests (excluding machines for traction vehicles) Measurement of losses by the calorimetric method. 1st ed., publication 34-2A, 1974.
[8] D. C. Montgomery, G.C. Runger. Applied Statistics and Probability for Engineers, 5th Ed., John Wiley and Sons, 2011.