Marc and Marta Bianchini The Bianchini Restaurants January 1 – December 31, 2010
Upload
julianna-hodgeCategory
view
234download
4
No-Till in ArgentinaNo-Till in ArgentinaNo-Till in ArgentinaNo-Till in Argentina
Ing. Agr. Agustín BianchiniIng. Agr. Agustín [email protected]@aapresid.org.ar
Ing. Agr. Agustín BianchiniIng. Agr. Agustín [email protected]@aapresid.org.ar
No-Till Farmer’sArgentinean Association
No-Till Farmer’sArgentinean Association
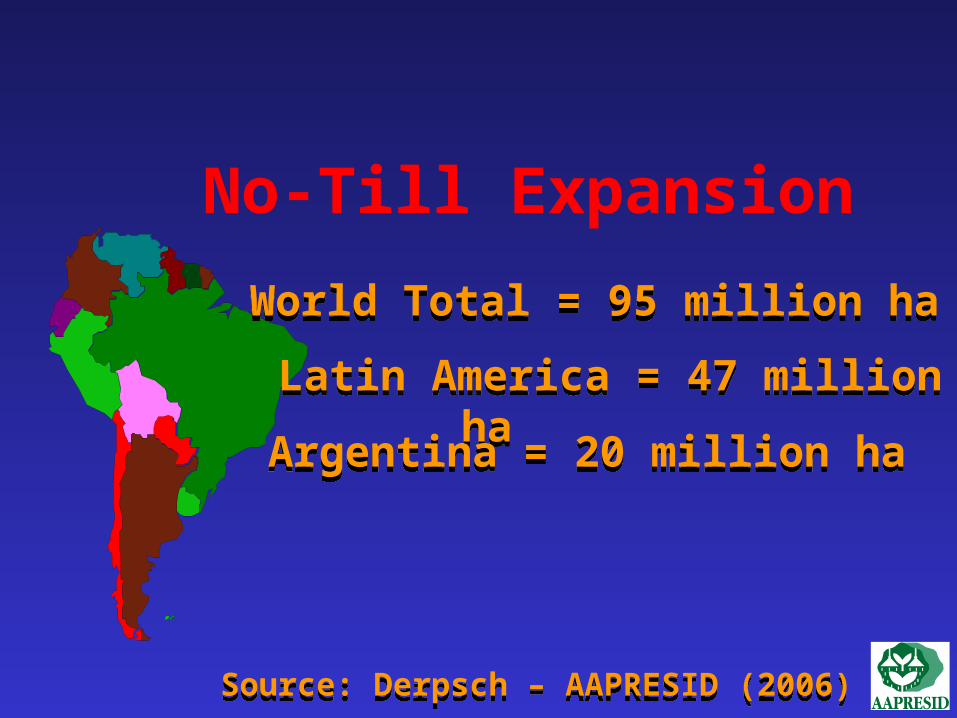
No-Till Expansion
Latin America = 47 million ha
Latin America = 47 million ha
World Total = 95 million haWorld Total = 95 million ha
Argentina = 20 million ha Argentina = 20 million ha
Source: Derpsch – AAPRESID (2006)
Source: Derpsch – AAPRESID (2006)
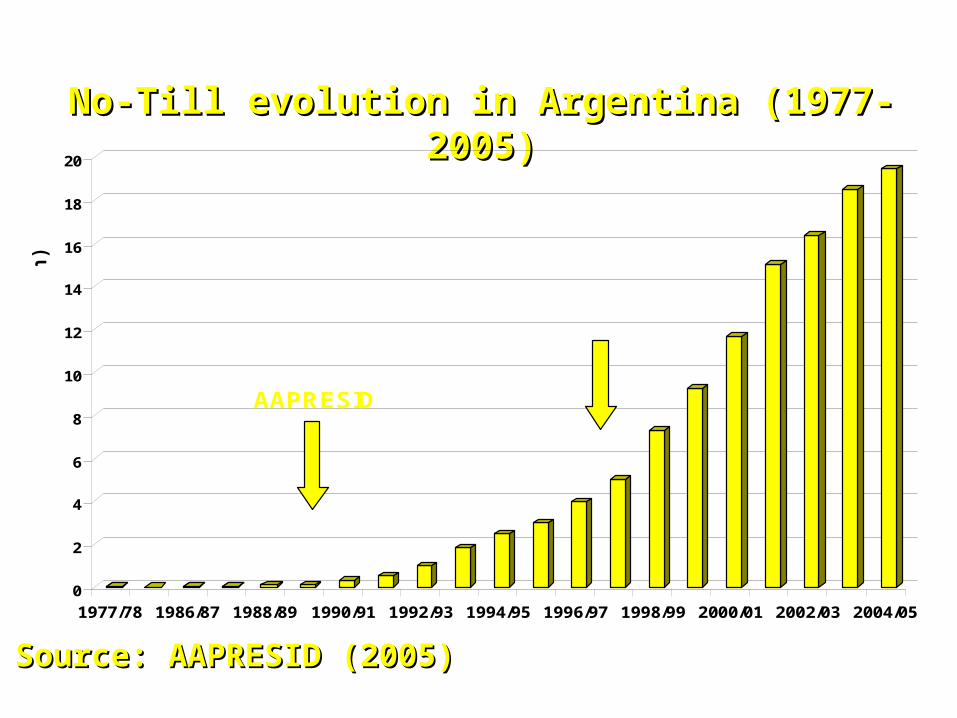
No-Till evolution in Argentina (1977-2005)No-Till evolution in Argentina (1977-2005)
Source: AAPRESID (2005)Source: AAPRESID (2005)
0
2
4
6
8
10
12
14
16
18
20
1977/78 1986/87 1988/89 1990/91 1992/93 1994/95 1996/97 1998/99 2000/01 2002/03 2004/05
AAPRESID
GMO
He
cta
res
(M
illio
n)

01000000
2000000
3000000
40000005000000
6000000
70000008000000
900000010000000
77/78
78/86
86/87
87/88
88/89
89/90
90/91
91/92
92/93
93/94
94/95
95/96
96/97
97/98*
98/99
99/00
00/01
01/02.
Corn
Wheat
Soybean
No-Till area evolution for wheat, corn, No-Till area evolution for wheat, corn, and soybean. 1977 – 2002and soybean. 1977 – 2002
Source: AAPRESIDSource: AAPRESID
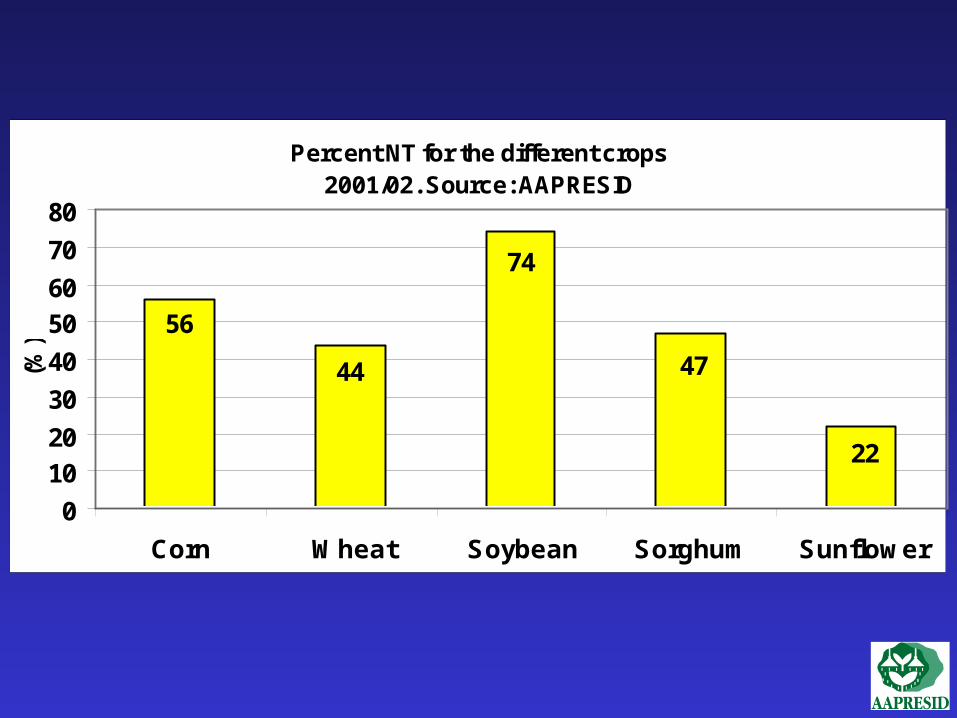
Percent NT for the different crops2001/02. Source: AAPRESID
56
44
74
47
22
0
1020
30
40
5060
70
80
Corn Wheat Soybean Sorghum Sunflower
(%)
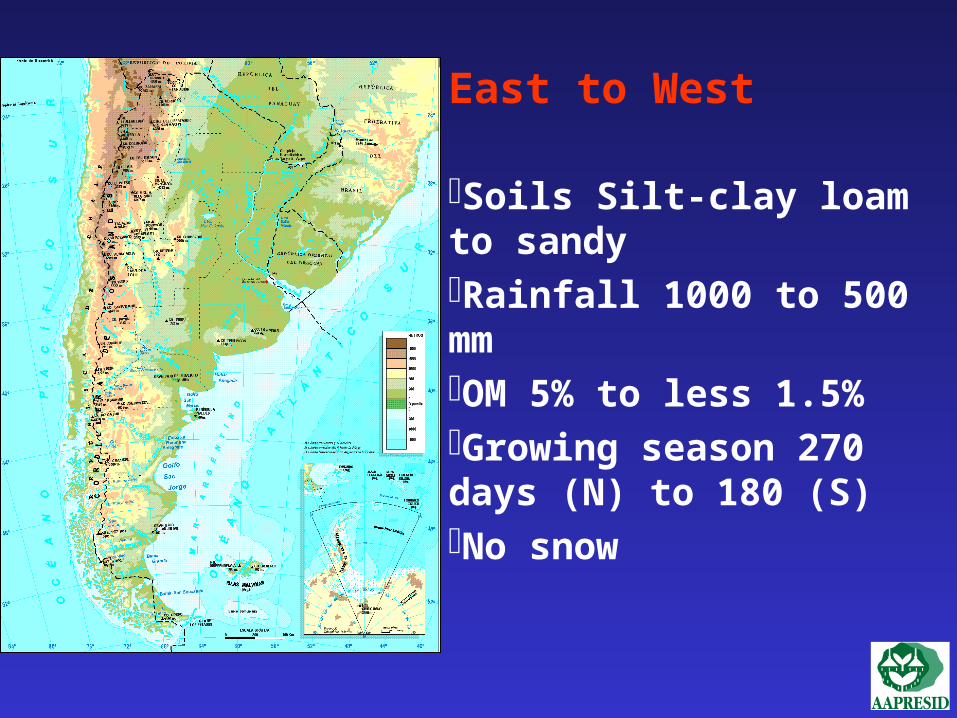
East to West Soils Silt-clay loam to sandyRainfall 1000 to 500 mmOM 5% to less 1.5%Growing season 270 days (N) to 180 (S)No snow
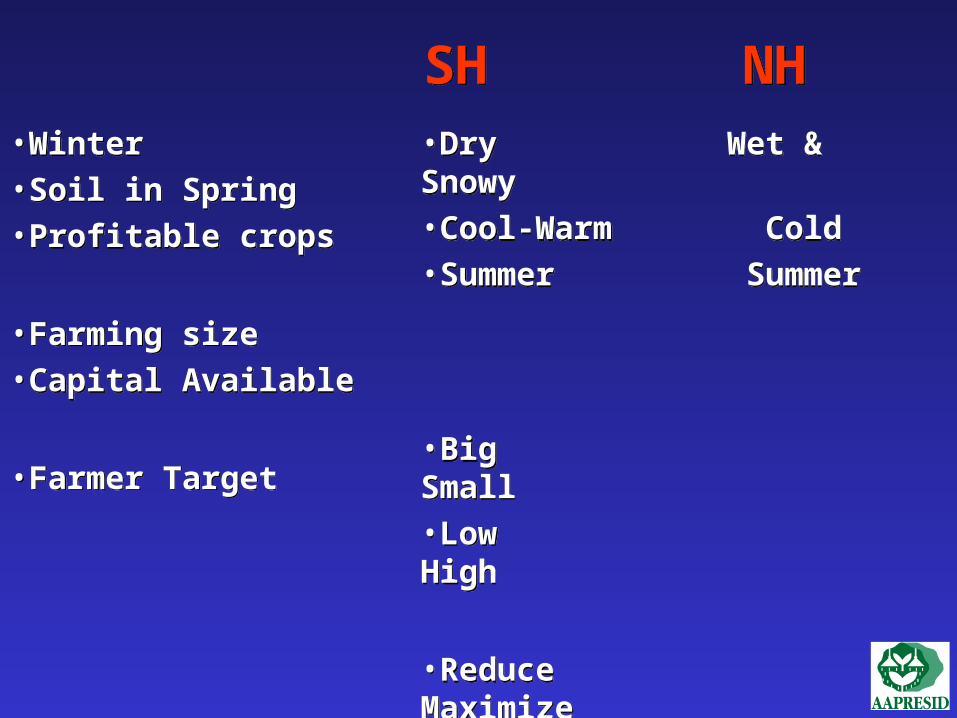
•Winter•Soil in Spring•Profitable crops
•Farming size•Capital Available
•Farmer Target
•Winter•Soil in Spring•Profitable crops
•Farming size•Capital Available
•Farmer Target
•Dry Wet & Snowy •Cool-Warm Cold•Summer Summer
•Big Small •Low High
•Reduce Maximize costs & production risks
•Dry Wet & Snowy •Cool-Warm Cold•Summer Summer
•Big Small •Low High
•Reduce Maximize costs & production risks
SH NHSH NH

Actual and Potential Yield for Actual and Potential Yield for Advanced Technology FarmersAdvanced Technology Farmers
0
2000
4000
6000
8000
10000
12000
Yie
ld (
kg/ha)
Wheat South Corn North Soybean North
Actual
Potential
+ 41%
+ 42%
+ 30%
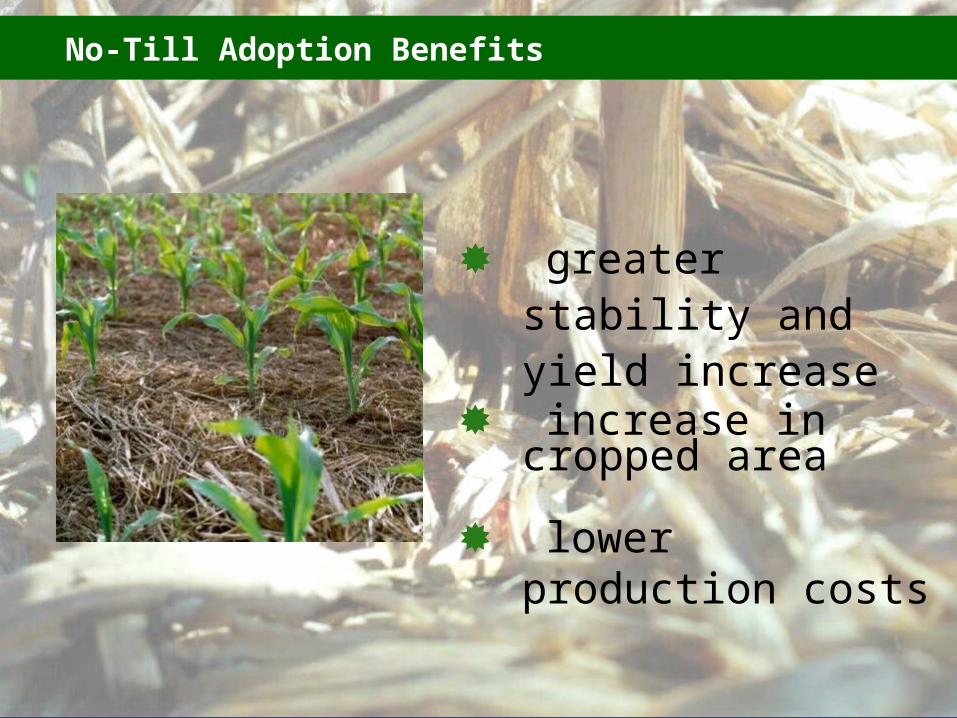
No-Till Adoption Benefits
greater stability and yield increase
increase in cropped area
lower production costs

WHAT HAPPENED WITH SOYBEAN?WHAT HAPPENED WITH SOYBEAN?
The decade of innovationsThe decade of innovations
No-TillNo-Till
Maturity Group IVMaturity Group IV
Round-Up ReadyRound-Up Ready
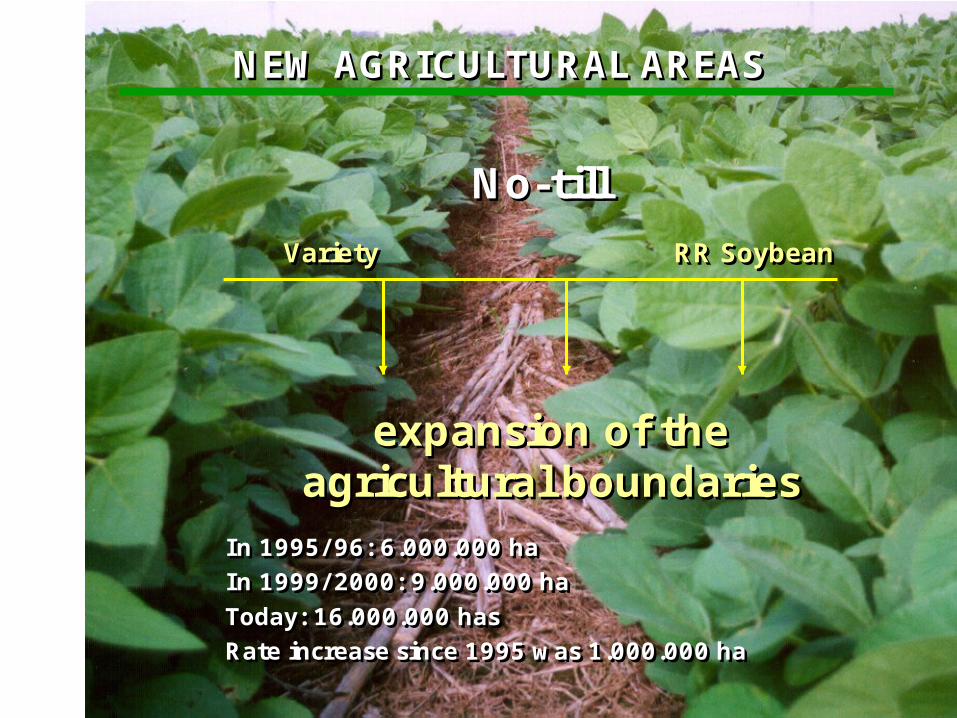
NEW AGRICULTURAL AREASNEW AGRICULTURAL AREAS
No-tillNo-till
VarietyVariety RR SoybeanRR Soybean
expansion of theagricultural boundaries
expansion of theagricultural boundaries
In 1995/ 96: 6.000.000 haIn 1999/ 2000: 9.000.000 ha
Today: 16.000.000 has Rate increase since 1995 was 1.000.000 ha
In 1995/ 96: 6.000.000 haIn 1999/ 2000: 9.000.000 ha
Today: 16.000.000 has Rate increase since 1995 was 1.000.000 ha

• Energy requirement
• Capital investment
• Labor
• Training (knowledge)
• Energy requirement
• Capital investment
• Labor
• Training (knowledge)
• Less More
• Less More
• Less More
• MORE Less
• Less More
• Less More
• Less More
• MORE Less
NT CTNT CT
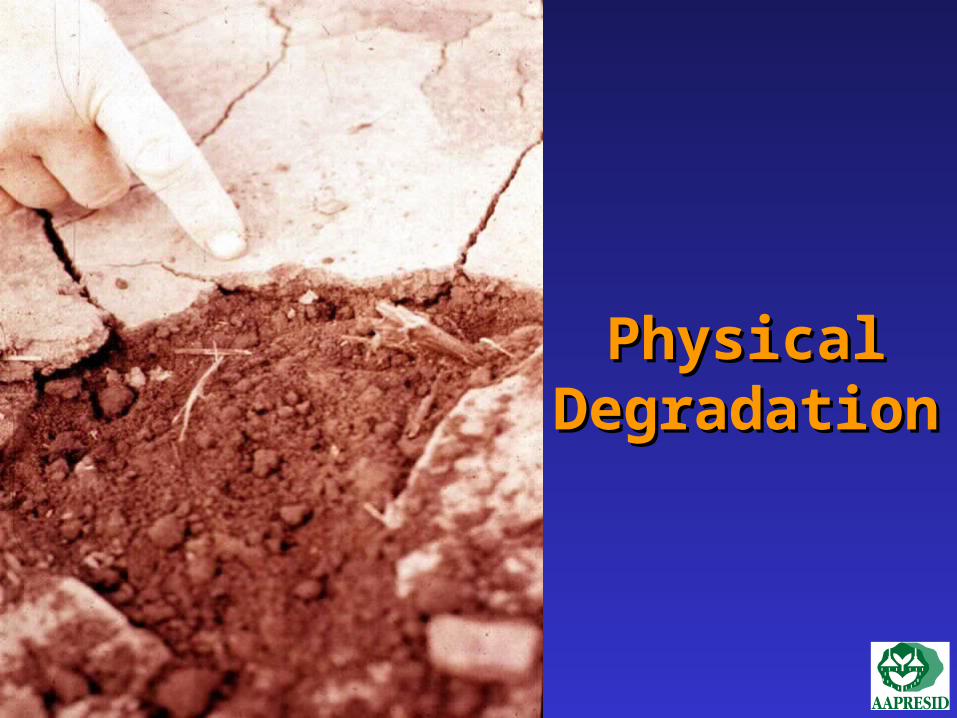
PhysicalPhysicalDegradationDegradation
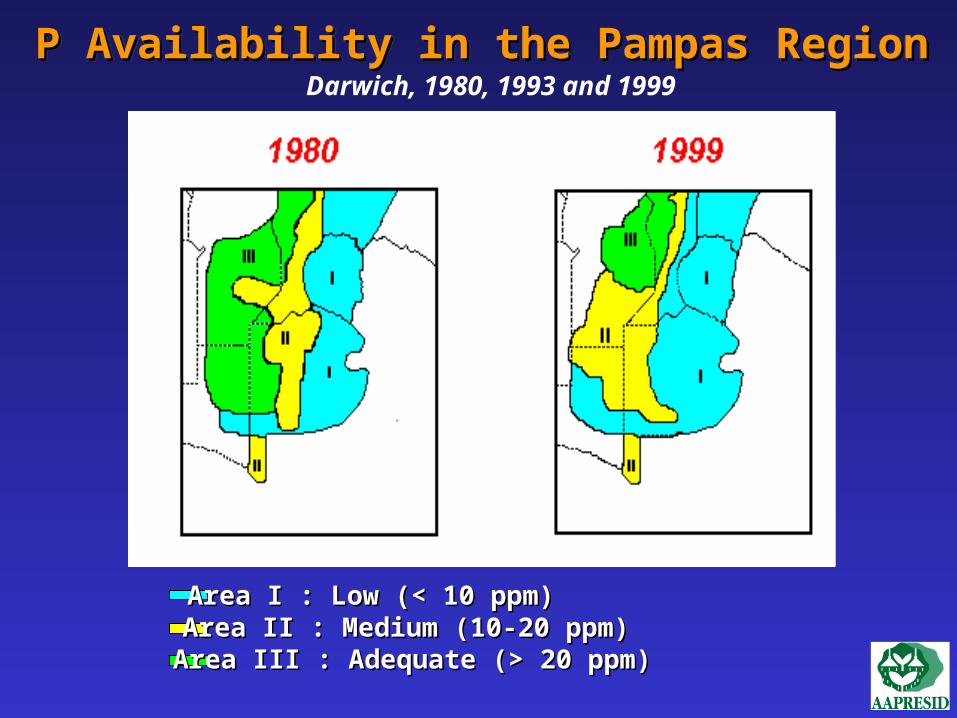
Area I : Low (< 10 ppm)Area I : Low (< 10 ppm)Area II : Medium (10-20 ppm)Area II : Medium (10-20 ppm)Area III : Adequate (> 20 ppm)Area III : Adequate (> 20 ppm)
P Availability in the Pampas RegionP Availability in the Pampas RegionP Availability in the Pampas RegionP Availability in the Pampas RegionDarwich, 1980, 1993 and 1999
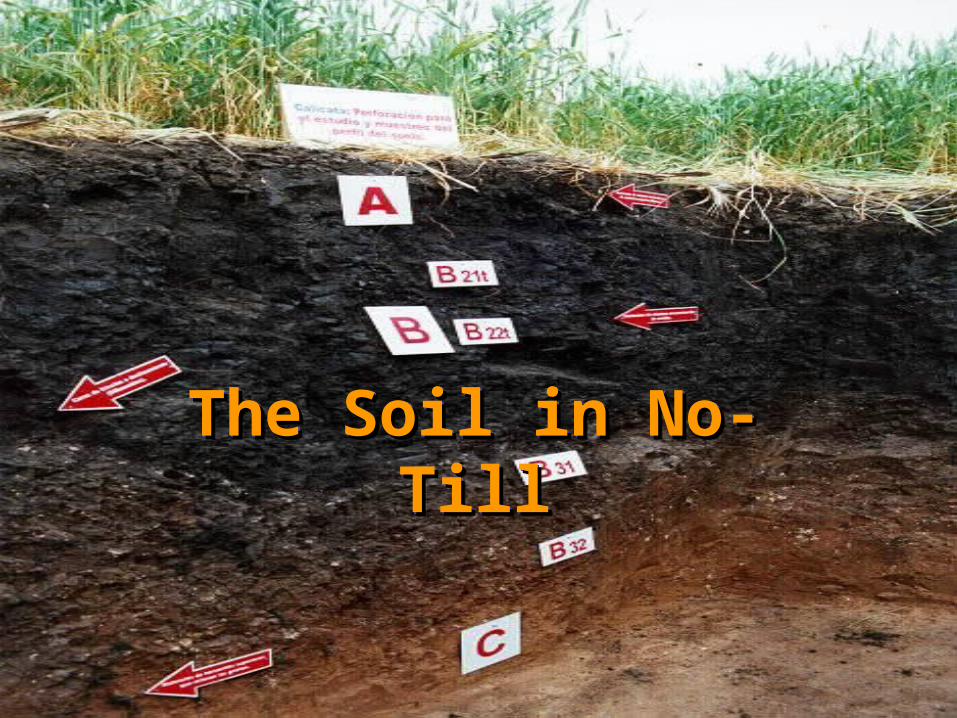
The Soil in No-TillThe Soil in No-TillThe Soil in No-TillThe Soil in No-Till
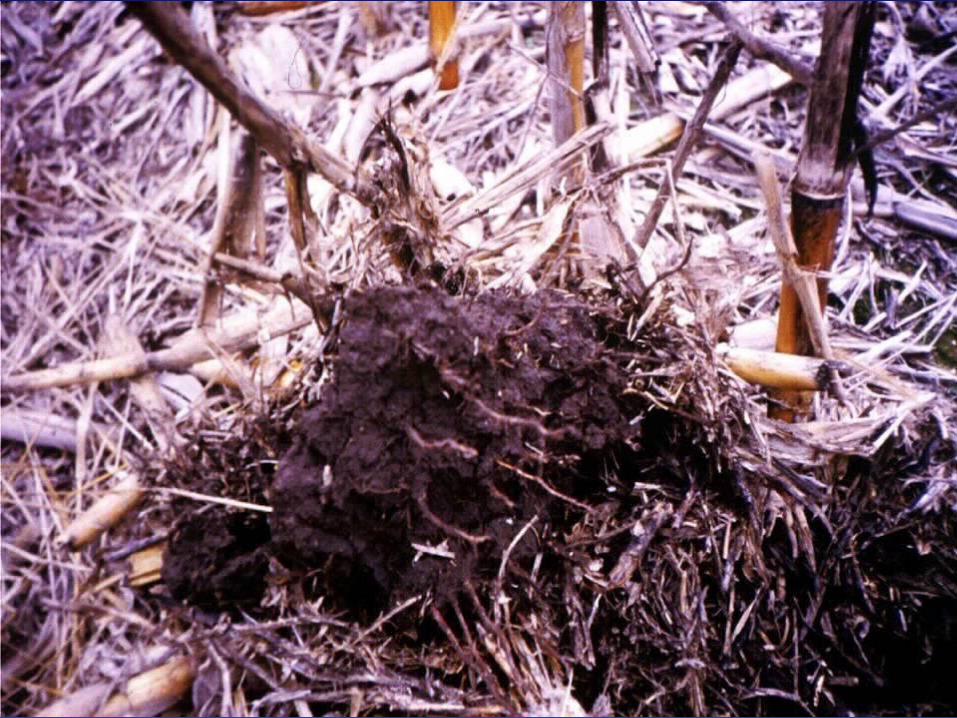
In no-till the function of the In no-till the function of the roots and the macro and meso roots and the macro and meso fauna plays an important role fauna plays an important role in the macropore regenerationin the macropore regeneration
Key Concept 1Key Concept 1


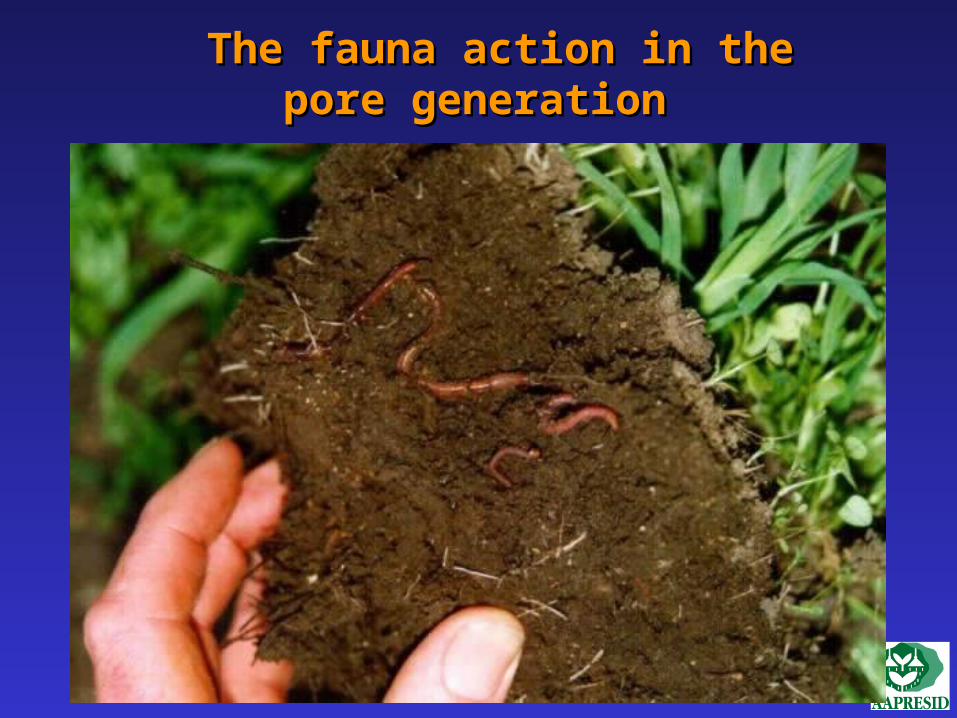
The fauna action in the The fauna action in the pore generationpore generation
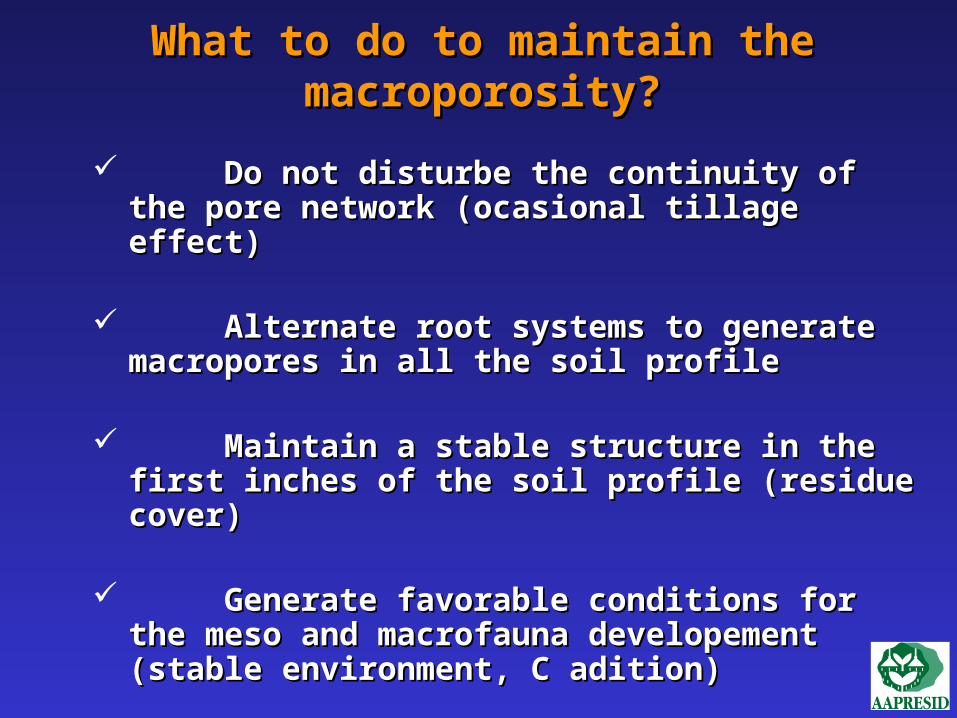
Do not disturbe the continuity of the Do not disturbe the continuity of the pore network (ocasional tillage effect)pore network (ocasional tillage effect)
Alternate root systems to generate Alternate root systems to generate macropores in all the soil profilemacropores in all the soil profile
Maintain a stable structure in the first Maintain a stable structure in the first inches of the soil profile (residue cover)inches of the soil profile (residue cover)
Generate favorable conditions for the Generate favorable conditions for the meso and macrofauna developement meso and macrofauna developement (stable environment, C adition)(stable environment, C adition)
What to do to maintain the What to do to maintain the macroporosity?macroporosity?
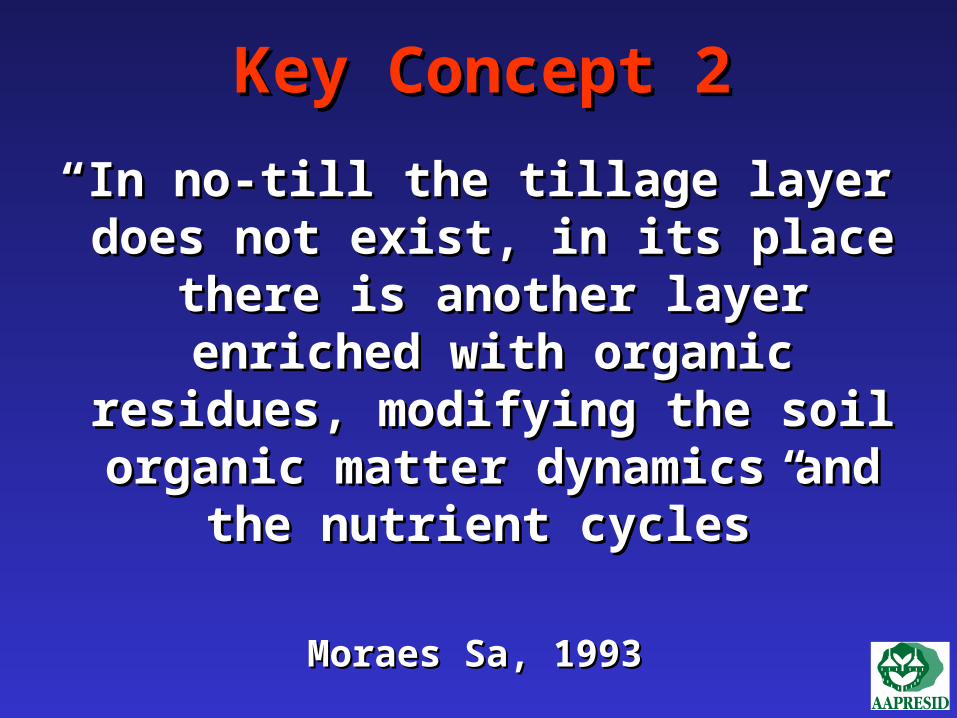
““In no-till the tillage layer does In no-till the tillage layer does not exist, in its place there is not exist, in its place there is another layer enriched with another layer enriched with
organic residues, modifying the organic residues, modifying the soil organic matter dynamics soil organic matter dynamics
and the nutrient cycles”and the nutrient cycles”
Moraes Sa, 1993Moraes Sa, 1993
Key Concept 2Key Concept 2
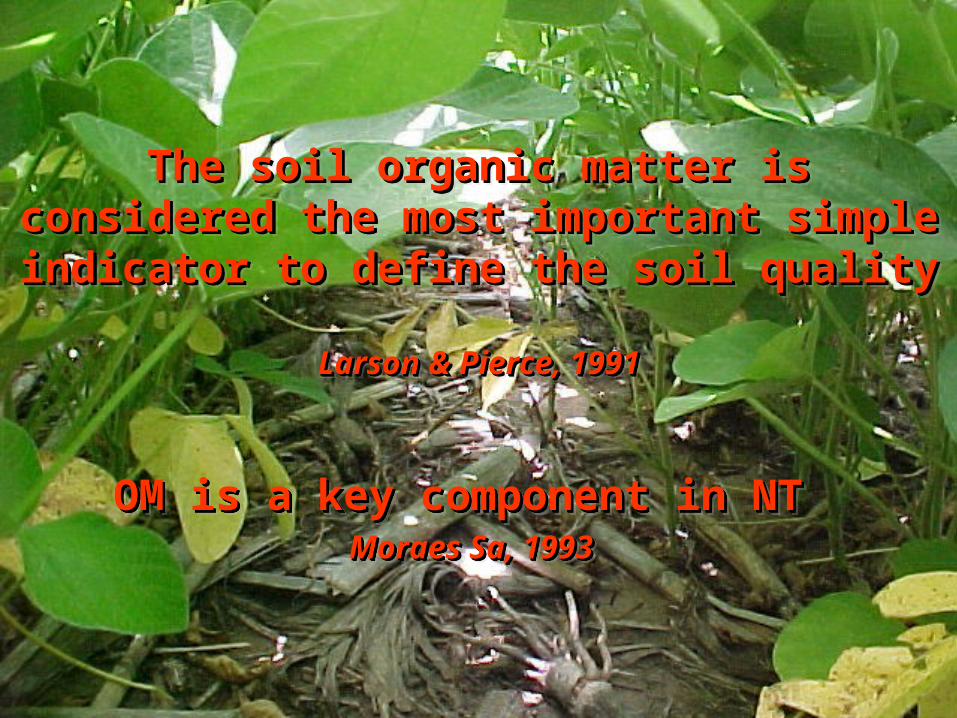
The soil organic matter is considered The soil organic matter is considered the most important simple indicator to the most important simple indicator to
define the soil quality define the soil quality Larson & Pierce,Larson & Pierce, 19911991
The soil organic matter is considered The soil organic matter is considered the most important simple indicator to the most important simple indicator to
define the soil quality define the soil quality Larson & Pierce,Larson & Pierce, 19911991
OM is a key component in NT OM is a key component in NT Moraes SMoraes Sa, 1993a, 1993
OM is a key component in NT OM is a key component in NT Moraes SMoraes Sa, 1993a, 1993
0
10
20
30
40
50
60
70
0 50 100 150 200 250 300
NTCT
De
pth
(c
m)
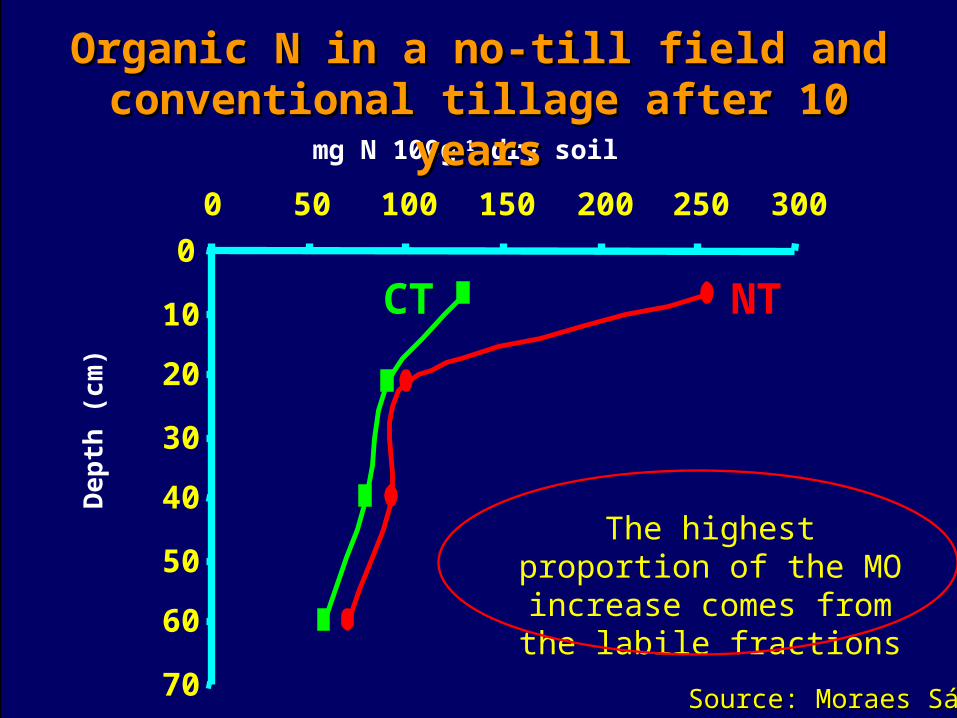
mg N 100g-1 dry soil
Organic N in a no-till field and Organic N in a no-till field and conventional tillage after 10 conventional tillage after 10
yearsyears
The highest proportion of the MO increase comes from the labile fractions
Source: Moraes SáSource: Moraes Sá
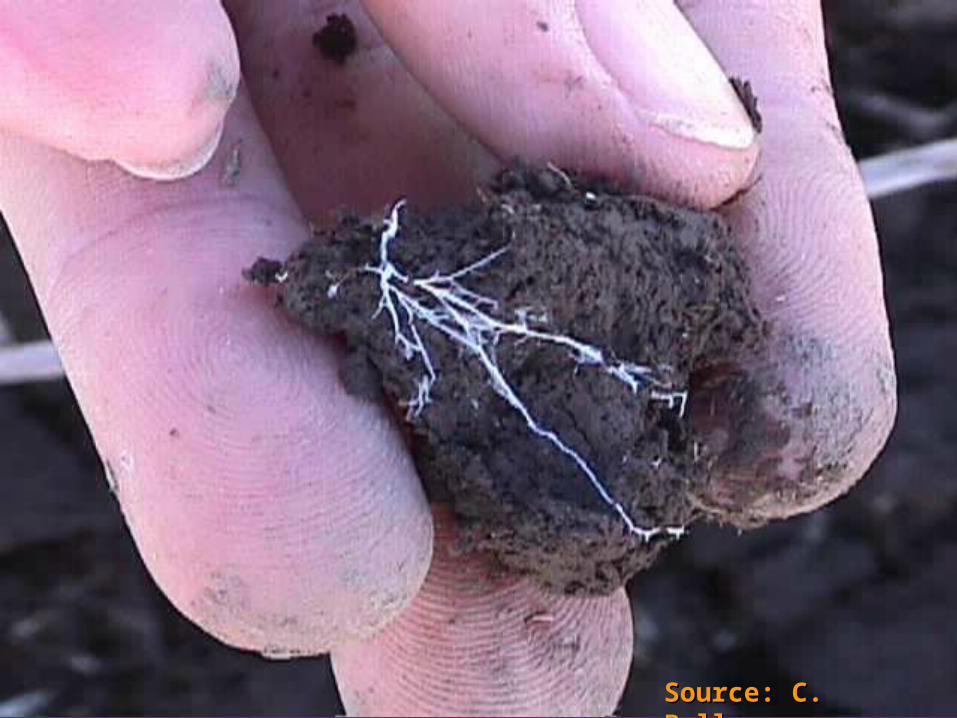
Source: C. BellosoSource: C. Belloso
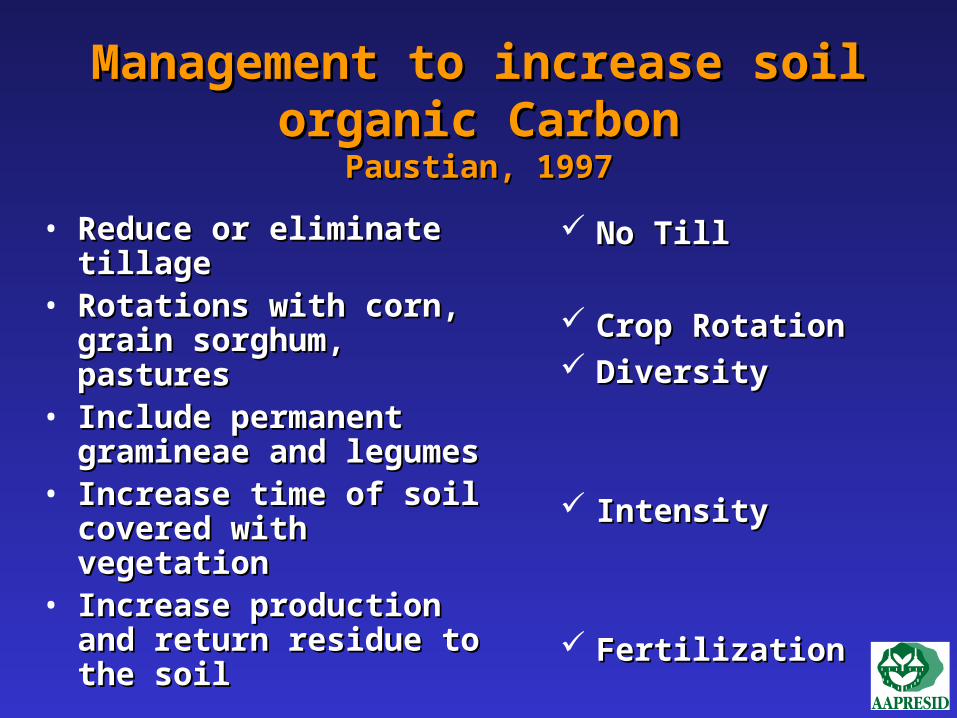
Management to increase soil Management to increase soil organic Carbonorganic Carbon
Paustian, 1997Paustian, 1997
• Reduce or eliminate Reduce or eliminate tillagetillage
• Rotations with corn, Rotations with corn, grain sorghum, grain sorghum, pasturespastures
• Include permanent Include permanent gramineae and gramineae and legumeslegumes
• Increase time of soil Increase time of soil covered with covered with vegetationvegetation
• Increase production Increase production and return residue to and return residue to the soilthe soil
No TillNo Till
Crop RotationCrop Rotation DiversityDiversity
IntensityIntensity
FertilizationFertilization
Key Concept 3Key Concept 3
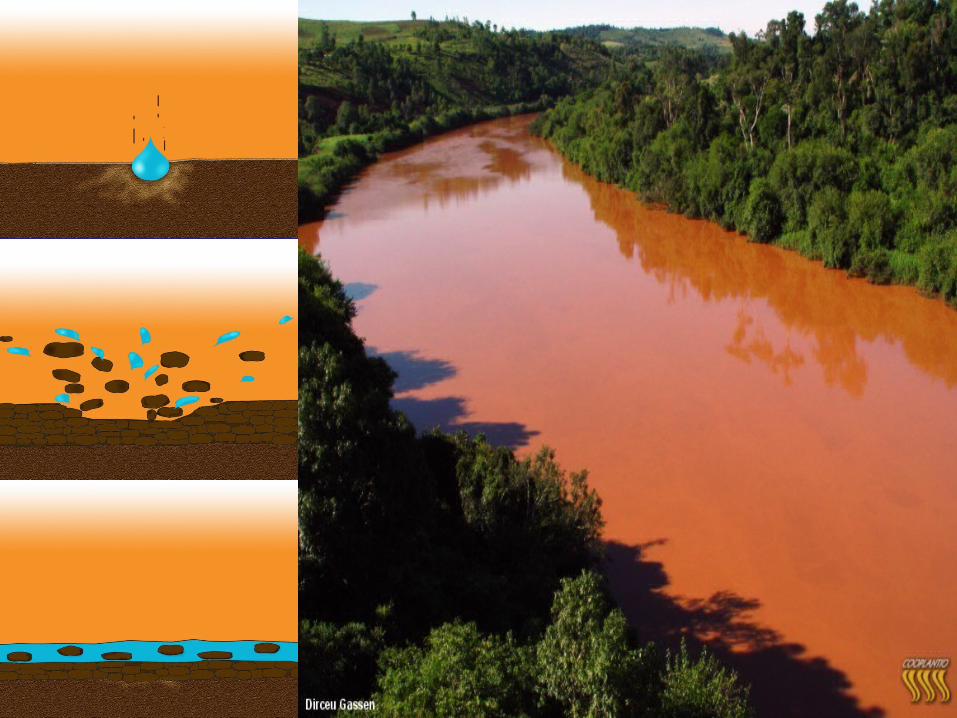
In no-till we make a more In no-till we make a more efficient use of the water as we efficient use of the water as we increase infiltration, decrease increase infiltration, decrease
run-off and evaporation losses, run-off and evaporation losses, and improve the water and improve the water
retention (water storage)retention (water storage)

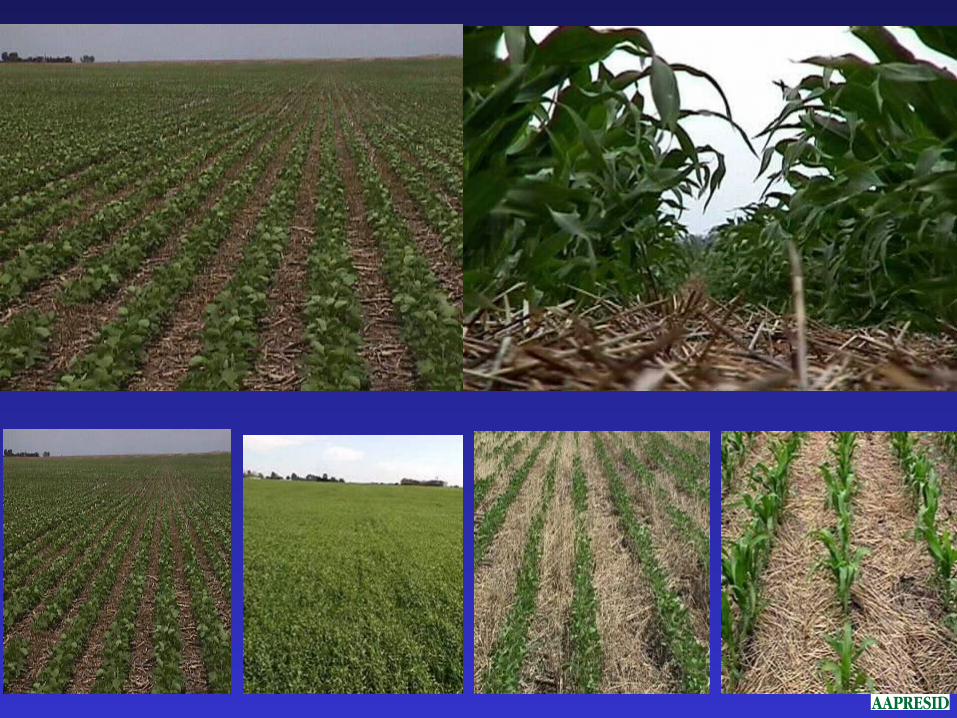
NO-TILLAGE is a synonym of crop residue
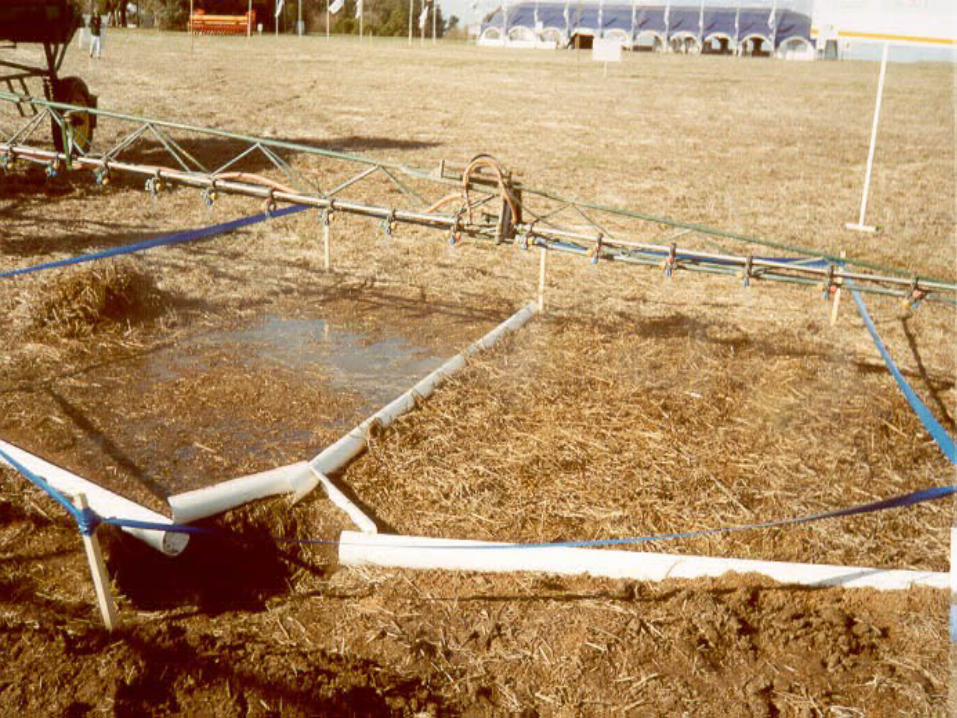
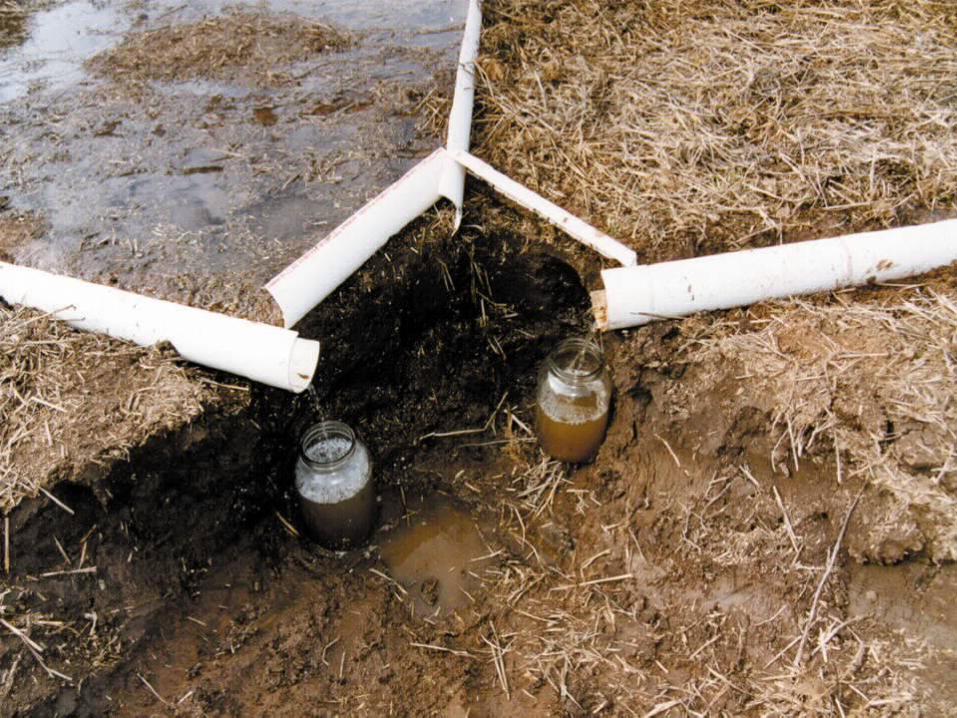


Cover the soil with crop residues Cover the soil with crop residues in an homogeneous and durable wayin an homogeneous and durable way
Maintain a stable structure , Maintain a stable structure , mainly in the first inches on the soil mainly in the first inches on the soil profileprofile
What to do to improve the What to do to improve the rainfall water use efficiency? rainfall water use efficiency?
Key Concept 4Key Concept 4
Balanced fertilization (crop Balanced fertilization (crop nutrition) and adequate crop nutrition) and adequate crop rotation are two of the most rotation are two of the most
important practices for the no-important practices for the no-till systemtill system

Fertilization of the rotationFertilization of the rotation
• Balanced fertilization
• Higher yield response in the rotation
• Nutrient residual effects
• Balance inmovilization-release
• Soil biological activity
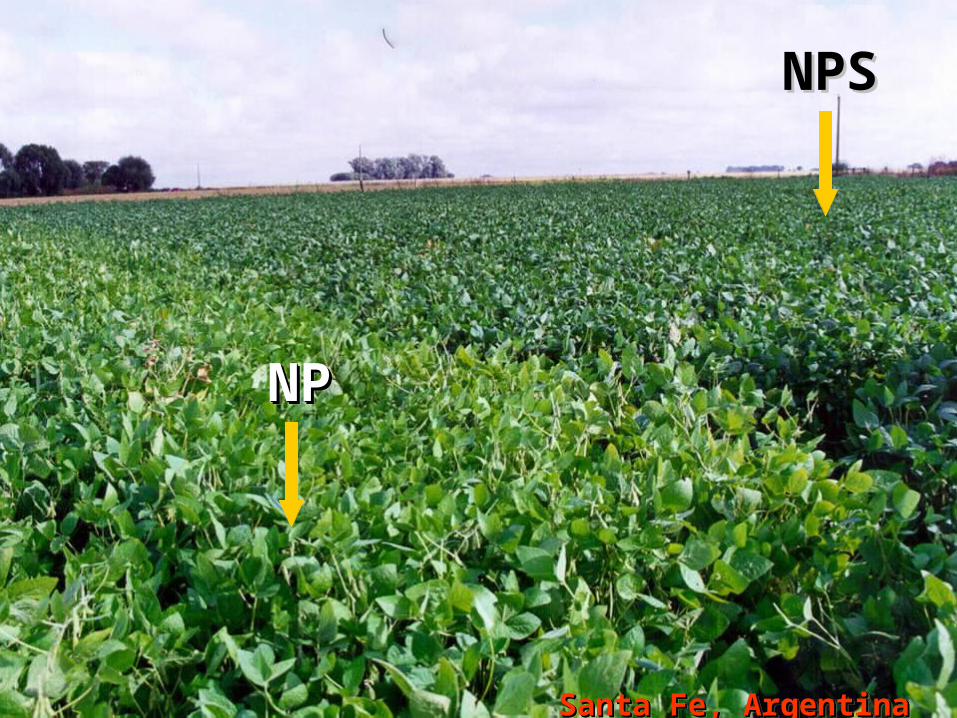
NPNPNPNP
NPSNPS
Santa Fe, ArgentinaSanta Fe, ArgentinaSanta Fe, ArgentinaSanta Fe, Argentina
Crop RotationCrop Rotation
Planned and ordered crop sequence Planned and ordered crop sequence with the objective:with the objective:
• Maximize Maximize productivityproductivity, ,
• minimize minimize risksrisks, ,
• and preserve the involved and preserve the involved resourcesresources. .

• Diversification of Diversification of productive risksproductive risks• Inhibitory effect on Inhibitory effect on pathogenspathogens• Interruption of Interruption of weedweed and and insectinsect cycles cycles• Chemical fertilityChemical fertility: nutrient balance: nutrient balance• Biological activity and diversityBiological activity and diversity
• Improves Improves soil physical conditionssoil physical conditions (structure (structure and porosity)and porosity)
• Intensification: use the Intensification: use the stored waterstored water in NT. in NT.
Crop Rotation:Crop Rotation:
AdvantagesAdvantages

I – Context AnalysisThe dilemma
“The humanity faces today a dilemma with no apparent solution, between the ghost of the lack of food for an increasing demand in quantity and quality, or a destruction of the natural resources needed to produce them”.
CertifiedAgriculture
The evolution of NT

II– The no-till system Consequences
- 96% less soil erosion.- 66% less fuel use.- Maintenance or improvement of the organic matter.- Higher water use efficiency.- Increase in soil fertility.- Lower production costs.- Higher production stability and higher yield potential.
TANGIBLE BENEFITS FOR THE FARMER
CertifiedAgriculture
The evolution of NT
II– The no-till system Benefits, beyond the farmer
- Better soils- Less competition for drinkable water (strategic resource)- Higher water quality (lower erosion and contamination risk)- Better atmosphere, positive impact in the climate change- Lower pressure on more fragile areas (by an increase in yields)- Possibility of producing in more fragile areas without the known risks of Conventional Tillage (CT).
BENEFITS TANGIBLE FOR THE SOCIETY (EXTERNALITY)
CertifiedAgriculture
The evolution of NT

III– Productive and environmental quality management system in CA (QMS/CA)
Objectives:
- To provide tools for a professional agronomical management, by the ordered registry of information and the analysis of the soil quality and efficiency indicators.
- To show to the rest of the society how are the production processes and its impact on the environment, allowing to capture the value of the positive externality that the CA makes in it.
CertifiedAgriculture
The evolution of NT
Components:
- Principles & Criteria:- RTRS, RSB, ISGA, RTSPO, FSC, FAO
- Management indicators:- in the soil - resource use efficiency
- Good Agricultural Practices Protocol (GAP’s)
III– Productive and environmental quality management system in CA (QMS/CA)
CertifiedAgriculture
The evolution of NT
It is the production alternative that better combines the interests – many times confronted – of reaching a production:
-Economically viable for farmers.-Environmentally sustainable.-Socially accepted.-Energetically efficient.
CertifiedAgriculture
The evolution of NT
Certified Agriculture
Thank you!!!!
www.aapresid.org.ar/english
CertifiedAgriculture
The evolution of NT

0.54
0.49 0.49
0.47
0.4
0.42
0.44
0.46
0.48
0.5
0.52
0.54
To
tal
Po
rosi
ty(c
c/cc
)
Surface 10 cm (4") SurfaceTrack
Track 10 cm(4")
Effect of the machinery tracks in no-till fie lds on the total porosity (and bulk density) in Tipic Argiudolls of
the Pampas. (Gil, 2001)

7.44
4.25
2.340.41
0
1
2
3
4
5
6
7
8
Sat
. K (
cm/h
r)
Surface 10 cm (4") SurfaceTrack
Track 10 cm(4")
Effect of the machinery tracks in no-till fields on the soil Hidraulic Conductivity in Tipic Argiudolls of the Pampas.
(Gil, 2001)
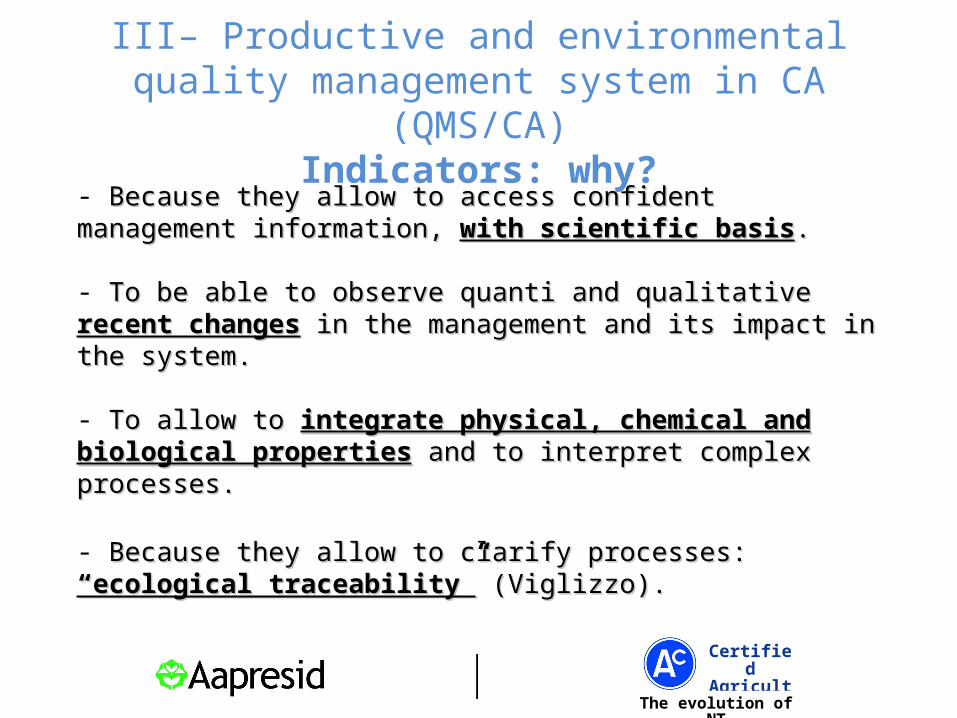
- Because they allow to access confident management information, Because they allow to access confident management information, with with scientific basisscientific basis..
- To be able to observe quanti and qualitative To be able to observe quanti and qualitative recent changesrecent changes in the in the management and its impact in the system.management and its impact in the system.
- To allow to To allow to integrate physical, chemical and biological propertiesintegrate physical, chemical and biological properties and to and to interpret complex processes.interpret complex processes.
- Because they allow to clarify processes: Because they allow to clarify processes: “ecological traceability”“ecological traceability” (Viglizzo).(Viglizzo).
- Because they are tools Because they are tools to certifyto certify products and processes, and also products and processes, and also to to create brandscreate brands (Viglizzo).(Viglizzo).
III– Productive and environmental quality management system in CA (QMS/CA)
Indicators: why?
CertifiedAgriculture
The evolution of NT
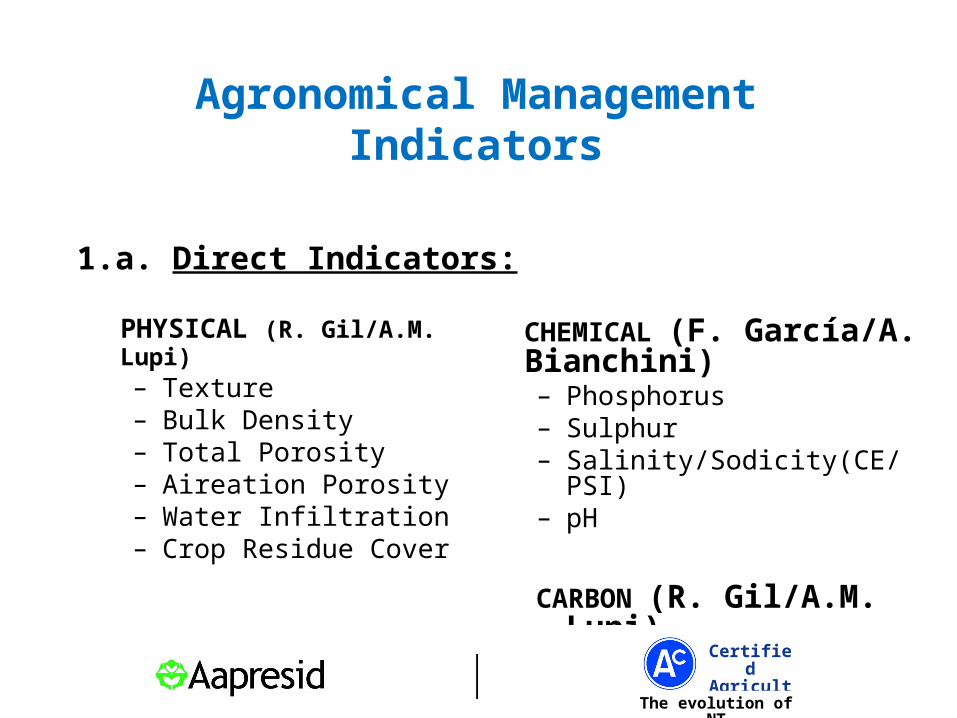
PHYSICAL (R. Gil/A.M. Lupi)
– Texture– Bulk Density– Total Porosity– Aireation Porosity– Water Infiltration– Crop Residue Cover
Agronomical Management Indicators
1.a. Direct Indicators:
CHEMICAL (F. García/A. Bianchini)– Phosphorus– Sulphur– Salinity/Sodicity(CE/PSI)– pH
CARBON (R. Gil/A.M. Lupi)– Soil Carbon Dynamics
CertifiedAgriculture
The evolution of NT
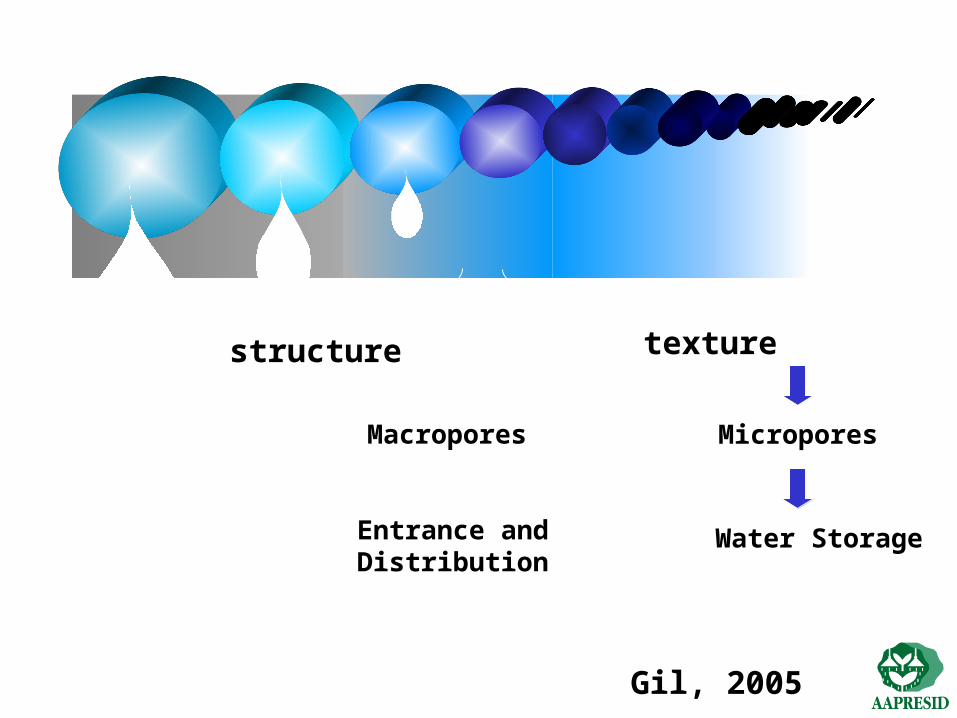
30u
CC0.2u
PMP
structure
Entrance and Distribution
Macropores
texture
Water Storage
Micropores
Gil, 2005

1.b. Indirect indicators:- Crop rotation diversity and intensity.- Nutrient balance (N, P, S).- Fosil energy use (Agro-Eco-Index).- Water use (Agro-Eco-Index).
1.c. Resource use efficiency: - Water use efficiency (Agro-Eco-Index).- Energy use efficiency (Agro-Eco-Index).
CertifiedAgriculture
The evolution of NT
Agronomical Management Indicators
Sources Used:
• FAO, ISGA, FCAA, USB, RTRS, RSB, RSPO, Rain Forest Alliance• National & international research studies
Peer review:
J.L. Arzeno (INTA Salta), N. Darwich (Consultor Privado), M. Díaz-Zorita (FAUBA-Nitragin), M. Ferrari (INTA Pergamino), J. Galantini (UN del Sur), V. Gudelj (INTA Marcos Juárez), E. Jobbagy (UN San Luis), M. Puente (Lab. GEA San Luis), C. Quintero (UN Entre Ríos).
CertifiedAgriculture
The evolution of NT
Agronomical Management Indicators
Why?Why?
Because there are scientific fundamentals that correlate soil health indicator values with
agronomical practices
III– Productive and environmental quality management system in CA (QMS/CA)
GAP’s
CertifiedAgriculture
The evolution of NT
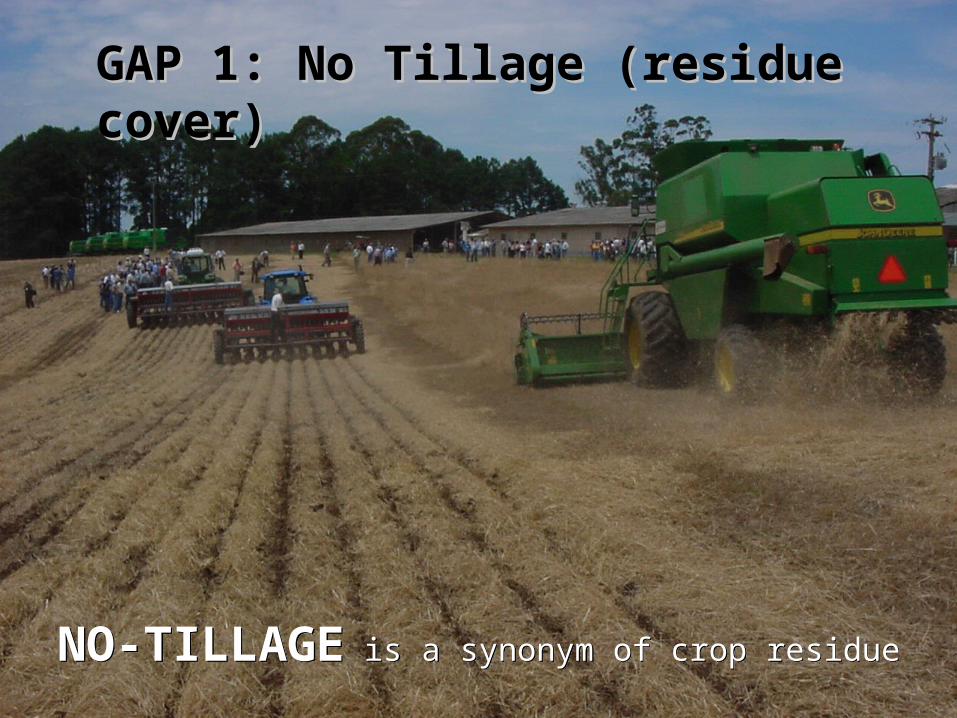
NO-TILLAGE is a synonym of crop residueNO-TILLAGE is a synonym of crop residue
GAP 1: No Tillage (residue cover)GAP 1: No Tillage (residue cover)
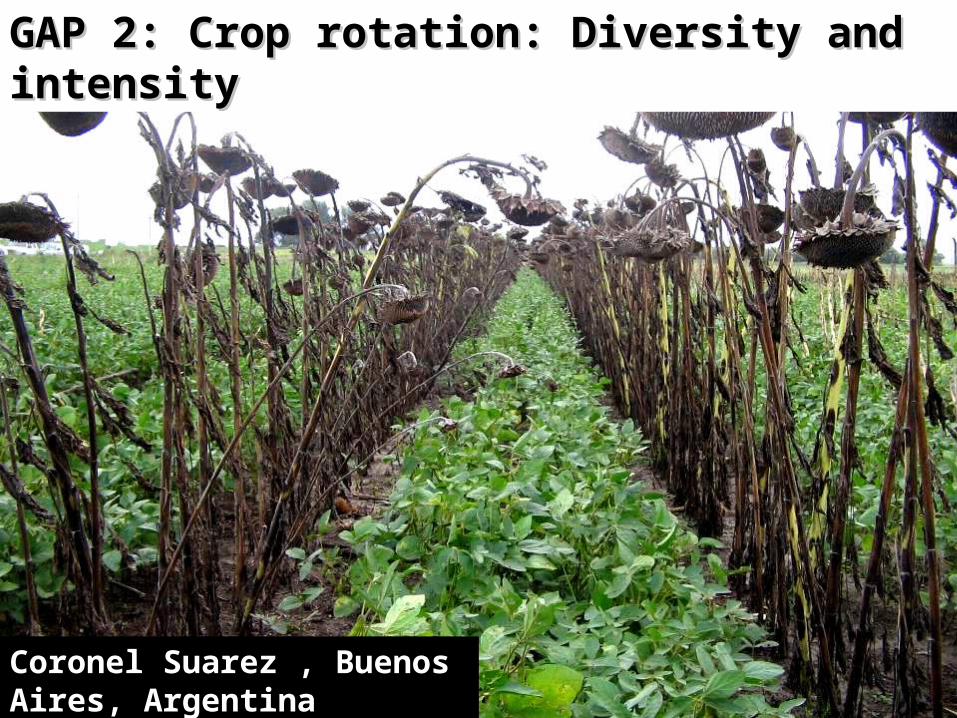
Coronel Suarez , Buenos Aires, ArgentinaFederico Roveda (2007)
GAP 2: Crop rotation: Diversity and intensityGAP 2: Crop rotation: Diversity and intensity
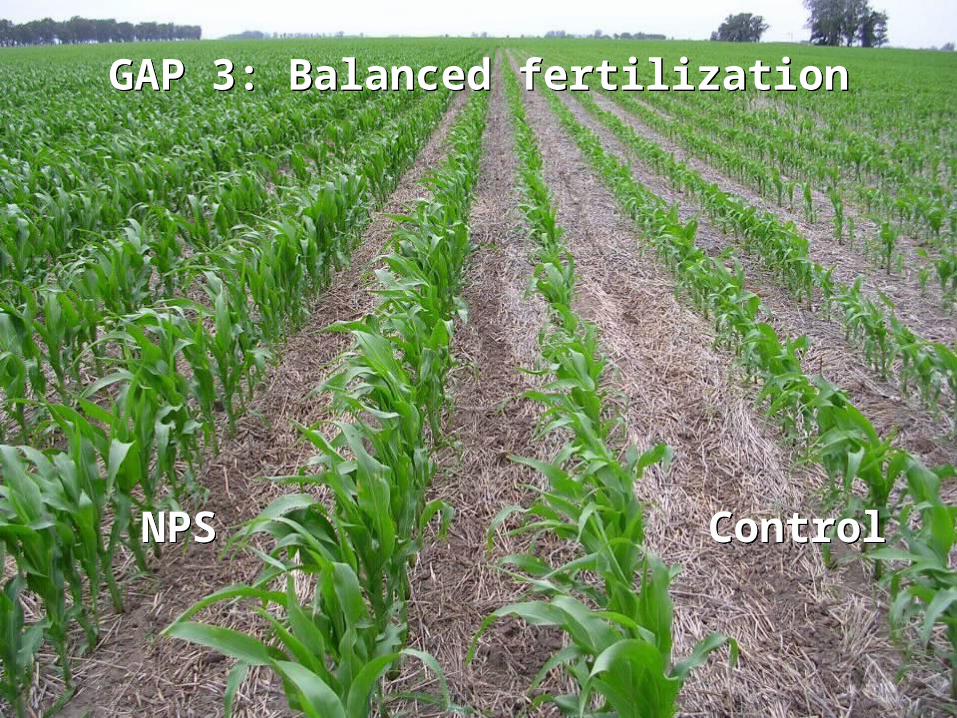
GAP 3: Balanced fertilizationGAP 3: Balanced fertilization
ControlControlNPSNPS
GAP 4: Integrated pest, weed and disease management.
Including the correct agrochemical management and its containers
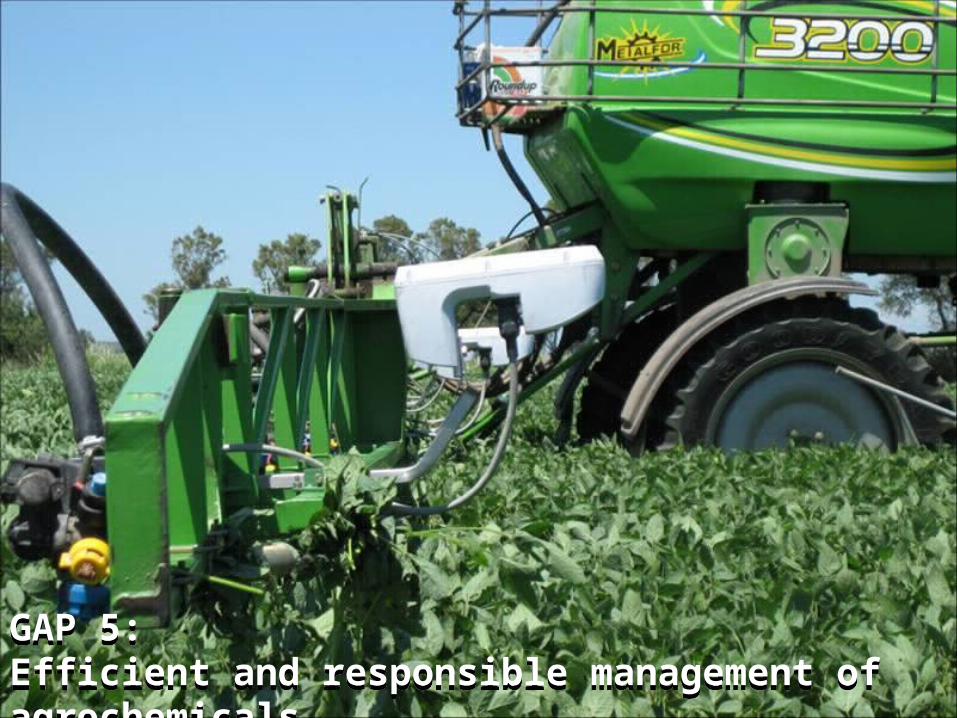
GAP 5: Efficient and responsible management of agrochemicalsGAP 5: Efficient and responsible management of agrochemicals

GAP 6: Cattle productionGAP 6: Cattle production