NitrogeN reductioN at five SwediSh muNicipal … · 3 · 12 169 NitrogeN reductioN at five SwediSh...
6
169 VATTEN · 3 · 12 NITROGEN REDUCTION AT FIVE SWEDISH MUNICIPAL WASTEWATER TREATMENT PLANTS CONFIGURED IN A MULTI-REACTOR MOVING BED BIOFILM REACTOR PROCESS Kvävereduktion på fem kommunala avloppsreningsverk i Sverige som tillämpar hela processen med rörliga bärare by GUSTAF LUSTIG 1 , CARL DAHLBERG 2 1 ÅF Infrastructure, Kvarnbergsg. 2, 411 05 GÖTEBORG, [email protected] 2 SWECO Environment, Ö. Strandg. 10, 553 24 JÖNKÖPING, [email protected] Abstract Results from wastewater treatment plants with their entire biological treatment step in a multi-reactor config- ured Moving Bed Biofilm Reactor process designed for nitrogen reduction is available on at least five places in Sweden. An evaluation has been made; of the design and reduction efficiency from these five wastewater treat- ment plants. The study confirms the idea that these Moving Bed Biofilm Reactors have been constructed in small volumes. However the treatment results have in some cases not been satisfactory. Among the five treat- ment plants, only one shows good performance. The reactor set up and the small volumes can therefore be attributed to overestimation of the capacity or the necessity to make the technology competitive. Key words – Moving Bed Biofilm Reactor, Nitrogen reduction, Full-scale experiences, Design, Sweden Sammanfattning Resultat från avloppsreningsverk som har hela det biologiska reningssteget i en flerstegs process bestående av rörlig biofilm (Moving Bed Biofilm Reactor) dimensionerad för kvävereduktion finns på åtminstone fem reningsverk i Sverige. Dessa fem avloppsreningsverk har utvärderats med hänsyn till design och effektivitet i denna studie. Studien bekräftar uppfattningen om att reningsverk med rörlig biofilm har konstruerats med små volymer. Dock har reningsresultaten inte alltid visat sig vara tillfredställande. Bland de fem, uppvisar endast ett reningsverk tillfredsställande resultat, i synnerhet med avseende på kvävereningen. Processtrukturen och de små volymerna kan därmed vara ett tecken på att kapaciteten överskattas eller att det finns ett behov av att dimen- sionera snålt för att göra tekniken konkurrenskraftig. VATTEN – Journal of Water Management and Research 68:169–174. Lund 2012 Introduction Biofilm processes, as Conventional Trickling Filters (CTF) are constructed in smaller volumes than sus- pended processes as Conventional Activated Sludge (CAS) systems. They are known for being less sensitive for hydraulic variations and have displayed good reduc- tion results of organic compounds but less respectable nitrogen reduction capacity. Several pilot and full-scale studies of multi-reactor sequenced Moving Bed Biofilm Reactor (MBBR) systems where carried out in the 90’s. Among those Ødegaard and Rusten (1994) and Rusten and Hem (1995a) indicated problems in establishing good denitrifaction in pre-denitification mode and lim- ited removal efficiency. Both pre- and post denitrifica- tion were studied intensely during the 90s at full-scale plants in Norway. Testing and start-up of the nine reac- tors sequenced Lillehammer Waste Water Treatment Plant (WWTP) is described by Rusten and Siljudalen (1995). Results at Lillehammer included over 80 % ni- trogen reduction in 1995. Gardemoen WWTP was studied by Tranum and Rusten (1999) with excellent
-
Upload
nguyenliem -
Category
Documents
-
view
217 -
download
4
Transcript of NitrogeN reductioN at five SwediSh muNicipal … · 3 · 12 169 NitrogeN reductioN at five SwediSh...

169VATTEN · 3 · 12
NitrogeN reductioN at five SwediSh muNicipal waStewater treatmeNt plaNtS coNfigured iN a
multi-reactor moviNg Bed Biofilm reactor proceSS
Kvävereduktion på fem kommunala avloppsreningsverk i Sverige som tillämpar hela processen med rörliga bärare
by Gustaf LustiG 1, CarL DahLberG 2
1 Åf infrastructure, Kvarnbergsg. 2, 411 05 GÖtebOrG, [email protected] sWeCO environment, Ö. strandg. 10, 553 24 JÖNKÖPiNG, [email protected]
abstractResults from wastewater treatment plants with their entire biological treatment step in a multi-reactor config-ured Moving Bed Biofilm Reactor process designed for nitrogen reduction is available on at least five places in Sweden. An evaluation has been made; of the design and reduction efficiency from these five wastewater treat-ment plants. The study confirms the idea that these Moving Bed Biofilm Reactors have been constructed in small volumes. However the treatment results have in some cases not been satisfactory. Among the five treat-ment plants, only one shows good performance. The reactor set up and the small volumes can therefore be attributed to overestimation of the capacity or the necessity to make the technology competitive.
Key words – Moving Bed Biofilm Reactor, Nitrogen reduction, Full-scale experiences, Design, Sweden
SammanfattningResultat från avloppsreningsverk som har hela det biologiska reningssteget i en flerstegs process bestående av rörlig biofilm (Moving Bed Biofilm Reactor) dimensionerad för kvävereduktion finns på åtminstone fem reningsverk i Sverige. Dessa fem avloppsreningsverk har utvärderats med hänsyn till design och effektivitet i denna studie. Studien bekräftar uppfattningen om att reningsverk med rörlig biofilm har konstruerats med små volymer. Dock har reningsresultaten inte alltid visat sig vara tillfredställande. Bland de fem, uppvisar endast ett reningsverk tillfredsställande resultat, i synnerhet med avseende på kvävereningen. Processtrukturen och de små volymerna kan därmed vara ett tecken på att kapaciteten överskattas eller att det finns ett behov av att dimen-sionera snålt för att göra tekniken konkurrenskraftig.
VATTEN – Journal of Water Management and Research 68:169–174. Lund 2012
introductionBiofilm processes, as Conventional Trickling Filters (CTF) are constructed in smaller volumes than sus-pended processes as Conventional Activated Sludge (CAS) systems. They are known for being less sensitive for hydraulic variations and have displayed good reduc-tion results of organic compounds but less respectable nitrogen reduction capacity. Several pilot and full-scale studies of multi-reactor sequenced Moving Bed Biofilm Reactor (MBBR) systems where carried out in the 90’s.
Among those Ødegaard and Rusten (1994) and Rusten and Hem (1995a) indicated problems in establishing good denitrifaction in pre-denitification mode and lim-ited removal efficiency. Both pre- and post denitrifica-tion were studied intensely during the 90s at full-scale plants in Norway. Testing and start-up of the nine reac-tors sequenced Lillehammer Waste Water Treatment Plant (WWTP) is described by Rusten and Siljudalen (1995). Results at Lillehammer included over 80 % ni-trogen reduction in 1995. Gardemoen WWTP was studied by Tranum and Rusten (1999) with excellent

170 VATTEN · 3 · 12
results, reaching 90 % reduction of nitrogen in a se-quence of seven reactors. The plant was revaluated by Rusten and Wien (2000) and the plant had a capacity of exceeding 85 % total nitrogen reduction efficiency. In five municipalities in Sweden, MBBR processes are used over the entire biological treatment step for nitro-gen reduction. Three of them have a configuration of pre-denitrification and two have both pre- and post-denitrification. The WWTPs are small compared with conventional systems and four of them are having capac-ity problems. This paper has its focus on evaluating full scale MBBR installations in Sweden with two different processes and their nitrogen reduction capacity.
theoryIn theory, pre-denitrification capacity is limited by hy-draulics and very dependent on the recirculation ratio. Praxis for recirculation ratio for CAS has been three times the influent flow besides the nitrate containing sludge recycle stream. It is however not unusual that the recirculation ratio is higher than three in CAS processes – particularly since a full scale plant average flow seldom are the design flow for pumps etc. The nitrate reduction potential depends on the recirculation ratio according to equation [1] described by Ødegaard (1992). rRN(%) = r + 1 * (100 %) [1]
The relation between recirculation ratio and the poten-tial reduction of nitrate from equation [1] is visualised in Figure 1. It implies that a recirculation ratio of 2 results in a maximum theoretical nitrate reduction of around 66 %. As seen in Figure 1, the potential reduction of nitrate increase with increasing recirculation ratio. Rusten and Hem (1995a) however displayed that there was a de-
crease in nitrogen reduction in MBBR processes when the recirculation ratio exceeded two. The reduced deni-trification performance was elucidated by Rusten and Hem (1995a) as large amounts Dissolved Oxygen (DO) being returned to the denitrification step and dilution of the influent easily degradable carbon (SBOD) for deni-trification. Since MBBR processes operates under higher DO concentrations, in the range of 5 to 8 mg per L, deoxidation is crucial for the process, and utterly prob-lematic. Pre-denitrification in a MBBR process is there-fore an issue of higher DO concentrations and recircula-tion ratios than for corresponding CAS processes, to achieve the same nitrate reduction potential. The capac-ity is therefore not only an issue of dilution sensitive degradation rates, but hydraulics in a complex feedback system. There are also hydraulic limitations due to the presens of carriers and sieves and reduction limitations are rapidly reached in the system. Substantial nitrification is considered crucial for a high nitrogen reduction capacity in multi-reactor con-figured MBBR processes and Rusten and Hem (1995a) suggested that nitrification rates could be described as reduction of ammonium per area biofilm and can be es-timated according to equation [2].
rA, NH4 = kA * Sn
N [2]
Where rA,NH4 is the ammonium degradation rate in the
biofilm per unit area and depends on a temperature sensitive reaction rate coefficient and a rate limiting sub-strate concentration. The rate limited substrate concen-tration for nitrification is estimated in each of the indi-vidual aerated reactor, connected in series. The substrate concentration Sn is limited by either oxygen concentra-tions SO available in the biofilm or the Total Ammoni-um Nitrogen (TAN) concentration in the wastewater, denoted SA and finally adjusted to a reaction order N estimated to 0.7 according to Hem and Rusten (1994) and Rusten et al. (2006). Oxygen rate limited condi-tions SO can be described according to Simonsen (2008), seen in equation [3].
SO = DODIM – DODEP [3] DO (TAN)TRANS
Where DODIM is the oxygen concentration in the bulk phase of the selected design and DODEP is the estimated consumption of oxygen through the heterotrophic layer of the biofilm, estimated to be 0.5 mg DO per L for very low BOD5 concentrations and up to 2.5 mg DO per L for SBOD5 close to 1.5 mg per L according to Rusten DOand Hem (1995a). The transition
(TAN)TRANS be-
tween oxygen rate limited nitrification and ammonium Figure 1. Potential nitrated reduction in relation to the recircula-tion ratio.
171VATTEN · 3 · 12
rate limited nitrification is between 2.5 and 4 mg per L according to Rusten and Hem (1995a) and often set to 3.2, specified by Szwerinski and Arvin (1986). The value is valid when easy degradable organic compounds are absent. The reaction rate coefficient depends on the temperature under oxygen rate limited nitrification according to equation [4], described by Rusten et al. (2006).
kT2 = kT1
* qT(T2 – T1) [4]
Where kT2 and kT1
is the reaction rate constant at differ-ent temperatures and qT describes the temperature coef-ficient, set to 1.06 by Ødegaard (1992) and 1.09 by Rusten and Hem (1995b). The rate coefficient kT2
is de-creasing with increasing soluble organic loads (SBOD) and suspended matter in the wastewater described by Rusten et al. (2006). At low ammonium concentrations kA is estimated to 0.5 d–1 according to Rusten et al. (2006). Therefore, it is implied that high oxygen con-centrations and high temperatures, with low concentra-tions of soluble BOD and Total Suspended Solids (TSS) are necessary for high nitrification rates in well-estab-lished nitrifying biofilms.
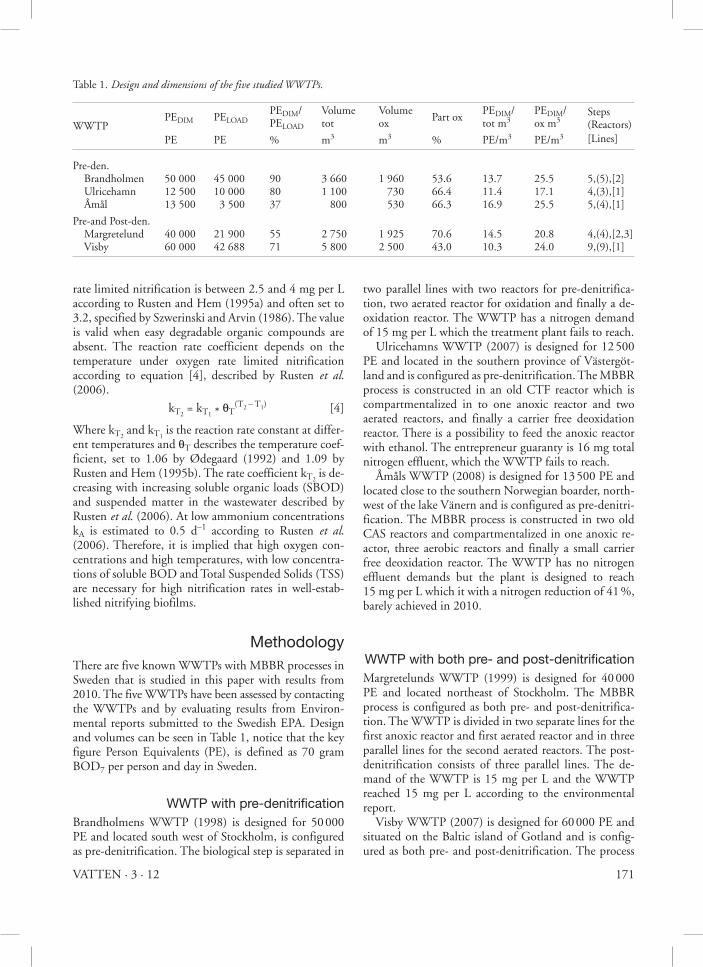
methodologyThere are five known WWTPs with MBBR processes in Sweden that is studied in this paper with results from 2010. The five WWTPs have been assessed by contacting the WWTPs and by evaluating results from Environ-mental reports submitted to the Swedish EPA. Design and volumes can be seen in Table 1, notice that the key figure Person Equivalents (PE), is defined as 70 gram BOD7 per person and day in Sweden.
wwtp with pre-denitrificationBrandholmens WWTP (1998) is designed for 50 000 PE and located south west of Stockholm, is configured as pre-denitrification. The biological step is separated in
two parallel lines with two reactors for pre-denitrifica-tion, two aerated reactor for oxidation and finally a de-oxidation reactor. The WWTP has a nitrogen demand of 15 mg per L which the treatment plant fails to reach. Ulricehamns WWTP (2007) is designed for 12 500 PE and located in the southern province of Västergöt-land and is configured as pre-denitrification. The MBBR process is constructed in an old CTF reactor which is compartmentalized in to one anoxic reactor and two aerated reactors, and finally a carrier free deoxidation reactor. There is a possibility to feed the anoxic reactor with ethanol. The entrepreneur guaranty is 16 mg total nitrogen effluent, which the WWTP fails to reach. Åmåls WWTP (2008) is designed for 13 500 PE and located close to the southern Norwegian boarder, north-west of the lake Vänern and is configured as pre-denitri-fication. The MBBR process is constructed in two old CAS reactors and compartmentalized in one anoxic re-actor, three aerobic reactors and finally a small carrier free deoxidation reactor. The WWTP has no nitrogen effluent demands but the plant is designed to reach 15 mg per L which it with a nitrogen reduction of 41 %, barely achieved in 2010.
wwtp with both pre- and post-denitrificationMargretelunds WWTP (1999) is designed for 40 000 PE and located northeast of Stockholm. The MBBR process is configured as both pre- and post-denitrifica-tion. The WWTP is divided in two separate lines for the first anoxic reactor and first aerated reactor and in three parallel lines for the second aerated reactors. The post-denitrification consists of three parallel lines. The de-mand of the WWTP is 15 mg per L and the WWTP reached 15 mg per L according to the environmental report. Visby WWTP (2007) is designed for 60 000 PE and situated on the Baltic island of Gotland and is config-ured as both pre- and post-denitrification. The process
Table 1. Design and dimensions of the five studied WWtPs.
PEDIM PELOAD
PEDIM/ Volume Volume Part ox
PEDIM/ PEDIM/ StepsWWTP PELOAD tot ox tot m3 ox m3 (Reactors) PE PE % m3 m3 % PE/m3 PE/m3 [Lines]
Pre-den. Brandholmen 50 000 45 000 90 3 660 1 960 53.6 13.7 25.5 5,(5),[2] Ulricehamn 12 500 10 000 80 1 100 730 66.4 11.4 17.1 4,(3),[1] Åmål 13 500 3 500 37 800 530 66.3 16.9 25.5 5,(4),[1]
Pre-and Post-den. Margretelund 40 000 21 900 55 2 750 1 925 70.6 14.5 20.8 4,(4),[2,3] Visby 60 000 42 688 71 5 800 2 500 43.0 10.3 24.0 9,(9),[1]

172 VATTEN · 3 · 12
consists of a sequence of nine deep reactors connected in series with two anoxic reactors, four aerated reactors, one deoxidation reactor and finally two external carbon-fed anoxic reactors. The WWTP is unevenly loaded throughout the year and have high loads during the summer period. The demand of the WWTP is 15 mg per L which the plant accomplished with margins.
resultsThe results of the study can be seen in Table 2 and Table 3 and are mainly based on results from environmental reports. The relationship between BOD7 and BOD5 can be estimated according to Rusten and Kolkinn (1997) as equation [5].
BOD7 = 1.15 * BOD5 [5]
It is important to remember that all the treatment plants are designed for the effluent demand 15 mg per L except for Ulricehamn, which for some reason is designed for an effluent concentration of 16 mg per L total nitrogen. However, neither Ulricehamn WWTP nor Åmål WWTP had a nitrogen demands from governing au-thorities in 2010.
Treatment results in Table 3 shows capacity problems at four WWTPs that do not reach or reaching nitrogen demands, guarantees and/or design specifications with-out margins, despite not being fully loaded. Visby WWTP performs so far well with sufficient nitrogen re-duction and stable and substantial nitrification. Table 3 shows that full reduction of ammonium, by oxidation and assimilation is achieved at least at two WWTP with MBBR processes. The three WWTP with pre-denitrifi-cation do not reach a reduction exceeding 50 % of total nitrogen influent. Neither Brandholmens WWTP reach its 15 mg per L total nitrogen effluent demand nor has Ulricehamn WWTP ever reached its 16 mg per L total nitrogen effluent guarantee. The three WWTPs Ulrice-hamn, Åmål and Margretelund, do not reach complete reduction of ammonium on a yearly basis and all three have capacity problems. Differences in reduction capac-ity can be seen within pre denitrification and pre- and post denitrification at Brandholmen and Visby WWTPs. Visby is the only treatment plant that reaches a higher reduction, which for the moment exceeds 75 %, and it is likely that it can achieve even more than that. It is though not needed for this plant since it is reaching its 15 mg per L demand with margins. Energy consump-tion is an important part of the operational costs of a
Table 2. Capacity of the five WWtP with Mbbr processes.
WWTP BODDIM BODLOAD NLOAD NEFFL. NRED BODLOAD/NRED BODLOAD/ox m3 m3/NRED
kg/day kg/day kg/day kg/day kg/day kg/kg kg/m3 m3/kg
Pre-den. Brandholmen 3 500 3 150 576.2 290.1 286.0 11.0 1.61 12.8 Ulricehamn 875 700 155.0 78.7 76.3 9.2 0.96 14.4 Åmål 945 245 95.2 59.0 36.2 6.7 0.46 21.9
Pre-and Post-den. Margretelund 2 800 1 530 338.0 124.0 214.0 7.2 1.45 12.9 Visby 4 200 2 990 526.7 129.0 397.7 7.5 1.20 14.6
Table 3. treatment results for the five WWtP with Mbbr processes.
WWTP
NH4-N NH4-N NH4-NRED
N N NRED NRED/m3 PEDIM/ PELOAD/
Infl. Effl. Infl. Effl. NRED NRED
mg/L mg/L % mg/L mg/L % g/m3 PE/kg PE/kg
Pre-den. Brandholmen 30.2 2.7 91.1 39.7 20.0 49.6 79.4 174.8 157.3 Ulricehamn 28.2 13.8 51.1 39.0 20.0 48.7 69.4 163.8 131.1 Åmål 15.5 8.9 42.6 25.6 15.1 41.0 45.6 369.8 95.9
Pre- and Post-den. Margretelund u.i 8.2 u.i 43.0 15.9 63.0 77.8 186.9 102.3 Visby 30.0 0.7 97.7 49.0 12.0 75.5 71.6 150.9 107.3

173VATTEN · 3 · 12
WWTP. The energy use in 2009 at over 300 Swedish WWTPs can be seen in Figure 2. The WWTPs are grouped in four different sizes and separated into WWTPs with no nitrogen reduction and WWTP with nitrogen reduction (KR). The five WWTPs with nitro-gen reduction in MBBR processes is marked with stars and are labelled. As can be seen in Figure 3, the influent nitrogen load at Visby WWTP varies intensely with a large standard deviation. An indication of a decline in influent concen-trations can be seen towards the end of the year. The effluent nitrogen concentration has a considerable smaller variation.
discussionDue to absence of standardised design guidelines and directions for construction, the design of biological wastewater processes in Sweden is an issue of pragma-
tism and individual preferences. There are differences between different processes that have to be considered in the design and construction of the MBBR systems and that differs utterly from conventional activated sludge systems. Among those, the multi-reactor set up of reac-tors in series. It is therefore reasonable to say that not all MBBR processes in this study have been constructed in a way that is optimal for the technique. The key figures in Table 1 and Table 2 which displays design and per-formances of the treatment systems should therefore be interpreted with precaution. Based on results found in Table 3, pre-denitrification has a low nitrogen reduction which is in compliance with results found by Rusten and Hem (1995). The theoretical dilemma with the process and the limitations of the treatment process is external-ized in results displayed in Table 3 and independent of the load on the treatment plant, seen in Table 1. As the theory in Figure 1 depicts, a rising nitrate reduction po-tential follows by an increasing recirculation ratio. How-ever, high recirculation ratios will recirculate too much
Figure 2. energy use at more than 300 WWtP in sweden, where the five WWtP with Mbbr processes is marked with a star. WWtP marked as Kr had nitrogen reduction demands introduced in 2007 or earlier. the data comes from the year 2009.
Figure 3. the influent and effluent nitrogen concentrations to the Mbbr process at the Visby WWtP in 2010.

174 VATTEN · 3 · 12
oxygen to the anoxic reactor, reducing hydraulic reten-tion times and dilute influent concentrations of sub-strate. Hydraulic properties for carriers and sieves, limits the flows through the reactor. Degradation rates in MBBR reactors have been through the years a moot point in which construction is based upon, but not par-ticularly applicable in design of pre-denitrification proc-esses. The two wastewater treatment plant with both pre- and post-denitrification, can be seen in Table 3, having a nitrogen reduction exceeding 60 %. The sub-stantial differences between pre- and post-denitrification is the ability to reduce high oxygen levels with addition of external carbon source and longer resident times. In-dications on the importance of substantial nitrification as a key component for high nitrogen reduction can be seen in Table 3. As seen in Table 3, both Brandholmen and Visby WWTP reach significant nitrification. Brand-holmens WWTP can’t however denitrify sufficient amount of nitrate to reach demands due to the limita-tions of the pre-denitrification process. At Visby WWTP, that problem is resolved by addition of external carbon, in the post-denitrification step. As can be seen in Figure 3, the effluent nitrogen concentrations have a lower variation in the data set, indicating a fairly controllable process. After the nitrification process, a deficiency of reduced substrate for the biomass to oxidise occurs. To compensate for this an addition of external carbon is necessary, both for deoxidation and the following deni-trification. Without this addition less biomass will be present in the deoxidation reactor and hence less con-sumption of oxygen will take place. Visby WWTP reaches, therefore a respectable performance due to the multi-reactor set up in series that enables substantial ni-trification. The addition of external carbon provides an environment suitable for post-denitrification. As can be seen in Figure 2, the WWTPs with MBBR processes does not stand out too much from the other WWTPs but they are not energy efficient despite the fact that they are fairly new constructions.
conclusionNitrogen reduction in a MBBR processes, involves a multi-reactor configuration set up. Pre-denitrification requires higher recirculation ratio in smaller volumes and a higher oxygen concentration in the aerated reac-tors than in corresponding CAS processes. Therefore limited nitrogen reduction is to be expected which could lead to difficulties in reaching nitrogen demands. Observations on the three present WWTPs are confirm-ing expectations and the theoretical predictions. WWTPs configured with both pre- and post-denitrification in MBBR process indicates that post-denitrification can compensate for high oxygen levels by addition of ex-
ternal carbon if nitrification is sufficient. This study confirms the idea that MBBR processes are indeed con-structed in small volumes. However the treatment re-sults are unsatisfactory for four WWTPs and can be attributed to overestimation of the capacity.
acknowledgmentThis paper is based on an article written for a Master thesis project at Lund University at Water and Environ-mental Engineering at the Department of Chemical Engineering. The project was initiated by SWECO Environment Jönköping. We would like to recognize Professor Jes la Cour Jansen for some important contri-butions to this article. We would also like to thank the contacted and visited WWTPs for the received informa-tion.
referencesHem, L.J., Rusten, B., Ødegaard, H. (1994) Nitrification in a
moving bed biofilm reactor. Water Research 28 (6), 1425–1433.
Rusten, B., Hem, L.J., Ødegaard H. (1995a) Nitrogen removal from diluted wastewater in cold climate using moving-bed biofilm reactors. Volume 67, No 1, Water Environment Research.
Rusten, B., Hem, L.J., Ødegaard, H. (1995b) Nitrification of municipal wastewater in moving bed biofilm reactors. Water Environ. Res. 67 (1), 75–86.
Rusten, B., Siljudalen, J.G., Bungum, S. (1995) Moving Bed Biofilm Reactors for nitrogen removal – From initial pilot testing to start-up of the Lillehammer WWTP. Accepted for presentation at WEFTEC 95 in Miami. USA.
Rusten, B., Kolkinn, O., Ødegaard, H. (1997) Moving bed biofilm reactors and chemical precipitation for high effi-ciency treatment of wastewater from small communities. Water Science & Technology. Vol. 35, No. 6. pp. 71–79.
Rusten, B., Eikebrokk, B., Ulgenes, Y., Lygren, E. (2006) De-sign and operations of the Kaldnes moving bed biofilm reactors. Received 26 December 2004; Accepted 18 April 2005. Available online 17 May 2005.
Simonsen, S. (2008) En analyse av dimensjoneringsgrunnlaget for HYBAS – en hybrid avløpsrenseprosess. Master i produktutvikling og produksjon. Juni 2008. Norges teknisk-naturvitenskapelige universitet. Institutt for energi og prosessteknikk.
Szwerinski, H., Arvin, E., Harremoës, P. (1986) pH-decrease in a nitrifying biofilm. Water Research. Volume 20, Issue 8, August 1986, Page 971–976.
Tranum, I., Rusten, B., Wien, A. (1999) Deicing chemicals as pollution source and external carbon source for nitrogen removal at the Gardemoen wastewater treatment plant.
Ødegaard, H. (1992) Fjerning av næringsstoffer ved Rensing av avløpsvann. Tapir Forlag. 1992. Universitetet i Trond-heim ISBN 82-519-1109-5.
Ødegaard, H., Rusten, B., Westrum, T. (1994) A new Moving Bed Biofilm reactor- Application and results. Wat. Sci. Tech. Vol. 29. No. 10–11, pp. 157–165.