NIHCS SAP Time Series 2001-2016 - nihe.gov.uk
12
1
Transcript of NIHCS SAP Time Series 2001-2016 - nihe.gov.uk

1

2
This report accompanies a tabular appendix which updates SAP figures from the Northern Ireland House Condition Survey (NIHCS) for the survey years 2001, 2006, 2009 and 2011. The revised SAP figures are based on the latest model SAP 2012 (RdSAP 9.93). The 2016 figures are also included in this report to complete the time series. A full HCS report for 2016 is published on the Housing Executive’s website. https://www.nihe.gov.uk/house_condition_survey_main_report_2016.pdf
Table of Contents
SAP rating 3
EER bands 7
User guide 10
For further information about the SAP time series report or the House Condition Survey contact: The Research Unit Northern Ireland Housing Executive 2 Adelaide Street Belfast BT2 8PB Karly Greene (Lead Statistical Official) Email: [email protected] Tel: (028) 9598 2540 or Jahnet Brown Email: [email protected] Tel: (028) 9598 2548

3
SAP rating
Introduction The Standard Assessment Procedure (SAP) is the Government’s standard method of rating the energy efficiency of a dwelling. The Building Research Establishment (BRE) https://www.bre.co.uk has developed the current and previous models on behalf of Government. The SAP takes into account a range of factors that contribute to energy efficiency such as materials used for construction, the efficiency and control of heating systems and fuel used for space and water heating.
The SAP rating itself is on a logarithmic scale and provides a comparative measure of the energy efficiency of dwellings. The lower the score, the lower the energy efficiency and the higher the score (up to a maximum of 100) the higher the efficiency. Over time the SAP model has been modified in order to improve the accuracy of energy efficiency ratings. The Energy Efficiency Rating for the 2016 NIHCS data has been derived from SAP 2012, which was published in 2013 and revised in 2017. The main HCS report (published in May 2018) outlined findings from the latest model for 2016.1 https://www.nihe.gov.uk/house_condition_survey_main_report_2016.pdf In order to provide a complete consistent SAP time series BRE has calculated revised SAP values for the NIHCS survey years 2001, 2006, 2009, 2011 using the SAP 2012 methodology and the latest 2016 energy model. The model incorporates updates and improvements that have been made annually as part of BRE’s standard modelling programme and also includes the updated U-values2 introduced in RdSAP version 9.93. The mean SAP 2012 values for all dwellings for previous HCS years (using the latest model and updated U-values) are shown in Figure 1.
1 Further information about SAP 2012, and the previous versions of SAP, is available in Appendix H
of the main HCS report. 2 See User guide for further information.

4
Figure 1: Mean SAP 2012 (RdSAP 9.93) New U-Values
The energy efficiency of Northern Ireland’s dwelling stock has increased steadily over time from a mean SAP of 48.55 in 2001 to 65.83 in 2016. The following section gives an overview of trends using SAP 2012 (RdSAP 9.93) in terms of the physical characteristics of the dwelling and the socio-demographic characteristics of the household. It is not the intention here to detail the mean ratings as these are provided in the accompanying set of SAP 2012 (RdSAP 9.93) time series tables (Please see NIHCS SAP 2012 time series appendix tables).
SAP Rating – Dwelling Tenure (Tables 1a-1e)
Over time social housing consistently had the highest SAP rating and vacant dwellings had the lowest SAP rating.
SAP Rating – Dwelling Age (Tables 2a-2e)
As expected, the SAP 2012 time series shows newer dwellings had higher SAP ratings than older dwellings.
SAP Rating – Dwelling Type (Tables 3a-3e)
The SAP time series shows that flats/apartments had the highest SAP rating. Single storey dwellings had the lowest SAP rating.
48.55
56.96 60.22 62.55
65.83
0
20
40
60
80
100
2001 2006 2009 2011 2016
Mean
SA
P201
2

5
SAP Rating – Dwelling Location (Tables 4a-4e)
Due to the update within dwelling location and the move to the new urban-rural classification in 20163, it is only possible to provide a time series for two points in time (2011 and 2016). For both years urban dwellings had a higher SAP rating than rural dwellings. In addition, for both years dwellings in the BMUA had the highest SAP rating.
SAP Rating – Household Characteristics (Tables 5a-5e)
The following section outlines variations in average SAP ratings by household characteristics. Please refer to the accompanying set of time series data for SAP 2012 (RdSAP 9.93) average ratings (Please see NIHCS SAP 2012 time series appendix tables). Using the SAP 2012 across all survey years shows that the energy efficiency of Northern Ireland’s occupied dwelling stock has increased steadily from a mean SAP of 48.99 in 2001 to 66.32 in 2016.
Age of Household Reference Person
The SAP time series shows that the average ratings decreased as the age of the household reference person increased. Household reference persons aged 75 plus were least likely to live in energy efficient dwellings.
Household Type
Across the survey years, households with children tended to live in more energy efficient dwellings.
Employment Status
The SAP time series show that households headed by an unemployed household reference person generally lived in the most energy efficient housing while households headed by a retired household reference person lived in the least energy efficient dwellings.
3 See the main HCS report for further information Chapter 3 section 3.3 pages 20-21.

6
Religion
Over time, Catholic households had higher average SAP ratings than Protestant households.

7
EER bands
The 2016 HCS was the first to report on the updated SAP 2012 Energy Efficiency Rating (EER) which uses an A-G banding system. EER band A represents low energy costs i.e. the most efficient band, and EER band G represents high energy costs i.e. the least efficient band. Bands A to C and F to G have been combined to avoid low sample size. The EER bands have been revised in line with the updated SAP methodology in 2016, for all HCS years (2001-2016) in order to provide a consistent time series. A full set of tables accompany this report which details the figures. Please see NIHCS SAP 2012 time series appendix tables. The overall proportions by EER bands for all dwellings since 2001 (using the latest model and updated U-values) are shown in Figure 2.
Figure 2: Revised EER bands 2001-2016
Figure 2 shows an improvement in the energy efficiency of dwellings in Northern Ireland4 over time, with more dwellings falling into bands A-C and less falling into bands F-G. In 2001 only 5% of dwellings were likely to have an EE rating of A-C compared to 49% by 2016. On the other end of the EE
4 Changes in the SAP methodology were minor and would not explain the improvement in energy
efficiency.
5
33
39
23 23
42
24
11
28
44
21
7
39 38
16
7
49
36
11
3 0
20
40
60
80
100
Bands A-C Band D Band E Bands F-G
%
2001
2006
2009
2011
2016
8
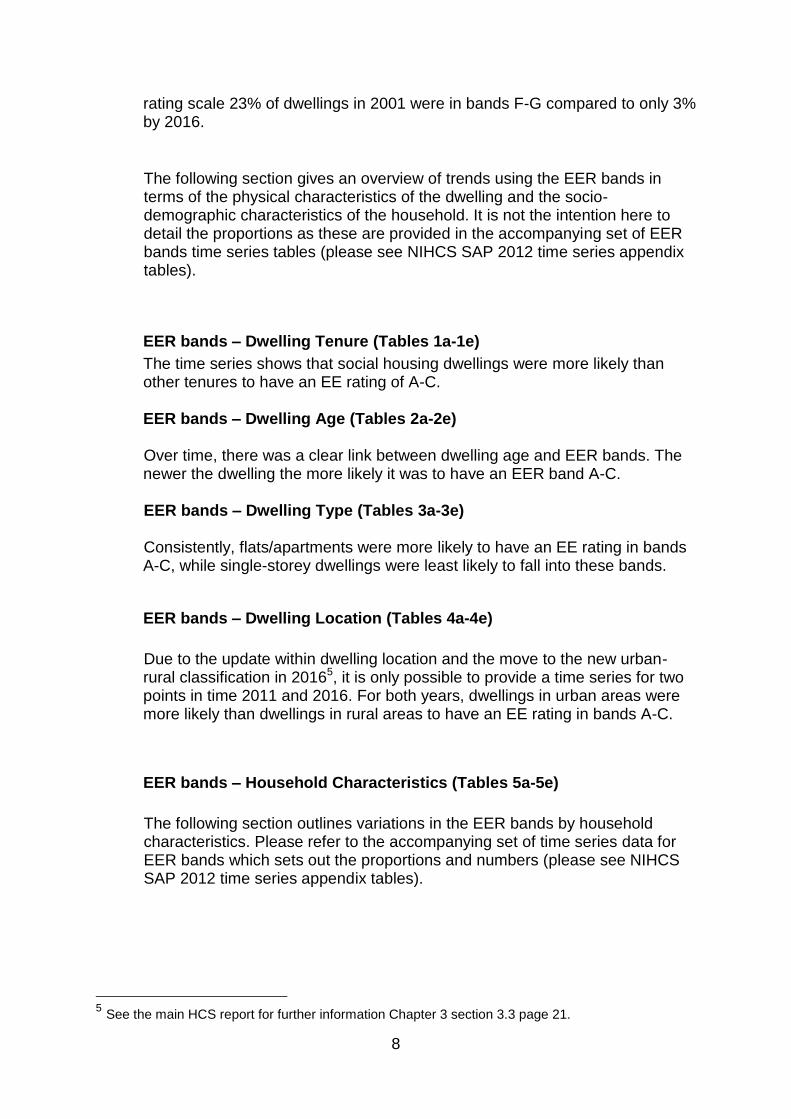
rating scale 23% of dwellings in 2001 were in bands F-G compared to only 3% by 2016.
The following section gives an overview of trends using the EER bands in terms of the physical characteristics of the dwelling and the socio-demographic characteristics of the household. It is not the intention here to detail the proportions as these are provided in the accompanying set of EER bands time series tables (please see NIHCS SAP 2012 time series appendix tables).
EER bands – Dwelling Tenure (Tables 1a-1e)
The time series shows that social housing dwellings were more likely than other tenures to have an EE rating of A-C. EER bands – Dwelling Age (Tables 2a-2e)
Over time, there was a clear link between dwelling age and EER bands. The newer the dwelling the more likely it was to have an EER band A-C. EER bands – Dwelling Type (Tables 3a-3e) Consistently, flats/apartments were more likely to have an EE rating in bands A-C, while single-storey dwellings were least likely to fall into these bands.
EER bands – Dwelling Location (Tables 4a-4e)
Due to the update within dwelling location and the move to the new urban-rural classification in 20165, it is only possible to provide a time series for two points in time 2011 and 2016. For both years, dwellings in urban areas were more likely than dwellings in rural areas to have an EE rating in bands A-C.
EER bands – Household Characteristics (Tables 5a-5e)
The following section outlines variations in the EER bands by household characteristics. Please refer to the accompanying set of time series data for EER bands which sets out the proportions and numbers (please see NIHCS SAP 2012 time series appendix tables).
5 See the main HCS report for further information Chapter 3 section 3.3 page 21.

9
Age of Household Reference Person
Generally over time, households with younger HRPs, aged between 17 and 24 or between 25 and 39 (for 2011), were more likely to live in dwellings with an EE rating of A-C. However, due to the small numbers in the 17 to 24 age group, this trend should be treated with some caution.
Household Type
Apart from 2001, households with children were most likely to live in dwellings in EER bands A to C, while older households were least likely to live in dwellings in these bands.
Employment Status
Apart from 2001, households where the HRP was retired were least likely to live in dwellings with EE ratings of A to C. Religion The EER time series shows that Catholic households were more likely than Protestant household to live in dwellings with EER bands A-C. This is largely due to the tendency for Catholics to live in newer housing.

10
User guide
Method The SAP rating for an existing dwelling is produced using a framework known as Reduced Data SAP (RdSAP). This framework provides a method for inferring values that cannot be ascertained from a non-intrusive inspection of an existing dwelling (such as wall U-values). SAP is updated periodically to reflect developments in the understanding of dwelling thermal heat transfers and to incorporate emerging technologies. The current version of SAP is SAP 2012. The similarities between the data collection method used for the NIHCS and EPCs mean that it is appropriate to use the RdSAP method in order to produce the SAP rating for NIHCS data. RdSAP was recently updated (to SAP 2012, version 9.93) and this came into use for the calculation of SAP for EPCs in November 2017. This is the version used throughout this report. The SAP ratings give a measure of the annual unit energy cost of space and water heating and lighting for the dwelling under a heating regime, assuming specific heating patterns and room temperatures. The fuel prices used are averaged over the previous three years across the regions in the UK. The SAP takes into account a range of factors that contribute to energy efficiency, which include:
thermal insulation of the building fabric;
the shape and exposed surfaces of the dwelling;
materials used for construction of the dwelling;
efficiency and control of the heating system;
the fuel used for space and water heating, ventilation and lighting;
ventilation and solar gain characteristics of the dwelling;
renewable energy technologies. SAP is not affected by the individual characteristics of the household occupying the dwelling or by the geographical location. Updates to the SAP model The Energy Efficiency Rating for the 2016 House Condition Survey data has been derived from SAP 2012 (the first version of which was published in 2013). The main differences between the earlier version of SAP known as SAP09 (which was used in the 2011 HCS report) and SAP 2012 were that in SAP 2012:
Climatic data had been extended to allow calculations using regional weather

11
An allowance for height above sea level was incorporated into external
temperature data
CO2 emission factors had been extensively revised
Fuel price and primary energy factors had been revised
The options for heat losses from primary pipework had been extended
There was a further revision to the SAP 2012 which was published in November
2017 (version 9.93). This revision updated the U-values for solid brick, stone and
cavity walls to more accurately reflect their thermal performance.
In addition, this revision also included an improvement to the way concrete wall
types were modelled. Previously, concrete walls were modelled using the same
assumptions as for solid walls, due to the similar thermal performance of the two wall
types under the original SAP 2012 assumptions. However, following the updates to
solid wall U-values, the assumptions for the two wall types diverged and it became
necessary to model concrete and solid wall types separately.
The changes implemented between the first and second versions of SAP 2012 had a
minor effect on final SAP ratings. Further information about both versions of SAP
2012 is available on the BRE website: https://www.bre.co.uk/sap2012
For more information on how the SAP is measured see Appendix H in the main 2016 NIHCS report. https://www.nihe.gov.uk/house_condition_survey_main_report_2016.pdf
Quality information
The process of development, quality assurance and creation of results followed an internal procedure so the work undertaken could be reviewed and assessed by project managers. Examples of the quality assurance undertaken to validate SAP processes and results included:
Updating and revising the methodology using the latest assumptions for this
area of work.
Checking of transformations undertaken and mathematical formulae.
Internal checks of data inputs to assure translation was completed correctly.
Checks of correct units for calculations.
Check correct and latest external data sources were used.
Sense check comparison to SAP results.
Internal review of results and reporting.

12
Strengths and weaknesses
The updated SAP time-series had two new elements:
Firstly, the move from the previous version of SAP (SAP09 used in the 2011 House Condition Survey main report) to the new SAP 2012 model first published in 2013.
Secondly, the time series also includes additional revisions to SAP 2012 published in 2017. These mainly related to an update of the U-values and improvements to the way concrete wall types were modelled.
Together these two new elements improve the accuracy of the SAP data. As part of the quality assurance process and to allow some indication of the effect of the modelling changes the mean SAP values were validated. SAP 2009 values were calculated using the latest 2016 model and compared to the previously produced SAP 2009 time-series calculated using the 2011 energy model. This was a useful exercise because it allowed comparison of the two models on a consistent basis (SAP 2009), without the effect of U-value changes. Comparison of the mean SAP 2009 values for the 2016 survey year showed that the updated U-Values did not have a significant impact on mean SAP; the mean SAP 2009 value for 2016 had been reduced by 0.02 through U-value changes alone. For all other years, with the exception of 2001, there had been a systematic increase in the mean SAP 2009 value. This increase was caused by a number of modelling changes made between 2011 and 2016. The most notable updates include a change to the method used to calculate fabric heat loss of doors, windows and external walls, and the inclusion of actual wall thickness in the internalisation of dimensions for floor area calculations. The mean SAP 2009 value for 2001 wasn’t affected by any of the major modelling changes discussed above; due to a change to the way data were collected and processed by the energy model post-2001. Therefore, as with 2016, the 2001 survey year is only affected by the updates to U-values, which results in a marginal reduction of the mean SAP by 0.16. The bases of this report are the Northern Ireland House Condition Survey statistics and the underlying NIHCS datasets. All surveys have limitations which can be caused by a number of factors such as budget and resources. The Housing Executive monitors any issues that could cause weaknesses in the data and takes steps to address them. All HCS models, including SAP, are reviewed and updated in order to incorporate new developments and emerging technologies. The aim of any update is to improve the accuracy and robustness of the data and, if possible, a consistent time series will be provided to aid interpretation. See Appendix H page 147 of the main 2016 House Condition Survey report for more information on the SAP model and Appendix A page 88 for the survey’s user guide. https://www.nihe.gov.uk/house_condition_survey_main_report_2016.pdf