Democratic Services Section Chief Executive’s Department ...

Travellers’ accommodaTionNeeds Assessment in Northern Ireland
2008

Travellers’ accommodaTion Needs Assessment in Northern Ireland 2008
�
Travellers’ accommodaTion Needs Assessment in Northern Ireland 2008
acknowledgements
The Housing Executive’s Research Unit would like to thank all those involved in the Travellers’ Accommodation Needs Assessment, in particular the following:
members of the Traveller community who participated in the survey, whose goodwill, patience and co-operation made the survey possible;
the fieldwork team who brought valuable expertise and professionalism to the data collection stage of the survey; and
the reference group for their input into the questionnaire and their support for the aims of the survey.
For further information on the research please contact:
Joe FreyHead of ResearchThe Research UnitNI Housing Executive2 Adelaide StreetBelfast BT2 8PB
Telephone: 02890318540Email: [email protected]

Travellers’ accommodaTion Needs Assessment in Northern Ireland 2008Travellers’ accommodaTion Needs Assessment in Northern Ireland 2008 Travellers’ accommodaTion Needs Assessment in Northern Ireland 2008
�
ForeWord
I am pleased to present this report, which is the second comprehensive Travellers’ Accommodation Needs Assessment carried out across Northern Ireland. The report will update the 2002 Travellers’ Accommodation Needs Assessment and will be used to inform and facilitate decisions around planning of future accommodation schemes for the Traveller community, helping to alleviate the inadequate living conditions experienced by many Travellers.
Since the last report the successful transfer of council owned sites has been completed. Group housing schemes in Derry/Londonderry and Belfast have been built by housing associations and a further scheme in Belfast, started in March 2008, is due for completion next year. Site identification is continuing for transit site provision in Craigavon, Newry and Belfast.
I would like to thank all those who took part in the reference group which oversaw the project, including An Munia Tober, Support Groups from Armagh, Craigavon, Newry, Derry/Londonderry, Omagh, Department for Social Development and the Equality Commission. I also wish to thank the team of researchers, especially the ‘Peer Researchers’ from the Traveller community in Belfast. The involvement of these researchers, who have links with the Traveller community in Northern Ireland, was extremely valuable in encouraging participation from this community.
The information from this latest Needs Assessment will be used to plan future accommodation schemes to help alleviate the inadequate living conditions of many Traveller families in Northern Ireland.
The Housing Executive remains committed to working in partnership with other statutory agencies, voluntary and support groups to bring about a better quality of life for Travellers.
Paddy McIntyreChief Executive

Travellers’ accommodaTion Needs Assessment in Northern Ireland 2008
�
Travellers’ accommodaTion Needs Assessment in Northern Ireland 2008
contents
Page
1. Background to the research 7
2. Key Findings 10
commenTarY
3. Household Profile 13
4. Travelling 17
5. Health and disability 19
6. community safety 20
7. accommodation - Housing needs 21
8. Further comments 26
9. conclusions 27
aPPendices
appendix 1: presentation of findings 28
appendix 2: tabular report 29

Travellers’ accommodaTion Needs Assessment in Northern Ireland 2008Travellers’ accommodaTion Needs Assessment in Northern Ireland 2008 Travellers’ accommodaTion Needs Assessment in Northern Ireland 2008
�
1.0 BacKGroUnd
1.1 Introduction In 2002 the Housing Executive completed a comprehensive assessment of the accommodation needs
of all Traveller households in Northern Ireland. The impetus for the first needs assessment arose from recommendations made in the final report of the Promoting Social Inclusion Working Group on Travellers in December 2000. Recommendation 5 stated:
‘The Northern Ireland Housing Executive should undertake a comprehensive strategic needs assessment of current and projected accommodation requirements of all Travellers in consultation with Traveller organisations, members of the Traveller communities and District Councils.’
This report updates the previous accommodation needs assessment; it will also be used to inform and facilitate decisions around the planning of future accommodation schemes for the Traveller community which should help to alleviate problems associated with the inadequate living conditions of many Travellers. The report contains comparisons, where appropriate, with findings from the Travellers’ Accommodation Needs Assessment 2002.
1.2 Reference Group As a first step in undertaking this research, the Housing Executive set up a reference group of interested
parties to oversee the project. Representatives from the following organisations agreed to join the reference group:
• An Munia Tober• An Tearmann• Armagh Traveller Support Group• Craigavon Traveller Support Committee• Department for Social Development• Derry Traveller Support Group• Equality Commission• Northern Ireland Housing Executive• Omagh Traveller Support Group• Traveller Family Support and Development Worker (Newry).
The role of the group was varied and included the following:
• The group would quality assure and validate findings of the research carried out.
• The wide membership of the group would ensure that agencies with an involvement in Traveller issues would be invited to bring expertise. The diverse yet complementary range of experiences of those attending would contribute to the effectiveness of the group.
• It was recognised at an early stage that it was important for the data collected and the means of collection to be open to scrutiny. This openness allowed everyone associated with the project to give it their full support.
1.� Research Objectives The main aims of the survey were to:
1. conduct an accommodation needs assessment of the Traveller community in Northern Ireland; 2. determine the housing, health and support needs of the Traveller community and examine any social
issues to be tackled; and 3. provide a socio-economic profile of, and inform future planning of accommodation for, the Traveller
population in Northern Ireland.

Travellers’ accommodaTion Needs Assessment in Northern Ireland 2008
�
Travellers’ accommodaTion Needs Assessment in Northern Ireland 2008
1.� Methodology In October 2007, following a selection procedure carried out in conjunction with the reference group, the
Housing Executive appointed sixteen interviewers to undertake the fieldwork for the Accommodation Needs of Travellers. Twelve of the interviewers were experienced research consultants who had already undertaken research in the Traveller community and the remainder were Travellers living in the Belfast area. All interviewers were given a day-long training course to ensure consistency and quality.
In Belfast the support group felt that the Traveller community had the capacity to carry out ‘peer1’ research. It was agreed that this methodology would be followed in Belfast and quality assured by the Housing Executive. Although this approach meant that the methodology was not entirely consistent across Northern Ireland, independent quality assurance undertaken by the Housing Executive ensured the comparability and validity of all data collected during the research. Furthermore, the peer research element offered a useful and important opportunity to develop research capacity among the Travellers themselves. On this basis a two-pronged approach to the research was agreed: in Belfast, through peer research with quality assurance by the Housing Executive, and outside Belfast, with a team of independent researchers appointed to work closely with the Traveller support groups and under the direction of the project leader.
Due to the complexities of the survey, the Research Unit in consultation with the reference group decided that face-to-face interviews were required to maximise the response rate. In view of the significance of the project, it was felt that the involvement of people with links to, or who were representatives of, the Traveller community in Northern Ireland was essential to encourage participation from this community.
The questionnaire design, analysis and report writing were the responsibility of the Housing Executive’s Research Unit. The content of the questionnaire was agreed in consultation with the reference group. The interviewers carried out face-to-face structured interviews over five months, from November 2007 to March 2008.
It was agreed that a ‘census’ approach should be adopted, whereby all possible Traveller households would be interviewed. Initially, the Housing Executive’s Traveller Unit drew up a list of households from a number of sources, including district councils and Housing Executive district offices. The Traveller support groups throughout Northern Ireland also provided assistance; in addition, the Research Unit used a ‘snowball2’ sampling technique to maximise the number of households interviewed.
1.� Questionnaire Following consultation with the reference group, a needs assessment questionnaire was devised. The main
aims of the questionnaire were to:
• ascertain the tenure of the accommodation in which the Traveller households lived and measure their satisfaction levels with their existing accommodation;
• determine the number of Travellers who exercised a nomadic way of life or still had aspirations to travel occasionally;
• assess the preferred accommodation choice of Travellers; and
• assess the incidence of ill-health/disability in the Traveller community.
1.� Response Rate In total, 531 Traveller households were identified through consultation with Traveller support groups,
education and library boards, health visitors and the Housing Executive. The interviewers subsequently carried out 449 face-to-face interviews across Northern Ireland.
1 Peer Research – research carried out by people from a similar background/culture as those being researched. 2 Snowball sampling involves identifying respondents who are then asked to refer researchers to other respondents.

Travellers’ accommodaTion Needs Assessment in Northern Ireland 2008Travellers’ accommodaTion Needs Assessment in Northern Ireland 2008 Travellers’ accommodaTion Needs Assessment in Northern Ireland 2008
�
As a general rule, if an interview had not been achieved on the first visit to an address, at least three further attempts were made to interview the household. These visits were made at varying times of the day and also in the evenings. If, at the end of the fieldwork period, interviewers had been unable to contact a household member, the address was recorded as a non-contact. The research team was unable to contact 69 households in total and a further 13 households refused to take part in the survey. A breakdown of response is provided in Table 1a.
Table 1a
Number PercentageFully Completed Interviews 449 85
Non-Contact 69 13Refusal 13 2
Total ��1 100
As the exact number of Traveller households in Northern Ireland is prone to seasonal fluctuations, the completeness of the overall number identified cannot be guaranteed. However, the number for this survey was significantly higher than in 2002, when 452 Traveller households were identified. Based on the figures in Table 1a, the response rate for the 2008 survey was high at 85%.
Monbrief, Craigavon.

Travellers’ accommodaTion Needs Assessment in Northern Ireland 2008
10
Travellers’ accommodaTion Needs Assessment in Northern Ireland 2008
2.0 KeY FindinGs
2.1 Profile of Household/Household Reference Person (HRP):• A total of 1,486 individuals were identified in 449 households across Northern Ireland.• HRPs3 were predominantly female (60%).• Almost half (45%) of HRPs were aged between 25 and 39 and only 6% were over 60.• Most HRPs (85%) were economically inactive, with only 11% in employment. Almost half (47%) of HRPs
were looking after family/home. • Almost two-fifths (39%) of HRPs were separated and the predominant household type was lone parent
(33%). For Northern Ireland’s population as a whole, the comparative figure for lone parent households is 6%4.
• Most households (94%) contained one family unit.• One-quarter (25%) of households comprised more than five persons and one-fifth (20%) had only one
person. • The younger age profile of the population is indicated by the fact that 28% of household members were
aged between six and 15 and 21% were aged five and under. For Northern Ireland’s population as a whole only 22% are aged under 165.
• As would be expected, 98% of HRPs were Irish Travellers. • The largest proportion (22%) of respondents resided in the Belfast area.
2.2 Travelling • The survey confirmed that less than one-third (29%) of Traveller households actually travel and 62% of
respondents confirmed they had not travelled in the year before the survey. • Almost all (94%) of those who travel said they normally do so during the summer months.• 89% of respondents said they travel with family.
2.� Health and Disability The survey results confirm a high proportion of households had a household member with a disability or
health problem.
• More than one-quarter (26%) of respondents reported that they or other household members had a disability which limits day-to-day activities and of these, 61% said there was one disabled household member.
• More than two-fifths (41%) of households containing a disabled household member required specially adapted accommodation and of these, almost half (48%) said appropriate adaptations had been carried out.
• 10% of household members had a mental health problem.
2.� Community Safety• Most respondents felt safe during the day, in their own home (94%) and walking around the area (94%). • More than half (55%) of respondents had experienced crime that had occurred in the previous 12 months,
14% of respondents reported that they had experienced discrimination and 9% had received a verbal threat.• Almost two-thirds (64%) of those respondents who had stated that they, or a member of their household,
had been a victim of crime, felt the reason had been their ethnic origin.
2.� Accommodation - Housing Needs This section summarises the key findings from the core of this research project, providing the evidence
base for the Housing Executive, in partnership with the Traveller community, to develop schemes which will address outstanding housing need in the Traveller community.
Current accommodation• More than two-fifths (42%) of respondents were living in social housing, 21% on serviced sites, 9% in
privately rented accommodation and 7% on unauthorised sites. 3 See Appendices for the definition of the Household Reference Person (HRP). 4 NISRA 2006 based household projections (www.nisra.gov.uk). 5 NISRA 2006 based household projections (www.nisra.gov.uk).

Travellers’ accommodaTion Needs Assessment in Northern Ireland 2008Travellers’ accommodaTion Needs Assessment in Northern Ireland 2008 Travellers’ accommodaTion Needs Assessment in Northern Ireland 2008
11
• The vast majority of households had access to key services in their accommodation: 89% had access to electricity and toilet facilities and 87% had access to mains water.
Length of time at current accommodation • The survey confirmed that the majority (82%) of respondents had lived at their current accommodation for
more than one year. • Of the remaining 18%, nearly one-third (31%) had lived in the South [Republic of Ireland] before moving to
their current accommodation. • More than three-quarters (78%) of respondents expected to remain in their current accommodation for
more than one year.
Overall satisfaction with current accommodation• More than half (53%) of respondents were very satisfied/satisfied with the standard of their current
accommodation. • 43% thought their current accommodation was better than their previous accommodation.
Previous accommodation• 31% of respondents said their previous accommodation had been social housing.
2.� Evidence of Housing Need Preferred accommodation
• 30% said they would prefer social housing and 19% would prefer grouped accommodation. • 27% said they did not need accommodation.
Preferred location• 26% of respondents said they would prefer to live in the Belfast area.
Glen Road Heights, Belfast.

Travellers’ accommodaTion Needs Assessment in Northern Ireland 2008
12
Travellers’ accommodaTion Needs Assessment in Northern Ireland 2008
Housing Need: Preferred and Current Accommodation
Table 1b
Preferred Accommodation Current Accommodation Frequency
Grouped Accommodation
Serviced Site 38Transit Site 6
Unauthorised Site 5Privately Owned 7Privately Rented 6
Social Housing (NIHE/HA) 21Total ��
Serviced Site
Transit Site 11Co-operated Site 17Unauthorised Site 23Privately Rented 2
Social Housing (NIHE/HA) 4Total ��
Transit Site Unauthorised Site 2Social Housing (NIHE/HA) 1
Total �
Settled Accommodation
Serviced Site 18Transit Site 4
Privately Owned 7Privately Rented 24
Other 4Total ��
Other Serviced Site 2Total 2
All households 202
Analysis of Table 1b shows that there is a gross need for 83 units of grouped accommodation, 57 serviced site pitches and 57 units of social housing. Of these households, 26 currently live in social housing. The knock-on effects of developing, for example, a new grouped accommodation scheme may be the release of a number of units on a serviced site, which may in turn release a number of units on a transit site, etc. The net housing need is a much more complex calculation which is outside the scope of this research project and will be undertaken by Strategic Partnerships in consultation with the Traveller community.
Number of people accommodated with HRP• 47% said three or more people were accommodated with them.• 20% said they expected household members to seek their own accommodation in the next three years.
The Housing Executive, in giving consideration to the findings of the research, will draw up a programme of Traveller-specific schemes to address the identified need over the next five years.
In drawing up a programme of schemes, the Housing Executive will give consideration to greatest need, land availability, compatibility and consultation with individuals, families and the wider community.
Travellers’ accommodaTion Needs Assessment in Northern Ireland 2008Travellers’ accommodaTion Needs Assessment in Northern Ireland 2008 Travellers’ accommodaTion Needs Assessment in Northern Ireland 2008
1�
commenTarY
3.0 Household Profile
�.1 Gender and age of Household Reference Person (HRP) Three-fifths (60%) of HRPs were female and 38% were male; the remainder refused to state the gender of their
HRP (2%) (Table 4). In the 2002 survey, 57% were female and 43% were male.
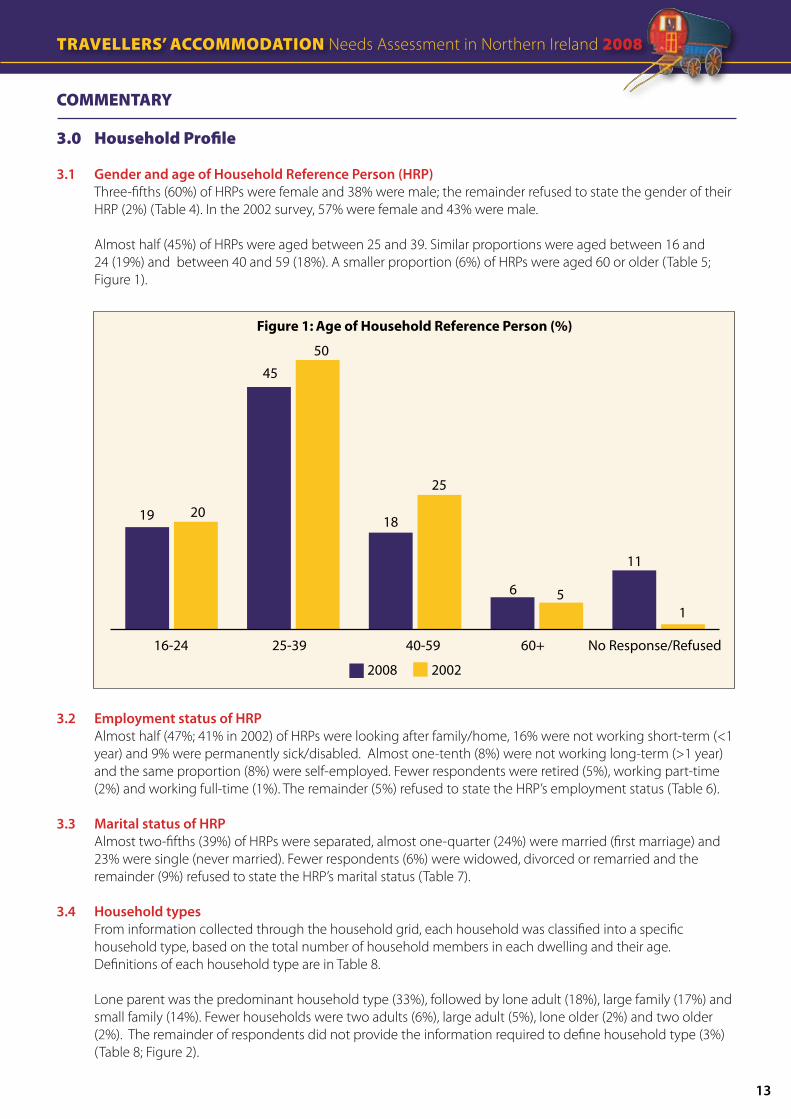
Almost half (45%) of HRPs were aged between 25 and 39. Similar proportions were aged between 16 and 24 (19%) and between 40 and 59 (18%). A smaller proportion (6%) of HRPs were aged 60 or older (Table 5; Figure 1).
�.2 Employment status of HRP Almost half (47%; 41% in 2002) of HRPs were looking after family/home, 16% were not working short-term (<1
year) and 9% were permanently sick/disabled. Almost one-tenth (8%) were not working long-term (>1 year) and the same proportion (8%) were self-employed. Fewer respondents were retired (5%), working part-time (2%) and working full-time (1%). The remainder (5%) refused to state the HRP’s employment status (Table 6).
�.� Marital status of HRP Almost two-fifths (39%) of HRPs were separated, almost one-quarter (24%) were married (first marriage) and
23% were single (never married). Fewer respondents (6%) were widowed, divorced or remarried and the remainder (9%) refused to state the HRP’s marital status (Table 7).
�.� Household types From information collected through the household grid, each household was classified into a specific
household type, based on the total number of household members in each dwelling and their age. Definitions of each household type are in Table 8.
Lone parent was the predominant household type (33%), followed by lone adult (18%), large family (17%) and small family (14%). Fewer households were two adults (6%), large adult (5%), lone older (2%) and two older (2%). The remainder of respondents did not provide the information required to define household type (3%) (Table 8; Figure 2).
Figure 1: Age of Household Reference Person (%)
16-24 25-39 40-59 60+ No Response/Refused
2008 2002
19 20
45
50
18
25
6 5
11
1

Travellers’ accommodaTion Needs Assessment in Northern Ireland 2008
1�
Travellers’ accommodaTion Needs Assessment in Northern Ireland 2008
�.� Family unit A family unit cannot span more than two consecutive generations (e.g. a young mother with child [family unit
2], living with her parents [family unit 1]). A total of 449 households took part in the survey and findings show that more than nine-tenths (94%) of households contained one family unit and 6% contained more than one family unit (Table 9).
�.� Number of people per household One-quarter (25%) of households comprised five or more persons and one-fifth (20%) had one person. Equal
proportions (19%) of households had two persons and four persons and 16% of households comprised three persons (Table 10).
�.� Age of household members All respondents were asked how many people lived in their household and the age of each member. In total,
information on age was provided for 1,486 household members. The younger age profile of the population is indicated by the fact that more than one-quarter (28%) of household members were aged between six and 15 and 21% were aged five or under. For the Northern Ireland population as a whole, 22% were aged under 166. Almost one-fifth (19%) of household members were aged between 25 and 39 and 16% were aged between 16 and 24. Fewer household members were aged between 40 and 59 (8%) and 60 or older (3%) (Table 11; Figure 3).
Figure 2: Household Type (%)
2008 2002
33
Lone Parent
Lone Adult
Large Family
Small Family
Two Adults
Large Adult
Lone Older
Two Older
34
18
11
17
25
1412
No Response/
Refusal
68
5 6
2 1 2 3 31
6 NISRA 2006 based household projections (www.nisra.gov.uk).

Travellers’ accommodaTion Needs Assessment in Northern Ireland 2008Travellers’ accommodaTion Needs Assessment in Northern Ireland 2008 Travellers’ accommodaTion Needs Assessment in Northern Ireland 2008
1�
�.� Ethnic origin of HRP Almost all HRPs (98%) were Irish Travellers. A small proportion (1%) reported the HRP’s ethnic origin as ‘other’
and the remainder (1%) refused to state the ethnic origin of the HRP (Table 12).
�.� Location of Traveller households The largest proportion (22%) of respondents resided in the Belfast area, followed by 17% in Dungannon, 12%
in Craigavon and 11% in Derry/Londonderry. The locations of the Traveller households surveyed are detailed in Figure 4 and in the appendix tables (Table 13). In 2002, the largest proportion of respondents resided in Dungannon (17%), followed by 14% in Belfast, 13% in Derry/Londonderry, 12% in Newry & Mourne and 10% in Armagh.
Figure 3: Age of Household Members (%)
2008 2002
5 yrs or under
6-15 yrs16-24 yrs
25-39 yrs
40-59 yrs
60 yrs+No Response/
Refusal
21 21
2831
1618 19 19
8 9
3 2
7
1
Hillhead, Toome.

Travellers’ accommodaTion Needs Assessment in Northern Ireland 2008
1�
Travellers’ accommodaTion Needs Assessment in Northern Ireland 2008
Figure �: Location of Respondents by Accommodation Type
Ballinamullin Gable view.
Travellers’ accommodaTion Needs Assessment in Northern Ireland 2008Travellers’ accommodaTion Needs Assessment in Northern Ireland 2008 Travellers’ accommodaTion Needs Assessment in Northern Ireland 2008
1�
4.0 TravellinG
The survey included questions on ‘travelling’, to measure the extent of nomadism within the Traveller community.
�.1 Propensity to travel More than two-thirds (70%; 80% in 2002) of respondents said they do not travel. Of those who travel (29% of
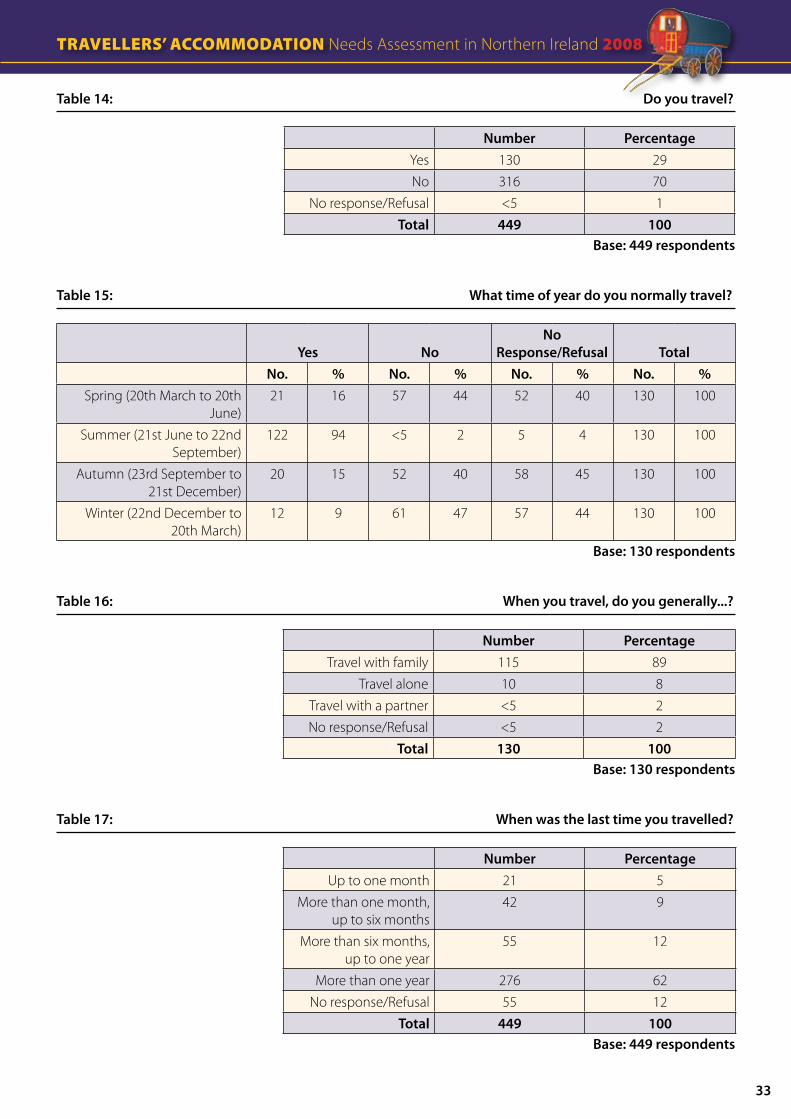
all respondents), more than nine-tenths (94%) said they normally travel during the summer, 16% in the spring, 15% in the autumn and 9% in the winter months (Tables 14 and 15).
Findings show that the majority (89%) of respondents who travel (29% of all respondents) do so with family, 8% travel alone and 2% travel with a partner (Table 16).
The last time respondents had travelled Almost two-thirds (62%) of all respondents had not travelled in the previous year and 12% had not done
so in more than six months, up to one year. Almost one-tenth (9%) of respondents had not travelled in the previous six months and 5% had not travelled in the previous month (Table 17).
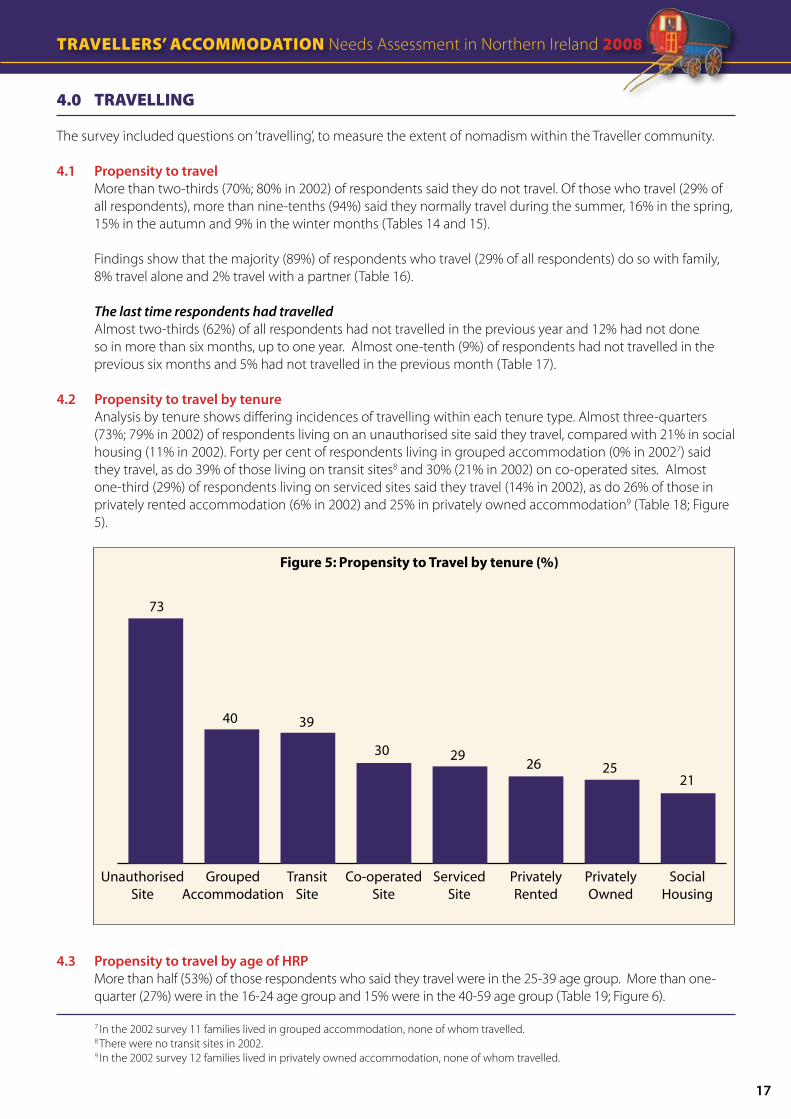
�.2 Propensity to travel by tenure Analysis by tenure shows differing incidences of travelling within each tenure type. Almost three-quarters
(73%; 79% in 2002) of respondents living on an unauthorised site said they travel, compared with 21% in social housing (11% in 2002). Forty per cent of respondents living in grouped accommodation (0% in 20027) said they travel, as do 39% of those living on transit sites8 and 30% (21% in 2002) on co-operated sites. Almost one-third (29%) of respondents living on serviced sites said they travel (14% in 2002), as do 26% of those in privately rented accommodation (6% in 2002) and 25% in privately owned accommodation9 (Table 18; Figure 5).
�.� Propensity to travel by age of HRP More than half (53%) of those respondents who said they travel were in the 25-39 age group. More than one-
quarter (27%) were in the 16-24 age group and 15% were in the 40-59 age group (Table 19; Figure 6). 7 In the 2002 survey 11 families lived in grouped accommodation, none of whom travelled. 8 There were no transit sites in 2002. 9 In the 2002 survey 12 families lived in privately owned accommodation, none of whom travelled.
Figure 5: Propensity to Travel by tenure (%)
73
UnauthorisedSite
GroupedAccommodation
TransitSite
Co-operatedSite
ServicedSite
Privately Rented
PrivatelyOwned
Social Housing
40 39
30 2926 25
21

Travellers’ accommodaTion Needs Assessment in Northern Ireland 2008
1�
Travellers’ accommodaTion Needs Assessment in Northern Ireland 2008
Figure 6: Propensity to Travel by Age of HRP (%)
27%
16-24 25-39 40-59 60+ No Response/Refusal
21%
53% 52%
15%
23%
2%5% 3%
0%
2008 2002
Briar View Houses

Travellers’ accommodaTion Needs Assessment in Northern Ireland 2008Travellers’ accommodaTion Needs Assessment in Northern Ireland 2008 Travellers’ accommodaTion Needs Assessment in Northern Ireland 2008
1�
5.0 HealTH and disaBiliTY
�.1 Health One-tenth (10%) of household members had a mental health problem; 88% of these household members
were receiving treatment from their GP/consultant and 5% were receiving alternative/complementary treatment. Sixty household members (4%) had arthritis, 49 (86%) of whom were receiving treatment from their GP/consultant; 53 (4%) had high blood pressure, most of whom (42; 86%) were receiving treatment from their GP/consultant. Fewer respondents reported heart disease (32; 2% of household members), diabetes (15; 1% of household members), joint replacement (9; 1% of household members) and osteoporosis (8; 1% of household members) (Table 20).
�.2 Disability in the household More than one-quarter (26%) of respondents reported that they or a member of their household had a
disability which limits day-to-day activities. Of these, almost two-thirds (61%) said there was one disabled household member. Almost one-quarter (23%) had two disabled household members and 4% had three or more disabled household members. Forty-one per cent of households containing one or more disabled members required specially adapted accommodation and of these, almost half (48%) said appropriate adaptations had been carried out (Tables 21-24; Figure 7).
Figure 7: Do you or any members of your household have a disability? (%)
26%
Yes
2008 2002
44%
71%
55%
3% 1%
No No Response/Refusal

Travellers’ accommodaTion Needs Assessment in Northern Ireland 2008
20
Travellers’ accommodaTion Needs Assessment in Northern Ireland 2008
6.0 commUniTY saFeTY
�.1 The majority of respondents reported that they felt safe:• at home during the day (94%);• walking around the area during the day (94%);• at home after dark (85%); and• walking around the area after dark (76%) (Table 25).
�.2 Crime More than half (55%) of all respondents said they, or other members of their household, had experienced
specific crimes during the previous 12 months. Some respondents had experienced discrimination (14%), verbal threat (9%), vandalism to property (7%), racist attack (7%) and hate crime (5%). Smaller proportions of respondents had experienced physical assault (4%), burglary (3%), vandalism of car or other motor vehicle (2%), theft of car or other motor vehicle (2%) and theft from car (1%) (Tables 26 and 27).
�.� Almost two-thirds (64%) of those respondents who stated that they, or a member of their household, had been a victim of crime (55% of all respondents), felt the reason had been their ethnic origin; 10% gave other reasons; 22% refused or omitted to state their reasons and 4% did not know (Table 28).
Ballyarnett

Travellers’ accommodaTion Needs Assessment in Northern Ireland 2008Travellers’ accommodaTion Needs Assessment in Northern Ireland 2008 Travellers’ accommodaTion Needs Assessment in Northern Ireland 2008
21
7.0 accommodaTion - HoUsinG needs
This section summarises the key findings from the core of this research project, providing the evidence base for the Housing Executive, in partnership with the Traveller community, to develop schemes which will address outstanding housing need in the Traveller community.
This section identifies the accommodation which Travellers currently live in, their satisfaction levels with their current accommodation and their previous accommodation type, and provides an important element of the housing needs assessment.
�.1 Current accommodation More than two-fifths (42%) of respondents said they already lived in social housing (i.e. Housing Executive or
housing association) and 21% lived on serviced sites. Almost one-tenth (9%) of respondents reported that they lived in privately rented accommodation, 7% lived on unauthorised sites and 6% lived in privately owned accommodation. Equal proportions (5%) of respondents lived on transit sites, co-operated sites and grouped accommodation. The remainder of respondents (1%) lived in other types of accommodation, details of which are in the appendix tables (Tables 29 and 30; Figure 810).
Most respondents had access to electricity (89%), toilet facilities (89%) and mains water (87%) in their accommodation (Tables 31-34). One-fifth (20%) of households living on sites had a play area for children (Table 35).
10 ‘Unauthorised site’ was described in 2002 as ‘side of the road’.
Figure 8: Current Accommodation (%)
2008 2002
42%Social Housing
Serviced Site
Privately Rented
UnauthorisedSite
Privately Owned
Transit Site
Co-operated Site
Grouped Accommodation
Other
No Response/Refusal
42%
21%21%
9%8%
7%11%
6%
4%
5%
0%
5%
9%
5%
4%
1%
2%
1%
0%

Travellers’ accommodaTion Needs Assessment in Northern Ireland 2008
22
Travellers’ accommodaTion Needs Assessment in Northern Ireland 2008
�.2 Length of time at current accommodation The survey shows that a high proportion of the Traveller community do not travel regularly, but of those who
travel (29% of all respondents), 31% had lived across the border in the previous year.
More than four-fifths (82%; 67% in 2002) of respondents reported that they had lived at their current accommodation for more than one year and 7% had lived there for more than one month, up to six months. Equal proportions (5%) had lived in their current accommodation for up to one month, and more than six months, up to one year (Table 36).
Of those respondents who had lived at their current accommodation for less than one year (17% of all respondents), almost one-third (24; 31%) had lived in the South [Republic of Ireland] before moving to their current accommodation and one-fifth (15; 20%) had lived in Craigavon before moving to their current accommodation (Table 37).
More than three-quarters (78%) of all respondents expected to remain in their current accommodation for more than one year, 11% for up to six months and 4% for more than six months, up to one year (Table 38).
�.� Overall satisfaction with current accommodation More than half (53%) of respondents were very satisfied/satisfied with the standard of their current
accommodation, 37% were dissatisfied/very dissatisfied and one-tenth (10%) were neither satisfied nor dissatisfied (Table 39). The main reasons for dissatisfaction were poor living conditions and overcrowding (Table 40).
�.� Previous accommodation Almost one-third (31%) of respondents said their previous accommodation had been social housing; 19%
had been living on a serviced site and 12% on an unauthorised site; 11% had been living on a transit site and 8% had been living in privately rented accommodation. A small proportion (7%) had no previous accommodation. Fewer respondents said they had been living on a co-operated site (2%), privately owned accommodation (2%) or grouped accommodation (1%), and 3% had lived in other types of accommodation, details of which are in the appendix tables (Tables 41 and 42; Figure 9).
Of those respondents who had lived previously in other accommodation (93% of all respondents), 43% (58% in 2002) said they thought their current accommodation was in better condition than their previous accommodation. Almost one-third (30%; 26% in 2002) thought it was about the same and 18% (16% in 2002) thought it was worse. Of the remainder, 5% of respondents did not know and 4% refused (Table 43).
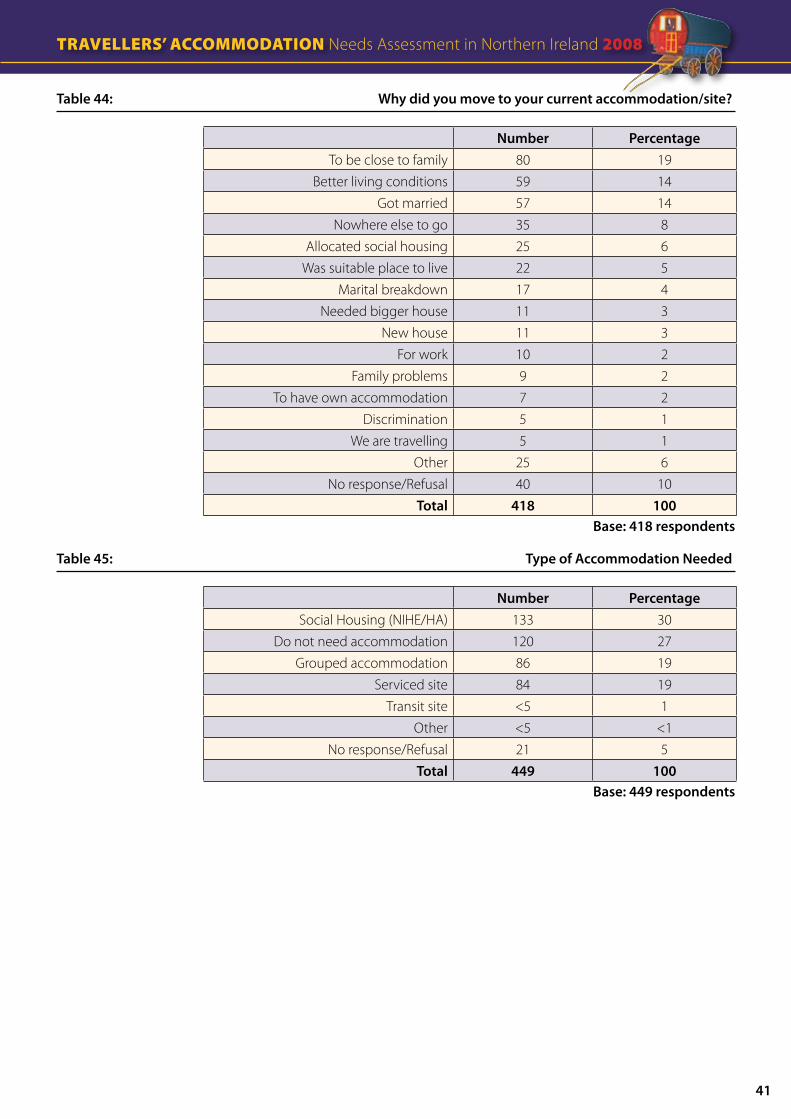
The most common reason for moving given by respondents who had lived previously in other accommodation was to be close to family (19%). Equal proportions (14%) cited better living conditions and marriage as their reason for leaving and 8% had moved as they had nowhere else to go (Table 44).
�.� Evidence of housing need Preferred accommodation All respondents, regardless of their housing requirements, were asked to state their preferred accommodation.
Almost one-third (133; 30%) said their preferred accommodation was social housing. Equal proportions (19%) preferred grouped accommodation (86 respondents) and a serviced site (84 respondents). A very small proportion (1%) (<5 respondents) said they would prefer a transit site. More than one-quarter (120; 27%) of respondents said they did not need accommodation (Table 45).
In 2002, 42% of respondents said their preferred accommodation was social housing, 38% preferred grouped accommodation and 14% preferred a serviced site. The remaining 6% preferred other accommodation types.
Preferred location More than one-quarter (26%; 22% in 2002) of all respondents said they would prefer to live in the Belfast area,
16% (5% in 2002) in the Craigavon area and 12% (16% in 2002) in the Dungannon area. Equal proportions (11%) of respondents gave the Newry & Mourne area (11% in 2002) and the Derry/Londonderry area (13% in

Travellers’ accommodaTion Needs Assessment in Northern Ireland 2008Travellers’ accommodaTion Needs Assessment in Northern Ireland 2008 Travellers’ accommodaTion Needs Assessment in Northern Ireland 2008
2�
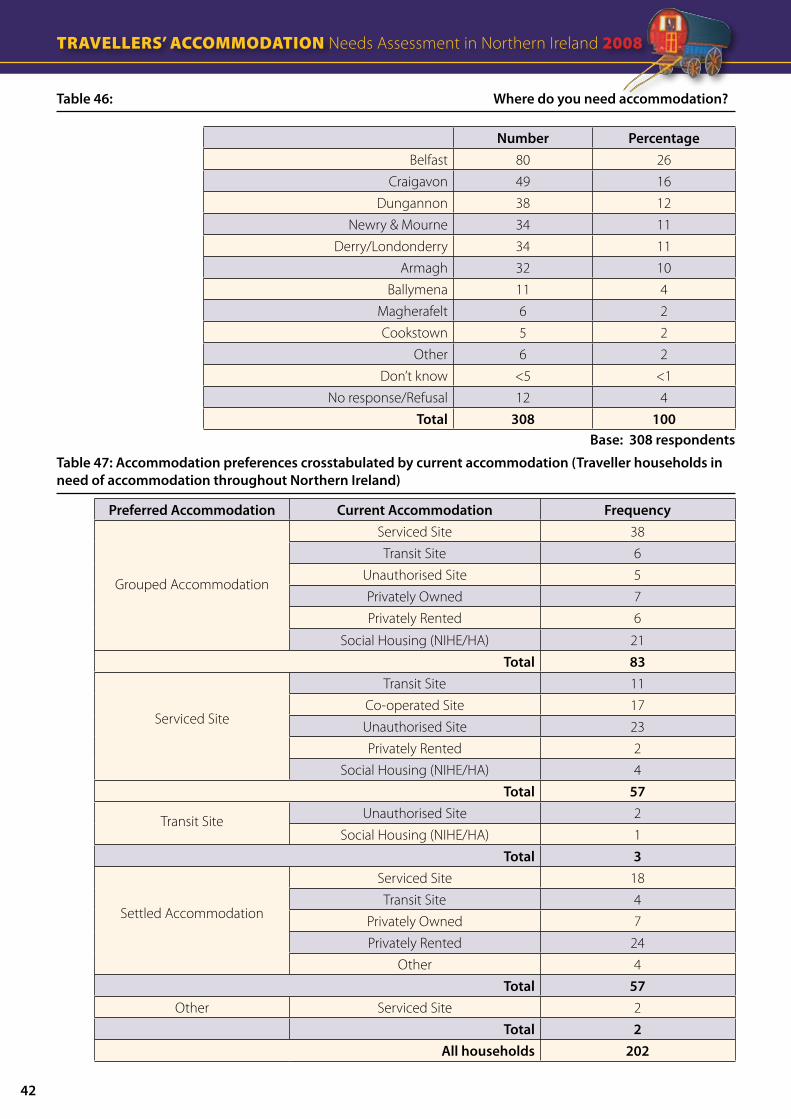
2002) as their preferred locations. The remainder of respondents preferred the Armagh (10%; 10% in 2002) and Ballymena areas (4%; 5% in 2002) (Table 46).
Housing need: preferred and current accommodation The core of the housing need analysis is given by comparing respondents’ preferred accommodation with
their current accommodation. Table 1c provides a breakdown of respondents’ preferred accommodation type by their current accommodation. Those respondents who did not need accommodation have been excluded from the analysis11.
Figure 9: Previous Accommodation (%)
2008 2002
31%23%
19%34%
8%4%
12%14%
7%7%
2%
0%
3%
11%
2%3%
1%
3%12%
0%
0%
3%
Social Housing
Serviced Site
Privately Rented
UnauthorisedSite
No previous Accommodation
Privately Owned
Transit Site
Co-operated Site
Grouped Accommodation
Other
No Response/Refusal
11 i.e. those whose current accommodation was the same as their preferred accommodation.

Travellers’ accommodaTion Needs Assessment in Northern Ireland 2008
2�
Travellers’ accommodaTion Needs Assessment in Northern Ireland 2008
Table 1c
Preferred Accommodation Current Accommodation Frequency
Grouped Accommodation
Serviced Site 38Transit Site 6
Unauthorised Site 5Privately Owned 7Privately Rented 6
Social Housing (NIHE/HA) 21Total ��
Serviced Site
Transit Site 11Co-operated Site 17Unauthorised Site 23Privately Rented 2
Social Housing (NIHE/HA) 4Total ��
Transit Site Unauthorised Site 2Social Housing (NIHE/HA) 1
Total �
Settled Accommodation
Serviced Site 18Transit Site 4
Privately Owned 7Privately Rented 24
Other 4Total ��
Other Serviced Site 2Total 2
All households 202
Analysis of Table 1c shows there is a gross need for 83 units of grouped accommodation, 57 serviced site pitches and 57 units of social housing. Of these households, 26 currently live in social housing. The knock-on effects of developing, for example, a new grouped accommodation scheme may be the release of a number of units on a serviced site, which may in turn release a number of units on a transit site, etc. The net housing need is a much more complex calculation which is outside the scope of this research project and will be undertaken by Strategic Partnerships in consultation with the Traveller community.
Table 1d provides a breakdown of respondents’ preferred accommodation type by preferred location, where this is different from their current accommodation. Once again, respondents who did not need accommodation have been excluded from the analysis. More than one-third (69 respondents) stated that they would prefer to live in Belfast. Outside Belfast, the most popular locations were Craigavon (41 respondents) and Dungannon (31 respondents).

Travellers’ accommodaTion Needs Assessment in Northern Ireland 2008Travellers’ accommodaTion Needs Assessment in Northern Ireland 2008 Travellers’ accommodaTion Needs Assessment in Northern Ireland 2008
2�
Table 1d
Preferred LocationPreferred
accommodationtype
Belfast Craigavon Dungannon Derry/ Londonderry
Armagh Newry &
Mourne
Other No Response
/Don’t know
Total
Serviced Site 19 33 - - - 1 2 2 ��Transit Site 1 2 - - - - - - �
Grouped Accommodation 45 5 18 3 1 3 7 1 ��
Social Housing
4 1 11 14 14 8 4 1 ��
Other - - 2 - - - - - 2Total �� �1 �1 1� 1� 12 1� � 202
It should be noted, therefore, that in terms of assessing housing need this analysis excludes those whose current accommodation type and preferred accommodation type are the same, but who would like to move to another area, or would require larger accommodation.
Number of people accommodated with HRPFurther insight into housing need is gained from the following analysis. Almost half (47%) of respondents said that three or more people were accommodated with the HRP, 19% were accommodated alone and equal proportions (13%) were accommodated with one other person and with two other people. Very few households reported that family members accommodated with them were living with other relatives or carers (2%) or travelling (2%) (Tables 52 and 53).
One-fifth (20%) of respondents said they expected household members to seek their own accommodation in the next three years12. Of these, two-thirds (66%) expected one household member to seek their own accommodation, 24% expected two household members and 10% expected three or more household members to seek their own accommodation in the next three years (Tables 54 and 55).
Developing Traveller SchemesIt is important to emphasise that, while this research project provides clear evidence of unmet housing need among the Traveller community, developing details of any new schemes to be provided is not part of this research project and will require further detailed analysis by the Housing Executive’s Strategic Partnerships Team, in consultation with the Traveller community and its representative groups.
12 Gathering this additional information during the survey will help to facilitate decisions around the planning of future
accommodation schemes for the Travelling community over the next few years.

Travellers’ accommodaTion Needs Assessment in Northern Ireland 2008
2�
Travellers’ accommodaTion Needs Assessment in Northern Ireland 2008
8.0 FUrTHer commenTs
Respondents were asked what they felt were the most important issues facing the Traveller community today. Almost all respondents (97%) made a total of 862 comments on a range of issues.
Almost half (48%) of respondents thought accommodation and 35% thought discrimination/racism were the most important issues facing the Traveller community today. Other responses included employment/jobs (29%), schools/education (6%) and poor health (14%) (Table 1e).
Table 1e
Number PercentageAccommodation issues 207 48Discrimination/Racism 154 35
Employment/Jobs 125 29School/Education 71 16
Poor health 61 14Poor living conditions 47 11
Facilities related 32 7Other comments 99 23
No response/Refusal 66 15 Base: ��� respondents who gave ��2 comments
Most respondents (70%) made a total of 397 further comments on a range of issues. More than two-fifths (43%) made comments related to accommodation and 19% noted that they had no accommodation needs; 8% stated a preference for grouped accommodation and 6% commented on health/disability issues (Table 1f ).
Table 1f
Number PercentageAccommodation related comments e.g. ‘Need proper housing’ 134 43
No accommodation needs 60 19Would like Group Housing 26 8
Health/Disability related comments e.g. ‘Poor health’ 20 6Facilities related comments e.g. ‘Play area needed’ 17 5
Better living conditions needed 9 3Other comments 59 19
No response/Refusal 72 23Base: �1� respondents who gave ��� further comments

Travellers’ accommodaTion Needs Assessment in Northern Ireland 2008Travellers’ accommodaTion Needs Assessment in Northern Ireland 2008 Travellers’ accommodaTion Needs Assessment in Northern Ireland 2008
2�
9.0 conclUsions
The survey attempted to reach all Traveller households in Northern Ireland, and while this was not achievable the Traveller Support Groups have confirmed that a very high proportion were contacted. On this basis the survey achieved a high response with 449 of the 531 Traveller households identified completing questionnaires. These households were spread across Northern Ireland, with the greatest concentrations in the Belfast area (22%), followed by Dungannon (17%), Craigavon (12%) and Derry/Londonderry (11%).
The survey confirms the youthful profile of the Traveller community and the over-representation of lone parent families.
For the survey to measure the extent of nomadism within the Traveller community, respondents were asked questions on ‘travelling’. Seventy per cent of respondents said they no longer travel; of those who do, the majority travel during the summer months.
Mental health problems were reported for one-tenth (10%) of household members and 26% of respondents reported that they or a member of their household had a disability which limits day-to-day activities.
More than two-fifths (42%) of respondents were living in social housing at the time of the survey, the same proportion as in the 2002 survey.
More than half of respondents (53%) were very satisfied/satisfied with the standard of their current accommodation, but the survey also indicates a significant level of unmet housing need (particularly in Belfast, Craigavon and Dungannon).
The following district council areas (listed alphabetically) have been identified as areas where the need is greatest:
• Belfast• Craigavon• Derry/Londonderry• Dungannon
More than two-fifths (41%) of those in housing need said they would prefer grouped accommodation and equal proportions (28%) would prefer social housing and serviced sites. There is a gross need for 83 units of grouped accommodation, 57 serviced site pitches and 57 units of social housing. The knock-on effects of developing, for example, a new grouped accommodation scheme may be the release of a number of units on a serviced site, which in turn may release a number of units on a transit site, etc. The net housing need is a much more complex calculation, which is outside the scope of this research project and will be undertaken by Strategic Partnerships in consultation with the Traveller community. The Housing Executive, in giving consideration to the findings of the research, will draw up a programme of Traveller-specific schemes to address the identified need over the next five years.
In drawing up a programme of schemes, the Housing Executive will give consideration to greatest need, land availability, compatibility and consultation with individuals, families and the wider community.

Travellers’ accommodaTion Needs Assessment in Northern Ireland 2008
2�
Travellers’ accommodaTion Needs Assessment in Northern Ireland 2008
aPPendices
APPENDIX 1: PRESENTATION OF FINDINGS
For data protection purposes it is the policy of the Research Unit that if fewer than five people respond in a particular way to any given question, the exact number is not reported, as it may be possible to identify individuals. Therefore, regardless of the size of the sample or sub-sample, if the number of responses is fewer than five, this is indicated throughout the report, in both the textual and tabular analyses, by the sign ‘<5’.
Conditions regarding the inclusion of numbers and/or percentages in findings, depending on the size of the sample or sub-sample, are set out below:
1) Where the sample, or sub-sample, is 100 or more, the textual analysis (i.e. the main body of the report) includes percentages only. The tabular analysis (i.e. the appendix tables) includes both numbers and percentages.
2) Where the sample, or sub-sample, is 50 or more but less than 100, both the textual and tabular analyses include numbers and percentages.
3) Where the sample, or sub-sample, is less than 50, both the textual and tabular analyses include numbers, but not percentage figures.
The total achieved response in this survey was 449. Furthermore, the analysis includes data relating to 1,486 household members. Questions were directed at sub-samples of less than 100 and also less than 50 respondents. Therefore, all three conditions apply to sections of both the textual and tabular analyses.
The HRP is the household member who:1. owns the dwelling/accommodation, or2. is legally responsible for the rent of the dwelling/accommodation, or3. is living in the dwelling/accommodation as an emolument or perquisite, or4. is living in the dwelling/accommodation by virtue of some relationship to the owner or lessee, who is not a
member of the household.
In the case of a joint tenancy or joint ownership of a dwelling, the person with the higher annual income is the HRP. If both people have the same income, the older of the two is the HRP.

Travellers’ accommodaTion Needs Assessment in Northern Ireland 2008Travellers’ accommodaTion Needs Assessment in Northern Ireland 2008 Travellers’ accommodaTion Needs Assessment in Northern Ireland 2008
2�
aPPendiX 2: TaBUlar rePorT
(Note: Due to rounding some tables may not add to 100%. Also, in some cases where the number of responses has been less than five, the actual figures have been omitted and these are shown as <�)
Table 1: Response Rate
Number PercentageFully Completed Interviews 449 85
Non-Contact 69 13Refusal 13 2
Total ��1 100
Table 2: Accommodation Type of all Traveller Households Identified
Number PercentageLiving in settled accommodation 314 59
Living in a trailer 118 22Living in a mobile caravan 47 9
Living in a chalet (park home) 23 4Other <5 1
No response/Refusal 25 5Total ��1 100
Base: ��1 sample
Table �: Population Count
NumberHouseholds Interviewed 449
Total Population 1,���
Table �: Gender (Household Reference Person)
Number PercentageMale 169 38
Female 270 60No response/Refusal 10 2
Total ��� 100 Base: ��� respondents

Travellers’ accommodaTion Needs Assessment in Northern Ireland 2008
�0
Travellers’ accommodaTion Needs Assessment in Northern Ireland 2008
Table �: Age (Household Reference Person)
Male Female No Response / Refusal
All
Age Groups Number % Number % Number % Number %16-24 33 20 51 19 <5 20 86 1925-39 69 41 126 47 6 60 201 4540-59 34 20 45 17 <5 20 81 1860-64 <5 2 7 3 - - 11 2
65+ 13 8 6 2 - - 19 4No Response/Refusal 16 10 35 13 - - 51 11
Total 1�� 100 2�0 100 10 100 ��� 100 Base: ��� respondents
Table �: Employment status (Household Reference Person)
Number PercentageLooking after home/family 213 47
Not working short-term (<1 year) 71 16Permanently sick/disabled 39 9
Not working long-term (>1 year) 36 8Self Employed 35 8
Retired 21 5Working part-time 8 2Working full-time 5 1
No response/Refusal 21 5Total ��� 100
Base: ��� respondents
Table �: Marital status (Household Reference Person)
Number PercentageSeparated 177 39
Married (first marriage) 107 24Single (never married) 103 23
Widowed 16 4Divorced 5 1
Re-married <5 <1No response/Refusal 39 9
Total ��� 100Base: ��� respondents

Travellers’ accommodaTion Needs Assessment in Northern Ireland 2008Travellers’ accommodaTion Needs Assessment in Northern Ireland 2008 Travellers’ accommodaTion Needs Assessment in Northern Ireland 2008
�1
Table �: Household Types
Definition of Household Types: Number %Lone Parent Sole adult living with dependent (children) under 16
years of age150 33
Lone Adult Lone person below pensionable age - 65 years for men, 60 years for women
81 18
Large Family Any two adults, related or unrelated, living with 3 or more dependent children under 16 years of age OR three or more adults, related or unrelated, living with two or more dependent children under 16 years of age
75 17
Small family Any two adults, related or unrelated living with 1 or 2 dependent children under 16 years of age
63 14
Two Adults Two people, related or unrelated, below pensionable age
26 6
Large Adult Three or more adults, related or unrelated, with or without 1 dependent child under 16 years of age
22 5
Lone Older One person of pensionable age, 65 years for men, 60 years for women
11 2
Two Older Two people, related or unrelated, at least one of whom is of pensionable age
9 2
No response / Refusal 12 3Total ��� 100
Base: ��� respondents
Table �: Family Units1� per Household
Number PercentageOne Family Unit 420 94
Concealed Family Unit 25 6Refusal <5 1
Total 449 100Base: ��� respondents
Table 10: Number of people in each household
Number PercentageOne person 92 20Two people 84 19
Three people 72 16Four people 84 19
Five or more people 113 25No response/Refusal <5 1
Total ��� 100Base: ��� respondents
13 A family unit cannot span more than two consecutive generations (e.g. mother with child [family unit 2] living with parent [family unit 1]).

Travellers’ accommodaTion Needs Assessment in Northern Ireland 2008
�2
Travellers’ accommodaTion Needs Assessment in Northern Ireland 2008
Table 11: Age of household members
Number Percentage5 and under 308 21
6 - 15 415 2816 - 24 231 1625 - 39 283 1940 - 59 112 8
60 or older 42 3No response/Refusal 95 7
Total 1,��� 100Base: 1,��� household members resident in ��� households
Table 12: Ethnic Origin (Household Reference Person)
Number PercentageIrish Traveller 440 98
Other 5 1No response/Refusal <5 1
Total ��� 100Base ��� respondents
Table 1�: Current Location by District Council
Number PercentageBelfast 99 22
Dungannon 76 17Craigavon 53 12
Derry/Londonderry 49 11Omagh 44 10Armagh 43 10
Newry & Mourne 38 9Ballymena 16 4
Cookstown 10 2Strabane 7 2
Antrim 6 1Other (Magherafelt/Fermanagh/
Lisburn/Ards/North Down)8 2
Total ��� 100 Base: ��� respondents
Travellers’ accommodaTion Needs Assessment in Northern Ireland 2008Travellers’ accommodaTion Needs Assessment in Northern Ireland 2008 Travellers’ accommodaTion Needs Assessment in Northern Ireland 2008
��
Table 1�: Do you travel?
Number PercentageYes 130 29No 316 70
No response/Refusal <5 1Total ��� 100
Base: ��� respondents
Table 1�: What time of year do you normally travel?
Yes NoNo
Response/Refusal TotalNo. % No. % No. % No. %
Spring (20th March to 20th June)
21 16 57 44 52 40 130 100
Summer (21st June to 22nd September)
122 94 <5 2 5 4 130 100
Autumn (23rd September to 21st December)
20 15 52 40 58 45 130 100
Winter (22nd December to 20th March)
12 9 61 47 57 44 130 100
Base: 1�0 respondents
Table 1�: When you travel, do you generally...?
Number PercentageTravel with family 115 89
Travel alone 10 8Travel with a partner <5 2No response/Refusal <5 2
Total 1�0 100Base: 1�0 respondents
Table 1�: When was the last time you travelled?
Number PercentageUp to one month 21 5
More than one month, up to six months
42 9
More than six months, up to one year
55 12
More than one year 276 62No response/Refusal 55 12
Total ��� 100Base: ��� respondents

Travellers’ accommodaTion Needs Assessment in Northern Ireland 2008
��
Travellers’ accommodaTion Needs Assessment in Northern Ireland 2008
Table 1�: Current Tenure by Propensity to Travel
Yes NoNo
Response/Refusal TotalNo. % No. % No. % No. %
Unauthorised Site 22 73 8 27 - - 30 100Grouped Accommodation 8 40 12 60 - - 20 100
Transit Site 9 39 14 61 - - 23 100Co-operated Site 7 30 16 70 - - 23 100
Serviced Site 27 29 64 70 <5 1 92 100Privately Rented 10 26 29 74 - - 39 100Privately Owned 7 25 21 75 - - 28 100
Social Housing 40 21 146 78 <5 1 187 100Other - - <5 100 - - <5 100
No response/Refusal - - <5 100 - - <5 100Total 1�0 2� �1� �0 <� 1 ��� 100
Base: ��� respondents
Table 1�: Age of respondents who travel
Number Percentage16-24 35 2725-39 69 5340-59 19 15
60+ <5 2No response/Refusal <5 3
Total 1�0 100Base: 1�0 respondents
Table 20: Do you or any members of your household have any of the following impairments?
Total with Impairment
Receiving treatment from GP/Consultant
Alternative/ Complementary
treatmentImpairments No. % No. % No. %
Mental health problems 156 10 108 88 6 5Arthritis 60 4 49 86 - -
High blood pressure 53 4 42 86 - -
Heart disease 32 2 24 80 - -
Diabetes 15 1 14 93 <5 7
Joint replacement 9 1 5 71 - -
Osteoporosis 8 1 6 75 - -
Cancer <5 <1 <5 100 - -
Stroke <5 <1 <5 67 - -
Other 77 5 46 72 <5 3
Base: Varies according to response to this question

Travellers’ accommodaTion Needs Assessment in Northern Ireland 2008Travellers’ accommodaTion Needs Assessment in Northern Ireland 2008 Travellers’ accommodaTion Needs Assessment in Northern Ireland 2008
��
Table 21: Do any members of your household have a disability?
Number PercentageYes 117 26No 318 71
No response/Refusal 14 3Total ��� 100
Base: ��� respondents
Table 22: Number of Household Members with Disabilities
Number PercentageOne 71 61Two 27 23
Three or more 5 4No Response/Refusal 14 12
Total 11� 100Base: 11� respondents
Table 2�: Do any of your family members with a disability require specially adapted accommodation?
Number PercentageYes 48 41No 52 44
No Response/Refusal 17 15Total 11� 100
Base: 11� respondents
Table 2�: Has your accommodation been adapted appropriately?
Number PercentageYes 23 48No 23 48
No Response <5 4Total �� 100
Base: �� respondentsTable 2�: Personal Safety
Do you feel safe…? Yes NoNo
Response/Refusal TotalNo. % No. % No. % No. %
Walking around the area during the day (6am to 9pm)
422 94 23 5 <5 1 449 100
Walking around the area at night (9pm to 6am)
342 76 100 22 7 2 449 100
In your home during the day(6am to 9pm)
423 94 21 5 5 1 449 100
In your home at night (9pm to 6am) 380 85 64 14 5 1 449 100Base: ��� respondents

Travellers’ accommodaTion Needs Assessment in Northern Ireland 2008
��
Travellers’ accommodaTion Needs Assessment in Northern Ireland 2008
Table 2�: Have you or has any member of your household experienced any of the following?
Yes NoNo
Response/Refusal TotalNo. % No. % No. % No. %
Discrimination 61 14 379 84 9 2 449 100Verbal threat 42 9 396 88 11 2 449 100
Vandalism of property 32 7 409 91 8 2 449 100Racist attack 31 7 410 91 8 2 449 100
Hate crime 22 5 417 93 10 2 449 100Physical Assault 19 4 420 94 10 2 449 100
Burglary 15 3 426 95 8 2 449 100Vandalism of car or other motor
vehicle10 2 428 95 11 2 449 100
Theft of car or other motor vehicle 9 2 430 96 10 2 449 100Theft from car 5 1 434 97 10 2 449 100
Any other crime <5 1 372 83 74 16 449 100Base: ��� respondents
Table 2�: If yes, did you report it to any organisation?
Yes NoNo
Response/Refusal
Total
No. No. No. No.Discrimination 18 39 <5 61
Verbal threat 20 17 5 42
Vandalism of property 23 6 <5 32Racist attack 20 7 <5 31
Hate crime 15 <5 <5 22Physical Assault 12 <5 <5 19
Burglary 11 <5 <5 15Vandalism of car or other motor
vehicle8 - <5 10
Theft of car or other motor vehicle 7 - <5 9Theft from car <5 <5 <5 5
Any other crime - - <5 <5Base: Varies according to response to this question
Table 2�: Why do you think you (or anyone in your household) were a victim of crime?
Number PercentageBecause I am a Traveller 72 64
Other 11 10Don’t know/no reason 5 4
No response/Refusal 25 22Total 11� 100
Base: 11� respondents

Travellers’ accommodaTion Needs Assessment in Northern Ireland 2008Travellers’ accommodaTion Needs Assessment in Northern Ireland 2008 Travellers’ accommodaTion Needs Assessment in Northern Ireland 2008
��
Table 2�: Current Accommodation/Site
Number PercentageSocial Housing (NIHE/HA) 187 42
Serviced Site (by NIHE) 92 21Privately Rented 39 9
Unauthorised Site 30 7Privately Owned 28 6
Transit Site (Basic Amenities) 23 5Co-operated Site 23 5
Grouped Accommodation 20 5Other (homeless/caravan on family property) <5 1
No response/Refusal <5 1Total ��� 100
Base: ��� respondents
Table �0: Current accommodation type
Number PercentagePrivately rented house 38 54
Privately owned land with a caravan 17 24Privately owned house 8 11
Privately owned site with a caravan <5 4Other (homeless/rent a room/rented demountable) 5 7
Total �1 100Base: �1 respondents
Table �1: In your accommodation do you have access to...?
Yes NoNo
Response/Refusal TotalNo. % No. % No. % No. %
Mains water 392 87 53 12 <5 1 449 100Electricity 398 89 47 11 <5 1 449 100
Toilet facilities 400 89 44 10 5 1 449 100Base: ��� respondents
Table �2: If no, please indicate how you access water
Number PercentageUse outside taps 21 40
Buy bottled water 12 23Use tap belonging to other families 6 11
Other <5 8Don’t know <5 2
No response/Refusal 9 17Total �� 100
Base: �� respondents

Travellers’ accommodaTion Needs Assessment in Northern Ireland 2008
��
Travellers’ accommodaTion Needs Assessment in Northern Ireland 2008
Table ��: If no, please indicate how you access electricity
NumberGenerator 39
Use other family member’s supply <5Don’t know <5
No response/Refusal 6Total ��
Base: �� respondents
Table ��: If no, please indicate how you access toilet facilities
NumberOutdoor toilet 21
Share with other families 20Other <5
No response/Refusal <5Total ��
Base: �� respondents
Table ��: Is there a play area for children on your site?
Number PercentageYes 23 20No 90 78
No response/Refusal <5 2Total 11� 100
Base: 11� respondents
Table ��: Length of Time at Current Accommodation
Number PercentageUp to one month 21 5
More than one month, up to six months 32 7More than six months, up to one year 24 5
More than one year 367 82No response/Refusal 5 1
Total ��� 100 Base: ��� respondents

Travellers’ accommodaTion Needs Assessment in Northern Ireland 2008Travellers’ accommodaTion Needs Assessment in Northern Ireland 2008 Travellers’ accommodaTion Needs Assessment in Northern Ireland 2008
��
Table ��: If one year or less, where did you live before?
Number PercentageSouth of Ireland 24 31
Craigavon 15 20Belfast <5 5
Derry/Londonderry <5 5England <5 5Armagh <5 5
Newry & Mourne <5 5Other 11 12
No Response/Refusal 8 10Total �� 100
Base: �� respondents
Table ��: How long do you expect to remain in your current accommodation?
Number PercentageUp to one month 11 3
More than one month, up to six months 37 8More than six months, up to one year 16 4
More than one year 352 78No response/Refusal 33 7
Total ��� 100 Base: ��� respondents
Table ��: Satisfaction with Current Accommodation/Site
Number PercentageVery satisfied 110 25
Satisfied 125 28Neither satisfied nor dissatisfied 45 10
Dissatisfied 72 16Very dissatisfied 94 21
No response/Refusal <5 1Total ��� 100
Base: ��� respondents
Table �0: Reasons for Dissatisfaction
Number PercentagePoor living conditions 91 55
Overcrowding 26 16Not safe for children 13 8
Wants security of tenure 9 5Other 23 14
No response/Refusal <5 2Total 1�� 100
Base: 1�� respondents

Travellers’ accommodaTion Needs Assessment in Northern Ireland 2008
�0
Travellers’ accommodaTion Needs Assessment in Northern Ireland 2008
Table �1: Previous Accommodation/Site
Number PercentageSocial Housing (NIHE/HA) 139 31
Serviced Site (by NIHE) 87 19Unauthorised Site 56 12
Transit Site (Basic Amenities) 51 11Privately Rented 37 8
No previous accommodation 31 7Co-operated Site 11 2Privately Owned 8 2
Grouped Accommodation (Permanent Dwellings for families) <5 1Other (homeless/temporary accommodation) 12 3
No response/Refusal 14 3Total ��� 100
Base: ��� respondents
Table �2: Was your previous accommodation/site....?
Number PercentagePrivately rented house 36 63Privately owned house 6 11
Privately owned land with a caravan <5 4Other 9 16
No response/Refusal <5 7Total �� 100
Base: �� respondents
Table ��: How does the condition of your current accommodation/site compare with the condition of your previous accommodation/site?
Number PercentageBetter 179 43
About the same 126 30Worse 76 18
Don’t know 21 5No response/Refusal 16 4
Total �1� 100Base: �1� respondents
Travellers’ accommodaTion Needs Assessment in Northern Ireland 2008Travellers’ accommodaTion Needs Assessment in Northern Ireland 2008 Travellers’ accommodaTion Needs Assessment in Northern Ireland 2008
�1
Table ��: Why did you move to your current accommodation/site?
Number PercentageTo be close to family 80 19
Better living conditions 59 14Got married 57 14
Nowhere else to go 35 8Allocated social housing 25 6
Was suitable place to live 22 5Marital breakdown 17 4
Needed bigger house 11 3New house 11 3
For work 10 2Family problems 9 2
To have own accommodation 7 2Discrimination 5 1
We are travelling 5 1Other 25 6
No response/Refusal 40 10Total �1� 100
Base: �1� respondents
Table ��: Type of Accommodation Needed
Number PercentageSocial Housing (NIHE/HA) 133 30
Do not need accommodation 120 27Grouped accommodation 86 19
Serviced site 84 19Transit site <5 1
Other <5 <1No response/Refusal 21 5
Total ��� 100Base: ��� respondents
Travellers’ accommodaTion Needs Assessment in Northern Ireland 2008
�2
Travellers’ accommodaTion Needs Assessment in Northern Ireland 2008
Table ��: Where do you need accommodation?
Number PercentageBelfast 80 26
Craigavon 49 16Dungannon 38 12
Newry & Mourne 34 11Derry/Londonderry 34 11
Armagh 32 10Ballymena 11 4
Magherafelt 6 2Cookstown 5 2
Other 6 2Don’t know <5 <1
No response/Refusal 12 4Total �0� 100
Base: �0� respondents
Table ��: Accommodation preferences crosstabulated by current accommodation (Traveller households in need of accommodation throughout Northern Ireland)
Preferred Accommodation Current Accommodation Frequency
Grouped Accommodation
Serviced Site 38Transit Site 6
Unauthorised Site 5Privately Owned 7Privately Rented 6
Social Housing (NIHE/HA) 21Total ��
Serviced Site
Transit Site 11Co-operated Site 17Unauthorised Site 23Privately Rented 2
Social Housing (NIHE/HA) 4Total ��
Transit Site Unauthorised Site 2Social Housing (NIHE/HA) 1
Total �
Settled Accommodation
Serviced Site 18Transit Site 4
Privately Owned 7Privately Rented 24
Other 4Total ��
Other Serviced Site 2Total 2
All households 202

Travellers’ accommodaTion Needs Assessment in Northern Ireland 2008Travellers’ accommodaTion Needs Assessment in Northern Ireland 2008 Travellers’ accommodaTion Needs Assessment in Northern Ireland 2008
��
Table ��: Accommodation preferences crosstabulated by current accommodation (Traveller households in need of accommodation - Belfast area)
Preferred Accommodation Current Accommodation Frequency
Grouped Accommodation
Serviced Site 25Transit Site 5
Unauthorised Site 1Privately Owned 5
Social Housing (NIHE/HA) 9Total ��
Serviced SiteTransit Site 6
Co-operated Site 12Unauthorised Site 1
Total 1�Transit Site Social Housing (NIHE/HA) 1
Settled AccommodationServiced Site 3
Privately Owned 1Total �
All households ��
Table ��: Accommodation preferences crosstabulated by current accommodation (Traveller households in need of accommodation - Craigavon area)
Preferred Accommodation Current Accommodation Frequency
Grouped AccommodationUnauthorised Site 1Privately Rented 2Social Housing 2
Total �
Serviced Site
Transit Site 5Co-operated Site 3Unauthorised Site 22Privately Rented 1
Social Housing (NIHE/HA) 2Total ��
Transit Site Unauthorised Site 2Settled Accommodation Privately Rented 1
All households �1

Travellers’ accommodaTion Needs Assessment in Northern Ireland 2008
��
Travellers’ accommodaTion Needs Assessment in Northern Ireland 2008
Table �0: Accommodation preferences crosstabulated by current accommodation (Traveller households in need of accommodation - Dungannon area)
Preferred Accommodation Current Accommodation Frequency
Grouped Accommodation
Serviced Site 13Privately Owned 2Privately Rented 1
Social Housing (NIHE/HA) 2Total 1�
Settled Accommodation
Serviced Site 5Privately Owned 2Privately Rented 2
Other 2Total 11
Other Serviced Site 2All households �1
Table �1: Accommodation preferences crosstabulated by current accommodation (Traveller households in need of accommodation - Derry/Londonderry area)
Preferred Accommodation Current Accommodation Frequency
Grouped AccommodationTransit Site 1
Privately Rented 2Total �
Settled AccommodationServiced Site 10Transit Site 4
Total 1�All households 1�
Table �2: Are any family members to be accommodated with you currently…
Yes NoNo
Response/Refusal TotalNo. % No. % No. % No. %
living with other relatives or carers? 10 2 409 91 30 7 449 100travelling? 9 2 409 91 31 7 449 100
in other accommodation (including hospital, penal institution,
long-term care)?7 2 434 96 8 2 449 100
Base: ��� respondents

Travellers’ accommodaTion Needs Assessment in Northern Ireland 2008Travellers’ accommodaTion Needs Assessment in Northern Ireland 2008 Travellers’ accommodaTion Needs Assessment in Northern Ireland 2008
��
Table ��: Number of People Accommodated with HRP
Number PercentageNone 86 19
One 59 13Two 60 13
Three or more 212 47No response /Refusal 32 7
Total ��� 100Base: ��� Respondents
Table ��: Do you expect any members of your household to seek their own accommodation in the next three years?
Number PercentageYes 90 20No 336 75
No response /Refusal 23 5Total ��� 100
Base: ��� respondents
Table ��: Number of family members expected to seek their own accommodation in next three years
Number PercentageOne 59 66Two 22 24
Three or more 9 10Total �0 100
Base: �0 respondents

Travellers’ accommodaTion Needs Assessment in Northern Ireland 2008
��
Table ��: Important Issues facing the Travelling community
Number PercentageAccommodation issues 207 48Discrimination/Racism 154 35
Employment/Jobs 125 29School/Education 71 16
Poor health 61 14Poor living conditions 47 11
Facilities related 32 7Other comments 99 23
No response/Refusal 66 15Base: ��� respondents who gave ��2 comments
Table ��: Further Comments
Number PercentageAccommodation related comments e.g. ‘Need proper housing’ 134 43
No accommodation needs 60 19Would like Group Housing 26 8
Health/Disability related comments e.g. ‘Poor health’ 20 6Facilities related comments e.g. ‘Play area needed’ 17 5
Better living conditions needed 9 3Other comments 59 19
No response/Refusal 72 23Base: �1� respondents who gave ��� further comments

Photograph: Mural designed by Travellers’ Support Group Project.
www.nihe.gov.ukNovember 2008 CS
/354
/11/
08