Nicaragua Family Planning Market Segmentation Analysis · 1 Reported in Instituto Nacional de...
41
Prepared for the Enhancing Equity and Sustainability of Public-Sector Family Planning project February 2013 Nicaragua Family Planning Market Segmentation Analysis
-
Upload
truongminh -
Category
Documents
-
view
215 -
download
1
Transcript of Nicaragua Family Planning Market Segmentation Analysis · 1 Reported in Instituto Nacional de...
Prepared for the Enhancing
Equity and Sustainability of
Public-Sector Family
Planning project
February 2013
Nicaragua Family Planning Market Segmentation Analysis
Acknowledgments This document was written by Dr. William Winfrey of the Futures Institute and Yann Lacayo of PATH on behalf of the Enhancing Equity and Sustainability of Public-Sector Family Planning project at PATH. This work was funded in whole by a grant from the Fred H. Bixby Foundation. Copyright © 2013, Program for Appropriate Technology in Health (PATH). All rights reserved. The material in this document may be freely used for educational or noncommercial purposes, provided that the material is accompanied by an acknowledgment line. Suggested citation: Winfrey W, Lacayo Y. Nicaragua Family Planning Market Segmentation Analysis. Seattle: PATH; 2013. Contact information Mailing address PO Box 900922 Seattle, WA 98109 USA
Street address 2201 Westlake Avenue, Suite 200 Seattle, WA 98121 USA
[email protected] www.path.org

1
TABLE OF CONTENTS
List of Tables ................................................................................................................................... 2
List of Figures .................................................................................................................................. 3
Acronyms ......................................................................................................................................... 4
Chapter 1. Introduction .................................................................................................................... 5
Chapter 2. Data and Methods ........................................................................................................... 7 A. Data ..................................................................................................................................... 7 B. Indicator of social economic status ..................................................................................... 8
Chapter 3. Use of family planning according to wealth status ...................................................... 11 A. Use of family planning methods by wealth status ............................................................ 11 B. First use of family planning versus resupply or follow-up ............................................... 15 C. Results by region ............................................................................................................... 18
Chapter 4. Attitudes and impressions about family planning service delivery .............................. 20 A. Impressions concerning service delivery .......................................................................... 20 B. Autonomy and choice of service-delivery point ............................................................... 22 C. Attitudes and impressions about family planning service delivery based on
socioeconomic status ........................................................................................................ 23
Chapter 5. Alternative scenarios of future family planning use ..................................................... 30 A. Description of method ....................................................................................................... 30 B. Results: Addressing the wealthy ....................................................................................... 32 C. Results: Expanding scope of social security ..................................................................... 33 D. Profiles .............................................................................................................................. 35
Chapter 6. Recommendations ........................................................................................................ 37 A. Private business sector ...................................................................................................... 37 B. Public Sector—MINSA .................................................................................................... 38 C. NGOs and Social Marketing ............................................................................................. 38 D. Nicaraguan Institute of Social Security (INSS) ................................................................ 39

2
LIST OF TABLES
Table 1: Family planning method mix comparison (excluding sterilization), ENDSA 2006/07 and PATH 2011 ................................................................................................................. 8
Table 2: Calculated monthly household income disaggregated by wealth quintile, PATH 2011 and Futures Institute calculations ...................................................................................... 9
Table 3: Socio-demographic characteristics disaggregated by wealth status, PATH 2011 and Futures Institute calculations ........................................................................................... 10
Table 4: Use of family planning methods and source of family disaggregated by wealth status ............................................................................................................... 11
Table 5: Use of family planning methods and source of family disaggregated by wealth status and method of family planning ....................................................................................... 13
Table 6: Use of family planning methods and source of family disaggregated by wealth status, first time to obtain method, and most recent time to receive services............................. 14
Table 7: Source of initial family planning visit versus source for subsequent visits ..................... 15 Table 8: Source of initial family planning versus source for subsequent visits
(wealthiest quintile) ......................................................................................................... 16 Table 9: Source of initial family planning versus source for subsequent visits
(public versus private) ..................................................................................................... 17 Table 10: Wealth status across four aggregated regions of Nicaragua .......................................... 18 Table 11: Use of family planning across four aggregated regions of Nicaragua ........................... 19 Table 12: Initial service delivery points across regions of Nicaragua ........................................... 19 Table 13: Transportation, waiting time, and impressions of quality
by service-delivery point ................................................................................................. 21 Table 14: Overall impressions by service-delivery point .............................................................. 22 Table 15: Autonomy and choice of service delivery ..................................................................... 22 Table 16: Autonomy and choice of service delivery among women living in
the wealthiest 40 percent of households .......................................................................... 23 Table 17: Number of sources known for family planning services ............................................... 24 Table 18: Reasons for choosing a method or changing a method for
family planning services .................................................................................................. 25 Table 19: Observations regarding prices paid ................................................................................ 26 Table 20: Opinions about future purchases .................................................................................... 27 Table 21: Observations about the most recent service received .................................................... 28 Table 22: Decision-making across socioeconomic status .............................................................. 29 Table 23: Percent of family planning users shifted from public-sector sources to private
sources for service delivery ............................................................................................. 30 Table 24: Projected family planning use, various surveys, and extrapolation
by Futures Institute .......................................................................................................... 31 Table 25: Projected family planning use ........................................................................................ 32 Table 26: Numbers of women accessing the public sector for their family planning methods,
Futures Institute calculations ........................................................................................... 32 Table 27: Numbers of commodities needed by the public sector to fulfill demand, Futures
Institute calculations ........................................................................................................ 33
3
Table 28: Commodity procurement costs to the public sector to fulfill demand (US$), Futures Institute calculations ........................................................................................................ 33
Table 29: Percent of family planning users potentially covered by social security ....................... 34 Table 30: Numbers of women using the public sector or EMP under different scenarios of
social security coverage .................................................................................................. 34 Table 31: Commodity procurement costs to the public sector to fulfill demand (US$), Futures
Institute calculations ........................................................................................................ 35
LIST OF FIGURES
Figure 1: Trend in the use of family planning in Nicaragua, ESF 1992/93, ENDESA 1998, 2001, and 2006/07 ............................................................................................................. 5
Figure 2: Distribution across SDPs ................................................................................................ 31
4
ACRONYMS
APEO Estrategia de Anticoncepción Post Evento Obstétrico (Strategy for Post-Obstetric Event Contraception)
DAIA Disponibilidad Asegurado de Insumos Anticonceptivos (Contraceptive
Supply Security)
ECMAC Estrategia Comunitaria para el Manejo de Anticonceptivos (Community
Strategy for Contraceptive Management)
EMP Empresa Medica Previsional (private social security clinic)
ENDESA Encuesta Nicaragüense de Demografía y Salud (Nicaraguan Demographic
and Health Survey)
FP family planning
INIDE Instituto Nacional de Información de Desarrollo (National Institute of
Development Information)
INSS Instituto Nicaragüense de Seguridad Social (Nicaraguan Social Security Institute)
IUD intrauterine device
MINSA Ministerio de Salud (Ministry of Health)
NGO nongovernmental organization
PASMO Pan American Social Marketing Organization
PATH Program for Appropriate Technology in Health
RAAN Región Autónoma Atlántico Norte (Autonomous Region of the Northern
Atlantic)
SDP service delivery point
SS social security
5
CHAPTER 1. INTRODUCTION
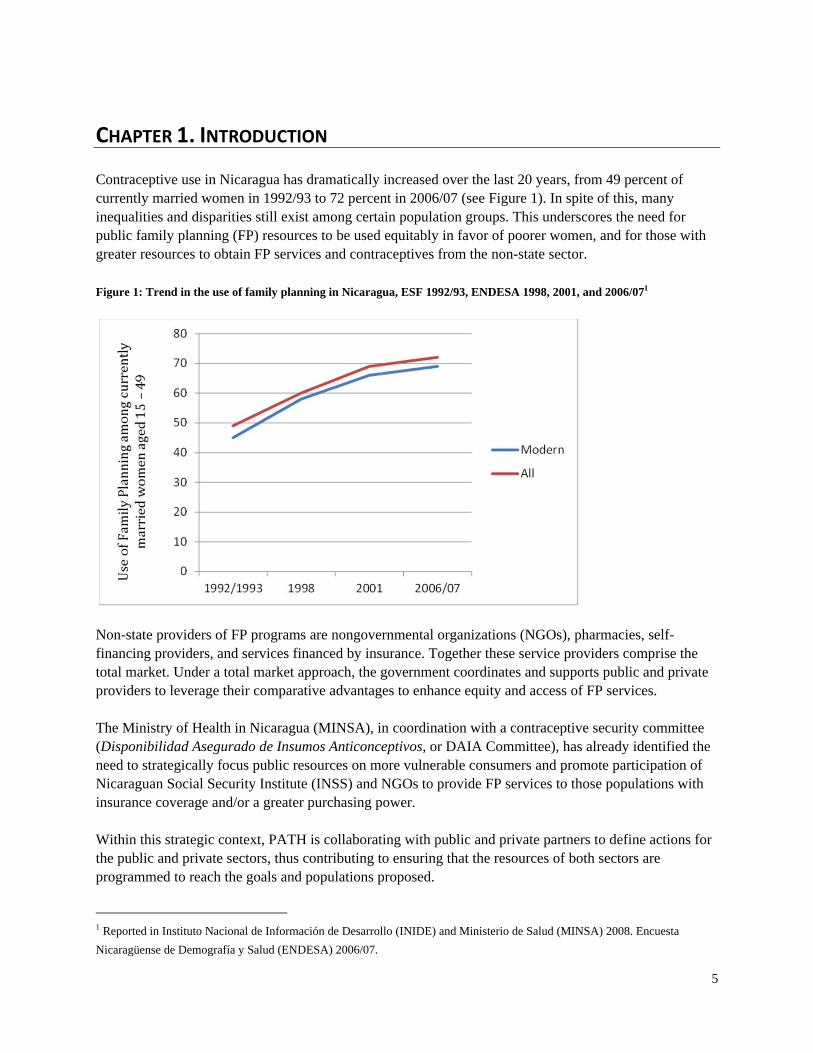
Contraceptive use in Nicaragua has dramatically increased over the last 20 years, from 49 percent of currently married women in 1992/93 to 72 percent in 2006/07 (see Figure 1). In spite of this, many inequalities and disparities still exist among certain population groups. This underscores the need for public family planning (FP) resources to be used equitably in favor of poorer women, and for those with greater resources to obtain FP services and contraceptives from the non-state sector. Figure 1: Trend in the use of family planning in Nicaragua, ESF 1992/93, ENDESA 1998, 2001, and 2006/071
Non-state providers of FP programs are nongovernmental organizations (NGOs), pharmacies, self-financing providers, and services financed by insurance. Together these service providers comprise the total market. Under a total market approach, the government coordinates and supports public and private providers to leverage their comparative advantages to enhance equity and access of FP services. The Ministry of Health in Nicaragua (MINSA), in coordination with a contraceptive security committee (Disponibilidad Asegurado de Insumos Anticonceptivos, or DAIA Committee), has already identified the need to strategically focus public resources on more vulnerable consumers and promote participation of Nicaraguan Social Security Institute (INSS) and NGOs to provide FP services to those populations with insurance coverage and/or a greater purchasing power. Within this strategic context, PATH is collaborating with public and private partners to define actions for the public and private sectors, thus contributing to ensuring that the resources of both sectors are programmed to reach the goals and populations proposed.
1 Reported in Instituto Nacional de Información de Desarrollo (INIDE) and Ministerio de Salud (MINSA) 2008. Encuesta
Nicaragüense de Demografía y Salud (ENDESA) 2006/07.

6
A deliberate analysis of users’ needs and behaviors regarding contraceptive method use and service-delivery point preferences is crucial to develop and implement program strategies and create an action plan for different providers. This includes matching types of FP providers with population groups, developing a plan to transfer public-sector users to the private sector, exploring how MINSA can focus on prioritized populations (such as the rural and adolescent populations), and at the same time determining what obstacles hinder the private sector from participating more broadly in delivering FP services, or impacting well-developed awareness-building strategies and advocacy for this sector. This document will contribute to a multi-dimensional segmentation of the FP market in Nicaragua by highlighting not only demographic and economic variations, but also group differences in values, beliefs, and attitudes, all of which are key drivers of FP demand and use and help clarify why users choose a particular provider over others. The present study segments private- and public-sector users of FP in Nicaragua into different subgroups, each with its own profile, and makes recommendations about how targeting strategies can best incorporate this information to effectively target and meet the needs of different groups.

7
CHAPTER 2. DATA AND METHODS
A. Data
This report uses a survey of 2,410 current FP users in Nicaragua. The survey used a random sampling of national households. In each selected household, a roster of women aged 18–49 in the household was created. From the roster, a random woman was chosen to participate in the survey. The questions in the survey included the following topics:
Social and demographic characteristics. Household income and assets. Past and current FP use. Future intentions concerning FP use. Details of FP services and the users’ opinions of them. Information on FP beliefs and myths. Women’s sense of autonomy.
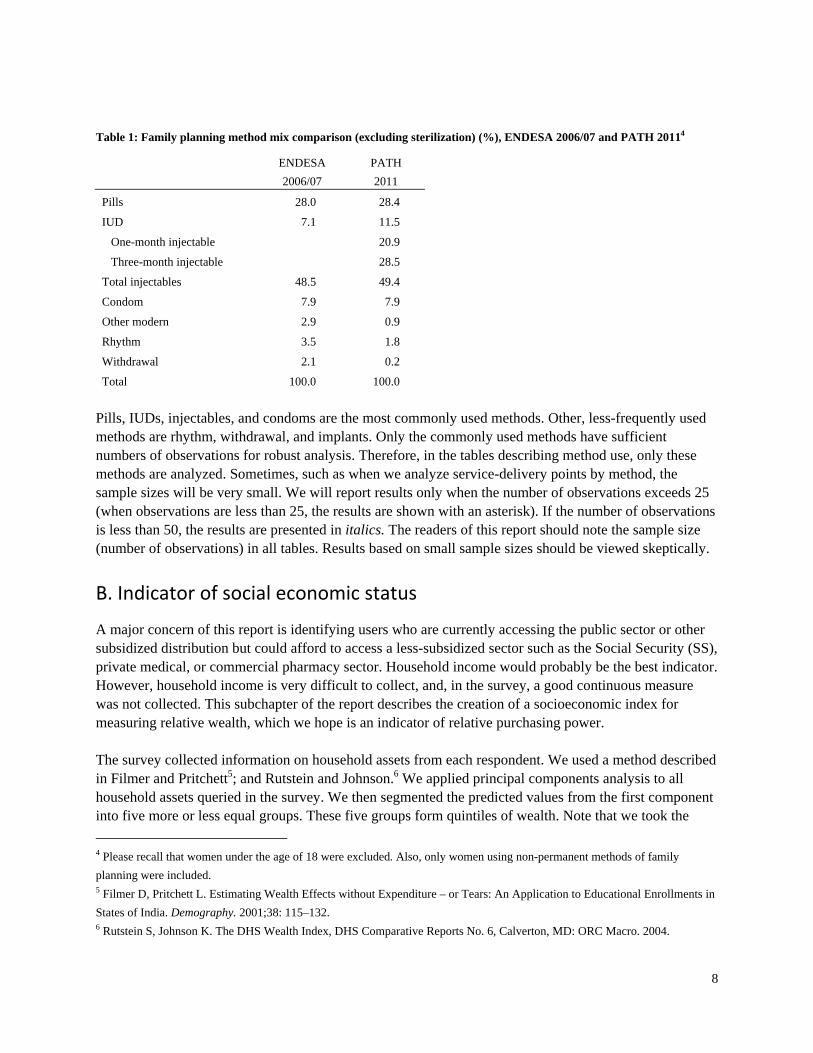
The survey sampling selected only women who were currently using an FP method other than sterilization. Those who were sterilized were not included in the survey because in most cases, they will not need further FP services. The tabulations presented here are done with the responses as they exist in the dataset. In all cases, we present the number of observations contributing to a particular tabulation. Table 1 presents a comparison of the method mix found in the most recent Nicaragua Reproductive Health Survey in 2006/07 (ENDESA 06/07)2 to the results of this survey. Given that the two surveys used significantly different sampling techniques,3 the results are surprisingly close. The distribution of pills, injectables, and condoms among users is almost exactly the same. Intrauterine devices (IUDs) show a significant difference (7.1 ENDESA versus 11.5 PATH).
2 Instituto Nacional de Información de Desarrollo (INIDE) and Ministerio de Salud (MINSA) 2008. Encuesta Nicaragüense de
Demografía y Salud (ENDESA) 2006/07. 3 Among other things, adolescents were excluded and only women using non-permanent methods of family planning were
included.
8
Table 1: Family planning method mix comparison (excluding sterilization) (%), ENDESA 2006/07 and PATH 20114
ENDESA
2006/07
PATH
2011
Pills 28.0 28.4
IUD 7.1 11.5
One-month injectable 20.9
Three-month injectable 28.5
Total injectables 48.5 49.4
Condom 7.9 7.9
Other modern 2.9 0.9
Rhythm 3.5 1.8
Withdrawal 2.1 0.2
Total 100.0 100.0
Pills, IUDs, injectables, and condoms are the most commonly used methods. Other, less-frequently used methods are rhythm, withdrawal, and implants. Only the commonly used methods have sufficient numbers of observations for robust analysis. Therefore, in the tables describing method use, only these methods are analyzed. Sometimes, such as when we analyze service-delivery points by method, the sample sizes will be very small. We will report results only when the number of observations exceeds 25 (when observations are less than 25, the results are shown with an asterisk). If the number of observations is less than 50, the results are presented in italics. The readers of this report should note the sample size (number of observations) in all tables. Results based on small sample sizes should be viewed skeptically.
B. Indicator of social economic status
A major concern of this report is identifying users who are currently accessing the public sector or other subsidized distribution but could afford to access a less-subsidized sector such as the Social Security (SS), private medical, or commercial pharmacy sector. Household income would probably be the best indicator. However, household income is very difficult to collect, and, in the survey, a good continuous measure was not collected. This subchapter of the report describes the creation of a socioeconomic index for measuring relative wealth, which we hope is an indicator of relative purchasing power. The survey collected information on household assets from each respondent. We used a method described in Filmer and Pritchett5; and Rutstein and Johnson.6 We applied principal components analysis to all household assets queried in the survey. We then segmented the predicted values from the first component into five more or less equal groups. These five groups form quintiles of wealth. Note that we took the
4 Please recall that women under the age of 18 were excluded. Also, only women using non-permanent methods of family
planning were included. 5 Filmer D, Pritchett L. Estimating Wealth Effects without Expenditure – or Tears: An Application to Educational Enrollments in
States of India. Demography. 2001;38: 115–132. 6 Rutstein S, Johnson K. The DHS Wealth Index, DHS Comparative Reports No. 6, Calverton, MD: ORC Macro. 2004.

9
additional step of disaggregating the wealthiest quintile into two more or less equal-sized groups. These two groups are referred to as the ninth and the tenth deciles. As a point of comparison, we also calculated a measure of household income based upon the declared income of the respondent and her partner (if available). Table 2 presents levels of income according to the wealth quintile. The proportion of women living in households with very low income (<1,000 Cordoba per month) is largest among the poorest quintiles and smallest among the richest quintile. The reverse is true for the income category of greater than 3,750 Cordoba per month. Also reported in Table 2 is place of work. The women in the wealthiest quintile are twice as likely to work outside the home as the women in the poorest quintile. This is another indication that wealthier women are perhaps more appropriately served by private or commercial providers. Table 2: Calculated monthly household income disaggregated by wealth quintile (%), PATH 2011
Lowest
wealth
quintile Second Third Fourth
Ninth
decile
Tenth
decile
All
respondents
Household monthly income
<= 1,000 Cordobas 78.6 75.3 62.7 61.9 60.7 51.9 66.8
>1,000 Cord. & <=3,750 Cord. 18.1 17.0 21.3 21.4 16.5 22.6 19.4
>3,750 Cordobas 3.4 7.8 16.1 16.7 22.7 25.6 13.8
Number of observations 443 477 423 430 242 266 2,281
Place of work
In the house 80.1 72.7 70.0 68.4 62.5 60.1 70.32
Outside the house 15.4 21.4 24.5 26.5 27.4 34.9 23.94
Both 3.4 5.5 5.2 4.6 9.7 5.0 5.25
Student 0.0 0.2 0.2 0.0 0.4 0.0 0.13
Does not work 1.1 0.2 0.0 0.5 0.0 0.0 0.36
Number of observations 441 476 420 415 237 258 2,247
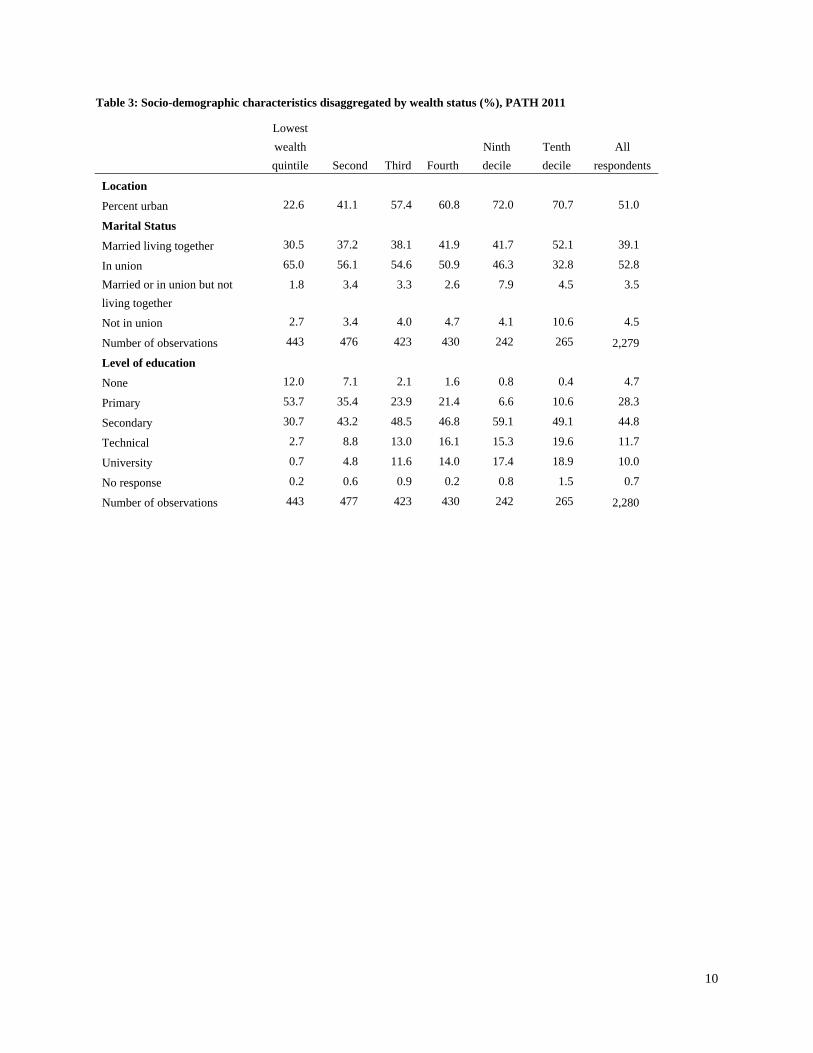
Table 3 shows disaggregations of location, education attainment, and marital status. The wealthier women are much more likely to be in urban areas than either the poor or middle-wealth women. Wealthier women have much higher levels of education and are more likely to have a legally formalized status of marriage. On the other hand, there is not much difference in the percent of women who are in unions across the wealth statuses.
10
Table 3: Socio-demographic characteristics disaggregated by wealth status (%), PATH 2011
Lowest
wealth
quintile Second Third Fourth
Ninth
decile
Tenth
decile
All
respondents
Location
Percent urban 22.6 41.1 57.4 60.8 72.0 70.7 51.0
Marital Status
Married living together 30.5 37.2 38.1 41.9 41.7 52.1 39.1
In union 65.0 56.1 54.6 50.9 46.3 32.8 52.8
Married or in union but not
living together
1.8 3.4 3.3 2.6 7.9 4.5 3.5
Not in union 2.7 3.4 4.0 4.7 4.1 10.6 4.5
Number of observations 443 476 423 430 242 265 2,279
Level of education
None 12.0 7.1 2.1 1.6 0.8 0.4 4.7
Primary 53.7 35.4 23.9 21.4 6.6 10.6 28.3
Secondary 30.7 43.2 48.5 46.8 59.1 49.1 44.8
Technical 2.7 8.8 13.0 16.1 15.3 19.6 11.7
University 0.7 4.8 11.6 14.0 17.4 18.9 10.0
No response 0.2 0.6 0.9 0.2 0.8 1.5 0.7
Number of observations 443 477 423 430 242 265 2,280
11
CHAPTER 3. USE OF FAMILY PLANNING ACCORDING TO WEALTH STATUS
A. Use of family planning methods by wealth status
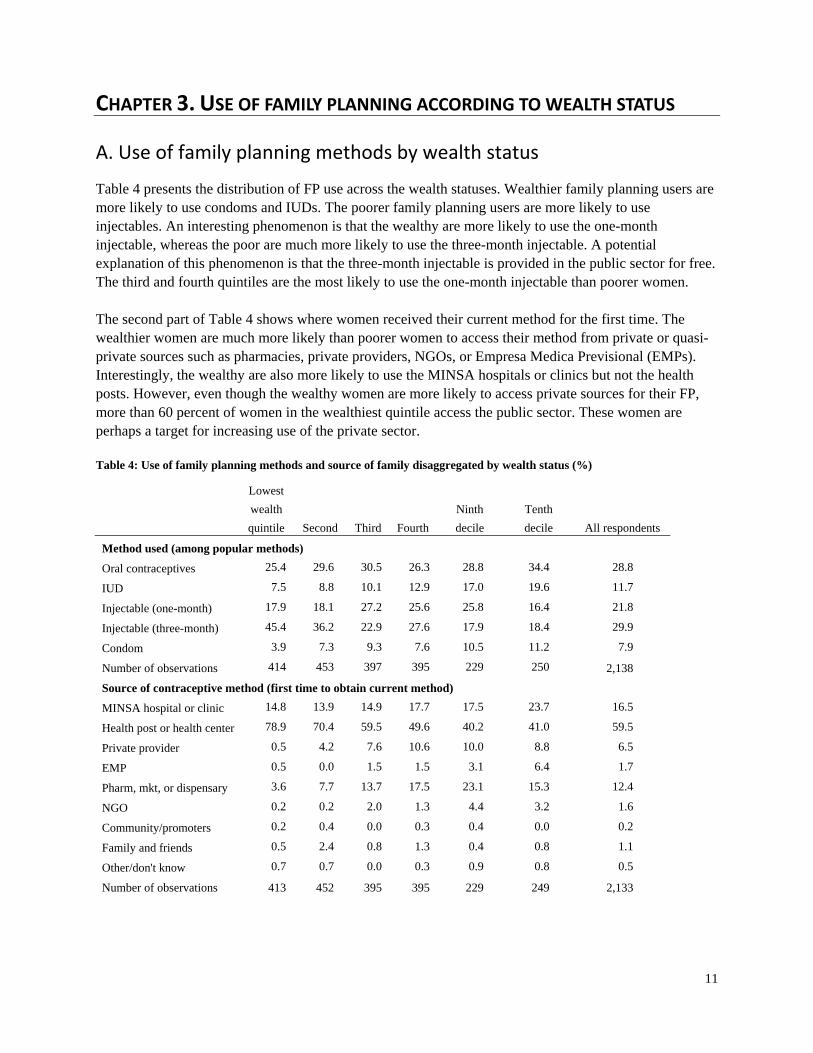
Table 4 presents the distribution of FP use across the wealth statuses. Wealthier family planning users are more likely to use condoms and IUDs. The poorer family planning users are more likely to use injectables. An interesting phenomenon is that the wealthy are more likely to use the one-month injectable, whereas the poor are much more likely to use the three-month injectable. A potential explanation of this phenomenon is that the three-month injectable is provided in the public sector for free. The third and fourth quintiles are the most likely to use the one-month injectable than poorer women. The second part of Table 4 shows where women received their current method for the first time. The wealthier women are much more likely than poorer women to access their method from private or quasi-private sources such as pharmacies, private providers, NGOs, or Empresa Medica Previsional (EMPs). Interestingly, the wealthy are also more likely to use the MINSA hospitals or clinics but not the health posts. However, even though the wealthy women are more likely to access private sources for their FP, more than 60 percent of women in the wealthiest quintile access the public sector. These women are perhaps a target for increasing use of the private sector. Table 4: Use of family planning methods and source of family disaggregated by wealth status (%)
Lowest
wealth
quintile Second Third Fourth
Ninth
decile
Tenth
decile All respondents
Method used (among popular methods)
Oral contraceptives 25.4 29.6 30.5 26.3 28.8 34.4 28.8
IUD 7.5 8.8 10.1 12.9 17.0 19.6 11.7
Injectable (one-month) 17.9 18.1 27.2 25.6 25.8 16.4 21.8
Injectable (three-month) 45.4 36.2 22.9 27.6 17.9 18.4 29.9
Condom 3.9 7.3 9.3 7.6 10.5 11.2 7.9
Number of observations 414 453 397 395 229 250 2,138
Source of contraceptive method (first time to obtain current method)
MINSA hospital or clinic 14.8 13.9 14.9 17.7 17.5 23.7 16.5
Health post or health center 78.9 70.4 59.5 49.6 40.2 41.0 59.5
Private provider 0.5 4.2 7.6 10.6 10.0 8.8 6.5
EMP 0.5 0.0 1.5 1.5 3.1 6.4 1.7
Pharm, mkt, or dispensary 3.6 7.7 13.7 17.5 23.1 15.3 12.4
NGO 0.2 0.2 2.0 1.3 4.4 3.2 1.6
Community/promoters 0.2 0.4 0.0 0.3 0.4 0.0 0.2
Family and friends 0.5 2.4 0.8 1.3 0.4 0.8 1.1
Other/don't know 0.7 0.7 0.0 0.3 0.9 0.8 0.5
Number of observations 413 452 395 395 229 249 2,133

12
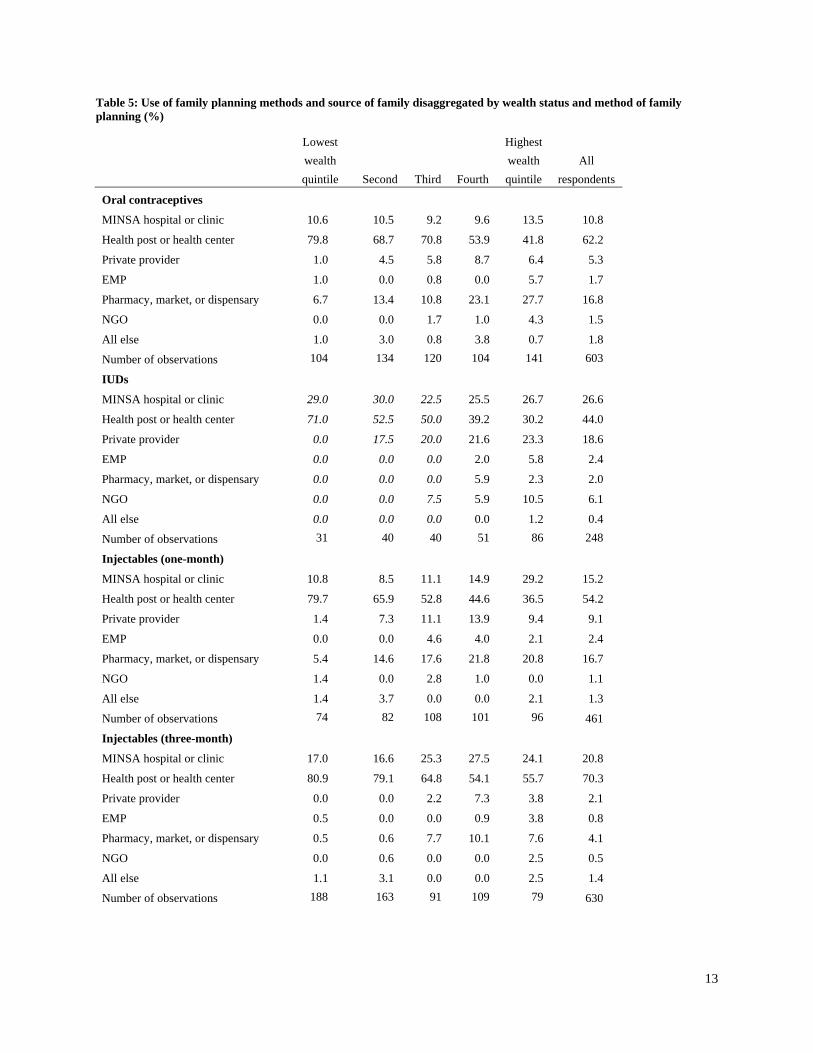
Table 4 obscures some important information. The source of supply for a particular method of contraception is frequently contingent upon the method. Table 5 presents the service-delivery point of distribution for oral contraceptives, IUDs, and injectables (disaggregated by one-month and three-month). The market for pills includes an important component for the private sector for the fourth quintile and the wealthiest quintile. More than 40 percent of users received their initial services from the private sector (including EMPs). This is a strong indication that the private sector could play an even larger role for the market for oral contraceptives. The private sector again plays an important role for the market of IUDs for the fourth quintile and the wealthiest quintiles. In contrast to oral contraceptives, the private providers have a larger share of the market than the pharmacies.7 Further expansion of the private sector share of IUD provision would need to be by NGOs and EMPs. The one-month injectable and the three-month injectable markets have an interesting contrast. For all wealth statuses, the public sector is overwhelmingly the main provider of the three-month injectable. On the other hand, the one-month injectable has many users in the private sector, including pharmacies and private providers in the wealthier groups of women.
7 This is not a surprising result since IUDs cannot be inserted except in clinical settings. We also note that the most aggressive
efforts of expanding use of IUDs are being made by NGOs such as the Pan American Social Marketing Organization (PASMO).
13
Table 5: Use of family planning methods and source of family disaggregated by wealth status and method of family planning (%)
Lowest
wealth
quintile Second Third Fourth
Highest
wealth
quintile
All
respondents
Oral contraceptives
MINSA hospital or clinic 10.6 10.5 9.2 9.6 13.5 10.8
Health post or health center 79.8 68.7 70.8 53.9 41.8 62.2
Private provider 1.0 4.5 5.8 8.7 6.4 5.3
EMP 1.0 0.0 0.8 0.0 5.7 1.7
Pharmacy, market, or dispensary 6.7 13.4 10.8 23.1 27.7 16.8
NGO 0.0 0.0 1.7 1.0 4.3 1.5
All else 1.0 3.0 0.8 3.8 0.7 1.8
Number of observations 104 134 120 104 141 603
IUDs
MINSA hospital or clinic 29.0 30.0 22.5 25.5 26.7 26.6
Health post or health center 71.0 52.5 50.0 39.2 30.2 44.0
Private provider 0.0 17.5 20.0 21.6 23.3 18.6
EMP 0.0 0.0 0.0 2.0 5.8 2.4
Pharmacy, market, or dispensary 0.0 0.0 0.0 5.9 2.3 2.0
NGO 0.0 0.0 7.5 5.9 10.5 6.1
All else 0.0 0.0 0.0 0.0 1.2 0.4
Number of observations 31 40 40 51 86 248
Injectables (one-month)
MINSA hospital or clinic 10.8 8.5 11.1 14.9 29.2 15.2
Health post or health center 79.7 65.9 52.8 44.6 36.5 54.2
Private provider 1.4 7.3 11.1 13.9 9.4 9.1
EMP 0.0 0.0 4.6 4.0 2.1 2.4
Pharmacy, market, or dispensary 5.4 14.6 17.6 21.8 20.8 16.7
NGO 1.4 0.0 2.8 1.0 0.0 1.1
All else 1.4 3.7 0.0 0.0 2.1 1.3
Number of observations 74 82 108 101 96 461
Injectables (three-month)
MINSA hospital or clinic 17.0 16.6 25.3 27.5 24.1 20.8
Health post or health center 80.9 79.1 64.8 54.1 55.7 70.3
Private provider 0.0 0.0 2.2 7.3 3.8 2.1
EMP 0.5 0.0 0.0 0.9 3.8 0.8
Pharmacy, market, or dispensary 0.5 0.6 7.7 10.1 7.6 4.1
NGO 0.0 0.6 0.0 0.0 2.5 0.5
All else 1.1 3.1 0.0 0.0 2.5 1.4
Number of observations 188 163 91 109 79 630
14
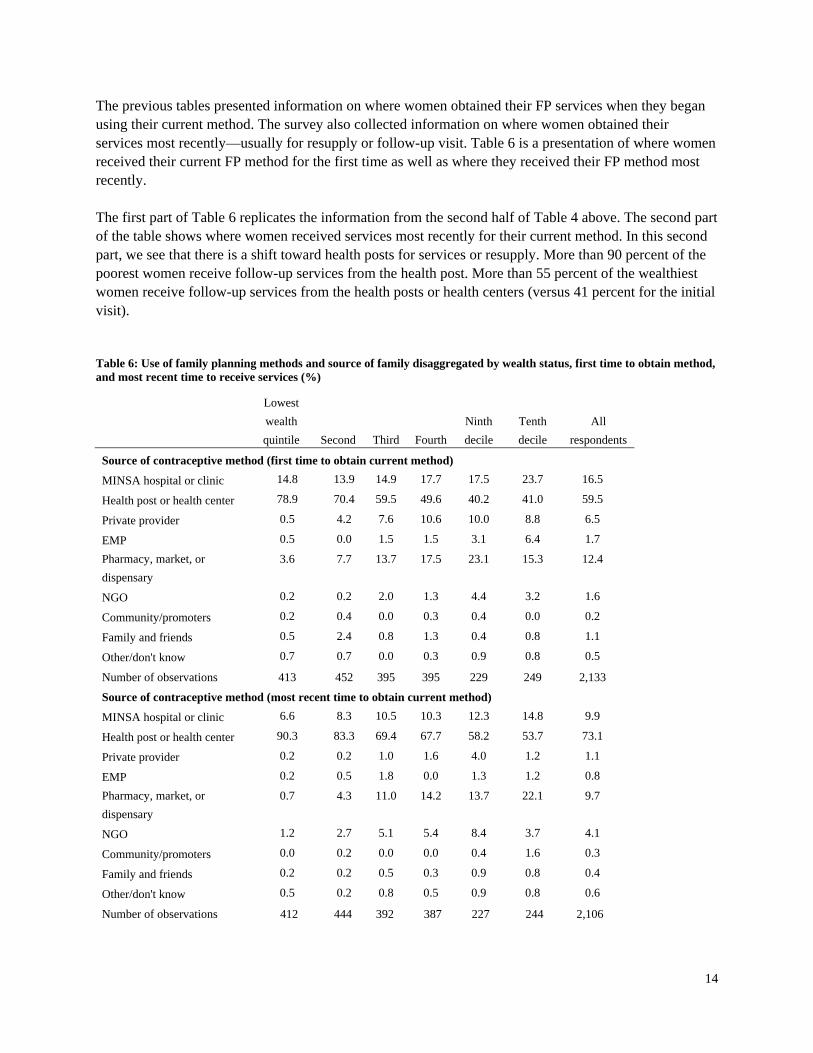
The previous tables presented information on where women obtained their FP services when they began using their current method. The survey also collected information on where women obtained their services most recently—usually for resupply or follow-up visit. Table 6 is a presentation of where women received their current FP method for the first time as well as where they received their FP method most recently. The first part of Table 6 replicates the information from the second half of Table 4 above. The second part of the table shows where women received services most recently for their current method. In this second part, we see that there is a shift toward health posts for services or resupply. More than 90 percent of the poorest women receive follow-up services from the health post. More than 55 percent of the wealthiest women receive follow-up services from the health posts or health centers (versus 41 percent for the initial visit). Table 6: Use of family planning methods and source of family disaggregated by wealth status, first time to obtain method, and most recent time to receive services (%)
Lowest
wealth
quintile Second Third Fourth
Ninth
decile
Tenth
decile
All
respondents
Source of contraceptive method (first time to obtain current method)
MINSA hospital or clinic 14.8 13.9 14.9 17.7 17.5 23.7 16.5
Health post or health center 78.9 70.4 59.5 49.6 40.2 41.0 59.5
Private provider 0.5 4.2 7.6 10.6 10.0 8.8 6.5
EMP 0.5 0.0 1.5 1.5 3.1 6.4 1.7
Pharmacy, market, or
dispensary
3.6 7.7 13.7 17.5 23.1 15.3 12.4
NGO 0.2 0.2 2.0 1.3 4.4 3.2 1.6
Community/promoters 0.2 0.4 0.0 0.3 0.4 0.0 0.2
Family and friends 0.5 2.4 0.8 1.3 0.4 0.8 1.1
Other/don't know 0.7 0.7 0.0 0.3 0.9 0.8 0.5
Number of observations 413 452 395 395 229 249 2,133
Source of contraceptive method (most recent time to obtain current method)
MINSA hospital or clinic 6.6 8.3 10.5 10.3 12.3 14.8 9.9
Health post or health center 90.3 83.3 69.4 67.7 58.2 53.7 73.1
Private provider 0.2 0.2 1.0 1.6 4.0 1.2 1.1
EMP 0.2 0.5 1.8 0.0 1.3 1.2 0.8
Pharmacy, market, or
dispensary
0.7 4.3 11.0 14.2 13.7 22.1 9.7
NGO 1.2 2.7 5.1 5.4 8.4 3.7 4.1
Community/promoters 0.0 0.2 0.0 0.0 0.4 1.6 0.3
Family and friends 0.2 0.2 0.5 0.3 0.9 0.8 0.4
Other/don't know 0.5 0.2 0.8 0.5 0.9 0.8 0.6
Number of observations 412 444 392 387 227 244 2,106

15
B. First use of family planning versus resupply or follow‐up
Table 6 perhaps obscures important information about exactly who is moving where. For example, we see that there are more women using the health posts for follow-up services, but we do not know where these women received their initial services. Table 7 presents a cross tabulation of the source for the first service with the source for the most recent visit for the FP method. Look first at the upper left-hand corner of table 7 where 33.4 is highlighted in gray. This cell indicates that 33.4 percent of women who obtained their initial services from MINSA facilities returned there for follow-up services. The cell immediately below (58.4) indicates that 58.4 percent of the women who received their initial services from MINSA went to a health post for follow-up services. Among women who initially went to private providers, almost 30 percent (21.0 health post and 8.4 MINSA) went to the public sector for follow up or resupply. These women are probably receiving misdirected public subsidies. More than 45 percent of women who initially went to pharmacies went to the public sector for resupply (6.7 MINSA and 40.4 health post). Any woman who initially went to the private sector and then followed up by going to the public sector is probably a good candidate for re-orienting toward the private sector. Translated into numbers of women, this is approximately 45,000 women out of the approximately 520,000 women who would be using non-permanent modern FP methods in 2015.8 Table 7: Source of initial family planning visit versus source for subsequent visits (%)
Initial source of supply for current method of family planning
MINSA
hospital or
clinic
Health
post or
health
center
Private
provider EMP
Pharmacy,
market, or
dispensary NGO
Most recent source of supply or services
MINSA hospital or clinic 33.4 4.5 8.4 5.3 6.7 5.9
Health post or health center 58.4 91.8 21.0 5.3 40.4 23.5
Private provider 0.6 0.4 2.8 0.0 0.7 35.3
EMP 0.0 0.2 4.9 0.0 1.8 8.8
Pharmacy, market, or dispensary 5.5 1.5 60.8 76.3 22.8 5.9
NGO 1.9 1.1 1.4 13.2 22.8 14.7
Community/promoters 0.0 0.1 0.0 0.0 1.1 5.9
Family and friends 0.0 0.3 0.0 0.0 1.8 0.0
Other/don't know 0.3 0.2 0.7 0.0 2.1 0.0
Number of observations 365 1321 143 38 285 34.0
8 This calculation is an extrapolation from the calculations made in Chapter 5 of this report.

16
Table 8 is the same as Table 7, except that it is only for the wealthiest quintile of women (i.e., the ninth and tenth deciles combined). In spite of a greater ability to pay than in the general population, we see very similar patterns to that in the table above. Women who initially went to the pharmacy are quite likely to shift to other sources that are subsidized, including the health posts and the NGOs. Seventy-five percent of the women who started at the pharmacies went somewhere else for their return visits. Although not presented here, if we look at the resupply methods (pills and both types of injectables), a similar pattern is observed. Of the women who first obtained their method at a pharmacy, only about 25 percent of them returned to the pharmacy for their most recent resupply. Table 8: Source of initial family planning versus source for subsequent visits (wealthiest quintile) (%)
Initial source of supply for current method of family planning
MINSA
hospital or
clinic
Health
post or
health
center
Private
provider
Pharmacy,
market, or
dispensary
Most recent source of supply or services
MINSA hospital or clinic 46.2 3.4 7.5 3.5
Health post or health center 40.9 91.6 5.0 37.7
Private provider 1.1 0.6 2.5 0.0
EMP 0.0 1.1 5.0 2.4
Pharmacy, market, or dispensary 10.8 1.7 75.0 25.9
NGO 0.0 1.1 2.5 22.4
Community/promoters 0.0 0.6 0.0 2.4
Family and friends 0.0 0.0 0.0 4.7
Other/don't know 1.1 0.0 2.5 1.2
Number of observations 93 179 40 85
Table 9 aggregates all of the private service-delivery categories into a single category, and all of the public categories into a single category. We then present a cross tabulation of where the women receive their initial services versus where they receive subsequent services. This is all disaggregated by wealth status. We have highlighted the most important cells in the table. If all women accessing the private sector for their initial services returned for subsequent services, these cells would be 0. However, we see across all wealth statuses at least 30 percent—and sometimes as much as 60 percent—of the women who at first accessed the private sector obtained their subsequent services in the public sector.

17
Table 9: Source of initial family planning versus source for subsequent visits (public versus private) (%)
Service-delivery
point first accessed
Public Private
Most recent service-delivery point
accessed
Poorest quintile
Public 98.8 58.6
Private 1.2 41.4
Total 100 100
Number of observations 411 29
Second quintile
Public 96.0 61.4
Private 4.1 38.6
Total 100 100
Number of observations 395 70
Third quintile
Public 93.5 40.2
Private 6.5 59.8
Total 100 100
Number of observations 309 102
Fourth quintile
Public 92.8 48.3
Private 7.3 51.8
Total 100 100
Number of observations 276 143
Ninth decile
Public 95.6 40.2
Private 4.4 59.8
Total 100 100
Number of observations 137 102
Tenth or wealthiest decile
Public 91.0 30.4
Private 9.0 69.6
Total 100 100
Number of observations 166 92

18
C. Results by region
Use of family planning varies considerably by region. For example, in the 2006/07 Reproductive Health Survey, only 55.9 percent of women in Region Autónoma Atlántico Norte (RAAN) used a modern method, whereas 77.1 percent of women in Rió San Juan used a modern method. This subsection will provide a brief perspective on the results by the country’s regions. The regions vary considerably by economic status. Table 10 presents the distribution of wealth status disaggregated by region. Almost 45 percent of women interviewed in Managua are in the 20 percent of wealthiest households. At the opposite end of the spectrum, less than ten percent of women in Centro live in the highest wealth quintile households. In fact, the majority (about 53 percent) of women in both the Centro region and the Pacifico region live in households among the two poorest quintiles. This relative poverty may make it difficult to expand efforts to increase the use of the private sector for FP services in these regions. Table 10: Wealth status across four aggregated regions of Nicaragua (%)
Pacifico Managua Centro Caribe Total
Poorest 22.2 3.6 31.2 10.8 19.4
Second 30.8 9.7 22.8 14.1 20.9
Third 15.1 17.7 20.5 25.4 18.5
Fourth 15.3 24.2 16.9 22.7 18.9
Second-highest decile 8.7 18.8 5.5 12.4 10.6
Highest decile 7.9 26.1 3.1 14.6 11.7
Number of observations 675 617 804 185 2,281
Table 11 disaggregates the use of FP by the four regions. Managua is the only region where the use of the one-month injectable exceeds the use of the three-month injectable. In each of the other three regions, use of the three-month injectable exceeds the use of the one-month injectable. In Caribe region, use of the three-month injectable is double the use of the one-month injectable, and overall use of injectables is almost ten percent higher than in any other region. Use of IUDs as a percent of the method mix is highest in Managua, where it is more than double that in Centro. Mobilization of private medical providers in Managua to provide a comprehensive set of methods could be a useful strategy. If a woman chooses an IUD, the provider could insert it. If a woman chooses a resupply method, the private provider could work with pharmacies to assure that the product is available so that clients can fill prescriptions.

19
Table 11: Use of family planning across four aggregated regions of Nicaragua (%)
Pacifico Managua Centro Caribe Total
Oral contraceptives 27.9 28.3 31.8 25.8 29.2
IUD 12.7 17.3 7.1 10.1 11.8
Injectable (one-month) 18.9 25.2 21.7 18.5 21.6
Injectable (three-month) 30.3 19.6 33.2 42.1 29.3
Condom 10.2 9.7 6.1 3.4 8.1
Number of observations 667 619 798 178 2,262
Table 12 presents the distribution of where women receive their initial services across the regions of Nicaragua. About 75 to 80 percent of women in the Pacifico, Centro, and Caribe regions receive their initial services from the public sector (either MINSA hospitals/clinics or health posts/centers). A smaller percent (64) of FP users in Managua access the public sector for their initial services. In the Caribe region, there is the interesting phenomenon that 40.7 percent of FP users access hospital or clinic services. This is more than double that in any other region. Given that most FP services (especially resupply methods) are best supplied by health posts or centers, this is an area for further assessment since it appears to be an inefficient use of clinical resources. Although Managua is by far the wealthiest of the regions, there is not a large difference between the use of the private sector by women in Managua and women in the other three regions. Urban Managua could be a target of opportunity for the private sector. Table 12: Initial service delivery points across regions of Nicaragua (%)
Pacifico Managua Centro Caribe Total
MINSA hospital or clinic 13.1 17.6 12.6 40.7 16.3
Health post or health center 67.4 46.7 66.5 34.5 58.8
Private provider 4.5 9.9 4.8 9.6 6.5
EMP 0.8 4.5 0.6 0.0 1.7
Pharmacy, market, or dispensary 10.2 17.8 11.9 14.7 13.3
NGO 1.2 2.1 1.8 0.6 1.6
Community/promoters 0.2 0.0 0.5 0.0 0.2
Family and friends 1.8 1.0 1.1 0.0 1.2
Other/don't know 0.9 0.5 0.3 0.0 0.5
Number of observations 665 619 796 177 2,257

20
CHAPTER 4. ATTITUDES AND IMPRESSIONS ABOUT FAMILY PLANNING SERVICE DELIVERY
This chapter presents information about differences in attitudes and service-delivery access based on the service-delivery option that a woman has chosen. This is potentially important information, useful for re-orienting women toward a more economically rational use of services.
A. Impressions concerning service delivery
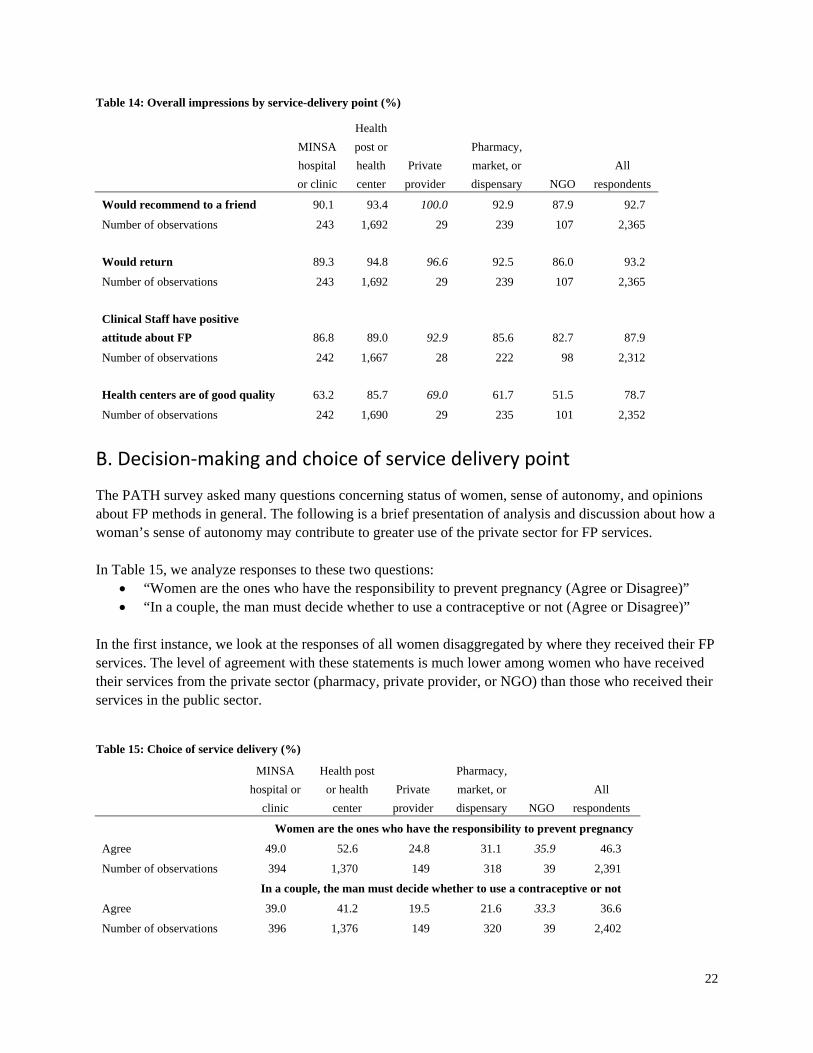
Table 13 presents information about specific aspects of service delivery disaggregated by service-delivery point. Users of health posts or health centers most frequently arrive at services by walking. Pharmacies, private providers, and MINSA are disproportionately accessed by urban women and relatively wealthy women. Not surprisingly, these women are likely to use private vehicles or public transportation to access these services. It is important to note that when plans are made to potentially re-orient women from the public sector to the private sector, these services must be reasonably accessible. Table 13 shows that the health posts/centers have a relatively long waiting time. The pharmacies and private providers seem to have the shortest waiting times. Surprisingly, the pharmacies are cited as having the best quality of FP information. Again, this may be useful for steering current users of the public sector to the private sector. Quality of privacy seems to be better at the private providers and pharmacies. More than 90 percent of the women using pharmacies for their last services said that privacy was good or very good. Shorter wait times and perceived quality services could be cited as advantages that attract consumers. Table 14 presents general impressions of services according to service-delivery point. The first three questions in the table do not offer much differentiation by service-delivery point. Between 90 and 100 percent of women using each type of service delivery say that they will return. Furthermore this same proportion would recommend their current service delivery outlet to a friend. There is a large difference in perceptions of quality for the health centers/posts. Eighty-five percent of the women who actually go to health centers say that the quality is good. On the other hand, less than 70 percent of women accessing other sources say that health centers have high-quality services. Emphasis of the quality of services at private facilities or pharmacies may be useful to attracting clients. Note, however, that the public sector should continue to provide the highest-quality services possible. Differentiations in quality should be restricted to quality associated with amenities, not associated with the quality of the medical services. Examples of amenity-based quality might include shorter waiting times, more comfortable waiting rooms, etc.

21
Table 13: Transportation, waiting time, and impressions of quality by service-delivery point (%)
MINSA
hospital
or
clinic
Health
post or
health
center
Private
provider
Pharmacy,
market, or
dispensary NGO
All
respondents
Mode of transportation to service-delivery point
Foot 36.1 72.1 31.0 17.8 72.6 61.59
Horseback 2.9 2.9 0.0 0.4 0.0 2.42
Public transport 47.1 19.7 37.9 51.7 18.9 26.46
Private vehicle 10.5 3.5 27.6 28.8 6.6 7.61
Bicycle 2.9 1.4 0.0 0.0 0.9 1.36
Other 0.4 0.4 3.5 1.3 0.9 0.6
Number of observations 238 1,688 29 236 106 2,351
Waiting time
Rapid 40.3 29.4 44.8 48.5 66.4 35.05
Acceptable 23.9 38.2 27.6 32.6 15.9 34.5
Very slow 28.0 29.0 6.9 14.6 10.3 26
No response 7.8 3.4 20.7 4.2 7.5 4.44
Number of observations 243 1,692 29 239 107 2,365
Quality of FP information
Very poor 5.37 0.89 0 1.28 2.97 1.45
Poor 2.07 3.07 10.34 0.85 2.97 2.76
Okay 12.81 17.67 13.79 8.51 11.88 15.7
Good 66.53 68.97 68.97 55.32 59.41 66.95
Very good 13.2 9.4 6.9 34.0 22.8 13.14
Number of observations 242 1,692 29 235 101 2,351
Quality of privacy
Very poor 5.8 2.5 13.8 0.4 7.5 3.04
Poor 6.6 5.3 0.0 2.5 3.7 4.9
Okay 10.7 19.1 10.3 3.4 21.5 16.28
Good 54.3 63.1 41.4 54.0 44.9 59.79
Very good 22.2 9.9 34.5 38.1 13.1 15.1
No response 0.4 0.1 0.0 1.7 9.4 0.89
Number of observations 243 1,692 29 239 107 2,365
22
Table 14: Overall impressions by service-delivery point (%)
MINSA
hospital
or clinic
Health
post or
health
center
Private
provider
Pharmacy,
market, or
dispensary NGO
All
respondents
Would recommend to a friend 90.1 93.4 100.0 92.9 87.9 92.7
Number of observations 243 1,692 29 239 107 2,365
Would return 89.3 94.8 96.6 92.5 86.0 93.2
Number of observations 243 1,692 29 239 107 2,365
Clinical Staff have positive
attitude about FP 86.8 89.0 92.9 85.6 82.7 87.9
Number of observations 242 1,667 28 222 98 2,312
Health centers are of good quality 63.2 85.7 69.0 61.7 51.5 78.7
Number of observations 242 1,690 29 235 101 2,352
B. Decision‐making and choice of service delivery point
The PATH survey asked many questions concerning status of women, sense of autonomy, and opinions about FP methods in general. The following is a brief presentation of analysis and discussion about how a woman’s sense of autonomy may contribute to greater use of the private sector for FP services. In Table 15, we analyze responses to these two questions:
“Women are the ones who have the responsibility to prevent pregnancy (Agree or Disagree)” “In a couple, the man must decide whether to use a contraceptive or not (Agree or Disagree)”
In the first instance, we look at the responses of all women disaggregated by where they received their FP services. The level of agreement with these statements is much lower among women who have received their services from the private sector (pharmacy, private provider, or NGO) than those who received their services in the public sector. Table 15: Choice of service delivery (%)
MINSA
hospital or
clinic
Health post
or health
center
Private
provider
Pharmacy,
market, or
dispensary NGO
All
respondents
Women are the ones who have the responsibility to prevent pregnancy
Agree 49.0 52.6 24.8 31.1 35.9 46.3
Number of observations 394 1,370 149 318 39 2,391
In a couple, the man must decide whether to use a contraceptive or not
Agree 39.0 41.2 19.5 21.6 33.3 36.6
Number of observations 396 1,376 149 320 39 2,402

23
A potential problem with the analysis above is that the private providers are most frequently chosen by wealthy women and that wealthy women are also the women most likely to express a sense of their own responsibility. To partially correct for this bias, in Table 16 we have done this analysis only for the wealthiest two quintiles of women. Here, we see that the pattern is repeated after controlling for wealth status of the household that the women live in. Therefore, campaigns to promote private services could target these women with messages emphasizing their sense of responsibility for family planning. In addition, the FP program in general could make larger efforts to build self-confidence and sense of responsibility as part of the efforts to promote FP. Table 16: Choice of service delivery among women living in the wealthiest 40 percent of households (%)
MINSA
hospital
or
clinic
Health
post or
health
center
Private
provider
Pharmacy,
market, or
dispensary NGO
All
respondents
Women are the ones who have the responsibility to prevent pregnancy
Agree 42.7 41.5 18.2 27.6 * 36.0
Number of observations 171 390 88 175 23 909
In a couple, the man must decide whether to use a contraceptive or not
Agree 31.6 32.8 18.2 23.3 * 29.8
Number of observations 171 390 88 176 23 910
* observations < 25
C. Attitudes and impressions about family planning service delivery based on socioeconomic status
Differences exist across socioeconomic groups that may be important for understanding the FP market. In this section, we examine various attitudes about FP disaggregated by wealth status. Wealthier women are more aware of the availability of FP services. In Table 17, we show the number of FP providers known to a woman; 36.3 percent of the wealthiest women know about locations of four or more FP providers, whereas only 11.5 percent of the poorest women know about four or more provider locations. This is perhaps indicative that messages targeted at wealthier women can be oriented toward in-depth information. We also note in Table 17 that almost 64 percent of the wealthiest women know of a private commercial provider for FP services, whereas only about 33 percent of the poorest women know of such a provider. This is perhaps indicative that promoters of commercial services can concentrate on explaining why their services are beneficial as opposed to raising awareness that they exist.

24
Table 17: Number of sources known for family planning services (%)
Poorest Second Third Fourth Richest All women
Number of sources for FP known
0 0.7 1.1 1.9 1.4 0.2 1.0
1 39.7 32.1 26.2 23.0 19.5 28.1
2 31.6 27.0 24.4 28.1 21.8 26.5
3 16.5 16.8 18.4 21.4 22.2 19.1
4 or more 11.5 23.1 29.1 26.1 36.3 25.3
Number of observations 443 477 423 430 482 2,255
Percent who know at least one
private source 32.9 43.8 51.8 59.6 63.9 50.5
Number of observations 443 477 423 430 482 2,255
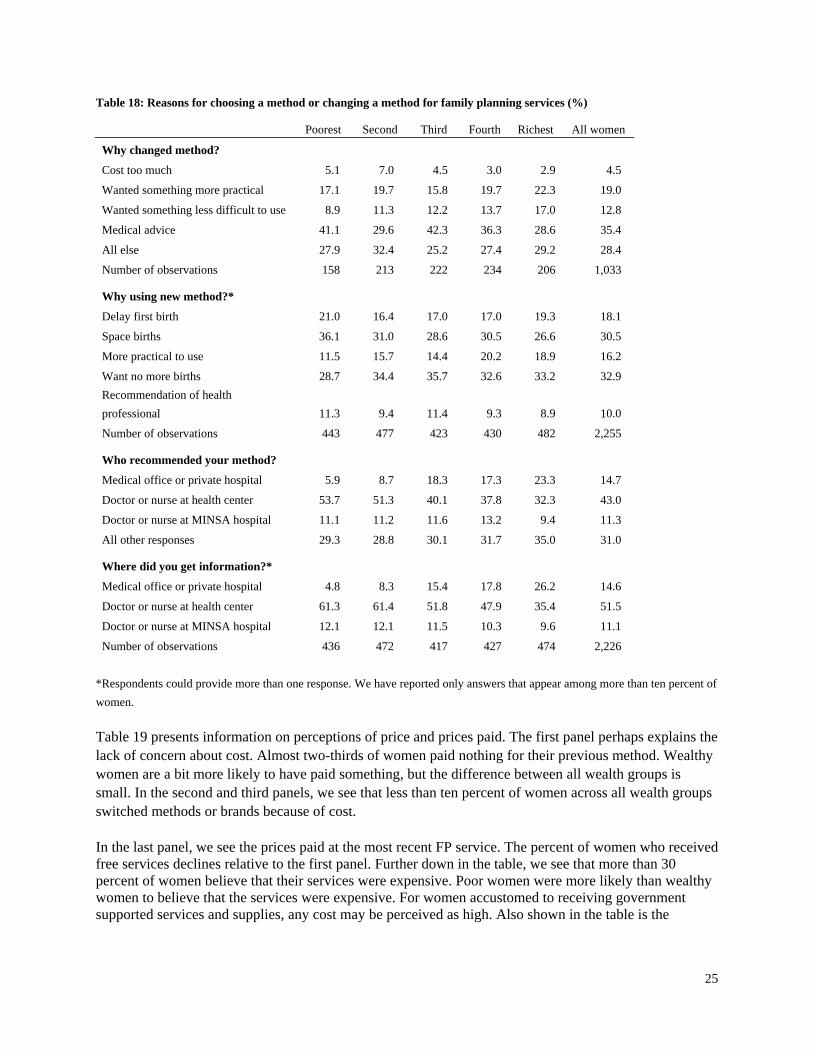
Table 18 provides information on why or how women decide upon services or methods of FP. In the first panel of the table, we see that the wealthier women who changed method were looking for practicality and ease of use for their method more often than poorer women. The wealthy women also seem less likely to depend upon the advice of medical personnel. This might be indicative of an independence of opinion. We also note here that less than ten percent of all groups of women mention cost as a reason for changing. The second panel of Table 18 describes motivations for using a particular FP method. The table shows that wealthier women are more likely to want no more children. Again, they are more likely to seek out methods they perceive as more practical. The last two panels of the table describe where women receive recommendations and information for FP services. Here, we see that the recommendations and information more or less mirror what we saw above in terms of service delivery. Wealthier women are much more likely to receive their information from private providers than poorer women.
25
Table 18: Reasons for choosing a method or changing a method for family planning services (%)
Poorest Second Third Fourth Richest All women
Why changed method?
Cost too much 5.1 7.0 4.5 3.0 2.9 4.5
Wanted something more practical 17.1 19.7 15.8 19.7 22.3 19.0
Wanted something less difficult to use 8.9 11.3 12.2 13.7 17.0 12.8
Medical advice 41.1 29.6 42.3 36.3 28.6 35.4
All else 27.9 32.4 25.2 27.4 29.2 28.4
Number of observations 158 213 222 234 206 1,033
Why using new method?*
Delay first birth 21.0 16.4 17.0 17.0 19.3 18.1
Space births 36.1 31.0 28.6 30.5 26.6 30.5
More practical to use 11.5 15.7 14.4 20.2 18.9 16.2
Want no more births 28.7 34.4 35.7 32.6 33.2 32.9
Recommendation of health
professional 11.3 9.4 11.4 9.3 8.9 10.0
Number of observations 443 477 423 430 482 2,255
Who recommended your method?
Medical office or private hospital 5.9 8.7 18.3 17.3 23.3 14.7
Doctor or nurse at health center 53.7 51.3 40.1 37.8 32.3 43.0
Doctor or nurse at MINSA hospital 11.1 11.2 11.6 13.2 9.4 11.3
All other responses 29.3 28.8 30.1 31.7 35.0 31.0
Where did you get information?*
Medical office or private hospital 4.8 8.3 15.4 17.8 26.2 14.6
Doctor or nurse at health center 61.3 61.4 51.8 47.9 35.4 51.5
Doctor or nurse at MINSA hospital 12.1 12.1 11.5 10.3 9.6 11.1
Number of observations 436 472 417 427 474 2,226
*Respondents could provide more than one response. We have reported only answers that appear among more than ten percent of
women.
Table 19 presents information on perceptions of price and prices paid. The first panel perhaps explains the lack of concern about cost. Almost two-thirds of women paid nothing for their previous method. Wealthy women are a bit more likely to have paid something, but the difference between all wealth groups is small. In the second and third panels, we see that less than ten percent of women across all wealth groups switched methods or brands because of cost. In the last panel, we see the prices paid at the most recent FP service. The percent of women who received free services declines relative to the first panel. Further down in the table, we see that more than 30 percent of women believe that their services were expensive. Poor women were more likely than wealthy women to believe that the services were expensive. For women accustomed to receiving government supported services and supplies, any cost may be perceived as high. Also shown in the table is the

26
observation that wealthy women have more recently obtained resupply of FP. This is probably because the poorer women are more likely to use three-month injectables that require less frequent resupply.9
Table 19: Observations regarding prices paid (%)
Poorest Second Third Fourth Richest All women
How much paid for their current method at the initial service visit? (Cordobas)
0 71.1 71.1 61.9 57.9 58.7 64.2
>=1 & <20 1.4 3.8 3.8 7.0 6.4 4.5
>=20 & <80 4.7 12.4 14.0 12.8 13.5 11.5
>=80 & <120 22.8 10.7 16.3 13.7 12.5 15.1
>=120 & <200 0.0 1.1 1.9 4.0 3.1 2.0
>=200 0.0 1.1 2.1 4.7 5.8 2.8
Number of observations 443 477 423 430 482 2,255
Had to buy another brand because
of lack of money 6.9 8.9 10.3 8.9 10.6 9.2
Number of observations 335 417 361 372 417 1,902
Had to change methods because of
lack of money 7.1 6.8 7.6 6.6 6.8 6.9
Number of observations 325 412 357 363 415 1,872
What did you pay the last time you purchased? (Cordobas)
0 68.2 67.1 57.2 51.9 47.5 58.4
>=1 & <20 21.9 12.8 14.0 14.2 10.6 14.6
>=20 & <80 8.6 14.5 16.1 17.4 18.1 14.9
>=80 & <120 1.4 3.6 6.6 4.4 7.7 4.8
>=120 & <200 0.0 1.3 3.3 7.2 5.4 3.4
>=200 0.0 0.8 2.8 4.9 10.8 4.0
Number of observations 443 477 423 430 482 2,255
Less than one week ago 3.5 11.6 16.7 15.1 13.3 12.8
Between two weeks and one month 23.8 29.8 37.2 30.2 34.0 31.7
More than one month 67.1 55.1 42.3 53.0 48.9 52.0
Don’t know 4.9 2.0 2.3 1.3 1.6 2.2
No response 0.7 1.5 1.4 0.4 2.3 1.4
Number of observations 143 198 215 232 309 1,097
How was the price?
Expensive 38.5 34.9 32.4 24.8 28.0 31.0
Number of observations 182 252 259 282 343 1,318
9 The authors verified in the data that the users of three-month injectables were more likely than other resupply-method users to
have received their last resupply more than a month ago.

27
The PATH survey also asked women questions concerning future choices about methods and service delivery. In the first panel of Table 20, we see that the wealthy women are less likely to say that they are not going to change their method. This orientation is perhaps indicative of receptiveness toward trying or using the private sector. The third panel of Table 20 asked women where they would like to receive a new method. Women across all wealth groupings would like to see the method at public services rather than private or commercial services. The next panel shows that women are most interested in finding a source nearby. In this regard, it might be useful to encourage an expansion of the numbers of facilities or pharmacies that offer FP methods. The last panel of the table offers some indications relative to price. Across all wealth groups, 80–120 Cordobas seems to be an almost universal price point that people would accept. Interestingly, 16.4 percent of the wealthiest women are willing to pay more than 200 Cordobas.
Table 20: Opinions about future purchases (%)
Poorest Second Third Fourth Richest All women
If you decided to change methods, what would the reason be?*
Medical advice 15.0 14.0 16.5 17.0 20.1 16.6
To get sterilized 10.6 14.2 14.8 15.3 11.7 13.3
Would not change 52.7 43.2 41.5 39.9 38.7 43.1
Number of observations 406 444 400 419 463 2,132
Why have you not changed?*
The current method is practical 17.0 15.8 11.5 10.7 8.5 12.5
Uncertainty 15.8 15.1 11.7 17.8 10.5 14.1
Not sure 24.9 21.7 23.9 27.3 31.7 26.1
Number of observations 230 278 253 270 296 1,327
Where would you like to see it available?
Hospital MINSA 16.8 19.7 23.5 20.6 29.2 22.0
Health Center 35.1 37.7 35.8 36.3 44.2 37.9
Health Post 28.6 24.4 16.0 16.7 15.8 20.4
Pharmacy 4.6 13.1 10.9 12.5 15.6 11.4
Number of observations 393 407 357 359 404 1,920
Number of observations 355 440 389 393 453 2,030
Why at that place?
Proximity 74.5 71.8 66.7 65.3 58.1 67.2
All other responses 25.5 28.2 33.3 34.8 42.0 32.8
Number of observations 439 471 417 423 472 2,222
What is the most you would be willing to pay? (Cordobas)
0 10.2 10.3 7.6 8.8 6.2 8.6
>=1 & <20 3.2 5.0 6.9 4.4 4.2 4.7
>=20 & <80 19.6 19.1 22.9 22.8 18.9 20.6
>=80 & <120 66.1 61.2 53.9 49.8 50.8 56.4
>=120 & <200 0.5 2.5 2.8 4.2 3.5 2.7
>=200 0.5 1.9 5.9 10.0 16.4 7.0
Number of observations 443 477 423 430 482 2,255
*Respondents could provide more than one response. We have reported only answers that appear among more than ten percent of women.

28
Table 21 offers observations about the most recent services received. The first two panels show that the wealthier women have an easier time obtaining services. Nearly 85 percent of the wealthiest women say that the services are close, versus 70.9 percent of the poorest. On the other hand, the waiting times appear to be about the same across the wealth groups. In the third panel of the table, we see that the wealthy women are more likely to receive a prescription than the poorest group. Among the poorest group, women are more likely to have received the method of their choice at the point of services. At the bottom of the table, we see that more than 90 percent of women across all of the wealth groups liked their services and would recommend their provider to others. Table 21: Observations about the most recent service received (%)
Poorest Second Third Fourth Richest All women
Distance to services
Close 70.9 79.3 83.5 85.1 84.9 80.7
Far 23.9 13.0 11.8 10.5 9.8 13.8
Extremely far 4.1 5.0 1.9 1.6 1.9 2.9
Don't know 1.1 2.7 2.8 2.8 3.5 2.6
Number of observations 443 477 423 430 482 2,255
Time to wait
Less than half an hour 30.5 29.6 38.1 39.5 36.1 34.6
Half an hour to an hour 39.7 37.1 30.5 30.2 33.0 34.2
One to two hours 26.0 27.9 26.2 22.8 26.4 25.9
Don’t know 3.8 5.5 5.2 7.4 4.6 5.3
Number of observations 443 477 423 430 482 2,255
Result of visit
A prescription 19.6 27.5 34.9 37.2 45.0 33.0
A prescription and a sample 22.3 26.6 25.9 20.0 20.5 23.0
The method 54.1 43.5 35.9 38.9 31.7 40.7
Referral 4.1 2.0 3.1 3.9 2.6 3.1
Nothing 0.0 0.4 0.0 0.0 0.2 0.1
Other 0.0 0.0 0.3 0.0 0.0 0.1
Number of observations 418 455 390 406 464 2,133
Would recommend this provider 95.3 94.1 89.6 93.3 90.0 92.5
Would return to this provider 97.5 92.9 91.0 89.5 90.7 92.3
Number of observations 443 477 423 430 482 2,255
29
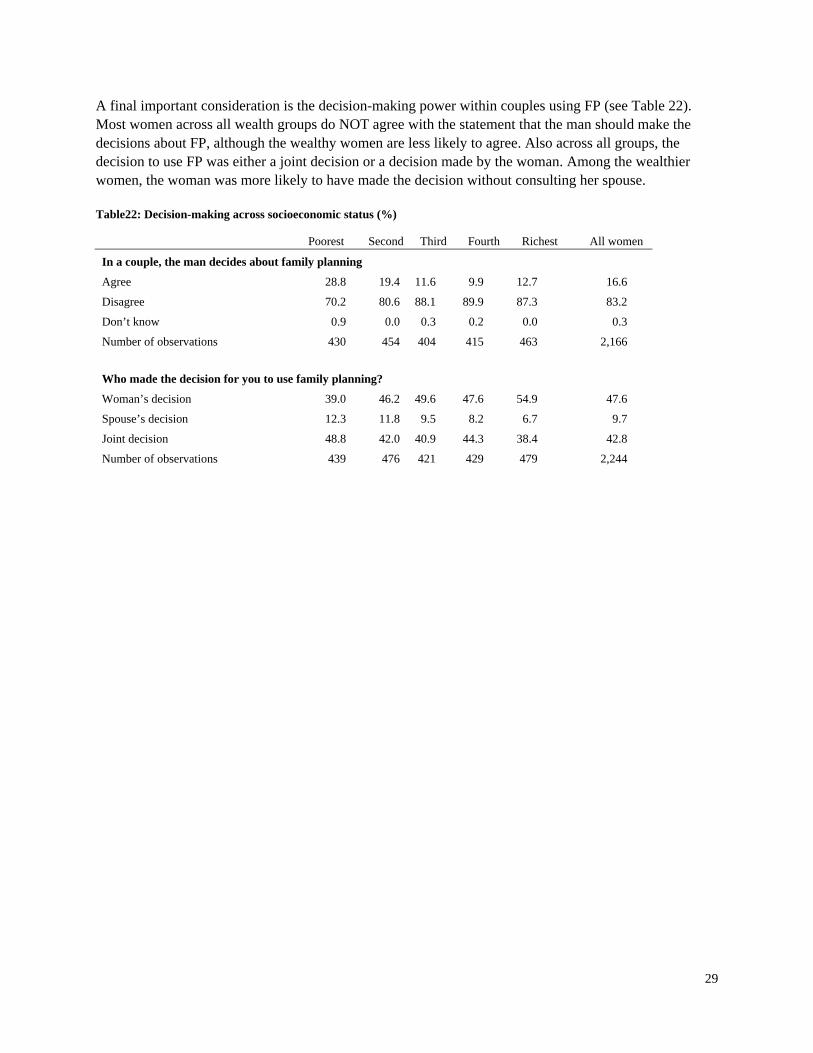
A final important consideration is the decision-making power within couples using FP (see Table 22). Most women across all wealth groups do NOT agree with the statement that the man should make the decisions about FP, although the wealthy women are less likely to agree. Also across all groups, the decision to use FP was either a joint decision or a decision made by the woman. Among the wealthier women, the woman was more likely to have made the decision without consulting her spouse. Table22: Decision-making across socioeconomic status (%)
Poorest Second Third Fourth Richest All women
In a couple, the man decides about family planning
Agree 28.8 19.4 11.6 9.9 12.7 16.6
Disagree 70.2 80.6 88.1 89.9 87.3 83.2
Don’t know 0.9 0.0 0.3 0.2 0.0 0.3
Number of observations 430 454 404 415 463 2,166
Who made the decision for you to use family planning?
Woman’s decision 39.0 46.2 49.6 47.6 54.9 47.6
Spouse’s decision 12.3 11.8 9.5 8.2 6.7 9.7
Joint decision 48.8 42.0 40.9 44.3 38.4 42.8
Number of observations 439 476 421 429 479 2,244

30
CHAPTER 5. ALTERNATIVE SCENARIOS OF FUTURE FAMILY PLANNING USE
Encouraging the use of the commercial sector by FP users with the ability to pay for such services can potentially save the MINSA valuable resources and perhaps reduce the load on MINSA service-delivery points. This chapter presents scenarios describing how commodity procurement costs could be reduced.
A. Description of method
As described above, every contraceptive has its own particular mix of service-delivery-point distribution and this mix varies depending on the wealth status of the users (see Table 4). Below, we create alternative scenarios of FP use by counterfactually shifting FP users from the public-sector services to the commercial or private sector. In these scenarios, we shift users of resupply methods from public-sector services to pharmacies. The baseline service delivery distribution of public-sector users is based upon the proportion of users whose last access of services was at MINSA facilities or health clinics/posts. IUD users are shifted from MINSA facilities or health clinics/posts to private medical services. In contrast to the resupply methods, the service-delivery mix is based upon the place where the initial services were obtained, since that is mostly likely where the IUD insertion took place. The proportions of FP users accessing other sources of FP are assumed to remain constant. Three scenarios are examined:
1. Business as usual: Service delivery distributions remain constant. 2. Moderate shifts of users to the private sector (see table 23). 3. Aggressive shifts of users to the private sector (see table 23).
Table 23: Percent of family planning users shifted from public-sector sources to private sources for service delivery
Business
as usual
Moderate
shifts to the
private sector
Aggressive
shifts to the
private sector
Percent of public-sector users shifted to the private sector
Wealthiest quintile 0 45 90
Fourth quintile 0 30 75
Third quintile 0 20 50
Second quintile 0 0 10
Poorest quintile 0 0 10

31
The numbers of FP users are estimated for 2015. The number of currently married women in 2015 is based upon a DemProj projection of women aged 15 to 49 and the proportion of women in this age group who were married or in union according to the 1998 Nicaragua Demographic and Health Survey (ENDESA). The percentage of women using FP is based upon an extrapolation of trends in method use between 2001 and 2006/07. Figure 2 and Table 24 below show the projected trends in overall use and use by method. Figure 2: Distribution across Service Delivery Points
Table 24: Projected family planning use (%)10
ENDESA
(1998)
ENDESA
(2001)
ENDESA
(2006/07)
Estimate
(2012)
Estimate
(2015)
Any 60.3 68.6 72.4 76.2 78.3
Modern 57.4 66.1 69.8 73.5 75.5
Sterilization 26.1 25.3 24.3 22.5 21.3
Pills 13.9 14.6 13.5 12.2 11.4
IUD 9.1 6.4 3.4 1.7 1.6
Injection 5.2 14.3 23.4 32.1 36.1
Condom 2.6 3.3 3.8 4.2 4.4
Other modern 0 6 1.4 0.7 0.7
Rhythm 1.6 1.5 1.7 1.6 1.6
Withdrawal 1 1 1 1.1 1.1
10 Data sourced from various ENDESA surveys and extrapolation by Futures Institute.
0
10
20
30
40
50
60
70
80
90
1996 1998 2000 2002 2004 2006 2008 2010 2012 2014 2016
Percent of currently married women
using family planning
Any
Modern
32
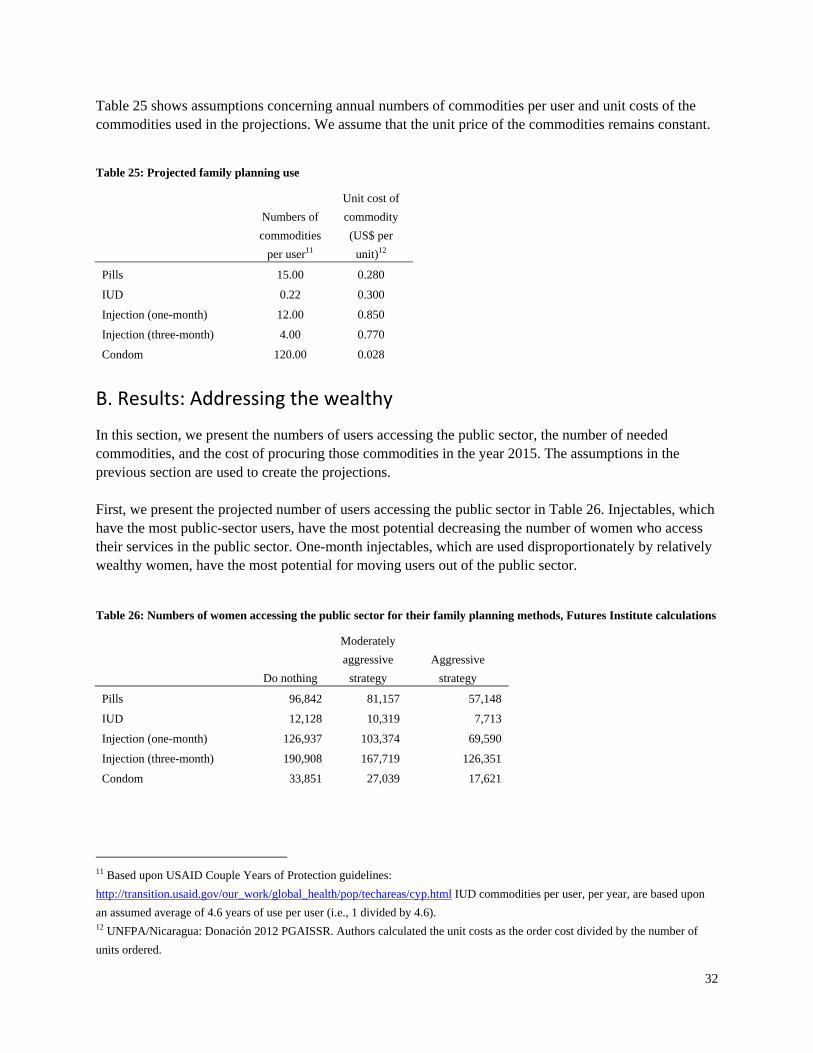
Table 25 shows assumptions concerning annual numbers of commodities per user and unit costs of the commodities used in the projections. We assume that the unit price of the commodities remains constant.
Table 25: Projected family planning use
Numbers of
commodities
per user11
Unit cost of
commodity
(US$ per
unit)12
Pills 15.00 0.280
IUD 0.22 0.300
Injection (one-month) 12.00 0.850
Injection (three-month) 4.00 0.770
Condom 120.00 0.028
B. Results: Addressing the wealthy
In this section, we present the numbers of users accessing the public sector, the number of needed commodities, and the cost of procuring those commodities in the year 2015. The assumptions in the previous section are used to create the projections. First, we present the projected number of users accessing the public sector in Table 26. Injectables, which have the most public-sector users, have the most potential decreasing the number of women who access their services in the public sector. One-month injectables, which are used disproportionately by relatively wealthy women, have the most potential for moving users out of the public sector.
Table 26: Numbers of women accessing the public sector for their family planning methods, Futures Institute calculations
Do nothing
Moderately
aggressive
strategy
Aggressive
strategy
Pills 96,842 81,157 57,148
IUD 12,128 10,319 7,713
Injection (one-month) 126,937 103,374 69,590
Injection (three-month) 190,908 167,719 126,351
Condom 33,851 27,039 17,621
11 Based upon USAID Couple Years of Protection guidelines:
http://transition.usaid.gov/our_work/global_health/pop/techareas/cyp.html IUD commodities per user, per year, are based upon
an assumed average of 4.6 years of use per user (i.e., 1 divided by 4.6). 12 UNFPA/Nicaragua: Donación 2012 PGAISSR. Authors calculated the unit costs as the order cost divided by the number of
units ordered.

33
Table 27 presents the numbers of commodities needed under the three scenarios.
Table 27: Numbers of commodities needed by the public sector to fulfill demand, Futures Institute calculations
Do
nothing
Moderately
aggressive
strategy
Aggressive
strategy
Pills 1,452,627 1,217,362 857,225
IUD 2,637 2,243 1,677
Injection (one-month) 1,523,241 1,240,483 835,084
Injection (three-month) 763,632 670,877 505,403
Condom 4,062,074 3,244,736 2,114,539
Table 28 below shows the procurement costs associated with the different scenarios for shifting public-sector users to the private sector. If an aggressive strategy was implemented and it succeeded, more than one million dollars could be saved by the public sector. By far, the method with the most potential for savings is the one-month injectable. In the moderately aggressive scenario, almost a quarter of a million dollars could be saved on the one-month injectable alone. This would constitute about sixty percent of the total savings that could be achieved. In fact, for the public sector to achieve savings, a strategy of both shifting users to the private sector and encouraging users of the one-month injectable to use the three-month injectable might be useful. The savings from IUDs is relatively small given the low price of IUDs and the small numbers of users.
Table28: Commodity procurement costs to the public sector to fulfill demand (US$), Futures Institute calculations
Do nothing
Moderately aggressive
strategy
Aggressive strategy
Total amount
Total
amount
Amount
saved
Total
amount
Amount
saved
Pills 407,519 341,645 65,874 240,807 166,712
IUD 791 673 118 503 288
Injection(one-month) 1,294,755 1,054,411 240,344 709,821 584,934
Injection(three-month) 587,997 516,576 71,421 389,160 198,836
Condom 115,561 92,857 22,704 61,462 54,098
Total 2,406,622 2,006,161 400,461 1,401,754 1,004,868
C. Results: Expanding scope of social security
People in Nicaragua are increasingly joining the formal sector for employment. Within the formal sector, FP benefits from SS are available to directly employed workers. In addition, FP benefits are available to spouses who receive services from SS-contracted public facilities. Benefits are not available to spouses receiving services in private SS clinics (EMPs). The SS system could provide assistance to MINSA by mobilizing contributions from employers to expand benefits to all spouses regardless of location of service. In this subsection, we analyze two possibilities: 1) all FP users who are eligible for SS obtain their FP services from private SS clinics (EMPs); and 2) FP users whose husbands are eligible for SS and could therefore obtain their FP services from SS if eligibility requirements were expanded.

34
Table 29 shows the percent of FP users who are in professions covered by SS. There is a relatively modest percent of women in such professions. On the other hand, their husbands are quite frequently in such professions. Then, when the two categories are combined, more than 50 percent of couples are potentially covered for all methods except three-month injectables. In fact, almost 60 percent of IUD users could potentially be covered.
Table29: Percent of family planning users potentially covered by social security
Pills IUDs
Injectables
(one-month)
Injectables
(three-month) Condoms
Percent of women in
professions covered by SS 18.9 22.1 18.7 11.8 26.2
Percent of husbands in
professions covered by SS 42.4 50.6 41.0 33.8 40.4
Percent of couples with at
least one member in a
profession covered by SS 51.9 59.2 50.0 38.8 54.6
Table 30 presents an estimate of the numbers of FP clients who use the public sector and the numbers using EMP services if SS coverage were expanded to cover all eligible women or eligible couples. If all eligible couples were covered, there would be almost equal numbers of clients using the public sector and EMPs, except for three-month injectables. For example, by this estimate, 47,544 women oral pill users would access public services, and 45,079 would access EMP services.
Table 30: Numbers of women using the public sector or EMPs under different scenarios of social security coverage
Do nothing
All eligible women
covered
All eligible women and
husbands covered
Public
users EMP
Public
users EMP
Public
users EMP
Pills 91,150 1,472 78,152 14,470 47,544 45,079
IUD 11,170 383 8,913 2,641 5,229 6,325
Injection (one-month) 116,847 1,633 99,086 19,394 63,880 54,600
Injection (three-month) 187,703 - 170,641 17,062 119,135 68,568
Condom 30,847 273 22,179 8,940 15,550 15,569

35
Table 31 presents the commodity costs and the potential savings if the distribution of users in Table 30 was achieved.
Table 31: Commodity procurement costs to the public sector to fulfill demand (US$), Futures Institute calculations
Do
nothing
All eligible women
covered by SS
All eligible women and
all eligible husbands
covered by SS
Total
amount
Total
amount
Amount
saved
Total
amount
Amount
saved
Pills 407,519 352,928 54,591 224,374 183,145
IUD 791 644 147 503 288
Injection(one-month) 1,294,755 1,113,613 181,141 709,821 584,934
Injection(three-month) 587,997 535,392 52,605 389,160 198,836
Condom 115,561 86,662 28,899 61,462 54,098
Total 2,406,622 2,089,239 317,384 1,385,321 1,021,301
D. Profiles
The projections above address the potential savings resulting from a re-orientation of users toward unsubsidized sources of FP. They do not address who these users are. Below are several user groups among the wealthiest quintile of women who may be useful to target. Profile 1
Women who work outside of the home. Women who use resupply methods. Women who want to space their births.
Wealthy women seemed to value practicality and proximity as principal reasons for choosing their methods and choosing a source for their FP methods. Commercial providers (pharmacies) could target these women by emphasizing the proximity of their services to working women. If these services are not yet near the women, additional efforts could be made to assure that FP methods are available in pharmacies. Profile 2
Women who work outside of the home. Women who want to limit their births, but are not ready for sterilization.
Again, practicality and the importance of time can be emphasized. In this case, IUDs from the private sector could be promoted. The private providers could set up services that are available in the evenings or lunch hours by appointment. With appointments, women could be assured that the services would be quick and good quality. An additional feature of the IUDs is that they would not require more than one return visit; thus, they are very practical.

36
Profile 3
Women who work in the home. Women who use resupply methods. Women who want to space their births.
Women in the home have many responsibilities and sometimes have little time for making visits to pharmacies or other medical facilities for non-urgent matters. Again, pharmacies could emphasize their proximity. They could also emphasize services or sell products that would serve multiple needs. This could make resupply of FP products part of a larger shopping trip that could save time. This would be in contrast to public services, where a special trip is needed. Profile 4
Women who work in the home and have children. Women who want to limit their births, but are not ready for sterilization.
Again, practicality and the importance of time can be emphasized. In this case, IUDs from the private sector could be promoted. The private providers could set up services that meet the needs of both mothers (for FP and other services) as well as their children. Examples of services that could be offered conjointly are well-baby care and vaccinations.

37
CHAPTER 6. RECOMMENDATIONS
Nicaragua has a wide and varied supply of contraceptive methods, and the support provided by the public and private sectors has increased the prevalence of contraceptive use in recent years. Furthermore, the contraceptives market in Nicaragua is today clearly segmented, and coverage at the national level is relatively high. Nevertheless, certain disparities with regard to access by more vulnerable populations, as well as the financial challenges currently presented by the current health model, lead us to present options for sustainability and continuity of that model. The results of this study allow us to identify certain opportunities that will help face those challenges and generate appropriate policies and strategies. This market study includes an analysis of the multidimensional factors affecting women’s decisions, allowing us to more clearly understand their underlying reasons for seeking service. This in turn allows us to pinpoint certain steps and strategies aimed at identifying the market niche most appropriate to different provider types.
A. Private business sector
The private business sector in Nicaragua offers a competitive and varied supply of contraceptive methods within several price ranges. Nevertheless, when compared to the public sector, these products have a relatively small market share. This is easily explained because access to high-quality contraception in Nicaragua is widespread and because government services are provided free of charge to the population as a whole. Therefore, the following steps or strategies are recommended for the private-business sector to attract higher-income women: 1. Increase the promotion and use of oral contraceptives. 2. Improve the supply of low-cost three-month injectables. 3. Differentiate the amenity-based quality of services provided by the private sector, such as shorter
waiting times, privacy and proximity of services to women. 4. Develop a strategy to keep pharmacy users within the channel and avoid migration to other
providers; for example, cumulative discounts, and lower prices for regular customers. 5. Develop strategies and alliances with the public sector to achieve complementary objectives. 6. Pharmaceutical suppliers and distributors could launch information campaigns in support of INSS-
affiliated clinics, to provide information concerning the availability of products offered by these clinics.
7. Focus on increasing market share in Managua and Caribe.

38
B. Public sector—MINSA
The public sector in Nicaragua is the largest provider of health services and of FP services. Although it provides a more limited range of products than the private sector, it is accessible and free of charge. MINSA policies and strategies to increase access to contraceptive methods are stated in the Contraceptive Community Distribution Strategy (Estrategia Comunitaria para el Manejo de Anticonceptivos or ECMAC) and the Post Obstetric Event Contraceptive Strategy (Estrategia de Anticoncepción Post Evento Obstétrico or APEO). However, disparities and inequities persist in highly vulnerable populations such as adolescents and very low-income populations who purchase contraceptive methods through the private sector. At the same time, more than 60 percent of women in the highest wealth quintile are obtaining their contraceptives from public services free of charge, despite their ability to pay. In this regard, recommendations to the public sector based upon the results of this study are to: 1. Improve access to contraceptive methods for vulnerable and low-income populations, including
adolescents and rural populations. 2. Provide better information to these female user groups to ensure greater safety and trust in the
contraceptive methods provided by public services. 3. Refer social security-eligible users of public health services to social security clinics. 4. Promote the use of IUDs at the public health service centers, as well as other long-term methods. 5. Encourage use of three-month injectable in the public system. 6. Coordinate efforts with the private sector to remove obstacles and barriers, and create joint
strategies aimed at promoting the use of contraceptive methods. At the same time, use industrial and commercial networks to achieve joint objectives, such as the coverage of adolescents and at-risk populations.
C. NGOs and social marketing
Social marketing and NGOs have decreased their share in the contraceptive market. In recent years, however, this sector has positioned itself clearly as a provider of condoms and IUDs, in strong contrast with other providers. There is a clear niche that provides opportunities for this subsector and we have identified the following recommendations: 1. Continue to promote the use of IUDs and support the public sector with training aimed at providing
these products. 2. Establish a joint strategy at the national level to distribute condoms, taking into account vulnerable
and priority groups. 3. Develop alliances and strategies with clinics affiliated with the social security system in order to
promote the adoption of IUDs and condoms by members and spouses.

39
D. Nicaraguan Social Security Institute (INSS)
The SS system in Nicaragua has gradually grown in recent years. Nevertheless, limited geographic access and reproductive health policies aimed at this subsector do not fully satisfy the needs of female users or beneficiaries of FP. Today not all INSS clinics offer contraceptive coverage to their members and spouses. The recommendations that we believe can have a rapid and highly positive impact on this sector are the following: 1. Include spouses of members as beneficiaries of FP services. 2. Develop strategies to recruit users and offer follow-up after the first visit to maintain continuation
among female beneficiaries. It should be noted that 76 percent of female users who initially received a contraceptive method through an INSS clinic obtained future supplies from private pharmacies.
3. Increase and improve the information given to members concerning the availability of contraceptives at their clinics.
4. Increase member coverage in the various regions, in addition to Managua. 5. Differentiate amenity-based quality of services as a reason to seek services there. 6. Promote IUD service availability. 7. Offer appointment times convenient to working women—for example, in the evenings or in
conjunction with child care appointments. Despite the additional insights that this study provided, some questions remain. We do not have clear data about the factors that determine a woman’s decision-making about choosing a FP provider. We could benefit from more information about decisions and behavior seeking for emergency contraception. There is no information about adolescent decision-making. However, we hope that this work complements information from other providers, such as PASMO, and that it can be applied to develop and implement strategies to achieve family planning equity and sustainability in Nicaragua in the next decade.


![PROGRAMA ESCUCHAR ENCUESTA A NIVEL INDIVIDUAL-ENCUESTA … · ENCUESTA A NIVEL INDIVIDUAL-ENCUESTA MADRE . Language | LOOP FROM 1 TO [PRELOAD NUMBER OF 1 English HH MEMBERS] DO |](https://static.fdocuments.in/doc/165x107/5f814d71a84657101b29a1f4/programa-escuchar-encuesta-a-nivel-individual-encuesta-encuesta-a-nivel-individual-encuesta.jpg)