Niagara River Upstream/Downstream Monitoring Program...
43
Niagara River Upstream/Downstream Monitoring Program Report 2001-2002 to 2004-2005 Prepared by: B. Hill and P. Klawunn Environment Canada For: Data Interpretation Group River Monitoring Committee July, 2009
-
Upload
nguyenliem -
Category
Documents
-
view
223 -
download
0
Transcript of Niagara River Upstream/Downstream Monitoring Program...

Niagara River Upstream/Downstream Monitoring Program Report 2001-2002 to 2004-2005
Prepared by: B. Hill and P. Klawunn Environment Canada
For: Data Interpretation Group
River Monitoring Committee July, 2009

i
Disclaimer: The intended use of the data from the Niagara River Upstream/Downstream program is to measure the concentrations/loads and trends of contaminants in the river, specifically in relation to implemented control measures. Data are compared to the most stringent water quality criteria available from the four agencies, to provide an indication of potential impairment of beneficial uses. Use of these data for any other purpose is at the discretion of the user.

ii
Table of Contents
Page No. Table of Contents................................................................................................................................ii
Figures.............................................................................................................................................ii Tables .............................................................................................................................................iii Appendices.....................................................................................................................................iii
1.0 Introduction ..................................................................................................................................1 2.0 Methodology.................................................................................................................................2
2.1 Sampling & Analytical Methodology ......................................................................................2 2.1.1 Protocol changes...............................................................................................................5
2.2 Statistical Methodology...........................................................................................................5 2.3 Data Quality Control (QC)........................................................................................................7
2.3.1 Data Completeness and Comparability ...........................................................................7 2.3.2 Data Flags...........................................................................................................................7 2.3.3 Implications to Data Based on Quality Control Flags.....................................................8
3.0 Results ..........................................................................................................................................9 3.1 Water Quality Exceedences ...................................................................................................10
3.1.1 Criteria Sources ...............................................................................................................10 3.2 Water Quality Trends.............................................................................................................14 3.3 Niagara River Sources...........................................................................................................19
4.0 Summary.....................................................................................................................................22 5.0 Acknowledgements ...................................................................................................................23 6.0 References..................................................................................................................................24 7.0 Appendicies.................................................................................................................................27
Figures
Figure 1. Niagara River Upstream/Downstream Sampling Locations 2 Figure 2. Annual Dissolved Phase MLE and Upper 90% CI of Dieldrin 15
from 1986/87 to 2004/05 Figure 3. Annual Suspended Sediment MLE & Upper 90% CI of 16
Hexachlorobenzene from 1986/87 to 2004/05 Figure 4. Annual Suspended Sediment MLE & Upper 90% CI of 16
Mirex from 1986/87 to 2004/05 Figure 5. Annual Suspended Sediment MLE & Upper 90% CI of 17
Benzo(b/k)Fluoranthene from 1986/87 to 2004/05 Figure 6. Annual Suspended Sediment MLE & Upper 90% CI of 18
Benzo(a)Pyrene from 1986/87 to 2004/05 Figure 7. Annual Whole Water MLE & Upper 90% CI of Arsenic 18
from 1986/87 to 2004/05

iii
Tables
Table 1a. Practical detection Limits for Organic Data (2001/02 to 2004/05) 3 Table 1b. Practical detection Limits for Trace Metal Data (2001/02 to 2004/05) 4 Table 2. Q Flags and Their Rationales for the Niagara River Database 8 Table 3. Annual Flow and Suspended Particulate Matter for 2001-2005 9 Table 4a. Comparison of RWW 90% CI with Most Stringent 11
Agency Water Quality Criteria for Organic Contaminants Table 4b. Comparison of Whole Water 90% CI with Most Stringent 13 Agency Water Quality Criteria for Trace Metals Table 5a. Ratio of Organic RWW Means 20
Table 5b. Ratio of Trace Metal RWW Means 21
Appendices
Appendix A: Niagara-on-the-Lake Raw Data Results Appendix B: Fort Erie Raw Data Results Appendix C: MLE Outputs for Organic Contaminants in Water and Solids Appendix D: MLE Outputs for Particulate Phase Converted to ng/L and Loads (kg/day) Appendix E: MLE Outputs for Recombined Whole Water (RWW) Appendix F: MLE Concentrations and Loads for Total Metals Appendix G: MLE Ratios (2001/02 - 2004/05) Appendix H: Spike Recoveries (2001/02 - 2004/05) Appendix I: Protocol Changes: 1986 - 2005 Appendix J : Acronym Dictionary

1
1.0 Introduction
The Niagara River has a significant influence on Lake Ontario. It is responsible for more than 83% of the total tributary inflow to the lake (Eadie and Robertson 1976), 85% of the total input water budget, and about 50% of all incoming fine grained sediment (Kemp and Harper 1976). Because of this influence, Environment Canada established a monitoring station in 1975 at the mouth of the Niagara River at Niagara-on-the-Lake (NOTL) to estimate the annual chemical loads and changes/trends in these loads from the river to Lake Ontario. Love Canal, and the publication of numerous reports on the magnitude of the hazardous waste site problem on the U.S. side of the river in the late 1970s, further heightened Environment Canada’s concern about the input of chemicals to the river and, subsequently, to Lake Ontario. A second station was established at the head of the Niagara River at Fort Erie (FE) in October 1983, to estimate the loads of chemicals to the river from Lake Erie. This Upstream/Downstream Program, as it became known, was a key component of the Niagara River Long Term Monitoring Plan recommended by the Niagara River Toxics Committee (NRTC 1984). It was formally incorporated into the Niagara River Declaration of Intent (DOI) signed by the Four Parties (Environment Canada, the United States Environmental Protection Agency (Region II), the Ontario Ministry of the Environment, and New York State Department of Environmental Conservation) in February, 1987. Thus, what had begun as an Environment Canada initiative, became a component of the Niagara River Toxics Management Plan (NRTMP). The overall goal of the NRTMP is to achieve significant reductions of toxic chemical pollutants in the Niagara River. Specifically, results from the Upstream/Downstream program are intended to determine whether concentrations of specified chemicals at NOTL are statistically different from concentrations at FE, and to assess trends over time. The River Monitoring Committee (RMC) was formed to co-ordinate the design, operation and reporting of results of the Upstream/Downstream Program. Specifically, the RMC is responsible for the overall design and auditing of a mutually agreed upon program to monitor levels of toxic substances at the head and mouth of the Niagara River, and for interpreting the program results in a manner which has the concurrence of the Four Parties. As part of their duties, RMC members, or their representatives from the Four Parties, resolve issues related to sampling and analytical methodologies; conduct periodic audits of field and laboratory operations; and analyse, review and report on the results from the Upstream/Downstream Program. Concentrations and loads have been summarised in annual data reports by the RMC Data Interpretation Group for the first 11 years of the program. At the end of that first series of annual reports, the first trend report summarising changes in contaminants over the 1986 – 1997 period was released by Environment Canada (Williams et al. 2000). With completion of the annual report for the 1996-97 data, the RMC adopted a new reporting schedule and a new reporting format. The new reporting schedule calls for biennial data summaries, with an updated trend report every four years as required by the Secretariat or RMC. As a result of several delays caused by updates to analytical methodology and improvements to data interpretation, this report summarises the Upstream/Downstream Program chemical data collected over a four year period from April 1, 2001 to March 31, 2005. It includes the raw data and the annual mean concentrations and loads estimated by the Maximum Likelihood Estimation (MLE) method (El-Shaarawi 1989) for all the parameters measured at both the FE and NOTL stations.

2
LAKE ONTARIO
Niagara River
Fort ErieStation
Niagara-on-the-Lake Station
LAKE ERIE
Figure 1. Niagara River Upstream/Downstream Sampling Locations
2.0 Methodology
2.1 Sampling & Analytical Methodology The Upstream/Downstream Program measures the concentrations of trace metals in whole water and trace organic contaminants in both water and suspended solids at the head of the Niagara River at Fort Erie (FE) and at the mouth of the River at Niagara-on-the-Lake (NOTL) (Figure 1). Program results are reported based upon Environment Canada’s “fiscal” year which runs from April 1 to March 31; as a result, samples for this 2001/02 - 2004/05 report were collected from April 1, 2001 to March 31, 2005. Over the eleven-year period 1986/87 – 1996/97, sampling was conducted weekly. Since that time, the sampling frequency has been bi-weekly. Sampling times at the two stations are offset by approximately 15-18 hours to allow for the travel time of water between the head and mouth of the river. While this does not account for the storage and release of water from the Robert Moses (U.S.) and Sir Adam Beck (Canadian) power plant reservoirs, it does better approximate the river’s hydrodynamic regime. Daily flow data are obtained from the Co-ordinating Committee on Great Lakes Basin Hydraulic and Hydrologic Data. Large-volume, 24-hour time-integrated dissolved and particulate phase samples for organic contaminants are collected using a submersible pump, intake line, and Westfalia centrifuge assembly (Anthony, 1994; Kuntz, 1994). Grab samples of whole water for trace metal analyses are collected from the intake line. Note that sampling for mercury in water was discontinued in April 1997 because the analytical method was not sufficiently sensitive. Mercury in water sampling was resumed in July

3
2002 after improvements to the method; however, it was discontinued again in April of 2003 due to evidence of contamination. As a result, only Mercury in the suspended particulate phase is included in this report, in the absence of whole water data. A complete list of chemicals measured, and the analytical detection limits used for the 2001-2005 data sets are provided in Table 1a and 1b. The highlighted compounds indicate where analytical detection limits have changed. Table 1a. Practical Detection Limits for Organic Data (2001/02 to 2004/05)
Organics Water (ng/l) Solids (ng/g)
2001/02 - 2004/05 Revised 2004/05 1,3-Dichlorobenzene 0.285 6.44
1,4-Dichlorobenzene 0.234 7.47
1,2-Dichlorobenzene 0.214 6.7
1,3,5-Trichlorobenzene 0.009 0.92
1,2,4-Trichlorobenzene 0.011 2.08
1,2,3-Trichlorobenzene 0.006 0.35
1,2,3,4-Tetrachlorobenzene 0.005 0.34
Pentachlorobenzene 0.005 0.3
Hexachlorobenzene 0.005 0.3 0.29
Hexachlorobutadiene 0.003 0.1 0.12
Hexachlorocyclopetadiene 0.004 0.31
Heptachlor 0.01 0.66
Aldrin 0.01 0.37
Octachlorosytrene 0.004 0.2 0.19
p,p’-DDE 0.011 0.4 0.37
p,p’-DDD 0.030 1.4 1.35
o,p’-DDT 0.033 0.6 0.57
p,p’-DDT 0.043 1.02
Photomirex 0.040 0.44
Mirex 0.014 0.66
α-BHC 0.031 0.2 0.24
γ-BHC 0.031 0.2 0.18
Heptachlor Epoxide 0.015 0.75
γ-Chlordane 0.006 0.42
α-Chlordane 0.036 0.49
α-Endosulfan 0.012 0.57
-Endosulfan 0.010 0.62
Dieldrin 0.032 0.67
Endrin 0.03 0.97
Endrin Aldehyde 0.027 1.07
Methoxychlor 0.07 4.62
TCPCB 0.211 14.6
2-Methyl Naphthalene 0.12 5.2 1-Methyl Naphthalene 0.08 3.3
Naphthalene 0.33 5.3
Acenaphthylene 0.09 8.1
Fluorene 0.7 5.5
Phenanthrene 0.12 32.2
Anthracene 0.02 16.2
Beta-Chloronaphthalene 0.01 3
Atrazine 6.04 20.5

4
Organics Water (ng/l) Solids (ng/g)
2001/02 - 2004/05 Revised 2004/05 Metolachlor 0.82 46.3
Fluoranthene 0.17 33.9
Pyrene 0.17 62.9
Benz(a)anthracene 0.01 43.5
Chrysene/Triphenylene 0.03 39.4
Benzo(b+k)fluoranthene 0.03 70.4
Benzo(a)pyrene 0.01 33.7
Indeno(1,2,3-c,d)pyrene 0.02 29.1
Dibenzo(a,h)anthracene 0.02 10.9
Benzo(g,h,i)perylene 0.02 20.5
Table 1b. Practical Detection Limits for Trace Metal Data (2001/02 to 2004/05)
2001/02 2002/03 2003/04 2004/05 Metals Whole
Water Solids Whole
Water Solids Whole
Water Solids Whole
Water Solids
(ug/L) (mg/kg) (ug/L) (mg/kg) (ug/L) (mg/kg) (ug/L) (mg/kg) Aluminum 2 0.1 0.2 0.2 Antimony 0.01 0.01 0.001 0.001 Arsenic 0.1 0.1 0.01 0.01 Barium 0.05 0.05 0.05 0.05 Beryllium 0.005 0.002 0.001 0.001 Cadmium 0.01 0.005 0.001 0.001 Cobalt 0.002 0.002 0.002 0.002 Chromium 0.05 0.02 0.005 0.005 Copper 0.05 0.02 0.02 0.02 Iron 1 1 0.5 0.5 Lithium 0.02 0.02 0.2 0.2 Manganese 0.01 0.005 0.05 0.05 Molybdenum 0.01 0.01 0.005 0.005 Nickel 0.05 0.05 0.02 0.02 Lead 0.005 0.005 0.005 0.005 Selenium 0.1 0.1 0.05 0.05 Silver 0.005 0.005 0.001 0.001 Strontium 0.05 0.05 0.05 0.05 Vanadium 0.01 0.01 0.005 0.005 Zinc 0.05 0.05 0.05 0.05 Mercury - - - 0.004 - - - 0.004 - - - 0.004 - - - 0.004
Sampling procedures and analytical methodologies for the Upstream/Downstream Program have been documented thoroughly (NRAP 1992; NRSP 1995; Data Interpretation Group 1997; Data Interpretation Group 1999, NRAP 2000, NRSP 2003, SOP 06-6001). These protocols, developed and agreed to by the Four Parties, include the requirement for regular audits of Environment Canada field and laboratory operations. The purpose of the audits is to ensure that the protocols are being followed by Environment Canada’s field and laboratory staff. Four Party audits were conducted in 1988, 1991, 1993, 1997, 2000, and most recently in 2005. In each case, the audit teams concluded that the procedures generally adhered to those described in the sampling and analytical protocol documents and should, therefore, result in the generation of data of acceptable quality.

5
2.1.1 Protocol changes
The data contained in this 2001-2005 report represents the last samples to be analysed according to the methods outlined in the “Niagara River Upstream/Downstream Monitoring Program Final Report 1999/00 & 2000/01”. As a result, most of the same notes regarding data collection, analysis, and interpretation are also applicable to the 2001-2005 data set; however, this report does not contain results for dissolved phase mercury or dioxins and phthalates in water and solids as they were discontinued as of April 1997. Instead, suspended particulate phase Mercury results were converted to water concentrations and included in this report, in the absence of dissolved phase data. Since the publication of the 1999/00 and 2000/01 data, there have been some revisions to the practical detection limits (PDLs) for both water and suspended solids analysis (Table 1a and 1b). In the case of Hexachlorobenzene, Hexachlorobutadiene, Octachlorostyrene, p.p.-DDE, p.p.-DDD, o.p.-DDT, α -BHC, and γ -BHC, this primarily represents an administrative change which simply adds an additional decimal place for a more accurate reporting of suspended solid values; however, changes and/or improvements in analytical methods have lead to lower detection limits for a number of trace metals. Conversely, detection limits for Aluminum, Lithium, and Manganese actually increased during the 2003/04 fiscal year due to the combined effects of replacing an older model PQ2 Inductively Coupled Plasma - Mass Spectrometry (ICP-MS) instrument with a high resolution Inductively Coupled Plasma - Sector Field Mass Spectrometry (ICP-SFMS) instrument and a decision made within the analytical lab to re-evaluate detection limits based on analytical ranges that covered ALL samples (as opposed to ranges specific to the Niagara River program itself). For this report, it is not possible to perform a direct comparison of the 2003/04 and 2004/05 Arsenic and Selenium data with previous data due to the fact that these compounds underwent an analytical method change in April of 2003. Prior to that date, these two trace metals were analysed using Hydride Generation / Inductively Coupled Plasma - Optical Emission Spectrometry (ICP-OES) while analysis after April of 2003 were performed using Acid Digestion / ICP-SFMS which provides a more sensitive analysis. Similarly, the change from an aroclor based method to a cogener specific method for the analysis of total PCBs outlined in the “Niagara River Upstream/Downstream Monitoring Program Final Report 1999/00 & 2000/01” make it impossible to directly compare PCB data from the method used prior to April 1998 to those results after this date. A complete chronology of changes to the sampling, analysis, and interpretation protocols for the Niagara River Upstream/Downstream Program can be found in Appendix I. Please note that all subsequent Niagara River Upstream/Downstream reports will focus on data collected using new protocols implemented in April of 2005 whereby 16 litre water samples are collected on site and transferred to Environment Canada’s clean facility for the analysis of organics in whole water (SOP 06-6001).
2.2 Statistical Methodology In the first series of annual Four Party Upstream/Downstream reports (1986/87 – 1996/97), estimates of annual mean concentrations and loads, and their 90% confidence limits, were calculated by applying the MLE method only to chemicals having three or more “trace” values (“trace” values are reported concentrations below the PDL). Annual means of flow, suspended particulate matter (SPM) concentrations and particulate phase chemical concentrations were used to calculate loads.
6
MLE summaries include reporting the particulate phase both as weight (ng/g dry weight) and as equivalent water concentration (EWC; ng/L). The EWC is calculated by multiplying the particulate phase concentration of the contaminant by the SPM concentration. EWCs are used to calculate recombined whole water (RWW) concentrations that represent the sum of the dissolved and particulate phases so that comparisons can be made to water quality criteria. If a compound is detected in only one phase, dissolved or suspended sediment, then the reported RWW is the concentration of that phase expressed in nanograms per litre. These values are also used to calculate annual mean total loads. Two important changes to the statistical methodology were implemented in the “Niagara River Upstream/Downstream Monitoring Program Final Report 1999/00 & 2000/01” and are similarly applied to this report: In this report, before the data for any analyte were subjected to statistical analysis, there must
have been at least three values above the practical detection (PDL). This differs from past practice which required only that the data have at least three “trace” values before being subjected to statistical analysis. Starting in 1999, a new set of PDLs were determined and used to generate the data presented in this report. As shown in Table 1, these were, in some cases, an order of magnitude lower than the previous PDLs. As a result, confidence in the presence and identification of “trace” values for analytes using the new PDLs remains high; however, confidence in the absolute reported concentrations is less. Thus, the reason for the change to “at least three values above the PDL” before subjecting the data to any statistical analysis. Once this requirement was met, statistical analysis proceeded using all of the valid reported data, including “trace” concentrations.
Paired contaminant concentration and SPM concentration for each individual sample (rather than
the annual means) were used to calculate the annual mean particulate phase loads. As noted above, annual mean particulate phase loads in the first series of annual Four Party reports were calculated as follows:
F x Cp x SPM
where F is the annual mean flow, Cp is the annual mean concentration of the chemical in the particulate phase, and SPM is the annual mean concentration of suspended particulate matter. Examination of the historical database indicated that the fall/winter SPM concentrations were, in some cases, an order of magnitude higher than summer concentrations due to the effects of storms and ice scour in Lake Erie. This tended to bias the annual mean SPM concentration high. Secondly, in most instances, the particulate phase contaminant concentrations were inversely related to the SPM concentrations. This inverse relationship has been previously reported by others (e.g., O’Connor et al. 1980). Using annual means for both the SPM and particulate phase contaminant concentrations to calculate the loads, therefore, resulted in a positive high bias to the load estimate. To provide a more realistic result, it was decided to calculate annual suspended particulate loads using the paired contaminant concentration and SPM concentration for each sample, rather than using annual means. Mean annual flow is still used because the variation in flow is relatively small (~10%). This will result in lower particulate phase contaminant loads than have been previously reported in the first series of Four Party Upstream/Downstream reports.
This change in statistical methodology is consistent with that employed in the Environment Canada 1986-1997 Upstream/Downstream trend report (Williams et al. 2000); the Appendices to that report provide revised estimates of annual concentrations and loads for the period 1986/87 – 1996/97.

7
2.3 Data Quality Control (QC)
2.3.1 Data Completeness and Comparability Based on the bi-weekly sampling protocol for the Upstream/Downstream Program, there are generally 26 samples collected for organic and trace metal parameters; however, scheduling of site visits can sometimes lead to either missed or extra samples depending on the year. In addition, there are a number of issues (including, but not limited to, equipment malfunction and internal data QC) which impact the success of sample collection, analysis, and reporting. Appendix A and Appendix B provide a quantitative assessment of the total number of samples collected for each compound from both the Fort Erie and Niagara-on-the-Lake stations during the 2001-02 to 2004-05 time period.
2.3.2 Data Flags To provide a more meaningful assessment of the results generated from the Upstream/Downstream Program, Environment Canada has developed a flagging procedure which qualifies the data. This procedure has been agreed to by the RMC, and was applied for the first time in the “Niagara River Upstream/Downstream Monitoring Program Final Report 1999/00 & 2000/01”. Table 2 lists the qualifying (Q) flags, with accompanying rationales, which are applied to the data as appropriate. For this report, Naphthalene data in the dissolved phase were flagged (Q04) at both stations because the lab recoveries of the deuterated naphthalene spikes were consistently less than 25% and highly variable. In addition, a number of samples were flagged due to a loss of sample (Q12) and a rare few were qualified because of “inappropriate sampling and/or analytical methodology” (Q10). Data labeled with a Q01, Q02, Q06, or Q07 flag are done so based on a statistical assessment of the data. Data values falling outside three standard deviations from the mean were automatically flagged with either the Q01 or Q02 designation. These data values were then re-examined in the context of historical data, data from the other site, or knowledge of specific events (eg., spills) to determine if the Q01 or Q02 designation was valid. Generally, few Q01 and Q02 flags were applied to the data in this report (primarily dissolved phase Total Cogener PCBs). Q06 or Q07 flags in this report highlight a problem specifically due to a persistent lab background contamination. Q13 is applied when the laboratory blanks, analysed with a particular set of samples, have a concentration higher than that defined by the Upper Confidence Limit for Contamination (UCLC; see section 2.3.2) for the blanks. Note that data qualified with Q06 and Q07 flags are replaced with less than detection limit (<DL) values prior to any statistical analysis. Data qualified by any other Q flags are not included in any statistical analysis for this report.
8
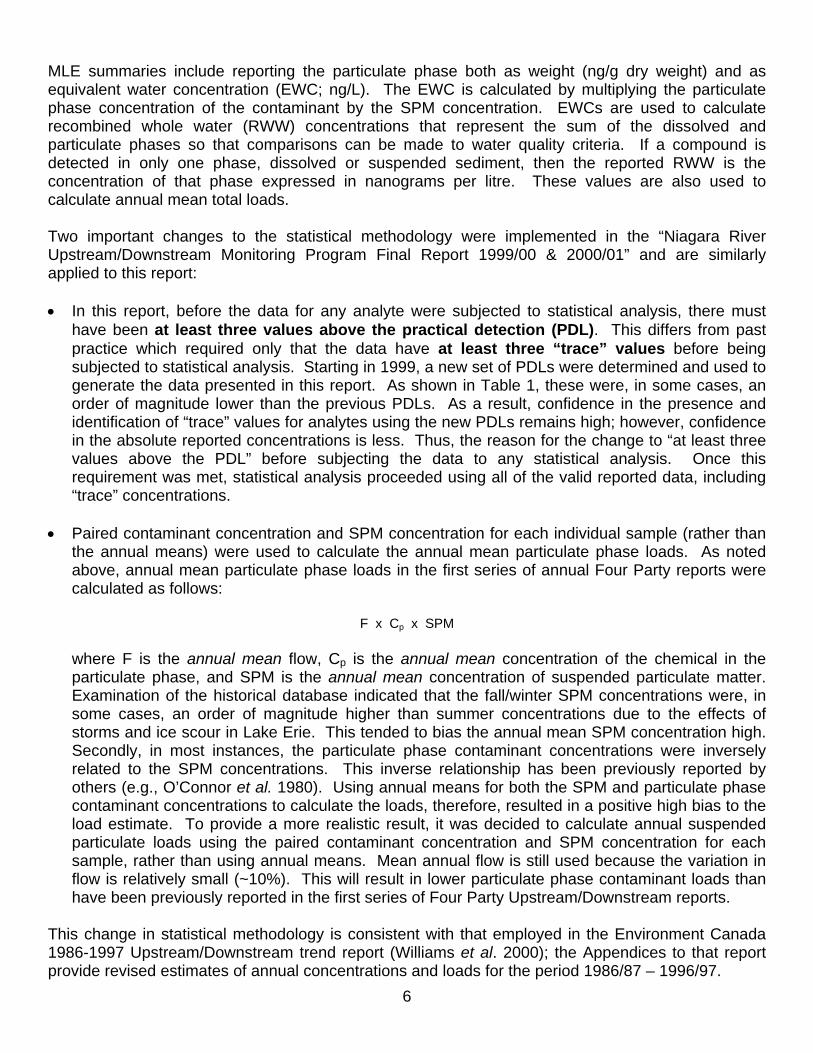
Table 2. Q Flags and Their Rationales for the Niagara River Database
Q flag Rationale Q01 Value qualified since concentration is greatly above the expected range – improbable. Q02 Value qualified since concentration is greatly below the expected range – improbable. Q03 Value qualified since surrogate recoveries are high and value above expected range. Q04 Value qualified since surrogate recoveries are low and value below expected range. Q05 Value qualified since sample contaminated; interference precludes quantitative assessment. Q06 Value qualified since blank typically constitutes >50% of value. (2xMean Blank conc.>Value>UCLC) Q07 Value qualified since indistinguishable from blank population. (Value<UCLC) Q08 Value considered biased low since method recovery of analyte is unacceptably low. Q09 Value considered biased high since method recovery of analyte is unacceptably high. Q10 Value qualified since inappropriate sampling and/or analytical methodology used to generate result. Q11 Value qualified since noisy baseline precludes quantitative assessment Q12 Value qualified as a result of sample loss Q13 Value qualified as a result of laboratory contamination issue. Q14 Value qualified as a result of field contamination issue Q15 Value of surrogate is higher than the expected range Q16 Value of surrogate is lower than the expected range Q17 Value of surrogate is Non-Detect (ND) because the surrogate was not added Q18 Value qualified because filtered fraction is greater than unfiltered fraction Q19 Value qualified because bottom disturbance suspected during sampling Q20 Value qualified as a result of an unidentified event Q99 Value qualified for miscellaneous reason.
2.3.3 Implications to Data Based on Quality Control Flags In this 2001/02 - 2004/05 Niagara River data set, a total of 33 laboratory water blanks were processed according to the “Procedure for Determining the Impact of Blanks on Sample Data” outlined in the “Niagara River Upstream/Downstream Monitoring Program Final Report 1999/00 & 2000/01”. In addition, a total of 30 laboratory sediment blanks were processed. These blank data have been added to the historical blank data in order to establish a cumulative blank database representing the long-term conditions. The QC protocol has been applied to this cumulative laboratory blank database and the mean blank results were used as the basis for flagging the data in this report. The lab blank background (Q06 and Q07 flags) had a significant impact on 1,3-dichlorobenzene, 1,4-dichlorobenzene, α-BHC, endrin, and p,p-DDE data as well as sporadic impacts on aldrin, octachlorostyrene, and mirex data. As stated in previous reports, the FE data were generally more affected than the NOTL data due to their lower concentrations. For TCPCBs & Mercury, field blank studies indicate the majority of the dissolved phase concentration is due to background contamination; as a result, Q01 flags have been applied to these data and, similar to previous U/D Program reports, only the particulate phase results are presented. Spike recoveries are also used as a tool for monitoring the accuracy of each analytical method in the Upstream/Downstream Program. Appendix H summarizes the spike recoveries for the 2001/02 - 2004/05 samples. Average particulate phase recoveries ranged from 29% to 191% while average recoveries in the dissolved phase ranged from 40% to 124%.

9
At the low end of the spectrum, spike recoveries of hexachlorcyclopentadiene in water and suspended solids were in the range of 30 – 40%, indicating levels in the river are probably 2X-3X higher than present measurements indicate. Despite this under estimation, the concentration remains well below the criteria for this contaminant. To date, these data have not been flagged. Spike recoveries of hexachlorobutadiene in water and suspended solids, which were both reported in the 28% range in the “Niagara River Upstream/Downstream Monitoring Program Final Report 1999/00 & 2000/01”, have increased to 68% and 65% respectively, indicating levels in the river are probably about 30% higher than present measurements indicate. Despite this under estimation, like hexachlorocyclopentadiene, the concentration of hexachlorobutadiene remains well below the criteria and so, to date, these data have not been flagged. At the opposite end of the spectrum, high recoveries were observed in several of the PAH compounds. For example, Pyrene and Fluoranthene showed mean particulate phase recoveries as high as 191% and 179% respectively with maximum recoveries over 300%. In the dissolved phase, Benzo(A)anthracene and TCPCB showed the highest mean recoveries at 117% and 111% respectively and both compounds had maximum recoveries greater than 200%. These high recoveries are mainly attributable to significant background interference from native matrix material; however, the high TCPCB rates suggest further evidence of TCPCB contamination in the dissolved phase samples. An alternate matrix for future sediment spike samples will be considered to allow a more reasonable assessment of the method.
3.0 Results
A statistical summary for suspended particulate matter (SPM) concentrations and flow for both monitoring stations for the 2001-2002 to 2004-2005 years is presented in Table 3. Table 3. Annual Flow and Suspended Particulate Matter for 2001-2005
Fort Erie Niagara-on-the Lake Year Parameter Mean Median S.D. Mean Median S.D.
Flow (m3/s) 5289 5220 359.10 5326 5300 389.542001/2002 SPM (mg/L) 7.90 2.38 10.88 10.60 4.02 15.86
Flow (m3/s) 5394 5350 439.07 5422 5354 448.942002/2003 SPM (mg/L) 3.66 1.80 5.44 5.88 3.36 7.67
Flow (m3/s) 5388 5374 315.22 5421 5437 337.242003/2004 SPM (mg/L) 5.93 1.98 9.94 6.39 2.70 8.54
Flow (m3/s) 5797 5807 284.08 5830 5841 315.162004/2005 SPM (mg/L) 3.01 1.87 3.36 5.49 3.23 5.71
Data retrievals were run for all organic parameters, trace metals, and suspended particulate matter concentrations for the period April 2001 through March 2005 for both the NOTL and FE stations. Results are presented in Appendix A and Appendix B for NOTL and FE, respectively. The retrievals include data for both dissolved and suspended solid phases, where applicable. Results reported below the PDL (i.e., trace values) are included in the retrievals. These data are denoted with a “T”. Confidence in the identification of the chemical is high, but there is less confidence in the actual reported concentration. Values below the detection limit are denoted with an “L” to the right of the value. Data considered valid are denoted with a ”V”. Data flagged for any of the reasons given in

10
Table 3 are denoted with the appropriate “Q” flag. Data presented in this report have not been blank corrected. Data denoted with a “V”, “L”, “T”, Q06 or Q07 were used in statistical analysis. Data flagged Q6 or Q7 were replaced with less than detection limit (<DL) values prior to statistical analysis. Data that were qualified with flags other than Q06 or Q07 have not been used for further statistical analysis in this report. The difference between an “L” and a “T” is important and sometimes confusing. Reported values are calculated from a chromatographic signal which has been calibrated against known standards. When the chromatographic signal cannot be differentiated from the normal baseline (i.e., no peak) an “L” denotation is applied. When a chromatographic signal sufficiently different from the normal baseline (i.e., signal/noise ratio>5) is present, a quantified value is reported. If the value is lower than the PDL a “T” notation is applied. Note that detection limits are not absolute, but rather, statistically derived values and, hence, it is possible to measure values below this threshold. The Maximum Likelihood Estimation (MLE) method was applied to the data set for each of the four years 2001-2002 to 2004-2005, for each station. The results are presented in Appendices C and D for organic parameters, and Appendix F for trace metals. For each variable, the predicted annual mean concentration and predicted annual mean load, along with their upper and lower 90% confidence limits, are reported for both the dissolved and particulate phases. Predicted mean concentrations and loads, along with their respective upper and lower 90% confidence limits for recombined whole water organic parameter concentrations are presented in Appendix E.
3.1 Water Quality Exceedences In order to help the Four Parties meet the NRTMP “Letter Of Support” goal of achieving “ambient water quality that will protect human health, aquatic life, and wildlife”, the Niagara River Upstream/Downstream Monitoring Program is used to identify toxic chemical concentrations that exceed water quality guidelines. As a result, Program data are compared to the strictest water quality criteria available (Tables 4a and 4b).
3.1.1 Criteria Sources
For the purpose of this report, the upper 90% confidence interval for recombined whole water concentrations (dissolved plus particulate phases) from 2001-2005 were compared to the most stringent agency criterion (Tables 4a and 4b) and exceedences were indicated by bold highlighted numbers. Using the upper 90% confidence interval is a more conservative approach to asses criteria exceedences than using the mean. The “most stringent agency criterion” cited in Tables 4a and 4b were taken from the following sources:
Canadian Council of Ministers of the Environment (CCME). “CEQG Online”. Canadian Environmental Quality Guidelines. 2009. CCME. July 14, 2009. < http://ceqg-rcqe.ccme.ca/>. IJC: (1) Specific Objectives. Annex 1 of the Great Lakes Water Quality Agreement of 1978, as amended 1987. NY State: Division of Water Technical and Operational Guidance Series (1.1.1), June 1998. New York State Department of Environmental Conservation, Albany, NY. Ontario MOE: (1) Water Management Policies, Guidelines, Provincial Water Quality Objectives. July 1994. U.S. EPA: National Recommended Water Quality Criteria. Office of Science and Technology, Washington, DC. May 21, 1999.

11
Table 4a. Comparison of RWW 90% CI With Agency Most Stringent Water Quality Criteria for Organic Contaminants
Parameter Units Criteria Agency Upper 90% CI (RWW Concentrations) 2001/02 2002/03 2003/04 2004/05 FE NOTL FE NOTL FE NOTL FE NOTL 1,2-Dichlorobenzene ng/L 3000 NYSDEC ND 0.4328 ND 0.3846 ND 0.3303 ND 0.3279 1,3-Dichlorobenzene ng/L 2500 MOE ND 0.3418 ND 0.3400 ND 0.3248 ND 0.2982 1,4-Dichlorobenzene ng/L 4000 MOE 0.4422 1.5797 0.3209 1.3183 0.2475 1.3969 ND 1.1174 1,3,5-Trichlorobenzene ng/L 650 MOE ND 0.0564 ND 0.0460 ND 0.0599 ND 0.0445 1,2,4-Trichlorobenzene ng/L 500 MOE 0.0258 0.4011 ND 0.3033 0.0267 0.2620 0.0266 0.2744 1,2,3-Trichlorobenzene ng/L 900 MOE 0.0118 0.0937 0.0064 0.0730 0.0102 0.0580 0.0162 0.1006 1,2,3,4-Tetrachlorobenzene ng/L 100 MOE 0.0066 0.2167 0.0051 0.1652 0.0052 0.1642 0.0050 0.2546 Pentachlorobenzene ng/L 30 MOE 0.0187 0.0961 0.0071 0.0639 0.0095 0.0553 0.0093 0.0891 Hexachlorobenzene ng/L 0.03 NYSDEC 0.0193 0.0676 0.0132 0.0436 0.0139 0.0388 0.0149 0.0651 Hexachlorobutadiene ng/L 10 NYSDEC 0.0021 0.0421 ND 0.0351 ND 0.0441 ND 0.0585 Hexachlorocyclopetadiene ng/L 450 NYSDEC ND 0.0411 ND ND 0.0034 0.0050 0.0030 0.0237 Heptachlor ng/L 0.2 NYSDEC ND ND ND ND ND ND ND ND Heptachlor Epoxide ng/L 0.3 NYSDEC 0.0489 0.0488 0.0335 0.0417 0.0306 0.0416 0.0329 0.0430 Aldrin ng/L 2 NYSDEC ND ND ND ND ND ND ND ND Octachlorosytrene ng/L 0.006 NYSDEC ND 0.0027 ND 0.0016 ND 0.0016 ND 0.0047 p,p-DDE ng/L 0.007 NYSDEC 0.0580 0.0416 0.0361 0.0245 0.0364 0.0322 0.0535 0.0507 p,p-TDE (p,p-DDD) ng/L 0.08 NYSDEC 0.0576 0.0570 0.0351 0.0335 0.0167 0.0380 0.0515 0.0147 o,p-DDT ng/L 0.0043 ND 0.0011 ND ND ND 0.0014 0.0045 p,p-DDT ng/L 0.01 NYSDEC 0.0265 0.0216 0.0108 0.0093 0.0199 0.0116 0.0181 0.0219 DDT (total) ng/L 0.01 NYSDEC 0.1470 0.1200 0.0831 0.0673 0.0730 0.0818 0.1240 0.0918 Mirex ng/L 0.001 NYSDEC ND 0.0112 ND 0.0039 ND 0.0032 ND 0.0069 Photomirex ng/L ND ND ND ND ND ND ND ND α-BHC ng/L 2 NYSDEC 0.1386 0.1952 0.0968 0.1392 0.1043 0.1409 0.1196 0.1455 -BHC ng/L 8 NYSDEC 0.2059 0.2508 0.1513 0.1798 0.1321 0.1554 0.1450 0.1360 Chlordane (total) ng/L 0.02 NYSDEC 0.0106 0.0225 0.00668 0.0132 0.00884 0.0134 0.00893 0.0116 Endosulfan (total) ng/L 9 NYSDEC 0.0322 0.0607 0.0217 0.0344 0.02700 0.0375 0.0150 0.0359 Dieldrin ng/L 0.0006 NYSDEC 0.1254 0.1364 0.1045 0.1177 0.0963 0.1112 0.0959 0.1114 Endrin ng/L 2 NYSDEC ND ND ND ND ND ND ND ND Endrin Aldehyde ng/L ND ND ND ND ND ND ND ND Methoxychlor ng/L 30 NYSDEC ND ND ND ND ND ND ND ND TCPCB1 ng/L 0.001 NYSDEC 0.2568 0.6479 0.1719 0.5515 0.2970 0.5040 0.1899 0.4912 2-Methylnaphthalene ng/L 4700 NYSDEC 0.7390 1.0214 0.6572 0.9386 0.8364 1.1062 0.7807 0.8101 1-Methylnaphthalene ng/L 2000 MOE (proposed) 0.4470 0.6252 0.4083 0.6898 0.7469 0.8300 0.6060 0.5928 Naphthalene2 ng/L 10000 NYSDEC 1.4598 1.8378 0.0418 0.2289 0.1438 0.3340 0.0768 0.2926 Fluorene ng/L 540 NYSDEC 0.5543 0.9201 0.5597 0.9329 0.6446 1.0159 0.7673 0.9046 Phenanthrene ng/L 5000 NYSDEC 2.3151 4.2657 1.6042 4.0988 2.8148 5.0183 3.0830 4.9740 Anthracene ng/L 3800 NYSDEC 0.2663 0.7863 0.2480 0.8001 0.3231 0.7380 0.2819 0.5915

12
Parameter Units Criteria Agency Upper 90% CI (RWW Concentrations) 2001/02 2002/03 2003/04 2004/05 FE NOTL FE NOTL FE NOTL FE NOTL Beta Chloronaphthalene ng/L 10000 NYSDEC ND ND ND ND ND ND ND ND Atrazine ng/L 1800 CCME 52.6850 46.4738 52.8754 52.2774 53.7910 59.8107 71.0492 71.9673 Metolachlor ng/L 3000 MOE (proposed) 12.9059 11.5100 11.9311 12.2244 13.8266 14.7083 15.0775 16.1649 Fluoranthene ng/L 50000 NYSDEC 3.0123 5.6909 1.6417 5.2444 3.1654 5.7100 2.8802 5.3598 Pyrene ng/L 4600 NYSDEC 2.1665 4.8284 1.0478 5.2603 2.4938 4.8385 1.9100 4.5803 Benz(a)anthracene ng/L 2.0 NYSDEC 0.9499 2.3032 0.4112 2.0763 0.9128 1.8961 0.9478 1.9597 Acenaphthylene ng/L No Criteria 0.1684 0.4250 0.1272 0.3464 0.1641 0.3233 0.1484 0.2594 Benzo(a)pyrene ng/L 1.2 NYSDEC 1.1680 2.5956 0.3943 1.8920 1.0139 1.9537 0.9620 2.2718 Indeno(1,2,3-c,d)pyrene ng/L 2.0 NYSDEC 0.9445 2.0572 0.4295 1.8154 0.9793 1.6264 0.8054 1.8923 Dibenz(a,h)anthracene ng/L 2 MOE (proposed) 0.1480 0.4214 0.0737 0.4134 0.1800 0.3257 0.1525 0.3826 Benzo(g,h,i)perylene ng/L 0.02 MOE (proposed) 0.8874 1.8765 0.4028 1.6357 1.0003 1.6181 0.6558 1.6395 Chrysene/Triphenylene ng/L 2.0 NYSDEC 1.3743 2.7463 0.6589 2.4462 1.1553 2.2169 1.1000 2.6812 Benzo(b+k)fluoranthene ng/L 2.0 NYSDEC 2.4170 4.5696 0.9314 3.9863 2.2510 4.1559 2.2204 5.1074
bold values represent Water Quality Criteria exceedences ND = not detected 1Upper 90%CI based on sediment contribution only. Field blank studies have shown the majority of the reported dissolved phase concentration is due to background contamination. 2Upper 90%CI based on sediment contribution only. Poor and variable recovery of the analyte in the dissolved phase
Our current analytical methodology does not distinguish between the two chemicals Chrysene and Triphenylene, nor the two isomers Benzo(b)- and Benzo(k)fluoranthene. Although the criteria are applicable to Chrysene alone (i.e., there is no criterion for Triphenylene), and to Benzo(b)- and Benzo(k)fluoranthene, in keeping with past practice, we have opted to be conservative in identifying an exceedance and are comfortable identifying these exceedences due to the magnitude by which the mean concentrations exceed the respective criteria. Also, we suspect that Chrysene is the contaminant that is being measured in the Niagara River (as opposed to Triphenylene), given its potential sources. Chrysene is a ubiquitous environmental contaminant that occurs as a product of the incomplete combustion of organic compounds. Anthropogenic sources of Chrysene include gasoline, diesel and aircraft turbine exhausts; coal combustion and gasification; emissions from coke ovens, wood burning stoves, and waste incineration; and various industrial processes such as iron, aluminum, and steel production. Chrysene is also a constituent of coal, oil, and their distillates, such as coal tar, and creosote. Triphenylene, on the other hand, is a minor constituent of gasoline and, while it is often found as a by product of industrial emissions, its concentration levels are relatively low unless measure directly downstream from a point source.

13
Table 4b. Comparison of Whole Water 90% CI With Agency Most Stringent Water Quality Criteria for Trace Metals
Parameter Units Criteria Agency Upper 90% CI (Whole Water Concentrations) 2001/02 2002/03 2003/04 2004/05 FE NOTL FE NOTL FE NOTL FE NOTL Aluminum ug/L 75 MOE 637 361 160 211 218 562 137 352 Antimony ug/L 3 NYSDEC 0.172 0.166 0.175 0.179 0.179 0.643 0.157 0.170 Arsenic ug/L 5 MOE (revised) 0.563 0.584 0.607 0.615 1.50 1.68 0.981 1.16 Barium ug/L 1000 NYSDEC 25.2 24.7 26.0 25.7 25.0 27.4 24.0 26.3 Beryllium ug/L 1100 MOE 0.018 0.015 0.009 0.014 0.009 0.022 0.007 0.023 Cadmium ug/L 0.2 IJC 0.020 0.020 0.021 0.024 0.027 0.033 0.019 0.038 Chromium ug/L 50 IJC 0.757 0.755 0.320 0.501 0.418 1.14 0.292 0.717 Cobalt ug/L 5 NYSDEC 0.370 0.268 0.123 0.196 0.219 0.242 0.108 0.306 Copper ug/L 10.5 NYSDEC 1.67 1.60 1.33 1.53 1.24 1.57 1.22 1.84 Iron ug/L 300 MOE 737 514 246 390 593 539 217 669 Lithium ug/L No Criteria 2.38 2.40 2.026 2.32 2.17 2.65 2.14 2.72 Manganese ug/L 300 NYSDEC 24.3 16.0 8.52 13.4 11.5 16.9 7.85 22.0 Molybdenum ug/L 10 MOE (proposed) 1.29 1.34 1.46 1.47 1.42 1.45 1.35 1.36 Nickel ug/L 25 MOE 1.94 1.53 1.15 1.39 1.17 1.55 1.11 1.70 Lead ug/L 2.5 USEPA 0.782 0.629 0.360 0.524 0.365 0.746 0.355 0.792 Selenium ug/L 4.6 NYDSDEC 0.175 0.168 0.172 0.164 0.220 0.215 0.200 0.183 Silver ug/L 3.2 USEPA 0.003 0.005 ND 0.003 0.003 0.013 0.004 0.011 Strontium ug/L No Criteria 165 163 173 172 167 174 173 172 Vanadium ug/L 14* NYSDEC 0.906 0.792 0.506 0.607 0.536 0.761 0.504 0.899 Zinc ug/L 20 MOE (revised) 3.54 3.04 2.13 3.20 2.38 2.92 1.31 4.06 Mercury ng/L 1.3 USEPA 1.26 1.60 0.31 0.84 0.69 1.02 0.38 0.70
bolded values represent Water Quality Criteria exceedences ND = not detected *NOTE: results shown in Table 4b represent “Whole Water” metal concentrations while the Water Quality Criteria for Metals are based on the dissolved phase Aluminum Criteria is based upon “clay-free” samples; however, trace metal samples were not filtered and; therefore may contain clay particles Mercury values based on sediment contribution only (field blank studies indicate majority of dissolved phase concentration is due to background contamination)

14
Briefly, when considering the upper 90% CI, Tables 4a and 4b show the following:
17 of the 71 compounds sampled show exceedences of the strictest agency guidelines between 2001/02 and 2004/05.
13 of the 17 compounds that show exceedences, including Dieldrin,
Hexachlorobenzene, Total Chlordane, Mirex, pp-DDT, pp-DDE, Total DDT, TPCB, Benz(a)anthracene, Benzo(b/k)flouranthene, Chrysene/Triphenylene, Benzo(a)pyrene, and Mercury, are part of the NRTMP’s 18 “Priority Toxics”.
The remaining 4 compounds that exceed strictest agency guidelines include
Benzo(g,h,i)perylene, Indeno(1,2,3-c,d)pyrene, Aluminum, and Iron.
Mirex, Hexachlorobenzene, Chrysene/Triphenylene, Total Chlordane, Benzo(a)pyrene, Benz(a)anthracene, Indeno(1,2,3-c,d)pyrene, Iron, and Mercury exceeded their criteria only at NOTL.
Dieldrin p,p-DDT, p,p-DDE, Total DDT, TCPCBs, Benzo(b/k)fluoranthene,
Benzo(g,h,i)perylene, and Aluminum exceeded strictest agency criteria at both FE and NOTL, suggesting Lake Erie/upstream sources to the River.
Aluminum exceeded strictest agency guidelines at FE and NOTL in all four years
(2001/02 to 2004/05); however, this is based upon a “clay-free” criteria which does not necessarily reflect the analytical method use for this compound.
Based on the particulate phase only, Mercury concentrations exceeded the strictest
whole water criteria (1.3 ng/L) once in the four year period (2001/02) and only at the NOTL site.
3.2 Water Quality Trends In addition to identifying water quality criteria exceedences, the Niagara River Upstream/Downstream Monitoring Program is used to examine trends in the concentration and loadings of toxic compounds. Changes in the collection, analysis, and interpretation protocols beginning in April of 2005 mean that the 2001-2005 data represent the last samples of the “old method”; therefore, it is fitting to examine some of the more common “trends” that have emerged over the past 19 years. Figures 2-7 show graphs of the annual MLEs and Upper 90% CIs for selected NRTMP “Priority Toxics” over the period 1986/87 to 2004/05. Comparison of the trends at FE and NOTL can provide insightful information on both the sources of these “Priority Toxics” to the River, and also what is happening with respect to inputs from these sources. Interestingly, these station trends can be quite similar or drastically different. For example, the trends for Dieldrin at both stations are very similar, while the trends for Hexachlorobenzene (HCB) at the two stations are quite different. The trend of Dieldrin concentration in the dissolved phase at NOTL and FE is shown in Figure 2. The concentrations and rate of decrease are similar at both stations. This suggests that the major input of Dieldrin to the River is from Lake Erie/upstream, and that the changes occurring at both the FE and

15
NOTL stations are being dictated by what is happening to Dieldrin concentrations upstream of the River.
Dieldrin in the Dissolved Phase
0.00
0.05
0.10
0.15
0.20
0.25
0.30
0.35
0.40
1986
-198
7
1987
-198
8
1988
-198
9
1989
-199
0
1990
-199
1
1991
-199
2
1992
-199
3
1993
-199
4
1994
-199
5
1995
-199
6
1996
-199
7
1997
-199
8
1998
-199
9
1999
-200
0
2000
-200
1
2001
-200
2
2002
-200
3
2003
-200
4
2004
-200
5
Year
Co
nc.
(n
g/L
)
NOTL Annual MLE NOTL Upper 90% CI FE Annual MLE FE Upper 90% CI
Figure 2. Annual Dissolved Phase MLE & Upper 90% CI of Dieldrin from 1986/87 to 2004/05
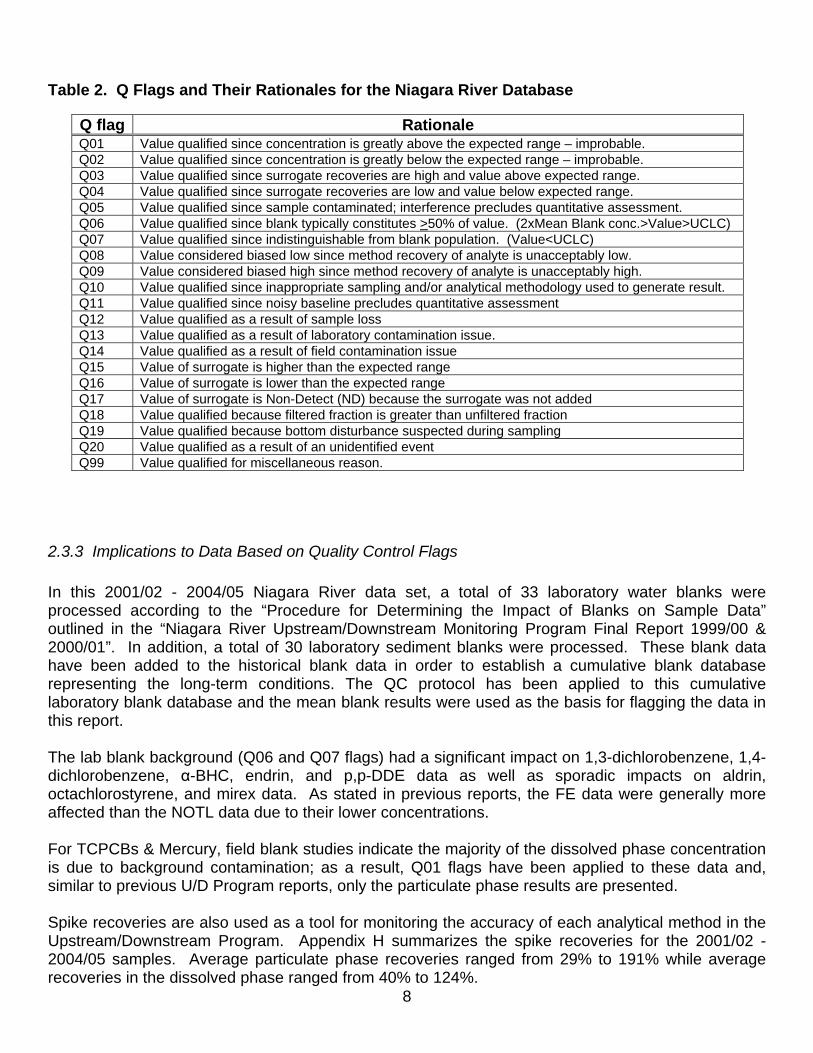
The changes in the HCB concentration on the suspended sediment using annual MLEs at the NOTL and FE stations is shown in Figure 3. In contrast to Dieldrin, the concentrations are vastly different at the two stations. At NOTL, concentrations in 1986/87 were 30 times higher than those seen at FE. Concentrations, decreased fairly rapidly in the 1980s, and subsequently declined more slowly until 2004/05, at which time NOTL concentrations are about 10 times greater than those measured at FE. In contrast, at FE over the same time period, the concentrations are extremely low, often below the PDL, but still show a decrease. The FE data show that there is a small, but steady input of HCB to the River from sources in Lake Erie/upstream. The much higher concentrations measured in the mid-80s at NOTL indicate that there were Niagara River sources of this chemical to the River. The rapid decline in concentrations seen from the mid-80s to the early ‘90s, however, points to the effectiveness of remediation at these sources in reducing HCB inputs to the River, thus, lowering the HCB concentration in the River. The slowing of this decline suggests that the implemented remedial measures are having less influence in further reducing the input of HCB to the River. The fact that suspended sediment concentrations at NOTL are still about 10X higher than at FE attests to the fact that there are still inputs of this chemical to the River from Niagara River sources.
16
Hexachlorobenzene in Suspended Sediment
0.00
10.00
20.00
30.00
40.00
50.00
60.00
1986
-198
7
1987
-198
8
1988
-198
9
1989
-199
0
1990
-199
1
1991
-199
2
1992
-199
3
1993
-199
4
1994
-199
5
1995
-199
6
1996
-199
7
1997
-199
8
1998
-199
9
1999
-200
0
2000
-200
1
2001
-200
2
2002
-200
3
2003
-200
4
2004
-200
5
Year
Co
nc.
(n
g/g
)NOTL Annual MLE NOTL Upper 90% CI FE Annual MLE FE Upper 90% CI
Figure 3. Annual Suspended Sediment MLE & Upper 90% CI of Hexachlorobenzene from 1986/87 to 2004/05
Mirex in Suspended Sediment at NOTL
0.00
2.00
4.00
6.00
8.00
10.00
12.00
1986
-198
7
1987
-198
8
1988
-198
9
1989
-199
0
1990
-199
1
1991
-199
2
1992
-199
3
1993
-199
4
1994
-199
5
1995
-199
6
1996
-199
7
1997
-199
8
1998
-199
9
1999
-200
0
2000
-200
1
2001
-200
2
2002
-200
3
2003
-200
4
2004
-200
5
Year
Co
nc.
(n
g/g
)
Annual MLE Upper 90% CI
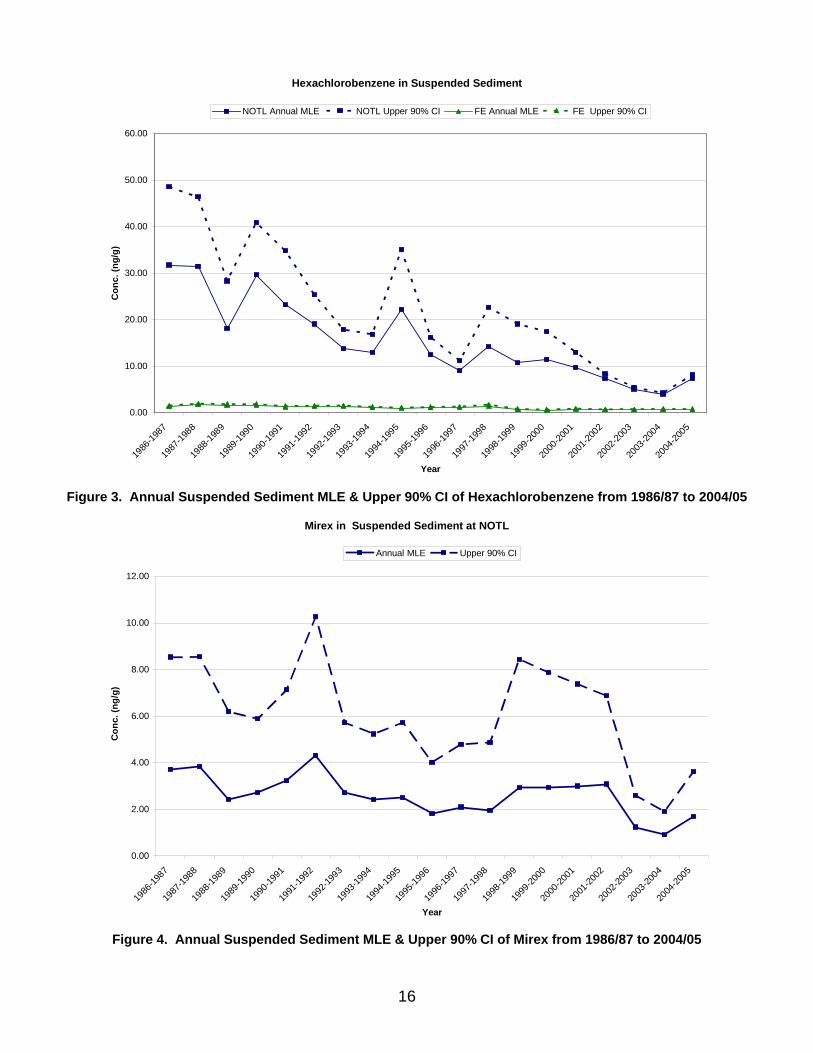
Figure 4. Annual Suspended Sediment MLE & Upper 90% CI of Mirex from 1986/87 to 2004/05

17
In some cases, compounds are not detected at the upstream FE site and trends can only be seen at NOTL. This is the case, for example, for Octachlorostyrene and Mirex (see Figure 4). This indicates that the chemical is originating from Niagara River sources, and the concentrations and changes in concentration reflect what is happening at those sources. The PAHs Benzo(b/k)fluorathene and Benzo(a)pyrene are shown in Figures 5 and 6, respectively. The results suggest that there is an increasing trend for these contaminants in the suspended sediment at FE and NOTL. It is also interesting to note that the spike in the PAH concentrations at FE in 2000/01 appears to be an anomaly as recent data suggest that NOTL concentrations are consistently higher than those at FE. A review of the FE data indicates that the high annual mean concentration reported in 2000/01 was related to a few exceptionally high values in May and June 2000 for several of the PAHs.
Benzo (b/k) Fluoranthene in Suspended Sediment
0
200
400
600
800
1000
1200
1400
1600
1986
-198
7
1987
-198
8
1988
-198
9
1989
-199
0
1990
-199
1
1991
-199
2
1992
-199
3
1993
-199
4
1994
-199
5
1995
-199
6
1996
-199
7
1997
-199
8
1998
-199
9
1999
-200
0
2000
-200
1
2001
-200
2
2002
-200
3
2003
-200
4
2004
-200
5
Year
Co
nc.
(n
g/g
)
NOTL Annual MLE NOTL Upper 90% CI FE Annual MLE FE Upper 90% CI
Figure 5. Annual Suspended Sediment MLE & Upper 90% CI of Benzo(b/k)Fluoranthene from 1986/87 to 2004/05
The trend analysis for Arsenic was (Fig. 7) was performed for the period of 1986/87 to 2004/05; however, an analytical method change beginning in 2003/04 does not allow for a meaningful comparison with earlier data. The new method reports whole water concentrations that are approximately 2X higher than the old method; however, these concentrations remain well below the NYSDEC criterion of 5.0 ug/L. The new method provides better sensitivity which should improve our ability to determine upstream/downstream differences in concentration. The analysis indicates no significant trend at FE while the results at NOTL show a significant decreasing trend of concentration of 31%.

18
Benzo (a) Pyrene in Suspended Sediment
0
100
200
300
400
500
600
700
1986
-198
7
1987
-198
8
1988
-198
9
1989
-199
0
1990
-199
1
1991
-199
2
1992
-199
3
1993
-199
4
1994
-199
5
1995
-199
6
1996
-199
7
1997
-199
8
1998
-199
9
1999
-200
0
2000
-200
1
2001
-200
2
2002
-200
3
2003
-200
4
2004
-200
5
Year
Co
nc.
(n
g/g
)
NOTL Annual MLE NOTL Upper 90% CI FE Annual MLE FE Upper 90% CI
Figure 6. Annual Suspend Sediment MLE & Upper 90% CI of Benzo(a)Pyrene from 1986/87 to 2004/05
Arsenic in Whole Water
0.00
0.50
1.00
1.50
2.00
2.50
3.00
1986
-198
7
1987
-198
8
1988
-198
9
1989
-199
0
1990
-199
1
1991
-199
2
1992
-199
3
1993
-199
4
1994
-199
5
1995
-199
6
1996
-199
7
1997
-199
8
1998
-199
9
1999
-200
0
2000
-200
1
2001
-200
2
2002
-200
3
2003
-200
4
2004
-200
5
Year
Co
nc.
(u
g/L
)
NOTL Annual MLE NOTL Upper 90% CI FE Annual MLE FE Upper 90% CI
Analytical method change
Figure 7. Annual Whole Water MLE & Upper 90% CI of Arsenic from 1986/87 to 2004/05

19
For those compounds which have sufficient data for calculating a trend, the decreases in the concentrations for the majority of chlorobenzenes and organochlorine pesticides over the 1986 - 2005 time period have been greater than 50%, except for the dissolved phase concentration of dieldrin at NOTL (-42.0%), the suspended sediment phase concentration of α-chlordane at NOTL (-48.9%) and the suspended sediment phase concentration of PCBs at FE (-45.0%). For many, the decreases have been greater than 70%. It is interesting to note that two of the PAHs, benzo(a)pyrene and benzo(b/k)fluoranthene exhibited an increasing trend at both FE and NOTL in the suspended sediment phase concentration. The increases range from 55% to 110% over the 1986 - 2005 time period. The reason for the increases is not known at present, but one theory is that they may be due to the change in the characteristics of the bottom sediments as a result of zebra and quagga mussel colonization of the eastern basin of Lake Erie. For example, changes in bottom sediment grain size from coarse sand to fine silt size particles and an increase in sediment total organic carbon (TOC) content have been documented at a station just off the Niagara River in the eastern basin of the lake (Howell et al. 1996). Both these factors, along with the changes in contaminant cycling in the lake as a result of mussel colonization, would tend to favour greater adsorption of contaminants onto the sediments. Indeed, the same researchers found an increase in the bottom sediment PAH concentrations at the same station. Evidence also seems to suggest that increasing PAH levels may be related to increased vehicular traffic at border crossings in the Niagara region. According to a Canada-United States Transportation Border Working Group report (Beningo, 2006), truck crossings entering the United States increased by 29% between the 1994 signing of the North American Free Trade Agreement (NAFTA) and 2005. Assuming a similar increase in Canada bound crossings and taking into consideration longer idling times due to heightened security measures may explain some increases in PAH concentrations in the Niagara River. Evidence also suggests that the Niagara region, like many areas throughout the Great Lakes Basin, may be experiencing increased PAH levels due to increases in vehicular traffic associated with general urbanization (Van Metre et al., 2000) as well as increasing use of coal for power and steel production (Simcik and Offenberg, 2006). It should be noted that PAHs are routinely formed through the combustion process. Natural sources of PAHs include events such as forest fires while anthropogenic sources include the burning of petroleum and coal in vehicles, boats and industrial boilers/furnaces (EPA 2007). The conditions of combustion and the nature of the fuel consumed dictate the type and amount of PAH formed. Other sources of PAHs to the environment include the direct discharge or accidental spilling of PAH containing oil and gasoline.
3.3 Niagara River Sources
In addition to identifying exceedences and examining trends in toxic chemical concentrations and loadings, the Niagara River Upstream/Downstream Program provides a means of comparing concentrations at NOTL to those measured at FE to identify chemicals with Niagara River sources. A statistical analysis was done to determine if there is a significant difference in concentrations between NOTL and FE (El-Shaarawi, pers. comm.). Based on statistics, the SIGNIFICANCE of the annual MLE ratio is determined by the range of values between the upper and lower 90% CI (Appendix G). If this range includes unity (i.e. a value of “1”), then the upstream/downstream difference is NOT considered to be significant.

20
Tables 5a and 5b show only the statistically significant downstream-upstream ratios of the annual MLE ([MLE]NOTL/[MLE]FE) for Organic RWW and Trace Metal Whole Water (WW) concentrations respectively. MLE ratios greater than one indicate a higher concentration of the analyte at the downstream (NOTL) site while, conversely, ratios less than one (bold text) indicate a higher concentration at the upstream site (FE). Based on this analysis, it is clear that there continues to be Niagara River sources for many of the organic and trace metal compounds. From 2001/02 to 2004/05, the number of analytes found in higher concentrations at FE has declined from 15 to 3 while several compounds have shown an increase in their ratio value and number of compounds detected ONLY at NOTL has increased slightly from 6 to 8. Closer examination of this method of analysis; however, does draw attention to some anomalies in the results. For example, the significant ratios for the DDT metabolites my be misleading in terms of their suggestion of Lake Erie as a potential source since investigations suggest a local DDT source in sediments. More significantly, based on this approach, Dieldrin appears to have significant Niagara River sources despite the fact that physical evidence suggests this compound is ubiquitous in the environment (Jorgenson 2001). As a result, investigations are underway to determine whether or not similar statistical analysis conducted with 95% and/or 99% confidence intervals will result in the same outcomes.
Table 5a. Ratio of Organic RWW Means (NOTL/FE) at the 90% Confidence Level
FISCAL YEAR COMPOUND 2001/02 2002/03 2003/04 2004/05
Benzo(b/k)fluoranthene 1.9365 4.1706 1.9362 2.3533 Chrysene/Triphenylene 2.0273 3.6315 1.9986 2.5066 Hexachlorobutadiene 19.7573 NOTL NOTL NOTL Fluoranthene 1.9088 3.1328 1.8687 1.8862 Pyrene 2.2743 4.6988 2.0800 2.4792 Benz(a)anthracene 2.4565 4.9402 2.1813 2.2059 Benzo(a)pyrene 2.2115 4.6918 2.0252 2.4271 2-Methyl Naphthalene 1.3628 1.4272 1.3218 NS 1-Methyl Naphthalene 1.3700 1.6237 NS NS Acenaphthylene 2.4872 2.6839 2.0242 1.7488 Fluorene 1.6085 1.6985 1.6062 1.1841 Phenanthrene 1.8442 2.5096 1.8391 1.6234 p,p-DDE 0.7077 0.6511 0.8948 NS p,p-DDD NS 0.92531 0.66631 0.44231 p,p-DDT 0.25971 0.37321 0.76911 0.61071 o,p-DDT FE1 0.71411 NS 1.61321 Indeno(1,2,3-cd)pyrene 2.2165 4.1542 1.8030 2.4944 Benzo(g,h,i)perylene 2.1541 3.9620 1.7271 2.6120 Naphthalene 1.2293 2.37371 2.41761 3.9139 Anthracene 2.9272 3.2824 2.3296 2.1587 Dibenzo(a,h)anthracene 1.72041 2.65181 2.05071 1.49991 Atrazine 0.84092 NS 1.13452 NS Metolachlor 0.85272 1.02902 1.06472 1.07112 Hexachlorobenzene 3.4535 3.2490 2.7914 4.2795 Alpha-BHC 1.3762 1.4349 1.3744 1.2442 Gamma-BHC 1.15362 1.1932 1.14212 NS Heptachlor Epoxide NS 1.23292 1.35152 1.30082 Gamma Chlordane 1.8503 1.5103 NS NS Alpha Chlordane 1.29201 NS 1.21051 NS

21
FISCAL YEAR COMPOUND 2001/02 2002/03 2003/04 2004/05
Alpha Endosulfan 1.55072 1.38352 1.32932 1.29872 Beta Endosulfan 2.2703 1.31382 1.23952 NOTL Dieldrin 1.0541 1.1229 1.1541 1.1647 Mirex NOTL1 NOTL1 NOTL1 NOTL1 Total PCBs 2.60931 1.59921 1.62511 1.63391 1,3-Dichlorobenzene NOTL2 NOTL2 NOTL2 NOTL 1,4-Dichlorobenzene 3.38732 4.20032 5.62952 NOTL 1,2-Dichlorobenzene NOTL2 NOTL2 NOTL2 NOTL2 1,3,5-Trichlorobenzene NOTL NOTL2 NOTL NOTL 1,2,4-Trichlorobenzene 13.65512 15.35632 9.28832 9.57282 1,2,3-Trichlorobenzene 7.28952 11.14362 5.27282 5.95322 1,2,3,4-Tetrachlorobenzene 29.28932 28.47432 28.54132 43.96882 Pentachlorobenzene 5.0326 5.7099 8.7558 9.4648 Hexachlorocyclopentadiene NOTL2 NS 1.46392 5.91272 Octachlorostyrene NOTL1 NOTL1 NOTL1 NOTL1
1Suspended sediments only 2Dissolved phase only NS = no STATISTICALLY SIGNIFICANT difference FE = compound only found in Fort Erie samples NOTL = compound only found in Niagara-On-The-Lake samples BOLD = significant upstream source (i.e. FE > NOTL)
Table 5b. Ratio of Trace Metal WW Means (NOTL/FE) at the 90% Confidence Level
FISCAL YEAR
COMPOUND 2001/02 2002/03 2003/04 2004/05 Aluminum 0.62206 1.30089 2.33689 2.50351 Arsenic 1.03562 NS NS 1.16836 Barium NS NS 1.08565 1.08949 Beryllium 0.84141 1.52644 2.19195 3.21867 Cadmium NS 1.16321 1.19175 1.88246 Cobalt 0.77333 1.57838 NS 2.73635 Chromium NS 1.53977 2.39869 2.36637 Copper NS 1.14960 1.25192 1.46833 Iron 0.75751 1.57389 NS 3.00718 Lithium NS 1.13955 1.20468 1.25094 Manganese 0.70369 1.55815 1.50444 2.71362 Molybdenum 1.03520 NS 1.01562 NS Nickel 0.81168 1.20199 1.30946 1.49195 Lead 0.84367 1.44163 1.94846 2.22183 Antimony 0.97460 1.02251 2.85237 1.07515 Selenium NS 0.95398 NS 0.90826 Strontium 0.98835 0.99132 1.03978 NS Vanadium 0.89462 1.19508 1.39372 1.72788 Zinc NS 1.50597 1.24871 3.03317 Silver 1.37026 NOTL 3.35489 2.89535 Mercury 1.410411 1.641431 1.633641 1.380971
1Suspended sediments only 2Dissolved phase only NS = no STATISTICALLY SIGNIFICANT difference FE = compound only found in Fort Erie samples NOTL = compound only found in Niagara-On-The-Lake samples BOLD = significant upstream source (i.e. FE > NOTL)

22
4.0 Summary This report has summarized results from the Upstream/Downstream Program for the four year period between 2001/02 and 2004/05. These results indicate that:
there are still several compounds which exceed strictest agency guidelines within the Niagara River
there are still compounds which show trends of increasing concentration
there are still compounds which show statistically significant evidence of Niagara River sources.
More specifically, this report highlights that the following still remain an issue in the Niagara River:
Mirex The U/D Program detected Mirex in the suspended particulate fraction only at NOTL, indicating Niagara River sources. The concentration in the sediment still exceeds the strictest agency criterion at NOTL.
HCB HCB still exceeds its strictest agency criterion at NOTL. The concentrations are still much higher at NOTL than at FE suggesting continuing Niagara River inputs.
PAHs Chrysene/triphenylene, benzo(b/k)fluoranthene and benzo(a)pyrene concentrations still exceed their respective criteria with the latter two compounds exhibiting a trend towards increasing concentrations over the 1986/87 to 2004/05 time period.
Dieldrin: Concentrations at both sites continue to exceed strictest agency; however, the concentrations measured at both sites are similar enough to suggest sources upstream of the Niagara River.
DDT & metabolites Total DDT and two of the three metabolites still exceed strictest agency criteria at both sites.
PCBs Focusing only on the suspended particulate phase (due to contamination of dissolved phase samples), PCBs exceed agency criterion at both stations and statistical analysis of U/D data indicates continuing Niagara River sources.
Aluminum Aluminum exceeded the strictest agency guideline at FE and NOTL in all four years (2001/02 to 2004/05); however, this is based upon a “clay-free” criteria which does not necessarily reflect the analytical method use for this compound.
Iron Iron exceeded the strictest agency guideline at NOTL in all four years (2001/02 to 2004/05) and at Fort Erie in two (2001/02 and 2003/04) of the four years.
Mercury Based on the particulate phase only, Mercury concentrations exceeded the strictest whole water criteria (1.3 ng/L) once in the four year period (2001/02) and only at the NOTL site.

23
5.0 Acknowledgements The authors would like to thank Bruce Harrison and Mary Lou Archer for their dedication to the field sampling program; also, the staff of the Chemistry Services Unit – WQMS-ON and NLET for the analysis of these samples.

24
6.0 References Anthony, D.J. 1994. Large sample extraction systems with analytical solvent recovery for low flow applications. NWRI Contribution No. 94-69. Environment Canada, Burlington. Ballschmitter, K. and Zell, M. 1980. Analysis of polychlorinated biphenyl (PCB) by glass capillary gas chromatography. Composition of technical Aroclor- and chlophen-PCB mixtures. Fresenius’ Z Anal. Chem. 302:20-31 Beningo, S. 2006. Trends in Border Crossing Volumes 1994-2005. Presentation to the Transportation Border Working Group. Niagara Falls, Ontario. October 23 Canadian Council of Ministers of the Environment (CCME). “CEQG Online”. Canadian Environmental Quality Guidelines. 2009. CCME. July 14, 2009. < http://ceqg-rcqe.ccme.ca/>. Data Interpretation Group. 1997. Joint Evaluation of Upstream/Downstream Niagara River Data 1995-96. A joint publication of New York State Department of Environmental Conservation, Environment Canada, U.S. Environmental Protection Agency, and Ontario Ministry of the Environment. Data Interpretation Group. 1999. Joint Evaluation of Upstream/Downstream Niagara River Data 1996-97. A joint publication of New York State Department of Environmental Conservation, Environment Canada, U.S. Environmental Protection Agency, and Ontario Ministry of the Environment. Data Interpretation Group. 2002. Upstream/Downstream Niagara River Monitoring Program Final Report - 1997-98 and 1998-99. A joint publication of New York State Department of Environmental Conservation, Environment Canada, U.S. Environmental Protection Agency, and Ontario Ministry of the Environment. Eadie, B.J., and A.J. Robertson. 1976. An IFYGL carbon budget for Lake Ontario. J Great Lakes Res. 2:307-323. El-Shaarawi, A.H. 1989. Inferences about the mean from censored water quality data. Wat. Resour. Res. 25(4)685-690. El-Shaarawi, A.H. 2008. Personal Communication Harrison, B., B. Hill, and P. Klawunn. SOP 06-6001 - Standard Operating Procedure For The Collection Of Water And Suspended Sediment Samples At The Niagara River Monitoring Stations (Fort Erie And Niagara-On-The-Lake) By The Ontario Water Quality Monitoring And Surveillance Office (Wqms) Of Environment Canada. IJC: (1) Specific Objectives. Annex 1 of the Great Lakes Water Quality Agreement of 1978, as amended 1987.

25
Jorgenson, J. L. 2001. Aldrin and dieldrin: a review of research on their production, environmental deposition and fate, bioaccumulation, toxicology, and epidemiology in the United States. Environ. Health Perspect. 109 Suppl. 1,113-139 Kemp, A.L.W., and N.S. Harper. 1976. Sedimentation rates and a sediment budget for Lake Ontario. J. Great Lakes Res. 2:324-340. Klawunn, P.J., and M.E. Comba. 2001. Niagara River Field Blank Study, Large Volume Extractor and XAD Resin Comparison, Environment Canada Report, February 2001. Kuntz, K.W. 1994. A Comparison of Extraction Efficiencies of Organic Contaminants in the Niagara River between the Goulden Large Sample Extractor (GLSE) and the New (GLSE/SR) with Solvent Recovery. Environment Canada, Burlington, (Draft Report). Martin, J., R. Gilliom, and T. Schertz. 1998. Summary and Evaluation of Pesticides in Field Blanks Collected for the National Water-Quality Assessment Program, 1992-95, U.S. Geological Survey Open – File Report 98-412. Niagara River Secretariat; 2007; Niagara River Toxics Management Plan (NRTMP) Progress Report and Work Plan. NRAP. 2000. Method Guide for the Analysis of Chlorobenzenes, Organochlorine Pesticides, Total Polychlorinated Biphenyls and Polynuclear Aromatic Hydrocarbons in Niagara River Samples. Prepared by M. E. Comba, P.J. Klawunn and E. Sverko, National Laboratory for Environmental Testing (NLET), Environment Canada, October 2000. NRAP. 1992. Analytical Protocol for Monitoring Ambient Water Quality at the Niagara-on-the-Lake and Fort Erie Stations. Analytical Protocol Group. A joint report by Environment Canada, U.S. Environmental Protection Agency, New York State Department of Environmental Conservation, and the Ontario Ministry of the Environment. NRSP. 1995. Niagara River Upstream/Downstream Sampling Protocol. Joint report of Environment Canada, United States Environmental Protection Agency, New York State Department of Environmental Conservation, and Ontario Ministry of Environment. NRSP. 2003. Niagara River Upstream/Downstream Sampling Protocol. Joint report of Environment Canada, United States Environmental Protection Agency, New York State Department of Environmental Conservation, and Ontario Ministry of Environment, Report No. EHD/ECB-OR/03-05/I. Environment Canada, Burlington. NRTC. 1984. Report of the Niagara River Toxics Committee. Joint Report of Environment Canada, the United States Environmental Protection Agency (II), New York State Department of Environmental Conservation, and the Ontario Ministry of the Environment. O’Connor, D.J., and J.P. Connolly. 1980. The effect of concentration of adsorbing solids on the partition coefficient. Wat. Res. 14:1517-1523. NY State: Division of Water Technical and Operational Guidance Series (1.1.1), June 1998. New York State Department of Environmental Conservation, Albany, NY.

26
Ontario MOE: (1) Water Management Policies, Guidelines, Provincial Water Quality Objectives. July 1994. Simcik, M.A. and J.H. Offenberg. “Polycyclic Aromatic Hydrocarbons in the Great Lakes”. Persistant Organic Pollutants In The Great Lakes. Edited by R.A. Hites. Vol. 5N. The Handbook Of Environmental Chemistry. 2006. pp. 307-353. U.S. EPA: National Recommended Water Quality Criteria. Office of Science and Technology, Washington, DC. May 21, 1999. Van Metre, Peter C.; Barbara J. Mahler; and Edward T. Furlong., 2000, “Urban Sprawl Leaves its PAH Signature”, Environ. Sci. Technol., v34, p.4064-4070 Williams, D.J., M. Neilson, J. Merriman, S. L’Italien, S. Painter, K. Kuntz, and A. El-Shaarawi. 2000. The Niagara River Upstream/Downstream Program 1986/87-1996/97. Report No. EHD/ECB-OR/00-01/I. Environment Canada, Burlington. The National Laboratory for Environmental Testing, 2001. Protocol 09-010 Protocol for the Application of Blank Sample Residue Values to Sample Data

7.0 Appendicies

Appendix A: Niagara-on-the-Lake Raw Data Results Where : T - trace value L - less than detection limit V - valid Q01 Value qualified since concentration is greatly above the expected range – improbable. Q02 Value qualified since concentration is greatly below the expected range – improbable. Q03 Value qualified since surrogate recoveries are high and value above expected range. Q04 Value qualified since surrogate recoveries are low and value below expected range. Q05 Value qualified since sample contaminated; interference precludes quantitative assessment. Q06 Value qualified since blank typically constitutes >50% of value. (2xMean Blank conc.>Value>UCLC) Q07 Value qualified since indistinguishable from blank population. (Value<UCLC) Q08 Value considered biased low since method recovery of analyte is unacceptably low. Q09 Value considered biased high since method recovery of analyte is unacceptably high. Q10 Value qualified since inappropriate sampling and/or analytical methodology used to generate result. Q11 Value qualified since noisy baseline precludes quantitative assessment Q12 Value qualified as a result of sample loss Q13 Value qualified as a result of laboratory contamination issue. Q14 Value qualified as a result of field contamination issue Q15 Value of surrogate is higher than the expected range Q16 Value of surrogate is lower than the expected range Q17 Value of surrogate is Non-Detect (ND) because the surrogate was not added Q18 Value qualified because filtered fraction is greater than unfiltered fraction Q19 Value qualified because bottom disturbance suspected during sampling Q20 Value qualified as a result of an unidentified event Q99 Value qualified for miscellaneous reason.

Appendix B: Fort Erie Raw Data Results
Where : T - trace value L - less than detection limit V - valid Q01 Value qualified since concentration is greatly above the expected range – improbable. Q02 Value qualified since concentration is greatly below the expected range – improbable. Q03 Value qualified since surrogate recoveries are high and value above expected range. Q04 Value qualified since surrogate recoveries are low and value below expected range. Q05 Value qualified since sample contaminated; interference precludes quantitative assessment. Q06 Value qualified since blank typically constitutes >50% of value. (2xMean Blank conc.>Value>UCLC) Q07 Value qualified since indistinguishable from blank population. (Value<UCLC) Q08 Value considered biased low since method recovery of analyte is unacceptably low. Q09 Value considered biased high since method recovery of analyte is unacceptably high. Q10 Value qualified since inappropriate sampling and/or analytical methodology used to generate result. Q11 Value qualified since noisy baseline precludes quantitative assessment Q12 Value qualified as a result of sample loss Q13 Value qualified as a result of laboratory contamination issue. Q14 Value qualified as a result of field contamination issue Q15 Value of surrogate is higher than the expected range Q16 Value of surrogate is lower than the expected range Q17 Value of surrogate is Non-Detect (ND) because the surrogate was not added Q18 Value qualified because filtered fraction is greater than unfiltered fraction Q19 Value qualified because bottom disturbance suspected during sampling Q20 Value qualified as a result of an unidentified event Q99 Value qualified for miscellaneous reason.
Appendix C: MLE Results for Organic Contaminants in Water (ng/L) and Suspended Solids (ng/g) and Loads (kg/day) for the Water Phase

Appendix D: MLE Outputs for Particulate Phase Converted to ng/L and Loads in kg/day

Appendix E: MLE Concentration (ng/L) and Load (kg/day) Outputs for Recombined Whole Water (RWW)

Appendix F: MLE Output Concentrations (mg/L) and Loads (kg/day) for Total Metals

Appendix G: MLE Ratios (2001/02 - 2004/05)

Appendix H: Spike Recoveries (2001/02 - 2004/05)

Appendix I: Protocol Changes: 1986 - 2005
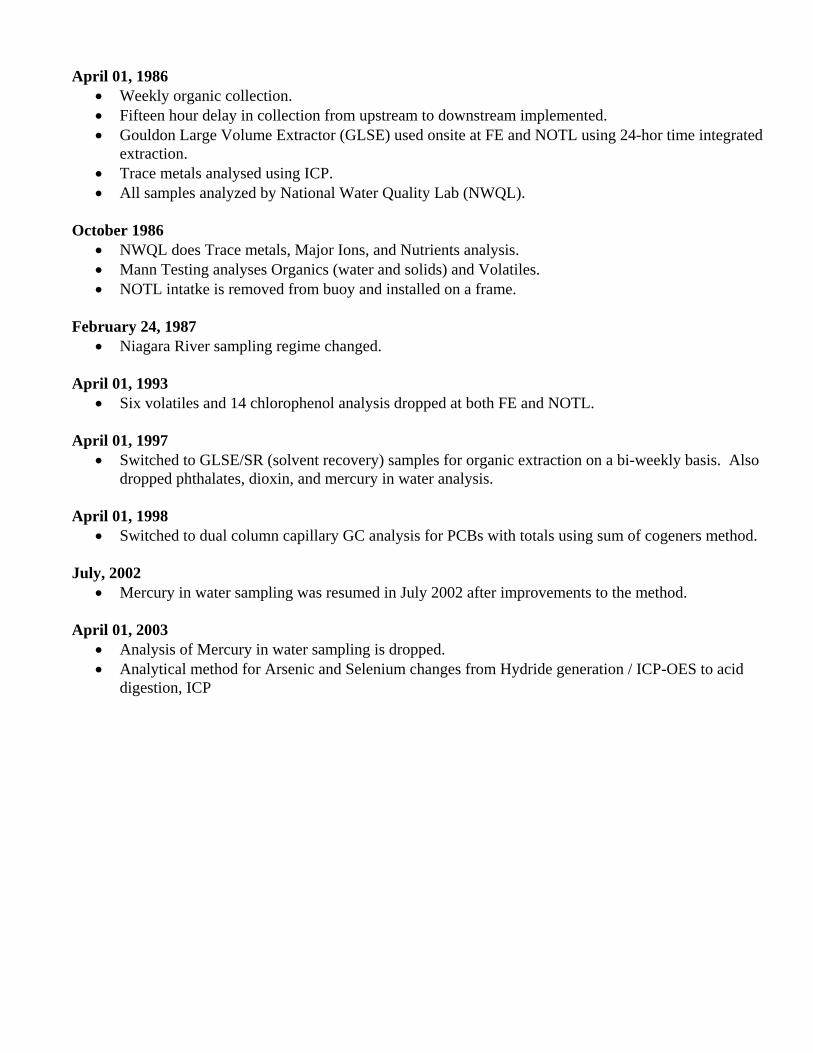
April 01, 1986 Weekly organic collection. Fifteen hour delay in collection from upstream to downstream implemented. Gouldon Large Volume Extractor (GLSE) used onsite at FE and NOTL using 24-hor time integrated
extraction. Trace metals analysed using ICP. All samples analyzed by National Water Quality Lab (NWQL).
October 1986
NWQL does Trace metals, Major Ions, and Nutrients analysis. Mann Testing analyses Organics (water and solids) and Volatiles. NOTL intatke is removed from buoy and installed on a frame.
February 24, 1987
Niagara River sampling regime changed.
April 01, 1993 Six volatiles and 14 chlorophenol analysis dropped at both FE and NOTL.
April 01, 1997
Switched to GLSE/SR (solvent recovery) samples for organic extraction on a bi-weekly basis. Also dropped phthalates, dioxin, and mercury in water analysis.
April 01, 1998
Switched to dual column capillary GC analysis for PCBs with totals using sum of cogeners method.
July, 2002 Mercury in water sampling was resumed in July 2002 after improvements to the method.
April 01, 2003 Analysis of Mercury in water sampling is dropped. Analytical method for Arsenic and Selenium changes from Hydride generation / ICP-OES to acid
digestion, ICP

Appendix J: Acronym Dictionary

A B C CCME - Canadian Council Of Ministers Of The
Environment CI - Confidence Interval CP - Annual Mean Concentration Of Chemical In
Particulate Phase D DL - Detection Limit DOI - Declaration Of Intent E EC - Environment Canada EWC - Equivalent Water Concentration F F - Annual Mean Flow FE - Fort Erie G H HCB - Hexachlorobenzene HWC - I ICP-MS - Inductively Coupled Plasma - Mass
Spectrometry ICP-OES - Inductively Coupled Plasma - Optical
Emission Spectrometry ICP-SFMS - Inductively Coupled Plasma - Sector Field
Mass Spectrometry IJC - International Joint Commission J K L L - Less Than Detect M MDL - Method Detection Limit MLE - Maximum Likelihood Estimation MOE - Ontario Ministry Of The Environment N NAFTA - North American Free Trade Agreement ND - Not Detected NOTL - Niagara-On-The-Lake
NRAP - Niagara River Upstream/Downstream Analytical Protocol
NRSP - Niagara River Upstream/Downstream Sampling Protocol
NRTC - Niagara River Toxics Committee NRTMP - Niagara River Toxics Management Plan NS - No Statistically Significant Difference NYSDEC - New York State Department Of
Environmental Conservation O OC - Organochlorine OMOE - Ontario Ministry Of The Environment P PAH - Polycyclic Aromatic Hydrocarbon PCB - Polychlorinated Biphenyl PDL - Practical Detection Limit Q QA - Quality Assurance QC - Quality Control Q Flag - Qualifying Flag R RMC - River Monitoring Committee RWW - Recombined Whole Water S SD - Standard Deviation SOP - Standard Operating Procedures SPM - Suspended Particulate Matter T T - Trace TCPCB - Total Cogener PCB U UCLC - Upper Confidence Limit For Contamination US - United States USA - United States Of America USEPA - United States Environmental Protection
Agency V V - Valid W X Y Z