Newly Listed Firms as Acquisition Targets€¦ · · 2015-03-05Newly Listed Firms as Acquisition...
45
Newly Listed Firms as Acquisition Targets: The Débutant Effect of IPOs * Luyao Pan a Xianming Zhou b February 18, 2015 Abstract Both theory and economic intuition suggest that newly listed firms differ from seasoned ones as potential takeover targets. We identify significant differences between the two groups of firms in this regard: (i) IPOs are more likely to be acquired than are seasoned firms, (ii) IPO targets receive higher acquisition premiums, and (iii) IPO targets are associated with greater synergy. These observations do not support the “double exit” theory that going-public presents an optimal first step of the process of selling a company, nor the argument that IPOs are weaker firms thus more vulnerable to takeover attacks. In contrast, our findings are consistent with the notion that as fresh merger candidates, IPOs are more attractive to acquirers due to greater synergy potential. JEL classification: G24, G34 Key words: Newly Listed Firms, Takeovers, Synergy * We have benefited from valuable comments and suggestions from Paolo Fulghieri, Jarrad Harford, Matti Keloharju, William J. Wilhelm, and seminar participants at the University of Hong Kong. All errors are our own. a Lingnan College, Sun Yat-Sen University, Guangzhou, China. Tel.: (+86) 20-84110485; Email: [email protected]. b College of Business and Economics, Australian National University, Canberra, Australia. Tel. (+61)2-61250729; Email. [email protected]. School of Economics and Finance, University of Hong Kong, Hong Kong.
Transcript of Newly Listed Firms as Acquisition Targets€¦ · · 2015-03-05Newly Listed Firms as Acquisition...
Newly Listed Firms as Acquisition Targets: The Débutant Effect of IPOs*
Luyao Pana Xianming Zhoub
February 18, 2015
Abstract
Both theory and economic intuition suggest that newly listed firms differ from seasoned ones as potential takeover targets. We identify significant differences between the two groups of firms in this regard: (i) IPOs are more likely to be acquired than are seasoned firms, (ii) IPO targets receive higher acquisition premiums, and (iii) IPO targets are associated with greater synergy. These observations do not support the “double exit” theory that going-public presents an optimal first step of the process of selling a company, nor the argument that IPOs are weaker firms thus more vulnerable to takeover attacks. In contrast, our findings are consistent with the notion that as fresh merger candidates, IPOs are more attractive to acquirers due to greater synergy potential. JEL classification: G24, G34
Key words: Newly Listed Firms, Takeovers, Synergy
* We have benefited from valuable comments and suggestions from Paolo Fulghieri, Jarrad
Harford, Matti Keloharju, William J. Wilhelm, and seminar participants at the University of Hong Kong. All errors are our own.
aLingnan College, Sun Yat-Sen University, Guangzhou, China. Tel.: (+86) 20-84110485; Email: [email protected].
bCollege of Business and Economics, Australian National University, Canberra, Australia. Tel. (+61)2-61250729; Email. [email protected]. School of Economics and Finance, University of Hong Kong, Hong Kong.

1
1. Introduction
Newly listed firms are expected to differ from seasoned firms in merger and acquisition
(M&A) activities in significant ways. Recent studies have established that IPOs are more active
acquirers than are seasoned firms in the first few years after the IPO (Celikyurt, Sevilir and
Shivdasani, 2010; Hovakimian and Hotton, 2010).1 This finding is consistent with the argument
that firms go public in order to raise public equity capital to facilitate long-term growth internally
or externally through acquisitions. Turning to the other side of the issue, in this study we ask: Do
newly listed firms also differ from seasoned firms as potential acquisition targets, and if they do
then how and why?
Theory suggests that they do. By allowing the initial owners to cash out, going public also
serves as an important channel for the insiders to exit. In particular, the insiders can pursue a
so-called “double exit” strategy: To sell the shares in a takeover after the company goes public.
Zingales (1995) provides a justification for this strategy, arguing that selling off cash flow rights
of a minority stake to dispersed shareholders helps bargaining, in a direct negotiation with future
buyers of the majority stake, over private benefits of control. Hsieh, Lyandres, and Zhdanov
(2011) further show that an IPO benefits the firm as a potential acquisition target by resolving its
value uncertainty thus enabling it to credibly communicate its value with the bidders. Hence,
going public can be an optimal first step of the process of selling a company, thus establishing a
direct link between a firm’s IPO and its subsequent sale through acquisition. Some empirical
1Many recent studies have investigated the role of IPOs in facilitating subsequent acquisition activities.
From a chief financial officers survey, Brau and Fawcett (2006) report that the primary motivations for going public is to facilitate aftermarket acquisitions and establish a market price for the firm. Consistent with this finding, Celikyurt, Sevilir and Shivdasani (2010) document that, on average, firms conduct four acquisitions within five years after their IPO. Similarly, Hovakimian and Hotton (2010) find that over one third of newly listed firms enter the market for corporate control as an acquirer within three years after the IPO.

2
phenomena further imply that IPOs are likely to be weaker firms in the sense that they are more
vulnerable to takeover attacks. Such observations include high uncertainty and low survival rate
of IPOs (Fama and French, 2004), weak antitakeover provisions of IPOs (Field and Karpoff,
2002) and poor long-term performance of IPOs within the first three to five years of the listing
(Ritter, 1991). For discussion convenience, we loosely call this implication the “vulnerable target”
argument.
Despite the strong implications from these theories and empirical observations about the role
of newly listed firms as acquisition targets, there is so far no study in the literature directly
examining this role.2 In this study, we address this issue by comparing IPOs with seasoned firms
focusing on three dimensions of their potential differences. We first examine the firm’s likelihood
of becoming a takeover target. Both the “double exist” strategy and “vulnerable target”
arguments predict a higher likelihood for IPOs than for comparable seasoned firms, in particular,
in the first few years after the IPO. We then compare acquisition premiums between IPO targets
and seasoned-firm targets. This comparison further determines the effects of the two alternative
mechanisms. The “double exit” strategy argument suggests that IPOs sell for lower or same
prices as their seasoned counterparts, depending on the presence of selling pressures from the
exiting insiders. But the “vulnerable target” argument has an unambiguous prediction for lower
acquisition premiums of IPO targets. We finally examine the synergy in merger by comparing the
combined firm’s post-merger performance and value. While neither the motivation for selling the
firm nor the firm’s financial status has a prediction about synergy, this examination aims at
evidence on another possible scenario: a débutant effect of IPOs. This scenario, unnoted in the
2Although no previous study has directly explored the link between a firm’s IPO and its subsequent sale, some studies report statistics of data that are related to this link. For a sample of mutual thrifts IPOs, Ciccotello, Field, and Bennett (2001) report that 36 percent of the IPOs were acquired within five years after being listed. On the other hand, Celikyurt, Sevilir and Shivdasani (2010) find that only 4.4 percent of the IPO firms in their sample become an acquisition target within five years after going public.

3
literature, has a clear intuition: Since newly listed firms emerge as fresh public-firm merger
candidates, they can be more attractive to bidders because of greater synergy potential than are
seasoned firms that have been screened in the M&A market for years.
By examining a large sample of U.S. IPOs conducted during the period of 1980-2007, we
obtain evidence on IPO-seasoned differences in all three dimensions. Our findings are
summarized as follows. (i) Newly listed firms are more likely to be acquired than are seasoned
firms. By comparing IPOs with seasoned firms that have been listed for five or more years, we
estimate the likelihood of an IPO becoming an acquisition target at 27 percent, which is eight
percentage points (or 30 percent) higher than the seasoned firm counterpart. This difference is
statistically significant and economically strong, and remains robust after controlling for various
firm characteristics. (ii) IPO targets receive significantly higher acquisition premiums. Based on
alternative valuation multiples (the ratio of deal value over book value of assets, sales, EBITDA
or pre-announcement market value), IPO targets are sold at a premium that is five to 28
percentage points higher than that received by seasoned-firm targets.3 (iii) IPO targets are
associated with greater synergy in merger. This observation is obtained from the combined firm’s
post-merger operating performance and combined market reactions to merger announcement.
Moreover, together with IPO targets receiving higher premiums (finding (ii)), an acquiring firm’s
shareholder value increases more by taking over an IPO than taking over a seasoned firm.
These findings allow us to conclude that the evidence does not support the “double exit”
theory nor the “vulnerable target” argument, which both are inconsistent with finding (ii) and
3 Previous studies have compared acquisition premium between public targets and private targets.
Brau, Francis, and Kohers (2003) find that selling the shares at the IPO offer price allows the firm’s insiders to realize a premium relative to a direct sale through takeover. This finding, referred to as the IPO valuation premium puzzle, identifies a higher IPO offer price than the corresponding private sale price. Officer (2007) further documents a 15% to 30% acquisition discount for unlisted targets relative to comparable publicly traded targets.

4
irrelevant to finding (iii). On the other hand, our results are highly consistent with a débutant
effect of IPOs. This effect enables a publicly listed firm to start with favorable merger
opportunities. This is an important feature of IPOs’ role in M&As unaddressed in previous
studies. A further interesting implication here is the potential impact of this feature on IPO
long-term valuation: When the efficient secondary market takes into account the débutant effect,
newly listed firms are on average initially more valuable and this initial value premium declines
as the débutant effect diminishes. This post-issue pattern of the value effect coincides with the
extensively examined phenomenon of IPO long-term underperformance. We leave a further
discussion of this long-term valuation effect to the conclusion section.
The remainder of the paper is organized as follows. Section 2 discusses the background and
the literature. Section 3 describes the data and sample. Section 4 presents and discusses our
empirical results on IPOs as acquisition targets. Section 5 provides concluding remarks.
2. Literature and Research Strategy
Decisions by newly listed firms are likely to be linked to their motive for going public, which
can involve various post-IPO activities in long-term investment, refinancing, acquisitions and
corporate restructuring. One seemingly apparent motive is to raise public capital. By selling
primary shares and gaining access to the public debt market (Rajan, 1992), the firm can obtain
public equity and debt capital to fund investment and facilitate long-term growth. Another going
public motive is to provide the firm’s initial owners including private equity funds and venture
capitalists with an exit strategy. The ultimate goal of these investors is to realize a desired return
on their investments by selling their shares. They can do this either privately through a takeover
or publicly in an IPO. In particular, they can pursue a “double exit” strategy: To sell their shares
in a takeover after the company goes public. Zingales (1995) provides a justification for this exit

5
strategy: selling off cash flow rights of a minority stake to dispersed shareholders helps
bargaining, in a direct negotiation with future buyers of the majority stake, over private benefits
of control. In this strategy, the initial owners can maximize the proceeds in the eventual sale of
their company. Hsieh, Lyandres, and Zhdanov (2011) further contend that an IPO benefits the
firm as a potential acquisition target by resolving its value uncertainty thus enabling it to credibly
communicate its value with bidders.4
A number of empirical studies have been conducted to examine the various issues regarding
firms’ going public decision. Depending on the major issues addressed, the empirical literature
can be loosely divided into three strands. The first strand focuses on the role of IPOs in raising
capital to fund investment and growth. By examining a sample of Italian firms, Pagano, Panetta
and Zingales (1998) find that firms tend to time the market in their IPO and, importantly, use the
newly raised equity capital to reduce leverage instead of to finance subsequent investment and
growth. Using a large sample from 38 countries, Kim and Weisbach (2008) examine the use of
funds raised in IPOs and SEOs. They conclude that financing investments and exploiting market
misvaluation are important motivations for firms to issue public equity.
The second strand of literature focuses on the role of going public in facilitating subsequent
acquisitions. In addition to providing a fusion of cash as acquisition funding and creating publicly
traded stock as potential acquisition currency, IPOs give firms access to the public equity and
debt markets and thus sources of external capital for acquisitions. From a survey on corporate
chief financial officers, Brau and Fawcett (2006) find that facilitating acquisitions and
4 Other theories of going public are also proposed. For example, according to Holmström and Tirole (1993), managerial incentive considerations are important in driving the IPO decision, for publicly listed companies can use incentive schemes such as stock-value based incentive pay and stock options that are unavailable to private companies. Subrahmanyam and Titman (1996) argue that going public can improve investment decisions through information production by outside investors. Chemmanur and Fulghieri (1999) further argue that since a firm’s market value reflects all available information, going public reduces the need for all investors to engage in costly duplicative information production.

6
establishing the firm’s market value are the top two considerations in their firms’ going public
decision. This finding has stimulated recent studies to examine acquisition activities by newly
listed companies. In a sample of IPOs with high proceeds, Celikyurt, Sevilir and Shivdasani
(2010) document that firms on average conduct four acquisitions within five years after the IPO,
and that acquisitions are as important as R&D and capital expenditures to the firm’s long-term
growth. By examining a comprehensive sample of IPOs, Hovakimian and Hotton (2010) find that
over one third of firms enter the market for corporate control as an acquirer within three years
after the IPO. Similarly, Brau, Couch and Sutton (2012) report that about one third of IPOs in
their sample conduct at least one acquisition before the first IPO anniversary.
The third strand of literature examines subsequent sales of IPO firms. A direct implication of
the double-exit argument is that IPOs are more likely to become an acquisition target than are
comparable seasoned firms. Empirical findings regarding this implication are mixed. In a sample
of Italian firms, Pagano, Panetta, and Zingales (1998) identify an increase in turnover of control
after the IPO. Ciccotello, Field, and Bennett (2001) examine mutual thrifts IPOs and find that 36%
of the sample firms were acquired within five years after being listed. On the other hand, Fama
and French (2004) document that the 10-year delisting rate for M&A reasons is lower for their
IPO sample than for their seasoned firm sample. Celikyurt, Sevilir and Shivdasani (2010) report
that only 4.4% of IPO firms in their sample become an acquisition target within five years after
going public, which is lower than typically 10% and above for seasoned companies.5
Apart from studies in this strand regarding the double-exit strategy, there are notable
5 It should be noted that these observations are apparently constrained by the specific data that are
used to address the different issues of these studies. For example, both Pagano, Panetta, and Zingales (1998) and Ciccotello, Field, and Bennett (2001) use a small sample of fewer than 100 firms; Celikyurt, Sevilir and Shivdasani (2010) focus on large IPOs with total proceeds of $100 million or above; Fama and French’s (2004) sample includes penny stocks that, being more frequent with IPOs, have a high delisting rate for non-M&A reasons.

7
empirical observations suggesting another possible reason why newly listed firms are more likely
to become a takeover target. Fama and French (2004) report high uncertainty and low survival
rate of IPOs and Field and Karpoff (2002) find that IPO firms generally have weak antitakeover
provisions. Both studies tend to suggest that newly listed firms are vulnerable to takeover attacks
and hence more likely to be acquired.
In addition, the fact that IPOs emerge as fresh public companies means that they might
provide new merger opportunities in the M&A market. In other words, IPO firms can be more
attractive to such potential acquirers that have been looking for suitable public targets and have
closely examined existing seasoned companies in the market. We refer to this potentially
favorable feature of newly listed firms as the débutant effect of IPOs. Although this feature seems
intuitive, it has not been noted in the literature. As we shown below, this feature has distinct
predictions that are appealing to empirical investigation.
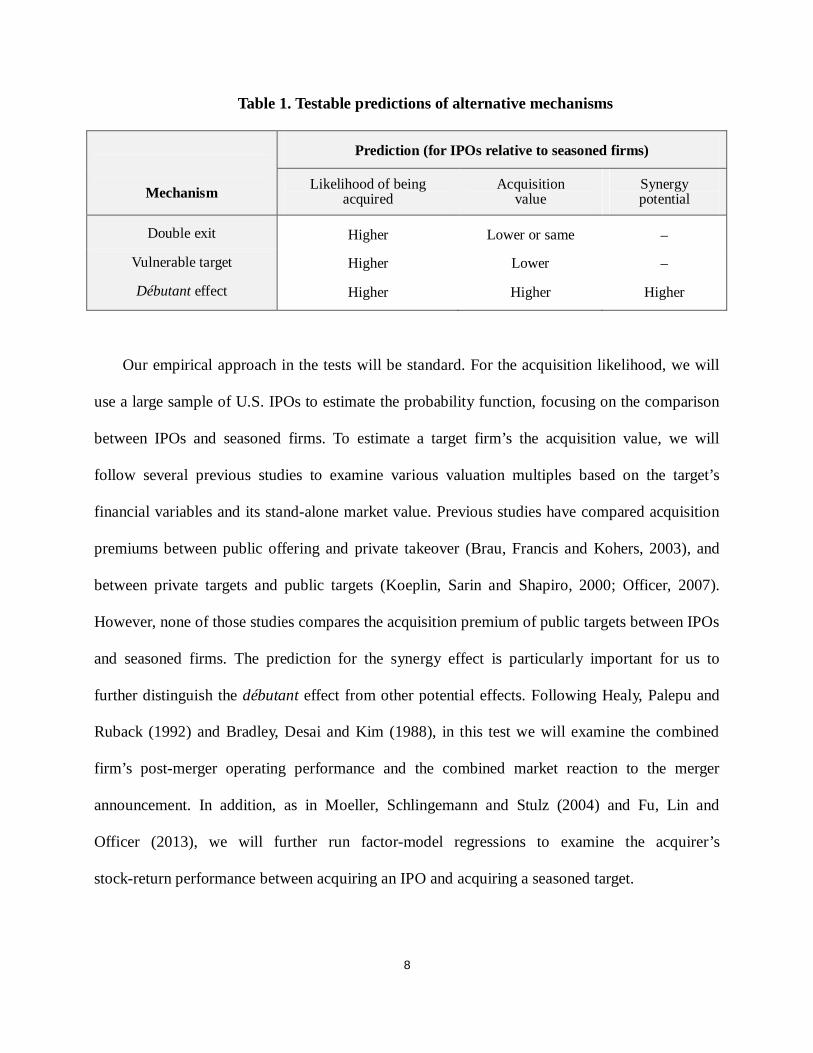
Table 1 presents summarized predictions of the three alternative mechanisms: Double-exit
strategy, vulnerable takeover targets, and the débutant effect of IPOs. While all three mechanisms
have the same prediction for IPOs’ likelihood of being acquired, their predictions differ regarding
the acquisition value of the target and the effect of synergy. In this study, we will start with a test
for the acquisition likelihood and then, to distinguish between the competing mechanisms
(particularly between the débutant effect and the other two, which is our main concern), conduct
further tests focusing on acquisition value and synergy.
8
Table 1. Testable predictions of alternative mechanisms
Mechanism
Prediction (for IPOs relative to seasoned firms)
Likelihood of being acquired
Acquisition value
Synergy potential
Double exit Higher Lower or same
Vulnerable target Higher Lower
Débutant effect Higher Higher Higher
Our empirical approach in the tests will be standard. For the acquisition likelihood, we will
use a large sample of U.S. IPOs to estimate the probability function, focusing on the comparison
between IPOs and seasoned firms. To estimate a target firm’s the acquisition value, we will
follow several previous studies to examine various valuation multiples based on the target’s
financial variables and its stand-alone market value. Previous studies have compared acquisition
premiums between public offering and private takeover (Brau, Francis and Kohers, 2003), and
between private targets and public targets (Koeplin, Sarin and Shapiro, 2000; Officer, 2007).
However, none of those studies compares the acquisition premium of public targets between IPOs
and seasoned firms. The prediction for the synergy effect is particularly important for us to
further distinguish the débutant effect from other potential effects. Following Healy, Palepu and
Ruback (1992) and Bradley, Desai and Kim (1988), in this test we will examine the combined
firm’s post-merger operating performance and the combined market reaction to the merger
announcement. In addition, as in Moeller, Schlingemann and Stulz (2004) and Fu, Lin and
Officer (2013), we will further run factor-model regressions to examine the acquirer’s
stock-return performance between acquiring an IPO and acquiring a seasoned target.

9
3. Sample and data
We obtain data on IPOs from the Securities Data Company (SDC) New Issues Database. To
make sure that all M&A activities by IPO firms can be tracked for five years, we focus on IPOs
conducted from 1980 to 2007. Following a standard process, we exclude from the initial sample
real-estate investment trusts (REITs), limited partnerships, closed-end funds, penny stocks (with
offer price less than $5), unit offers, financial firms (with SIC code from 6000 to 6999). We also
require firms to have financial data in Standard and Poor’s Compustat database for the IPO year
and stock return data from the Center for Research in Security Prices (CRSP) database within 3
months after the IPO. The final sample consists of 4,401 IPOs.
Following Fama and French (2004) and Celikyurt, Sevilir and Shivdasani (2010), for each
calendar year we consider all stocks that have been listed for at least five years as seasoned stocks.
After removing financial firms and those with a share code other than 10 or 11 (which are
certificates, ADRs, SBIs or units), the seasoned firm sample has total 73,751 observations. As a
comparison, we also construct a matching sample based on firm size and Tobin’s Q: for each IPO,
we identify all seasoned stocks of market capitalization within the [50%, 150%] range and then
choose the one with the closest market-to-book ratio as the matching seasoned stock. As a
robustness check, we also examined an alternative matching sample based on size and industry.6
Since all results from the matching samples are qualitatively the same, in our discussions we will
focus on the results from the matched sample based on size and Tobin’s Q.
As in Fama and French (2004), we use the CRSP delisting code to determine firm delisting
reasons, which are either due to takeover (as being acquired) or for other reasons (mainly
6 The other matching sample is obtained from size and industry matches; for each IPO, we identify all
seasoned stocks in the same industry under the Fama-French 48 industry classification and then choose the one with the closest market capitalization as the matching seasoned stock.

10
liquidation). The delisting code is between 200-399 for acquired firms, and of 400 or above for
delisted firms for other reasons. Summary statistics of selected firm variables are presented in
Table 2. We calculate most of the variables as in Karpoff and Field (2002). The following
variables are calculated for the first fiscal year after the IPO: total assets, market capitalization,
Tobin’s Q as the ratio of market value of assets to book value of assets, leverage as the ratio of
total liability to total assets, and property as the ratio of gross property, plant and equity to total
assets. The following variables are calculated as the respective average ratio over up to three
years before acquisition for acquired firms or over three to five years after the IPO for survived
firms: sales growth, R&D normalized by sales, liquidity as the ratio of current assets minus
current liabilities to total assets, and operating ROA as the ratio of operating income before
depreciation to total assets. Stock return is the cumulative abnormal stock return over up to six
month before the delisting date for acquired firms or over the first three years after the IPO for
survived firms, using the equally weighted CRSP index as the market portfolio.
Panel A presents statistics for the total sample, Panel B for the subsample of both survived
and acquired firms (which we use to examine firms’ likelihood of being acquired), and Panel C
for the matched sample. The numbers indicate significant differences between IPOs and seasoned
firms, showing that IPOs are on average smaller and with lower leverage and higher growth
potential, and underperformed seasoned firms. This observation is consistent with Fama and
French (2004), who document that IPO firms, particularly those that went public after 1980, are
associated with low profitability and high growth relative to seasoned firms. The weaker financial
and stock-value performance of IPOs are consistent with the widely discussed IPO long-term
underperformance phenomenon.
Panel C shows that difference between IPOs and seasoned firms disappears in several

11
dimensions, including size, Tobin’s Q and R&D. However, the matching process does not remove
the differences in leverage, sales growth and performance measures. Therefore, it is important to
include various firm characteristics variables in regressions to control for firm heterogeneity.
4. Empirical results
4.1. The likelihood of being acquired
Table 3 presents the statistics of firms’ survival and delisting within five years after the
corresponding event date, which is the issue date for IPOs and the first fiscal-year end for
seasoned firms. The numbers (frequency in parentheses) show the distribution of firms among the
three categories: survived, delisted due to acquisition, and delisted for other reasons. To show the
cross-industry and over-time differences, Panel A presents the statistics for four subperiods,
where the two year period of 1999-2000 is separately reported for the internet bubble period, and
Panel B for the Fama-French 12 broad industries. Overall, 27% of IPO firms are acquired within
five years of their going public, which is eight percentage points (or 30 percent) higher than the
seasoned firm counterpart. Although the magnitude of the difference varies with subsample, it is
visibly similar for all time periods and industries. This is an important observation because it
preliminarily rules out the possibility that the difference is driven by certain specific industry or
year. The numbers also indicate a higher rate of delisting of IPOs for reasons unrelated to
acquisition. However, the IPO-seasoned difference in this dimension is relatively small and even
becomes negligible in some subsamples.7
7 This pattern is different from that documented by Fama and French (2004). They find that the
10-year delisting rate for acquisitions is lower, and delisting rate for other causes (mainly liquidation) is higher, for IPO firms that went public between 1973 and 1991 than for seasoned firms. There are two possible reasons for this discrepancy. First, our sample is from a more recent period which is associated with a generally increasing trend of IPO firms being acquired. Second, Fama and French’s (2004) sample of IPOs includes penny stocks that usually have a very high rate of delisting due to liquidation.
12
To show the time pattern of the IPO-seasoned difference, Table 4 further presents by-year
statistics for the 10-year period after the IPO. The sample used in this table is restricted to IPOs
conducted between 1980 and 2003. The numbers show a clear pattern of the IPO-seasoned
difference in the acquisition frequency: while the frequency of seasoned firms remains quite
stable at around 4% throughout the 10-year period, the IPO counterpart starts and increases from
the first year, peaks at 8.7% in year four, and then decreases gradually and drops to 5.7% in year
10. The IPO-seasoned difference shows an inverted U-shape and is apparently driven by the
over-time changes from IPOs. The difference in the first year presents an exception, however,
which is reversed when the delisting rate is lower for IPOs than for seasoned firms regardless of
the reason. This seeming inconsistency is caused by incomplete data on IPOs of the first year. For
an IPO to be included in the SDC database, it has to survive the first fiscal year in the sense its
financial data is available for the first year; as a result, the statistics for delisted IPOs in that year
are only for those that are acquired or liquidated during the year but remained non-delisted by the
year end.
We now proceed to test for the IPO-seasoned difference in the acquisition likelihood.
Viewing delisting events due to takeover to be independent of those due to other reasons, in this
test we only consider survived firms and acquired ones, using the subsample described on Panel
B in Table 2. To avoid the misleading effect caused by incomplete data as explained above, we
exclude the first year data.8 Following several previous studies (Palepu, 1986; Ambrose and
Megginson, 1992; Song and Walking, 1993; and Field and Karpoff, 2002), we estimate a logit
model in which the dependent variable is dichotomous, having a value of one if the firm is
acquired within five years after the corresponding IPO date, and having a value of zero otherwise.
8 Our results remain qualitatively unchanged when the first year data are included.

13
As in Field and Karpoff (2002), control variables are included to capture the effects of firm
size, leverage, growth, property, liquidity, and financial and stock-return performance. Phillips
and Zhdanov (2012) argue that small firms may have incentive to invest more in innovation in
order to attract large firms for potential acquisition, and Bena and Li (2014) find that small firms
with high R&D expenses and slow growth in patent portfolio are likely to become acquisition
targets. Therefore, we also include the ratio of R&D expense over sales to capture the effect of
innovation on the acquisition likelihood. Moreover, since a firm’s stage of development can
affect its suitability as a takeover target, we further include firm age in the regression model. We
define firm age as the number of years from the firm’s founding year to the listing year of an IPO,
or to the starting fiscal year of a seasoned firm. The founding date information is obtained from
Jay Ritter’s website.9 Because the website only provides this information for firms that went
public after 1974, it is available for 93 percent of IPOs and only 28 percent of seasoned firms.
This data limitation reduces the sample size by 67 percent when firm age is included in the model.
Industry and year fixed effects are also controlled in all regressions.
Table 5 presents the regression results, where the first three columns are the regressions from
the entire sample. The coefficient on the IPO dummy is our main concern, which estimates the
difference in the acquisition likelihood between IPOs and seasoned firms. The third column
presents the complete model regression for the entire sample, where firm age is also included. To
mitigate potential outlier effects, we winsorize the sample by removing the top and bottom 1%
extreme observations of relevant variables. The coefficient on the IPO dummy is positive and
statistically significant in all regressions. Consistent with the preliminary observation from Tables
3 and 4, the coefficient estimate confirms a higher likelihood of newly listed firms being acquired
9 http://bear.warrington.ufl.edu/ritter/ipodata.htm

14
than that of seasoned firms. This result is obtained after we control for various firm characteristic
including firm age. To show the economic significance of this finding, we estimate the
acquisition likelihood using the regression in column 3 and assuming mean values for all control
variables. The likelihood is estimated at 25.5% for IPO firms and 20.4% for seasoned firms. This
difference, 5.1 percentage points (or 25%) higher for IPOs, is economically significant.
Most of the control variables have an expected effect on the takeover likelihood. Firms that
are small, young, and associated with high leverage and poor performance are more vulnerable to
takeover attacks. As in Field and Karpoff (2002), the effect of Tobin’s Q is negative and those of
liquidity and sales growth are positive. Unlike Bena and Li (2014), our regressions show a
negative effect of R&D on the likelihood. However, as our matched sample results will show, this
effect disappears when both IPOs and seasoned firms have similarly high levels of R&D
investment.10 This appears to be an interesting observation and needs to be further examined.
Columns 4 to 8 present the regression results from the matched sample. With the
substantially reduced sample size, in these regressions we are able to include two governance
variables. The first governance variable is stock ownership held by the firm’s largest institutional
blockholder, which is can be considered as proxy variable for internal corporate control.
According to Shleifer and Vishny (1986), large shareholders are effective monitors and effective
monitoring contributes to the gain realized in takeovers. Hence, the presence of large
shareholders makes the firm more attractive as a takeover target. We obtain the institutional
ownership information from firms’ 13-f filings collected by Thomson Reuters. The second
governance variable is the firm’s use of staggered board. Field and Karpoff (2002) find that IPO
10 The average ratio of R&D over sales for our seasoned firms is close to that of Bena and Li’s (2014)
target sample at 0.08. When we run the regressions for the subsample of seasoned firms, the coefficient on this ratio turns positive as in Bena and Li (2014).

15
firms are associated with weaker antitakeover provisions than seasoned firms and that
antitakeover provisions play a significant role in deterring takeovers. The G-index that includes
24 antitakeover provisions or E-index that includes 6 antitakeover provisions are often used to
characterize the intensity of the firm’s antitakeover defenses. The RiskMetrics database is the
information source of the indexes, which covered large corporations since 1990 and then
expanded in 1998 to also include small companies.11 As a result of its limited coverage on small
firms, the database covers only around 10% of our IPO sample. For this reason, we manually
collect data on one important provision, staggered board, which has been demonstrated to be an
efficient takeover deterrence (Gompers, Ishii and Metrick, 2003; Bebchuk and Cohen, 2005; and
Masulis, Wang and Xie, 2007).12 We obtain this information from firms proxy filings posted on
EDGAR. Since the EDGAR posts start from 1996 and became more complete from 1997, our
two governance variables, stock ownership by the firm’s largest institutional blockholder and
staggered board dummy, only cover the subperiod of 1997-2007.13
The resulting governance data shows that 65% of IPO firms have staggered board, which is
significantly higher than 44% for seasoned firms.14 Ownership by the firm’s largest blockholder
11 Gompers, Ishii and Metrick (2003) compiled the G-Index from the information on company
antitakeover provisions published by Investor Responsibility Research Center (IRRC), which was acquired by ISS Governance Services in 2005 and now belongs to RiskMetrics. The publications provide detailed information on firms’ antitakeover provisions since 1990 and in the early years covers approximately 1500 firms, including S&P 500 index firms and the annual lists of the largest corporations published by Fortune, Forbes and Business Week. The sample was expanded in 1998 to include small firms and firms with high level of institutional ownership (see Masulis, Wang and Xie, 2007).
12 According to Gompers, Ishii and Metrick (2003), A staggered board (or classified board) is one in which the directors are placed into different classes and serve overlapping terms. Since only part of the board can be replaced each year, an outsider who gains control of a corporation may have to wait a few years before being able to gain control of the board. This slow replacement is one of the few provisions that clearly retains some deterrent value in modern takeover battles.
13 For this reason, the coverage of Thomason Reuters on firms’ 13-f filings has greatly enhanced after 1997.
14 This pattern is different from that observed by Field and Karpoff (2002).

16
is 5.6% for IPOs and 7.3% for seasoned firms. Both governance variables seem to suggest that
from corporate governance perspective, IPO firms are relatively unfavorable takeover targets.
Despite the substantially reduced sample size, the results from the matched sample in
columns 5 to 8 are very similar to those from the total sample, indicating a significantly higher
likelihood of IPOs to be acquired than the seasoned firm counterpart. The results from the
matched sample indicate an even greater IPO-seasoned difference; using the regression in column
6, we estimate the likelihood at 27.8% for IPOs, which is 8.6 percentage points (or 44.8%) higher
than that for seasoned firms. The coefficients on the two governance variables tend to be negative,
which is consistent with the notion that IPOs are associated with stronger antitakeover provisions,
but none is statistically or economically significant.
…
Taken together, the results of our regression analysis indicate that newly listed firms are more
likely to be acquired than are comparable seasoned firms. This finding is very robust, which
survives after controlling for various firm characteristics, governance factors, and industry and
year fixed effects.
4.2. The acquisition value of IPO targets
In this section, we compare the acquisition value between IPO targets and seasoned-firm
targets. As the summary predictions in Table 1 indicate, while all three mechanisms (double-exit
strategy, vulnerable targets, and débutant effect) predict that IPOs are more likely to be acquired
than are seasoned firms, they differ in their implications regarding the target firm’s acquisition
value. Hence, this comparison can help differentiate among the three competing mechanisms.
/// The débutant effect argument has an unambiguous prediction for higher selling prices of
IPOs. Theories on double-exit strategy suggest that the selling shareholders can realize a higher

17
return through double-exit than through a private sale, which has been confirmed by the empirical
finding of Chemmanur et al. (2014). However, these theories do not compare the selling in an
acquisition between newly listed targets and seasoned public targets. On the other hand,
intuitively, the insiders of IPO firms in the double exit strategy have an incentive to sell their firm
as soon as they can and hence might be willing to accept a discount. Therefore, the double-exit
argument implies lower selling value of IPO targets. Similarly, the vulnerable IPO targets
argument also predicts that IPO targets should sell at lower prices, because when they are weak in
defending them against takeover they disadvantaged in bargaining and hence might be forced to
sell at a discount.
Sample for the takeover premium analysis is drawn from SDC Mergers and Acquisitions
Database. Following Netter, Stegemoller and Wintoki (2011) and others, we impose the following
requirements to screen the original takeover sample from the SDC Mergers and Acquisitions
Database: (i) Acquisitions made on U.S. public firms between January 1, 1980 and December 31,
2012; (ii) all acquisitions with or without disclosed deal value (with deal type of 1 or 2); (iii)
completed deals; (iv) 50% or more of total shares acquired in transaction; and (v) 90% or more of
total shares owned by the acquirer after transaction. This screening results in total 11,265 deals.
We further restrict the original sample by removing deals with financial targets (SIC code
6000-6999) and targets that are limited partnerships or leveraged buyouts. We then connected the
dataset with CRSP database to identify the first CRSP date as proxy for IPO date. The
information of share code is also obtained from CRSP, and deals of targets with share code other
than 10 and 11 are further excluded. Consistent with our previous practice, we define firms that
are taken over within 60 month after the IPO date as IPO targets, and seasoned targets otherwise.
This process results in 1,038 deals with IPO targets and 4,399 deals with seasoned targets.

18
Two measures of takeover premiums are commonly used in extant literature. The first
measure is the target cumulative abnormal return over the bid period. A relatively long event
window is used, typically from 42 trading days before the announcement day to the earlier of deal
completion day or 126 trading days after the announcement. This measure was first proposed by
Schwert (1996) and has been adopted by a number of following studies. However, as is criticized
by Betton et al. (2008), because target abnormal stock return incorporates the probability of bid
failure and competition at the initial offer date, it is a noisy measure of the actual offer premiums
determined by the bidder. The second measure is the ratio of offer price (or deal value) to target's
fundamental or market variables measured at a time point prior to the announcement date. It is a
more direct measure of offer premium and is also widely used. In this paper, we follow Officer
(2007) to use four fundamental based acquisition multiples, including offer price to book value of
equity per share, offer price to earnings per share, deal value to sales and deal value to EBITDA,
as measures of takeover premiums, with the fundamental variables being measured at the fiscal
year end immediately prior to the announcement date. All these multiples are directly obtained
from SDC Mergers and Acquisitions Database. In addition to the fundamental based takeover
premiums, we also follow Harford et al. (2012) to include two market-value based acquisition
multiples, which are measured by deal value divided by target's market value at the 11 or 35
trading days prior to the announcement. One advantage of the market-value based multiples is
that they directly reflect the premium or discount that the selling shareholders actually realize in
an acquisition. Consistent with the practice of SDC, when deal value is the numerator, the ratio is
further divided by the fraction of shares transferred in the deal so as to capture the premium as if
the target's entire control right has been taken over by the acquirer, and thus comparable across
deals.

19
Table 7 presents the result of the univariate analysis. For both samples the mean value of
each acquisition multiple is greater than the median, indicating the multiples distributions are
skewed to the right. As a result, we focus on median values when interpreting the results. The
median IPO-seasoned differences in acquisition multiples are all significantly positive and
economically meaningful. Based on the fundamental based acquisition multiples, the IPO targets
are associated with relative premiums ranging from 18.1% to 51.2%15 compared to the seasoned
counterparts. The numbers for the market value based acquisition multiples suggest that while
shareholders of IPO targets realize a median of 56% (63%) return relative to their market value at
11 (35) day prior to the announcement date, those of seasoned targets realize 49% (56%), which
implies a premium of 7 percentage points (or relatively, 4.5% and 4.3%, respectively, for target
market value measured at 11 or 35 days prior to announcement) associated with newly public
targets.
We then conduct multivariate regressions to examine whether the observed IPO-seasoned
difference in acquisition multiples are attributed to differences in deal, target and acquirer
characteristics. Following previous literature, we control for deal characteristics including
fraction of cash paid for the deal, takeover attitude, whether or not the acquirer holds target's
shares prior to the merger, whether or not the deal is cross-border (i.e. made by non-U.S. firms)
and whether or not the acquirer and target are in the same industry classification (with the same
two-digit SIC code). We also control for target financial variables, including logarithm of sales,
Tobin's Q, book leverage, R&D/sales, and operating ROA, that are measured at the fiscal year
end immediately prior to the announcement date, and stock return runup, measured as cumulative
abnormal stock return over [-235, -36] days relative to the announcement, using equally weighted
15 The numbers are calculated by '(median of multiple for IPO targets-median of multiple for seasoned targets)/median of multiple for IPO targets.

20
CRSP stock return as the market return. Because acquirers can be private firms, we rely on SDC
database to obtain their financial data. We include logarithm of sales and ROS, the net profit
margin, of acquirers, that are also measured at the fiscal year end immediately prior to
announcement. In addition, in the light of Bargeron et al. (2008) who document that public
acquirers pay more relative to private acquires in general, and private equity firms in particular,
we include a dummy variable indicating private acquirer, a dummy variable indicating financial
buyer and an interaction term of the two16. Year fixed effects and target and acquirer industry
fixed effects are also controlled for.
The sample for the regressions is the pooled deals of IPO targets and seasoned targets. Each
acquisition multiple is regressed on the control variables and an IPO target dummy, which is the
key variable that captures the difference in acquisition multiples between the two groups of
targets. Regression results are reported in table 7. Except for column (2), for which deal value to
EPS is used as the dependent variable, coefficients on IPO target dummy are significantly
positive. Potential earnings management effect(not sure whether earnings management matters,
the operating ROA is lower for the IPO sample) Coefficients on the control variables suggest that
deals that are paid less in cash, that are hostile, with smaller targets, with targets doing more
R&D, with larger and public acquirers are associated with higher takeover premium. These
results are consistent with those documented by Moeller et al. (2004), Moeller (2005), Bargeron
et al. (2008), Fu et al. (2013) among others.
For a robustness check, we also construct a matching sample consisting of IPO and seasoned
targets that have similar characteristics. Specifically, for each IPO target, we identify all seasoned
targets that have the same acquisition announcement year, Fama-French 48 industry classification
16 Information on financial or strategic buyers is obtained from SDC Mergers and Acquisitions Database.

21
and choose the one with the closest sales at the fiscal year end immediately prior to the
announcement date. Based on the resulting 721 pairs of targets, the median IPO-seasoned
difference in the acquisition multiples are all significantly positive with relative premiums
ranging from 3.2% to 41.0%. Multivariate analysis on the matching sample gives similar results
as do the total sample, indicating that the IPO-seasoned difference in takeover premiums are not
captured by deal, target and acquirer characteristics and year and industry effects.
4.3 The effect of synergy
We have now established that (1) IPOs are more likely to be acquired in the first few years
after going public, and (2) IPO targets receive higher acquisition premiums than do
seasoned-firm targets. While these two observations are consistent with the débutane effect of
IPOs, the second observation does not support the double-exit strategy argument nor the notion
of IPOs as vulnerable takeover targets. To further distinguish the débutane-effect mechanism
from the other two, we now compare the synergy effect between acquiring an IPO and acquiring
a seasoned firm. This comparison helps address the more fundamental question: Is the débutane
effect justified economically?
/// We conjecture that IPO firms create a great many new selections for potential bidders.
Compared with seasoned firms that have been screened on market for years, IPO firms may be
more attractive acquisition targets in the sense that they can generate more synergies in takeovers.
Therefore, on the one hand, they are more likely to become acquisition targets, and on the other,
their better target effects are compensated by higher takeover premiums. If this is indeed the case,
we expect to observe that newly listed firms generate higher synergies than do seasoned
counterparts.
We follow extant literature to employ three measure of synergies. The first measure is the

22
abnormal change in industry-adjusted operating ROA (IAROA) after merger. This measure was
first proposed by Healy et al. (1992) and has been widely adopted. As in Healy et al. (1992),
operating ROA is measured as operating income before depreciation over the market value of
asset (market value of equity plus book value of net debt) at the beginning of the fiscal year. The
operating ROA is then adjusted by industry median at the same fiscal year, which is treated as the
proxy for counterfactual (performance of the bidder had it not did the merger). We focus on six
fiscal years (years -1 to +5) surrounding the merger effective year (year t=0)17. Pre-merger
IAROA of the merging firm is calculated as the weighted average IAROA of acquirer and target,
with market value of assets of the two firms at the beginning of the fiscal year being the weights.
Summary statistics of IAROA are reported in Panel A of Table 8. Based on the sample used
in the takeover premium analysis, we further require acquirers to be U.S. public firms to remove
cross-border mergers and ensure the availability of operating ROA data. As in Healy et al. (1992),
we ignore the numbers in years 0, which are likely to be affected by accounting treatment and
thus not comparable among deals and across industries. Furthermore, keeping in mind that
synergies effects typically reveal in the long run, we focus on post-merger years 2 to 5. At t=-1,
the mean combined IAROA of the merging firms with IPO targets is 1.74%, which is 1.07
percentage point smaller than the number for merging firms with seasoned targets of 2.81%. The
difference is statistically significant at 5% level. In the post-merger years from t=2 to 4, the mean
IAROAs of merging firms with IPO targets are slightly greater. And in t=5, the number is 1.03
percentage points greater for firms merging IPO targets than the counterpart sample merging
seasoned firms. Similar pattern is observed from the median IPO-seasoned difference in IAROA,
which is significantly negative at 5% level prior to merger and become positive with 10% level of
17 Extant studies typically examine longer period (3-5 years) prior to the merger. To avoid large loss in sample
size, especially for the sample of merging firms with IPO targets, we only focus on one year prior to the merger.

23
significance at year 5 after merger.
We then run regressions for post-merger IAROA from years 2 to 5 on IPO target dummy,
controlling for acquirer and target firm characteristics and pre-merger IAROA. The results are
reported in Table 9, where the dependent variable is yearly IAROA in columns 1 and 2 and mean
IAROA in columns 3 and 4. The IPO target dummy captures the difference in abnormal changes
in IAROA caused by the merger between merging firms acquiring IPO and seasoned targets18. In
addition to the baseline model, we also follow Harford et al. (2012) to control for acquirer
characteristics variables, including ln(sales) and Tobin's Q, that are measured at the fiscal year
immediately prior to the announcement date and the previously defined deal characteristics
variables. Consistent with the pattern presented by statistics, coefficients on IPO target dummy
are all significantly positive, indicating that IPO targets bring about higher increase in operating
returns to acquirers in the long run relative to do seasoned counterparts. Coefficients on control
variables suggest that acquirers that are larger, with higher Tobin's Q, and deals paid by higher
faction of cash and those without toehold are associated with stronger increase in post-merger
operating performance.
The second measure of synergies is the combined acquirer and target cumulative abnormal
return (CAR) over a short event window surrounding the merger announcement date. This
measure was developed by Bradley et al. (1988). As in Bradley et al. (1988), Lang et al. (1989)
and Wang and Xie (2008), we examine a 11-day event window around the announcement date19.
Abnormal return is the realized stock return net of that predicted from market model, parameters
18 Same regressions are run for IAROA of post-merger years 1 to 5, and on a sample of pooled
merging firms with a five-year post-merger survival requirement. The results are insensitive to these treatments.
19 A 5-day event window around announcement date is also examined and results remain qualitatively unchanged.
24
of which are estimated over [-36, -235] trading days relative to the announcement date (day 0)
with equally weighted CRSP stock return being the market return. The combined CAR is
calculated as the weighted average CAR of acquirer and target, with toehold-adjusted market
value at day -6 being the weights20.
Panel B of Table 8 reports the summary statistics of acquirer, target and the combined
11-day CAR around announcement date for the two samples of merging firms with IPO targets
and seasoned targets. Consistent with our previous results that IPO targets receive higher
takeover premiums than seasoned counterparts, the 11-day target CAR around announcement
date is significantly higher for IPO targets. On the other hand, acquirer and combined CAR are
not significantly different between the two samples.
Keeping in mind that acquirer, target and deal characteristics can be systematically different
between the two samples, we then conduct a multivariate regression, using combined CAR as
dependent variable and controlling for various acquirer, target and deal characteristics variables.
An IPO target dummy is also included as the variable of interest to capture the difference in
combined CAR between the two samples. The regression results are presented in column 5 of
Table 9. The coefficient on IPO target dummy is positive and significant at 5% level. It indicates
that, ceteris paribus, merging an IPO targets generates an average 11-day CAR around the
announcement date of 1.3% higher than merging a seasoned target. This is again consistent with
our conjecture that IPO targets generate higher synergies in takeovers.
As in Wang and Xie (2008) and Cai and Sevilir (2012), smaller acquirers, acquirers with
better operating performance and those with lower pre-merger stock price runup, and deals paid
with higher fraction of cash are associated with higher combined CAR. In addition, our results
20 When calculating the weight, the value of shares held by acquirer prior to merger is subtracted from target market value.

25
also show that acquirers with higher Tobin's Q, higher ratio of R&D expenditures to sales, and
targets that are smaller and with better operating performance are associated with lower
combined CAR.
We also use a third measure, the acquirer post-merger abnormal returns obtained from
calendar-time portfolio approach recommended by Fama (1998), as proxy for synergies. This
measure is also used by Moeller et al. (2004) and Fu et al. (2013) to examine the acquirer
long-run benefit from the merger. For each calendar month from January 1985 to December 2012,
we form an equally-weighted portfolio consisting of firms that have completed an acquisition
over [-12, -36] (and [-12, -60]) months relative to that month. The portfolios are rebalanced
monthly and formed separately for acquirers of IPO targets and those of seasoned targets. To
avoid results being affected by extreme values, we require portfolio of each calendar month to
comprise at least ten firms. The calendar time series of portfolio returns net of risk-free rate are
then regressed on Fama and French (1992, 1993) three factors and Carhart (1997) momentum
factor. Intercepts of the regressions represent monthly abnormal returns. We also form a zero-cost
portfolio by longing acquirers of IPO targets and shorting acquirers of seasoned targets and
regress the monthly return of this portfolio on the four factors. Intercept of this regression reflects
monthly abnormal return earned by the specific strategy.
Table 10 reports the results from the calendar-time regressions. The annualized abnormal
return of the portfolio of acquirers merging IPO targets is 3.6% and is statistically significant
when the [-12, -60] months window is used. On the other hand, for the portfolio of acquirers
merging seasoned targets, the annualized abnormal return is close to zero and insignificant. The
zero-cost portfolio of longing acquirers of IPO targets and shorting acquirers of seasoned targets
also earn an annualized abnormal return of 3.6% and are statistically significant for both

26
windows.
In summary, our results have shown that acquirers of IPO targets exhibit higher combined
increase in operating return, greater announcement cumulative abnormal return, and greater
long-run abnormal stock return. The conclusion from these results is that IPO targets are
associated with greater synergy of merger than are seasoned targets are. This conclusion lends
further support to our conjectured débutant effect of IPOs.
5. Conclusion
Using a large sample of U.S. IPOs, we have examined the role of newly listed firms in M&A
as potential takeover targets. We find that compared to similar seasoned firms, IPOs are more
likely to be acquired within the first few years after listing, and IPO targets receive higher
acquisition premiums and are associated with great synergy in merger. On the one hand, our
findings do not support the “double exit” strategy that going-public presents an optimal first step
of the process of selling a company, nor the “vulnerable target” mechanism that IPOs present
firms in weak financial and antitakeover positions that are likely to suffer from takeover attacks.
On the other hand, our findings are highly consistent with the notion that as fresh public-firm
candidates for merger, IPOs are more attractive to acquirers because of their greater synergy
potential. We interpret this result as a débutant effect of IPOs.
A closely related issue that we do not address in this study is whether a similar débutant
effect also applies to IPOs acquirers. The existent literature of IPO acquirers focus on the firm’s
acquisition activity intensity and post-issue investment decisions (e.g., Celikyurt, Sevilir and
Shivdasani, 2010; Hovakimian and Hotton, 2010). To address this issue, one needs to compare
IPO acquirers with seasoned ones for their cost of acquisition and post-acquisition performance.
The issues involved in such a comparison (e.g., firms’ and managers’ motivations to take over

27
another company) are beyond the scope of the current study.
As mentioned earlier, the débutant effect directly impacts the valuation of IPOs. Since this
effect is strongest in the early years after the IPO (except the first year because it takes time for
any post-issue takeover initiative to complete a deal) and it diminishes over time, we expect it to
contribute to IPO post-issue valuation in a way highly consistent with the long-run
underperformance pattern documented by Ritter (1991). Related to this issue, it is interesting to
note the recent study by Brau et al. (2012), who examine the effect of acquisition activity on IPO
long-run underperformance. They find that IPOs that acquire within a year of going public
significantly underperform during the one to four years following the first year, whereas
nonacquiring IPOs do not underperform over the same time frame. It, however, remains to be
seen to what extent the combined effect of both IPO acquirers and targets can account for new
issue long-run underperformance.
References
Ambrose, B., Megginson, W., 1992. The role of asset structure, ownership structure, and takeover
defenses in determining acquisition likelihood. Journal of Financial and Quantitative
Analysis 27, 575-589.
Bargeron, L., Schlingemann, F., Stulz, R., Zutter, C., 2008. Why do private acquirers pay so little
compared to public acquirers? Journal of Financial Economics 89, 375-390.
Bayar, O., Chemmanur, T., 2011. IPOs versus Acquisitions and the Valuation Premium Puzzle: A
Theory of Exit Choice by Entrepreneurs and Venture Capitalists. Journal of Financial and
Quantitative Analysis 46, 1755-1793.
Bayar, O., Chemmanur, T., 2012. What drives the valuation premium in IPOs versus acquisitions?

28
An Empirical Analysis. Journal of Corporate Finance 18, 451-475.
Bebchuk, L., Cohen, A., 2005. The costs of entrenched boards. Journal of Financial Economics
78, 409-433.
Bena, J., Li, K., 2014. Corporate innovations and mergers and acquisitions. The Journal of
Finance 69, 1923-1960.
Bradley, M., Desai, A., Kim, E., 1988. Synergistic gains from corporate acquisitions and their
division between the stockholders of target and acquiring firms. Journal of Financial
Economics 21, 3-40.
Brau, J., Couch, R., Sutton, N., 2012. The desire to acquire and IPO long-run underperformance.
Journal of Financial and Quantitative Analysis 47, 493-510.
Brau, J., Fawcett, S., 2006. Initial public offerings: analysis of theory and practice. The Journal of
Finance 61, 399-436.
Brau, J., Francis, B., Kohers, N., 2003. The choice of IPO versus takeover: Empirical evidence.
The Journal of Business 76, 583-612.
Boulton, T., 2010. Venture capital and the incorporation decisions of IPO firms. Journal of
Economics and Business 62, 477-501.
Celikyurt,U., Sevilir, M., Shivdasani, A., 2010. Going public to acquire? The acquisition motive
in IPOs. Journal of Financial Economics 96, 345-363.
Chemmanur, T., Fulghieri, P., 1999. A theory of the going-public decision, Review of Financial
Studies 12, 249-279.
Ciccotello, C., Field, L., Bennett, R., 2001. The thrift IPO as the first stage of its subsequent sale.
Financial Markets, Institutions & Instruments 10, 19-39.
De, S., Jindra, J., 2012. Why newly listed firms become acquisition targets. Journal of Banking
29
and Finance 36, 2616-2631.
DeLong, J., Shleifer, A., Summers, L., 1990. Noise trader risk in financial markets. Journal of
Political Economy 98, 703-738.
Fama, E., French, K., 2004. New lists: Fundamentals and survival rates. Journal of Financial
Economics 73, 229-269.
Field, L., Karpoff, J., 2002. Takeover defenses of IPO firms. The Journal of Finance 57,
1857-1889.
Fu, F., Lin, L., Officer, M., 2013. Acquisitions driven by stock overvaluation: Are they good deals?
Journal of Financial Economics 109, 24-39.
Gompers, P., Ishii, J., Metrick, A., 2003. Corporate governance and equity prices. Quarterly
Journal of Economics, 118, 107-155.
Harford, J., Humphery-Jenner, M., Powell, R., 2012. The sources of value destructions by
entrenched managers. Journal of Financial Economics, 106, 247-261.
Holmström, B., Tirole, J., 1993. Market liquidity and performance monitoring. Journal of
Political Economy 101, 678-709.
Hovakimian, A., Hotton, I., 2010. Merger-motivated IPOs. Financial Management 39,
1547-1573.
Healy, P., Palepu, K., Ruback, R., 1992. Does corporate performance improve after mergers?
Journal of Financial Economics 31, 135-175.
Hsieh, J., Lyandres, E., Zhdanov, A., 2011. A theory of merger-driven IPOs. Journal of Financial
and Quantitative Analysis 46, 1367-1405.
Kim, W., Weisbach, M., 2008. Motivations for public equity offers: An international perspective.
Journal of Financial Economics 87, 281-307.
30
Koeplin, J., Sarin, A., Shapiro, A., 2000. The private company discount. Journal of Applied
Corporate Finance 12, 94-101.
Lyon, J., Barber, B., Tsai, C.,1999. Improved methods for tests of long-run abnormal stock
returns. The Journal of Finance 54, 165-201.
Masulis, R., Wang, C., Xie, F., 2007. Corporate governance and acquirer returns. The Journal of
Finance 62, 1851-1889.
Mello, A., Parsons, J., 1998. Going public and the ownership structure of the firm. Journal of
Financial Economics 49, 79-109.
Moeller, S., Schlingemann, F., Stulz, R., 2004. Firm size and gains from acquisitions. Journal of
Financial Economics 73, 201-228.
Moeller, T., 2005. Let’s make a deal! How shareholder control impacts merger payoffs. Journal of
Financial Economics 76, 167-190.
Netter, J., Stegemoller, M., Wintoki, M., 2011. Implications of data screens on merger and
acquisition analysis: a large sample study of mergers and acquisitions from 1992 to 2009.
Review of Financial Studies 24, 2316-2357.
Officer, M., 2007. The price of corporate liquidity: acquisition discounts for unlisted target.
Journal of Financial Economics 83, 571-598.
Pagano, M., Panetta, F., Zingales, L., 1998. Why do companies go public? An empirical analysis.
The Journal of Finance 53, 27-64.
Palepu, K., 1986. Predicting takeover targets: a methodological and empirical analysis. Journal of
Accounting and Economics 8, 3-35.
Phillips G., and Zhdanov A., 2012. R&D and the incentives from merger and acquisition activity.
Review of Financial Studies 26, 34-78.

31
Poulsen, A., Stegemoller, M., 2008. Moving from private to public ownership: selling out to
public firms versus initial public offerings. Financial Management 37, 81-101.
Rajan, R., 1992. Insiders and outsiders: The choice between informed and arm's-length debt. The
Journal of Finance 47, 1367-1400.
Ritter, J., 1984. The hot issue market of 1980. Journal of Business 57, 215-240.
Ritter, J. R., 1991, The long-run performance of initial public offerings. Journal of Finance 46,
3-27.
Shleifer, A., Vishny, R., 1986. Large shareholders and corporate control. Journal of Political
Economy 94, 461-488.
Song, M., Walkling, R., 1993. The impact of managerial ownership in acquisition attempts and
target shareholder wealth. Journal of Financial and Quantitative Analysis 28, 439-457.
Subrahmanyam, A., Titman, S., 1999, The going public decision and the development of financial
markets, Journal of Finance 54, 1045-1082.
Zingales, L., 1995. Insider ownership and the decision to go public. The Review of Economic
Studies 62, 425-448.

32
Table 2. Summary Statistics of Selected Variables
The sample consists of U.S. IPOs conducted during the period of 1980-2007. For each calendar year, we identify seasoned firms from the Compustat database that have been listed on CRSP for at least five years. The following variables are calculated for the IPO year: market capitalization, assets, market-to-book (the ratio of market value of assets, which is the market value of equity plus book value of debt, to book value of assets), leverage (the ratio of total liabilities to total assets), and property (the ratio of property, plant, and equipment to total assets). The following variables are calculated as the average over up to three years before takeover for acquired firms, or over three to five years after the IPO for survived firms: liquidity (the ratio of net liquid assets, which is current assets minus current liabilities, to total assets), sales growth, R&D/sales, and operating ROA (the ratio of operating income before depreciation to total assets). Stock return is the cumulative abnormal return over up to six months before the delisting date for acquired firms, or over the first three years after the IPO for survived firms, where the equally weighted CRSP index is used as the market portfolio. Two-sided t test for the mean and Wilcoxon test for the median of the IPO-seasoned difference are provided. ***, **, and * indicate statistical significance at the 1%, 5%, and 10% level, respectively.
IPO firms
Seasoned firms
IPO-seasoned difference
Mean Median N Mean Median N Mean Median Panel A: All firms
Assets ($million) 157.24 56.64 4,357 1,323.46 152.46 73,015 -1166.22*** -95.82*** Market capitalization ($million) 316.35 117.10 4,357 1,278.45 121.42 73,015 -962.10*** -4.32* Market-to-book ratio 3.15 2.37 4,357 1.68 1.29 73,015 1.47*** 1.08*** Leverage 0.36 0.31 4,350 0.49 0.51 72,879 -0.13*** -0.20*** Property 0.30 0.20 4,340 0.59 0.51 72,610 -0.29*** -0.31***
Panel B: After excluding firms delisted due to acquisition-unrelated reasons
Assets ($million) 168.24 59.44 3,747 1,495.53 185.91 63,266 -1,327.29*** -126.47*** Market capitalization ($million) 334.74 126.05 3,747 1,473.27 155.40 63,266 -1,138.53*** -29.35*** Market-to-book ratio 3.15 2.37 3,747 1.70 1.31 63,266 1.45*** 0.67*** Leverage 0.35 0.31 3,739 0.49 0.50 63,157 -0.13*** -0.19*** Property 0.31 0.20 3,736 0.59 0.52 62,932 -0.28*** -0.32*** Liquidity 0.35 0.35 3,664 0.26 0.25 61,568 0.09*** 0.10*** Sales growth 0.46 0.21 3,707 0.11 0.07 63,111 0.35*** 0.14*** R&D/Sales 0.52 0.01 3,752 0.07 0.00 63,429 0.45*** 0.01*** Operating ROA 0.03 0.10 3,745 0.10 0.12 63,183 -0.07*** -0.02*** Stock return -0.12 -0.47 3,747 0.04 -0.15 62,887 -0.17*** -0.32***
Panel B: Matched sample (based on size and Tobin’s Q)
Assets ($million) 171.70 62.84 3,430 160.05 61.82 3,430 11.65 1.02

33
Market capitalization ($million) 339.89 131.31 3,432 326.94 125.93 3,432 12.94 5.38 Market-to-book ratio 3.12 2.36 3,428 3.04 2.36 3,428 0.08 0.00 Leverage 0.36 0.31 3,384 0.39 0.37 3,384 -0.03*** -0.06*** Property 0.31 0.20 3,375 0.47 0.40 3,375 -0.16*** -0.20*** Liquidity 0.35 0.35 3,291 0.34 0.35 3,291 0.01 0.00 Sales growth 0.46 0.21 3,347 0.21 0.11 3,347 0.25*** 0.10*** R&D/Sales 0.49 0.01 3,405 0.47 0.02 3,405 0.02 -0.01 Operating ROA 0.04 0.10 3,396 0.08 0.12 3,396 -0.05*** -0.02*** Stock return -0.12 -0.47 3,394 -0.06 -0.30 3,394 -0.07** -0.17***

34
Table 3. Firm Delisting due to Takeover This table shows the number (frequency in parentheses) of firms that survive for five years, and of firms delisted due to acquisition or for other reasons within five years after the IPO. Panel A
reports the numbers for four subperiods and Panel B for the Fama-French 12 broad industries. We identify delisted firms using the CRSP code, which is between 200 to 399 for acquired firms and 400 or above for delisted firms for other causes. IPO firms Seasoned firms
Total Survived Delisted due to acquisition
Delisted for other causes
Total Survived Delisted due to acquisition
Delisted for other causes
Panel A. By-period distribution
1980-1989 1,266 837 (66%) 260 (21%) 169 (13%) 24,366 17,709 (73%) 4,577 (19%) 2,080 (9%) 1990-1998 2,054 1,174 (57%) 626 (30%) 254 (12%) 24,369 17,124 (70%) 4,821 (20%) 2,424 (10%) 1999-2000 531 267 (50%) 165 (31%) 99 (19%) 5,627 3,940 (70%) 910 (16%) 777 (14%) 2001-2007 550 368 (67%) 141 (26%) 41 (8%) 19,389 13,876 (72%) 3,627 (19%) 1,886 (10%) Whole period 4,401 2,646 (60%) 1,192 (27%) 563 (13%) 73,751 52,649 (71%) 13,935 (19%) 7,167 (10%)
Panel B. By-industry distribution
Consumer nondurables 192 123 (64%) 45 (23%) 24 (13%) 5,862 4,131 (70%) 1,140 (19%) 591 (10%) Consumer durables 107 69 (64%) 22 (21%) 16 (15%) 2,691 1,931 (72%) 426 (16%) 334 (12%) Manufacturing 371 252 (68%) 82 (22%) 37 (10%) 12,452 9,083(73%) 2,310 (19%) 1,059 (9%) Energy 126 81 (64%) 34 (27%) 11 (9%) 3,811 2,679 (70%) 703 (18%) 429 (11%) Chemicals 63 42 (67%) 13 (21%) 8 (13%) 2,530 2,016 (80%) 380 (15%) 134 (5%) Business equipment 1,433 852 (59%) 434 (30%) 147 (10%) 14,086 9,956 (71%) 2,731 (19%) 1,399 (10%) Telephone and television transmission 177 75 (42%) 50 (28%) 52 (29%) 1,548 1,037 (67%) 384 (25%) 127 (8%) Utilities 33 19 (58%) 12 (36%) 2 (6%) 4,125 3,528 (86%) 582 (14%) 15 (0%) Wholesale, retail and some services 572 341 (60%) 128 (22%) 103 (18%) 9,354 6,381 (68%) 1,856 (20%) 1,117 (12%) Healthcare, medical equipment and drugs 656 407(62%) 176 (27%) 73 (11%) 6,933 4,920 (71%) 1,403 (20%) 610 (9%) Finance 0 0 (0%) 0 (0%) 0 (0%) 0 0 (0%) 0 (0%) 0 (0%) Other 671 385 (57%) 196 (29%) 90 (13%) 10,359 6,987 (67%) 2,020 (20%) 1,352 (13%) Total 4,401 2,646 (60%) 1,192 (27%) 563 (13%) 73,751 52,649 (71%) 13,935 (19%) 7,167 (10%)

35
Table 4. By-Year Delisting due to Takeover
This table presents by-year delisting of newly listed firms, in comparison with seasoned firms, within ten years after the IPO. Delisting percentages are reported in parentheses. The first-year numbers for newly listed firms are partial because firms delisted before the first fiscal-year end do not have financial data in the IPO year, so are not included in our sample. Year after IPO
1 2 3 4 5 6 7 8 9 10 IPO firms
Firms at year beginning 3,979 3,914 3,534 3,091 2,695 2,353 2,050 1,814 1,639 1,469 Firms delisted for takeover 53 262 282 270 222 190 141 121 112 83 (1.3%) (6.7%) (8.0%) (8.7%) (8.2%) (8.1%) (6.9%) (6.7%) (6.8%) (5.7%) Firms delisted for other causes 12 118 161 126 120 113 95 54 58 40
(0.3%) (3.0%) (4.6%) (4.1%) (4.5%) (4.8%) (4.6%) (3.0%) (3.5%) (2.7%) Seasoned firms
Firms at year beginning 59,962 56,790 52,858 49,223 45,901 42,855 40,076 37,565 35,290 33,239 Firms delisted for takeover 2,131 2,535 2,360 2,185 2,032 1,864 1,658 1,513 1,365 1,255 (3.6%) (4.5%) (4.5%) (4.4%) (4.4%) (4.4%) (4.1%) (4.0%) (3.9%) (3.8%) Firms delisted for other causes 1,041 1,397 1,275 1,137 1,014 915 853 762 686 621
(1.7%) (2.5%) (2.4%) (2.3%) (2.2%) (2.1%) (2.1%) (2.0%) (1.9%) (1.9%)

36
Table 5. Determinants of the Firm’s Likelihood of being Acquired
This table presents the results of the logistic regression analysis, where the dependent variable equals one if the firm is acquired within five years, of the issue date for IPOs
or since the starting fiscal-year end for seasoned firms, and equals zero otherwise. Firm age is defined as the number of years from the firm’s founding year to the listing year of an IPO, or to the starting fiscal year of a seasoned firm. Block is stock ownership held by the firm’s largest institutional blockholder. Staggered board dummy equals one if the firm has staggered board, and equals zero otherwise. Other control variables are as defined in Table 2. p-values are reported in the parentheses. ***, **, and * indicate statistical significance at the 1%, 5%, and 10% level, respectively.
Whole sample Matched sample
(1) (2) (3) (4) (5) (6) (7) (8) Constant -1.021*** -2.312*** -3.818*** -1.354* -2.886*** -3.238** -10.971 -2.364 (0.000) (0.000) (0.000) (0.059) (0.000) (0.022) (0.979) (0.159) IPO dummy 0.509*** 0.468*** 0.361*** 0.638*** 0.532*** 0.482*** 0.440*** 0.377** (0.000) (0.000) (0.000) (0.000) (0.000) (0.000) (0.002) (0.019) Ln(assets) 0.454*** 0.690*** 0.596*** 0.682*** -0.232 0.025 (0.000) (0.000) (0.000) (0.000) (0.586) (0.957) [Ln(assets)]2 -0.050*** -0.072*** -0.062*** -0.070*** 0.019 -0.012 (0.000) (0.000) (0.000) (0.001) (0.637) (0.794) Tobin' Q -0.147*** -0.124*** -0.076*** -0.070*** -0.053** -0.050** (0.000) (0.000) (0.000) (0.000) (0.010) (0.022) Leverage 0.709*** 0.754*** 0.928*** 1.176*** 0.726* 1.151*** (0.000) (0.000) (0.000) (0.000) (0.065) (0.007) Property 0.124*** 0.043 -0.125 -0.212 0.070 -0.155 (0.003) (0.545) (0.411) (0.275) (0.824) (0.676) Liquidity 0.574*** 0.359*** 0.694*** 0.687*** 0.679* 0.700* (0.000) (0.001) (0.001) (0.003) (0.058) (0.068) Sales growth 0.433*** 0.573*** 0.494*** 0.554*** 0.295*** 0.282*** (0.000) (0.000) (0.000) (0.000) (0.000) (0.000) R&D/Sales -0.090*** -0.159*** -0.021 -0.015 -0.029 -0.037 (0.000) (0.000) (0.103) (0.456) (0.168) (0.137) Operating ROA 0.045 -0.116 0.351* 0.376* -0.533* -0.720** (0.676) (0.413) (0.078) (0.095) (0.060) (0.018) Stock return -0.132*** -0.157*** -0.197*** -0.234*** -0.145** -0.149** (0.000) (0.000) (0.000) (0.000) (0.016) (0.019)

37
Firm age -0.003*** 0.001 0.003 (0.001) (0.805) (0.502) Block -0.006 -0.004 (0.472) (0.590) Staggered board dummy 0.099 -0.045 (0.440) (0.752) Industry dummy Yes Yes Yes Yes Yes Yes Yes Yes Year dummy Yes Yes Yes Yes Yes Yes Yes Yes Observations 62,920 60,818 20,274 6,093 5,930 4,111 1,615 1,307 Pseudo R2 0.033 0.052 0.061 0.059 0.087 0.100 0.090 0.091

38
Table 6. The Acquisition Value: IPO Targets vs. Seasoned-Firm Targets
This table reports acquisition value multiples (purchase price over a financial variable or market value) for IPO targets and seasoned target firms. The sample consists of 1,038 IPOs and 4,399 seasoned firms that were acquired during the period of 1980-2012. The first four multiples are based on financial variables, which are directly obtained from the SDC Mergers and Acquisitions Database, for which the most current financial information prior to the acquisition announcement is used. The deal value is adjusted for the proportion of shares acquired in the transaction. Two-sided t test for the mean and Wilcoxon test for the median of the IPO-seasoned difference are conducted. ***, **, and * indicate statistical significance at the 1%, 5%, and 10% level, respectively. IPO targets Seasoned targets IPO-seasoned difference
Mean Median N Mean Median N Mean Median
Offer price to book equity 4.66 3.12 964 3.40 2.41 3,569 1.26*** 0.71***
Offer price to EPS 50.68 28.80 533 44.40 23.60 2,601 6.29* 5.20***
Deal value to sales 6.56 2.15 928 1.88 1.05 3,346 4.67*** 1.10*** Deal value to EBITDA 29.65 13.22 582 15.18 9.46 2,648 14.47*** 3.76***
Deal value to target market cap 11 days before announcement 1.71 1.56 962 1.70 1.49 3,190 0.02 0.07***
Deal value to target market cap 35 days before announcement 1.80 1.63 961 1.76 1.56 3,168 0.04 0.07***

39
Table 7. Determinants of the Acquisition Value
This table reports the results of the regression analysis for the acquisition value multiples of target firms. The sample consists of 1,038 IPOs and 4,399 seasoned firms that were acquired during the period of 1980-2012. Fraction of pay in cash is the proportion of cash in total payment for the deal. Hostile takeover dummy equals one if the attitude of the transaction is indicated as hostile, and equals zero otherwise. Toehold dummy equals one if the acquirer holds the target’s shares prior to merger, and zero otherwise. Cross-border dummy equals one if the acquirer is a non-U.S. firm, and zero otherwise. Within-industry acquisition dummy equals one if the acquirer and the target firm have the same two-digit SIC code, and zero otherwise. High-tech target dummy equals one for high-tech target firms. Target sales are as of the most current financial information prior to the acquisition announcement. Target leverage is the ratio of total liabilities to total assets as of the most current financial information prior to the acquisition announcement. Target operating ROA is the ratio of operating income before depreciation to total assets as of the most current financial information prior to the acquisition announcement. Target stock return is its excess stock return over the 200 days, 11 or 35 days prior to the announcement date, using the equally weighted CRSP index as the market portfolio. Acquirer ROS is the ratio of net income over sales as of the most current financial information prior to the acquisition announcement. p-values are reported in the parentheses. ***, **, and * indicate statistical significance at the 1%, 5%, and 10% level, respectively. (1) (2) (3) (4) (5) (6)
Ln(Offer price to book value)
Ln(Offer price to EPS)
Ln(Deal value to sales)
Ln(Deal value to EBITDA)
Ln(Deal value to market cap 11 days before announc.)
Ln(Deal value to market cap 35 days before announc.)
Constant -0.668 3.970*** 0.931 3.135*** 1.378*** 1.214*** (0.224) (0.000) (0.226) (0.000) (0.000) (0.001) IPO target dummy 0.086*** -0.001 0.223*** 0.097*** 0.036** 0.054*** (0.001) (0.992) (0.000) (0.009) (0.033) (0.003) Fraction of pay in cash 0.000 -0.000 -0.002*** -0.000 -0.000* -0.000 (0.997) (0.377) (0.000) (0.790) (0.078) (0.186) Hostile takeover dummy -0.009 0.138 0.050 0.144* 0.128*** 0.110** (0.887) (0.196) (0.600) (0.080) (0.003) (0.018) Toehold dummy 0.031 0.047 0.156*** -0.038 0.032 0.021 (0.430) (0.525) (0.005) (0.491) (0.216) (0.448) Cross border takeover -0.045 -0.072 0.038 -0.024 0.017 0.038* (0.128) (0.195) (0.399) (0.584) (0.402) (0.081) Within-industry dummy 0.015 -0.061 0.076** -0.000 0.016 0.029* (0.523) (0.169) (0.027) (0.991) (0.323) (0.083) High-tech target dummy 0.077* -0.116 0.003 0.023 0.021 0.013 (0.081) (0.215) (0.964) (0.737) (0.484) (0.693) Ln(sales) (Target) -0.033*** -0.012 -0.100*** -0.035** -0.013* -0.017** (0.001) (0.528) (0.000) (0.021) (0.058) (0.021) Tobin's Q (Target) 0.308*** 0.171*** 0.277*** 0.293*** -0.016** -0.025***

40
(0.000) (0.000) (0.000) (0.000) (0.011) (0.000) Leverage (Target) 1.108*** -0.199* -1.027*** -0.744*** 0.468*** 0.491*** (0.000) (0.088) (0.000) (0.000) (0.000) (0.000) R&D/Sales (Target) 0.110*** 1.486*** 0.363*** 1.777*** 0.030 0.015 (0.000) (0.001) (0.000) (0.000) (0.102) (0.438) Operating ROA (Target) 0.451*** -4.192*** 0.092 -5.070*** -0.041 0.043 (0.000) (0.000) (0.411) (0.000) (0.447) (0.454) Stock return (Target) 0.312*** 0.099* 0.378*** 0.150*** -0.072*** -0.077*** (0.000) (0.061) (0.000) (0.000) (0.000) (0.000) Ln(Sales) (Acquirer) 0.036*** 0.009 0.084*** 0.041*** 0.016*** 0.019*** (0.000) (0.511) (0.000) (0.000) (0.000) (0.000) ROS (Acquirer) 0.027 -0.270 -0.065* -0.079 -0.013 -0.017 (0.308) (0.115) (0.054) (0.405) (0.401) (0.275) Acquirer is a private firm -0.231*** -0.174 -0.337*** -0.210* -0.167*** -0.136** (0.007) (0.301) (0.009) (0.095) (0.004) (0.028) Acquirer is a financial buyer -0.027 0.235* -0.029 0.069 -0.002 -0.023 (0.683) (0.089) (0.776) (0.503) (0.964) (0.648) Acquirer is a private financial buyer 0.233 -0.283 0.781** 0.014 0.228 0.191 (0.318) (0.488) (0.023) (0.963) (0.136) (0.246) Industry dummies Yes Yes Yes Yes Yes Yes Year dummy Yes Yes Yes Yes Yes Yes Observations 2,268 1,512 2,161 1,572 2,107 2,102 Adjusted R2 0.541 0.260 0.614 0.569 0.162 0.158
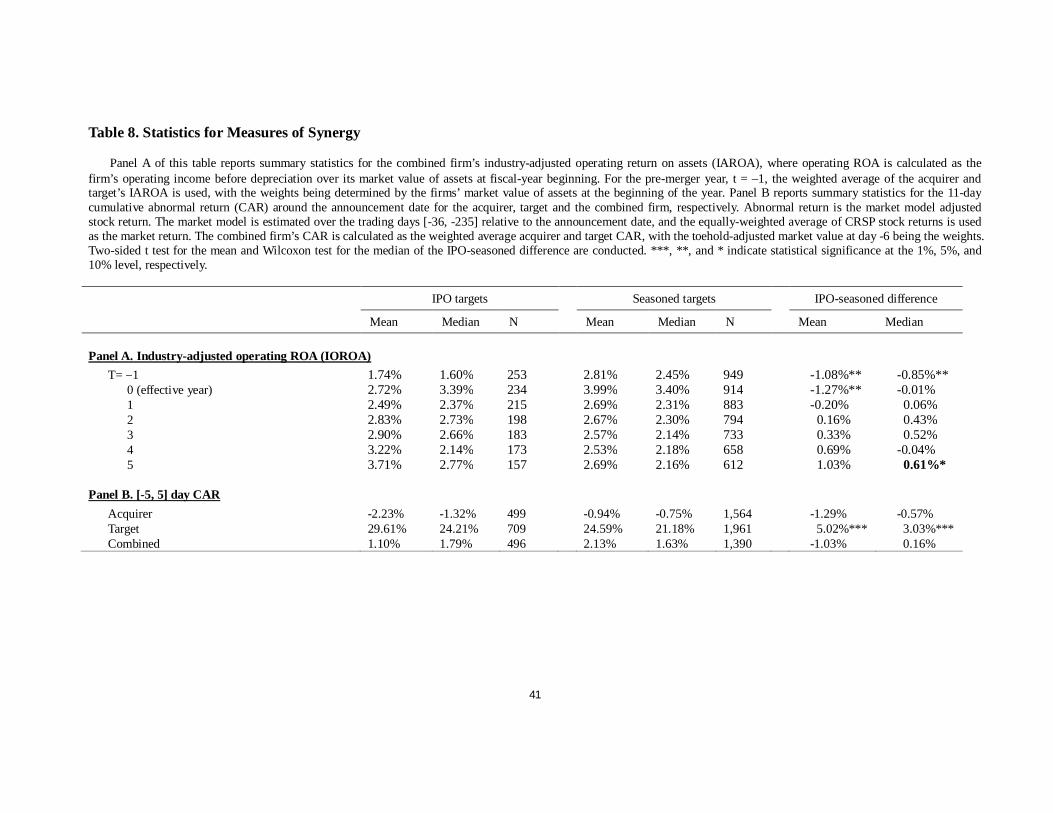
41
Table 8. Statistics for Measures of Synergy
Panel A of this table reports summary statistics for the combined firm’s industry-adjusted operating return on assets (IAROA), where operating ROA is calculated as the firm’s operating income before depreciation over its market value of assets at fiscal-year beginning. For the pre-merger year, t = 1, the weighted average of the acquirer and target’s IAROA is used, with the weights being determined by the firms’ market value of assets at the beginning of the year. Panel B reports summary statistics for the 11-day cumulative abnormal return (CAR) around the announcement date for the acquirer, target and the combined firm, respectively. Abnormal return is the market model adjusted stock return. The market model is estimated over the trading days [-36, -235] relative to the announcement date, and the equally-weighted average of CRSP stock returns is used as the market return. The combined firm’s CAR is calculated as the weighted average acquirer and target CAR, with the toehold-adjusted market value at day -6 being the weights. Two-sided t test for the mean and Wilcoxon test for the median of the IPO-seasoned difference are conducted. ***, **, and * indicate statistical significance at the 1%, 5%, and 10% level, respectively.
IPO targets Seasoned targets IPO-seasoned difference
Mean Median N Mean Median N Mean Median Panel A. Industry-adjusted operating ROA (IOROA)
T= 1 1.74% 1.60% 253 2.81% 2.45% 949 -1.08%** -0.85%** 0 (effective year) 2.72% 3.39% 234 3.99% 3.40% 914 -1.27%** -0.01% 1 2.49% 2.37% 215 2.69% 2.31% 883 -0.20% 0.06% 2 2.83% 2.73% 198 2.67% 2.30% 794 0.16% 0.43% 3 2.90% 2.66% 183 2.57% 2.14% 733 0.33% 0.52% 4 3.22% 2.14% 173 2.53% 2.18% 658 0.69% -0.04% 5 3.71% 2.77% 157 2.69% 2.16% 612 1.03% 0.61%*
Panel B. [-5, 5] day CAR
Acquirer -2.23% -1.32% 499 -0.94% -0.75% 1,564 -1.29% -0.57% Target 29.61% 24.21% 709 24.59% 21.18% 1,961 5.02%*** 3.03%*** Combined 1.10% 1.79% 496 2.13% 1.63% 1,390 -1.03% 0.16%
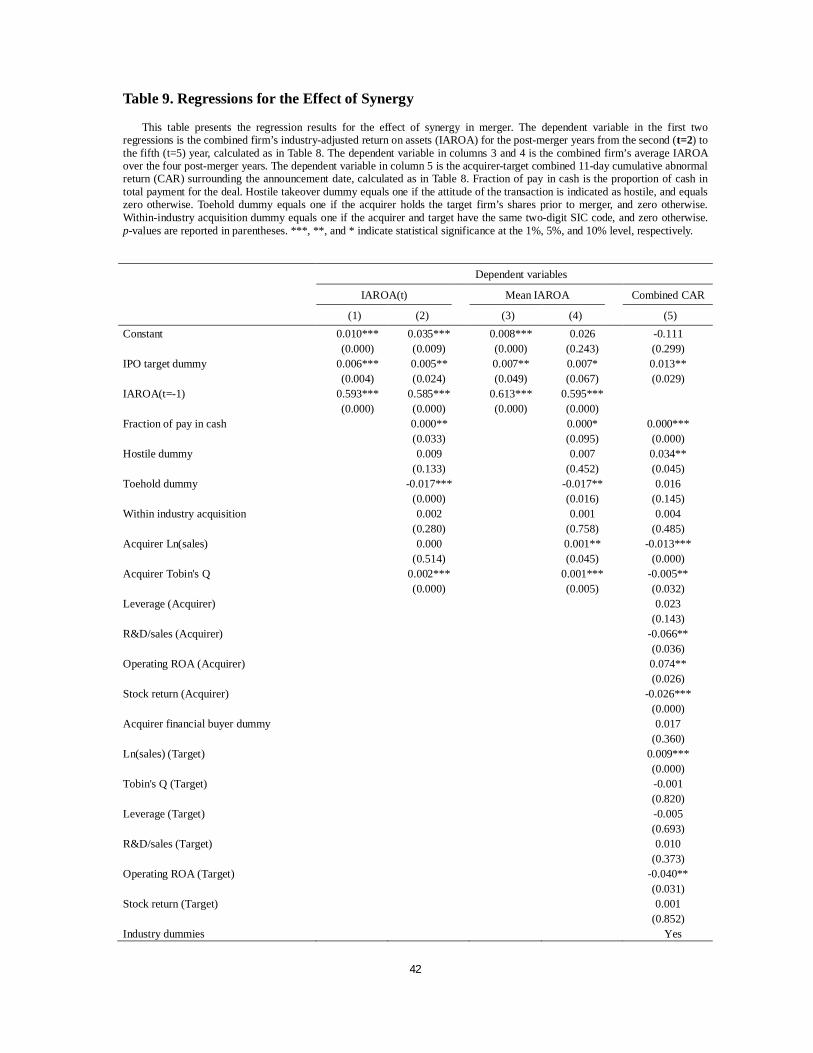
42
Table 9. Regressions for the Effect of Synergy
This table presents the regression results for the effect of synergy in merger. The dependent variable in the first two regressions is the combined firm’s industry-adjusted return on assets (IAROA) for the post-merger years from the second (t=2) to the fifth (t=5) year, calculated as in Table 8. The dependent variable in columns 3 and 4 is the combined firm’s average IAROA over the four post-merger years. The dependent variable in column 5 is the acquirer-target combined 11-day cumulative abnormal return (CAR) surrounding the announcement date, calculated as in Table 8. Fraction of pay in cash is the proportion of cash in total payment for the deal. Hostile takeover dummy equals one if the attitude of the transaction is indicated as hostile, and equals zero otherwise. Toehold dummy equals one if the acquirer holds the target firm’s shares prior to merger, and zero otherwise. Within-industry acquisition dummy equals one if the acquirer and target have the same two-digit SIC code, and zero otherwise. p-values are reported in parentheses. ***, **, and * indicate statistical significance at the 1%, 5%, and 10% level, respectively.
Dependent variables
IAROA(t) Mean IAROA Combined CAR
(1) (2) (3) (4) (5) Constant 0.010*** 0.035*** 0.008*** 0.026 -0.111 (0.000) (0.009) (0.000) (0.243) (0.299) IPO target dummy 0.006*** 0.005** 0.007** 0.007* 0.013** (0.004) (0.024) (0.049) (0.067) (0.029) IAROA(t=-1) 0.593*** 0.585*** 0.613*** 0.595*** (0.000) (0.000) (0.000) (0.000) Fraction of pay in cash 0.000** 0.000* 0.000*** (0.033) (0.095) (0.000) Hostile dummy 0.009 0.007 0.034** (0.133) (0.452) (0.045) Toehold dummy -0.017*** -0.017** 0.016 (0.000) (0.016) (0.145) Within industry acquisition 0.002 0.001 0.004 (0.280) (0.758) (0.485) Acquirer Ln(sales) 0.000 0.001** -0.013*** (0.514) (0.045) (0.000) Acquirer Tobin's Q 0.002*** 0.001*** -0.005** (0.000) (0.005) (0.032) Leverage (Acquirer) 0.023 (0.143) R&D/sales (Acquirer) -0.066** (0.036) Operating ROA (Acquirer) 0.074** (0.026) Stock return (Acquirer) -0.026*** (0.000) Acquirer financial buyer dummy 0.017 (0.360) Ln(sales) (Target) 0.009*** (0.000) Tobin's Q (Target) -0.001 (0.820) Leverage (Target) -0.005 (0.693) R&D/sales (Target) 0.010 (0.373) Operating ROA (Target) -0.040** (0.031) Stock return (Target) 0.001 (0.852) Industry dummies Yes

43
Year dummy Yes Yes Yes Observations 3,482 3,477 1,002 1,001 1,326 Adjusted R2 0.323 0.356 0.396 0.431 0.128

44
Table 10. Factor Model Regressions for Stock Performance
This table presents the factor model regressions for monthly portfolios composed of stocks of acquirers of IPO targets (the first column), acquirers of seasoned targets (the second column), and the arbitrage strategy of longing acquirers of IPO targets and shorting acquirers of seasoned targets (the third column), respectively. For each regression, a portfolio is formed for each calendar month from January 1985 to December 2012, and the dependent variable is the portfolio mean return over that month. Panel A presents the regressions for the monthly portfolios consisting of all acquisitions made during the 24 months one year prior to the calendar month, and Panel B presents the regressions for the monthly portfolios consisting of all acquisitions made during the 48 months one year prior to the calendar month. p-values are reported in parentheses. ***, **, and * indicate statistical significance at the 1%, 5%, and 10% level, respectively.
Acquirers of IPO targets
Acquirers of seasoned targets
Zero-cost portfolio of longing acquirers of IPO targets and shorting acquirers of seasoned targets
(1) (2) (3) Panel A: [-36, -12] (portfolio window of 24-month acquisitions)
0.003 -0.000 0.003* (0.120) (0.718) (0.056) mkt 1.135*** 1.043*** 0.136*** (0.000) (0.000) (0.002) SmB 0.612*** 0.484*** 0.144** (0.000) (0.000) (0.023) HmL -0.300*** 0.129*** -0.370*** (0.000) (0.002) (0.000) UmD -0.412*** -0.264*** -0.149***
(0.000) (0.000) (0.000) Observations 298 329 297 Adjusted R2 0.783 0.874 0.232
Panel B: [-60, -12] (portfolio window of 48-month acquisitions)
0.003* 0.000 0.003** (0.058) (0.670) (0.043) mkt 1.093*** 1.042*** 0.077** (0.000) (0.000) (0.020) SmB 0.619*** 0.496*** 0.096* (0.000) (0.000) (0.050) HmL -0.139** 0.169*** -0.292*** (0.017) (0.000) (0.000) UmD -0.322*** -0.209*** -0.108*** (0.000) (0.000) (0.001) Observations 316 330 315 Adjusted R2 0.821 0.890 0.190