The Effect of Cross Listing on the Value of Firms Listed ...
55
THE EFFECT OF CROSS LISTING ON THE VALUE OF FIRMS LISTED AT THE NAIROBI SECURITIES EXCHANGE BY ACHUODHO PAUL ODHIAMBO D63/68582/2013 A RESEARCH PROJECT SUBMITTED IN PARTIAL FULFILMENT OF THE REQUIREMENT FOR THE AWARD OF THE DEGREE OF MASTER OF SCIENCE IN FINANCE, SCHOOL OF BUSINESS, UNIVERSITY OF NAIROBI NOVEMBER 2017
Transcript of The Effect of Cross Listing on the Value of Firms Listed ...

THE EFFECT OF CROSS LISTING ON THE VALUE OF FIRMS
LISTED AT THE NAIROBI SECURITIES EXCHANGE
BY
ACHUODHO PAUL ODHIAMBO
D63/68582/2013
A RESEARCH PROJECT SUBMITTED IN PARTIAL FULFILMENT
OF THE REQUIREMENT FOR THE AWARD OF THE DEGREE OF
MASTER OF SCIENCE IN FINANCE, SCHOOL OF BUSINESS,
UNIVERSITY OF NAIROBI
NOVEMBER 2017

ii
DECLARATION
This research project is my original work and has never been presented for a degree at
any other university for examination.
Signature _________________________ Date ______________________
Achuodho Paul Odhiambo
D63/68582/2013
This research project has been submitted for examination with my approval as the
University supervisor.
Signature __________________________ Date _______________________
Dr. Herick Ondigo
Lecturer, Department of Finance and Accounting
School of Business
University of Nairobi

iii
ACKNOWLEDGEMENTS
I would like to acknowledge the support of my supervisor Dr. Herick Ondingo in guiding
me through the long period this process took, the Capital Market Authority through their
regulations and availing of historical data for the listed firms that made data collection
workable and even the firms that have been sampled in this study. More support is
acknowledged from my whole family and a very close Friend Miss Mwaura who never
stopped pushing me to carry through and make sure I get to the further end of this. Above
all I thank God.

iv
DEDICATION
This project is my dedication to my Mother, Dinah Akal, you showed me the way and
this is the following. My Father Maurice Achuodho for the support and the sacrifices they
had to make together to give me Education.

v
TABLE OF CONTENTS
DECLARATION................................................................................................... ii
ACKNOWLEDGEMENTS ................................................................................ iii
DEDICATION...................................................................................................... iv
TABLE OF CONTENTS ......................................................................................v
LIST OF TABLES ............................................................................................. viii
LIST OF FIGURES ............................................................................................. ix
LIST OF ABBREVIATIONS ...............................................................................x
ABSTRACT .......................................................................................................... xi
CHAPTER ONE: INTRODUCTION ..................................................................1
1.1 Background of the Study ...............................................................................1
1.1.1 Cross-Listing .......................................................................................2
1.1.2 Value of the Firm ................................................................................3
1.1.3 The Effect of Cross- listing on Value of Firms...................................4
1.1.4 Nairobi Securities Exchange ...............................................................5
1.2 Research Problem ..........................................................................................7
1.3 Research Objective ........................................................................................9
1.4 Value of the Study .........................................................................................9
CHAPTER TWO: LITERATURE REVIEW ...................................................10
2.1 Introduction ..................................................................................................10
2.2 Theoretical Review ......................................................................................10

vi
2.2.1 Investor Recognition Hypothesis ......................................................10
2.2.2 Bonding Hypothesis ..........................................................................11
2.2.3 Market Segmentation Hypothesis .....................................................12
2.3 Determinants of the Value of Firms.............................................................12
2.3.1 Profitability .......................................................................................13
2.3.2 Leverage ............................................................................................13
2.3.3 Liquidity ............................................................................................14
2.4 Empirical Review.........................................................................................15
2.5 Conceptual Framework ................................................................................18
2.6 Summary of the Literature Review ..............................................................18
CHAPTER THREE: RESEARCH METHODOLOGY ..................................20
3.1 Introduction ..................................................................................................20
3.2 Research Design...........................................................................................20
3.3 Population of the Study ................................................................................20
3.4 Data Collection ............................................................................................21
3.5 Data Analysis ...............................................................................................21
3.5.1 Analytical Model ..............................................................................21
3.5.2 Test of Significance ..........................................................................22
CHAPTER FOUR: DATA ANALYSIS, RESULTS AND
INTERPRETATION .......................................................................................................23
4.1 Introduction ..................................................................................................23
4.2 Descriptive Statistics ....................................................................................23
vii
4.3 Correlation Analysis ....................................................................................25
4.4 Paired Samples Tests ...................................................................................26
4.5 Interpretation of the Findings.......................................................................28
CHAPTER FIVE: SUMMARY, CONCLUSION AND
RECOMMENDATIONS .................................................................................................30
5.1 Introduction ..................................................................................................30
5.2 Summary ......................................................................................................30
5.3 Conclusions ..................................................................................................31
5.4 Recommendations for Policy and Practice ..................................................32
5.5 Limitations of the Study...............................................................................33
5.6 Suggestion for Further Research ..................................................................33
REFERENCES .....................................................................................................34
APPENDICES ......................................................................................................41
Appendix I: List of Cross Listed Firms at the NSE ...........................................41
Appendix II: Research data ................................................................................42

viii
LIST OF TABLES
Table 4.1: Paired Summary Statistics ................................................................................23
Table 4.2: Paired Samples Correlation ..............................................................................25
Table 4.3: Paired Samples Test ..........................................................................................26

ix
LIST OF FIGURES
Figure 2.1 Conceptual Model ............................................................................................18

x
LIST OF ABBREVIATIONS
CEO - Chief Executive Officer
DSE - Dar salaam Securities Exchange
EAC - East Africa Community
NSE - Nairobi Securities Exchange
OTC - Over the Counter
PV - Present Value
ROA - Return on Assets
RSE - Rwanda Securities Exchange
SOX - Sarbanes-Oxley Act
UK - United Kingdom
US - United States
USE - Uganda Securities Exchange

xi
ABSTRACT
Cross listing is meant to improve informativeness of the firm’s stock price and also
enabling firm’s managers to get precise information on the best future opportunities for
investment purposes. In Kenya, several Kenyan firms have cross-listed in markets that
have better investor protection such as Rwanda, which has better regulations in terms of
investor protection in the region. However, there is very limited secondary trading in
cross-listed companies in all the East Africa Community Partner State owing to different
levels of market development and the capital adequacy requirements for the different
EAC Partners. There is also lack of harmonized legal regimes, which is one of the major
hindrances to secondary trading of shares in cross-listed companies. This study aimed at
establishing the effects of cross-listing on the value of cross-listed firms at Nairobi
Security Exchange. Employing an event study methodology, the study carried out a
census of the 8 cross listed firms at the Nairobi Securities Exchange. The secondary data
covered a period 4 years before cross listing and a period of 4 years after cross listing of
each cross-listed firm. The study used the paired t- test method to determine whether
cross listing affects the value of the cross-listed firms. The finding of the study
established that t statistic for EABL, KCB, Centum Investments and the Nation Media
Group (NMG) before and after cross listing was insignificant at 95% confidence level.
The finding of the study established that t statistic for Kenya airways (KQ), Jubilee
insurance, Equity bank and Uchumi supermarkets before and after cross listing was
significant at 95% confidence level. The study concluded that cross listing had no
significant effect on the value of EABL, KCB, Centum Investments and the Nation
Media Group and that cross listing had a significant effect on the value of Kenya airways
(KQ), Jubilee insurance, Equity bank and Uchumi supermarkets. The study
recommended that the NSE should encourage firms to cross listing since cross listing
affects the value of listed firms.
1
CHAPTER ONE: INTRODUCTION
1.1 Background of the Study
Financial policies like cross listing has been adopted by many firms in order to overcome
market segmentation. Costs that are related to equity capital have been reduced with the
help of Cross listing. Through cross listing, systematic riskiness of firm’s shares is highly
reduced for investors. This is done by increasing shares’ liquidity and improvement of
informational environment (Chouinard & D’Souza, 2004). The main motive of cross
listing of the firm’s shares is the low cost of capital and taking the advantage of an
increased integration and globalization of financial market around the world (Chung, Cho
& Kim, 2011). In addition, activities around cross-borders enable most firms to go global
(O’connor & Phylaktis, 2011).
Theoretically, the investor recognition hypothesis supports that managers of firms have
the power to increase investor’s base of the firm through cross- listing of the firm’s
shares on other exchanges apart from the home country exchanges. This cross-listing
enables the firm to go a high notch in terms of awareness to the firm’s investors (Baker,
Nofsinger & Weaver, 1998). The bonding hypothesis affirms that cross-listing to other
foreign exchanges around the world is a good act of bonding mechanism. This is mostly
used by those firms which are not in a well-off jurisdiction as far as investors’ protection
is concerned (Chisadza, 2013). The market segmentation theory suggests that cross-
listing breaks barriers of investment since it allows investors to access stocks from
different jurisdiction (Makanga & Gateri, 2015). Asset pricing models have predicted a
price increase of stocks after cross listing of firm’s stocks (Olatundun, 2009).

2
Listing a cross borders has earned a significant recognition over some few years now
(Muheirwe, Memba & Kule, 2015). The emergence of cross listing and its development a
cross Kenya, Tanzania, Rwanda and Uganda is a great achievement for East African
Community (EAC) for regional integration (Onyuma, Mugo & Karuiya, 2012). Cross
border listings has been one of the strategies for facilitating cross border activity within
the EAC capital market. So far, 7 Kenyan firms are cross-listed in Uganda, 2 Kenyan
firms are cross-listed in Rwanda and 4 Kenyan firms are cross-listed in Tanzania (Katto,
2012). Some of Kenyan firms like Kenya Airways and Equity Bank are listed in other
east African countries like Tanzania and Uganda (Makau, Onyuma & Okumu, 2015).
1.1.1 Cross-Listing
Cross listing basically refers to offering a firm’s ordinary shares to other investors
through a different exchange from its home exchange. A good example is where Kenyan
firms get its shares listed in a Tanzanian stock exchange, or entail a single stock being
listed on more than one exchange (Chisadza, 2013). Cross listing is a corporate decision
to apply for a secondary listing of shares on a foreign exchange (host exchange). It
materializes in the issuance, on a secondary international capital market, of securities that
are representative of the underlying home equity (Carrieri, Mouchette & Muller, 2014).
Cross listing enabled most firms to access external financing that is likely to be at a lower
cost as compared to what the firms would have got from their home exchanges. As such,
these firms can easily invest in projects that have more potential as far as profitability is
concerned (Onyuma, Mugo & Karuiya, 2012).
Cross listing has the potential of helping a firm to grow at a very high rate. It is a good
strategic decision for a firm to cross list its stocks. Cross listing is seen as a crucial
3
avenue that most firms from different countries can alleviate their constraints as far as
financing is concerned from their home markets, and enable them to access some external
financial from foreign markets for investment purposes (Kusnadi, 2014). Cross-listing is
regarded as a cost of capital lowering mechanism since it enable firms to get more
financing from investors who buy their stocks in a public market (Chisadza, 2013). Cross
listing has plenty of benefits to both the economy of a home country as well as to the firm
itself. When firms get more money for investments, it can easily introduce a new product
in the market (Peng & Su, 2013).
Cross listing enable the firm to diversify their portfolios. Cross listing is also beneficial to
the secondary country in which the foreign firm is listing its stocks since it provides an
avenue for investments. Cross listing has the potential of increasing stock market
liquidity as well as increasing employment opportunities for the secondary country where
the listing by a foreign firm is being done (Olatundun, 2009).
1.1.2 Value of the Firm
The value of the firm is the present value of the future expected flow of cash (Ayako &
Wamalwa, 2015). Firm’s value must equal to that of assets’ stream cash flows. Firm’s
value is usually expressed as total discounted value of future profits. Firm value is
depended on the expected future dividend stream that shareholders anticipate to receive
from a firm during the going concern life cycle of that firm, which is discounted back to
present (Rajni & Kawalpreet, 2013). The greater the firm value the better the position of
the firm financially and better is the prospects for prospective investors (Rajni &
Kawalpreet, 2013).

4
The value creation of a firm indicates an improvement in firm’s worthiness to its
stakeholders. Managers of any given firm will always desire to enhance its firm’s market
value. As such, managers have no choice other than making some critical decisions
especially concerning development of a superior product, a thorough marketing strategy,
serious investment portfolios, finance strategy as well as how the firms earning will be
distributed or utilized (Sudiyatno, Puspitasari & Kartika, 2012). Value of the firm is
determined by market price of firm’s stock (Rajni & Kawalpreet, 2013). Tobin’s Q is
widely utilized as a measure of the firm’s value. Under Tobin’s Q, firm’s value is arrived
at by dividing the market value of the firm by asset’s replacement value. Its wide use
makes it the best measure for valuation and comparison of cross-listed firms’ value
(Makanga & Gateri, 2015).
1.1.3 The Effect of Cross- listing on Value of Firms
Cross- listing enables firms to make wise investment decisions as well as enhancing
informativeness of stock price. Theoretically, managers in cross-listed firms make more
efficient investment decisions since their firm’s stock price are more informative. Cross
listing also enhances the firm’s value (Foucault & Gehrig, 2006). The bonding asserts
that the value of a firm increases from cross listing because cross-listed companies are
required to uphold higher standards of governance and disclosure than their home
markets require (Silvers & Elgers, 2011).
Empirically, Olatundun (2009) studied effects of regional cross listing on stock prices in
sub- Saharan African firms and showed that a positive public announcement, together
with a post cross- listing performance, indicates that a regional cross-listing enhances a
firm’s value. A study by Jong, Mertens and Poel (2010) investigated how forecast by

5
managements affects the Dutch firms cross-listed in UK and US and found that the
relationship between shareholder wealth and the net effect on cross listing is positive
when a management forecast is announcement.
In their study, Hail & Leuz (2008) examined if cross-listing in U.S. has a potential to
reduce foreign firms’ cost of capital and established that with cross-listings, firm’s cost of
capital reduces significantly and a reduction in cost of capital increases firm value.
Kusnadi (2014) examined foreign firms whether cross-listed in U.S. exchange exhibit
corporate cash savings. The study found out that cross-listed firms usually exhibit high
cash savings sensitivity to stock price than their counterparts who are not cross-listed.
1.1.4 Nairobi Securities Exchange
NSE is a sole exchange that presently exists in Kenya with 64 listed companies in 2016.
It is also among the most vibrant in Africa and the leading in Eastern Africa. However,
N.S.E is relatively a small market as compared to other exchanges in United States and
United Kingdom that have more than 5,000 and 2,000 companies listed respectively
(Muiruri, 2014). NSE was initially registered as a private company in the year 1991 by
shares with the floor - based open outcry system in place, it was later replaced by the
central depository system that was commissioned in 2004 (Rono, 2013). The cross listed
firms at the NSE include East African Breweries-USE/DSE, Kenya Airways-USE/DSE,
Jubilee Holding Ltd- USE/DSE, KCB- USE/RSE, Equity-USE, Centum-RSE, Umeme-
NSE, Uchumi and- USE/RSE Nation Media Group USE/RSE/DSE.
According to the NSE website, its market capitalization has tremendously improved
hitting Kshs. 1,930.58 billion as of September 2016. Turnover at the NSE increased

6
phenomenally from Kshs. 2.90 billion in the year 2002 to Kshs. 95 billion in the year
2006. The number of CDSC accounts that were opened increased from 80,000 in the year
2005 to over 1,000,000 investors to date (NSE, 2015).
There are two indices that are used in measurement of the performance at NSE. NSE 20
share index is a yardstick that is used to track the best performing 20 companies in Kenya
that are listed at the NSE. Although it is widely watched and cited because it is comprised
of select 20 large companies, it cannot gauge fluctuations in smaller companies. The
Nairobi Securities Exchange all share index (NASI) that is usually used to measure
Market Capitalization other than the movements in price of few selected counters.
Firms listed at NSE are classified into different sectors such as; Agricultural, Banking,
insurance, investment and investment services, Allied and Construction, Commercial and
service, Energy and Petroleum, Automobiles and Accessories, Manufacturing,
Telecommunication and Technology and Real Estate Sector (NSE, 2016). As at
December 2016, NSE had 65 listed companies in the different sectors. Financial firms at
the NSE comprise of commercial banks and insurance firms, which provide financial
intermediation functions while the Non-financial firms are those companies that are not
involved in the provision of financial intermediary services. Financial services companies
are excluded since they are the companies that provide leverage and other debt services to
the non-financial firms. The NSE is at the time one of the most promising and attractive
markets in Africa by which the bulwark of investors wants to invest and benefit more
especially due to the high growth as well as the more promising Kenyan economic
outlook (Muiruri, 2014).

7
1.2 Research Problem
Cross listing is meant to improve informativeness of the firm’s stock price. It also enables
firm’s managers to get precise information on the best future opportunities for investment
purposes (Kusnadi, 2014). Bonding hypothesis affirms that, cross-listed firms can easily
improve on their governance especially if they list their stocks in countries where good
governance is paramount to any firm’s survival and where investors are more protected
(Chouinard & D’Souza, 2004). Segmentation of market hypothesis suggests that cross-
listing improves stock investability which in turn enhances shareholder base. It also
makes it possible to share risk and, thus lowering the cost of capital and higher stock
valuation (Dodd, 2013). However, there exists a disagreement on valuation gains for
listing in a foreign exchange, or more precisely, the durability of valuation gains from
listing in a foreign exchange (O’connor & Phylaktis, 2011).
In Kenya, several Kenyan firms have cross-listed in markets that have better investor
protection such as Rwanda, which has better regulations in terms of investor protection in
the region (Omanyo, 2016). However, there is very limited secondary trading in cross-
listed companies in all the East Africa Community Partner State due to different levels of
market development and different capital adequacy requirements for the different EAC
Partners. There is also lack of harmonized legal regimes, which is one of the major
bottlenecks to secondary trading of shares in cross-listed companies (Katto, 2012). In
addition, there are 65 firms listed at the NSE however only 9 of them have cross-listed
their shares which necessitates an investigation on effects of firms cross listing on the
value of the firm at NSE.
8
Several local and international empirical studies on cross listing have been extensively
studied by different scholars on different perspectives. Ma’aji and Sadiq (2014) examined
market reaction to international dual listings and established that market positively reacts
to cross-listing program and that the stock prices reaction is depended on exchange,
geography and ways of raising equity capital. Khurana, Xiumin and Periera (2008)
explored the relationship that exist between the growth of firms and cross listing and
found out that a positive relationship exists between firms’ growth and cross listing for
externally financed firms.
A study by Ndiritu and Mugivane (2015) examined the factors that are likely to lead a
slow growth for the firms that are listed in East Africa Region and found that institutional
factors, environmental factors, regulatory factors, historical factors, informational factors
were the major factors leading to slow growth of cross listed firms but the study focused
on growth challenges. Ndirangu and Iraya (2016) examined effects associated with cross-
listing on accounting quality of firms cross-listed in East African stock exchanges and
concluded that cross listing has no effect on the quality of accounts reporting of cross-
listed firms however, the study focused on accounting quality. From the reviewed studies
local and global studies it is evident that the concept of cross listing has been extensively
studied however few studies have done to establish if there is a relation of any sought
between cross listing and the firm’s value specifically in Kenya. Many challenges have
been reported for cross listed firms such as Uchumi, Kenya Airways with little
consideration given to cross-listing effect yet the firms represent 23% of the firms out of
9. Thus, the question: What are the effects of cross- listing on the value of firms cross-
listed at NSE?

9
1.3 Research Objective
To establish the effects of cross- listing on the value of cross listed firms at Nairobi
Security Exchange.
1.4 Value of the Study
The study will help managers of cross listed firms or those considering to be listed to
evaluate pre and post cross listing effects on firm’s value. Post cross listing valuation
effects would help managers come up with strategies needed to be applied by firms,
which predicts either fall or rise in the firm value thus making this study important for
both the Managers in such firms or the board of directors while acting on behalf of the
shareholders.
The study will be significant to policymaking organizations like the East African Member
States Securities and Regulation Authorities, alongside other regulating authorities such
as the Capital Market Authority of Kenya who may document the research or advance it
to come up with regulations and policies that would address the effects brought forth
from this study. Such policies would ensure that smooth running the cross-listed
securities and firms and ensure that the investors are caution appropriately against any
adverse effects identified from this study.
The study adds on to the existing knowledge on investment analysis, market analysis and
in the general finance literature. The study will also contribute to the past studies as an
empirical information base for the past study and or contribute to the established fact by
giving a concurrency or in-concurrency of cross listing.
10
CHAPTER TWO: LITERATURE REVIEW
2.1 Introduction
This chapter looks at available literature on cross- listing and firm’s value as explored by
various authors around the globe. The chapter outlines the theoretical foundation of the
study, the determinants of value of firms, the empirical literature review, the conceptual
framework and finally a summary of the literature reviewed.
2.2 Theoretical Review
This study explores the investor recognition hypothesis, bonding hypothesis and market
segmentation hypothesis as main theories to explain the relation that exist between cross
listing and value of firms that are cross-listed.
2.2.1 Investor Recognition Hypothesis
The hypothesis of investor recognition was first proposed by Merton (1987). The
hypothesis explains that when visibility or recognition by investors caused by cross-
listing enhances investors’ base which in turn results in an increased value of the firm
(Waweru, Pokhariyal & Mwaura, 2012). The theory of investor recognition also
presupposes that firms are able to increase their shareholders’ base through extensive
marketing, good public relation as well as through cross listing, which enhances visibility
or firm’s value (Berg, 2012).
The investor recognition hypothesis also suggests that accessibility and free flow of
information about any firm has the potential of increasing the firm’s visibility, hence
increased firm’s recognition by investors (Baker, Nofsinger & Weaver, 1998). In

11
addition, the investor recognition hypothesis states that abnormal returns caused by cross-
listing are related to an enhanced investors, who are mainly institutional based holding
the shares or stock, the equity analysts and media coverage of the firm (King & Segal,
2006).
2.2.2 Bonding Hypothesis
The bonding hypothesis was proposed by (Coffee & Stulz, 1999). This hypothesis affirms
that cross-listings help capital markets to foster good corporate governance and
protection of interests of shareholders especially the minority shareholders through
reduction of agency costs related to shareholders controlling (Chisadza, 2013). According
to this hypothesis, cross listed firms in major stock exchanges are better placed as far as
corporate governance is concerned in comparison to those which are none cross-listed
from the same jurisdiction. This is mainly because cross- listed firms are subject to a very
strong investor protection. The protections may include but not limited to corporate
disclosures and enhanced law enforcement (Lel and Miller, 2006).
The bonding hypothesis also assumes that firms from countries that’s has a weak investor
protection policies could likely enhance their valuation through cross-listing (Waweru,
Pokhariyal & Mwaura, 2012). According to this hypothesis, cross- listed firms are mostly
subject to a more improved scrutiny from other intermediaries like debt rating agencies
and financial analysts. Therefore, cross listed firms are able to bond with one another,
this bonding has the ability to enhance a better corporate governance (Lel and Miller,
2006).

12
2.2.3 Market Segmentation Hypothesis
Segmentation of markets hypothesis was first proposed by (Alexander, Eun &
Janakiramanan, 1987). Segmentation of market hypothesis affirms that stock prices will
increase due to integration of markets. As such, capitalization will go up before cross-
listing is done and after cross-listing, assets of the firm will increase (Waweru,
Pokhariyal & Mwaura, 2012). The theory emphasizes that market segmentation can be
caused by some market imperfections like taxes, regulatory restriction on investments
and so on (Dodd, 2013). According to the segmentation hypothesis, cross-listing of firms
stock could easily reduce segmentation of markets (Berg, 2012).
The theory of market segmentation suggests risks are shared when investor base is
enhanced through cross-listing which in turn leads to a low risk and low cost of capital.
Therefore, cross-listings of stock to more developed markets have the potential to
increase prices charged by domestic firms (Chisadza, 2013). The market segmentation
hypothesis explains that cross listing presents an investment opportunity to a broader
class of investors who were previously unaware of the firm. This awareness increases
access to capital and widens a firm’s shareholder base, thus promoting risk sharing via
better dispersion of securities, and thereby lowering the cost of capital which in both
short- and long-run increases in value (Silvers & Elgers, 2011).
2.3 Determinants of the Value of Firms
This study will examine profitability, leverage and liquidity as the determinants of value
of cross-listed firms at NSE.

13
2.3.1 Profitability
Profitability refers to the ability of a firm to generate income and avoid loses.
Profitability is a good indicator of how well the managers of a firm are as far as running
and generation of firms earning is concerned given the resources at their disposal.
Profitability is crucial in development and structure of a firm since it measures success as
well as the performance of a firm. With profitability, a firms performance is assessed and
measured in relation to what the shareholders put in as far as investment is concerned or
the capital employed (Bashar & Islam, 2014). Most firms are more concerned with the
profits the firm makes. Profitability itself is a function of performance and a prerequisite
for value creation and the strongest determinant of total shareholder returns (Rajni &
Kawalpreet, 2013).
Profitability is important to both the firm’s managers and the owners. Profitability ratios
are used to determine if the firm is growing well. Profitability is a measure of a
successful investment (Sivathaasan et al., 2013). Profitability is seen by many as a very
important value driver, which can be improved by achieving relevant economies of scale.
Profitability is seen by many as a very important value driver which can be improved by
achieving relevant economies of scale. The profitability of a firm is an essential criterion
to measure the effectiveness and success of firm operations (Bashar & Islam, 2014).
2.3.2 Leverage
Leverage is the extent to which firms are able and willing to borrow (debt finance) and
make good investment to increase their profitability (Ayako & Wamalwa, 2015).
Leverage is a source of firms finance. Leverage is mostly defined by the debt (or liability)
14
to asset ratio. Greater financial leverage is expected to generally induce a higher shortfall
risk and thus higher financial distress costs. debt can have a negative influence on firm
value since high debt prevents firms from taking on investment opportunities with
positive net present value. Accordingly, leverage ratio has significant positive
relationships with firm value and companies using large borrowings face higher risks
while those using more equity tend to operate more conservatively, relying on internal
funds (Sekerci, 2013).
Profitable firms are likely to earn more and make a lesser use of debt financing in their
capital structure compared to firms that make little profit (Ayako & Wamalwa, 2015).
During business recession, firms that may borrow a huge some of funds are likely to
default in paying off such debts when they fall due; they are likely to end up with a high
level of leverage and likely to end up with a potential risk of bankruptcy (Alkhatib,
2012). According to Sekerci (2013), debt can mitigate agency cost of free cash flow by
reducing the cash flow available to managers because debt increases firm value to the
extent that managerial discretion decreases
2.3.3 Liquidity
Liquidity refers to available funds that can be easily used for an investment and or
expenditure. It is also an indicator of the ability of the firm meet its obligations when they
fall due (Alkhatib, 2012). Liquidity is a firm’s ability to fulfill both expected and
unexpected demands of cash on an ongoing basis. In order for a firm to sustain its
activities and remain in existence for a long time, it must be liquid and able to meet its
obligations at any time (Kumar & Agarwal, 2012). Working capital management is
crucial to any successful business. With poor management of working capital, the firm’s

15
funds are likely to be tied up in idle assets. This may reduce the firm’s liquidity and the
firm will not be able to invest in more profitable projects that may arise (Bashar & Islam,
2014).
A firm in order to remain in existence and sustain its activities as a going concern must
remain liquid and meet its obligations as and when they become due. The existence of an
adequate liquidity and its careful management can make substantial difference between
the success and failure of an enterprise (Kumar & Agarwal, 2012). Excessive liquidity
indicates accumulated idle funds, which do not earn any profit for the firm, and
inadequate liquidity not only adversely affect the credit worthiness of the firm, but also
interrupts the production process and hampers its earning capacity to a great extent
(Alkhatib, 2012).
2.4 Empirical Review
Omanyo (2016) studied effects of cross border listing on volatility of return on shares of
companies cross-listed within east Africa. The study used a descriptive research design
and questionnaires to collect data from a sample of 7 cross listed firms at NSE. The
results revealed that financial performance, price of shares, liquidity of shares and
transactions cost greatly affect the volatility of shares in cross listed firms. The study
concluded that Inter-listing of stocks plays a great role in reducing the firm’s cost of
capital as well as a reduction in risks that are related to their stocks. The study
recommended that cross-listed firms should embrace competition to cause exchanges to
continuously improve trading processes so as to enhance the quality of the market.

16
Muheirwe, Memba and Kule (2015) carried out a study on factors that are likely to affect
the financial performance of firms cross-listed in Rwanda exchange. The study used a
descriptive survey design and data was collected using questionnaires from a sample size
of 67 participants. Using Multiple Regression technique the result of study established a
negative correlation between awareness and financial performance of the firms,
regulation framework was positive and significant. The study also found that market
capitalization of the domestic companies was larger than that of cross-listed, and return
on equity of the domestic firms was better than for the cross-listed companies.
Brockman, Salas and Zagorchev (2015) examined effects associated with cross- listing on
corporate governance quality utilizing a set of 454 involuntary cross- listings in the year
2004 to the year 2008. The study results showed that governance quality of cross – listed
firms converges to the one of domestically listed in a statistically significant manner. The
finding of the study also showed that governance quality of cross-listed firms diverges
from their home market counterparts and the simultaneous convergence of governance
quality toward the cross-listed market and divergence from the home market provide
strong evidence in favor of governance-bonding hypothesis.
Makanga and Gateri (2015) examined the impacts of regional cross-listing on the firm’s
value and financial performance using an event study methodology where time series was
employed for the analysis to examine evolution of different variables over time and
univariate analysis using the paired t-test for the periods before and after comparison was
used. The study also employed correlation analysis to measure the degree of relationship
between Tobin’s Q, liquidity and leverage, profitability and growth, and operational
17
performance. The study’s results revealed that cross listing yielded a valuation premia but
was not sustained two years after cross listing.
Makau, Onyuma and Okumu (2015) examined the effects associated with cross- listing
on share liquidity for cross-listed firms. A census of Kenyan cross-listed firm’s secondary
data was used. Using the paired t test, the results of the study established that stock
liquidity of some firms like Equity Bank and Centum Investments had improved and was
statistically significant. The study found that stock liquidity after cross-listing for Kenya
Commercial Bank Limited had declined, though the decline was insignificant. The study
revealed that cross-listing enhances the firm’s stock liquidity.
Kamotho (2013) investigated whether cross- listing and cross-listed firm’s liquidity on
the shares of the firm are related in any way at East African Securities Exchanges
(EASE). The study employed an event study design, the study employed daily traded
volumes of shares 6 months before and 6 months after cross listing. The study revealed
an increase in volume of traded stocks and an increased market capitalization of firms’
cross- listed as well as an improvement in market capitalization of the bourses where the
firms had cross listed. However, the results showed insignificant improvement in
liquidity of the cross-listed firm’s securities.
Prasad, Brusa and Camacho (2012) investigated effects of cross listing on CEO’s
compensation scheme. The study used a sample firms from Canada cross-listed in U.S.
exchanges. The study results established a positive significant relationship between
CEO’s compensation and cross-listing. This was merely because the CEO receives a high
compensation after cross listing in comparison to what they had been receiving prior to

18
cross-listing. The study also established that firm’s size and independence of firm’s board
has a positive significance influence the CEO’s compensation, though the CEO’s duality
has insignificant influence on CEO’s pay.
2.5 Conceptual Framework
The conceptual framework contains an abstract blocks that are usually used to represent
observational, experimental and analytical aspects, process, or system being considered.
The independent variable for the study will cross listing while the dependent variables
will be firm value before and after cross listing. Market Value of Equity and the Book
Value of Equity will form the control variables. The conceptual model is developed on
the based on growth opportunity hypothesis which states that cross-listing firm have
higher growth opportunities than their peers that do not cross-list. The Conceptual
framework will be developed as follows:-
Figure 2.1 Conceptual Model
Source: Researcher
2.6 Summary of the Literature Review
From the reviewed theories, investors view cross listing of stocks as a firm’s action to
circumvent many regulatory restrictions, costs, and information problems. The investor
Event
Cross Listing
Firm Value
Value before cross
listing (Tobin’s Q)
Firm Value
Value after cross
listing (Tobin’s Q)

19
recognition hypothesis supports that greater flow of information and coverage enhances
the value or visibility of the firm. The bonding hypothesis suggests that firms that are
cross-listed have better corporate governance, which enhances performance and the
firm’s value. The market segmentation theory supports that cross listing is an effective
way to reduce market segment and enhances market integration. The growth opportunity
hypothesis explains that cross listing is a mean of enhancing a firm’s growth. According
to the theories, cross listing has many advantages as well as disadvantages.
Disadvantages may be like listing fees which are usually charged.
The reviewed empirical studies agree that cross listing enable firms to access lower cost
external financing. For example, Brockman, Salas and Zagorchev (2015) governance
quality of cross-listed firms diverges from their home market counterparts. Cetorelli and
Peristiani (2015) established that firms cross listing in a more prestigious market enjoy
significant valuation gains while Prasad, Brusa and Camacho (2012) found that found
that cross-listing had a significant positive influence on CEO compensation. In Kenya,
Omanyo (2016) concluded that stock Inter-listing allows firms to reduce the cost of their
equity capital. Makanga and Gateri (2015) found a significant difference in financial
performance before and after cross listing while Makau, Onyuma and Okumu (2015)
found cross listing improves a firm’s stock liquidity. From the reviewed empirical
studies, it is clear that most of the studies examine the effect of cross listing on other
variables like CEO compensation, governance quality, liquidity with few studying the
effect of cross listing on firm performance.
20
CHAPTER THREE: RESEARCH METHODOLOGY
3.1 Introduction
This chapter presents the research design, the population of the study, the data collection
methods and the methods of data analysis.
3.2 Research Design
A research design is plan, which specifies the methods and procedures for collecting and
analyzing data (Zikmund et al., 2011). A research design is also defined as a conceptual
structure in which a research is conducted. It constitutes a blueprint for data collection,
measurement and data analysis. This study employed an event study methodology which
compares performance of a group of firms that have undergone a particular event. In the
context of this study, there was cross listing, which was compared with value of the firm
and other performance metrics 48 months before and 48 months after cross listing.
3.3 Population of the Study
Population refers to all people or items with the similar characteristics that one wishes to
study (Zikmund et al., 2011). The population of this study consisted of 8 cross listed firm
at the Nairobi Securities Exchange as at 31/12/2015 hence the study carried out a census
of the 8 cross listed firms at the Nairobi securities exchange. The population had the
potential to provide adequate data for the research.
21
3.4 Data Collection
This research utilized secondary data which was obtained from the cross listed firm’s
financial statements; the income statement and the balance sheet of firms cross-listed to
obtain information on value of the firms. The secondary data covered a period of 4 years
before cross listing and a period of 4 years after cross-listing of each cross-listed firm.
The financial statements were obtained from the Capital Market Authority, Kenya.
3.5 Data Analysis
The study used statistical data analysis to establish the relationship between cross listing
and the value of firms listed at the NSE. The study used paired correlation analysis to
establish the strength of the relationship between the paired samples and the paired t- test
method used in the determination to whether cross listing affects the value of firms listed
at NSE.
3.5.1 Analytical Model
The study used the paired t- test model. The paired t- test model was derived
mathematically as follows
Where; x = Population mean
μ = t critical value
S =Sample mean
n = Sample size
22
In the finance literature, Event study methodology has become a standard methodology in
evaluating the stock price reaction to a specific event (McWilliams and Siegel 1997).
This methodology of study was used to investigate the market’s response to Cross Listing
four years before and from the cross listing event by examining the Market Value of
Equity divided by the Book Value of Equity as per Tobin’s Q formula around such event.
The study variables included
Firm value measure using the Tobin Q = Market value of equity /Book value of equity
Where; Y = Firm Value
a = Market Value of Equity
b = Book Value of Equity
3.5.2 Test of Significance
The study used P-values to establish the statistical significance of the study variables
where p value of less than 0.05 (P<0.05) was considered as significant while p value
greater than 0.05(P>0.05) was considered insignificant.

23
CHAPTER FOUR: DATA ANALYSIS, RESULTS AND
INTERPRETATION
4.1 Introduction
Chapter four highlights the study findings from analyzed data and also discuss the
findings. The chapter entails the descriptive summarized statistics, paired samples
correlations, paired samples test and the findings interpretation.
4.2 Descriptive Statistics
The descriptive statistics entails the paired samples statistics on the Tobin Q before cross
listing and after cross listing. Table 4.1 illustrates the findings
Table 4.1: Paired Summary Statistics
Mean N Std. Deviation Std. Error
Mean
EABL
Tobin Q before cross
listing 95.000 4 84.793 42.3969
Tobin Q after cross listing 75.750 4 5.6050 2.8025
KQ
Tobin Q before cross
listing 1.525 4 0.15067 0.07533
Tobin Q after cross listing 14.325 4 7.2669 3.63350
Jubilee
Tobin Q before cross
listing 10.325 4 5.5769 2.78848
Tobin Q after cross listing 31.750 4 9.5028 4.75140
KCB
Tobin Q before cross
listing 107.000 4 111.8130 55.9065
Tobin Q after cross listing 28.900 4 13.3387 6.66940
Equity
Tobin Q before cross
listing 275.500 4 193.9097 96.9548
Tobin Q after cross listing 48.575 4 12.1719 6.08596

24
Centum
Tobin Q before cross
listing 50.500 4 26.1916 13.0958
Tobin Q after cross listing 59.925 4 45.5158 22.7579
NMG
Tobin Q before cross
listing 94.900 4 49.5885 24.7942
Tobin Q after cross listing 93.900 4 29.4108 14.7054
Uchumi
Tobin Q before cross
listing 2.772 4 0.97061 0.48531
Tobin Q after cross listing 1.415 4 0.79542 0.39771
Source: Research findings
The paired summary statistics on table 4.1 shows that the average Tobin Q value of East
Africa Breweries Ltd (EABL) before cross listing was 95. Thereafter cross listing, it
declined to 75.75, indicating that the value of EABL was higher before cross listing and
lower after cross listing. The Kenya Airways (KQ) results indicate that average Tobin Q
value for KQ before cross listing was 1.525 but after closing listing it rose to 14.325, an
indication that the value of KQ shares was lower before cross listing and higher after
cross listing. In addition, the results indicates that average Tobin Q value for Jubilee
insurance before cross listing was 10.325 while the average Tobin Q value after cross
listing was 31.75 which is an indication that the value of Jubilee insurance shares was
higher after cross listing than before cross listing. The findings of the KCB group indicate
that the average Tobin Q for KCB before cross listing was 107.00 and 28.90 after cross
listing hence an indication that the value of KCB was higher before cross listing than
after cross listing.

25
The findings on Equity bank indicates that the average Tobin Q for Equity bank before
cross listing was 275.50 while the average value after cross listing was 48.575 which
indicates that Equity banks value was higher before cross listing. The results on Centum
Investments indicates that the average Tobin Q for Centum Investments before cross
listing was 50.50 but the value after cross listing was 59.925 which indicates the average
value of the firm increased after cross listing. The findings on the Nation Media Group
(NMG) indicate that the average Tobin Q for the firm before cross listing was 94.90
while after cross listing the average value was 93.90 which indicates that the average
NMG was higher before cross listing than after cross listing. Finally, Uchumi
supermarkets results shows that the average Tobin Q value of the firm before cross listing
was 2.772 while the average Tobin Q value after cross listing was 1.415 indicating a
decline in value after the cross listing.
4.3 Correlation Analysis
The paired samples correlations were undertaken to determine the correlations before and
after cross listing for the firms. Table 4.2 shows the results
Table 4.2: Paired Samples Correlation
N Correlation Significance
EABL Tobin Q before cross listing &
Tobin Q after cross listing 4 -0.376 0.624
KQ Tobin Q before cross listing &
Tobin Q after cross listing 4 -0.600 0.400
Jubilee Tobin Q before cross listing &
Tobin Q after cross listing 4 -0.349 0.651
KCB Tobin Q before cross listing &
Tobin Q after cross listing 4 -0.787 0.213

26
Equity Tobin Q before cross listing &
Tobin Q after cross listing 4 -0.448 0.552
Centum Tobin Q before cross listing &
Tobin Q after cross listing 4 -0.891 0.109
NMG Tobin Q before cross listing &
Tobin Q after cross listing 4 -0.864 0.136
Uchumi Tobin Q before cross listing &
Tobin Q after cross listing 4 0.110 0.900
Source: Research findings
The paired samples correlations on table 4.2 indicate that the paired samples correlations
for EABL, KQ, Jubilee insurance, KCB group, Equity Group, Centum and the Nation
Media group Tobin Q before and after cross listing were negative. However, the paired
samples correlation for Uchumi supermarkets Tobin Q before and after cross listing was
positive.
4.4 Paired Samples Tests
The paired t- test method used to determine whether cross listing affects the value of
firms listed at NSE. Table 4.3 shows the obtained results
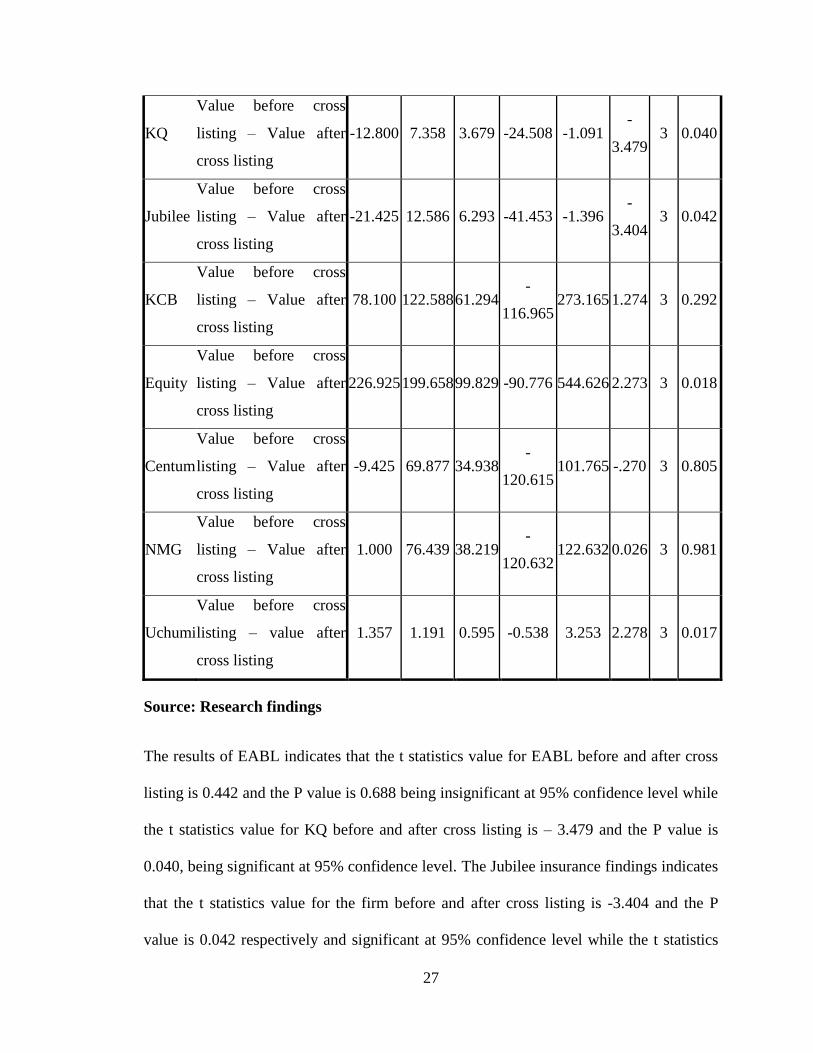
Table 4.3: Paired Samples Test
Paired Differences t df Sig.
(2-
tailed)
Mean Std.
Dev
Std.
Error
Mean
95% Confidence
Interval of the
Difference
Lower Upper
EABL
Value before cross
listing – Value after
cross listing
19.250 87.054 43.527 -
119.272 157.772 0.442 3 0.688
27
KQ
Value before cross
listing – Value after
cross listing
-12.800 7.358 3.679 -24.508 -1.091 -
3.479 3 0.040
Jubilee
Value before cross
listing – Value after
cross listing
-21.425 12.586 6.293 -41.453 -1.396 -
3.404 3 0.042
KCB
Value before cross
listing – Value after
cross listing
78.100 122.588 61.294 -
116.965 273.165 1.274 3 0.292
Equity
Value before cross
listing – Value after
cross listing
226.925 199.658 99.829 -90.776 544.626 2.273 3 0.018
Centum
Value before cross
listing – Value after
cross listing
-9.425 69.877 34.938 -
120.615 101.765 -.270 3 0.805
NMG
Value before cross
listing – Value after
cross listing
1.000 76.439 38.219 -
120.632 122.632 0.026 3 0.981
Uchumi
Value before cross
listing – value after
cross listing
1.357 1.191 0.595 -0.538 3.253 2.278 3 0.017
Source: Research findings
The results of EABL indicates that the t statistics value for EABL before and after cross
listing is 0.442 and the P value is 0.688 being insignificant at 95% confidence level while
the t statistics value for KQ before and after cross listing is – 3.479 and the P value is
0.040, being significant at 95% confidence level. The Jubilee insurance findings indicates
that the t statistics value for the firm before and after cross listing is -3.404 and the P
value is 0.042 respectively and significant at 95% confidence level while the t statistics
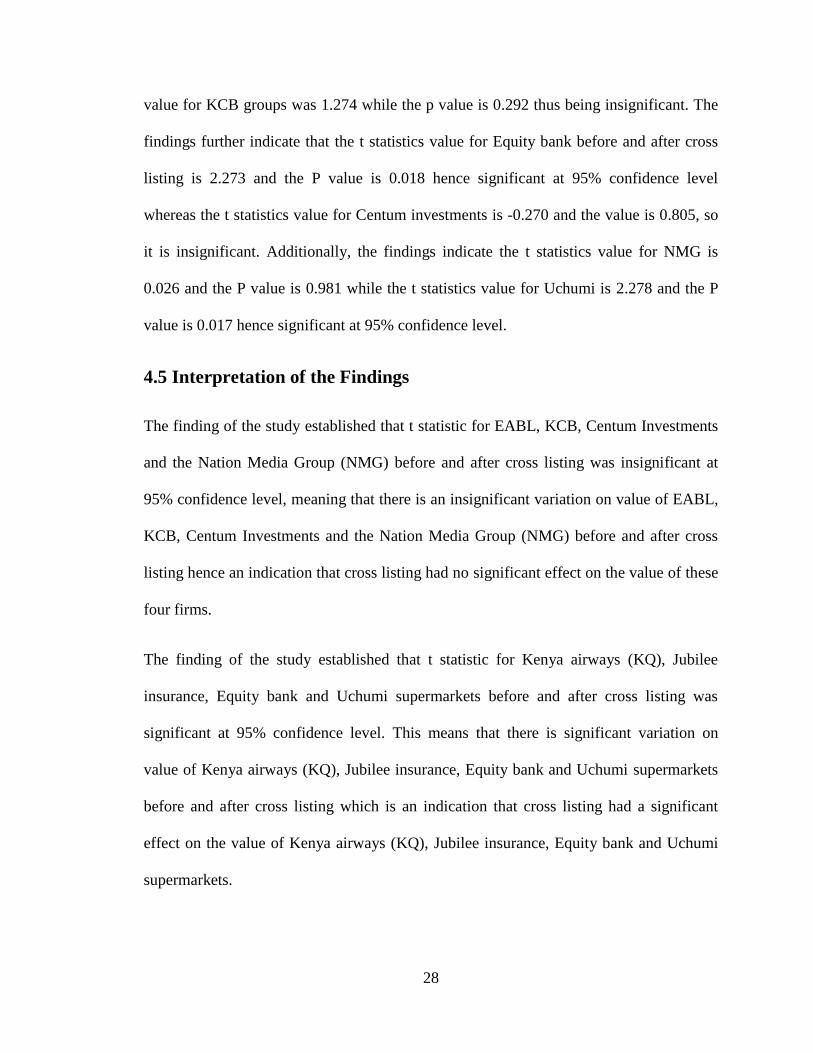
28
value for KCB groups was 1.274 while the p value is 0.292 thus being insignificant. The
findings further indicate that the t statistics value for Equity bank before and after cross
listing is 2.273 and the P value is 0.018 hence significant at 95% confidence level
whereas the t statistics value for Centum investments is -0.270 and the value is 0.805, so
it is insignificant. Additionally, the findings indicate the t statistics value for NMG is
0.026 and the P value is 0.981 while the t statistics value for Uchumi is 2.278 and the P
value is 0.017 hence significant at 95% confidence level.
4.5 Interpretation of the Findings
The finding of the study established that t statistic for EABL, KCB, Centum Investments
and the Nation Media Group (NMG) before and after cross listing was insignificant at
95% confidence level, meaning that there is an insignificant variation on value of EABL,
KCB, Centum Investments and the Nation Media Group (NMG) before and after cross
listing hence an indication that cross listing had no significant effect on the value of these
four firms.
The finding of the study established that t statistic for Kenya airways (KQ), Jubilee
insurance, Equity bank and Uchumi supermarkets before and after cross listing was
significant at 95% confidence level. This means that there is significant variation on
value of Kenya airways (KQ), Jubilee insurance, Equity bank and Uchumi supermarkets
before and after cross listing which is an indication that cross listing had a significant
effect on the value of Kenya airways (KQ), Jubilee insurance, Equity bank and Uchumi
supermarkets.

29
The findings of significance agrees with those of Omanyo (2016) who revealed that
financial performance, price of shares, liquidity of shares and transactions cost greatly
affect the volatility of shares in cross listed firms. Muheirwe, Memba and Kule (2015)
found that market capitalization of the domestic companies was larger than that of cross-
listed, and return on equity of the domestic firms was better than for the cross-listed
companies. Brockman, Salas and Zagorchev (2015) also established that that governance
quality of cross – listed firms converges to the one of domestically listed in a statistically
significant manner.
The insignificant findings concur with that of Makanga and Gateri (2015) revealed that
cross listing yielded a valuation premia but were not sustained two years after cross
listing. Kamotho (2013) also established an insignificant improvement in liquidity of the
cross-listed firm’s securities. Hail & Leuz (2008) established that with cross-listings,
firm’s cost of capital reduces significantly and a reduction in cost of capital increases
firm value.

30
CHAPTER FIVE: SUMMARY, CONCLUSION AND
RECOMMENDATIONS
5.1 Introduction
This chapter summarizes the results of the research, provides its conclusions and gives
recommendations to that effect while indicating limitations and suggests areas for further
research.
5.2 Summary
The objective of this study was to assess the effects of cross- listing on the value of cross
listed firms at Nairobi Security Exchange. The study explored the investor recognition
hypothesis, bonding hypothesis and market segmentation hypothesis as main theories to
explain the relations between cross listing and value of firms that are cross-listed. The
value of the firm was determined using the Tobin Q, which is the ratio of Market Value
of Equity and the Book Value of Equity. The study employed an event study
methodology and carried out a census of the 8 cross listed firms at the Nairobi securities
exchange. The study utilized secondary data which covered a period of 4 years before
cross listing and 4 years after cross-listing of each cross-listed firm. The paired samples
and the paired t- test method used to determine whether cross listing affects the value of
firms listed at NSE.
The paired summary statistics established that the average Tobin Q value of East Africa
Breweries Ltd (EABL) was higher before cross listing and lower after cross listing while
the average Tobin Q value for KQ before cross listing was lower before cross listing and
31
higher after cross listing. The findings also revealed that the average Tobin Q value for
Jubilee insurance was higher after cross listing than before cross listing while that of the
KCB group was higher before cross listing than after cross listing. The findings further
revealed that the average Tobin Q for Equity bank was higher before cross listing while
the average Tobin Q for Centum Investments increased after cross listing. The findings
further established that the average Tobin Q value for NMG was higher before cross
listing than after cross listing while the average Tobin Q value of Uchumi supermarkets
was higher before cross listing than after cross listing.
The paired samples correlations revealed that the paired samples correlations for EABL,
KQ, Jubilee insurance, KCB group, Equity Group, Centum and the Nation Media group
Tobin Q before and after cross listing were negative but the paired samples correlation
for Uchumi supermarkets Tobin Q before and after cross listing was positive. The finding
of the study established that t statistic for EABL, KCB, Centum Investments and the
Nation Media Group (NMG) before and after cross listing was insignificant at 95%
confidence level. The finding of the study established that t statistic for Kenya airways
(KQ), Jubilee insurance, Equity bank and Uchumi supermarkets before and after cross
listing was significant at 95% confidence level
5.3 Conclusions
Based on the revelation of the findings that the t statistic for EABL, KCB, Centum
Investments and the Nation Media Group (NMG) before and after cross listing was
insignificant at 95% confidence level, the study concludes that there is an insignificant
variation on value of EABL, KCB, Centum Investments and the Nation Media Group

32
(NMG) before and after cross listing hence an indication that cross listing had no
significant effect on the value of EABL, KCB, Centum Investments and the Nation
Media Group.
On the other hand, it was founded from this research that the t statistic for Kenya airways
(KQ), Jubilee insurance, Equity bank and Uchumi supermarkets before and after cross
listing was significant at 95% confidence level and on this basis, this finding concludes
that there is a significant variation on value of Kenya airways (KQ), Jubilee insurance,
Equity bank and Uchumi supermarkets before and after cross listing hence an indication
that cross listing had a significant effect on the value of Kenya airways (KQ), Jubilee
insurance, Equity bank and Uchumi supermarkets.
5.4 Recommendations for Policy and Practice
This research having concluded that cross listing had a significant effect on the value of
Kenya airways (KQ), Jubilee insurance, Equity bank and Uchumi supermarkets, this
study recommends that the NSE should encourage firms to cross list in other securities
exchanges as this may significantly impact on the firm value positively.
However, with the other conclusion of the study that cross listing had no significant
effect on the value of EABL, KCB, Centum Investments and the Nation Media Group.
This study nevertheless recommends that the management of listed firms should not be
discouraged from cross listing their firms since cross listing brings about other benefits to
the firms yet they were not covered in the objective of this study.

33
5.5 Limitations of the Study
This study assessed the effects of cross- listing on the value of cross-listed firms at
Nairobi Security Exchange using secondary for a period of four years before and after
cross listing. The study findings and recommendations thus are applicable to the sampled
firms and are applicable to the considered study period.
The study also used annual data on market value of equity, however, share prices are
available on daily basis hence the findings are based on the annual closing share price of
the sampled firms, which had cross-listed at the Nairobi Securities Exchange. The study
also sampled the firms, which had carried out cross listing from the year 2000 up to 2017.
5.6 Suggestion for Further Research
The study considered firms, which had been cross-listed at the Nairobi securities
exchange in Kenya for the period between 2000 and 2017 and used annual secondary
data hence, the study therefore a similar study using monthly secondary data on share
prices. This study used the Tobin Q to measure the value of the cross listed firms hence
the study also recommends a similar study using other measures of firm value.

34
REFERENCES
Alkhatib, K. (2012). The Determinants of Leverage of Listed Companies. International
Journal of Business and Social Science, 3(24), 78-83
Ayako, A. & Wamalwa, F. (2015). Determinants of Firm Value in Kenya: Case of
Commercial Banks Listed at the Nairobi Securities Exchange. Applied Finance
and Accounting, 1(2), 129 – 142
Baker, H. K., Nofsinger, R. F. & Weaver, D. G. (1998). International Cross-Listing and
Visibility. Available at https://www.researchgate.net/publication/207258219
Bashar, S. M. & Islam, M. I. (2014). Determinants of Profitability in the Pharmaceutical
Industry of Bangladesh. Journal of SUB., 5(1), 56-76
Berg, M. (2012). Cross-listing and valuation differences between the Hong Kong and the
Chinese stock markets Finance. Unpublished Thesis. Aalto University
Brockman, P., Salas, J. M. & Zagorchev, A. (2015). The Impact of Cross-Listing on
Corporate Governance: A Test of the Governance-Bonding Hypothesis. Lehigh
University
Carrieri, F., Mouchette, X. & Muller, A. (2014). The Role of Segmentation and Investor
Recognition through the Lens of Cross-Listing Activity. University of Li`ege,
Belgium
Cetorelli, N. & Peristiani, S. (2015). Firm Value and Cross Listings: The Impact of Stock
Market Prestige. Risk and Financial Management, 8, 150-180

35
Chisadza, M. W. (2013). The Role of Cross-Listings in Establishing a SADC Regional
Stock Exchange. Unpublished LLM Thesis. The University of the Western Cape
Chouinard, E. & D’Souza, C. (2004). The Rationale for Cross-Border Listings. Bank of
Canada Review, 1, 23-30
Chung, J., Cho, H. & Kim, W. (2011). Is Cross-Listing a Commitment Mechanism?
Evidence from Cross-Listings around the World. Korea University
Dobrina, G. & Lee, W. Y. (2007). Impact of Sarbanes-Oxley Act on Cross-Listing.
Available at https://www.researchgate.net/publication/228259070
Dodd, O. & Frijns, B. (2012). Cross listing and the Home Bias. Auckland University of
Technology, Auckland, New Zealand
Dodd, O. (2013). Why Do Firms Cross-List Their Shares on Foreign Exchanges? A
Review of Cross-Listing Theories and Empirical Evidence. Auckland University
of Technology, New Zealand
Doidge, C., Karolyi, G. & Stulz, M. (2004). Why are Foreign Firms Listed in the U.S.
Worth More? Journal of Financial Economics, 71, 205–238
Foucault, T. & Gehrig, T. (2006). Stock Price Informativeness, Cross-Listings and
Investment Decisions. University of Freiburg and CEPR, Freiburg, Germany
Hail, L. & Leuz, C. (2008). Cost of Capital Effects and Changes in Growth Expectations
around U.S. Cross-Listings. University of Chicago

36
Jong, A., Mertens, G. & Poel, M. (2010). The Effect of Cross Listing on Management
Forecast Specificity and Accuracy in the Netherlands. Open Universiteit
Nederland
Kamotho, C. W. (2013). The Relationship Between Cross Listing and Liquidity: A Study
of Shares Cross-Listed in the East African Securities Exchanges. Unpublished
MSc Project. University of Nairobi
Katto, J. (2012). The EAC Common Market: The East African Securities Regulatory
Authorities (Easra) Experience. Presentation at the EAC Legal Harmonization
Conference 6th & 7th August 2012 Arusha, Tanzania
Khurana, I. K., Xiumin, M. & Periera, R. (2008). Cross listing and Firm Growth. Review
of Finance, 12 (2), 293-322
King, M. R & Segal, D. (2006). The Long-Term Effects of Cross-Listing, Investor
Recognition, and Ownership Structure on Valuation. University of Toronto
King, M. R. & Segal, D. (2004). International Cross-Listing and the Bonding Hypothesis.
Bank of Canada Working Paper 2004-17
Kumar, D. & Agarwal, C. (2012). Liquidity Management in Indian Electrical Equipment
Companies (A Comparative Study of Companies Listed in Nifty 50). Int. J. of
Trade and Commerce, 1(2), 367-389
Kusnadi, Y. (2014). Cross-Listings and Corporate Cash Savings: International Evidence.
Singapore Management University

37
Lel, U. & Miller, D. P. (2006). International Cross-listing, Firm Performance and Top
Management Turnover: A Test of the Bonding Hypothesis. International Finance
Discussion Papers No. 877. Board of Governors of the Federal Reserve System
Ma’aji, M. M. & Sadiq, R. A. (2014). Market Reaction to International Cross-Listing:
Evidence from Nigeria. International Journal of Information Technology and
Business Management, 27(1), 13-25
Makanga, I. M. & Gateri, M. W. (2015). Effects of Cross-Listing on Valuation and Firm
Performance. United States International University, Africa
Makau, S. M., Onyuma, S. O. & Okumu, A. N. (2015). Impact of Cross-Border Listing
on Stock Liquidity: Evidence from East African Community. Journal of Finance
and Accounting, 3(1), 10-18.
Melvin, M. & Valero-Tonone, M. (2004). The Dark Side of International Cross-Listing:
Effects on Rival Firms at Home. Arizona State University, Tempe, USA
McWilliams, A., & Siegel, D. (1997). Event studies in management research: theoretical
and empirical issues. Academy of Management Journal, 40(3), 626–657.
Mugo, R. K. (2010). An Assessment of the Effects of Cross-Border Listing on Firm’s
Financial Performance. The Case of Kenyan Listed Companies. Unpublished
MBA Project. Egerton University
Muheirwe, D., Memba, F. & Kule, J. W. (2015). An Assessment of the Factors that affect
the Financial Performance of the Cross-Listed Companies in the Rwanda Stock
38
Exchange. European Journal of Accounting, Auditing and Finance Research,
3(10), 34-57
Nairobi Securities Exchange (2014). Review of the NSE 20 Share Index Constituent
Counters. The Nairobi Securities Exchange Ltd
Ndirangu, E. W. & Iraya, C. (2016). The Effect of Cross Listing on the Accounting
Quality of Firms Cross-Listed in East African Markets. European Scientific
Journal, 12(10), 403 – 416
Ndiritu, G. M. & Mugivane, F. I. (2015). Factors Leading to Slow Growth in Listed
Firms on Stock Markets in the East Africa Region: The Case of Nairobi Security
Exchange (NSE). Prime Journal of Business Administration and Management,
5(7), 1886-1890
O’connor, T. & Phylaktis, K. (2011). Cross-Listing Behavior. National University of
Ireland
Olatundun J. A. (2009). The Impact of the Regional Cross-Listing of Stocks on Firm
Value in Sub-Saharan Africa. IMF Policy Discussion Paper 09/99. International
Monetary Fund
Omanyo, V. O. (2016). The Effect of Cross Border Listing on Volatility of Returns on
Shares of Companies Cross - Listed within East Africa. International Journal of
Innovative Research & Development, 5(3), 154- 166

39
Onyuma, S.O., Mugo, R. K. & Karuiya, J. K. (2012). Does Cross-Border Listing (Still)
Improve Firm Financial Performance In Eastern Africa? Journal of Business,
Economics & Finance, 1 (1), 92-109
Opiyo, E. (2013). Effects of Corporate Governance on Insider Trading: A Case of Listed
Companies on Nairobi Securities Exchange. Prime Journal of Business
Administration and Management, 3(10), 1202-1224
Peng, M. W. & Su, W. (2013). Cross-listing and The Scope of the Firm. Journal of World
Business, Available at http:// dx.doi.org/10.1016/j.jwb.2012.11.002
Prasad, V., Brusa, J. & Camacho, P. (2012). The Effect of Cross-Listing on CEO
Compensation. Texas A&M International University, Texas, USA
Rajni, K. R. & Kawalpreet, K. (2013). Financial Determinants of Firm’s Value Evidence
from Indian Firms. Zenith International Journal of Business Economics, 3 (5), 70-
76
Rono, H. C. (2014). Stock Price Reaction to Earnings Announcements: A Comparative
Test of Market Efficiency between NSE securities exchange and JSE securities
exchange. Unpublished Thesis. University of the Witwatersrand
Sarkissian, S. & Schill, M. J. (2009). Cross Listing Waves and the Search for Value
Gains. University of Virginia
Silvers, R. & Elgers, P. (2011). The Valuation Impact of SEC Enforcement Actions on
Non-Target Cross-Listed Firms. University of Massachusetts

40
Sivathaasan, N., Tharanika R., Sinthuja, M. & Hanitha, V. (2013). Factors determining
Profitability: A Study of Selected Manufacturing Companies listed on Colombo
Stock Exchange in Sri Lanka. European Journal of Business and Management,
5(27), 99-107
Sudiyatno, B., Puspitasari, E. & Kartika, A. (2012). The Company's Policy, Firm
Performance, and Firm Value: An Empirical Research on Indonesia Stock
Exchange. American International Journal of Contemporary Research, 2 (12), 30
– 40
Waweru, K. M., Pokhariyal, G. P. & Mwaura, M. F. (2012). Cross Listing and Valuation
Effects: Evidence from Nairobi Securities Exchange. Journal of Modern
Accounting and Auditing, 8(9), 1371-1380
Waweru, K. M., Pokhariyal, G. P. & Mwaura, M. F. (2012). The Key Reasons for Cross -
Listing in East African Stock Exchanges by Firms Listed in the Nairobi Securities
Exchange. International Journal of Business and Management, 7(16), 118 – 124
Zikmund, W. G., Babin, J., Carr. J. C. & Griffin, M. (2011). Business Research Methods.
(9th Ed.). South-Western, Cengage Learning

41
APPENDICES
Appendix I: List of Cross Listed Firms at the NSE
Company Primary
listing
Year of
listing
Cross listed
Exchange
1. East Africa Breweries
Ltd (EABL)
NSE 2005 USE/DSE
2. Kenya Airways (KQ) NSE 2004 USE/DSE
3. Jubilee Holding Ltd NSE 2006 USE/DSE
4. KCB Group NSE 2009 USE/RSE
5. Equity Group NSE 2009 USE
6. Centum Investment
Group
NSE 2010 RSE
7. Nation Media Group NSE 2010 USE/DSE/RSE
8. Uchumi NSE 2013 USE/RSA
Source: NSE (2017)

42
Appendix II: Research data
Firm Year MVE BVE Tobin Q
EABL 2001 74.00 2.00 37.00
2002 128.00 2.00 64.00
2003 442.00 2.00 221.00
2004 116.00 2.00 58.00
2005 135.00 2.00 67.50
2006 149.00 2.00 74.50
2007 168.00 2.00 84.00
2008 144.00 2.00 72.00
2009 145.00 2.00 72.50
KQ 2000 7.60 5.00 1.52
2001 7.40 5.00 1.48
2002 6.85 5.00 1.37
2003 8.65 5.00 1.73
2004 16.90 5.00 3.38
2005 82.00 5.00 16.40
2006 114.00 5.00 22.80
2007 63.50 5.00 12.70
2008 27.00 5.00 5.40
Jubilee 2002 15.50 5.00 3.10
2003 50.00 5.00 10.00
2004 58.00 5.00 11.60
2005 83.00 5.00 16.60
2006 338.00 5.00 67.60
2007 213.00 5.00 42.60
2008 123.00 5.00 24.60
2009 115.00 5.00 23.00
2010 184.00 5.00 36.80

43
KCB 2005 113.00 1.00 113.00
2006 263.00 1.00 263.00
2007 28.50 1.00 28.50
2008 23.50 1.00 23.50
2009 20.50 1.00 20.50
2010 21.75 1.00 21.75
2011 16.85 1.00 16.85
2012 29.75 1.00 29.75
2013 47.25 1.00 47.25
Equity 2005 0.00 0.00 0.00
2006 225.00 0.50 450.00
2007 150.00 0.50 300.00
2008 176.00 0.50 352.00
2009 14.35 0.50 28.70
2010 26.75 0.50 53.50
2011 16.40 0.50 32.80
2012 23.25 0.50 46.50
2013 30.75 0.50 61.50
Centum 2006 41.25 0.50 82.50
2007 29.75 0.50 59.50
2008 18.75 0.50 37.50
2009 11.25 0.50 22.50
2010 23.00 0.50 46.00
2011 13.50 0.50 27.00
2012 12.35 0.50 24.70
2013 33.00 0.50 66.00
2014 61.00 0.50 122.00
NMG 2006 361.00 2.50 144.40
2007 326.00 2.50 130.40
2008 144.00 2.50 57.60

44
2009 118.00 2.50 47.20
2010 167.00 2.50 66.80
2011 140.00 2.50 56.00
2012 222.00 2.50 88.80
2013 314.00 2.50 125.60
2014 263.00 2.50 105.20
Uchumi 2009 14.50 5.00 2.90
2010 14.50 5.00 2.90
2011 7.35 5.00 1.47
2012 19.10 5.00 3.82
2013 19.45 5.00 3.89
2014 10.05 5.00 2.01
2015 10.95 5.00 2.19
2016 3.90 5.00 0.78
2017 3.40 5.00 0.68
Source: Research Findings