FACTORS INFLUENCING STOCK PRICES FOR FIRMS LISTED AT ...
59
FACTORS INFLUENCING STOCK PRICES FOR FIRMS LISTED AT NAIROBI SECURITIES EXCHANGE AFTER INITIAL PUBLIC OFFERINGS IN KENYA BY MUGO PAUL NJOGU KCA O7/01634 A RESEARCH PROJECT SUBMITTED IN PARTIAL FULFILLMENT OF THE REQUIREMENTS FOR THE AWARD OF MASTERS OF SCIENCE IN COMMERCE, TO THE SCHOOL OF GRADUATE STUDIES AND RESEARCH, KCA UNIVERSITY OCTOBER 2017
Transcript of FACTORS INFLUENCING STOCK PRICES FOR FIRMS LISTED AT ...
FACTORS INFLUENCING STOCK PRICES FOR FIRMS LISTED AT NAIROBI
SECURITIES EXCHANGE AFTER INITIAL PUBLIC OFFERINGS IN KENYA
BY
MUGO PAUL NJOGU
KCA O7/01634
A RESEARCH PROJECT SUBMITTED IN PARTIAL FULFILLMENT OF THE
REQUIREMENTS FOR THE AWARD OF MASTERS OF SCIENCE IN
COMMERCE, TO THE SCHOOL OF GRADUATE STUDIES AND RESEARCH,
KCA UNIVERSITY
OCTOBER 2017

ii
DECLARATION
This research project is my original work and has not been presented to any other examination
body. No part of this work may be reproduced without my consent or that of the KCA
University.
Student Name: Student Number:
Mugo Paul Njogu ………………………………………… Reg. No: KCA/07/01634
Sign…………………… Date ….…................
Declaration by the Supervisor
This research project has been submitted for defense with my approval as the KCA University
Supervisor.
Lecturer Name:
Dr. Michael Njogo
Sign………………………… Date…………………

iii
ABSTRACT
Initial Public Offerings (IPO’s) have recently become popular as way of sourcing for funds
by organizations and to the investors by buying shares in those companies. However, IPO
can be a risky investment avenue because of uncertainty regarding the future prices of the
shares. For the individual investor, it is difficult to predict how the stock or shares performed
on its initial day of trading and in the near future since there is often little historical data with
which to analyze the company and into which to base or guide the investor while making
investment decisions. The study targeted 9 companies that had IPO during the period 2006 to
2015. The main objective of the study was to determine the factors influencing stock market
prices of companies listed at NSE after IPO’s in Kenya. The study was guided by the
following specific objectives: to determine the effect of Earning per Share on stock market
prices of companies listed at NSE after IPO’s in Kenya; to establish the effect of Dividend
Policy on stock market prices of companies listed at NSE after IPO’s in Kenya; to ascertain
the effect of Liquidity of the firm on stock market prices of companies listed at NSE after
IPO’s in Kenya; to ascertain the effect of Size of a firm on stock market prices of companies
listed at NSE after IPO’s in Kenya. A correlation research design was undertaken in the
study and secondary data collected from annual statements of the nine companies for the
period of study. The study established that in view of significance at 0.05, the study
documents that the main significant predictors of share prices after IPO for listed firms are
DPS (p=0.022) and EPS (p=0.000) which are all less than 0.05. Also the Liquidity and the
firm size have a positive relationship with the firms’ share price. The study concludes and
recommends that upon listing of the firms on the NSE, should evaluate their dividend policy.
The firms listed on NSE should enhance their EPS by investing in viable projects that
increase the earnings. Listed firms on the NSE should regularly pay dividends to their
shareholders on the income generated from investment projects.
Key words: Market stock prices; Initial Public Offering; Dividend Policy; Earning per Share

iv
ACKNOWLEDGEMENT
All thanks to God for the gift of life he has bestowed upon me, and for making possible what
seemed impossible at certain times in my life and for seeing me through the whole of this
project process. Without Him, I would not have made it to see this day. I also acknowledge
my supervisor Dr. Michael Njogo, whose intellectual support and insightful guidance has seen
this research project come out better. I also thank my colleagues in college for their insights
during the research project process. The discussions we had on this topic shaped the course
which the project took. Lastly, I thank my family members- my late dear wife Hannah and my
three lovely daughters Ciru, Ciku and Sarah Liz for being supportive all through. Their prayer
and support, both financially and mental has seen me go this far.

v
TABLE OF CONTENTS
DECLARATION............................................................................................................ ii
ABSTRACT ................................................................................................................... iii
ACKNOWLEDGEMENT ............................................................................................ iv
DEDICATION.............................................................................................................. vii
LIST OF FIGURES .................................................................................................... viii
LIST OF TABLES ........................................................................................................ ix
ABBREVIATIONS .........................................................................................................x
DEFINITION OF TERMS........................................................................................... xi
CHAPTER ONE: INTRODUCTION ...........................................................................1
1.1 Backgrounds to the Study ...........................................................................................1
1.2 The Statement of the Problem.....................................................................................6
1.3 Objectives of the Study ...............................................................................................8
1.4 Research Questions .....................................................................................................8
1.5 Justification of the Study ............................................................................................9
1.6 Significance of the Study ............................................................................................9
1.7 The Scope of the Study .............................................................................................10
CHAPTER TWO: LITERATURE REVIEW ..........................................................111
2.1 Introduction .............................................................................................................111
2.2 Theoretical Review .................................................................................................111
2.3 Empirical Review....................................................................................................155
2.4 Research Gap ............................................................................................................20
2.5 Conceptual Framework ...........................................................................................222
2.6 Operationalization ...................................................................................................233
CHAPTER THREE: RESEARCH METHODOLOGY ............................................24
3.1 Introduction .............................................................................................................244
3.2 Research Design......................................................................................................244
3.3 Target Population ....................................................................................................244
3.4 Sample Size and Sampling Technique ....................................................................243
3.5 Research Instruments ..............................................................................................255
3.6 Data Analysis ..........................................................................................................255
3.7 Model Specification ..................................................................................................27
vi
CHAPTER FOUR: DATA ANALYSIS AND INTERPRETATION .....................288
4.1 Introduction .............................................................................................................288
4.2 Exploratory Data Analysis ........................................................................................32
4.3 Diagnostic Tests...………………………………………………………………….32
4.4.1 Panel Data Descriptive Analysis ..........................................................................333
4.4.2 Panel Data Regression Analysis ..........................................................................334
CHAPTER FIVE: SUMMARY, CONCLUSIONS AND RECOMMENDATIONS366
5.1 Introduction .............................................................................................................366
5.2 Summary of the Findings ........................................................................................366
5.3 Conclusion of the Study ..........................................................................................388
5.4 Recommendations for Further Studies....................................................................389
5.5 Limitation of the Study ...........................................................................................399
References.......................................................................................................................40
APPENDICES ...............................................................................................................44
Appendix I: Initial Public Offers Kenya (IPOs) 2006-2015 ......................................44
Appendix II: Work Plan .............................................................................................455
Appendix III: Budget ..................................................................................................466
Appendix IV: Data for the Study ................................................................................47

vii
DEDICATION
I dedicate this project to my family and friends

viii
LIST OF FIGURES
Figure 2.1: Conceptual Framework .................................................................................... 22
Figure 4.1: Growth Pattern for each Firm Share Price ..................................................... 229
Figure 4.2: Overlain Share Price ......................................................................................... 22

ix
LIST OF TABLES
Table 2.1: Operationalization of Variables ....................................................................... 233
Table 4.1: Multi-co linearity Test…………………………………………………………32
Table 4.2: Durbin Watson test statistics ............................................................................. 32
Table 4.3: Heteroscedasticity Tests .................................................................................... 33
Table 4.4: Information Criteria ........................................................................................... 33
Table 4.5: Type III Tests of Fixed Effect ........................................................................... 34

x
ABBREVIATIONS
CBK Central Bank of Kenya
CMA Capital Market Authority
IPO Initial Public Offering
Kshs Kenya Shillings
NSE Nairobi Securities Exchange

xi
DEFINITION OF TERMS
Initial Public Offering
Initial Public Offering occurs when a company sells its shares or stock to the public for the
first time (Gregoriou, 2006).
Market
Market means a place where trade transactions of exchange take place. There are
organizations that facilitate the trade in financial securities, like a stock exchange or
commodity exchange. This may be a physical location like Nairobi Securities Exchange
(Gregoriou, 2006).
Stock Market Value
Stock Market Value means the market price of the stock. It is the price at which investors
buy or sell a share of common stock or a bond at a given time. Market value is determined by
the interaction between buyers and sellers. The current market price of a security is indicated
by the latest trade recorded (Farwell & Leffler 1963).
Nairobi Securities Exchange
Nairobi Securities Exchange is a market which deals in the exchange of shares of publicly
quoted companies, and government and corporate bonds among other instruments for money
(NSE, 2015).
Capital Market Authority
Capital Market Authority is the authority charged with responsibility of safeguarding the
investors` interests by ensuring that various regulations on capital market are followed and
adhered to. This is a market that brings together lenders (investors) of capital and borrowers
(companies that sell securities to the public) of capital (CMA, 2015).
The Prospectus
The Prospectus is the primary document in communicating information about the quality and
potential of the firm. A high disclosure level decreases information asymmetry between the
firm and the investors (potential investors) and therefore leads to a lower risk in the
investment (CMA, 2015).
CHAPTER ONE
INTRODUCTION
1.1 Backgrounds to the Study
Initial public offering (IPO) is when firms issue shares or common stock to the public for
the very first time (Gregoriou, 2006). The extent to which public information is
incorporated into the pricing of an IPO is a matter of recent debate. Many factors affect
market share prices of listed companies after initial public offerings. Stock prices changes
after IPO’s have shown that most stocks of companies fetch higher, lower or remain
stable in comparison with the offer price of respective companies just before IPO (NSE
Handbook, 2008). Returns from share investments are expected to vary owing to the
movement of market share prices that depends on various factors that could be either
internal or firm specific like; earnings per share, dividends and book value or external
factors such as interest rate, GDP, inflation, government regulations and Foreign
Exchange Rate (FOREX). Share price is used as a benchmark to gauge performance of a
firm and its variations as an indicator of the economic health or otherwise of a firm hence
the need to be conversant with the factors that could adversely affect share prices.
An initial public offer IPO is one of the most significant cycles in a firm’s cycle as this
facilitates accessibility to sources of finances that drives growth of the firm. Through an
IPO, a firm is able to access public equity market platforms that drive future growth.
According to Edmonston (2009), an IPO is where a firm sell to public equities for the
first time so at to raise finance for specific purpose for example growth. An IPO brings
about transformation of a private into a public company (Edmonston, 2009). During the
issue of IPO, the public are invited to participate and the formula of allotting shares is
clearly stated. There are certain costs that a firm incurs in the process of IPO issue which
can be direct or indirect costs. Direct costs include underwriting fees and auditors fee
while in direct costs include the time spent by management in advertising for the IPO
before the actual issue. IPOs help companies to enhance their liquidity positions and
expand their accessibility to capital (Berk, Demarzo & Jarrad, 2013).
The other common terms that describe IPO include going public or floatation. Initial
public offerings IPOs are normally floated through security exchange markets. These
security markets can either be efficient or inefficient. An efficient security market is
2
based on the Efficient Market Hypothesis as indicated by Fama (1970). However,
according to Chuvakhin (2000), security exchange markets are not as efficient as
indicated by the EMH but rather relatively efficient. Companies usually issue IPOs at
predetermined price which can be undervalued or overvalued based on how shareholders
will react. When a firm under prices its share prices, this means that the share price is
priced at lower value than the market value.
According to Gajewski and Gresse (2006) firms normally price their IPO below the
market value to improve the secondary market liquidity, for shareholders to maximize the
sale price, to manage litigation risk and to solve information asymmetries. After an IPO,
the share price may either go up or reduce and this is likely to affect the share returns of
the share holders. During the past years the global equity markets have been
characterized by increased interest into IPO issues, with investors in the Kenyan market
experiencing over-subscriptions when it comes to IPO applications. From an investors’
point of view, the IPO issues are an opportunity to maximize gains and profits as they
penetrate into the equity investments (French, 2008).
Share prices are highly affected by the business fundamentals, which are either economic
or political. These are factors that affect the share prices but are outside the share market
itself. The many traders and investors in the market are at all times seeking to know the
trend of the share prices. Good dividend payouts indicate that companies are generating
real earnings and they are not giving a false picture of the reality. This in turn leads to
higher firm value as share prices increases to reflect higher dividend payouts after first
shares are initially sold by a company. Announcements of initial share offering leads to
positive average abnormal returns that are statistically significant.
The changes in stock prices in the Nairobi Securities Exchange after initial public
offering have shown that most stocks of companies fetch higher, lower or remain stable
in comparison with the offer price of the IPO (NSE Handbook 2008). Kenyans have in
the recent years taken a lot of interest in investing in the financial markets. A financial
market is a market in which people and entities can trade financial securities,
commodities, and other valuable items at low transaction costs and at prices that reflect
supply and demand (Vincent, Ongore & Kusa, 2013). Financial markets have evolved
significantly over several years and are undergoing constant innovation to improve
liquidity.

3
The earnings per share EPS of the firm indicates the return to outstanding shareholders of
the company as a result of their investment in shares. Stability of an EPS is a significant
determinant of the share prices after IPO (Baker & Haslem, 2015). The dividend policy
of the firm on the other hand is determined by the amount of cash flow stream from an
investment. Some firms strive to strike a balance between the amount set aside for
dividends to shareholders and the retained amount for future investments.
If a financial system is well-developed, it will enhance investment by identifying and
funding good business opportunities, mobilize savings, enable the
trading, hedging and diversification of risk and facilitate the exchange of goods and
services (Vincent et al. 2013). The Financial markets perform a wide range of economic
and political function while offering trading, investment, speculation, hedging, and
arbitrage opportunities. In addition, they serve as a mechanism for price discovery and
information dissemination while providing vehicles for raising finances for companies.
Financial markets attract funds from investors and channel them to corporations. They
thus allow corporations to finance their operations and achieve growth. Money markets
allow firms to borrow funds on a short term basis, while capital markets allow
corporation to borrow on long-term funding to support expansion.
1.1.1 Initial Public Offering (IPO)
Initial public offering (IPO) is when a company issues common stock or shares to the
public for the first time (Gregoriou, 2006). Lowry & Schwert (2002) define Initial Public
Offer (IPOs) as the first sale of stock by a company to the public. They are often issued
by smaller, younger companies seeking capital to expand, but can also be done by large
privately-owned companies looking to become publicly traded. Initial Public Offerings
(IPO) involve problems regarding price discovery due to uncertainties regarding
aggregate demand and the quality of the issuer. Lowry and Shu (2002) observed that
pricing of IPOs have become a daunting task due to obscurity of discovering an
appropriate comparable firm, the market is not certain about the quality of the IPO firm,
while the issuing firm and its underwriter do not know the demand for IPO shares.
In an IPO, the issuer may obtain the assistance of an underwriting firm, which helps it
determines the type of security to issue, best offering price and time to bring it to market.
IPO’s involve one or more investment banks as underwriters. The company offering its
shares, called the issuer enters into a contract with a lead underwriter to sell its shares to
4
the public. The underwriter then approaches investors with offers to sell these shares.
Upon selling the shares, the underwriters charge a commission based on a percentage of
the value of the shares sold with individual investors, which is a key incentive for many
companies seeking to list. Usually, the offering will include the issuance of new shares,
intended to raise new capital, as well as the secondary sale of existing shares, (Benninga,
Helmantel & Sarig, 2005).
The extent to which public information is incorporated into the pricing of an IPO is a
matter of recent debate. Loughran and Ritter’s (2002a) findings suggest that public
information is only partially incorporated into the offer price, even though Benveniste
and Spindt (1989) would not predict this. In fact, this partial incorporation of public
information seems to suggest that the IPO pricing process is not efficient. In Kenya there
are many companies which have carried out IPO’s and the following are the ones which
have done so from the year 2006 to 2015 namely KenGen, AccesKenya Group, Scan
group, Eveready East Africa Ltd., Kenya Re, Safaricom, Cooperative Bank, British-
American Investment Co. and NSE. The listing of KenGen in the year 2006 crowned a
successful government campaign to promote share ownership among the ordinary people
that brought renewed interest in capital markets and drew many investors to the stock
market for the first time, (NSE 92015).
The Safaricom Ltd attracted the highest number of prospective buyers about 860,000 in
Kenya’s IPO history. The 10 billion shares that were put on sale were oversubscribed by
a massive 453 per cent forcing a reduction in the number of minimum shares allocated to
individual applicants. The Safaricom refund was in total mess because as at 20th August
2008, at a total of Kshs l .67 billion out of the total refunds amounting to Kshs 92 billion
had not been refunded to the investors according to the statistics from the Central Bank of
Kenya. The performance of the shares in the stock market in Kenya after IPO’s vary from
the time of the first trading and thereafter in comparison with the offer price. The trend of
the share prices after the IPO’s could be higher, lower or stable than the offer price (NSE
Handbook, 2008). Hence the need to evaluate the factors influencing the share prices
after the IPO ‘s for the listed companies in NSE, (Kipngetich, Kibet, Guyo & Kipkoskey,
2011).

5
1.1.2 Changes of Stock Share Price
Returns from equity investments are expected to vary owing to the movement of share
prices, which depend on various factors which could be internal or firm specific such as
earnings per share, dividends and book value or external factors such as interest rate,
GDP, inflation, government regulations and Foreign Exchange Rate (FOREX). Share
price is used as a benchmark to gauge performance of a firm and its variations as an
indicator of the economic health or otherwise of a firm hence the need to be conversant
with the factors that could adversely affect share prices. Share price is the value of the
firm divided by the number of shares outstanding. It can also be defined as the price that
buyers and sellers establish when they trade in the shares, (NSE Hand Book 2005).
Share prices are highly affected by the business fundamentals, which are either economic
or political. These are factors that affect the share prices but are outside the share market
itself. The many traders and investors in the market are at all times seeking to know the
trend of the share prices, and this trend is mainly based on the fundamental conditions,
(Farwell & Leffler,1963). Investors are mainly interested in the returns they get from
their investment, therefore, they will always select their investment well so as to fulfill
their expectations.
1.1.3 Nairobi Securities Exchange (NSE)
The Nairobi Securities Exchange (NSE) was constituted as Nairobi Stock Exchange in
1954 as a voluntary association of stockbrokers, registered under the Societies Act. In
Kenya, dealing in shares and stocks started in the 1920s when the country was still a
British colony. However, the market was not formal as there were no rules and
regulations to govern stock broking activities. Trading took place on a ‘gentleman’s
agreement.’ Standard commissions were charged with clients being obligated to honor
their contractual commitments of making good delivery and settling relevant costs. The
NSE is a member of the African Stock Exchanges Associations (ASEA). It is Africa's
fourth largest stock exchange in terms of trading volumes, and fifty in terms of market
capitalization as a percentage of GDP. The Exchange works in cooperation with the
Uganda Securities Exchange and the Dar Es Salaam Stock Exchange including the cross
listing of various equities (NSE Handbook ,2008).
6
In May 2006, NSE formed a demutualization committee to spearhead the process of
demutualization. Demutualization is the process through which a member-owned
company becomes shareholder-owned. It is sometimes called stocking or privatization.
The NSE has already demutualised itself, that is, the shares of the NSE ltd are now
tradable on the stock exchange itself. The purpose of this is to separate ownership from
management of the NSE while keeping along with global trends. On June 27, 2014, the
Capital Markets Authority approved the listing of the NSE stocks through an IPO. The
IPO opened on July 24, 2014 and ran up to August 12, 2014. The listing made the NSE
joins the Johannesburg Stock Exchange in being the only exchanges in Africa that are
self-listed. The NSE IPO was oversubscribed by 763.92% making it the most
oversubscribed share offer in the NSE’s 60-year history. The NSE shares started trading
on the Main Investment Market Segment of the exchange on September 9, 2014.
The NSE currently has 4 indices used to measure the performance of stocks. The NSE all
share Index (NASI) that is a weighted index for all the listed companies on the exchange;
the NSE 20-share Index that is a weighted index of 20 blue chip companies using market
capitalization, shares traded, number of deals and turnover as criteria for inclusion in the
index; the Financial Times Stock Exchange (FTSE) NSE Kenya 25 Index representing
the performance of the 25 most liquid stock trading on the NSE and the FTSE NSE
Kenya 15 representing the performance of the largest 15 stock trading on the NSE,
ranked by full market capitalization, (NSE, 2016).
1.2 The Statement of the Problem
Kenyan investors have expressed great interest in investing in equities especially IPO’s as
evidenced by the level of over-subscription as witnessed on the number of IPO’s issued.
Initial Public offerings are the yardsticks of growth of listed firms and for the economy as
a whole. Listed firms are in position to access funds needed for investment through IPOs.
In Kenya, for example, the IPO by Safaricom Ltd put on sale 10 Billion shares that
attracted the highest number of prospective buyers about 860,000 in Kenya’s IPO history.
IPOs help investors earn returns in form of dividends that help in furthering economic
development of the country. This indicates the significant role of IPOs towards economic
development of the country. Despite this significant role played by IPOs towards
national growth and development, little attention has been paid to determine the factors

7
that affect share prices after IPOs so as to enhance the returns for investors to grow the
economy of the country.
Various studies have been done to determine the factors that affect share prices returns.
Suret and Kooli (2004) explored the aftermarket performance for a period of five years
after the listing of 445 Canadian IPOs listed at the Toronto Stock Exchange (TSE).
Goergen et al. (2007) examined a total of 252 IPOs on firms listed at the London Stock
Exchange.
Mahmood, et al. (2011) examined the IPO under-pricing and aftermarket performance for
two windows of crises (Asian financial crises 1997-1999 and global financial crisis 2007-
2009) in Chinese stock market. Sample of 626 companies and a market adjusted return
model were used. Results indicated that in the recent global economic crisis IPO activity
is on shrinking trend and there is 10% increase in average under-pricing as compared to
last Asian financial crisis. Tsangarakis (2004) studied price performance of IPO’s in
Greece, in the long-run where he considered the long-run within the first year of trading.
Locally, Waweru (2010) sought to establish if there exists a relationship between stock
prices and news of an IPO at NSE. Kiluku (2014) explored the relationship between
initial public offer price and the post listing market price at the Nairobi Securities
Exchange for listed state owned enterprises. Chibeka (2014) sought to determine the
effects of initial public offering pricing on the long run stock returns of companies listed
at the NSE. Odongo (2012) explored mispricing and long run performance of IPO`s at the
Nairobi Securities Exchange. Wairia (2010) in his long-run analysis of initial public
offering in NSE did an annual analysis for the 3rd
, 4th
and 5th
year of trading. The study
established a long-run under-performance. Simiyu (2008) conducted study on pricing and
performance of IPO-a comparison between states owned enterprises and privately owned
at NSE. Simiyu (2015) conducted a study on the long run performance of IPOs for firms
listed at NSE and concluded that after the issuance of IPO stocks performed fairly well in
the first 3 years of trading. During the 4th
year of trading the stock under-perform but
later on performed well. Mwendwa (2014) examined the effects of initial public offering
on long-run stock price performance of companies listed at the Nairobi Securities
Exchange.
Although, most of previous studies of IPOs are based in developed markets such as the
US, Europe and Asia, the studies done in Kenya majorly concentrated on the effects of
8
initial public offerings on performance of the company. The yearly long-run studies for
the past 8 years on factors influencing stock prices after IPO have not been conducted in
Kenya for firms which had issued initial public offering from the year 2006 to 2015,
hence forming the research gap. This research will analyze factors influencing stock
prices after IPO and the effects those factors have on long run performance for the past 8
years of trading to establish whether this study results are similar to those done on long-
run performance of IPO’s both locally and internationally. This study sought to fill this
research gap as it undertook to reveal the various factors that influence share prices of
listed companies after IPO at Nairobi Security Exchange.
1.3 Objectives of the Study
1.3.1 General Objective
The main objective of the study was to determine the factors influencing stock market
prices of companies listed in NSE after IPO’s in Kenya.
1.3.2 Specific objectives of the study
Specific objectives of the study were to: -
i. To establish the effect of Dividend Policy on stock market prices of companies
listed at NSE after IPO’s in Kenya.
ii. To determine the effect of Earning per Share on stock market prices of companies
listed at NSE after IPO’s in Kenya.
iii. To determine the effect of Liquidity of the firm on stock market prices of
companies listed at NSE after IPO’s in Kenya.
iv. To ascertain the effect of Size of a firm on stock market prices of companies
listed at NSE after IPO’s in Kenya.
1.4 Research Questions
The study was based on the following research questions:
i. How does Dividend Policy of the firm influence stock market prices of companies
listed at NSE after IPO’s in Kenya?
9
ii. What is the effect of EPS on stock market prices of companies listed at NSE after
IPO’s in Kenya?
iii. How does Liquidity of a firm influence stock market prices of companies listed at
NSE after IPO’s in Kenya?
iv. What is the Size of a firm on stock market prices of companies listed at NSE after
IPO’s in Kenya?
1.5 Justification of the Study
The stock market is seen as a very significant component of the financial sector of the
economy. The study sought to evaluate the factors influencing share prices of listed
companies after the IPO to provide the investors; government regulators’ and other
stakeholders with relevant information. Many factors have an effect on market share
prices of listed companies at the NSE after IPO’s. The changes in stock prices in the NSE
after IPO’s have shown that most stocks of companies fetch higher, lower or remain
stable in comparison with the offer price of the IPO. This study would therefore add to
existing literature with regards to the influence of various identified factors on share
pricing after IPO`s. Research findings from this study would therefore add to the body of
knowledge regarding share pricing in the developing economies.
1.6 Significance of the Study
The study would have varying benefits to various stakeholders in the economy all
together to enhance better share pricing.
The study would give guidelines to investors to enhance their understanding of the
factors influencing stock market prices after IPO’s. This would assist the investors in
making viable decisions while investing in the stock market leading to reducing risk
exposure.
The market regulators namely the CMA & NSE would gain knowledge on how to handle
future 1PO’s in regard to the regulations and making of policies. Due to making sound
regulations and policies, this would result into improved confidence in investors in
investing in the stock market.
Companies would be able to appreciate the factors influencing the market prices after
IPO’s, and this would assist them in making sound decisions when to float their shares

10
through IPO’s. They would make viable decisions when setting the offer price of shares
during IPO’s. The study would establish the link between the dividends policy and the
market values. The management of companies would also make policies in regard to the
corporate governance in running the affairs of the organizations.
Information obtained by this study would be useful to future researchers who want to
advance the knowledge and literature of the company stock market values after IPO.
1.7 The Scope of the Study
This study evaluated the factors influencing the stock market prices after IPO’s of listed
companies in NSE from the year 2006 to 20l5 because most of the IPO’s in the Kenya’s
history were carried out during this period. The study targeted a population of nine
companies that have carried out IPO during the period 2006-2015. These companies are
Acces Kenya group, Safaricom, Scangroup, Kengen, Kenya Reinsurance Corporation,
Co-operative bank, Eveready, British-American Investment and NSE (Appendix I).

11
CHAPTER TWO
LITERATURE REVIEW
2.1 Introduction
This chapter discusses literature review that is related to the study based, in essence the
theoretical framework and empirical review of the factors influencing stock market prices
of firms listed in the NSE after initial public offers (IPOs) in Kenya will be covered. The
theoretical framework focuses on the Random Walk Theory, Dividend Relevance
Theory, Liquidity Preference Theory and Signaling Theory. The empirical review shall
be concerned with the factors influencing stock market prices of firms listed in the NSE
after IPOs in Kenya in relation to EPS, Dividend Policy, Liquidity and Size of the firm.
2.2 Theoretical Review
Theoretical frameworks are critical in deductive, theory-testing studies. In this section,
the study discusses the various theories that underpin the study. Specifically, the Random
Walk Theory, Dividend Relevance Theory, Liquidity Preference Theory and Signaling
Theory are discussed.
2.2.1 Random Walk Theory
The Random Walk Theory gained popularity due to the works of Malkie (1973). The
random walk theory is a stock market theory which puts on the assumption that past
movement of stock prices as well as overall markets cannot be used to forecast future
stock prices movement (Burton & Malkiel, 1973). The theory further assumes that stock
price fluctuations are in essence independent of each other in that they have the same
probability distribution. However, the theory assumes that stock prices will have an
upward trend over a period of time. According to the theory, market prices follows an up
and down random path which is not influenced by past price movements. This therefore
makes it impossible to forecast with accuracy the direction in which markets will likely
move at a point in time.
In simple terms, the theory claimed that stock prices follow a random walk which cannot
be estimated through examination of historical price information particularly in the short
term. Malkiel (1973) stated that, the adoption of the long-term buy-and-hold strategy is
the best strategy that individuals can use and that they should not try to time markets in
12
anticipation of certain trends. In addition, the making of attempts on the basis of
fundamental, technical, or any form of analysis is in essence futile.
According to Fama (2000), the context in the stock markets does not imply that the
movements of price are chaotic and whimsical. On the contrary, what it implies is that
there are periodic price changes that are un-forecast-able and statistically independent,
they cannot be properly anticipated. In essence, price movements are due to perfectly
lucid response to information, however, it should be anticipated that new information is
non-random thereby price changes as a result of this information are also supposed to be
uncorrelated and random to any apparent trend over time.
This theory is relevant to the current study as indicates the movements in share prices
predict the future movements of share prices. Predictions in share price movements are
based on a number of factors for example issue of IPOs. The theory therefore helps in
explaining whether the identified factors play significant role in determining the
movements in share prices especially after IPOs.
2.2.2 Dividend Relevance Theory
The theory was postulated by Gordon (1963). The theory suggests that investors are
generally risk averse and would rather have dividends today (“bird-in-the-hand”) than
possible share appreciation and dividends tomorrow. Dividend relevance theory proposes
that dividend policy affect the share price. Therefore, according to this theory, optimal
dividend policy should be determined which will ensure maximization of the wealth of
the shareholders. If the choice of the dividend policy affects the value of a firm, it is
considered as relevant. In that case a change in the dividend payout ratio will be followed
by a change in the market value of the firm. If the dividend is relevant, there must be an
optimum payout ratio. Optimum payout ratio is that ratio which gives highest market
value per share.
James (2001) argues that the choice of dividend payout ratio almost always affects the
value of the firm. He studied the significance of the relationship between internal rate of
return (R) and cost of capital (K) in determining optimum dividend policy which
maximizes the wealth of shareholders. Walter’s model is based on the following
assumptions: The firm finances its entire investments by means of retained earnings only,
internal rate of return (R) and cost of capital (K) of the firm remains constant, the firms’
13
earnings are either distributed as dividends or reinvested internally, 11 the earnings and
dividends of the firm will never change and the firm has a very long or infinite life.
They said that dividend policy does affect the value of firm and market price of shares.
Investors always prefer secure and current income in the form of dividends over capital
gains. Lack and Scholes (1974) found no relationship between dividend policy and stock
prices. Their results further explain that dividend policy does not affect the stock prices
and it depends on investors’ decision to keep either high or low yielding securities; return
earned by them in both cases remains the same. Empirical studies do not support
dividend relevance theory. However, actions of market participants tend to suggest that
there is some connection between dividend policy and share price.
This theory is found suitable for this study because risk averse shareholders of a firm will
prefer to be paid dividend today than wait for future capital gains. However, a firm can
only pay divided within the designed divided policy which has an effect on share prices
after IPO.
2.2.3 Liquidity Preference Theory
The liquidity preference theory was formulated by Keynes (1964). The theory suggests
that liquidity preference entails the degree to which individuals prefer cash over less
liquid assets. It basically entails individuals` ease of holding cash. The theory suggests
that, holding all other things equal, investors actually prefer liquid investments in
comparison to illiquid ones. Investors prefer cash as it results to a resultant demand
in premiums after they fortify their cash by adopting illiquid investments (Choudhry,
2011). Liquidity is cash money whereas liquidity preference is people liking for cash
money.
According to the theory, investors prefer short-term securities in comparison to long-term
securities. Encouragements to hold long term bonds are due to the notion that there will
be higher interests compared to short-term bonds. The result is that the yield curve will
always have an upward slope. Important to note is that long term bonds yields more
compared to short term bonds. This is due to various reasons that are; investors prefer to
clasp onto short term securities since they are more liquid and that they can be easily
converted to cash with modest dangers of loss of engaged principals. Simultaneously,
borrowers tend to react in the reverse direction in that they prefer long term debts

14
compared to short-term debts since the latter exposes them to the risk of having to repay
the debt under adverse condition.
This theory explains how a firm can enhance its liquidity position which definitely has an
influence on share prices especially after an IPO. The theory suggests that a firm can
enhance its liquidity position by holding more short term securities as opposed to long
term securities.
2.2.4 Signalling Theory
This theory as forwarded by Ross (1978) based on asymmetric information problems
between well-informed managers and poorly informed outsiders. Corporate executives
with favorable inside information about their firms have an incentive to convey this
positive information to outside investors in order to cause an increase in the firm’s stock
price. Hence managers of high value firms signal information to investors by adopting
some financial policy. Ross (1977) shows that managers of high valued firms will adopt a
heavily levered capital structure for their companies. Less valuable companies are
unwilling to assume so much debt because they are much more likely to fall into
bankruptcy.
Thus a separating equilibrium occurs where high valued firms use a great deal of debt
financing and less valuable companies rely more on equity financing. Investors are able
to send the signal due to market imperfections which result in market prices not reflecting
all information, especially that which is not publicly available. As a result, increased
leverage implies a higher probability of bankruptcy, and since management will be
penalized contractually if bankruptcy occurred, investors conclude they are optimistic
about the future prospects and this cause share prices to rise. Accordingly, capital
structure does not cause changes in valuation, rather it is signal conveyed by the changes
that is significant. Therefore, what is valued is the market’s perception of the value of the
firm.
This theory is relevant to this study because different actions taken by management of a
firm affects the share prices especially after an IPO. This is because such actions as
expansion and heavy capital investments (which grows the size of the firm) sends
positive signals in the mind of shareholders after an IPO that the firm is doing fine.
15
2.3 Empirical Review
This section looks at the various empirical studies regarding the factors that affect share
prices of listed companies. In essence, the influence of EPS, DPS, Liquidity, and Size on
share prices will be discussed extensively.
2.3.1 Earnings per Share and Share Prices
Islam, Khan and Adnan (2014) sought to determine how EPS affects stock prices and the
value of the firm. This was a hypothesis testing study. The data was collected using both
primary and secondary sources. Data analysis was done using Excel software. The study
established that share price does not move as fast as the EPS move. The study further
established that the share price movement depends on micro and macro economic factors
on the economy. The study recommends that investors must consider other factors as well
as EPS in order to invest in the security market.
A study was conducted by Pushpa and Sumangala (2012) to establish how EPS impacts
on market value of Equity share. The study was carried out in India. The study used 50
companies as sample size of a period of 5 years. The study revealed that EPS affects the
market value of equities in Indian stock market. In South Africa, Robbetze, de-Villiers,
and Harmse (2016) assessed the effect of earnings per share categories on share price
behavior. This study was conducted in South Africa. The study sampled 40 listed firms in
South Africa and data was examined over 2005-2013. The findings of the study indicated
that basic EPS correlated best with the changing behavior of share prices. Furthermore,
the study established that EPS proved to deliver lower correlation coefficients with share
prices.
In a study by Kalama (2013) to determine the relationship between EPS and share prices
of listed firms on the NSE, using a sample of 42 firms. The data for the study was
collected over the period 2007 to 2012. The findings of the study indicated that there was
a positive significant relationship between earnings and share prices of firms quoted at
the Nairobi Securities Exchange (NSE). It was also found that there were other variables
significantly correlated with share price. These variables included DPS and PBV which
were used as control variables in the study.
Murugesu (2013) sought to determine the effect of earning Per Share (EPS) on Share
Price (Listed Manufacturing Companies in Sri Lanka). The firm’s investment and

16
financing decisions are unavoidable and continuous. In order to make them rationally, the
firm must have a goal. Correlation and regression were used to find out the impact of
earning per share on share price. Analyzed results revealed there is strong positive
relationship between Earning per share and share price. Further earning per share can
explain 89.7% on share price of ten sample manufacturing companies in Sri Lanka.
2.3.2 Dividend Policy and Share Prices
Masum (2014) assessed on the dividend policy and its impact on stock price – a study on
commercial banks listed in Dhaka stock exchange. This paper empirically estimates
excess stock market returns for all the thirty banks listed in Dhaka Stock Exchange for
the period of 2007 to 2011. The study used panel data approach in explaining relationship
between dividends and stock prices after controlling the variables like Earnings per
Share, Return on Equity, Retention Ratio have positive relation with Stock Prices and
significantly explain the variations in the market prices of shares, while the Dividend
Yield and Profit after Tax has negative, insignificant relation with stock prices. Overall
results of this study indicate that Dividend Policy has significant positive effect on Stock
Prices.
Mutwiri (2011) investigated the effect of dividend payout ratio on share prices of
nonfinancial firms quoted on the Nairobi securities exchange. The study adopted a
descriptive research design targeting secondary data collected from NSE for all the non-
financial trading companies listed in NSE, which informed the study. The study found
that that dividend payout ratio affects the share prices of non-financial firms quoted in
NSE. This study therefore recommends diligence in the handling of dividend payout
information among the sector players in a bid to ensure that there is inclusivity of the
stock market stakeholders.
Ahmed (2011) conducted a study on the relationship between dividend per share and firm
value on companies listed on the NSE. The target population was all the 55 companies
listed on the NSE for the period from 2005 to 2009 and only companies that have
continuously paid dividends and met researcher requirements were sampled. Secondary
data was used for the study and data sourced from NSE hand book and data base.
Multiple regression statistical method was used to analyze the data. He concluded that
there was a positive between dividend payout and value of companies
17
Ratib (2013) conducted a study on effect of bonus share issues on stock returns of firms
listed at the NSE. The study employed event study methodology where the impact of
bonus shares on stock prices was measured over the five-year period from 2008 to 2012.
From the findings the study showed that bonus issue announcements led to statistically
significant positive average abnormal returns around the announcement dates. This
means the Kenyan market reacted positively to bonus issue announcements.
2.3.3 Liquidity and Share Prices
A study was conducted by Briggeman, Langemeier and Russell (2013) to assess the
impact of liquidity and solvency on cost efficiency for a sample of Kansas farms. The
study modified the standard cost-efficiency model was to incorporate liquidity and
solvency ratios. Tobit regressions were used to determine the impact of firm
characteristics on improvements in efficiency. The study established that liquidity and
solvency measures have a significant impact on improving cost efficiency. Companies
with larger expenditures on purchased inputs relative to capital were less likely to
improve efficiency when liquidity and solvency were considered.
Khidmat and Rehman (2014) studied the impact of liquidity and solvency on profitability
of chemical sector of Pakistan. The population of the study included comprised of 36
chemical companies and from these, 10 of them were selected by the researcher. The
data of the study covered a period of 9 years from 2001 to 2009. The study found out that
solvency ratio has negative and highly significant impact on the ROA and ROE and this
implies that debt to equity ratio increases then performance decreases. It is also
concluded that liquidity has high positive effect over Return on Assets of sector i.e. if
liquidity Rate is increased, ROA will also be increased with greater effect and vice versa.
Ehiedu (2014) examined the Impact of Liquidity on Profitability of Some Selected
Companies, using the Financial Statement Analysis (FSA) Approach. The study adopted
quantitative research design and the population consisted of listed firms that make up
domestic/industrial industry. The study established that there was a significant positive
correlation between current ratio and profitability, there was no definite significant
correlation between Acid-test ratio and profitability and lastly that there was no
significant positive correlation between return on capital employed and profitability. The
researcher recommends that corporate entities should not pursue extreme liquidity
policies at the expense of their profitability.

18
Banafa et.al, (2015) investigated the effect of liquidity on financial performance of non
financial firms in Kenya. The study used causal research design and the target population
constituted 42 listed non-financial firms at the NSE under different categories. The
researchers used secondary panel data contained in the annual reports and statements of
financial positions of listed non-financial companies. The results were presented using
descriptive statistics and inferential analysis. The results of statistical tests show that
liquidity, has positive effect on corporate performance (ROA). The study recommends
that financial managers must decide both how much liquidity to hold and the way in
which they hold this liquidity.
2.3.4 Size of the Firm and Share Prices
Li (2011) examined the effects of firm size, financial leverage, and R&D expenditures on
firm earnings. Using the quintile regression (QR) approach, the study analyzed S&P 500
firms from 1996 to 2005. The study found that the effects of firm size, financial leverage
and research and development expenditures on firm earnings differ considerably across
earnings quintiles. The study concluded that there exists a positive relationship between
firm size and financial leverage.
Vithessonthi (2015) surveyed the effect of firm size on the leverage–performance
relationship during the financial crisis of 2007–2009 in Thailand. From a data set of
496,430 firm-year observations of a sample of 170,013 mostly private firms, the study
found that the magnitude of the effect of leverage on operating performance is no
monotonic and conditional on firm size. Panel regression results indicate that leverage
has a negative effect on performance across firm size subsamples, year-by-year while
cross-sectional regression results show that the effect of leverage on performance is
positive for small firms and is negative for large firms. Further, the findings observed
that about 75% of Thailand firms have managed to get through the global financial crisis
on the basis that they do not have to simultaneously deleverage and liquidate their assets.
Kithuka (2013) did a study on the relationship between firm size and financial innovation
of firms listed at the Nairobi Securities Exchange. The study used a descriptive survey
research design. The study did a sample of 40 firms which were chosen using stratified
random sampling. A regression model was used for analysis and the results showed that
there was a positive relationship between the firm size and financial innovation of firms
listed at the Nairobi Stock Exchange.
19
Njoroge (2014) studied the effect of firm size on financial performance of pension
schemes in Kenya. The study did a descriptive survey between the variables under
investigation. The target population for this study was 30 occupational pension schemes
in Kenya. The research was carried out using secondary data. The data was collected
from annual reports and financial statements. The analysis showed that there was a
positive relationship between the firm size and financial performance. Further the results
indicated that there was significant market volatility as evident from the NSE index,
Treasury bill rate movement and offshore indices.
2.3.5 Share Prices
Okoro and Stephen (2014) conducted a study to investigate the factors that determine
stock price movement in Nigeria for the period 2001-2011. Data were collected from the
financial statement of 99 listed firms in the NSE. Ordinary Least Square was used to
analyze the data. Three proxies were used: EPS, Book Value of Equity per Share and
dividend cover. The result revealed that EPS has a positive impact on stock prices. The
explained that the magnitude of changes is that increase in the EPS by 1 unit will lead to
an increase in the price per share by 0.25 units. They stressed that EPS has the strongest
explanatory power in explaining stock prices movement. Sometimes OLS tend to be
biased as it does not recognize time factor, and individual firm invariant characteristics.
Gatua (2013) sought to investigate the share price determinants at NSE in Kenya. Data
was collected on the seven variables under study for a period of five years (2008 – 2012)
and regression analysis was utilized to determine the effect of selected macroeconomic
variables on the share prices of seven companies in seven sectors at NSE and the share
prices for the companies were analyzed in terms of change in magnitude. The general
results indicate that there is no one model to predict share prices at NSE. Only one
company, Equity Bank, had a model that could be used to determine share prices based
on the variables under study and this could be explained by the fact that the share prices
of Equity Bank had a big differential (of Kshs 312.15) with the highest price at Kshs
324.00 and the lowest price at Kshs 11.85 while the share prices of the other companies
under study had small differentials with the biggest differential being Kshs 54.25
Sharma (2011) undertook to examine the empirical relationship between equity share
prices and the explanatory variables; Book Value Per (BVP) share, Dividend Per
Share (DPS), Earnings Per Share (EPS), price earnings ratio, dividend yield, dividend
20
payout, size in terms of sale and net worth for the period 1993 to 1994 and 2008 to 2009
in India. Using correlation and a linear multiple regression model the results
revealed that EPS, DPS and BVP had significant impact on the market price of
shares with the former two being the strongest determinants.
Uwuigbe, Olusegun and Godswill (2012) examined the determinants of share
prices in the Nigerian stock exchange market. Using the judgmental sampling
technique, a total of 30 companies were selected and data (2006 to 2010)
collected from the stock exchange and annual reports of the firms. The paper modeled
the effects of financial performance, dividend payout and financial leverage on share
price of listed firms by using regression analysis. The study concluded that financial
performance and dividend payout had a significant positive relation with share
prices while financial leverage (proxied by debt-equity ratio) had significant
negative influence on the market value of share prices in Nigeria. Further studies could
be conducted incorporating the independent variables under current analysis as well as
having other internal and external variables.
Waweru (2010) sought to establish if there exists a relationship between stock
prices and news of an IPO at NSE. Secondary data (2004 to 2009) was obtained and
analyzed using the Comparison Period Return Approach (CPRA). The mean portfolio
daily return was calculated for the IPO within the window period. The study found that
issuing of IPOs at NSE had both positive and negative effects on daily mean returns.
Negative effects (declining mean daily returns) were on the days nearing the IPOs event
which were the result of buyer and seller expectation in the market so as to capitalize on
the new issue while positive effects (normalcy is restored) were in the days after the IPOs
event which were the result of buyer-seller initiated trading. Further research could be
carried out on whether other factors combined with the announcement of an IPO
could affect share prices and also the effect of stock splits on share prices.
2.4 Research Gap
Several studies have been conducted to determine the factors that affect share prices after
IPO. Islam, Khan and Adnan (2014) sought to assess how EPS affects prices of stock and
the value of the firm. Data analysis was done using Excel software. Pushpa and
Sumangala (2012) investigated how EPS impacts on market value of Equity share. The
study was done in India and therefore need a similar study in Kenyan context. Robbetze,
21
de-Villiers, and Harmse (2016) assessed the effect of earnings per share categories on
share price behavior and established that basic EPS correlated best with the changing
behavior of share prices. However, this study was done in South Africa. In a study to
determine the how dividend policy impacts on prices of stock, the study was conducted in
the banking sector in Dhaka stock exchange and therefore there is need for a similar
study in Kenya among listed firms. Mwitwiri (2011) on the other hand sought to ass1es
effect of dividend payout ratio on share prices of nonfinancial firms quoted on the
Nairobi securities exchange; the study concentrated on non financial firms and therefore
need a similar study among the listed firms.
Briggeman, Langemeier and Russell (2013) sought to assess the impact of liquidity and
solvency on cost efficiency for a sample of Kansas farms. Khidmat and Rehman (2014)
studied the impact of liquidity and solvency on profitability of chemical sector of
Pakistan. Vithessonthi (2015) surveyed the effect of firm size on the leverage–
performance relationship during the financial crisis of 2007–2009 in Thailand. The
studies in this paragraph however were not carried out in Kenyan context and therefore
need similar studies in Kenya.
22
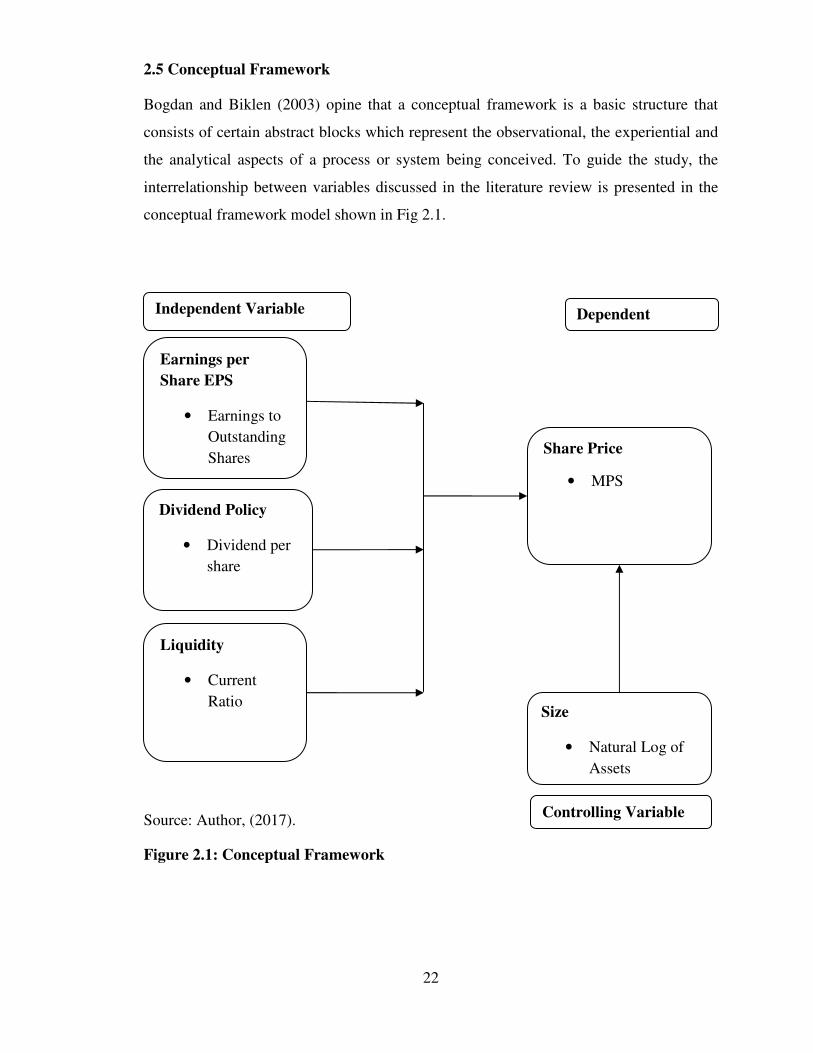
2.5 Conceptual Framework
Bogdan and Biklen (2003) opine that a conceptual framework is a basic structure that
consists of certain abstract blocks which represent the observational, the experiential and
the analytical aspects of a process or system being conceived. To guide the study, the
interrelationship between variables discussed in the literature review is presented in the
conceptual framework model shown in Fig 2.1.
Source: Author, (2017).
Figure 2.1: Conceptual Framework
Dividend Policy
• Dividend per
share
Controlling Variable
Liquidity
• Current
Ratio
Share Price
• MPS
Independent Variable Dependent
Earnings per
Share EPS
• Earnings to
Outstanding
Shares
Size
• Natural Log of
Assets

23
2.6 Operationalization
This refers to the way, in which independent variables were measured, indicators of the
variables and factors determining the same in the study.
Table 2.1: Operationalization of Variables
Variable
Indicators Measure Author
Earnings
Per Share
EPS
Earnings Per Share
after IPO
Earnings/ Outstanding
Shares
Kalama (2013)
Dividend
Per share
Dividend per share
After IPO
Dividend Paid/Number
of Shares Outstanding
Masum (2014)
Size of the
Firm
Size of Firm after
IPO
Natural Log of Assets
Fama and French, K.
R. (2012)
Liquidity Liquidity after IPO Current Assets/Current
Liabilities
Schnabl (2012)
Share price
after IPO
Changes in Share
Prices after IPO
Market Price per Share
MPS
Christiano, Ilut, Motto
and Rostagno (2010)

24
CHAPTER THREE
RESEARCH METHODOLOGY
3.1 Introduction
This section gives details regarding the procedures to be used in conducting this study.
The areas to be discussed are research design, population of the study, sample &
sampling techniques, description of data collection and data analysis methods to be used,
measurement of variables and the techniques to be used in analyzing the data.
3.2 Research Design
Research design can be defined as the plan according to which research participants are
chosen, data is collected and analyzed (Kothari, 2004). The study investigated factors
which are important in influencing market prices of listed companies after IPOs which
carried out IPOs from the year 2006 to 2015 and laying particular emphasis on their
effects to the companies and the shareholders. A correlation research design was
undertaken in the study and secondary data collected from annual statements of the nine
companies for the period of study. Archival data was used by the study to enable
subsequent analysis. Archival data means data for which the original purpose of
gathering it was not academic research (Cooper, Schindler & Sun 2003).
3.3 Target Population
Target population is the specific population for which information is desired (Mugenda &
Mugenda 2003). The study targeted a population of nine companies that have carried out
IPO during the period 2006 to 2015. In Kenya this is the only period when IPO has taken
place. To be precise IPO in Kenya has taken place from year 2006 to 2014. These
companies were Access Kenya group, Safaricom, Scan group, Ken gen, Kenya
Reinsurance Corporation, Co-operative bank Eveready, British-American Investment and
NSE.
3.4 Sample Size and Sampling Technique
Sample size is the number of cases or entities in the sample studied (Cooper & Schindler,
2006). The researcher adopted stratified random sampling technique to select the sample
size of the study. The 9 firms were stratified depending on the year it carried out its IPO.
The researcher purposively picked all those firms which carried IPO on or before the year

25
2008 in order to eliminate the problem of unbalanced data and this gave a sample size of
7 firms. The researcher collected data for 8 years from the year 2008 to 2015.
3.5 Research Instruments
The study used desk review to collect research data. This method entailed collecting
research data from existing resources hence it is a low cost technique in comparison to
field research methods (Kothari, 2004). The adoption of desk review was intensive so as
to enable a search, review as well as a synthesis of all relevant documents that can reveal
sought research data by the researcher. The study collected secondary data relating to the
company namely EPS, DPS, Current assets, current liabilities and total assets. Secondary
data entails information gathered from already existing sources (Mugenda & Mugenda,
2003). This set of data was acquired from published annual reports and financial
statements of the companies for 8 years of trading after IPO, industry analysis, websites,
and internet.
3.6 Data Analysis
Data analysis included the following procedure: data cleaning, data analysis,
interpretation and report writing. Data was collected through secondary data captured on
Microsoft Excel sheets and then imported to STATA statistical packages for analysis.
Graphical techniques are used to explore the data. Since data is both cross sectional and
time series, we use Panel regression analysis. Diagnostic test for heteroskedasticity, serial
correlation and fixed effects were conducted.
Heteroskedasticity is when the variance of the error term along the line of best fit, given
the explanatory variables is not constant. Usually, it is assumed that a significance of
more than 0.05 indicates that there is no problem of heteroscedasticity while significance
level of less than 0.05 indicates a problem of heteroscedasticity.
TABLE 2
Panel Data Diagnostic Tests
Test Test Used Conclusion
Use of pooled or
random effects
model
Breusch Pagan
LM test If P value >0.05, use pooled effects model.
26
Time Fixed Effects F statistics
If p value >0.05, there are no time fixed
effects do not use two way model or introduce
dummy variables
Heteroskedasticity
Modified Wald
Test
If P value <0.05, presence of non-uniform
variance.
Serial correlation
Wooldridge
Drukker test If P>0.05, no serial correlation
Random or fixed
effects Hausman test If p value>0.05, use random effects model.
Random effects models assume there are differences in disturbance or the error term
while fixed effects model assumes that heterogeneous groups or time had different
intercepts. We will use the Hausman test to choose between random effects and fixed
effects model which is to be applied in this study. According to Hausman (1978) there
will be enough to warrant rejection of the null hypothesis which hypothesis that the
model has random effects against the alternative which states that the model had fixed
effects.
The resulting model will be used to analyze the factors influencing stock prices for firms
listed at Nairobi Securities exchange after initial public offerings in Kenya. The
following model was used:
Fitting the pooled OLS, fixed and random effects models will be as follows:
Pooled OLS:
Yit =α + βXit +εit (1)
Where εit = error term
Fixed effects:
Yit =αi + βXit +µi+εit (2)
Where µt = fixed effect
Where εit = error term
27
Random effects:
Yit =α + Xitβ+ µit+εit (3)
Where εit = within entity error term
µit = between entity error term
From the equations;
Yit = Share Price for ith
firm in tth
year.
Xit = vector representing independent variables (Earning Per Share, Dividend Per Share,
liquidity and size) for firm i in year t,
β = Vector of Coefficients of the independent variables,
α = the intercept for each entity, i= 1, 2 …7 (indicator of the listed firms)
t = 1, 2 … 8 (time indicator)
3.7 Model Specification
To analyze the factors influencing stock prices for firms listed at Nairobi Securities
exchange after initial public offerings in Kenya the following models was used:
Share Price it = f (EPS it, DPS it, Liquidity it, Firm size it,) + Ɛ it
Yit= β0 + β1X1it + β2X2it + β3X3it + β4X4it+ eit
Where:
Share it: Share Price i at time t
DPS it: Dividend per share of firm i at time t
EPS it: Earning per share of firm i at time t
Liquidity it: Liquidity of firm i at time t
Firm size it: firm size of company i at time t
Ɛ it: Error term

28
CHAPTER FOUR
DATA ANALYSIS AND INTERPRETATION
4.1 Introduction
The study sought to establish the factors influencing stock market prices of companies
listed at NSE after IPO’s in Kenya. The study was guided by the following specific
objectives: to determine the effect of Earning per Share EPS on stock market prices of
companies listed at NSE after IPO’s in Kenya; to establish the effect of Dividend Policy
on stock market prices of companies listed at NSE after IPO’s in Kenya; to ascertain the
effect of Liquidity of the firm on stock market prices of companies listed at NSE after
IPO’s in Kenya; to ascertain the effect of Size of a firm on stock market prices of
companies listed at NSE after IPO’s in Kenya. The data used was secondary in nature and
the analysis was done using Stata software. Panel data methodologies were used for
analysis of the data. Exploratory analysis, diagnostic tests and panel data analysis is
presented.
4.2 Exploratory Data Analysis
Prior to examination on factors influencing stock prices for firms listed at Nairobi
Securities Exchange after initial public offerings in Kenya, exploration data analysis was
carried out through the use of graphical methods primarily to examine the applicability of
panel data models or pooled regression analysis. Results of the study were summarized as
shown in the Figures below.

29
FIGURE 4.1
Growth Pattern for each Firm Share Price
020
40
60
020
40
60
020
40
60
2008 2010 2012 2014 20162008 2010 2012 2014 2016
2008 2010 2012 2014 2016
Access Kenya Coop Bank Eveready
Ken Gen Kenya Re Safaricom
Scan GroupMark
et Price P
er Share
YearGraphs by Firm Name
4.2 .1 Access Kenya
Figure below shows that the market price per share in the first year was high and
thereafter started a declining trend and followed by future stagnant growth.
4.2 .2 Co-operative Bank
Figure below shows that the market price per share for Co-operative Bank had an
increasing trend on share price in the period under investigation.
30
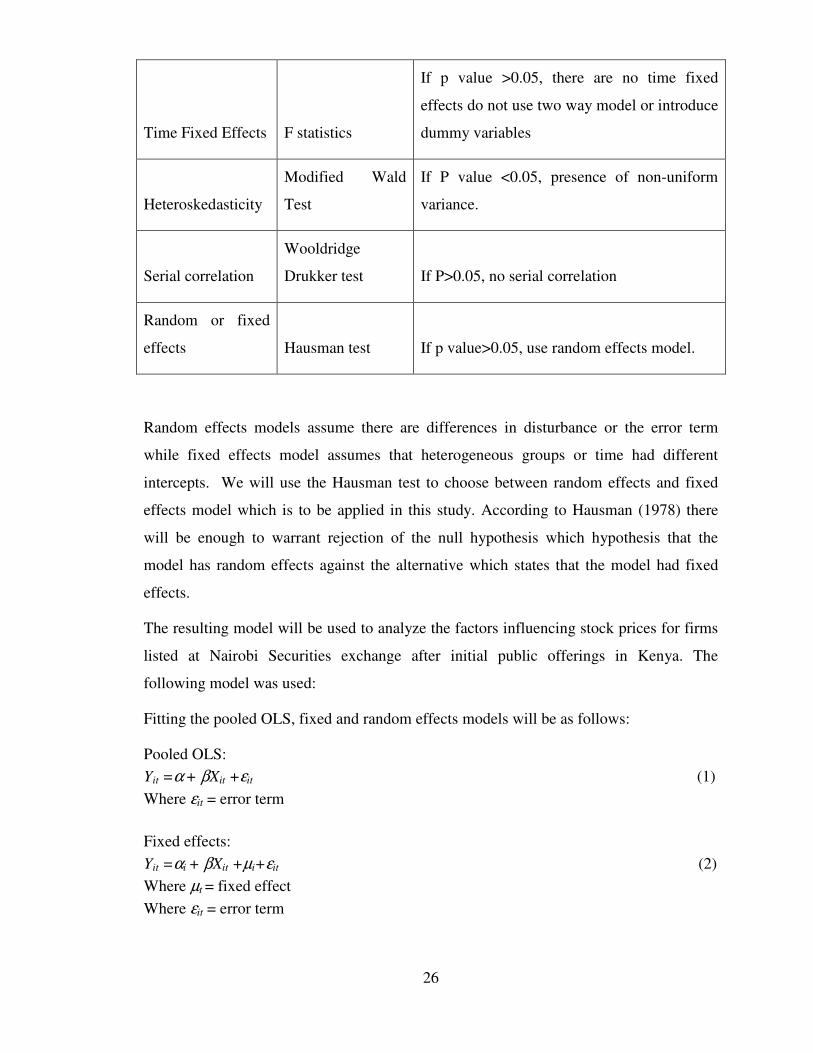
4.2 .3 Eveready
Figure below shows that the market price per share for Eveready had an increasing trend
but on 4th
year there was a sharp decreasing trend but thereafter the price increased which
later flattened at a low price.
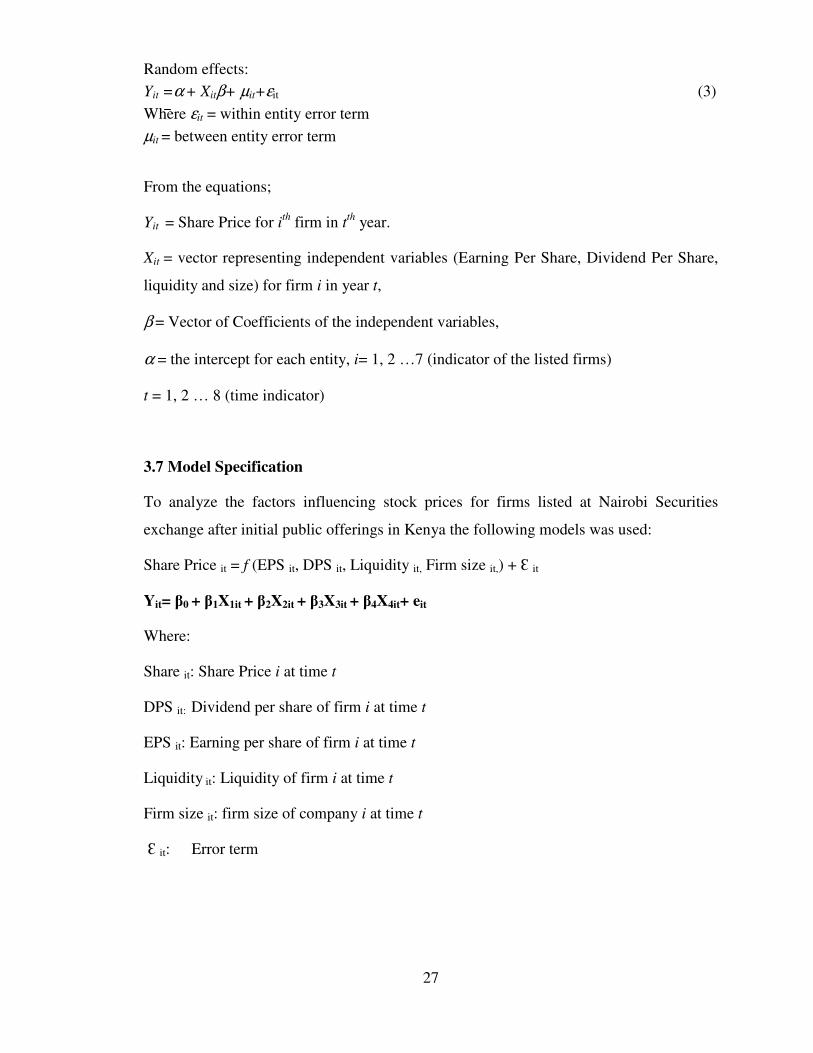
4.2 .4 Ken Gen
Kengen had periodic fluctuations of increase and decrease through the period of study
though the first year the price was high followed by decline.
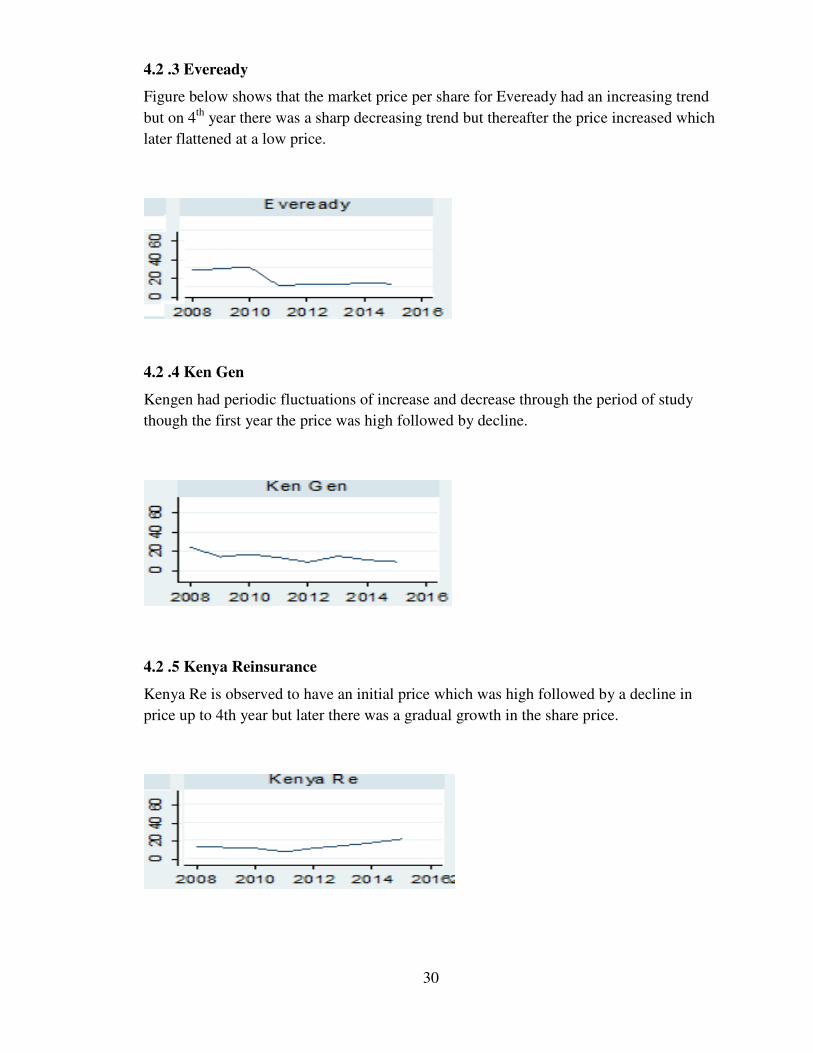
4.2 .5 Kenya Reinsurance
Kenya Re is observed to have an initial price which was high followed by a decline in
price up to 4th year but later there was a gradual growth in the share price.
31
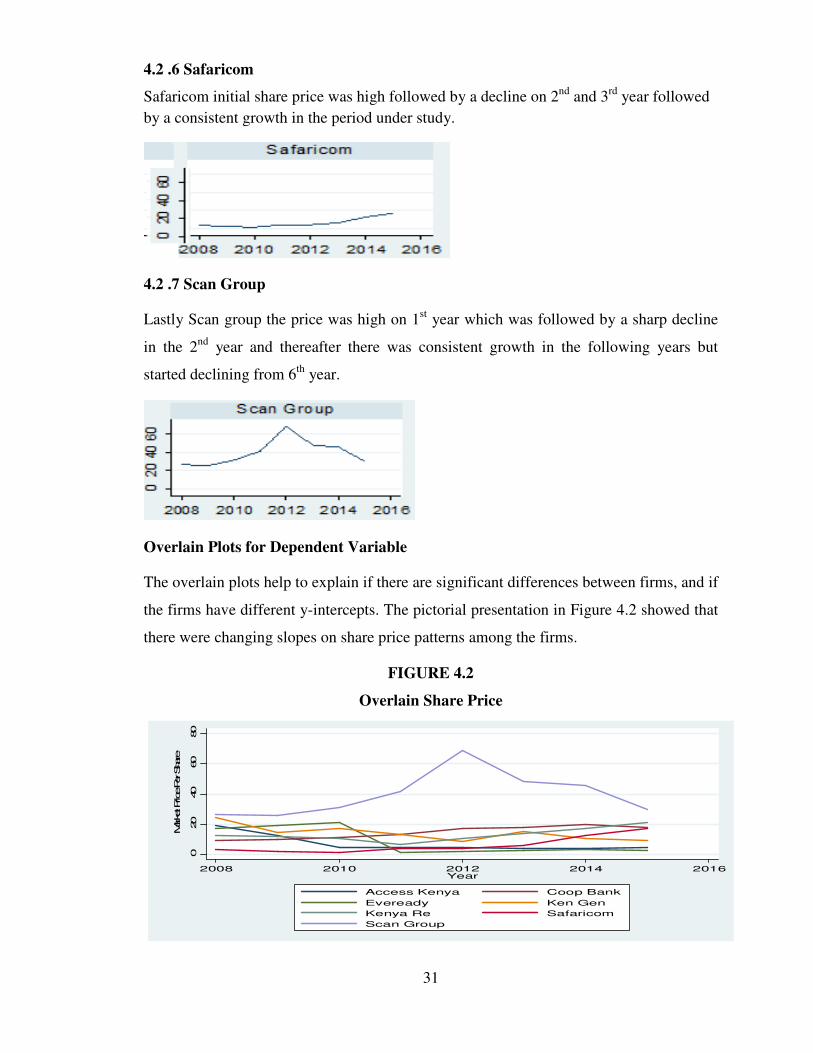
4.2 .6 Safaricom
Safaricom initial share price was high followed by a decline on 2nd
and 3rd
year followed
by a consistent growth in the period under study.
4.2 .7 Scan Group
Lastly Scan group the price was high on 1st year which was followed by a sharp decline
in the 2nd
year and thereafter there was consistent growth in the following years but
started declining from 6th
year.
Overlain Plots for Dependent Variable
The overlain plots help to explain if there are significant differences between firms, and if
the firms have different y-intercepts. The pictorial presentation in Figure 4.2 showed that
there were changing slopes on share price patterns among the firms.
FIGURE 4.2
Overlain Share Price
020
40
60
80
Market Price Per Share
2008 2010 2012 2014 2016Year
Access Kenya Coop Bank
Eveready Ken Gen
Kenya Re Safaricom
Scan Group
32
4.3 Diagnostic Tests
Upon undertaking the exploratory analysis, we carry out a panel data diagnostic tests.
This is to help us examine whether the error terms were serially correlated, choose
between pooled, random and pooled effects model. It will also help determine if the
variables are biased.
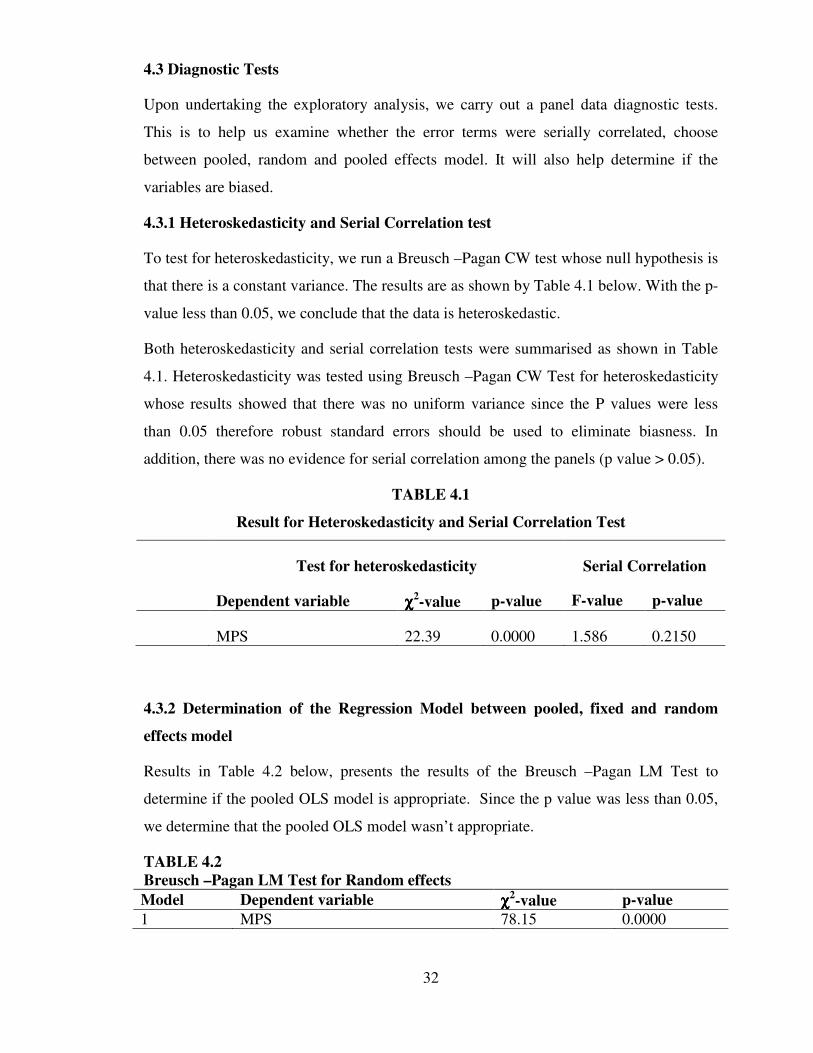
4.3.1 Heteroskedasticity and Serial Correlation test
To test for heteroskedasticity, we run a Breusch –Pagan CW test whose null hypothesis is
that there is a constant variance. The results are as shown by Table 4.1 below. With the p-
value less than 0.05, we conclude that the data is heteroskedastic.
Both heteroskedasticity and serial correlation tests were summarised as shown in Table
4.1. Heteroskedasticity was tested using Breusch –Pagan CW Test for heteroskedasticity
whose results showed that there was no uniform variance since the P values were less
than 0.05 therefore robust standard errors should be used to eliminate biasness. In
addition, there was no evidence for serial correlation among the panels (p value > 0.05).
TABLE 4.1
Result for Heteroskedasticity and Serial Correlation Test
Test for heteroskedasticity Serial Correlation
Dependent variable χχχχ2-value p-value F-value p-value
MPS 22.39 0.0000 1.586 0.2150
4.3.2 Determination of the Regression Model between pooled, fixed and random
effects model
Results in Table 4.2 below, presents the results of the Breusch –Pagan LM Test to
determine if the pooled OLS model is appropriate. Since the p value was less than 0.05,
we determine that the pooled OLS model wasn’t appropriate.
TABLE 4.2
Breusch –Pagan LM Test for Random effects
Model Dependent variable χχχχ2-value p-value
1 MPS 78.15 0.0000
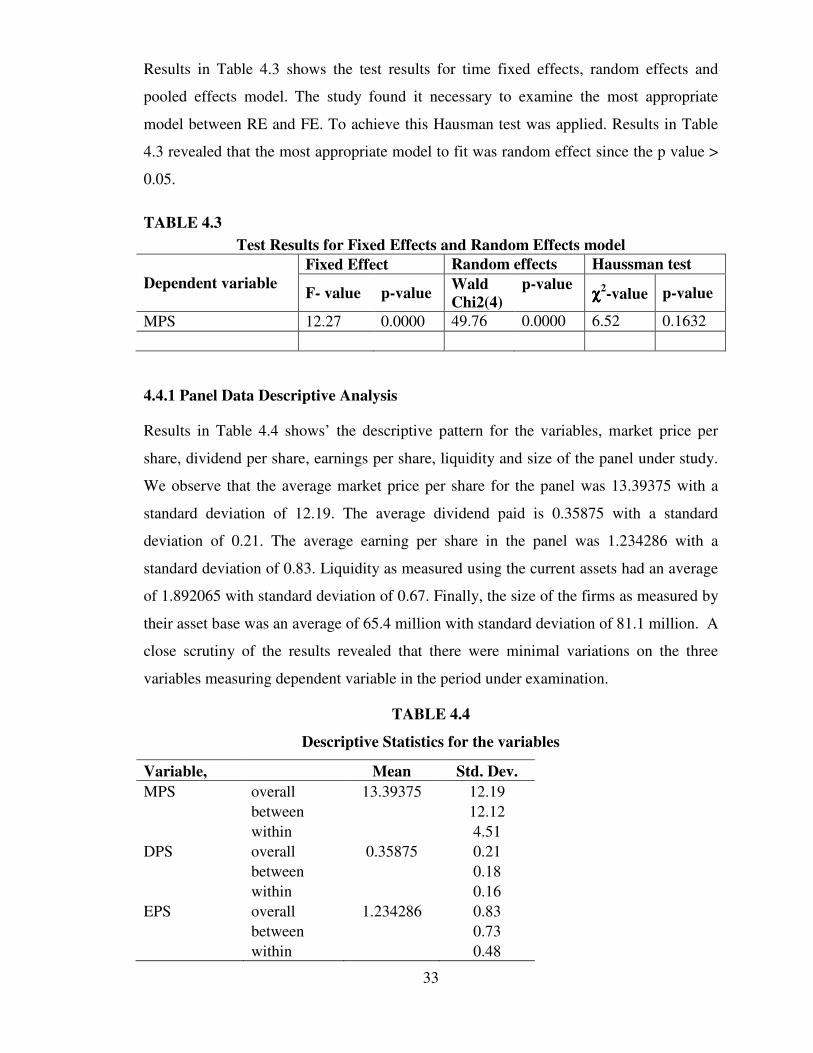
33
Results in Table 4.3 shows the test results for time fixed effects, random effects and
pooled effects model. The study found it necessary to examine the most appropriate
model between RE and FE. To achieve this Hausman test was applied. Results in Table
4.3 revealed that the most appropriate model to fit was random effect since the p value >
0.05.
TABLE 4.3
Test Results for Fixed Effects and Random Effects model
Dependent variable
Fixed Effect Random effects Haussman test
F- value p-value Wald
Chi2(4)
p-value χχχχ2
-value p-value
MPS 12.27 0.0000 49.76 0.0000 6.52 0.1632
4.4.1 Panel Data Descriptive Analysis
Results in Table 4.4 shows’ the descriptive pattern for the variables, market price per
share, dividend per share, earnings per share, liquidity and size of the panel under study.
We observe that the average market price per share for the panel was 13.39375 with a
standard deviation of 12.19. The average dividend paid is 0.35875 with a standard
deviation of 0.21. The average earning per share in the panel was 1.234286 with a
standard deviation of 0.83. Liquidity as measured using the current assets had an average
of 1.892065 with standard deviation of 0.67. Finally, the size of the firms as measured by
their asset base was an average of 65.4 million with standard deviation of 81.1 million. A
close scrutiny of the results revealed that there were minimal variations on the three
variables measuring dependent variable in the period under examination.
TABLE 4.4
Descriptive Statistics for the variables
Variable, Mean Std. Dev.
MPS overall 13.39375 12.19
between 12.12
within 4.51
DPS overall 0.35875 0.21
between 0.18
within 0.16
EPS overall 1.234286 0.83
between 0.73
within 0.48
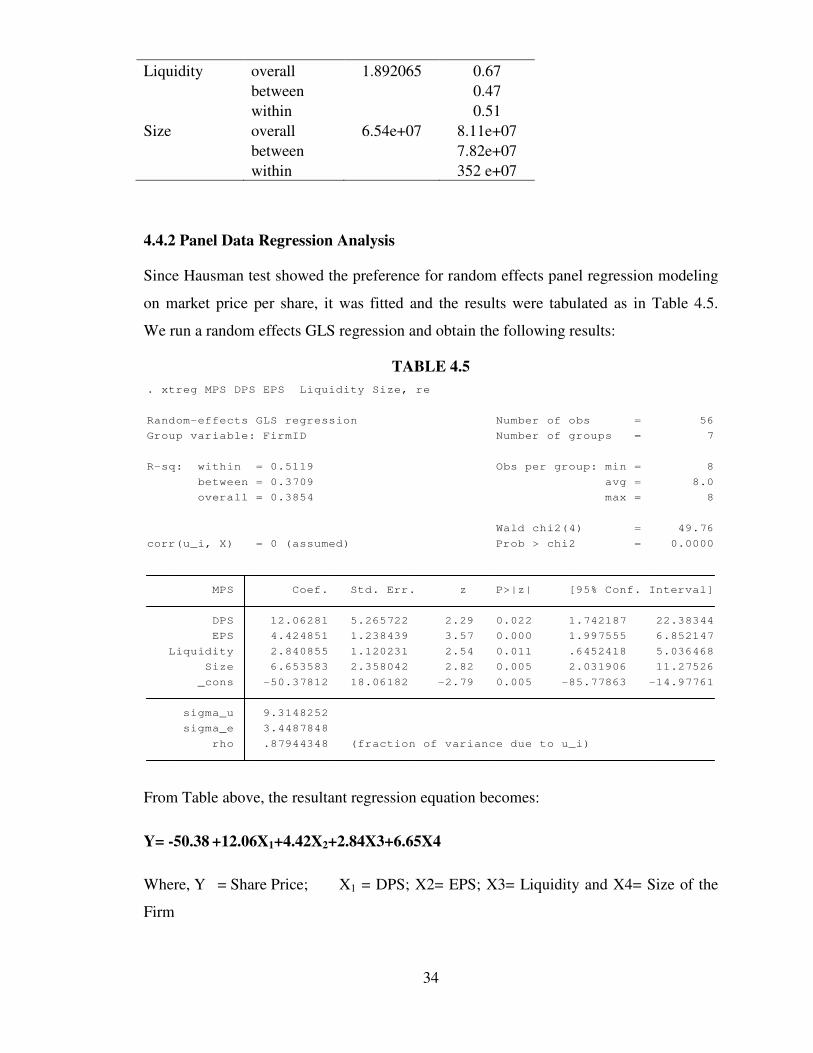
34
Liquidity overall 1.892065 0.67
between 0.47
within 0.51
Size overall 6.54e+07 8.11e+07
between 7.82e+07
within 352 e+07
4.4.2 Panel Data Regression Analysis
Since Hausman test showed the preference for random effects panel regression modeling
on market price per share, it was fitted and the results were tabulated as in Table 4.5.
We run a random effects GLS regression and obtain the following results:
TABLE 4.5
rho .87944348 (fraction of variance due to u_i)
sigma_e 3.4487848
sigma_u 9.3148252
_cons -50.37812 18.06182 -2.79 0.005 -85.77863 -14.97761
Size 6.653583 2.358042 2.82 0.005 2.031906 11.27526
Liquidity 2.840855 1.120231 2.54 0.011 .6452418 5.036468
EPS 4.424851 1.238439 3.57 0.000 1.997555 6.852147
DPS 12.06281 5.265722 2.29 0.022 1.742187 22.38344
MPS Coef. Std. Err. z P>|z| [95% Conf. Interval]
corr(u_i, X) = 0 (assumed) Prob > chi2 = 0.0000
Wald chi2(4) = 49.76
overall = 0.3854 max = 8
between = 0.3709 avg = 8.0
R-sq: within = 0.5119 Obs per group: min = 8
Group variable: FirmID Number of groups = 7
Random-effects GLS regression Number of obs = 56
. xtreg MPS DPS EPS Liquidity Size, re
From Table above, the resultant regression equation becomes:
Y= -50.38 +12.06X1+4.42X2+2.84X3+6.65X4
Where, Y = Share Price; X1 = DPS; X2= EPS; X3= Liquidity and X4= Size of the
Firm

35
The mode goodness of fit was tested using the coefficient of determination which showed
that 38.54% variation on market price per share (MPS) was explained by DPS, EPS,
Liquidity and size when combined. All the independent variables had a significant joint
effect since the Wald Chi2 (4) statistics was 49.76 and p value <0.05. Effects
specification statistics revealed that there was a strong relationship in the cross sectional
error term (Rho = 0.8794) and there was minimal deviation across the error term as
indicated by standard deviation of 3.4488.
From the findings, when all the variables are held constant, the share prices would be at
-50.38.
Also the results showed that there was a positive and significant relationship between
DPS and MPS. This implies that, holding other factors constant, a unit increase in DPS
increased the MPS by 12.06
It can be also deduced that earnings per share of a company is significant since its p-value
<0.05. We observe that a unit increase in earnings per share will increase the market price
per share by 4.42 while holding other factors constant.
We also observe a positive and significant relationship between market price per share
and the liquidity of the firms. A unit increase in liquidity results in 2.84 increases in
market price while holding other factors constant. This can be attributed to the ability of
the firm to pay dividends as well as other liabilities as and when they fall due.
Finally, we observe a positive and significant relationship between market price per share
and firm size. This implies that a unit increase in a firm size would result in an increase in
the share price by 6.65 while holding other factors constant.
36
CHAPTER FIVE
DISCUSSION, CONCLUSIONS AND RECOMMENDATIONS
5.1 Introduction
This chapter presents a summary of the research findings. There is also the conclusion of
the study based on the main findings. The chapter also presents the recommendations of
the study that are relevant to policy makers, theory and practice. There are also the
recommendations for further studies that open room for future scholars and academicians
in their quest of adding more knowledge to the existing one.
5.2 Summary of the Findings and Discussion
The study objective was to determine the factors influencing stock market prices of
companies listed at NSE after IPO’s in Kenya. To achieve this, the study aimed at
responding to the study questions: What is the effect of EPS on stock market prices of
companies listed at NSE after IPO’s in Kenya? How does Dividend Policy of the firm
influence stock market prices of companies listed at NSE after IPO’s in Kenya? How
does Liquidity of a firm influence stock market prices of companies listed at NSE after
IPO’s in Kenya? What is the Size of a firm on stock market prices of companies listed at
NSE after IPO’s in Kenya?
The study collected secondary data relating to the company namely MPS, EPS, and DPS,
Current assets, current liabilities and total assets. This set of data was acquired from
published annual reports and financial statements of the seven companies for eight years
of trading after IPO, industry analysis, websites, and internet. Random effects were used
to test the study hypothesis. Market price per share was the dependent variable while
dividend per share, earnings per share, liquidity and Firm size were the dependent
variables. Natural logarithm to base ten was used to transform the firm size data
variables.
5.2.1 Dividend per share and share price
The results of the study revealed that there was a positive relationship between dividend
per share and share price. The findings agree with Hulori (2013) who found a positive
significant relationship between dividend per share and share price. These results were
also in agreement with Mensa and Talisis (2012) who found a positive relationship

37
between dividend per share and share price. Moreover, the results have contrasted the
findings by Geati (2014) who found a negative and insignificant relationship between
dividend per share and share price. It can be implied that the listed manufacturing firms
share price are affected by the dividend per share. There is therefore need for the firms
listed in Nairobi securities exchange to highly consider their dividend policy as it affects
the shareholders’ wealth.
5.2.2 Earnings per share and share price
There was a positive relationship between earnings per share and the firms share price.
These findings were in agreement with Hastings (2008) who argued that a firms’
profitability as measured by earnings per share influence share positively. From the
findings it can be implied that companies’ financial performance in terms of profitability
improves the shareholders’ wealth in the stock market.
The firm’s investment in long term projects that assures increased profitability of the firm
should therefore be evaluated to ensure that there are positive net present value and thus
profitability which will thence lead to better market prices.
5.2.3 Liquidity and share price
There was a positive relationship between the firm share price and liquidity of the firms.
These findings were in agreement with Maina and Kiniti (2013) who found a positive
relationship between liquidity and share price among the companies which were listed in
NSE. In addition, there were in agreement with Azeez and Latifat (2013) and Ajanthjan
(2013) who found that the current ratio had a positive and significant relationship with
listed company’s performance. However, the findings contrasted Sharma and Panigrahi
(2013) who found an inverse significant relationship between working capital and firm
performance. It also contrasted the recommendations of Azam and Haider (2011) who
recommended that the management ought to devise measures to reduce the cash
conversion cycle and consequently increase the shareholders’ value. All listed companies
should examine their working capital and look for means to make it more efficient as
such to increase the benefits associated with it in relation to firm performance. There is
need to hasten the debtor repayment period and improve inventory management
strategies and evaluate on the ways of benefiting from extended credit period.
38
There is need to evaluate the liquidity ratios of the firms as well as the composition of the
current assets and current liabilities.
5.2.4 Firm size and share price
Finally, we observe a positive relationship between firms share price and the firm size.
This agrees with Heshmati and Loof (2008) who argued that asset acquisition influence
share price positively though it can minimize the annual profit levels in a company due to
increase in annual expenses which are related to the specific investment. From the
findings it can be implied there are benefits on share price upon firm size though these
benefits are not fully beneficial to the shareholders since short term profitability may be
negatively impacted.
The amount of capital expenditure per annum should be evaluated to ensure that there are
maximum benefits and only those projects which are having positive net present value
are invested in. More so the management should examine the investment policy to
ensure that there are profitable to operate and the maintenance costs are within the set
levels.
5.3 Conclusion of the Study
The study finding concludes and recommends that upon listing of firms on the NSE they
should evaluate their dividend policy. The dividend policy adopted by listed companies
should be tailored to meet the unique needs of all investors within an organization to
maximize investors’ confidence. There is need to sensitize investors on how they can
benefit through the various dividend payment patterns.
Second, there is need to increase the firms size in capital expenditure per annum so as to
assure long term profitability. Although, asset base increased firm’s profitability there is
need for listed firms to evaluate all projects independently and eliminate those projects
whose maintenance costs is so high.
Thirdly, the firms should evaluate the liquidity management decision so as to adopt the
optimal working capital cycle. This may include increase in the creditor’s period and
decrease in the debtors and inventory turnover periods. The management should develop
strategies on liquidity management that’s specific to the investor’s preference.

39
5.4 Recommendations for Further Studies
The current study focused on the establishing the factors that affect share prices after
IPO, the study used secondary data that was gathered from financial reports and annual
reports, future studies should use both primary and secondary data. The current study
only covered four factors (EPS, DPS, Liquidity and Size) and the analysis was done using
STATA statistical packages; therefore, future studies should be carried to cover these
other variables that may have significant effect on share prices after IPO for example the
macro economic variables like interest rate.
5.5 Limitation of the Study
The study used secondary data as the preferred source of study data. Therefore, the
amount of research data collected will be dependent on the extent of data availability in
regards to the initial public offers as carried out by the targeted companies.
The study only sought to determine the factors that influence stock market prices of
companies listed in NSE after IPO’s in Kenya in the short run i.e. the first 8 years of
trading. The findings therefore ought not to be generalized to imply the same results over
the long run.

40
REFERENCES
Aamir, M., Nasir, A., Khan, K., & Qayyum, M. (2011). Can Dividend Decisions Affect
the Stock Prices: A Case of Dividend Paying Companies of KSE, Euro
Journals Publishing, Inc., International Research Journal of Finance and
Economics 76(1).
Abraham R. & Harrington C. (2011). Seasoned Equity Offerings: Characteristics of
Firms. International Journal of Business, Humanities and Technology 1(3).
Baker, H. K., & Haslem, J. A. (2015). Information needs of individual investors.
Aduda J. Odera & Onwonga M. (2012), ‘The Behaviours & Financial Performance of
Individual Investors in the Trading of Shares of Companies listed at the NSE
Kenya’. Journal of Finance & Investment Analysis, j (3), 33-60
Ahmed, H., & Javid, A. (2009). Dynamics and Determinants of Dividend Policy in
Pakistan: Evidence from Karachi Stock Exchange Non-Financial Firms.
International Journal of Finance and Economics 2, 148-171.
Ajanthan, A. (2013). The Relationship Between Dividend Payout and Firm
Profitability: A Study of Listed Hotels and Restaurant Companies in Sri
Lanka. International Journal of Scientific and Research Publications, 3(5), 1-
6.
Akbar, M., & Baig, H. (2010). Reaction of Stock Prices to Dividend announcements
and Market Efficiency in Pakistan. The Lahore Journal of Economics, 15 (1),
103 - 125.
Kalama, D. J. (2013). The relationship between earnings and share prices of firms
listed at the Nairobi Securities Exchange (Doctoral dissertation, University of
Nairobi).
Christiano, L., Ilut, C. L., Motto, R., & Rostagno, M. (2010). Monetary policy and stock
market booms (No. w16402). National Bureau of Economic Research.
Schnabl, P. (2012). The international transmission of bank liquidity shocks: Evidence
from an emerging market. The Journal of Finance, 67(3), 897-932.
Fama, E. F., & French, K. R. (2012). Size, value, and momentum in international stock
returns. Journal of financial economics, 105(3), 457-472.
Masum, A. A. (2014). Dividend policy and its impact on stock price–A study on
commercial banks listed in Dhaka stock exchange.
Bailey, S., A. (2005). Investigating the Link Between Financial Dollarization and
Inflation: Evidence from Jamaica. Working Paper, Bank of Jamaica.
Beatty., R. & J. Ritter, (2014). Investment Banking, Reputation, and the Under pricing
of Initial Public Offerings. Journal of Financial Economics 15, 1986, 213-
232.
Bruce, A. A. (2014). IPO Stocks Performance Imperfection: A Review of Models and
Empirical Works. American Journal of Industrial and Business
Management, 2014.

41
Chibeka, D. O. (2014). The effect of initial public offering pricing on the long run stock
returns of companies listed at the Nairobi Securities Exchange (Doctoral
dissertation, University of Nairobi).
CMA. (2015). Capital Market Master Plan (the “Master Plan”) 2014-2023.
Faruque, M., U. (2011). An Empirical Investigation of the Arbitrage Pricing Theory in a
Frontier Stock Market: Evidence from Bangladesh.
Gitere, P., M. (2014). The Relationship Between Dividend Pay-out Ratio and Value of
Shares of Firms Listed at The Nairobi Securities Exchange (Doctoral
dissertation, University of Nairobi).
Jecheche, P. (2012). An Empirical Investigation of Arbitrage Pricing Theory: A case
Zimbabwe. Research in Business and Economics Journal, 6, 1.
Karethio, E. N. (2013). The effect of Dividend Payout Ratio on Financial Performance
of Companies Listed at the Nairobi Securities Exchange (Doctoral
Dissertation, University of Nairobi).
Kiluku, L. M. (2014). The Relationship Between Initial Public Offer Price and the Post
Listing Market Price at the Nairobi Securities Exchange for Listed State
Owned Enterprises (Doctoral Dissertation, University of Nairobi).
Kipngetich, T. J., Kibet, B. J., Guyo, S. A., & Kipkoskey, B. J. (2011). Determinants of
Initial Public Offer Pricing in Kenya. The Centre for Innovations in Business
and Management Practice.
Loderer, C. F., & Waelchli, U. (2010). Firm Age and Performance. Available at SSRN
1342248.
Mahmood, f., Xia, X., M., Usman & Shahid h. (2011). How Asian and Global
Economic crises prevail in Chinese IPO and Stock Market Efficiency.
International Business Research, 4(2), pp. 226-238
Masum, A. A. (2014). Dividend policy and its impact on stock price–A study on
commercial banks listed in Dhaka stock exchange.
.Mugenda, O., & Mugenda, A. (2003). Research Methods: Quantitative and Qualitative
methods. Nairobi, Rev editions.
Muli, B. M. (2014). The Effect of Initial Public Offering on Long Run Stock Price
Performance of Companies Listed at the Nairobi securities
Exchange (Doctoral Dissertation, University of Nairobi).
Murekefu, M., T., & Ouma, P., O. (2012). The Relationship Between Dividend Payout
and Firm Performance. European Scientific Journal, 8 (9), 199-215.
Murugesu, T. (2013). Impact of Earning Per Share (EPS) On Share Price (Listed
Manufacturing Companies in Sri Lanka).
Musyoki, D. (2012). Changes in Share Prices as a Predictor of Accounting Earnings for
Financial Firms Listed in Nairobi Securities Exchange. International Journal
of Business and Public Management, 2(2), 1-11.
Mutai, B., (2014). The Relationship that Exists Between Stock Prices at the Nairobi
Securities Exchange and Various Kenya's Macroeconomic Variables.
Unpublished Master’s Thesis, University of Nairobi.

42
Mutisya, B., M. (2014). The Relationship Between Dividend Payout and Financial
Performance of Firms Listed at the Nairobi Securities Exchange (Doctoral
Dissertation, University of Nairobi).
Mutwiri, W., T. (2014). The Effect of Dividend Payout Ratio on Share Prices of Non-
Financial Firms Quoted on the Nairobi Securities Exchange (Doctoral
Dissertation, University of Nairobi).
Nazir, M., S., Nawaz, M., M., Anwar, W., & Ahmed, F. (2010). Determinants of Stock
Price Volatility in Karachi Stock Exchange: The Mediating Role of Corporate
Dividend Policy.
Ndiege, C., O. (2012). Factors Influencing Investment Decision in Equity Stocks at the
Nairobi Securities Exchange Among Teachers in Kisumu Municipality,
Kenya (Doctoral Dissertation).
Neneh, B. N., & Vanzyl, J. (2014). Growth Intention and its Impact on Business
Growth Amongst SMEs in South Africa. Mediterranean Journal of Social
Sciences, 5(20), 172.
Ng’ang’a, K. (2014). The Relationship Between Dividends and Firm’s Performance: A
Case Study of Listed Firms in the Nairobi Securities Exchange for the Period
2006-2012 (Doctoral dissertation, United States International University-
Africa).
NSE (2015). Annual Reports (various issues). Website & Handbooks.
Odongo, A. O. (2012). Mispricing and Long Run Performance of IPOs at the Nairobi
Securities Exchange (NSE) (Doctoral Dissertation, University of Nairobi).
Olweny, T. (2012). Dividend Announcement and Firm Value: A Test of Semi Strong
Form of Efficiency at the Nairobi Stock Exchange. Asian Social
Science, 8(1), 161.
Olweny, T., O., & Kimani, D. (2011). Stock Market Performance and Economic
Growth: Empirical Evidence from Kenya Using Causality Test
Approach. Advances in Management & Applied Economics, 1(3), 153-196.
Onagoruwa, O. (2006). Analysis Propose Antidotes to Down Trend in the Market.
Stock Watch, 1(4):.3-8.
Rahman, M., L., & Uddin, J. (2009). Dynamic Relationship Between Stock Prices and
Exchange Rates: Evidence from Three South Asian Countries. International
Business Research, 2(2), 167.
Ratib, M., R. (2014). Effects of Bonus Share Issues on Stock Returns of Firms Listed at
the Nairobi Securities Exchange. Unpublished Master’s Thesis, University of
Nairobi.
Rock, K. (2005). Why New Issues Are Underpriced, Journal of Financial Economics
15, 1986, 87-212.
Sahoo, S., & Rajib, P. (2010). After Market Pricing Performance of Initial Public
Offerings (IPOs): Indian IPO Market 2002–2006. Vikalpa, 35(4), 27-44.
Scholtens, B., & Wensveen, V., D. (2003). The Theory of Financial Intermediation: An
Essay on What It Does (not) Explain. Chapters in SUERF Studies, 7-53.

43
Tsangarakis, N.V. (2004). The Price Performance of IPO in Greece. Managerial
Finance,30(10), 26-44
Vincent O., Ongore & G., B., Kusa (2013). Determinant of Financial Performance of
Commercial Banks in Kenya, 3(1), 237-252
Wahome., M. (2008), Eveready: The Sickman of Kenya, In the Weekly Business
Magazine.
Wairia, K.D. (2010). Long-run performance of IPO: Evidence from NSE, unpublished
MBA project. University of Nairobi
Waweru, J., M. (2010). Reaction of Share Prices to Issue of IPOs from the NSE:
Empirical Evidence. Unpublished MBA Project, University of Nairobi.
Waweru, N., N. (2013). Analysis of the determinants of stock price volatility at Nairobi
Securities Exchange (Doctoral dissertation, University of Nairobi).
Welch, I. (2012). Seasoned Offerings, Imitation Costs, and the Underpricing of Initial
Public Offerings. Journal of Finance, 44 (1989), 421-449.

44
APPENDICES
Appendix I: Initial Public Offers Kenya (IPOs) 2006-2015
Company Shares on
Issues
Type
of
Issue
Year of
Issue
Issue
Price
Sum
Raised
Subscription
Level
Ord. Shares Year/
Month
Kshs. Kshs. %
Kengen 658,900,000 IPO 2006
April
11.90 7,840,910,0
00
333%
Scangroup 69,000,000 IPO 2006
June
10.45 721,050,00
0
620%
Eveready 63,000,000 IPO 2006
Aug
9.50 598,500,00
0
830%
Access
Kenya
80,000,000 IPO 2007
Mar
10.00 800,000,00
0
363%
Kenya Re 240,000,000 IPO 2007
July
9.50 2,280,000,0
00
334%
Safaricom 10,000,000,00
0
IPO 2008
June
5.00 50,000,000,
000
532%
Co-op
Bank
701,000,000 IPO 2008
Oct
9.50 5,400,000,0
00
81%
British-
American
660,000,000 IPO 2011
Sept
9.00 3,515,103,0
00
60%
NSE 66,000,000 IPO 2014
July
9.50 763.9%

45
Appendix II: Work Plan
No. Item Month
JAN -
JUN
JULY AUG SEPT OCT
1 Proposal writing
2 Presentation of proposal
to the board of
examiners
3 Carrying out field
survey
4 Data processing and
analysis
5 Project write-up
6 Project defense
7 Submission of the
project for examination

46
Appendix III: Budget
NO. DESCRIPTION AMOUNT
(Kshs)
1. Proposal writing @ 20/= per page 5,000.00
2. Stationery e.g. paper, pens and staples 3,000.00
3. Data collection (preparation of questionnaire etc) 8,000.00
4. Travels 7,000.00
5. Data analysis 3,500.00
6. Preparation of final report and binding (about 5 copies) 6,000.00
7. Contingencies 3,000.00
TOTAL
35,500.00

47
Appendix IV: Data for the Study
Firm FirmID Year Asset Base Size CA CL Liquidity EPS DPS MPS
Access Kenya 1 2008 2318717 6.365 599,117 547,410 1.0945 0.72 0.3 5.23
Access Kenya 1 2009 2728978 6.436 1,113,827 791,788 1.4067 0.6 0.2 5.1
Access Kenya 1 2010 2415111 6.383 658,142 482,981 1.3627 0.5 0.2 4.93
Access Kenya 1 2011 2265714 6.355 549,671 293,924 1.8701 0.69 0.3 4.41
Access Kenya 1 2012 2265714 6.355 549,671 293,924 1.8701 0.69 0.3 4.41
Access Kenya 1 2013 3542754 6.549 617,632 331,165 1.8650 0.45 0.2 4.01
Access Kenya 1 2014 4134251 6.616 632,154 391,234 1.6158 0.42 0.2 3.79
Access Kenya 1 2015 5321421 6.726 640,012 416,432 1.5369 0.53 0.3 4.49
Coop Bank 2 2008 83486000 7.922 7,053,400 1,648,000 4.2800 0.8 0.1 9.1
Coop Bank 2 2009 110700000 8.044 9,502,200 2,420,000 3.9265 0.85 0.2 10.3
Coop Bank 2 2010 154300000 8.188 13,440,000 5,611,000 2.3953 1.31 0.4 11.3
Coop Bank 2 2011 168300000 8.226 14,740,000 5,714,000 2.5796 1.53 0.4 13.3
Coop Bank 2 2012 200600000 8.302 17,120,000 6,171,013 2.7743 1.84 0.5 17.5
Coop Bank 2 2013 231200000 8.364 194,600,000 131,200,000 1.4832 2.2 0.5 17.8
Coop Bank 2 2014 285396067 8.4554 242,518,948 185,396,061 1.3081 2.69 0.50 20.00
Coop Bank 2 2015 342500000 8.535 293,200,000 142,500,000 2.0575 2.31 0.5 18
Eveready 3 2008 837329 5.923 638,114 384,139 1.6612 1.01 0.1 1.73
Eveready 3 2009 997672 5.999 795,254 528,176 1.5057 1.31 0.1 1.93
Eveready 3 2010 958487 5.982 943,397 668,833 1.4105 0.87 0.1 1.82
Eveready 3 2011 10116908 7.005 733,708 658,427 1.1143 0 0 1.6
Eveready 3 2012 1150729 6.061 876,043 695,764 1.2591 0.43 0 2
Eveready 3 2013 941749 5.974 683,971 444,019 1.5404 0.47 0 2.7
Eveready 3 2014 930057 5.969 763,357 572,293 1.3339 0.51 0 3.65
Eveready 3 2015 1511665 6.179 640,620 651,306 0.9836 0.48 0 3.05
Ken Gen 4 2008 99068607 7.996 10,655,138 7,924,944 1.3445 0.9 0.5 18.5
Ken Gen 4 2009 102736136 8.0117 12,748,759 5,867,743 2.1727 0.94 0.50 14.55
Ken Gen 4 2010 143597071 8.1571 12,849,414 5,969,815 2.1524 1.49 0.50 17.10
Ken Gen 4 2011 149700000 8.175 19,539,034 11,256,593 1.7358 0.85 0.5 13.6
Ken Gen 4 2012 148100000 8.171 22,288,066 15,000,957 1.4858 0.28 0.5 12.6
Ken Gen 4 2013 171000000 8.233 25,127,810 17,672,629 1.4218 2.39 0.5 15.2
Ken Gen 4 2014 225000000 8.352 27,630,643 25,196,229 1.0966 1.29 0.5 10.9
Ken Gen 4 2015 117784821 8.0711 21,368,973 22,473,517 1.0517 1.24 0.50 9.25
Kenya Re 5 2008 13665599 7.136 22,436,120 8,003,887 2.8032 1.47 0.5 12.8
Kenya Re 5 2009 15000633 7.176 32,341,220 9,099,925 3.5540 1.21 0.5 11.7
Kenya Re 5 2010 17240929 7.237 23,242,340 10,573,502 2.1982 1.17 0.5 11.1
Kenya Re 5 2011 19046441 7.28 24,320,910 11,526,485 2.1100 1.19 0.4 10
Kenya Re 5 2012 23173248 7.3650 20,732,580 9,208,421 2.2515 2.00 0.50 10.85
Kenya Re 5 2013 27628311 7.4414 20,283,110 10,634,683 1.9073 2.19 0.50 13.80
Kenya Re 5 2014 32174251 7.5075 20,744,510 12,182,847 1.7028 2.48 0.70 17.20
Kenya Re 5 2015 35572195 7.5511 222,722,950 137,596,961 1.6187 2.91 0.75 21.00
Safaricom 6 2008 49122593 7.6913 25,243,720 12,887,438 1.9588 0.35 0.05 3.60
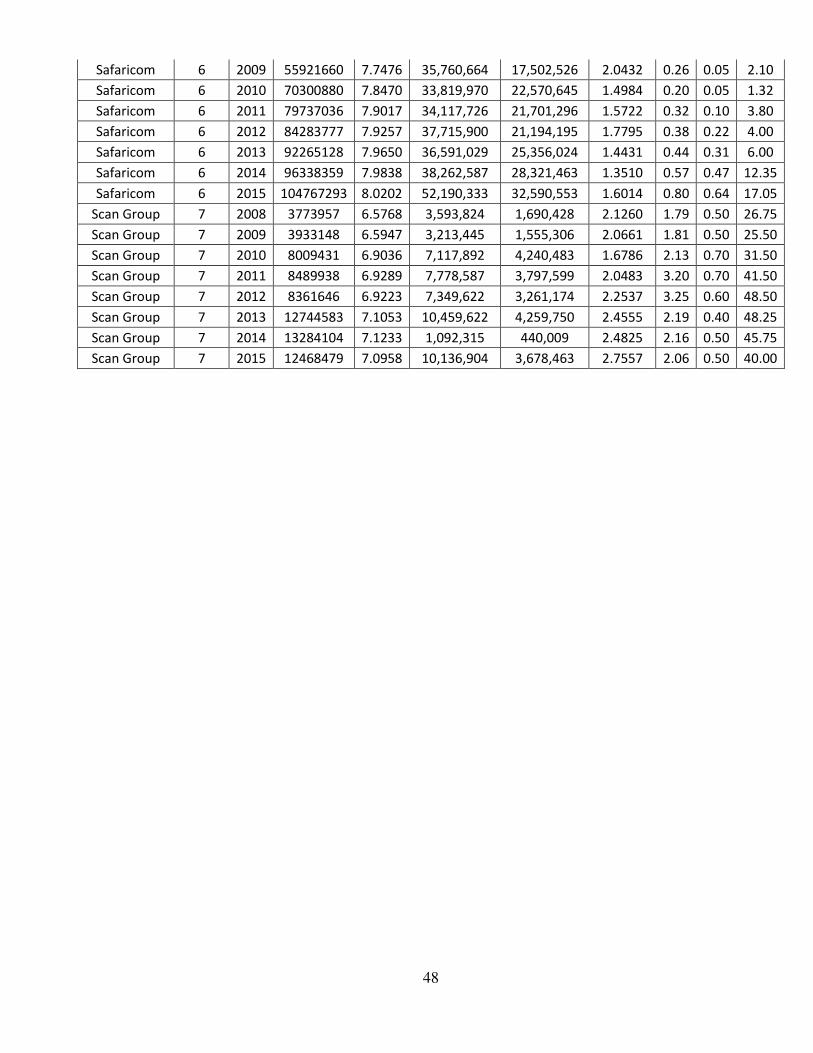
48
Safaricom 6 2009 55921660 7.7476 35,760,664 17,502,526 2.0432 0.26 0.05 2.10
Safaricom 6 2010 70300880 7.8470 33,819,970 22,570,645 1.4984 0.20 0.05 1.32
Safaricom 6 2011 79737036 7.9017 34,117,726 21,701,296 1.5722 0.32 0.10 3.80
Safaricom 6 2012 84283777 7.9257 37,715,900 21,194,195 1.7795 0.38 0.22 4.00
Safaricom 6 2013 92265128 7.9650 36,591,029 25,356,024 1.4431 0.44 0.31 6.00
Safaricom 6 2014 96338359 7.9838 38,262,587 28,321,463 1.3510 0.57 0.47 12.35
Safaricom 6 2015 104767293 8.0202 52,190,333 32,590,553 1.6014 0.80 0.64 17.05
Scan Group 7 2008 3773957 6.5768 3,593,824 1,690,428 2.1260 1.79 0.50 26.75
Scan Group 7 2009 3933148 6.5947 3,213,445 1,555,306 2.0661 1.81 0.50 25.50
Scan Group 7 2010 8009431 6.9036 7,117,892 4,240,483 1.6786 2.13 0.70 31.50
Scan Group 7 2011 8489938 6.9289 7,778,587 3,797,599 2.0483 3.20 0.70 41.50
Scan Group 7 2012 8361646 6.9223 7,349,622 3,261,174 2.2537 3.25 0.60 48.50
Scan Group 7 2013 12744583 7.1053 10,459,622 4,259,750 2.4555 2.19 0.40 48.25
Scan Group 7 2014 13284104 7.1233 1,092,315 440,009 2.4825 2.16 0.50 45.75
Scan Group 7 2015 12468479 7.0958 10,136,904 3,678,463 2.7557 2.06 0.50 40.00