New Ways of Showing How Good Students and Faculty Use Blackboard
53
New Ways of Showing How Good Students and Faculty Use Blackboard Jeffrey Berman, Drexel Deb Everhart, Blackboard John Fritz, UMBC
Transcript of New Ways of Showing How Good Students and Faculty Use Blackboard

New Ways of Showing How Good Students and Faculty
Use Blackboard Jeffrey Berman, Drexel
Deb Everhart, Blackboard John Fritz, UMBC

Overview
• About UMBC • Problem • Demo • Perspectives to Consider
– Students – Faculty – Bb Admin/developers
• Future Plans • Other Examples & Policy Implications • More Information • Q & A

About UMBC • Founded in 1966 • “Research extensive university” Carnegie classification • Fall 2007 Stats
– 12,041 Students • 9,464 undergrad, 2,577 grad
– 1,319 Faculty • 636 FT, 683 PT
• Selected Brags – One of 50 Best Colleges for Women – 1st in undergrad chemistry degrees
awarded to African Americans – Six-time National College Chess
Champions

About Blackboard @ UMBC • Learning System Version 7.2 • As of Fall 2007
– 11,614 students (96% of all students) – 1,074 Bb course sites (includes multi-section courses) – 808 Instructors (61% of all instructors) – 356 Communities
• Includes all student, faculty and staff senates • Support Staff:
– 2 FTE (Admin & Support) – 1 Server Admin

PROBLEM How do you answer?
“So, is Blackboard making a difference?” Former UMBC Provost Art Johnson in 2002

Current Reporting in Blackboard

What I Want?

Questions
• Functional – What is the relationship between Blackboard use and
teaching and learning? – What tools can we give users to shed light on (and
improve) their own performance within the system?
• Technical – How do we query the system without breaking it? – How do we scale and maintain the process?
• Bb – Core product? • Community – Building Blocks? • Other?

New Tools & Approaches

UMBC Solution: Transparency & Curiosity
• Show faculty what peers are doing through publicly available reports of student use. – Bb Sysadmins shouldn’t have the only “birds eye”
view.
• “Average hits per student” course rankings don’t favor large courses over smaller ones. – Usage alone is no indicator of quality. – But activity by students piques faculty curiosity.
• New user tools build on “activity” as an indicator (not a cause) of student success.

DEMO
Most Active Blackboard Courses Rankings (Publicly Available) Self Service Tool: Check My Activity (UMBC Students Only) Self Service Tool: Grade Distribution Reports (UMBC Faculty Only)

www.umbc.edu/blackboard/reports

Three Types of Usage

Rankings Based on Usage

Course Tool Usage

Rankings by Department
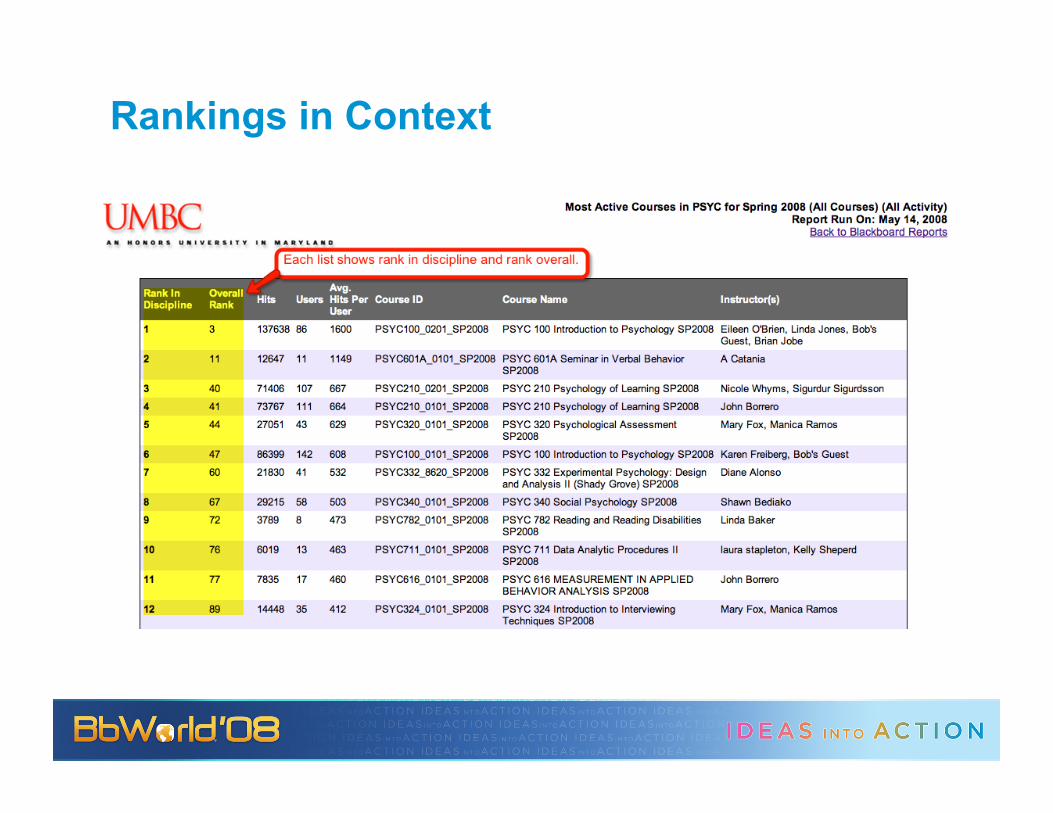
Rankings in Context

How Faculty Can Connect
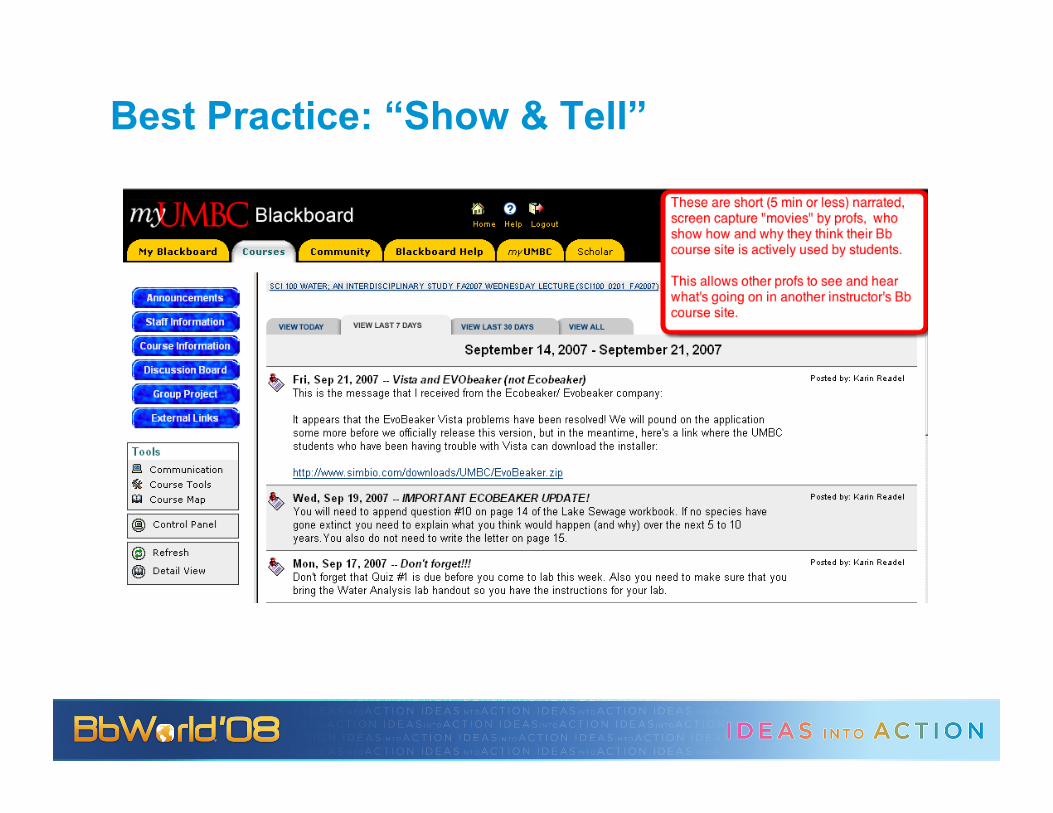
Best Practice: “Show & Tell”

Best Practice: Q&A (iTunesU)

DEMO Self Service Tool: Check My Activity (UMBC Students Only)

All Users Start Outside Bb Using myUMBC

Students See Personal Report of Activity

Students See Their Summary to Date

Comparison with Class Summary to Date

DEMO Self Service Tool: Grade Distribution Reports (UMBC Faculty Only)
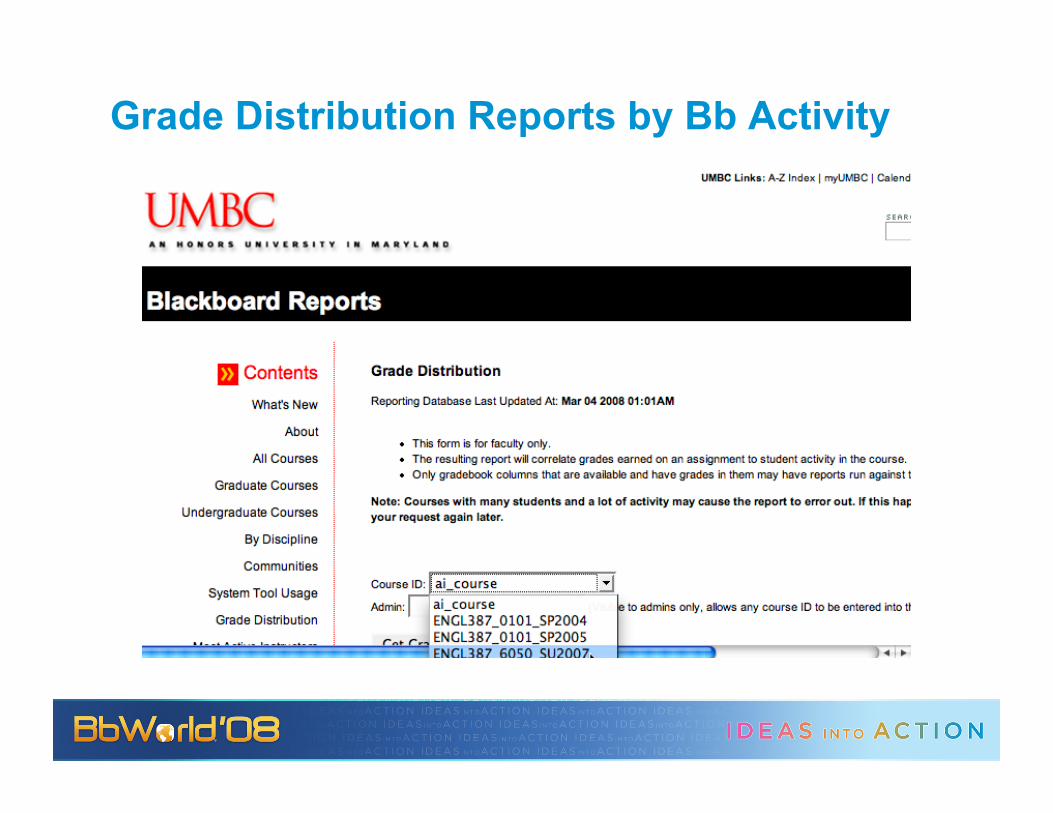
Grade Distribution Reports by Bb Activity
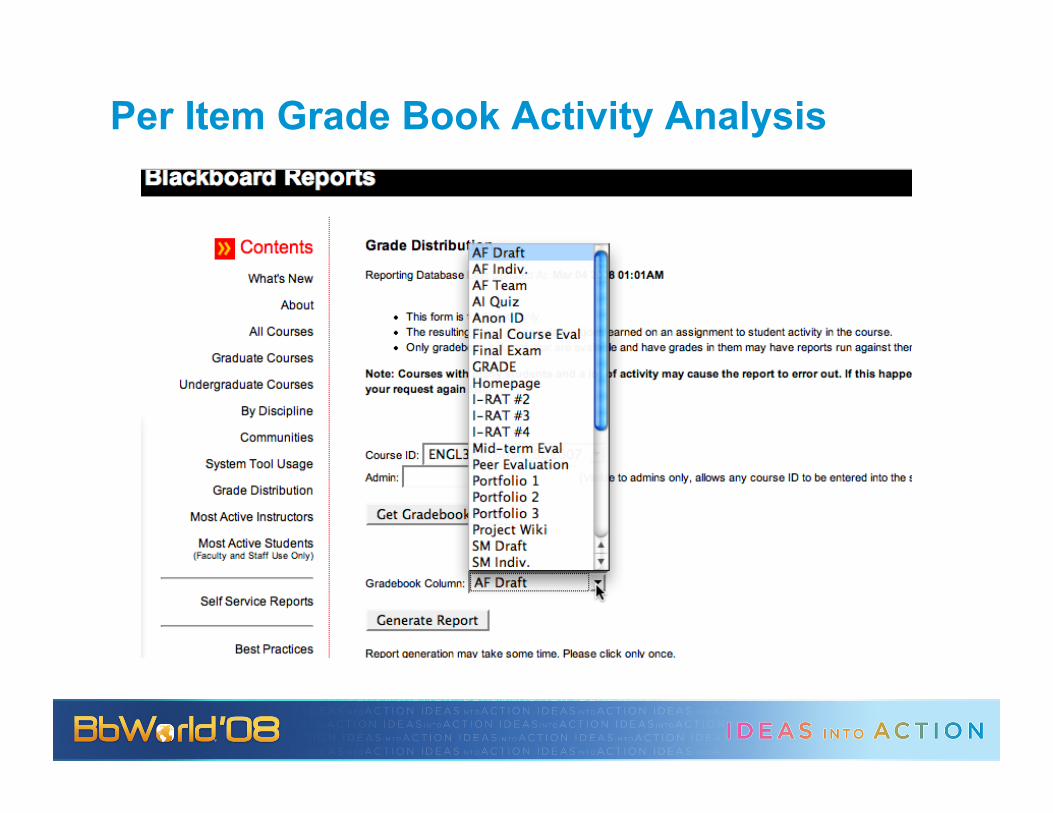
Per Item Grade Book Activity Analysis

Sample Report for Final Grades in a Class
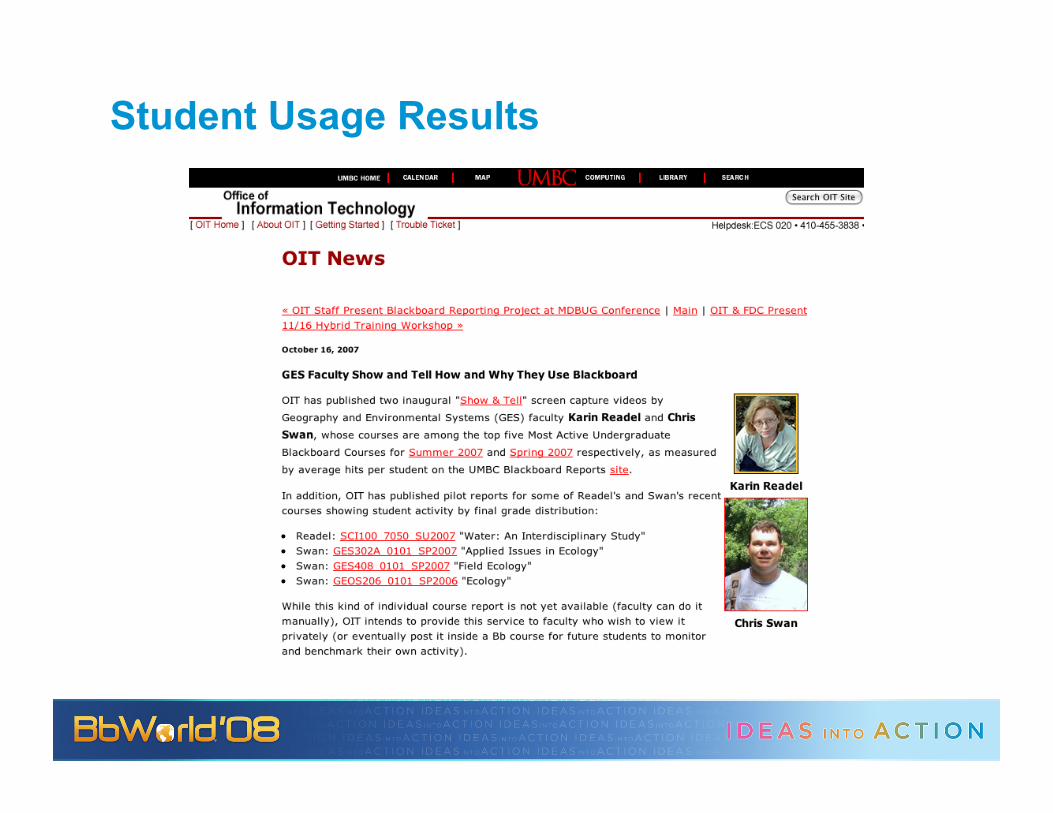
Student Usage Results
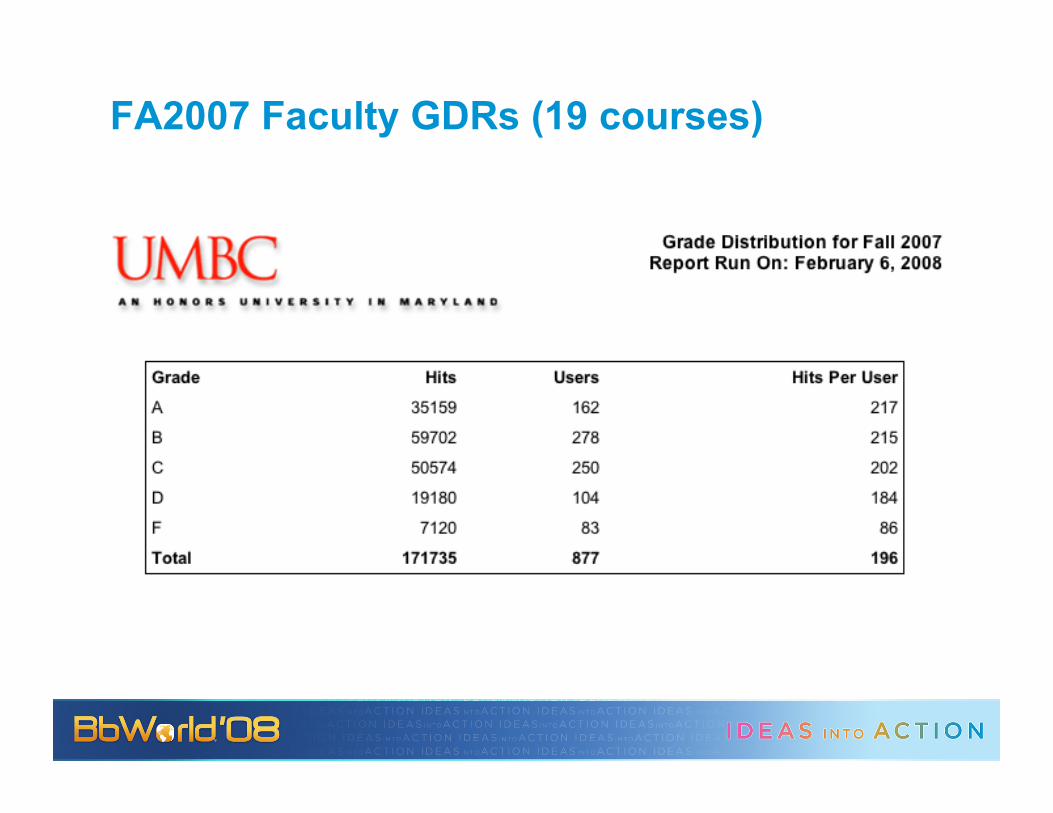
FA2007 Faculty GDRs (19 courses)
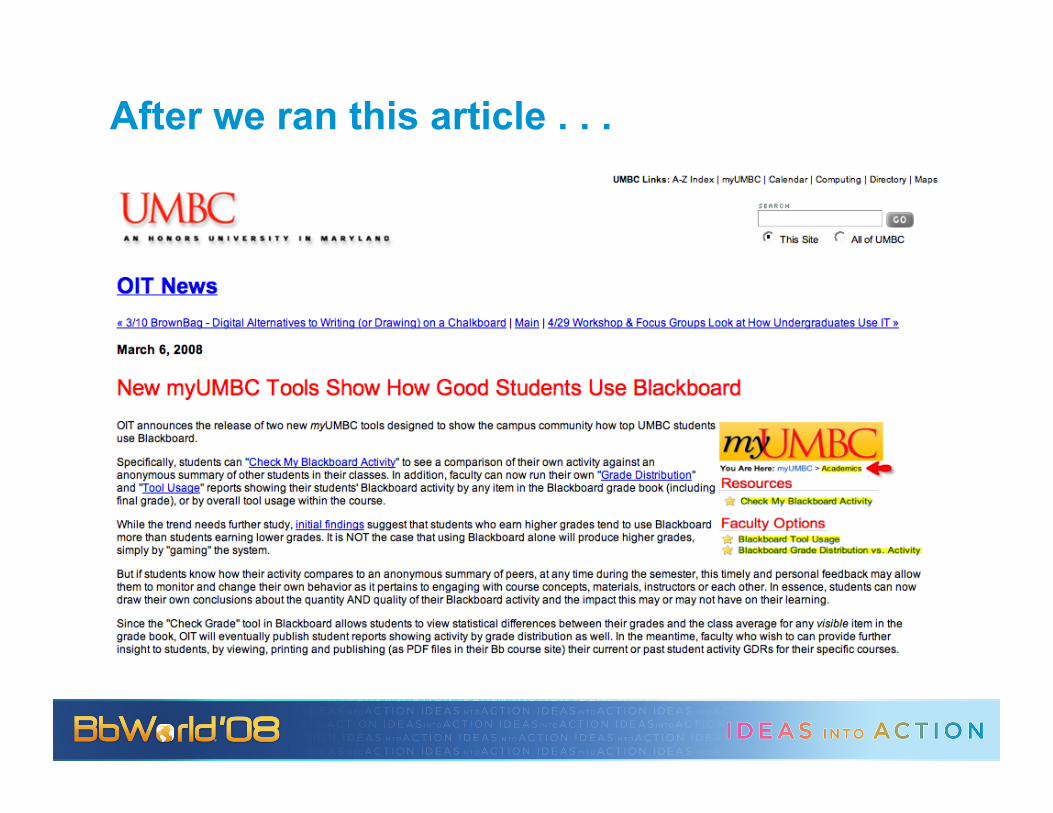
After we ran this article . . .

SP2008 Faculty GDRs (28 courses)
PERSPECTIVES TO CONSIDER
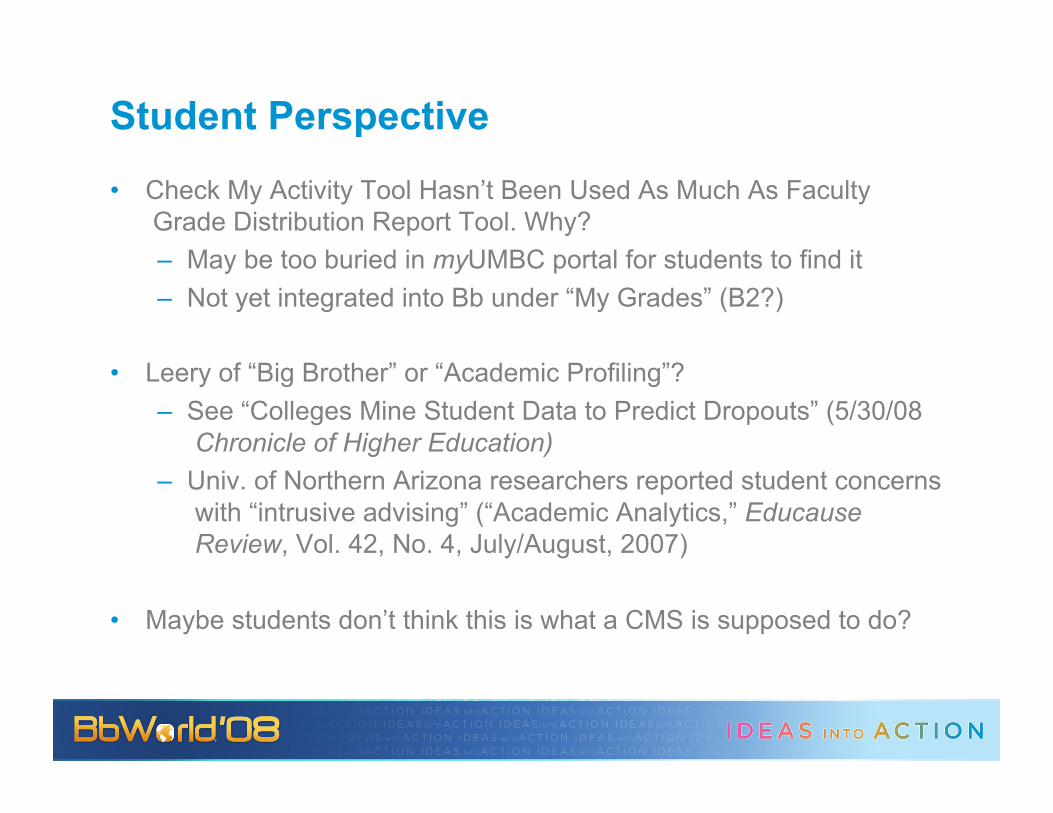
Student Perspective
• Check My Activity Tool Hasn’t Been Used As Much As Faculty Grade Distribution Report Tool. Why? – May be too buried in myUMBC portal for students to find it – Not yet integrated into Bb under “My Grades” (B2?)
• Leery of “Big Brother” or “Academic Profiling”? – See “Colleges Mine Student Data to Predict Dropouts” (5/30/08
Chronicle of Higher Education) – Univ. of Northern Arizona researchers reported student concerns
with “intrusive advising” (“Academic Analytics,” Educause Review, Vol. 42, No. 4, July/August, 2007)
• Maybe students don’t think this is what a CMS is supposed to do?

Faculty Perspective
• Concerns about “course ranking” based on average Bb hits per user? – Not a problem at UMBC (so far)
• Cheap feedback to students in terms of faculty effort to produce it. – Better if they “publish” grade distribution reports in their
courses, so students see how activity informs success.
• Can CMS feedback change student motivation? And behavior (performance)?

Bb Sysadmin/Developer Perspective
• No simple feat to query the system without breaking it. We did (twice).
• How do we scale and maintain this process, which is necessary so users can learn to use these “self-service” tools?
• AND NOW SOME IMPORTANT TECHNICAL CONSIDERATIONS FROM OUR GURU MR. BERMAN.

INFRASTRUCTURE ISSUES
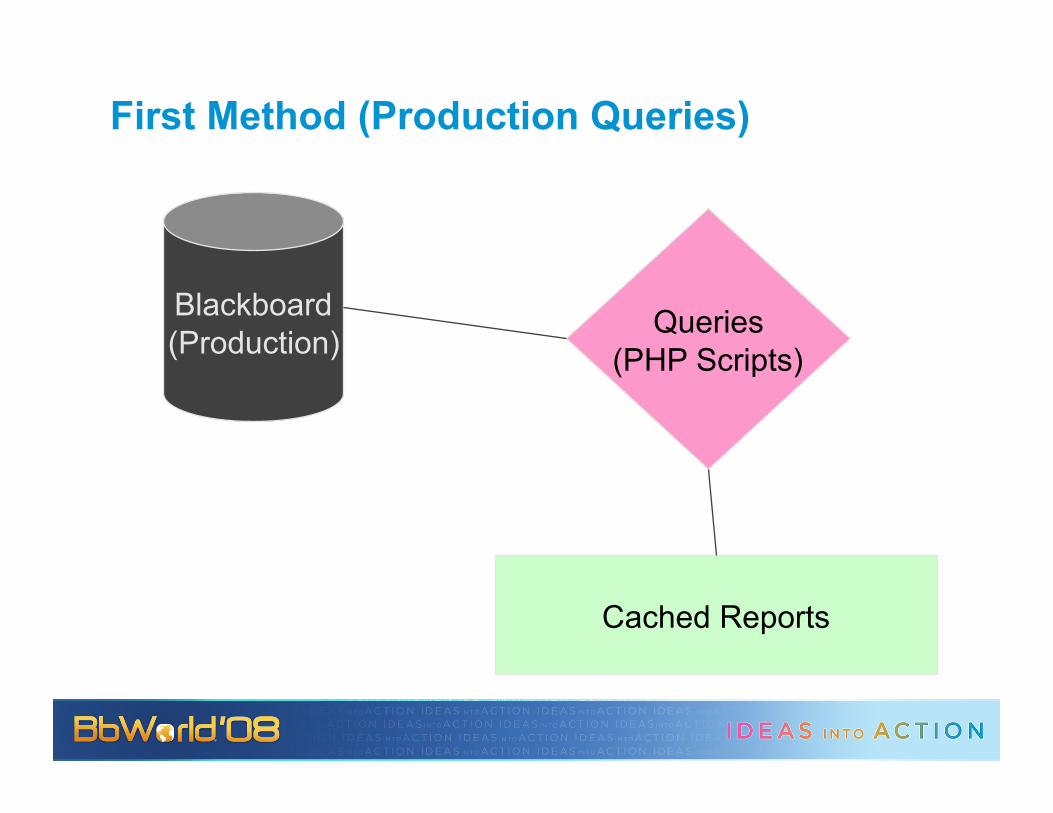
First Method (Production Queries)
Blackboard (Production) Queries
(PHP Scripts)
Cached Reports
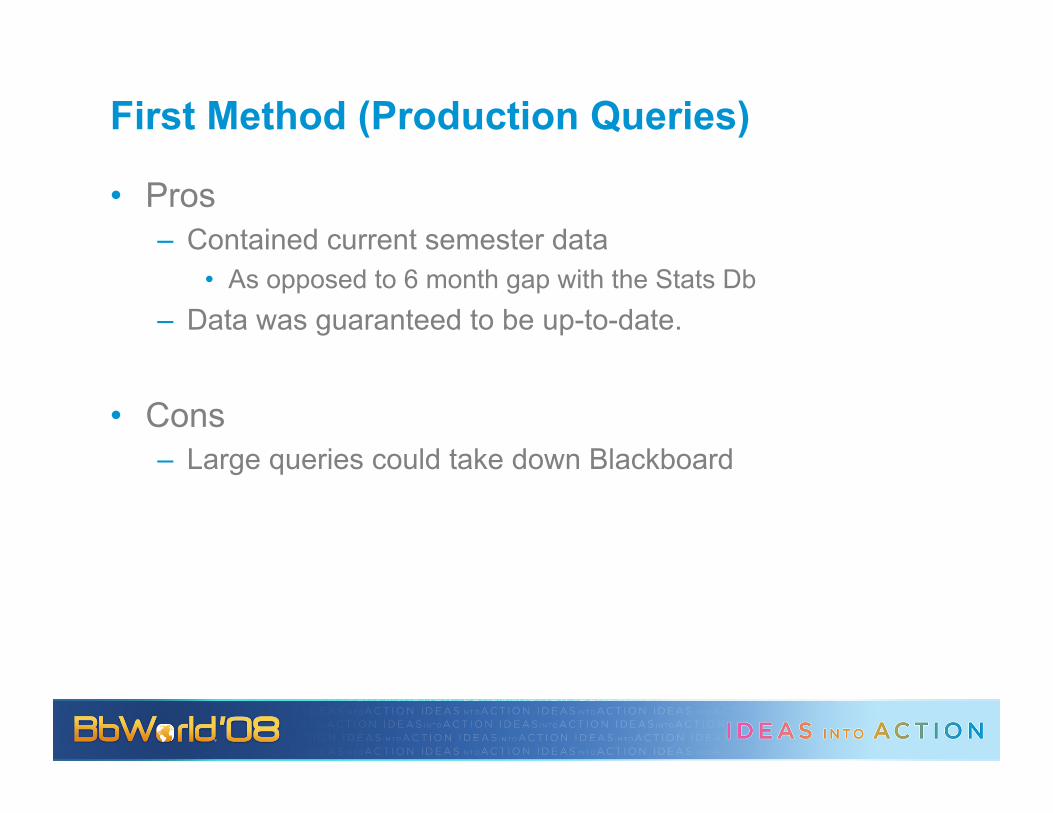
First Method (Production Queries)
• Pros – Contained current semester data
• As opposed to 6 month gap with the Stats Db – Data was guaranteed to be up-to-date.
• Cons – Large queries could take down Blackboard

Blackboard (Clone) Queries
(PHP Scripts)
Cached Reports
Second Method (Cloned Database)
Blackboard (Production)
Updated every 4 minutes

Second Method (Cloned Database)
• Pros – Could query current semester data with minimal impact on
production – Data was close to up-to-date (no more than 4 minute
delay)
• Cons – Cloning process inserted extra columns – Replication service broke numerous times limiting query
accuracy
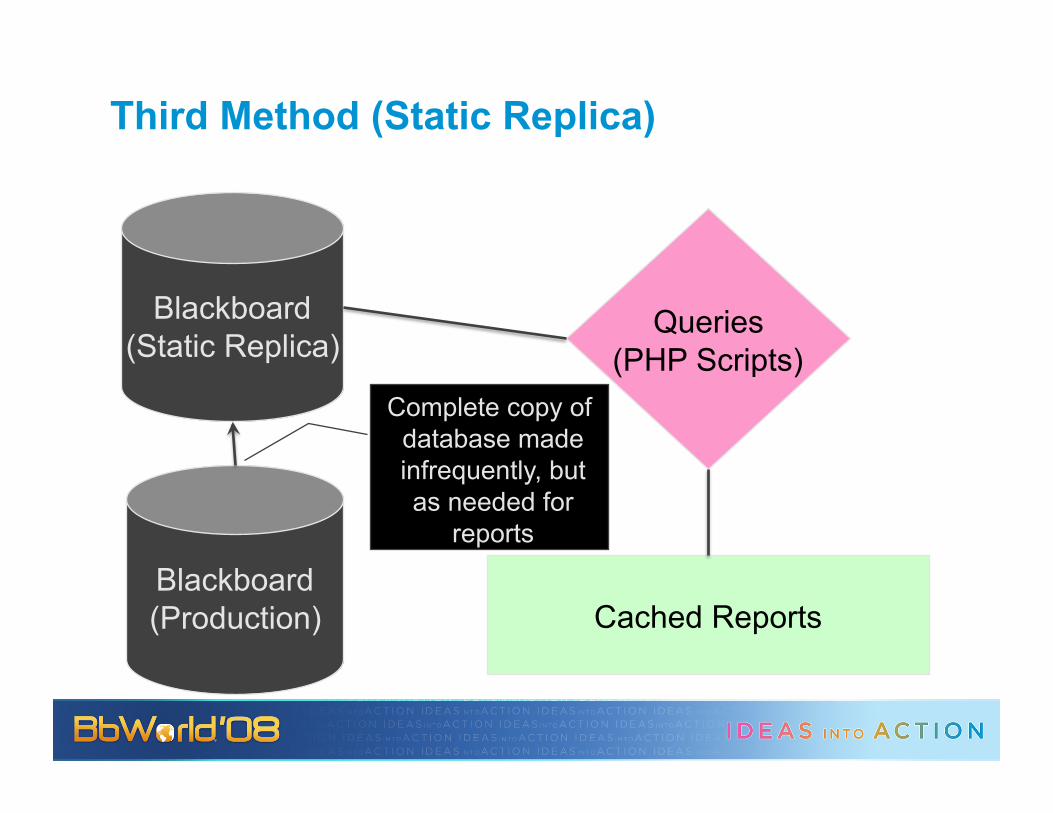
Blackboard (Static Replica)
Queries (PHP Scripts)
Cached Reports Blackboard (Production)
Complete copy of database made infrequently, but as needed for
reports
Third Method (Static Replica)
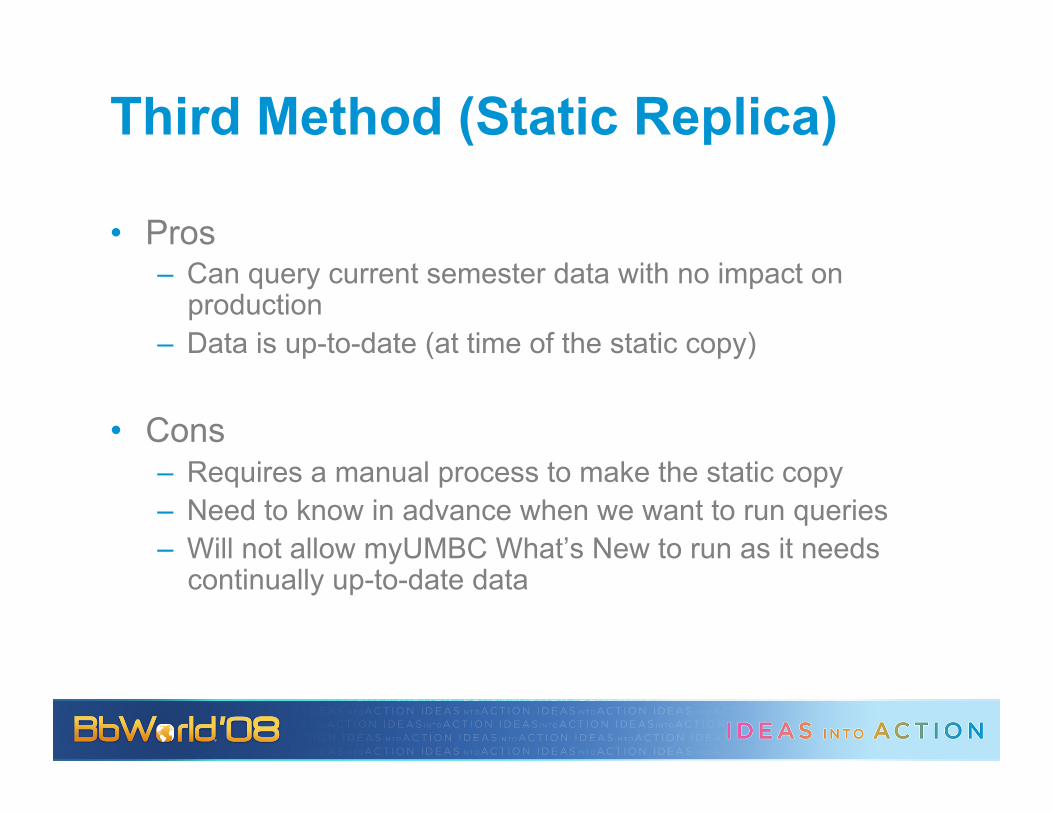
Third Method (Static Replica)
• Pros – Can query current semester data with no impact on
production – Data is up-to-date (at time of the static copy)
• Cons – Requires a manual process to make the static copy – Need to know in advance when we want to run queries – Will not allow myUMBC What’s New to run as it needs
continually up-to-date data

FUTURE PLANS
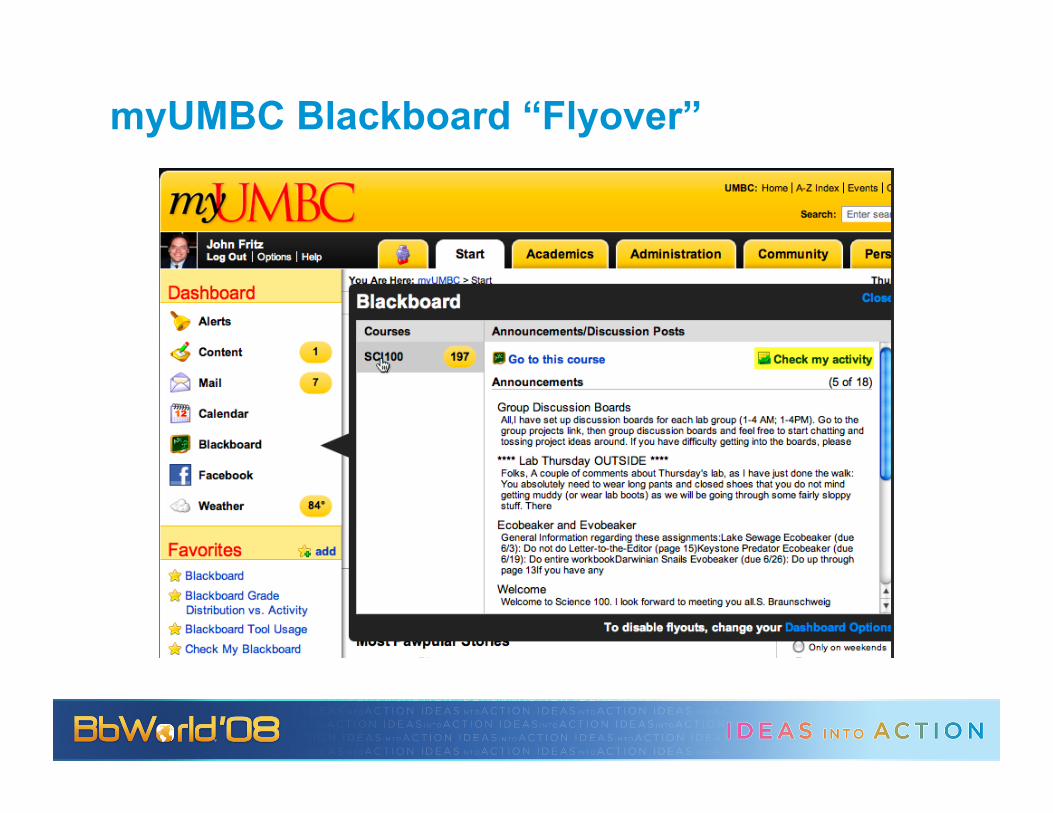
myUMBC Blackboard “Flyover”

What We Want – Building Block or New App

Promote? Test? Expand Scope?
• Continue to promote Check My Activity in Portal. – 75 percent of all users login to Bb via myUMBC – Add “Check My Activity” on Blackboard “flyover”
• Conduct focus groups and/or individual usability tests with students about Check My Activity.
• Alert students who may be at risk? – Who decides? – How would this not come across as “intrusive advising”?

OTHER EXAMPLES and POLICY IMPLICATIONS

Examples of other CMS “Data Mining” projects
• 5/30/08, Chronicle of Higher Education – Argosy University – Purdue University – Slippery Rock University of Pennsylvania – South Texas College – SUNY Buffalo – Tiffin University – University of Alabama – University of Central Florida – University System of Georgia
• Blackboard Greenhouse Grant - Project ASTRO – OSCELOT.org, Advanced System Tracking & Reporting tool
• Hofstra University
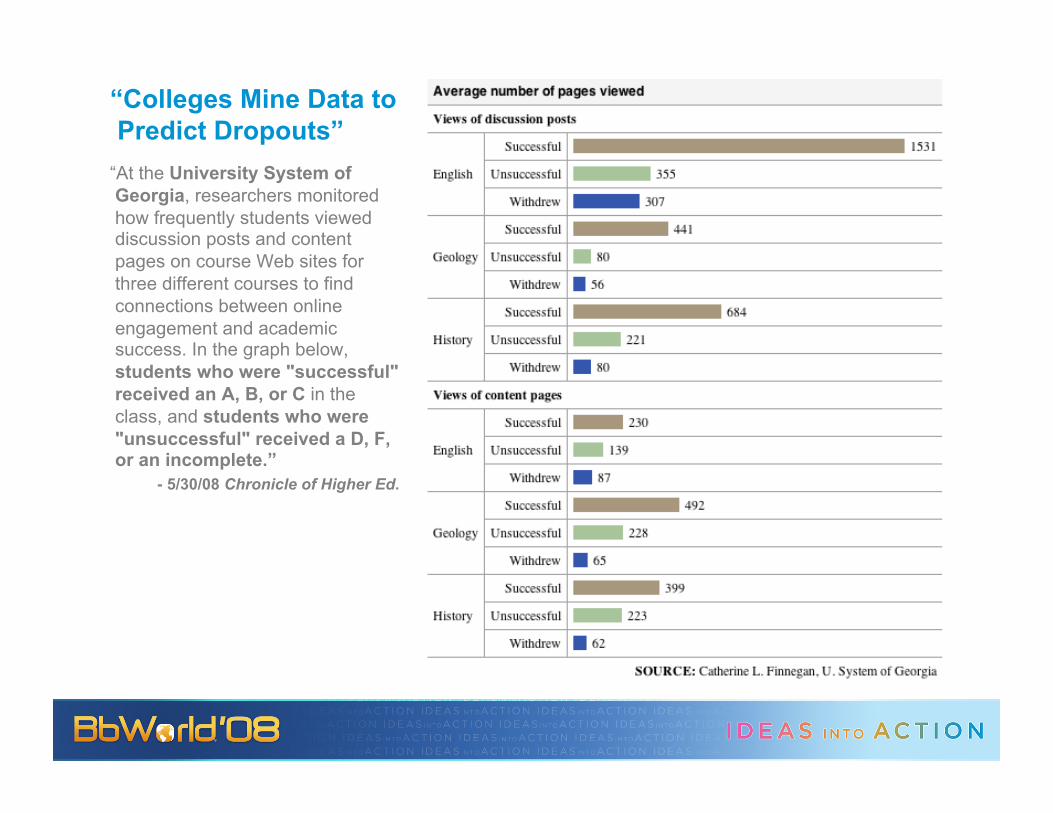
“Colleges Mine Data to Predict Dropouts” “At the University System of Georgia, researchers monitored how frequently students viewed discussion posts and content pages on course Web sites for three different courses to find connections between online engagement and academic success. In the graph below, students who were "successful" received an A, B, or C in the class, and students who were "unsuccessful" received a D, F, or an incomplete.”
- 5/30/08 Chronicle of Higher Ed.
Want More?
• To view our resources and references for this presentation, visit
www.scholar.com
• Simply click “Advanced Search” and search by fritzumbc and tag: ‘bbworld08’
– Includes link to UMBC’s Bb Reports site which contains brief “show & tell” video screencasts about this project by John Fritz and Jeffrey Berman.
QUESTIONS?